Measurement of some EAS properties using new scintillator detectors developed for the GRAPES-3 experiment The GRAPES-3 Collaboration: P.K. Mohanty a , S.R. Dugad a , U.D. Goswami a , S.K. Gupta a, * , Y. Hayashi b , A. Iyer a , N. Ito b , P. Jagadeesan a , A. Jain a , S. Karthikeyan a , S. Kawakami b , M. Minamino b , S.D. Morris a , P.K. Nayak a , T. Nonaka b , A. Oshima b , B.S. Rao a , K.C. Ravindran a , H. Tanaka a , S.C. Tonwar a a Tata Institute of Fundamental Research, Mumbai 400005, India b Graduate School of Science, Osaka City University, Osaka 558-8585, Japan article info Article history: Received 10 September 2008 Received in revised form 29 October 2008 Accepted 9 November 2008 Available online 27 November 2008 PACS: 96.50.S 96.60.sd 95.55.Vj 29.40.Gx Keywords: Cosmic rays Extensive air shower Particle detector Scintillation detector abstract The GRAPES-3 extensive air shower (EAS) array started operation with 256 scintillator detectors at Ooty in India. Each detector is viewed by a fast photomultiplier tube (PMT) mounted at a height of 60 cm above the scintillator. However, for further expansion of the array, an alternative readout of the scintillator using wave-length shifting (WLS) fibers is employed. This resulted in improved performance with a larger photon signal and a more uniform response. With the inclusion of a second PMT, the dynamic range for particle detection has been increased to 5 10 3 particles m 2 . We now use plastic scintillators, devel- oped in-house to cut costs. The measurement of the density spectrum, shows a power law dependence with an index c = 1.57 ± 0.04. Using the zenith angle dependence of the density spectrum, an attenuation length K a = 98–106 g cm 2 for the EAS is obtained. These measurements are found to be consistent with the results reported earlier by other groups. Ó 2008 Elsevier B.V. All rights reserved. 1. Introduction The GRAPES-3 (Gamma Ray Astronomy at PeV EnergieS – phase 3) is a high density extensive air shower (EAS) array designed for precision study of the cosmic ray energy spectrum and its nuclear composition using the muon multiplicity distribution [1] in the en- ergy range from 3 10 13 eV to 3 10 16 eV. The experiment was started with 256 plastic scintillator detectors (each 1 m 2 in area) deployed on a hexagonal pattern, at Ooty (2200 m altitude, 11.4°N, 76.7°E) in southern India in 2001. The scintillator detector is viewed by a fast photomultiplier tube (PMT) in a conventional configuration; wherein the PMT is mounted with its photo-cathode face at a height of 60 cm, above the scintillator. The entire assem- bly of scintillator and PMT is housed inside a highly reflecting trap- ezoidal shaped light-tight aluminum container [2]. The GRAPES-3 array also contains a large area (560 m 2 ) tracking muon telescope [3] to detect and measure the muon component in the EAS. The muon telescope is an effective tool, in the study of the nuclear composition of primary cosmic rays. The tracking muon telescope has also proved to be an invaluable tool in the studies of the solar flares, coronal mass ejections and the subsequent Forbush decrease events observed at the Earth [4,5]. The occurrence of the ‘knee’ in the cosmic ray energy spectrum around 3 10 15 eV is believed to be intimately related to the issue of cosmic ray origin. But even after several decades of study, a clear understanding of the origin of the ‘knee’ is yet to emerge. Clearly the data obtained with higher sensitivity and lesser uncertainty in the estimation of the primary energy and the composition are expected to provide a better understanding of this important fea- ture of the high energy astrophysics. An efficient detector system should provide a large separation between the PMT noise and the signal due to the charged particles in the EAS, and should also have a uniform spatial response over the entire area of the scintillator. In the original GRAPES-3 trape- zoidal shaped detectors, the scintillation photons collected at the PMT are, primarily due to diffuse reflection from the inner walls of the container [2]. This is not an efficient process, and results in a sizable loss of the signal. Most of the scintillator detectors had a photon output [10 photo-electrons, even for the 5 cm thick 0927-6505/$ - see front matter Ó 2008 Elsevier B.V. All rights reserved. doi:10.1016/j.astropartphys.2008.11.004 * Corresponding author. Tel.: +91 9869439435; fax: +91 2222804610. E-mail address: [email protected] (S.K. Gupta). Astroparticle Physics 31 (2009) 24–36 Contents lists available at ScienceDirect Astroparticle Physics journal homepage: www.elsevier.com/locate/astropart

Welcome message from author
This document is posted to help you gain knowledge. Please leave a comment to let me know what you think about it! Share it to your friends and learn new things together.
Transcript
Astroparticle Physics 31 (2009) 24–36
Contents lists available at ScienceDirect
Astroparticle Physics
journal homepage: www.elsevier .com/locate /astropart
Measurement of some EAS properties using new scintillator detectorsdeveloped for the GRAPES-3 experiment
The GRAPES-3 Collaboration: P.K. Mohanty a, S.R. Dugad a, U.D. Goswami a, S.K. Gupta a,*, Y. Hayashi b,A. Iyer a, N. Ito b, P. Jagadeesan a, A. Jain a, S. Karthikeyan a, S. Kawakami b, M. Minamino b, S.D. Morris a,P.K. Nayak a, T. Nonaka b, A. Oshima b, B.S. Rao a, K.C. Ravindran a, H. Tanaka a, S.C. Tonwar a
a Tata Institute of Fundamental Research, Mumbai 400005, Indiab Graduate School of Science, Osaka City University, Osaka 558-8585, Japan
a r t i c l e i n f o
Article history:Received 10 September 2008Received in revised form 29 October 2008Accepted 9 November 2008Available online 27 November 2008
PACS:96.50.S�96.60.sd95.55.Vj29.40.Gx
Keywords:Cosmic raysExtensive air showerParticle detectorScintillation detector
0927-6505/$ - see front matter � 2008 Elsevier B.V. Adoi:10.1016/j.astropartphys.2008.11.004
* Corresponding author. Tel.: +91 9869439435; faxE-mail address: [email protected] (S.K. Gupt
a b s t r a c t
The GRAPES-3 extensive air shower (EAS) array started operation with 256 scintillator detectors at Ootyin India. Each detector is viewed by a fast photomultiplier tube (PMT) mounted at a height of 60 cm abovethe scintillator. However, for further expansion of the array, an alternative readout of the scintillatorusing wave-length shifting (WLS) fibers is employed. This resulted in improved performance with a largerphoton signal and a more uniform response. With the inclusion of a second PMT, the dynamic range forparticle detection has been increased to �5 � 103 particles m�2. We now use plastic scintillators, devel-oped in-house to cut costs. The measurement of the density spectrum, shows a power law dependencewith an index c = 1.57 ± 0.04. Using the zenith angle dependence of the density spectrum, an attenuationlength Ka = 98–106 g cm�2 for the EAS is obtained. These measurements are found to be consistent withthe results reported earlier by other groups.
� 2008 Elsevier B.V. All rights reserved.
1. Introduction
The GRAPES-3 (Gamma Ray Astronomy at PeV EnergieS – phase3) is a high density extensive air shower (EAS) array designed forprecision study of the cosmic ray energy spectrum and its nuclearcomposition using the muon multiplicity distribution [1] in the en-ergy range from 3 � 1013 eV to 3 � 1016 eV. The experiment wasstarted with 256 plastic scintillator detectors (each 1 m2 in area)deployed on a hexagonal pattern, at Ooty (2200 m altitude,11.4�N, 76.7�E) in southern India in 2001. The scintillator detectoris viewed by a fast photomultiplier tube (PMT) in a conventionalconfiguration; wherein the PMT is mounted with its photo-cathodeface at a height of 60 cm, above the scintillator. The entire assem-bly of scintillator and PMT is housed inside a highly reflecting trap-ezoidal shaped light-tight aluminum container [2]. The GRAPES-3array also contains a large area (560 m2) tracking muon telescope[3] to detect and measure the muon component in the EAS. Themuon telescope is an effective tool, in the study of the nuclear
ll rights reserved.
: +91 2222804610.a).
composition of primary cosmic rays. The tracking muon telescopehas also proved to be an invaluable tool in the studies of the solarflares, coronal mass ejections and the subsequent Forbush decreaseevents observed at the Earth [4,5].
The occurrence of the ‘knee’ in the cosmic ray energy spectrumaround 3 � 1015 eV is believed to be intimately related to the issueof cosmic ray origin. But even after several decades of study, a clearunderstanding of the origin of the ‘knee’ is yet to emerge. Clearlythe data obtained with higher sensitivity and lesser uncertaintyin the estimation of the primary energy and the composition areexpected to provide a better understanding of this important fea-ture of the high energy astrophysics.
An efficient detector system should provide a large separationbetween the PMT noise and the signal due to the charged particlesin the EAS, and should also have a uniform spatial response overthe entire area of the scintillator. In the original GRAPES-3 trape-zoidal shaped detectors, the scintillation photons collected at thePMT are, primarily due to diffuse reflection from the inner wallsof the container [2]. This is not an efficient process, and results ina sizable loss of the signal. Most of the scintillator detectors hada photon output [10 photo-electrons, even for the 5 cm thick
PMT
PMTHodoscope−2
Hodoscope−1
Lower Strips
Upper StripsU1 − U5
L1 − L5
Test Scintillator
Cone Detector
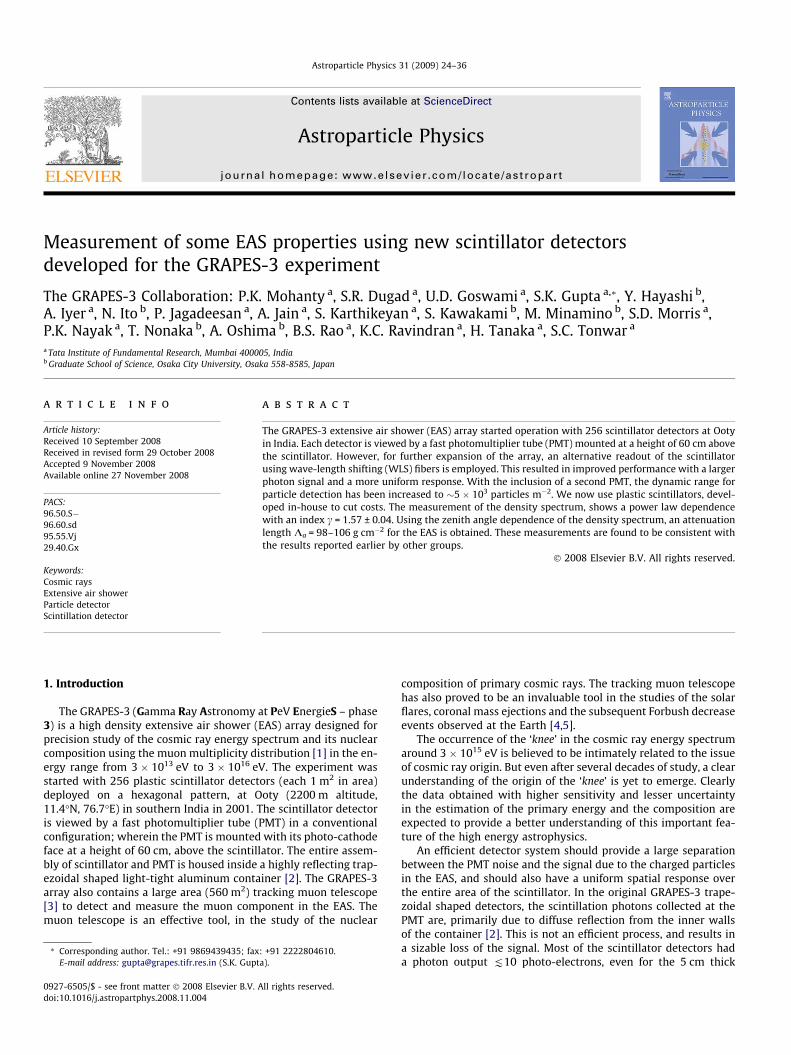
Fig. 1. A sketch of the experimental setup with two identical hodoscopes placed,above and below the test scintillator along with the trapezoidal shaped detector.
P.K. Mohanty et al. / Astroparticle Physics 31 (2009) 24–36 25
scintillators used. The geometry of the detector also resulted in alarge spatial non-uniformity in the signal across the detector anda variation �30% is observed in photon output from the center tothe edge of the detector. In view of these limitations, we haveinvestigated the use of wave-length shifting (WLS) fibers [6,7] foran efficient collection of photons.
Observation of the photon pulses with a decay time of a fewnanoseconds in plastic fibers were reported in 1981 [8] and subse-quently, extensive development of the plastic fibers occurred. Useof WLS fibers, where wave-length shifting cores ranging from sev-eral hundred microns to a few mm diameter, surrounded by singleor multiple layers of cladding of progressively lower refractiveindices were developed. The double clad WLS fibers provide read-out of the blue photon emitting scintillators in a detector, with thesubsequent re-emission of the photons in the green wave-lengthusing a 3-hydroxyflavone (3HF) type wave-length shifter presentin the core material [9]. A fraction of the re-emitted photons aretransported to the end of the fiber through total internal reflec-tions. It is known that the double clad fibers provide an improvedphoton yield of up to 70% higher than the single clad ones, byincreasing the fraction of light trapped through total internalreflections [10].
We have developed a new scintillator detector with signifi-cantly improved performance, by a suitable placement of theWLS fibers in machined grooves on the scintillator surface. Since,the spatial uniformity and the response time of the scintillator crit-ically depends on the layout of the fibers, the performance of thedetector has also been simulated using a Monte Carlo simulationcode ‘G3ScSIM’ developed by us. A direct comparison of the resultsfrom the simulations and the actual measurements has allowed, abetter understanding of the performance of the detector to emerge.Three different layouts of WLS fibers were evaluated using MonteCarlo code, G3ScSIM. However, the final configuration has beenadopted on the basis of cost effective fabrication with excellentuniformity and high photon output. The saturation of the PMTsencountered at very high particle densities in the earlier GRAPES-3 detectors, limited their use over a wider range of primary cosmicray energies. To overcome this limitation, the WLS fiber detectorshave been designed with two PMTs. The results of the tests andthe performance of the new detectors is summarized here.
The density distribution of the particles observed in an EASdetector station provides a useful and simple method of probingthe energy spectrum of the primary cosmic rays. The integral den-sity spectrum is defined as the frequency N(q) with which the par-ticle density exceeds a value q at a given location. To a firstapproximation the density spectrum N(q) is given by,
NðqÞ ¼ K � q�c ð1Þ
However, the actual measurements have shown that c is onlyapproximately constant and it shows a very weak dependence onthe detected particle density. Nevertheless, for most purposes aconstant value of c provides an adequate description of the data.If all EAS have an identical lateral distribution, the density spectrumrepresented by Eq. (1) implies a similar size spectrum of EAS [11].The measurements of the density spectrum have shown a clearpower law dependence as outlined above. The density spectrum ob-tained from a plastic scintillator detector at an altitude of 2770 m atMt. Norikura showed a dependence of N(q) = K � q�c; wherec = 1.55 ± 0.05 was obtained in the density range 50–104 particlesm�2, which progressively increased to 2.0 at the densities beyond2 � 104 particles m�2 [12].
The zenith angle distribution of the EAS has been studied for along time to measure the attenuation of the EAS in the atmosphere[13,14]. The zenith angle distribution of the EAS for different par-ticle densities has been used to estimate the attenuation lengthof the EAS by the ARGO–YBJ collaboration. They have reported an
attenuation length of (124 ± 11) g cm�2 in Tibet, at an atmosphericdepth of 606 g cm�2 [15]. The KASCADE collaboration has studiedthe attenuation of the EAS in great detail at the sea level, and haveobtained a value of (100–120) g cm�2 for this parameter [16].Although, a direct comparison of the above two experimental re-sults is rather difficult, owing to the different altitudes of observa-tion and radically different methods of data analysis employed.However, the fact that the magnitude of the attenuation lengthare same within stated errors, indicates that it is very usefulparameter to describe the attenuation of EAS in the atmosphere.
2. The experimental setup
A special experimental setup has been erected, for studying theperformance of the scintillator detectors being developed. A sketchof the arrangement used in this setup, consisting of three sets oftrigger scintillators is shown in Fig. 1. The two scintillator hodo-scopes are placed, directly above and below the scintillator detec-tor under development. Each hodoscope consists of a total of 10strips of plastic scintillators, each strip is 50 cm long with across-sectional area of 10 cm � 2 cm. The 10 strips are divided intotwo groups of 5 strips each. The first group of 5 strips labeled U1through U5, are placed adjacent to each other to form a layer, cov-ering an area of 50 cm � 50 cm, seen as the top layer in Fig. 1. Thesecond group of 5 strips labeled L1 through L5, are also similarlydeployed, but along a direction orthogonal to the first group. Eachstrip is viewed by an individual 5 cm diameter, fast PMT (modelETL-9807B) coupled directly to the strip. To avoid the cross-talk,each strip is wrapped in aluminum foil and then inside a layer ofblack plastic sheet. The high voltage applied to each PMT is ad-justed, to make it fully sensitive to single muons. Thus, each hodo-scope records the passage of a through going muon by the twogroups of scintillator strips along two orthogonal, namely X- andY-directions to a precision of 10 cm � 10 cm. A total of 25 localizedcells, of constant cross sectional area (10 cm � 10 cm) are obtainedfrom each hodoscope as is shown in Fig. 1. A vertical separation of50 cm between the two hodoscopes allows the direction and thelocation of each muon to be determined.
In addition, another plastic scintillator (50 cm � 50 cm � 5 cmin size) is placed below the lower hodoscope, inside an inverted,trapezoidal shaped cone, with inner surfaces painted black. ThePMT viewing this scintillator is placed at the bottom of the cone,which detects only direct photons, thus providing significantly bet-ter timing.
26 P.K. Mohanty et al. / Astroparticle Physics 31 (2009) 24–36
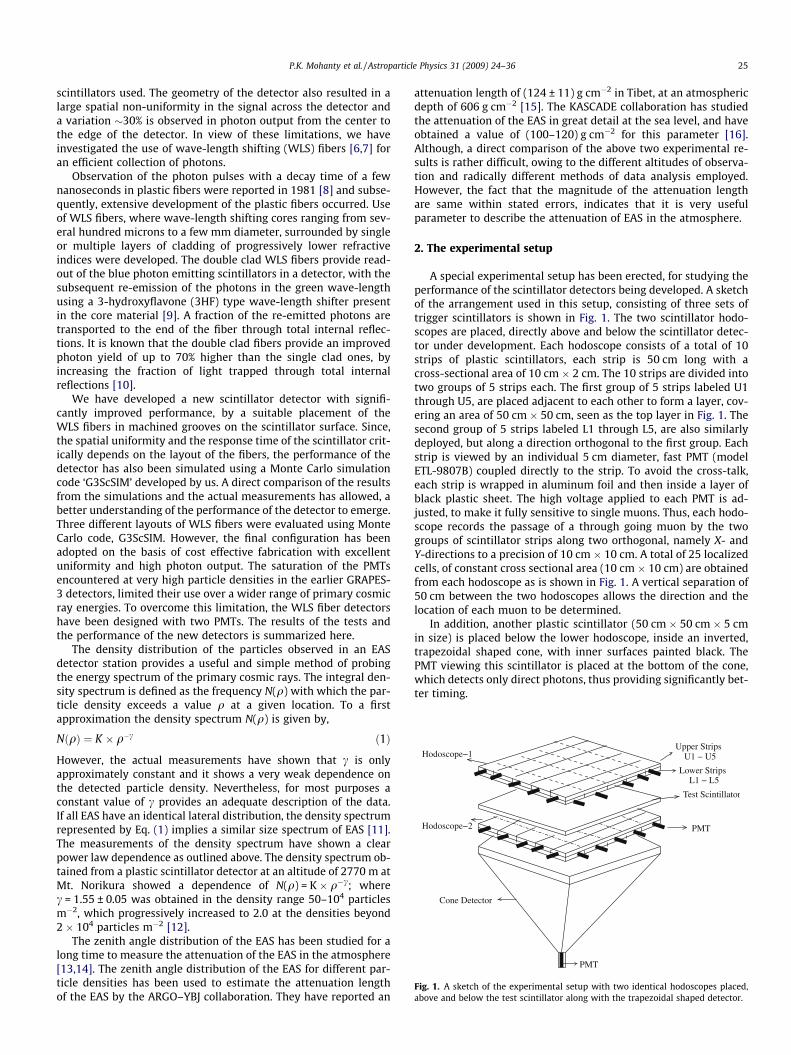
The muon trigger is generated as described below. As shown inFig. 2, the output pulses from each of the PMTs coupled to the 10strips from the 2 layers of a hodoscope, are discriminated to pro-duce logical output pulses. Next, a logical OR of the discriminatoroutputs, from the 5 strips in a layer called OR1 is generated whichindicates the passage of a muon through layer 1 in hodoscope 1.Thus the 4 layers of the scintillator strips from the two hodoscopesprovide 4 independent signals OR1, OR2, OR3, OR4 during the pas-sage of a muon. Finally, a 4-fold coincidence of OR1, OR2, OR3, OR4is taken to generate the initial muon trigger l0. The output of thePMT from the trapezoidal shaped detector is also discriminatedand its coincidence is taken with l0 after a small delay, to generatetrigger l1. Signal l1 provides faster timing, because the trapezoidalshaped detector triggers only on direct photons which have signif-icantly smaller time spread. Signal l1 is subsequently also used asthe GATE for the charge integrating analog to digital converters(ADCs) and as the START for the time to digital converters (TDCs).Since l1 is generated by a 5-fold coincidence, it provides a rela-tively clean muon trigger, free from the noise in the PMTs.
The passage of the muons through the specific scintillator stripsin the two hodoscopes is obtained, by latching the discriminatoroutput pulses from all 20 strips as a flag by the use of a 20-bit flaglatch module, where the corresponding bit for the strip is set to thelogical state ‘1’ if that strip is hit, otherwise it is set to the state ‘0’.Normally a muon would results in at least 4 strips being hit fromthe 4 layers of scintillators in the two hodoscopes. A small fractionof the total events record hits in more than one strip in a singlelayer, which might be due to the passage of an inclined muon,through two adjacent strips or due to the production of a knock-on electron by the parent muon. Events with such multiple hitsare rejected during the subsequent data analysis.
AND
OR
Detector
L1 L2 L3 L4
OR
Test
Disc.
ADC
TDC
AND
μ0
Disc.
U1 U2 U3 U4 U5
OR1
L5
Cone
START
GATE
μ1
Trigger
Disc.
FlagLatch
Module
OR3OR4
Disc.
400 ns
50 ns
Detector
GATEGEN.
OR2
Fig. 2. A schematic diagram of the trigger and signal processing setup used in themeasurements.
50cm
50cm
2cm
a b
50cm
2cm
Cookie
Fig. 4. The three groove layouts on the scintillator surface wit
The information on the scintillator strip hits are used to localizethe muons to within cells of 10 cm � 10 cm in size, as shown inFig. 1. However, only near vertical muons are selected for furtheranalysis. To obtain a reasonably good statistics, the data are accu-mulated over a period of 7 days. The ADC and the TDC distributionsare obtained for each of the 25 position cells (10 cm � 10 cm insize). These ADC and TDC distributions are then compared withthe results of the Monte Carlo simulations. The PMT viewing thetest detector has been calibrated by measuring its response to sin-gle photons, which is shown in Fig. 3. The observed first photo-electron peak has been fitted to a Gaussian function. The widthof this fit is used in the subsequent Monte Carlo simulations togenerate the PMT response.
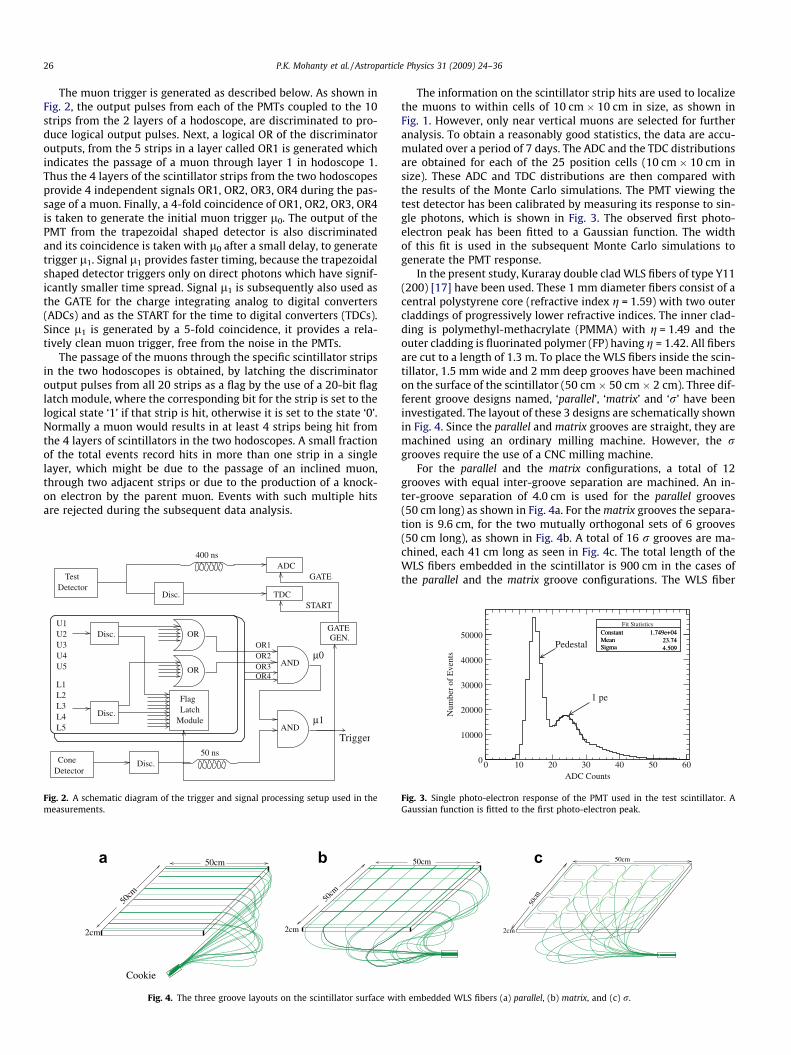
In the present study, Kuraray double clad WLS fibers of type Y11(200) [17] have been used. These 1 mm diameter fibers consist of acentral polystyrene core (refractive index g = 1.59) with two outercladdings of progressively lower refractive indices. The inner clad-ding is polymethyl-methacrylate (PMMA) with g = 1.49 and theouter cladding is fluorinated polymer (FP) having g = 1.42. All fibersare cut to a length of 1.3 m. To place the WLS fibers inside the scin-tillator, 1.5 mm wide and 2 mm deep grooves have been machinedon the surface of the scintillator (50 cm � 50 cm � 2 cm). Three dif-ferent groove designs named, ‘parallel’, ‘matrix’ and ‘r’ have beeninvestigated. The layout of these 3 designs are schematically shownin Fig. 4. Since the parallel and matrix grooves are straight, they aremachined using an ordinary milling machine. However, the rgrooves require the use of a CNC milling machine.
For the parallel and the matrix configurations, a total of 12grooves with equal inter-groove separation are machined. An in-ter-groove separation of 4.0 cm is used for the parallel grooves(50 cm long) as shown in Fig. 4a. For the matrix grooves the separa-tion is 9.6 cm, for the two mutually orthogonal sets of 6 grooves(50 cm long), as shown in Fig. 4b. A total of 16 r grooves are ma-chined, each 41 cm long as seen in Fig. 4c. The total length of theWLS fibers embedded in the scintillator is 900 cm in the cases ofthe parallel and the matrix groove configurations. The WLS fiber
Constant 1.749e+04Mean 23.74Sigma 4.509
ADC Counts0 10 20 30 40 50 60
Num
ber
of E
vent
s
0
10000
20000
30000
40000
50000 Constant 1.749e+04Mean 23.74Sigma 4.509Pedestal
1 pe
Fit Statistics
Fig. 3. Single photo-electron response of the PMT used in the test scintillator. AGaussian function is fitted to the first photo-electron peak.
c50cm 50cm
50cm
2cm
h embedded WLS fibers (a) parallel, (b) matrix, and (c) r.
20000
Peak = 1.59 MeV
P.K. Mohanty et al. / Astroparticle Physics 31 (2009) 24–36 27
are restrained from any movement by applying tiny strips of adhe-sive aluminum tape just above the groove. A total of 18 fibers havebeen used and placed in alternative grooves as single and two fibers,respectively. The total length of WLS fibers is 656 cm for the r con-figuration with only one fiber in each groove as shown in Fig. 4.
The entire scintillator and WLS fiber assembly is wrapped insidetwo layers of Tyvek paper [18], which acts as an efficient but dif-fuse reflector, resulting in a substantial enhancement in the num-ber of the photons collected. Tyvek has been chosen for its highreflectivity, chemically inert nature and excellent mechanicalstrength. Since only a small fraction of the total length (41 or50 cm) of WLS fiber is embedded inside the groove, the remainderis used for its smooth and safe bending, en-route to the PMT. Thefree ends of the WLS fibers are bunched together and glued intoan acrylic disk called a ‘cookie’ which is finally coupled to thePMT using an optical glue. The entire assembly is placed inside alight-tight aluminum tank. The experimental conditions are keptunchanged during the tests with different groove designs.
3. Monte Carlo simulations (G3ScSIM Code)
Prior to the actual experimental measurements, a Monte Carlosimulation code ‘G3ScSIM’ [19] has been developed to get anunderstanding of the response of the scintillator for different fiberconfigurations. The G3ScSIM is basically a photon tracking code, fora plastic scintillator of rectangular geometry, with embedded WLSfibers of cylindrical geometry. In this code, the trigger conditionsare kept identical to those in the experiment with cosmic raymuons, as shown in the Fig. 1. The important input parametersused in G3ScSIM are listed in Table 1. Some of the simplifiedassumptions made in G3ScSIM are: (i) the scintillator response ishomogeneous, (ii) the scintillator photons are monochromatic,and (iii) the WLS fibers are in optical contact with the scintillatorsurface, over an area projected by it. A brief description of someof the relevant features of G3ScSIM code are summarized belowand described in greater detail elsewhere [19].
3.1. Basic G3ScSIM code
The detector setup modeled in G3ScSIM code, is identical to thatin Fig. 1. The origin of the coordinate system is selected at the cor-ner of the test detector and the geometry is defined through its ex-treme coordinates (Xmin,Ymin) to (Xmax,Ymax). The cosmic ray muonsare generated over the surface of the top hodoscope (Fig. 1) withrandom coordinates x, y and arrival direction; zenith angle h(0 6 h 6 60 �), azimuth angle / (0 6 / 6 360 �). By projecting thetrajectory of the muon, its location on the test detector, and onthe other triggering detectors is calculated. A trigger is generated,only if a muon passes through all the five triggering detectors.
The energy loss �dE/dx of the muon, in the test scintillator iscalculated using the Landau distribution [20,21] based on an algo-
Table 1Monte Carlo simulation parameters.
Scint. Refractive index (gsc) 1.59WLS (gwls) Fx core 1.59In. clad 1.49Out. clad 1.42Scint. decay time 1.7 nsWLS fiber decay time 6.1 nsScint. attenuation length 100 cmWLS attenuation length 350 cmTyvek reflectivity 90%ETIR 93%PMT time jitter (FWHM) 2.2 nsMean energy loss/photon 100 eV
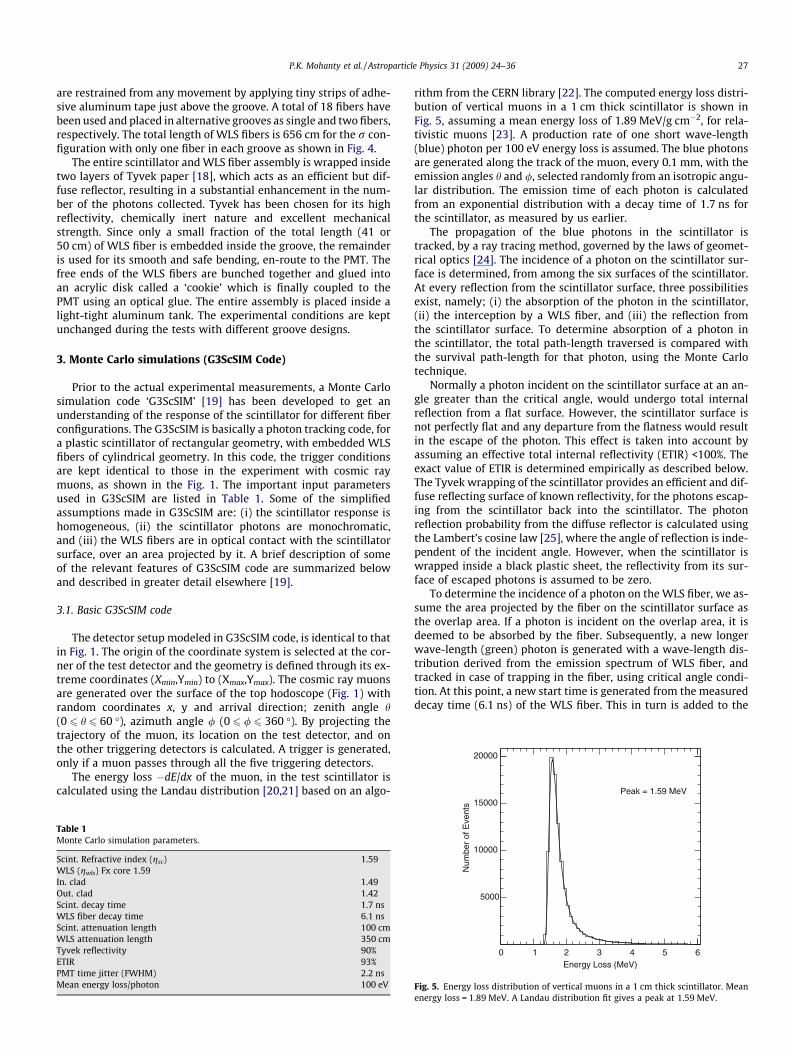
rithm from the CERN library [22]. The computed energy loss distri-bution of vertical muons in a 1 cm thick scintillator is shown inFig. 5, assuming a mean energy loss of 1.89 MeV/g cm�2, for rela-tivistic muons [23]. A production rate of one short wave-length(blue) photon per 100 eV energy loss is assumed. The blue photonsare generated along the track of the muon, every 0.1 mm, with theemission angles h and /, selected randomly from an isotropic angu-lar distribution. The emission time of each photon is calculatedfrom an exponential distribution with a decay time of 1.7 ns forthe scintillator, as measured by us earlier.
The propagation of the blue photons in the scintillator istracked, by a ray tracing method, governed by the laws of geomet-rical optics [24]. The incidence of a photon on the scintillator sur-face is determined, from among the six surfaces of the scintillator.At every reflection from the scintillator surface, three possibilitiesexist, namely; (i) the absorption of the photon in the scintillator,(ii) the interception by a WLS fiber, and (iii) the reflection fromthe scintillator surface. To determine absorption of a photon inthe scintillator, the total path-length traversed is compared withthe survival path-length for that photon, using the Monte Carlotechnique.
Normally a photon incident on the scintillator surface at an an-gle greater than the critical angle, would undergo total internalreflection from a flat surface. However, the scintillator surface isnot perfectly flat and any departure from the flatness would resultin the escape of the photon. This effect is taken into account byassuming an effective total internal reflectivity (ETIR) <100%. Theexact value of ETIR is determined empirically as described below.The Tyvek wrapping of the scintillator provides an efficient and dif-fuse reflecting surface of known reflectivity, for the photons escap-ing from the scintillator back into the scintillator. The photonreflection probability from the diffuse reflector is calculated usingthe Lambert’s cosine law [25], where the angle of reflection is inde-pendent of the incident angle. However, when the scintillator iswrapped inside a black plastic sheet, the reflectivity from its sur-face of escaped photons is assumed to be zero.
To determine the incidence of a photon on the WLS fiber, we as-sume the area projected by the fiber on the scintillator surface asthe overlap area. If a photon is incident on the overlap area, it isdeemed to be absorbed by the fiber. Subsequently, a new longerwave-length (green) photon is generated with a wave-length dis-tribution derived from the emission spectrum of WLS fiber, andtracked in case of trapping in the fiber, using critical angle condi-tion. At this point, a new start time is generated from the measureddecay time (6.1 ns) of the WLS fiber. This in turn is added to the
Energy Loss (MeV)0 1 2 3 4 5 6
Num
ber
of E
vent
s
5000
10000
15000
Fig. 5. Energy loss distribution of vertical muons in a 1 cm thick scintillator. Meanenergy loss = 1.89 MeV. A Landau distribution fit gives a peak at 1.59 MeV.
28 P.K. Mohanty et al. / Astroparticle Physics 31 (2009) 24–36
earlier transit time of the blue photon, from the time it was gener-ated in the scintillator to the time of its absorption in the fiber. Atrapped green photon is propagated, until it is absorbed in the fiberdue to attenuation or if it reaches the collection end of the fiber.The green photons propagating in the direction opposite to thatof the PMT are assumed to be lost. The green photons reachingthe PMT are converted into photo-electrons at the photo-cathodeusing the wave-length dependent quantum efficiency of the PMT.The amplitude and the response time of the PMT are convolutedto generate the PMT pulse. For each muon, the recorded informa-tion includes the X, Y coordinates on the triggering and test scintil-lators, also the photon statistics such as the number of photons (i)produced in the scintillator, (ii) escaped from the scintillator, (iii)lost due to the attenuation, (iv) absorbed in the WLS fiber, (v) es-caped from the fiber, and finally the number of the photo-electronsand their arrival times at the PMT.
3.2. Effective total internal reflectivity (ETIR)
A Monte Carlo simulation can reproduce the experimental dataonly if the detector parameters describing its performance are suf-ficiently close to their true values. These parameters include thescintillation efficiency, the surface reflectivity, the attenuationlength, and the decay times etc. Many of these parameters havebeen directly measured by us or are available from the literature.The remaining parameters have to be obtained by assuming someinitial values and then fine tuning those values by matching thesimulation results with the experimental data for a particular con-figuration of the test detector. The results can then be crosschecked by carrying out another set of measurements with a differ-ent configuration of the test detector.
To fix the free parameters in the simulations, the parallel groovedesign, with and without the Tyvek wrapping was modeled. Theonly free parameter used in these simulations is the ETIR. The ini-tial value of the ETIR is taken to be 100%, implying that the scintil-lator surfaces to be perfectly flat. The resultant photon distributionfrom the simulations disagreed with the experimental data. It isobserved that the simulated ratio of the mean number of photonswith and without the Tyvek wrapping is 2.2, while the experimen-tal value is 3.3. It is observed that this ratio increases with decreas-ing value of ETIR. A value of ETIR = 93%, gives a nearly perfectagreement with the experimental data. This value of the ETIR hasbeen used for all subsequent simulations.
3.3. Photon statistics
The muons suffer a mean energy loss of 1.89 MeV/cm in a scin-tillator. However, when due account is taken of the muons arrivingfrom different directions that trigger the setup, the mean energyloss becomes 4.6 MeV in the 2 cm thick scintillator used. This re-sults in production of a large number of photons (�46,000), but
Scintillator tile WL
to house PMT and BaseAluminum box
Aluminum cylinderHigh Gain PMT
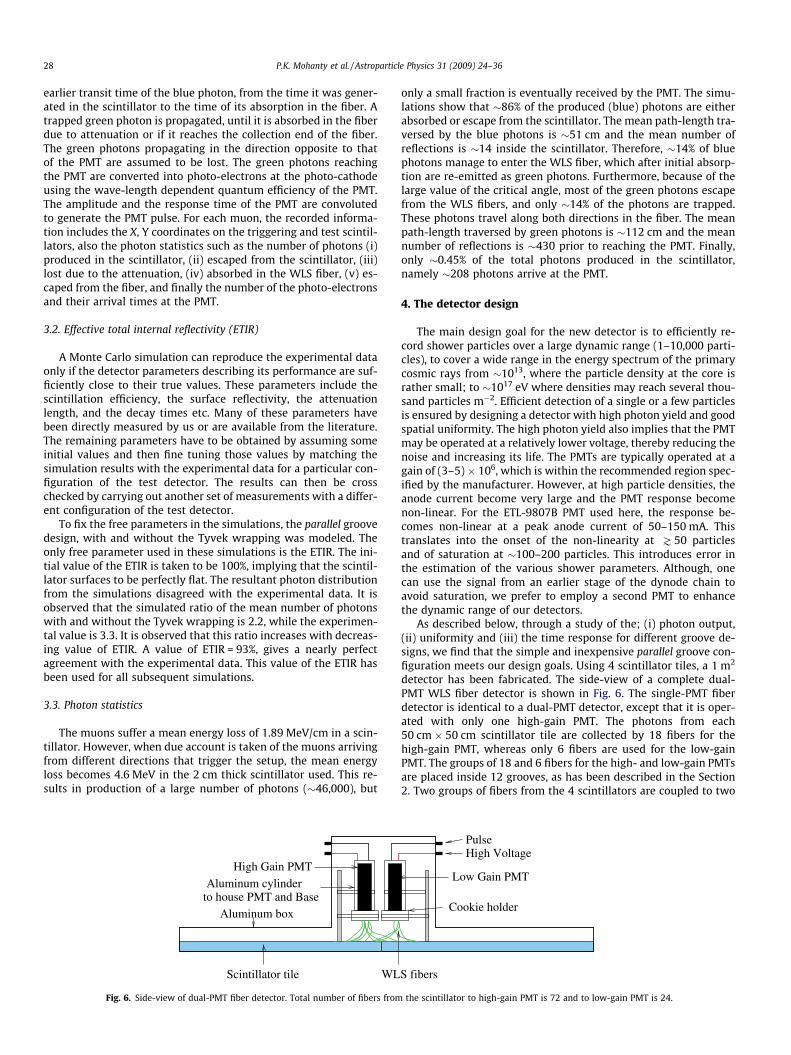
Fig. 6. Side-view of dual-PMT fiber detector. Total number of fibers from
only a small fraction is eventually received by the PMT. The simu-lations show that �86% of the produced (blue) photons are eitherabsorbed or escape from the scintillator. The mean path-length tra-versed by the blue photons is �51 cm and the mean number ofreflections is �14 inside the scintillator. Therefore, �14% of bluephotons manage to enter the WLS fiber, which after initial absorp-tion are re-emitted as green photons. Furthermore, because of thelarge value of the critical angle, most of the green photons escapefrom the WLS fibers, and only �14% of the photons are trapped.These photons travel along both directions in the fiber. The meanpath-length traversed by green photons is �112 cm and the meannumber of reflections is �430 prior to reaching the PMT. Finally,only �0.45% of the total photons produced in the scintillator,namely �208 photons arrive at the PMT.
4. The detector design
The main design goal for the new detector is to efficiently re-cord shower particles over a large dynamic range (1–10,000 parti-cles), to cover a wide range in the energy spectrum of the primarycosmic rays from �1013, where the particle density at the core israther small; to �1017 eV where densities may reach several thou-sand particles m�2. Efficient detection of a single or a few particlesis ensured by designing a detector with high photon yield and goodspatial uniformity. The high photon yield also implies that the PMTmay be operated at a relatively lower voltage, thereby reducing thenoise and increasing its life. The PMTs are typically operated at again of (3–5) � 106, which is within the recommended region spec-ified by the manufacturer. However, at high particle densities, theanode current become very large and the PMT response becomenon-linear. For the ETL-9807B PMT used here, the response be-comes non-linear at a peak anode current of 50–150 mA. Thistranslates into the onset of the non-linearity at J 50 particlesand of saturation at �100–200 particles. This introduces error inthe estimation of the various shower parameters. Although, onecan use the signal from an earlier stage of the dynode chain toavoid saturation, we prefer to employ a second PMT to enhancethe dynamic range of our detectors.
As described below, through a study of the; (i) photon output,(ii) uniformity and (iii) the time response for different groove de-signs, we find that the simple and inexpensive parallel groove con-figuration meets our design goals. Using 4 scintillator tiles, a 1 m2
detector has been fabricated. The side-view of a complete dual-PMT WLS fiber detector is shown in Fig. 6. The single-PMT fiberdetector is identical to a dual-PMT detector, except that it is oper-ated with only one high-gain PMT. The photons from each50 cm � 50 cm scintillator tile are collected by 18 fibers for thehigh-gain PMT, whereas only 6 fibers are used for the low-gainPMT. The groups of 18 and 6 fibers for the high- and low-gain PMTsare placed inside 12 grooves, as has been described in the Section2. Two groups of fibers from the 4 scintillators are coupled to two
S fibers
Pulse High Voltage
Cookie holder
Low Gain PMT
the scintillator to high-gain PMT is 72 and to low-gain PMT is 24.
2000
4000
6000a
Num
ber
of E
vent
s
2000
4000
6000b
0 20 40 60 80
2000
4000
6000c
Photo-electrons
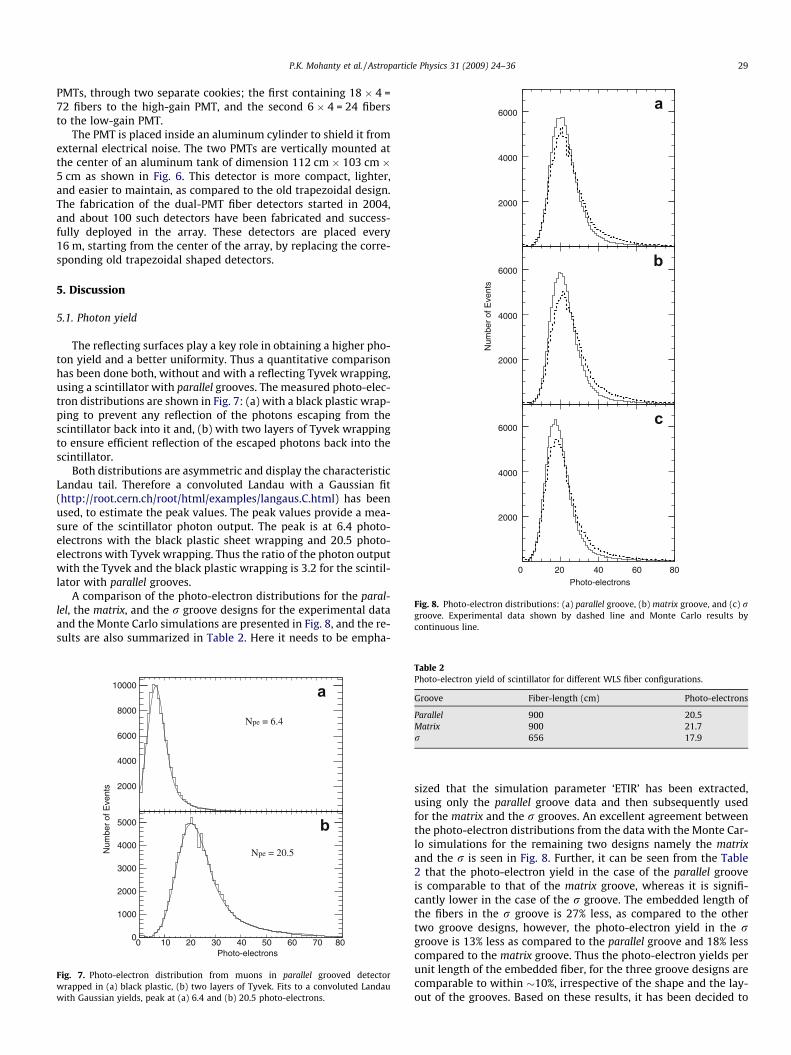
Fig. 8. Photo-electron distributions: (a) parallel groove, (b) matrix groove, and (c) rgroove. Experimental data shown by dashed line and Monte Carlo results bycontinuous line.
P.K. Mohanty et al. / Astroparticle Physics 31 (2009) 24–36 29
PMTs, through two separate cookies; the first containing 18 � 4 =72 fibers to the high-gain PMT, and the second 6 � 4 = 24 fibersto the low-gain PMT.
The PMT is placed inside an aluminum cylinder to shield it fromexternal electrical noise. The two PMTs are vertically mounted atthe center of an aluminum tank of dimension 112 cm � 103 cm �5 cm as shown in Fig. 6. This detector is more compact, lighter,and easier to maintain, as compared to the old trapezoidal design.The fabrication of the dual-PMT fiber detectors started in 2004,and about 100 such detectors have been fabricated and success-fully deployed in the array. These detectors are placed every16 m, starting from the center of the array, by replacing the corre-sponding old trapezoidal shaped detectors.
5. Discussion
5.1. Photon yield
The reflecting surfaces play a key role in obtaining a higher pho-ton yield and a better uniformity. Thus a quantitative comparisonhas been done both, without and with a reflecting Tyvek wrapping,using a scintillator with parallel grooves. The measured photo-elec-tron distributions are shown in Fig. 7: (a) with a black plastic wrap-ping to prevent any reflection of the photons escaping from thescintillator back into it and, (b) with two layers of Tyvek wrappingto ensure efficient reflection of the escaped photons back into thescintillator.
Both distributions are asymmetric and display the characteristicLandau tail. Therefore a convoluted Landau with a Gaussian fit(http://root.cern.ch/root/html/examples/langaus.C.html) has beenused, to estimate the peak values. The peak values provide a mea-sure of the scintillator photon output. The peak is at 6.4 photo-electrons with the black plastic sheet wrapping and 20.5 photo-electrons with Tyvek wrapping. Thus the ratio of the photon outputwith the Tyvek and the black plastic wrapping is 3.2 for the scintil-lator with parallel grooves.
A comparison of the photo-electron distributions for the paral-lel, the matrix, and the r groove designs for the experimental dataand the Monte Carlo simulations are presented in Fig. 8, and the re-sults are also summarized in Table 2. Here it needs to be empha-
2000
4000
6000
8000
10000
Photo-electrons0 10 20 30 40 50 60 70 80
Num
ber
of E
vent
s
0
1000
2000
3000
4000
5000
Npe = 6.4
Npe = 20.5
a
b
Fig. 7. Photo-electron distribution from muons in parallel grooved detectorwrapped in (a) black plastic, (b) two layers of Tyvek. Fits to a convoluted Landauwith Gaussian yields, peak at (a) 6.4 and (b) 20.5 photo-electrons.
Table 2Photo-electron yield of scintillator for different WLS fiber configurations.
Groove Fiber-length (cm) Photo-electrons
Parallel 900 20.5Matrix 900 21.7r 656 17.9
sized that the simulation parameter ‘ETIR’ has been extracted,using only the parallel groove data and then subsequently usedfor the matrix and the r grooves. An excellent agreement betweenthe photo-electron distributions from the data with the Monte Car-lo simulations for the remaining two designs namely the matrixand the r is seen in Fig. 8. Further, it can be seen from the Table2 that the photo-electron yield in the case of the parallel grooveis comparable to that of the matrix groove, whereas it is signifi-cantly lower in the case of the r groove. The embedded length ofthe fibers in the r groove is 27% less, as compared to the othertwo groove designs, however, the photo-electron yield in the rgroove is 13% less as compared to the parallel groove and 18% lesscompared to the matrix groove. Thus the photo-electron yields perunit length of the embedded fiber, for the three groove designs arecomparable to within �10%, irrespective of the shape and the lay-out of the grooves. Based on these results, it has been decided to
X (cm)
5040
3020
100
Y (cm)
5040
3020
10
60
70
80
90
100
X (cm)
5040
3020
100
Y (cm)
5040
3020
10
60
70
80
90
100
Fibers to PMT
Fibers to PMT
b
a
Nor
mal
ized
Pho
ton
Out
put
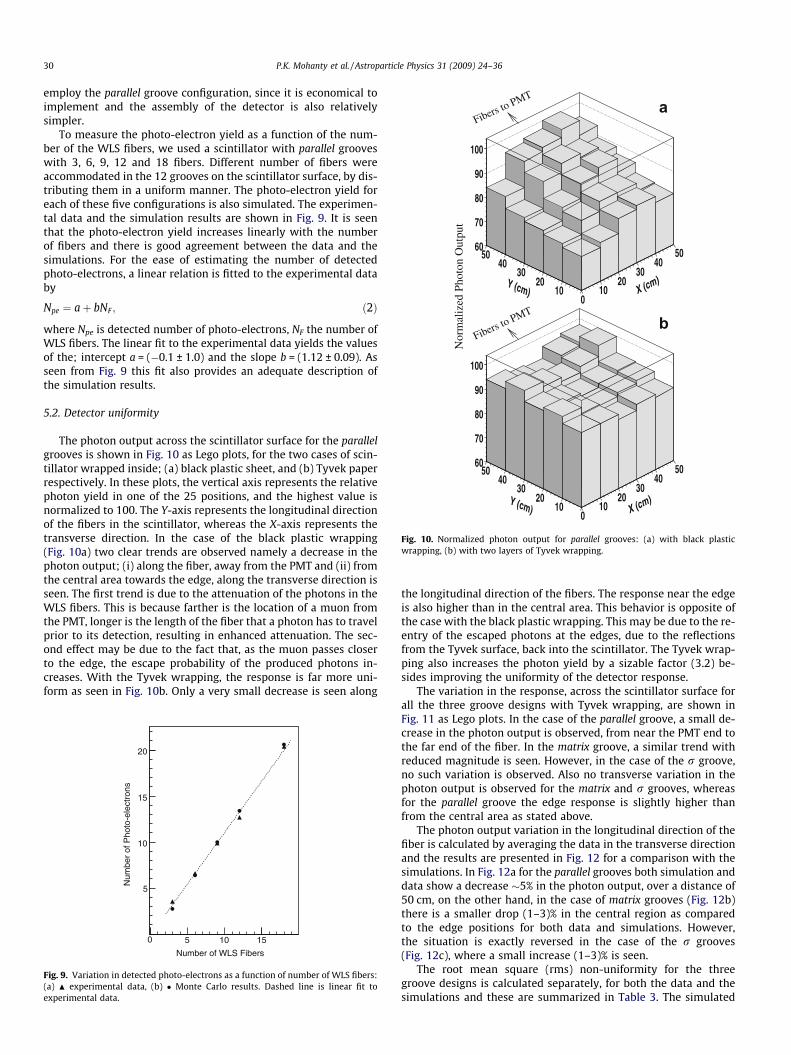
Fig. 10. Normalized photon output for parallel grooves: (a) with black plasticwrapping, (b) with two layers of Tyvek wrapping.
30 P.K. Mohanty et al. / Astroparticle Physics 31 (2009) 24–36
employ the parallel groove configuration, since it is economical toimplement and the assembly of the detector is also relativelysimpler.
To measure the photo-electron yield as a function of the num-ber of the WLS fibers, we used a scintillator with parallel grooveswith 3, 6, 9, 12 and 18 fibers. Different number of fibers wereaccommodated in the 12 grooves on the scintillator surface, by dis-tributing them in a uniform manner. The photo-electron yield foreach of these five configurations is also simulated. The experimen-tal data and the simulation results are shown in Fig. 9. It is seenthat the photo-electron yield increases linearly with the numberof fibers and there is good agreement between the data and thesimulations. For the ease of estimating the number of detectedphoto-electrons, a linear relation is fitted to the experimental databy
Npe ¼ aþ bNF ; ð2Þ
where Npe is detected number of photo-electrons, NF the number ofWLS fibers. The linear fit to the experimental data yields the valuesof the; intercept a = (�0.1 ± 1.0) and the slope b = (1.12 ± 0.09). Asseen from Fig. 9 this fit also provides an adequate description ofthe simulation results.
5.2. Detector uniformity
The photon output across the scintillator surface for the parallelgrooves is shown in Fig. 10 as Lego plots, for the two cases of scin-tillator wrapped inside; (a) black plastic sheet, and (b) Tyvek paperrespectively. In these plots, the vertical axis represents the relativephoton yield in one of the 25 positions, and the highest value isnormalized to 100. The Y-axis represents the longitudinal directionof the fibers in the scintillator, whereas the X-axis represents thetransverse direction. In the case of the black plastic wrapping(Fig. 10a) two clear trends are observed namely a decrease in thephoton output; (i) along the fiber, away from the PMT and (ii) fromthe central area towards the edge, along the transverse direction isseen. The first trend is due to the attenuation of the photons in theWLS fibers. This is because farther is the location of a muon fromthe PMT, longer is the length of the fiber that a photon has to travelprior to its detection, resulting in enhanced attenuation. The sec-ond effect may be due to the fact that, as the muon passes closerto the edge, the escape probability of the produced photons in-creases. With the Tyvek wrapping, the response is far more uni-form as seen in Fig. 10b. Only a very small decrease is seen along
0 5 10 15
Num
ber
of P
hoto
-ele
ctro
ns
5
10
15
20
Number of WLS Fibers
Fig. 9. Variation in detected photo-electrons as a function of number of WLS fibers:(a) N experimental data, (b) � Monte Carlo results. Dashed line is linear fit toexperimental data.
the longitudinal direction of the fibers. The response near the edgeis also higher than in the central area. This behavior is opposite ofthe case with the black plastic wrapping. This may be due to the re-entry of the escaped photons at the edges, due to the reflectionsfrom the Tyvek surface, back into the scintillator. The Tyvek wrap-ping also increases the photon yield by a sizable factor (3.2) be-sides improving the uniformity of the detector response.
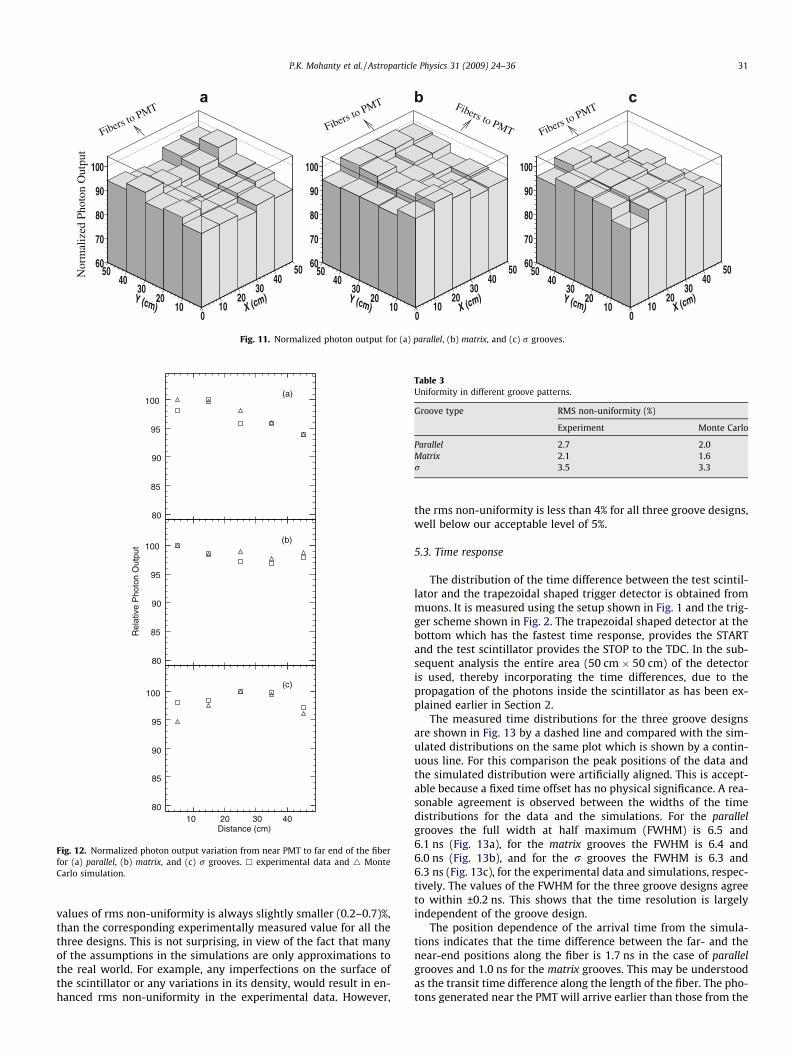
The variation in the response, across the scintillator surface forall the three groove designs with Tyvek wrapping, are shown inFig. 11 as Lego plots. In the case of the parallel groove, a small de-crease in the photon output is observed, from near the PMT end tothe far end of the fiber. In the matrix groove, a similar trend withreduced magnitude is seen. However, in the case of the r groove,no such variation is observed. Also no transverse variation in thephoton output is observed for the matrix and r grooves, whereasfor the parallel groove the edge response is slightly higher thanfrom the central area as stated above.
The photon output variation in the longitudinal direction of thefiber is calculated by averaging the data in the transverse directionand the results are presented in Fig. 12 for a comparison with thesimulations. In Fig. 12a for the parallel grooves both simulation anddata show a decrease �5% in the photon output, over a distance of50 cm, on the other hand, in the case of matrix grooves (Fig. 12b)there is a smaller drop (1–3)% in the central region as comparedto the edge positions for both data and simulations. However,the situation is exactly reversed in the case of the r grooves(Fig. 12c), where a small increase (1–3)% is seen.
The root mean square (rms) non-uniformity for the threegroove designs is calculated separately, for both the data and thesimulations and these are summarized in Table 3. The simulated
X (cm)
5040
3020
100
Y (cm)
5040
3020
10
60
70
80
90
100
X (cm)
5040
3020
100
Y (cm)
5040
3020
10
60
70
80
90
100
X (cm)
5040
3020
100
Y (cm)
5040
3020
10
60
70
80
90
100
a b c
Fibers to PMT
Fibers to PMT
Fibers to PMTFibers to PMT
Nor
mal
ized
Pho
ton
Out
put
Fig. 11. Normalized photon output for (a) parallel, (b) matrix, and (c) r grooves.
80
85
90
95
100(a)
Rel
ativ
e P
hoto
n O
utpu
t
80
85
90
95
100(b)
10 20 30 4080
85
90
95
100(c)
Distance (cm)
Fig. 12. Normalized photon output variation from near PMT to far end of the fiberfor (a) parallel, (b) matrix, and (c) r grooves. h experimental data and 4 MonteCarlo simulation.
Table 3Uniformity in different groove patterns.
Groove type RMS non-uniformity (%)
Experiment Monte Carlo
Parallel 2.7 2.0Matrix 2.1 1.6r 3.5 3.3
P.K. Mohanty et al. / Astroparticle Physics 31 (2009) 24–36 31
values of rms non-uniformity is always slightly smaller (0.2–0.7)%,than the corresponding experimentally measured value for all thethree designs. This is not surprising, in view of the fact that manyof the assumptions in the simulations are only approximations tothe real world. For example, any imperfections on the surface ofthe scintillator or any variations in its density, would result in en-hanced rms non-uniformity in the experimental data. However,
the rms non-uniformity is less than 4% for all three groove designs,well below our acceptable level of 5%.
5.3. Time response
The distribution of the time difference between the test scintil-lator and the trapezoidal shaped trigger detector is obtained frommuons. It is measured using the setup shown in Fig. 1 and the trig-ger scheme shown in Fig. 2. The trapezoidal shaped detector at thebottom which has the fastest time response, provides the STARTand the test scintillator provides the STOP to the TDC. In the sub-sequent analysis the entire area (50 cm � 50 cm) of the detectoris used, thereby incorporating the time differences, due to thepropagation of the photons inside the scintillator as has been ex-plained earlier in Section 2.
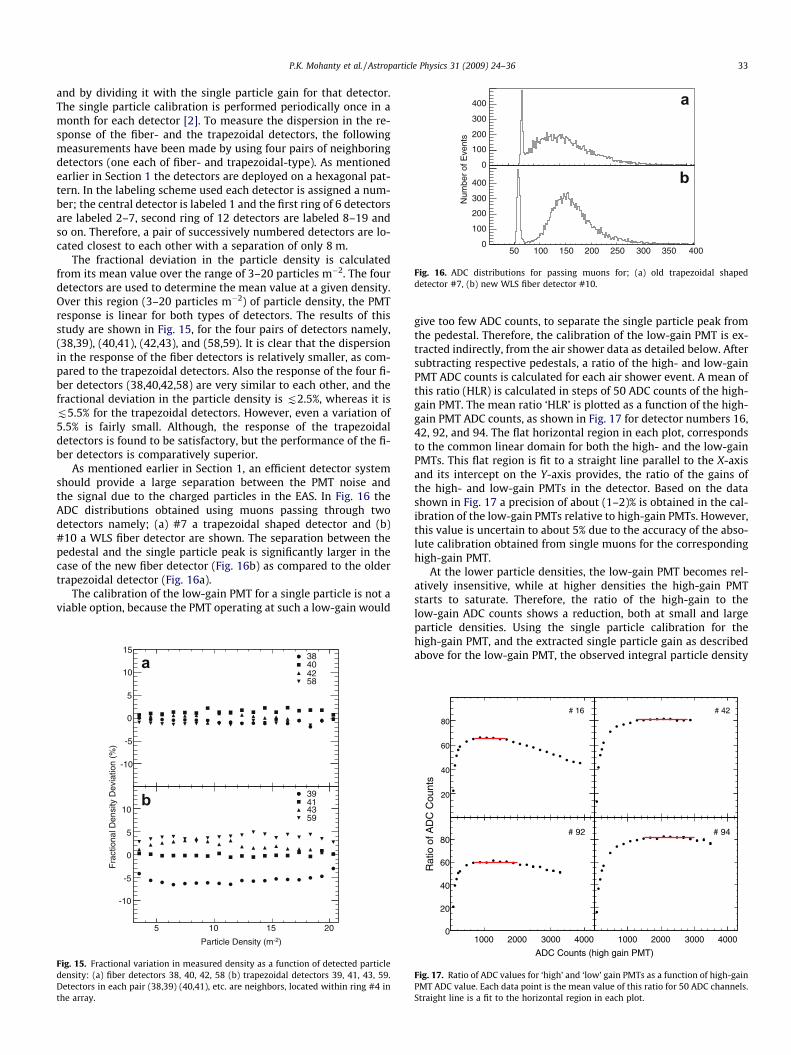
The measured time distributions for the three groove designsare shown in Fig. 13 by a dashed line and compared with the sim-ulated distributions on the same plot which is shown by a contin-uous line. For this comparison the peak positions of the data andthe simulated distribution were artificially aligned. This is accept-able because a fixed time offset has no physical significance. A rea-sonable agreement is observed between the widths of the timedistributions for the data and the simulations. For the parallelgrooves the full width at half maximum (FWHM) is 6.5 and6.1 ns (Fig. 13a), for the matrix grooves the FWHM is 6.4 and6.0 ns (Fig. 13b), and for the r grooves the FWHM is 6.3 and6.3 ns (Fig. 13c), for the experimental data and simulations, respec-tively. The values of the FWHM for the three groove designs agreeto within ±0.2 ns. This shows that the time resolution is largelyindependent of the groove design.
The position dependence of the arrival time from the simula-tions indicates that the time difference between the far- and thenear-end positions along the fiber is 1.7 ns in the case of parallelgrooves and 1.0 ns for the matrix grooves. This may be understoodas the transit time difference along the length of the fiber. The pho-tons generated near the PMT will arrive earlier than those from the
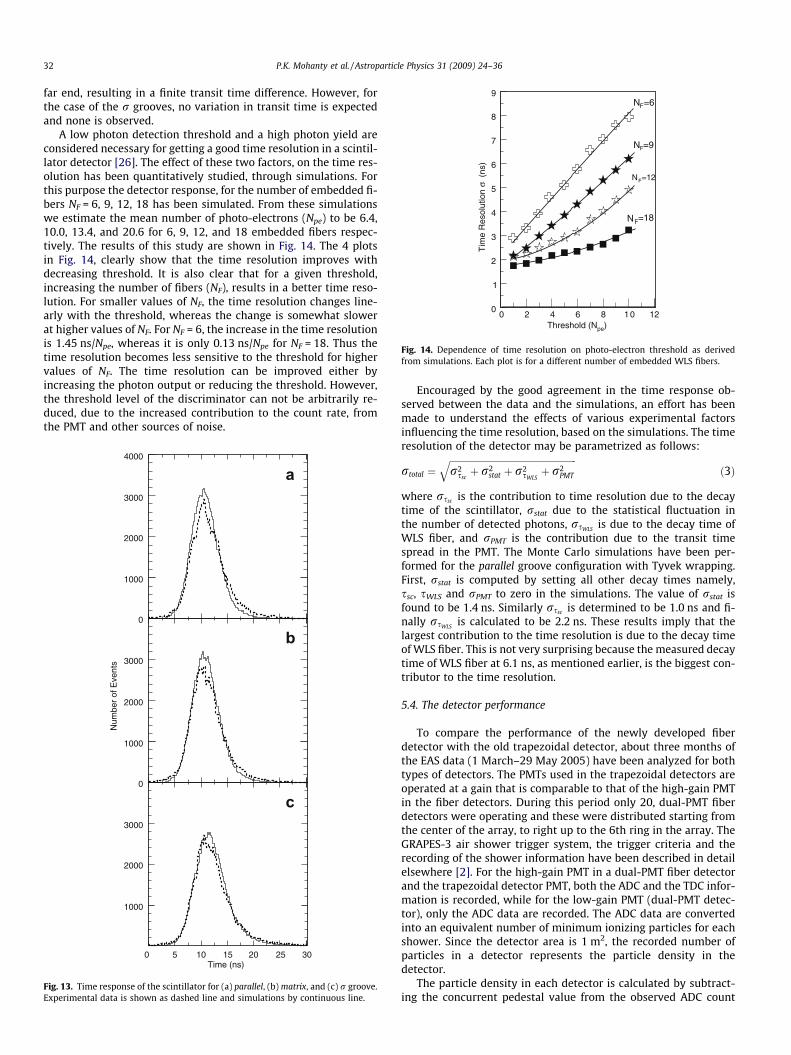
Threshold (Npe)0 2 4 6 8 10 12
Tim
e R
esol
utio
n σ
(ns
)
0
1
2
3
4
5
6
7
8
9=6FN
=9FN
=12FN
=18FN
Fig. 14. Dependence of time resolution on photo-electron threshold as derivedfrom simulations. Each plot is for a different number of embedded WLS fibers.
32 P.K. Mohanty et al. / Astroparticle Physics 31 (2009) 24–36
far end, resulting in a finite transit time difference. However, forthe case of the r grooves, no variation in transit time is expectedand none is observed.
A low photon detection threshold and a high photon yield areconsidered necessary for getting a good time resolution in a scintil-lator detector [26]. The effect of these two factors, on the time res-olution has been quantitatively studied, through simulations. Forthis purpose the detector response, for the number of embedded fi-bers NF = 6, 9, 12, 18 has been simulated. From these simulationswe estimate the mean number of photo-electrons (Npe) to be 6.4,10.0, 13.4, and 20.6 for 6, 9, 12, and 18 embedded fibers respec-tively. The results of this study are shown in Fig. 14. The 4 plotsin Fig. 14, clearly show that the time resolution improves withdecreasing threshold. It is also clear that for a given threshold,increasing the number of fibers (NF), results in a better time reso-lution. For smaller values of NF, the time resolution changes line-arly with the threshold, whereas the change is somewhat slowerat higher values of NF. For NF = 6, the increase in the time resolutionis 1.45 ns/Npe, whereas it is only 0.13 ns/Npe for NF = 18. Thus thetime resolution becomes less sensitive to the threshold for highervalues of NF. The time resolution can be improved either byincreasing the photon output or reducing the threshold. However,the threshold level of the discriminator can not be arbitrarily re-duced, due to the increased contribution to the count rate, fromthe PMT and other sources of noise.
1000
2000
3000
4000
a
Num
ber
of E
vent
s
1000
2000
3000
0
b
0 5 10 15 20 25 30
1000
2000
3000
0
c
Time (ns)
Fig. 13. Time response of the scintillator for (a) parallel, (b) matrix, and (c) r groove.Experimental data is shown as dashed line and simulations by continuous line.
Encouraged by the good agreement in the time response ob-served between the data and the simulations, an effort has beenmade to understand the effects of various experimental factorsinfluencing the time resolution, based on the simulations. The timeresolution of the detector may be parametrized as follows:
rtotal ¼ffiffiffiffiffiffiffiffiffiffiffiffiffiffiffiffiffiffiffiffiffiffiffiffiffiffiffiffiffiffiffiffiffiffiffiffiffiffiffiffiffiffiffiffiffiffiffiffiffiffiffiffiffiffiffir2
sscþ r2
stat þ r2sWLSþ r2
PMT
qð3Þ
where rssc is the contribution to time resolution due to the decaytime of the scintillator, rstat due to the statistical fluctuation inthe number of detected photons, rsWLS is due to the decay time ofWLS fiber, and rPMT is the contribution due to the transit timespread in the PMT. The Monte Carlo simulations have been per-formed for the parallel groove configuration with Tyvek wrapping.First, rstat is computed by setting all other decay times namely,ssc, sWLS and rPMT to zero in the simulations. The value of rstat isfound to be 1.4 ns. Similarly rssc is determined to be 1.0 ns and fi-nally rsWLS is calculated to be 2.2 ns. These results imply that thelargest contribution to the time resolution is due to the decay timeof WLS fiber. This is not very surprising because the measured decaytime of WLS fiber at 6.1 ns, as mentioned earlier, is the biggest con-tributor to the time resolution.
5.4. The detector performance
To compare the performance of the newly developed fiberdetector with the old trapezoidal detector, about three months ofthe EAS data (1 March–29 May 2005) have been analyzed for bothtypes of detectors. The PMTs used in the trapezoidal detectors areoperated at a gain that is comparable to that of the high-gain PMTin the fiber detectors. During this period only 20, dual-PMT fiberdetectors were operating and these were distributed starting fromthe center of the array, to right up to the 6th ring in the array. TheGRAPES-3 air shower trigger system, the trigger criteria and therecording of the shower information have been described in detailelsewhere [2]. For the high-gain PMT in a dual-PMT fiber detectorand the trapezoidal detector PMT, both the ADC and the TDC infor-mation is recorded, while for the low-gain PMT (dual-PMT detec-tor), only the ADC data are recorded. The ADC data are convertedinto an equivalent number of minimum ionizing particles for eachshower. Since the detector area is 1 m2, the recorded number ofparticles in a detector represents the particle density in thedetector.
The particle density in each detector is calculated by subtract-ing the concurrent pedestal value from the observed ADC count
0
100
200
300
400 a
Num
ber
of E
vent
s
50 100 150 200 250 300 350 4000
100
200
300
400 b
Fig. 16. ADC distributions for passing muons for; (a) old trapezoidal shapeddetector #7, (b) new WLS fiber detector #10.
P.K. Mohanty et al. / Astroparticle Physics 31 (2009) 24–36 33
and by dividing it with the single particle gain for that detector.The single particle calibration is performed periodically once in amonth for each detector [2]. To measure the dispersion in the re-sponse of the fiber- and the trapezoidal detectors, the followingmeasurements have been made by using four pairs of neighboringdetectors (one each of fiber- and trapezoidal-type). As mentionedearlier in Section 1 the detectors are deployed on a hexagonal pat-tern. In the labeling scheme used each detector is assigned a num-ber; the central detector is labeled 1 and the first ring of 6 detectorsare labeled 2–7, second ring of 12 detectors are labeled 8–19 andso on. Therefore, a pair of successively numbered detectors are lo-cated closest to each other with a separation of only 8 m.
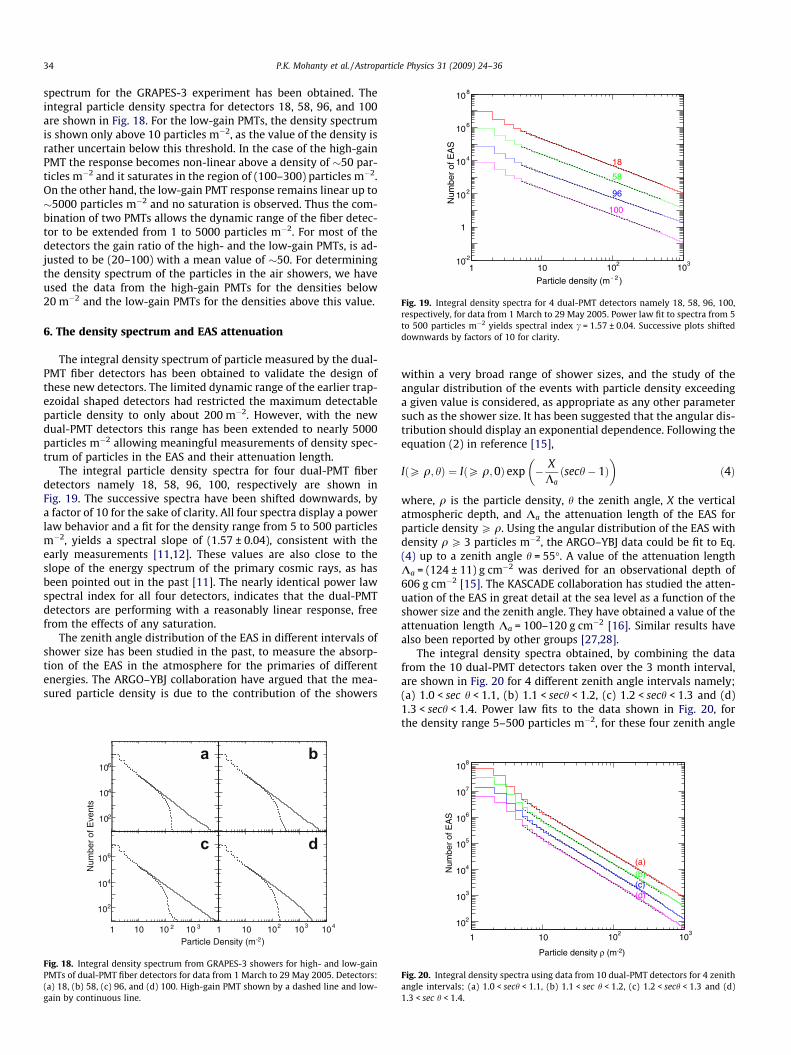
The fractional deviation in the particle density is calculatedfrom its mean value over the range of 3–20 particles m�2. The fourdetectors are used to determine the mean value at a given density.Over this region (3–20 particles m�2) of particle density, the PMTresponse is linear for both types of detectors. The results of thisstudy are shown in Fig. 15, for the four pairs of detectors namely,(38,39), (40,41), (42,43), and (58,59). It is clear that the dispersionin the response of the fiber detectors is relatively smaller, as com-pared to the trapezoidal detectors. Also the response of the four fi-ber detectors (38,40,42,58) are very similar to each other, and thefractional deviation in the particle density is [2.5%, whereas it is[5.5% for the trapezoidal detectors. However, even a variation of5.5% is fairly small. Although, the response of the trapezoidaldetectors is found to be satisfactory, but the performance of the fi-ber detectors is comparatively superior.
As mentioned earlier in Section 1, an efficient detector systemshould provide a large separation between the PMT noise andthe signal due to the charged particles in the EAS. In Fig. 16 theADC distributions obtained using muons passing through twodetectors namely; (a) #7 a trapezoidal shaped detector and (b)#10 a WLS fiber detector are shown. The separation between thepedestal and the single particle peak is significantly larger in thecase of the new fiber detector (Fig. 16b) as compared to the oldertrapezoidal detector (Fig. 16a).
The calibration of the low-gain PMT for a single particle is not aviable option, because the PMT operating at such a low-gain would
-10
-5
0
5
10
15
a 38 40 42 58
Particle Density (m-2)
5 10 15 20
-10
-5
0
5
10b 39
41 43 59
Fra
ctio
nal D
ensi
ty D
evia
tion
(%)
Fig. 15. Fractional variation in measured density as a function of detected particledensity: (a) fiber detectors 38, 40, 42, 58 (b) trapezoidal detectors 39, 41, 43, 59.Detectors in each pair (38,39) (40,41), etc. are neighbors, located within ring #4 inthe array.
give too few ADC counts, to separate the single particle peak fromthe pedestal. Therefore, the calibration of the low-gain PMT is ex-tracted indirectly, from the air shower data as detailed below. Aftersubtracting respective pedestals, a ratio of the high- and low-gainPMT ADC counts is calculated for each air shower event. A mean ofthis ratio (HLR) is calculated in steps of 50 ADC counts of the high-gain PMT. The mean ratio ‘HLR’ is plotted as a function of the high-gain PMT ADC counts, as shown in Fig. 17 for detector numbers 16,42, 92, and 94. The flat horizontal region in each plot, correspondsto the common linear domain for both the high- and the low-gainPMTs. This flat region is fit to a straight line parallel to the X-axisand its intercept on the Y-axis provides, the ratio of the gains ofthe high- and low-gain PMTs in the detector. Based on the datashown in Fig. 17 a precision of about (1–2)% is obtained in the cal-ibration of the low-gain PMTs relative to high-gain PMTs. However,this value is uncertain to about 5% due to the accuracy of the abso-lute calibration obtained from single muons for the correspondinghigh-gain PMT.
At the lower particle densities, the low-gain PMT becomes rel-atively insensitive, while at higher densities the high-gain PMTstarts to saturate. Therefore, the ratio of the high-gain to thelow-gain ADC counts shows a reduction, both at small and largeparticle densities. Using the single particle calibration for thehigh-gain PMT, and the extracted single particle gain as describedabove for the low-gain PMT, the observed integral particle density
20
40
60
80# 16
1000 2000 3000 40000
20
40
60
80# 92
# 42
1000 2000 3000 4000
# 94
Rat
io o
f AD
C C
ount
s
ADC Counts (high gain PMT)
Fig. 17. Ratio of ADC values for ‘high’ and ‘low’ gain PMTs as a function of high-gainPMT ADC value. Each data point is the mean value of this ratio for 50 ADC channels.Straight line is a fit to the horizontal region in each plot.
) - 2Particle density (m1 10
2103
10
Num
ber
of E
AS
-210
1
210
410
610
810
18
58
96
100
Fig. 19. Integral density spectra for 4 dual-PMT detectors namely 18, 58, 96, 100,respectively, for data from 1 March to 29 May 2005. Power law fit to spectra from 5to 500 particles m�2 yields spectral index c = 1.57 ± 0.04. Successive plots shifteddownwards by factors of 10 for clarity.
34 P.K. Mohanty et al. / Astroparticle Physics 31 (2009) 24–36
spectrum for the GRAPES-3 experiment has been obtained. Theintegral particle density spectra for detectors 18, 58, 96, and 100are shown in Fig. 18. For the low-gain PMTs, the density spectrumis shown only above 10 particles m�2, as the value of the density israther uncertain below this threshold. In the case of the high-gainPMT the response becomes non-linear above a density of �50 par-ticles m�2 and it saturates in the region of (100–300) particles m�2.On the other hand, the low-gain PMT response remains linear up to�5000 particles m�2 and no saturation is observed. Thus the com-bination of two PMTs allows the dynamic range of the fiber detec-tor to be extended from 1 to 5000 particles m�2. For most of thedetectors the gain ratio of the high- and the low-gain PMTs, is ad-justed to be (20–100) with a mean value of �50. For determiningthe density spectrum of the particles in the air showers, we haveused the data from the high-gain PMTs for the densities below20 m�2 and the low-gain PMTs for the densities above this value.
6. The density spectrum and EAS attenuation
The integral density spectrum of particle measured by the dual-PMT fiber detectors has been obtained to validate the design ofthese new detectors. The limited dynamic range of the earlier trap-ezoidal shaped detectors had restricted the maximum detectableparticle density to only about 200 m�2. However, with the newdual-PMT detectors this range has been extended to nearly 5000particles m�2 allowing meaningful measurements of density spec-trum of particles in the EAS and their attenuation length.
The integral particle density spectra for four dual-PMT fiberdetectors namely 18, 58, 96, 100, respectively are shown inFig. 19. The successive spectra have been shifted downwards, bya factor of 10 for the sake of clarity. All four spectra display a powerlaw behavior and a fit for the density range from 5 to 500 particlesm�2, yields a spectral slope of (1.57 ± 0.04), consistent with theearly measurements [11,12]. These values are also close to theslope of the energy spectrum of the primary cosmic rays, as hasbeen pointed out in the past [11]. The nearly identical power lawspectral index for all four detectors, indicates that the dual-PMTdetectors are performing with a reasonably linear response, freefrom the effects of any saturation.
The zenith angle distribution of the EAS in different intervals ofshower size has been studied in the past, to measure the absorp-tion of the EAS in the atmosphere for the primaries of differentenergies. The ARGO–YBJ collaboration have argued that the mea-sured particle density is due to the contribution of the showers
210
410
610a
1 10 210 310
Num
ber
of E
vent
s
210
410
610c
b
1 10 210 310 410
d
)-2Particle Density (m
Fig. 18. Integral density spectrum from GRAPES-3 showers for high- and low-gainPMTs of dual-PMT fiber detectors for data from 1 March to 29 May 2005. Detectors:(a) 18, (b) 58, (c) 96, and (d) 100. High-gain PMT shown by a dashed line and low-gain by continuous line.
within a very broad range of shower sizes, and the study of theangular distribution of the events with particle density exceedinga given value is considered, as appropriate as any other parametersuch as the shower size. It has been suggested that the angular dis-tribution should display an exponential dependence. Following theequation (2) in reference [15],
IðP q; hÞ ¼ IðP q;0Þ exp � XKaðsech� 1Þ
� �ð4Þ
where, q is the particle density, h the zenith angle, X the verticalatmospheric depth, and Ka the attenuation length of the EAS forparticle density P q. Using the angular distribution of the EAS withdensity q P 3 particles m�2, the ARGO–YBJ data could be fit to Eq.(4) up to a zenith angle h = 55�. A value of the attenuation lengthKa = (124 ± 11) g cm�2 was derived for an observational depth of606 g cm�2 [15]. The KASCADE collaboration has studied the atten-uation of the EAS in great detail at the sea level as a function of theshower size and the zenith angle. They have obtained a value of theattenuation length Ka = 100–120 g cm�2 [16]. Similar results havealso been reported by other groups [27,28].
The integral density spectra obtained, by combining the datafrom the 10 dual-PMT detectors taken over the 3 month interval,are shown in Fig. 20 for 4 different zenith angle intervals namely;(a) 1.0 < sec h < 1.1, (b) 1.1 < sech < 1.2, (c) 1.2 < sech < 1.3 and (d)1.3 < sech < 1.4. Power law fits to the data shown in Fig. 20, forthe density range 5–500 particles m�2, for these four zenith angle
Particle density ρ (m-2)
1 10210
310
Num
ber
of E
AS
210
310
410
510
610
710
810
(a)(b)(c)(d)
Fig. 20. Integral density spectra using data from 10 dual-PMT detectors for 4 zenithangle intervals; (a) 1.0 < sech < 1.1, (b) 1.1 < sec h < 1.2, (c) 1.2 < sech < 1.3 and (d)1.3 < sec h < 1.4.
P.K. Mohanty et al. / Astroparticle Physics 31 (2009) 24–36 35
intervals are shown by dashed line. The magnitude of the spectralindex c shows a small, but gradual increase with the increasing ze-nith angle. The fitted values of the spectral index c are 1.64, 1.65,1.69, 1.71 for the four zenith angle intervals listed above. A similarbehavior has also been reported earlier [29].
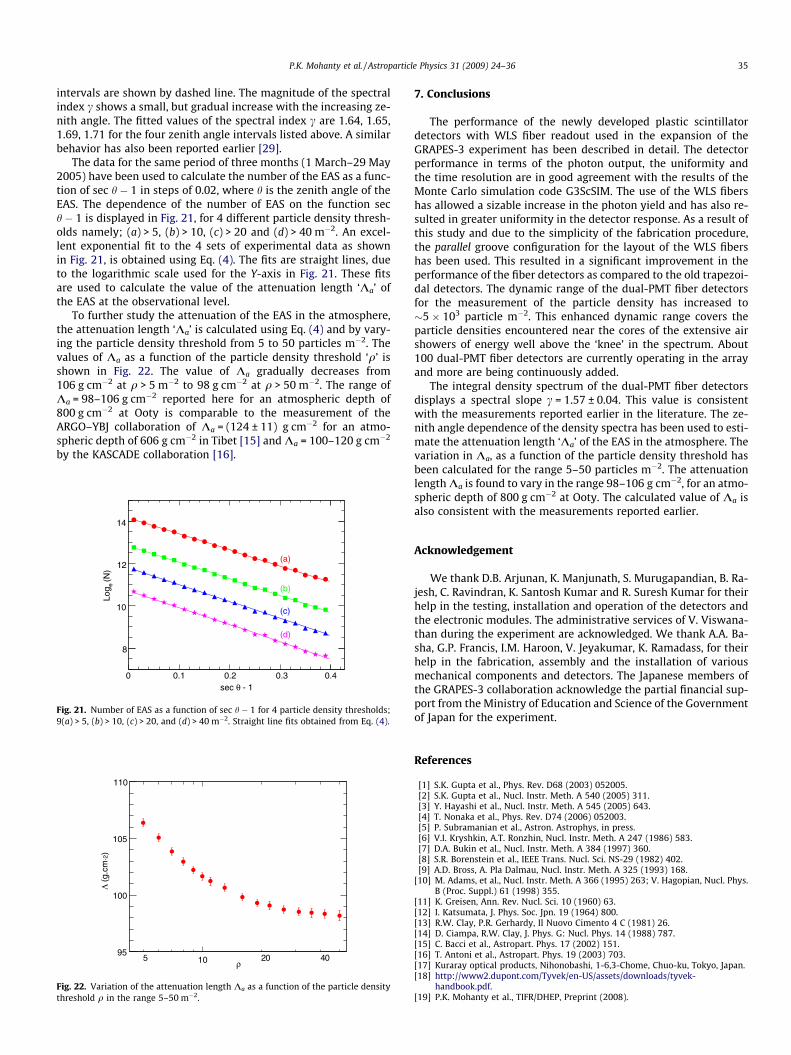
The data for the same period of three months (1 March–29 May2005) have been used to calculate the number of the EAS as a func-tion of sec h � 1 in steps of 0.02, where h is the zenith angle of theEAS. The dependence of the number of EAS on the function sech � 1 is displayed in Fig. 21, for 4 different particle density thresh-olds namely; (a) > 5, (b) > 10, (c) > 20 and (d) > 40 m�2. An excel-lent exponential fit to the 4 sets of experimental data as shownin Fig. 21, is obtained using Eq. (4). The fits are straight lines, dueto the logarithmic scale used for the Y-axis in Fig. 21. These fitsare used to calculate the value of the attenuation length ‘Ka’ ofthe EAS at the observational level.
To further study the attenuation of the EAS in the atmosphere,the attenuation length ‘Ka’ is calculated using Eq. (4) and by vary-ing the particle density threshold from 5 to 50 particles m�2. Thevalues of Ka as a function of the particle density threshold ‘q’ isshown in Fig. 22. The value of Ka gradually decreases from106 g cm�2 at q > 5 m�2 to 98 g cm�2 at q > 50 m�2. The range ofKa = 98–106 g cm�2 reported here for an atmospheric depth of800 g cm�2 at Ooty is comparable to the measurement of theARGO–YBJ collaboration of Ka = (124 ± 11) g cm�2 for an atmo-spheric depth of 606 g cm�2 in Tibet [15] and Ka = 100–120 g cm�2
by the KASCADE collaboration [16].
sec θ - 10 0.1 0.2 0.3 0.4
Log e
(N)
8
10
12
14
(a)
(b)
(c)
(d)
Fig. 21. Number of EAS as a function of sec h � 1 for 4 particle density thresholds;9(a) > 5, (b) > 10, (c) > 20, and (d) > 40 m�2. Straight line fits obtained from Eq. (4).
ρ10
(g.
cm-2
)Λ
95
100
105
110
25 0 40
Fig. 22. Variation of the attenuation length Ka as a function of the particle densitythreshold q in the range 5–50 m�2.
7. Conclusions
The performance of the newly developed plastic scintillatordetectors with WLS fiber readout used in the expansion of theGRAPES-3 experiment has been described in detail. The detectorperformance in terms of the photon output, the uniformity andthe time resolution are in good agreement with the results of theMonte Carlo simulation code G3ScSIM. The use of the WLS fibershas allowed a sizable increase in the photon yield and has also re-sulted in greater uniformity in the detector response. As a result ofthis study and due to the simplicity of the fabrication procedure,the parallel groove configuration for the layout of the WLS fibershas been used. This resulted in a significant improvement in theperformance of the fiber detectors as compared to the old trapezoi-dal detectors. The dynamic range of the dual-PMT fiber detectorsfor the measurement of the particle density has increased to�5 � 103 particle m�2. This enhanced dynamic range covers theparticle densities encountered near the cores of the extensive airshowers of energy well above the ‘knee’ in the spectrum. About100 dual-PMT fiber detectors are currently operating in the arrayand more are being continuously added.
The integral density spectrum of the dual-PMT fiber detectorsdisplays a spectral slope c = 1.57 ± 0.04. This value is consistentwith the measurements reported earlier in the literature. The ze-nith angle dependence of the density spectra has been used to esti-mate the attenuation length ‘Ka’ of the EAS in the atmosphere. Thevariation in Ka, as a function of the particle density threshold hasbeen calculated for the range 5–50 particles m�2. The attenuationlength Ka is found to vary in the range 98–106 g cm�2, for an atmo-spheric depth of 800 g cm�2 at Ooty. The calculated value of Ka isalso consistent with the measurements reported earlier.
Acknowledgement
We thank D.B. Arjunan, K. Manjunath, S. Murugapandian, B. Ra-jesh, C. Ravindran, K. Santosh Kumar and R. Suresh Kumar for theirhelp in the testing, installation and operation of the detectors andthe electronic modules. The administrative services of V. Viswana-than during the experiment are acknowledged. We thank A.A. Ba-sha, G.P. Francis, I.M. Haroon, V. Jeyakumar, K. Ramadass, for theirhelp in the fabrication, assembly and the installation of variousmechanical components and detectors. The Japanese members ofthe GRAPES-3 collaboration acknowledge the partial financial sup-port from the Ministry of Education and Science of the Governmentof Japan for the experiment.
References
[1] S.K. Gupta et al., Phys. Rev. D68 (2003) 052005.[2] S.K. Gupta et al., Nucl. Instr. Meth. A 540 (2005) 311.[3] Y. Hayashi et al., Nucl. Instr. Meth. A 545 (2005) 643.[4] T. Nonaka et al., Phys. Rev. D74 (2006) 052003.[5] P. Subramanian et al., Astron. Astrophys, in press.[6] V.I. Kryshkin, A.T. Ronzhin, Nucl. Instr. Meth. A 247 (1986) 583.[7] D.A. Bukin et al., Nucl. Instr. Meth. A 384 (1997) 360.[8] S.R. Borenstein et al., IEEE Trans. Nucl. Sci. NS-29 (1982) 402.[9] A.D. Bross, A. Pla Dalmau, Nucl. Instr. Meth. A 325 (1993) 168.
[10] M. Adams, et al., Nucl. Instr. Meth. A 366 (1995) 263; V. Hagopian, Nucl. Phys.B (Proc. Suppl.) 61 (1998) 355.
[11] K. Greisen, Ann. Rev. Nucl. Sci. 10 (1960) 63.[12] I. Katsumata, J. Phys. Soc. Jpn. 19 (1964) 800.[13] R.W. Clay, P.R. Gerhardy, Il Nuovo Cimento 4 C (1981) 26.[14] D. Ciampa, R.W. Clay, J. Phys. G: Nucl. Phys. 14 (1988) 787.[15] C. Bacci et al., Astropart. Phys. 17 (2002) 151.[16] T. Antoni et al., Astropart. Phys. 19 (2003) 703.[17] Kuraray optical products, Nihonobashi, 1-6,3-Chome, Chuo-ku, Tokyo, Japan.[18] http://www2.dupont.com/Tyvek/en-US/assets/downloads/tyvek-
handbook.pdf.[19] P.K. Mohanty et al., TIFR/DHEP, Preprint (2008).

36 P.K. Mohanty et al. / Astroparticle Physics 31 (2009) 24–36
[20] L.D. Landau, J. Exp. Phys. (USSR) 8 (1944) 201.[21] D.H. Wilkinson, Nucl. Instr. Meth. A 383 (1996) 513.[22] K.S. Kolbig, B. Schorr, Comput. Phys. Commun. 31 (1984) 97.[23] M. Aguilar-Benitez et al., Phys. Lett. B 170 (1986) 1.[24] N.S. Kapany, Fiber Optics: Principles and Applications, Academic Press, London
and New York, 1967.
[25] W.L. Leo, Techniques for Nuclear and Particle Physics Experiments, NarosaPublishing House, New Delhi, 1995.
[26] M. Moszynski, Nucl. Instr. Meth. A 158 (1979) 1.[27] D.E. Alexandreas et al., Nucl. Instr. Meth. A 328 (1992) 570.[28] M. Aglietta et al., Nucl. Phys. B (Proc. Suppl.) 70 (1999) 509.[29] J.D. Hollows, H.W. Hunter, A.N. Suri J. Phys. A: Gen. Phys. 2 (1969) 591.
Related Documents


