JKAU: Eng. Sci., Vol. 20 No. 2, pp: 81-93 (2009 A.D. / 1430 A.H.) 81 Measurement of Size Distribution of Blasted Rock Using Digital Image Processing F.I. Siddiqui, S.M. Ali Shah and M. Y. Behan Department of Mining Engineering, Mehran University of Eng. and Tech., Jamshoro, Pakistan [email protected] Abstract. The purpose of this study is to measure the size distribution of blasted rock using the digital image processing software “Split- Desktop system” in order to evaluate the efficiency of blasting operation. Site of study is a limestone quarry producing limestone for cement manufacturing. Fragmentation is the ultimate measure of efficiency of any production blasting operations. The degree of fragmentation plays an important role in order to control and minimize the loading, hauling, and crushing costs. The size distribution analysis of the rock fragmentation by sieving is a direct and accurate method but it is very time consuming and costly. Fragmentation analysis by digital image processing is a low cost and quick method. Split system is one of the digital image processing software developed to compute the size distribution of fragmented rock from digital images. In this study, size distributions were analyzed by using Split Desktop ® system. In the analysis, the mean fragment size obtained is 149.76 mm and top-size 1057.44 mm. 25% of the fragments are below 30 mm. A thorough appraisal of blasting operation is suggested to enhance the efficiency of all the post-blast operations such as Loading, Hauling, crushing and Grinding and also reduces the cost of secondary breakage. Keywords: Fragmentation, Rock blasting, Digital image processing, Split-Desktop 1. Introduction The key objective of production blasting is to achieve optimum rock fragmentation. The degree of rock fragmentation plays an important role in order to control and minimize the overall production cost including

Welcome message from author
This document is posted to help you gain knowledge. Please leave a comment to let me know what you think about it! Share it to your friends and learn new things together.
Transcript
JKAU: Eng. Sci., Vol. 20 No. 2, pp: 81-93 (2009 A.D. / 1430 A.H.)
81
Measurement of Size Distribution of Blasted Rock Using
Digital Image Processing
F.I. Siddiqui, S.M. Ali Shah and M. Y. Behan
Department of Mining Engineering,
Mehran University of Eng. and Tech., Jamshoro, Pakistan
Abstract. The purpose of this study is to measure the size distribution
of blasted rock using the digital image processing software “Split-
Desktop system” in order to evaluate the efficiency of blasting
operation. Site of study is a limestone quarry producing limestone for
cement manufacturing. Fragmentation is the ultimate measure of
efficiency of any production blasting operations. The degree of
fragmentation plays an important role in order to control and minimize
the loading, hauling, and crushing costs.
The size distribution analysis of the rock fragmentation by
sieving is a direct and accurate method but it is very time consuming
and costly. Fragmentation analysis by digital image processing is a
low cost and quick method. Split system is one of the digital image
processing software developed to compute the size distribution of
fragmented rock from digital images. In this study, size distributions
were analyzed by using Split Desktop ® system. In the analysis, the
mean fragment size obtained is 149.76 mm and top-size 1057.44 mm.
25% of the fragments are below 30 mm. A thorough appraisal of
blasting operation is suggested to enhance the efficiency of all the
post-blast operations such as Loading, Hauling, crushing and Grinding
and also reduces the cost of secondary breakage.
Keywords: Fragmentation, Rock blasting, Digital image processing,
Split-Desktop
1. Introduction
The key objective of production blasting is to achieve optimum rock
fragmentation. The degree of rock fragmentation plays an important role
in order to control and minimize the overall production cost including
F.I. Siddiqui, et al. 82
loading, hauling, and crushing costs. Optimum rock fragmentation
improves the energy efficiency of comminution (Crushing & Grinding)
processes and thousands of kilowatt-hours energy per year can also be
saved.
Blasting is the first step of the size reduction in mining and it is
followed by crushing and grinding unit operations. The efficiency of
these unit operations is directly related to the size distribution of
muckpile. Therefore, reliable evaluation of fragmentation is a critical
mining problem[1]
.
Production of finer fragments in blasting operation reduces the work-
load of primary crushers; therefore increasing the crusher efficiency and
reducing the crushing cost. Also crushing rate per hour will increase.
2. Size Distribution Analysis Using Digital Image Processing
Measurement of fragment size of blasted rock is considerably
important in order to evaluate the efficiency of the production blasting
operation. There are several methods of size distribution measurement
and fall under two broad categories; direct method and indirect methods.
The sieve analysis is the direct and accurate method of measuring size
distribution. Although it is the most accurate technique among others, it
is not practical for such a large scale due to being both expensive and
time consuming. For this reason, indirect methods which are
observational, empirical and digital methods have been developed[1]
.
Observational methods include the visual observations of muckpiles
immediately following the blasting. It is widely used by blasting
engineers to arrive at an approximation.
In some empirical models such as Larsson’s equation, SveDeFo
formula, KUZ-RAM model, etc, blasting parameters are considered to
determine the size distribution of blasted rock[2]
.
Recent fragmentation assessment techniques using digital image
processing program allow rapid and accurate blast fragmentation size
distribution assessments. Digital image software was developed through
the 1990s and at present it is a worldwide accepted tool in the mining and
mineral processing industries. Its main advantage is that it can be used on
a continuous basis without affecting the production cycle, which makes it
the only practical tool for evaluating fragmentation of the run of mine.
Measurement of Size Distribution of Blasted Rock …
83
However, some errors are also associated with the digital image
analysis. It is extremely hard to obtain accurate estimates of rock
fragmentation after blasting. Following are the main reasons for error in
using image analysis programs[3]
.
a. Image analysis can only process what can be seen with the eye.
Image analysis programs cannot take into account the internal rock, so
the sampling strategies should be carefully considered.
b. Analyzed particle size can be over-divided or combined; which
means larger particles can be divided into smaller particles and smaller
particles can be grouped into larger particles. This is a common problem
in all image-processing programs. Therefore, manual editing is required.
c. Very fine particles can be underestimated, especially from a
muckpile after blasting. There is no good answer to avoid these
problems.
There are several softwares namely SPLIT, WipFrag, GoldSize,
FragScan, TUCIPS, CIAS, PowerSieve, IPACS, KTH, WIEP, etc. that
are commercially available to quantify the size distribution. The accuracy
of these systems varies between 2 % to 20 %[4]
. In this investigation, the
SPLIT-DESKTOP system was used for size distribution computation.
2.1 SPLIT System for Size Distribution Analysis
Split system is an image-processing program designed to calculate
the size distribution of rock fragments through analyzing digital
grayscale images. Digital grayscale images can be acquired manually
through use of a digital camera, individual frame capture from video or
through scanned (digitized) photographs.
The Split software is the result of over nine years of research and
development at The University of Arizona. Split-Desktop combines the
elements of Split, a software program copyrighted by the Arizona Board
of Regents and exclusively licensed for further development and
marketing to Split Engineering, LLC, with elements and research input
from Julius Kruttschnitt Mineral Research Centre of Brisbane,
Queensland, Australia. The original Split software programs were written
using source code modifications to NIH Image, a public domain image-
processing program developed by Wayne Rasband at the United States
National Institutes of Health[5]
.
F.I. Siddiqui, et al. 84
There are two formats of Split system, one is fully automated and
operates continuously on images taken from a conveyor belt. The other is
the Split-Desktop® software refers to the “user-assisted” off-line version
of the Split programs that can be operate on saved images.
The subject of these images can be a muckpile, haul truck, leach pile,
draw point, waste dump, stockpile, conveyor belt, or any other location
where clear images of rock fragments can be obtained. Once the images
are taken and saved to a computer, the Split-Desktop software has five
progressive steps for analyzing each image[6]
.
The first step in the program allows the scale to be determined for
each image taken in the field. The second step performs the automatic
delineation of the fragments in each of the images that are processed. The
third step allows editing of the delineated fragments to ensure accurate
results. The fourth step involves the calculation of the size distribution
based on the delineated fragments. Finally, the fifth step concerns the
graphing and various outputs to display the size distribution results.
3. Measurement of Size Distribution of Blasted Rock
at Limestone Quarry
Site of investigation is a limestone quarry producing limestone for
cement manufacturing. The mining method at the quarry uses the
traditional open pit practice of drilling and blasting a planned rock bench,
loading of material with wheel loaders, and hauling to the primary
crusher by heavy duty rear-dump trucks.
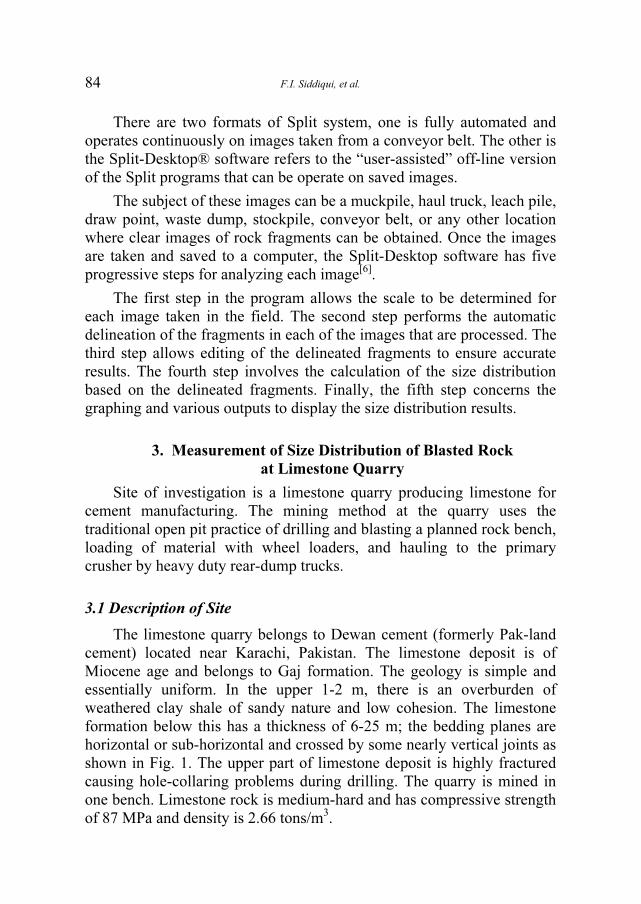
3.1 Description of Site
The limestone quarry belongs to Dewan cement (formerly Pak-land
cement) located near Karachi, Pakistan. The limestone deposit is of
Miocene age and belongs to Gaj formation. The geology is simple and
essentially uniform. In the upper 1-2 m, there is an overburden of
weathered clay shale of sandy nature and low cohesion. The limestone
formation below this has a thickness of 6-25 m; the bedding planes are
horizontal or sub-horizontal and crossed by some nearly vertical joints as
shown in Fig. 1. The upper part of limestone deposit is highly fractured
causing hole-collaring problems during drilling. The quarry is mined in
one bench. Limestone rock is medium-hard and has compressive strength
of 87 MPa and density is 2.66 tons/m3.
Measurement of Size Distribution of Blasted Rock …
85
Fig. 1. Bench view of quarry, the upper fractured zone and horizontal bedding planes are
clearly visible.
Drilling is done with heavy duty down-the-hole hammer drill to a
preset blasting pattern. The blasting parameters are designed to suit the
rock conditions and gradation requirements. The holes are charged with
primed cartridge at the bottom with Shock-tube for detonation. ANFO is
filled as column charge. Two types of high explosives are used;
Gelatinous dynamite and Emulite. Each hole contains 15 kg of high
explosive and 60 kg of ANFO. Other blasting parameters are given in
Table 1.
Table 1. Blasting parameters.
Parameters Description
Hole diameter 104 mm
Bench Height 12 meters
Sub-drilling 0.5 meter
Burden 3 meter
Spacing 4 meter
Stemming 3 meter
Blasting Pattern Rectangular
Initiation System Nonel or Shock-tube
Powder Factor 0.5 kg / m3
F.I. Siddiqui, et al. 86
3.2 Image Acqusition
Image acquisition of blasted rock for size distribution analysis is the
most critical phase of the analysis. Important issues in image sampling
are: The location of the image, the image angle from the surface of the
muckpile, and the scale of the image. In order to obtain good images,
which are both capable of being analyzed and representative of the entire
rock assemblage, sampling strategies must be carefully considered.
The location of image taking is important, and there are two
sampling methods, random and systematic. Both methods have been used
for this investigation. Another consideration is the angle of the surface
being photographed. Ideally, the surface should be perpendicular to the
camera lens.
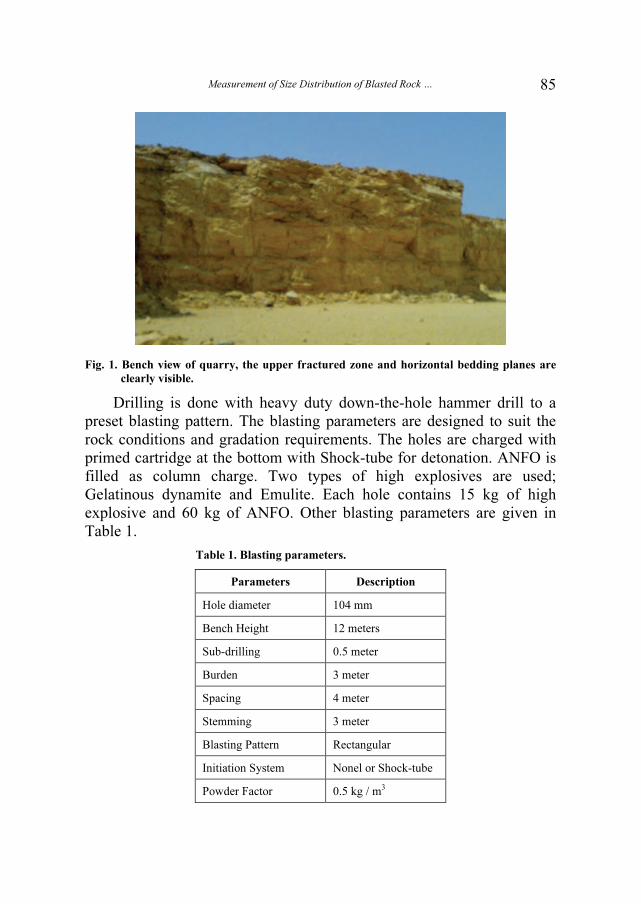
Fig. 2. Typical image taken in the field for calculation of size distribution.
A digital camera was used to get the images of the blasted muck,
which were used in SPLIT. Images were taken randomly in the field and
a basket ball of 24 cm in diameter (9.4488 inch) was used to provide
scale in the images. Single scaling object was used in this investigation.
Total 15 images were taken for analysis.
3.3 Fragment Delineation
After the image acquisition the next step was to produce the binary
images from the acquired digital images that show the outlines of the
particles visible in the image. In this step Split-Desktop performs the
Measurement of Size Distribution of Blasted Rock …
87
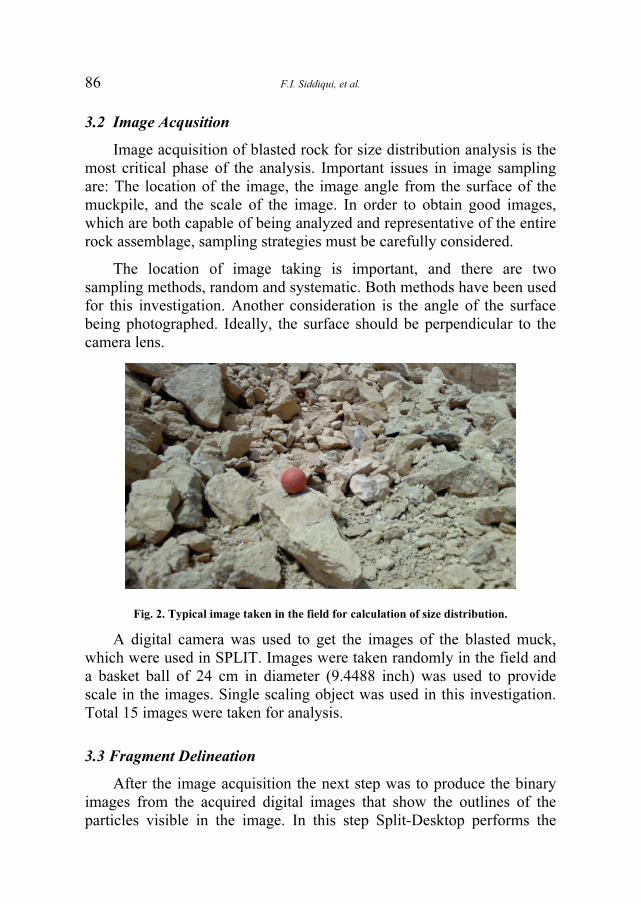
automatic delineation of the particles. As it can be observed from the Fig.
3b, the binary image actually allows three color levels: white for
particles, black for boundaries and fines, and gray for areas that do not
count in the size distribution such as the scaling object.
Fig. 3a. Grey-scale image Fig. 3b. Delineated binary image.
The three most important delineation parameters are Noise size,
Watershed ratio and Gradient ratio[6]
.
Noise Size: The noise size parameter is used to determine the size,
in pixels, of the smallest pixel grouping that is used in
the split algorithm. Noise size value may range from 3
to 90 and default value is 7. If the image contains
larger rock fragments and boulders, noise value may
set to as higher as 80 to 90 and if it contains finer
fragments, the value may reduce to 3.
The Noise size value for this investigation was found
empirically by using various values and finally 22 was
found best-fit for the images.
Watershed ratio: The watershed size ratio controls the number of
divisions made during the watershed algorithm which
is used to make additional divisions based on the
shape of the particles. The default value is 1.5, which
usually gives satisfactory result for most images.
Increasing this number makes fewer divisions and
decreasing it makes more. This value can be changed
typically between 0.33 and 3. In this investigation,
watershed ratio was set at 1.85.
Gradient ratio: The gradient is a numerical measure of grayscale
change from light to dark. The typical average
F.I. Siddiqui, et al. 88
Gradient Ratio is 0.14. A higher value will create
fewer dividing lines and a lower value will create
more. The gradient ratio for this analysis was set at
0.18.
3.4 Binary Image Editing
Editing of the binary images is often required to enhance the
delineation of the individual fragment because the built-in delineation
algorithm of Split-Desktop not so precisely outline each and every
fragment so some manual editing must be done.
In this step the particle edges should be clearly outlined in a
continuous line, patches of fine material should be noted by filling in,
and the objects (such as sky, loading equipment and the floor in front of
the pile and scaling object) within the image that are not to be sized
should be removed.
3.5 Computation of Size Distribution Curves
Once the binary images have been completely edited, computation of
size distribution can be carried out. In this step, the distribution of fines
in each image can be calculated using two approaches Rosin-Rammler or
Schumann distribution. In the present study, a combination of these two
approaches was used to best-fit the fines distribution.
The final step and the most critical influence on the size calculation
is the Fines Estimation. Split-Desktop can measure particles
automatically, but in every image there is a point below the resolution of
the image where particles can no longer be “seen" and delineated. At this
point, Split-Desktop will estimate the remaining finer material. The
"fines" cutoff chiefly depends on the resolution in pixels/unit of the
image. Since the black pixels in the image represent both fines and
outlines of particles, a percent of these pixels is included in the fines
calculation. This percentage of black to be counted as fines can vary for
each muckpile and can be adjusted by the user[6]
.
For the images that contain too much fines, the High option can be
selected and also other options such as None, Low and Medium can be
selected accordingly depending upon the fines percentage in each image.
Measurement of Size Distribution of Blasted Rock …
89
4. Discussion of Results
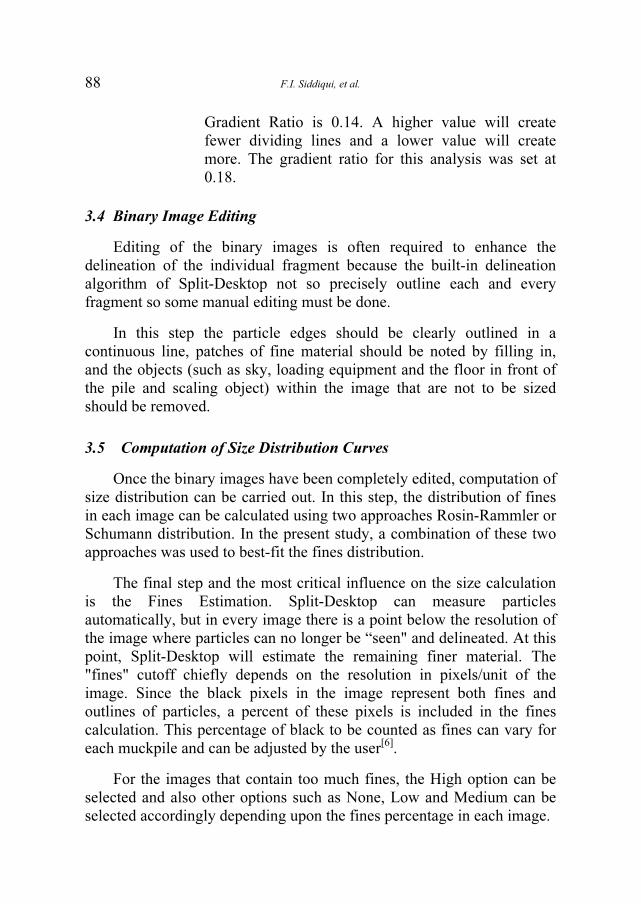
The seven most representative images of blasted muckpile were
analyzed and mean values were obtained. The obtained size distribution
curve is shown in Fig. 4.
Fig. 4. Size distribution results.
The percentage values, Rosin-Rammler uniformity index and mean
fragment size are given in Tables 2 and 3.
Table 2. Cumulative percent passing.
Size [mm] % Passing
2000 100
1000 99.02
750 96.04
500 85.78
250 62.81
125 45.46
F.I. Siddiqui, et al. 90
Table 3. Fragment size characteristics.
Size fractions Size (mm)
P10 2.08
P20 11.66
P30 50.79
P40 102.15
P50 149.76
P60 225.02
P70 318.24
P80 426.31
P90 566.48
Top-Size 1057.44
Rosin-Rammler
uniformity index 0.81
Mean fragment size 149.76 mm
Table 2. Contd.
Size [mm] % Passing
100 39.43
75 33.46
53 30.36
37.5 27.56
26.5 25.02
19 22.82
13.2 20.66
9.5 18.94
6.7 17.31
4.75 15.86
Measurement of Size Distribution of Blasted Rock …
91
5. Conclusion
The results obtained from the analysis of muckpile images using
Split-Desktop shows that the mean fragment size is 149.76 mm and P20,
P80, and Top-size are 11.66 mm, 426.31 mm and 1057.44 mm
respectively. The primary crusher installed at the quarry accepts the feed
size as large as 1000 mm and crush down to the 30 mm. As the results
indicate that approximately 25% of the fragments are below 30 mm;
hence the fragments do not require crushing and pass the primary crusher
screen smoothly and effortlessly. Results also indicate that only 1% of
the material is above 1000 mm therefore it requires secondary breakage.
The Rosin-Rammler uniformity index of the entire muckpile is 0.81.
This index is generally used to approximate the size distribution of rock
in blasted muckpiles. The value ranges between 0.5 (very non-uniform)
and 2 (very uniform). So the obtained index value confirms non-uniform
size distribution. Non-uniform size distribution affects the loading and
hauling operations and crusher’s efficiency.
As the results indicate that 25% fragments are below 30 mm, which
is product size of primary crusher, this percentage can be enhanced by
optimizing the overall blasting operation. The Burden and spacing are
two most important factors in the blasting because these factors can be
adjusted to obtain required fragmentation. Proper explosive in an
appropriate quantity can also results in good fragmentation and reduce
the overall cost of production.
Acknowledgment
The authors would like to express their sincere appreciation to
Engineer Mushtaq Abro, Deputy Manager at Dewan Cement Ltd, for his
help in data collection and image taking which are vital for this research
work and also thanks to every one at Department of Mining Engineering,
MUET Jamshoro, Pakistan.
References
[1] Esen, S. and Bilgin, H.A., “Effect of Explosive on Fragmentation”, (http://www.-
metsominerals.com/inetMinerals/mm_proc.nsf/WebWID/WTB-060320-2256F-60F1C/$File/esen_fragmentation_2001.pdf).
[2] Jimeno, C.L., Jimeno, E.L. and Carcedo, F.J.A., “Drilling and Blasting of Rocks”, A.A.
Balkema, Rotterdam, Netherlands (1995).

F.I. Siddiqui, et al. 92
[3] Ozkahraman, H.T., “Fragmentation Assessment and Design of Blast Pattern at Goltas
Limestone Quarry, Turkey (Technical Note)”, International Journal of Rock Mechanics & Mining Sciences, Volume 43, pp: 628-633 (2006).
[4] Franklin, J.A., Kemeny, J.M. and Girdner K.K., “Evolution of Measuring Systems: A
review”, Proceedings of the Fragblast-5 Workshop on Measurement of Blast
Fragmentation, A.A. Balkema, Montreal, Quebec, Canada, pp. 47-52, August (1996).
[5] Split Engineering, LLC, Tucson, Arizona, USA, “Split-Desktop Software Manual”.
[6] Bobo, T., “What’s New with the Digital Image Analysis Software Split-Desktop®?” Split
Engineering, LLC, Tucson, Arizona, USA.

Measurement of Size Distribution of Blasted Rock …
93
����� ���� � �������� ����� ������� ������� � ��
������ �������
����� ��� ������ ����� ���� � ���� ��� ���� ��� � �
������� ��� �������� �������� ����� ����� ����
������� . ������� ����� � �� � ������� ��� �� ����� ��
� �������� ���!� ������ ��!�"� #� � $� %�� &�����
������"Split- Desktop System" ��!�' (��) &��*� +�,� -�� /
������� . �0 &������� 1����� ���!� ����� ���� ������� 2��
2%��3� �' %� .���� �� 4 "��� � �*��� �� ����� 2���
2 �!�"�� �0 &5���� �0 ��� ��� #"!� 6�� ������� ��!�"�
��7�� ���5��� 4*%�� 4������ 48� ������� �"� ��%��"��� . ��
4�!���� &����� � ����� 2���� ������� ����� �) ��"���
9 ��� �%5� �*����� ��: ���� �*��7�� �� �!�%��� 2� ;��
&����� � ����� 2���� ������� ����� �5� /��!5� ���
��!5� 4�3� <��3� � ����*��� �*��7�� . �� 4���� &� ��
������� ���!� 7����� &���� ���*� ;!' ������� -!� $= �%
2,!� 6�� ������� ����� 2����>?@,BC ;��) ;!' /&�
���*�� 2 ����!� &��>DEB,?? 2����� ���% ���*� &� �5 / &�
�� 4�3� 2 ����!�FD ���*�� &� GEH.
Related Documents