1 School of Geology University of New South Wales Sydney NSW 2052 Australia [email protected] 307 Exploration Geophysics (2001) Vol 32, No. 3 & 4 Exploration Geophysics (2001) 32, 307 - 314 Key Words: seismic, refraction, anistrophy, fabric, 3D, amplitudes, GRM Measurement of Rock Fabric In Shallow Refraction Seismology Derecke Palmer 1 ABSTRACT A three dimensional (3D) seismic refraction survey carried out across a shear zone shows that there is an increase in the depth of weathering and a decrease in seismic velocity in the sub-weathering associated with the shear zone. Although the shear zone is generally considered to be a two dimensional (2D) feature, the significant lateral variations in both depths to, and seismic velocities within the refractor in the cross-line direction, indicate that it is best treated as a 3D target. These variations are not predictable on the basis of a 2D profile recorded earlier. Qualitative measures of azimuthal anisotropy are obtained from the seismic velocities and the time-depths computed from the traveltime data with the generalised reciprocal method (GRM) algorithms and from the head wave amplitudes. These three methods give similar, consistent results, with the direction of the greater seismic velocity being approximately parallel to the direction of the dominant geological strike over most of the survey area. Conversely, all three methods show that the direction of the greater seismic velocity is approximately orthogonal to the direction of the dominant geological strike in a small region adjacent to the shear zone. The amplitudes of the refracted signals are approximately proportional to the ratio of the specific acoustic impedances between the upper layer and the refractor, and they provide a convenient and detailed qualitative measure of azimuthal anisotropy or rock fabric. The amplitudes also contain additional useful geological information, although some of the cross-line amplitudes could not be completely explained. The in-line results show that both accurate refractor depths and seismic velocities can be computed with moderate cross-line offsets, say less than 20 m, of shot points. These results demonstrate that swath shooting with a number of parallel recording lines would be adequate for 3D surveys over targets such as highways, damsites and pipelines. Only a modest increase in the number of shot points over the requirements for the normal 2D program would be required in the cross-line direction to measure azimuthal anisotropy and rock fabric with amplitudes. The results of this study demonstrate that simple and efficient 3D refraction methods using a GRM approach can provide more useful geological interpretations than would be the case with detailed 2D approaches. INTRODUCTION In the last two decades, three dimensional (3D) seismic reflection methods have revolutionised exploration and production of petroleum resources. The improved images of the subsurface geology are a result of the recognition that most geological targets are in fact three dimensional, and that it is essential to employ spatial sampling densities and processing methods which recognise and accommodate this reality. It is now generally accepted that in many cases, two dimensional (2D) seismic reflection methods give an incorrect rather than an incomplete picture of the sub-surface (Nestvold, 1992). By contrast, 3D refraction methods (Zelt, 1998; Bennett, 1999; Deen et al, 2000) are not very common. However, there are compelling reasons for the expedient development of 3D shallow refraction methods for routine use in geotechnical, environmental and groundwater applications. Geological structures and the corresponding depths to and seismic velocities within bedrock, can show as much variation in the cross-line direction as in the in-line direction. In the vast majority of near-surface studies, such variations are significant. However, possibly the most important reason is the need to address azimuthal anisotropy of seismic velocities, which is a measure of rock fabric. Anisotropy can be caused by lamination, foliation or by the preferred orientation of joints and cracks within the refractor, and it is another important parameter for assessing rock strength for rippability and foundation design. However, the most important near-surface application of azimuthal anisotropy may be in the determination of fracture porosity in crystalline rocks for the development of groundwater supplies for domestic and irrigation purposes; in studies of contaminant transport especially of radioactive wastes (Barker, 1991); the stability of rock slopes and seepage from dams; the construction of underground rock cavities for storing water, gas, etc; and the construction of tunnels. The relationship between anisotropy and crack parameters has been the subject of considerable research in the past (Crampin et al, 1980; Thomsen, 1995). Nevertheless, there are no established approaches for the routine mapping of these parameters with shallow geotechnical or environmental targets, although radial surveys to measure azimuthal anisotropy (Bamford and Nunn, 1979; Leslie and Lawton, 1999) represent the first steps in that direction. This study describes the results of a 3D shallow seismic refraction survey recorded across a shear zone, which was the target for an earlier 2D refraction investigation, (Palmer, 2000a, 2000b). It is part of an ongoing program for the development of acquisition and processing methods for determining detailed quantitative measures of azimuthal anisotropy and in turn of rock fabric. The seismic velocities in the refractor range from less than 2000 m/s in the shear zone to more than 5000 m/s in the adjacent rocks, while depths range from 15 m to 30 m. Accordingly, the challenge is to separate the large effects of the complex geological structure, from the more subtle effects of rock fabric or azimuthal anisotropy within the seismic data. Three qualitative measures of azimuthal anisotropy are employed in this study. They are the time-depth and seismic

Welcome message from author
This document is posted to help you gain knowledge. Please leave a comment to let me know what you think about it! Share it to your friends and learn new things together.
Transcript
1 School of GeologyUniversity of New South WalesSydney NSW 2052 [email protected]
307Exploration Geophysics (2001) Vol 32, No. 3 & 4
Exploration Geophysics (2001) 32, 307 - 314
Key Words: seismic, refraction, anistrophy, fabric, 3D, amplitudes, GRM
Measurement of Rock Fabric In ShallowRefraction Seismology
Derecke Palmer1
ABSTRACT
A three dimensional (3D) seismic refraction survey carried outacross a shear zone shows that there is an increase in the depth ofweathering and a decrease in seismic velocity in thesub-weathering associated with the shear zone. Although theshear zone is generally considered to be a two dimensional (2D)feature, the significant lateral variations in both depths to, andseismic velocities within the refractor in the cross-line direction,indicate that it is best treated as a 3D target. These variations arenot predictable on the basis of a 2D profile recorded earlier.
Qualitative measures of azimuthal anisotropy are obtainedfrom the seismic velocities and the time-depths computed from thetraveltime data with the generalised reciprocal method (GRM)algorithms and from the head wave amplitudes. These threemethods give similar, consistent results, with the direction of thegreater seismic velocity being approximately parallel to thedirection of the dominant geological strike over most of the surveyarea. Conversely, all three methods show that the direction of thegreater seismic velocity is approximately orthogonal to thedirection of the dominant geological strike in a small regionadjacent to the shear zone.
The amplitudes of the refracted signals are approximatelyproportional to the ratio of the specific acoustic impedancesbetween the upper layer and the refractor, and they provide aconvenient and detailed qualitative measure of azimuthalanisotropy or rock fabric. The amplitudes also contain additionaluseful geological information, although some of the cross-lineamplitudes could not be completely explained.
The in-line results show that both accurate refractor depths andseismic velocities can be computed with moderate cross-lineoffsets, say less than 20 m, of shot points. These resultsdemonstrate that swath shooting with a number of parallelrecording lines would be adequate for 3D surveys over targetssuch as highways, damsites and pipelines. Only a modest increasein the number of shot points over the requirements for the normal2D program would be required in the cross-line direction tomeasure azimuthal anisotropy and rock fabric with amplitudes.
The results of this study demonstrate that simple and efficient3D refraction methods using a GRM approach can provide moreuseful geological interpretations than would be the case withdetailed 2D approaches.
INTRODUCTION
In the last two decades, three dimensional (3D) seismicreflection methods have revolutionised exploration and productionof petroleum resources. The improved images of the subsurface
geology are a result of the recognition that most geological targetsare in fact three dimensional, and that it is essential to employspatial sampling densities and processing methods which recogniseand accommodate this reality. It is now generally accepted that inmany cases, two dimensional (2D) seismic reflection methods givean incorrect rather than an incomplete picture of the sub-surface(Nestvold, 1992).
By contrast, 3D refraction methods (Zelt, 1998; Bennett, 1999;Deen et al, 2000) are not very common. However, there arecompelling reasons for the expedient development of 3D shallowrefraction methods for routine use in geotechnical, environmentaland groundwater applications.
Geological structures and the corresponding depths to andseismic velocities within bedrock, can show as much variation inthe cross-line direction as in the in-line direction. In the vastmajority of near-surface studies, such variations are significant.
However, possibly the most important reason is the need toaddress azimuthal anisotropy of seismic velocities, which is ameasure of rock fabric. Anisotropy can be caused by lamination,foliation or by the preferred orientation of joints and cracks withinthe refractor, and it is another important parameter for assessingrock strength for rippability and foundation design. However, themost important near-surface application of azimuthal anisotropymay be in the determination of fracture porosity in crystallinerocks for the development of groundwater supplies for domesticand irrigation purposes; in studies of contaminant transportespecially of radioactive wastes (Barker, 1991); the stability ofrock slopes and seepage from dams; the construction ofunderground rock cavities for storing water, gas, etc; and theconstruction of tunnels.
The relationship between anisotropy and crack parameters hasbeen the subject of considerable research in the past (Crampin etal, 1980; Thomsen, 1995). Nevertheless, there are no establishedapproaches for the routine mapping of these parameters withshallow geotechnical or environmental targets, although radialsurveys to measure azimuthal anisotropy (Bamford and Nunn,1979; Leslie and Lawton, 1999) represent the first steps in thatdirection.
This study describes the results of a 3D shallow seismicrefraction survey recorded across a shear zone, which was thetarget for an earlier 2D refraction investigation, (Palmer, 2000a,2000b). It is part of an ongoing program for the development ofacquisition and processing methods for determining detailedquantitative measures of azimuthal anisotropy and in turn of rockfabric. The seismic velocities in the refractor range from less than2000 m/s in the shear zone to more than 5000 m/s in the adjacentrocks, while depths range from 15 m to 30 m. Accordingly, thechallenge is to separate the large effects of the complex geologicalstructure, from the more subtle effects of rock fabric or azimuthalanisotropy within the seismic data.
Three qualitative measures of azimuthal anisotropy areemployed in this study. They are the time-depth and seismic
308 Exploration Geophysics (2001) Vol 32, No. 3 & 4
velocity analysis functions of the generalised reciprocal method(GRM) (Palmer, 1980; Palmer1986), and head wave amplitudes.
Head wave amplitudes are generally dominated by the rapidvariation due to geometric spreading. Palmer (2001a)demonstrates that the effects of geometrical spreading and dippinginterfaces can be accommodated with either the multiplication ofthe amplitudes of the forward and reverse traces, or by theconvolution of those traces. Furthermore, Palmer (2001b) hasshown that the head coefficient, the parameter which controls theamplitude of the refracted signal, is approximately proportional tothe ratio of the specific acoustic impedances of the overburden andthe refractor. In this study, the ratios of the amplitude products forpairs of shot points with varying azimuths are used as a detailedqualitative measure of azimuthal anisotropy.
The data were processed with the GRM rather than withtomographic inversion because of the large lateral variations inrefractor seismic velocity, the relatively small volume of data, andbecause azimuthal anisotropy is rarely accommodated with mosttomography programs.
Recent case histories (Lanz et al, 1998, Figure 8), demonstratethat current tomographic inversion methods cannot reliably resolveseismic velocities in the main refractor, even though over 90% ofthe traveltimes originated from the refractor. In those cases wherestable inversion has been achieved, the variations in seismicvelocities are generally less than about 5% (Zelt, 1998).
The volume of data is low in contrast to that generallyconsidered desirable for effective tomographic inversion. As acomparison, the approximately 2000 traveltimes for 120 detectorpositions used in this study are much less than the more than50,000 traveltimes for 29 detector positions used in thetomographic analysis of Zelt and Barton, (1998). For most routineshallow refraction investigations, the costs of recording at least anorder of magnitude of additional shot points can be prohibitive.
Azimuthal anisotropy is rarely accommodated with mosttomography programs. The traveltime differences due toanisotropy are usually quite small, and they are often within theaccepted range for the residuals of inversion.
Palmer Rock fabric in shallow refraction seismology
SURVEY DETAILS
The data were acquired in approximately the same location asa 2D set of data described previously (Palmer, 2000a). The surveywas carried out shortly after the area had undergone completeclearing of the native vegetation and subsequent planting of tubestock for a pine plantation. As a result, the survey pegs whichmarked out the exploration grid had been removed, and so theprecise relationship between the two surveys is not known.However, the cross-line numbers in this studycorrelate approximately with the station numbers on the 2Dprofile.
The data were recorded with a 48 trace seismic system using aroll switch and single 40 Hz detectors. Shot holes were drilled todepths of between 1 and 2.5 m with a small trailer mounted drillrig. Charge sizes were between 1 and 3 kg of a seismic explosive.
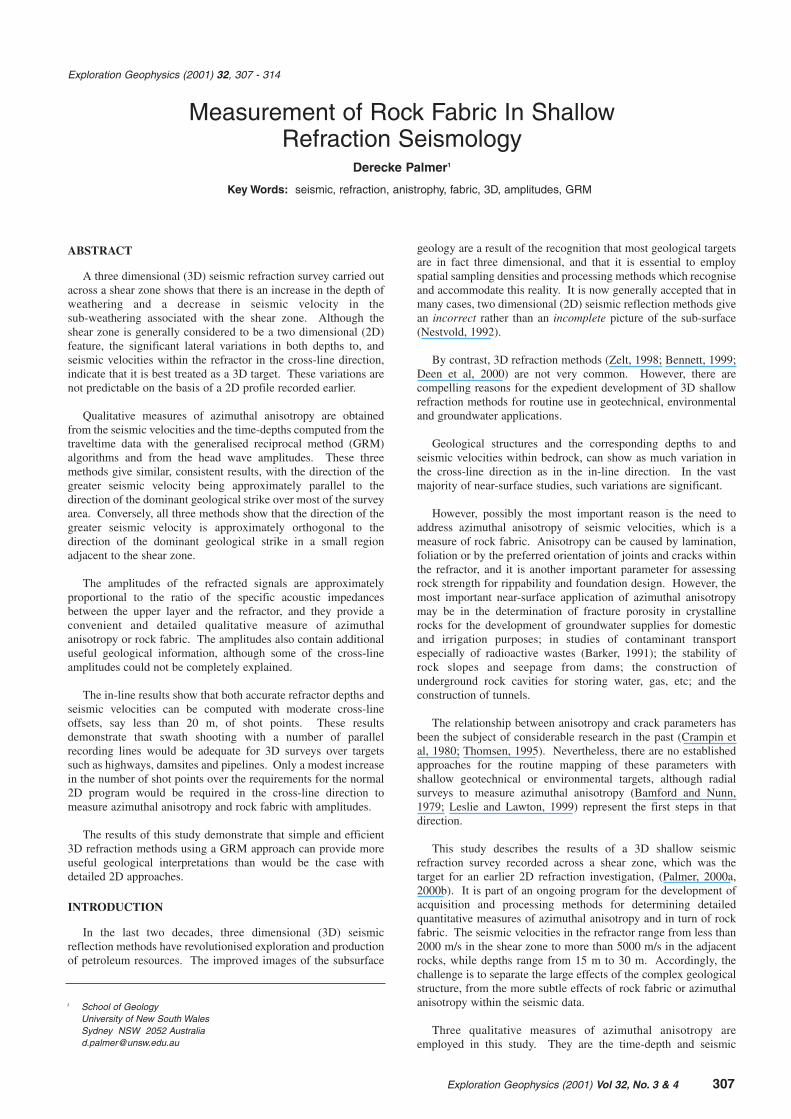
Initially, two parallel lines 20 m apart, with each consisting of24 geophones at a 5 m spacing were set out. These in-lines werelocated approximately either side of the earlier 2D profile. Fiveshot points, nominally 60 m apart, were located along each line.Another four oblique shot points offset 60 m from the end of eachline of geophones in the in-line direction and offset 60 m in thecross-line direction were also recorded, making a total of fourteenshots.
A second series of seven parallel cross-lines which were 20 mapart, and each of which consisted of twelve geophones at a 5 mseparation were then set out. There were four shot points on eachcross-line and the shots were nominally 60 m apart. These lineswere recorded in groups of four by simply rolling through fromone end to the other. A total of 27 shots were recorded in thecross-line directions.
Figure 1 is a plan of the two geophone arrangements and shotpoint locations.
ANALYSIS OF THE IN-LINE TRAVELTIME DATA
Traveltimes were hand picked from the shot records, andstandard corrections for the uphole time and the system delay inthe analogue components were applied. The previous 2D study(Palmer, 2000b) showed that a three layer model was applicable.It consists of a thin surface layer of friable soil with a seismicvelocity of about 400 m/s, a thicker layer of weathered materialwith a seismic velocity of approximately 700 m/s, and a mainrefractor with an irregular interface with seismic velocitiesbetween approximately 2000 m/s and 5000 m/s.
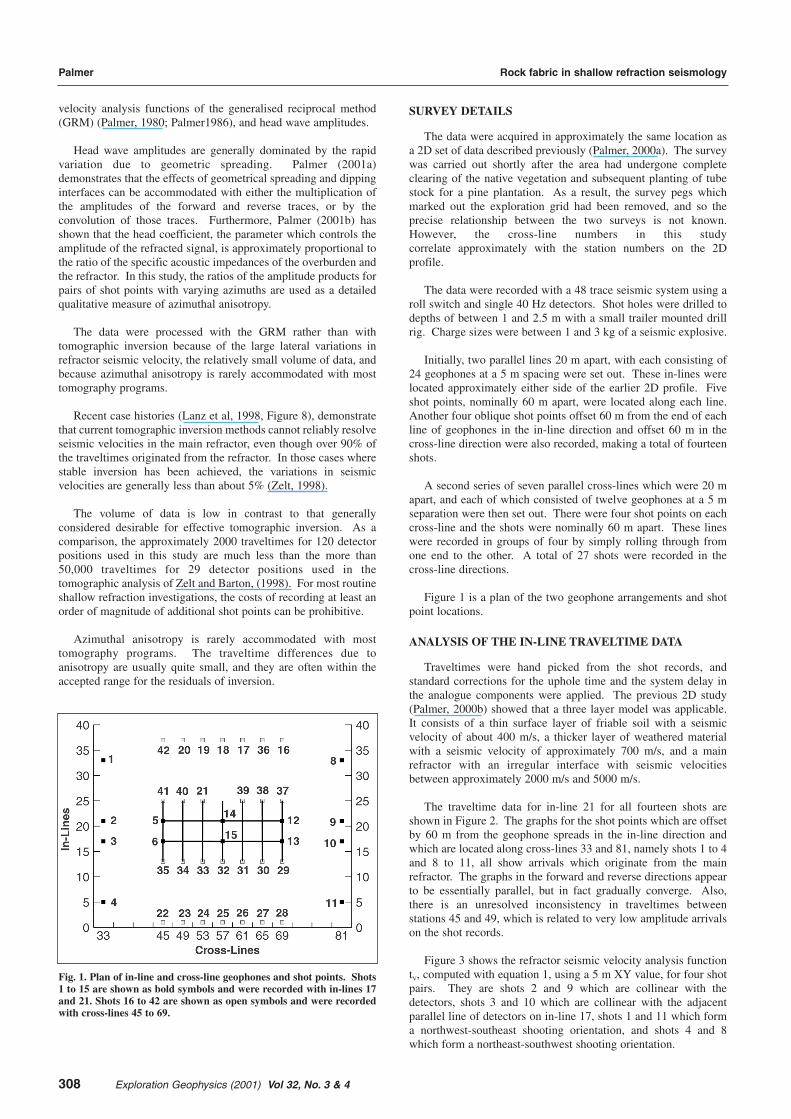
The traveltime data for in-line 21 for all fourteen shots areshown in Figure 2. The graphs for the shot points which are offsetby 60 m from the geophone spreads in the in-line direction andwhich are located along cross-lines 33 and 81, namely shots 1 to 4and 8 to 11, all show arrivals which originate from the mainrefractor. The graphs in the forward and reverse directions appearto be essentially parallel, but in fact gradually converge. Also,there is an unresolved inconsistency in traveltimes betweenstations 45 and 49, which is related to very low amplitude arrivalson the shot records.
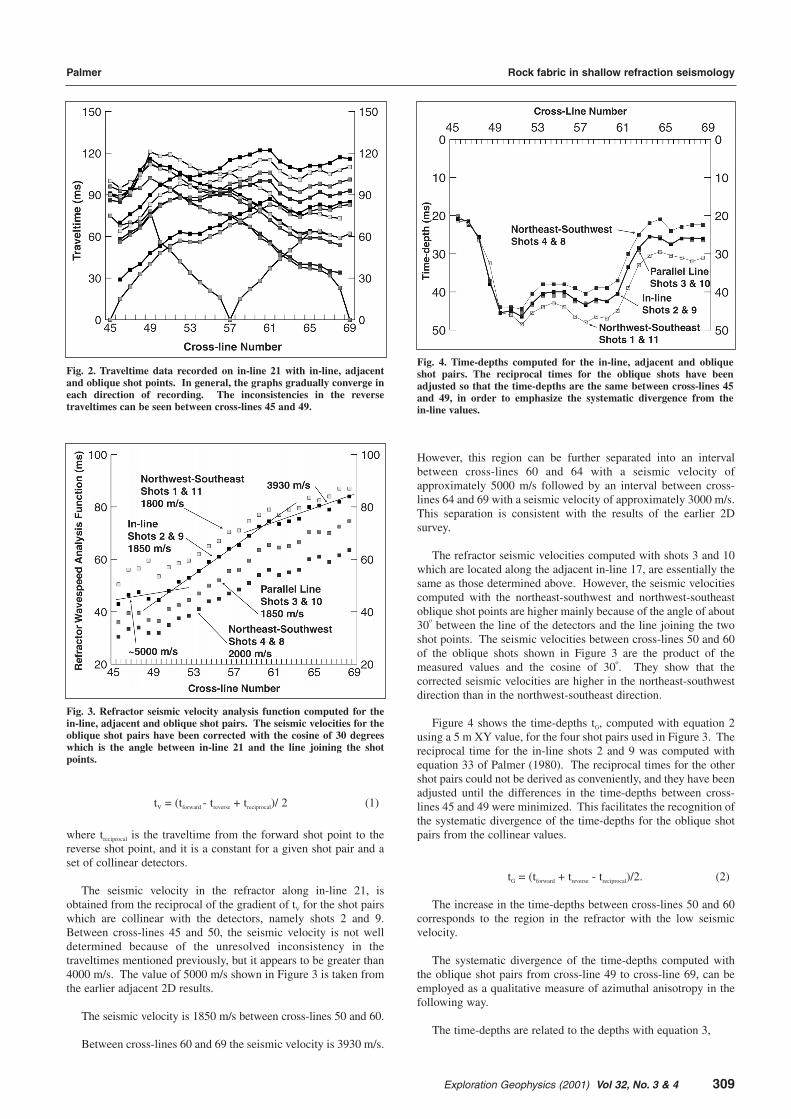
Figure 3 shows the refractor seismic velocity analysis functiontV, computed with equation 1, using a 5 m XY value, for four shotpairs. They are shots 2 and 9 which are collinear with thedetectors, shots 3 and 10 which are collinear with the adjacentparallel line of detectors on in-line 17, shots 1 and 11 which forma northwest-southeast shooting orientation, and shots 4 and 8which form a northeast-southwest shooting orientation.
Fig. 1. Plan of in-line and cross-line geophones and shot points. Shots1 to 15 are shown as bold symbols and were recorded with in-lines 17and 21. Shots 16 to 42 are shown as open symbols and were recordedwith cross-lines 45 to 69.
309Exploration Geophysics (2001) Vol 32, No. 3 & 4
tV = (tforward - treverse + treciprocal)/ 2 (1)
where treciprocal is the traveltime from the forward shot point to thereverse shot point, and it is a constant for a given shot pair and aset of collinear detectors.
The seismic velocity in the refractor along in-line 21, isobtained from the reciprocal of the gradient of tV for the shot pairswhich are collinear with the detectors, namely shots 2 and 9.Between cross-lines 45 and 50, the seismic velocity is not welldetermined because of the unresolved inconsistency in thetraveltimes mentioned previously, but it appears to be greater than4000 m/s. The value of 5000 m/s shown in Figure 3 is taken fromthe earlier adjacent 2D results.
The seismic velocity is 1850 m/s between cross-lines 50 and 60.
Between cross-lines 60 and 69 the seismic velocity is 3930 m/s.
Palmer Rock fabric in shallow refraction seismology
Fig. 2. Traveltime data recorded on in-line 21 with in-line, adjacentand oblique shot points. In general, the graphs gradually converge ineach direction of recording. The inconsistencies in the reversetraveltimes can be seen between cross-lines 45 and 49.
Fig. 3. Refractor seismic velocity analysis function computed for thein-line, adjacent and oblique shot pairs. The seismic velocities for theoblique shot pairs have been corrected with the cosine of 30 degreeswhich is the angle between in-line 21 and the line joining the shotpoints.
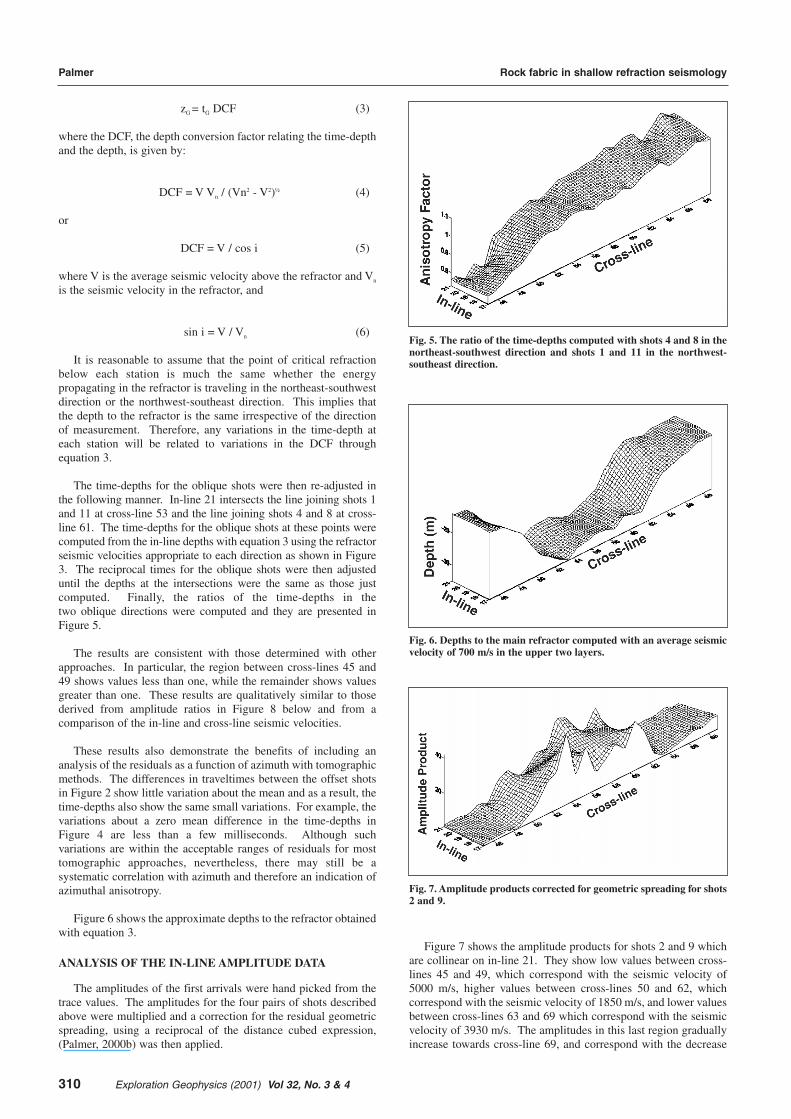
Fig. 4. Time-depths computed for the in-line, adjacent and obliqueshot pairs. The reciprocal times for the oblique shots have beenadjusted so that the time-depths are the same between cross-lines 45and 49, in order to emphasize the systematic divergence from thein-line values.
However, this region can be further separated into an intervalbetween cross-lines 60 and 64 with a seismic velocity ofapproximately 5000 m/s followed by an interval between cross-lines 64 and 69 with a seismic velocity of approximately 3000 m/s.This separation is consistent with the results of the earlier 2Dsurvey.
The refractor seismic velocities computed with shots 3 and 10which are located along the adjacent in-line 17, are essentially thesame as those determined above. However, the seismic velocitiescomputed with the northeast-southwest and northwest-southeastoblique shot points are higher mainly because of the angle of about30
obetween the line of the detectors and the line joining the two
shot points. The seismic velocities between cross-lines 50 and 60of the oblique shots shown in Figure 3 are the product of themeasured values and the cosine of 30
o. They show that the
corrected seismic velocities are higher in the northeast-southwestdirection than in the northwest-southeast direction.
Figure 4 shows the time-depths tG, computed with equation 2using a 5 m XY value, for the four shot pairs used in Figure 3. Thereciprocal time for the in-line shots 2 and 9 was computed withequation 33 of Palmer (1980). The reciprocal times for the othershot pairs could not be derived as conveniently, and they have beenadjusted until the differences in the time-depths between cross-lines 45 and 49 were minimized. This facilitates the recognition ofthe systematic divergence of the time-depths for the oblique shotpairs from the collinear values.
tG = (tforward + treverse - treciprocal)/2. (2)
The increase in the time-depths between cross-lines 50 and 60corresponds to the region in the refractor with the low seismicvelocity.
The systematic divergence of the time-depths computed withthe oblique shot pairs from cross-line 49 to cross-line 69, can beemployed as a qualitative measure of azimuthal anisotropy in thefollowing way.
The time-depths are related to the depths with equation 3,
310 Exploration Geophysics (2001) Vol 32, No. 3 & 4
Fig. 6. Depths to the main refractor computed with an average seismicvelocity of 700 m/s in the upper two layers.
Palmer Rock fabric in shallow refraction seismology
zG = tG DCF (3)
where the DCF, the depth conversion factor relating the time-depthand the depth, is given by:
DCF = V Vn / (Vn2 - V2)½ (4)
or
DCF = V / cos i (5)
where V is the average seismic velocity above the refractor and Vn
is the seismic velocity in the refractor, and
sin i = V / Vn (6)
It is reasonable to assume that the point of critical refractionbelow each station is much the same whether the energypropagating in the refractor is traveling in the northeast-southwestdirection or the northwest-southeast direction. This implies thatthe depth to the refractor is the same irrespective of the directionof measurement. Therefore, any variations in the time-depth ateach station will be related to variations in the DCF throughequation 3.
The time-depths for the oblique shots were then re-adjusted inthe following manner. In-line 21 intersects the line joining shots 1and 11 at cross-line 53 and the line joining shots 4 and 8 at cross-line 61. The time-depths for the oblique shots at these points werecomputed from the in-line depths with equation 3 using the refractorseismic velocities appropriate to each direction as shown in Figure3. The reciprocal times for the oblique shots were then adjusteduntil the depths at the intersections were the same as those justcomputed. Finally, the ratios of the time-depths in thetwo oblique directions were computed and they are presented inFigure 5.
The results are consistent with those determined with otherapproaches. In particular, the region between cross-lines 45 and49 shows values less than one, while the remainder shows valuesgreater than one. These results are qualitatively similar to thosederived from amplitude ratios in Figure 8 below and from acomparison of the in-line and cross-line seismic velocities.
These results also demonstrate the benefits of including ananalysis of the residuals as a function of azimuth with tomographicmethods. The differences in traveltimes between the offset shotsin Figure 2 show little variation about the mean and as a result, thetime-depths also show the same small variations. For example, thevariations about a zero mean difference in the time-depths inFigure 4 are less than a few milliseconds. Although suchvariations are within the acceptable ranges of residuals for mosttomographic approaches, nevertheless, there may still be asystematic correlation with azimuth and therefore an indication ofazimuthal anisotropy.
Figure 6 shows the approximate depths to the refractor obtainedwith equation 3.
ANALYSIS OF THE IN-LINE AMPLITUDE DATA
The amplitudes of the first arrivals were hand picked from thetrace values. The amplitudes for the four pairs of shots describedabove were multiplied and a correction for the residual geometricspreading, using a reciprocal of the distance cubed expression,(Palmer, 2000b) was then applied.
Fig. 5. The ratio of the time-depths computed with shots 4 and 8 in thenortheast-southwest direction and shots 1 and 11 in the northwest-southeast direction.
Fig. 7. Amplitude products corrected for geometric spreading for shots2 and 9.
Figure 7 shows the amplitude products for shots 2 and 9 whichare collinear on in-line 21. They show low values between cross-lines 45 and 49, which correspond with the seismic velocity of5000 m/s, higher values between cross-lines 50 and 62, whichcorrespond with the seismic velocity of 1850 m/s, and lower valuesbetween cross-lines 63 and 69 which correspond with the seismicvelocity of 3930 m/s. The amplitudes in this last region graduallyincrease towards cross-line 69, and correspond with the decrease
311Exploration Geophysics (2001) Vol 32, No. 3 & 4
Fig. 9. Stacked traveltimes for the shot points at each end of the cross-lines.
Palmer Rock fabric in shallow refraction seismology
in seismic velocity when the region is further sub-divided into tworegions.
These results are consistent with previous studies (Palmer,2001b), which demonstrate that the amplitude product isapproximately proportional to the square of the ratio of thespecific acoustic impedances of the overburden and the refractor.Since the seismic velocities in the layers above the main refractorexhibit little lateral variation in the in-line direction, theamplitudes are essentially a function of the seismic velocities anddensities in the refractor.
The amplitudes of the other shot pairs show the same generalpattern, as well as the detailed features such as the higher values atcross-lines 54, 56, 59 and 61 on line 17. These variations may beattributed to changes in the coupling of the detectors, but are morelikely to be due to near-surface changes in the seismic velocities(Palmer 2001c).
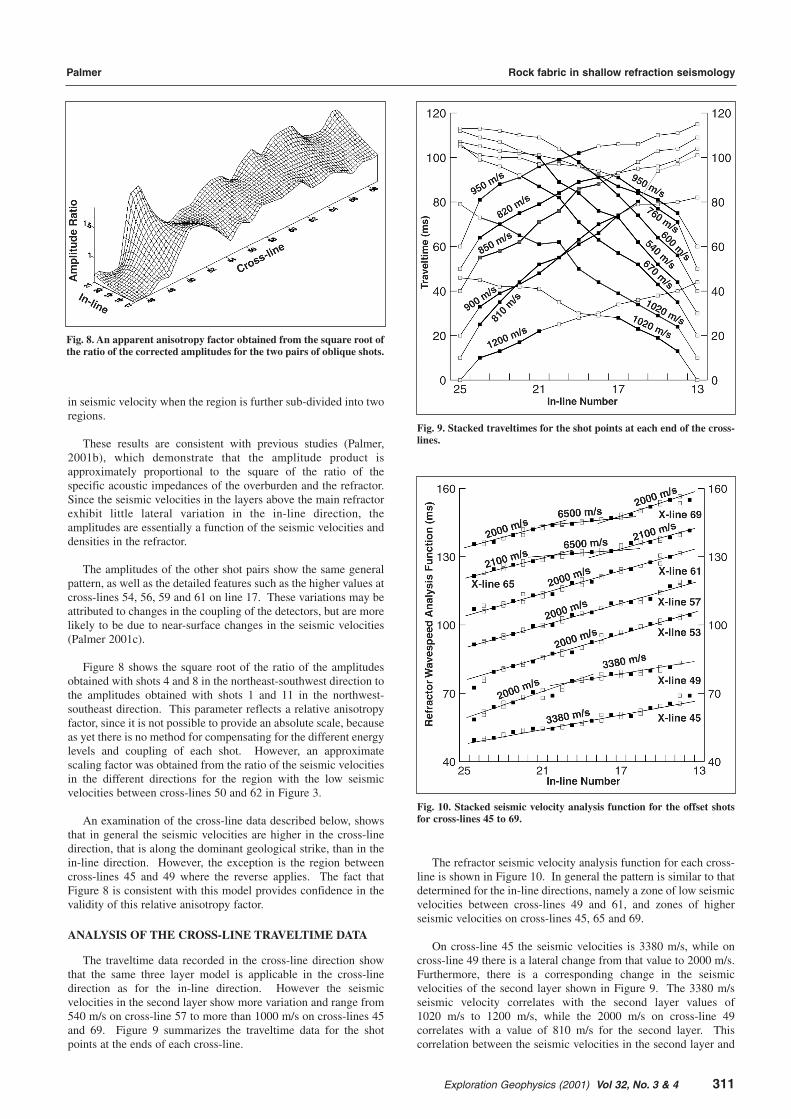
Figure 8 shows the square root of the ratio of the amplitudesobtained with shots 4 and 8 in the northeast-southwest direction tothe amplitudes obtained with shots 1 and 11 in the northwest-southeast direction. This parameter reflects a relative anisotropyfactor, since it is not possible to provide an absolute scale, becauseas yet there is no method for compensating for the different energylevels and coupling of each shot. However, an approximatescaling factor was obtained from the ratio of the seismic velocitiesin the different directions for the region with the low seismicvelocities between cross-lines 50 and 62 in Figure 3.
An examination of the cross-line data described below, showsthat in general the seismic velocities are higher in the cross-linedirection, that is along the dominant geological strike, than in thein-line direction. However, the exception is the region betweencross-lines 45 and 49 where the reverse applies. The fact thatFigure 8 is consistent with this model provides confidence in thevalidity of this relative anisotropy factor.
ANALYSIS OF THE CROSS-LINE TRAVELTIME DATA
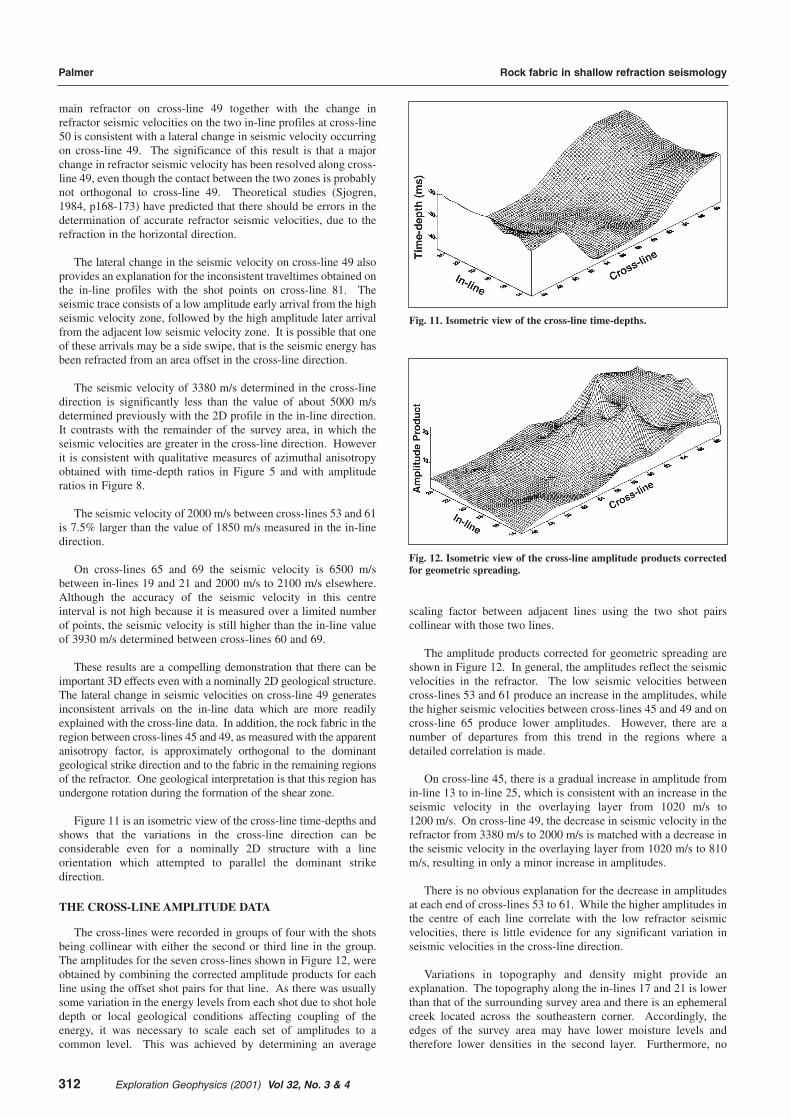
The traveltime data recorded in the cross-line direction showthat the same three layer model is applicable in the cross-linedirection as for the in-line direction. However the seismicvelocities in the second layer show more variation and range from540 m/s on cross-line 57 to more than 1000 m/s on cross-lines 45and 69. Figure 9 summarizes the traveltime data for the shotpoints at the ends of each cross-line.
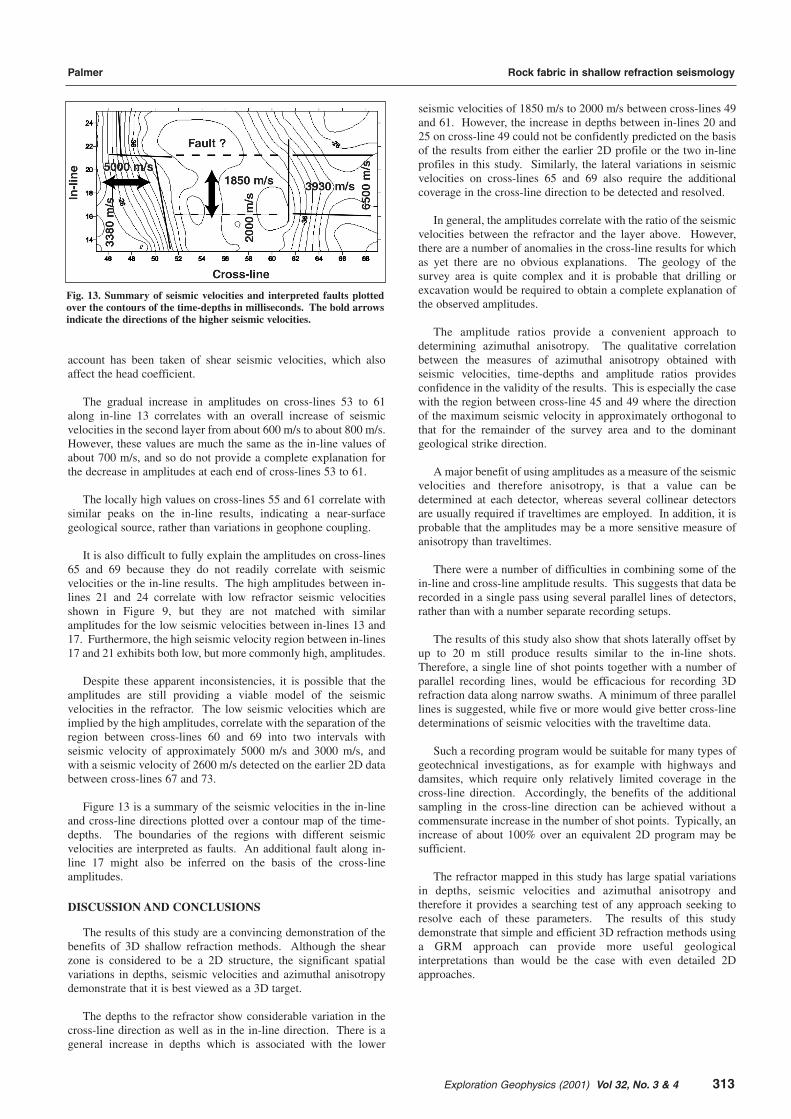
The refractor seismic velocity analysis function for each cross-line is shown in Figure 10. In general the pattern is similar to thatdetermined for the in-line directions, namely a zone of low seismicvelocities between cross-lines 49 and 61, and zones of higherseismic velocities on cross-lines 45, 65 and 69.
On cross-line 45 the seismic velocities is 3380 m/s, while oncross-line 49 there is a lateral change from that value to 2000 m/s.Furthermore, there is a corresponding change in the seismicvelocities of the second layer shown in Figure 9. The 3380 m/sseismic velocity correlates with the second layer values of1020 m/s to 1200 m/s, while the 2000 m/s on cross-line 49correlates with a value of 810 m/s for the second layer. Thiscorrelation between the seismic velocities in the second layer and
Fig. 10. Stacked seismic velocity analysis function for the offset shotsfor cross-lines 45 to 69.
Fig. 8. An apparent anisotropy factor obtained from the square root ofthe ratio of the corrected amplitudes for the two pairs of oblique shots.
312 Exploration Geophysics (2001) Vol 32, No. 3 & 4
main refractor on cross-line 49 together with the change inrefractor seismic velocities on the two in-line profiles at cross-line50 is consistent with a lateral change in seismic velocity occurringon cross-line 49. The significance of this result is that a majorchange in refractor seismic velocity has been resolved along cross-line 49, even though the contact between the two zones is probablynot orthogonal to cross-line 49. Theoretical studies (Sjogren,1984, p168-173) have predicted that there should be errors in thedetermination of accurate refractor seismic velocities, due to therefraction in the horizontal direction.
The lateral change in the seismic velocity on cross-line 49 alsoprovides an explanation for the inconsistent traveltimes obtained onthe in-line profiles with the shot points on cross-line 81. Theseismic trace consists of a low amplitude early arrival from the highseismic velocity zone, followed by the high amplitude later arrivalfrom the adjacent low seismic velocity zone. It is possible that oneof these arrivals may be a side swipe, that is the seismic energy hasbeen refracted from an area offset in the cross-line direction.
The seismic velocity of 3380 m/s determined in the cross-linedirection is significantly less than the value of about 5000 m/sdetermined previously with the 2D profile in the in-line direction.It contrasts with the remainder of the survey area, in which theseismic velocities are greater in the cross-line direction. Howeverit is consistent with qualitative measures of azimuthal anisotropyobtained with time-depth ratios in Figure 5 and with amplituderatios in Figure 8.
The seismic velocity of 2000 m/s between cross-lines 53 and 61is 7.5% larger than the value of 1850 m/s measured in the in-linedirection.
On cross-lines 65 and 69 the seismic velocity is 6500 m/sbetween in-lines 19 and 21 and 2000 m/s to 2100 m/s elsewhere.Although the accuracy of the seismic velocity in this centreinterval is not high because it is measured over a limited numberof points, the seismic velocity is still higher than the in-line valueof 3930 m/s determined between cross-lines 60 and 69.
These results are a compelling demonstration that there can beimportant 3D effects even with a nominally 2D geological structure.The lateral change in seismic velocities on cross-line 49 generatesinconsistent arrivals on the in-line data which are more readilyexplained with the cross-line data. In addition, the rock fabric in theregion between cross-lines 45 and 49, as measured with the apparentanisotropy factor, is approximately orthogonal to the dominantgeological strike direction and to the fabric in the remaining regionsof the refractor. One geological interpretation is that this region hasundergone rotation during the formation of the shear zone.
Figure 11 is an isometric view of the cross-line time-depths andshows that the variations in the cross-line direction can beconsiderable even for a nominally 2D structure with a lineorientation which attempted to parallel the dominant strikedirection.
THE CROSS-LINE AMPLITUDE DATA
The cross-lines were recorded in groups of four with the shotsbeing collinear with either the second or third line in the group.The amplitudes for the seven cross-lines shown in Figure 12, wereobtained by combining the corrected amplitude products for eachline using the offset shot pairs for that line. As there was usuallysome variation in the energy levels from each shot due to shot holedepth or local geological conditions affecting coupling of theenergy, it was necessary to scale each set of amplitudes to acommon level. This was achieved by determining an average
scaling factor between adjacent lines using the two shot pairscollinear with those two lines.
The amplitude products corrected for geometric spreading areshown in Figure 12. In general, the amplitudes reflect the seismicvelocities in the refractor. The low seismic velocities betweencross-lines 53 and 61 produce an increase in the amplitudes, whilethe higher seismic velocities between cross-lines 45 and 49 and oncross-line 65 produce lower amplitudes. However, there are anumber of departures from this trend in the regions where adetailed correlation is made.
On cross-line 45, there is a gradual increase in amplitude fromin-line 13 to in-line 25, which is consistent with an increase in theseismic velocity in the overlaying layer from 1020 m/s to1200 m/s. On cross-line 49, the decrease in seismic velocity in therefractor from 3380 m/s to 2000 m/s is matched with a decrease inthe seismic velocity in the overlaying layer from 1020 m/s to 810m/s, resulting in only a minor increase in amplitudes.
There is no obvious explanation for the decrease in amplitudesat each end of cross-lines 53 to 61. While the higher amplitudes inthe centre of each line correlate with the low refractor seismicvelocities, there is little evidence for any significant variation inseismic velocities in the cross-line direction.
Variations in topography and density might provide anexplanation. The topography along the in-lines 17 and 21 is lowerthan that of the surrounding survey area and there is an ephemeralcreek located across the southeastern corner. Accordingly, theedges of the survey area may have lower moisture levels andtherefore lower densities in the second layer. Furthermore, no
Palmer Rock fabric in shallow refraction seismology
Fig. 11. Isometric view of the cross-line time-depths.
Fig. 12. Isometric view of the cross-line amplitude products correctedfor geometric spreading.
313Exploration Geophysics (2001) Vol 32, No. 3 & 4
account has been taken of shear seismic velocities, which alsoaffect the head coefficient.
The gradual increase in amplitudes on cross-lines 53 to 61along in-line 13 correlates with an overall increase of seismicvelocities in the second layer from about 600 m/s to about 800 m/s.However, these values are much the same as the in-line values ofabout 700 m/s, and so do not provide a complete explanation forthe decrease in amplitudes at each end of cross-lines 53 to 61.
The locally high values on cross-lines 55 and 61 correlate withsimilar peaks on the in-line results, indicating a near-surfacegeological source, rather than variations in geophone coupling.
It is also difficult to fully explain the amplitudes on cross-lines65 and 69 because they do not readily correlate with seismicvelocities or the in-line results. The high amplitudes between in-lines 21 and 24 correlate with low refractor seismic velocitiesshown in Figure 9, but they are not matched with similaramplitudes for the low seismic velocities between in-lines 13 and17. Furthermore, the high seismic velocity region between in-lines17 and 21 exhibits both low, but more commonly high, amplitudes.
Despite these apparent inconsistencies, it is possible that theamplitudes are still providing a viable model of the seismicvelocities in the refractor. The low seismic velocities which areimplied by the high amplitudes, correlate with the separation of theregion between cross-lines 60 and 69 into two intervals withseismic velocity of approximately 5000 m/s and 3000 m/s, andwith a seismic velocity of 2600 m/s detected on the earlier 2D databetween cross-lines 67 and 73.
Figure 13 is a summary of the seismic velocities in the in-lineand cross-line directions plotted over a contour map of the time-depths. The boundaries of the regions with different seismicvelocities are interpreted as faults. An additional fault along in-line 17 might also be inferred on the basis of the cross-lineamplitudes.
DISCUSSION AND CONCLUSIONS
The results of this study are a convincing demonstration of thebenefits of 3D shallow refraction methods. Although the shearzone is considered to be a 2D structure, the significant spatialvariations in depths, seismic velocities and azimuthal anisotropydemonstrate that it is best viewed as a 3D target.
The depths to the refractor show considerable variation in thecross-line direction as well as in the in-line direction. There is ageneral increase in depths which is associated with the lower
seismic velocities of 1850 m/s to 2000 m/s between cross-lines 49and 61. However, the increase in depths between in-lines 20 and25 on cross-line 49 could not be confidently predicted on the basisof the results from either the earlier 2D profile or the two in-lineprofiles in this study. Similarly, the lateral variations in seismicvelocities on cross-lines 65 and 69 also require the additionalcoverage in the cross-line direction to be detected and resolved.
In general, the amplitudes correlate with the ratio of the seismicvelocities between the refractor and the layer above. However,there are a number of anomalies in the cross-line results for whichas yet there are no obvious explanations. The geology of thesurvey area is quite complex and it is probable that drilling orexcavation would be required to obtain a complete explanation ofthe observed amplitudes.
The amplitude ratios provide a convenient approach todetermining azimuthal anisotropy. The qualitative correlationbetween the measures of azimuthal anisotropy obtained withseismic velocities, time-depths and amplitude ratios providesconfidence in the validity of the results. This is especially the casewith the region between cross-line 45 and 49 where the directionof the maximum seismic velocity in approximately orthogonal tothat for the remainder of the survey area and to the dominantgeological strike direction.
A major benefit of using amplitudes as a measure of the seismicvelocities and therefore anisotropy, is that a value can bedetermined at each detector, whereas several collinear detectorsare usually required if traveltimes are employed. In addition, it isprobable that the amplitudes may be a more sensitive measure ofanisotropy than traveltimes.
There were a number of difficulties in combining some of thein-line and cross-line amplitude results. This suggests that data berecorded in a single pass using several parallel lines of detectors,rather than with a number separate recording setups.
The results of this study also show that shots laterally offset byup to 20 m still produce results similar to the in-line shots.Therefore, a single line of shot points together with a number ofparallel recording lines, would be efficacious for recording 3Drefraction data along narrow swaths. A minimum of three parallellines is suggested, while five or more would give better cross-linedeterminations of seismic velocities with the traveltime data.
Such a recording program would be suitable for many types ofgeotechnical investigations, as for example with highways anddamsites, which require only relatively limited coverage in thecross-line direction. Accordingly, the benefits of the additionalsampling in the cross-line direction can be achieved without acommensurate increase in the number of shot points. Typically, anincrease of about 100% over an equivalent 2D program may besufficient.
The refractor mapped in this study has large spatial variationsin depths, seismic velocities and azimuthal anisotropy andtherefore it provides a searching test of any approach seeking toresolve each of these parameters. The results of this studydemonstrate that simple and efficient 3D refraction methods usinga GRM approach can provide more useful geologicalinterpretations than would be the case with even detailed 2Dapproaches.
Palmer Rock fabric in shallow refraction seismology
Fig. 13. Summary of seismic velocities and interpreted faults plottedover the contours of the time-depths in milliseconds. The bold arrowsindicate the directions of the higher seismic velocities.
314 Exploration Geophysics (2001) Vol 32, No. 3 & 4
ACKNOWLEDGEMENTS
The data were acquired when I was an employee of theGeological Survey of New South Wales, with the assistance ofRoss Spencer, during a week in the spring of 1986 which rapidlyturned cold and damp. My memory of the survey is of twobedraggled geophysicists who had forgotten their wet weatherclothing wallowing in ankle deep mud and becoming increasinglyfrustrated with a temperamental drill rig.
REFERENCES
Bamford, D., and Nunn, K. R., 1979, In-situ seismic measurements of crackanisotropy in the Carboniferous limestone of North-west England: Geophys.Prosp., 27, 322-338.
Barker, J. A., 1991, Transport in fractured rock, in Downing, R. A., and Wilkinson, W.B., eds., Applied groundwater hydrology: Clarendon Press, 199-216.
Bennett, G., 1999, 3-D seismic refraction for deep exploration targets: The LeadingEdge, 18, 186-191.
Crampin, S., McGonigle, R., and Bamford, D., 1980, Estimating crack parametersfrom observations of P-wave velocity anisotropy: Geophysics, 45, 345-360.
Deen, T. J., Gohl, K., Leslie, C., Papp, E., and Wake-Dyster, K., 2000, Seismicrefraction inversion of a palaeochannel system in the Lachlan Fold Belt, CentralNew South Wales: Explor. Geophys., 31, 389-393.
Lanz, E., Maurer, H., and Green, A. G., 1998, Refraction tomography over a buriedwaste disposal site: Geophysics, 63, 1414-1433.
Leslie, J. M., and Lawton, D. C., 1999, A refraction-seismic field study to determinethe anisotropic parameters of shales: Geophysics, 64, 1247-1252.
Nestvold, E. O., 1992, 3-D seismic: is the promise fulfilled?: The Leading Edge, 11,12-19.
Palmer, D., 1980, The generalized reciprocal method of seismic refractioninterpretation: Society of Exploration Geophysicists.
Palmer, D., 1986, Refraction seismics - the lateral resolution of structure and seismicvelocity: Geophysical Press.
Palmer, D., 2000a, Can new acquisition methods improve signal-to-noise ratios withseismic refraction techniques? Explor. Geophys. 31, 275-280.
Palmer, D., 2000b, Can amplitudes resolve ambiguities in refraction inversion?Explor. Geophys. 31, 304-309.
Palmer, D., 2001a, Imaging refractors with convolution: Geophysics, 66, 1583-1589.
Palmer, D., 2001b, Resolving refractor ambiguities with amplitudes: Geophysics, 66,1590-1593.
Palmer, D., 2001c, Effects of near-surface lateral variations on refraction amplitudes:submitted.
Sjogren, B., 1984, Shallow refraction seismics: Chapman and Hall.
Thomsen, L., 1995, Elastic anisotropy due to aligned cracks in porous rock: Geophys.Prosp., 43, 805-829.
Zelt, C. A., and Barton, P. J., 1998, 3D seismic refraction tomography: a comparisonof two methods applied to data from the Faeroe Basin: J. Geophy. Res., 103,7187-7210.
Zelt, C. A., 1998, Lateral velocity resolution from 3-D seismic refraction data:Geophysical Journal International, 135, 1101-1112.
Palmer Rock fabric in shallow refraction seismology
Related Documents


