© 2014 Hata et al. This work is published by Dove Medical Press Limited, and licensed under Creative Commons Attribution – Non Commercial (unported, v3.0) License. The full terms of the License are available at http://creativecommons.org/licenses/by-nc/3.0/. Non-commercial uses of the work are permitted without any further permission from Dove Medical Press Limited, provided the work is properly attributed. Permissions beyond the scope of the License are administered by Dove Medical Press Limited. Information on how to request permission may be found at: http://www.dovepress.com/permissions.php Clinical Ophthalmology 2014:8 105–111 Clinical Ophthalmology Dovepress submit your manuscript | www.dovepress.com Dovepress 105 ORIGINAL RESEARCH open access to scientific and medical research Open Access Full Text Article http://dx.doi.org/10.2147/OPTH.S46769 Measurement of retinal nerve fiber layer thickness in eyes with optic disc swelling by using scanning laser polarimetry and optical coherence tomography Masayuki Hata Kazuaki Miyamoto Akio Oishi Yugo Kimura Satoko Nakagawa Takahiro Horii Nagahisa Yoshimura Department of Ophthalmology and Visual Sciences, Kyoto University Graduate School of Medicine, Kyoto, Japan Correspondence: Masayuki Hata Department of Ophthalmology and Visual Sciences, Kyoto University Graduate School of Medicine, Sakyo-ku, Kyoto 606-8507, Japan Tel +81 75 751 3250 Fax +81 75 752 0933 Email [email protected] Background: The retinal nerve fiber layer thickness (RNFLT) in patients with optic disc swelling of different etiologies was compared using scanning laser polarimetry (SLP) and spectral-domain optical coherence tomography (OCT). Methods: Forty-seven patients with optic disc swelling participated in the cross-sectional study. Both GDx SLP (enhanced corneal compensation) and Spectralis spectral-domain OCT measurements of RNFLT were made in 19 eyes with papilledema (PE), ten eyes with optic neuritis (ON), and 18 eyes with nonarteritic anterior ischemic optic neuropathy (NAION) at the neuro-ophthalmology clinic at Kyoto University Hospital. Differences in SLP (SLP-RNFLT) and OCT (OCT-RNFLT) measurements among different etiologies were investigated. Results: No statistical differences in average OCT-RNFLT among PE, ON, and NAION patients were noted. Average SLP-RNFLT in NAION patients was smaller than in PE (P,0.01) or ON (P=0.02) patients. When RNFLT in each retinal quadrant was compared, no difference among etiologies was noted on OCT, but on SLP, the superior quadrant was thinner in NAION than in PE (P,0.001) or ON (P=0.001) patients. Compared with age-adjusted normative data of SLP- RNFLT, average SLP-RNFLT in PE (P,0.01) and ON (P,0.01) patients was greater. Superior SLP-RNFLT in NAION patients was smaller (P=0.026). The ratio of average SLP-RNFLT to average OCT-RNFLT was smaller in NAION than in PE (P=0.001) patients. Conclusion: In the setting of RNFL thickening, despite increased light retardance in PE and ON eyes, SLP revealed that NAION eyes have less retardance, possibly associated with isch- emic axonal loss. Keywords: optic disc swelling, scanning laser polarimetry, optical coherence tomography Introduction The retinal nerve fiber layer (RNFL) is composed of retinal ganglion cell (RGC) axons. The circumpapillary RNFL (cpRNFL), in particular, comprises all nerve fibers entering the optic nerve disc. Therefore, evaluating the cpRNFL is useful in detecting RGC damage and in understanding the pathophysiology of neuro-ophthalmic disease. 1,2 Thickness of the cpRNFL is a useful measure, and recent advances in diagnostic equip- ment allow for noninvasive measurement of RNFL thickness (RNFLT). 3,4 Different types of instruments are available for measuring cpRNFLT. Optical coher- ence tomography (OCT), a near-infrared light-based imaging technique, allows for microscopic cross-sectional imaging of biological systems. 5 An optical signal transmitted through, or reflected from, the human retina contains time-to-flight information, which

Welcome message from author
This document is posted to help you gain knowledge. Please leave a comment to let me know what you think about it! Share it to your friends and learn new things together.
Transcript
© 2014 Hata et al. This work is published by Dove Medical Press Limited, and licensed under Creative Commons Attribution – Non Commercial (unported, v3.0) License. The full terms of the License are available at http://creativecommons.org/licenses/by-nc/3.0/. Non-commercial uses of the work are permitted without any further
permission from Dove Medical Press Limited, provided the work is properly attributed. Permissions beyond the scope of the License are administered by Dove Medical Press Limited. Information on how to request permission may be found at: http://www.dovepress.com/permissions.php
Clinical Ophthalmology 2014:8 105–111
Clinical Ophthalmology Dovepress
submit your manuscript | www.dovepress.com
Dovepress 105
O r i g i n a l r e s e a r C h
open access to scientific and medical research
Open access Full Text article
http://dx.doi.org/10.2147/OPTH.S46769
Measurement of retinal nerve fiber layer thickness in eyes with optic disc swelling by using scanning laser polarimetry and optical coherence tomography
Masayuki hataKazuaki Miyamotoakio OishiYugo Kimurasatoko nakagawaTakahiro horiinagahisa YoshimuraDepartment of Ophthalmology and Visual sciences, Kyoto University graduate school of Medicine, Kyoto, Japan
Correspondence: Masayuki hata Department of Ophthalmology and Visual sciences, Kyoto University graduate school of Medicine, sakyo-ku, Kyoto 606-8507, Japan Tel +81 75 751 3250 Fax +81 75 752 0933 email [email protected]
Background: The retinal nerve fiber layer thickness (RNFLT) in patients with optic disc
swelling of different etiologies was compared using scanning laser polarimetry (SLP) and
spectral-domain optical coherence tomography (OCT).
Methods: Forty-seven patients with optic disc swelling participated in the cross-sectional
study. Both GDx SLP (enhanced corneal compensation) and Spectralis spectral-domain OCT
measurements of RNFLT were made in 19 eyes with papilledema (PE), ten eyes with optic
neuritis (ON), and 18 eyes with nonarteritic anterior ischemic optic neuropathy (NAION) at the
neuro-ophthalmology clinic at Kyoto University Hospital. Differences in SLP (SLP-RNFLT)
and OCT (OCT-RNFLT) measurements among different etiologies were investigated.
Results: No statistical differences in average OCT-RNFLT among PE, ON, and NAION patients
were noted. Average SLP-RNFLT in NAION patients was smaller than in PE (P,0.01) or ON
(P=0.02) patients. When RNFLT in each retinal quadrant was compared, no difference among
etiologies was noted on OCT, but on SLP, the superior quadrant was thinner in NAION than in
PE (P,0.001) or ON (P=0.001) patients. Compared with age-adjusted normative data of SLP-
RNFLT, average SLP-RNFLT in PE (P,0.01) and ON (P,0.01) patients was greater. Superior
SLP-RNFLT in NAION patients was smaller (P=0.026). The ratio of average SLP-RNFLT to
average OCT-RNFLT was smaller in NAION than in PE (P=0.001) patients.
Conclusion: In the setting of RNFL thickening, despite increased light retardance in PE and
ON eyes, SLP revealed that NAION eyes have less retardance, possibly associated with isch-
emic axonal loss.
Keywords: optic disc swelling, scanning laser polarimetry, optical coherence tomography
IntroductionThe retinal nerve fiber layer (RNFL) is composed of retinal ganglion cell (RGC)
axons. The circumpapillary RNFL (cpRNFL), in particular, comprises all nerve fibers
entering the optic nerve disc. Therefore, evaluating the cpRNFL is useful in detecting
RGC damage and in understanding the pathophysiology of neuro-ophthalmic disease.1,2
Thickness of the cpRNFL is a useful measure, and recent advances in diagnostic equip-
ment allow for noninvasive measurement of RNFL thickness (RNFLT).3,4
Different types of instruments are available for measuring cpRNFLT. Optical coher-
ence tomography (OCT), a near-infrared light-based imaging technique, allows for
microscopic cross-sectional imaging of biological systems.5 An optical signal transmitted
through, or reflected from, the human retina contains time-to-flight information, which
Clinical Ophthalmology 2014:8submit your manuscript | www.dovepress.com
Dovepress
Dovepress
106
hata et al
in turn yields spatial information about tissue microstructure.
Compared to conventional time-domain OCT (TD-OCT), the
recent advances in spectral-domain OCT (SD-OCT) enable
faster acquisition speed and fewer motion artifacts in the images,
which provides reproducible RNFLT measurements.6,7
Scanning laser polarimetry (SLP) measures the change
in light polarization (retardation) as light passes through a
medium, in this case, the cornea and the RNFL. Weinreb et al8
reported a correlation between SLP values and histopathologic
measurements in nonhuman retinas. In RNFL, axonal cell mem-
branes, microtubules, neurofilaments, and mitochondria may
contribute to tissue birefringence.9–11 Therefore, SLP measure-
ments reflect the birefringent properties of the RNFL and are
not a substitute for actual RNFLT measurements.12
These two instruments have the possibility of evaluating
different elements in measuring RNFLT. The OCT measure-
ments reflect the anatomic thickness of the cpRNFL and
include both intracellular and extracellular components.13 In
contrast, SLP measurements provide information on intra-
axonal microtubule and neurofilament structure.9–11
Both OCT and SLP measurements show similar tendency
of RNFL thinning in glaucoma and other diseases that involve
optic nerve atrophy. There is a strong correlation between the
two measures,14 which means that a reduction in tissue birefrin-
gence accompanies RNFL thinning. However, the correlation
between the two measurements in the setting of disc swelling
(eg, papilledema [PE], anterior ischemic optic neuropathy
[AION], or optic neuritis [ON]) had remained unknown.
Recently, Kupersmith et al15 reported a disparity between
SLP and OCT measurements in eyes with nonarteritic AION
(NAION). Interestingly, SLP measurements of RNFLT
revealed an RNFL thinning in eyes with NAION, in contrast
to an increase in RNFLT measured mainly by TD-OCT in
eyes with NAION or other conditions of optic disc swell-
ing, while PE and ON cases showed slight increase in SLP-
RNFLT. However, it has also been reported that RNFLT
measurements differ between TD-OCT and SD-OCT,
and that these measurements are not interchangeable.7,16
Therefore, in the present study, we used SD-OCT, which
provides both faster scan acquisition and higher scan resolu-
tion than TD-OCT, to investigate differences in cpRNFLT
measurements obtained by SD-OCT (OCT-RNFLT) and SLP
(SLP-RNFLT) in the setting of optic disc swelling.
Materials and methodsPatientsEthics approval was granted by the Institutional Review
Board of Kyoto University Graduate School of Medicine.
We retrospectively reviewed the clinical records of
47 patients with optic disc swelling caused by PE, NAION,
or ON, who presented at the neuro-ophthalmology clinic at
Kyoto University Hospital between April 2009 and March
2012. To be included in analyses, both ON and NAION had
to be of new onset (vision loss or visual field defect within
2 weeks), and PE cases had to have no visual dysfunction
or have it limited to blind spot enlargement. Eyes with other
ocular diseases, except mild cataract, were excluded.
Diagnostic determinations and classifications of etiologiesAll patients underwent various eye examinations to determine
the cause of optic disc swelling. At the first visit, evaluations
included visual acuity, slit lamp examination, fundus photog-
raphy, perimetry, Spectralis SD-OCT (Heidelberg Spectralis
OCT; Heidelberg Engineering Inc, Heidelberg, Germany),
and SLP (GDx Nerve Fiber Analyzer; Carl Zeiss Meditec
AG, Jena, Germany). An experienced neuro-ophthalmologist
made all diagnoses (KM). A diagnosis of NAION was based
on clinical signs and symptoms alone, which included acute/
subacute monocular visual impairment at an age of $45
years, absence of pain, and absence of giant cell arteritis
or multiple sclerosis. A diagnosis of ON was also based on
clinical grounds alone, and signs and symptoms included
acute/subacute monocular visual impairment occurring
between 15–45 years of age, retrobulbar pain and/or pain
with eye movement, and a history of multiple sclerosis. All
patients with ON underwent magnetic resonance imaging
with gadolinium enhancement. A diagnosis of PE was made
if patients had intracranial hypertension, as confirmed by
lumbar puncture or magnetic resonance imaging with gado-
linium enhancement.
scanning laser polarimetry and optical coherence tomographyAll SLP-RNFLT measurements were made in nondilated
pupils on an SLP system equipped with enhanced corneal
compensation research software (GDx ECC; Carl Zeiss
Meditec AG). Five SLP parameters, which provided absolute
measurements of RNFL retardation, were analyzed. These
included average RNFLT measurements of the entire circum-
papillary region (temporal-superior-nasal-inferior-temporal
[TSNIT], average SLP-RNFLT), the superior quadrant
(superior SLP-RNFLT), the inferior quadrant (inferior SLP-
RNFLT), the temporal quadrant (temporal SLP-RNFLT), and
the nasal quadrant (nasal SLP-RNFLT). The ellipse average
represents average thickness of the retinal nerve fiber in a
Clinical Ophthalmology 2014:8 submit your manuscript | www.dovepress.com
Dovepress
Dovepress
107
Retinal nerve fiber layer thickness in eyes with optic disc swelling
10-pixel-wide band with a diameter 1.75 times that of the
optic nerve.
Spectralis SD-OCT was used in high-resolution mode
to measure RNFL thickness with the built-in RNFL/optic
disc protocol. Five OCT parameters were used to assess
RNFLT and included average cpRNFL (average OCT-
RNFLT), average superior (superior OCT-RNFLT), average
inferior (inferior OCT-RNFLT), average temporal (tempo-
ral OCT-RNFLT), and average nasal (nasal OCT-RNFLT)
measurements. These parameters were automatically gener-
ated by both the SLP and SD-OCT software.
As for SD-OCT, at least two scans were performed by
the same experienced operator after the patient’s pupils had
been dilated. To enhance the SD-OCT signal-to-noise ratio,
over 40 scans were averaged to obtain the final recording.
Only images that were well-centered on the optic disc and had
good quality were chosen to be included in analyses. A single
physician (MH), who was masked to the patient’s clinical
condition, made the decision to include or exclude patient
scans. For SLP scans, only images with a quality score $7
were used, and results were compared with normative data
from the GDx database. All SLP-RNFLT measurements
were adjusted for age by using the best-fit line obtained from
540 normal eyes.17 The following equations were used:
TSNIT average: y = -0.053 × age + 58.563 (1)
Superior average: y = -0.1164 × age + 73.444 (2)
Inferior average: y = -0.1047 × age + 70.356 (3)
Data analysesData are presented as mean ± standard deviation. Statistical
analyses were performed using statistical software (SPSS
Statistics Desktop, version 19.0.0; IBM Corporation,
Armonk, NY, USA). Patient means between disease groups
were compared using unpaired Student’s t-tests and one-way
ANOVA with Bonferroni correction. Bivariate relationships
were examined using Spearman correlation coefficients.
Statistical significance was defined as P#0.05.
ResultsNineteen eyes (ten patients) with PE, 18 eyes (17 patients)
with NAION, and ten eyes (eight patients) with ON were
included in analyses. Mean subject age at disease onset was
41.8±17.7 years in PE patients, 61.8±12.1 years in NAION
patients, and 34.5±12.3 years in ON patients.
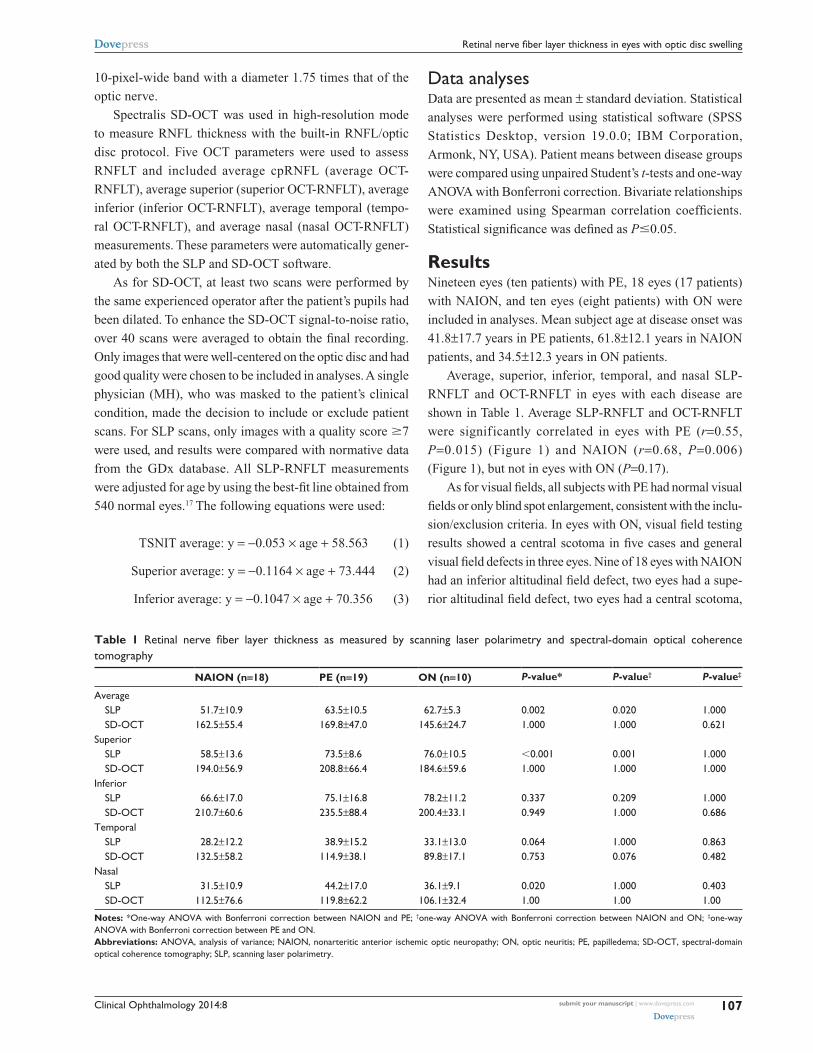
Average, superior, inferior, temporal, and nasal SLP-
RNFLT and OCT-RNFLT in eyes with each disease are
shown in Table 1. Average SLP-RNFLT and OCT-RNFLT
were significantly correlated in eyes with PE (r=0.55,
P=0.015) (Figure 1) and NAION (r=0.68, P=0.006)
(Figure 1), but not in eyes with ON (P=0.17).
As for visual fields, all subjects with PE had normal visual
fields or only blind spot enlargement, consistent with the inclu-
sion/exclusion criteria. In eyes with ON, visual field testing
results showed a central scotoma in five cases and general
visual field defects in three eyes. Nine of 18 eyes with NAION
had an inferior altitudinal field defect, two eyes had a supe-
rior altitudinal field defect, two eyes had a central scotoma,
Table 1 Retinal nerve fiber layer thickness as measured by scanning laser polarimetry and spectral-domain optical coherence tomography
NAION (n=18) PE (n=19) ON (n=10) P-value* P-value† P-value‡
average slP
sD-OCT51.7±10.9
162.5±55.463.5±10.5
169.8±47.062.7±5.3
145.6±24.7
0.002 1.000
0.020 1.000
1.000 0.621
superior slP
sD-OCT58.5±13.6
194.0±56.973.5±8.6
208.8±66.476.0±10.5
184.6±59.6
,0.001 1.000
0.001 1.000
1.000 1.000
inferior slP
sD-OCT66.6±17.0
210.7±60.675.1±16.8
235.5±88.478.2±11.2
200.4±33.1
0.337 0.949
0.209 1.000
1.000 0.686
Temporal slP
sD-OCT28.2±12.2
132.5±58.238.9±15.2
114.9±38.133.1±13.089.8±17.1
0.064 0.753
1.000 0.076
0.863 0.482
nasal slP
sD-OCT31.5±10.9
112.5±76.644.2±17.0
119.8±62.236.1±9.1
106.1±32.4
0.020 1.00
1.000 1.00
0.403 1.00
Notes: *One-way ANOVA with Bonferroni correction between NAION and PE; †one-way ANOVA with Bonferroni correction between NAION and ON; ‡one-way ANOVA with Bonferroni correction between PE and ON.Abbreviations: ANOVA, analysis of variance; NAION, nonarteritic anterior ischemic optic neuropathy; ON, optic neuritis; PE, papilledema; SD-OCT, spectral-domain optical coherence tomography; SLP, scanning laser polarimetry.
Clinical Ophthalmology 2014:8submit your manuscript | www.dovepress.com
Dovepress
Dovepress
108
hata et al
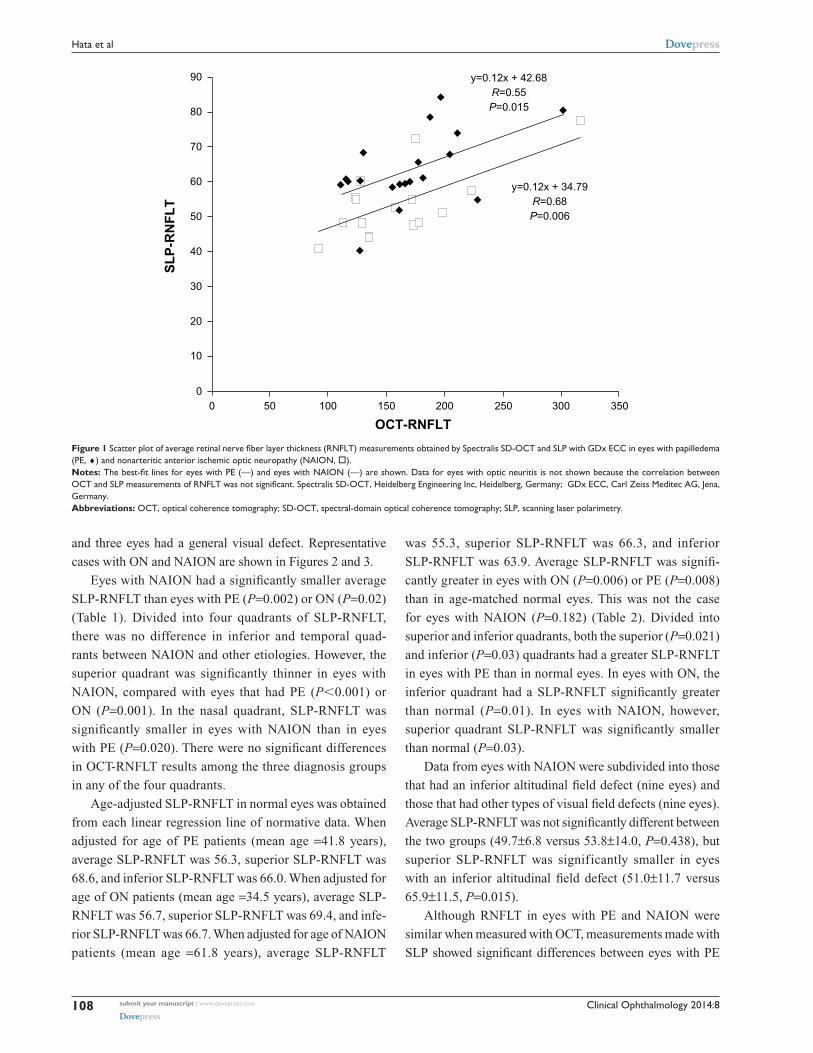
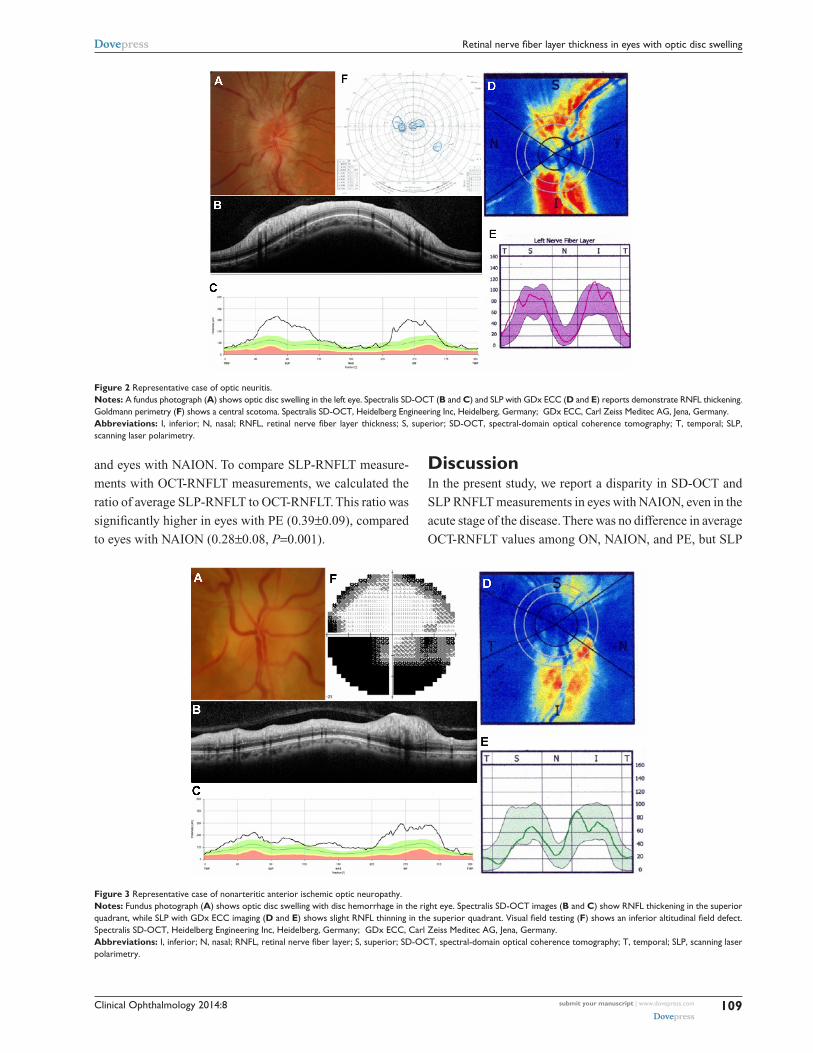
and three eyes had a general visual defect. Representative
cases with ON and NAION are shown in Figures 2 and 3.
Eyes with NAION had a significantly smaller average
SLP-RNFLT than eyes with PE (P=0.002) or ON (P=0.02)
(Table 1). Divided into four quadrants of SLP-RNFLT,
there was no difference in inferior and temporal quad-
rants between NAION and other etiologies. However, the
superior quadrant was significantly thinner in eyes with
NAION, compared with eyes that had PE (P,0.001) or
ON (P=0.001). In the nasal quadrant, SLP-RNFLT was
significantly smaller in eyes with NAION than in eyes
with PE (P=0.020). There were no significant differences
in OCT-RNFLT results among the three diagnosis groups
in any of the four quadrants.
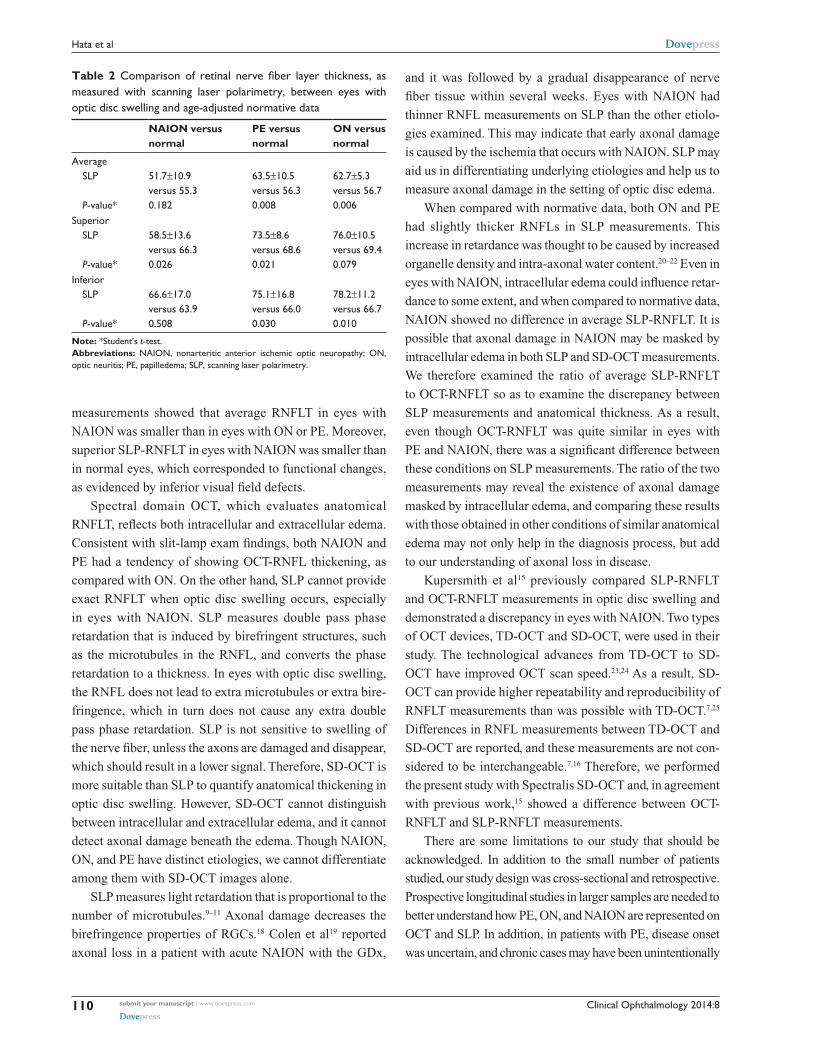
Age-adjusted SLP-RNFLT in normal eyes was obtained
from each linear regression line of normative data. When
adjusted for age of PE patients (mean age =41.8 years),
average SLP-RNFLT was 56.3, superior SLP-RNFLT was
68.6, and inferior SLP-RNFLT was 66.0. When adjusted for
age of ON patients (mean age =34.5 years), average SLP-
RNFLT was 56.7, superior SLP-RNFLT was 69.4, and infe-
rior SLP-RNFLT was 66.7. When adjusted for age of NAION
patients (mean age =61.8 years), average SLP-RNFLT
was 55.3, superior SLP-RNFLT was 66.3, and inferior
SLP-RNFLT was 63.9. Average SLP-RNFLT was signifi-
cantly greater in eyes with ON (P=0.006) or PE (P=0.008)
than in age-matched normal eyes. This was not the case
for eyes with NAION (P=0.182) (Table 2). Divided into
superior and inferior quadrants, both the superior (P=0.021)
and inferior (P=0.03) quadrants had a greater SLP-RNFLT
in eyes with PE than in normal eyes. In eyes with ON, the
inferior quadrant had a SLP-RNFLT significantly greater
than normal (P=0.01). In eyes with NAION, however,
superior quadrant SLP-RNFLT was significantly smaller
than normal (P=0.03).
Data from eyes with NAION were subdivided into those
that had an inferior altitudinal field defect (nine eyes) and
those that had other types of visual field defects (nine eyes).
Average SLP-RNFLT was not significantly different between
the two groups (49.7±6.8 versus 53.8±14.0, P=0.438), but
superior SLP-RNFLT was significantly smaller in eyes
with an inferior altitudinal field defect (51.0±11.7 versus
65.9±11.5, P=0.015).
Although RNFLT in eyes with PE and NAION were
similar when measured with OCT, measurements made with
SLP showed significant differences between eyes with PE
350300250200150
OCT-RNFLT
SL
P-R
NF
LT
1005000
10
20
30
40
50
60
70
80
90 y=0.12x + 42.68R=0.55P=0.015
y=0.12x + 34.79R=0.68P=0.006
Figure 1 Scatter plot of average retinal nerve fiber layer thickness (RNFLT) measurements obtained by Spectralis SD-OCT and SLP with GDx ECC in eyes with papilledema (PE, ♦) and nonarteritic anterior ischemic optic neuropathy (NAION, o).Notes: The best-fit lines for eyes with PE (—) and eyes with NAION (—) are shown. Data for eyes with optic neuritis is not shown because the correlation between OCT and SLP measurements of RNFLT was not significant. Spectralis SD-OCT, Heidelberg Engineering Inc, Heidelberg, Germany; GDx ECC, Carl Zeiss Meditec AG, Jena, germany.Abbreviations: OCT, optical coherence tomography; SD-OCT, spectral-domain optical coherence tomography; SLP, scanning laser polarimetry.
Clinical Ophthalmology 2014:8 submit your manuscript | www.dovepress.com
Dovepress
Dovepress
109
Retinal nerve fiber layer thickness in eyes with optic disc swelling
and eyes with NAION. To compare SLP-RNFLT measure-
ments with OCT-RNFLT measurements, we calculated the
ratio of average SLP-RNFLT to OCT-RNFLT. This ratio was
significantly higher in eyes with PE (0.39±0.09), compared
to eyes with NAION (0.28±0.08, P=0.001).
DiscussionIn the present study, we report a disparity in SD-OCT and
SLP RNFLT measurements in eyes with NAION, even in the
acute stage of the disease. There was no difference in average
OCT-RNFLT values among ON, NAION, and PE, but SLP
Figure 2 representative case of optic neuritis.Notes: A fundus photograph (A) shows optic disc swelling in the left eye. Spectralis SD-OCT (B and C) and SLP with GDx ECC (D and E) reports demonstrate RNFL thickening. Goldmann perimetry (F) shows a central scotoma. Spectralis SD-OCT, Heidelberg Engineering Inc, Heidelberg, Germany; GDx ECC, Carl Zeiss Meditec AG, Jena, Germany.Abbreviations: i, inferior; N, nasal; RNFL, retinal nerve fiber layer thickness; S, superior; SD-OCT, spectral-domain optical coherence tomography; T, temporal; SLP, scanning laser polarimetry.
Figure 3 representative case of nonarteritic anterior ischemic optic neuropathy.Notes: Fundus photograph (A) shows optic disc swelling with disc hemorrhage in the right eye. Spectralis SD-OCT images (B and C) show RNFL thickening in the superior quadrant, while SLP with GDx ECC imaging (D and E) shows slight RNFL thinning in the superior quadrant. Visual field testing (F) shows an inferior altitudinal field defect. Spectralis SD-OCT, Heidelberg Engineering Inc, Heidelberg, Germany; GDx ECC, Carl Zeiss Meditec AG, Jena, Germany.Abbreviations: i, inferior; N, nasal; RNFL, retinal nerve fiber layer; S, superior; SD-OCT, spectral-domain optical coherence tomography; T, temporal; SLP, scanning laser polarimetry.
Clinical Ophthalmology 2014:8submit your manuscript | www.dovepress.com
Dovepress
Dovepress
110
hata et al
measurements showed that average RNFLT in eyes with
NAION was smaller than in eyes with ON or PE. Moreover,
superior SLP-RNFLT in eyes with NAION was smaller than
in normal eyes, which corresponded to functional changes,
as evidenced by inferior visual field defects.
Spectral domain OCT, which evaluates anatomical
RNFLT, reflects both intracellular and extracellular edema.
Consistent with slit-lamp exam findings, both NAION and
PE had a tendency of showing OCT-RNFL thickening, as
compared with ON. On the other hand, SLP cannot provide
exact RNFLT when optic disc swelling occurs, especially
in eyes with NAION. SLP measures double pass phase
retardation that is induced by birefringent structures, such
as the microtubules in the RNFL, and converts the phase
retardation to a thickness. In eyes with optic disc swelling,
the RNFL does not lead to extra microtubules or extra bire-
fringence, which in turn does not cause any extra double
pass phase retardation. SLP is not sensitive to swelling of
the nerve fiber, unless the axons are damaged and disappear,
which should result in a lower signal. Therefore, SD-OCT is
more suitable than SLP to quantify anatomical thickening in
optic disc swelling. However, SD-OCT cannot distinguish
between intracellular and extracellular edema, and it cannot
detect axonal damage beneath the edema. Though NAION,
ON, and PE have distinct etiologies, we cannot differentiate
among them with SD-OCT images alone.
SLP measures light retardation that is proportional to the
number of microtubules.9–11 Axonal damage decreases the
birefringence properties of RGCs.18 Colen et al19 reported
axonal loss in a patient with acute NAION with the GDx,
and it was followed by a gradual disappearance of nerve
fiber tissue within several weeks. Eyes with NAION had
thinner RNFL measurements on SLP than the other etiolo-
gies examined. This may indicate that early axonal damage
is caused by the ischemia that occurs with NAION. SLP may
aid us in differentiating underlying etiologies and help us to
measure axonal damage in the setting of optic disc edema.
When compared with normative data, both ON and PE
had slightly thicker RNFLs in SLP measurements. This
increase in retardance was thought to be caused by increased
organelle density and intra-axonal water content.20–22 Even in
eyes with NAION, intracellular edema could influence retar-
dance to some extent, and when compared to normative data,
NAION showed no difference in average SLP-RNFLT. It is
possible that axonal damage in NAION may be masked by
intracellular edema in both SLP and SD-OCT measurements.
We therefore examined the ratio of average SLP-RNFLT
to OCT-RNFLT so as to examine the discrepancy between
SLP measurements and anatomical thickness. As a result,
even though OCT-RNFLT was quite similar in eyes with
PE and NAION, there was a significant difference between
these conditions on SLP measurements. The ratio of the two
measurements may reveal the existence of axonal damage
masked by intracellular edema, and comparing these results
with those obtained in other conditions of similar anatomical
edema may not only help in the diagnosis process, but add
to our understanding of axonal loss in disease.
Kupersmith et al15 previously compared SLP-RNFLT
and OCT-RNFLT measurements in optic disc swelling and
demonstrated a discrepancy in eyes with NAION. Two types
of OCT devices, TD-OCT and SD-OCT, were used in their
study. The technological advances from TD-OCT to SD-
OCT have improved OCT scan speed.23,24 As a result, SD-
OCT can provide higher repeatability and reproducibility of
RNFLT measurements than was possible with TD-OCT.7,25
Differences in RNFL measurements between TD-OCT and
SD-OCT are reported, and these measurements are not con-
sidered to be interchangeable.7,16 Therefore, we performed
the present study with Spectralis SD-OCT and, in agreement
with previous work,15 showed a difference between OCT-
RNFLT and SLP-RNFLT measurements.
There are some limitations to our study that should be
acknowledged. In addition to the small number of patients
studied, our study design was cross-sectional and retrospective.
Prospective longitudinal studies in larger samples are needed to
better understand how PE, ON, and NAION are represented on
OCT and SLP. In addition, in patients with PE, disease onset
was uncertain, and chronic cases may have been unintentionally
Table 2 Comparison of retinal nerve fiber layer thickness, as measured with scanning laser polarimetry, between eyes with optic disc swelling and age-adjusted normative data
NAION versus normal
PE versus normal
ON versus normal
average slP
P-value*
51.7±10.9 versus 55.3 0.182
63.5±10.5 versus 56.3 0.008
62.7±5.3 versus 56.7 0.006
superior slP
P-value*
58.5±13.6 versus 66.3 0.026
73.5±8.6 versus 68.6 0.021
76.0±10.5 versus 69.4 0.079
inferior slP
P-value*
66.6±17.0 versus 63.9 0.508
75.1±16.8 versus 66.0 0.030
78.2±11.2 versus 66.7 0.010
Note: *student’s t-test.Abbreviations: NAION, nonarteritic anterior ischemic optic neuropathy; ON, optic neuritis; PE, papilledema; SLP, scanning laser polarimetry.
Clinical Ophthalmology
Publish your work in this journal
Submit your manuscript here: http://www.dovepress.com/clinical-ophthalmology-journal
Clinical Ophthalmology is an international, peer-reviewed journal covering all subspecialties within ophthalmology. Key topics include: Optometry; Visual science; Pharmacology and drug therapy in eye diseases; Basic Sciences; Primary and Secondary eye care; Patient Safety and Quality of Care Improvements. This journal is indexed on
PubMed Central and CAS, and is the official journal of The Society of Clinical Ophthalmology (SCO). The manuscript management system is completely online and includes a very quick and fair peer-review system, which is all easy to use. Visit http://www.dovepress.com/ testimonials.php to read real quotes from published authors.
Clinical Ophthalmology 2014:8 submit your manuscript | www.dovepress.com
Dovepress
Dovepress
Dovepress
111
Retinal nerve fiber layer thickness in eyes with optic disc swelling
included in our analyses. We tried to minimize this by including
only those cases that had minimal visual impairment. On the
flip side, this may have introduced a patient selection bias.
In conclusion, exact anatomical thickness in eyes with
optic disc swelling could not be evaluated by SLP differ-
ently from OCT. In particular, eyes with early-stage NAION
showed RNFL thinning on SLP measurements, while eyes
with ON or PE did not. This may suggest that GDx SLP
detects axonal damage, presumably caused by ischemia,
even in the setting of optic disc swelling. The magnitude of
the discrepancy between SLP and OCT measurements of
RNFLT may be useful in differentiating diseases that are
accompanied by optic disc swelling.
DisclosureThe authors report no conflicts of interest in this work.
References 1. Jonas JB, Dichtl A. Evaluation of the retinal nerve fiber layer. Surv
Ophthalmol. 1996;40(5):369–378. 2. Pasol J. Neuro-ophthalmic disease and optical coherence tomography:
glaucoma look-alikes. Curr Opin Ophthalmol. 2011;22(2):124–132. 3. Burk RO, Völcker HE. Current imaging of the optic disk and retinal
nerve fiber layer. Curr Opin Ophthalmol. 1996;7(2):99–108. 4. Townsend KA, Wollstein G, Schuman JS. Imaging of the retinal nerve
fibre layer for glaucoma. Br J Ophthalmol. 2009;93(2):139–143. 5. Huang D, Swanson EA, Lin CP, et al. Optical coherence tomography.
Science. 1991;254(5035):1178–1181. 6. Wojtkowski M, Srinivasan V, Fujimoto JG, et al. Three-dimensional
retinal imaging with high-speed ultrahigh-resolution optical coherence tomography. Ophthalmology. 2005;112(10):1734–1746.
7. Arthur SN, Smith SD, Wright MM, et al. Reproducibility and agree-ment in evaluating retinal nerve fibre layer thickness between Stratus and Spectralis OCT. Eye (Lond). 2011;25(2):192–200.
8. Weinreb RN, Dreher AW, Coleman A, Quigley H, Shaw B, Reiter K. Histopathologic validation of Fourier-ellipsometry measurements of retinal nerve fiber layer thickness. Arch Ophthalmol. 1990;108(4): 557–560.
9. Huang XR, Knighton RW. Microtubules contribute to the birefringence of the retinal nerve fiber layer. Invest Ophthalmol Vis Sci. 2005;46(12): 4588–4593.
10. Zhou Q, Knighton RW. Light scattering and form birefringence of parallel cylindrical arrays that represent cellular organelles of the retinal nerve fiber layer. Appl Opt. 1997;36(10):2273–2285.
11. Knighton RW, Huang X, Zhou Q. Microtubule contribution to the reflectance of the retinal nerve fiber layer. Invest Ophthalmol Vis Sci. 1998;39(1):189–193.
12. Banks MC, Robe-Collignon NJ, Rizzo JF. Scanning laser polarimetry of edematous and atrophic optic nerve heads. Arch Ophthalmol. 2003;121(4):484–490.
13. Schuman JS, Pedut-Kloizman T, Pakter H, et al. Optical coherence tomography and histologic measurements of nerve fiber layer thickness in normal and glaucomatous monkey eyes. Invest Ophthalmol Vis Sci. 2007;48(8):3645–3654.
14. Medeiros FA, Zangwill LM, Bowd C, Weinreb RN. Comparison of the GDx VCC scanning laser polarimeter, HRT II confocal scanning laser ophthalmoscope, and stratus OCT optical coherence tomograph for the detection of glaucoma. Arch Ophthalmol. 2004;122(6):827–837.
15. Kupersmith MJ, Kardon R, Durbin M, Horne M, Shulman J. Scanning laser polarimetry reveals status of RNFL integrity in eyes with optic nerve head swelling by OCT. Invest Ophthalmol Vis Sci. 2012;53(4): 1962–1970.
16. Vizzeri G, Weinreb RN, Gonzalez-Garcia AO, et al. Agreement between spectral-domain and time-domain OCT for measuring RNFL thickness. Br J Ophthalmol. 2009;93(6):775–781.
17. Laser Diagnostic Technologies, Inc. RNFL Evaluation with the GDx VCC to Diagnose and Monitor Glaucoma. In: The GDx VCC Primer. San Diego, CA: Laser Diagnostic Technologies, Inc; 2004:20;17–25.
18. Weinreb RN, Shakiba S, Zangwill L. Scanning laser polarimetry to measure the nerve fiber layer of normal and glaucomatous eyes. Am J Ophthalmol. 1995;119(5):627–636.
19. Colen TP, van Everdingen JA, Lemij HG. Axonal loss in a patient with anterior ischemic optic neuropathy as measured with scanning laser polarimetry. Am J Ophthalmol. 2000;130(6):847–850.
20. Kupersmith MJ, Mandel G, Anderson S, Meltzer DE, Kardon R. Baseline, one and three month changes in the peripapillary retinal nerve fiber layer in acute optic neuritis: relation to baseline vision and MRI. J Neurol Sci. 2011;308(1–2):117–123.
21. Tso MO, Fine BS. Electron microscopic study of human papilledema. Am J Ophthalmol. 1976;82(3):424–434.
22. Hayreh SS. Pathogenesis of optic disc oedema in raised intracranial pressure. Trans Ophthalmol Soc UK. 1976;96(3):404–407.
23. van Velthoven ME, Faber DJ, Verbraak FD, van Leeuwen TG, de Smet MD. Recent developments in optical coherence tomography for imaging the retina. Prog Retin Eye Res. 2007;26(1):57–77.
24. Chen TC, Cense B, Pierce MC, et al. Spectral domain optical coherence tomography: ultra-high speed, ultra-high resolution ophthalmic imaging. Arch Ophthalmol. 2005;123(12):1715–1720.
25. Töteberg-Harms M, Sturm V, Knecht PB, Funk J, Menke MN. Repeatability of nerve fiber layer thickness measurements in patients with glaucoma and without glaucoma using spectral-domain and time-domain OCT. Graefes Arch Clin Exp Ophthalmol. 2012;250(2): 279–287.
Related Documents