MEASUREMENT OF PLANT BIO- DIVERSITY Marthie Kemp Centre for Environmenal Management UFS

MEASUREMENT OF PLANT BIO-DIVERSITY
Dec 30, 2015
MEASUREMENT OF PLANT BIO-DIVERSITY. Marthie Kemp Centre for Environmenal Management UFS. ANALYTIC PHASE. SYNTHETIC PHASE. BRAUN BLANQUET TECHNIQUE. ANALYTIC PHASE Reconnaissance of study area Homogenous Characteristic Relevé size Environmental Factors. SYNTHETIC PHASE. - PowerPoint PPT Presentation
Welcome message from author
This document is posted to help you gain knowledge. Please leave a comment to let me know what you think about it! Share it to your friends and learn new things together.
Transcript

MEASUREMENT OF PLANT BIO-DIVERSITY
Marthie Kemp
Centre for Environmenal Management
UFS

BRAUN BLANQUET TECHNIQUE
ANALYTIC PHASE SYNTHETIC PHASE

BRAUN BLANQUET TECHNIQUE
ANALYTIC PHASE• Reconnaissance of
study area• Homogenous• Characteristic • Relevé size• Environmental Factors
SYNTHETIC PHASE

BRAUN BLANQUET TECHNIQUE
5m
5m

BRAUN BLANQUET TECHNIQUE
5m
5m
10m
10m
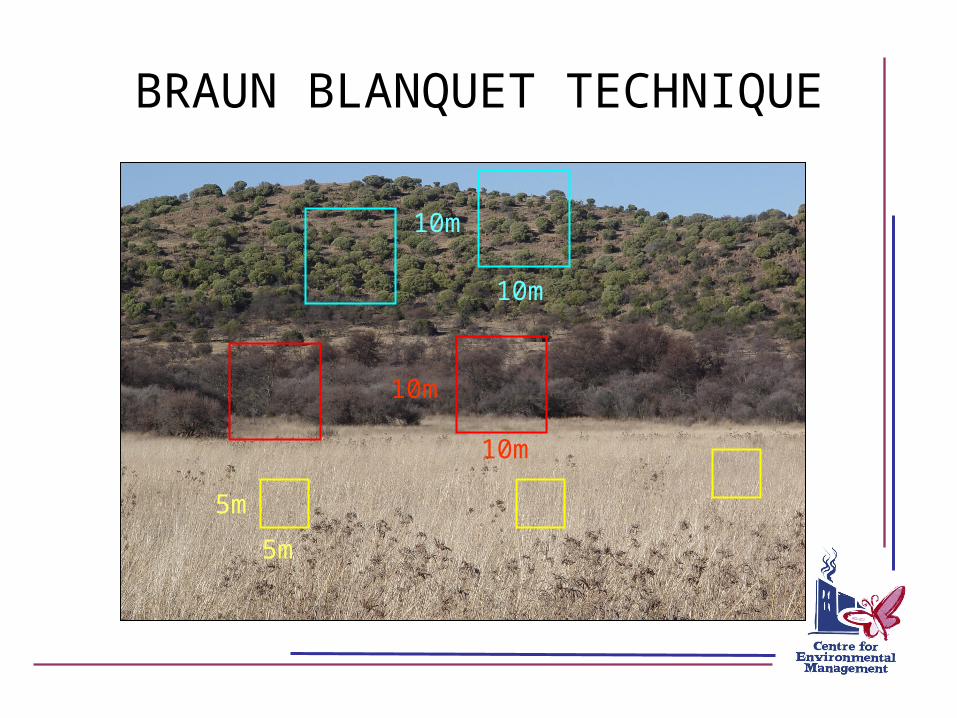
BRAUN BLANQUET TECHNIQUE
5m
5m
10m
10m
10m
10m
BRAUN BLANQUET TECHNIQUE
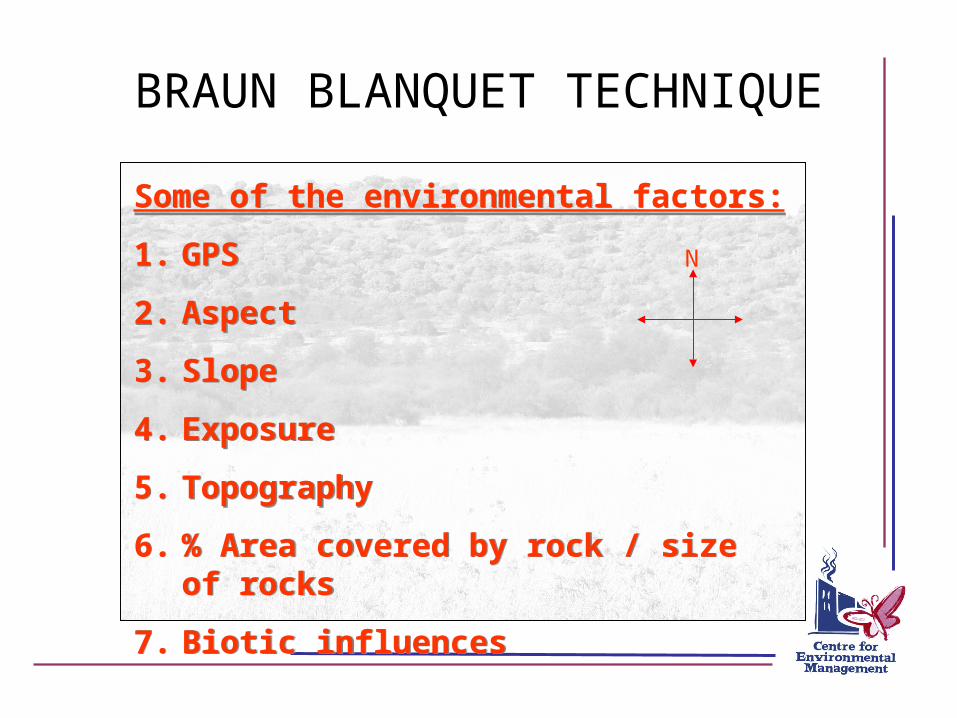
Some of the environmental factors:
1. GPS
2. Aspect
3. Slope
4. Exposure
5. Topography
6. % Area covered by rock / size of rocks
7. Biotic influences
Some of the environmental factors:
1. GPS
2. Aspect
3. Slope
4. Exposure
5. Topography
6. % Area covered by rock / size of rocks
7. Biotic influences
N

BRAUN BLANQUET TECHNIQUE
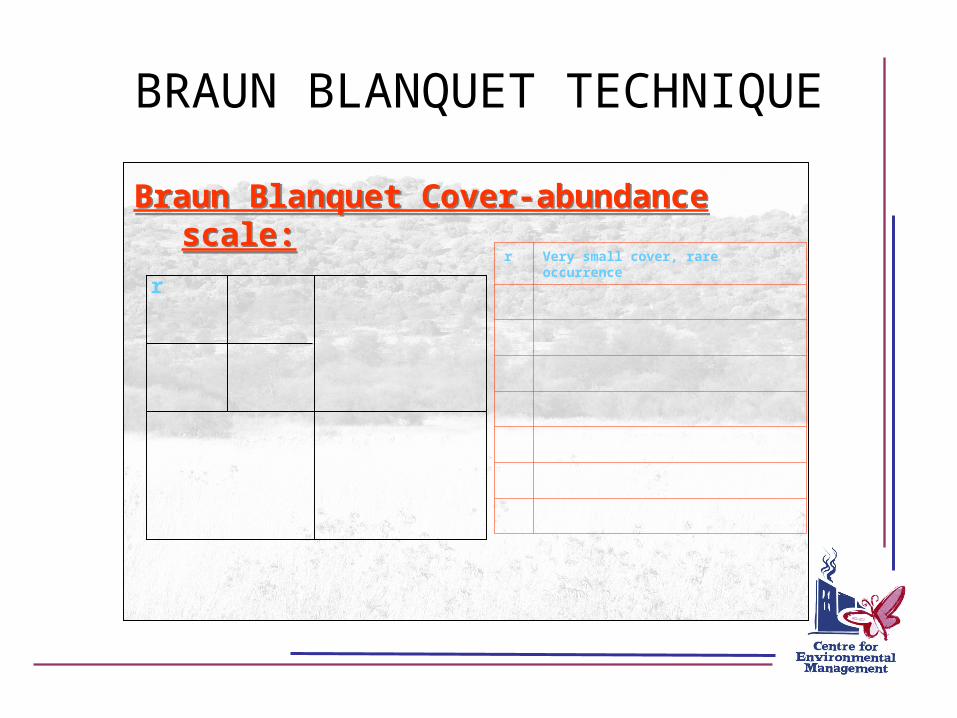
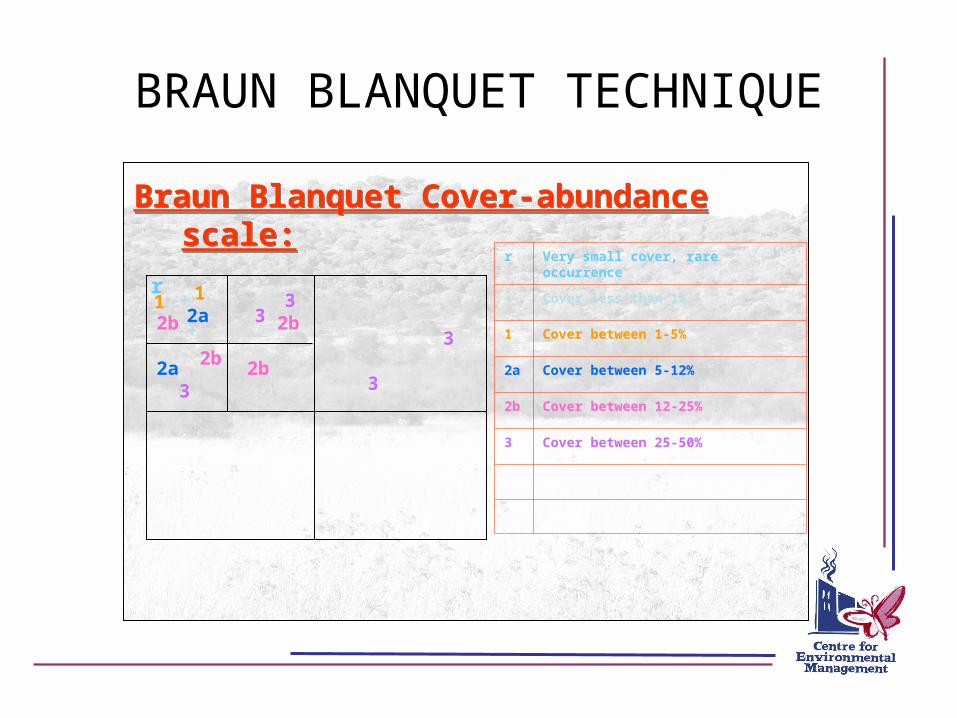
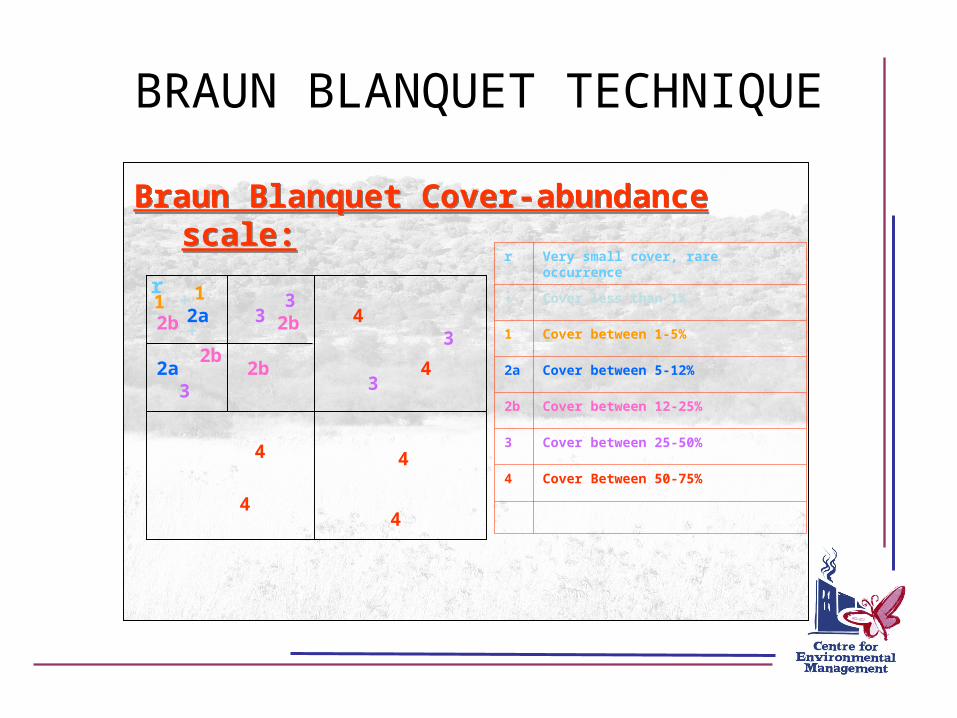
Braun Blanquet Cover-abundance scale:Braun Blanquet Cover-abundance scale:
r Very small cover, rare occurrence
+ Cover less than 1%
1 Cover between 1-5%
2a Cover between 5-12%
2b Cover between 12-25%
3 Cover between 25-50%
4 Cover Between 50-75%
5 Cover more than 75%
BRAUN BLANQUET TECHNIQUE
Braun Blanquet Cover-abundance scale:Braun Blanquet Cover-abundance scale:
r Very small cover, rare occurrence
r
BRAUN BLANQUET TECHNIQUE
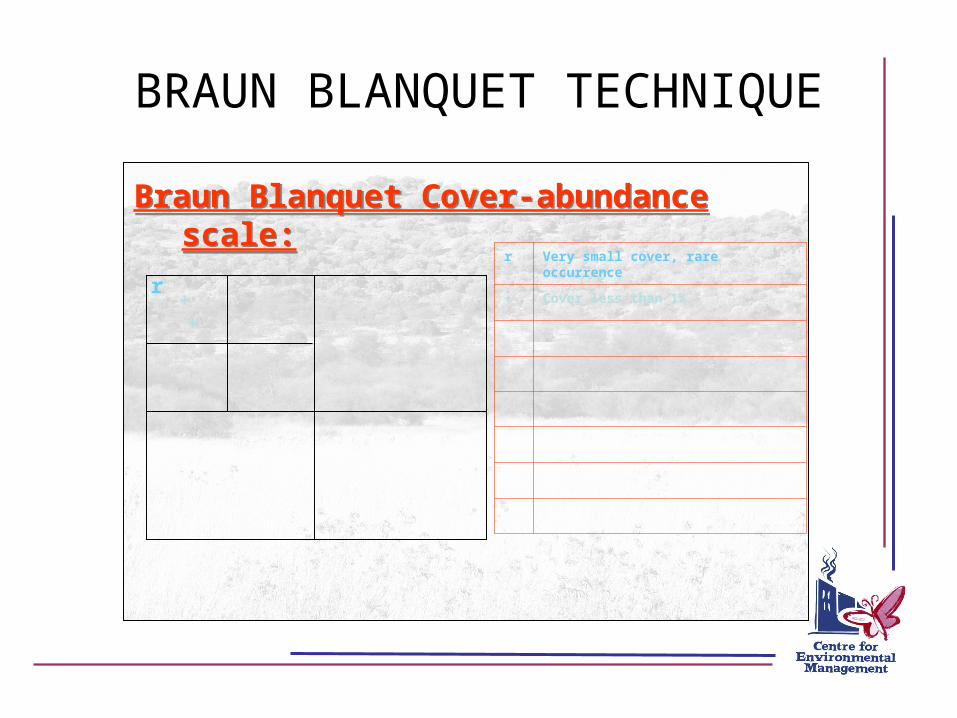
Braun Blanquet Cover-abundance scale:Braun Blanquet Cover-abundance scale:
r Very small cover, rare occurrence
+ Cover less than 1%r++
BRAUN BLANQUET TECHNIQUE
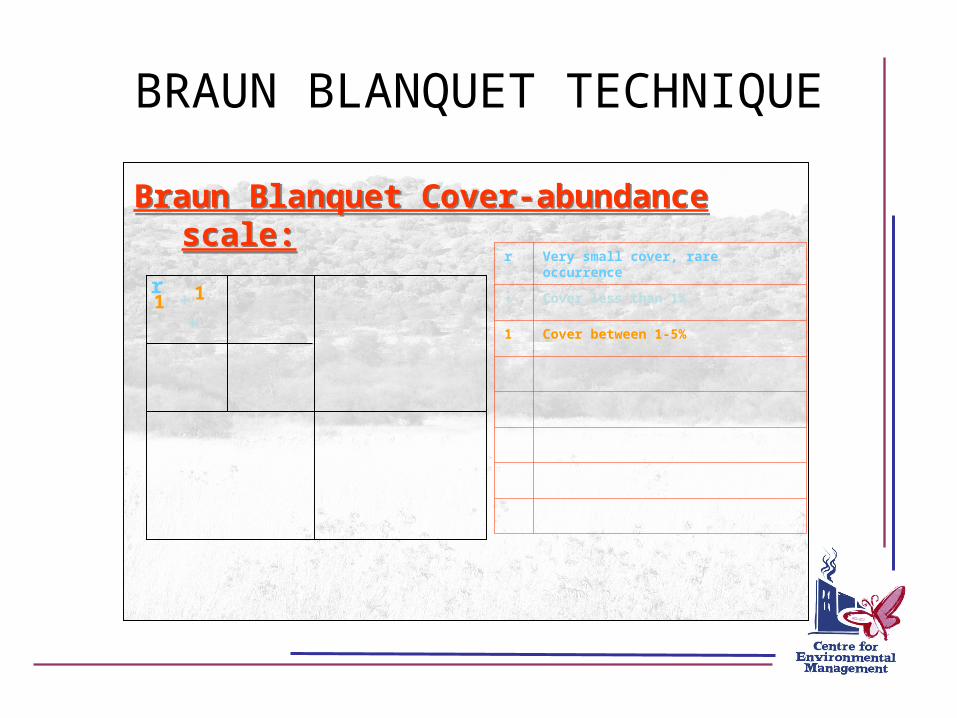
Braun Blanquet Cover-abundance scale:Braun Blanquet Cover-abundance scale:
r Very small cover, rare occurrence
+ Cover less than 1%
1 Cover between 1-5%
r++
11
BRAUN BLANQUET TECHNIQUE
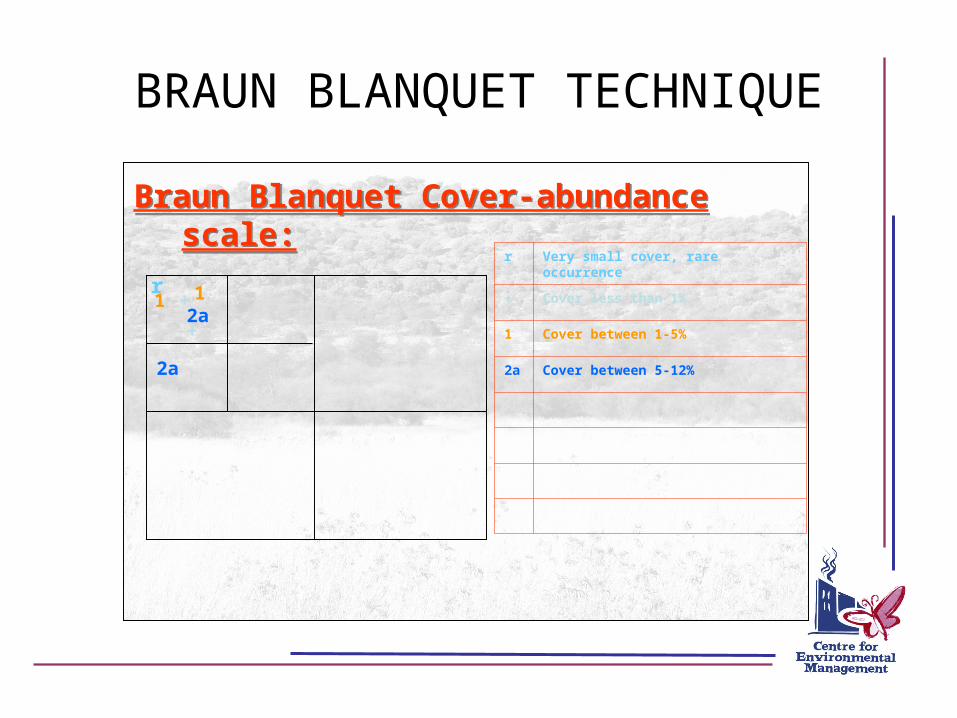
Braun Blanquet Cover-abundance scale:Braun Blanquet Cover-abundance scale:
r Very small cover, rare occurrence
+ Cover less than 1%
1 Cover between 1-5%
2a Cover between 5-12%
r
+
+2a
1 1
2a

BRAUN BLANQUET TECHNIQUE
Braun Blanquet Cover-abundance scale:Braun Blanquet Cover-abundance scale:
r Very small cover, rare occurrence
+ Cover less than 1%
1 Cover between 1-5%
2a Cover between 5-12%
2b Cover between 12-25%
r
+
+
2b
2b
2a
2a1 1
2b
2b
BRAUN BLANQUET TECHNIQUE
Braun Blanquet Cover-abundance scale:Braun Blanquet Cover-abundance scale:
r Very small cover, rare occurrence
+ Cover less than 1%
1 Cover between 1-5%
2a Cover between 5-12%
2b Cover between 12-25%
3 Cover between 25-50%
r
+
+
3
33
2b
2b
2a
2a1
2b
2b
1
3
3
BRAUN BLANQUET TECHNIQUE
Braun Blanquet Cover-abundance scale:Braun Blanquet Cover-abundance scale:
r Very small cover, rare occurrence
+ Cover less than 1%
1 Cover between 1-5%
2a Cover between 5-12%
2b Cover between 12-25%
3 Cover between 25-50%
4 Cover Between 50-75%
r
+
+
4
4
4
4
4
4
3
33
2b
2b
2a
2a1
2b
2b3
1
3

BRAUN BLANQUET TECHNIQUE
Braun Blanquet Cover-abundance scale:Braun Blanquet Cover-abundance scale:
r Very small cover, rare occurrence
+ Cover less than 1%
1 Cover between 1-5%
2a Cover between 5-12%
2b Cover between 12-25%
3 Cover between 25-50%
4 Cover Between 50-75%
5 Cover more than 75%
r
+
+
55
5
55
5
5
55
4
4
4
4
4
4
3
33
2b
2b
2a
2a1
2b
2b3
1
3

BRAUN BLANQUET TECHNIQUE
ANALYTIC PHASE• Reconnaissance of
study area• Homogenous• Characteristic • Relevé size• Environmental Factors
SYNTHETIC PHASE• TURBOVEG (Hennekens 1996)
• TWINSPAN (Hill 1979a) /JUICE (Trichy & Holt 2006)
• Megatab• Decorana

BRAUN BLANQUET TECHNIQUETABLE 6: PHYTOSOCIOLOGICAL TABLE OF THE ACACIA KARROO COMMUNITIES
COMMUNITIES | 1 | 2 |SUB-COMMUNITIES | 1 1 | | 3VARIANTS | | | | |
- - - - - - - - - - - - - - - - - - - - - - - -Relevé number | | | 5 5 5 5 5 4 | 1 1 2 3 3 3 |
| 5 6 4 | 1 2 3 | 5 6 7 8 4 1 | 5 7 9 7 0 1 3 |- - - - - - - - - - - - - - - - - - - - - - - -
Turboveg Database Number| 4 4 4 | 4 4 4 | 4 4 4 4 4 4 | 4 4 4 4 4 4 4 || 1 1 1 | 1 1 1 | 1 1 1 1 1 1 | 1 1 1 1 1 1 1 || 3 3 3 | 3 3 3 | 9 9 9 9 9 7 | 3 3 3 3 3 4 4 || 1 1 1 | 1 1 1 | 0 1 1 1 0 3 | 6 6 9 3 9 0 7 || 8 9 7 | 4 5 6 | 9 0 1 2 8 4 | 4 6 8 6 9 0 3 |- - - - - - - - - - - - - - - - - - - - - - - -
Number of species / relevé| 0 1 1 | 1 1 1 | 1 2 2 1 1 0 | 2 2 1 1 1 1 0 || 9 1 1 | 8 7 8 | 7 2 1 6 2 5 | 4 8 5 2 0 3 9 |- - - - - - - - - - - - - - - - - - - - - - - -
SPECIES GROUP ACyperus rupestris | r 1 + | 1 r 1 | . . . . . . | . . . . . . . |Commelina africana | + + r | r 1 + | . . . . . . | + . . . . . . |Chenopodium album | + + r | + + + | . . r . . . | + . . . . . . |SPECIES GROUP B |Ledebouria luteola | 1 1 r | . . . | . r . + . . | . + . . . . . |Lactuca inermis | . + r | . . . | . . . . . . | . . . . . . . |Limeum aethiopicum | . + r | . . . | . . . . . . | . . . r . . . |SPECIES GROUP C |Berkheya onopordifolia | . . . | + + 1 | . . . . . . | . . . . . . . |Thuranthos basuticum | . . . | + + + | . . . . . . | . . . . . . . |Felicia muricata | . . . | r r + | . . . . . . | . . r . . r r |Selago densiflora | . . . | r + r | . . . . . . | . . . . . . . |SPECIES GROUP D |Setaria sphacelata | . . . | . . . | + + r + + . | . . . 1 . . . |Rhus burchellii | . . . | . . . | 1 + . . 1 3 | . . . . . . . |Rhus lancea | . . . | . . . | a 1 . . a . | . . . . . . . |Melica decumbens | . . . | . . . | r + + 1 . . | . + . . . . . |Asparagus suaveolens | . . . | . . . | . + r + + . | . . . . . . . |Clematis brachiata | . . . | . . . | + + r . + . | . . . . . . . |Pentzia globosa | . . . | . . . | + + . . . 1 | . . . . . . . |Rosenia humilis | . . . | . . . | . + r + . . | . . . . . . . |Aptosimum procumbens| . . . | . . . | + + . . r . | . . . . . . . |Zinnia peruviana | . . . | . . . | + r r . . . | . . . . . . . |Cineraria lyrata | . . . | . . . | . . + + . . | r + . . . . . |Tragus berteronianus | . . . | . . . | . . + r . . | r . . . . . . |Salvia verbenaca | . . . | . . . | . + r . . . | . . . . . . . |Aristida bipartita | . . . | . . . | . + . . + . | . . . . . . . |Duthiastrum linifolium | . . . | . . . | . . + + . . | . . . . . . . |Nidorella resedifolia | . . . | . . . | . r r . . . | . . + . . . . |SPECIES GROUP E |Cynodon hirsutus | . . . | . . . | . a a 1 . . | 1 1 3 . 4 . . |SPECIES GROUP F |Salsola glabrescens | . . . | . . . | . . . . . . | 1 . 3 + 3 + + |Eragrostis obtusa | . . . | . . . | . . . . . + | . + + a + . r |

BRAUN BLANQUET TECHNIQUEThe hierarchical classification of the 53 relevés, 5 communities, 4 subcommunities and 3 variants in which Acacia karroo is dominant, are:
1. Cyperus rupestris – Cynodon dactylon Community1.1 Ledebouria luteola – Digitaria eriantha Sub-community1.2 Berkheya onopordifolia – Cynodon dactylon Sub-community
2. Setaria sphacelata – Acacia karroo Community3. Diospyros lycioides – Rhus pyroides Community
3.1 Salsola glabrescens – Cynodon hirsutus Sub-community3.2 Sphaeralcea bonariensis – Eragrostis curvula Sub-
community 3.2.1 Setaria verticillata Variant3.2.2 Phyla nodiflora Variant3.2.3 Asparagus laricinus Variant
4. Eragrostis lehmanniana – Acacia karroo Community5. Eragrostis trichophora – Eragrostis curvula Community
BRAUN BLANQUET TECHNIQUE
DESCRIPTION OF COMMUNITIES:• Diagnostic species• Dominant species• Associated with environmental factors
BRAUN BLANQUET TECHNIQUE
0 50 100 150 200 250 300 350 400 450 500 550 600 650 700 750 800 850
0
50
100
150
200
250
300
350
400
450
500
550
600
650
700
750
800
3
5
8.2 - 11.3
8.1
1 & 6.1
2
8.1
7.1 & 7.2
4
11.1 & 11.2
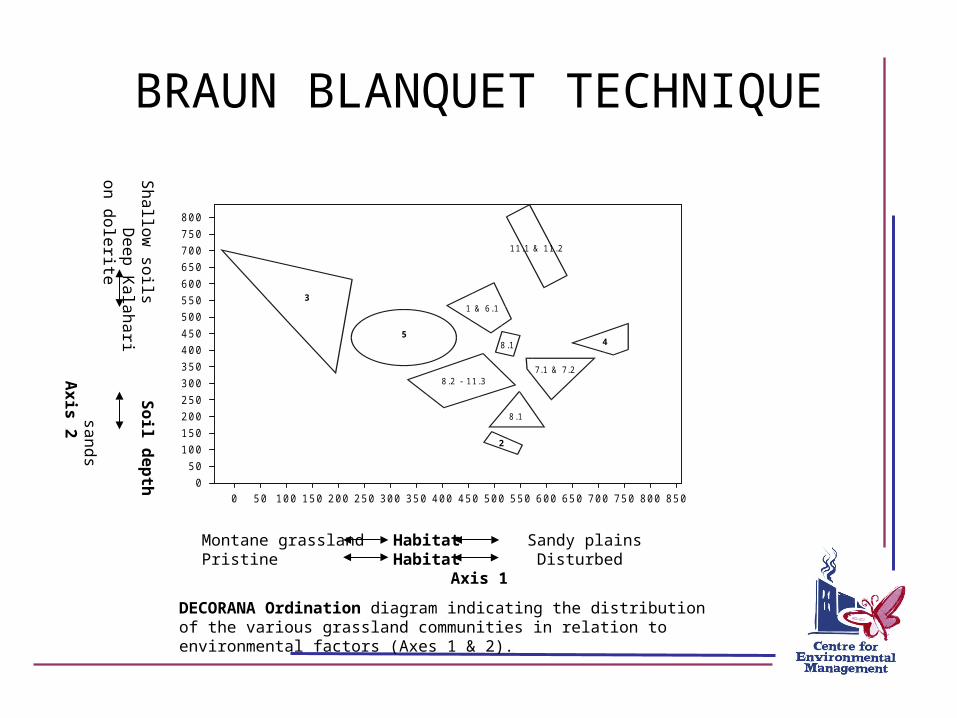
DECORANA Ordination diagram indicating the distribution of the various grassland communities in relation to environmental factors (Axes 1 & 2).
Sh
allo
w so
ils So
il de
pth
De
ep
K
ala
ha
ri o
n d
ole
rite
san
ds
Ax
is 2
Montane grassland Habitat Sandy plainsPristine Habitat Disturbed
Axis 1

BRAUN BLANQUET TECHNIQUE• Hennekens SM (1996a) MEGATAB – A visual editor for phytosociological
tables. Giesen and Geurts• Hennekens SM (1996b) TURBO(VEG) – Software package for input,
processing and presentation of phytosociological data. User’s guide. University of Lancaster
• Hill MO (1979a) TWINSPAN – A FORTRAN Program for arranging multivariate data in an ordered two-way table by classification of the individuals and attributes. Department of Ecology and Systematics, Cornell University, Ithaca, New York
• Hill MO (1979b) DECORANA – A FORTRAN Program for detrended correspondence analysis and reciprocal averaging. Department of Ecology and Systematics, Cornell University, Ithaca, New York
• Kent M, Coker P (1992) Vegetation description and analysis: A practical approach. John Wiley and Sons, New York, pp1 – 275. ISBN 0-4719-4810-1
• Mueller-Dombois D, Ellenberg H (1974) Aims and methods of vegetation ecology. John Wiley Sons, New York, pp 10 – 66. ISBN 0-4716-2291-5
• Müller ME (2002) The phytosociology of the central Free State. M.Sc Dissertation. University of the Free State
• Tricky L, Holt J (2006) JUICE – Program for management, analysis and classification of ecological data. Program Manual. Masaryk University Brno.
Related Documents