The Journal of Arthroplasty Vol. 11 No. 4 1996 Measurement of Periprosthetic Bone Density in Hip Arthroplasty Using Dual-energy X-ray Absorptiometry Reproducibility of Measurements R. C. Smart, BSc, MSc, PhD,* S. Barbagallo, ANMT,* G. L. Slater, MB, BS,t R. S. Kuo, MB, BS, t S. R Butler, MB, BS, MA, BSc, FRACP,* R. P. Drummond, MB, BS, FRCS (Edin), FRCS (Eng), FRACS (Ortho),t and R. Sekel, MB, BS, FRCSE, FRACS (Ortho)t Abstract: To define the precision (reproducibility) of measurement of periprosthetic bone mineral density and bone mineral content, dual-energy x-ray absorptiometry scans were obtained on 45 randomly selected patients who had had a unilateral total hip arthroplasty within the previous 3 years. The coefficients of variation of the bone mineral density in the proximal Gruen zones were 5.0 and 5.3%, corresponding to errors of 0.07 and 0.11 g/cm a. The coefficients of variation of the bone mineral den- sity for the distal zones averaged 2.8%, with an error of 0.08 glcm 2. The coefficients of variation of the bone mineral content were 4.8 and 2.9% for the proximal and dis- tal zones. The contralateral femur was also scanned in 32 of the patients. For the con- tralateral femur bone mineral density, the coefficients of variation were 5.0% for the proximal zones and 4.8% for the distal zones. The bone mineral content was 6.0% for the contralateral regions. These results imply that differences in bone mineral density greater than 0.16 g/cm 2 (2 standard errors) can be reliably measured. Dual- energy x-ray absorptiometry therefore provides a highly reproducible technique for quantitatively monitoring the changes in bone density that occur after total hip arthroplasty. Key words: bone density, hip arthroplasty, reproducibility. Total hip arthroplasty (THA) is a relatively com- mon procedure for the treatment of degenerative joint disease of the hip; however, resorptive bone remodeling secondary to proximal femoral stress shielding may occur. The pattern of bone loss depends, among other things, on the stiffness and size ot the stem of the prosthesis [1] and the extent of the porous coating of the implant [2]. The pattern From the Departments of *Nuclear Medicine and ]-Orthopaedics, St. George Hospital, Sydney, New South Wales, Australia. Reprint requests: Dr. R. C. Smart, Department of Nuclear Medicine, St. George Hospital, Kogarah, NSW 2217, Australia. and extent of bone resorption cannot be predicted in the individual patient, and numerous techniques have been proposed to evaluate the degree of remodeling of the periprosthetic bone. Traditionally, bone resorption has been assessed by visual interpretation of radiographs; however, quantitative studies employing x-ray densitometry have demonstrated that changes in density as large as 20% can be introduced due to differences in film response, exposure variations, and positional inac- curacies [3]. More recently, other imaging modali- ties including computed tomography [4], ultrasound [51, and dual-energy x-ray absorptiometry (DEXA) [6] have been used to assess bone resorption. 445

Welcome message from author
This document is posted to help you gain knowledge. Please leave a comment to let me know what you think about it! Share it to your friends and learn new things together.
Transcript
The Journal of Arthroplasty Vol. 11 No. 4 1996
Measurement of Periprosthetic Bone Density in Hip Arthroplasty Using Dual-energy
X-ray Absorptiometry
Reproducibility of Measurements
R. C. S m a r t , BSc , M S c , P h D , * S. B a r b a g a l l o , A N M T , * G. L. S la t e r , M B , B S , t
R. S. K u o , M B , BS, t S. R B u t l e r , M B , BS, M A , BSc , F RA CP ,*
R. P. D r u m m o n d , M B , BS, F R C S ( E d i n ) , F R C S ( E n g ) , F R A C S ( O r t h o ) , t
a n d R. S e k e l , M B , BS, F R C S E , F R A C S ( O r t h o ) t
Abstract: To define the precision (reproducibility) of measurement of periprosthetic bone mineral density and bone mineral content, dual-energy x-ray absorptiometry scans were obtained on 45 randomly selected patients who had had a unilateral total hip arthroplasty within the previous 3 years. The coefficients of variation of the bone mineral density in the proximal Gruen zones were 5.0 and 5.3%, corresponding to errors of 0.07 and 0.11 g/cm a. The coefficients of variation of the bone mineral den- sity for the distal zones averaged 2.8%, with an error of 0.08 glcm 2. The coefficients of variation of the bone mineral content were 4.8 and 2.9% for the proximal and dis- tal zones. The contralateral femur was also scanned in 32 of the patients. For the con- tralateral femur bone mineral density, the coefficients of variation were 5.0% for the proximal zones and 4.8% for the distal zones. The bone mineral content was 6.0% for the contralateral regions. These results imply that differences in bone mineral density greater than 0.16 g/cm 2 (2 standard errors) can be reliably measured. Dual- energy x-ray absorptiometry therefore provides a highly reproducible technique for quantitatively monitoring the changes in bone density that occur after total hip arthroplasty. Key words: bone density, hip arthroplasty, reproducibility.
Total hip arthroplasty (THA) is a relatively com- mon procedure for the t reatment of degenerative joint disease of the hip; however, resorptive bone remodeling secondary to proximal femoral stress shielding may occur. The pattern of bone loss depends, among other things, on the stiffness and size ot the stem of the prosthesis [1] and the extent of the porous coating of the implant [2]. The pattern
From the Departments of *Nuclear Medicine and ]-Orthopaedics, St. George Hospital, Sydney, New South Wales, Australia.
Reprint requests: Dr. R. C. Smart, Department of Nuclear Medicine, St. George Hospital, Kogarah, NSW 2217, Australia.
and extent of bone resorption cannot be predicted in the individual patient, and numerous techniques have been proposed to evaluate t h e degree of remodeling of the periprosthetic bone.
Traditionally, bone resorption has been assessed by visual interpretation of radiographs; however, quantitative studies employing x-ray densitometry have demonstrated that changes in density as large as 20% can be introduced due to differences in film response, exposure variations, and positional inac- curacies [3]. More recently, other imaging modali- ties including computed tomography [4], ul trasound [51, and dual-energy x-ray absorptiometry (DEXA) [6] have been used to assess bone resorption.
445
446 The Journal of Arthroplasty Vol. 11 No. 4 June 1996
Dual-energy x-ray absorptiometry was developed to measure the bone mineral density (BMD) of the lumbar spine and femoral neck [7-9], with minimal radiation exposure to the patient [i0]. The tech- nique has recently been extended to the measure- ment of periprosthetic bone density by the develop- ment of suitable software algorithms for the detection of the bone-prosthesis interface. Early experience with this technique was limited to either two or four regions of interest (ROIs) positioned over the proximal bone area [11,12]. These studies reported reproducibility measurements (coefficients of variation) in the range 1.8 to 7.5%. Modifications to the analysis software have recently become avail- able enabling the BMD to be measured in the seven standard Gruen zones [13]. Trevisan et al. reported coefficients of variation of 1.8 to 6.8% for the seven Gruen zones in a limited study of 14 women [14]. In this study, we measured the reproducibility of this technique using the Gruen zones to define the ROIs in a larger group of 45 patients, to establish the mini- m u m statistically detectable change in BMD between successive measurements. The min imum detectable change was defined as two standard errors from the regression analysis. The BMD was assessed in a 5- m m band, immediately adjacent to the prosthesis. It is probable that changes in BMD in this band will significantly precede radiographic changes associated with loosening or bone remodeling.
Materials and Methods
Forty-five patients were included in the study. They were randomly chosen from the patients of two surgeons (R.P.D. and R.S.) and were included in the study if they had had a unilateral THA within the previous 3-year period. The plain radiographs of the femur were reviewed on all the patients, and none of the patients showed visible radiolucent lines at the bone- implant interface at the time of the DEXA scan. The mean time in situ for the prosthesis was 13.3 months (range, 0.2-35.4 months). There were 23 wome n and 22 men. The mean age was 65
years (range, 38-81 years). In all cases, the con- tralateral femur was clinically normal, with no evi- dence of osteoarthritis (ie, no radiologic evidence of a decrease in joint space, subchondral sclerosis, cyst formation, or osteophyte formation).
There were 10 cemented prostheses and 35 uncemen ted prostheses. The details of the unce- men ted group are given in Table 1. The cemented group included five Mueller (Zimmer, Warsaw, IN), three Centralign (Zimmer), one Internat ional (Smith & Nephew Surgical, Memphis, TN), and one Harris Pre-coat (Zimmer). The patients who had received the cemented prostheses were signifi- cantly older than those who had uncemen ted pros- theses (mean ages, 73.4 and 60.2 years, P < .001 t-test) and had had the prostheses in situ for a shorter period (mean time of 6.4 months compared with a mean time of 15.1 months, P < .01 t-test).
The patients were scanned using a Lunar DPX-L bone densi tometer and analyzed using the Lunar Orthopaedic Software Package, Version 1.2 (Lunar Corporation, Madison, WI). The patients were positioned supine on the scan table with the knee of the leg to be scanned supported on a foam posi- tioner. The patient's foot was strapped to a foot brace so that the foot was held vertical, with the patient's thigh parallel to the long axis of the scan table. This ensured that the position of the patient's leg could be precisely reproduced on successive measurements . A bag containing rice, which is approximately tissue equivalent, was placed on the outside of the patient's thigh to prevent the x-ray beam from scanning into air. To assess the repro- ducibility of the BMD measurements , each patient was scanned a second time, on the same occasion, after being reposit ioned on the scan table.
The scan acquisition commenced approximately 15 m m below the distal end of the prosthesis and cont inued until approximately 15 m m above the greater trochanter. The scans were obtained using a current of 3 mA and a pixel size of 0.6 x 1.2 m m (transverse × longitudinal). Scans typically took 4 to 5 minutes to complete. The contralateral leg was also scanned in 32 patients. In these patients, the
T a b l e 1. Deta i l s of t he P r o s t h e s e s U s e d in the U n c e m e n t e d THA
No. of Extent of Prosthesis Manufacturer Patients Porous Coating Alloy
Anatomic Zimmer, Warsaw, IN 20 Proximal Titanium ABG Howmedica, Rutherford, NJ 5 Proximal Titanium and hydroxyapatite Autophore Osteo AG, Selzach, Switzerland 6 Full Cobalt-chrome Omnifit Osteonics, Allendale, NJ 3 Proximal Titanium Precision Osteolock Howmedica 1 Proximal Titanium and hydroxyapatite
same length of normal femur was scanned as had been scanned for the leg containing the prosthesis. All patients were scanned and the scans analyzed by one of two operators.
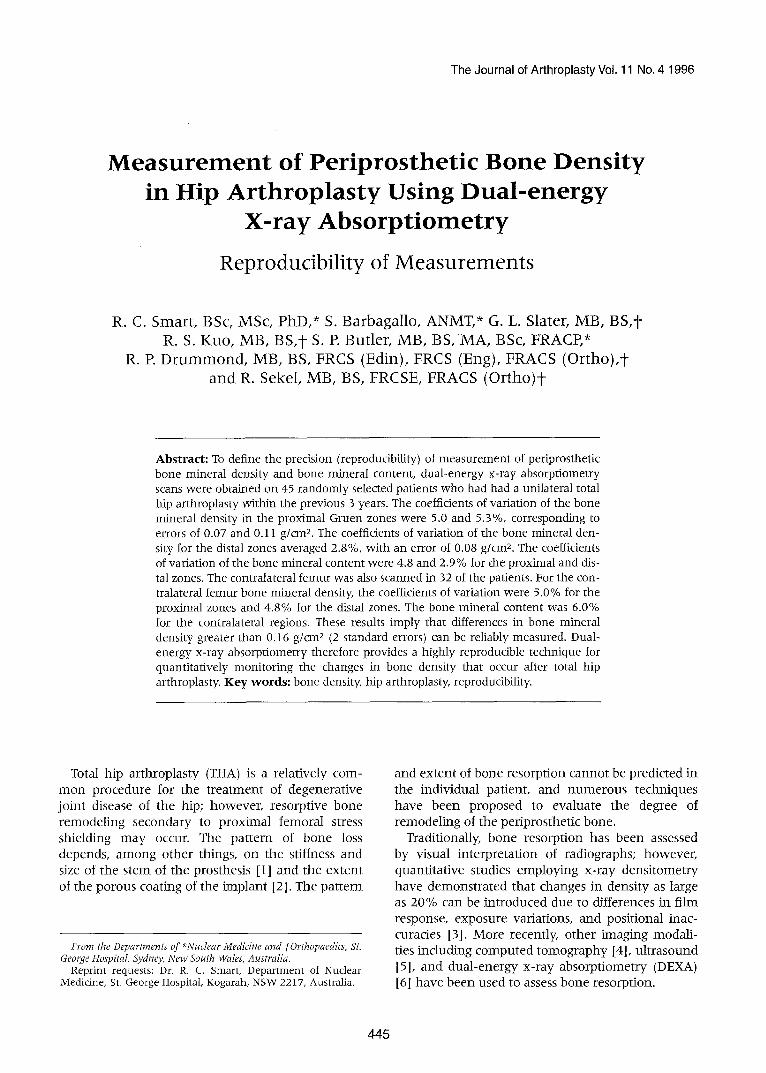
The Lunar software employed an edge-detect ion algori thm to define the edge of the prosthesis and the edge of the bone, and enabled the seven Gruen zones to be automatically defined from the length of the prosthesis (Fig. 1). With the exception of zone 4 (at the tip of the prosthesis), all zones were of equal length. The length of Gruen zone 7, the proximomedia l zone, was manual ly adjusted so that the top of the zone coincided with the top of the bone in the scan. The length of zone 4 was standardized at 10 m m for all patients, except in studies where there was less than 10 m m of bone in the scan image below the tip of the prosthesis. The BMD and bone mineral content were calcu- lated for a 5-mm-wide region of bone immediately adjacent to the surface of the prosthesis, for each of the seven Gruen zones (Fig. 1).
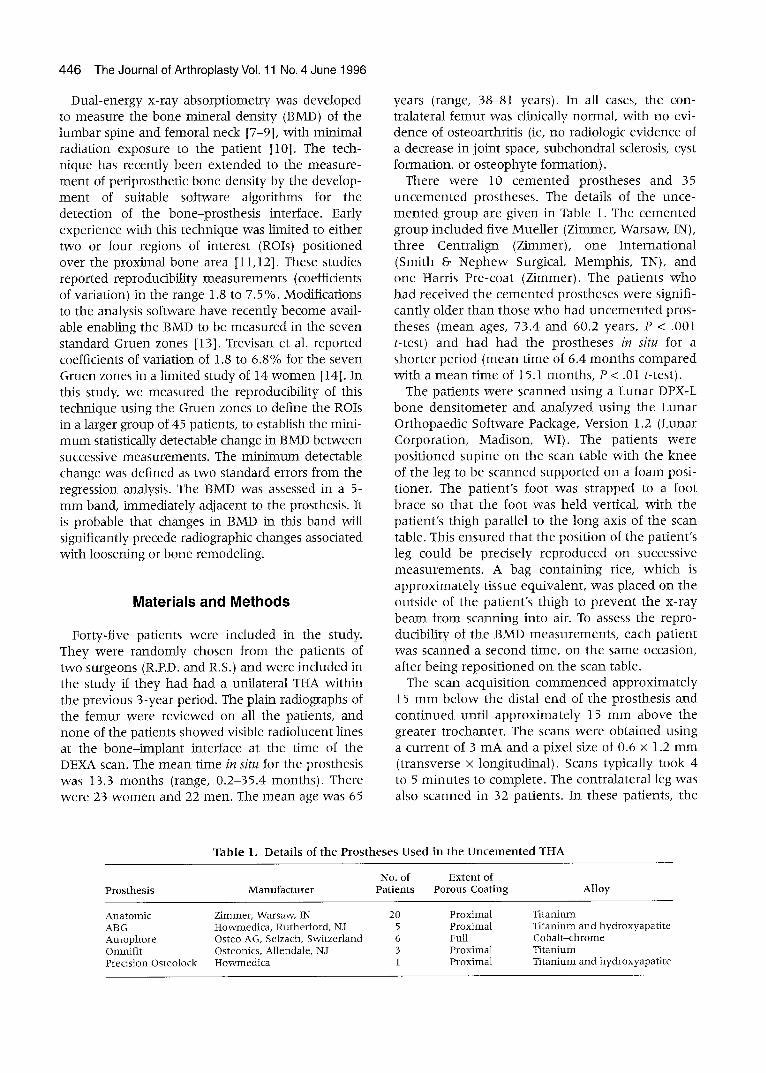
The Lunar software allowed the ROIs from the prosthesis and bone edges to be superimposed on the image of the contralateral femur after they have been automatically mirrored about the axis of the leg. The operator manual ly aligned the bone ROI with the image of the intact femur, using the greater and lesser t rochanter and the femoral shaft as anatomic landmarks. Bone mineral density was then calculated for the same 5-mm-wide Gruen zones (Fig. 2).
Periprosthetic Bone Density • Smart et al. 447
The reproducibility was calculated as the coeffi- cient of variation from the two scans on each patient. This was calculated using the formula [15]
E d ) n
(1) cv° / ° = (:~,-+~x~--~,__ × 1oo
2
where n is the number of paired observations and d is the ditference be tween two paired measure- ments, x1 and x2. In addition, the standard error of the estimate f rom linear regression was calculated for the paired patient results.
The patient results were subdivided into several categories and the mean BMD and coefficient of variation calculated for each category:
1. For the uncemen ted prostheses, the 6 fully coated prostheses were compared with the 29 proximally coated prostheses.
2. For the uncemen ted prostheses, the 9 patients who had had their prosthesis in situ longer than 24 months were compared with the 26 patients who had had their prosthesis less than 24 months.
3. The 10 cemented prostheses were compared with the 35 uncemen ted prostheses.
The significance of the differences in the results for the various categories was tested using the t-test.
This project was approved by the Ethics Commit- tee of the Southern Sydney Area Health Service.
Fig. 1. Bone density scan of a femur containing a THA, together with the computer-generated Gruen zones.
Fig. 2. Bone density scan of the contralateral femur, with the image of the prosthesis and regions of interest superimposed.
448 The Journal of Arthroplasty Vol. 11 No. 4 June 1996
Results
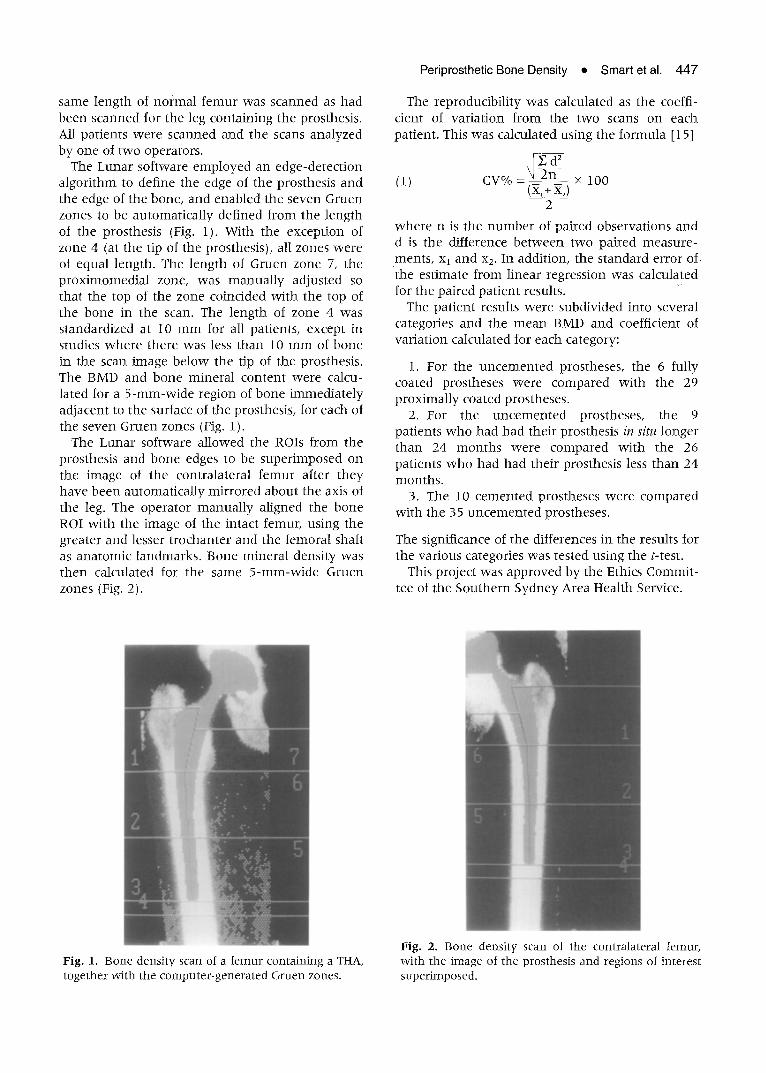
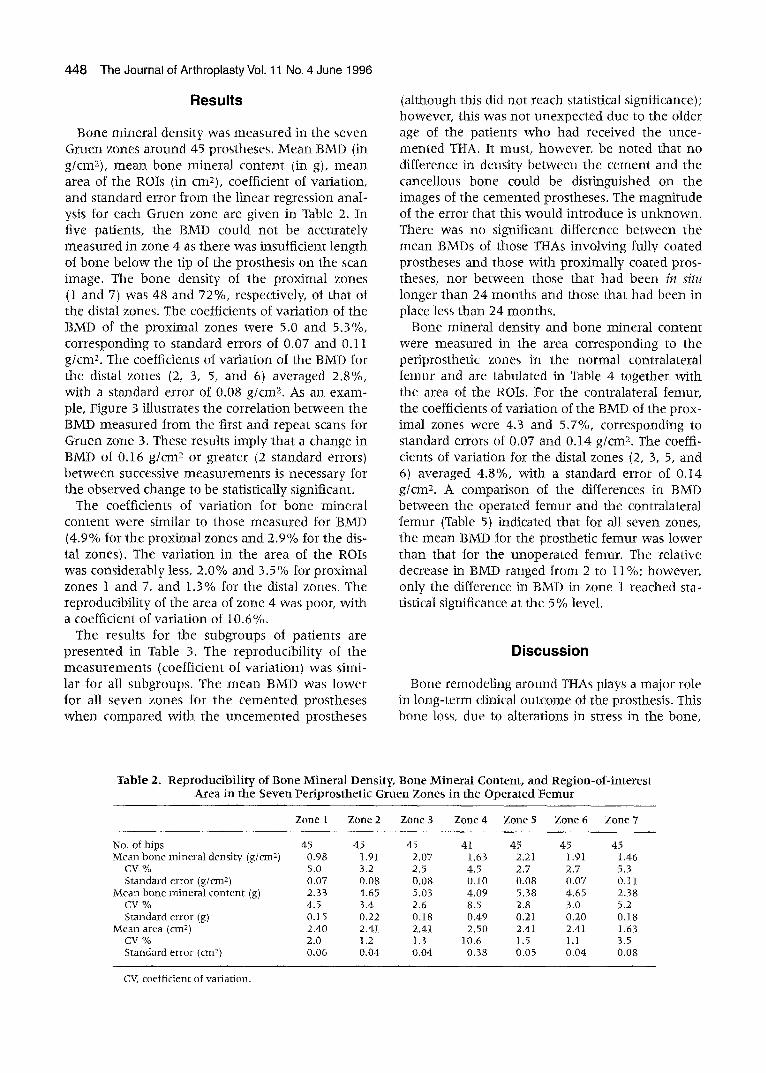
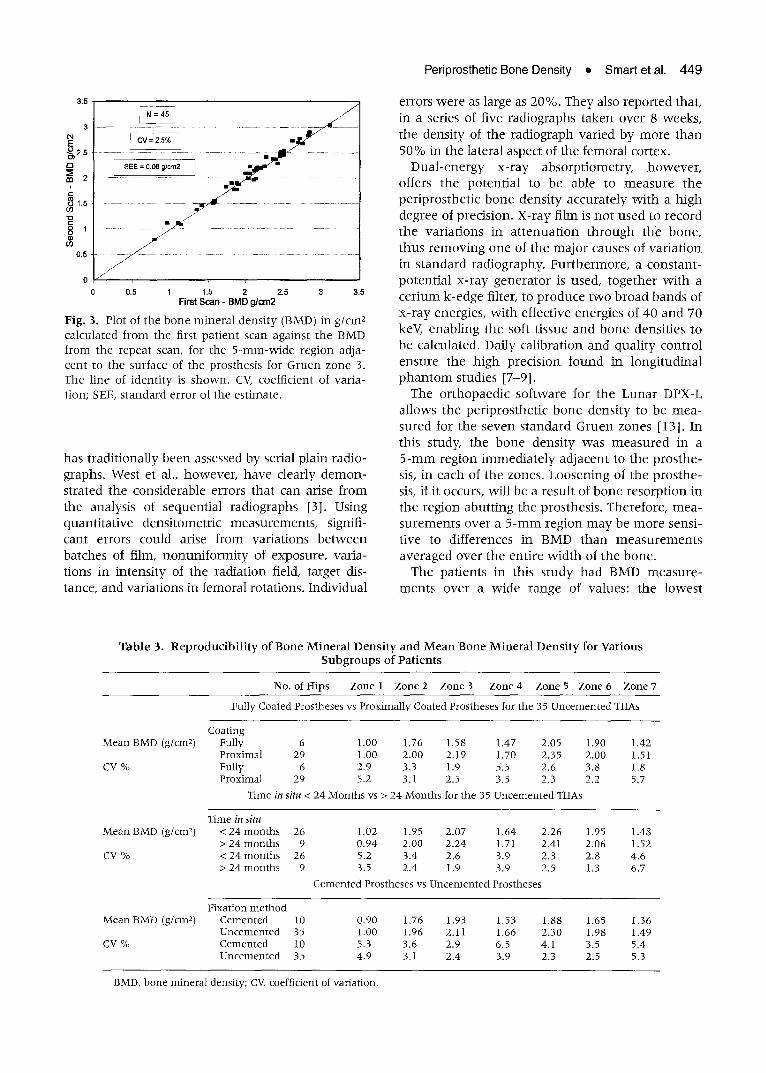
Bone mineral density was measured in the seven Gruen zones a round 45 prostheses, Mean BMD (in gtcm2), mean bone mineral content (in g), mean area of the ROIs (in cm2), coefficient of variation, and standard error f rom the linear regression anal- ysis for each Gruen zone are given in Table 2. In five patients, the BMD could not be accurately measured in zone 4 as there was insufficient length of bone below the tip of the prosthesis on the scan image. The bone density of the proximal zones (1 and 7) was 48 and 72%, respectively, of that of the distal zones. The coefficients of variation of the BMD of the proximal zones were 5.0 and 5.3%, corresponding to standard errors of 0.07 and 0.11 g/cm 2. The coefficients of variation of the BMD for the distal zones (2, 3, 5, and 6) averaged 2.8%, with a standard error of 0,08 g/cm x. As an exam- ple, Figure 3 illustrates the correlation be tween the BMD measured from the first and repeat scans for Gruen zone 3. These results imply that a change in BMD of 0.16 g/cmX or greater (2 standard errors) between successive measurements is necessary for the observed change to be statistically significant.
The coefficients of variation for bone mineral content were similar to those measured for BMD (4.9% for the proximal zones and 2.9% for the dis- tal zones). The variat ion in the area of the ROIs was considerably less, 2.0% and 3.5% for proximal zones 1 and 7, and 1.3% for the distal zones. The reproducibility of the area of zone 4 was poor, with a coefficient of variation of 10.6%,
The results for the subgroups of patients are presented in Table 3. The reproducibil i ty of the measurement s (coefficient of variation) was simi- lar for all subgroups. The m e a n BMD was lower for all seven zones tor the cemen ted prostheses w h e n compared with the uncemen ted prostheses
(akhough this did not reach statistical significance); however, this was not unexpected due to the older age of the patients who had received the unce- men ted THA. It must, however, be noted that no difference in density be tween the cement and the cancellous bone could be distinguished on the images of the cemented prostheses. The magnitude of the error that this would introduce is unknown . There was no significant difference be tween the m ean BMDs of those THAs involving fully coated prostheses and those with proximally coated pros- theses, nor be tween those that had been in situ longer than 24 months and those that had been in place less than 24 months.
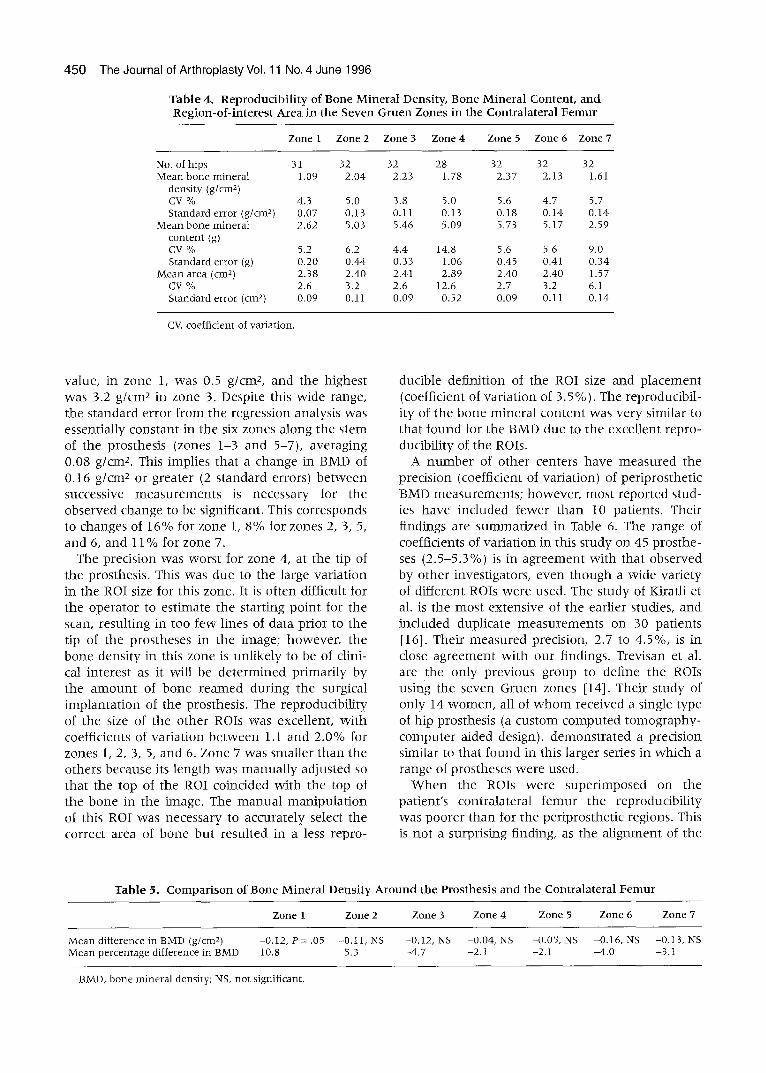
Bone mineral density and bone mineral content were measured in the area corresponding to the periprosthetic zones in the normal contralateral femur and are tabulated in Table 4 together with the area of the ROIs. For the contralateral femur, the coefficients of variation of the BMD of the prox- imal zones were 4.3 and 5.7%, corresponding to standard errors of 0.07 and 0.14 g/cmX. The coeffi- cients of variation for the distal zones (2, 3, 5, and 6) averaged 4,8%, with a standard error of 0.14 g/cm 2. A comparison of the differences in BMD be tween the operated femur and the contralateral femur (Table 5) indicated that for all seven zones, the mean BMD for the prosthetic femur was lower than that for the unopera ted femur. The relative decrease in BMD ranged from 2 to 11%; however, only the difference in BMD in zone 1 reached sta- tistical significance at the 5 % level.
Discussion
Bone remodeling around THAs plays a major role in long-term clinical outcome of the prosthesis. This bone loss, due to alterations in stress in the bone,
Table 2. Reproducibility of Bone Mineral Density, Bone Mineral Content, and Region-of-interest Area in the Seven Periprosthetic Gruen Zones in the Operated Femur
Zone 1 Zone 2 Zone 3 Zone 4 Zone 5 Zone 6 Zone 7
No, of hips 45 Mean bone mineral density (g/cm a) 0.98
CV % 5.0 Standard error (g/cm ~) 0.07
Mean bone mineral content (g) 2.33 CV % 4.5 Standard error (g) 0.15
Mean area (cm 2) 2.40 CV % 2.0 Standard error (cm 2) 0,06
45 45 41 45 45 45 1,91 2,07 1,63 2.21 1,91 1,46 3.2 2.5 4,5 2.7 2.7 5.3 0.08 0.08 0,10 0,08 0,07 0.11 4.65 5.03 4.09 5,38 4,65 2.38 3,4 2,6 8.5 2,8 3,0 5,2 0.22 0,18 0,49 0,21 0.20 0,18 2.41 2.41 2,50 2.41 2.41 1,63 1,2 1,3 10,6 1,5 1.1 3.5 0,04 0,04 0.38 0,05 0,04 0.08
CV, coefficient of variation.
3 . 5
3 .......................................................................
E3 [ SEE = 0,08 g/crn2 1 = ~ == 2 ......... '- .................................................... ! . . . . . . . . . . . . . . . . . . . . . . . . . . . . . . . . . . . . . . . . . . . . . . . . . . . . . . . . . . . . . . . . . . . . .
1 , . . . . . . . . . . . . . . . . . . . . . . . . . . . . . . . . . . . . . . . . . . . . . . . . . . . . . . . . . . . . . . . . . . . . . . . . . . . . . . . . . . . . . . . . . . . . . . . . . .
° ' o l ................................ i ....... ................... 0 0,5 1 1.5 2 2.5 3 3.5
First Scan - BMD g/cm2
Fig. 3. Plot of the bone mineral density (BMD) in g/cm 2 calculated from the first patient scan against the BMD from the repeat scan, for the 5-ram-wide region adja- cent to the surface of the prosthesis for Gruen zone 3. The line of identity is shown. CV, coefficient of varia- tion; SEE, standard error of the estimate.
has t r ad i t i ona l l y b e e n assessed b y ser ia l p l a in r ad io - graphs . Wes t et al., h o w e v e r , h a v e d e a r l y d e m o n - s t ra ted the cons ide rab l e e r rors t ha t can ar ise f rom the analys is of s equen t i a l r ad iog raphs [3]. Using quan t i t a t i ve dens i t ome t r i c m e a s u r e m e n t s , signifi- cant er rors cou ld arise f rom var ia t ions b e t w e e n
ba tches of film, n o n u n i f o r m i t y of exposure , var ia - t ions in in t ens i ty of the r ad i a t i on field, t a rge t dis- tance , a n d va r ia t ions in f emora l ro ta t ions . I nd iv idua l
Periprosthetic Bone Density • Smart et al. 449
errors w e r e as large as 20%. They also r e p o r t e d that ,
in a series of five r ad iog raphs t a k e n ove r 8 weeks , the dens i ty of t he r a d i o g r a p h va r i ed b y m o r e t h a n 50% in the la te ra l aspect of the f emora l cortex.
D u a l - e n e r g y x - r a y a b s o r p t i o m e t r y , h o w e v e r , offers t h e p o t e n t i a l to be able to m e a s u r e t h e p e r i p r o s t h e t i c b o n e d e n s i t y a c c u r a t e l y w i t h a h igh degree of p rec i s ion . X - r a y f i lm is n o t u sed to r e c o r d t h e va r i a t i ons in a t t e n u a t i o n t h r o u g h the b o n e , t hus r e m o v i n g o n e of t he m a j o r causes of v a r i a t i o n in s t a n d a r d r a d i o g r a p h y . F u r t h e r m o r e , a c o n s t a n t - p o t e n t i a l x - r a y g e n e r a t o r is used , t o g e t h e r w i t h a c e r i u m k - e d g e filter, to p r o d u c e t w o b r o a d b a n d s of x - r a y energ ies , w i t h effect ive ene rg ie s of 40 a n d 70 keV, e n a b l i n g the soft t i ssue a n d b o n e dens i t i es to be ca lcu la ted . Dai ly ca l ib ra t i on a n d qua l i t y c o n t r o l e n s u r e t h e h i g h p r e c i s i o n f o u n d in l o n g i t u d i n a l p h a n t o m s tudies [7-9] .
The o r t h o p a e d i c so f twa re for t he L u n a r DPX-L a l lows the p e r i p r o s t h e t i c b o n e d e n s i t y to be m e a - s u r e d for t he s e v e n s t a n d a r d G r u e n zones [13]. In this s tudy, t he b o n e d e n s i t y was m e a s u r e d in a 5 - m m r e g i o n i m m e d i a t e l y a d j a c e n t to t he p r o s t h e - sis, in e ach of t he zones . L o o s e n i n g of t he p r o s t h e - sis, if it occurs , wi l l be a r esu l t of b o n e r e s o r p t i o n in t he r e g i o n a b u t t i n g t h e p ros thes i s . There fo re , m e a - s u r e m e n t s ove r a 5 - m m r e g i o n m a y be m o r e sensi - t ive to d i f fe rences in BMD t h a n m e a s u r e m e n t s a v e r a g e d ove r t he en t i r e w i d t h of t h e b o n e .
The pa t i en t s in this s t u d y h a d BMD m e a s u r e - m e n t s o v e r a w i d e r a n g e of va lues : t he l o w e s t
Table 3. Reproducib i l i ty of Bone Minera l Densi ty and Mean Bone Minera l Densi ty for Various Subgroups of Patients
No. of Hips Zonel Zone2 Zone3 Zone4 Zone5 Zone6 Zone7
Fully Coated Prostheses vs Proximally Coated Prostheses for the 35 Uncemented THAs
Coating Mean BMD (g/cm 2) Fully 6 1.00 1.76 1.58 1.47 2.05 1.90 1.42
Proximal 29 1.00 2.00 2.19 1.70 2.35 2.00 1.51 CV % Fully 6 2.9 3.3 1.9 5.5 2.6 3.8 1.8
Proximal 29 5.2 3.1 2.5 3.5 2.3 2.2 5.7 Time in situ < 24 Months vs > 24 Months for the 35 Uncemented THAs
Time in situ Mean BMD (g/cm 2) < 24 months 26 1.02 1.95 2.07 i .64 2.26 1.95 1.48
> 24 months 9 0.94 2.00 2.24 1.71 2.41 2.06 1.52 CV % < 24 months 26 5.2 3.4 2.6 3.9 2.3 2.8 4.6
> 24 months 9 3.5 2.4 1.9 3.9 2.5 1.3 6.7 Cemented Prostheses vs Uncemented Prostheses
Fixation method Mean BMD {g/cm a) Cemented 10 0.90 1.76 1.93 1.53 1.88 1.65 1.36
Uncemented 35 1.00 1.96 2.11 1.66 2.30 1.98 1.49 CV % Cemented 10 5.3 3.6 2.9 6.5 4.1 3.5 5.4
Uncemented 35 4.9 3.1 2.4 3.9 2.3 2.5 5.3
BMD, bone mineral density; CV, coefficient of variation.
450 The Journal of Arthroplasty Vol. 11 No. 4 June 1996
Table 4. Reproducib i l i ty of Bone Minera l Density, Bone Minera l Content, and Region-of- interest Area in the Seven Gruen Zones in the Contralateral Femur
Zone 1 Zone 2 Zone 3 Zone 4 Zone 5 Zone 6 Zone 7
No. of hips 31 32 32 28 32 32 32 Mean bone mineral 1.09 2.04 2.23 1.78 2.37 2.13 1.61
density (g/cm 2) CV % 4.3 5.0 3.8 5.0 5.6 4.7 5.7 Standard error (g/cm 2) 0.07 0.13 0.11 0.13 0.18 0.14 0.14
Mean bone mineral 2.62 5.03 5.46 5.09 5.73 5.17 2.59 content (g) CV % 5.2 6.2 4.4 14.8 5.6 5.6 9.0 Standard error (g) 0.20 0.44 0.33 1.06 0.45 0.41 0.34
Mean area (cm 2) 2.38 2.40 2.41 2.89 2.40 2.40 1.57 CV % 2.6 3.2 2.6 12.6 2.7 3.2 6.1 Standard error (cm 2) 0.09 0.11 0.09 0.52 0.09 0.11 0.14
CV, coefficient of variation.
va lue , in zone 1, was 0.5 g / c m 2, a n d the h ighe s t was 3.2 g / c m 2 in zone 3. Despi te th is w i d e range , t he s t a n d a r d e r ro r f r o m the r eg r e s s ion ana lys i s was es sen t i a l ly c o n s t a n t in t he six zones a l o n g the s t em of t he p ros thes i s (zones 1-3 a n d 5-7) , a v e r a g i n g 0.08 g / c m 2. This impl i e s t ha t a c h a n g e in BMD of 0.16 g / c m 2 or g r ea t e r (2 s t a n d a r d er rors) b e t w e e n success ive m e a s u r e m e n t s is n e c e s s a r y for the o b s e r v e d c h a n g e to be s ignif icant . This c o r r e s p o n d s to changes of 16% for zone l , 8 % for zones 2, 3, 5, a n d 6, a n d I 1% for zone 7.
The p r e c i s i o n was w o r s t for zone 4, at t he t ip of t h e p ros thes i s . This was due to t he la rge v a r i a t i o n
in t he ROI size for th is zone . It is o f t en diff icul t for t he o p e r a t o r to e s t i m a t e t he s ta r t ing p o i n t for t he scan, r e su l t ing in too f ew l ines of da t a p r io r to t h e t ip of t he p ro s the se s in t he image ; h o w e v e r , t he b o n e d e n s i t y in this zone is u n l i k e l y to be of cl ini- cal i n t e r e s t as it wi l l be d e t e r m i n e d p r i m a r i l y b y the a m o u n t of b o n e r e a m e d d u r i n g t h e surg ica l i m p l a n t a t i o n of t he pros thes i s . The r e p r o d u c i b i l i t y of t he size of t he o t h e r ROIs was exce l len t , w i t h coeff ic ients of v a r i a t i o n b e t w e e n 1.1 a n d 2 .0% for zones 1, 2, 3, 5, a n d 6. Zone 7 was sma l l e r t h a n the o the r s b e c a u s e its l e n g t h was m a n u a l l y a d j u s t e d so t ha t t h e top of t h e ROI co inc ided w i t h t he top of t he b o n e in t he image . The m a n u a l m a n i p u l a t i o n of th is ROI was n e c e s s a r y to a c c u r a t e l y select t he cor rec t a r ea of b o n e b u t r e s u l t e d in a less r e p r o -
duc ib le de f in i t i on of t he ROI size a n d p l a c e m e n t (coeff ic ient of v a r i a t i o n of 3.5 %). The r e p roduc ib i l - i ty of t h e b o n e m i n e r a l c o n t e n t was v e r y s imi la r to t ha t f o u n d for t he BMD d u e to t h e exce l l en t r e p r o - duc ib i l i ty of t he ROIs.
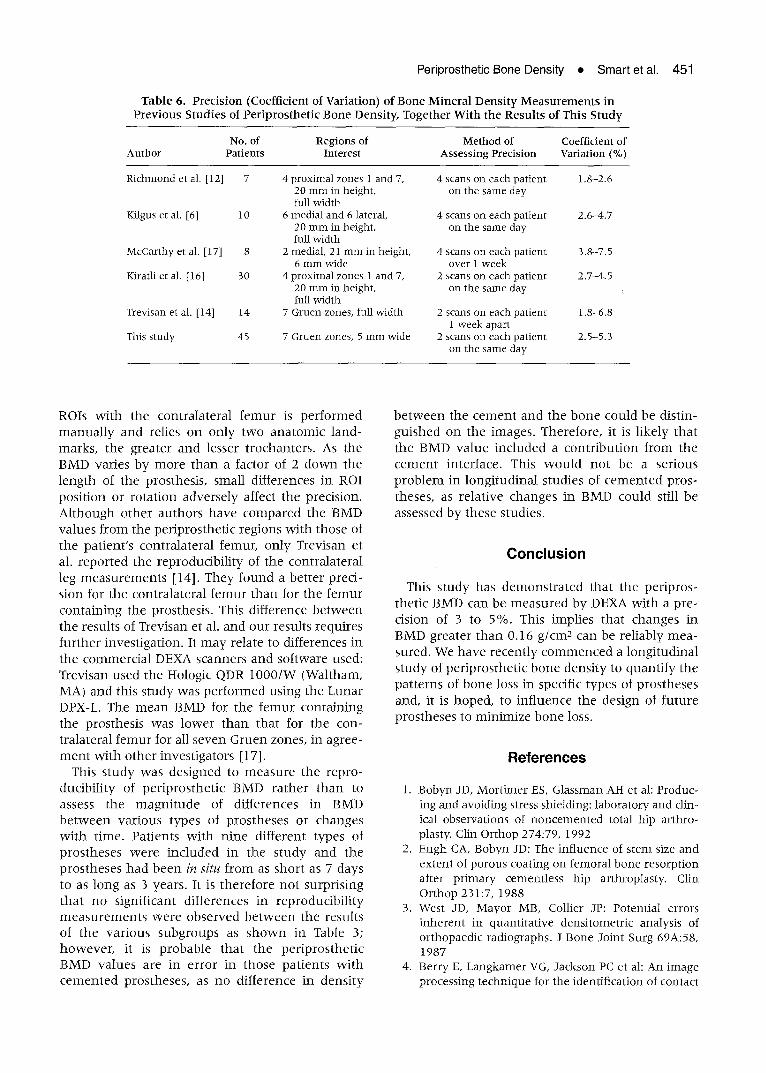
A n u m b e r of o t h e r cen te r s h a v e m e a s u r e d the p rec i s ion (coeff ic ient ot va r i a t ion ) of p e r i p r o s t h e t i c BMD m e a s u r e m e n t s ; h o w e v e r , m o s t r e p o r t e d s tud- ies h a v e i n c l u d e d f e w e r t h a n l 0 pa t i en t s . Thei r f ind ings a re s u m m a r i z e d in Table 6. The r a n g e of coeff ic ients of v a r i a t i o n in this s t u d y on 45 p r o s t h e - ses ( 2 . 5 - 5 . 3 % ) is in a g r e e m e n t w i t h tha t o b s e r v e d b y o t h e r inves t iga tors , e v e n t h o u g h a w ide va r i e t y of d i f fe ren t ROIs w e r e used . The s t u d y of Kirat l i et al. is t he m o s t ex t ens ive of t he ea r l i e r s tudies , a n d i n c l u d e d dup l i ca t e m e a s u r e m e n t s o n 30 pa t i en t s [16]. Thei r m e a s u r e d prec is ion , 2.7 to 4 . 5 % , is in close a g r e e m e n t w i t h o u r f indings. Trevisan et al. are t he on ly p r e v i o u s g r o u p to de f ine t he ROIs us ing the s even G r u e n zones {14]. Thei r s t u d y of on ly 14 w o m e n , all of w h o m rece ived a s ingle type of h ip p ros thes i s (a c u s t o m c o m p u t e d t o m o g r a p h y - c o m p u t e r a i d e d des ign) , d e m o n s t r a t e d a p r ec i s i on s imi lar to t ha t f o u n d in this l a rger ser ies in w h i c h a r ange of p ro s the se s w e r e used .
W h e n the ROIs w e r e s u p e r i m p o s e d on the pa t i en t ' s c o n t r a l a t e r a l f e m u r t he r e p r o d u c i b i l i t y was p o o r e r t h a n for t he p e r i p r o s t h e t i c reg ions . This is n o t a su rp r i s ing f inding, as t he a l i g n m e n t of t he
Table 5. Compar ison of Bone Mineral Densi ty Around the Prosthesis and the Contralateral Femur
Zone 1 Zone 2 Zone 3 Zone 4 Zone 5 Zone 6 Zone 7
Mean difference in BMD (g/cm 2) -0.12, P = .05 -0.11, NS -0.12, NS -0.04, NS -0.05, NS -0.16, NS -0.13, NS Mean percentage difference in BMD -10.8 -5.3 -4.7 -2.1 -2.1 -4.0 -3.1
BMD, bone mineral density; NS, not significant.
Periprosthetic Bone Density • Smart et al.
Table 6. Precision (Coefficient of Variation) of Bone Mineral Densi ty Measurements in Previous Studies of Periprosthet ic Bone Density, Together With the Results of This Study
451
No. of Regions of Method of Coefficient of Author Patients Interest Assessing Precision Variation (%)
Richmond et al. [12] 7 4 proximal zones 1 and 7, 4 scans on each patient 1.8-2.6 20 nm~ in height, on the same day full width
Kilgus et al. [6] 10 6 medial and 6 lateral, 4 scans on each patient 2.6-4.7 20 mm in height, on the same day full width
McCarthy et al. [17] 8 2 medial, 21 mm in height, 4 scans on each patient 3.8-7.5 6 mm wide over 1 week
Kiratli et al. [16] 30 4 proximal zones 1 and 7, 2 scans on each patient 2.7-4.5 20 mm in height, on the same day full width
Trevisan et al. [14] 14 7 Gruen zones, full width 2 scans on each patient 1.8-6.8 1 week apart
This study 45 7 Gruen zones, 5 mm wide 2 scans on each patient 2.5-5.3 on the same day
ROIs w i t h t he c o n t r a l a t e r a l f e m u r is p e r f o r m e d m a n u a l l y a n d rel ies o n on ly t w o a n a t o m i c l a n d - marks , t he g rea t e r a n d lesser t r ochan t e r s . As the BMD var ies b y m o r e t h a n a fac tor of 2 d o w n the l e n g t h of t he p ros thes i s , smal l d i f fe rences in ROI p o s i t i o n or r o t a t i o n a d v e r s e l y affect t he p rec i s ion . A l t h o u g h o t h e r a u t h o r s h a v e c o m p a r e d the BMD va lues f r o m the p e r i p r o s t h e t i c reg ions w i t h t h o s e of t he pa t i en t ' s c o n t r a l a t e r a l femur , o n l y Trevisan et al. r e p o r t e d the r e p r o d u c i b i l i t y of t he c o n t r a l a t e r a l leg m e a s u r e m e n t s [14]. T h e y f o u n d a b e t t e r p rec i - s ion for t he c o n t r a l a t e r a l f e m u r t h a n for t he f e m u r c o n t a i n i n g the pros thes i s . This d i f fe rence b e t w e e n the resu l t s of Trev isan et al. a n d o u r resul t s r equ i r e s f u r t h e r inves t iga t ion . It m a y re la te to d i f fe rences in t he c o m m e r c i a l DEXA scanne r s a n d so f tware used: Trevisan u sed the Hologic QDR 1 0 0 0 / W (Wal tham, MA) a n d this s t u d y was p e r f o r m e d us ing the L u n a r DPX-L. The m e a n BMD for t he f e m u r c o n t a i n i n g the p ros thes i s was l o w e r t h a n t ha t for t he con- t r a l a t e ra l f e m u r for all s e v e n G r u e n zones , in ag ree - m e n t w i t h o t h e r inves t iga to r s [17].
This s t u d y w a s d e s i g n e d to m e a s u r e t h e r e p r o - duc ib i l i t y of p e r i p r o s t h e t i c BMD r a t h e r t h a n to assess t he m a g n i t u d e of d i f f e rences in BMD b e t w e e n v a r i o u s t y p e s of p r o s t h e s e s or c h a n g e s w i t h t ime . Pa t i en t s w i t h n i n e d i f f e ren t t y p e s of p r o s t h e s e s w e r e i n c l u d e d in t h e s t u d y a n d the p r o s t h e s e s h a d b e e n in situ f r o m as s h o r t as 7 days to as l ong as 3 yea rs . I t is t h e r e f o r e n o t su rp r i s i ng t h a t n o s ign i f i can t d i f f e rences in r e p r o d u c i b i l i t y m e a s u r e m e n t s w e r e o b s e r v e d b e t w e e n the resu l t s of t he v a r i o u s s u b g r o u p s as s h o w n in Table 3; h o w e v e r , it is p r o b a b l e t h a t t h e p e r i p r o s t h e t i c BMD v a l u e s a re in e r r o r in t h o s e p a t i e n t s w i t h c e m e n t e d p r o s t h e s e s , as n o d i f f e rence in d e n s i t y
b e t w e e n the c e m e n t a n d the b o n e c o u l d be d i s t in - g u i s h e d o n t h e images . The re fo re , it is l i ke ly t h a t t he BMD v a l u e i n c l u d e d a c o n t r i b u t i o n f r o m the c e m e n t in t e r face . This w o u l d n o t be a s e r ious p r o b l e m in l o n g i t u d i n a l s tud ies of c e m e n t e d p ros - theses , as r e l a t ive c h a n g e s in BMD c o u l d still be assessed b y t h e s e s tudies .
Conclusion
This s t u d y has d e m o n s t r a t e d t ha t t he p e r i p r o s - t he t i c BMD can be m e a s u r e d b y DEXA w i t h a p re - c is ion of 3 to 5%. This impl i e s t ha t c h a n g e s in BMD g re a t e r t h a n 0.16 g / c m 2 can be r e l i ab ly m e a -
sured . W e h a v e r e c e n t l y c o m m e n c e d a l o n g i t u d i n a l s t u d y of p e r i p r o s t h e t i c b o n e d e n s i t y to q u a n t i f y t he p a t t e r n s of b o n e loss in specific t ypes of p r o s t h e s e s and , it is h o p e d , to i n f l u e n c e t h e des ign of f u tu r e p r o s t h e s e s to m i n i m i z e b o n e loss.
References
1. Bobyn JD, Mortimer ES, Glassman AH et al: Produc- ing and avoiding stress shielding: laboratory and clin- ical observations of noncemented total hip arthro- plasty. Clin Orthop 274:79, 1992
2. Engh CA, Bobyn JD: The influence of stem size and extent of porous coating on femoral bone resorption after pr imary cementless hip arthroplasty. Clin Orthop 231:7, 1988
3. West JD, Mayor MB, Collier JP: Potential errors inherent in quantitative densitometric analysis of orthopaedic radiographs. J Bone Joint Surg 69A:58, ]987
4. Berry E, Langkamer VG, Jackson PC et ah An image processing technique for the identification of contact
452 The Journal of Arthroplasty Vol. 11 No. 4 June 1996
pixels applied to x-ray CT images of implanted hip prostheses. Phys Med Biol 38:323, 1993
5. Z immerman MC, Meunier A, Katz JL et al: The evaluat ion of bone remodelfing about orthopaedic implants with ul trasound. J Orthop Res 7:607, I989
6. Kilgus D J, Shimaoka EE, Tipton JS, Eberle RW: Dual-energy x-ray absorptiometry measurement of bone mineral density around porous-coated cement- less femoral implants: methods and prel iminary results. J Bone Joint Surg 75B:279, 1993
7. Larnach TA, Boyd S J, Smart RC et al: Reproducibil- ity of lateral spine scans using dual energy x-ray absorptiometry. Calcif Tissue Int 51:255, 1992
8. Mazess R, Collick B, Trempe J e t al: Performance evaluation of a dual-energy x-ray bone densitome- ter. Calcif Tissue Int 44:228, 1989
9. Orwoll ES, Oviatt SK, Nafarelin/Bone Study Group: Longitudinal precision of dual-energy x-ray absorp- t iometry in a multicenter study. J Bone Miner Res 6:191, 1991
10. Kalender WA: Effective dose values in bone mineral measurements by photon absorptiometry and com- puted tomography. Osteoporosis Int 2:82, 1992
11. Kiratli B J, Heiner JP, McKinley N e t al: Bone min- eral density of the proximal femur after uncemented total hip arthroplasty. Presented at the 37th Annual
Meeting of the Orthopaedic Research Society, Ana- heim, CA, March 1991
12. Richmond BJ, Eberle RW, Stulberg BN, Deal CL: DEXA measurement of periprosthetic bone mineral density in total hip arthroplasty. Presented at the 13th Annual Meeting of the American Society for Bone and Mineral Research, San Diego, CA, August 1991
13. Gruen TA, McNeice GM, Amstutz HC: "Modes of failure" of cemented stem-type femoral compo- nents: a radiographic analysis of loosening. Clin Orthop 141:17, 1979
14. Trevisan C, Bigoni M, Cherubini R et al: Dual x-ray absorptiometry for the evaluation of bone density from the proximal femur after total hip arthroplasty: analysis protocols and reproducibility. Catcif Tissue Int 53:158, 1993
15. Nilas L, Hassager C, Christiansen C: Long-term pre- cision of dual-photon absorptiometry in the lumbar spine in clinical settings. J Bone Miner Res 3:305, 1988
16. Kiratli B J, Heiner JP, McBeath AA, Wilson MA: Deter- ruination of bone mineral density by dual energy x- ray absorptiometry in patients with uncemented total hip arthroplasty. J Orthop Res 10:836, 1992
17. McCarthy CK, Steinberg GG, Agren M e t al: Quanti- fying bone loss from the proximal femur after total hip arthroplasty. J Bone Joint Surg 73B:774, 1991
Related Documents


