Journal of Advanced Research in Fluid Mechanics and Thermal Sciences 53, Issue 1 (2019) 11-24 11 Journal of Advanced Research in Fluid Mechanics and Thermal Sciences Journal homepage: www.akademiabaru.com/arfmts.html ISSN: 2289-7879 Measurement of Liquid Holdup by Using Conductance Probe Sensor in Horizontal Annular Flow Andriyanto Setyawan 1,* , Indarto 2 , Deendarlianto 2 1 Department of Refrigeration and Air Conditioning Engineering, Politeknik Negeri Bandung, Bandung 40012, Indonesia 2 Department of Mechanical and Industrial Engineering, Gadjah Mada University, Yogyakarta 55281, Indonesia ARTICLE INFO ABSTRACT Article history: Received 11 September 2018 Received in revised form 24 October 2018 Accepted 30 October 2018 Available online 8 January 2019 An experimental study by using flush-mounted conductance probe sensors has been carried out in an air-water horizontal annular flow. The experiment was arranged in a 26-mm diameter pipe with superficial gas velocity of 10 to 40 m/s and superficial liquid velocity of 0.025 to 0.4 m/s. The probe detects the liquid film thickness at 7 circumferential positions from the bottom part to the top of the pipe and the liquid holdup is determined from the average of the circumferential liquid film thickness. A range of liquid holdup form 0.022 to 0.21 is resulted from the experiment. A decrease of liquid holdup is resulted with the increase superficial gas velocity and decrease of superficial liquid velocity. Conversely, the liquid holdup increases with the decrease of the gas velocity and the increase of liquid velocity. Examination of the experimental data by using 7 previous available correlations results in a reasonably good agreement. Keywords: Annular flow, Liquid holdup, Liquid film thickness, Horizontal pipe Copyright © 2019 PENERBIT AKADEMIA BARU - All rights reserved 1. Introduction Annular flow can be found in many engineering applications that employ two-phase flow, such as geothermal plant, chemical industries, and refrigeration system. In annular two-phase flow, a small part of pipe cross-sectional area is filled by liquid and the remaining is occupied by gas. The ratio of volume of flow filled by liquid in a two-phase flow to the volume of pipe element is called as liquid holdup. If the pipe cross-sectional area is denoted as A and the area of pipe occupied by liquid is denoted as AL, then the liquid holdup could be expressed as = (1) For a fluid flow, the liquid holdup value varies from 0 (single-phase gas flow) to 1 (for single-phase liquid flow). In two-phase flow, the value is 0<η<1. The complement of liquid holdup, called the void fraction, is defined as the ratio of gas volume to the total volume of the segment of pipe * Corresponding author. E-mail address: [email protected] (Andriyanto Setyawan) Open Access

Measurement of Liquid Holdup by Using … address: [email protected] (Andriyanto Setyawan) Open Access Journal of Advanced Research in Fluid Mechanics and Thermal Sciences Volume
Apr 29, 2019
Welcome message from author
This document is posted to help you gain knowledge. Please leave a comment to let me know what you think about it! Share it to your friends and learn new things together.
Transcript

Journal of Advanced Research in Fluid Mechanics and Thermal Sciences 53, Issue 1 (2019) 11-24
11
Journal of Advanced Research in Fluid
Mechanics and Thermal Sciences
Journal homepage: www.akademiabaru.com/arfmts.html ISSN: 2289-7879
Measurement of Liquid Holdup by Using Conductance Probe Sensor in Horizontal Annular Flow
Andriyanto Setyawan1,*, Indarto2, Deendarlianto2
1 Department of Refrigeration and Air Conditioning Engineering, Politeknik Negeri Bandung, Bandung 40012, Indonesia 2 Department of Mechanical and Industrial Engineering, Gadjah Mada University, Yogyakarta 55281, Indonesia
ARTICLE INFO ABSTRACT
Article history: Received 11 September 2018 Received in revised form 24 October 2018 Accepted 30 October 2018 Available online 8 January 2019
An experimental study by using flush-mounted conductance probe sensors has been carried out in an air-water horizontal annular flow. The experiment was arranged in a 26-mm diameter pipe with superficial gas velocity of 10 to 40 m/s and superficial liquid velocity of 0.025 to 0.4 m/s. The probe detects the liquid film thickness at 7 circumferential positions from the bottom part to the top of the pipe and the liquid holdup is determined from the average of the circumferential liquid film thickness. A range of liquid holdup form 0.022 to 0.21 is resulted from the experiment. A decrease of liquid holdup is resulted with the increase superficial gas velocity and decrease of superficial liquid velocity. Conversely, the liquid holdup increases with the decrease of the gas velocity and the increase of liquid velocity. Examination of the experimental data by using 7 previous available correlations results in a reasonably good agreement.
Keywords: Annular flow, Liquid holdup, Liquid film thickness, Horizontal pipe Copyright © 2019 PENERBIT AKADEMIA BARU - All rights reserved
1. Introduction
Annular flow can be found in many engineering applications that employ two-phase flow, such as geothermal plant, chemical industries, and refrigeration system. In annular two-phase flow, a small part of pipe cross-sectional area is filled by liquid and the remaining is occupied by gas. The ratio of volume of flow filled by liquid in a two-phase flow to the volume of pipe element is called as liquid holdup. If the pipe cross-sectional area is denoted as A and the area of pipe occupied by liquid is denoted as AL, then the liquid holdup could be expressed as
𝜂 =𝐴𝐿
𝐴 (1)
For a fluid flow, the liquid holdup value varies from 0 (single-phase gas flow) to 1 (for single-phase
liquid flow). In two-phase flow, the value is 0<η<1.
The complement of liquid holdup, called the void fraction, is defined as the ratio of gas volume
to the total volume of the segment of pipe * Corresponding author. E-mail address: [email protected] (Andriyanto Setyawan)
Open
Access

Journal of Advanced Research in Fluid Mechanics and Thermal Sciences
Volume 53, Issue 1 (2019) 11-24
12
𝜀 = 1 − 𝜂 = 1 −𝐴𝐺
𝐴 (2)
where AG is the area of pipe occupied by gas.
Liquid holdup or void fraction cannot be determined analytically. It should be determined by using
empirical correlations resulted from experiment. Many methods have been proposed for liquid
holdup measurements. A ring conductance probe for the measurement of liquid holdup in a 50-mm
pipe has been proposed by Andreussi et al., [1]. The similar sensor has also been utilized by
Tsochatzidis et al., [2] for the measurement of liquid fraction in packed beds as well as in pipes. An
improvement of the electronics circuit in the conductance sensor has been reported by Fossa [3]. It
has been used for the measurement of liquid fraction in a 70-mm pipe. Using X-ray absorption,
Kendoush and Sarkis [4] reported the measurement of void fraction in 28 mm and 36 mm pipes. The
use of acoustic emission for the measurement of gas void fraction in a 50-mm pipe has been reported
by Al-lababidi et al., [5]. Ko et al., [6] reported their successful experiment with an improvement of
conductance sensor for measurement of void fraction in a 40-mm horizontal pipe. Later, Dabirian et
al., [7] conducted liquid holdup measurement involving a three-phase Y ray densitometer in a 97 mm
horizontal pipe.
The value of liquid holdup is affected by the liquid and gas properties, pipe inclination, pipe
diameter, and flow pattern. Many models have been developed for predicting the liquid holdup
and/or void fraction. Several correlations will be discussed here.
By analyzing the available experimental data with different pipe inclination, Spedding and Chen [8] developed a correlation for determining the void fraction as follows
𝜀 = [1 + 2.22 (1−𝑥
𝑥)0.65
(𝜌𝐺
𝜌𝐿)0.65
] (3)
where x is the mass quality, i.e. the fraction of gas to the total mass, and ρG and ρL are the density of gas and liquid, respectively. The liquid holdup (η) is then determined by using η = 1 – ε.
Fukano and Ousaka [9] proposed a correlation for predicting the liquid holdup as
𝜙𝐿 = 𝜂−1.90 (4) Here, ϕL denotes the two-phase friction multiplier, i.e. the ratio of pressure drop of two-phase flow and the pressure drop when there is only liquid flowing in the channel.
Spedding and Spence [10] developed an implicit correlation for the prediction void fraction as follows 1−𝜀
𝜀= [0.45 + 0.08exp(−100(0.25 − 𝐽𝐿
2)] (𝐽𝐺
𝐽𝐿)0.65
(5)
In this correlation, the value of superficial gas (air) velocity, JG, and superficial liquid (water) velocity, JL, are explicitly employed for void fraction prediction, instead of the mass quality as proposed by the previous correlation.
By employing Reynolds number of superficial liquid, ReSL, Hart et al., [11] predicted the void fraction using the following explicit correlation

Journal of Advanced Research in Fluid Mechanics and Thermal Sciences
Volume 53, Issue 1 (2019) 11-24
13
𝜀 = {1 + (𝐽𝐺
𝐽𝐿) [1 + (108 (
𝜌𝐿
𝜌𝐺)𝑅𝑒𝑆𝐿
−0.726)0.5
]}−1
(6)
Originally, this correlation was used for the prediction of high void fraction that is commonly found in high gas velocity annular flow. The viscosity of the liquid is employed implicitly in this correlation through the use of Reynolds number of liquid, ReSL.
The prediction of liquid holdup through the measurement of circumferential liquid-film thickness has been proposed by Fukano and Furukawa [12]. Formerly, the correlation predicted the mean film thickness (hfm) instead of liquid holdup
ℎ𝑓𝑚 = 0.0594exp(−0.34𝐹𝑟𝐺𝑂0.25𝑅𝑒𝐺𝑂
0.19𝑥0.6) (7)
where Fr is the Froude number and the subscript GO denotes condition if only gas flows in the system. If D is the pipe diameter, then the liquid holdup, η, can be calculated by
ℎ𝑓𝑚 = 0.5𝐷(1 − √1 − 𝜂) (8)
Instead of examining the physical parameters, Woldesemayat and Ghajar [13] examined 68
previous correlations by classifying it into four methods, i.e. slip ratio correlations, KεH correlation, drift flux correlations, and general void fraction correlations. Their new correlation for void fraction was developed as follows
𝜀 =𝐽𝐺
𝑝+2.9𝑞𝑟 (9)
where
𝑝 = 𝐽𝐺 [1 + (𝐽𝐿
𝐽𝐺) (
𝜌𝐿
𝜌𝐺)0.1
], 𝑞 = [𝑔𝐷𝜎(1+𝑐𝑜𝑠𝜃)(𝜌𝐿−𝜌𝐺)
𝜌𝐿2 ]
0.25
, and
𝑟 = (1.22 + 1.22 sin 𝜃)𝑃𝑎𝑃𝑠
σ denotes the surface tension of the liquid, g denotes the gravitational acceleration, and θ expresses the angle of pipe inclination measured from horizontal. The ratio of the ambient pressure and system pressure are denoted by Pa and Ps, respectively.
Later, Cioncolini and Thome [14] proposed a model for to predict the void fraction in annular flow. The model was developed from 2673 sets of data from 29 literatures and expressed as
𝜀 =ℎ𝑥𝑛
1+(ℎ−1)𝑥𝑛; 0 < 𝑥 < 1;10−3 <
𝜌𝐺
𝜌𝐿< 1 (10)
where
ℎ = −2.2129 + 3.219 (𝜌𝐿
𝜌𝐺)−0.2186
and 𝑛 = 0.3847 + 0.6513 (𝜌𝐺
𝜌𝐿)0.515

Journal of Advanced Research in Fluid Mechanics and Thermal Sciences
Volume 53, Issue 1 (2019) 11-24
14
In this paper, the liquid holdup was indirectly measured by using the flush mounted conductance sensor for measuring the circumferential liquid film height over the pipe. The liquid holdup was calculated on the basis of the mean liquid film height over the pipe. Thereafter, the liquid holdup data are analyzed and tested by using the available correlations. 2. Methodology
A horizontal rig of transparent acrylic pipes with 26-mm diameter was used for determining the behavior of air-water two-phase flow under annular flow regime. Compressed air entered at one end of the test rig, meanwhile the liquid entered the other end. A mixer was used to mix the air and water before entering the 1.29-m test section (Figure 1a). To ensure that the flow is fully-developed annular, the test section was placed at a distance of about 200D, in which D is the pipe diameter. The measurement of the flow rate of the air and water uses a bank of Tokyo-Keisho and Brook rotameters were used with accuracies of 4% and 3%, respectively.
The measurement of small water-film thickness in annular flow was carried out by the use of flush-mounted conductance sensor or sometimes called as compact multiple probe instrument (CMPI), as shown in Figure 1b. The film thicknesses were measured at 7 circumferential positions by
7 sensors, i.e. from 0 (bottom of the pipe) to 180 (top of the pipe). Each sensor was equally-spaced
by 30 and it measures the film thickness by sensing the conductance of liquid between the two sensor electrodes. Generally, the conductance of a liquid decreases as the liquid thickness increases.
(a)
(b)
Fig. 1. Experimental rig: (a) pipe loop, (b) detail of CMPI sensor
In this experiment, a 5 V supply voltage was fed to the sensors. The output voltage was then sent
to the NI 6218 NI-DAQ from National Instrument. Monitoring and storing of the output voltage were conducted by a personal computer. The calculation of the thickness of liquid film was carried out on the basis of the calibration curves resulted from the calibration process using a stepped cylinder with
Supply pump
Valve
Water tank
Valve
Mixer
Valve
Valve
Separator
Air
Water Signal
conditioning
10000
xLamp
Screen
High Speed
Camera
Camera
Processor
PC
215 215 215 215 215215
Circulating pump
Air compressor
Probe CMPI 1 - 5
DP transmitter
Flow meterFlow meter
ADC

Journal of Advanced Research in Fluid Mechanics and Thermal Sciences
Volume 53, Issue 1 (2019) 11-24
15
varied diameters. The cylinder was used to calibrate the film thickness within 0.05 to 4.9 mm. The average uncertainty for the film thickness measurement is 7.1%. If it is combined with the air and water flow measurements, the total uncertainty is found to be 8.7% under 90% level of confidence.
The experiment was conducted under the combinations of the superficial liquid velocities of 0.025, 0.05, 0.1, 0.2, and 0.4 m/s and superficial gas velocities of 10, 12, 18, 25, 30, and 40 m/s. As shown in Figure 2, in the Mandhane map [15], most of the experimental flow conditions are located at the annular flow region. The numbers 1, 2, …, 30 indicate the number of experimental run. The detailed experimental matrix is presented in Table 1, which shows all the 30 runs of the experimental flow conditions. In Table 1, point 1 represents the experimental flow condition with JG = 10 m/s and JL = 0.025 m/s, point 2 represents the experimental flow condition with JG = 12 m/s and JL = 12 m/s, etc. The experiment with JG = 40 m/s and JL = 0.4 m/s is indicated by point 30.
In the downstream direction of the test section, a visualization box with DC LCD lamp was also installed to allow the study of the flow visually. In detail, the apparatus for carrying out the experiment can also be found in Setyawan et al., [16, 17, 18].
Fig. 2. Experimental matrix on Mandhane Map
Table 1 Experimental matrix
JL (m/s) JG (m/s)
10 12 18 25 30 40
0.025 1 2 3 4 5 6 0.05 7 8 9 10 11 12 0.1 13 14 15 16 17 18 0.2 19 20 21 22 23 24 0.4 25 26 27 28 29 30
3. Results
The sample of the image of the gas-liquid flow is depicted in Figure 3. The liquid flows in the pipe
wall while the gas flow with the higher velocity in the center of the pipe surrounded by the thin liquid film. The high velocity gas shears the liquid, so that a wavy liquid flow is occurred. The wavy liquid could be distinguished into two: ripple wave and disturbance wave. The ripple flows with small amplitude wave and the disturbance wave flow with the higher amplitude. When the annular flow is fully developed, the ring-shaped liquid film will be formed in the pipe wall. Thicker liquid film forms disturbance wave that travels with the higher velocity than that of the base liquid film.
0.001
0.01
0.1
1
10
0.1 1 10 100
J L[m
/s]
JG [m/s]
BUBBLY
PLUG SLUG
STRATIFIED
WAVYANNULAR
1 2 3 4 5 6
25 26 27 28 29 30
7 8 9 10 11 12
13 14 15 16 17 18
19 20 21 22 23 24

Journal of Advanced Research in Fluid Mechanics and Thermal Sciences
Volume 53, Issue 1 (2019) 11-24
16
To examine the effect of the circumferential position on the liquid film thickness, a sample of the
liquid film signals at JL = 0.05 m/s and JG = 18 m/s are plotted in Figure 4. At the bottom (0), the liquid
film is thicker and wavier than that of the side (90) and the top of pipe (180). At this flow condition, the gravity force controls the flow. As a result, the liquid tend to drain to the bottom and gives the thicker film at this position with high asymmetry. As the gas velocity increases, the effect of gravity decreases and the inertial force has a more significant role in control the flow, resulting in a more symmetry of liquid film thickness distribution. The asymmetry of liquid film thickness distribution for the experiment with JL = 0.05 m/s is illustrated in Figure 5.
Fig. 3. The photograph of the annular flow, taken from the experiment with JG = 25 m/s and JL = 0.05 m/s
Fig. 4. Liquid film thickness signals at different circumferential positions for JL = 0.05 m/s and JG = 18 m/s
0
1
2180
0
1
2150
0
1
2120
0
1
290
0
1
260
0
1
230
0
1
2
0 0.1 0.2 0.3 0.4 0.5 0.6 0.7 0.8 0.9 1
Time (s)
0
Film
th
ickn
ess
(m
m)

Journal of Advanced Research in Fluid Mechanics and Thermal Sciences
Volume 53, Issue 1 (2019) 11-24
17
Fig. 5. Asymmetry of liquid film thickness for JL = 0.05 m/s
To calculate the liquid holdup for this present experiment, the average liquid thickness over the
pipe wall is calculated by
12
22222 1801501209060300 hhhhhhhhaverage
(11)
where h is the mean liquid film height and subscripts 0, 30, 60, … are the degree of circumferential position throughout the pipe wall. Using the results of the measurement, the liquid holdup is calculated as
1 (12)
where ε is the void fraction or gas fraction of the flow, expressed as
)4/(2)4/(22 AhDADgas (13)
In this equation, Dgas denotes the area of the pipe occupied by gas and A denotes the pipe surface area. The liquid holdup is, therefore
A
hD
4
211
2
(14)
JG = 10 m/s JG = 12 m/s
JG = 18 m/s JG = 25 m/s
JG = 30 m/s JG = 40 m/s

Journal of Advanced Research in Fluid Mechanics and Thermal Sciences
Volume 53, Issue 1 (2019) 11-24
18
3.1 The Effects of the Superficial Gas and Liquid Velocity on the Liquid Holdup
The liquid holdup resulted from the experiment ranges from 0.022 to 0.210. The higher superficial liquid velocity gives the higher liquid holdup. Conversely, the higher superficial gas velocity provides a lower liquid holdup. This means that at the higher gas velocity, the liquid film will travel with the smaller thickness but with the higher velocity. The behaviors of liquid holdup under the given range of experimental conditions can also be seen in Figure 6.
Both the superficial gas and liquid velocities influence the liquid holdup. In general, the liquid holdup decreases when the superficial gas velocity increases as well as the decrease of superficial liquid velocity. From Figure 6, it reveals that the increase of superficial gas velocity from 10 to 40 m/s (by a factor of 400%) gives the decrease of liquid holdup by 62%. Meanwhile, the change of liquid superficial velocity from 0.1 to 0.4 m/s (by a factor of 400%) changes the liquid holdup by 53%. It means that the liquid holdup is more influenced by the superficial gas velocity than that of liquid superficial velocity.
The comparison of the present experimental data with the above mentioned correlations for JL = 0.025 m/s is described in Figure 7. As shown, the present experimental result is considerably in a good agreement with the result form the correlation found in [8,9,10] with the mean absolute error (MAE) in the range of 9% to 10%. The correlation of [12,13,14] have a significantly larger error for whole range of superficial gas velocity. Meanwhile, the correlation of Hart et al., [11] has a large error at low JG and smaller error at high JG. It is because this correlation was developed for high void fraction annular flow that needs a very high superficial gas velocity.
Increasing JL to 0.05 m/s, all of the tested correlations have an average error of 14.2%, better than the previous test. The best prediction for this condition is provided by Fukano and Ousaka [9] with an error of 5.6%, as can also be observed in Figure 8. The largest error of about 23.5% is provided by the correlation of Fukano and Furukawa [12] that employed the liquid viscosity in term of liquid Reynolds number. The other correlations have moderate errors in the range of 11.5% to 16.3%.
(a)
(b)
Fig. 6. Experimental data of liquid holdup at various JG and JL
0
0.05
0.1
0.15
0.2
0.25
0 5 10 15 20 25 30 35 40
Liq
uid
ho
ldu
p [
-]
Superficial gas velocity [m/s]
0.025 m/s 0.05 m/s
0.1 m/s 0.2 m/s
0.4 m/s
JL:
0
0.05
0.1
0.15
0.2
0.25
0 0.05 0.1 0.15 0.2 0.25 0.3 0.35 0.4
Liq
uid
ho
ldu
p [
-]
Superficial liquid velocity [m/s]
10 m/s 12 m/s 18 m/s
25 m/s 30 m/s 40 m/sJG:

Journal of Advanced Research in Fluid Mechanics and Thermal Sciences
Volume 53, Issue 1 (2019) 11-24
19
Fig. 7. Liquid holdup data for JL = 0.025 m/s Fig. 8. Liquid holdup data for JL = 0.05 m/s
As JL is further doubled to 0.1 m/s, all of the correlations provide an average error of 14.1%. The best prediction is offered by Cioncolini and Thome [14] with an MAE of 9.7%. The correlation of Fukano and Furukawa [12], with an MAE of 28.2%, gives the largest error. The other correlations have an error range of 10.2% to 14.9%. The comparison of the present data and the available correlations for this flow conditions is presented in Figure 9.
At JL of 0.2 m/s, an average error of 17.3% is resulted. The correlation that gives the best prediction is given by Spedding and Spence [10] and Spedding and Chen [8] with an error of 11.9%. The largest error is still provided by the correlation of Fukano and Furukawa [12], with an MAE of 33.5%. An error range of 13.6% to 20.9% is given by the other correlations. For this flow conditions, the comparison of the correlations with the present data is displayed in Figure 10.
At the highest JL (0.4 m/s), the correlation of Cioncolini and Thome [14] provides the best prediction with an MAE of 8.2%. The largest error is, again, contributed by the correlation of Fukano and Furukawa [12]. The remaining correlations have an error range from 8.7% to 27.0%. The overall error for all correlations is about 16.2%. Figure 11 depicts the comparison of the present data and the available correlations for JL = 0.4 m/s.
Fig. 9. Liquid holdup data for JL = 0.1 m/s Fig. 10. Liquid holdup data for JL = 0.2 m/s

Journal of Advanced Research in Fluid Mechanics and Thermal Sciences
Volume 53, Issue 1 (2019) 11-24
20
The comparisons to the other previous data or correlations are not performed here by considering some reasons. For instance, liquid holdup data form Dabirian et al., [7] are not included here because of the different range of superficial gas velocity. They used the range of superficial gas velocity from 5 to 15 m/s. Within this range, the flow pattern is stratified-wavy, instead of annular. The review from Godbole et al., [19] could not be applied here because it was aimed for vertical orientation in the upward direction. Other holdup data from Lumban-Gaol and Valko [20] also discarded from the comparison because it was also taken from an experiment in vertical orientation.
Fig. 11. Liquid holdup data for JL = 0.4 m/s
3.2 Examination for All Ranges of Experimental Matrix
This subsection discusses the test of the available correlations with the present experimental
data. The test is carried out for all ranges of gas and liquid superficial velocity, i.e. with JG from 10 m/s to 40 m/s and JL from 0.025 m/s to 0.4 m/s.
The correlation of Spedding and Spence [10] provides an overall MAE of 10.3%. For all experimental data, 53.3% are predicted inside ±10% error band, 90% within ±20% error band, and 100% within ±10% error band. The low MAE and the high percentage of available data located within small error band emphasize that the available experimental data is in accordance with this correlation. Figure 12 shows the performance of this correlation in predicting the liquid holdup.
Fig. 12. Performance of the correlation of Spedding and Spence [10]
Compared with all experimental data, the correlation of Spedding and Chen [8] has an MAE of
0
0.05
0.1
0.15
0.2
0 0.05 0.1 0.15 0.2
p
red
icti
on
experiment
Spedding & Spence, 1989
+20%
-20%

Journal of Advanced Research in Fluid Mechanics and Thermal Sciences
Volume 53, Issue 1 (2019) 11-24
21
10.4% for all ranges of gas and liquid superficial velocity. Figure 13 describes the performance of the correlation. The percentage of data points predicted within ±10% error band is 56.7%, 90% of data are within 20% error band, and all data points (100%) are within ±40% error band. This implies that this correlation can accurately predict the liquid holdup. The best prediction for the correlation is found for JG of 12 m/s and JL of 0.4 m/s. By inspection of Mandhane Map in Figure 2, it is obvious that this correlation is best used for both the transition from wavy and slug flows to annular flow and low velocity annular flow.
Fig. 13. Performance of the correlation of Spedding and Chen [8]
The correlation of Fukano and Ousaka [9] has an overall MAE of 11.0%. An amount of 26 out of
30 data sets (or 86.7%) are within ±20% error band, 96.7% are within ±40% error band, and 100% are inside ±50% error band. The low MAE shows that this correlation is also a good predictor for liquid holdup. The performance of this correlation is presented in Figure 14.
Fig. 14. Performance of the correlation of Fukano and Ousaka [9]
An MAE of 13.9% is provided by the correlation of Cioncolini & Thome [14]. This MAE is higher
than those of previous discussed correlations. However, it could be used for a wide range of JL and JG. Moreover, 80% of data points are within ±20% of error band and 100% are predicted within 40% error band that imply a good estimate to liquid holdup. Figure 15 depicts the comparison of the prediction with the experimental data.
Developed for a wide range of pipe inclination and surface tension, the correlation of Woldesemayat and Ghajar [13] still has a reasonable accuracy to predict the liquid holdup of air-
0
0.05
0.1
0.15
0.2
0 0.05 0.1 0.15 0.2
p
red
icti
on
experiment
Spedding & Chen, 1984
+20%
-20%
0
0.05
0.1
0.15
0.2
0 0.05 0.1 0.15 0.2
p
red
icti
on
experiment
Fukano & Ousaka, 1988
+20%
-20%
Journal of Advanced Research in Fluid Mechanics and Thermal Sciences
Volume 53, Issue 1 (2019) 11-24
22
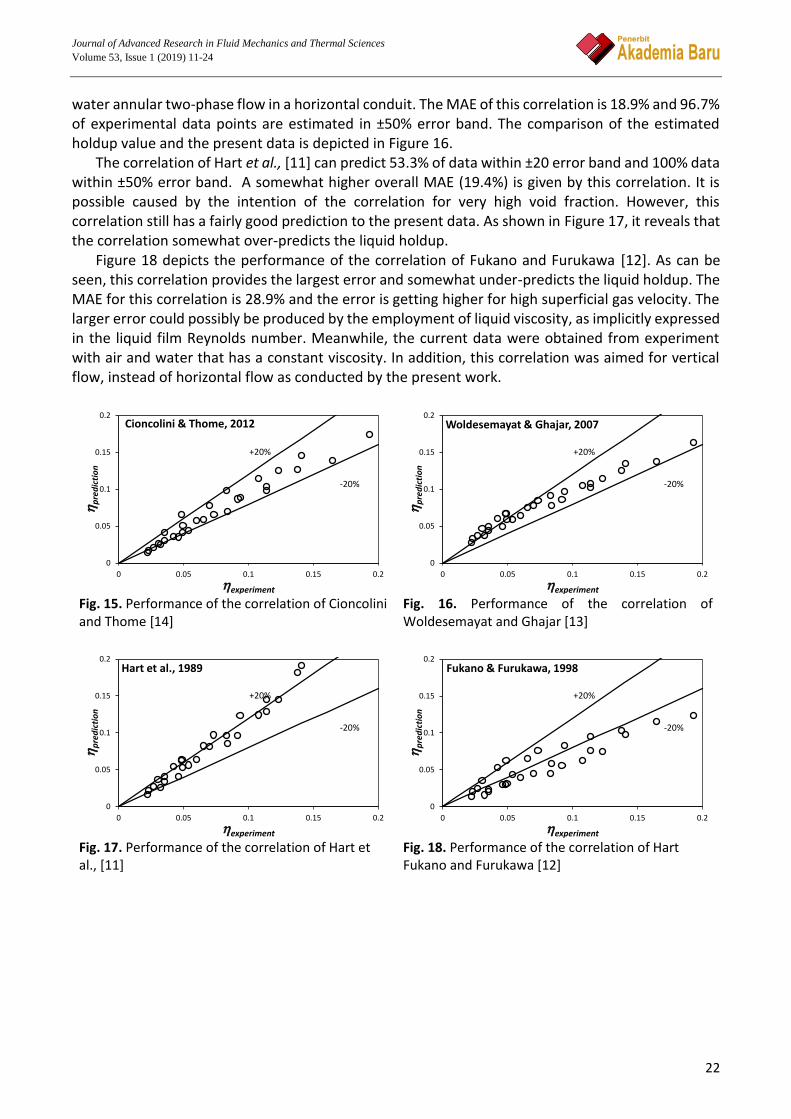
water annular two-phase flow in a horizontal conduit. The MAE of this correlation is 18.9% and 96.7% of experimental data points are estimated in ±50% error band. The comparison of the estimated holdup value and the present data is depicted in Figure 16.
The correlation of Hart et al., [11] can predict 53.3% of data within ±20 error band and 100% data within ±50% error band. A somewhat higher overall MAE (19.4%) is given by this correlation. It is possible caused by the intention of the correlation for very high void fraction. However, this correlation still has a fairly good prediction to the present data. As shown in Figure 17, it reveals that the correlation somewhat over-predicts the liquid holdup.
Figure 18 depicts the performance of the correlation of Fukano and Furukawa [12]. As can be seen, this correlation provides the largest error and somewhat under-predicts the liquid holdup. The MAE for this correlation is 28.9% and the error is getting higher for high superficial gas velocity. The larger error could possibly be produced by the employment of liquid viscosity, as implicitly expressed in the liquid film Reynolds number. Meanwhile, the current data were obtained from experiment with air and water that has a constant viscosity. In addition, this correlation was aimed for vertical flow, instead of horizontal flow as conducted by the present work.
Fig. 15. Performance of the correlation of Cioncolini and Thome [14]
Fig. 16. Performance of the correlation of Woldesemayat and Ghajar [13]
Fig. 17. Performance of the correlation of Hart et al., [11]
Fig. 18. Performance of the correlation of Hart Fukano and Furukawa [12]
0
0.05
0.1
0.15
0.2
0 0.05 0.1 0.15 0.2
p
red
icti
on
experiment
Cioncolini & Thome, 2012
+20%
-20%
0
0.05
0.1
0.15
0.2
0 0.05 0.1 0.15 0.2
p
red
icti
on
experiment
Woldesemayat & Ghajar, 2007
+20%
-20%
0
0.05
0.1
0.15
0.2
0 0.05 0.1 0.15 0.2
p
red
icti
on
experiment
Hart et al., 1989
+20%
-20%
0
0.05
0.1
0.15
0.2
0 0.05 0.1 0.15 0.2
p
red
icti
on
experiment
Fukano & Furukawa, 1998
+20%
-20%

Journal of Advanced Research in Fluid Mechanics and Thermal Sciences
Volume 53, Issue 1 (2019) 11-24
23
Table 2 summarizes the accuracies of the available correlations to estimate the liquid holdup based on the present experimental data. Overall, all correlations could predict the liquid holdup with an MAE of 16.1%. All correlations, except from Fukano and Furukawa [12] have prediction errors of less than 20%. This means that the experimental data have a good agreement with the previous works. In other words, the use of conductance probe for measuring the liquid holdup in horizontal annular flow provides accurate results.
In general, the present work has a reasonably good agreement with all of the tested correlations which give an overall error about 16.1%. The performance of the available correlations to predict the experimental data within ±10% to ±50% error band is summarized in Table 3.
Table 2
Mean absolute error for the available correlations (%)
Correlation JL (m/s)
Average 0.025 0.05 0.1 0.2 0.4
Spedding& Chen [8] 9.3 11.6 10.2 11.9 8.7 10.4
Fukano & Ousaka [9] 10.2 5.6 11.7 13.6 13.7 11.0
Spedding & Spence [10] 9.2 11.6 10.2 11.9 8.8 10.3
Hart et al., [11] 18.1 15.8 14.9 20.9 27.0 19.4
Fukano & Furukawa [12] 21.3 23.5 28.2 33.5 38.1 28.9
Woldesemayat & Ghajar [13] 41.6 14.8 13.9 15.2 8.8 18.9
Cioncolini & Thome [14] 21.1 16.3 9.7 14.1 8.2 13.9
Average 18.7 14.2 14.1 17.3 16.2 16.1
Table 3 The performance of the existing correlation in predicting the experimental data
Correlation Percent of data predicted within error bands
±10% ±20% ±30% ±40% ±50%
Spedding& Chen [8] 57 90 97 100 100
Fukano & Ousaka [9] 63 87 90 97 100
Spedding & Spence [10] 53 90 97 100 100
Hart et al., [11] 27 53 60 97 100
Fukano & Furukawa [12] 10 27 27 87 97
Woldesemayat & Ghajar [13] 37 70 73 87 97
Cioncolini & Thome [14] 33 80 93 100 100
4. Conclusions
Experimental study of determining liquid holdup by using CMPI has been carried out. Analysis the experimental data using the previous available correlations has also been accomplished. In comparison to all available correlations discussed in this paper, an average mean absolute error of 16.1% is resulted. Almost 100% of the liquid holdup data are predicted within ±50% error band and averagely 71% data points are predicted within ±20% error band. Some correlations, such as from [8], [9], [10], and [14] could predict more than 80% of liquid holdup data within ±20 error band. It, therefore, could be concluded that the CMPI could be used for determining the liquid holdup for annular flow with a reasonably good accuracy.

Journal of Advanced Research in Fluid Mechanics and Thermal Sciences
Volume 53, Issue 1 (2019) 11-24
24
Acknowledgement The authors wish to thank to The Ministry of Research, Technology, and Higher Education of Republic of Indonesia for funding the research. References [1] Andreussi, Paolo, A. Di Donfrancesco, and M. Messia. "An impedance method for the measurement of liquid hold-
up in two-phase flow." International Journal of Multiphase Flow 14, no. 6 (1988): 777-785. [2] Tsochatzidis, N. A., T. D. Karapantsios, M. V. Kostoglou, and A. J. Karabelas. "A conductance probe for measuring
liquid fraction in pipes and packed beds." International Journal of Multiphase Flow 18, no. 5 (1992): 653-667. [3] Fossa, M. "Design and performance of a conductance probe for measuring the liquid fraction in two-phase gas-
liquid flows." Flow Measurement and Instrumentation 9, no. 2 (1998): 103-109. [4] Kendoush, Abdullah Abbas, and Zareh Azat Sarkis. "Void fraction measurement by X-ray absorption." Experimental
thermal and fluid science 25, no. 8 (2002): 615-621. [5] Al-Lababidi, S., A. Addali, H. Yeung, D. Mba, and F. Khan. "Gas void fraction measurement in two-phase gas/liquid
slug flow using acoustic emission technology." Journal of Vibration and Acoustics 131, no. 6 (2009): 064501. [6] Ko, Min Seok, Bo An Lee, Woo Youn Won, Yeon Gun Lee, Dong Wook Jerng, and Sin Kim. "An improved electrical-
conductance sensor for void-fraction measurement in a horizontal pipe." Nuclear Engineering and Technology 47, no. 7 (2015): 804-813.
[7] Dabirian, Ramin, Ashwin Padsalgikar, Mobina Mohammadikharkeshi, Ram S. Mohan, and Ovadia Shoham. "The Effects of Phase Velocities and Fluid Properties on Liquid Holdup Under Gas-Liquid Stratified Flow." In SPE Western Regional Meeting. Society of Petroleum Engineers, 2018.
[8] Spedding, P. L., and J. J. J. Chen. "Holdup in two phase flow." International journal of multiphase flow 10, no. 3 (1984): 307-339.
[9] Fukano, Tohru, and Akiharu Ousaka. "Air-Water Two-Phase Annular Flow in Near-Horizontal Tubes (Effect of Pipe Inclination on the Fundamental Parameters)." JSME international journal. Ser. 2, Fluids engineering, heat transfer, power, combustion, thermophysical properties 31, no. 3 (1988): 477-485.
[10] Spedding, P. L., K. D. O'Hare, and D. R. Spence. "Prediction of holdup in two phase flow." In Proceedings of the 4th Miami international symposium on multi-phase transport particulate phenomena (condensed papers). 1987.
[11] Hart, J., P. J. Hamersma, and J. M. H. Fortuin. "Correlations predicting frictional pressure drop and liquid holdup during horizontal gas-liquid pipe flow with a small liquid holdup." International Journal of Multiphase Flow 15, no. 6 (1989): 947-964.
[12] Fukano, T., and T. Furukawa. "Prediction of the effects of liquid viscosity on interfacial shear stress and frictional pressure drop in vertical upward gas–liquid annular flow." International journal of multiphase flow 24, no. 4 (1998): 587-603.
[13] Woldesemayat, Melkamu A., and Afshin J. Ghajar. "Comparison of void fraction correlations for different flow patterns in horizontal and upward inclined pipes." International journal of multiphase flow 33, no. 4 (2007): 347-370.
[14] Cioncolini, Andrea, and John R. Thome. "Void fraction prediction in annular two-phase flow." International Journal of Multiphase Flow 43 (2012): 72-84.
[15] Mandhane, J. M., G. A. Gregory, and K. Aziz. "A flow pattern map for gas—liquid flow in horizontal pipes." International Journal of Multiphase Flow 1, no. 4 (1974): 537-553.
[16] Setyawan, Andriyanto, Indarto Indarto, and Deendarlianto Deendarlianto. "Experimental investigation on disturbance wave velocity and frequency in air-water horizontal annular flow." Modern Applied Science 8, no. 4 (2014): 84.
[17] Setyawan, Andriyanto, Deendarlianto, Indarto, and Fredrick Neo. "Experimental investigation on liquid film asymmetry in air-water horizontal annular flow." In AIP Conference Proceedings, vol. 1737, no. 1, p. 040009. AIP Publishing, 2016.
[18] Setyawan, Andriyanto. "Experimental investigations of the circumferential liquid film distribution of air-water annular two-phase flow in a horizontal pipe." Experimental Thermal and Fluid Science 85 (2017): 95-118.
[19] Godbole, Pranav V., Clement C. Tang, and Afshin J. Ghajar. "Comparison of void fraction correlations for different flow patterns in upward vertical two-phase flow." Heat Transfer Engineering 32, no. 10 (2011): 843-860.
[20] Lumban-Gaol, Ardhi, and Peter P. Valkó. "Liquid holdup correlation for conditions affected by partial flow reversal." International Journal of Multiphase Flow 67 (2014): 149-159.
Related Documents