Measurement and Analysis of Weather Phenomena with K-Band Rain Radar Jun-Hyeong Park Dept. of Electrical Engineering KAIST DaeJeon, Republic of Korea [email protected] Ki-Bok Kong Development team Kukdong Telecom Nonsan, Republic of Korea [email protected] Seong-Ook Park Dept. of Electrical Engineering KAIST DaeJeon, Republic of Korea [email protected] Abstract—To overcome blind spots of an ordinary weather radar which scans horizontally at a high altitude, a weather radar which operates vertically, so called an atmospheric profiler, is needed. In this paper, a K-band radar for observing rainfall vertically is introduced, and measurement results of rainfall are shown and discussed. For better performance of the atmospheric profiler, the radar which has high resolution even with low transmitted power is designed. With this radar, a melting layer is detected and some results that show characteristics of the meting layer are measured well. Keywords—K-band; FMCW; rain radar; low transmitted power; high resolution; rainfall; melting layer I. INTRODUCTION A weather radar usually measures meteorological conditions of over a wide area at a high altitude. Because it observes weather phenomena in the area, it is mainly used for weather forecasting. However, blind spots exist because an ordinary weather radar scans horizontally, which results in difficulties in obtaining information on rainfall at higher and lower altitudes than the specific altitude. Therefore, a weather radar that covers the blind spots is required. A weather radar that scans vertically could solve the problem. This kind of weather radar, so called an atmospheric profiler, points towards the sky and observes meteorological conditions according to the height [1]. Also, because the atmospheric profiler usually operates continuously at a fixed position, it could catch the sudden change of weather in the specific area. In this paper, K-band rain radar which has low transmitted power and high resolutions of the range and the velocity is introduced. The frequency modulated continuous wave (FMCW) technique is used to achieve high sensitivity and reduce the cost of the system. In addition, meteorological results are discussed. Reflectivity, a fall speed of raindrops and Doppler spectrum measured when it rained are described, and characteristics of the melting layer are analyzed as well. II. DEVELOPMENT OF K-BAND RAIN RADAR SYSTEM A. Antenna To suppress side-lobe levels and increase an antenna gain, offset dual reflector antennas are used [2]. Also, separation wall exists between the transmitter (Tx) and receiver (Rx) antennas to improve isolation between them. With these methods, leakage power between Tx and Rx could be reduced. Fig. 1 shows manufactured antennas and the separation wall. B. Design of Tranceiver Fig. 2 shows a block diagram of the K-band rain radar. Reference signals for all PLLs in the system and clock signals for every digital chip in baseband are generated by four frequency synthesizers. In the Tx baseband module, a field programmable gate array (FPGA) controls a direct digital synthesizer (DDS) to generate an FMCW signal which decreases with time (down-chirp) and has a center frequency of 670 MHz. The sweep bandwidth is 50 MHz which gives the high range resolution of 3 m. Considering the cost, 2.4 GHz signal used as a reference clock input of the DDS is split and used for a local oscillator (LO). the FMCW signal is transmitted toward raindrops with the power of only 100 mW. Beat frequency which has data of the range and the radial velocity of raindrops is carried by 60 MHz and applied to the input of the Rx baseband module. In the Rx baseband module, quadrature demodulation is performed by a digital down converter (DDC). Thus, detectable range can be doubled than usual. Two Dimensional-Fast Fourier Transform (2D-FFT) is performed by two FPGAs. Because the 2D FFT is performed with 1024 beat signals, the radar can have high resolution of the radial velocity. Finally, data of raindrops are transferred to a PC with local LAN via the an UDP protocol. TABLE I. shows main specification of the system. Fig. 1. Manufactured antenna and separation wall. 2016 URSI Asia-Pacific Radio Science Conference August 21-25, 2016 / Seoul, Korea 1 HERA The Hydrogen Epoch of Reionization Array David R. DeBoer Radio Astronomy Lab University of California Berkeley, CA USA [email protected] Kathryn Rosie SKA-South Africa National Research Foundation Cape Town, South Africa [email protected] Abstract—The Hydrogen Epoch of Reionization Array (HERA) uses the unique properties of the 21 cm line of neutral hydrogen to probe the Epoch of Reionization (EoR) and the preceding Cosmic Dawn. During these epochs, roughly 0.3 to 1 Gyr after the Big Bang, the first stars and black holes heated and reionized the Universe. By directly observing the large scale structure of reionization as it evolves with time, HERA will profoundly impact our understanding of the birth of the first galaxies and black holes, their influence on the intergalactic medium (IGM), and cosmology. Keywords—radio astronomy; interferometry; epoch of reionization; cosmology; astrophysics I. INTRODUCTION Due to the expansion of the Universe, we can identify and measure the early Universe via the redshift of spectral lines. The hydrogen hyperfine transition at a rest frequency of 1420 MHz is a key spectral line due to the ubiquity of hydrogen and, being a “forbidden” transition, the optical depth lets us see through the entire Universe back almost to the period of recombination, the origin of the cosmic microwave background. The bandwidth of observation therefore equates to a volume along the site of the telescope, with the frequency determining the epoch. Figure 1: Frequency of the rest frame 1420 MHz hydrogen line as a function of redshift (bottom axis) and age of the Universe (top axis). The nominal EoR band is shown. The Epoch of Reionization (EoR) is that period when the first luminous objects in the Universe produced enough photons to reionize the intergalactic medium, which had been neutral since the epoch of the cosmic microwave background. The frequency range for these measurements are 100-200 MHz to cover a redshift range of about 6 – 12 (see Figure 1). Initial measurements of the EoR strive to measure a statistical power spectrum of the signal since the nature of the reionization process should have a specific spatial signature. The goal is therefore to measure a range of aggregate spatial scales on the sky, rather than to image the signal directly. Imaging does remain an ultimate goal to fully understand the process, however we will need a greater understanding of its properties to achieve this more difficult goal. Current instruments are on the verge of being able to make a detection, but their sensitivity is limited. The Precision Array Probing the Epoch of Reionization (PAPER; [1]), the Murchison Widefield Array (MWA; [2]), the LOw Frequency ARray(LORAR; [3]), and the Giant Metrewave Radio Telescope (GMRT; [4]) represent the current state of the art, a legacy which HERA (http://reionization.org) intends to extend. This material is based upon work supported by the National Science Foundation Graduate Research Fellowship under Grant No. 1440343. Figure 2: Map of South Africa showing the location of the Karoo Astronomy Reserve (“Site”) and major South African cities (Google Earth). 1426

Welcome message from author
This document is posted to help you gain knowledge. Please leave a comment to let me know what you think about it! Share it to your friends and learn new things together.
Transcript

Measurement and Analysis of Weather Phenomena with K-Band Rain Radar
Jun-Hyeong Park Dept. of Electrical Engineering
KAIST DaeJeon, Republic of Korea
Ki-Bok Kong Development team Kukdong Telecom
Nonsan, Republic of Korea [email protected]
Seong-Ook Park Dept. of Electrical Engineering
KAIST DaeJeon, Republic of Korea
Abstract—To overcome blind spots of an ordinary weather radar which scans horizontally at a high altitude, a weather radar which operates vertically, so called an atmospheric profiler, is needed. In this paper, a K-band radar for observing rainfall vertically is introduced, and measurement results of rainfall are shown and discussed. For better performance of the atmospheric profiler, the radar which has high resolution even with low transmitted power is designed. With this radar, a melting layer is detected and some results that show characteristics of the meting layer are measured well.
Keywords—K-band; FMCW; rain radar; low transmitted power; high resolution; rainfall; melting layer
I. INTRODUCTION A weather radar usually measures meteorological
conditions of over a wide area at a high altitude. Because it observes weather phenomena in the area, it is mainly used for weather forecasting. However, blind spots exist because an ordinary weather radar scans horizontally, which results in difficulties in obtaining information on rainfall at higher and lower altitudes than the specific altitude. Therefore, a weather radar that covers the blind spots is required.
A weather radar that scans vertically could solve the problem. This kind of weather radar, so called an atmospheric profiler, points towards the sky and observes meteorological conditions according to the height [1]. Also, because the atmospheric profiler usually operates continuously at a fixed position, it could catch the sudden change of weather in the specific area.
In this paper, K-band rain radar which has low transmitted power and high resolutions of the range and the velocity is introduced. The frequency modulated continuous wave (FMCW) technique is used to achieve high sensitivity and reduce the cost of the system. In addition, meteorological results are discussed. Reflectivity, a fall speed of raindrops and Doppler spectrum measured when it rained are described, and characteristics of the melting layer are analyzed as well.
II. DEVELOPMENT OF K-BAND RAIN RADAR SYSTEM
A. Antenna To suppress side-lobe levels and increase an antenna gain,
offset dual reflector antennas are used [2]. Also, separation
wall exists between the transmitter (Tx) and receiver (Rx) antennas to improve isolation between them. With these methods, leakage power between Tx and Rx could be reduced. Fig. 1 shows manufactured antennas and the separation wall.
B. Design of Tranceiver Fig. 2 shows a block diagram of the K-band rain radar.
Reference signals for all PLLs in the system and clock signals for every digital chip in baseband are generated by four frequency synthesizers. In the Tx baseband module, a field programmable gate array (FPGA) controls a direct digital synthesizer (DDS) to generate an FMCW signal which decreases with time (down-chirp) and has a center frequency of 670 MHz. The sweep bandwidth is 50 MHz which gives the high range resolution of 3 m. Considering the cost, 2.4 GHz signal used as a reference clock input of the DDS is split and used for a local oscillator (LO). the FMCW signal is transmitted toward raindrops with the power of only 100 mW. Beat frequency which has data of the range and the radial velocity of raindrops is carried by 60 MHz and applied to the input of the Rx baseband module. In the Rx baseband module, quadrature demodulation is performed by a digital down converter (DDC). Thus, detectable range can be doubled than usual. Two Dimensional-Fast Fourier Transform (2D-FFT) is performed by two FPGAs. Because the 2D FFT is performed with 1024 beat signals, the radar can have high resolution of the radial velocity. Finally, data of raindrops are transferred to a PC with local LAN via the an UDP protocol. TABLE I. shows main specification of the system.
Fig. 1. Manufactured antenna and separation wall.
2016 URSI Asia-Pacific Radio Science Conference August 21-25, 2016 / Seoul, Korea
1
HERA The Hydrogen Epoch of Reionization Array
David R. DeBoer Radio Astronomy Lab
University of California Berkeley, CA USA
Kathryn Rosie SKA-South Africa
National Research Foundation Cape Town, South Africa
Abstract—The Hydrogen Epoch of Reionization Array (HERA) uses the unique properties of the 21 cm line of neutral hydrogen to probe the Epoch of Reionization (EoR) and the preceding Cosmic Dawn. During these epochs, roughly 0.3 to 1 Gyr after the Big Bang, the first stars and black holes heated and reionized the Universe. By directly observing the large scale structure of reionization as it evolves with time, HERA will profoundly impact our understanding of the birth of the first galaxies and black holes, their influence on the intergalactic medium (IGM), and cosmology.
Keywords—radio astronomy; interferometry; epoch of reionization; cosmology; astrophysics
I. INTRODUCTION Due to the expansion of the Universe, we can identify and
measure the early Universe via the redshift of spectral lines. The hydrogen hyperfine transition at a rest frequency of 1420 MHz is a key spectral line due to the ubiquity of hydrogen and, being a “forbidden” transition, the optical depth lets us see through the entire Universe back almost to the period of recombination, the origin of the cosmic microwave background. The bandwidth of observation therefore equates to a volume along the site of the telescope, with the frequency determining the epoch.
Figure 1: Frequency of the rest frame 1420 MHz hydrogen line as a function of redshift (bottom axis) and age of the Universe (top axis). The nominal EoR band is shown.
The Epoch of Reionization (EoR) is that period when the first luminous objects in the Universe produced enough photons to reionize the intergalactic medium, which had been neutral since the epoch of the cosmic microwave background. The frequency range for these measurements are 100-200 MHz to cover a redshift range of about 6 – 12 (see Figure 1).
Initial measurements of the EoR strive to measure a statistical power spectrum of the signal since the nature of the reionization process should have a specific spatial signature. The goal is therefore to measure a range of aggregate spatial scales on the sky, rather than to image the signal directly. Imaging does remain an ultimate goal to fully understand the process, however we will need a greater understanding of its properties to achieve this more difficult goal.
Current instruments are on the verge of being able to make a detection, but their sensitivity is limited. The Precision Array Probing the Epoch of Reionization (PAPER; [1]), the Murchison Widefield Array (MWA; [2]), the LOw Frequency ARray(LORAR; [3]), and the Giant Metrewave Radio Telescope (GMRT; [4]) represent the current state of the art, a legacy which HERA (http://reionization.org) intends to extend.
This material is based upon work supported by the National Science Foundation Graduate Research Fellowship under Grant No. 1440343.
Figure 2: Map of South Africa showing the location of the Karoo Astronomy Reserve (“Site”) and major South African cities (Google Earth).
1426
II. OVERVIEW HERA is a collaboration of the following institutions:
Arizona State University (Tempe, AZ USA), Brown University (Providence, RI USA), University of California Berkeley (Berkeley, CA USA), University of California Los Angeles (Los Angeles, CA USA), University of Cambridge (Cambridge, UK), Massachusetts Institute of Technology (Cambridge, MA USA), National Radio Astronomy Observatory (Charlottesville, VA USA), University of Pennsylvania (Philadelphia, PA USA), Scuola Normale Superiore di Pisa (Pisa, Italy),SKA-South Africa (Cape Town, South Africa), andUniversity of Washington (Seattle, WA USA). Harvard University (Cambridge, MA USA), University of KwaZulu Natal (Durban, South Africa), University of Western Cape (Cape Town, South Africa), Imperial College London (London, UK) and California State Polytechnic University (Pomona, CA USA).
HERA is a focussed experiment, not a general-use facility,
which allows the system design to be optimized for detecting and characterizing the Epoch of Reionization. It is under construction in at the Karoo Astronomy Reserve in Northern Cape, South Africa, located approximately 500 km northeast of Cape Town (Fig. 2).
Currently 19 14-m antennas in a close-packed hexagonal configuration are in use (Fig. 3) and construction has commenced on an additional 18 to be used later in 2016. The goal is to build 350 elements to be completed in 2019. This will comprise 320 in a close-packed ~300m hexagonal core and 30 outriggers in concentric circles with a maximum baseline of about 800m.
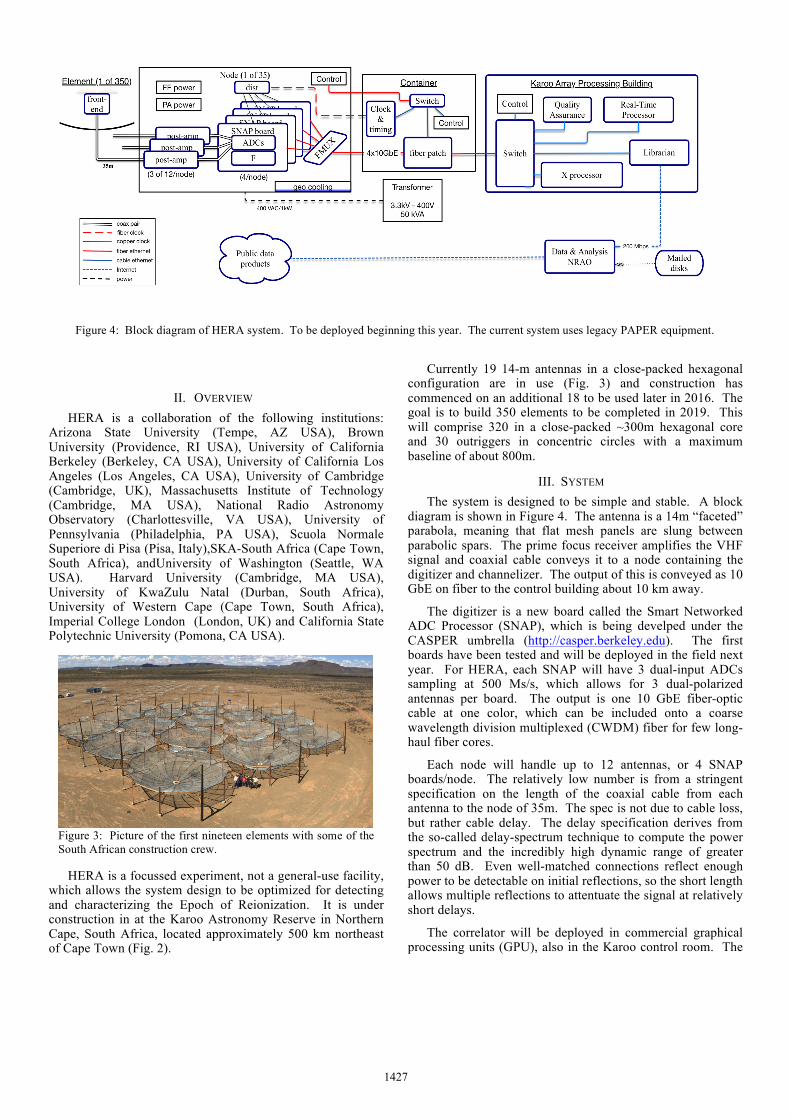
III. SYSTEM The system is designed to be simple and stable. A block
diagram is shown in Figure 4. The antenna is a 14m “faceted” parabola, meaning that flat mesh panels are slung between parabolic spars. The prime focus receiver amplifies the VHF signal and coaxial cable conveys it to a node containing the digitizer and channelizer. The output of this is conveyed as 10 GbE on fiber to the control building about 10 km away.
The digitizer is a new board called the Smart Networked ADC Processor (SNAP), which is being develped under the CASPER umbrella (http://casper.berkeley.edu). The first boards have been tested and will be deployed in the field next year. For HERA, each SNAP will have 3 dual-input ADCs sampling at 500 Ms/s, which allows for 3 dual-polarized antennas per board. The output is one 10 GbE fiber-optic cable at one color, which can be included onto a coarse wavelength division multiplexed (CWDM) fiber for few long-haul fiber cores.
Each node will handle up to 12 antennas, or 4 SNAP boards/node. The relatively low number is from a stringent specification on the length of the coaxial cable from each antenna to the node of 35m. The spec is not due to cable loss, but rather cable delay. The delay specification derives from the so-called delay-spectrum technique to compute the power spectrum and the incredibly high dynamic range of greater than 50 dB. Even well-matched connections reflect enough power to be detectable on initial reflections, so the short length allows multiple reflections to attentuate the signal at relatively short delays.
The correlator will be deployed in commercial graphical processing units (GPU), also in the Karoo control room. The
Figure 3: Picture of the first nineteen elements with some of the South African construction crew.
Figure 4: Block diagram of HERA system. To be deployed beginning this year. The current system uses legacy PAPER equipment.
1427

data will then undergo additional processing in a CPU cluster, and finally compressed and sent back to the US for analysis and archiving.
IV. STATUS AND SCHEDULE As mentioned above, 19 elements are currently in
operation on the site, primarily for commissioning to test the new HERA element, which is used with the well-characterized PAPER signal path. Beginning late 2016, scientific observing with 37 elements is expected to commence, with sensitivity that begins to have a reasonable chance at detecting the EoR, if it does not happen prior. Fig. 5 shows the planned rollout of future elements.
Figure 5: Expected rollout of HERA elements and observing.
References
[1] Ali, Z. S., A. R. Parsons, H. Zheng, J. C. Pober, A. Liu, J. E. Aguirre, R. F. Bradley, G. Bernardi, C. L. Carilli, C. Cheng, D. R. DeBoer, M. R. Dexter, J. Grobbelaar, J. Horrell, D. C. Jacobs, P. Klima, D. H. E. MacMahon, M. Maree, D. F. Moore, N. Razavi, I. I. Stefan, W. P. Walbrugh, and A. Walker, 2015: PAPER-64 Constraints on Reionization: The 21 cm Power Spectrum at z = 8.4. ApJ, 809, 61.
[2] Tingay, S. J., R. Goeke, J. D. Bowman, D. Emrich, S. M. Ord, D. A. Mitchell, M. F. Morales, T. Booler, B. Crosse, R. B. Wayth, C. J. Lonsdale, S. Tremblay, D. Pallot, T. Colegate, A. Wicenec, N. Kudryavtseva, W. Arcus, D. Barnes, G. Bernardi, F. Briggs, S. Burns, J. D. Bunton, R. J. Cappallo, B. E. Corey, A. Deshpande, L. Desouza, B. M. Gaensler, L. J. Greenhill, P. J. Hall, B. J. Hazelton, D. Herne, J. N. Hewitt, M. Johnston-Hollitt, D. L. Kaplan, J. C. Kasper, B. B. Kincaid, R. Koenig, E. Kratzenberg, M.
J. Lynch, B. Mckinley, S. R. Mcwhirter, E. Morgan, D. Oberoi, J. Pathikulangara, T. Prabu, R. A. Remillard, A. E. E. Rogers, A. Roshi, J. E. Salah, R. J. Sault, N. Udaya-Shankar, F. Schlagenhaufer, K. S. Srivani, J. Stevens, R. Subrahmanyan, M. Waterson, R. L. Webster, A. R. Whitney, A. Williams, C. L. Williams, and J. S. B. Wyithe, 2013: The Murchison Widefield Array: The Square Kilometre Array Precursor at Low Radio Frequencies. PASA, 30, 7
[3] van Haarlem, M. P., M. W. Wise, A. W. Gunst, G. Heald, J. P. McKean, J. W. T. Hessels, A. G. de Bruyn, R. Nijboer, J. Swinbank, R. Fallows, M. Brentjens, A. Nelles, R. Beck, H. Falcke, R. Fender, J. H ̈orandel, L. V. E. Koopmans, G. Mann, G. Miley, H. R ̈ottgering, B. W. Stappers, R. A. M. J. Wijers, S. Zaroubi, M. van den Akker, A. Alexov, J. Anderson, K. Anderson, A. van Ardenne, M. Arts, A. Asgekar, I. M. Avruch, F. Batejat, L. B ̈ahren, M. E. Bell, M. R. Bell, I. van Bemmel, P. Bennema, M. J. Bentum, G. Bernardi, P. Best, L. Bˆırzan, A. Bonafede, A.-J. Boonstra, R. Braun, J. Bregman, F. Breitling, R. H. van de Brink, J. Broderick, P. C. Broekema, W. N. Brouw, M. Bru ̈ggen, H. R. Butcher, W. van Cappellen, B. Ciardi, T. Coenen, J. Conway, A. Coolen, A. Corstanje, S. Damstra, O. Davies, A. T. Deller, R.-J. Dettmar, G. van Diepen, K. Dijkstra, P. Donker, A. Doorduin, J. Dromer, M. Drost, A. van Duin, J. Eisl ̈offel, J. van Enst, C. Ferrari, W. Frieswijk, H. Gankema, M. A. Garrett, and et al, 2013: LOFAR: The LOw-Frequency ARray. A&A, 556, A2
[4] Paciga, G., J. G. Albert, K. Bandura, T.-C. Chang, Y. Gupta, C. Hirata, J. Odegova, U.-L. Pen, J. B. Peterson, J. Roy, J. R. Shaw, K. Sigurdson, and T. Voytek, 2013: A simulation-calibrated limit on the H I power spectrum from the GMRT Epoch of Reionization experiment. MNRAS
.
.
1428
Related Documents


