LBL-28147 Vol. II UC-350 i_-_ ............... I n l nn " '"|'"' '""" " I IllFIU I ii I Inl Lawrence Berkeley Laboratory UNIVERSITY F CALIFORNIA I II iii i i l II I APPLI ED SCI ENCE DIVISION Measured Energy Savings and Economics of Retrofitting Existing Single-Family Homes: An Update of the BECA-B Database S.D. Cohen, C.A. Goldman, and J.P. Harris Fe bruary 1991 i iii III I APPLIED SCIENCE \\ DIVISION Prepared fortheU.S. Department of Energy under Contract Number DE-AC03-76SF00098 , ,

Welcome message from author
This document is posted to help you gain knowledge. Please leave a comment to let me know what you think about it! Share it to your friends and learn new things together.
Transcript
LBL-28147 Vol. IIUC-350
i_-_ ............... I n l nn " '"|'"' '""" " I IllFIU I ii I Inl
Lawrence Berkeley LaboratoryUNIVERSITY F CALIFORNIAI II iii i i l II I
APPLI ED SCI ENCEDIVISION
Measured Energy Savings and Economics of Retrofitting ExistingSingle-Family Homes: An Update of the BECA-B Database
S.D. Cohen, C.A. Goldman, and J.P. Harris
Fe bruary 1991
i iii III I
APPLIED SCIENCE
\\ DIVISION
Prepared for the U.S. Department of Energy under Contract Number DE-AC03-76SF00098
, ,
DISCLAIMER
This document wus prepared as an account of work sponsored by theUnited States Government. Neither the United States Government
nor any agency thereof, nor "['heRegents of the University of Califor-nia, nor any of their employees, makes any warranty, express or im-plied, or assumes any legal liability or responsibility for the accuracy,completeness, or usefulness of any informaLion, apparatus, product,or process dLsclosed, or represents that its use would not infringe pri-vately owned rights. Reference herein to any specific commercialproduct, process, or service by its trade name, trademark, manufac-turer, or otherwise, does not necessarily constitute or imply its en-dorsement, recommendation, or favoring by the United States Gov-ernment or any agency thereof, or The Regents of the University ofCalifornia. The views and opinions of authors expressed herein donot necessarily state or reflect those of the United States Governmentor any agency thereof or The Regents of the University of Californiaand shall not be used for advertising or product endorsement pur-poses.
This report has been reproduced directlyfrom the best available copy.
Available to DOE and DOE Contractors
from the Office of Scientific and Technical Information
I7.O. Box 62, Oak Ridge, TN 37831Prices available from (615) 576-8401, FTS 626-8401
Available to the public from theNational Technical Information Service
U.S. Department of Commerce
5285 Port Royal Road, Springfield, VA 22161,6
Lawrence Berkeley Laboratory is an equal opportunity employer.
LBL--28147-Vol. 2
DE92 0006 90
MEASURED ENERGY SAVINGS AND ECONOMICS
OF RETROFITTING EXISTING SINGLE-FAMILY HOMES:
AN UPDATE OF THE BECA-B DATABASE
Volume II
S. D. Cohen, C. A. Goldman, J. P. Harris
Applied Science Division
Energy Analysis Program
Lawrence Berkeley Laboratory
One Cyclotron Road
Berkeley, Califorv,:a 94720
February 1991
The work described in this report was funded by the Assistant Secretary for Conservation and Renewable Energy,Office of Building Technologies of the U.S. Department of Energy under Contract No. DE-AC03-76SF(X)098.
MASTER....... ' ...... __"'!,-!_,/I!TED_,_ "
TABLE OF CONTENTS
Volume I Page
Executive Summary ................................................................................................. 1
1. Introduction .......................................................................................................... 7
2. Data Sources and Quality .................................................................................... 9
• 3. Methodology ........................................................................................................ 10
4. Individual Retrofit Measures and Strategies" Savings and Costs ........................ 14
5. DOE Weatherization Assistance Program: National and State Evaluations ....... 26
6. Utility Weatherization Programs ......................................................................... 53
7. Predicted vs. Actual Savings ............................................................................... 67
8. Savings Potential in the Existing Building Stock ................................................ 72
9. References ............................................................................................................ 75
10. Acknowledgements ............................................................................................ 82
Volume II
Appendix A - Summary Data Tables ....................................................................... A-1
Appendix B - Summary of Single-Family Retrofit Projects .................................... B-1
Appendix C - Estimating End Use Breakdowns ...................................................... C-1
Appendix D - Material, Labor, and Administrative Costs for
Low-Income Weatherization Programs ............................................ D-1
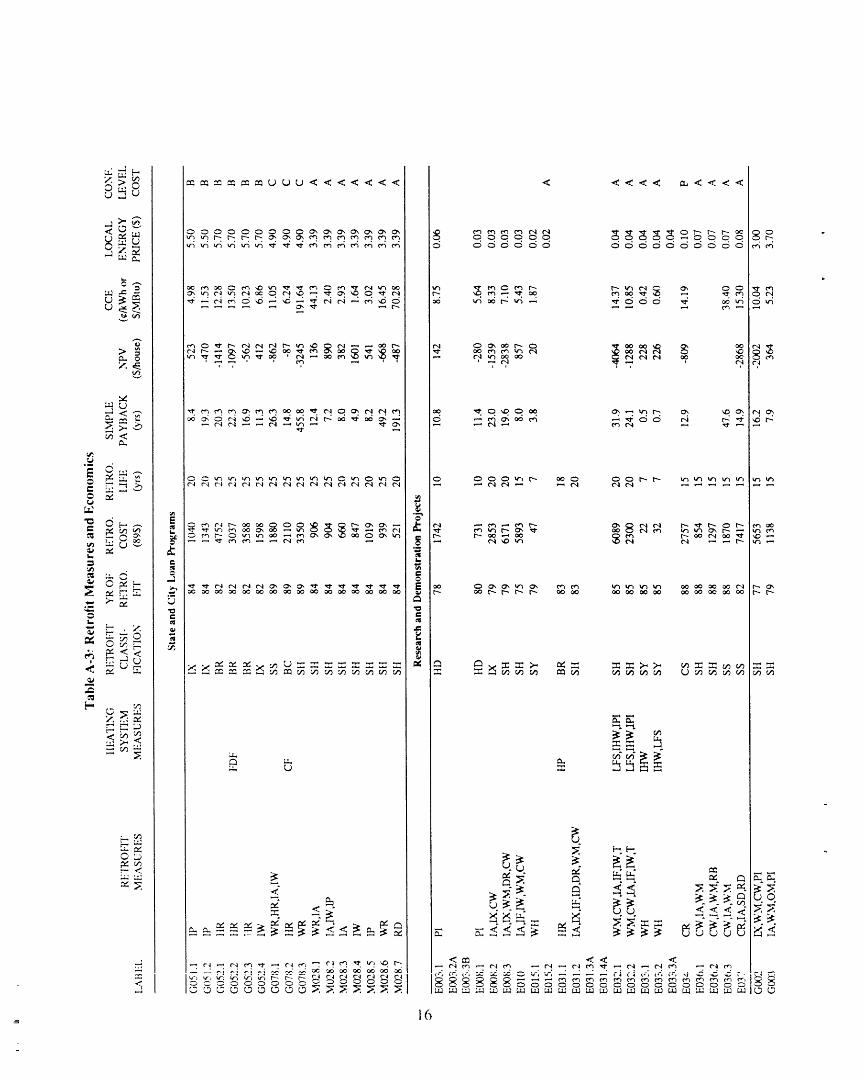
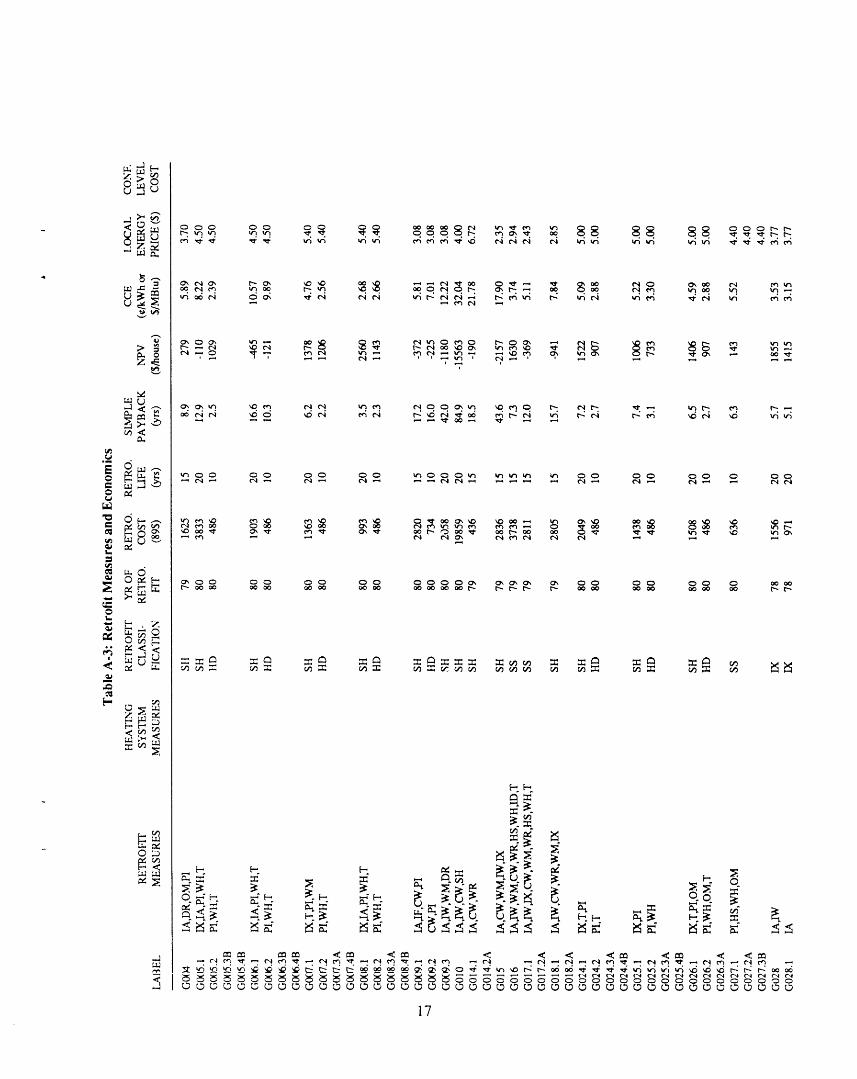
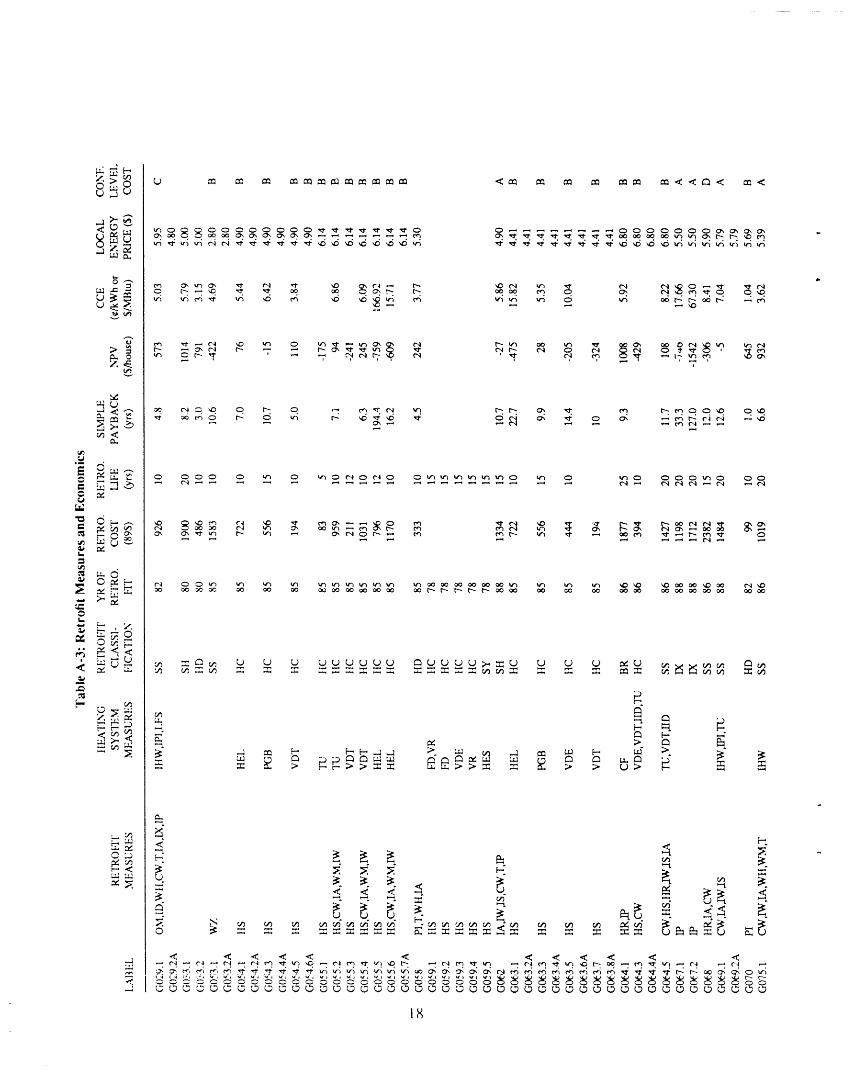
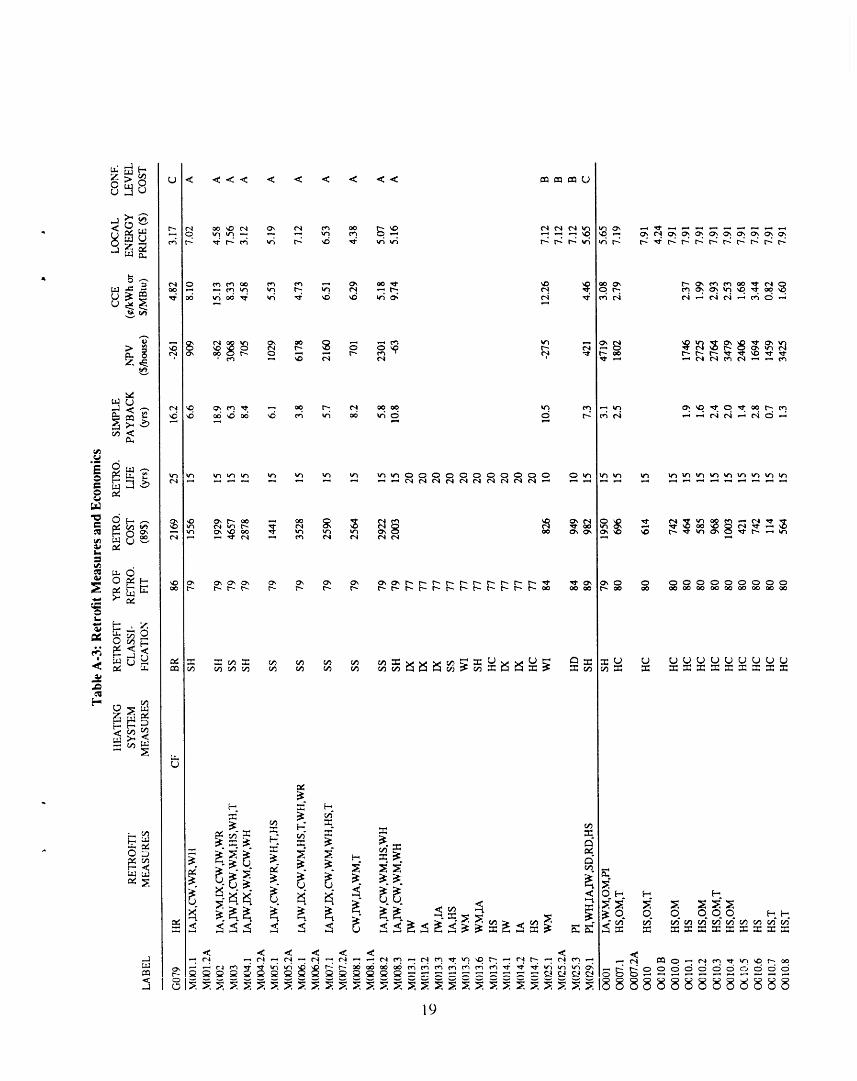
APPENDIX A: SINGLE-FAMILY RETROFIT DATA BASE
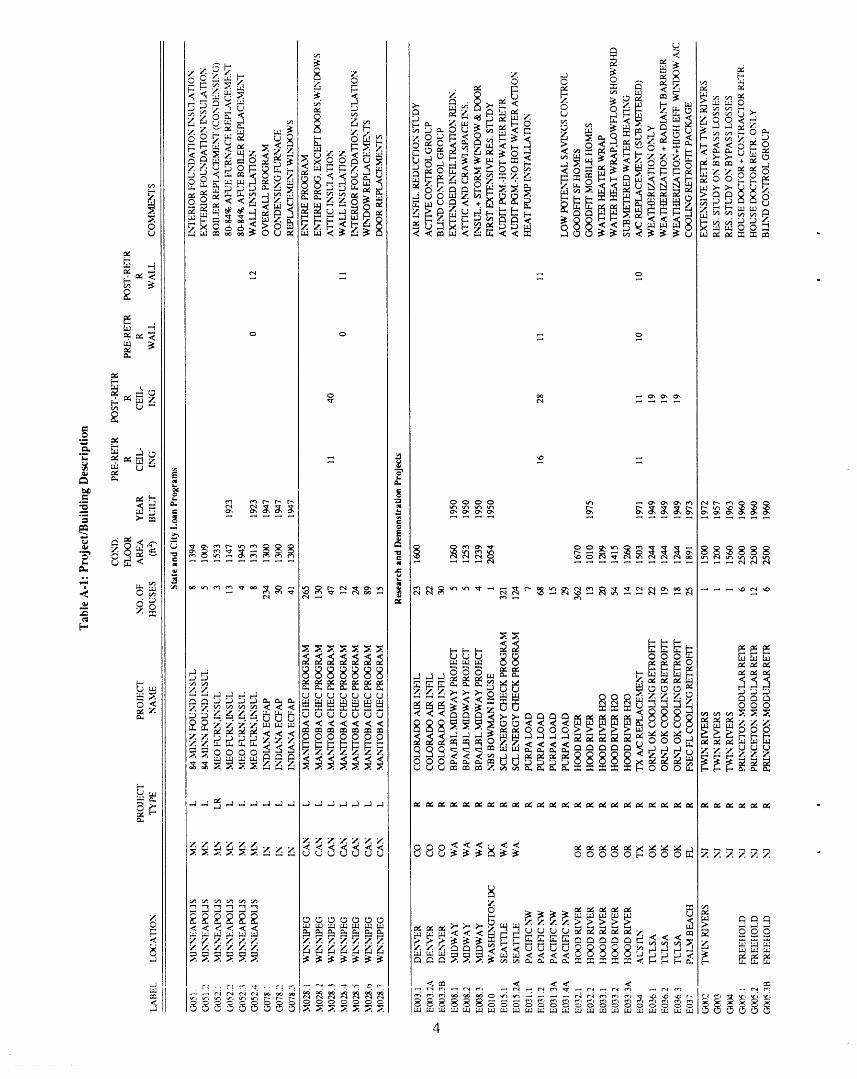
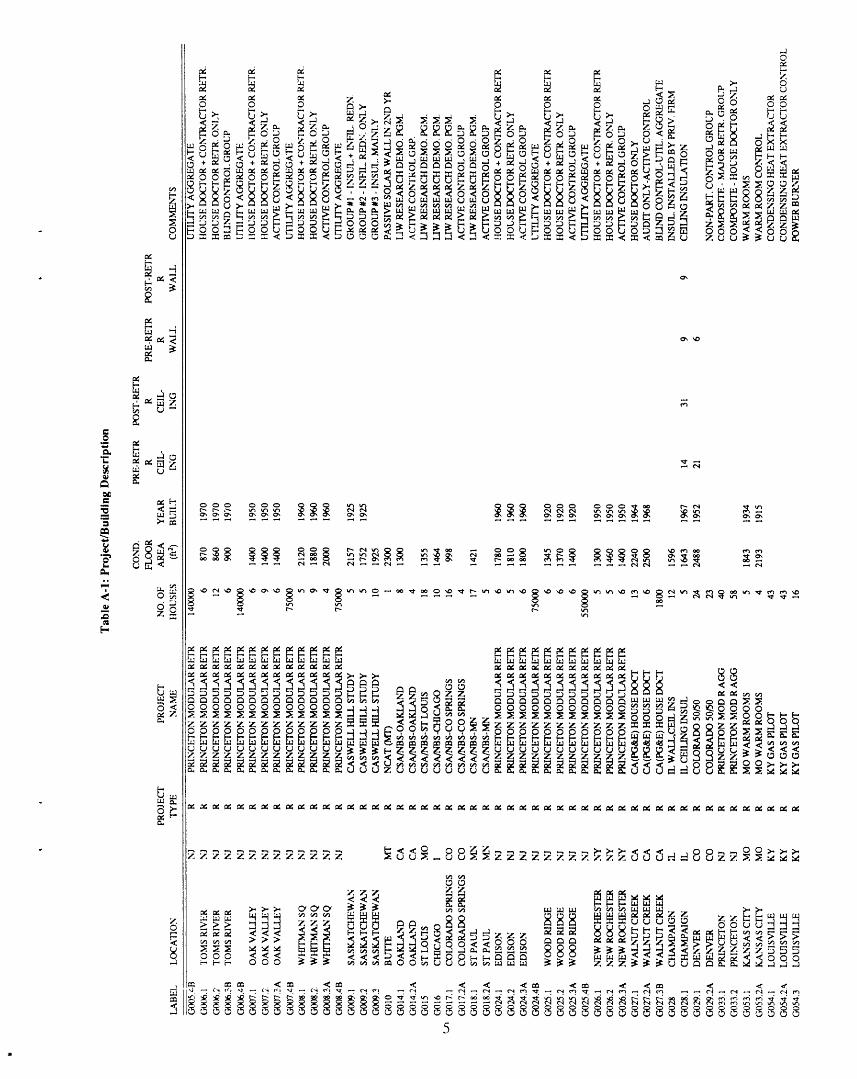
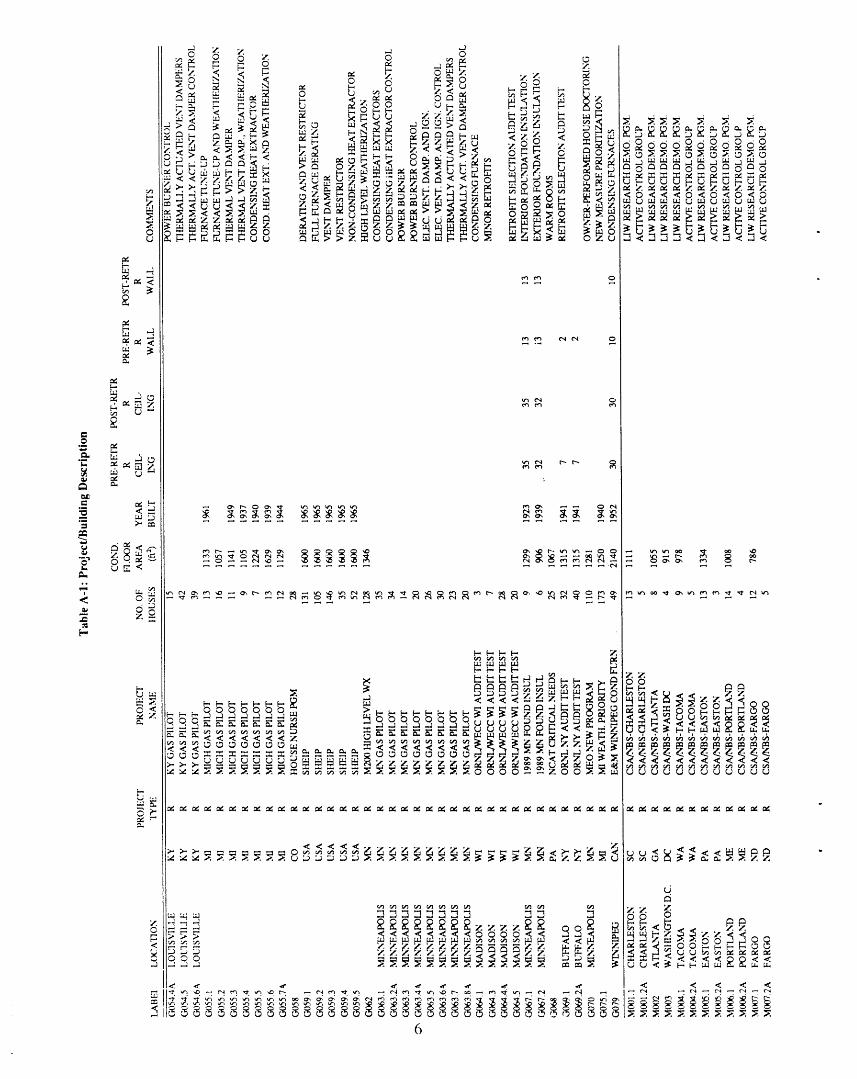
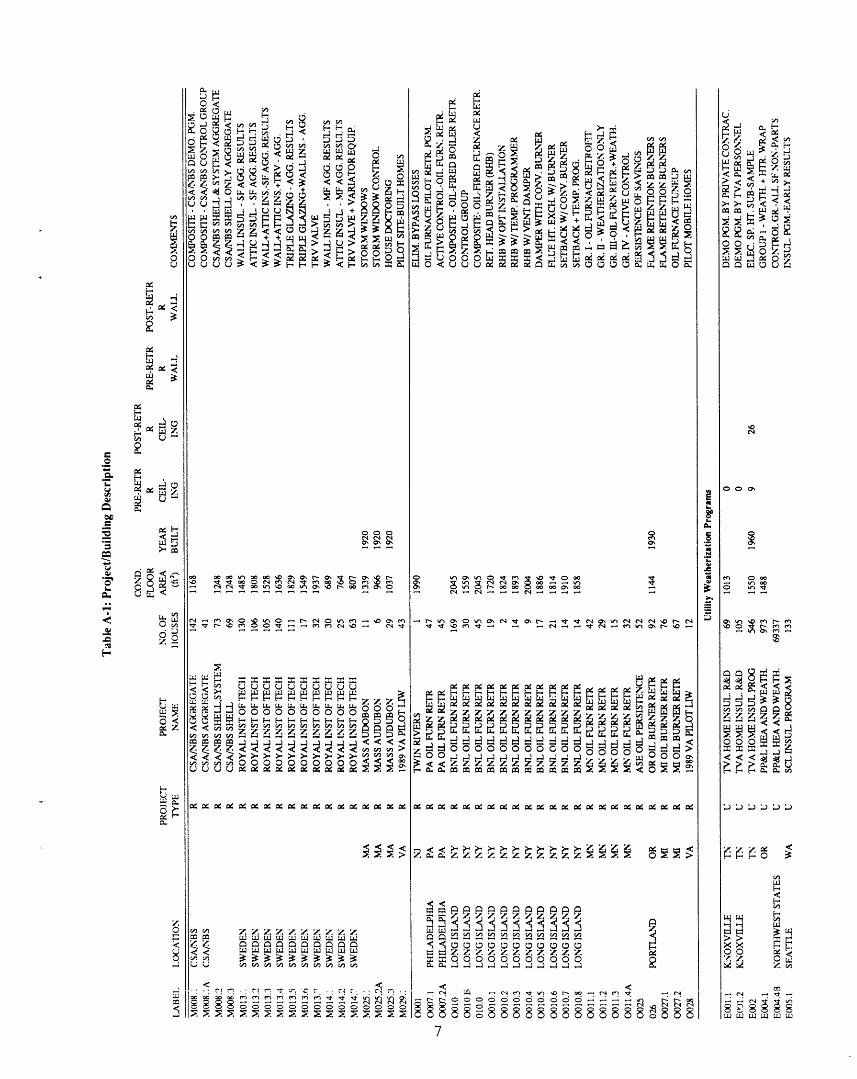
The following tables include data on physical characteristics, energy consumption and savings, and retrofitmeasures installed and their costs for each retrofit project. Each retrofit is uniquely identified by a label. The abbre-viations are used in the tables are explained below. Data is sorted by project type (state or city loan program [L],research study or demonstration program [R], utility weatherization IU], and low income weatherization [W]) andthen by label. The numbers in these tables typically represent average values for groups of houses.
. TABLE A-I:
Label: The first letter in each label stands for the fuel used for the end-use affected
by the retrofit. E = Electricity, G = Natural Gas, M = Mixed, O = Oil.
Project Type: L = State or City Loan Program, R = Research Study or Demonstration Pro-gram, U = Utility Conservation Program, W = Low Income WeatherizationProgram.
Floor Area: Average conditioned floor area per house, in ft2.
Pre-Retrofit R Ceiling: Pre-retrofit R-value (in ft2-°F-hour/Btu) of ceiling or attic insulation (exclud-ing structural components).
Post-Retrofit R Ceiling: Post-retrofit R-value (in ft2-°F-hour/Btu) of ceiling or attic insulation(excluding structural components).
Pre-Retrofit R Wall: Pre-retrofit R-value (in ftX-°F-hour/Btu) of wall insulation (excluding struc-tural components).
Post-Retrofit R Wall: Post-retrofit R-value (in ft2-°F-hour/Btu) of wall insulation (excluding struc-tural components).
TABLE A-2 :
End Uses: End uses included in consumption data: C = Cooling (HVAC System), D =Domestic hot water, F = Ali end uses of space heat fuel, tt = Space heat, W= Space heat and hot water.
Energy Use Data: Annual average electricity use per house is reported in kWh, av0_rage con-sumption for fuel-heat projects is expressed in MBtu (1 MBtu=10 Btu). Oilconverted to MBtus using the following conversion factor: Oil = 0.139
" MBtu/gallon.
NAC: Weather-normalized annual consumption, for end uses coded as C, D, F, tt,J,
and W.
Space Heat: Weather-normalized space heat consumption, for end uses coded as tl, or
weather-dependent portion of consumption estimated in PRISM analysis.
Heating Factor: Estimated space heating intensity in Btu/ft2-HDD.
Analysis Method: E = Regression of submetered end-use data (e.g., space heat), F = Regres-sion with fixed reference temperature (usually 65°F), O = Calculation basedon measured steady state efficiency (SSE) improvements of HVAC equip-ment (often done for oil furnaces), R = Regression (PRISM) with variable
reference temperature, S = Scaling of space heat data by annual or monthlyHDD.
Confidence Level Energy: A = Submetered energy data, B+ = PRISM analysis (variable reference tem-perature), B = Regression analysis of energy data with fixed reference tem-perature or accurate baseload determination from summer months' bills, C =Annual consumption data that is weather-corrected by scaling space-heatfraction by ratio of actual to normal HDD, D = Energy data only availablefor small part of heating season.
Prediction Method: Description or complexity of audit prediction method: IlOUR = Buildingenergy simulation program that computes building loads each hour, MONTH= Building energy simulation program that computes building loads eachhour, MtlDD = Modified base degree-day engineering calculation, VIIDD =
Variable base degree-day engineering calculation (using measured referencetemperature), EST- Estimate based on previous results for similar buildings.
HDD: Long-term average heating degree-days for that location (base 65°F).
Heat System Type: B = central steam or hydronic boiler, E = Individual resistance electric heat-ing unit installed in wall,floor, or baseboards, F = Central warm air furnace(forced and gravity; can be gas or electric).
Hot Water Fuel: E = Electricity, G = Gas, M = Mixed, O = Oil.
TABLE A-3 :
Retrofit Measures: CR = Cooling system replacement, CS = Cooling system retrofit, CW =Caulk + weatherstrip, DR = Storm doors, tlR= Heating system replacement,ttS= Heating system retr., lA = Ceiling/attic insulation, ID = Duct insula-tion, IF = Subfloor insulation, lP = Foundation insulation (perimeter), IS =
Sill box insulation, IW = Wall insulation, OM = Operations &maintenance, P1 = Pressurization, infii, reduction ('House-Doctor'), RB =
Radiant bamers, RD = Replace Ducts SD = Sealing ducts SK = MobileHome Skirting T = Clock thermostat, WIt = Water-heating retr., WM = Win-dow management (storm windows, exterior blinds or shutters), WR =
Replace windows, WZ = Warm room zoning.
Heat System Measures: This field provides a more detailed list of heating system retrofit options: CF= Install New Condensing Furnace, FD = Full furnace derating, FDF =Install New Forced Draft Furnace, HES = Non-condensing heat extractor,
HEL = Condensing heat extractor, tlP = Install New Heat Pump, ltlW =Insulating water heater blanket, HD = Intermittent ignition device, IPl =Insulation on hot water pipes, LFS = Low-flow showerhead, PGB = PowerGas Burner (forced or induced draft), RIIB = Flame retention head burner,TU = Furnace tune-up, VDE = Electronic vent dampers, VDT = Thermalvent dampers, VR = Vent restrictor.
Retrofit Classification: LBL classification of major retrofit strategy used in each project. BC =Boiler/Furnace replacement and controls, BR = Boiler/furnace replacement,CI = Ceiling insulation and infiltration-reduction package, CB = Ceilinginsulation and foundation insulation package, HC = Heating controls (andrelatively low-cost heating system retrofits), HD = House-doctoring, IX =Insulation in various areas (e.g., wall, attic, foundation), SH = Shell pack-
ages (e.g., insulation, windows, caulking), SS = Shell & system packages, SY= Heating and hot water system packages, WI = Window replacement ormodification, CS = Cooling system modifications, CR = Cooling systemreplacement,
Simple Payback Time: The period required for the undiscounted cumulative value of future energysavings (based on the energy price at the time of the retrofit) to equal the ini-tial cost of the measure in question.
Net Present Value: The difference between the present value of the benefits resulting from aretrofit's lifetime energy savings and the present value of the lifetime costsof the retrofit. A retrofit is cost-effective if it has a positive NPV. To calcu-late the NPV we used a 7% real discount rate, economic lifetimes for meas-
ures shown in Table C-I, and fuel price escalation rates of 0.001 for electri-city and 0.028 for gas and oil (EIA Annual Energy Outlook, 1989).
Cost of Conserved Energy: The ratio of the annualized investment in a retrofit to the annual energy sav-ings caused by it. An efficient investment is one whose CCE is less than thecost of fuel.
Confidence Level Cost: A = Well-documented cost data, cost breakdown for individual measures, B= Documented cost data, contractor cost of retrofit, estimated O&M costs, C
= Adequate cost data, aggregate cost data for group of buildings or buildingsthat have only materials cost plus labor hours, F = No retrofit cost data.
10
11
_ 12
13
°
= .<
_ oooooooo o oooooooo o o __ ___
• •
]4
15
Appendix B
Summary of Retrofit Projects in the BECA-B
(Existing Single Family Residential Building) Data Base
Appendix B contains a brief description of each retrofit project in the data base. Program summaries are
• arranged in order of tile project label. The label consists of a letter that indicates the fuel used for space heating(e.g., g_s (G), oil (0), mixed (M), and electricity (E)) and a number unique to that project. Each summary includesa description of the retrofit measures that were installed, a discussion of energy savings and cost-effectiveness, andnotes key adjustments to the data. Retrofit costs in this appendix are given in nominal dollars.
23
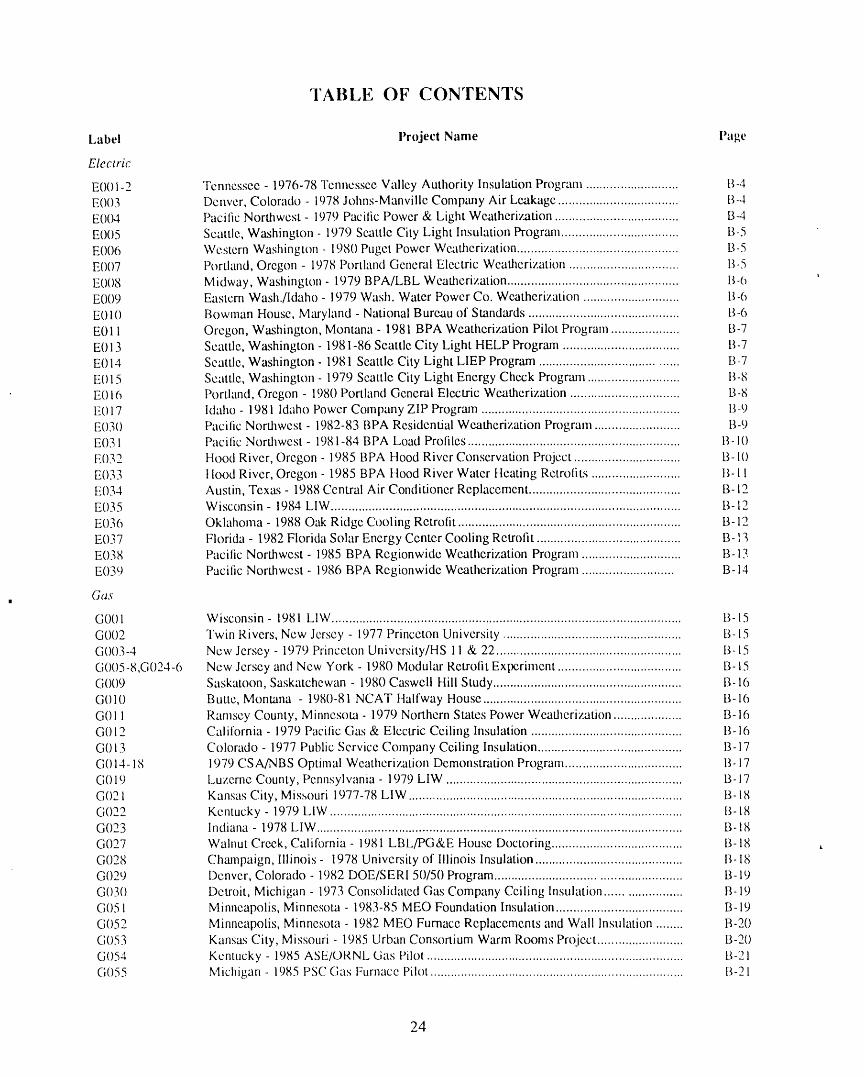
TABLE OF CONTENTS
Label l'roject Name l'age
Electric
E0()I-2 Tennessee - 1976-78 Tennessee Valley Authority Insulation Program ........................... 1_-4E003 Denver, Colorado - 1978 Johns-Manville Company Air Leakage ................................... i_,4E004 Pacific Northwest - 1979 Pacific Power & Light Weatherization .................................... B4E(.)05 Seattle, Washington - 1979 Seattle City Light Insulation Progrmu .................................. B-5E006 Western Washington - 1980 Puget Power Weatherization ............................................... B-5
E007 Portland, Oregon - 1978 Portland General Electric Weatherization ................................ I_-5E0()8 Midway, Wash ing ton - 1979 BPA/LB L Weatherization .................................................. I?,-6E009 Eastern Wash./Idaho - 1979 Wash. Water Power Co. Weatherization ............................ I?,-6
E010 Bowman House, Maryland - National Bureau of Standards ............................................ 13-6E011 Oregon, Washington, Montana - 1981 BPA Weatherization Pilot Program .................... B-7E013 Seattle, Washington - 1981-86 Seattle City Light HELP Program .................................. B-7E014 Seattle, Washington - 1981 Seattle City Light LIEP Program ........................................ 13-7E()I 5 Seattle, Washington - 1979 Seattle City Light Energy Check Program ........................... I?,-8E016 Portland, Oregon - 1980 Portland General Electric Weatherization ................................ B-8E017 Idaho - 1981 Idaho Power Company ZIP Program .......................................................... 17,-9E030 Pacific Northwest - 1982-83 BPA Residential Weatherization Program ......................... B-9E031 Pacific Northwest - 1981-84 BPA Load Profiles .............................................................. I_;- 10
E()32 Hood River, Oregon - 1985 BPA Hood River Conservation Project ............................... B-10E()33 Hood River, Oregon - 1985 BPA Hood River Water Heating Retrofits .......................... I_-11E034 Austin, Texas - 1988 Central Air Conditioner Replacement ............................................ B-12E035 Wisconsin - 1984 LIW ...................................................................................................... B-12
E036 Oklahoma- 1988 Oak Ridge Cooling Retrofit ................................................................. B-12E037 Florida - 1982 Florida Solar Energy Center Cooling Retrofit .......................................... B-Ii_E038 Pacilic Northwest - 1985 BPA Regionwide Weatherization Program ............................. B- 17E039 Pacific Northwest - 1986 BPA Regionwide Weatherization Program ........................... B- 14
G_IS
G001 Wisconsin - 1981 LIW ...................................................................................................... B-15
G002 Twin Rivers, New Jersey - 1977 Princeton University .................................................... B-15
G003-4 New Jersey - 1979 Princeton University/HS 11 & 22 ...................................................... I:',-15G005-8,G024-6 New Jersey and New York - 1980 Modular Retrolit Exlx:riment .................................... B-15G0()9 Saskatoon, Saskatchewan - 1980 Caswell Hill Study ....................................................... B-16G(.)10 Butte, Montana - 1980-81 NCAT Halfway House .......................................................... B- 16G011 Ramsey County, Minnesota - 1979 Northern States Power Weatherization .................... B-16G012 California - 1979 Pz_citicGas & Electric Ceiling Insulation ............................................ B-16G013 Colorado - 1977 Public Service Company Ceiling Insulation .......................................... I3-17G014-18 1979 CS A/NBS Optimal Weatherization Demonstration Program .................................. B- 17(;019 Luzerne County, Pennsylvania - 1979 LIW ..................................................................... B- 17
G021 Kansas City, Missouri 1977-78 LIW ................................................................................ B-lHG022 Kentucky - 1979 LIW ....................................................................................................... I?,-18G023 Indiana - 1978 LIW ........................................................................................................... B-IX
G027 Walnut Creek, California- 1981 LBL/F'G&E House Doctoring ...................................... B-18 ,G028 Champaign, Illinois- 1978 University of Illinois Insulation ........................................... I?,-18G029 Denver, Colorado - 1982 DOE/SERI 50/50 Program ....................................................... B-19
G03() Detroit, Michigan - 1973 Consolidated Gas Company Ceiling Insulation ...................... B-19G051 Minneapolis, Minnesota - 1983-85 MEO Foundation Insulation ..................................... B- 19G()52 Minneapolis, Minnesota- 1982 MEO Furnace Replacements and Wall Insulati_)n ........ B-20G053 Kansas City, Missouri - 1985 Urban Consortium Warm R_×)ms Project ......................... B-2()G054 Kentucky - 1985 ASE/OIa,,NL Gas l'ilc)t ........................................................................... B-21G()55 Michigan - 1985 PS(" Gas Furnace Pilot .......................................................................... B-21
24
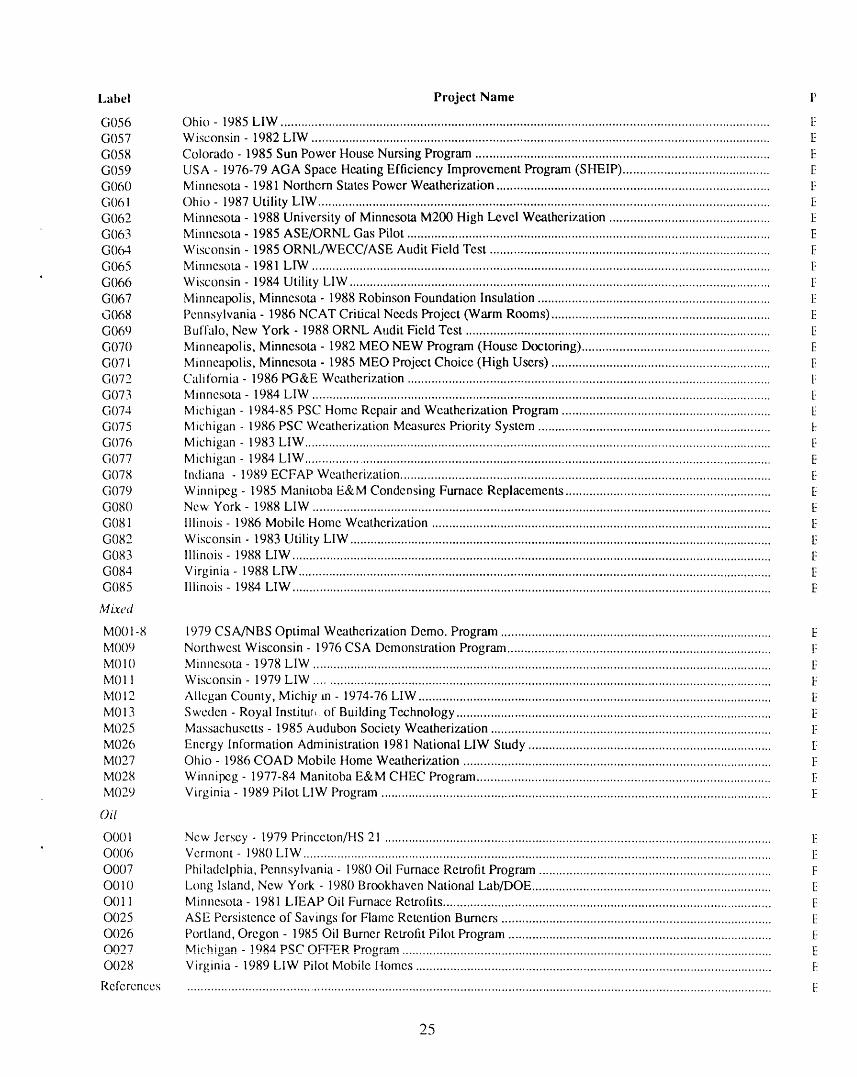
Label Project Name !'
G056 Ohio - 1985 LIW ............................................................................................................................................... 15G057 Wisconsin - 1982 LIW ...................................................................................................................................... t5G058 Colorado - 1985 Sun Power House Nursing Program ...................................................................................... E
G059 USA - 1976-79 AGA Space Heating Efficiency Improvement Program (SHEIP) ........................................... 15G060 Minnesota - 1981 Northern States Power Weatherization ................................................................................ 15
G061 Ohio - 1987 Utility LIW .................................................................................................................................... I5G062 Minnesota - 1988 University of Minnesota M200 High Level Weatherization ............................................... EG063 Minnesota - 1985 ASE/ORNL Gas Pilot .......................................................................................................... I_G064 Wisconsin - 1985 ORNL/WECC/ASE Audit Field Test .................................................................................. EG065 Minnesota- 1981 LIW ...................................................................................................................................... l!
' G066 Wisconsin - 1984 Utility LIW ........................................................................................................................... 15
G067 Minneapolis, Minnesota - 1988 Robinson Foundation Insulation .................................................................... 15G068 Pennsylvania - 1986 NCAT Critical Needs Project (Warm Rooms) ................................................................ t5G069 Buffalo, New York - 1988 ORNL Audit Field Test ......................................................................................... 15
G070 Minneapolis, Minnesota - 1982 MEO NEW Program (House Doctoring) ....................................................... I_G071 Minneapolis, Minnesota - 1985 MEO Project Choice (High Users) ................................................................ 15G072 California - 1986 PG&E Weatherization .......................................................................................................... 15G073 Minnesota- 1984 LIW ...................................................................................................................................... 15
G074 Michigan - 1984-85 PSC Home Repair and Weatherization Program ............................................................. 15G075 Michigan - 1986 PSC Weatherization Measures Priority System .................................................................... 15G076 Michigan - 1983 LIW ........................................................................................................................................ 15G077 Michigan - 1984 LIW ........................................................................................................................................ 15G078 Indiana - 1989 ECFAP Weatherization ............................................................................................................ 15
G079 Winnipeg - 1985 Manitoba E&M Condensing Furnace Replacements ............................................................ [5G080 New York- 1988 LIW ...................................................................................................................................... t5G081 Illinois - 1986 Mobile Home Weatherization ................................................................................................... 15
G082 Wisconsin - 1983 Utility LIW ........................................................................................................................... 15G083 Illinois - 1988 LIW ............................................................................................................................................ 15
G084 Virginia - 1988 LIW .......................................................................................................................................... 15G085 Illinois - 1984 LIW ............................................................................................................................................ E
ML_ed
M001-8 1979 CSA/NBS Optimal Weatherization Demo. Program ............................................................................... 15
MOC)9 Northwest Wisconsin - 1976 CSA Demonstration Program ............................................................................. 15M010 Minnesota - 1978 LIW ...................................................................................................................................... 15M011 Wisconsin - 1979 LIW ..................................................................................................................................... 15
M012 Allcgan County, Michi_:,m - 1974-76 LIW ....................................................................................................... 15M013 Sweden - Royal Institut, of Building Technology ............................................................................................ 15M025 Massachusetts - 1985 Audubon Society Weatherization .................................................................................. tiM026 Energy Information Administration 1981 National LIW Study ....................................................................... 15M027 Ohio - 1986 COAD Mobile Home Weatherization .......................................................................................... I5
M028 Winnipeg - 1977-84 Manitoba E&M CHEC Program ...................................................................................... 15M029 Virginia - 1989 Pilot LIW Program .................................................................................................................. E
Oil
O001 New Jersey - 1979 Princeton/HS 21 ................................................................................................................. 150006 Vermont - 1980 LIW ......................................................................................................................................... lT
0007 Philadelphia, Pennsylvania - 1980 Oil Furnace Retrofit Program .................................................................... 15O010 Long Island, New York - 1980 Brookhaven National Lab/DOE ...................................................................... 15O011 Minnesota - 1981 LIEAP Oil Furnace Retrofits ................................................................................................ 15
0025 ASE Persistence of Savings for Flame Retention Burners ............................................................................... 150026 Portland, Oregon - 1985 Oil Burner Retrofit Pilot Program ............................................................................. 150027 Michig',__.n- !984 PSC O.__ZE.RProgr;L.m............................................................................................................. E0028 Virginia - 1989 LIW Pilot Mobile Itomes ........................................................................................................ l_i
References ........................................................................................................................................................................... 15
25
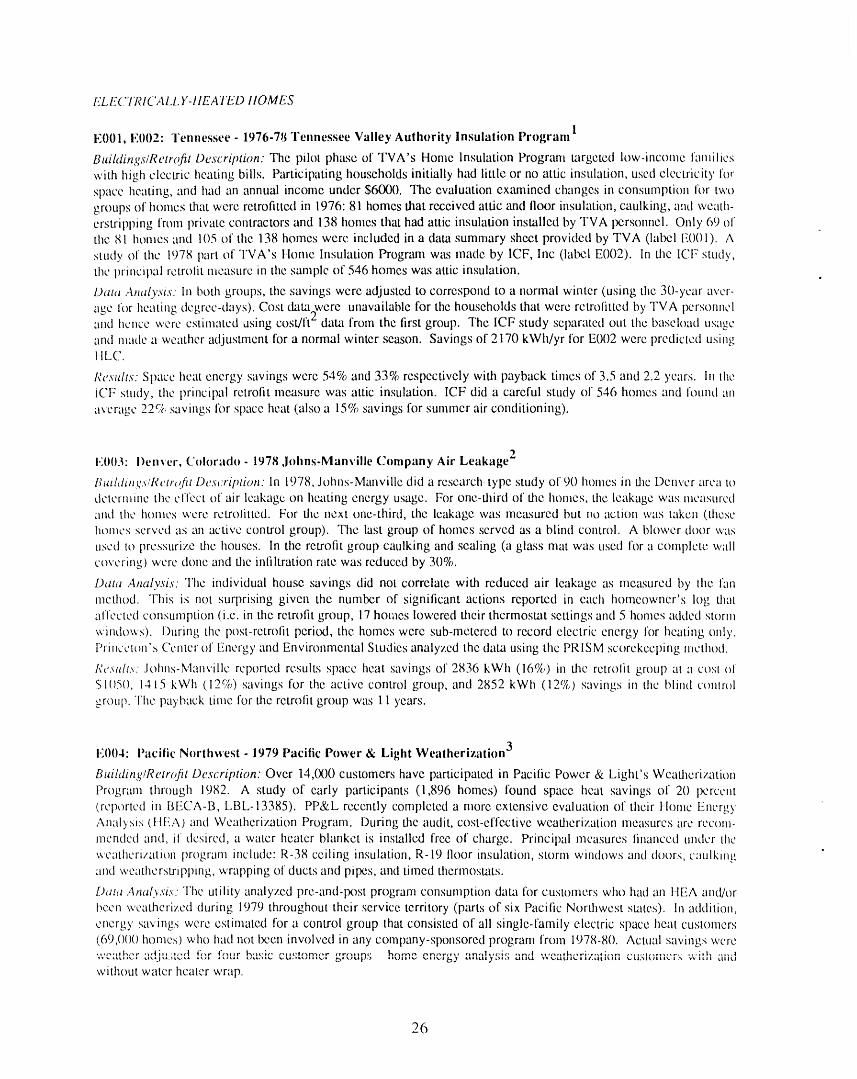
[;LE(. IRICALL)-IlEAI I: IIOMES
1E001, E002- "l'ennessee - 1976-78 Tennessee Valley Authority Insulation Program
Buihtings/Retrqfit Description: The pilot phase of TVA's Home Insulation Progrmn targeted low-inconm fanlilicswith high electric heating bills. Participating households initially had little or no attic insulation, used electricity for
space heating, and had an annual income under $6000. The evaluation exmnined changes in consumption for twt)groups of homes that were retrofitted in 1976:81 homes that received attic and floor insulation, caulking, and weath-erstripping from private contractors and 138 homes that had attic insulation installed by TVA personnel. Only 69 ofthe 81 homes and 105 of the 138 homes were included in a data summary sheet provided by TVA (lalx?,l E001). A
study of the 1978 part of TVA's Home Insulation Program was made by ICF, lnc (la|×;l E002). In the ICF" study,the principal retrolit measure in the sample of 546 homes was attic insulation.
Dam .4mdysis: In both groups, the savings were adjusted to correspond to a normal winter (using the 30-year aver-
age for heating degree-days). Cost data were unavailable for the households that were retrofitted by TVA personneland hence were estimated asing cost/ft" data from the first group. The ICF study separated out the baseload usage
and made a weather adjusunent for a normal winter season. Savings of 2170 kWh/yr for E002 were predicted usingt lLC.
Restdrs: Space heat energy savings were 54% and 33%respectively with payback times of 3.5 and 2.2 years. In theICl;" study, the principal retrofit measure was attic insulation. ICF did a careful study of 546homesand found anaverage 22% savings for space heat (.also a 15% savings for summer air conditioning).
!.;003: i)enxer, Colorado - 1978 ,Johns-Manville Company Air Leakage"
l_uihtin_._/Rctr,;/it l)es,:ription: In 1978, Johns-Manville (lid a research, type study of 90 homes in the Denver area tr,detern_ine the effect of air leakage on heating energy usage. For one-third of the homes, the leakage was measuredand the homes were retrolitted. For the next one-third, the leakage was measured but no action was taken (thesehomes served as zm active control group). The last group of homes served as a blind control. A blower door wasused lt) pressurize the houses. In the retrofit group caulking and sealing (a glass mat was used for a complete wallcovering) wcrc done and the infiltration rate was reduced by 30%.
Data Analysis: The individual house savings did not correlate with reduced air leakage as measured by lhc fanmethod. This is not surprising given the number of significant actions reported in each homeowner's log thataffected consumption (i.e. in the retrofit group, 17 homes lowered their thermostat settings and 5 homes added storm
winttt)ves). During the post-retrofit perkxl, the homes were sub-metered to re.cord electric energy for heating only.f"rincctcm's Center of Energy and Environn_ental Studies analyzed the data using the PRISM scorckeeping mctht)d.
[¢e.xult.s:Johns-Manville reported results space heat savings of 2836 kwh (16%) in the rem)lit group at a cost _)151050, 1415 kwh (12%) savings for the active control group, and 2852 kWh (12%) savings in the blind ctmlrolgroup. "l'hc payback time for the retrofit group was 11 years.
3E004: Pacific Northwest - 1979 Pacific Power & Light Weatherization
Building/Retrofit Description: Over 14,000 customers have participated in Pacific Power & Light's WeatherizationProgram through 1982. A study of early participants (1,896 homes) found space heat savings of 20 percent
(reported in BECA-B, LBL-13385). PP&L recently completed a more extensive evaluation of their Home EnergyAnals_._i_(FlEA) and Weatherization Program. During the audit, cost-effective weatherization measures m-e recom-mended and, ii desired, a water heater blanket is insRflled free of charge. Principal measures financed under the
weathcrizatitm I)rogrant include: R-38 ceiling insulation, R-19 lloor insulation, storm windows and dot)rs, caulkingand weatherstripping, wrapping of ducts and pipes, and timed thermostats.
Data Anal_sis: The utility analyzed pre-and-lx)st program consumption data for customers who had an HEA and/orbeen wcatherizcd during 1979 throughout their service territory (p_u'ts of six Pacilic Northwest suites). In addition,
energy savings were estimated for a control group that consisted of ali single-family electric space heat customers(69,()()() homes) who had not lx_en involved in any company-sponsored program from 1978-80. Actual savings were......' ' " " t _' ' _ '....... "'"'.'_I' '_""_;'' 1' '' 't ' ' ' '_' ' _ ' " ' "'C''''' _,,,,,.,,,.;,.cu:;tomcr groups home ,.,-",,..,...........b., -,,,,,,J_...........;..........and ,.,,au,_,_".... ,,.,tt_,,,,,;..... ;"" cus[olllCr:.; W lth ,ti,t.,a
without water hcater v,,rap.
26
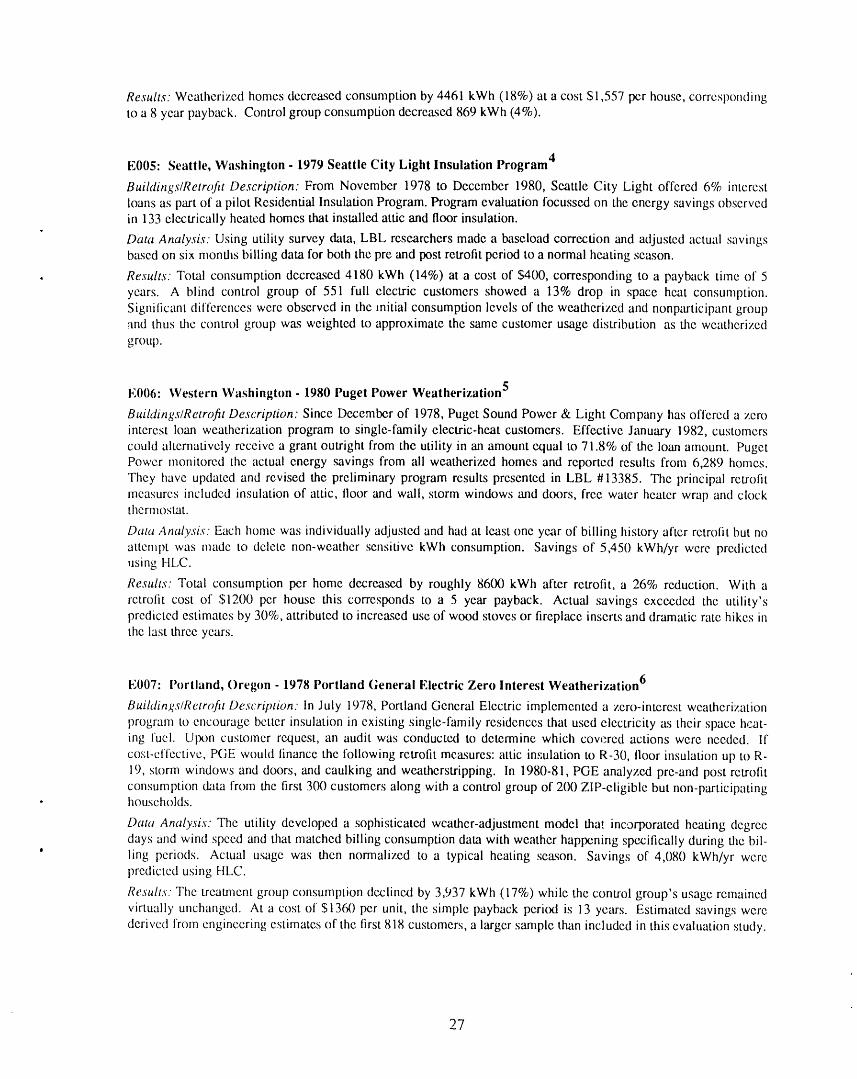
Results: Weatherized homes decreased consumption by 4461 kWh (18%) at a cost $1,557 per house, corresponding
to a 8 year payback. Control group consumption decreased 869 kWh (4%).
4E005: Seattle, Washington - 1979 Seattle City Light Insulation Program
Buildings/Retrofit Description: From November 1978 to December 1980, Seattle City Light offered 6% interestloans as part of a pilot Residential Insulation Program. Program evaluation focussed on the energy savings observedin 133 electrically heated homes that installed attic and floor insulation.
Data Analysis: Using utility survey data, LBL researchers made a baseload correction and adjusted actual savingsbased on six months billing data for both the pre and post retrofit period to a normal heating season.
• Results: Total consumption decreased 4180 kWh (14%) at a cost of $4(,'0, corresponding to a payback time of 5
years. A blind control group of 551 full electric customers showed a 13% drop in space heat consumption.Signilicant differences were observed in the initial consumption levels of the weatherized and nonparticipant groupand thus the control group was weighted to approximate the same customer usage distribution as the weatherizecl
group.
E006: Western Washington - 1980 Puget Power Weatherization 5
Buildings/Retrofit Description: Since December of 1978, Puget Sound Power & Light Company has offered a zerointerest loan weatherization program to single-family electric-heat customers. Effective January 1982, customers
could alternatively receive a grant outright from the utility in an amount equal to 71.8% of the loan amount. PugetPower monitored the actual energy savings from "allweatherized homes and reported results from 6,289 homes.
They have updated and revised the preliminary program results presented in LBL #13385. The principal retrofitmeasures included insulation of attic, tloor and wall, storm windows and doors, free water heater wrap and clockthermostat.
Data Analysis." Each home was individually adjusted and had at least one year of billing history after retrolit but noattempt was made to delete non-weather sensitive kWh consumption. Savings of 5,450 kWh/yr were predictedusing HLC.
Results: Total consumption per home decreased by roughly 8600 kWh after retrofit, a 26% reduction. With a
retrotit cost of $1200 per house this corresponds to a 5 year payback. Actu',d savings exceeded the utility'spredicted estimates by 30%, attributed to increased use of wood stoves or fireplace inserts and dramatic rate hikes inthe last three years.
6E007: Portland, Oregon - 1978 Portland General Electric Zero Interest Weatherization
Buildings/Retrofit Description: In July 1978, Portland General Electric implemented a zero-interest weatherization
program to encourage better insulation in existing single-family residences that used electricity as their space heat-ing fuel. Utxm customer request, an audit was conducted to determine which covered actions were needed. If
cost-effective, PGE would finance the following retrofit measures: attic insulation to R-30, lloor insulation up to R-19, storm windows and doors, and caulking and weatherstripping. In 1980-81, PGE analyzed pre-and post retrofitconsumption cklta from the first 300 customers along with a control group of 200 ZIP-eligible but non-participating
• households.
Data Analysis: The utility developed a sophisticated wcather-adjustment model that inc,.-)rporated heating degreedays and wind speed and that matched billing consumption data with weather happening specifically during the bil-
• ling periocls. Actual usage was then normalized to a typical heating season. Savings of 4,080 kWh/yr werepredicted using HLC.
Results. The treatment group consumption declined by 3,937 kWh (17%) while the control group's usage remainedvirtually unchangecl. At a cost of $1360 per unit, the simple payback period is 13 years. Estimated savings werederived from engineering estimates of the lirst 818 customers, a larger sample than included in this evaluaticm study.
27
7E008: Midway, Washington - 1979 BPA/LBL Weatherization
Buildings/Retrofit Description: The Bonneville Power Administration (BPA) retrofitted 18 houses over a three-year
period (only 14 are included in the final analysis). Evaluation of energy savings and cost effectiveness of differentconservation retrolits were the principal study objectives. Houses were divided into three different groups. ('ell 1homes received an extensive infiltration-reducing weatherization using a blower door to find air leaks. Cell 2houses received attic insulation, foundation sill caulking, and increased attic ventilation, and Cell 3 received these
retrolits plus storm windows and doors. This project had :.;everal tmique characteristics which affected the results.First, Midway residents pay a flat monthly fcc for electricity regardless of their energy usage, and thus the nommlmarket signals (i.e., changing prices affecting demand) were not operative. Second, ali 18 houses were owned byBPA, thus making it easier to ensure that the retrofit work was identical.
Data Analysis: Before and after each set of retrofits, infiltration rates were determined by calculating leakage areai
using blower door fan pressurization techniques. LBL enterexl the data as three groups: 5 houses with extensiveinliltration reduction, 5 houses with attic and crawlspace insulation, and 4 houses with insulation and storm doorsand windows. Using ('IRA, annual space he_,, savings of 840 kwh, 4460 kWh, and 6510 kWh were predicted for
the three groups of houses.
Resuhs: Storm windows and infiltration reduction decreased effective leakage are.a by 14% and 27% respectively.Energy savings ranged between 9% (payback period = 11 years) lhr infiltration reduction to 42% from installationof storm windows and insulation (payback peritxt = 20 years).
E009: Eastern Washington/Idaho - 1979 Washington Water Power Weatherization 8
Buihtin_.,s/Retrofit Description: Starting in 1978, Washington Water Power (WWP) sponsored an extensive zero-interest lozm program for its single-family electric heat residential customers. Possible retrolit measures for whichIt:ms were available included ceiling and lloor insulation, storm windows and doors, and insulation of the hot watertank.
Data Analysis: The company analyzed the fuel bills of 1,030 participants and 251 customers selected at random
tcontml group) to determine energy savings and to evaluate the accuracy of their energy prediction mctht)ds. Thedata has been disaggregated by retrofit measurc and we calculated the space heat savings for 810 homes thatinst,filed measures designed to reduce space heat usage only (no water heater wrap). LBL researchers used WWP's
baseload estimate of 1,0(X)kWh/month in determining the space heating fraction of total clectric consumption.
Resuhs: The entire participant group (1030 homes) obtained annual weather- adjusted savings of 4448 kWh, only 51percent of estimated savings (using ASHRAE steady state heat loss calculation). At a cost of $1,243 per house thesimple payback period was 18 years. A revised method, using the ratio of a home's pre-retrofit actual heating loadto the load eslimated using study state heat loss calculation to adjust the new savings estimate, proved to be farmore accurate in predicting actual energy savings.
E010: ihp, vman ilouse, Maryland - National Bureau of Standards 9
Buihtings/Retrofit Description: This was the lirst extensively monitored residential retrolit on record. The NationalBureau of Standards retrofitted a wood-frame structure in three stages: reduction of air leaks, addition of storm win-
dow's, and installation of liter, ceiling, and wall insulation. Bowman House was unoccupied but occupant ix'.lTavior(i.e. lighting, appliance usage) was simulated.
Data Analysis: Pre- and post-retrofit annual heating loads (e.g. delivcrcxt heat to the house) wcrc calculated from aleast-squares regression of daily average heating loads correlated with ouLside average temperature. I_.Bt. calculatedannual space heat fucl c(msumption based on the efficiency rating (92%) given for the house's electric resistance "heater.
ResulL_. The rctroliP_ resulted in signilicant reductions iii space heat usage (59%) but did not reduce lhc house'sctx)ling energy requirement. NBS researchers concluded thai installation of storni windows was the ni()st co.<q-effective measure.c;;.ii that site. The retrofit cost $2,840 and had an 8 year payback.
28
10E011: Oregon, Washington, Montana - 1981 BPA Weatherization Pilot Program
Buildings/Retrofit Description: The Bonneville Power Administration (BPA) operated a pilot program with eleven
small public utilities in the Pacific Northwest for almost three years that provided residential energy audits to 6,000electrically-heated homes and financed weatherization of roughly half those homes with a zero-interest loan pro-
gram. Oak Ridge National Laboratory conducted an extensive evaluation of the progrmn that encompassed estima-tion of energy savings attributable to the program, comparison of key characteristics among three groups of house-holds (audit plus weatherization, audit only, eligible non-participants), and a cost/benefit analysis. Retrofit measuresfinanced included attic, wall and floor insulation, storm windows and doors, caulking and weatherstripping, the insu-
. lation of heating ducts and hot water heaters. The average retrofit cost was $2,098.
Data Analysis." LBL researchers used results obtained from a 3 parameter (reference temperature, weather-sensitive
slope coefficient, nonweather-sensitive intercept) regression model of monthly electricity consumption developed- for each housellold (Model 3) in our analysis. LBL calculated the space heat fraction by subtracting the baseload
usage estimated by the regression model from total electricity consumption. The authors assumed a constant (X)°Freference temperature for each of 449 households (total of the three different groups). Savings of 12,000 kWh/yr
were predicted using the revised BPA version of SSHL.
Results: Major findings that emerge from the evaluation study are: 1) electricity savings of roughly 3,500 kWh perweatherizcd home attributable to the BPA program 2) total annual savings of 4,500 kWh/home 3) actual savingswere much less than predicted levels, resulting in significant changes in estimation methods 4) households receivingan audit only showed no reduction in electricity use relative to nonparticipants and 5) homes in the audit plus loan
group consumed substantially more electricity prior to the program than the other two groups. Study authorsdeveloped several approaches to the problem of estimating program energy savings. The simple payback periodwas 18 years.
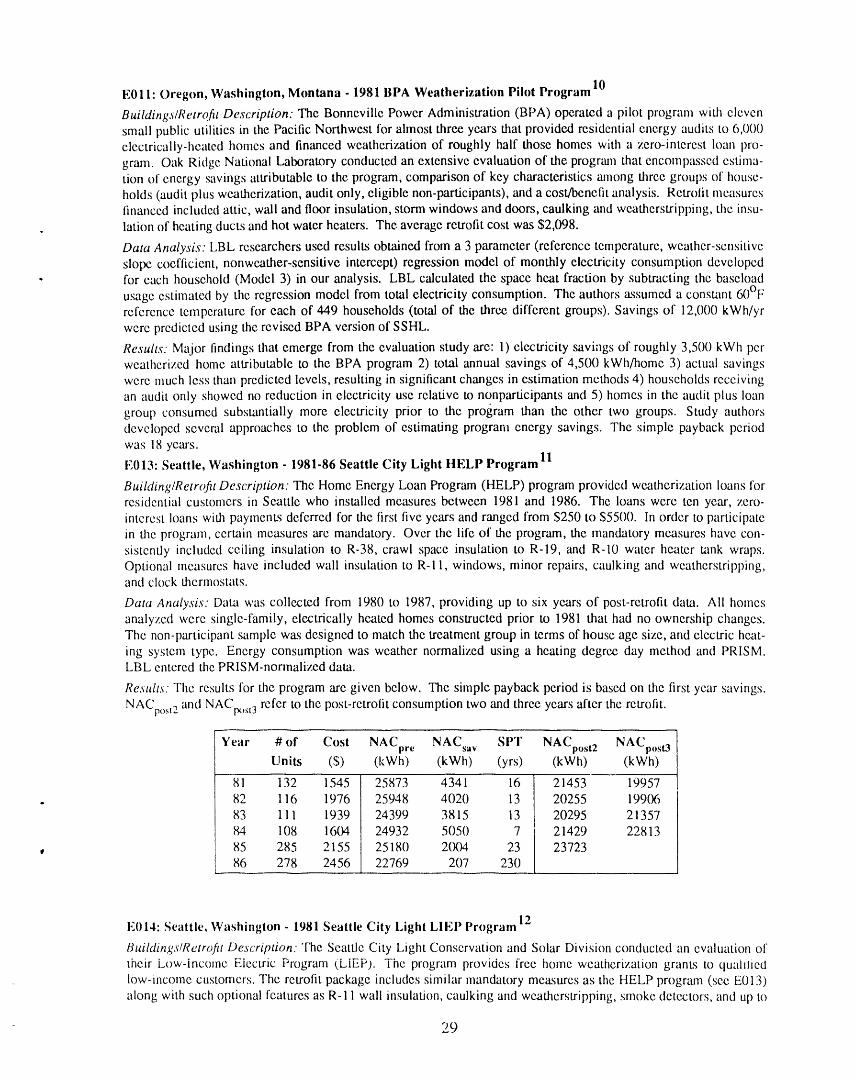
11E013: Seattle, Washington - 1981-86 Seattle City Light HELP Program
Building/Retrofit Description." The Home Energy Loan Program (HELP) program provided weatherization loans forresidential customers in Seattle who installed measures between 1981 and 1986. The loans were ten year, zero-interest loans with payments deferred for the first five years and ranged from $250 to $5500. In order tc)participate
in the program, certain measures are mandatory. Over the life of the program, the mandatory measures have con-sistently included ceiling insulation to R-38, crawl space insulation to R-19, and R-10 water heater tank wraps.Optional measures have included wall insulation to R-I 1, windows, minor repairs, caulking and weatherstripping,and clock thermostats.
Data Analysis." Data was collected from 1980 to 1987, providing up to six years of post-retrofit data. Ali homesanalyzed were single-family, electrically heated homes constructed prior to 1981 that had no ownership changes.The non-participant sample was designed to match the treatment group in terms of house age size, and electric heat-ing system type. Energy consumption was weather normalized using a heating degree day method and PRISM.LBL entered the PRISM-normalized data.
Results: The results for the program are given below. The simple payback period is based on the first year savings.
NACpost 2 and NAClx,st3 refer to the post-retrofit consumption two and three years after the retrofit.
Year # of Cost NACpr e NACsa v SPT NACpost 2 NACpost3Units ($) (kWh) (kWh) (yrs) (kWh) (kWh)
81 132 1545 25873 4341 16 I 21453 19957
, 82 116 1976 25948 4020 13 / 20255 1990683 111 1939 24399 3815 13 20295 21357
84 108 1604 24932 5050 7 | 21429 22813
• 85 285 2155 25180 2004 23 I 2372386 278 2456 22769 207 230
12EO14: Seattle, Washington - 1981 Seattle City Light LIEP Program
Buildings/Retrofit Description: The Seattle City Light Conservation and Solar Division conducted an evaluation of
their Low-income Electric Program (LIEP). The program provides free home weatherization grants to quallliedlow-income customers. The retrofit package includes similar mandatory mettsures as the HELP program (see E013)along with such optional features as R-11 wall insulation, caulking and weatherstripping, smoke detectors, and up tc)
29
$25() of weatherization-related home repairs. The average cost per house was S1,424.
Data Analysis: Complete electricity billing data were obtained for 377 of 557 homes wcadmrized iri 1981 in addi-tion to a control group of 208 non-participants, drawn from customers who received LIEP weatherization the fol-
lowing year. LBt. did a somewhat crude weather-adjusunent on bi-monthly electricity consumption data, estimated
the space heating fraction of total usage using SCL's estimate of the baseload (50% of total annual consuu_ption or10,500 kWh/yr) and normalized the data to a typical heating season.
Result._: Weather nornlalized consumption declined by 3,000 kWh (14%) in the participant group and increased by300 kWh (1 _;.) in the control group. The simple payback period was 23 years.
E015: Seattle, Washington - 1979 Seattle City Light Energy Check Program 13,m
Building/Retrq/it Description: The Evaluation Unit of the Seattle City Light Conservation and Solar Division put)-lished an evaluation of their Home Energy Check Program. They compared program performance data (number of
audits/yr, conservation actions taken, and energy _vings in audited homes relative to a control group) against pro-gram objectives. From 1978 through 1980, the Utility completed 11,000 audits, performed 4,800 hot water tankwraps and 6.600 thermostat setbacks on water heaters. SCL looked closely at tw() sub-groups of audited h(_ncs:those that had a hot water tank wrap and/or thermostat setback and those audited homes that did not take either ofthese actions. LBL used these results in the analysis.
Data Analv._i._."Electricity consumption before and after the audit was examined for a sample of 518 audited homes(66 with electric spacc heat and 452 non-electric space heat). LBL assumed a contractor cost of $30/homc foraudited homes that had only a hot water tank wrap and/or thermostat setback.
Results: The electric space heat homes showed average net savings (test minus control group) of 1,534 kwh pcryear while usage in the non-electric space heat residences declined by 516 kWh. Annual electricity consunlptiondeclined by 465 kwh in those homes that reported taking actions to reduce hot water energy consumption. In thesehomes (with an assumed contractor cost of S30/home R)r these measures,) yielded a 3.8 year simple payback time.
E016" Portland, Oregon - 1980 Portland General Electric Zero-lnterest Loan Weatherization 14
Buitdink,.vRetrqfit Des_.ription: In September of 1982, Portland General Electric (PGF.) rclea:;ed a more c.xtcnsive
cvaluaticm of their zero-interest weatherization audit and linzmcing program. A principal f_us of this later studywas analysis of the portion of weather-adjusted gross savings that could be assigned to either weatherization, a
change in the use of ,,ro{xi tor space heat, appliance replacements, or other factors. Conservation measures eligiblefor linancing include: insulation of attics, lloors, walls, and heating ducts; addition of storm windows and doors,caulking and weatherstripping, and wrapping of hot water tanks (free of charge at time of audit) and pipes. PGE'sevaluation drew heavily on an in-depth survey of 758 homes that sought information on actions that potentiallycould lead to changes in consumption from mid-1978 to early 1981. The study defined four participant-levelcategories: non-elcctric space heat customers (ineligible for participation) and groups of electric space heat non-participanLs, audit only customers and ZIP audit and finance households. The average retrolit cost was SI,40().
Data Analy._is." Each individual household's consumption data was weather-adjusted with separate adjustmentsmade in the before and after period. The utility also collected two ),ears of post-retrotit data in order to examine thepersistence of savings and customer behavior patterns. The reportcd cost data for the weatherized homes is anoverall program average for that time period.
Results: Using several muhiple regression m(xlels, PGE apportioned the tirst year's annual weather-adjusted savingsof 4,000 kWh (16'_) for the audit and finance homes as follows: weatherization, 2,627 kwh; use of wo_×l heat, 782
kwh appliance replacements, -191 kWh" and other factors, 823 kWh. The rexluction in consumption due to ,,increased use of wood heat was in the 7(X)-8(X)kwh range for ali three groups of electric space heat customers. Thestudy found that expected :_avings from performed actions exceeded actual savings attributable to weatherization
(3,475 kwh ,,crsus 2,627 kwh). Possible explanatory factors cited include: audit overestimation (_1expected sav-ings (calculated for a typical house), lifestyle factors that thc audit did not incoq)oratc (zoning), and custozl_cr relax-ation _)1various conscrvation practices in thc initial period after weatherization. The simple payback l)cric_d avt.'r-aged 12 },cars.
3()
15E017: Idaho - 1981 Idaho Power Company ZIP Program
Buildings/Retrofit Description." Idaho Power Co. conducted an evaluation of their Zero Interest Loan Program withthe primary objective of comparing actual energy savings with engineering estimates obtained from audits. The con-servation program tinances the installation of attic, wall and floor insulation, storm windows, caulking and weather-stripping, and clock thermostats. The average retrofit cost was $1,040.
Data Analysis: Their study analyzed pre- and post-retrofit consumption data for 101 single-family electric spaceheat customers who participated in the program along with a matched sample of 48 control homes. LBL normalizedthe actual consumption data to a typical heating season and made a annual baseload subtraction of 11,0(X)/kWh
• (using the utility's estimate) to estimate the space heating portion of total consumption.
Results." Actual savings in the test group fell substantially short of predicted savings based on the audit. Possible
explanations include shortcomings in the audit program (double-counting of savings from measures) and problems4,
in the evaluation design (in some homes, installation of retrofits occurred during the time period defined as pre-retrolit, thus yielding lower savings because the before period includes a portion of the retrofit savings impact). The
average payback period was 14 years.
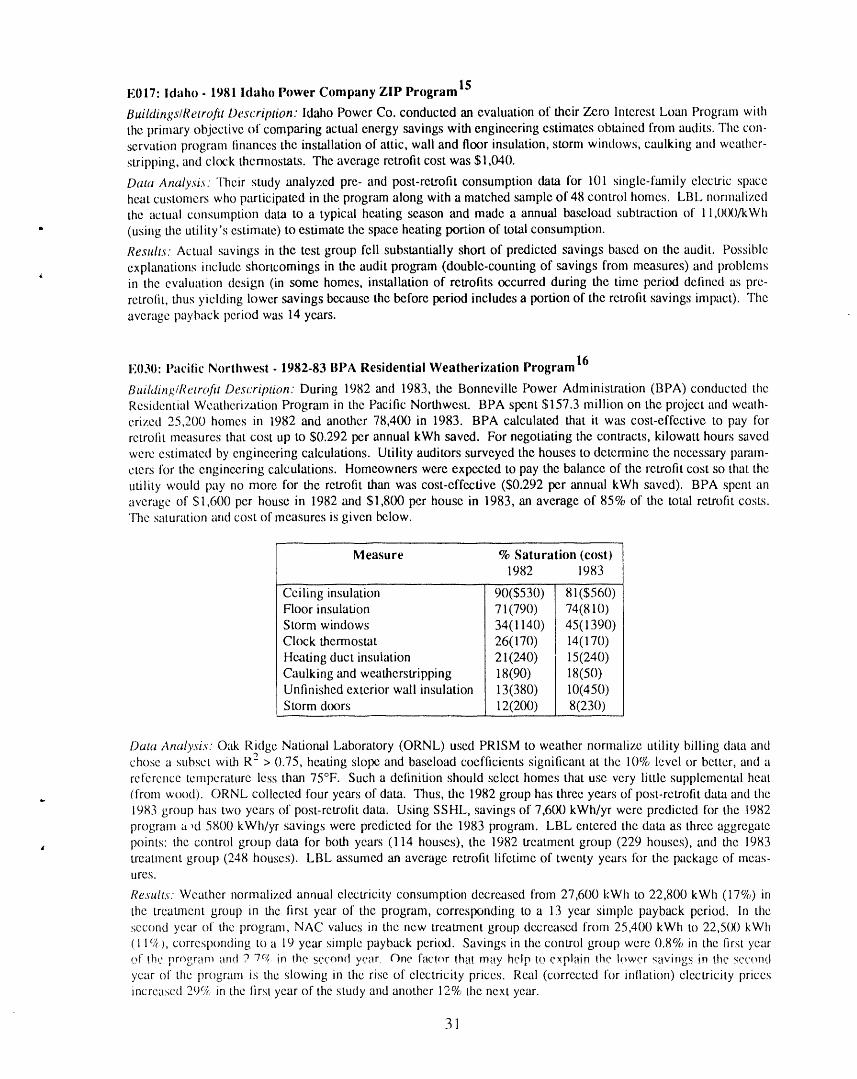
16E030: l'acilic Northwest - 1982-83 BPA Residential Weatherization Program
Building/Retrofit Description: During 1982 and 1983, the Bonneville Power Administration (BPA) conducted theResidential Weatherization Program in the Pacific Northwest. BPA spent $157.3 million on the project and weath-erized 25,200 homes in 1982 and another 78,400 in 1983. BPA calculated that it was cost-effective to pay forretrofit measures that cost up to $0.292 per annual kWh saved. For negotiating the contracts, kilowatt hours savedwcrc estimated by engineering calculations. Utility auditors surveyed the houses to determine the necessary param-eters for the engineering calculations. Homeowners were expected to pay the balance of the retrofit cost so that the
utility would pay no more for the retrofit than was cost-effective ($0.292 per annual kWh saved). BPA spent anaverage of S1,600 per house in 1982 and $1,800 per house in 1983, an average of 85% of the total retrofit costs.The saturation and cost of measures is given below.
Measure % Saturation (cost)1982 1983
Ceiling insulation 90($530) I 81($560)
Floor insulation 71(790) / 74(810)
Storm windows 34(1140) 45(1390)
Clock thermostat 26(170) 14(170)
Heating duct insulation 21(240) / 15(240)
Caulking and weatherstripping 18(90) I 18(50)
Unfinished exterior wall insulation 13(380) 10(450)Storm d(x3rs 12(200) 8(230)
Data Analysis. Oak Ridge National Laboratory (ORNL) used PRISM to weather normalize utility billing data antichose a subset with R2 > 0.75, heating slope and baseload coefficients significant at the 10% level or better, and a
reference temperature less than 75°F. Such a definition should select homes that use very little supplemental heat,. (from wood). ORNL collected four years of data. Thus, the 1982 group has three years of post-retrofit data and the
1983 group has two years of post-retrofit data. Using SSHL, savings of 7,600 kWh/yr were predicted for the 11982program a ,d 58/)0 kWh/yr savings were predicted for the 1983 program. LBL entered the data as three aggregate
• points: the control group data for both years (114 houses), the 1982 treatment group (229 houses), and the 1983treatment group (248 houses). LBL assumed an average retrofit lifetime of twenty years for the package of meas-ures.
Resuhs: Weather normalized annual electricity consumption decreased from 27,600 kWh to 22,800 kWh (17%) in
the treauncnt group m the first year of the program, corresponding to a 13 year simple payback period. In the:;ccond year of the program, NAC values in the new treatment group decreased from 25,400 kWh to 22,5(X) kWh(I 1%), corresponding to a 19 year simple payback perkx:l. Savings in the control group were 0.8% in the first yearof !b.c prr_gram and 77c_ irt !he second year, One fao!or !h'a! may help !o cx.p!ain !he !owcr s'_.,,'ir_.gsin the secondyear of tlm program is the slowing in the rise of electricity prices. Real (corrected for inllation) electricity pricesincreased 29c,4.in the lirst year of the study and another 12% the next year.
31
17E031: Pacific Nortllwest - 1981-84 BPA l.oad Protiles
Building/Retrofit Description From 1981 to 1984, Bonneville Power Administration (BPA) submetered home,; forthe Public Utility Regulatory Policy Act (PURPA) load research data. From this set of metered houses, fourcategories were analyzed" heat pump retrofits, shell measure packages, a control group, and a low potential savings
group. The PURPA lo:ld research, and thus these subsets, were biased toward high cncrgy users.
Data Analysis." If an audit indicated potential savings of 15(X)kWh or more and had electric space and water heat-ing, the house was included in the weatherization group. Homes that audits determined to 1_ well wcatherizcdformed the low potential savings group. The control group was randomly selected. Submetered hourly data wascollected for two years txzfore the retrolits and for one year afterwards. LBL entered the data as four aggregate "
groups: heat pumps (7), shell measure packages (68), control group (15), and low lX)tential savers (29). 1.I_1.assunwd an eighteen year lifetime for the heat pumps (California Coilatx)rative Pux:ess) and twenty years for theshell measure package. The winter peak day was created by averaging the hourly demands for the day of systenl
peak for the months of Dccember, January, trod February.
Results. Consumption for the heat pump group decreased (x'383 kWh (26%) and peak load decreased !.72 kW(20%). Consumption for the shell measure sites decreztsed 3670 kWh (14%) and peak load decreased (1.(_, kW(7_:). No cost data was given.
E032: Ihmd River, Oregon - 1985 BPA tlood River Conservation Pr_ject 18
Building/Retrofit Description: The Hood River Conservation Project (HRCP) was a $19.2 million, live year test of
the uPt_er limits of residential energy conservation. The project was proposed by the National Resource DefenseCouncil (NRDC), funded by the Bonneville Power Administration, and carried out by Pacitic Power and Light in
ltood River, Oregon. Monitoring was done from 1982 to 1986 with most of the retrotits being installed in 1985.The goal was 100% participation of electrically heated homes and consequently an extensive package of measureswas installed, generally at no charge. BPA paid for measures up to a limit of $1.15 per first yc.ar kWh saved, nearlyfour times that which the BPA RWP program paid. 91% of the eligible homes received audits and 85% had majorweatherization measures installed. BPA spent an average of $5480 on site-built homes and $2070 on mobile homes.The saturation and predicted energy savings of retrofit measures are listed below.
Measure Saturation Cost
(%) ($)Insulation
Ceiling 67Floor 63Wall 39Duct 12
Windows and DoorsStorm windows 89
Sliding glass doors 29Insulated doors 3
Inti Itration
Caulking 78 ..,D_x)r wead_erstrip 69Outlet gaskeu,_ 85
Clock thermostats 26
Water heaterInsulation 51
Pipe insulation 63Low- tlows howerheads 62
Dalai Analy.si,s ORNl_, used PRISM to weather normalize fuel c(msumption for houses with utility billing data (screwilouses were submetercd). The 'Goodiit': sample that I.Bi.. analyzed contained 362 site-buih ilomes and i3,',;nlolulchomes. The screening criteria for this sanlple were R2 > 0.75, a and b cocflicients statistically signilicant at the 1()51.
level or better, Tre f less than the maximum daily ouksidc temperature for the year, and Tre f standard error of lc'sn than
32
20°F for each year of data. As a result of these criteria, the homes do not use wood for a signilicant portion of theirspace heating. Oak Ridge adjusted PRISM space heating results since it generally underestimates base use by aboutten percent. LBL cntered the data as two aggregate groups: the site-built homes (362) and the mobile homes (138).The site-built and mobile homes had R2 values of 0.94 and 0.96 respectively. LBt, assumed a lifetime of twentyyears for the retrofit packages.
Approximately two thirds of the Hood River Residences are served by Pacific Power and Light (PP&L) andthe rest arc served by the Hood River Electric Cooperative (HREC). PP&L rates arc roughly double those ofHREC. LBL took a weighted average of electricity prices according to the number of houses in the region served
,, by each utility. Without knowing what fraction of houses in each data group were served by each utility, this is thebest estimate LBL can make. However, price will effect the household energy use.
Resuhs: For site-built homes, the NAC decreased 16% and for mobile homes the NAC decreased 10%. The simple" payback periods for the site-built and mobile homes were 24 and 32 years respectively. Single family homes
decreased peak demand by 0.48 kW per household while mobile homes reduced the demand by only 0.26 kWhousehold. The time of the peak advanced 15 to 30 minutes. Space heat savings account for the peak demandreduction. The cost of avoided peak power (CAPP) is $11,400/kW for site-built and $7961/kW for mobile homes.
These numbers are higher than the cost to produce and transmit power. However, selecting the most cost effectiveretrofits would decrease the CAPP.
Averaged over ali the homes in the Hood River Project (including multi-family homes), actual savings were43% of the predicted savings (6,100 kWh). Low pre-program energy use may be one cause of the smaller thanpredicted savings. Pre-HRCP energy use was much lower in the Hood River area than in comparable areas in thePacific Northwest.
End Use Hood River Pacific NW
NAc Pre (kWh) 20,000 25,000
LSpace Heat Pre (kWh) 8,000 12,000
Several factors account for low pre-program energy use. In the two years preceding HRCP, real (corrected
for inllation) electricity prices rose 40%. Additionally, many households had participated in ezu'lier conservationprograms. Single-family homes that had not participated in prior conservation programs saved 4,500 kwh, whilethose that had saved only 2,200 kWh. These factors account for the low pre-program energy use and consequentlymake it harder to save large amounts of energy. Another factor that contributed to small savings is that the HRCP
was trying for 100% participation. New homes that were retrotit had small savings due to better construction prac-tices. Also, some of the savings were taken in the form of increased comfort and convenience. For homes retrofit in
1985, households raised their indoor temperature by an average of 0.6 F which corresponds to an increased electri-city use of 300 kWh. Post-HRCP electricity use for the primary-electric, single-family homes was lower than typi-cal new-home levels.
E033: tlood River, Oregon - 1985 BPA Hood River Water Heating Retrofits 19
Building/Retrofit Description: Savings from water heating retrofits were measured in Hood River end-use monitored
(EUM) houses equipped with a water heater channel. Retrofits included water heater wraps ($20) and low-llowshowcrhcads ($9). If houses contained a dishwasher (75% of homes), the temperature was reduced to 140 F, ii notthe temperature was lowered to 120 F. Thermostat setbacks were pcdormed in 30% of the homes.
Data Analysis LBL entered the data as three aggregate groups. Group one contained 20 households that had water. heater wraps installed. The second group (54 homes) received both water heater wraps and low llow showerheads.
Group three (14 households) was a control group. LBL assumed a seven year lifetime for ali the water heatingmcas ure s.
Resuhs. Data from the Hood River Project indicate that water heating retrofits are highly cost-effective, though sav-ings seem somewhat uncertain. A sample of 20 homes with submetered water heating were found u) save 972 kWh
per >,ear (22% of water heating electricity use) from water heater tank wraps, yielding a 0.5 year payback. A groupof 54 homes that had both water heater wraps and low Ilow showerheads installed saved 1,())1 kWh per year (17%u, w,atci ttuatlJlg t.:lu%tllt;ity U,';C), resulting in a u./ year payback. An unknown percentage of the homes in eachgroup also reduced the water temperature to reduce standby losses. Peak savings for ali homes with submetercd
water heating (more than these 74 homes) were estimated to be 0.088 kW on peal< (per house), corresponding to a
33
=
cost of avoided t×'ak power (CAPP) of S228/kW.
E034: Austin, Texas - 1988 Central Air Conditioner Replacement 20
Buildin_c/Retrojit Description: The City of Austin (Texas) Resource Management Department is attempting tc) deferthe building of an additional power plant by using demand side management. One of the measures is a ResidentialAppliance Rebate Program which offers rebates to consumers that replace low-efficiency appliances (air conclition-
ers in particular) with high-efficiency units. This study included twelve homes that replaced low efliciency centralair conditioning units (EER = 6.8) with high efficiency units (EER = 11.4) in early 1988. The pew units were also "smaller capacity, 2.8 versus 2.4 tons. The average installed cost based on information from the six available low-interest loan applications, was $2640 per unit.
a.
Data Analysis. Pre-retrofit performance was monitored in September and October of 1987 and post-retrofit perfor-mance was monitored between May and October of 1988. Air conditioner energy use, ambient and indoor tempera-tures, and indoor relative humidity were recorded at fifteen minute intervals. Electric billing data was also runthrough PRISM. The peak load savings are for 100°F conditions and are predicted using a least squares regressionof kW use versus outdoor temperature squared. The median R2 is 0.82 for the pre-retrolit data and 0.89 for the
post-retrofit data. Peak power savings were predicted to be 2.48 kW per house. Peak power use per housedecreased trom 4.18 kW before the retrofit to 2.59 kW afterwards, a difference of 1.59 kW. A linear regression ofyearly air conditioning consumption per squm'e foot of Iloor space versus outdoor temperature was lound to have R2
values of 0.87 to 0.92 for the twelve houses. Using a "bin method" to group days according to their average tem-perature gave pre- and post-retrofit weather normalized cooling values of 5,110 kWh and 2977 kWh. For com-ptu-ison, PRISM predicted weather normalized cooling to be 5,220 kWh before the retrofit and 3,451 kWh after.PRISM showed a reduction in total household electricity use from 12,708 kWh before the retrofit to 11,152 after-wards. LBL assumed a tilteen year lifetime for the new central air conditioning units based on estimates lron_ theLBL Residential Energy model.
Results." "l'he cost of avoided peak power is $1660/kW. Normalized annual cooling consumption decreased from5,110 kWh before the retrofit to 2,977 after the retrofit. In Austin, Texas where electricity costs $.09(_/kWh duringthe summer, the simple payback period is about 13 years.
E035: Wisconsin. 1984 LIW 21
Building/Retrc_t Description: The Utility Weatherization Assistance Program (UWAP) involves ali Class A gas andelectric utilities ira Wisconsin and provides free weatherization services to qualilied low-income households. Thisevaluation analyzed both electrical and gas heated homes (G066). The linal sample for the evaluation of the 1984
program contained 36 treatment houses and 37 control houses. Measures offereal included: water heating retrofits(tank wraps and water [low restrictors), insulation for ali areas of the house, furnace replacements and retrolits (elec-
tronic ignition, setback thermostat, and vent dampers), storm windows and doors, blower door sealing and caulkingand weatherstripping, and attic ventilation. An average of $1594 was spent on each house.
Data Analysis. Utility billing data was weather normalized using PRISM. Homes included in the sample had nooccupancy changes, at least six consecutive billing dates, R2 > 0.75, and positive baseloads and heating slopes.LBL entered the tream_ent and control groups as two aggregate data points and assumed a lifteen year lifetime forthe package of measures.
Results: The consumption of the treatment group increased 67 kWh per year (0.3%). The control group consump-tion increased 794 kWh (4.5c7_:).
22E036: ()klaimma - 1988 ()RNL Cooling Retrofit
Buildink,,s/Retrofit Description: Oak Ridge National Laboratory ran an experiment in 1988 tc) test the effect of cc×_l-ing retrolit.s on air conditioning use in low income weatherization programs. Three categories of homes in the
Oklahoma weatherization program were analyzed: 22 homes that received only weatherization ($836/hc)usc), 19homes with weatherization and a radiant barrier ($1,270), and 18 homes with weatherization and a replacemcnthigh-eflk:ienc'y air c_mctili_mer(5_lRgl I. Ali hc_mc;gwe.re we_ilherizc:dwith allic: insulalinn_ caulking and weather-stripping, storm windows. Weatherization expenditures were approximately $860 in ali three groups.
34
Data Analysis: Air conditioning electricity use was submetered and weather normalized using regression analysesbased on the outdoor-indoor temperature difference. Homes included in the sample had no cx:cupancy changes.LBL entered the data as the three aggregate groups described above and and assumed a fifteen year lifetime for thepackage oi' measures.
Results." The cooling energy consumption of the weatherization-only group increased by 2% (31 kWh/yr) and by 4%
(52 kWh/yr) for the weatherization and radiant barrier group. For the weatherization and replacement window airconditioning group, average cooling energy savings were 28% (535 kWh/yr) resulting in a simple payback of 47years.
E037: Fh)rida - 1982 FSEC Cooling Retrolit 23
" Buildings/Retrofit Description." The Florida Solar Energy Center (FSEC) analyzed cooling energy savings from 25homes in Pahn Beach County, Florida that were retrofitted in 1982. Expenses averaged $5,927 pcr house. Thesaturation of measures is given below.
Measure Saturation (%)
Replacement Central A/C 80Attic insulation 80
Ceiling Fans 40Duct Scaling 32Duct Replacement 20Window Tinting 16
Data Analysis: Air conditioning electricity use was submetered. Since the correlation between cooling energy sav-ings and cooling degree clays was poor, data was not normalized by cooling degree days. Normalizing by squarefootage produced daul that varied by two orders of magnitude. Therefore, cooling consumption was reported inunadjusted form. LBL entered ali 25 homes as one data point and assumed a lifetime of 15 years for the retrofitpackage.
Results." This study points out the difficulty of normalizing cooling energy data. Indoor-outdoor temperature differ-ence, humidity, landscaping, house design, and occupant behavior ali effect cooling energy consumption. (See thesection on research studies in the first volume of this report for more detail). Cooling energy savings of 5,320 kWh
(65%) resulted in a 15 year payback period. Regression analyses indicated that air conditioning replacement saved3,600 kWh/yr, duct replacement saved 2,900 kWh/yr, and ceiling insulation saved 1,900 kWh/yr (ali at greater than90% confidence levels). Ceiling fans saved 890 kWh/yr (confdence level 87%).
E038: Parific Northwest - 1985 Regionwide Weatherization Program 24
Buildings/Retrofit Description In 1985, the Bonneville Power Administration began operation of the Long-TermRcgionwidc Weatherization Program (RWP). In 1985, 21,982 non low-income, single-family homes were weather-ized. A sample of 239 retrofit_ homes and 731 non-participants were analyzed. Three years of post-retrofit con-
sumption metering was done. The average retrofit cost was $1,880 per house, of which $1371 (73%) was paid by. BPA with the balance being paid by the customer. Retrofit measures installed in large saturations included attic
insuhltion, tloor insulation, window replacements, caulking and weatherstripping, storm windows, duct insulation,and wall insulation.
• Data Analysis. Utility billing data was weather normalized using PRISM. Screening criteria included continuousbilling histories, no occupancy changes and an R2 > 0.25. LBL assumed a 20 year lifetime for the retrofit measures
and entered the treatment and nonparticipant houses in two aggregate groups.
Results: Using a 31 year financing term and a discount rate of 3%, the CCE for Bonneville was 2.96C/kWh. In the
first year after retrofit, total consumption decreased 2,1(X) kWh (9%), resulting in 25 year payback. Control groupconsumption increased 90 kWh in the first year after retrofit. NAC usage for three post-retroft years are shownbelow.
35
Treatment NAC (kWh/yr) 23860 21760 21670 21335Nonparticipants NAC 22460 22550 22430 22300
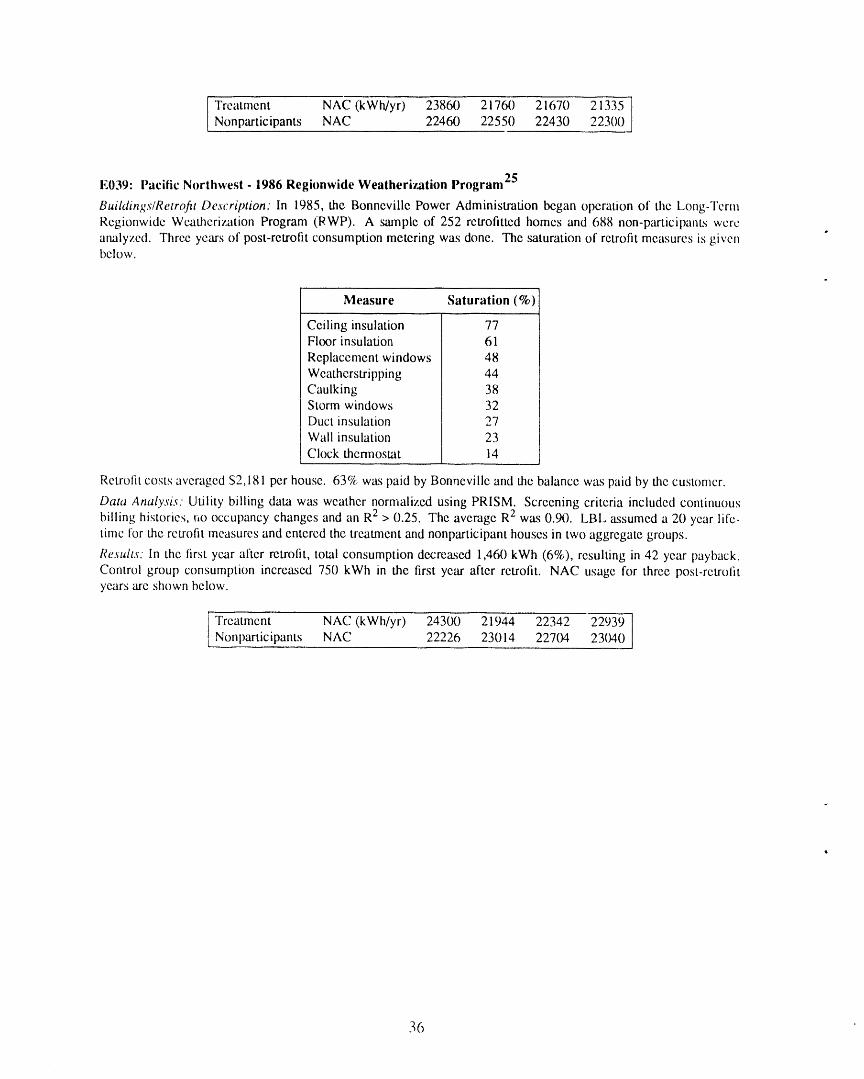
25E039: Pacific Northwest - 1986 Regionwide Weatherization Program
Buildings/Retrofit Description: In 1985, the Bonneville Power Administration began operation of the Long-TermRcgionwide Weatherization Program (RWP). A sample of 252 retrofitted homes and 688 non-participant.s wcrcanalyzed. Three years of post-retrofit consumption metering was done. The _turation of retrofit measures is givenbelow.
Measure Saturation (%)
Ceiling insulation 77Floor insulation 61
Replacement windows 48
Weatherstripping 44Caulking 38Storm windows 32Duct insulation 27Wall insulation 23Clock thermostat 14
Retrofit costs averaged $2,181 per house. 63N: was paid by Bonneville and the balance was paid by the customer.
Data Analysis: Utility billing data was weather normalized using PRISM. Screening criteria included continuous
billing historic.s, r,o occupancy changes and an R2 > 0.25. The average R2 was 0.90. LBL assumed a 20 year life-time for the retrofit measures and entered the treatment and nonparticipant houses in two aggregate groups.
Results: In the first year after retrofit, total consumption decreased 1,460 kWh (6%), resulting in 42 year payback.Control group consumption increased 750 kWh in the tirst year after retrofit. NAC usage for three post-retrofityears arc shown below.
i Treatment NAC (kWh/yr) 24300 21944 22342 22939Nonparticipants NAC 22226 23014 22704 23040
36
,] ,
GAS IIEATED-tlOMES
G001: Wisconsin- 1981 LIW 26
Buildings/Retrofit Description: The Wisconsin Department of Health and Social Services did a small sal,:_le (17homes) evaluation study of their state's low-income weatherization program in an effort to gain insight into service
provider effectiveness (i.e. the local community action agencies). Typical retrofit measures installed included atticinsulation (bringing existing levels to R-38), caulking and weatherstripping, wrapping of hot water heaters, andstonn windows and floor insulation (in a several of the homes). Retrofit costs averaged $1,660.
• Data Analysis." In most cases, degree day data and fuel use data were obtained for two years prior to the weatheriza-tion activity and averaged along with one year of post-retrofit data. The study authors reported annual energy con-sumption of the space heating fuel and material costs for each home's conservation measures. LBL researchers used11 of the 17 homes, those that utilized natural gas for space heating and for which a baseload subtraction (using anaverage summer months f_,,ei usage as the non- space heating portion of total consumption) could be accuratelymade. Cost data was multiplied by 1.85 in order to estimate the co ltmctor cost of the retrofit (the factor used byWisconsin personnel).
Results: Average annual space heat consumption was reduced by 21 MBtu (17%) after the retrofit and the simplepayback period was 16 years.
G002: Twin Rivers, New Jersey - 1977 Princeton University 27
Buildings/Retrofit Description: In 1977, the Princeton Center for Energy and Environmental Studies (CEES)retrolitted a town house in stages. In the first stage, conventional retrofits such as additional attic insulation and
moderate se_ding ef attic air leaks reduced heating fuel usage by 25% in a townhouse. Second stage "super-retrolits" included insulating shutters for south windows, basement insulation, and sealing additional air leaks. Sub-
sequent to these retrofits, another attic bypass heat loss was discovered, by a convective loop within the masonryparty walls. This heat loss w_,:,partially cor,ected by blowing cellulose into the walls at the attic lloor level. The
importance of sealing attic bypass losses and the usefulness of a blower door in house diagnostics were the twomajor outcomes of this Pri,_ceton retrofit experiment. Many of the window and door retrofits were custom-made,resulting in high retrofit costs (average of $3,000).
Results: Net savings in heating fuel increased to 62 MBtu (76%) following completion of ali retrofits including thesealing of attic bypasses. The simple payback period was 16 years.
G003 and G004: New Jersey - 1979 Princeton University/HS 11 & 2228
Buildings/Retrofit Description: In 1979, two occupied houses were retrofitted by Princeton University's CEESGroup and local contractors. Additional attic insulation, furnace tuneups, and sealing air leak convective loops,diagnosed using a blower door and infrared viewer, were the main retrofit measures. The retrofits costs were $700(for G003) and Sl ,(X)0for G004.
Results." The results for the two houses are shown below.
Space Heat
- Savings PaybackLabel (MBtu) (%) (yrs)
• G003 I 24 40 8G004 I 30 26 9
(;005-8, G024-6: New Jersey and New York - 1980 Modular Retrofit Experiment 29
Buildings/Retrofit Description: In 1980, groups of homes at seven different sites, called "modules," wcre retrofitted
in a collaborative study between Princeton University, four gas utilities in the State of New Jersey, and ConsolidatedEdison. The principal aim of the study was to make a quantitative evaluation of the "house doctor" concept. Eachmodule consisted of three groups of houses at the same site: "no treatment" houses used as a control group, "housedoctor only" homes, and "house doctor plus contractor retrofit" homes. The house doctor treatment included theplugging of air leaks and convective loops diagnosed using a blower door and an infrared scanner, the installation of
37
clock thermostats, the wrapping of water heaters with insulation, and sometimes the installation of low-llow shower
heads and lowering of water heater temperature settings. A list of possible contractor retrofits was prepared for eachhouse following tlm house doctor visit and in one group in each module these improvements were carried out.These included such measures as installation of insulation in attics, walls, and basements, and store1 windows.
Results: In ali seven m_xlules the "house doctor only" group yielded the lowest cost of conserved energy (CCE) for
the module, indicating that some of the most cost effective retrofit measures were included in the typical house doc-tor visit. The "house doctor plus contractor retrotit" had considerably higher CCEs than the "house doctor only"group because the additional contractor work was relatively expensive and saved less energy per dollar spent. In sixof the seven modules the control group decreased its energy usage as weil, a trend also seen for the aggregate of ,New Jersey's gas heating customers. The results of this study are discussed in detail in volume I of this retxm.
m
(;009: Saskatoon, Saskatchewan - 1980 Energy Conservation lnt'o. Center Caswell lliil Study 30
Buildings/Retrofit Description." The Caswell Hill Infiltration Project attempted to determine the relative cost-effectiveness of scaling air leaks by caulking and weatherstripping throughout the thermal envelope. Ten houseswere sealed and thereafter five of them received attic and basement insulation. The National Research Council
(NRC) of Canada used pressure tests to measure air leakage rates before and after retrolitting. The NRC foundsigniticant variations in the quality of workmanship and materials used in the retrofit work.
Data Analysis: lt should be noted that retrofit costs have been converted from Canadian to U.S. dollars.
Result.:: Results from these two groups were compared to another group of ten houses that had mainly added insula-tion and storm windows. The five homes that had been sealed and insulated achieved energy savings of 53 MBtu(30%) at a an average cost of S 1,940 pcr house. The simple payback period was 17 years for this group.
(;01(l: Butte, Montana - 1980-81 NCAT [ialfway ltouse 31
Buildings/Retrqfit Description: In 1980 and 1981, the National Center for Appropriate Technology retrolitted a2,300 square foot halfway house in Butte, Montana. This retrofit occurred in two steps: attic insulation only wasadded to a halfway house before the first winter with wall insulation, caulking and weatherstripping, and a south-facing passive wall installed before the second winter. $4(X)0 was spent on weatherization materials. The solar_etrotit cost approximately $6,000 (materials only).
Data Analysis The basic data (consumption, weather, costs) were provided by NCAT and LBL did the calculations.
Results. NCAT concluded Omt the money spent on the solar retrofit would have been better spent on weatherization.The payback txeriod for the weatherization and solar retrofit was 85 years.
G011: Ramsey County, Minnesota - 1979 Northern States Power Weatherization 32
Buildinks/Retrofit Description." In 1979, the City of St. Paul, Ramsey County, and Northern States Power Company(NSP) combined to institute a test program of weatherizing homes for low income people in St. Paul. The principalweatherization measures were the addition of attic insulation, caulking, and weatherstripping at an average cost ofS290 per house. The test program was funded by an NSP grant and NSP conducted an evaluation study.
Data Analysis." After the 1980 winter the gas consumption records of 84 participating customers were analyzed.Baseload corrections and weather adjusunents were made.
Results: Post-retrofit space heat energy consumption decreased by 12 MBtu (8%) and the payback period was 8years. A 1981 follow-up study on 25 customers in the program (the initial group was reduced by changes in occu-
t)ancy} found that annual consumption declined further in 16 households and increased slightly in nine households.
(;012: San ,loaquin Valley, Calit'ornia - 1979 Pacilic (;as & Electric Ceiling Insulation 33
Buildinxs/Retrofit Description: This study analvzexl pre- and post-retrofit consumpti(m (_1"a ,m_all ,¢,'._.mpleof the
7,629 customers who financed ceiling insulation through Pacific (;as & Electric Company's low interest loan pro-gram irs 1979. Tlae study focussed on 49 customers who initially had no ceiling insulation and installed R-19 and
lived in the San Joaquin Valley of California (33 in Bakerslicld and 16 in Fresno). The average cost was alWoxi-mately $425 per house.
38
Data Analysis: P.G. & E. made a baseload correction on the consumption data and calculated the savings for a 5-month heating season. The results were scaled up to reflect a normal winter season.
Results. Savings averaged 15 MBtu (12%) in Bakersfield and 20 MBtu (13%) in Fresno. The respective paybackperiods were 6 and 4 years.
G013: Coh)rado - 1977 Public Service Company Ceiling Insulation 34
• Buildings/Retrofit Description: Public Service Company (PSC) provided a low-interest loan program for its custo-
mers over a 40-month period from September 1975 to the end of 1978. Over 33,000 gas users, mainly in theDenver nmtropolitan area, increased their attic insulation, usually from R-11 to R-30.
" Data Analysis. The PSC provided weather-adjusted total gas usage numbers for before and after retrofit periods andwc subtracted a baseload use estimate to derive the space heating component.
Results: Approximately 20 MBtu per customer were saved with an original invesUnent of less than $300. Theinvestment had a average payback time of 5 years.
(;014-18:1979 CSA/NBS Optimal Weatherization Demonstration Program 35
Buildings/Retrofit Description: The Community Services Administration and the National Bureau of Standards
designed and completed an optimal weatherization research project involving low-income houses throughout theUnited States. Retrofits were performed in 1979. Energy savings and retrofit costs were carefully compiled fortwelve different sites. Even though the study concentrated on low-income households, the results have applicabilityto most middle-income homes since many of the houses were occupied by people whose retirement from workdropped them into the low-income category. More than half of the 142 retrofitted homes used in the final studyreceived optimal weatherization, including both shell measures and mechanical options. The remainder of theretrofitted homes received shell measures only. The final control group consisted of 41 homes.
Retrofit options included ali improvements to the thermal envelope such as insulation, caulking and weather-stripping, and storm windows and doors as well as space heating system or domestic hot water system measures -such things as flue dampers, furnace tuneups, electronic ignition, thermostats, duct and pipe insulation, and llow res-trictors. Submetering of ali space heating systems and of many hot water systems was done in this project.
Data Analysis: The CSA/NBS study listed individual consumption and cost data for each house. Only space heatingdata were presented even though in many cases water heater data had been collected. Ali consumption data hadbeen weather-adjusted.
Results." The sites with both envelope and heating system retrofits appear to be more cost-effective than those sites
for which only shell retrofits were done. Absolute savings per house were 45 MBtu with 31 percent savings inspace heating energy for the composite of 12 cities (label M008). Retrofit costs averaged $1,610 per house and the
payback period was 8 years. The control group space heating consumption decreased by 4 percent. As expected,the resulLs vary from site to site because of such factors as: differences in the original thermal integrities of thehouses, selection of retrofit options implemented, and the different fuel types.
G019: Luzerne County, Pennsylvania - 1979 LIW 36
Buildings/Retrofit Descriptions: This was a local study of the DOE Weatherization Program for low-income homes.The retrofit measures included attic insulation, caulking and weatherstripping, and energy efficient windows.
• Retrolit costs averaged S790 per home.
Data Analysis: Gas consumption data for 30 homes during both December through March periods of '78-'79 and'79-'80 were included in the study. LBL made a bttseload correction and adjusted the data to a normal winter sea-son.
Results: Post-retrolit consumption declined by 29 MBtu (14%), yielding a payback time of 9 years.
39
G021: Kansas City, Missouri 1977-78 LIW 37
Buildings/Retrofit Description: Kansas City, Missouri conducted several evaluations of the t4ome W_thcrizationProgram. The programs were implemented with DOE Low-Income Weatherization funds dispensed through theMissouri Department of Natural Resources. ResulLs are reported for three .,;ample groups that received insulation,caulking and weatherstripping during 1977 and 1978.
Data Analysis. LBL used the consumption data in the report (3 months winter billing (lata representing apl)roxi-mately 60% of the HDD in the heating season), and made a btt,;eload correction and weather adjustment to a normalKansas City winter.
Results. Percent savings of space heating energy use for the three groups ranged between 15-27% with a simplepayback time of 7 to 15 years.
G(122: Kentucky- 1979LIW 38
Buildings/Retrofit Description: The Kentucky report on the DOE Low-Income Weatherization Program was veryextensive zmd detailed, lt contained a large sample of homes heated with a mixture of fuel sources. Many t)l thehomes had several fuel sources including some with wood heating. In order to avoid possibly inaccurate fuel con-sumption records, only the homes heated by natural gas were included. The principal retrolit options implclnentcdwere caulking zmd weatherstripping, storm windows and doors, and ceiling insulation. Retrofit costs averaged S25()pcr house. There was a control group in the study but no results arc shown due to insuflicient consumption tlala.
Data Analysis. LBL made a baseload correction and adjusted usage to a normal heating season.
Results: Average savings were 16 MBtu per year (11%) yiehling a 5 year payback.
(;023: Indiana- 1978LIW 39
Buildi_Tgs/Rctrofit Description." ResulL,; from the DOE Low-Income Weatherization Program in Indiana arepresented. The principal retrofit options were insulation, caulking and weatherstripping, and adjusUncnts of theheating system. Retrofit costs averaged S1,375 per house.
Data Analysis." Consumption data was provided by U.S.R.&E. LBL made a baseload correction and adjusted for anormal winter of heating degree-days.
Results: Total consumption decreased by 46 MBtu (21%) after the retrofit, yielding a payback time of 14 )'cars.
(;027: Walnut Creek, California - 1981 LBL/PG&E House Doctoring 40
Buildings/Retrofit Description; In cooperation with Pacific Gas & Electric Co., Lawrence Berkeley Laboratory con-ducted a demonstration project to measure the incremental savings that result from adding house doctoring to anenergy audit. The experiment analyzed the pre-and post retrofit energy consumption of 19 homes divided into 4groups: a "full retrofit" group (A) that received an audit, house doctoring and conventional contractor retrofiL'_, agroup (I31 that received the audit and house doctoring, a group (C) that had the audit only, and a blind control (D)
which received no treaunent. The house doctor treatment emphasized the installation of an intermittent ignitiondevice (liD), inliltration-reduction measures using diagnostic equipment, low-llow showerheads, insulating thewater heater, and sealing furnace ducts.
Data Analysis. At this stage of the experiment, usage data from Group A includes the resulL_;from house doctoringonly (the conventional retrofits were done in June 1981) and thus the data from Groups A and B together were com-bincd.
Results: Though the "house-doctored" group had a larger average value of savings than either the audit only or blindcontrol (11.4c'_ compared to 9.4 and 7.0%), the differences were not statistically signilicant (at the 95% conlidcncclevel) clue to the small sample size.
,111
(;028" (;han_paign, Illinois - 1978 University ot"Illinois Insulation _j
[3uildings/Rctrc_fit Definition. Energy consumption data were studied by University of lllinois rcsearchurs l(_r 12
households that received insulation retrofits in 1978. F'ive homes received ceiling insulation only, one received wall
40
insulation only. Retrofit costs averaged $900 Ibr the group of ali 12 homes and $560 for the group of five honmsthat rcceiw.'zl only attic insulation.
Data Analysis." Researchers analyzed several years of utility bills for each home before and after retrofit. LBL calcu-lated annual space heat energy savings using their data on "heating factors" and baseload correction (summer usagein the pre-and post retrofit years defined as baseload). LBL entered the data in two gToups: the entire group of 12and the 5 homes that received only attic insulation.
Results: The entire group had average savings of 42 MBtu per year (24%) and the ceiling insulation only saved 29MBtu per year (17%). The respective paybacks were 6 and 5 years.
G029: Denver, Colorado - 1982 DOE/SERI 50/50 Program 42,t
Buildings/Retrofit Description." This study analyzed the energy savings from 25 households that participated in aDOE/SERI demonstration project of the 50/50 program. Working with local contractors, SERI adapted the retrofitpackage to gas-heated homes in Colorado (i.e. included attic insulation and eliminated cooling system and 7sealing/heating system improvements that were not applicable to gas systems). Thirty low-cost measures could
potentially be installed by contractors with estimated savings up to 40%. Retrofit costs averaged $750 per house.
Data Analysis: Saving estimates are based on extrapolations from 6 months of post-retrofit data.
Results: From 12 to 21 retrofit measures were actually installed in each house. The retrofits resulted in averageannual energy savings of 26 MBtu (21%). q'he package of conservation measures had an average payback time of 5years. A "non-participant" control group of 25 households also reduced their consumption by 14% attributed to ris-ing gas prices and "independent" retrofit action taken by at least 7 of the 25 "non-participants."
G030: Detroit, Michigan - 1973.76 Consolidated Gas Company Ceiling Insulation 43
Buildings/Retrofit Description This study conducted by staff of the Michigan Public Service Commission analyzedenergy savings from 71 homes that participated in a Michigan Consolidated Gas Company loan program to financethe installation of attic insulation [up to R-19]. The retrofits occurred between 1973-76 and were installed by con-tractors at an avmage cost $285 per house.
Data Analysis: PSC staff made a baseload correction of annual energy consumption data and used cost data esti-mates from local contractors.
l_'csults. Consumption decreased by 21 MBtu per year (I 3%) after the retrofit with a pa) back time of 4 years.
(;051: Minneapolis, Minnesota - 1983-85 MEO Foundation Insulation (Unconditioned Basements) 44
Building/Retrofit Description Minnegasco and the Minneapolis Energy Office (MEO) conducted a study of fifteenhouses whose foundations were insulated between 1983 and 1985. These basements were unconditioned spaces.Ali of these houses already had insulated walls and attics. Eight houses received interior foundation insulation, five
houses received exterior foundation insulation, while two received a combination. For interior insulation (averagecost of $1820), a 2 x 4 wall was erected against the foundation wall and R-II fiberglass baits were sandwiched
between two polyethylene vapor barriers. The average cost was $1820 including sheetrock and $906 excluding. sheetrock installation. As LBL is interested in the costs related to the energy savings, we used the figure of $906.
However, sheetrock is mandated by most fire codes. For exterior insulation (average cost of $1170), R-10 polys-tyrene rigid foam was attached at the first-tloor bottom plate and mn four feet below that level. The polystyrene wascoated with a cement-based finish.x
Data/Analysis. None of the houses in the sample had other retrofits done during the analysis period or significantchanges in occupant lifestyle. Utility billing data was weather normalized using PRISM. Houses were included in
the study only ii they had an R2 > 0.95 and a coefficient of variance of the NAC of less than five percent. Tc) calcu-
late the end use fractions of the NAC, LBL assumed that 80% of the pre-retrofit NAC was used for space heating(EIA 1989). LBL reported aggregate results for the two groups of houses: those that received interior insulation(ei_2hl) and lh_vm !ha! rec,:ive<! ex!erior in,_u.!a!ion(five). There is a large uncer,'Jinty in the lifetime ,.)f ,d_.ef,ounda-tion insulation. LBl.. assumed twenty year lifetimes for both interior and exterior insulation. However, if interior
(tiberglass) insulation is exposed to water, it will be ruined and there will be little or no subsequent energy savings.
_S 41
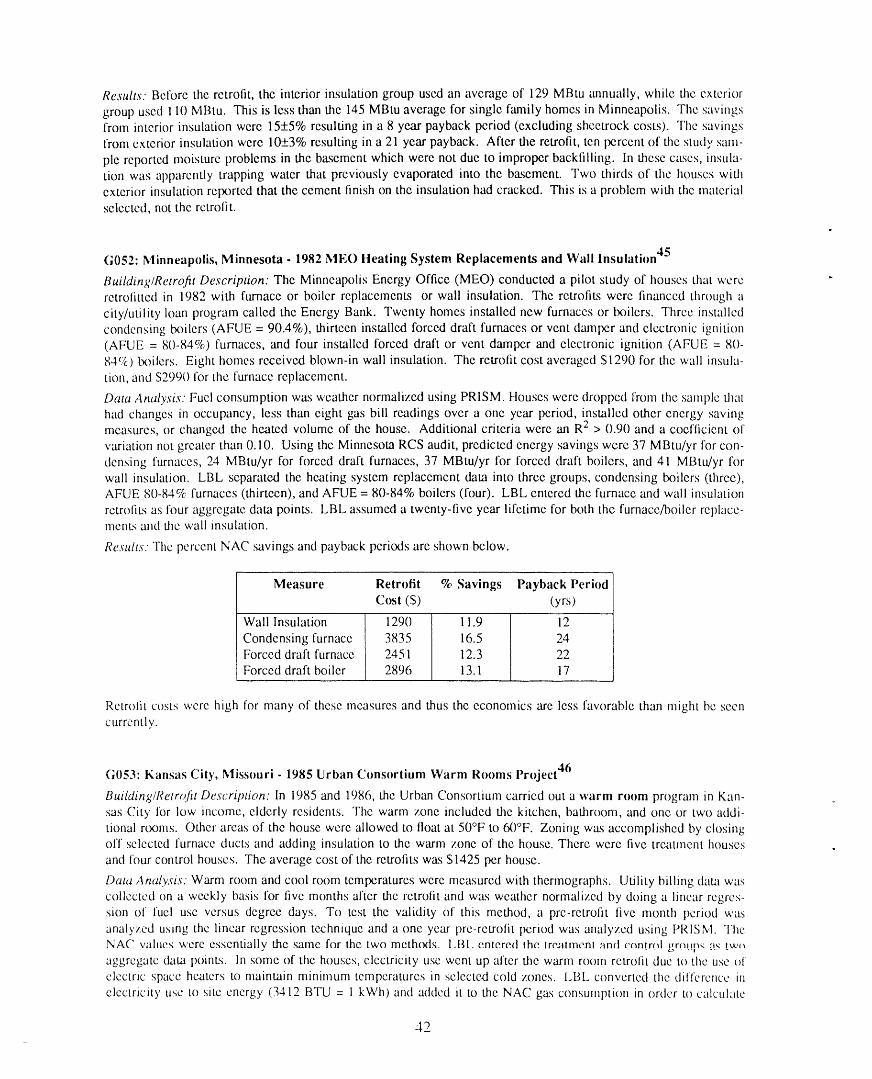
Results. Before the retrofit, the interior insulation group used an average of 129 MBtu annually, while the exterior
group used 110 MBtu. This is less than the 145 MBtu average for single family homes in Minneapolis. The savingsfrom interior insulation were 15+5% resulting in a 8 year payback period (excluding sheetrock costs). The savingsfrom exterior insulation were 10L-_3%resulting in a 21 year payback. After the retrofit, ten txzrcent of the study sand-
pie reported moisture problems in the basement which were not due to improper backfilling. In these cases, insula-tion was apparently trapping water that previously evaporated into the basement. Two thirds of the houses withexterior insulation retxmed that the cement finish on the insulation had cracked. This is a problem with the materialselected, not the retrofit.
(;052: Minneapolis, Minnesota - 1982 MEO lteating System Replacements and Wall Insulation 45
Building/Retrofit Description: The Minneapolis Energy Office (MEO) conducted a pilot study of houses that wereretrofitted in 1982 with furnace or boiler replacements or wall insulation. The retrofits were financed through a
city/utility loan program called the Encrgy Bank. Twenty homes installed new furnaces or boilers. Three installedcondensing boilers (AFUE = 90.4%), thirteen installed forced draft furnaces or vent damper and electronic ignition(AFUE = 80-84%) furnaces, and four installed forced draft or vent damper and electronic ignition (AFUE = 80-84%) 1×fliers. Eight homes received blown-in wall insulation. The retrofit cost averaged S1290 for the wall insula-tion, and $299() for the furnace replacement.
Data Analysis. Fuel consumption was weather normalized using PRISM. Houses were droppod from the sample thathad changes in occupancy, less than eight gas bill readings over a one year period, installed other energy savingmeasures, or changed the heated volume of the house. Additional criteria were an R2 > 0.90 and a coefficient of
variation not greater than 0.10. Using the Minnesota RCS audit, predicted energy savings were 37 MBtu/yr for con-densing furnaces, 24 MBtu/yr for forced draft furnaces, 37 MBtu/yr for forced draft boilers, and 41 MBtu/yr forwall insulation. LBL separated the heating system replacement data into three groups, condensing boilers (three),AFUE 80-84% furnaces (thirteen), and AFUE = 80-84% boilers (four). LBL entered the furnace and wall insulation
retrofit.,; as four aggregate data points. LBL assumed a twenty-five year lifetime for both the furnace/boiler rcplace-rnenL,;and the wall insulation.
Results. The percent NAC savings and payback periods are shown below.
Measure Retrofit % Savings Payback PeriodC_rst ($) (yrs)
Wall Insulation 1290 11.9 12
Condensing furnace 3835 16.5 24Forced draft furnace 2451 12.3 22Forced draft boiler 2896 13.1 17
Retrolit costs were high for many of these measures and thus the economics are less favorable than might be seencurrently.
(;1153: Kansas Cit)', Missouri - 1985 Urban Consortium Warm Rooms l'roject 46
Building/Retrofit Description." In 1985 and 1986, the Urban Consortium carried out a warm room program in Kan-sas City for low income, elderly residents. The warm zone included the kitchen, bathroom, and one or two addi-
tional r_xgms. Other areas of the house were allowed to float at 50°F to 60°F. Zoning was accomplished by closingoff selected furnace ducts and adding insulation to the warm zone of the house. There were five treaunent housesand four control houses. The average cost of the retrofits was $1425 per house.
Data Analysis. Warm room and cool room temperatures were measured with thermographs. Utility billing data wascollected on a weekly basis for five months after the retrofit and was weather normalized by doing a linear regres-sion of fuel use versus degree days. To test the validity of this method, a pre-retrofit live month period wasanalyzed using the linear regression technique and a one year pre-retrofit period was analyzed using PRISM. TheNAC, values; were essentially the same for the two meth(xis, l.BI. entered lhc Ire.alm_nl :_nct('cre!ml gm_.!p,_q.,_tu.,_aggregate _ktta points. In some of the houses, electricity use went up after the warm room retrofit due to the use ofelectric space heaters to maintain minimum temperatures in selected cold zones. LBL converted the difference inelectricity use to site energy (3412 BTU = 1 kWh) and added it to the NAC gas consumption in order to calculate
42
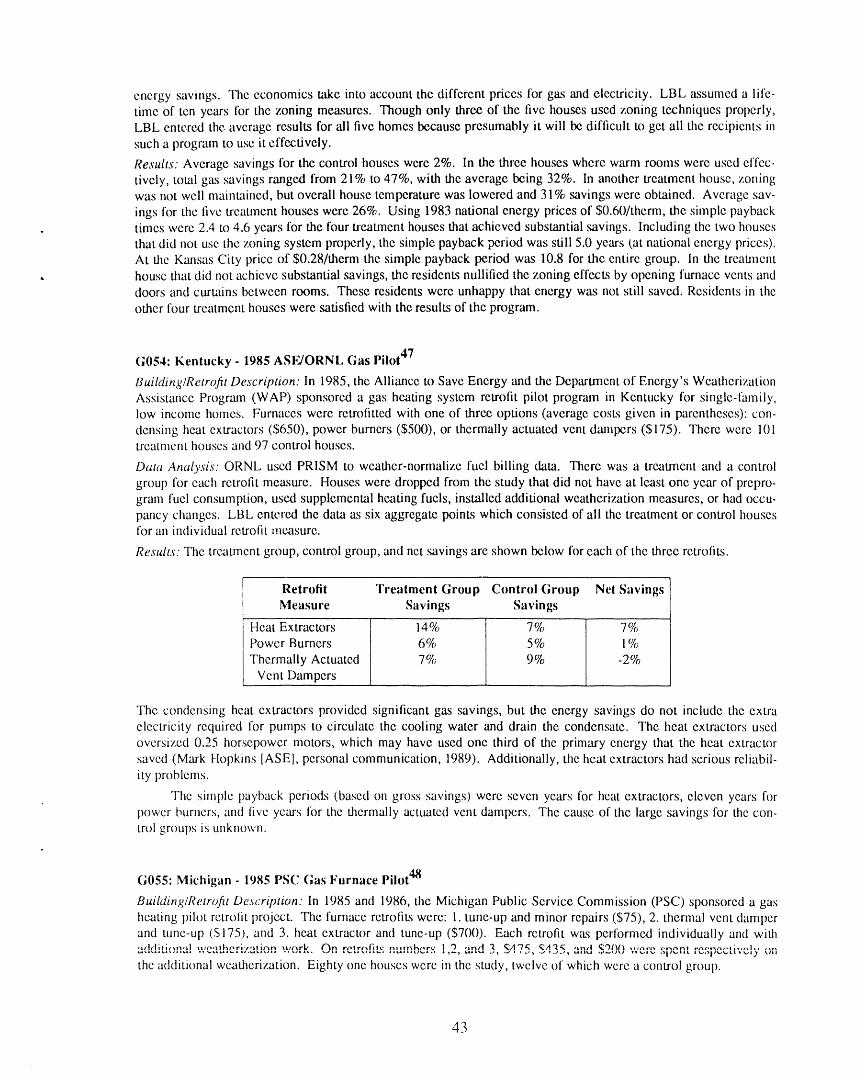
energy savings. The economics take into account the different prices for gas and electricity. LBL assumed a life-time of ten years for the zoning measures. Though only three of the five houses used zoning techniques properly,LBL entered the average results for ali five homes because presumably it will be difficult to get ali the recipients ill
such a program to use it effectively.
Results: Average savings for the control houses were 2%. In the three houses where warm rooms were used effec-tively, total gas savings ranged from 21% to 47%, with the average being 32%. In another treatment house, zoningwas not well maintained, but overall house temperature was lowered and 31% ,savings were obtained. Average sav-
ings for the live treatment houses were 26%. Using 1983 national energy prices of $0.60/therm, the simple paybacktimes were 2.4 to 4.6 years for the four treatment houses that achieved substantial savings. Including the two housesthat did not use the zoning system properly, the simple payback period was still 5.0 years I,at national energy prices).
At the Kansas City price of $0.28/therm the simple payback period was 10.8 for the entire group. In the treatment, house that did not achieve substantial savings, the residents nullified the zoning effects by opening furnace vents and
doors and curtains between rooms. These residents were unhappy that energy was not still saved. Residents in theothcr four treatment houses were satisfied with the results of the program.
G054: Kentucky - 1985 ASE/ORNL (;as Pilot 47
Building/Retrofit Description: In 1985, the Alliance to Save Energy and the Department of Energy's WeatherizationAssistance Program (WAP) sponsored a gas heating system retrofit pilot program in Kentucky for single-family,low income homes. Furnaces were retrotitted with one of three options (average cosL,_given in parentheses): con-
densing heat extractors (5650), power burners ($500), or thermally actuateA vent dtunpers ($175). There were 101treatment houses anti 97 control houses.
Data Analysis: ORNL used PRISM to weather-normalize fuel billing data. There was a treatment and a control
group for each retrofit measure. Houses were dropped from the study that did not have at least one year of prepro-gram fuel consumption, used supplemental heating fuels, installed additional weatherization measures, or had occu-pancy changes. LBL entered the data as six aggregate points which consisted of ali the treaunent or control housesfor an individual retroIit measure.
Results: The treatment group, control group, and net savings are shown below for each of the three retrofits.
Retrofit Treatment Group Control Group Net SavingsMeasure Savings Savings
Heat Extractors 14% 7% 7%
Power Burners 6% 5% 1%
Thermally Actuated 7% 9% -2%Vent Dampers
The condensing heat extractors provided significant gas savings, but the energy savings do not include the extraelectricity required for pumps to circulate the cooling water and drain the condensate. The heat extractors usedoversized 0.25 horsepower motors, which may have used one third of the primary energy that the heat extractorsavcxl (Mark Hopkins [ASE], personal communication, 1989). Additionally, the heat extractors had serious reliabil-ity problems.
The simple payback perio(ks (based on gross savings) were seven years for heat extractors, eleven years for
power burners, and live years Ibr the thermally actuated vent dampers. The cause of the large savings for the con-trol groups is tmknown.
G055: Michigan - 1985 PSC (;as Furnace Pilot 48
Building/Retr@t Description: In 1985 and 1986, the Michigan Public Service Commission (PSC) sponsored a gasheating pilot retrofit project. The furnace retrofits were: 1. tune-up and minor repairs ($75), 2. thermal vent damperand ttme-up (S175), and 3. heat extractor and tune-up ($700). Each retrofit wits performed individually and with•m_;,; ..... I .......,ho,-i.,,,i_,-, v.,_ark, n, _,.,_,,_;,........ _..... , 1 '_, ,,_a "_ $!"7_ $,_'_ and $200 -;'ere ...... ' .......... , ...._,,,)t,,.,,,_ _,-,ot,,..,..L_, _.,_y Oil
the additional weatherization. Eighty one houses were in the study, twelve of which were a control group.
43
Data Analysis: Utility billing data was collected from December 1984 through July 1986, though often not over theentire period for a given house. The data was weather normalized using PRISM. Only homes with at least threemonths of winter fuel consumption data and no supplemental fuel use were included in the analysis. The length of
the pre and post-retrolit monitoring period depended on when in the twenty month monitoring period that the retrotitwas done. The baseload was calculated by averaging the fuel consumption for the month with the least heating
degree days and the utility's estimate of baseload provldJ on the fuel consumption record. Space heating energyuse was calculated by subtracting off the baseload from the total fuel consumption. LBL entered data from the study
as seven aggregate points. One is the control group and the other six are the three furnace retroliks with and withoutweatherization. Base 65°F heating and cooling degree days were calculated by utking a weighted average of the
regions in the sample.
Tune-ups were assumed to have a five year lifetime. Hardware furnace modilications were assigned a twelve
year lifetime, roughly half the lifetime of an average furnace. Furnace hardware moditications combined with ,,weatherizati¢m were given a ten year lifetime. The combination was assumed to have the lifetime of weatherizationmeasures since the only statistically significant savings were from weatherization. LBl_, used a lifetime of ten yearsrather than liftecn ye_u-s because the low cost of weatherization implies short term mea_sures like caulking andweatherstripping.
Results: None of the furnace retrofits showed statistically significant savings by themselves. However, ali of thefurnace retrofits showed significant savings when combined with additional weatherization measures. With theadditional weatherization measures, the gross percentage fuel savings were 17% for tune-ups (SPT = 7 years), 19%for vent dampers (SPT = 6 years) and 9% tbr heat extractors (SPT = 16 years). For a larger data set that did not
screen for supplemental heating fuels or a minimum of three winter heating fuel bills, the savings were much largerfor heat extractors (18.2%), but not radically different for other measures. Heat extractors were subject to ficquentoperational problems and have additional electricity costs from pumps that circulate water and drain the condensate.The authors of the study do not recommend heat extractors due to their reliability problems.
G056: Ohio- 1985 LIW 49
Building/Retrofit Description." In 1985, 13,427 low income homes were weatherized by the state of Ohio. Generalheat waste (GtIW) measures were assigned the first priority for ali houses. GHW measures include: heating unittune-up, water heater tank wrap, infiltration reduction, sealing of thermal bypasses. Floor, attic, and sidewall insula-tion and storm windows were done with the money left over after GHW measures were installed. (Wall insulation
was generally loose cellulose fill - not high density blown cellulose). Sufficient data was collected to analyze 1083treatment homes and 356 control homes. The control homes were selected from a group eligible for the progran_but which had not received prior weatherization work. An average of S1800 per house was spent on weatherizalion.
Data Analysis. Utility billing data was weather normalized using PRISM. Homes were excluded that had auxiliaryheat or did not have at least nine readings in both the pre- and post-weatherization years. LBL assumed a fifteen
year lifetime for the retrolit packages and entered the data as two aggregate Ix)inks: the treatment and the controlhomes. Based on data in the Residential Energy Consumption Survey for houses in this degree clay range, LBLassumed that 75_ of the pre-retrotit NAC was used for space heating (EIA 1989).
Results: Retrolit packages that emphasized insulation measures were found to be the most cost-effective. Units with
a large tx:rcenmgc of the money spent on general heat waste measures had low or negative savings. Consumption inthe treatment group decreased from 153 MBtu before the retrofit to 136 MBtu after the retrolit (11 percent savings).The simple payback period is 18 years. The control group consumption increased 10 percent in the second year ofmonitoring, but no explanation is provided for this dramatic increase.
G057: Wisconsin .- 1982 l.lW 50
13uildinURe.trv_it l)escription: An evaluation of Wisconsin's 1982 low inconm weatherization program analyzed atreatment gr,mp consisting of 243 houses and a control group of 46 homes weatherized in the next year (1983) olthe program. (The control houses were not weatherized during the study period). Weatherization measures andsaturations arc sh()wn below.
44
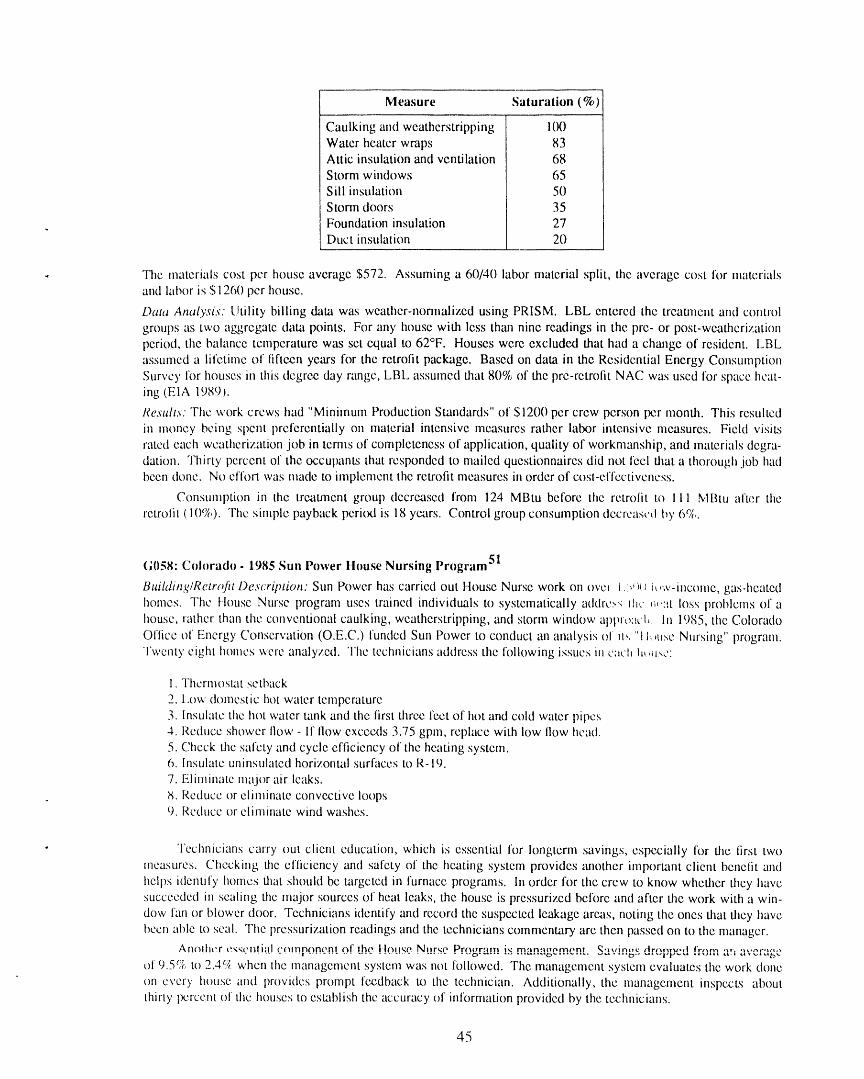
Measure Saturation (%)
Caulking and weatherstripping 100Water heater wraps 83Attic insulation and ventilation 68
Storm windows 65S iii insulation 50
Storm doors 35Foundation insulation 27Duct insulalion 20
, ,
, Tile materials cost per house average $572. Assuming a 60/40 labor material split, tile average cost for materialsand labor is $1260 per house.
Data Analysis. Utility billing data was wcathcr-norm',dized using PRISM. LBL entered the trcauncnt and controlgroups as two aggregatc data points. For any house with less than nine readings in the pre- or post-weatherizationperiod, the balance temperature was set equal to 62°F. Houses were excluded that had a change of resident. LBL
assumed a lifetime of iiftcen years for the retrofit package. Based on data in the Residential Energy ConsumptionSurvey for houses in this degree day r,'mge, LBL assumed that 80% of the pre-retrofit NAC was used for space heat-ing (EIA 1989).
Results: The work crews had "Minimum Production Standards" of $1200 per crew person l×',r month. This resultedin money being spent preferentially on material intensive measures rather labor intensive measures. Field visitsrated each weatherization job in terms of completeness of application, quality of workmanship, and materials degra-dation. Thirty percent of the occupants that responded to rnailed questionnaires did not fcel that a thorough job hadbeen done. No effort was made to implement the retrofit measures in order of cosl-effectiveness.
Consumption in the treaunent group decreased from 124 MBtu before the retrolit tt_ 111 MBtu after the
retrolit (10%). The simple payback peri_xl is 18 years. Control group consumption decrcasc_l by 6%.
51(;058: Colorado - 1985 Sun Power House Nursing Program
Building/Retrofit Description." Sun Power has carried out House Nurse work on o,,'c_ i :;')_ i_,w-inconm, gas-heatedhomes. The ttouse Nurse program uses trained individuals to systematically addrc.,,< It_c _,,'::t loss problenas of ahouse, rather than the conventional caulking, weatherstripping, and storm window apprt_zwl, In 1985, the Colorado
Ofiice of Energy Conservation (O.E.C.) funded Sun Power tc) conduct an analysis of iI_:"t I.,,u_c Nursing" program.Twenty eight homes were analyzed. The technicians address the following issue.,; in c:_c'l_Itr,iJ.,c':
1. Thcrmoslat setback
2. lx)w domestic hot water temperature3. Insulate the hot water tank and the first three feet of hot and cold water pipes4. Reduce shower flow - If llow excetxls 3.75 gpm, replace with low tlow head.5. Check the safety and cycle efficiency of the heating system.6. Insulate t'ninsulated horizontal surfaces to R-19.
7. Eliminate major air leaks.
, :,,;.Reduce or eliminate convective loops9. Reduce or eliminate wind washes.
" Technicians carry out client education, which is essential for longterm savings, especially for the first twomeasures. Checking the efliciency and safety of the heating system provides another important client benelit and
helps identify homes that should be targeted in furnace programs. In order R)r the crew to know whether they havesucceeded in sealing the major sources of heat leaks, the house is pressurized before and after the work with a win-
dow fan or blower door. Technicians identify and record the suspected leakage areas, noting the ones that they havebeen able to seal. The pressurization readings and the technicians commenuary are then passed on to the manager.
Arn_ther e,_,_enlialc_mp_m_'nw_t" lhc tq_.l,_eN,Irqc' Program i,_m;_n;_gnment _,_,,ing_'dr,,,,p,pe,! _',',,,-,at: '1..........of 9.5% to 2.4(_/,when the management system was not followed. The management system evaluates the work done
on evcry house and provides prompt feedback to the technician. Additionally, the management inspects aboutthirty l×:rcent of the houses to establish the accuracy of information provided by the tc,chnicians.
45
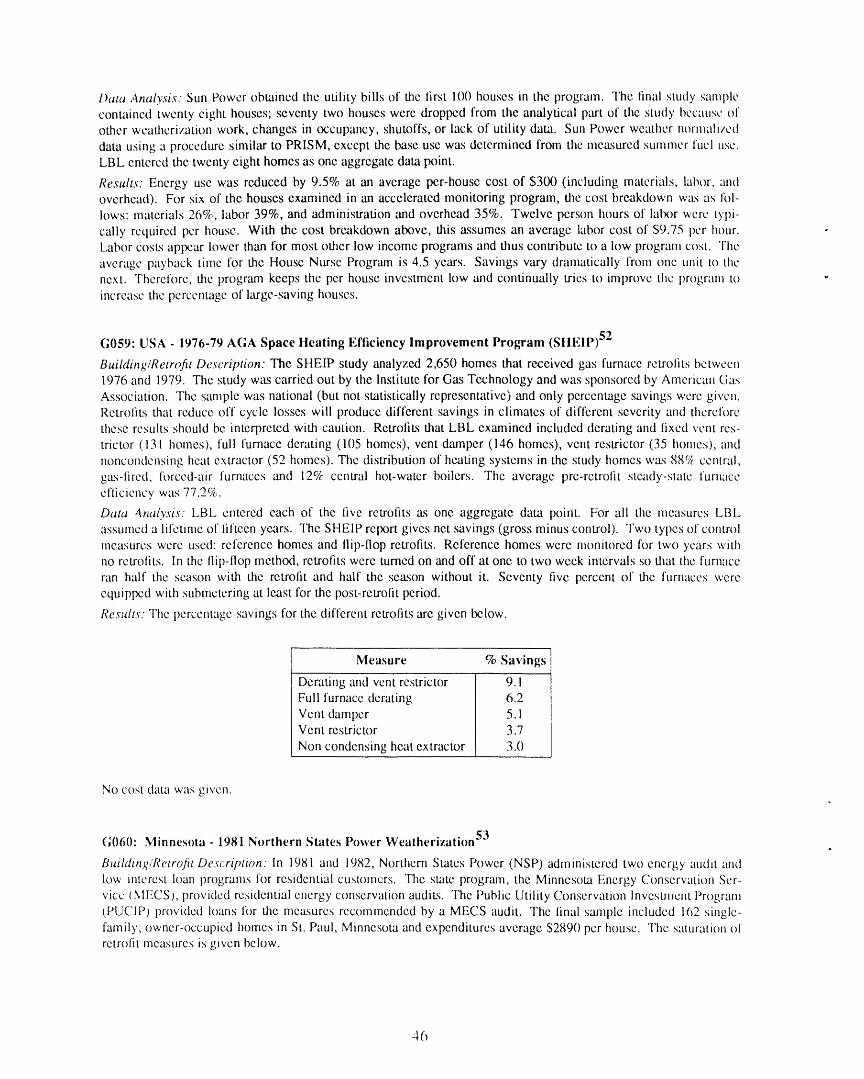
Data Analysis. Sun Power obtained the utility bills of the Iirst 100 houses in the program. 3'he final study samplecontained twenty eight houses; seventy two houses were dropped from the analytical part of the study because ofother weatherization work, changes in occupancy, shutoffs, or lack of utility data. Sun Power weather normalized
data using a procedure similar to PRISM, except the base use was determined from the measured summer fuel use.LBL entered the twenty eight homes as one aggregate data point.
Results." Energy use was reduced by 9.5% at an average pcr-house cost of $300 (including materials, labor, andoverhead). For six of the houses examincd in an accelerated monitoring program, the cost breakdown was as lbl-
lows: materials 26%, labor 39%, and administration zmd overhead 35%. Twelve person hours of labor were typi-
cally required per house. With the cost breakdown above, this assumes an average labor cost of S9.75 per hour.Labor costs apwar lower than for most other low income programs and thus contribute to a low program cost. Theaverage payback time for the Housc Nurse Program is 4.5 years. Savings vary dramatically from one unit to thenext. Therefore, the progrzun keeps the per house investmcnt low and continually tries to improve the program to "
increase the percentage of large-saving houses.
G059: USA - 1976-79 AGA Space Heating Efficiency Improvement Program (StlEIP) 52
Building/Retrofit Description: The SHEIP study analyzed 2,650 homes that received gas furnace retrolits between1976 and 1979. The study was carried out by the Institute for Gas Technology and was sponsored by American Gas
Association. The sample was national (but not statistically representative) and only percentage savings were given.Retrolits that reduce off cycle losses will produce different savings in climates of different severity and thereforethese results should be interpreted with caution. Retrofits that LBL examined included derating and fixed vent res-trictor (131 homes), full furnace derating (105 homes), vent damper (146 homes), vent restrictor (35 homes), and
noncondensing heat extractor (52 homes). The distribution of heating systems in the study homes was 88% central,gas-fired, forced-air furnaces and 12% central hot-water boilers. The average prc-retrolit steady-state furnaceefficiency was 77.2%.
Data 4nalysis. LBL entered each of the live retrofits as one aggregate data point. For ali the measures LBLassumed a lifetime of fifteen years. The SHEIP report gives net savings (gross minus control). Two types of controlmeasures were used: reference homes and llip-flop retrofits. Reference homes were monitored for two years withno retrofits. In the tlip-tlop method, retrofits were turned on and off at one to two week intervals so that the furnaceran half the season with the retrofit and hall the sea;on without it. Seventy five percent of the furnaces were
equipped with submetering at least for the post-retrofit period.
Results: The percentage savings for the different retrofits arc given below.
Measure % Savings
Derating and vent restrictor 9.1Full furnace derating 6.2
Vent damper 5.1Vent restrictor 3.7
Non condensing heat extractor 3.0
No cost data was given.
(;060: Minnesota - 1981 Northern States Power Weatherization 53
Building/Retrofit Description: In 1981 and 1982, Northern States Power (NSP) administered two energy audit andlow interest loan programs for residential customers. The suite program, the Minnesota Energy Conservation Ser-vlcc IMECS), provided residential energy conservation audits. The Public Utility Conservation InvestnJcnt Program(PUCIP) provided loans for the measures recommended by a MECS audit. The linal sample included 162 single-family, owner-occupied homes in St. Paul, Minnesota and expenditures average $2890 pcr house. The saturation ofretro[it measures is given below.
46
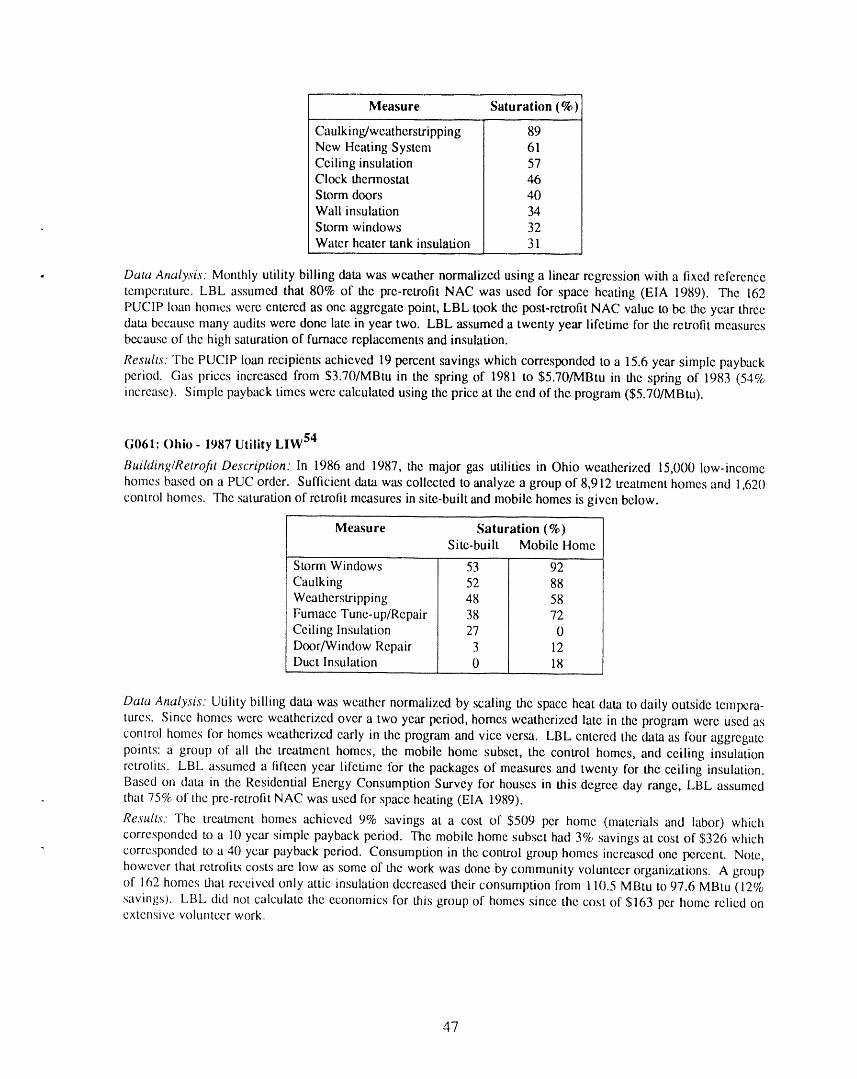
M easure Satu ration (%)
Caulking/weatherstripping 89New Heating System 61Ceiling insulation 57Clock thermostat 46Storm doors 40Wall insulation 34Storm windows 32Water heater tank insulation 31
,,
, Data Analysis: Monthly utility billing data was weather normalized using a linear regression with a fixed reference
temperature. LBL assumed that 80% of the pre-retrofit NAC was used for space heating (EIA 1989). The 162PUCIP loan homes were entered as one aggregate point, LBL took the post-retrofit NAC value to be the year threedata beeause many audits were done late in year two. LBL assumed a twenty year lifetime for the retrofit measuresbecause of the high saturation of furnace replacements and insulation.
Results: The PUCIP loan recipients achieved 19 percent savings which corresponded to a 15.6 year simple paybackperiod. Gas prices increased from $3.70/MBtu in the spring of 1981 to $5.70/MBtu in the spring of 1983 (54%increase). Simple payback times were calculated using the price at the end of the program ($5.70/MBtu).
(;1161: Ohio- 1987 Utility LIW 54
Building/Retrofit Description: In 1986 and 1987, the major gas utilities in Ohio weatherized 15,000 low-incomehomes based on a PUC order. Sufficient data was collected to analyze a group of 8,912 treatment homes and 1,620control homes. The saturation of retrofit measures in site-built and mobile homes is given below.
Measure Saturation (%)Site-built Mobile Home
Storm Windows 53 92
Caulking 52 88Weatherstripping 48 58
Furnace Tune-up/Repair 38 72Ceiling Insulation 27 0
Door/Window Repair 3 12Duct Insulation 0 18
Data Analysis: Utility billing data was weather normalized by scaling the space heat data to daily outside tempera-tures. Since homes were weatherized over a two year period, homes weatherized late in the program were used ascontrol homes for homes weatherized early in the program and vice versa. LBL entered the data as four aggregatepoints: a group of ali the treatment homes, the mobile home subset, the control homes, and ceiling insulationretrotits. LBL assumed a tilteen year lifetime for the packages of measures and twenty for the ceiling insulation.Based on data in the Residential Energy Consumption Survey for houses in this degree day range, LBL assumedthat 75% of the pre-retrofit NAC was used for space heating (EIA 1989).
Results. The treatment homes achieved 9% savings at a cost of $509 per home (materials and labor) whichcorresponded to a 10 year simple payback period. The mobile home subset had 3% savings at cost of $326 whichcorresponded to a 40 year payback period. Consumption in the control group homes increased one percent. Note,
however that retrofits costs are low as some o1"the work was done by community volunteer organizations. A groupof 162 homes that received only attic insulation decreased their consumption from 110.5 MBtu to 97.6 MBtu (12%savings). LBL did not calculate the economics for this group of homes since the cost of $163 pcr home relied onextensive volunteer work.
47
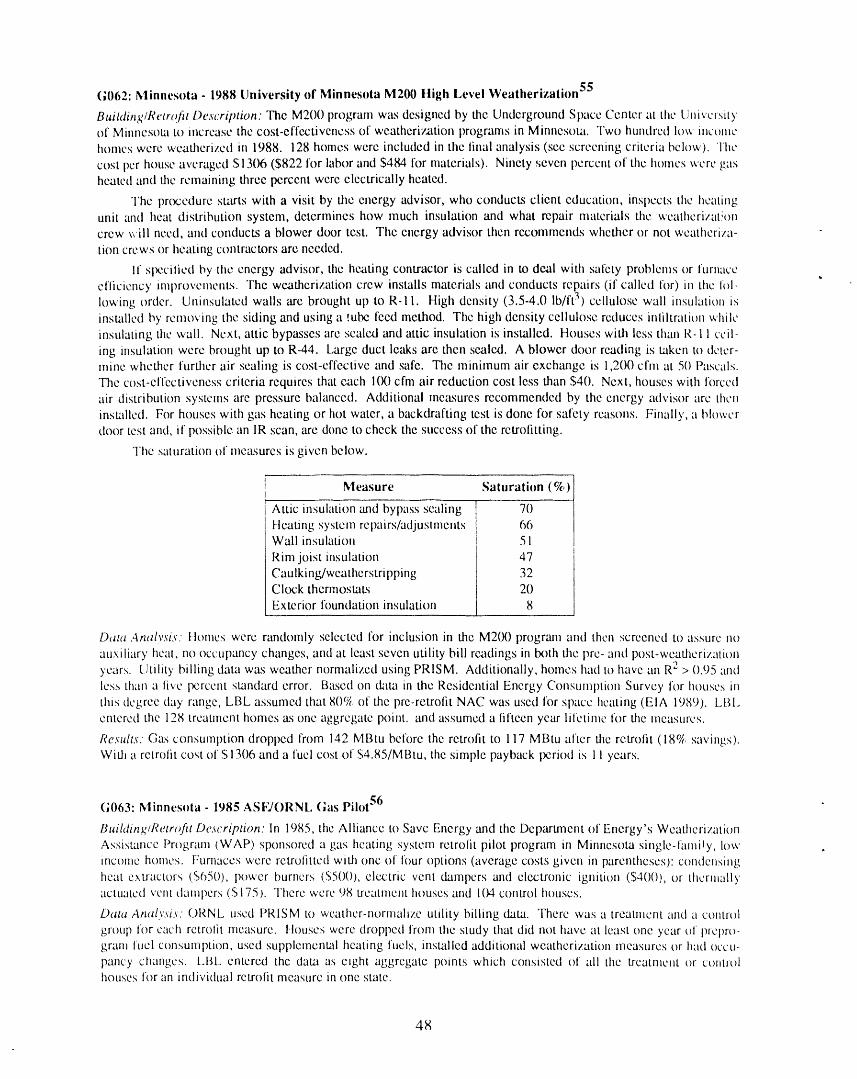
(;062: Minnesota - 1988 University of Minnesota M200 tligh Level Weatherization 55
Building/Retrofit Description: The M200 program w:Lsdesigned by the Underground Space Center :it tile tJtlivcrsityof Minnesota to increase the cost-effectiveness of weatherization programs in Minnesota. Two hundrctl low Jnc:rulehomes wcrc wcathcrizcd in 1988. 128 homes were included in the iinal analysis (see screening criteria below). The
cost per house averaged $1306 ($822 for labor and $484 for materials). Ninety seven percent of the homes were gasheated and the remaining three percent were electrically heatexl.
The procedure starts with a visit by the energy advisor, who conducts client education, inspects the heatingunit arid heat distribution system, determines how much insulation and what repair materials the weatherizat!oncrew will need, and conducts a blower door test. The energy advisor then rccommends whether or not weatheriza-
tion crews or heating contractors are needed.
If Sl×',cilied by the energy advisor, the heating contractor is called in to deal with safety problems or furnaceefliciency imlmwemcnLs. The weatherization crew installs materials and conducts repairs (if called for) in the lift-
lowing order. Uninsulatcd walls _ue brought up to R-II. High density (3.5-4.0 lb/ft 3) cellulose wall insulation isinstalled by removing the siding and using a :ube feed method. The high density cellulose reduces inliltratitm while
insulating the wall. Next, attic bypasses are scaled and attic insulation is installed. Houses with less than R-11 ceil-ing insulation were brought up to R-44. Large duct leaks are then sealed. A blower door reading is taken to deter-mine whether fur:hor air scaling is cost-cffectivc and safe. Thc minimum :airexchange is 1,200 cfm at 50 Pascals.The cost-effectiveness criteria requires that each lD() cfm air reduction cost less than $40. Next, houses with forcedair distribution systems are pressure balanced. Additional measures recommended by the energy advisor are theninstalled. For houses with gas heating or hot water, a backdrafting test is done tk)r safety reasons. Finally, a blowerdoor test and, if possible an lR scan, are done to check the success of the retrofitting.
The saturation of measures is given below.
Measure Saturation (%)
Attic insulation and bypass scaling 70Heating system repairs/adjustments 66Wall insulation 51
Rim joist insulation 47
Caulking/weatherstripping 32Clock thermos:aLs 20Exterior fl)undation insulation 8
Data ,4nalvsis: tlomes were randomly selected for inclusion in the M200 program and then screened to assure noauxiliary heat, no occupancy changes, and at least seven utility bill readings in t'x)th the pre- and post-weatherizatitmyears, tJtility billing data was weather normalized using PRISM. Additionally, homes had to have an R2 > 0.95 and
less than a live tx'.rcent standard error. Based on data in the Residential Energy Consumption Survey for houses inthis degree day range, LBL assumed that 80% of the prc-retrolit NAC was used lk_rspace heating (EIA 1989). LBl.entered the 128 treatment homes as one aggregate point, and assure:xi a tiftecn year lifetime for the measures.
Results. Gas consumption dropped from 142 MBtu before the retrofit to 117 MBtu after the retrotit (18% savings).Widt a retrotit cost of $1306 and a fucl cost of $4.85/MBtu, the simple payback tx_riod is 1! years.
(;(163: Minnesota - 1985 ASF7ORNL Gas Pilot 56
Building/Retrofit Description: In 1985, the Alliance to Save Energy and the Dcparuncnt of Energy's WeatherizationAssistance Prc_gram (WAP) sponsored a gas heating system retrolit pilot program ira Minnesota single-family, lowinor)file h(.)llaCs. _-:UrllaCCS were retroiitted with one of four options (average costs given in parentheses): condensingheat extractors (S650), power burners (S500), electric vent dampers and electronic ignition ($40()), or thcrt_mllyactuated vent dampers ($175). There were 98 treatment houses anti 104 control houses.
Data Analy,si,v. ORNL used PRISM to wcathcr-nor|nalizc utility billing data. There was a treatnlent and a contrc)lgroup for each retrolit measure. Houses were dropped from the study that did not have at least one year of preprt_-gram fuel consumption, used supplemental heating fuels, installed additional weatherization measures or had occu-
pancy changes, t,BL entered the data as etght aggregate points which consisted of :til the treatn_ent or ct)l_trolhouses for an individual retrofit measure in one state.
48
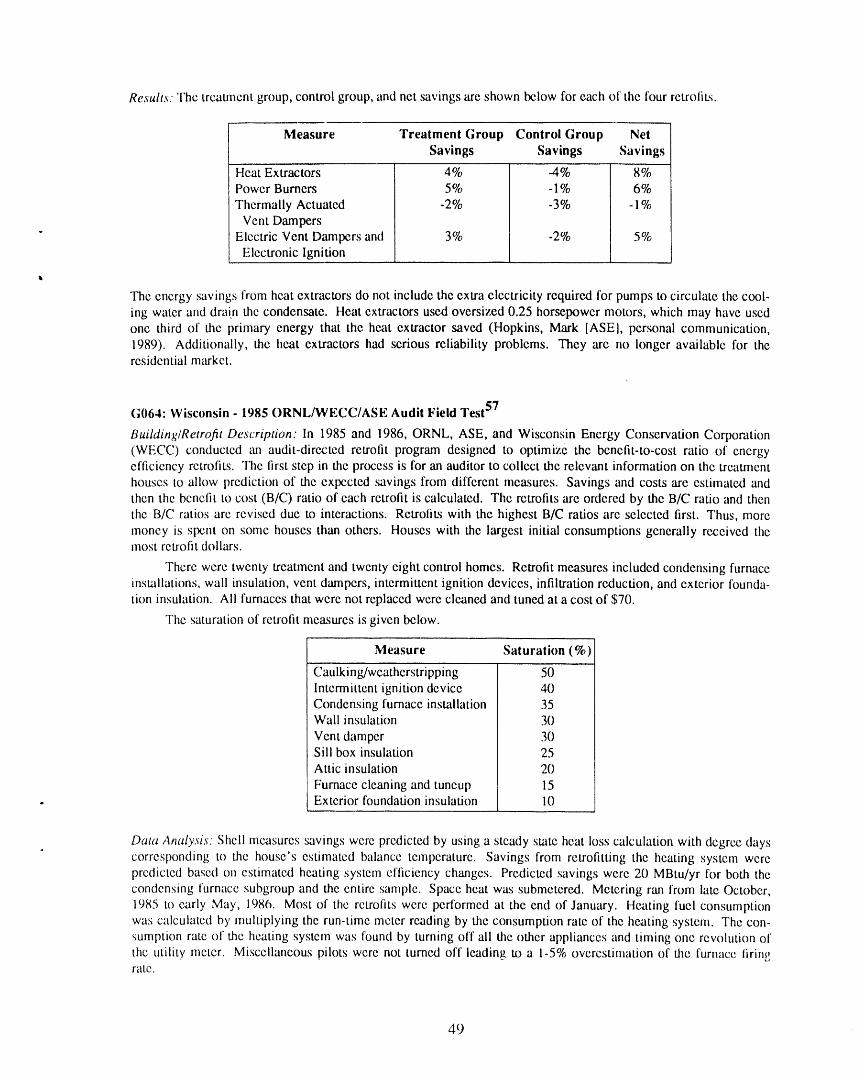
Results. The treaunent group, control group, and net savings are shown below for each of the four retrofit.s.
Measure Treatment Group Control Group Net
Savings Savings Savings
Heat Extractors 4% -4% 8%Power Burners 5% -1% 6%
Thermally Actuated -2% -3% - 1%Vent Dampers
" Elcctric Vent Dampers and 3% -2% 5%Electronic Ignition
The energy savings from heat extractors do not include the extra electricity required for pumps to circulate the cool-ing water and drain the condensate. Heat extractors used oversized 0.25 horsepower motors, which may have usedone third of the primary energy that the heat extractor saved (Hopkins, Mark [ASE], personal communication,1989). Additionally, the heat extractors had serious reliability problems. They are no longer available for theresidential market.
(;064: Wisconsin - 1985 ORNL/WECC/ASE Audit Field Test 57
Building/Retrofit Description." In 1985 and 1986, ORNL, ASE, and Wisconsin Energy Conservation Corporation
(WECC) conducted an audit-directed retrofit program designed to optimize the benefit-to-cost ratio of energyefficiency retrofits. The first step in the process is for an auditor to collect the relevant information on thc treatmenthouses to allow prediction of the expected savings from different measures. Savings and costs are estimated andthen the benefit to cost (B/C) ratio of each retroft is calculated. The retrofits are ordered by the B/C ratio and thenthe B/C ratios are revised due to interactions. Retrofits with the highest B/C ratios are selected first. Thus, more
money is spent on some houses than others. Houses with the largest initial consumptions gcneraily received themost retrofit dollars.
There were twenty treatment and twenty eight control homes. Retrofit measures included condensing furnaceinstallations, wall insulation, vent dampers, intermittent ignition devices, infiltration reduction, and exterior founda-tion insulation. Ali furnaces that were not replaced were cleaned and tuned at a cost of $70.
The saturation of retrofit measures is given below.
Measure Saturation (%)
Caulking/weatherstripping 50Intermittent ignition device 40Condensing furnace installation 35Wall insulation 30
Vent damper 30Sill box insulation 25Attic insulation 20
Furnace cleaning and tuneup 15. Exterior foundation insulation 1()
Data Analysis. Shell measures savings were predicted by using a steady state heat loss calculation with degree clays4
corresponding to the house's estimated balance temperature. Savings from retrofitting the heating system werepredicted based cm estimated heating system effciency changes. Predicted savings were 20 MBtu/yr for both thecondensing furnace subgroup and the entire sample. Space heat was submetered. Metering ran from late October,
1985 to early May, 1986. Most of the retrofits were performed at the end of January. Heating fuel consumptionwas calculated by multiplying the run-time meter reading by the consumption rate of the heating system. The con-sumption rate of the heating system was found by turning off ali the other appliances and timing one revolution of
the utility meter. Miscellaneous pilots were not turned off leading to a 1-5% overestimation of the furnace firingrate.
49
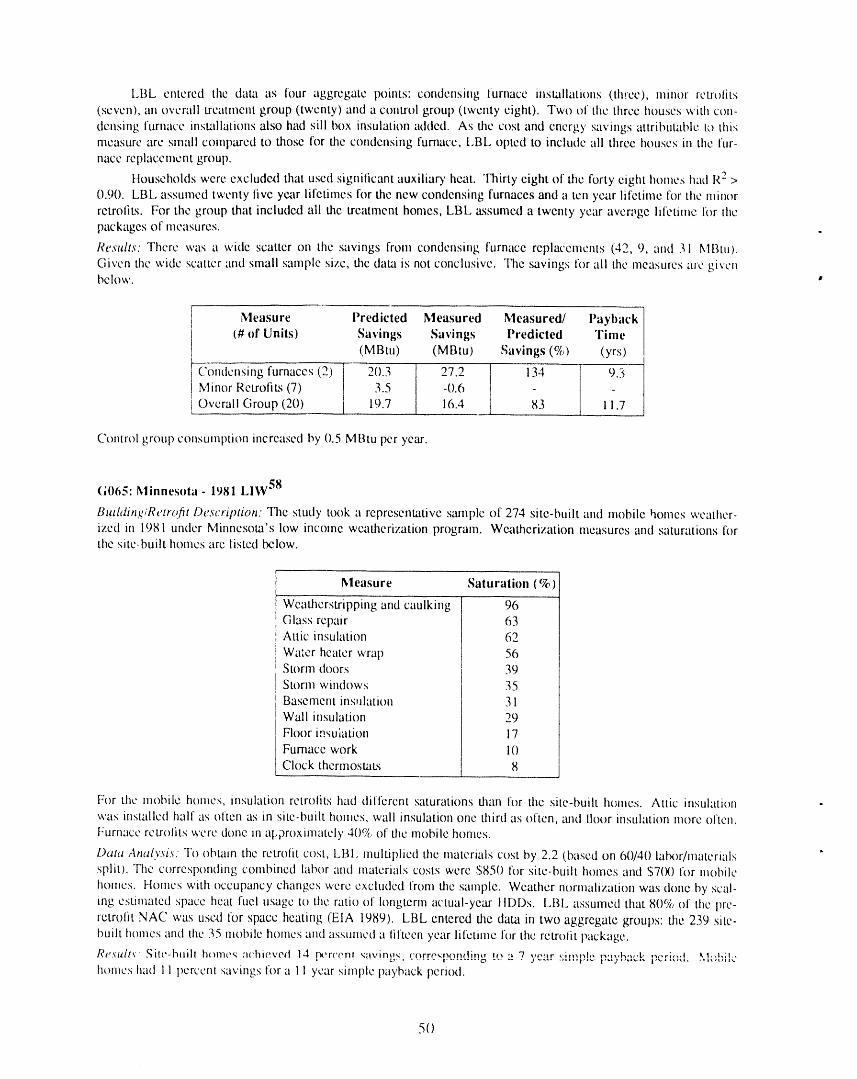
LBL entered the data as four aggregate points: condensing furnace installations (,th:ce), minor rctrt)lits(seven), an overall treatment group (twenty) and a conm)l group (twenty eight). Two of the three houses with con-
dmlsing furnace installations also had sill box insulation added. As the cost and energy savings attributabh:, to thismeasure are small comp_ued to those for the condensing furnace, LBL opted to include ali three houses in the fur-
nace replacement group.
Households were excluded that used significant auxiliary he_lt. Thirty eight of the forty eight homes had R2 >0.90. LBL assumed twenty live year lifetimes for the new condensing furnaces and a ten },,ear lifetime for the minor
retroliLs. For the group that included ali the treatment homes, LBL assumed a twenty year average lifetime for thepackages of nmasures.
Resuhs. There was a wide scatter on the savings from condensing furnace replacements (42, 9, and 31 MP,tu).
Given the wide scatter and small sample size, the data is not conclusive. The savings for ali the measures are givenbelow, a
Measure Predicted Measured Measured/ l'aybacki# of Units) Savings Savings Predicted Time
(MBtu) (MBtu) Savings (%) (yrs)
Condensing furnaces (2) 20.3 27.2 134 9.3Minor Retrofits (7) 3.5 -0.6
t
Overall Group (20) 19.7 16.4 83 11.7
Control group consumption increased by 0.5 MBtu per year.
(;065: Minnesota- 1981 LIW 58
Buihting/Retrofit Description." The study took a representative stmiple of 274 site-built and mobile homes weather-ized in 1981 under Minnesota's low income weatherization program. W_itherization measures and saturations forthe site-built homes are listed below.
Measure Saturation (%)
Weatherstripping and caulking 96Glass repair 63Attic insulation 62
Wa_er heater wrap 56Storm doors 39
Storm windows 35Basement insulation 31Wall insulation 29Floor i.qsulation 17Furnace work 10Clock thermostat.s 8
For the mobile homes, insulation retroliLs had different saturations than for the site-built homes. Attic insulationwas installed half as often as in site-built homes, ,,vail insulation one third as often, and lloor insulation more often.Furnacc retr()lits were done in at.proximatcly 40% of the mobile homes.
Data Analvsi._ "I'()obtain the retrolit cost, LBl. multiplied the materials cost by 2.2 (based on 60/40 latx)r/materialssplit). The corresponding combined labor and materials costs were $850 for site-built homes and ST(X) for mobile
hon:es. Homes with occupancy changes were excluded from the sample. Weather m)rmalization was done by scal-ing estimated space heat fuel usage to the ratio of longterm actual-year IIDDs. I..BI. assumed that 80% of the pre-
rctroiit NAC was used for space heating (EIA 1989). LBL entered the data in two aggregate groups: the 239 site-built homes and the 35 mobile homes and assumed a litteen year lifetime for the retrolit package.lee.vultv Site-huill htmae,_ :mhie','ed 14 l-v.'r('enl ,qavint, v ('orro,_non,lin_, t_ :_ '7 _,o;_r _.;m,'d ........ I...... t- ,.... ;,,,; _,1.,I,;I.,
i ........ ¢_.-1 ....... I[.......... O ..... g _¢1 ,_lill|,i_.. _1_6,/i t.*tl_l_ tt_.. i ilk/kl, l_,lllltllk
homes had 11 percent savings for a 11 year simple payback period.
5()
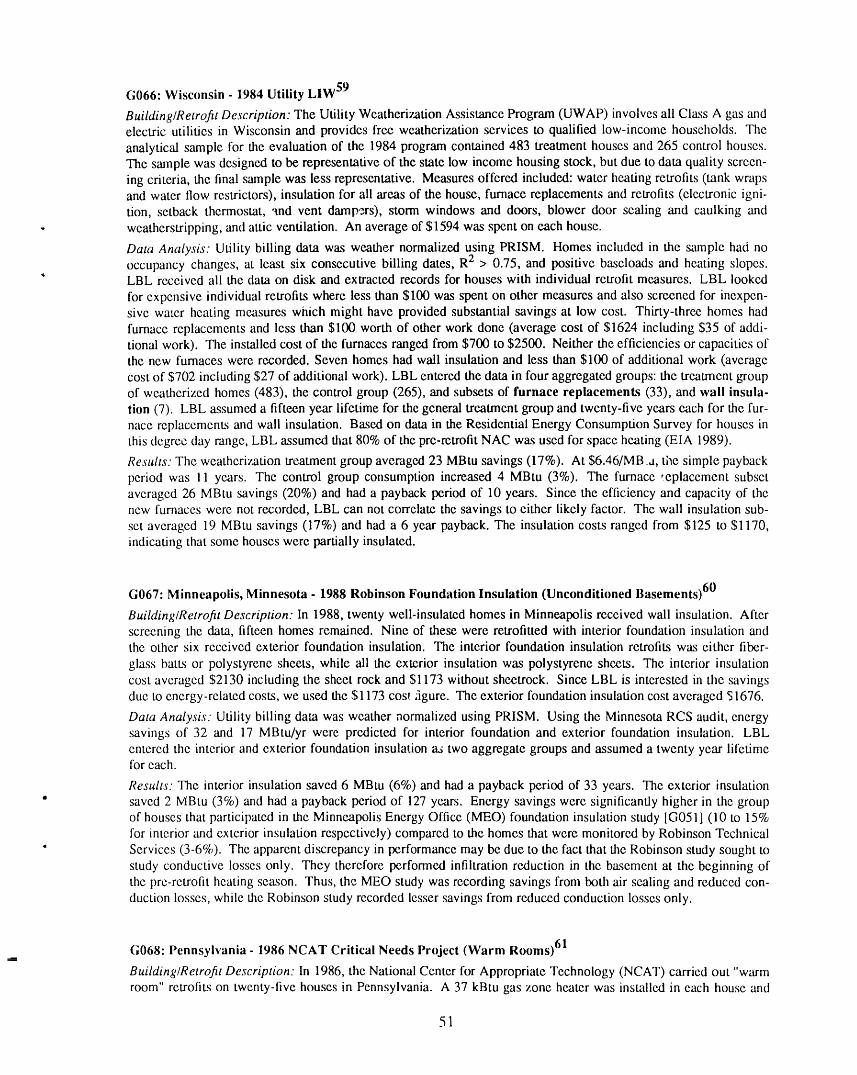
G066: Wisconsin - 1984 Utility LIW 59
Building/Retrofit Description: The Utility Weatherization Assistance Program (UWAP) involves ali Class A gas andelectric utilities in Wisconsin and provides free weatherization services to qualified low-income households. The
analytical sample for the evaluation of the 1984 program contained 483 treatment houses and 265 control houses.The stuuple was designed to be representative of the state low income housing stock, but due to data quality screen-ing criteria, the final sample was less representative. Measures offered included: water heating retrofits (tank wrapsand water flow restrictors), insulation for ali areas of the house, furnace replacements and retrofits (electronic igni-tion, setback thermostat, and vent damp,?,rs), storm windows and doors, blower door sealing and caulking and
- weatherstripping, and attic ventilation. An average of $1594 was spent on each house.
Data Analysis." Utility billing data was weather normalized using PRISM. Homes included in the sample had no
occupancy changes, at least six consecutive billing dates, R2 > 0.75, and positive baseloads and heating slopes._' LBL received ali the data on disk and extracted records for houses with individual retrofit measures. LBL looked
for expensive individual retrofits where less than $100 was spent on other measures and also screened for inexpen-sive water heating measures which might have provided substantial savings at low cost. Thirty-three homes hadfurnace replacements and less than $100 worth of other work done (average cost of $1624 including $35 of addi-tional work). The installed cost of the furnaces ranged from $700 to $2500. Neither the efficiencies or capacities ofthe new fumaces were recorded. Seven homes had wall insulation and less than $100 of additional work (average
cost of $702 including $27 of additional work). LBL entered the data in four aggregated groups: the treatment groupof weatllerized homes (483), the control group (265), and subsets of furnace replacements (33), and wall insula-
tion (7). LBL assumed a fifteen year lifetime for the general treatment group and twenty-five years each for the fur-nace replacements and wall insulation. Based on data in the Residential Energy Consumption Survey for houses inthis degree day range, LBL assumed that 80% of the pre-retrofit NAC was used for space heating (EIA 1989).
Results: The weatherization treatment group averaged 23 MBtu savings (17%). At $6.46/MB .a, the simple payback
period was 11 years. The control group consumption increased 4 MBtu (3%). The furnace ,eplacement subsetaveraged 26 MBtu savings (20%) and had a payback period of 10 years. Since the efficiency and capacity of thenew furnaces were not recorded, LBL can not correlate the savings to either likely factor. The wall insulation sub-
set averaged 19 MBtu savings (17%) and had a 6 year payback. The insulation costs ranged from $125 to $1170,indicating that some houses were partially insulated.
G067: Minneapolis, Minnesota - 1988 Robinson Foundation Insulation (Unconditioned Basements) 60
Building/Retrofit Description: In 1988, twenty well-insulated homes in Minneapolis received wall insulation. Afterscreening the data, fifteen homes remained. Nine of these were retrofitted with interior foundation insulation andthe other six received exterior foundation insulation. The interior foundation insulation retrofits was either fiber-
glass batt.s or polystyrene sheets, while ali the exterior insulation was polystyrene sheets. The interior insulationcost averaged $2130 including the sheet rock and $1173 without sheetrock. Since LBL is interested in the savingsdue to energy-related costs, we used the $1173 cost figure. The exterior foundation insulation cost averaged $1676.
Data Analysis: Utility billing data was weather normalized using PRISM. Using the Minnesota RCS audit, energysavings of 32 and 17 MBtu/yr were predicted for interior foundation and exterior foundation insulation. LBLentered the interior and exterior foundation insulation as two aggregate groups and assumed a twenty year lifetimefor each.
Results: The interior insulation saved 6 MBtu (6%) and had a payback period of 33 years. The exterior insulation• saved 2 MBtu (3%) and had a payback period of 127 years. Energy savings were significantly higher in the group
of houses that participated in the Minneapolis Energy Office (MEO) foundation insulation study [G051] (10 to 15%for interior and exterior insulation respectively) compared to the homes that were monitored by Robinson Technical
" Services (3-6%). The apparent discrepancy in performance may be due to the fact that the Robinson study sought tostudy conductive losses only. They therefore performed infiltration reduction in the basement at the beginning ofthe pre-retrofit heating season. Thus, the MEO study was recording savings from both air sealing and reduced con-duction losses, while the Robinson study recorded lesser savings from reduced conduction losses only.
(;068: Pennsylvania - 1986 NCAT Critical Needs Project (Warm Rooms) 61
Building/Retrofit Description." In 1986, the National Center for Appropriate Technology (NCAT) carried out "warmroom" retrofits on twenty-five houses in Pennsylvania. A 37 kBtu gas zone heater was installed in each house and
51
used in piace, of the central heating system. The houses also received zoning and infiltration reduction measures aswell as ceiling insulation and client education was stressed. Costs were not well documented but were estimated tobe $2,200 per house.
Data Analysis: Post-retrofit monitoring was done for four to six months during the heating season. Energy con-sumption data was given only for the monitoring period, not for an annual period. In order to calculate annual spaceheating values, LBL scaled up the pre-retrotit space heating consumption for the monitoring period by multiplyingthe it by the ratio of the HDDs in a year to the number in the monitoring period. For the post-retrofit space-heating,LBL assumed that the retrofit was only used during the deep heating season (corresponding to the monitoring
period) and did not scale up the savings.
LBL assumed a fifteen year lifetime for the retrofit. LBL assigned this zoning retrofit a longer lifetime thanthe Kansas City project (G053), which was assigned a ten year lifetime, because both the zone heater and the insula-tion have long lifetimes. The Kansas City project uscd curtains and infiltration reduction measures that have shorterlifetimes.
Results: The retrolit produced 35 pcrcent space heat savings, which corresponds to 23% of total gas consumption.The payback period is 12 years. Ten of the participants preferred the zone heater to the central furnace, eightaccepted the central heater because it saved them money, and seven preferred the ccntml furnace. Central heatingsystems result in more uniform temperatures throughout the house and two participants had problems with exposedpipes freezing when they used the zone heater. Note, sincc a space heater has no distribution system, it will thuswork better in a more open floor plan.
G069: Buft'alo, New York - 1988 Oak Ridge Audit Field Test 62
Building/Retrofit Description: The purpose of this study was to test a new audit procedure developed by Oak RidgeNational Laboratory for selecting the most cost-effective retrofit options. The 32 treatment and 40 control homeswere ali located in Buffalo, New York. The retrofits were done in 1988. The treatment and control houses were
poorly insulated, 62% had no wall insulation and 17% had no envelope insulation at all.
For this audit procedure, options are ranked by benefit-to-cost ratio (B/C). The highest B/C ratio options for agroup of houses are selected first and consequently some houses will receive more work than others. After anoption is selected, the remaining options are adjusted to account for their interaction with previously selected meas-ures. Options are chosen until the retrofit funds are spent or a minimum B/C ratio is reached. The overall B/C ratiotbr the treatment hou_c_ was 1.25 using local fuel prices and a five percent discount rate. An average of 51453 wasspent per house, but less than $500 was spent in five houses and more than $2000 was spent in eleven houses.
Infiltration reduction measures were done first and a B/C ratio of 2.0 was used for the cutoff, since savingsfrom infiltration reduction are difficult to predict. Furnace tune-ups were often done for safety and liability reasons,not for predicted cost-effectiveness. Attics with less than R-10 insulation were insulated. Of the thirty six treaunenthomes, five were completely insulated prior to the start of the program. Twenty three of the remaining thirty onehad wall insulation installed in ali uninsulated areas. Of the other eight, two had brick or stone siding, three had B/C
ratios greater than 1.0, and for three others the measure was determined to be not applicable. Heating systemreplacement was cost-effective in six homes before considering the interaction with higher B/C ratio options. Thenheating system replacement was cost etf_tive in only one house.
-2
52
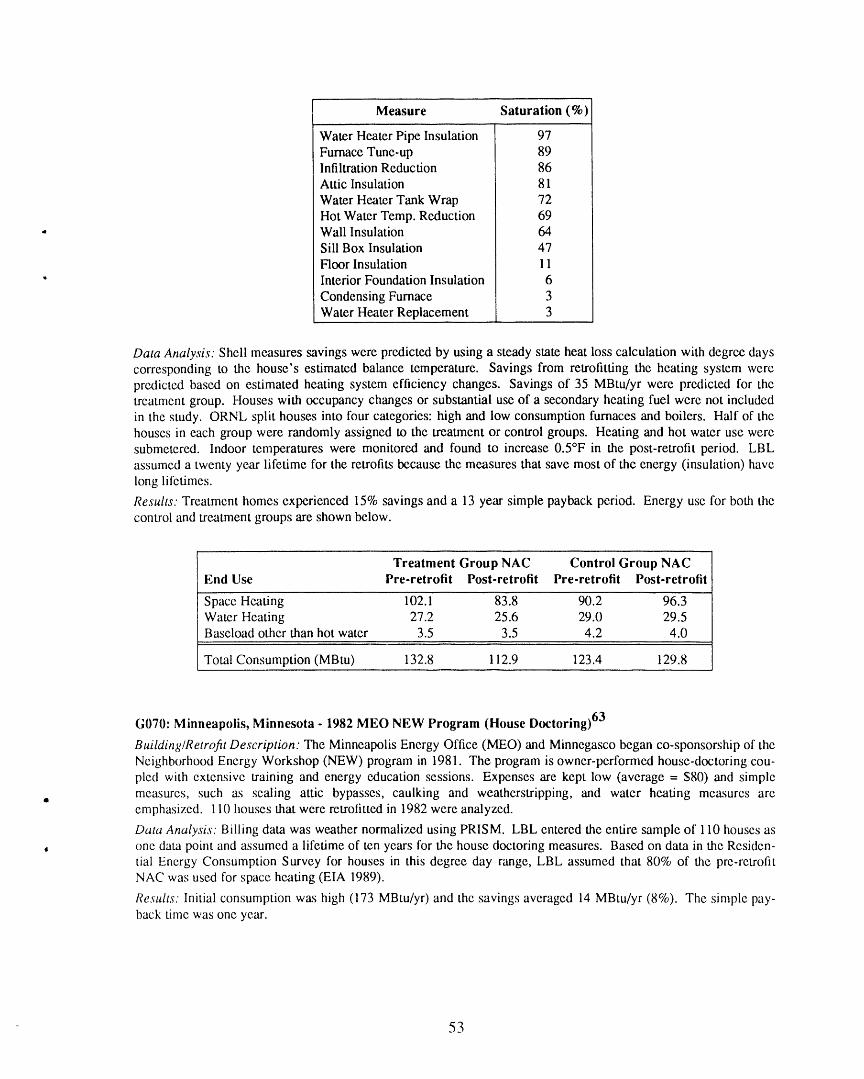
Measure Saturation (%)
Water Heater Pipe Insulation 97Furnace Tune-up 89Infiltration Reduction 86Attic Insulation 81
Water Heater Tank Wrap 72Hot Water Temp. Reduction 69
- Wall Insulation 64Sill Box Insulation 47
Floor Insulation 11• Interior Foundation Insulation 6
Condensing Furnace 3
Water Heater Replacement 3
Data Analysis: Shell measures savings were predicted by using a steady state heat loss calculation with degree dayscorresponding to the house's estimated balance temperature. Savings from retrofitting the heating system werepredicted based on estimated heating system efficiency changes. Savings of 35 MBtu/yr were predicted for thetreatment group. Houses with occupancy changes or substantial use of a secondary heating fuel were not includedin the study. ORNL split houses into four categories: high and low consumption furnaces and boilers. Half of thehouses in each group were randomly assigned to the treatment or control groups. Heating and hot water use weresubmetered. Indoor temperatures were monitored and found to increase 0.5°F in the post-retrofit period. LBLassumed a twenty year lifetime for the retrofits because the measures that save most of the energy (insulation) havelong lifetimes.
Results." Treatment homes experienced 15% savings and a 13 year simple payback period. Energy use for both the
control and treatment groups are shown below.
Treatment Group NAC Control Group NACEnd Use Pre-retrofit Post-retrofit Pre-retrofit Post-retrofit
Space Heating 102.1 83.8 90.2 96.3Water Heating 27.2 25.6 29.0 29.5Baseload other than hot water 3.5 3.5 4.2 4.0
Total Consumption (MBtu) 132.8 112.9 123.4 129.8
G070: Minneapolis, Minnesota - 1982 MEO NEW Program (House Doctoring) 63
Building/Retrofit Description: The Minneapolis Energy Office (MEO) and Minnegasco began co-sponsorship of theNeighborhood Energy Workshop (NEW) program in 1981. The program is owner-performed house-doctoring cou-pled with extensive training and energy education sessions. Expenses are kept low (average = $80) and simplemeasures, such as sealing attic bypasses, caulking and weatherstripping, and water heating measures areI
emphasized. 110 houses that were retrofitted in 1982 were analyzed.
Data Analysis: Billing data was weather normalized using PRISM. LBL entered the entire sample of 110 houses as, one data point and assumed a lifetime of ten years for the house doctoring measures. Based on data in the Residen-
tial Energy Consumption Survey for houses in this degree day range, LBL assumed that 80% of the pre-retrofitNAC was used for space heating (EIA 1989).
Results: Initial consumption was high (173 MBtu/yr) and the savings averaged 14 MBtu/yr (8%). The simple pay-back time was one year.
53
(;071: Minneapolis, Minnesota - 1985 MEO Project Choice (High Users) 64
Building/Retrofit Description: In 1985, six Minneapolis government and non-profit agencies formed Ctx)rdinatedEnergy Services (later renamed Project Choice) to reduce gas bills and payment arrearages in low income homes. Agroup of high energy users was targeted for this study. Thirty homes received house doctoring and thirteen receivedhouse doctoring and weatherization. Client education was a part of ali the retrofits. An average of $602 was spenton the house-doctoring homes and $2,259 was spent on the homes that received house-doctoring and wcathcri_,.a-tion. ]'he additional weatherization was mainly in the form of attic and wall insulation.
Data Analysis: Billing data was weather normalized using PRISM. LBL entered the homes as two data points:house-doctoring only and house-doctoring with weatherization. LBL assumed a lifetime of ten years lhr the house -doctoring measures and fifteen years for the combined house-doctoring and insulation. Based on data in theResidential Energy Consumption Survey for houses in this degree day range, LBL assumed that 80% of the pre-retrofit NAC was used for space heating (EIA 1989). "
Results: Initial consumption was extremely high (average of 242 MBtu/yr for ali 43 homes). The savings averaged21 MBtu/yr (9%) for the house-doctoring only sample and 48 MBtu/yr (21%) for the house-doctoring and weatheri-zation group. The simple payback time was 5 years for weatherization and 9 years for the house-dcx:toring andweatherization. Post-retrofit consumption was still relatively high (181 MBtu/yr), even in the homes that rczcivcdhouse-doctoring and weatherization, compared to typical existing single-family homes in Minnesota.
(;072: California - 1986 Pacific Gas and Electric Weatherization 65
Building/Retrofit Description: Initiated in 1983, Pacific Gas and Electric's Direct Weatherization Program weather-ized 252,000 homes by the end of 1987. The program provides no cost retrofits to households earning less than150% of the poverty guideline or senior citizens with incomes less than 200% of the poverty level. Retrofit meas-ures include ceiling insulation, caulking and weatherstripping, low flow showerheads, water heater tank wraps, andduct wrapping. The homes that were analyzed were retrofitted between January and May, 1986. An average oiS523 was spent on site-built homes and $408 was spent on mobile homes.
Data At_alysis: Data was weather normalized using a variable reference temperature method similar to PRISM.
LBL entered the data in three groups: site-built homes (5,920), mobile homes (671), and the control group (5,020.)and assumed a fifteen year lifetime for the retrofit package.
Results: Site-built homes saved 5 MBtu per year (8%) and had a simple payback of 21 years. Mobile homes hadconsiderably poorer performance: savings of less than 1 MBtu per year, corresponding to a payback of more than100 years.
(;073" Minnesota- 1984 LIW 66
Building/Retrofit Description: The University of Minnesota Underground Space Center conducted an evaluation ofthe 1984 Minnesota low income weatherization program by selecting a random sample of 1,200 houses weatherizedthat year. The saturation of measures is given below.
54
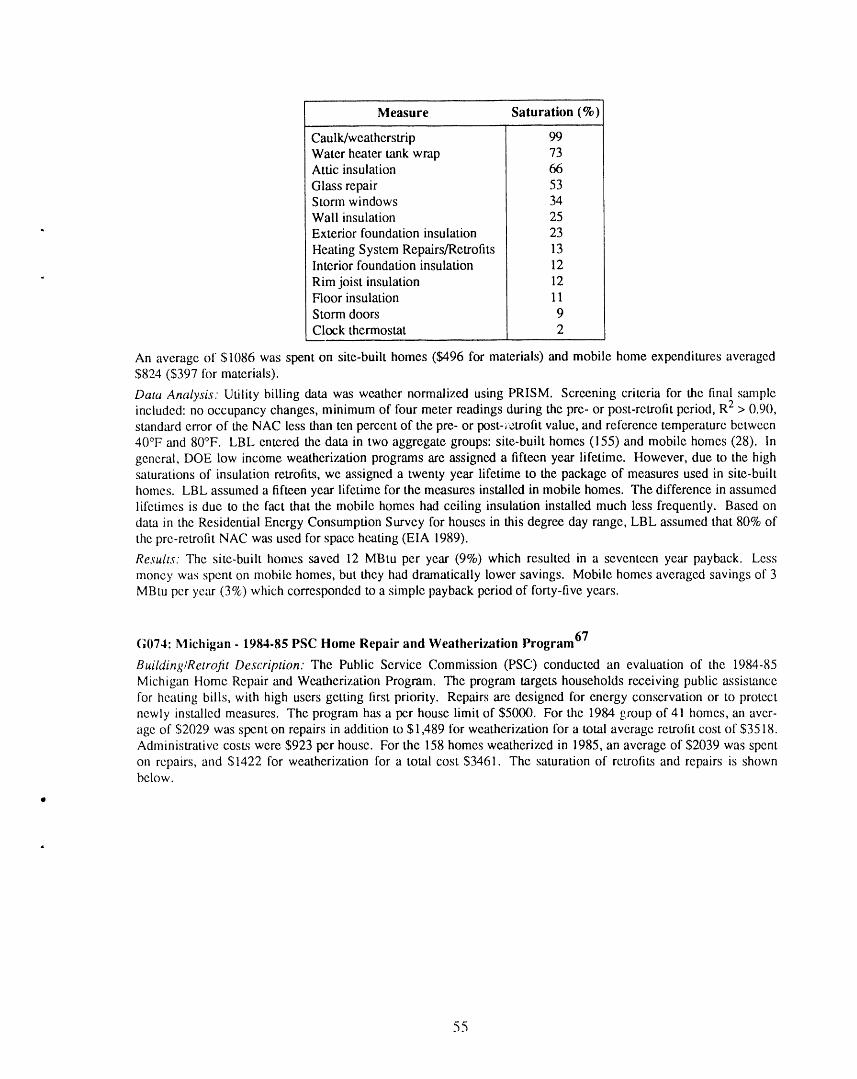
Measure Saturation (%)
Caulk/weatherstrip 99Water heater tank wrap 73Attic insulation 66
Glass repair 53Storm windows 34Wall insulation 25
" Exterior foundation insulation 23
Heating System Repairs/Retrofits 13Interior foundation insulation 12
" Rim joist insulation 12Floor insulation 11Storm doors 9
Clock thermostat 2
An average of $1086 was spent on site-built homes ($496 for materials) and mobile home expenditures averaged$824 ($397 for materials).
Data Analysis: Utility billing data was weather normalized using PRISM. Screening criteria for the final sampleincluded: no occupancy changes, minimum of four meter readings during the pre- or post-retrofit period, R2 > 0.90,standard error of the NAC less than ten percent of the pre- or post-_ etrofit value, and reference temperature between40°F and 80°F. LBL entered the data in two aggregate groups: site-built homes (155) and mobile homes (28). In
general, DOE low income weatherization programs are assigned a fifteen year lifetime. However, due to the highsaturations of insulation retrofits, we assigned a twenty year lifetime to the package of measures used in site-builthomes. LBL assumed a fifteen year lifetime for the measures installed in mobile homes. The difference in assumedlifetimes is due to the fact that the mobile homes had ceiling insulation installed much less frequently. Based ondata in the Residential Energy Consumption Survey for houses in this degree day range, LBL assumed that 80% of
the pre-retrofit NAC was used for space heating (EIA 1989).
Results. The site-built homes saved 12 MBtu per year (9%) which resulted in a seventeen year payback. Lessmoney was spent on mobile homes, but they had dramatically lower savings. Mobile homes averaged savings of 3MBtu pcr year (3%) which corresponded to a simple payback period of forty-five years.
(;074- Michigan - 1984-85 PSC Home Repair and Weatherization Program 67
Building/Retrofit Description: The Public Service Commission (PSC) conducted an evaluation of the 1984-85Michigan Home Repair and Weatherization Program. The program targets households receiving public assistancefor heating bills, with high users getting first priority. Repairs are designed for energy conservation or to protectnewly installed measures. The program has a per house limit of $5000. For the 1984 group of 41 homes, an aver-age of $2029 was spent on repairs in addition to $1,489 for weatherization for a total average retroIit cost of $3518.Administrative costs were $923 per house. For the 158 homes weatherized in 1985, an average of $2039 was spenton repairs, and $1422 for weatherization for a total cost $3461. The saturation of retrofits and repairs is shownbelow.
O
55
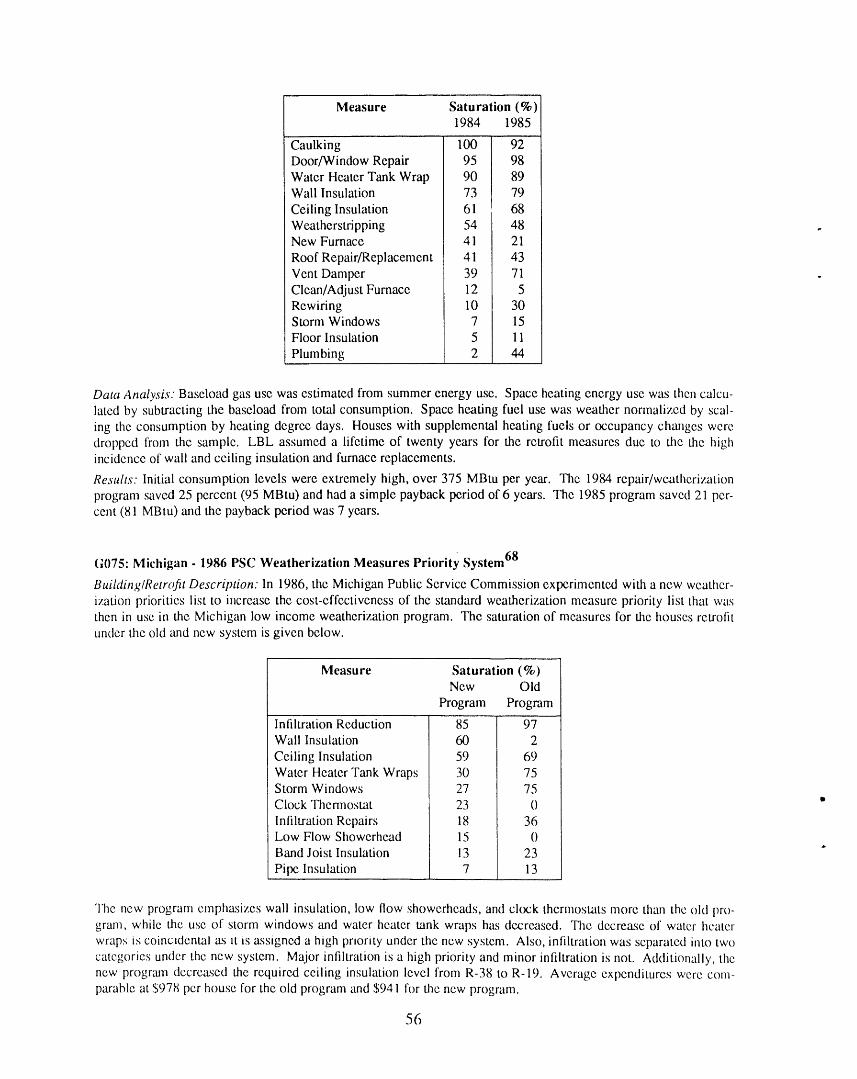
Measure Satu ration (%)1984 1985
Caulking 100 92Door/Window Repair 95 98Water Heater Tank Wrap 90 89Wall Insulation 73 79
Ceiling Insulation 61 68Weatherstripping 54 48New Furnace 41 21
Roof Repair/Replacement 41 43Vent Damper 39 71Clean/Adj ust Furnace 12 5Rewiring 10 30Storm Windows 7 15Floor Insulation 5 11
Plumbing 2 44
Data Analysis: Baseload gas use was estimated from summer energy use. Space heating energy use was then calcu-lated by subtracting the baseload from total consumption. Space heating fuel use was weather normalized by scal-
ing the consumption by heating degree days. Houses with supplemental heating fuels or occupancy changes weredropped from the sample. LBL assumed a lifetime of twenty years for the retrofit measures due to the the highincidence of wall and ceiling insulation and furnace replacements.
Results: Initial consumption levels were extremely high, over 375 MBtu per year. The 1984 repair/weatherizationprogram saved 25 percent (95 MBtu) and had a simple payback period of 6 years. The 1985 program saved 21 per-cent (81 MBtu) and the payback period was 7 years.
G075: Michigan - 1986 PSC Weatherization Measures Priority System 68
Building/Retrofit Description: In 1986, the Michigan Public Service Commission experimented with a new weather-ization priorities list to increase the cost-effectiveness of the standard weatherization measure priority list that wasthen in use in the Michigan low income weatherization program. The saturation of measures for the houses retrofitunder the old and new system is given below.
Measure Saturation (%)New Old
Program Program
Infiltration Reduction 85 97Wall Insulation 60 2
Ceiling Insulation 59 69Water Heater Tank Wraps 30 75Storm Windows 27 75Clock Thermostat 23 0 "
Infiltration Repairs 18 36Low Flow Showerhead 15 0Band Joist Insulation 13 23
Pipe Insulation 7 13
The new program emphasizes wall insulation, low flow showerheads, and clock thermostats more than the old pro-gram, while the use of storm windows and water heater tank wraps has decre_lsed. The decrease of water heater
wraps is coincidental as _t is assigned a high priority under the new system. Also, intiltration was separated into twocategories under the new system. Major infiltration is a high priority and minor infiltration is not. Additionally, thenew program decreased the required ceiling insulation level from R-38 to R-19. Average expenditures were com-parable at $978 per house for the old program and $941 for the new program.
56
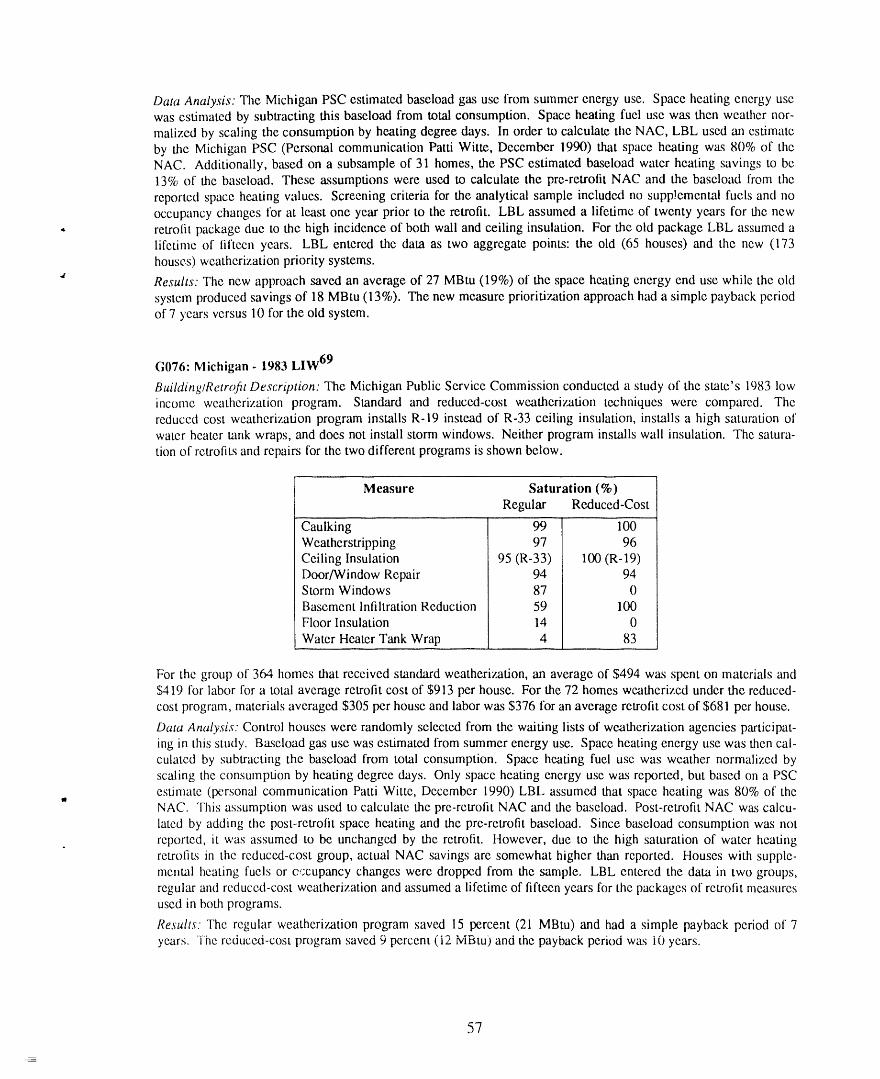
Data Analysis: The Michigan PSC estimated baseload gas use from summer energy use. Space heating energy usewas estimated by subtracting this baseload from total consumption. Space heating fuel use was then weather nor-malized by scaling the consumption by heating degree days. In order to calculate the NAC, LBL used an estimate
by the Michigan PSC (Personal communication Patti Witte, December 1990) that space heating was 80% of theNAC. Additionally, based on a subsample of 31 homes, the PSC estimated baseload water heating savings to be13% of the baseload. These assumptions were used to calculate the pre-retrofit NAC and the baseload from the
reported space heating values. Screening criteria for the analytical sample included no supp!emental fuels and nooccupancy changes for at least one year prior to the retrofit. LBL assumed a lifetime of twenty years for the new
- retrofit package due to the high incidence of both wall and ceiling insulation. For the old package LBL assumed alifetime of tiftecn years. LBL entered the data as two aggregate points: the old (65 houses) and the new (173
houses) weatherization priority systems.
"_ Results: The new approach saved an average of 27 MBtu (19%) of the space heating energy end use while the old
system produced savings of 18 MBtu (13%). The new measure prioritization approach had a simple payback periodof 7 ycars versus 10 for the old system.
G076: Michigan- 1983 LIW 69
Building/Retrofit Description." The Michigan Public Service Commission conducted a study of the state's 1983 lowincome weatherization program. Standard and reduced-cost weatherization techniques were compared. Thereduced cost weatherization program installs R-19 instead of R-33 ceiling insulation, installs a high saturation of
water heater tank wraps, and does not install storm windows. Neither program installs wall insulation. The satura-tion of retrofits and repairs for the two different programs is shown below.
M easu re Saturation (%)
Regular Reduced-Cost
Caulking 99 100Weatherstripping 97 96Ceiling Insulation 95 (R-33) 100 (R-19)Door/Window Repair 94 94Storm Windows 87 0Basement Infiltration Reduction 59 100Floor Insulation 14 0
Water Heater Tank Wrap 4 83
For the group of 364 homes that received stan 'dard weatherization, an average of $494 was spent on materials and$419 for labor for a total average retrofit cost of $913 per house. For the 72 homes weatherized under the reduced-
cost program, materials averaged $305 per house and labor was $376 for an average retrofit cost of $681 per house.
Data Analysis." Control houses were randomly selected from the waiting lists of weatherization agencies participat-
ing in this study. Baseload gas use was estimated from summer energy use. Space heating energy use was then cal-culated by subtracting the baseload from total consumption. Space heating fuel use was weather normalized byscaling the consumption by heating degree days. Only space heating energy use was reported, but based on a PSCestimate (personal communication Patti Witte, December 1990) LBL assumed that space heating was 80% of theW
NAC. Thin assumption was used to calculate the pre-retrofit NAC and the baseload. Post-retrofit NAC was calcu-lated by adding the post-retrofit space heating and the pre-retrofit baseload. Since baseload consumption was notreported, it was assumed to be unchanged by the retrofit. However, due to the high saturation of water heatingretrofits in the reduced-cost group, actual NAC savings are somewhat higher than reported. Houses with supple-
mental heating fuels or occupancy changes were dropped from the sample. LBL entered the data in two groups,regular and reduced-cost weatherization and assumed a lifetime of fifteen years for the packages of retrofit measuresused in both programs.
Results: The regular weatherization program saved 15 percent (21 MBtu) and had a simple payback period of 7years. The reduced-cost program saved 9 percent (i2 MBtu) and the payback period was i0 years.
57
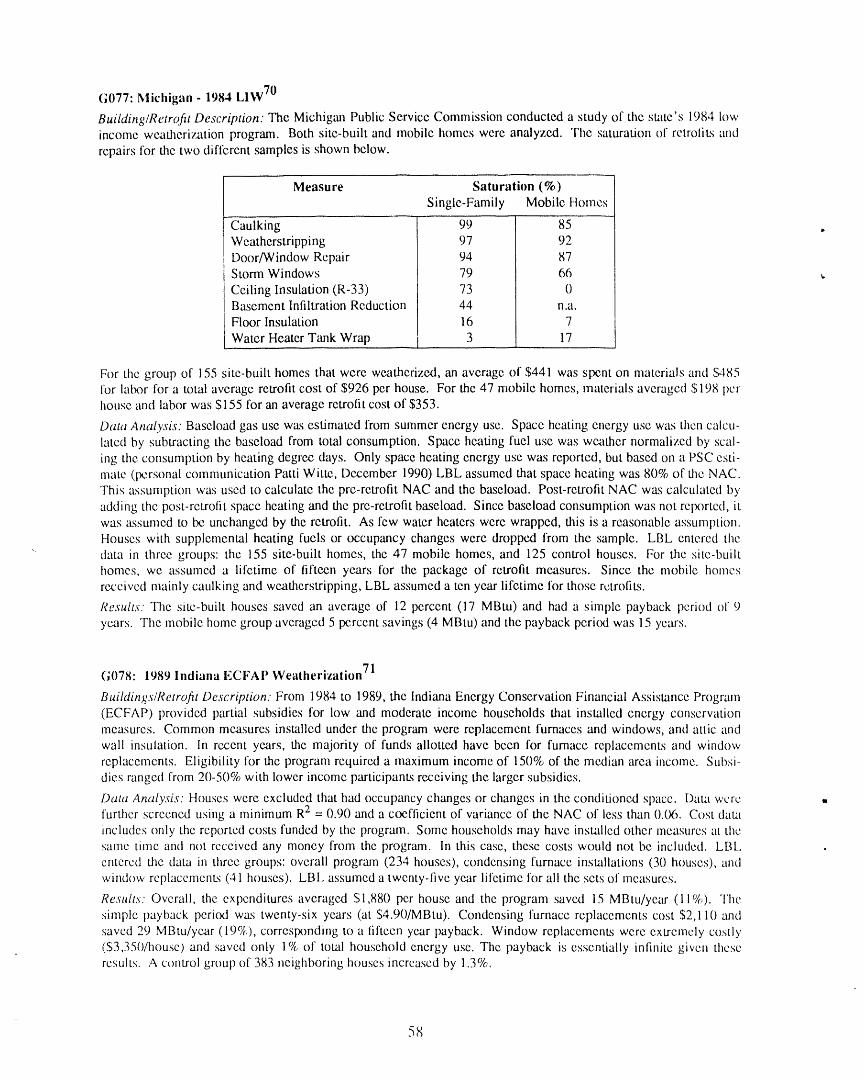
G077: Michigan - 1984 LIW 70
Building/Retrofit Description: The Michigan Public Service Commission conducted a study of the state's 1984 lowincome weatherization program. Both site-built and mobile homes were analyzed. The saturation of retrotits and
repairs tbr the two different samples is shown below.
Measu re Satu ration (%)
Single-Family Mobile Homes
Caulking 99 85 ,,Weatherstripping 97 92Door/W indow Repair 94 87Storm Windows 79 66 _.
Ceiling Insulation (R-33) 73 0Basement Infiltration Reduction 44 n.a.Floor Insulation 16 7
Water Heater Tank Wrap 3 17
For the group of 155 site-built homes that were weatherized, an average of $441 was spent on materials anti 5485for latx)r for a total average retrofit cost of $926 per house. For the 47 mobile homes, materials averaged $198 perhouse and labor was $155 for an average retrofit cost of $353.
Data Analysis: Baseload gas use was estimated from summer energy use. Space heating energy use was then calcu-lated by subtracting the baseload from total consumption. Space heating fuel use was weather normalized by scal-ing the consumption by heating degree clays. Only space heating energy use was reported, but based on a PSC esti-mate (personal communication Patti Witte, December 1990) LBL assumed that space heating was 80% of the NAC.This assumption was used to calculate the pre-retrofit NAC and the baseload. Post-retrofit NAC was calculated by
adding the post-retrofit space heating and the pre-retrofit baseload. Since baseload consumption was not reported, itwas assumed to be unchanged by the retrofit. As few water heaters were wrapped, this is a reasonable assumption.Houses with supplemental heating fuels or occupancy changes were dropped from the sample. LBL entered the
" data in three groups: the 155 site-built homes, the 47 mobile homes, and 125 control houses. For the site-builthomes, we assumed a lifetime of [ifteen years for the package of retrofit measures. Since the mobile homesreceived mainly caulking and weatherstripping, LBL assumed a ten year lifetime for those retrofits.
Results. The site-built houses saved an average of 12 percent (17 MBtu) and had a simple payback period of 9years. The mobile home group averaged 5 percent savings (4 MBtu) and the payback period was 15 years.
(;078:1989 Indiana ECFAP Weatherization 71
Buildings/l-_etrofit Description. From 1984 to 1989, the Indiana Energy Conservation Financial Assistance Program(ECFAP) provided partial subsidies for low and moderate income households that installed energy conservationmeasures. Common measures installed under the program were replacement furnaces and windows, and attic andwall insulation. In recent years, the majority of funds allotted have been for furnace replacements and windowreplacements. Eligibility for the program required a maximum income of 150% of the median area income. Subsi-dies ranged from 20-50% with lower income participants receiving thc larger subsidies.
Data Analysis. Houses were excluded that had occupancy changes or changes in the conditioned space. Data wcrc ,,further screened using a minimum R2 = 0.90 and a coefiicient of variance of the NAC oi less than 0.(X). Cost dataincludes only the reported costs funded by the program. Some households may have installed other measures at thesame time and not received any moncy from the program. In this case, these costs would not be included. LBLentered the data in three groups: overall program (234 houses), condensing furnace installations (30 houses), andwindc)w replacements (41 houses). LBL assumed a twenty-five year lifetime for ali the sets of measures.
Results. Overztll, the expenditures averaged 51,880 per house and the program saved 15 MBtu/ycar (11%). Thesimple payback period was twenty-six years (at $4.90/MBtu). Condensing furnace replacements cost $2,110 andsaved 29 MBtu/ycar (19%), corresponding to a fifteen year payback. Window replacements were extremely cosily(53,350/house) and saved only 1% of tc)ml household energy use. The payback is essentially infinite given theseresults. A control group of 383 neighboring houses increased by 1.3%.
58
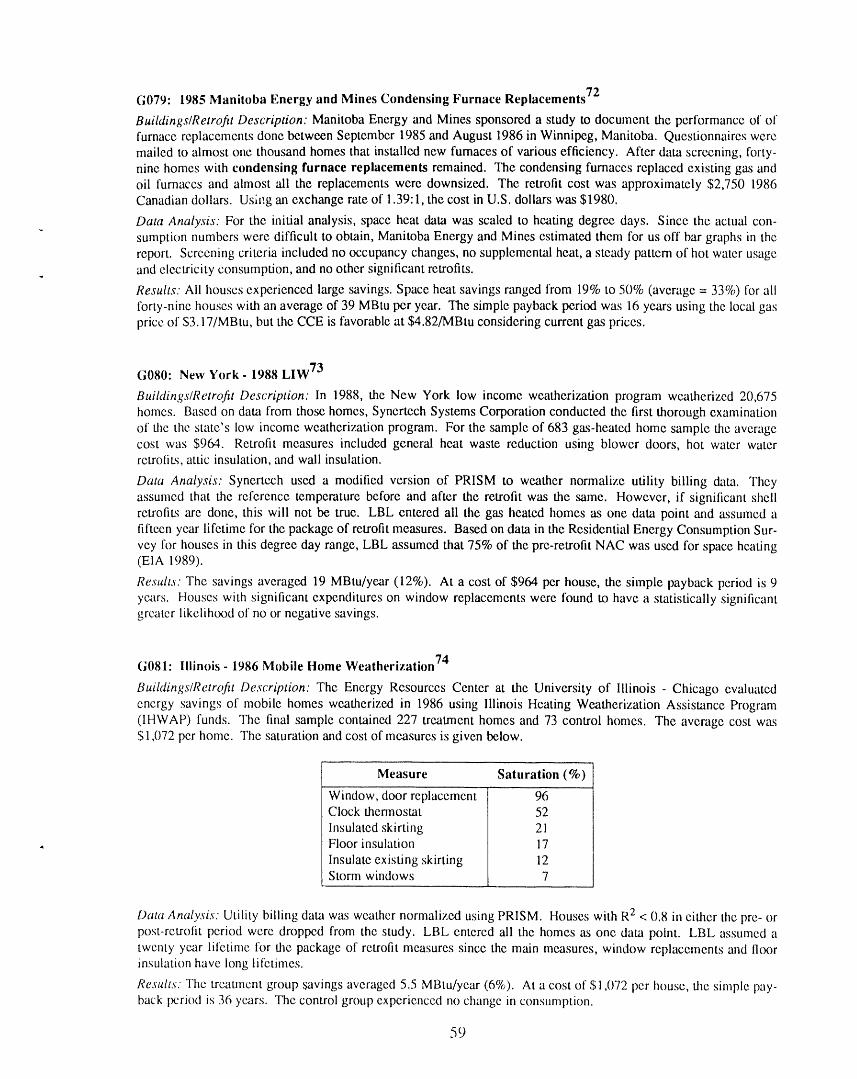
G079:1985 Manitoba Energy and Mines Condensing Furnace Replacements 72
Buildings/Retrofit Description: Manitoba Energy and Mines sponsored a study to document the performance of offurnace replacements done between September 1985 and August 1986 in Winnipeg, Manitoba. Questionnaires weremailed to almost one thousand homes that installed new furnaces of various efficiency. After data screening, Ik_rty-nine homes with condensing furnace replacements remained. The condensing furnaces replaced existing gas andoil furnaces and ahnost ali the replacements were downsized. The retrofit cost was approximately $2,750 1986Canadian dollars. Using an exchange rate of 1.39:1, the cost in U.S. dollars was $1980.
Data Analysis: For the initial analysis, space heat data was scaled to heating degree days. Since the actual con-sumption numbers were difficult to obtain, Manitoba Energy and Mines estimated them for us off bar graphs in thereport. Screening criteria included no occupancy changes, no supplemental heat, a steady pattern of hot water usageand electricity consumption, and no other significant retrofits.
Results." Ali houses experienced large savings. Space heat savings ranged from 19% to 50% (average = 33%) lhr aliforty-nine houses with an average of 39 MBtu per year. The simple payback period was 16 years using the local gasprice of $3.17/MBtu, but the CCE is favorable at $4.82/MBtu considering current gas prices.
G080: New York - 1988 LIW 73
Buildings/Retrofit Description: In 1988, the New York low income weatherization program weatherizcd 20,675
homes. Based on data from those homes, Synertech Systems Corporation conducted the first thorough examinationof the the state's low income weatherization program. For the sample of 683 gas-heated home sample the averagecost was $964. Retrofit measures included general heat waste reduction using blower doors, hot water waterretro[its, attic insulation, and wall insulation.
Data Analysis: Synertcch used a modified version of PRISM to weather normalize utility billing data. Theyassumed that the reference temperature before and after the retrofit was the same. However, if significant shellretrofits are done, this will not be true. LBL entered ali the gas heated homes as one data point and assumed afifteen year lifetime for the package of retrofit measures. Based on data in the Residential Energy Consumption Sur-vey for houses in this degree day range, LBL assumed that 75% of the pre-retrofit NAC was used for space heating(EIA 1989).
Results: The savings averaged 19 MBtu/year (12%). At a cost of $964 per house, the simple payback period is 9years, t-louses with significant expenditures on window replacements were found to have a statistically significantgreater likelihcx)d of no or negative savings.
74G081" Illinois - 1986 Mobile itome Weatherization
Buildings/Retrofit Description: The Energy Resources Center at the University of Illinois - Chicago evaluatedenergy savings of mobile homes weatherized in 1986 using Illinois Heating Weatherization Assistance Program(IHWAP) funds. The final sample contained 227 treatment homes and 73 control homes. The average cost was$1,072 per home. The saturation and cost of measures is given below.
Measure Saturation (%)
Window, door replacement 96Clock thermostat 52
Insulated skirting 21, Floor insulation 17
Insulate existing skirting 12Storm windows 7
Data Analysis: Utility billing data was weather normalized using PRISM. Houses with R2 < 0.8 in either the pre- orpost-retrofit period were dropped from the study. LBL entered ali the homes as one data point. LBL assumed atwenty year lifetime for the package of retrofit measures since the main measures, window replacements and llc×}rinsulation have long lifetimes.
Results: The treaunent group _iavings averaged 5.5 MBtu/year (6%). At a cost of $1,072 per house, the simple pay-back period is 36 years. The control group experienced no change in consumption.
59
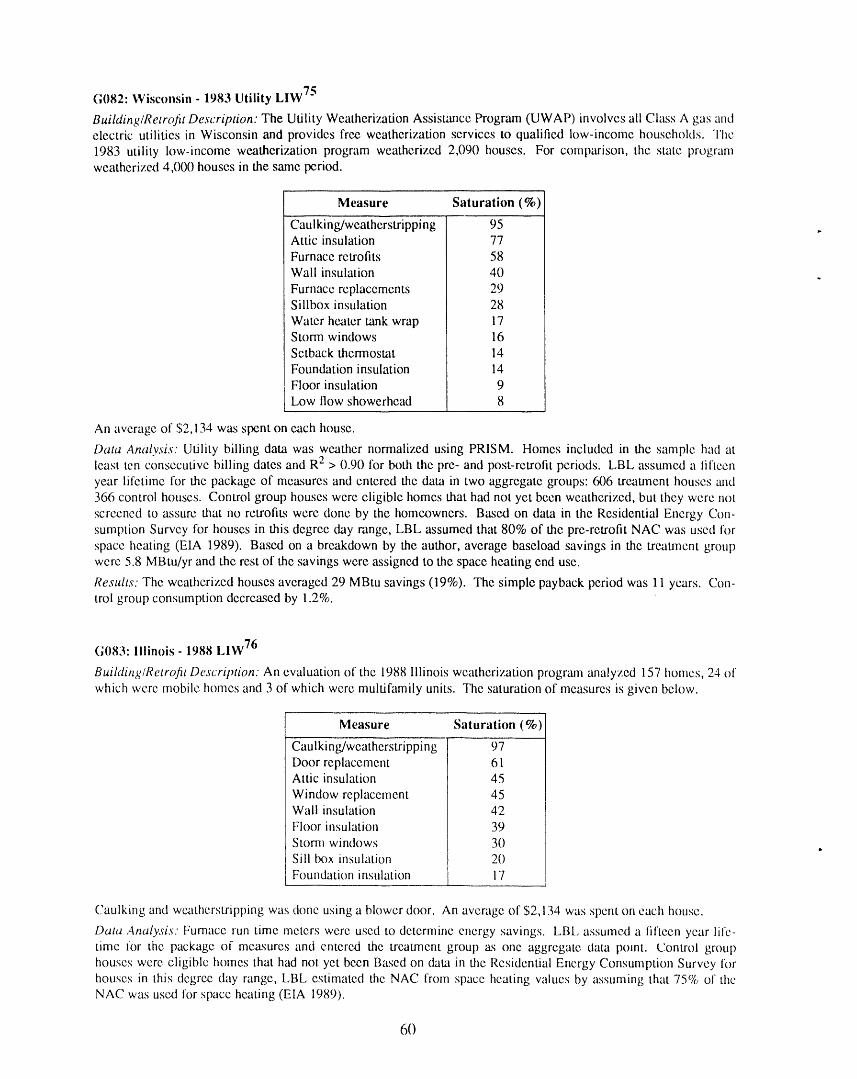
(;082: Wisconsin - 1983 Utility LIW 75
Building/Retrofit Description: The Utility Weatherization Assistance Program (UWAP) involves ali Class A gas andelectric utilities in Wisconsin and provides free weatherization services to qualified low-income households. The1983 utility low-income weatherization program weatherized 2,090 houses. For comparison, the smtc programweatherized 4,000 houses in the same period.
Measure Saturation (%)
Caulking/weatherstripping 95Attic insulation 77Furnace retrofits 58Wall insulation 40
Furnace replacements 29Sillbox insulation 28
Water heater tank wrap 17Stonn windows 16Setback thermostat 14
Foundation insulation 14Floor insulation 9
Low tlow showerhead 8
An average of $2,134 was spent on each house.
Data Analysis: Utility billing data was weather normalized using PRISM. Homes included in the sample had atleast ten consecutive billing dates and R2 > 0.90 for both the pre- and post-retrofit periods. LBL assumed a lifte_n
year lifetime for the package of measures and entered the data in two aggregate groups: 606 treatment houses and366 control houses. Control group houses were eligible homes that had not yet been weatherized, but they were not
screened to assure that no retrofits were done by the homeowners. Based on data in the Residential Energy Con-sumption Survey for houses in this degree day range, LBL assumed that 80% of the pre-retrofit NAC was used forspace heating (EIA 1989). Based on a breakdown by the author, average baseload savings in the treaunent groupwere 5.8 MBtu/yr and the rest of the savings were assigned to the space heating end use.
Results: The weatherized houses averaged 29 MBtu savings (19%). The simple payback period was 11 years. Con-trol group consumption decreased by 1.2%.
(;083: Illinois - 1988 LIW 76
Building/Retrofit Description: An evaluation of the 1988 Illinois weatherization program analyzed 157 homes, 24 ofwhich were mobile homes and 3 of which were multifamily units. The saturation of measures is given below.
Measure Saturation (%)
Caulking/weatherstripping 97Door replacement 61Attic insulation 45
Window replacement 45Wall insulation 42
Floor insulation 39Ston-n windows 30Sill box insulation 20Foundation insulation 17
....
Caulking and weatherstripping was done using a blower door. An average of $2,134 was spent on each house.
Data Analysis: Furnace run time meters were used to determine energy savings. LBl_, assumed a iiiteen year life-time for the package oi measures and entered the treatment group as one aggregate dam IX)mt. Control grouphouses were eligible homes that had not yet been Based on data in the Residential Energy Consumption Survey forhouses in this degree day range, LBL estimated the NAC from space heating values by assuming that 75% of theNAC was used for space heating (EIA 1989).
60
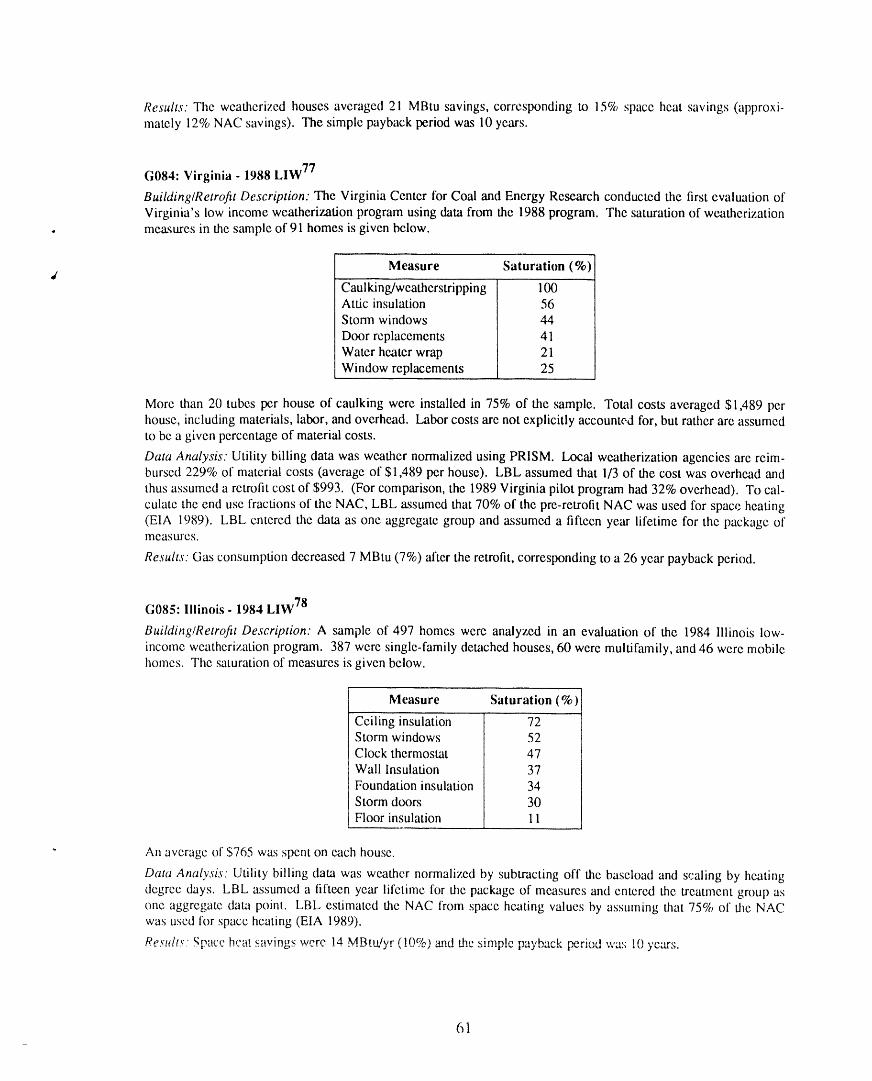
Results." The weathcrized houses averaged 21 MBtu savings, corresponding to 15% space heat savings (approxi-mately 12% NAC savings). The simple payback period was 10 years.
G084: Virginia- 1988 LIW 77
Building/Retrofit Description." The Virginia Center for Coal and Energy Research conducted the first evaluation ofVirginia's low income weatherization program using data from the 1988 program. The saturation of weatherization
, measures in the sample of 91 homes is given below.
Measure Saturation (%)dCaulking/weatherstripping 1O0Attic insulation 56Storm windows 44
Door replacements 41Water heater wrap 21Window replacements 25
More than 20 tubes per house of caulking were installed in 75% of the sample. Total costs averaged $1,489 perhouse, including materials, labor, and overhead. Labor costs are not explicitly accounted for, but rather are assumedto be a given percentage of material costs.
Data Analysis." Utility billing data was weather normalized using PRISM. Local weatherization agencies are reim-bursed 229% of material costs (average of $1,489 per house). LBL assumed that 1/3 of the cost was overhead and
thus assumed a rctrofit cost of $993. (For comparison, the 1989 Virginia pilot program had 32% overhead). To cal-
culate the end use fractions of the NAC, LBL assumed that 70% of the pre-retrofit NAC was used for space heating(EIA 1989). LBL entered the data as one aggregate group and assumed a fifteen year lifetime for the package ofineasures.
Results.Gas consumptiondecreased7MBtu (7%)aftertheretrofit,correspondingtoa26 yearpaybackperiod.
(3085: Illinois - 1984 LIW 78
Building/Retrofit Description: A sample of 497 homes were analyzed in an evaluation of the 1984 Illinois low-
income weatherization program. 387 were single-family detached houses, 60 were multifamily, and 46 were mobilehomes. The saturation of measures is given below.
Measure Saturation (%)
Ceiling insulation 72Storm windows 52Clock thermostat 47
Wall Insulation 37Foundation insulation 34Storm doors 30Floor insulation 11
" An average of S765 was spent on each house.
Data Analysis. Utility billing data was weather normalized by subtracting off the baseload and scaling by heatingdegree days. LBL assumexl a tifteen year lifetime for the package of measures and entered the treatment group asone aggregate data point. LBL estimated the NAC from space heating values by assuming that 75% of die NACwas used for space heating (EIA 1989).
Res::!!._ Space heat savings were !4 MBt,,.../yr(!(3%) and the simple payback l_riod wa:; !0 years.
61
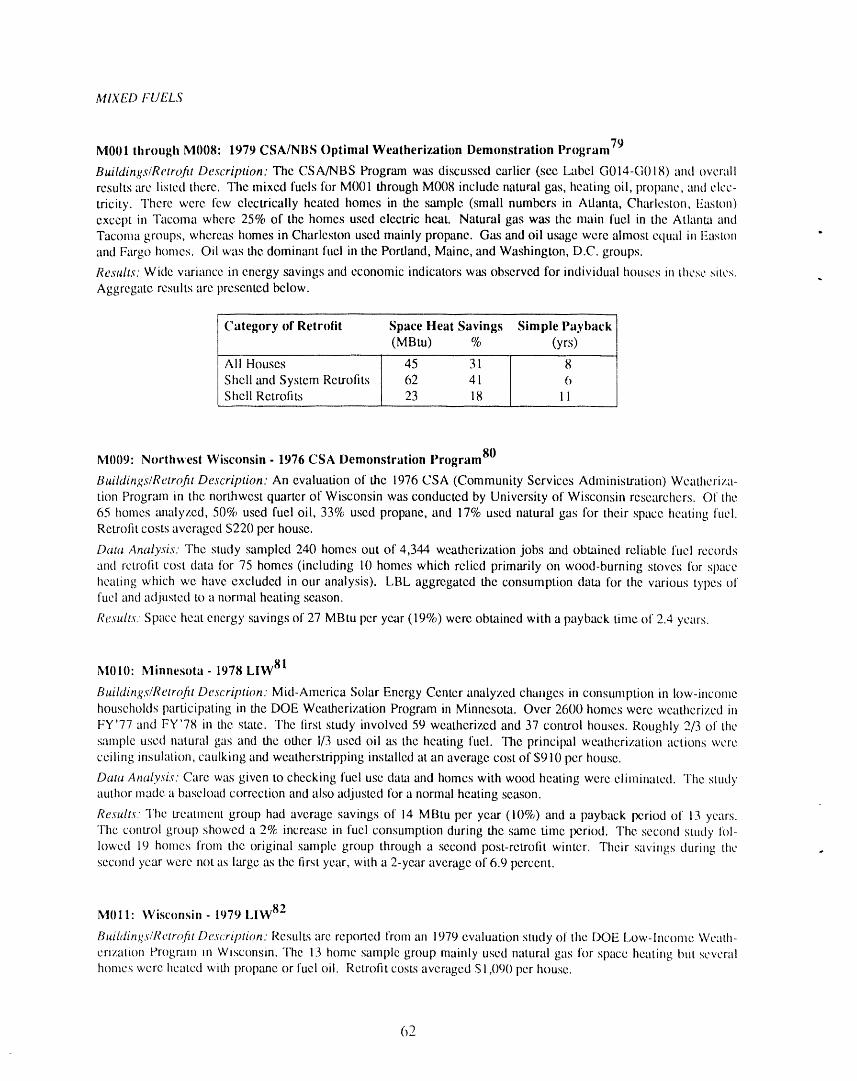
MIXED FUELS
M001 through M008:1979 CSA/NBS Optimal Weatherization Demonstration Program 79
Buildings/Retro[it Description: The CSA/NBS Program was discussed earlier (see Label G014-G018) and overallresults are listed there. The mixed fuels for M001 through M008 include natural gas, heating oil, propane, and elec-tricity. There were few electrically heated homes in the sample (small numbers in Atlanta, Charleston, Easton)
except in Tacoma where 25% of the homes used electric heat. Natural gas was the main fuel in the Atlanu_ andTacoma groups, whereas homes in Charleston used mainly propane. Gas and oil usage were almost equal in Eastonand Fargo homes. Oil was the dominant fuel in the Portland, Maine, and Washington, D.C. groups.
Results: Wide variance in energy savings and economic indicators was observed for individual houses in these sites.Aggregate results are presented below.
Category of Retrofit Space Heat Savings Simple Payback
(MBtu) % (yrs)
Ali Houses 45 31 8
Shell and System Retrofits 62 41 6Shell Retrofits 23 18 11
.....
M009: Northv,'est Wisconsin - 1976 CSA Demonstration Program 80
Buildings/Retrofit Description: An evaluation of the 1976 CSA (Community Services Administration) Weatheriza-tion Progrzun in the northwest quarter of Wisconsin was conducted by University of Wisconsin researchers. Of the
65 homes analyzed, 50% used fuel oil, 33% used propane, and 17% used natural gas for their space heating fuel.Retrotit costs averaged S220 per house.
Data Analysis." The study sampled 240 homes out of 4,344 weatherization jobs and ob_fined reliable fuel records
and retrofit cost daut for 75 homes (including 10 homes which relied primarily on wood-burning stoves for Sl)aceheating which we have excluded in our analysis). LBL aggregated the consumption data lhr the various types offuel and adjusted to a normal heating season.
Results: Space heat energy savings of 27 MBtu per year (19%) were obtained with a payback time of 2.4 years.
MOIO: Minnesota - 1978 LIW 81
Buihtings/Retrofit Description. Mid-America Solar Energy Center analyzed changes in consunlption in low-incomehouseholds participating in the DOE Weatherization Program in Minnesota. Over 2600 homes were weatherized in
FY'77 and FY'78 in the state. The first study involved 59 weatherized and 37 control houses. Roughly 2/3 of thesample used natural gas and the other 1/3 used oil as the heating fuel. The principal weatherization actions wereceiling insulation, caulking and weatherstripping installed at an average cost of $910 per house.
Data Analysis: Care was given to checking fuel use dam and homes with wood heating were eliminated. The studyauthor made a baseload correction and also adjusted for a normal heating season.
Results. The treatment group had average savings of 14 MBtu per year (10%) and a payback period of 13 years.The control group showed a 2% increase in fuel consumption during the same time period. The second study lbl-lowed 19 homes from tlm original sample group through a second post-retrofit winter. Their savings during the ,,second year were not as large as the frst year, with a 2-year average of 6.9 percent.
MI)ll: Wisconsin - 1979 LIW 82
Buihting,s/Retrofit Description." Results are reported from an 1979 evaluation study of the DOE Low-Income Weath-
erization Program in Wisconsin. The 13 home sample group mainly used natural gas for space heating but severalhomes were heated with propane or fuel oil. Retrofit cosLs averaged $ 1,090 per house.
62
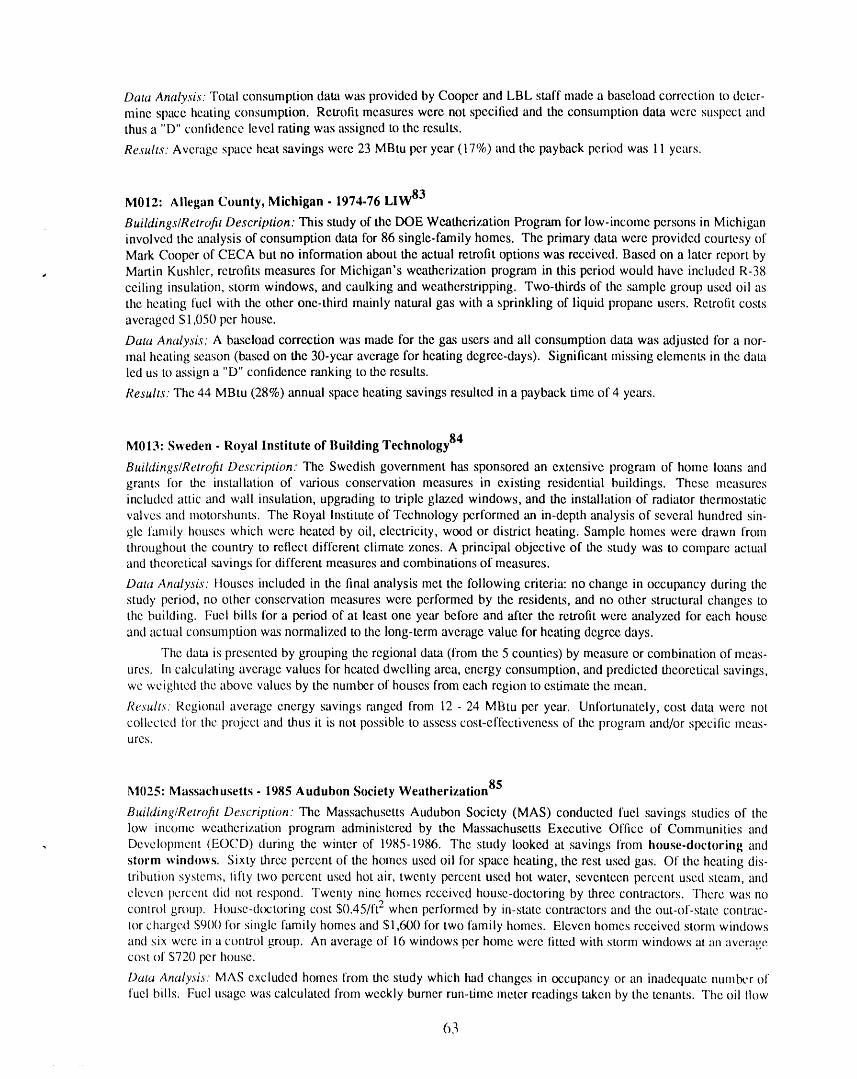
Data Analysis: Total consumption data was provided by Cooper and LBL staff made a bztseload correction to deter-
mine space heating consumption. Retrofit measures were not specilied and the consumption data were suspect andthus a "D" confidence level rating was assigned to the results.
Results. Average space heat savings were 23 MBtu per year (17%) and the payback period was 11 years.
M012: Allegan County, Michigan - 1974-76 LIW 83
Buildings/Retrofit Description: This study of the DOE Weatherization Program for low-income persons in Michiganinvolved the analysis of consumption data for 86 single-family homes. The primary data were provided courtesy of
Mark Cooper of CECA but no information about the actual retrofit options was received. Based on a later report by, Martin Kushlcr, retrofits measures for Michigan's weatherization program in this period would have included R-38
ceiling insulation, storm windows, and caulking and weatherstripping. Two-thirds of the sample group used oil asthe heating fucl with the other one-third mainly natural gas with a sprinkling of liquid propane users. Retrofit costsaveraged SI,050 per house.
Data Analysis. A baseload correction was made for the gas users and ali consumption data was adjusted for a nor-
real heating season (based on the 30-year average for heating degree-days). Significant missing elements in the dataled us to assign a "D" confidence ranking to the results.
Results: The 44 MBtu (28%) annual space heating savings resulted in a payback time of 4 years.
M013: Sweden - Royal Institute of Building Technology 84
Buildings/Retrofit Description." The Swedish government has sponsored an extensive program of home loans andgrants for the installation of various conservation measures in existing residential buildings. These measuresincluded attic and wall insulation, upgrading to triple glazed windows, and the installation of radiator thermostaticvalves and motorshunts. The Royal Institute of Technology performed an in-depth analysis of several hundred sin-glc family houses which were heated by oil, electricity, wood or district heating. Sample homes were drawn from
throughout the country to reflect different climate zones. A principal objective of the study was to compare actualand theoretical savings for different measures and combinations of measures.
Data Analysis: Houses included in the final analysis met the following criteria: no change in occupancy during thestudy period, no other conservation measures were performed by the residents, and no other structural changes tothe building. Fuel bills for a period of at least one year before and after the retrofit were analyzed for each houseand actual consumption was normalized to the long-term average value for heating degree days.
The data is presentcxl by grouping the regional data (from the 5 counties) by measure or combination of meas-
ures. In calculating average values for heated dwelling area, energy consumption, and predicted theoretical savings,we weighted the above values by the number of houses from each region to estimate the mean.
Results. Regional average energy savings rangeA from 12 - 24 MBtu per year. Unfortunately, cost daua were not
collected for the project and thus it is not possible to assess cost-effectiveness of the program and/or spcciric meas-ures.
M025: Massachusetts - 1985 Audubon Society Weatherization 85
Building/Retrofit Description: The Massachusetts Audubon Society (MAS) conducted fuel savings studies of thelow income weatherization program administered by the Massachusetts Executive Office of Communities anti
, Deveiopnaent (EOCD) during the winter of 1985-1986. The study looked at savings from house-doctoring and
storm windows. Sixty three percent of the homes used oil for space heating, the rest used gas. Of the heating dis-tribution systems, fifty two percent used hot air, twenty percent used hot water, seventeen percent used steam, and
eleven percent did not respond. Twenty nine homes received house-doctoring by three contractors. There was nocontrol group, ttouse-dtx:toring cost $0.45/ft 2 when performed by in-suite contractors and the out-of-state contrac-tor charged $900 for single family homes and $1,600 for two family homes. Eleven homes received storm windows
and six were in a control group. An average of 16 windows pcr home were litted with storm windows at an averagecost of S720 per house.
Data Analysis: MAS excluded homes from the study which had changes in _cupancy or an inadequate number offuel bills. Fuel usage was calculated from weekly burner run-time meter readings taken by the tenants. The oil flow
63
rate was determined by backing out tile burner and noting the nozzle size. MAS assumed that tile oil flow would bethe rated llow for a given nozzle size. (If the pressure varies from the set point, this will not hold). Gas burnerswere assumed to consume fuel at the manufacturer's rated rate. Space heating fuel consumption was weather nor-
malized by scaling it to the number of heating degree days. A tempcnlture difference accumulator measured degreehour differences between inNx_r anti outdoor temFemtures. The balance point was taken to be 60'-_F (based onresearch by Fels, 1985). The ind(×)r tcmpcvature was assumed to bc 68°F, which was corroborated by averages ofclient thermostat settings. The pre-retrofit monitoring period was from mid-December to the end of January and the
post-retrolit period was from mid-February to the end of March.
LBL entered the data as three aggregate data points: house-doctoring treaUnent group and window treatment
and control groups. The authors of the study used the meCm ratio method to estimate fuel savings: The n_ean ratiomethod compares the mezm ratio of fuel consumption per degree hour during the prc-wcathcrization period to that
during the post-weatherization period.
Results: Fuel savi_tgs had large uncertainties. The mean fuel savings lhr house-doctoring were 8.9 :t 7.6%. The
mcdian savhlgs was 6.0%. Savings rangcd from -0.4% to 25.6%. The simple payback l×;riod was approximately 8years. Savings from house Nx:toring have a wide range. Fuel savings in the storm windows treatment group rangedfrom -0.5% to 20.6%. The mean fuel savings were 9.6 + 9.6% and the median was 10.8%. hl die control group,savings ranged from -9.1% to 9.4% with a mean of 2.0 + 8.7%. The simple payback period was 6.1 years. Housedoctoring and storm windows arc cost effective, but once again, other measures should be done first before instal-ling stonn windows.
M026: Energy lnl'ormation Administration 1981 National LIW Study 86
Building/Retrq[it Description: The Energy Information Administration (EIA) conducted a national cvaluatitm ofDOE's 1981 LIW program. 965 homes weathcrized in 1981 were randomly selected. The main heating fuel wasnatural gas for 66%, fuel oil/kerosene for 21%, LPG for 8%, and electricity lhr 5%. The saturation of weatheriza-tion measures is given below.
Measure Saturation (%)
Weadlcrstripping or caulking 91Attic, wall or floor insulation 81Storm windows or Nx_rs 53Other services 69
Data Analysis: The report did not indicate how the fuel consumption was weather normalized or how the percentageof the main fuci used for space heating was ealculated. Homes were only included if tile same family occupied the
house both before and after the retrofit and ii they (lid not fuel switch. However, sora? houses had changes in thenumber of occupanL,;. Houses with large amounts of supplemental heating sources were dropped from the study.There was no control group for the experiment. Savings were found by subtracting the actual consumption from thepredicted consumption if no work had been done. Electricity consumption was converted to site energy (3412Btu/kWh). LBL assumed a fifteen year effective lifetime. Since most odler low-income weatherization evaluationx
measure only the main space heating fuel, LBL used these numbers in our analysis, rather than total house energy
consun_ption. To estimate the total contractc_r cost of tile retrolit, LBL |nuitiplicd d_e materials cost (S393 perhouse) by 2.7 and came up with S1060.
Resuhs: Before the rctrotit, szunple homes used 133 MBtu annually. After the rctrolit, this number dropped to 119MBtu which corresponds to I0 percent NAC savings. The simple payback pericxl was 15 years. Other measuresshould be done lirst before installing storm windows.
M027: ()hio- 1986 (2()AI) Mobile ltome Weatherization 87
Buildings/R_:tro/it De._criytion. The (?orp(_rati(m for Ohio Appalachian Devel(_pmcnt (COAD) ev_duated energy s_lv-_ngs m mobile h(m_cs weather,zed _n _k'.;dtstrtct m 1980 and lt)_/, lhc ltnai sample contatned t)9 trcam_cnt and 2_
control homes. Rctrolit costs averaged $815 pcr house. The saturation of retrolit measures is givell tx_h_w.
64
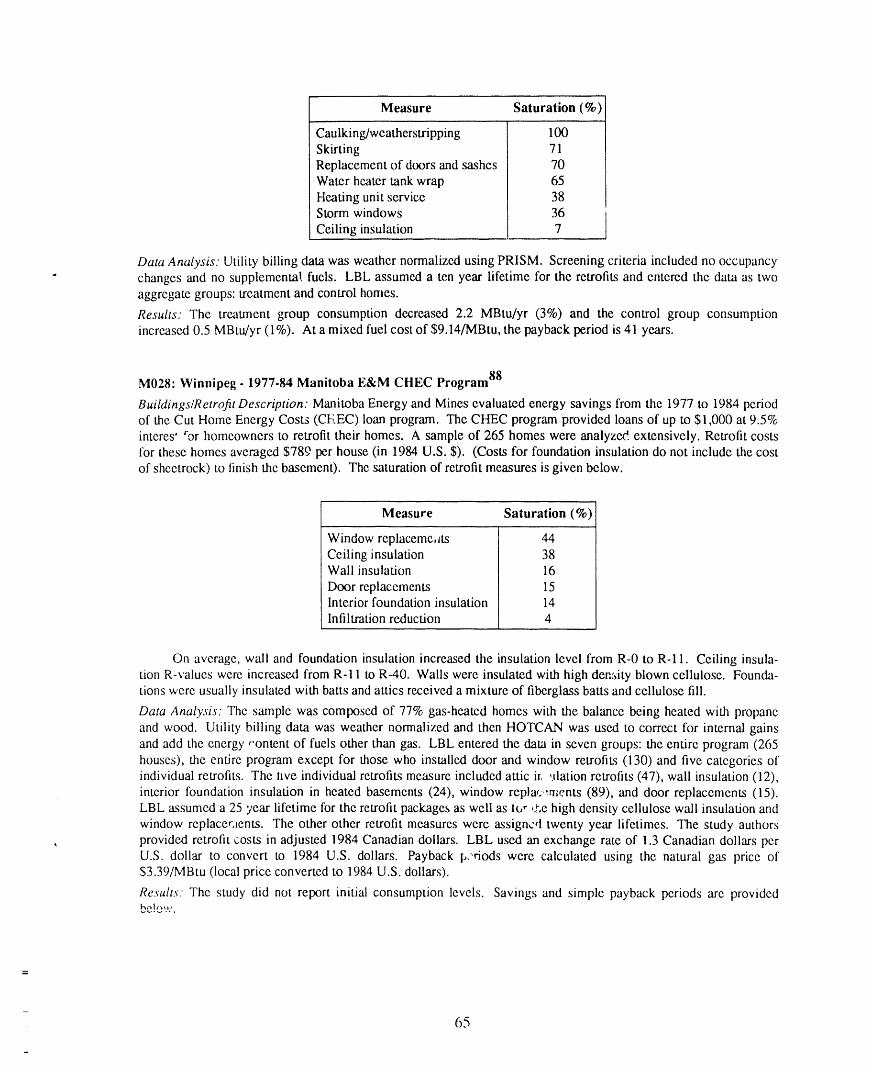
Measure Saturation (%)
Caulking/weatherstripping 1O0Skirting 71Replacement of doors and sashes 70Water heater tank wrap 65Heating unit service 38Storm windows 36
Ceiling insulation 7
Data Analysis: Utility billing data was weather normalized using PRISM. Screening criteria included no occupancy
" changes and no supplemental fuels. LBL assumed a ten year lifetime for the retrofits and entered the data as twoaggregate groups: treatment and control homes.
Results: The treatment group consumption decreased 2.2 MBtu/yr (3%) and the control group consumptionincreased 0.5 MBtu/yr (1%). At a mixed fuel cost of $9.14/MBtu, the payback period is 41 years.
M028: Winnipeg - 1977-84 Manitoba E&M CHEC Program 88
Buildings/Retrofit Description: Manitoba Energy and Mines evaluated energy savings from the 1977 to 1984 periodof the Cut Home Energy Costs (CI_.EC) loan program. The CHEC program provided loans of up to $1,000 at 9.5%interes' "or homeowners to retrofit their homes. A sample of 265 homes were analyzed, extensively. Retrofit costsfor these homes averaged $789 per house (in 1984 U.S. $). (Costs for foundation insulation do not include the costof sheetrock) to finish the basement). The saturation of retrofit measures is given below.
Measure Saturation (%)
Window replaceme, as 44Ceiling insulation 38Wall insulation 16
Door replacements 15Interior foundation insulation 14Infiltration reduction 4
On average, wall and foundation insulation increased tile insulation level from R-0 to R-11. Ceiling insula-tion R-values were increased from R-11 to R-40. Walls were insulated with high density blown cellulose. Founda-tions were usually insulated with batts and attics received a mixture of fiberglass batts and cellulose fill.
Data Analysis: The sample was composed of 77% gas-heated homes with the balance being heated with propane
and wood. Utility billing data was weather normalized and then HOTCAN was used to correct for internal gainsand add the energy ,'ontent of fuels other than gas. LBL entered the data in seven groups: the entire program (265houses), the entire program except for those who installed door and window retrofits (130) and five categories ofindividual retrofits. The Ilve individual retrofits measure included attic it, ulation retrofits (47), wall insulation (12),interior foundation insulation in heated basements (24), window replw;;rr:ents (89), and door replacements (15).LBL assumed a 25 year lifetime for the retrofit packages as well as lc,,",Le high density cellulose wall insulation and
window replacer.tents. The other other retrofit measures were assigned twenty year lifetimes. The study authors, provided retrofit costs in adjusted 1984 Canadian dollars. LBL used an exchange rate of 1.3 Canadian dollars per
U.S. dollar to convert to 1984 U.S. dollars. Payback I_.'riods were calculated using the natural gas price of$3.39/MBtu (local price converted to 1984 U.S. dollars).
Results: The study did not report initial consumption levels. Savings and simple payback periods are providedbe!ew.
65
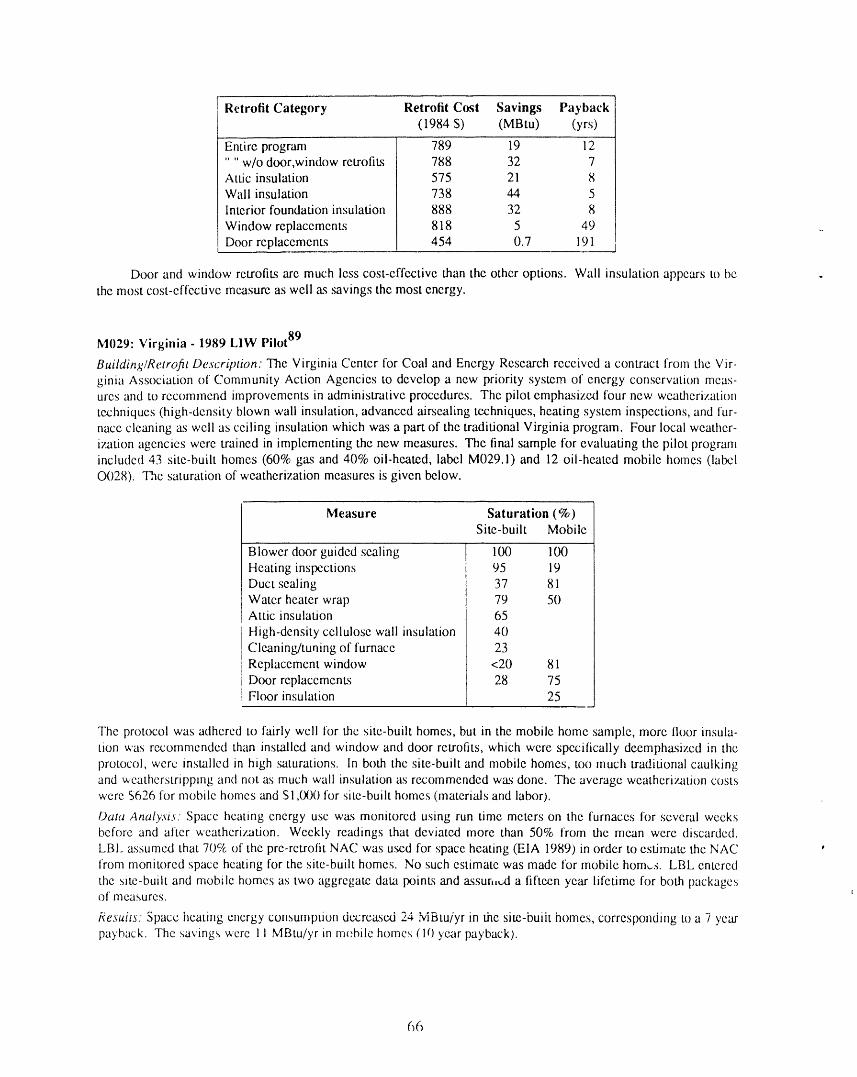
Retrofit Category Retrofit Cost Savings Payback(1984 $) (MBtu) (yrs)
Entire program 789 19 12.... w/o door,window retrofits 788 32 7Attic insulation 575 21 8Wall insulation 738 44 5
Interior foundation insulation 888 32 8
Window replacements 818 5 49Door replacements 454 0.7 191
Door and window retrofits are much less cost-effective than the other options. Wall insulation appears tc) bethe most cost-effective measure as well as savings the most energy.
M029: Virginia - 1989 LIW Pilot 89
Building/Retrofit Description: The Virginia Center for Coal and Energy Research received a contract from the Vir-ginia Association of Community Action Agencies to develop a new priority system of energy conservation meas-ures and to recommend improvements in administrative procedures. The pilot emphasized four new weatherizationtechniques (high-density blown wall insulation, advanced airsealing techniques, heating system inspections, and fur-nace cleaning as well as ceiling insulation which was a part of the traditional Virginia program. Four local weather-ization agencies were trained in implementing the new measures. The final sample tbr evaluating the pilot programincluded 43 site-built homes (60% gas and 40% oil-heated, label M029.1) and 12 oil-heated mobile homes (label0028). The saturation of weatherization measures is given below.
Measure Saturation (%)Site-built Mobile
Blower door guided sealing 100 100Heating inspections 95 19Duct sealing 37 81Water heater wrap 79 50Attic insulation 65
High-density cellulose wall insulation 40
Cleaning/tuning of furnace 23Replacement window <20 81Door replacements 28 75Floor insulation 25
The protocol was adhered to fairly well lor the site-built homes, but in the mobile home sample, more lloor insula-tion was recommended than installed and window and door retrofits, which were specifically deemphasized in theprotocol, were installed in high .saturations. In both the site-built and mobile homes, too much traditional caulkingand weatherstripping and not a.s much wall insulation as recommended was done. The average weatherization costswere 5626 for mobile homes and $1,000 for site-built homes (materi',.ds and labor).
Oata Analysis. Space heating energy use was monitored using run time meters on the furnaces for several weeksbefore and after weatherization. Weekly readings that deviated more than 50% from the mean were discarded.
LBL assumed that 70% of the pre-retrofit NAC was used for space heating (EIA 1989) in order to estimate the NACfrom monitored space heating for the site-built homes. No such estimate was made for mobile homes. LBL entered
the site-built and mobile homes as two) aggregate data poinLs and assur,,o..'!a fifteen year lifetime for both packagesof measures.
i_esuits: Space imating energy consumption decreased 24 bdBtu/yr in the site-built homes, corresponding to a 7 yearpayback. The savings were 11 MBtu/yr in mc'bile homes (10 year payback).
66
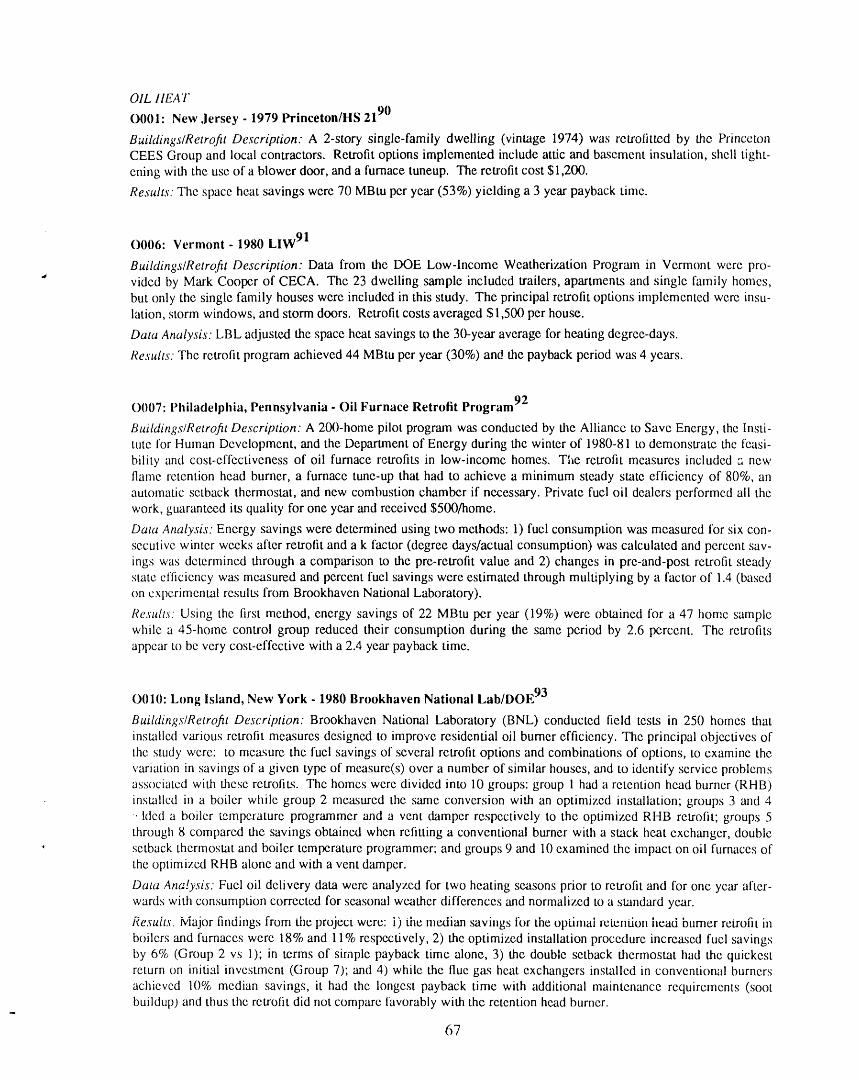
OIL IlEA T
O001: New Jersey - 1979 Princeton/HS 2190
Buildings/Retrofit Description: A 2-story single-family dwelling (vintage 1974) was retrolitted by the PrincetonCEES Group and local contractors. Retrofit options implemented include attic and basement insulation, shell tight-ening with the use of a blower door, and a furnace tuneup. The retrofit cost $1,200.
Results: The space heat savings were 70 MBtu per year (53%) yielding a 3 year payback time.
0006: Vermont - 1980 LIW 91
Buildings/Retrofit Description: Data from the DOE Low-Income Weatherization Program in Vermont were pro-vided by Mark Cooper of CECA. The 23 dwelling sample included trailers, apartments and single family homes,but only the single family houses were included in this study. The principal retrofit options implemented were insu-lation, storm windows, and storm doors. Retrofit costs averaged $1,500 per house.
Data Analysis: LBL adjusted the space heat savings to the 30-year average for heating degree-days.
Results: The retrofit program achieved 44 MBtu per year (30%) and the payback period was 4 years.
920007: Philadelphia, Pennsylvania - Oil Furnace Retrofit Program
Buildings/Retrofit Description: A 200-home pilot program was conducted by the Alliance to Save Energy, the Insti-tute for Human Development, and the Deparunent of Energy during the winter of 1980-81 to demonstrate the feasi-bility and cost-effectiveness of oil furnace retrofits in low-income homes. The retrofit measures included a new
flame retention head burner, a furnace tune-up that had to achieve a minimum steady state efficiency of 80%, anautomatic setback thermostat, and new combustion chamber if necessary. Private fuel oil dealers performed ali thework, guaranteed its quality for one year and received $500/home.
Data Analysis: Energy savings were determined using two methods: 1) fuel consumption was measured for six con-
secutive winter weeks after retrofit and a k factor (degree days/actual consumption) was calculated and percent sav-ings was determined through a comparison to the pre-retrofit value and 2) changes in pre-and-post retrofit steadystate efficiency was measured and percent fuel savings were estimated through multiplying by a factor of 1.4 (basedon experimental results from Brookhaven National Laboratory).
Results: Using the first method, energy savings of 22 MBtu per year (19%) were obtained for a 47 home samplewhile a 45-home control group reduced their consumption during the same period by 2.6 percent. The retrofitsappear to bc very cost-effective with a 2.4 year payback time.
O010: Long Island, New York - 1980 Brookhaven National Lab/DOE 93
Buildings/Retrofit Description: Brookhaven National Laboratory (BNL) conducted field tests in 250 homes that
installed various retrofit measures designed to improve residential oil burner efficiency. The principal objectives ofthe study were: to measure the fuel savings of several retrofit options and combinations of options, to examine thevariation in savings of a given type of measure(s) over a number of similar houses, and to identify service problemsassociated with these retrofits. The homes were divided into 10 groups: group 1 had a retention head burner (RHB)
installed in a boiler while group 2 measured the same conversion with an optimized installation; groups 3 and 4, lded a boiler temperature programmer and a vent damper respectively to the optimized RHB retrofit; groups 5through 8 compared the savings obtained when refitting a conventional burner with a stack heat exchanger, double
• setback thermostat and boiler temperature programmer; and groups 9 and 10 examined the impact on oil furnaces ofthe optimized RHB alone and with a vent damper.
Data Analysis: Fuel oil delivery data were analyzed for two heating seasons prior to retrofit and for one year after-wards with consumption corrected for seasonal weather differences and normalized to a standard year.
Results. Major findings from the project were: i) tile median savings for the optimal retention head burner retrofit in
boilers and furnaces were 18% and 11% respectively, 2) the optimized installation procedure increased fucl savingsby 6% (Group 2 vs 1); in terms of simple payback time alone, 3) the double setback thermostat had the quickestreturn on initial investment (Group 7); and 4) while the tlue gas heat exchangers installed in conventional burners
achieved 10% median savings, it had the longest payback time with additional maintenance requirements (sootbuildup) and thus the retrofit did not compare favorably with the retention head burner.
67
O011: Minnesota - 1981 LIEAP ()ii Furnace Retrotits 94
Buildings/Retrofit Description: The Institute for Human Development provided technical assistance to tile state ofMinnesota's Low Income Energy Assisumce Program by instituting an oil furnace retrofit program that was comple-mentary to existing weatherization efforts. The experimental design consisted of four groups: Group 1, householdswhose heating systems were retrofitted with llame retention burners and tuned up tc) achieve at legist 80% steaclystate efficiency; Group 2, homes that were weatherized (e.g. infiltration reduction measures, attic and some wallinsulation, storm windows and energy-relatexl minor repairs); Group 3 that receivect weatherization plus heating sys-tem retrolit, and a control group in which no retrofits were installed. Major objectives of the project included:
assessment of the additivity of savings between weatherization and oil furnace retrolit, the relative cost- .-effectiveness of the different treatmenLs, and analysis of the correlation between changes in fuel use and changes insteady state efliciency.
Data Analysis. After the measures were installed, fuel use for each house was determined from 8 weekly oil tankdipstick measurements taken during micl-winter from which a regression equation was estimated. Results were con_-p_ued to a schedule of oil deliveries from the previous year (Sept. 1981 - Sept. 1982). For ahnost one-half of thehouses only total annual usage was available for the pre-retrofit pericxt.
Results: The authors concluded that average usage decreased by 22.3% in Group 1, consumption declined by 12.49_in Group ,.,"_ Group .3 showed a 79,..._7%reduction and the control group's usage remained virtually unchanged.
()025: Wisconsin, Maine - ASE Persistence of Savings for Flame Retention tlead Burners 95
Building/lCetrc_fit Description: In 1987, the Alliance to Save Energy (ASE) looked at the persistence of savings fromretroiits of tlame retention head burners lot oil furnaces. The retrotits were performed in 1982 for low incomehouscholds in Wisconsin and Maine. The contractors were paid a tlat fee of $500 to install the retrofit.
Data Analysis: LBL entered the fifty two furnaces as one aggregate data point and assumed a fifteen year lifetimelk)r llame retention head burners. Fuel savings were calculated bttsed on measured steady state efficiency (SSE)
improvemenl.s. Based on work done by Brookhaven National Laboratory (Batey, et al., 1978), LBL multipliedoverall savings from burner efficiency improvements by 1.4 to include savings from reduced off-cycle losses.
(Flame retention burners reduce the off-cycle air llow through the burner and consequently reduce off-cycle losses).
Results. The steady state efficiency and ttssociated heating energy savings are shown below.
Time period SSE(%) Fuel Savings (%)
Pre-retrofit 67.8 0
Post-retrofit year 1 81.1 23.0
Post-retrofit year 5 76.9 16.5
Based on the assumption of constant post-retrotit SSE, the simple payback period is 3.6 years. Assuming alinear decay in efficiency, the simple payback period is 4.1 years. In either case, the payback period is shorter thanmost other measures used in weatherization programs.
Many furnaces were not serviced in the five years following the retrofit. Filters were often dirty or missing.Without tuning, many heat exchangers became coverecl with soot and therefore transferred heat less efficiently.ASE recommends that some of the money for such a program go into yearly maintenance of the furnaces to main-tain the high efficiency gains.
?
()026: Portland, Oregon - 1985 ()ii Burner Retrotit Pilot l'rogram 96
BuihtinulCetr@t l.)escription: In 1985 and 1986, the slate of Oregon funded a pilot program that installed tlamcretenticm head burners for low income households. Portland Energy Conservation, Inc. conducted an evaluation of,h............. ,, c_nl,, r,,m,,,,,,,. ,,,;,h ,.,,,,,_y ._:',.at,-"ef!icienci,,,- io_,,,lh_.,n7(]f:.,tr...... rO r,-,.tr,',iillr,tl ('h ,,:irto r'r_nlr.,r'lq_r_;,x,¢,r,:
hired and had a $5¢)0 limit (per household). The contractors were rcslxmsible for insullling and tuning up the newburner and achieving a minimum efficiency of eighty percent. The final sample included ninety-two homes.
Data Anal;,sis" Fuel savings were calculated both from steady state efticiency impmvemenLs and from dipstick read-ings. ]he measured fuel savings based on dipstick readings (22.8%) were calculated by looking only at the coldestpart of the )'ear. Thus, the measured savings clo not rellect ali of the savings trom reduced sumdby (off-cycle)
68
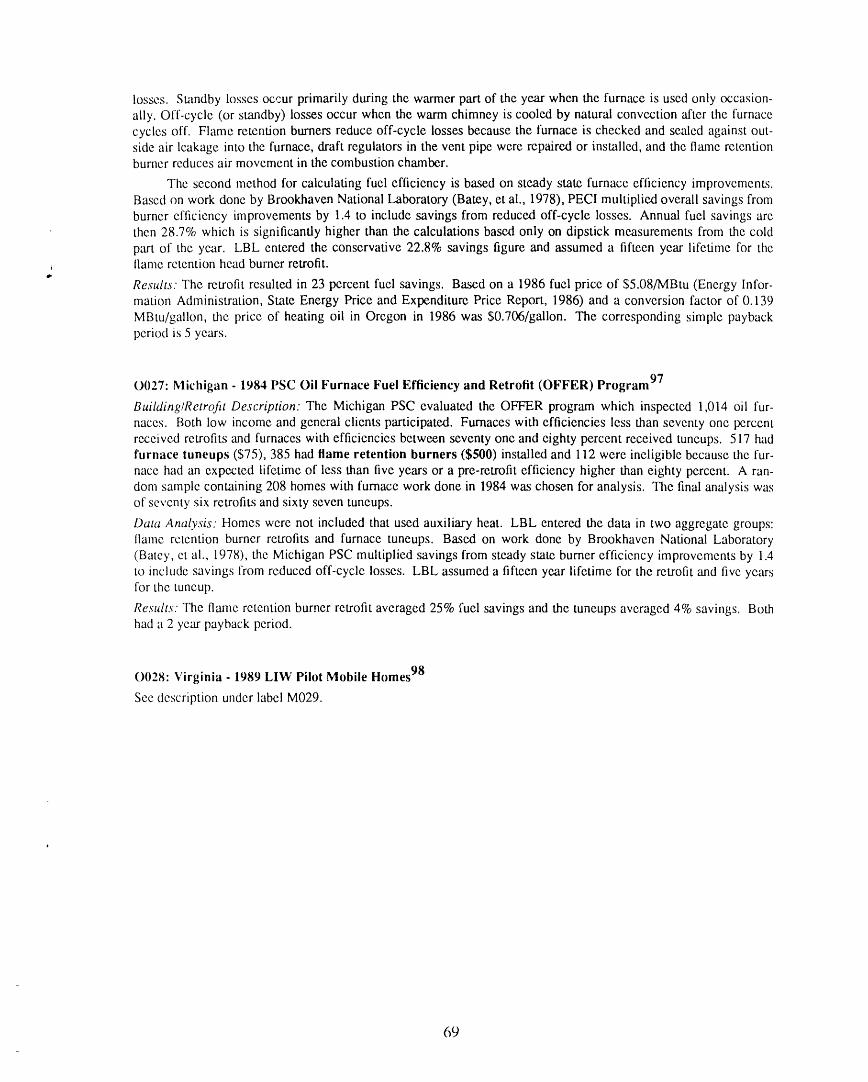
losses. Standby losses occur primarily during the warmer part of the year when the furnace is used only occasion-ally. Off-cycle (or standby) losses occur when the warm chimney is cooled by natural convection 'after the furnacecycles off. Flame retention burners reduce off-cycle losses because the furnace is checked and sealed against out-side air leakage into the furnace, draft regulators in the vent pipe were repaired or installed, and the flanae retentionburner reduces air movement in the combustion chamber.
The second method for calculating fuel efficiency is based on steady state furnace efficiency improvements.Based on work done by Brookhaven National Laboratory (Batey, et al., 1978), PECI multiplied overall savings from
burner efficiency improvements by 1.4 to include savings from reduced off-cycle losses. Annual fuel savings arethen 28.7% which is significantly higher than the calculations based only on dipstick measurements from the coldpart of the year. LBL entered the conservative 22.8% savings figure and assumed a fifteen year lifetime for thellame retention head burner retrofit.
Results." The retrofit resulted in 23 percent fuel savings. Based on a 1986 fuel price of $5.08/MBtu (Energy Infor-mation Administration, State Energy Price and Expenditure Price Report, 1986) and a conversion factor of 0.139
MBtu/gallon, the price of heating oil in Oregon in 1986 was $0.706/gallon. The corresponding simple paybackperiod is 5 years.
0027: Michigan - 1984 PSC ()ii Furnace Fuel Efficiency and Retrofit (OFFER) Program 97
Building/Retrofit Description: The Michigan PSC evaluated the OFFER program which inspected 1,014 oil fur-naces. Both low income and general clients participated. Furnaces with efficiencies less than seventy one percentreceived retrofits and furnaces with efficiencies between seventy one and eighty percent received tuneups. 517 hadfurnace tuneups ($75), 385 had flame retention burners ($500) installed and 112 were ineligible because the fur-
nace had an expected lifetime of less than five years or a pre-retrofit efficiency higher than eighty percent. A ran-dom sample containing 208 homes with furnace work done in 1984 was chosen for analysis. The final analysis wasof seventy six retrofits and sixty seven tuneups.
Data Analysis: Homes were not included that used auxiliary heat. LBL entered the data in two aggregate groups:
flame retention burner retrofits and furnace tuneups. Based on work done by Brookhaven National Laboratory(Batcy, ct al., 1978), the Michigan PSC multiplied savings from steady state burner efficiency improvements by 1.4to include savings from reduced off-cycle losses. LBL assumed a fifteen year lifetime for the retrofit and five yearsfor the tuneup.
Results. The flame retention burner retrofit averaged 25% fuel savings and the tuneups averaged 4% savings. Bothhad a 2 year payback period.
0028: Virginia - 1989 LIW Pilot Mobile Homes 98
See description under label M029.
69
REFERENCES
1. D. Ozenne and R. Reisner 1980, "The TVA Home Insulation Program: An Evaluation of Early Program Impact",ICF Inc., Washington D.C., April.
2. J. Collins, P. Shepherd, and T. Scripps 1981, "Demonstration of Energy Conservation Through Reduction of AirHouses , Johns-Manville Sales Corporation, Research and DevelopmentInfiltration in Electrically Heated " "
Center, E.P.R.I. (RP-1351-1), June.
3. S. Hannigan, and Patrick King 1982, "Residential Conservation Programs at Pacilic Power and Light Company:Models, Forecasts, and Assessments", EPRI-EB-2496, Workshop Proceedings: Measuring the Effects of Util-ity Conservation Programs, Electric Power Research Institute, Columbus Ohio, July.
4. R. Bradley, and J. Shaffer 1981, "Evaluation of Seattle City Light's Residential Insulation Program", Conserva-tion and Solar Division of Seattle City Light, Seattle WA, February.
5. J. Croft 1982, "Residential Weatherization Program Evaluation of Actual Savings", Puget Power, internal report,Juno 8.
6. T. Burnett 1982, "Measuring Weatherization Effectiveness: Portland General Electric Company's Experience",Portland General Electric Company Load Management and Research Branch, EPRI-EA-2496, WorkshopProceedings: Measuring the Effects of Utility Conservation Programs, Electric Power Research Institute,Columbus OH July.
7. J. Dickinson, D. Grimsrud, D. Krinkel, and R. Lipshutz 1981, "Results of the Bonneville Power Administralion
Weatherization and Tightening Projects at the Midway Substation Residential Community", Relx_rt #LBt,-12742, Lawrence Berkeley Laboratory, Berkeley CA, November.
8. T. Dukich, and R. Deniston 1982, "Changes in kWh Consumption of Single-Family, Electric Heat, Weatheriza-tion Loan Customers and Single Family, Electric Heat Non-participants", Washington Water Power Co.,prepared for PNUCC Conservation Committee.
9. D. Burch, and C. Hunt 1978, "Retrolitting an Existing Wood-Frame Residence for Energy Conservation - an
Experimental Study", National Bu,cau of Standards Building Science Series 105, Washington D.C., July.
10. E. Hirst, D. White, and R. Goeltz 1985, "Three Years after Participation: Electricity Savings due to the BPA
Residential Weatherization Pilot Program", ORNL/CON-166, Oak Ridge National Laboratory, Oak RidgeTN, January.
11. D. Sumi, and B. Coates 1988, "Longitudinal Evaluation of Energy Savings from Seattle City Light's HomeEnergy Loan Program (HELP)", City Light Department, Seattle WA, December.
12. T. Newcomb 1983, "Electricity Conservation Estimates for the Low-Income Electric Program", Seattle CityLight, Conservation and Solar Division, Seattle WA.
13. C. Weiss, and T. Newcomb 1981, "Evaluation of the Home Energy Check Program", Seattle City Light, Conser-vation and Solar Division, Seattle WA, November.
14. T. Burnett 1982, "Weatherization within Single-Family Residences: Report III, Estimation of Savings throughWeatherization", Portl;md General Electric Co., Load Planning Department, Portland OR, September.
15. D. Johnson 1983, "Idaho Power Company Zero Interest Loan Program: Actual/Estimated kWh Savings AnalysisII", Idaho Power Co., Energy Management Department, March.
16. R. Goeltz, E. Hirst, and D. Trumble 1986, "Electricity Savings One to Three Years After Participation in theBPA Residential Weatherization Program", ORNL/CON-194, Oak Ridge TN, April.
17. D. Perry, K. Ritland, ct al. 1985, "Effects of Weatherization on Loads of Selected PURPA Metered Residences",BPA Relx)rt No. 7237-R2, October.
18. E. Hirst, R. (;oeitz ct al. 1987, "Electricity Use and Savings in the Hood River Conservation Project",ORNL/CON-231, Oak Ridge TN, April.
19. M. Brown, D. White ct al. 1987, "Impact of the Hood River Conservation Project on Electricity Use forResidential Water Heating", ORNL/CON-238, Oak Ridge TN, October•
_,¢_, lr ! i. i t'_c_t-_ ui 4 -, • i r.-, ! ,- ......acJ. R ct m• :,c_,,• _luugll 1 *vluttltUlltlg aim evmuaucut of Replacing Low-Efiiciency Air Conditioners w,lm l llgll-Efficiency Air Conditioners in Single-Family Detachext Homes in Austin, Texas", Fleming Group (SyracuseNY), September.
21. Ni. Horowitz, and D. Philipp 1987, "Evaluation of the Utility Weatherization Assistance Programs", Interna-tional Energy Associates Limited, Portland OR, November.
70
22. M. Terries, _md W. Levins 1990, "Measured Space-Cooling Electricity Savings from Standard Energy Conserva-tion Measures, Radiant Barriers, and High-Efficiency Window Air Conditioners", Proceedings of the 1990ACEEE Summer Study, Pacific Grove CA, August 28-September 1.
23. D, Parker 1990, "Monitored Residential Space Cooling Electricity Consumption in a Hot-Humid Climate: Mag-nitude, Variation, and Reduction from Retrofits", Proceedings of the 1990 ACEEE Summer Study, Pacific
Grove CA, August 28-September 1.
24. M. Haeri 1988, "Electricity Savings Three Years After Participation in the Bonneville Power Administration
Regionwide Weatherization Program", ERC International, Portland OR, September.
25. D. White and M. Brown 1990, "Electricity Savings Among Participants Three Years After Weatherization inBonneville's 1986 Residential Weatherization Program", Oak Ridge National Laboratory, Oak Ridge TN,
September.4'
26. J. Fullmer 1982, "Wisconsin Weatherization Program Energy Savings Study", Wisconsin Division of EconomicAssistance, June.
27. F.W. Sinden 1977, "A Two-thirds Reduction in the Space Heat Requirements of a Twin Rivers Townhousc",F'U/CES 56, Center for Environmental Studies, Princeton NJ, December.
28. G. Dutt 1981, "If Home Energy Saving is Such a Good Idea, Why Don't More People Do It?", Preprint, Center
for Energy and Environmental Studies, Princeton NJ.
29. G. Dutt, M. Lavine, B. Levi, and R. Socolow 1982, "The Modular Retrofit Experiment: Exploring the HouseDoctor Concept", PU/CEES #130, Center for Energy and Environmental Studies, Princeton NJ, June.
30. Energy Conservation Information Center 1981, "Caswell Hill Work-study Final Report", Saskatoon,Saskatchewan, July.
31. F.L. Quivik 1981, "A Comparison Between Passive Solar and Superinsulation Retrofits", National Center for
Appropriate Technology, Butte MT.
32. M. Thornsjo 1980 and 1981, Northern States Power Co., private communication.
33. J. Williams 1980, "An Analysis of Heating Savings for Homes Retrofitted with Ceiling Insulation in San JoaquinDivision", Pacific Gas & Electric Co. Internal Report, July.
34. R. McLcnon 1981, Public Service Company of Colorado, private communication.
35. R. Crenshaw, and R. Clark 1982, "Optimal Weatherization of Low-Income Housing in the U.S.: A ResearchDemonstration Project", National Bureau of Standards Building Science Series 144, Washington D.C., Sep-tember.
36. Commission on Economic Opportunity 1980, "Conservation Data on 30 Weatherized Homes During 78/79 -79/80 Heating Seasons", Luzerne County PA.
37. Missouri Department of Natural Resources 1981, "Kansas City, Missouri: Evaluation of Home WeatherizationProgram", January 15.
38. D. Allen, and D. Gilbert ct al. 1980, "Report on the Impact of the Weatherization Program in Kentucky",University of Louisville, September.
39. J. Carley 198_0,"FEA Weatherization Assistance Program Regulations and Procedures Special Contract," Stateof Indiana FEA Contract CA-04-70368-00, January.
40. B.C. O'Regan, and B. Wagner, and J.B. Dickinson 1982, "Results of the Walnut Creek House Doctor Project",Report #LBL-15083, Lawrence Berkeley Laboratory, Berkeley CA, November.
41. N. Hegan, R. Herendeen, and L. Stiles 1982, "Measuring Energy Savings using Personal Trend Data: 12, Retrofits in Champaign-Urbana, Illinois", University of Illinois, presented at 1982 ACEEE Conference, Santa
Cruz CA, August.
42. D. Claridgc, and T. Brubaker 1982, "Preliminary Analysis of 50/50 Program RetroIits in Colorado", presented at1982 ACEEE Conference, Santa Cruz CA, August.
43. P. Proudfoot 1979, Testimony before the Michigan Public Service Commission, Case No. U-5451.
44. M. Quaid, and M. Anderson 1988, "Measured Energy Savings from Foundation Insulation in Minneapolis Sin-gle Family Homes", Proceedings from the 1988 ACEEE Summer Study, Pacific Grove, CA August.
45. M. Hewett, T. Dunsworth et al. 1986, "Measured versus Predicted Savings from Single Retrolits: a SampleStudy", Energy and Buildings, 9( 1986)65-73.
71
46. Wagner and Di_unond 1987, "The Kansas City Warm Room Project: Economics, Energy Savings, and ltealthand Comfort Impacts", Report #LBL-22752, Lawrence Berkeley Laboratory, Berkeley CA, January.
47. L. Berry, J. Bledsoe et al. 1987, "Evaluation of Gas Heating System Retrofit Pilot Programs in Kentucky andMinnesota", ORNL/CON-229, March.
48. P. Witte, M. Kushler 1987, "Results oi"the Michigan Natural Gas Furnace Retrolit Pilot for Low-Income House-holds", Public Service Commission, Michig_m Department of Commerce, Lansing MI, April.
49. J. Gregory 1987, "Ohio Home Weatherization Assistance Program Fined Report", Center for NeighborhoodDevelopment (Cleveland State University), December.
50. D. Hewitt, B. Senti et al. 1984, "Preliminary Weatherization Guidelines for the Low-Income WeatherizationProgram in Wisconsin", Wisconsin Energy Conservation Corporation, Madison WI, August.
51. J. Proctor, and R. deKieffer 1988, "Sun Power House Nurse Program", Sun Power Consumer Association,Denver CO, Septem_r.
52. R. Macriss, T. Zawacki et "al. 1980, "Analysis and Correlation oi"Seasonal Performance Data from the GasIndustry's Space Heating Efliciency Improvement Program (SHEIP), Institute of Gas Technology, ChicagoIL, May.
53. Ii. Hirst, R. Goeltz et al. 1983, "Evaluation of Home Energy Audit and Retrofit Loan Programs in Minnesota: theNorthern States Power Experience", ORNL/CON-136, Oak Ridge TN, December.
54. W. Kirkscy, R. Lordo ct al. 1989, "Ohio's Pilot Low-lncome Weatherization Project", Battelle, Columbus O!-t,
February.
55. L. Shen, G. Nelson et al. 1990, "The M200 Enhanced Low-Income Weatherization Demonstration Project",
Underground Space Center, University ot" Minnesota, February.
56. L. Berry, J. Bledsoe et al. 1987," Evaluation of Gas Heating System Retrofit Pilot Programs in Kentucky andMinnesota," ORNL/CON-229, Oak Ridge TN, March.
57. L. McCold, J. Schlegel ct al. 1988, "Field Test Evaluation of Conservation Retrofits of Low-Income, Single-Family Buildings in Wisconsin: Audit Field Test Implementation _mdResults", ORNL/CON-228/f_, June.
58. A. McKenzie, and S. Pheneger 1983, "The Cost-Effectiveness of the Minnesota Weatherization Assistance F'ro-
gram", Minnesota Department of Energy and Economic Development (St Paul MN), July.
59. M. Horowitz, and P. Degens 1987, "Evaluation of the Utility Weatherization Assistance Programs", Interna-tional Energy Associates Limited, Portland OR, November.
60. D. Robinson, and G. Nelson 1989, "Monitoring and Evaluation of Foundation Insulation Rem)fits in TwentyMinnesota Houses", Robinson Technical Services, St Paul MN.
61. J. McBride, and B. Castelli, ct al. 1988, "Findings from the Critical Needs Weatherization Research Project",National Center for Appropriate Technology (NCAT), Washington D.C.
62. M. Terncs, and P. Hu, ct al. 1989, "The National Fuel End-use Efficiency Field ]'est: Energy Savings and Per-lormance of an Improved Energy Efticiency Measure Selection Technique", Oak Ridge National Lalx)ratory,Oak Ridge TN, November.
63. M. J. Brummit 1984, "Marketing a Conservation Progrzun "l"hrough Grassroots Organizing: NeighborhoodEnergy Workshop Program in Minneapolis", Minneapolis Energy OIrice.
(,,4. M. Quaid, R. Faber 1988, "An Evaluation of Coordinated Energy Services: A Comprctmnsive Low Income
Conservation Program (Project Choice)," Minneapolis Energy Oftice, August.
65. Cambridge Systcmatics 1988, "Impact Evaluation of the l_x_wIncome Direct Weatherization Program," Berke-
ley CA, August.
66. J. Carmody 1986, "Evaluation oi" the Low-Income Weatherization Program in Minnesota", Underground SpaceCenter (University of Minnesota).
67. M. Kushler, P. Witte, ct al. 1987, "A Second Ycar Assessment of the Home Repair and Weatherization Com-
ponent of thc Michigan Energy Assurance Progrmn", Michigan Public Service Commission, July.
68. M. Kushler, and P. Witte 1988, "An Evaluation of the Fuel Savings Results of a New Weatherization McasuresPriority System", Michigan Department of Labor, January.
69. M. Kushler and P. Witte 1985, "A Study of Weatherization Service Alternatives in Michigan", Michigan PSC,March.
72
70. M. Kushler, and P. Witte 1986, "A Two Year Evaluation of tile Michigan Low-Income Weatherization t'ro-
gram", Michigan PSC, May.
71. W. Hill 1990, "Replacement Windows and Furnaces in the Heartland: Indiana's Energy Conservation FinancialAssistance Program", Proceedings of the 1990 ACEEE Summer Study, Pacific Grove CA, August 28-September 1.
72. C. Maclnness 1988, "Study of the Savings Achieved by High Efficiency Gas Furnaces and Boilers", UNIES
Ltd., Winnipeg, Manitoba, March.
73. L. Kinney, S. Bretschneider, and F. Baldwin 1990, "An Evaluation of the New York State Weatherization Assis-tance Program", Synertech Systems Corporation, Syracuse NY, June.
74. A. Bournakis 1988, "Analysis of Weatherization Measures in Low-Income Mobile Homes in 1986", Energy, Resources Center, University of Illinois at Chicago, Chicago IL, May.
75. A. Banerjec and M. Goidberg 1985, "Evaluation of Utility Weatherization Programs in Wisconsin," Departmentof Statistics, University of Wisconsin, Madison WI, September.
76. E. Habcr and P. Hastings 1989, "Short Term Energy Evaluation Project," Illinois Department of Commerce andCommunity Affairs, Springfield IL, September.
77. J. Randolph, K. Greely, and W. Hill 1991, "The Virginia Weatherization Evaluation Project," (Draft, cited withpermission), Virginia Center for Coal and Energy Research, Blacksburg VA, January.
78. R. Patterson, B. Mystikides 1987, An Analysis of Weatherization Measures in Low Income Housing in 1984,"Arthur D. Little, Inc., Cambridge MA, April.
79. R. Crenshaw, ct al. 1982, "Optimal Weatherization of Low-Income Housing in the U.S.: A Research Demons-
tration Project", National Bureau of Standards Building Science Series 144, Washington D.C., September.
80. N. Prochnow, and C. Saueressig 1977, " An Evaluation of the Community Services Administration's Weatheri-
zation Program in the Northwest Quarter of Wisconsin", U. of Wisconsin, September.
81. R. Talwar 1979, "Evaluation of the federal Weatherization Assistance Program in Minnesota", Mid-AmericaSolar Energy Center, Bloomington MN, December.
82. M. Cooper 1981, "A Comprehensive Analysis of the Costs and Benefits of Low-Income Weatherization and ItsPotential Relationship to Low Income Energy Assistance", Consumer Energy Council of America ResearchFoundation, Washington D.C., June.
83. M. Cooper 1981, "A Comprehensive Analysis of the Costs and Benefits of Low-Income Weatherization and ItsPotential Relationship to Low Income Energy Assistance", Consumer Energy Council of America ResearchFoundation, Washington D.C., June.
84. A. Ehnroth, J. Forslund, and C. Rolen 1982, "Effects of Energy Conservation Measures in Dwellings inSweden", Royal Institute of Technology, Stockholm, Sweden, presented at 1982 ACEEE Summer Study,Santa Cruz CA, August.
85. S. Nadcl, and M. Heineman 1986, "Fuel Savings Achieved by "House D_toring" and Storm Windows in Mas-sachusetts Low-Income Homes: Final Report", Massachusetts Audubon Society, Lincoln MA, November.
86. (_. Peabody 1984, "Weatherization Program Evaluation", Energy Information Administration, Office o1"EnergyMarkets and End Use, Washington D.C., August.
87. J. l_averty 1989, "Mobile Home Weatherization Research Project: Final Summary Report", Corporation forOhio Appalachian Development, Athens Ohio, March.
88. G. McVicar and P. Carroll 1985, "An Evaluation of the Home Insulation Program (H.I.L.P.) or as it is CurrentlyKnown - The Cut Home Energy Costs Loan Program (C.H.E.C.) for the Peri_,d 1977 to 1984", ManitobaEnergy and Mines, Winnipeg, Manitoba, March.
89..I. Randolph, K. Greely, and W. Hill 1991, "The Virginia Weatherization Evaluation Project," (Draft, cited withpermission), Virginia Center tbr Coal and Energy Research, Blacksburg VA, January.
90. G. Dutt 1981, "II Home Energy Saving is Such a Good Idea, Why Don't More People Do It?", Preprint, Centerfor Energy and Environmental Studies, Princeton NJ.
91. M. Cooper 1981, "A Comprehensive Analysis of the Costs and Benelits of Low-Income Weatherization and ItsPotential Relationship to Low Income Energy Assistance", Consumer Energy Council of America ResearchFoundation, Washington D.C., June.
73
92. W. Gathers, and F. Kensill 1982, "Measuring the Effects of Oil Furnace Retrofit in Low-Interim tqomcs", Alli-ance to Save Energy & Institute for Human Development, presented at the 1982 ACEEE Summer Study,Santa Cruz CA, August.
93. R. Hoppe, and W. Graves 1982, "Field Tests of Refit Equipment for Residential Oil-Fircd Heating Equipment",BNL-51555, Brookhaven National Laboratory, Upton NY, April.
94. J. Mitteldorf 1983, "Fuel Oil Savings from Oil Burner Retrofits and Weatherization: Minnesota, 1983", Institute
for l-Iunlan Development, Philadelphia PA.
95. G. Guyant, M. Hopkins, and M. Reid 1989, "Longevity of Energy Savings: An Inspection and Analysis ofOilheat Systems Five Years After Retrotit", Alliance to Save Energy, Washington D.C., July.
96. Portland Energy Conservation, Inc. 1986, "Evaluation of Oregon's Oil Burner Retrofit Pilot Program", PortlandOR, October.
97. P. Witte, and M. Kushler 1985, "Pilot Results for the Michigan Oil Furnace Fuel Eflicicncy and Retrolit
(OFFER) Program", Michigan Department of Commerce, Lansing MI, October.
98. J. Randolph, K. Greely, and W. Hill 1991, "The Virginia Weatherization Evaluation Project," (Draft, cited withpermission), Virginia Center for Coal and Energy Research, Blacksburg VA, January.
74
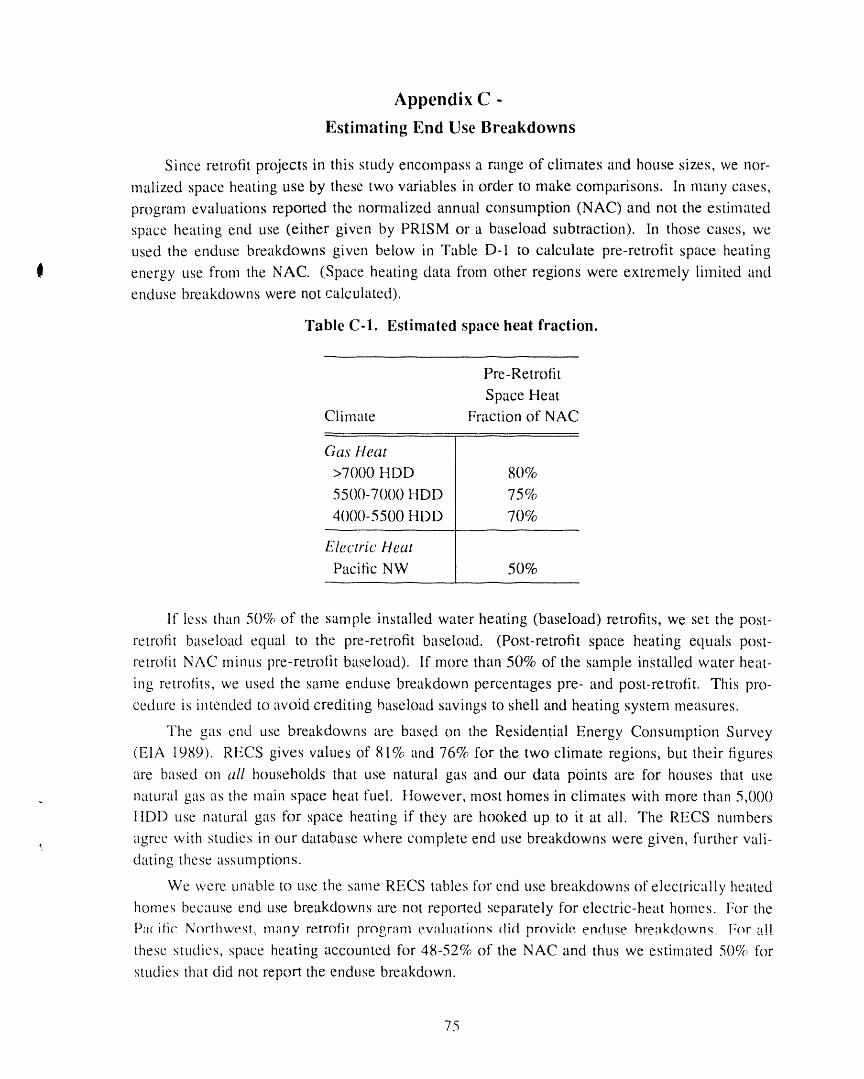
Appendix C -
Estimating End Use Breakdowns
Since retrofit projects in this study encompass a range of climates and house sizes, we nor-
realized space heating use by these two variables in order to make comparisons. In many cases,
program evaluations reported the normalized annual consumption (NAC) and not the estimated
space heating end use (either given by PRISM or a baseload subtraction). In those cases, weused the enduse breakdowns given below in Table D-1 to calculate pre-retrofit space heating
li energy use from the NAC. (Space heating data from other regions were extremely limited andenduse breakdowns were not calculated).
"Fable C-I. Estimated space heat fraction.
Pre-Retrofit
Space HeatClimate Fraction of NAC
Gas tteat
>7000 HDD 80%
5500-7000 HDD 75%
400()-5500 HDD 70%
Electric Heat
Pacific NW 50%
If less than 50% of the sample installed water heating (baseload) retrofits, we set the post-
retrofit baseload equal to the pre-retrofit baseload. (Post-retrofit space heating equals post-
retrolit NAC minus pre-retrolit baseload). If more than 50% of the sample installed water heat-
ing retrofits, we used the same enduse breakdown percentages pre- and post-retrofit. This pro-
cedure is intended to avoid crediting baseload savings to shell and heating system measures.
The gas end use breakdowns are based on the Residential Energy Consumption Survey
(EIA 1989). RECS gives values of 81% and 76% for the two climate regions, but their figures
are based on all households that use natural gas and our data points are for houses that use
natural gas as the main space heat fuel. However, most homes in climates with more than 5,000
HDD use natural gas fk)r space heating if they are hooked up to it at all. The RECS numbers
, agree with studies in our database where complete end use breakdowns were given, further vali-dating these assumptions.
We ,,,,,ereunable to use the same RECS tables for end use breakdowns of electrically heated
homes because end use breakdowns are not reported separately for electric-heat homes. For the
Pac ilic Ncwthwest: many retrofit program evaluatinns did provide e.n(tt!se breakdowns, l_:or.'a!!
these studies, space heating accounted for 48-52% of the NAC and thus we estimated 50% for
studies that did not report the enduse breakdown.
75
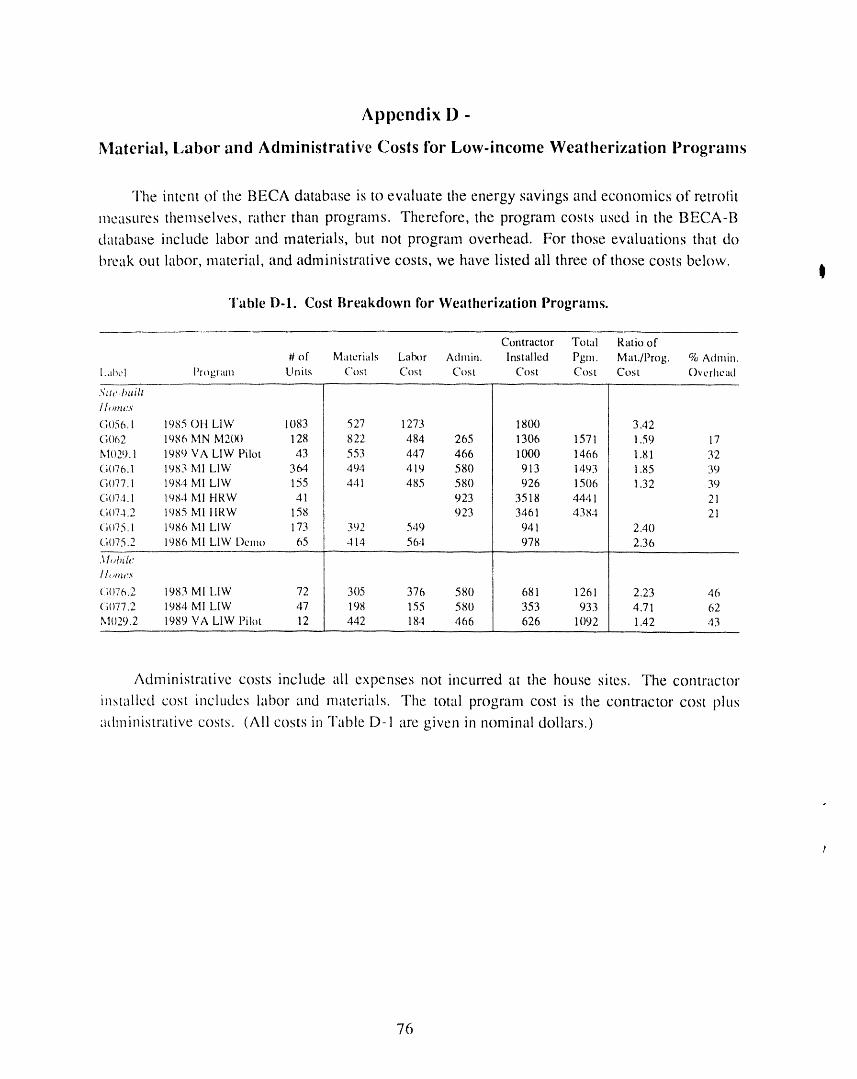
Appendix I) -
Material, Labor and Administrative Costs for Low-income Weatherization Programs
The intent of the BECA database is to evaluate tile energy savings and economics of retrofit
measures themselves, rather than programs. Therefore, the program costs used in tile BECA-B
database include labor :rod materials, but not program overhead. For those evaluations that dobreak out labor, material, and administrative costs, we have listed ali three of those costs below.
t
Table D-I. Cost Breakdown for Weatherization Programs.
Contractor Total Ratio of
# of Materials Labour Admin. Installed Pgm. Mat./F'rog. % Admin.l,ahcl Program Units Cost Cost Cost Cost Cost Cost Overhead
;li,' t,uiil
]¢mq£S
3056.1 1985 OH LIW 1083 527 1273 1800 3.42i;062 1986 MN M2(X) 128 822 484 265 1306 1571 1.59 17d()29.1 1989 VA LIW Pilot 43 553 447 466 1000 1466 1.81 3211076.1 1983 MI LIW 364 49:1 419 580 913 1493 1.85 39;077.1 198.4 MI LIW 155 441 485 580 926 1506 1.32 39
_;()74.1 lt_8=lMI HRW 41 923 3518 4441 215074.2 1985 NII tlRW 158 923 3461 4384 21i,(_75.1 1986 MI LIW 173 392 5,19 941 2.40
_]075.2 1986 MI LIW t)cmo 65 414 564 978 2.36
_t,,_,ii,, ..........
i;()76.2 1983 Ml I,IW 72 305 376 580 681 1261 2.23 46?,(177.2 1984 MI LIW 47 198 155 580 353 933 4.71 62q()29.2 1989 VA LIW Pilot 12 442 184 466 626 1092 1.42 43
Administrative costs include ali expenses not incurred at the house sites. The contractor
i_stallcd cost includes labor and materials. The total program cost is the contractor cost plus
athninistrative costs. (Ali costs in Table D-1 are given in nominal dollars.)
76


Related Documents