Measure of experimental pain using Rasch analysis Ce ´line Decruynaere, Jean-Louis Thonnard, Le ´on Plaghki * Unite ´ de Re ´adaptation et Me ´decine Physique (READ 5375), Universite ´ catholique de Louvain, Tour Pasteur, Avenue Mounier, 53, 1200 Bruxelles, Belgium Received 28 January 2006; received in revised form 12 June 2006; accepted 6 July 2006 Available online 17 August 2006 Abstract Most common instruments used to assess the painfulness of nociceptive stimuli and the perception of such stimuli are ordinal. This property limits arithmetical operations and statistical procedures that can be applied on their numbers. The Rasch methodol- ogy provides mathematical procedures for transforming scores on an ordinal scale into measures on an interval scale. The present paper aims at presenting the basics of this methodology by applying it to the measurement of experimentally induced pain. Six blocks of seven CO 2 laser heat stimuli varying in intensity were delivered on the hand of 100 healthy subjects. They rated their pain perception on a three-level verbal rating scale (not painful, slightly painful, painful). One member of the family of Rasch models, the many-facet model, was applied to the analysis of these ratings. The analysis provided linear measures of the painfulness for each intensity of stimulation, of the pain perception of each subject and of the painfulness of each successive block. All these measures are located on a single pain perception continuum. Advantages and disadvantages of this methodology will be discussed in terms of subsequent possible mathematical analyses, statistical tests and implications for experimental and clinical investigations. Ó 2006 European Federation of Chapters of the International Association for the Study of Pain. Published by Elsevier Ltd. All rights reserved. Keywords: Pain assessment; Measure; Rasch analysis 1. Introduction Most common instruments used to assess the painful- ness of nociceptive stimuli and the perception of such stimuli are ordered verbal or numerical rating scales. These scales are widely used as they are inexpensive, easy to design and to administer, and because they provide quite valuable information. Numbers are assigned to the different response categories. Ordinal scores usually start at zero for the lowest category and follow a regular progression by increment of one till the highest category. Nevertheless, there is no real basis for choosing one num- ber progression instead of another. Any scheme can be used to assign numbers, as long as the numbers get larger with consecutive categories. These numbers only indicate an ordering relationship and cannot be considered as measures (Merbitz et al., 1989; Wright and Linacre, 1989) because no information is given concerning the dis- tance that separates each pair of adjacent categories of the underlying attribute that is measured. All that is known is that higher numbers represent ‘‘more’’ of the attribute. Considering a 4-level rating scale: not painful, slightly painful, moderately painful and extremely pain- ful; scored 0, 1, 2 and 3, respectively, a reduction from category 2 to category 0 represent a greater relief than a change from category 2 to category 1 but not necessar- ily twice as much. Often, however, arithmetical opera- tions and parametrical statistics are performed on scores obtained on these ordinal scales. These operations are in principle not valid because scores allocated to each category are not true numbers. Consequently, results are 1090-3801/$32 Ó 2006 European Federation of Chapters of the International Association for the Study of Pain. Published by Elsevier Ltd. All rights reserved. doi:10.1016/j.ejpain.2006.07.001 * Corresponding author. Tel.: +32 2 764 16 68; fax: +32 2 764 53 60. E-mail address: [email protected] (L. Plaghki). www.EuropeanJournalPain.com European Journal of Pain 11 (2007) 469–474

Welcome message from author
This document is posted to help you gain knowledge. Please leave a comment to let me know what you think about it! Share it to your friends and learn new things together.
Transcript

Measure of experimental pain using Rasch analysis
Celine Decruynaere, Jean-Louis Thonnard, Leon Plaghki *
Unite de Readaptation et Medecine Physique (READ 5375), Universite catholique de Louvain, Tour Pasteur,Avenue Mounier, 53, 1200 Bruxelles, Belgium
Received 28 January 2006; received in revised form 12 June 2006; accepted 6 July 2006Available online 17 August 2006
Abstract
Most common instruments used to assess the painfulness of nociceptive stimuli and the perception of such stimuli are ordinal.This property limits arithmetical operations and statistical procedures that can be applied on their numbers. The Rasch methodol-ogy provides mathematical procedures for transforming scores on an ordinal scale into measures on an interval scale. The presentpaper aims at presenting the basics of this methodology by applying it to the measurement of experimentally induced pain. Sixblocks of seven CO2 laser heat stimuli varying in intensity were delivered on the hand of 100 healthy subjects. They rated their painperception on a three-level verbal rating scale (not painful, slightly painful, painful). One member of the family of Rasch models, themany-facet model, was applied to the analysis of these ratings. The analysis provided linear measures of the painfulness for eachintensity of stimulation, of the pain perception of each subject and of the painfulness of each successive block. All these measuresare located on a single pain perception continuum. Advantages and disadvantages of this methodology will be discussed in terms ofsubsequent possible mathematical analyses, statistical tests and implications for experimental and clinical investigations.! 2006 European Federation of Chapters of the International Association for the Study of Pain. Published by Elsevier Ltd. Allrights reserved.
Keywords: Pain assessment; Measure; Rasch analysis
1. Introduction
Most common instruments used to assess the painful-ness of nociceptive stimuli and the perception of suchstimuli are ordered verbal or numerical rating scales.These scales are widely used as they are inexpensive, easyto design and to administer, and because they providequite valuable information. Numbers are assigned tothe di!erent response categories. Ordinal scores usuallystart at zero for the lowest category and follow a regularprogression by increment of one till the highest category.Nevertheless, there is no real basis for choosing one num-ber progression instead of another. Any scheme can beused to assign numbers, as long as the numbers get larger
with consecutive categories. These numbers only indicatean ordering relationship and cannot be considered asmeasures (Merbitz et al., 1989; Wright and Linacre,1989) because no information is given concerning the dis-tance that separates each pair of adjacent categories ofthe underlying attribute that is measured. All that isknown is that higher numbers represent ‘‘more’’ of theattribute. Considering a 4-level rating scale: not painful,slightly painful, moderately painful and extremely pain-ful; scored 0, 1, 2 and 3, respectively, a reduction fromcategory 2 to category 0 represent a greater relief thana change from category 2 to category 1 but not necessar-ily twice as much. Often, however, arithmetical opera-tions and parametrical statistics are performed onscores obtained on these ordinal scales. These operationsare in principle not valid because scores allocated to eachcategory are not true numbers. Consequently, results are
1090-3801/$32 ! 2006 European Federation of Chapters of the International Association for the Study of Pain. Published by Elsevier Ltd. All rightsreserved.doi:10.1016/j.ejpain.2006.07.001
* Corresponding author. Tel.: +32 2 764 16 68; fax: +32 2 764 53 60.E-mail address: [email protected] (L. Plaghki).
www.EuropeanJournalPain.com
European Journal of Pain 11 (2007) 469–474

potentially erroneous (Townsend and Ashby, 1984).These operations require scales with known and equalintervals. Such scales are defined as interval scalesaccording to the classification of measurement scalesestablished by Stevens (1946). In these scales, the di!er-ence between two graduations is known and constantall along the dimension of interest. Compared with ordi-nal scales, besides the ordering relationship, numbers oninterval scales tell us how much more of the attribute ofinterest is present. Interval scales are linear and quantita-tive. They allow all elementary arithmetical operationsand accordingly calculation of common statistical indi-cators leading to meaningful quantitative comparisonswithin and between subjects.
In the context of painmeasurement, more informationcould be gained if pain perception was expressed on aninterval scale. The family ofRaschmodels providesmath-ematical procedures for transforming responses on anordinal scale intomeasures of pain perception on an inter-val scale ofmeasurement. Thesemodels take into accountdi!erences in stimulus characteristics as well as variationsbetween subjects and allow strong predictions of a sub-ject’s future pattern of responses to painful stimuli(McArthur et al., 1992). The present paper aims at pre-senting the basics of one of these models, the many-facetmodel (Linacre, 1989), by applying it to the measurementof experimentally induced pain. Finally, advantages anddisadvantages as compared to the use of ordinal scoreswill be discussed in terms of subsequent possible mathe-matical analyses, statistical tests and implications for clin-ical investigations.
2. Methods
2.1. Subjects
Experiments were performed on 100 healthy volun-teers. These subjects had no history of neurological, psy-chiatric or chronic pain disorders. This was determinedon the basis of a short interview at the time of therecruitment. Eight participants were excluded from theanalysis for technical reasons. A significant thermal driftof the laser power occurred during their experimentalsession. The 92 remaining subjects (39 males and 53females) were between 20 and 59 years of age (mean:39.4). The study was authorized by the ethics committeeof the Universite catholique de Louvain, Faculty ofMedicine in Brussels, Belgium.
2.2. Experimental apparatus and design
2.2.1. Laser stimulatorCutaneous heat stimuli were delivered by a CO2 laser
(10.6 lm wavelength) (Plaghki et al., 1994) on the dor-sum of the right hand. The laser was designed and built
in the Department of Physics (Universite catholique deLouvain, Belgium). Stimulus duration was 50 ms andits surface area was 79 mm2 (10 mm diameter). In orderto minimize habituation or nociceptor sensitization, thelaser beam was moved between each stimulus.
2.2.2. Experimental designA few stimuli varying in strength were applied before
starting the recording session in order to familiarize sub-jects with the nociceptive stimuli. The recording sessionwas divided into 6 successive blocks. Each block con-sisted of 7 di!erent test stimuli (325, 400, 475, 550,625, 700 and 775 mJ) applied in random order with aninter-stimulus interval of 10–15 s. A session lasted about15 min.
2.2.3. Data acquisition: pain perceptionSubjects were informed that they would receive stim-
uli of varying laser intensities, which could produce tac-tile and/or thermal sensations like a touch, a tingle, apinprick, warmth or a burn. They were instructed to ratethe intensity of their perception, whatever the quality ofthe sensation, on a three-level verbal rating scale labeled‘not painful’, ‘slightly painful’, ‘painful’ after each laserstimulus. The scale appeared on a computer screenplaced in front of the subject who had to check one ofthe three categories with a mouse hold in the left hand.Stimuli that were not perceived were considered as notpainful. The response categories (not painful, slightlypainful, painful) were scored 0, 1 and 2, respectively sothat subject’s total scores (TSsubj) could range from 0to 84 (2 · 7 stimuli · 6 blocks). From the 92 subjects,seven always answered in the category ‘‘not painful’’providing an extreme TSsubj score of 0. As extremescores imply undefined measures from the Rasch analy-sis, these 7 subjects were not taken into account for thesubsequent analysis. The total score for a given stimulusintensity (TSstim) is the sum of the scores of all subjectsthrough all blocks. TSstim can range from 0 to 1020(2 · 85 subjects · 6 blocks). The total score for a givenblock (TSblock) is the sum of the scores of all subjectsto all stimuli. TSblock could range from 0 to 1190(2 · 85 subjects · 7 intensities).
2.3. Rasch analysis
Developed in the 1950s, the Rasch model is part of afamily of models known as item response theory (IRT).This model requires that only stimulus painfulness andsubject’s perception determine the probabilities ofresponse category choice when subject has to score painevoked by the stimulus. These two parameters (subject’sperception and stimulus painfulness) are estimated bythe model from the matrix of reported responses. Ini-tially, the model was developed for dichotomous data(e.g., not painful/painful) (Rasch, 1960). Later, the ori-
470 C. Decruynaere et al. / European Journal of Pain 11 (2007) 469–474
ginal model has been extended to the analysis of polyt-omous items, i.e., with more than two ordered responsecategories (Wright and Masters, 1982; Andrich, 1988).In the present design, with the inclusion of repetitiveblocks, it is useful to estimate simultaneously not onlythe perception of the subject and the painfulness of thestimulus but also the block painfulness allowing toquantify the e!ect of block repetition on pain percep-tion. This is accomplished by applying another expan-sion of Rasch’s original (i.e., two-facets) model calledthe many-facet model (Linacre, 1989).
Responses to the experimental stimuli were thus con-sidered as a three-faceted data matrix (85 subjects · 6blocks · 7 intensities of stimulation). A many-facetRasch analysis was performed using FACETS! (Lina-cre, 1994a). The rating scores were analyzed with thethree-faceted rating scale model as formulated below(Linacre, 1989):
logPnijk
P nijk!1
! "" bn ! di ! kj ! sk
where, Pnijk is the probability of subject n giving a ratingof k on stimulus i in bloc j, Pnijk ! 1 is the probability ofsubject n giving a rating of k ! 1 on stimulus i at thebloc j, bn is the pain perception of subject n (n = 1,2, . . ., 85), di is the painfulness of stimulus i (i = 1,2, . . ., 7), kj is the painfulness of block j (j = 1, 2, . . ., 6),sk is the threshold between each pair of adjacent catego-ries and k = 1, 2.
This formula computes the probability that a subjectwill give a particular response to a given stimulus in agiven block. As the rating scale used in this study ispolytomous (three response categories), the model alsoprovides a measure of the thresholds (sk) that separateeach pair of adjacent response categories. Subject, stim-ulus, block and threshold measures are accompanied bystandard errors (SE) representing the range withinwhich the true measures are expected to lie. All thesemeasures are located on the same equal-interval scaleand are expressed in the same unit, the logit. The logitactually expresses a di!erence (e.g., between subjects,between stimuli or between subjects and stimuli). Onelogit can be defined as the increase in subject’s pain per-ception that increases the probability of responding in agiven category rather than in the category below by afactor of e1 = 2.71. As stimuli are located on the samemeasurement scale, one logit can also be defined as theincrease in stimulus painfulness that increases the prob-ability of responding in a given category rather than inthe category below by a factor of e1 = 2.71. This unitof measurement is constant all along the pain perceptionscale.
Rasch analysis estimates separation reliability forsubjects, stimuli and blocks (Wright and Masters,1982; Fisher, 1992). The index of separation reliability
(R) is defined as the ratio between the true measure var-iance and the observed (true + error) measure variance.In other words, it corresponds to the proportion ofobserved variance that is not due to measurement error.Separation reliability indicates the reliability with whichmeasures can be separated, with values ranging between0 and 1 (Wright and Masters, 1982). The higher R, thebetter the measures are separated. High subject separa-tion reliability means that subjects are well separatedaccording to their pain perception; high stimulus separa-tion reliability means that stimuli are well separatedaccording to their painfulness; high block separationreliability means that identical intensities of stimulationare di!erently perceived from one block to another.
3. Results
The dominant tendency among subjects was to use lowpain ratings for laser stimuli as the percentage ofresponses to all stimuli and all blocks in the di!erent cat-egories was 60%, 30% and 10% for ‘not painful’, ‘slightlypainful’ and ‘painful’, respectively. Stimuli that were notperceived (11%) were considered as not painful (cf. meth-ods). As expected, we observed an increase in the TSstimwith the increase in the laser power (Table 1, two first col-umns). Concerning the TSblock, we observed a slightdecline from the first block to the sixth (Table 2, two firstcolumns) but this decrease was not perfectly monotonic.
The many-facet Rasch analysis that follows allowedus to quantify the pain perception. This analysis resultedin linear measures in logit units for subjects, stimuli,blocks and thresholds. All these measures can be locatedon a single pain perception continuum.
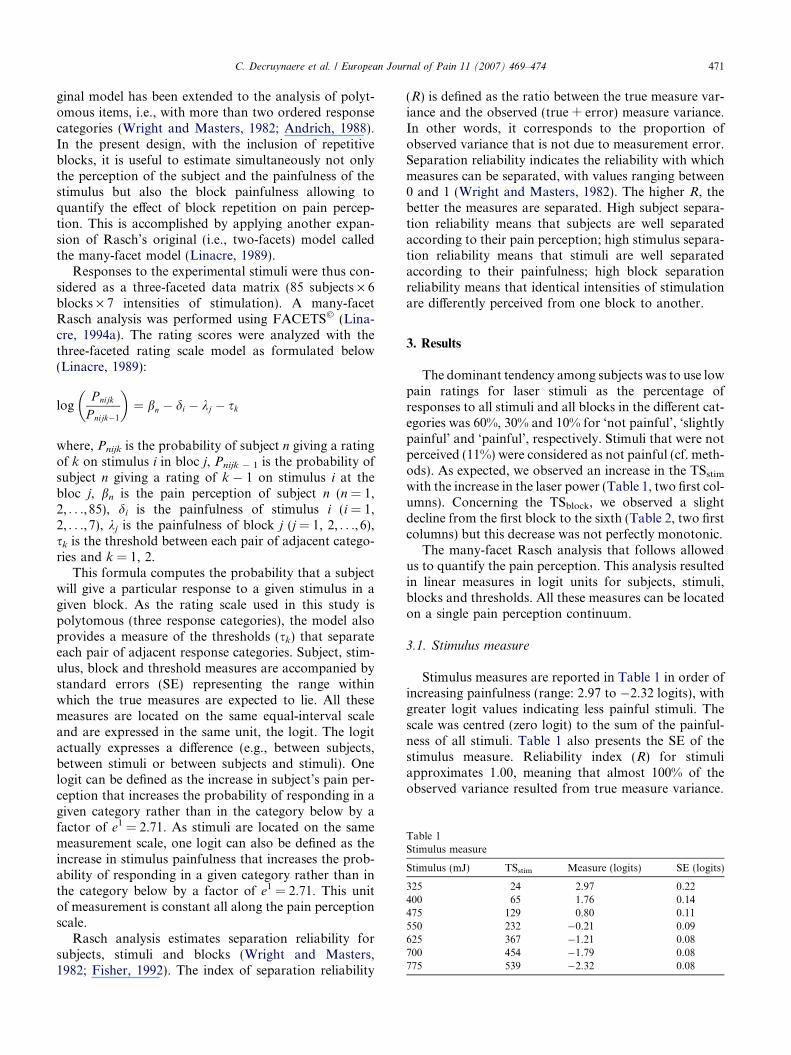
3.1. Stimulus measure
Stimulus measures are reported in Table 1 in order ofincreasing painfulness (range: 2.97 to !2.32 logits), withgreater logit values indicating less painful stimuli. Thescale was centred (zero logit) to the sum of the painful-ness of all stimuli. Table 1 also presents the SE of thestimulus measure. Reliability index (R) for stimuliapproximates 1.00, meaning that almost 100% of theobserved variance resulted from true measure variance.
Table 1Stimulus measure
Stimulus (mJ) TSstim Measure (logits) SE (logits)
325 24 2.97 0.22400 65 1.76 0.14475 129 0.80 0.11550 232 !0.21 0.09625 367 !1.21 0.08700 454 !1.79 0.08775 539 !2.32 0.08
C. Decruynaere et al. / European Journal of Pain 11 (2007) 469–474 471

3.2. Block measure
Measures and SE for the six blocks are presented inTable 2, with greater logit values indicating that blocksare perceived as less painful. Blocks tend to be perceivedas less painful over time. However, that decrease inblock painfulness was rather small, ranging from!0.21 to 0.24 logit (range = 0.45 logit) and not whollymonotonic (see last block). Moreover, if we considerthe SE associated with the estimation of the block mea-sure, we cannot conclude to a significant block e!ect.Indeed, the SE signifies that you have 95% of chancethat the true block measure lies within a range ofapproximately ± 2 SE. This range is called the confi-dence interval (CI). The CIs of five blocks out of sixoverlap making this block e!ect not significant. Reliabil-ity index (R) was 0.73, meaning that 27% of theobserved variance resulted from measurement error.
3.3. Subject’s measure
Distribution of subjects’ measures is displayed on thetop panel of Fig. 1. These measures range approximatelyfrom !6 to 1.5 logits with higher values associated withhigher pain reports. Complete table with measures andSE is not displayed. Subject separation reliability of0.93 indicates that the calibrated stimuli have wellspread out the subjects along the pain perceptioncontinuum.
3.4. Relationship between the subject’s measure and itstotal score (TSsubj)
The bottom panel of Fig. 1 shows the ogival relation-ship between the TSsubj (range: 0–84) and the measuresof pain perception. Note that this relationship is almostlinear between approximately !2 and 2 logits. Neverthe-less, this relationship is not linear outside this rangewhere half of the subjects are located (Fig. 1, top panel).
3.5. The most probable response and threshold measure
The top panel of Fig. 2 is the item map for the firstblock. This item map displays the most probableresponse to a given stimulus as a function of the measure
Table 2Block measure
Block TSblock Measure (logits) SE (logits)
1 327 !0.21 0.092 321 !0.17 0.093 318 !0.13 0.094 286 0.13 0.095 273 0.24 0.096 285 0.14 0.09
Subj
ects
0
5
10
15
Pain perception (logits)
-6 -4 -2 0 2 4 6
TS s
ubj
0
30
60
Fig. 1. Top panel: distribution of subjects’ pain perception measures.Bottom panel: relationship between subject’s total scores (TSsubj)(range: 0–84) and pain perception measures (solid line) and its 95%confidence interval (dotted lines). The ogival shape of the relationshipaccounts for the non-linear transformation of scores into linear painperception measures. The broken lines illustrates that an identicaldi!erence in terms of score (5 points) all along the scale does notnecessarily represent an identical di!erence in terms of measure.
Pain perception (logits)
-6 -4 -2 0 2 4 6
Subj
ects
05
1015
Exp
ecte
d sc
ore
325 mJ
400 mJ
475 mJ
550 mJ
625 mJ
700 mJ
775 mJ
Not painfulSlightly painfulPainful
Fig. 2. Top panel: item map for the first block providing a subject’s most probable response to each stimulus as a function of the measure of painperception. Bottom panel: distribution of subjects’ pain perception measures.
472 C. Decruynaere et al. / European Journal of Pain 11 (2007) 469–474

of pain perception. By comparing the measure of a givensubject to the painfulness of each stimulus, it is possibleto determine his most probable response category toeach stimulus of this first block. For instance, a subjectwith a perception of !2 logits (dotted line in Fig. 2)would be expected to rate the four less painful stimulias not painful and the three most painful as slightlypainful. None of the stimuli would be rated as painful.On the item map, the points of transition from one greyshade to the adjacent one are the thresholds of the firstblock. For a given stimulus, the threshold between twoconsecutive response categories corresponds to the levelof perception for which the response probabilities of thetwo adjacent categories are equal. The item map for theother blocks can be obtained simply by translating tothe right the thresholds by the di!erence of measurebetween the first block and each subsequent block(0.04, 0.08, 0.34, 0.45 or 0.35 logit, see Table 2, third col-umn). As a fact, the shift is quite small.
4. Discussion
The purpose of the present study was to present aprobabilistic model, the many-facet Rasch model, toanalyze rating scale data and to apply it with experimen-tal pain ratings. This model overcomes the limitations ofordinal scales by transforming scores of the di!erentparameters (subjects, stimuli and blocks in the presentcase) into measures on a common interval scale. Thispsychometric approach, derived from item response the-ory (IRT) is still not much exploited by the pain commu-nity perhaps due to its ‘‘originality and specificterminology’’ (Tesio, 2003). Few studies have appliedthe Rasch model to quantify pain perception in experi-mental (McArthur et al., 1992) and clinical settings(e.g., McArthur et al., 1991; Thomee et al., 1995; Tesioet al., 1997; Wolfe, 2003; Pesudovs and Noble, 2005).
A major advantage of Rasch analysis consists in theresulting linear measures of pain perception for sub-jects. This allows comparing quantitatively either twosubjects (or two groups of subjects) or the same sub-jects at two di!erent moments. A di!erence of 1 logitunit between two subject’s measure indicates that thesubject with the higher perception has a probabilityof responding in a given category (e.g., ‘‘slightly pain-ful’’) rather than in the category below (e.g., ‘‘not pain-ful’’) raised by a factor e1 = 2.71 whatever the stimulus,the block and their absolute location along the scale.The ogival relationship between TSsubj and subject’smeasure estimated by the model (Fig. 1, bottom panel)means that in the central part of the scale, this relation-ship is approximately linear but outside the middle ofthe scale, it is not. In other words, according to thelocation along the scale, an identical increment in theTSsubj (on the y-axis) does not represent an identical
increment in pain perception measure (on the x-axis)all along the pain perception continuum. The brokenlines illustrate that point. Consider two subjects whoseTSsubj equals 50 and 10, respectively. An equal decreaseof 5 points in terms of TSsubj for both subjects corre-sponds to very unequal pain relief in terms of measureof pain perception expressed in logit units (0.42 versus0.95). The more you move away from the centre of thescale (TSsubj of 42), the more a di!erence of one interms of TSsubj represents a large variation of measureof pain perception. This can be particularly critical asillustrated in this study where half the population islocated on the left of the linear part of the relationship.In clinical practice, when dealing with patients we cansuppose that subjects may often been located at theextremities of scales where TSsubj are not linear. Quan-titative comparisons using TSsubj for these subjectscould lead to erroneous conclusions. In the presentcase, we may attribute the relatively low pain percep-tion to the reluctance of healthy subjects to label a verybrief and well-controlled stimulus as painful particu-larly in the absence of any anxiogenic component (sub-jects knew that the experiment did not carry any risk).Higher stimulus intensities were not used due to thepotential risk of skin burn.
Concerning the block parameter, the many-facetedRasch analysis resulted in slightly di!erent measuresfor the successive blocks with a tendency to be perceivedas less painful over time. However, this e!ect was notsignificant, providing evidence for the absence of habit-uation or sensitization. It is worthwhile to notice herethat this many-faceted model can also be used to quan-tify the e!ect of experimental or therapeutic interven-tions. For instance, if we had to test an analgesic drug,this method could have revealed the presence or absenceof a treatment e!ect and, most importantly, quantified iton a linear scale.
Of course, the limitations of the Rasch analysis mustalso be taken into consideration. The first limitationconcerns the intellectual investment in order to fullyunderstand the model as well as to handle the analysissoftware. Indeed, the analysis of ratings with the Raschmodel requires more e!ort than the traditional han-dling of ordinal scores. The second limitation is relatedto the sample size required for building a high preci-sion instrument for measurement. In general, the biggerthe sample size, the more precise the stimulus calibra-tion estimated by the model. This measurement preci-sion is modelled by the SE associated with theestimated stimulus measure. In the present study, thestimulus SE was around 0.1 logit meaning that we have95% confidence that stimulus calibration was no morethan 0.2 logit away from their estimated value (Lina-cre, 1994b). Notice that the SE for the lowest intensi-ties of stimulation was higher (Table 1). This isexplained by the poorer targeting of these intensities
C. Decruynaere et al. / European Journal of Pain 11 (2007) 469–474 473

with the sample of subjects. Moreover, the scale cali-bration holds only for subjects presenting the samecharacteristics than those of the sample used to cali-brate the scale. It means that for clinical applications,invariance of the measurement instrument must be ver-ified according to clinical state, age and gender.
However, these limitations should not constitute anobstacle for using the Rasch model. They can be over-come. Indeed, once an investigator su"ciently familiar-ized with the Rasch model has calibrated themeasurement scale, the relationship between the sub-ject’s total score and its pain perception measure isdetermined. Consequently, each time another investiga-tor, maybe less familiarized with the model, assesses asingle additional subject, he can use the total score toobtain the linear measure of pain perception by simplegraphical interpolation of this relationship (Fig. 1, bot-tom panel).
Finally, two advantages of the Rasch model must beunderlined. First, it allows obtaining measures of per-ception from a relatively small number of rating dataper subject. Although, long experimental designs arenot a major concern in the experimental field, they canbecome one in the clinical domain where time-consum-ing procedures are not realistically done neither for thepatient nor for the practitioner. In the present study,in view of the absence of a meaningful block e!ect, wecan envisage to further reduce the number of blocks.The only disadvantage of this reduction lies in theincrease of the SE of subjects’ measure or in other wordsin the decrease in subjects’ measurement precision. Asecond advantage of the model is that its application isnot limited to experimental stimuli for which we havea known physical calibration. It can also be used in aclinical context when rating data correspond forinstance to pain experienced during di!erent conditionssuch as walking, standing or sitting (McArthur et al.,1991; Tesio et al., 1997; Thomee et al., 1995; Whiteet al., 2002; Davis et al., 2003).
In conclusion, the Rasch methodology overcomesthe limitations associated with the use of ordinalscores. It provides scientific rigorousness to pain per-ception assessment, which can then be considered aslinear, quantitative information rather than ‘‘soft’’qualitative data (Tesio, 2004). Therefore, this methodcontributes to eliminate the di!erence existing betweenclinical variables such as pain and physical or biologi-cal variables in terms of measurement. Finally, con-trary to ordinal pain scores, Rasch measures canvalidly be treated with parametrical statistical proce-dures with all the subsequent advantages in terms ofpower.
References
Andrich D. Rasch models for measurement. Newbury Park,Ca: SAGE Publications Inc.; 1988.
Davis AM, Badley EM, Beaton DE, Kopec J, Wright JG,Young NL, et al. Rasch analysis of the Western OntarioMcMaster (WOMAC) Osteoarthritis Index: results fromcommunity and arthroplasty samples. J Clin Epidemiol2003;56:1076–83.
Fisher WP. Reliability statistics. Rasch Meas Trans 1992;6:238.Linacre JM. Many-facet Rasch measurement. Chicago: Mesa Press;
1989.Linacre JM. A user’s guide to Facets: Rasch measurement computer
program. Chicago: Mesa Press; 1994.Linacre JM. Sample size and item calibration stability. Rasch Meas
Trans 1994;7:328.McArthur DL, Cohen MJ, Schandler SL. Rasch analysis of functional
assessment scales: an example using pain behaviors. Arch PhysMed Rehabil 1991;72:296–304.
McArthur DL, Casey KL, Morrow TJ, Cohen MJ, Schandler SL.Partial-credit modeling and response surface modeling of biobe-havioral data. In: Wilson M, editor. Objective measurement: theoryinto practice, 1. Norwood, NJ: ABLEX Publishing; 1992. p.109–20.
Merbitz C, Morris J, Grip JC. Ordinal scales and foundations ofmisinference. Arch Phys Med Rehabil 1989;70:308–12.
Pesudovs K, Noble BA. Improving subjective scaling of pain usingRasch analysis. J Pain 2005;6:630–6.
Plaghki L, Delisle D, Godfraind JM. Heterotopic nociceptive condi-tioning and mental task modulate di!erently the perception andphysiological correlates of short CO2 laser stimuli. Pain1994;57:181–92.
Rasch G. Probabilistic models for some intelligence and attainmenttests. Copenhagen: Danish Institute for Educational Research;1960 (Expanded edition, Chicago: Mesa Press, 1980).
Stevens SS. On the theory of scales of measurement. Science1946;103:677–80.
TesioL.Measuring behaviours andperceptions:Rasch analysis as a toolfor rehabilitation research. J Rehabil Med 2003;35:105–15.
Tesio L. Measurement in clinical vs. biological medicine: theRasch model as a bridge on a widening gap. J Appl Meas2004;5:362–6.
Tesio L, Granger CV, Fiedler RC. A unidimensional pain/disabilitymeasure for low-back pain syndromes. Pain 1997;69:269–78.
Thomee R, Grimby G, Wright BD, Linacre JM. Rasch analysis ofvisual analog scale measurements before and after treatment ofpatellofemoral pain syndrome in women. Scand J Rehabil Med1995;27:145–51.
Townsend JT, Ashby FG. Measurement scales and statistics: themisconception misconceived. Psychol Bull 1984;96:394–401.
White LJ, Craig PT, Velozo CA. The use of Rasch measurement toimprove the Oswestry classification scheme. Arch Phys MedRehabil 2002;83:822–31.
Wolfe F. Pain extend and diagnosis: development and validation of theregional pain scale in 12,799 patients with rheumatic disease. JRheumatol 2003;30:369–78.
Wright BD, Linacre M. Observations are always ordinal; measure-ments, however, must be interval. Arch Phys Med Rehabil1989;70:857–60.
Wright BD, Masters GN. Rating scale analysis. Chicago: Mesa Press;1982.
474 C. Decruynaere et al. / European Journal of Pain 11 (2007) 469–474
Related Documents