1 MEAN-REVERSION VERSUS ADJUSTMENT TO PPP : THE TWO REGIMES OF EXCHANGE RATE DYNAMICS UNDER THE EMS, 1979-1998 MARIE BESSEC › EUREQua, Université Paris 1 Panthéon-Sorbonne SUMMARY This paper examines jointly the empirical relevance of the mean-reversion and the PPP hypotheses in the exchange rate dynamics under the EMS. Given the non stationarity and the nonlinearities characterizing foreign exchange rate dynamics, this question is studied in the framework of a MS-ECM model : it allows a discontinuous adjustment towards the cointegration relationship. We find that the European exchange rates of the ERM members display mean-reversion in the credible regime, whereas they adjust to the PPP during the volatile period. The first mechanism is due to the stabilizing effect of a credible target-zone, while the second one can be explained by the realignments made in accordance with the underlying inflation rates. 1. INTRODUCTION The European Exchange Rate Mechanism (ERM) was founded on March 13, 1979. At the beginning, eight currencies participated in this arrangement : the Belgian Franc, the Danish Krone, the French Franc, the German Mark, the Irish Pound, the Italian Lira, the Luxemburg Franc and the Dutch Guilder. A major purpose of the EMS was to reduce real and nominal exchange rate volatility. The currencies were allowed to fluctuate within a band of ± 2.25% around an official parity (except the Italian Lira which initially obtained a margin of ± 6%). Nevertheless, the EMS had experienced several crises, which had led to realignments of the bilateral parities among the participants. Both theoretical and empirical studies highlighted the peculiar dynamics of the macroeconomic variables, especially of the exchange rates under such a semi- fixed exchange rate regime. On the theoretical side, the target-zone literature › EUREQua, Université Paris 1 Panthéon-Sorbonne, [email protected] Correspondence to : Marie Bessec, EUREQua, MSE, 106-112 Bld de l’hôpital, 75647 Paris Cedex 13 France Telephone : +33 1 44 02 82 13 Fax : +33 1 44 02 82 02

Welcome message from author
This document is posted to help you gain knowledge. Please leave a comment to let me know what you think about it! Share it to your friends and learn new things together.
Transcript

1
MEAN-REVERSION VERSUS ADJUSTMENTTO PPP : THE TWO REGIMES OF EXCHANGERATE DYNAMICS UNDER THE EMS, 1979-1998
MARIE BESSEC
EUREQua, Université Paris 1 Panthéon-Sorbonne
SUMMARY
This paper examines jointly the empirical relevance of the mean-reversion and thePPP hypotheses in the exchange rate dynamics under the EMS. Given the nonstationarity and the nonlinearities characterizing foreign exchange rate dynamics,this question is studied in the framework of a MS-ECM model : it allows adiscontinuous adjustment towards the cointegration relationship. We find that theEuropean exchange rates of the ERM members display mean-reversion in thecredible regime, whereas they adjust to the PPP during the volatile period. Thefirst mechanism is due to the stabilizing effect of a credible target-zone, while thesecond one can be explained by the realignments made in accordance with theunderlying inflation rates.
1. INTRODUCTION
The European Exchange Rate Mechanism (ERM) was founded on March 13,1979. At the beginning, eight currencies participated in this arrangement : theBelgian Franc, the Danish Krone, the French Franc, the German Mark, the IrishPound, the Italian Lira, the Luxemburg Franc and the Dutch Guilder. A majorpurpose of the EMS was to reduce real and nominal exchange rate volatility. Thecurrencies were allowed to fluctuate within a band of ± 2.25% around an officialparity (except the Italian Lira which initially obtained a margin of ± 6%).Nevertheless, the EMS had experienced several crises, which had led torealignments of the bilateral parities among the participants.
Both theoretical and empirical studies highlighted the peculiar dynamics of themacroeconomic variables, especially of the exchange rates under such a semi-fixed exchange rate regime. On the theoretical side, the target-zone literature
EUREQua, Université Paris 1 Panthéon-Sorbonne, [email protected]
Correspondence to : Marie Bessec, EUREQua, MSE, 106-112 Bld de l’hôpital, 75647 Paris Cedex 13 FranceTelephone : +33 1 44 02 82 13 Fax : +33 1 44 02 82 02
2
emerged in 1991 and tried to model explicitly the exchange rate dynamics under atarget-zone regime. The so-called first-generation model developped by Krugman(1991) is based on a fully credible target-zone. Nevertheless, given that theimplications of this model (the U-shaped distribution of the exchange rates withinthe band, the negative correlation between the interest differential and theexchange rate (Svensson (1991)) are empirically rejected, Krugman’s model hasbeen extended to account for endogenous expectations of realignment (Bertolaand Caballero (1992), Bertola and Svensson (1993), Tristani (1994)). Thissecond-generation model allows for a time-varying credibility affectingsignificantly the exchange rate behavior. On the empirical side, by estimatingMarkov-Switching models, many authors point that the European exchange ratedynamics is typically characterized by periods of relative calm when the target-zone is credible, punctuated by sudden and short-lived phases of speculativeattacks (Engel and Hakkio (1996), Peria (1999), Amato and Tronzano (1998) andTronzano (1999)). Thus, both theoretical and empirical approaches stress theinfluence of punctual decrease of the confidence of the markets in thesustainability of the target-zone in the exchange rates dynamics.
Related to this time-varying credibility, the possibility of two anchors in theEuropean Exchange Rate Mechanism seems relevant : on the one hand, during thecredible regime, the exchange rate should fluctuate around the central parity,hence displays mean-reversion, whereas in the uncredible regime, the exchangerate departs from the central parities but is dragged back to the Purchasing PowerParity (PPP) value when realignments occur. Indeed, many authors indicate thatrealignments were made in accordance with the underlying inflation rates in orderto maintain the Purchasing Power Parity (PPP). In other words, realignmentsseemed to be designed to attenuate the deviations from the PPP, i.e. to maintaincompetitiveness between the EMS members.The existence of these two anchors –central parity and PPP- has already beenexplored in the literature but only separately. Some evidence of mean-reversiontowards central parities has been provided by conducting unit root tests (see, forinstance, Anthony and MacDonald (1998, 1999)) or by using diffusion processes(see, among others, Ball and Roma (1993), De Jong et al. (1996), Pentecôte andRoncalli (1996)). More conflicting evidence for the PPP hypothesis has beenfound. Empirical studies on PPP use cointegration analysis, because exchangerates are found to have a unit root (Meese and Singleton (1982)). In thiseconometric framework, these studies present no clear-cut evidence for the EMScountries. On the one hand, Artis and Nachane (1990), Edison and Fisher (1991)did not find that the European real exchange rates are cointegrated i.e. rejected thePPP hypothesis under the EMS. On the other hand, MacDonald and Taylor(1991), Fung and Lo (1992), Cheung et al. (1995) presented evidence in favour ofPPP in the EMS.

3
However, very little attention has been paid to testing jointly the relevance ofthese two mechanisms. The purpose of this paper is to show empirically theexistence of two alternative long-run equilibrium relationships : a relationshipdescribing the mean-reverting behavior of the European exchange rates towardscentral parities and the PPP relationship. Our intuition is that the mixed resultsobtained in the last framework could be linked to the presence of regime shifts inthe European exchange rate process, as noted previously both in the theoreticaland empirical literature. In regard to these papers, the regime-switching approachseems to be the appropriate one to characterize the exchange rate dynamics underthe EMS. In other words, to test the relevance of mean-reversion and the PPP inthe European exchange rates dynamics under the EMS, we have to account for thenonlinearities inherent to their dynamics. We will thus consider a Markov-Switching Error Correction Model (MS-ECM) so as to show the existence of adiscontinuous adjustment in time towards two long-run equilibria : the centralparity during the credible periods (mean-reversion) and the PPP during thespeculative periods. We will implement this approach for the European exchangerates of six countries : Belgium, Denmark, France, Ireland, Italy and theNetherlands from the inception of the European Exchange Rate Mechanism in1979 to the establishment of the European Monetary Union on January 1999.
The rest of the paper is organised as follows. The first part reviews existingtheoretical and empirical models on the exchange rate dynamics under a target-zone. Section 2 briefly describes our data sources and our sample period. The MS-ECM model underlying our empirical work is described in the third section.Section 4 comments the results. The last part concludes. A GAUSS program thatimplements the estimation methods of the Markov-Switching Error CorrectionModel is available on request from the author.
2. THEORETICAL AND EMPIRICAL BACKGROUND
This first section presents supportive evidence in favour of two alternative anchorsin the European Exchange Rate Mechanism that can be found both in the previoustheoretical and empirical literature. On the theoretical side, first-generationmodels based on a fully credible target-zone and only inframarginal interventionsare rejected in favour of the second-generation models allowing for episodes ofdecreasing credibility. On the empirical side, the Markov-switching modelsintroduced by Hamilton are frequently used to model the European exchange ratedynamics under the ERM and point the significant alternance of a stable regime(low mean and variance) and a more unquiet state (large mean and variance).
On the theoretical side, the target-zone literature tries to model explicitly theexchange rate dynamics under a target-zone regime.

4
The basic target-zone model was introduced by Krugman in 1991. His so-calledfirst-generation model highlights the stabilizing effect of a target-zone on theexchange rate behavior, because of the market expectations of monetaryinterventions if the exchange rate hits the edge of the band (the so-calledinframarginal interventions).Formally, it suggests a non linear S-shaped relationship between the exchange rateand some fundamental variables (the velocity of the money and the moneysupply) instead of the 45° line under a free-floating regime (zero expected changein the exchange rate) : the market expectations allowing for the marginalinterventions by the authorities drag down the exchange rate at the top of the bandand pull up the series when it nears the lower limit.Yet, the implications of this model, like the U-shaped distribution of the exchangerates inside the zone or the negative correlation between the interest ratedifferentials and the exchange rate (Svensson (1991)), are empirically rejected. Anobvious shortcoming of the Krugman specification is the two assumptions it isbased on : Krugman supposes a fully credible exchange rate band i.e. irrevocablyfixed and he only allows for inframarginal interventions by the monetaryauthorities, that is when the exchange rate hits the edge of the band. However,many realignments occurred during the EMS period (from 3 for the Netherlandsto 12 for Italy) and the intramarginal interventions (that is when the exchange ratelies inside the band) largely exceed the marginal ones (see among others Bini-Smaghi and Micossi (1989), Lindberg and Söderlind (1992)).
Consequently, new models often referred to the second-generation models extendthe Krugman specification in two alternative directions.On the one hand, Bertola and Caballero (1992), Bertola and Svensson (1993),Tristani (1994) integrate an endogenous realignment risk by introducing anexogenous drift in the stochasticcomponent of the devaluation risk (Bertola and Svensson (1993)) or a dependenceof the expected rate of devaluation on the dynamics of fundamentals or closely onthe position of the exchange rate within the band. It is worth noting that, in thismodel, a high probability of realignment can cancel out the stabilizing effect ofthe target-zone advocated by the proponents of target-zones.On the other hand, Froot and Obstfeld (1991), Lindberg and Söderlind (1994)combine inframarginal interventions with interventions inside the band(intramarginal interventions) by introducing a mean-reverting mechanism in thefundamental process.Nevertheless, it should be noted as in Tristani (1994) or in De Haan, Knot andDijkstra (1999) that these two extensions are closely interrelated. Indeed, a largedeviation of the exchange rate from the central parity may correspond to a weakercontrol of the monetary authorities but this devaluation may have been entailed bya continual deterioration in fundamentals.

5
De Haan, Knot and Dijkstra (1999) present a direct test of the first and second-generation models for the currencies of six European countries –Austria, Belgium,Denmark, France, Italy and the Netherlands- with respect to Germany over theperiod 1983-1993 (except for Italy for which the sample ends on September 1992,when Italy was forced out the ERM). They find that the French and Italianestimates fit better with the second-generation model, whereas the countries witha high degree of economic integration and convergence vis-à-vis Germany,namely Belgium after 1990, Austria and the Netherlands, are better described bythe Krugman specification. Denmark constitutes an intermediate case, displayingfeatures of both models. Basically, the first-generation model is more suited tocountries that have pegged strongly their currency to the Deutsche Mark : theparities of the ERM are more credible there. Consequently, the endogenousdevaluation risk of the second-generation model is not significant in thesecountries. On the contrary, parities for countries like France or Italy are lesscredible because of deteriorating fundamentals or less commited policies towardsthe European economic integration. Consequently, they are better described by thesecond-generation models allowing for a time-varying credibility.
On the empirical side, the regime-switching approach is largely employed toanalyse the European exchange rate dynamics within the EMS. We can quotepapers by Engel and Hakkio (1996), Peria (1999), Amato and Tronzano (1998)and Tronzano (1999). The first authors are interested in characterizing theexchange rate dynamics under the European target-zone, whereas the later want toidentify the speculative attacks and their determinants.
Engel and Hakkio (1996) estimate a MS-autoregressive model on the French andItalian exchange rates with respect to the Deutsche Mark from 1979 to 1992 forthe Lira or 1993 for the French Franc. They consider first a specification withfixed transition probabilities and then allow transition probabilities to depend onthe position of the exchange rate within the band. They show among other thingsthat the dynamics of the French and Italian exchange rates is characterized by longperiods of stability interrupted by short periods of extreme volatility, that aMarkov-Switching model can appropriately account for. Moreover, their estimatesof the time-varying transition probabilities suggest that the probabilities ofremaining in both states increase significantly when the exchange rate nears theedge of the band.
More recently, Peria (1999) applies MS-models on the exchange rates of Belgium,Denmark, France, Ireland (1979-93), Italy (1979-92), Spain (1989-93) and theUnited-Kingdom (1990-92) vis-à-vis Germany. Peria considers a MS

6
specification in order to identify speculative attacks episodes captured by theunstable state and, as Engel and Hakkio (1996), allows transition probabilities tobe time-varying functions of observable variables to determine what causes theshifts towards the unstable state i.e. to identify the determinants of speculativeattacks. Peria estimates an univariate MS-AR model on the exchange rate andgiven that the speculative attacks do not always result in exchange ratedevaluations but can be avoided by the governments by selling reserves or byraising interest rates, she also considers a MS-VAR of changes in exchange rates,reserves and interest rates. Her MS-VAR model enables her to identify mostspeculative episodes captured previously by Eichengreen, Rose and Wyplosz withtheir index of speculative pressure and other ones for which one can find evidencein the financial press or in IMF’s reports. Moreover, she finds that bothfundamentals variables (the budget deficit) and expectations (captured by theinterest differentials) are significant determinants of the European currency crises.
A similar analysis has been carried out by Amato and Tronzano (1998) andTronzano (1999) on the peculiar case of the Italian currency from 1990 to 1996.They conclude that indicators of imbalance in domestic public finance, indicatorsof domestic real activity (industrial production changes) and external equilibriumindicators (real exchange rate, current account balance) affect significantly theexchange rate behavior. These studies provide empirical evidence to theconsensus view in the literature that speculative attacks against the Italiancurrency were largely driven by growing macroeconomic imbalances (see forinstance Eichengreen and Wyplosz (1993)).
In conclusion, the empirical literature is generally based on the existence oftwo alternative phases in the dynamics of the European exchange rates supportingthe second-generation models ; empirical papers highlight the existence of stableperiods featured by a small mean and variance and interrupted by more unquietepisodes characterized by wider fluctuations of the European exchange ratesaround a larger mean. The first ones correspond to periods of strong credibility inthe future of the EMS, while the second ones are periods of decrease of theconfidence. Krugman’s hypothesis of a fully credible target-zone seemsconsequently unrealistic. It seems relevant that different equilibria characterizethese two alternative states. We will investigate it in the following sections.
7
2. AN OVERVIEW OF THE DATA
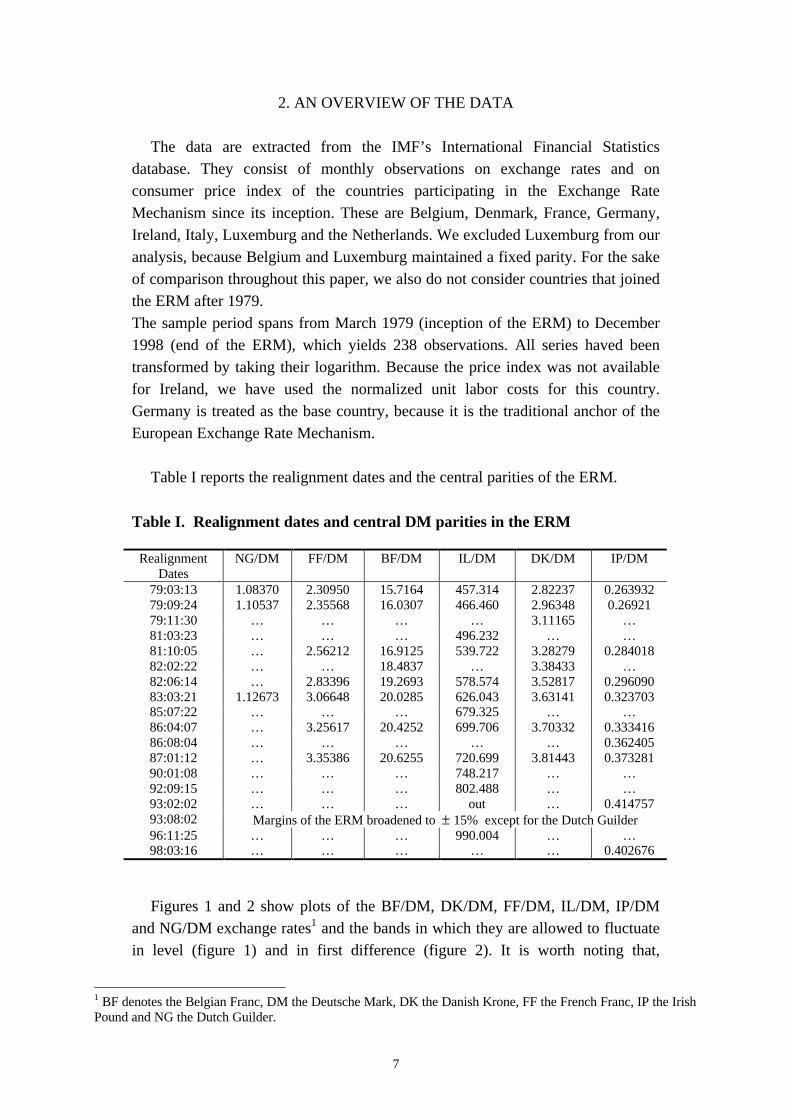
The data are extracted from the IMF’s International Financial Statisticsdatabase. They consist of monthly observations on exchange rates and onconsumer price index of the countries participating in the Exchange RateMechanism since its inception. These are Belgium, Denmark, France, Germany,Ireland, Italy, Luxemburg and the Netherlands. We excluded Luxemburg from ouranalysis, because Belgium and Luxemburg maintained a fixed parity. For the sakeof comparison throughout this paper, we also do not consider countries that joinedthe ERM after 1979.The sample period spans from March 1979 (inception of the ERM) to December1998 (end of the ERM), which yields 238 observations. All series haved beentransformed by taking their logarithm. Because the price index was not availablefor Ireland, we have used the normalized unit labor costs for this country.Germany is treated as the base country, because it is the traditional anchor of theEuropean Exchange Rate Mechanism.
Table I reports the realignment dates and the central parities of the ERM.
Table I. Realignment dates and central DM parities in the ERM
RealignmentDates
NG/DM FF/DM BF/DM IL/DM DK/DM IP/DM
79:03:13 1.08370 2.30950 15.7164 457.314 2.82237 0.26393279:09:24 1.10537 2.35568 16.0307 466.460 2.96348 0.2692179:11:30 … … … … 3.11165 …81:03:23 … … … 496.232 … …81:10:05 … 2.56212 16.9125 539.722 3.28279 0.28401882:02:22 … … 18.4837 … 3.38433 …82:06:14 … 2.83396 19.2693 578.574 3.52817 0.29609083:03:21 1.12673 3.06648 20.0285 626.043 3.63141 0.32370385:07:22 … … … 679.325 … …86:04:07 … 3.25617 20.4252 699.706 3.70332 0.33341686:08:04 … … … … … 0.36240587:01:12 … 3.35386 20.6255 720.699 3.81443 0.37328190:01:08 … … … 748.217 … …92:09:15 … … … 802.488 … …93:02:02 … … … out … 0.41475793:08:02 Margins of the ERM broadened to ± 15% except for the Dutch Guilder96:11:25 … … … 990.004 … …98:03:16 … … … … … 0.402676
Figures 1 and 2 show plots of the BF/DM, DK/DM, FF/DM, IL/DM, IP/DMand NG/DM exchange rates1 and the bands in which they are allowed to fluctuatein level (figure 1) and in first difference (figure 2). It is worth noting that,
1 BF denotes the Belgian Franc, DM the Deutsche Mark, DK the Danish Krone, FF the French Franc, IP the IrishPound and NG the Dutch Guilder.

8
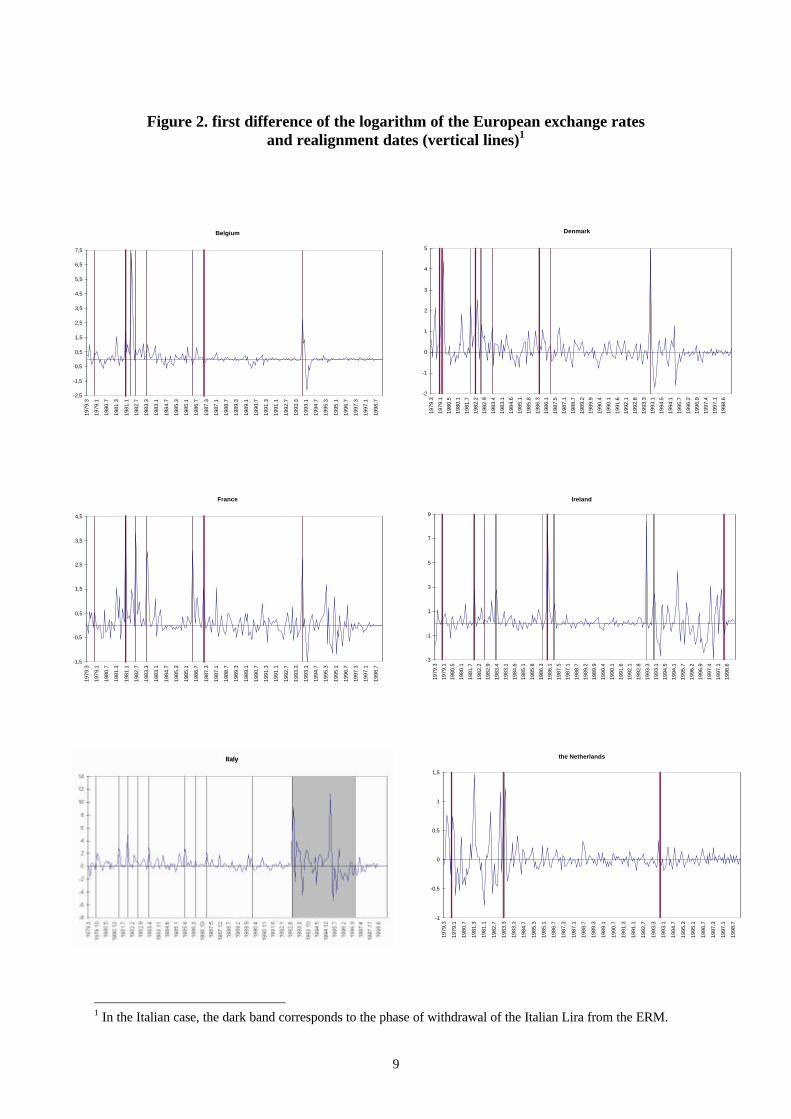
following important speculative attacks, the Italian Lira withdrew from the ERMfrom September 1992 to November 1996.The visual inspection of these series supports the results found in previousempirical studies using Hamilton’s model : there exists an alternance of phases ofhigh volatility and phases less turbulent in the dynamics of the Europeanexchange rates. Such an evolution justifies the approach based on regimes of thefollowing sections.
Figure 1. European exchange rates in level in the Exchange Rate Mechanism
Belgium
15
16
17
18
19
20
21
22
23
24
1979
.3
1979
.1
1980
.7
1981
.3
1981
.1
1982
.7
1983
.3
1983
.1
1984
.7
1985
.3
1985
.1
1986
.7
1987
.3
1987
.1
1988
.7
1989
.3
1989
.1
1990
.7
1991
.3
1991
.1
1992
.7
1993
.3
1993
.1
1994
.7
1995
.3
1995
.1
1996
.7
1997
.3
1997
.1
1998
.7
Denmark
2,7
2,9
3,1
3,3
3,5
3,7
3,9
4,1
4,3
4,5
1979
.3
1979
.1
1980
.7
1981
.3
1981
.1
1982
.7
1983
.3
1983
.1
1984
.7
1985
.3
1985
.1
1986
.7
1987
.3
1987
.1
1988
.7
1989
.3
1989
.1
1990
.7
1991
.3
1991
.1
1992
.7
1993
.3
1993
.1
1994
.7
1995
.3
1995
.1
1996
.7
1997
.3
1997
.1
1998
.7
France
2
2,2
2,4
2,6
2,8
3
3,2
3,4
3,6
3,8
4
1979
.3
1979
.1
1980
.7
1981
.3
1981
.1
1982
.7
1983
.3
1983
.1
1984
.7
1985
.3
1985
.1
1986
.7
1987
.3
1987
.1
1988
.7
1989
.3
1989
.1
1990
.7
1991
.3
1991
.1
1992
.7
1993
.3
1993
.1
1994
.7
1995
.3
1995
.1
1996
.7
1997
.3
1997
.1
1998
.7
Ireland
0,25
0,3
0,35
0,4
0,45
0,5
1979
.3
1979
.1
1980
.7
1981
.3
1981
.1
1982
.7
1983
.3
1983
.1
1984
.7
1985
.3
1985
.1
1986
.7
1987
.3
1987
.1
1988
.7
1989
.3
1989
.1
1990
.7
1991
.3
1991
.1
1992
.7
1993
.3
1993
.1
1994
.7
1995
.3
1995
.1
1996
.7
1997
.3
1997
.1
1998
.7
the Netherlands
1,05
1,07
1,09
1,11
1,13
1,15
1,17
1979
.3
1979
.11
1980
.7
1981
.3
1981
.11
1982
.7
1983
.3
1983
.11
1984
.7
1985
.3
1985
.11
1986
.7
1987
.3
1987
.11
1988
.7
1989
.3
1989
.11
1990
.7
1991
.3
1991
.11
1992
.7
1993
.3
1993
.11
1994
.7
1995
.3
1995
.11
1996
.7
1997
.3
1997
.11
1998
.7
9
Figure 2. first difference of the logarithm of the European exchange ratesand realignment dates (vertical lines)1
1 In the Italian case, the dark band corresponds to the phase of withdrawal of the Italian Lira from the ERM.
Belgium
-2,5
-1,5
-0,5
0,5
1,5
2,5
3,5
4,5
5,5
6,5
7,5
1979
.3
1979
.1
1980
.7
1981
.3
1981
.1
1982
.7
1983
.3
1983
.1
1984
.7
1985
.3
1985
.1
1986
.7
1987
.3
1987
.1
1988
.7
1989
.3
1989
.1
1990
.7
1991
.3
1991
.1
1992
.7
1993
.3
1993
.1
1994
.7
1995
.3
1995
.1
1996
.7
1997
.3
1997
.1
1998
.7
Denmark
-2
-1
0
1
2
3
4
5
1979
.3
1979
.1
1980
.5
1980
.1
1981
.7
1982
.2
1982
.9
1983
.4
1983
.1
1984
.6
1985
.1
1985
.8
1986
.3
1986
.1
1987
.5
1987
.1
1988
.7
1989
.2
1989
.9
1990
.4
1990
.1
1991
.6
1992
.1
1992
.8
1993
.3
1993
.1
1994
.5
1994
.1
1995
.7
1996
.2
1996
.9
1997
.4
1997
.1
1998
.6
France
-1,5
-0,5
0,5
1,5
2,5
3,5
4,5
1979
.3
1979
.1
1980
.7
1981
.3
1981
.1
1982
.7
1983
.3
1983
.1
1984
.7
1985
.3
1985
.1
1986
.7
1987
.3
1987
.1
1988
.7
1989
.3
1989
.1
1990
.7
1991
.3
1991
.1
1992
.7
1993
.3
1993
.1
1994
.7
1995
.3
1995
.1
1996
.7
1997
.3
1997
.1
1998
.7
Ireland
-3
-1
1
3
5
7
9
1979
.3
1979
.1
1980
.5
1980
.1
1981
.7
1982
.2
1982
.9
1983
.4
1983
.1
1984
.6
1985
.1
1985
.8
1986
.3
1986
.1
1987
.5
1987
.1
1988
.7
1989
.2
1989
.9
1990
.4
1990
.1
1991
.6
1992
.1
1992
.8
1993
.3
1993
.1
1994
.5
1994
.1
1995
.7
1996
.2
1996
.9
1997
.4
1997
.1
1998
.6
the Netherlands
-1
-0,5
0
0,5
1
1,5
1979
.3
1979
.1
1980
.7
1981
.3
1981
.1
1982
.7
1983
.3
1983
.1
1984
.7
1985
.3
1985
.1
1986
.7
1987
.3
1987
.1
1988
.7
1989
.3
1989
.1
1990
.7
1991
.3
1991
.1
1992
.7
1993
.3
1993
.1
1994
.7
1995
.3
1995
.1
1996
.7
1997
.3
1997
.1
1998
.7

10
3. MS-ECM MODEL
Given the apparent non-constancy of unconditional moments of first andsecond order (mean and variance) that we observe on the figures 1 and 2especially on the figure 2 and that is pointed out in the previous empiricalliterature, we have used the dicrete regime-switching model of Goldfeld andQuandt (1973), Cosslett and Lee (1985) and Hamilton (1989) to characterize theexchange rates growth. Such a model enables the description and the forecast ofrecurrent stochatic changes in the behavior of economic series. To achieve thisaim, the parameters of this model are allowed to switch, potentially every period,
depending on which value (zero or one) an unobserved variable tS takes on. This
variable characterizes the “state” or “regime” in which the process of the
exchange rates was at date t . When tS =1, the first difference of the logarithm of
the exchange rates, te∆ , is distributed ),(N 211 σµ and when 0St = , te∆ is
distributed ),(N 200 σµ . The states are assumed to follow a first-order Markov
chain ; it means that the process for tS is supposed to depend on past realizations
of e and S only through 1tS − .
),...,kS,jSiS(P)jSiS(P 1t2t1tt1tt −−−− ====== Θ (1)
Consequently, this process is completely described by the following constanttransition probabilities :
q1)0S1S(P
q)0S0S(P
p1)1S0S(P
p)1S1S(P
1tt
1tt
1tt
1tt
−===
===
−===
===
−
−
−
−
(2)
Contrary to what has been done previously by Engel and Hakkio (1996), Peria(1999), Amato and Tronzano (1998) or Tronzano (1999) when they study thedynamics of exchange rates under the EMS, we do not consider in this paper a MSautoregressive model but a MS Error Correction Model (MS-ECM) in order tostudy the adjustment towards one or several cointegration relationships. Acointegration relationship between several nonstationary variables can beinterpreted in term of a long-run equilibrium relationship. ECM models describehow the variables respond to deviations from this equilibrium.

11
It is generally assumed in ECM representations that the adjustment towards thelong-run equilibrium relationship is always present. However, the movementtowards the equilibrium relationship need not occur in every time period. Thereexist two models in which the error correction mechanism is discontinuous in thetime : the threshold cointegration model and the Markov-Switching ErrorCorrection model. In threshold cointegration models described by Balke andFomby (1997), there is an adjustment if the series moves too far away from theequilibrium relationship, but this correction does not take place as long as theseries is relatively close to the equilibrium. In Markov-Switching Error CorrectionModels (MS-ECM), the presence of the adjustment depends on the dynamics ofthe considered variable (which determines the realized regime). Such a model wasfor example used by Hall, Psaradakis and Sola (1997) to detect periodicallycollapsing bubbles in the British house prices. They interpreted the regimewithout adjustment towards the cointegration relationship as a regime of bubble.In this paper, we will use a MS-ECM representation instead of a thresholdcointegration model, because we think that there is an alternance between twolong-run equilibrium relationships depending on which exchange rates regime isrealized. Indeed, we show here that for most countries, there is an adjustmenttowards the central parity (mean-reversion) in the credible regime, while there is acorrection of deviations from the PPP in the unstable regime.
Formally, to test this hypothesis, we consider the following representation :
tS
k
1i
*ititiit
k
1iiit
k
1ii
*1t1t1tS21t1tS1St
t
321ttt
)PP(Ce
)PPe(,)Ce(,e
εσ∆δ∆ζ∆φ
ββµ∆
+−++
++−+−+=
∑∑∑=
−−−=
−=
−−−−−
(3)
where tε is an i.i.d. N(0,1) variable, te represents the logarithm of the nominal
exchange rate, tP the logarithm of the domestic price index, *tP the logarithm of
the foreign price index, tC the logarithm of the central parity and { }1,0St = .
This model is an ECM model with two long-run equilibria corresponding to two
alternative anchors of the ERM. The first one ( tC ) is the European central parity
around which European exchange rates have to fluctuate. The adjustment towardsthis equilibrium illustrates the mean-reverting behavior of exchange rates. The
second potential equilibrium ( *tt PP − ) is the Purchasing Power Parity (PPP). The
difference between the nominal exchange rate and the PPP is the real exchangerate which measures the competitiveness of the home country relative to thereference country (Germany).
12
Thus, ( 1t1t Ce −− − ) and ( *1t1t1t PPe −−− +− ) reflect the deviations of the exchange
rate from these two anchors and the coefficients 1β and 2β capture the potential
adjustment to departures from these anchors. If 1β and 2β are significantly
negative, there is a tendency of the system to drift back towards the equilibriumrelationship. On the contrary, if these two parameters are positive or nonsignificant, there is no adjustment.To test the idea of a discontinuous adjustment towards the two equilibria, we
allow the error-term parameters (i.e. 1β and 2β ) to switch across the regimes.
Thus, not only the intercept ( µ ) and the variance ( 2σ ) but also these two
coefficients depend on the realized state tS .
4. EMPIRICAL RESULTS
In a first part, we estimate an unconstrained MS-ECM model where there may bea correction to deviations from the two cointegration relationships in bothregimes. Then, given the non significant error correction term towards the centralparity in the unstable regime and the non significant error correction term towardsthe PPP in the credible regime in most countries, we estimate a constrained modelwith an adjustment process towards only one of the two equilibrium relationshipsin each regime.
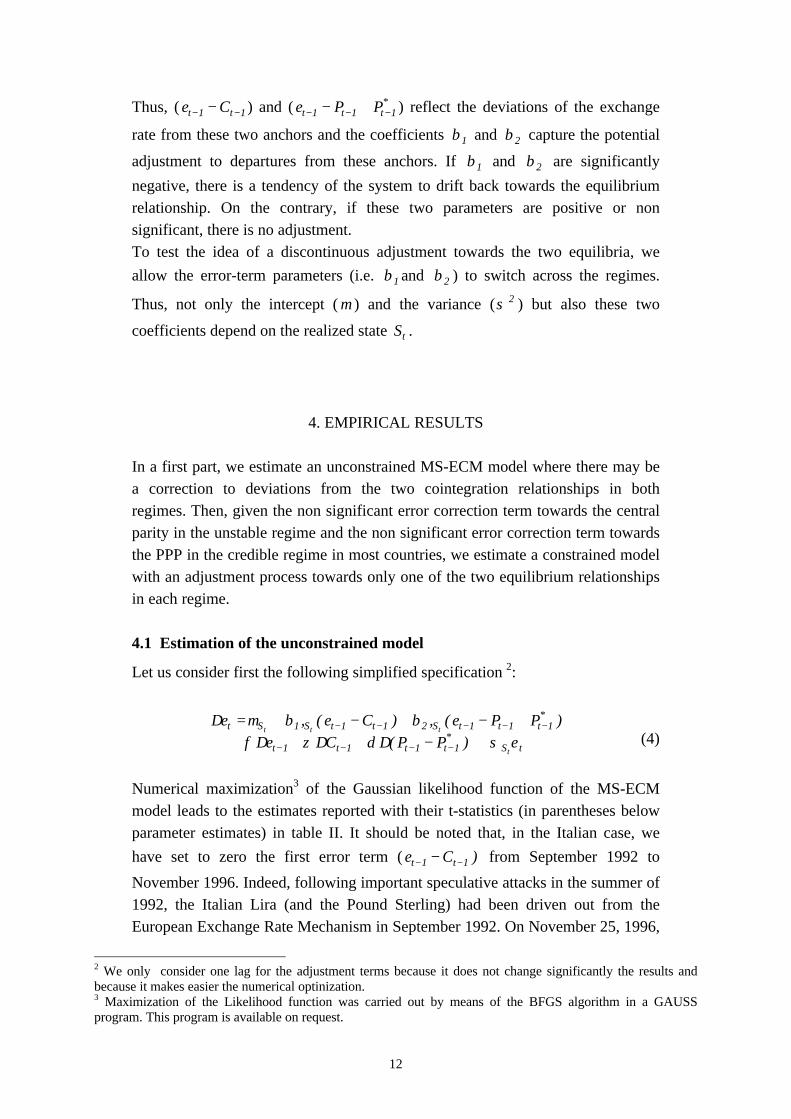
4.1 Estimation of the unconstrained model
Let us consider first the following simplified specification 2:
tS*
1t1t1t1t
*1t1t1tS21t1tS1St
t
ttt
)PP(Ce
)PPe(,)Ce(,e
εσ∆δ∆ζ∆φββµ∆
+−++++−+−+=
−−−−
−−−−−(4)
Numerical maximization3 of the Gaussian likelihood function of the MS-ECMmodel leads to the estimates reported with their t-statistics (in parentheses belowparameter estimates) in table II. It should be noted that, in the Italian case, we
have set to zero the first error term ( )Ce 1t1t −− − from September 1992 to
November 1996. Indeed, following important speculative attacks in the summer of1992, the Italian Lira (and the Pound Sterling) had been driven out from theEuropean Exchange Rate Mechanism in September 1992. On November 25, 1996,
2 We only consider one lag for the adjustment terms because it does not change significantly the results andbecause it makes easier the numerical optinization.3 Maximization of the Likelihood function was carried out by means of the BFGS algorithm in a GAUSSprogram. This program is available on request.

13
the Italian Lira reentered the ERM. Thus, there can not be an adjustment towardsthe central parity from September 1992 to November 1996. Consequently, wehave set to zero the deviations from the central parities during this period, to offsetthis potential adjustment during this phase.The “smoothed’’ probabilities of being in the stable regime are depicted togetherwith the exchange rate growth by figure 3. We recall here that a “ smoothed ’’
probability )IiS(P Tt = is the probability that the exchange rate growth at time t,
te∆ , comes from the state i at time t conditional on all observations of the sample.
Now, let us describe the results obtained with our unconstrained specification.First, we can check that, as noted previously in the literature, the exchange ratesswitch between a tranquil and persistent state i.e. with a low variance (when theEMS is credible) and a large transition probability p and a more unquiet and short-lived state i.e. with a larger variance and a small transition probability q (when theEMS is not credible and consequently encountered severe speculative attacks).The comparison of the datation of the two states (see the smoothed probabilities)and the timing of some events occuring from 1979 to 1998 (see table V inappendix) and affecting the confidence of markets and politicians in the future ofthe European Monetary Union allows this interpretation of the regimes in term ofcredibility.
Then, we can consider the estimates of the two error-term parameters 1β and 2β .
As expected, in Denmark, France, Ireland and Italy, we find a statistically
significant adjustment process towards the PPP in the unstable regime ( 20β
negative and significant) and a statistically significant adjustment process towards
the central parity in the credible regime ( 11β negative and significant). On the
contrary, there is no adjustment towards the PPP in the stable regime ( 21β non
significant) and no adjustment towards the central parity in the turbulent regime
( 10β non significant). Nevertheless, the adjustment towards the central parity is
also significant in the unstable state in the case of Denmark.
However, Belgium and the Netherlands exhibit a different pattern. In theNetherlands, the numerical optimization fails and in Belgium, we obtain onlymean-reversion in the unstable regime.All these results are confirmed by the estimation of the constrained specification.

14
Table II. The unconstrained MS-ECM model
Country p q φ ζ δ β10/β11
β20/β21
σ0 σ1 µ0 µ1 L(θ)
Belgium 0.93(6.86)
0.90(5.48)
0.19(6.01)
0.25(11.39)
0.016(0.76)
-0.28(-4.94)0.005(0.49)
-0.01(-0.67)0.002 (0.42)
0.69(13.57)
0.08(12.09)
3.62(0.76)
-0.63(-0.42)
-2.69
Denmark 0.97(7.21)
0.86(2.03)
0.35(4.66)
-0.13(-2.50)
-0.07(-1.41)
-0.31(-5.36)-0.09
(-3.12)
-0.32 (-4.21)-0.007 (-0.75)
0.82(5.26)
0.32(15.55)
45.20(4.26)
0.98(0.82)
-135.68
France 0.89(6.09)
0.58(0.63)
0.09(1.84)
0.04(1.18)
-0.02(-0.28)
-0.12(-1.34)-0.06
(-2.00)
-0.13 (-2.17)-0.001 (-0.14)
1.02(8.56)
0.27(13.41)
16.0(2.28)
0.13(0.17)
-145.29
Ireland 0.90(7.05)
0.74(2.66)
0.16(2.37)
-0.015(-0.23)
-0.001(-0.08)
-0.012(-0.20)-0.08
(-3.24)
-0.013 (-2.39)-0.001 (-0.73)
1.86(10.18)
0.30(13.1)
-1.19(-1.72)
-0.05(-0.36)
-231.51
Italy 0.89(6.41)
0.72(2.44)
0.23(5.26)
-0.26 (-3.87)
-0.10(-1.24)
0.05(0.16)-0.04
(-1.88)
-0.09 (-2.77)0.008 (1.53)
2.30(10.43)
0.43(11.0)
61.0(2.80)
-5.50(-1.67)
-306.16
Explicative notes to table II :
1) t-statistics are given in parentheses below parameter estimates.
2) The state zero ( 0St = ) refers to the unstable regime and the state one ( 1St = )
to the credible state.
3) The different coefficients (first line of the table) are defined in the followingway :p and q are the constant transition probabilities of remaining, respectively, in state1 and 0.
δζφ ,, are the coefficients of the first-difference of, respectively, the exchangerate, the central parity and the Purchasing Power Parity (adjustment terms).
0β and 1β are the error-correction parameters of the two regimes.
0σ and 1σ are the innovation standard deviations, 0µ and 1µ are the intercepts.

15
Figure 3. smoothed probabilities of being in the stable regime (state 1) in the unconstrainedMS-ECM model
Belgium
0
0,1
0,2
0,3
0,4
0,5
0,6
0,7
0,8
0,9
1
1979
.3
1979
.1
1980
.7
1981
.3
1981
.1
1982
.7
1983
.3
1983
.1
1984
.7
1985
.3
1985
.1
1986
.7
1987
.3
1987
.1
1988
.7
1989
.3
1989
.1
1990
.7
1991
.3
1991
.1
1992
.7
1993
.3
1993
.1
1994
.7
1995
.3
1995
.1
1996
.7
1997
.3
1997
.1
1998
.7
-2,5
-1,5
-0,5
0,5
1,5
2,5
3,5
4,5
5,5
6,5
7,5
Denmark
0
0,1
0,2
0,3
0,4
0,5
0,6
0,7
0,8
0,9
1
1979
.3
1979
.1
1980
.7
1981
.3
1981
.1
1982
.7
1983
.3
1983
.1
1984
.7
1985
.3
1985
.1
1986
.7
1987
.3
1987
.1
1988
.7
1989
.3
1989
.1
1990
.7
1991
.3
1991
.1
1992
.7
1993
.3
1993
.1
1994
.7
1995
.3
1995
.1
1996
.7
1997
.3
1997
.1
1998
.7
-3
-2
-1
0
1
2
3
4
5
6

16
France
0
0,1
0,2
0,3
0,4
0,5
0,6
0,7
0,8
0,9
1
1979
.3
1979
.1
1980
.7
1981
.3
1981
.1
1982
.7
1983
.3
1983
.1
1984
.7
1985
.3
1985
.1
1986
.7
1987
.3
1987
.1
1988
.7
1989
.3
1989
.1
1990
.7
1991
.3
1991
.1
1992
.7
1993
.3
1993
.1
1994
.7
1995
.3
1995
.1
1996
.7
1997
.3
1997
.1
1998
.7
-2
-1
0
1
2
3
4
5
Ireland
0
0,1
0,2
0,3
0,4
0,5
0,6
0,7
0,8
0,9
1
1979
.3
1979
.1
1980
.7
1981
.3
1981
.1
1982
.7
1983
.3
1983
.1
1984
.7
1985
.3
1985
.1
1986
.7
1987
.3
1987
.1
1988
.7
1989
.3
1989
.1
1990
.7
1991
.3
1991
.1
1992
.7
1993
.3
1993
.1
1994
.7
1995
.3
1995
.1
1996
.7
1997
.3
1997
.1
1998
.7
-4
-2
0
2
4
6
8
10

17
4.2 Estimation of the constrained model
As the error correction parameters 10β and 21β seem to be not significant in
Denmark, France, Ireland and Italy, we may consider the following parcimoniousrepresentation of our MS-ECM model in these countries :
+−++−+
++−+
= −−−−
−−
−−−
tS*
1t1t1t1t
1t1t111
*1t1t1t200
t t)PP(Ce
)Ce(
)PPe(e εσ∆δ∆ζ∆φ
βµ
βµ∆ (5)
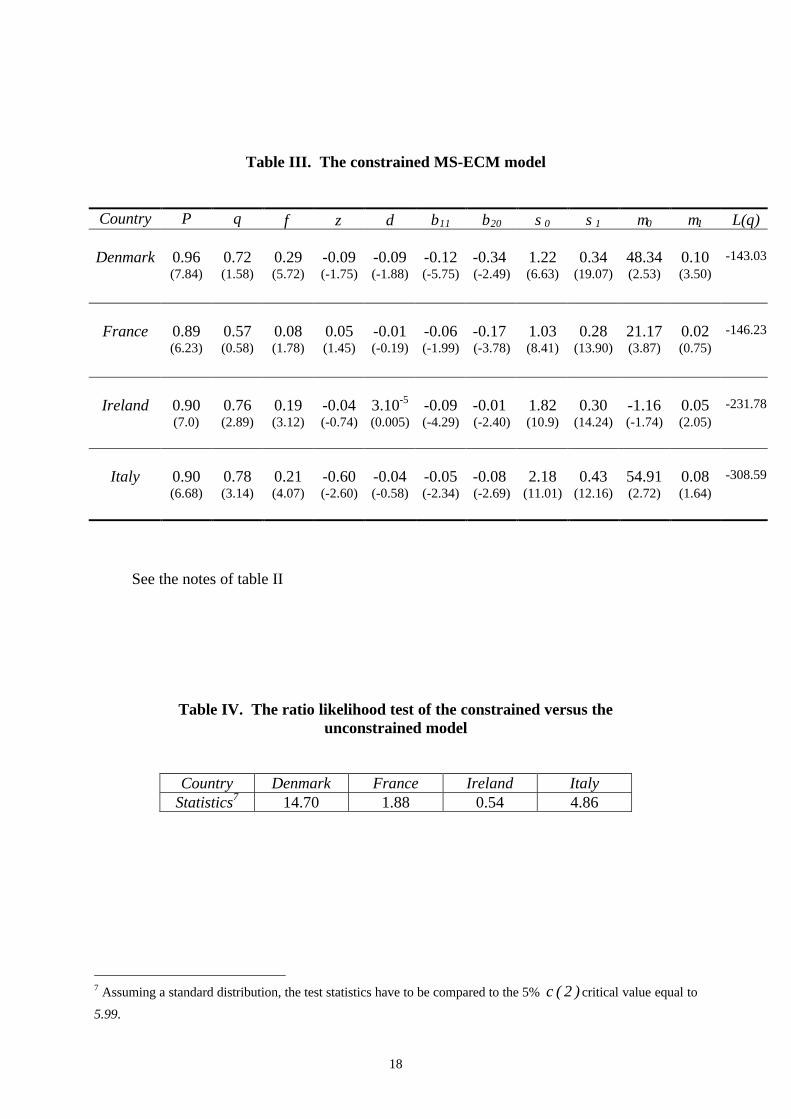
Table III contains the estimates of this constrained model, table IV reports the
likelihood ratio statistics of the null hypothesis 02110 == ββ and figure 4 depicts
the smoothed probabilities of being in the stable state.All these results provide further support to those of the section 4.1. First, the two
correction error parameters we keep, 20β and 11β , are still very significant (see
table III). Moreover, the difference between the log-likelihood of the constrainedand unconstrained models is small (see tables II and III). Consequently, the ratiolikelihood test6 reported in the table IV rejects the unconstrained model at the 5%significance level, except in Denmark, where there was also a significantadjustment towards the central parity in the unstable regime. At last, as can beseen in figure 4, the smoothed probabilities remain essentially unchanged.Consequently, we can conclude that there exist two alternative anchors in theERM depending on which regime we are. In the credible state, the Europeanexchange rates fluctuate around the central parity, whereas they converge towardsthe Purchasing Power Parity value in the unstable regime.
Based on the interpretation of the regimes in term of credibility, we can explainthe existence of these two anchors in Denmark, France, Ireland and Italy in thefollowing way. In the stable regimes where the official parities are credible, theexchange rate fluctuate around the central parity. This mean-reversion can berelated to the stabilizing impact of a credible target-zone as it is stressed by thetarget-zone literature. On the contrary, in the unstable regimes, some events affectthe credibility of the target-zone, which encounters severe speculative attacks.Consequently, the exchange rates depart from the central parities of the lesscredible target-zone. Thus, the adjustments towards the first anchor disappear butrealignments which mostly take place during the unstable regime drag back theexchange rates on their PPP value. This can be found by comparing the datation ofregimes (smoothed probabilities) and the realignment dates (vertical lines) of thefigures 3 and 4. The inspection of the smoothed probabilities shows that mosttransitions towards the regime where there is only an adjustment towards the PPP
6 This test statistics may have a non-standard distribution. Nevertheless, the weak difference between thelikelihood of the two specifications is a supportive evidence in favour of the constrained representation.
18
Table III. The constrained MS-ECM model
Country P q φ ζ δ β11 β20 σ0 σ1 µ0 µ1 L(θ)
Denmark 0.96(7.84)
0.72(1.58)
0.29(5.72)
-0.09(-1.75)
-0.09(-1.88)
-0.12(-5.75)
-0.34 (-2.49)
1.22(6.63)
0.34(19.07)
48.34(2.53)
0.10(3.50)
-143.03
France 0.89(6.23)
0.57(0.58)
0.08(1.78)
0.05(1.45)
-0.01(-0.19)
-0.06(-1.99)
-0.17 (-3.78)
1.03(8.41)
0.28(13.90)
21.17(3.87)
0.02(0.75)
-146.23
Ireland 0.90(7.0)
0.76(2.89)
0.19(3.12)
-0.04(-0.74)
3.10-5
(0.005)-0.09(-4.29)
-0.01 (-2.40)
1.82(10.9)
0.30(14.24)
-1.16(-1.74)
0.05(2.05)
-231.78
Italy 0.90(6.68)
0.78(3.14)
0.21(4.07)
-0.60(-2.60)
-0.04(-0.58)
-0.05(-2.34)
-0.08 (-2.69)
2.18(11.01)
0.43(12.16)
54.91(2.72)
0.08(1.64)
-308.59
See the notes of table II
Table IV. The ratio likelihood test of the constrained versus theunconstrained model
Country Denmark France Ireland ItalyStatistics7 14.70 1.88 0.54 4.86
7 Assuming a standard distribution, the test statistics have to be compared to the 5% )2(χ critical value equal to
5.99.

19
Figure 4. Smoothed probabilities of being in the stable regime (state 1) in the constrainedMS-ECM model
Denmark
0
0,1
0,2
0,3
0,4
0,5
0,6
0,7
0,8
0,9
1
1979
.3
1979
.1
1980
.7
1981
.3
1981
.1
1982
.7
1983
.3
1983
.1
1984
.7
1985
.3
1985
.1
1986
.7
1987
.3
1987
.1
1988
.7
1989
.3
1989
.1
1990
.7
1991
.3
1991
.1
1992
.7
1993
.3
1993
.1
1994
.7
1995
.3
1995
.1
1996
.7
1997
.3
1997
.1
1998
.7
-3
-2
-1
0
1
2
3
4
5
6
France
0
0,1
0,2
0,3
0,4
0,5
0,6
0,7
0,8
0,9
1
1979
.3
1979
.1
1980
.7
1981
.3
1981
.1
1982
.7
1983
.3
1983
.1
1984
.7
1985
.3
1985
.1
1986
.7
1987
.3
1987
.1
1988
.7
1989
.3
1989
.1
1990
.7
1991
.3
1991
.1
1992
.7
1993
.3
1993
.1
1994
.7
1995
.3
1995
.1
1996
.7
1997
.3
1997
.1
1998
.7
-2
-1
0
1
2
3
4
5

20
Ireland
0
0,1
0,2
0,3
0,4
0,5
0,6
0,7
0,8
0,9
1
1979
.3
1979
.1
1980
.7
1981
.3
1981
.1
1982
.7
1983
.3
1983
.1
1984
.7
1985
.3
1985
.1
1986
.7
1987
.3
1987
.1
1988
.7
1989
.3
1989
.1
1990
.7
1991
.3
1991
.1
1992
.7
1993
.3
1993
.1
1994
.7
1995
.3
1995
.1
1996
.7
1997
.3
1997
.1
1998
.7
-4
-2
0
2
4
6
8
10
21
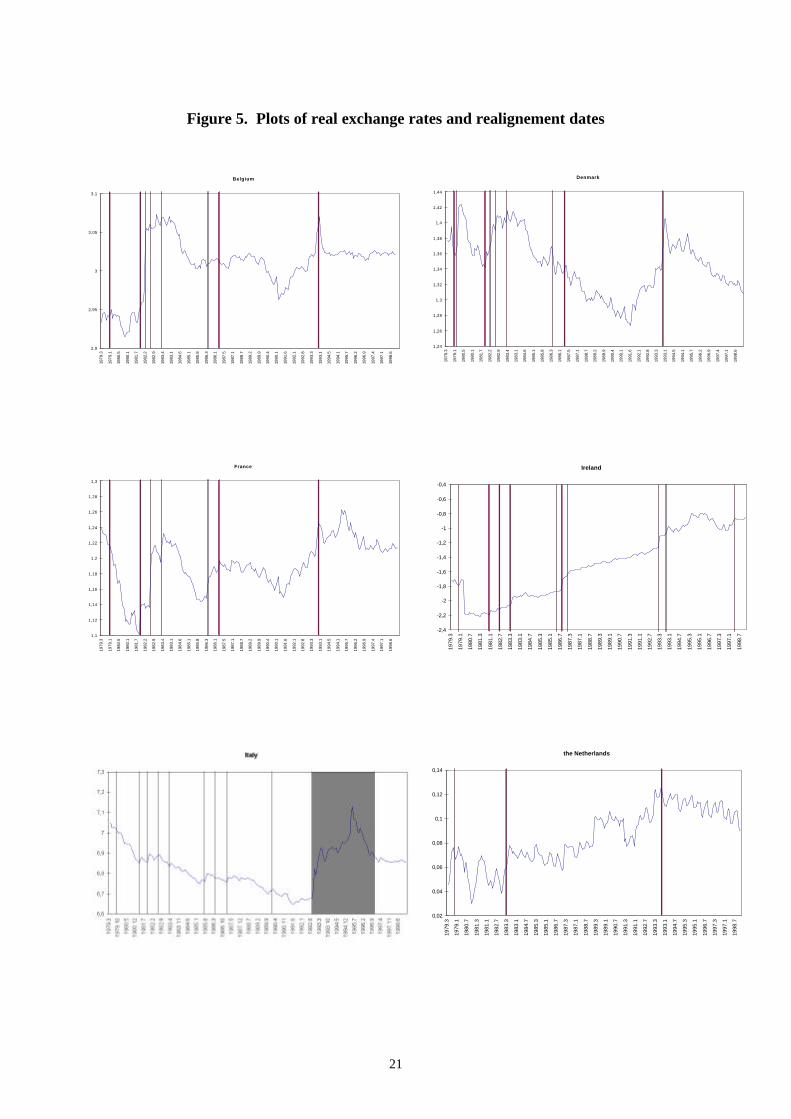
Figure 5. Plots of real exchange rates and realignement dates
Belgium
2,9
2,95
3
3,05
3,1
1979
.3
1979
.1
1980
.5
1980
.1
1981
.7
1982
.2
1982
.9
1983
.4
1983
.1
1984
.6
1985
.1
1985
.8
1986
.3
1986
.1
1987
.5
1987
.1
1988
.7
1989
.2
1989
.9
1990
.4
1990
.1
1991
.6
1992
.1
1992
.8
1993
.3
1993
.1
1994
.5
1994
.1
1995
.7
1996
.2
1996
.9
1997
.4
1997
.1
1998
.6
Denmark
1,24
1,26
1,28
1,3
1,32
1,34
1,36
1,38
1,4
1,42
1,44
1979
.3
1979
.1
1980
.5
1980
.1
1981
.7
1982
.2
1982
.9
1983
.4
1983
.1
1984
.6
1985
.1
1985
.8
1986
.3
1986
.1
1987
.5
1987
.1
1988
.7
1989
.2
1989
.9
1990
.4
1990
.1
1991
.6
1992
.1
1992
.8
1993
.3
1993
.1
1994
.5
1994
.1
1995
.7
1996
.2
1996
.9
1997
.4
1997
.1
1998
.6
France
1,1
1,12
1,14
1,16
1,18
1,2
1,22
1,24
1,26
1,28
1,3
1979
.3
1979
.1
1980
.5
1980
.1
1981
.7
1982
.2
1982
.9
1983
.4
1983
.1
1984
.6
1985
.1
1985
.8
1986
.3
1986
.1
1987
.5
1987
.1
1988
.7
1989
.2
1989
.9
1990
.4
1990
.1
1991
.6
1992
.1
1992
.8
1993
.3
1993
.1
1994
.5
1994
.1
1995
.7
1996
.2
1996
.9
1997
.4
1997
.1
1998
.6
Ireland
-2,4
-2,2
-2
-1,8
-1,6
-1,4
-1,2
-1
-0,8
-0,6
-0,4
1979
.3
1979
.1
1980
.7
1981
.3
1981
.1
1982
.7
1983
.3
1983
.1
1984
.7
1985
.3
1985
.1
1986
.7
1987
.3
1987
.1
1988
.7
1989
.3
1989
.1
1990
.7
1991
.3
1991
.1
1992
.7
1993
.3
1993
.1
1994
.7
1995
.3
1995
.1
1996
.7
1997
.3
1997
.1
1998
.7
the Netherlands
0,02
0,04
0,06
0,08
0,1
0,12
0,14
1979
.3
1979
.1
1980
.7
1981
.3
1981
.1
1982
.7
1983
.3
1983
.1
1984
.7
1985
.3
1985
.1
1986
.7
1987
.3
1987
.1
1988
.7
1989
.3
1989
.1
1990
.7
1991
.3
1991
.1
1992
.7
1993
.3
1993
.1
1994
.7
1995
.3
1995
.1
1996
.7
1997
.3
1997
.1
1998
.7

22
correspond to realignments of the European currencies. It corroborates the resultsobtained by Engel and Hakkio (1996) showing on the FF/DM and IL/DMexchange rates with MS models with fixed and time-varying transitionprobabilities that most realignments for these two countries occured during thevolatile period. It means that the existence of this second long-run equilibriumrelationship is artificially brought by the authorities’ interventions designed tolower competitiveness differentials between the countries participating in theEMS ; realignments were designed to offset inflation differentials between theEMS partners. This idea is confirmed by fig. 4. It plots our second error-term : thedeviation of the nominal exchange rate from the PPP (i.e. the real exchange rate).We notice on this picture that the realignment dates correspond mainly to peaks ofthis error term and that this series decreases afterwards. Consequently, the realexchange rate exhibits no long-run increase thanks to the realignments whichbroke their increase, corresponding to a loss of competitiveness of the consideredcountry relative to the reference country ; the realignments prevent the nominalexchange rates to move too far away from the PPP.However, the Netherlands and Belgium make exception to this analysis. Thefailure of our specification to model their exchange rates dynamics can beexplained by their high degree of convergence with respect to Gemany. Indeed,the Dutch Guilder and the Belgian Franc have been pegged to the Deutsche Markrespectively since 1984 and 1990. This involves a strong stability of theseexchange rates explaining the inadequacy of our specification for these twocountries.
5. CONCLUSION
This paper has explored the possibility of two alternative anchors -the centralparity and the Purchasing Power Parity value- in the European Exchange RateMechanism during the whole period of the EMS for six European countries. Totest this hypothesis, we have used the Markov-Switching approach, as it isrecommended by the empirical literature and implicitly by a part of the theoreticalliterature. In this framework, it turns out that the Danish, French, Irish and Italianexchange rates switch between a credible state with mean-reversion towards theofficial parities and an unstable regime with an adjustment to the PPP value. Yet,the Belgian Franc and the Dutch Guilder which have been pegged sooner or laterto the Deutsche Mark constitute peculiar cases.
We have thus reconciled two issues rarely treated together : the mean-reversionand the PPP hypotheses in the dynamics of exchange rates within a target-zonesystem. Anyway, at the end of the ERM, these two questions became redundant :with the gradual convergence of the European economies and consequently the

23
removal of the competitiveness differentials between the European members, thePPP was converging towards the central parity (see Gros and Thygesen 1998,p.78). Consequently, the adjustment towards the Purchasing Power Parity valuebecame equivalent to a convergence of the exchange rate towards the centralparity.
ACKNOWLEDGEMENTS
This paper owes a great deal to suggestions and comments from P.Y. Hénin. I amalso grateful to F. Karamé, P. N’Diaye and C. Perraudin for fruitful discussions onan earlier version of this paper. However, all remaining errors are of course mine.
REFERENCES
Amato A. and M. Tronzano (1998), ‘Fiscal Policy, Debt Management andExchange Rate Credibility : Lessons from the Recent Italian Experience’,forthcoming in Journal of Banking and Finance.
Anthony M. and R. MacDonald (1998), ‘On the Mean-Reverting Properties of aTarget-Zone Exchange Rate : Some Evidence from the ERM’, European
Economic Review, 42, 1493-1523.Anthony M. and R. MacDonald (1999), ‘The Width of the Band and Exchange
Rate Mean-Reversion : Some Further ERM-based Results’, Journal of
International Money and Finance, 18, 411-428.Artis, M.J. and D. Nachane (1990), ‘Wages and Prices in Europe : A Test of the
German Leadership Thesis’, Weltwirtschaftliches Archiv, 136, 59-77.Balke N.S. and T.B. Fomby (1997), ‘Threshold Cointegration’, International
Economic Review, Vol. 38, No. 3, August 1997.Ball C. and A. Roma, (1993), ‘A Jump-Diffusion Model for the European
Monetary System’, Journal of International Money and Finance, Vol. 12, No.5, 475-492.
Bertola G. and L.E.O Svensson (1993), ‘Stochatic Devaluation Risk and theEmpirical Fit of Target-Zone Models’, Review of Economic Studies, 60, 689-712.
Bertola G. and R. Caballero (1992), ‘Target Zones and Realignments’, American
Economic Review, 82, 520-36.Bini-Smaghi L. and S. Micossi (1989), ‘Managing Exchange Rate Markets in the
EMS with Free Capital’, Banca-Nazionale-del-Lavoro-Quarterly-Review,O(171), 395-430.

24
Cheung Y.W., H.G. Fung, K.S. Lai and W.C. Lo (1995), ‘Purchasing PowerParity Under the European Monetary System’, Journal of International Money
and Finance, Vol. 14, No. 2, 179-189.De Haan J., T. K. Dijkstra and K. H. W. Knot (1999), ‘Empirical Features of the
Second-Generation Target Zone Models : Mean Reverting fundamentals andEndogenous Devaluation Risk’, Economic Inquiry, Vol. 37, No. 3, July 1999,489-509.
De Jong F., F.C. Drost and B..J..M. Werker (1996), ‘Exchange Rate Target-Zone :a New Approach’, Department of Economics, Tilburg University, PO BOX90153, the Netherlands.
Edison H.J. and E.O’N. Fisher (1991), ‘A Long-Run View of the EuropeanMonetary System’, Journal of International Money and Finance, 10, 53-70.
Eichengreen B., A. Rose and C. Wyplosz (1996), ‘Speculative Attacks on PeggedExchange Rates : an Empirical Exploration with Special Reference to theEuropean Monetary System’, Canzoneri, Matthew, Ethier, Wilfred, Grilli,Vittorio, eds The New Transatlantic Economy, Cambridge University Press,New York and Melbourne.
Cosslett S.R. and L.F. Lee (1985), ‘Serial Correlation in Latent Discrete VariableModels’, Journal of Econometrics, 27(1), 79-97.
Eichengreen B. and C. Wyplosz (1993), ‘The unstable EMS’, Brooking Papers on
Economic Activity, 1, 51-124 .Engel C. and C. Hakkio (1996), ‘The Distribution of Exchange Rates in the
EMS’, International Journal of Finance Economics, 1, 55-67.Froot K.A. and L.E.O. Obstfeld (1991), ‘Exchange Rate Dynamics under
Stochastic Regime Shifts : a Unified Approach’, Journal of International
Economics, 31(3-4), 203-229.Fung H.G.and W.C. Lo (1992), ‘Deviations from Purchasing Power Parity’,
Financial Review, 27, 553-570.Goldfeld S.M. and R.E Quandt (1973), ‘A Markov Model of Switching
Regressions’, Journal of Econometrics, 1, 3-16.Gros D.and N. Thygesen, European Monetary Integration, 2nd edition, Longman.Hall S., Z. Psaradakis and M. Sola (1997), ‘Switching Error-Correction Models of
House Prices in the United-Kingdom’, Economic Modelling, 14, 517-527.Hamilton J.D. (1989), ‘A New Approach to the Economic Analysis of
Nonstationary Time Series and the Business Cycle’, Econometrica, 57, 357-384.
Hamilton J.D. (1990), ‘Analysis of Time Series Subject to Changes in Regime’,Journal of Econometrics, 45, 39-70.
Krugman P. (1991), ‘Target Zones and Exchange Rate Dynamics’, Quarterly
Journal of Economics, Vol. 56, No. 3, 669-682.Lindberg H. and P. Söderlind (1992), ‘Target Zone Models and Intervention
Policy : the Swedish Case’, Mimeo, IIES Seminar Paper 496, Stockholm.

25
Lindberg H. and P. Söderlind (1994), ‘Intervention Policy and Mean Reversion inExchange Rate Target Zones : the Swedish Case’, Scandinavian Journal of
Economics, 96(4), 499-513.Meese R.A. and K.J. Singleton (1992), ‘On Unit Roots and the Empirical
Modeling of Exchange Rates’, Journal of Finance, Vol. 37, p 1029-35.MacDonald R. and M..P. Taylor (1991), ‘Exchange Rates, Policy Convergence
and the European Monetary System’, Review of Economics and Statistics, 73,553-558.
Pentecôte J.B. and T. Roncalli (1996), ‘Retour à la moyenne dans les cours dumécanisme de change européen : 1987-1995’, Economie et Prévision, No. 123-124, 1996/2-3.
Peria M. S. M (1999), ‘A Regime Switching Approach to Studying SpeculativeAttacks : A Focus on European Monetary System Crises’, unpublished.
Rose A. K.and L.E.O. Svensson (1994), ‘European Exchange Rate CredibilityBefore the Fall’, European Economic Review 38, 763-862.
Tristani O. (1994), ‘Variable Probability of Realignment in a Target Zone’,Scandinavian Journal of Economics, 96(1), 1-14.
Svensson L.E.O. (1991), ‘The Term Structure of Interest Rate Differentials :Theory and Swedish Data’, Journal of Monetary Economics, 28, 87-116.
Svensson L.E.O. (1992), ‘An Interpretation of Recent Research on Exchange RateTarget Zones’, Journal of Economic Perspect 6, 119-144.
Svensson L.E.O. (1993), ‘Assessing Target Zone Credibility’, European
Economic Review 37, 763-802.

26
APPENDIX
Table V. Main events occuring during the EMS
Date Event79:03:13 Inception of ERM 87:09:12 Basle-Nyborg Agreement 89:06:19 Entry of Spain 90:01:08 Reduction of the Italian margin 90:06:16 The Belgian Franc is pegged to the Deutsche Mark 90:10:08 Entry of United Kingdom
91:12 Maastricht Summit 92:04:06 Entry of Portugal92:06:02 Negative outcome of the Danish referendum on Maastricht 92:06 Irish referendum on Maastricht
92:08:25 French polling result indicating a short majority of French voters in favour ofthe ratification of the Maastricht treaty
92:09:14 Devaluation by 7% of the Italian Lira 92:09:17 Withdrawal of Italy and Britain from the ERM 92:09:20 Positive outcome of the French referendum on the Maastricht Treaty with a slim
majority 92:11:23 Devaluation by 6% of the Spanish Peseta and the Portuguese Escudo 93:02:01 Devaluation by 10% of the Irish Pound 93:05:13 Devaluation of the Spanish Peseta and the Portuguese Escudo93:08:02 ERM bands widening to ± 15% except for the Dutch Guilder 95:01:07 Entry of the Austrian Schilling
95 Entry of Finland 96:11:24 Reentry of Italy 98:03:16 Entry of Greece
98:05 Bruxelles Summit announcing the future bilateral parities between the Europeancurrencies
Related Documents