health.mn.gov/coronavirus Minnesota Department of Health Weekly COVID-19 Report: Updated 3/3/2022 with data current as of 4 a.m. the previous business day unless specifically noted. Page 1 Minnesota Department of Health WEEKLY COVID-19 REPORT 3/3/2022 This MDH Weekly COVID-19 Report presents data in an easy to interpret way and enhances the information provided in the daily Situation Update for COVID-19 web page with situational insights as well as trends over time. More MN COVID-19 data and statistics: Minnesota Situation Update for Coronavirus Disease 2019 (COVID-19) (https://www.health.state.mn.us/diseases/coronavirus/situation.html) - updated daily at 11 a.m.

Welcome message from author
This document is posted to help you gain knowledge. Please leave a comment to let me know what you think about it! Share it to your friends and learn new things together.
Transcript
health.mn.gov/coronavirus
Minnesota Department of Health Weekly COVID-19 Report: Updated 3/3/2022 with data current as of 4 a.m. the previous business day unless specifically noted. Page 1
Minnesota Department of Health
WEEKLY COVID-19 REPORT 3/3/2022
This MDH Weekly COVID-19 Report presents data in an easy to interpret way and enhances the information provided in the daily Situation Update for COVID-19 web page with situational insights as well as trends over time.
� More MN COVID-19 data and statistics: Minnesota Situation Update for Coronavirus Disease 2019 (COVID-19) (https://www.health.state.mn.us/diseases/coronavirus/situation.html) - updated daily at 11 a.m.
Minnesota Department of Health Weekly COVID-19 Report: Updated 3/3/2022 with data current as of 4 a.m. the previous business day unless specifically noted. Page 2
About Minnesota COVID-19 Data
ContentsAbout Minnesota COVID-19 Data ............................................2
COVID-19 Overview Summary ..................................................3
Laboratory Tests for COVID-19..................................................4Number of Tests and Percent Positive by Week....................5Laboratory Test Rates by County of Residence ....................6Percent of Tests Positive by County of Residence ................ 7Weekly Percent of Tests Positive by County of Residence ..8Testing Demographics: Age .....................................................9Testing Demographics: Gender ............................................. 10
Positive COVID-19 Cases .......................................................... 11New Cases by Week, 7-Day Average ................................... 12
Cases by County of Residence .................................................. 13Cumulative Case Rate by County of Residence ................. 14Weekly Case Rate by County of Residence ........................ 15
Hospitalizations, ICU Hospitalizations ...................................... 16Hospitalizations by Week, 7-Day Average ............................17ICU Hospitalizations by Week, 7-Day Average .................. 18
COVID-19 Deaths ..................................................................... 19Deaths by Week, 7-Day Average ......................................... 20Deaths by County of Residence .......................................... 21
Demographics: Age.....................................................................22Cases by Age Group and Specimen Collection Date .........23Case Rate in Children by Specimen Collection Date ........ 24Hospitalization Rate in Children by Specimen Collection .25
Demographics: Gender ..............................................................26
Demographics: Race & Ethnicity ..............................................27Age-Adjusted Race & Ethnicity Rates ................................ 28
Potential Exposure in Child Care Settings ...............................29
Student Cases Associated with PK-12 School Buildings ........ 30
Minnesota IHE Facilities Reporting Cases ............................... 31
Resident Cases Associated with Congregate Care Settings ..32
SARS-CoV-2 Variants Circulating in Minnesota ....................33SARS-CoV-2 Variants by Region ........................................ 34
Vaccine Breakthrough (VBT) Cases .........................................35VBT Hospitalizations and Deaths ......................................... 36VBT Cases, Hospitalizations, and Deaths by Age Group ...37
Response Metrics: Testing and Interview Timing .................... 38
Syndromic Surveillance ............................................................. 39
� Data is for cases that were tested and returned positive. • At-home test results are not counted by MDH.• Many people with COVID-19 are not tested, so the
cases in this report represent only a fraction of the total number of cases in Minnesota.
� All data is preliminary and may change as cases are investigated.
• Many data points are collected during case interviews. Data presented below is for all cases, regardless of interview status. Data for cases pending interview may be listed as “unknown/missing”.
• As of 10/28/21, case interviews are prioritized. Priority groups include people under 18 years old, hospitalizations, deaths, and people with vaccine breakthrough or variants. Therefore, not all cases were contacted for interview.
� Minnesota uses the CSTE standardized surveillance case definition.
• A person is counted as having a reinfection if they test positive (confirmed or probable) for COVID-19 more than 90 days after a previous lab-confirmed case. Cases include reinfections unless otherwise noted.
• Positive PCR test results are considered confirmed cases. Positive antigen test results are considered probable cases. All probable cases get the same public health follow up and recommendations as cases confirmed by PCR tests. Total cases includes confirmed and probable cases unless otherwise noted.
• A person with a positive PCR test result following a positive antigen test result would move from being a probable case to a confirmed case.
� Weekly data is reported by MMWR week, which is the week of the year assigned by the National Notifiable Diseases Surveillance System for the purposes of disease reporting and publishing.
� Numbers listed as cumulative total are cumulative since 1/20/20 for confirmed (PCR) tests and cases, and since 9/1/20 for probable (antigen) tests and cases, unless specified otherwise.
Archived:VBT Cases among Health Care Workers ........................40 Demographics: Interview Language ................................. 41Interview Language by County of Residence ................. 42Likely Exposure .................................................................. 43Likely Exposure and Specimen Collection Date ............44Residence Type .................................................................. 45Cases among Health Care Workers ................................ 46High Risk Exposures in Health Care Workers .................47Staff with Potential Exposure in Child Care Settings.... 48Staff Cases Associated with PK-12 Schools ................... 49PreK-12 School Buildings Reporting Cases .................... 50Cases that have an Affiliation with IHE ........................... 51Staff Cases Associated with Congregate Care Settings 52Congregate Care Facility Outbreaks ...............................53
Minnesota Department of Health Weekly COVID-19 Report: Updated 3/3/2022 with data current as of 4 a.m. the previous business day unless specifically noted. Page 3
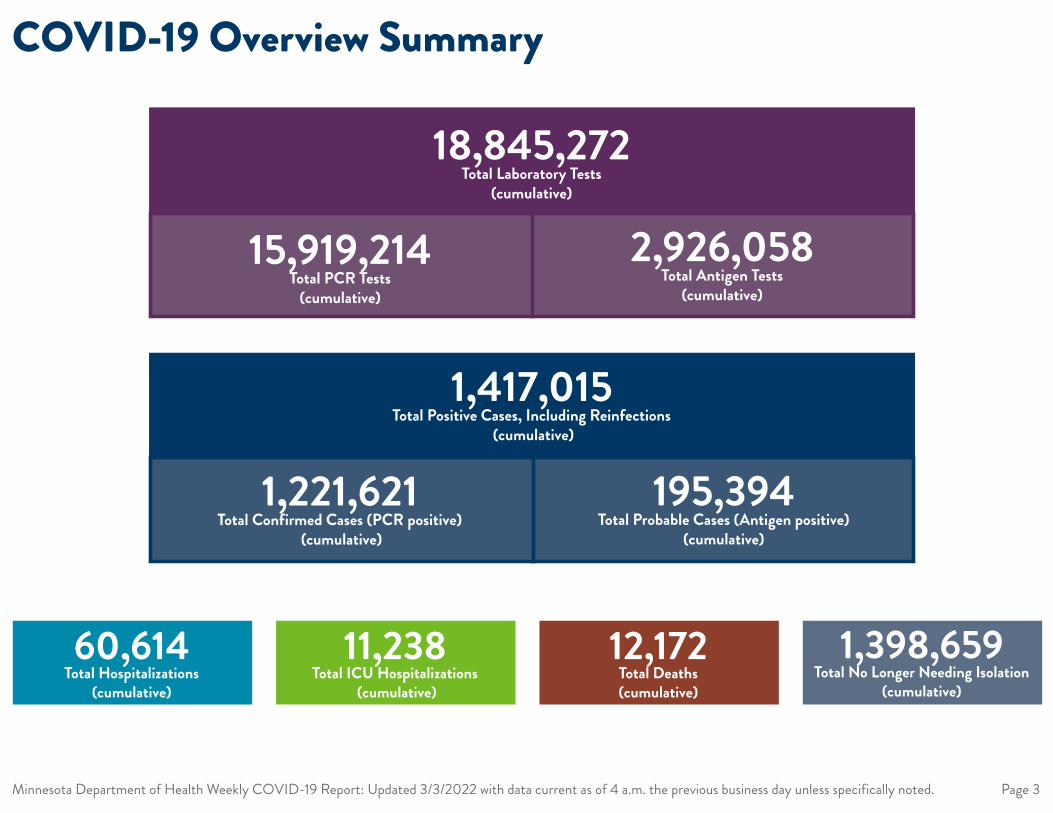
1,398,659 Total No Longer Needing Isolation
(cumulative)
12,172 Total Deaths (cumulative)
11,238 Total ICU Hospitalizations
(cumulative)
60,614 Total Hospitalizations
(cumulative)
195,394 Total Probable Cases (Antigen positive)
(cumulative)
1,221,621 Total Confirmed Cases (PCR positive)
(cumulative)
1,417,015 Total Positive Cases, Including Reinfections
(cumulative)
2,926,058 Total Antigen Tests
(cumulative)
15,919,214 Total PCR Tests
(cumulative)
18,845,272 Total Laboratory Tests
(cumulative)
COVID-19 Overview Summary
Minnesota Department of Health Weekly COVID-19 Report: Updated 3/3/2022 with data current as of 4 a.m. the previous business day unless specifically noted. Page 4
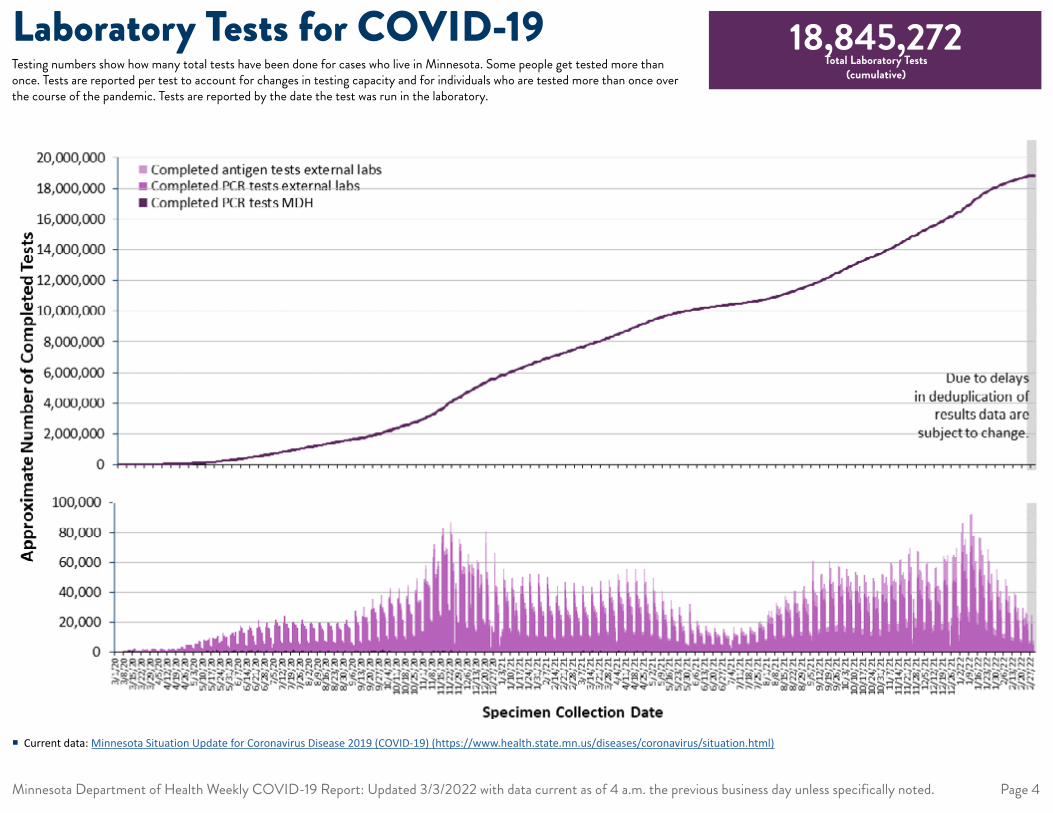
Laboratory Tests for COVID-19Testing numbers show how many total tests have been done for cases who live in Minnesota. Some people get tested more than once. Tests are reported per test to account for changes in testing capacity and for individuals who are tested more than once over the course of the pandemic. Tests are reported by the date the test was run in the laboratory.
18,845,272 Total Laboratory Tests
(cumulative)
� Current data: Minnesota Situation Update for Coronavirus Disease 2019 (COVID-19) (https://www.health.state.mn.us/diseases/coronavirus/situation.html)
3/1
3/22
4/12 5/
3
5/24
6/14 7/
5
7/26
8/16 9/
6
9/27
10/1
8
11/8
11/2
9
12/2
0
1/10
1/31
2/21
3/14 4/
4
4/25
5/16 6/
6
6/27
7/18 8/
8
8/29
9/19
10/1
0
10/3
1
11/2
1
12/1
2
1/2
1/23
2/13
0
50,000
100,000
150,000
200,000
250,000
300,000
350,000
400,000
450,000N
umbe
r of W
eekl
y Te
sts
0
5
10
15
20
25
30
35
40
45
Weekly Number and Percent Posi�ve COVID-19 PCR and An�gen Tests by Specimen Date
Percent of All Tests Posi�vePercent of PCR Tests Posi�vePercent of An�gen Tests Posi�ve
Number of Weekly PCR TestsNumber of Weekly An�gen Tests
Source: MDH analysis of an�gen and PCR COVID-19 tes�ng for MN residents. Data is reported at the test level using the specimen date. Percent of posi�ve tests is the percentage of tests posi�ve outof the total number of tests for the week. Currently, lines for Percent of All Tests Posi�ve and Percent of PCR Tests Posi�ve are indis�nguishable due to the similar percent posi�ves. Posi�ve casesinclude both confirmed cases (PCR posi�ve) and probable cases (An�gen posi�ve), and completed tests include both completed PCR tests and completed An�gen tests.
Percent of Tests Posi�ve
3/1
3/22
4/12 5/
3
5/24
6/14 7/
5
7/26
8/16 9/
6
9/27
10/1
8
11/8
11/2
9
12/2
0
1/10
1/31
2/21
3/14 4/
4
4/25
5/16 6/
6
6/27
7/18 8/
8
8/29
9/19
10/1
0
10/3
1
11/2
1
12/1
2
1/2
1/23
2/13
0
50,000
100,000
150,000
200,000
250,000
300,000
350,000
400,000
450,000
Num
ber o
f Wee
kly
Test
s
0
5
10
15
20
25
30
35
40
45
Weekly Number and Percent Posi�ve COVID-19 PCR and An�gen Tests by Specimen Date
Percent of All Tests Posi�vePercent of PCR Tests Posi�vePercent of An�gen Tests Posi�ve
Number of Weekly PCR TestsNumber of Weekly An�gen Tests
Source: MDH analysis of an�gen and PCR COVID-19 tes�ng for MN residents. Data is reported at the test level using the specimen date. Percent of posi�ve tests is the percentage of tests posi�ve outof the total number of tests for the week. Currently, lines for Percent of All Tests Posi�ve and Percent of PCR Tests Posi�ve are indis�nguishable due to the similar percent posi�ves. Posi�ve casesinclude both confirmed cases (PCR posi�ve) and probable cases (An�gen posi�ve), and completed tests include both completed PCR tests and completed An�gen tests.
Percent of Tests Posi�ve
Week
3/1-
3/7/
203/
8-3/
14/2
03/
15-3
/21/2
03/
22-3
/28/
203/
29-4
/4/2
04/
5-4/
11/20
4/12
-4/18
/20
4/19
-4/2
5/20
4/26
-5/2
/20
5/3-
5/9/
205/
10-5
/16/2
05/
17-5
/23/
205/
24-5
/30/
205/
31-6
/6/2
06/
7-6/
13/2
06/
14-6
/20/
206/
21-6
/27/
206/
28-7
/4/2
07/
5-7/
11/20
7/12
-7/18
/20
7/19
-7/2
5/20
7/26
-8/1/
208/
2-8/
8/20
8/9-
8/15
/20
8/16
-8/2
2/20
8/23
-8/3
0/20
8/31
-9/5
/20
9/6-
9/12
/20
9/13
-9/19
/20
9/20
-9/2
6/20
9/27
-10/
3/20
10/4
-10/
10/2
010
/11-1
0/17
/20
10/18
-10/2
4/20
10/2
5-10
/31/2
011/
1-11/
7/20
11/8-
11/14
/20
11/15
-11/2
1/20
11/22
-11/2
8/20
11/29
-12/
5/20
12/6
-12/
12/2
012
/13-12
/19/2
012
/20-
12/2
6/20
12/2
7-1/2
/21
1/3-1
/9/2
11/1
0-1/1
6/21
1/17-
1/23/
211/2
4-1/3
0/21
1/31-
2/6/
212/
7-2/
13/2
12/
14-2
/20/
212/
21-2
/27/
212/
28-3
/6/2
13/
7-3/
13/2
13/
14-3
/20/
213/
21-3
/27/
213/
28-4
/3/2
14/
4-4/
10/2
14/
11-4/
17/2
14/
18-4
/24/
214/
25-5
/1/21
5/2-
5/8/
215/
9-5/
15/2
15/
16-5
/22/
215/
23-5
/29/
215/
30-6
/5/2
16/
6-6/
12/2
16/
13-6
/19/2
16/
20-6
/26/
216/
27-7
/3/2
17/
4-7/
10/2
17/
11-7/
17/2
17/
18-7
/24/
217/
25-7
/31/2
18/
1-8/
7/21
8/8-
8/14
/21
8/15
-8/2
1/21
8/22
-8/2
8/21
8/29
-9/4
/21
9/5-
9/11/
219/
12-9
/18/2
19/
19-9
/25/
219/
26-1
0/2/
2110
/3-1
0/9/
2110
/10-1
0/16
/21
10/17
-10/
23/2
110
/24-
10/3
0/21
10/3
1-11/
6/21
11/7-
11/13
/21
11/14
-11/2
0/21
11/21
-11/2
7/21
11/28
-12/
4/21
12/5
-12/
11/21
12/12
-12/
18/2
112
/19-1
2/25
/21
12/2
6-1/1
/22
1/2-1
/8/2
21/9
-1/15
/22
1/16-
1/22/
221/2
3-1/2
9/22
1/30/
22-2
/5/2
22/
6/22
-2/12
/22
2/13
-2/19
/22
2/20
-2/2
6/22
Minnesota Department of Health Weekly COVID-19 Report: Updated 3/3/2022 with data current as of 4 a.m. the previous business day unless specifically noted. Page 5
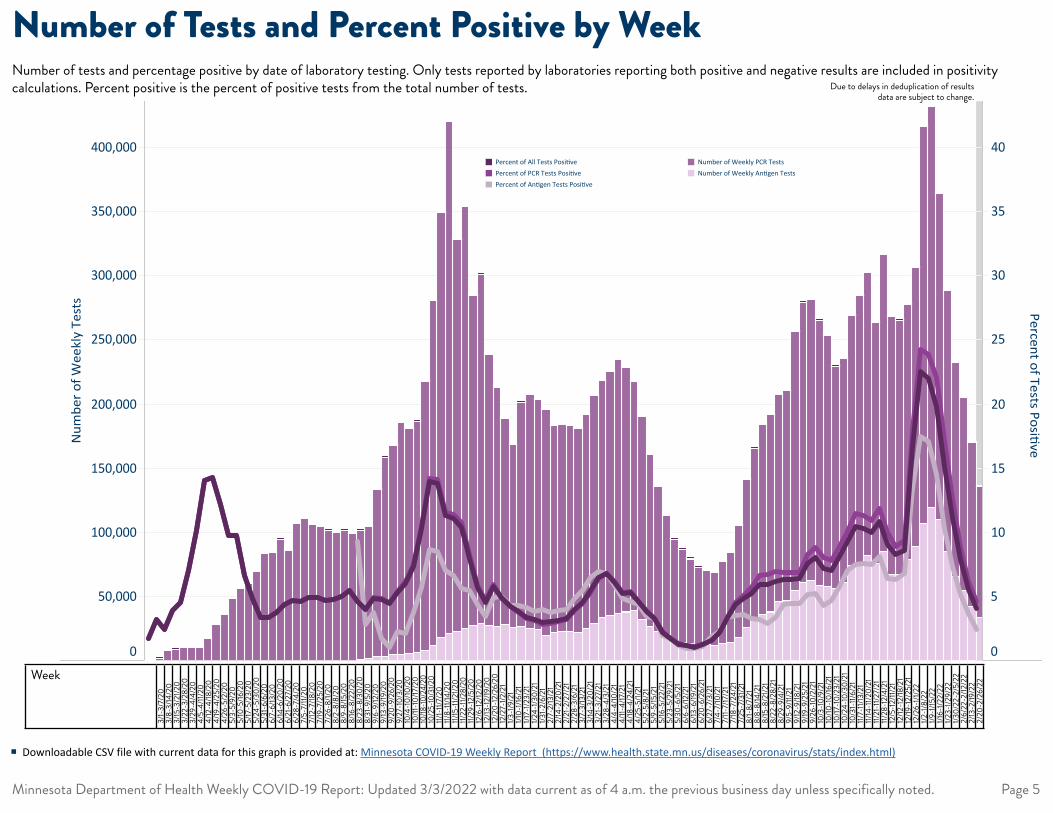
Number of Tests and Percent Positive by WeekDue to delays in deduplication of results
data are subject to change.
Number of tests and percentage positive by date of laboratory testing. Only tests reported by laboratories reporting both positive and negative results are included in positivity calculations. Percent positive is the percent of positive tests from the total number of tests.
� Downloadable CSV file with current data for this graph is provided at: Minnesota COVID-19 Weekly Report (https://www.health.state.mn.us/diseases/coronavirus/stats/index.html)
© 2022 Mapbox © OpenStreetMap
Tests Completed per 10,000 People, by County
1,335 4,869
Minnesota Department of Health Weekly COVID-19 Report: Updated 3/3/2022 with data current as of 4 a.m. the previous business day unless specifically noted. Page 6
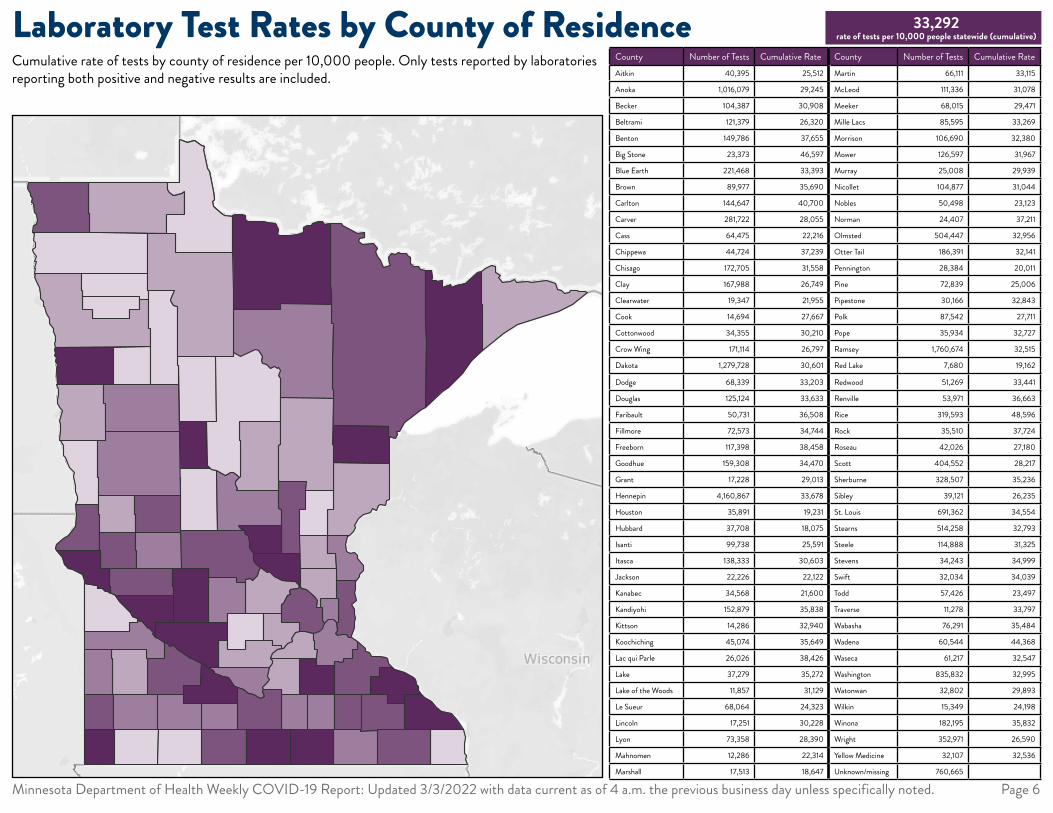
Laboratory Test Rates by County of ResidenceCumulative rate of tests by county of residence per 10,000 people. Only tests reported by laboratories reporting both positive and negative results are included.
33,292 rate of tests per 10,000 people statewide (cumulative)
County Number of Tests Cumulative Rate County Number of Tests Cumulative RateAitkin 40,395 25,512 Martin 66,111 33,115
Anoka 1,016,079 29,245 McLeod 111,336 31,078
Becker 104,387 30,908 Meeker 68,015 29,471
Beltrami 121,379 26,320 Mille Lacs 85,595 33,269
Benton 149,786 37,655 Morrison 106,690 32,380
Big Stone 23,373 46,597 Mower 126,597 31,967
Blue Earth 221,468 33,393 Murray 25,008 29,939
Brown 89,977 35,690 Nicollet 104,877 31,044
Carlton 144,647 40,700 Nobles 50,498 23,123
Carver 281,722 28,055 Norman 24,407 37,211
Cass 64,475 22,216 Olmsted 504,447 32,956
Chippewa 44,724 37,239 Otter Tail 186,391 32,141
Chisago 172,705 31,558 Pennington 28,384 20,011
Clay 167,988 26,749 Pine 72,839 25,006
Clearwater 19,347 21,955 Pipestone 30,166 32,843
Cook 14,694 27,667 Polk 87,542 27,711
Cottonwood 34,355 30,210 Pope 35,934 32,727
Crow Wing 171,114 26,797 Ramsey 1,760,674 32,515
Dakota 1,279,728 30,601 Red Lake 7,680 19,162
Dodge 68,339 33,203 Redwood 51,269 33,441
Douglas 125,124 33,633 Renville 53,971 36,663
Faribault 50,731 36,508 Rice 319,593 48,596
Fillmore 72,573 34,744 Rock 35,510 37,724
Freeborn 117,398 38,458 Roseau 42,026 27,180
Goodhue 159,308 34,470 Scott 404,552 28,217
Grant 17,228 29,013 Sherburne 328,507 35,236
Hennepin 4,160,867 33,678 Sibley 39,121 26,235
Houston 35,891 19,231 St. Louis 691,362 34,554
Hubbard 37,708 18,075 Stearns 514,258 32,793
Isanti 99,738 25,591 Steele 114,888 31,325
Itasca 138,333 30,603 Stevens 34,243 34,999
Jackson 22,226 22,122 Swift 32,034 34,039
Kanabec 34,568 21,600 Todd 57,426 23,497
Kandiyohi 152,879 35,838 Traverse 11,278 33,797
Kittson 14,286 32,940 Wabasha 76,291 35,484
Koochiching 45,074 35,649 Wadena 60,544 44,368
Lac qui Parle 26,026 38,426 Waseca 61,217 32,547
Lake 37,279 35,272 Washington 835,832 32,995
Lake of the Woods 11,857 31,129 Watonwan 32,802 29,893
Le Sueur 68,064 24,323 Wilkin 15,349 24,198
Lincoln 17,251 30,228 Winona 182,195 35,832
Lyon 73,358 28,390 Wright 352,971 26,590
Mahnomen 12,286 22,314 Yellow Medicine 32,107 32,536
Marshall 17,513 18,647 Unknown/missing 760,665
Minnesota Department of Health Weekly COVID-19 Report: Updated 3/3/2022 with data current as of 4 a.m. the previous business day unless specifically noted. Page 7
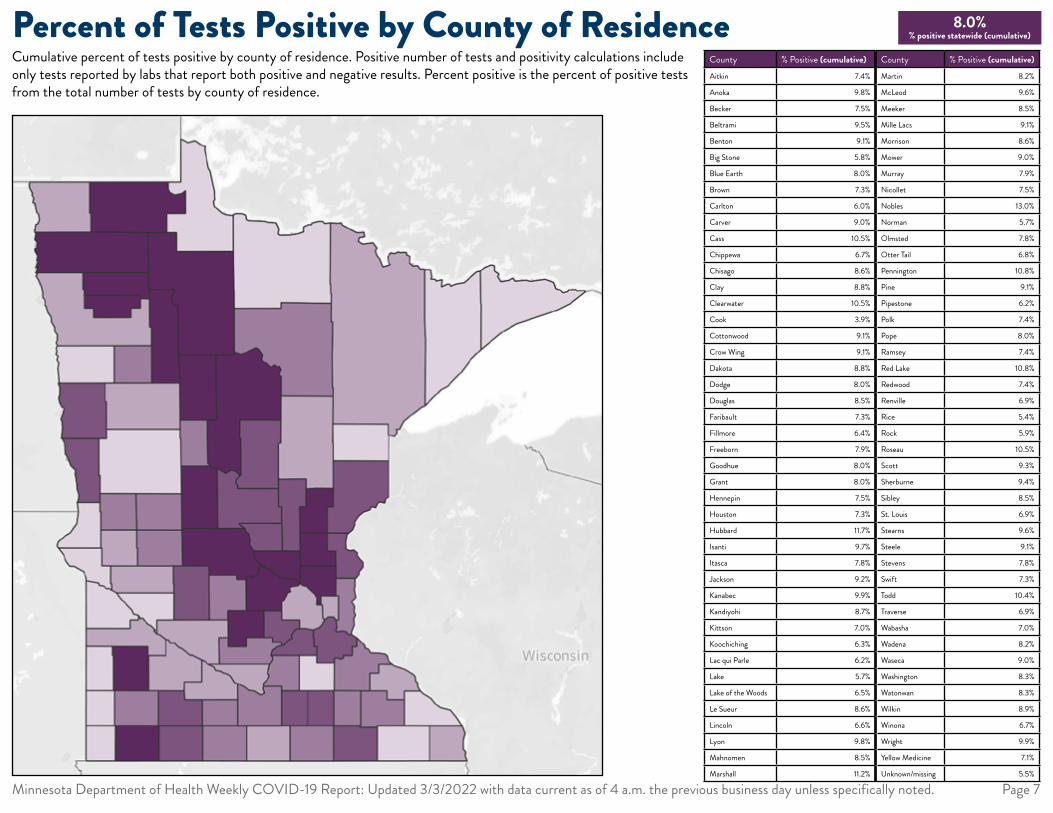
Percent of Tests Positive by County of ResidenceCumulative percent of tests positive by county of residence. Positive number of tests and positivity calculations include only tests reported by labs that report both positive and negative results. Percent positive is the percent of positive tests from the total number of tests by county of residence.
8.0% % positive statewide (cumulative)
County % Positive (cumulative) County % Positive (cumulative)Aitkin 7.4% Martin 8.2%
Anoka 9.8% McLeod 9.6%
Becker 7.5% Meeker 8.5%
Beltrami 9.5% Mille Lacs 9.1%
Benton 9.1% Morrison 8.6%
Big Stone 5.8% Mower 9.0%
Blue Earth 8.0% Murray 7.9%
Brown 7.3% Nicollet 7.5%
Carlton 6.0% Nobles 13.0%
Carver 9.0% Norman 5.7%
Cass 10.5% Olmsted 7.8%
Chippewa 6.7% Otter Tail 6.8%
Chisago 8.6% Pennington 10.8%
Clay 8.8% Pine 9.1%
Clearwater 10.5% Pipestone 6.2%
Cook 3.9% Polk 7.4%
Cottonwood 9.1% Pope 8.0%
Crow Wing 9.1% Ramsey 7.4%
Dakota 8.8% Red Lake 10.8%
Dodge 8.0% Redwood 7.4%
Douglas 8.5% Renville 6.9%
Faribault 7.3% Rice 5.4%
Fillmore 6.4% Rock 5.9%
Freeborn 7.9% Roseau 10.5%
Goodhue 8.0% Scott 9.3%
Grant 8.0% Sherburne 9.4%
Hennepin 7.5% Sibley 8.5%
Houston 7.3% St. Louis 6.9%
Hubbard 11.7% Stearns 9.6%
Isanti 9.7% Steele 9.1%
Itasca 7.8% Stevens 7.8%
Jackson 9.2% Swift 7.3%
Kanabec 9.9% Todd 10.4%
Kandiyohi 8.7% Traverse 6.9%
Kittson 7.0% Wabasha 7.0%
Koochiching 6.3% Wadena 8.2%
Lac qui Parle 6.2% Waseca 9.0%
Lake 5.7% Washington 8.3%
Lake of the Woods 6.5% Watonwan 8.3%
Le Sueur 8.6% Wilkin 8.9%
Lincoln 6.6% Winona 6.7%
Lyon 9.8% Wright 9.9%
Mahnomen 8.5% Yellow Medicine 7.1%
Marshall 11.2% Unknown/missing 5.5%
County
County Week 3: 1/16/22-1/22/22 Week 4: 1/23/22-1/29/22 Week 5: 1/30/22-2/5/22 Week 6: 2/6/22-2/12/22 Week 7: 2/13/22-2/19/22
Aitkin 14.3% 12.4% 10.1% 6.2% 5.9%
Anoka 22.1% 16.7% 11.6% 7.5% 5.6%
Becker 22.0% 16.6% 13.0% 9.3% 6.0%
Beltrami 24.5% 21.0% 16.4% 10.7% 8.2%
Benton 23.0% 18.4% 12.5% 10.3% 5.3%
Big Stone 15.3% 15.5% 10.3% 4.4% 5.1%
Blue Earth 26.8% 23.2% 18.5% 10.4% 7.4%
Brown 16.5% 10.5% 8.8% 7.1% 3.4%
Carlton 16.1% 16.7% 10.9% 6.4% 3.6%
Carver 20.4% 16.8% 11.9% 9.6% 7.2%
Cass 23.2% 21.6% 18.6% 12.0% 9.2%
Chippewa 17.5% 13.3% 10.3% 8.6% 6.2%
Chisago 17.5% 15.8% 13.9% 9.6% 4.8%
Clay 27.1% 21.6% 15.2% 11.6% 9.2%
Clearwater 21.8% 15.8% 15.0% 9.1% 5.0%
Cook 16.3% 16.5% 9.1% 6.4% 3.7%
Cottonwood 24.2% 16.2% 10.0% 9.8% 6.3%
Crow Wing 24.1% 18.8% 15.2% 11.9% 7.0%
Dakota 21.6% 16.1% 12.6% 8.7% 6.2%
Dodge 24.1% 16.5% 13.2% 8.6% 6.8%
Douglas 19.1% 16.4% 13.2% 10.7% 7.0%
Faribault 19.3% 15.2% 10.0% 4.4% 4.5%
Fillmore 14.4% 13.3% 8.9% 8.1% 4.7%
Freeborn 21.5% 16.5% 10.4% 10.2% 8.1%
Goodhue 21.4% 16.6% 12.3% 9.7% 6.9%
Grant 23.3% 17.1% 9.2% 7.5% 4.3%
Hennepin 17.5% 12.7% 9.1% 6.5% 4.9%
Houston 17.6% 11.0% 7.7% 7.4% 4.2%
Hubbard 27.0% 17.7% 18.6% 15.4% 10.3%
Isanti 23.1% 18.0% 12.7% 10.6% 6.8%
Itasca 21.9% 17.0% 13.3% 8.1% 6.4%
Jackson 19.2% 11.4% 10.2% 7.0% 3.1%
Kanabec 18.7% 19.2% 12.8% 11.0% 6.1%
Kandiyohi 19.4% 13.9% 11.4% 8.4% 6.7%
Kittson 20.4% 16.5% 11.7% 8.1% 0.0%
Koochiching 13.9% 14.2% 9.8% 7.4% 3.9%
Lac qui Parle 13.6% 10.1% 16.7% 12.6% 8.1%
Lake 15.1% 10.0% 6.3% 4.9% 3.4%
Lake of the Woods 13.2% 19.4% 11.7% 5.3% 3.3%
Le Sueur 22.2% 14.4% 12.5% 7.4% 7.0%
Lincoln 17.4% 8.8% 5.8% 3.3% 1.9%
Lyon 23.5% 19.7% 12.5% 7.0% 7.7%
Mahnomen 24.8% 19.8% 13.4% 8.8% 18.7%
Marshall 24.3% 18.3% 17.7% 12.5% 10.6%
Martin 19.8% 17.2% 14.0% 9.4% 8.0%
McLeod 24.2% 19.8% 17.2% 8.7% 7.0%
Meeker 17.1% 13.2% 12.3% 6.7% 4.0%
Mille Lacs 20.4% 16.0% 11.1% 6.8% 4.8%
Morrison 18.6% 17.9% 13.5% 11.5% 6.8%
Mower 27.2% 18.7% 12.9% 11.3% 9.8%
Murray 14.7% 7.5% 5.7% 4.9% 4.5%
Nicollet 23.6% 21.3% 16.9% 12.2% 6.1%
Nobles 22.4% 21.0% 11.8% 8.6% 4.2%
Norman 21.5% 16.5% 11.2% 10.9% 2.6%
Olmsted 24.1% 18.2% 14.2% 12.1% 10.1%
Otter Tail 20.8% 20.5% 10.7% 8.6% 5.4%
Pennington 27.4% 21.2% 19.3% 11.3% 13.8%
Pine 14.4% 14.8% 12.3% 6.7% 4.8%
Pipestone 13.6% 8.3% 4.6% 2.7% 1.9%
Polk 20.9% 16.5% 11.4% 7.2% 5.3%
Pope 24.1% 21.8% 18.8% 9.6% 4.3%
Ramsey 16.7% 12.4% 9.0% 6.7% 4.7%
Red Lake 30.8% 26.2% 13.7% 13.6% 5.9%
Redwood 15.9% 12.2% 9.3% 6.7% 2.9%
Renville 16.9% 10.3% 9.4% 8.1% 6.9%
Rice 13.5% 8.7% 7.4% 3.4% 1.7%
Rock 7.8% 4.3% 3.5% 2.2% 1.4%
Roseau 30.9% 22.3% 14.4% 10.8% 4.2%
Scott 22.2% 15.7% 10.5% 8.3% 5.3%
Sherburne 22.8% 16.7% 10.6% 7.5% 4.8%
Sibley 22.4% 24.1% 11.7% 6.9% 10.4%
St Louis 17.6% 14.6% 11.3% 8.6% 6.7%
Stearns 24.5% 17.4% 12.3% 8.9% 5.3%
Steele 26.6% 20.0% 14.4% 12.2% 10.5%
Stevens 24.9% 16.7% 14.7% 5.5% 4.9%
Swift 16.6% 12.5% 11.3% 8.5% 2.3%
Todd 20.4% 18.7% 17.1% 11.6% 11.2%
Traverse 13.4% 11.1% 18.4% 14.5% 5.5%
Wabasha 17.9% 18.8% 15.3% 10.1% 6.2%
Wadena 18.8% 15.3% 14.1% 9.5% 6.2%
Waseca 25.6% 18.7% 11.1% 6.0% 1.7%
Washington 20.8% 14.8% 11.8% 8.0% 5.6%
Watonwan 23.5% 21.0% 15.5% 8.5% 4.6%
Wilkin 13.7% 6.7% 6.6% 7.7% 6.8%
Winona 19.6% 15.0% 11.1% 7.7% 5.7%
Wright 21.8% 16.7% 12.6% 8.9% 5.9%
Yellow Medicine 11.2% 13.8% 8.1% 4.5% 4.2%
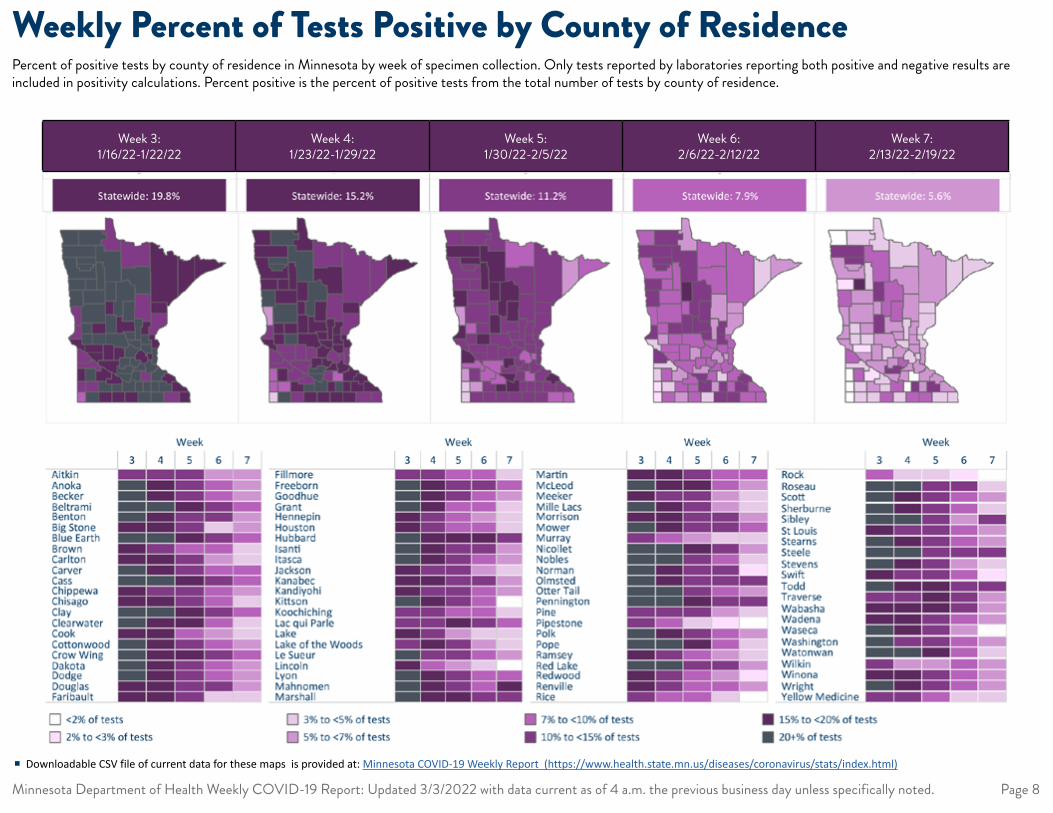
Statewide 19.8% 15.2% 11.2% 7.9% 5.6%
Week 3: 1/16/22-1/22/22
Week 4: 1/23/22-1/29/22
Week 5: 1/30/22-2/5/22
Week 6: 2/6/22-2/12/22
Week 7: 2/13/22-2/19/22
Minnesota Department of Health Weekly COVID-19 Report: Updated 3/3/2022 with data current as of 4 a.m. the previous business day unless specifically noted. Page 8
Weekly Percent of Tests Positive by County of ResidencePercent of positive tests by county of residence in Minnesota by week of specimen collection. Only tests reported by laboratories reporting both positive and negative results are included in positivity calculations. Percent positive is the percent of positive tests from the total number of tests by county of residence.
� Downloadable CSV file of current data for these maps is provided at: Minnesota COVID-19 Weekly Report (https://www.health.state.mn.us/diseases/coronavirus/stats/index.html)
Null
0-4
5-9
10-1
4
15-1
9
20-2
4
25-2
9
30-3
4
35-3
9
40-4
4
45-4
9
50-5
4
55-5
9
60-6
4
65-6
9
70-7
4
75-7
9
80-8
4
85-8
9
90-9
4
95-9
9
100+
0
100,000
200,000
300,000
400,000
500,000
600,000
700,000
800,000
900,000
1,000,000
1,100,000
1,200,000
1,300,000
1,400,000
1,500,000
Num
ber o
f Tes
tsTes�ng by Age Group
ResultNega�vePosi�ve
Num
ber o
f Tes
ts
Minnesota Department of Health Weekly COVID-19 Report: Updated 3/3/2022 with data current as of 4 a.m. the previous business day unless specifically noted. Page 9
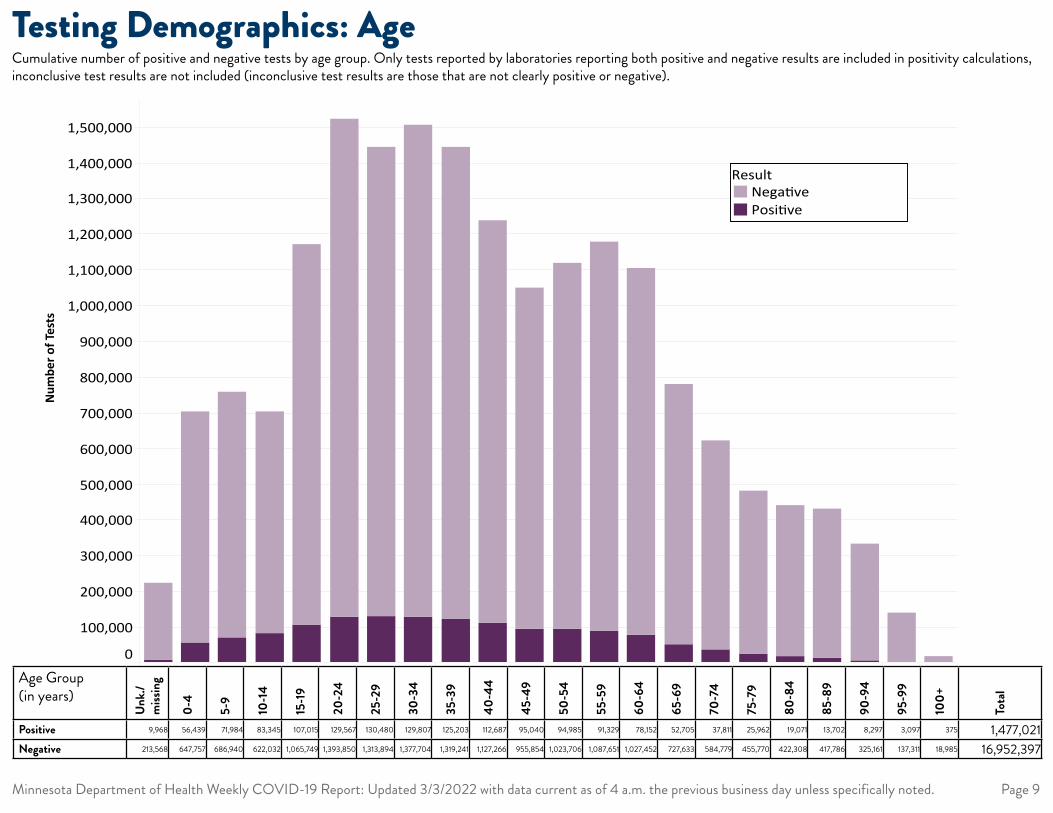
Testing Demographics: Age
Age Group (in years)
Unk.
/m
issin
g
0-4
5-9
10-1
4
15-1
9
20-2
4
25-2
9
30-3
4
35-3
9
40-4
4
45-4
9
50-5
4
55-5
9
60-6
4
65-6
9
70-7
4
75-7
9
80-8
4
85-8
9
90-9
4
95-9
9
100+
Tota
l
Positive 9,968 56,439 71,984 83,345 107,015 129,567 130,480 129,807 125,203 112,687 95,040 94,985 91,329 78,152 52,705 37,811 25,962 19,071 13,702 8,297 3,097 375 1,477,021Negative 213,568 647,757 686,940 622,032 1,065,749 1,393,850 1,313,894 1,377,704 1,319,241 1,127,266 955,854 1,023,706 1,087,651 1,027,452 727,633 584,779 455,770 422,308 417,786 325,161 137,311 18,985 16,952,397
Cumulative number of positive and negative tests by age group. Only tests reported by laboratories reporting both positive and negative results are included in positivity calculations, inconclusive test results are not included (inconclusive test results are those that are not clearly positive or negative).
Male Female Ambiguous Unknown/Missing Null0
1,000,000
2,000,000
3,000,000
4,000,000
5,000,000
6,000,000
7,000,000
8,000,000
9,000,000
10,000,000
Num
ber o
f Tes
tsTes�ng by Gender
ResultNega�vePosi�ve
Num
ber o
f Tes
ts
Minnesota Department of Health Weekly COVID-19 Report: Updated 3/3/2022 with data current as of 4 a.m. the previous business day unless specifically noted. Page 10
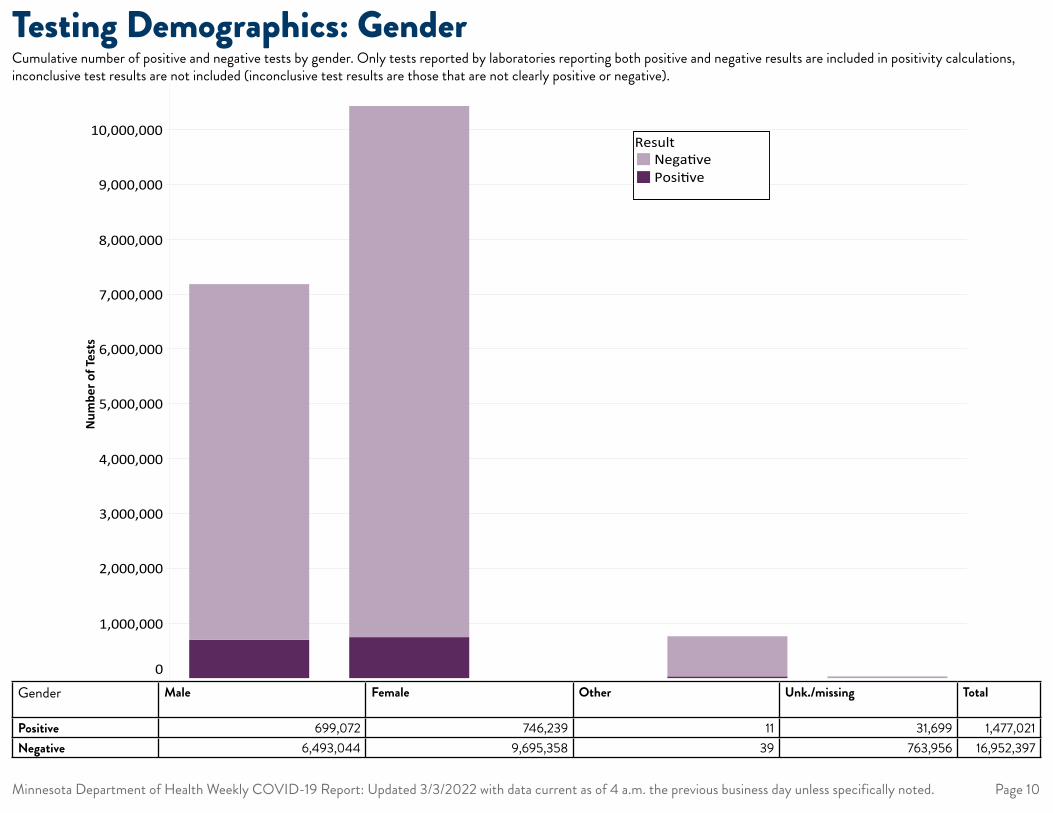
Testing Demographics: Gender
Gender Male Female Other Unk./missing Total
Positive 699,072 746,239 11 31,699 1,477,021Negative 6,493,044 9,695,358 39 763,956 16,952,397
Cumulative number of positive and negative tests by gender. Only tests reported by laboratories reporting both positive and negative results are included in positivity calculations, inconclusive test results are not included (inconclusive test results are those that are not clearly positive or negative).
Minnesota Department of Health Weekly COVID-19 Report: Updated 3/3/2022 with data current as of 4 a.m. the previous business day unless specifically noted. Page 11
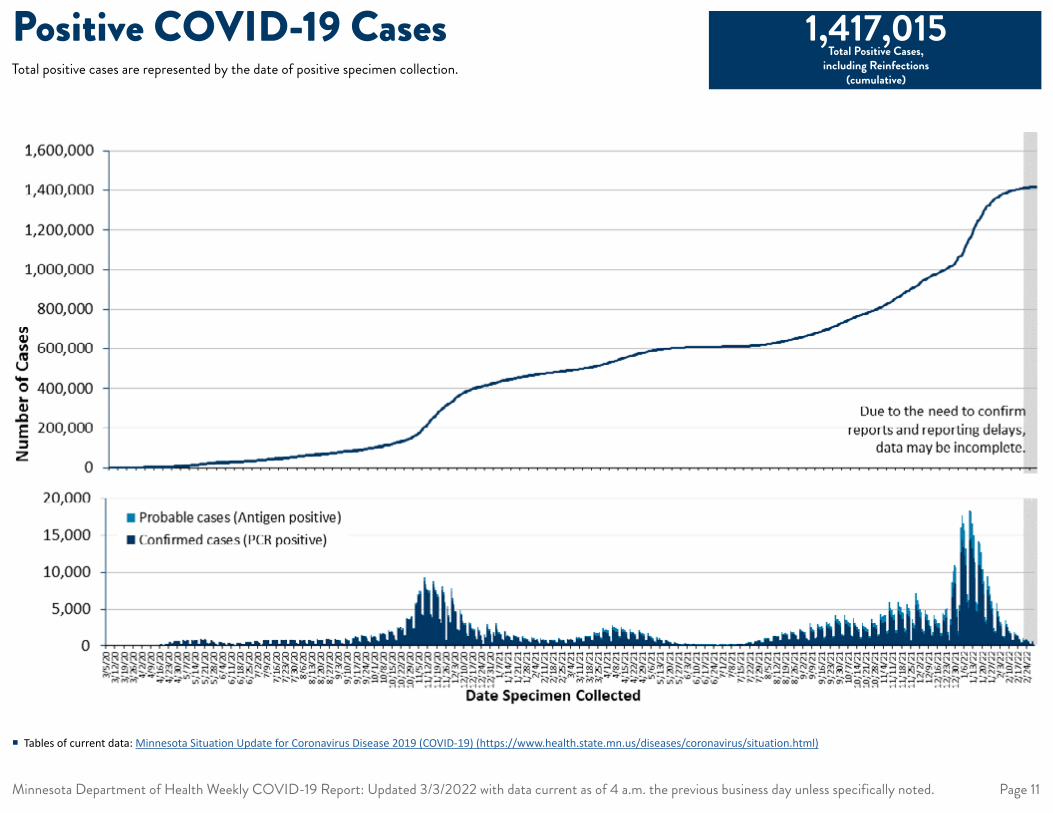
Positive COVID-19 CasesTotal positive cases are represented by the date of positive specimen collection.
1,417,015 Total Positive Cases,
including Reinfections (cumulative)
� Tables of current data: Minnesota Situation Update for Coronavirus Disease 2019 (COVID-19) (https://www.health.state.mn.us/diseases/coronavirus/situation.html)
May 10, 20 Jul 19, 20 Sep 27, 20 Dec 6, 20 Feb 14, 21 Apr 25, 21 Jul 4, 21 Sep 12, 21 Nov 21, 21 Jan 30, 22
Week of specimen_date
0
20,000
40,000
60,000
80,000
Num
ber o
f Cas
es
New Cases by Week of Specimen Date
May 10, 20 Jul 19, 20 Sep 27, 20 Dec 6, 20 Feb 14, 21 Apr 25, 21 Jul 4, 21 Sep 12, 21 Nov 21, 21 Jan 30, 22Specimen Date
0K
5K
10K
Num
ber o
f Cas
es
Seven Day Moving Average of New Cases
Week
3/1-
3/7/
203/
8-3/
14/2
03/
15-3
/21/2
03/
22-3
/28/
203/
29-4
/4/2
04/
5-4/
11/20
4/12
-4/18
/20
4/19
-4/2
5/20
4/26
-5/2
/20
5/3-
5/9/
205/
10-5
/16/2
05/
17-5
/23/
205/
24-5
/30/
205/
31-6
/6/2
06/
7-6/
13/2
06/
14-6
/20/
206/
21-6
/27/
206/
28-7
/4/2
07/
5-7/
11/20
7/12
-7/18
/20
7/19
-7/2
5/20
7/26
-8/1/
208/
2-8/
8/20
8/9-
8/15
/20
8/16
-8/2
2/20
8/23
-8/3
0/20
8/31
-9/5
/20
9/6-
9/12
/20
9/13
-9/19
/20
9/20
-9/2
6/20
9/27
-10/
3/20
10/4
-10/
10/2
010
/11-1
0/17
/20
10/18
-10/2
4/20
10/2
5-10
/31/2
011/
1-11/
7/20
11/8-
11/14
/20
11/15
-11/2
1/20
11/22
-11/2
8/20
11/29
-12/
5/20
12/6
-12/
12/2
012
/13-12
/19/2
012
/20-
12/2
6/20
12/2
7-1/2
/21
1/3-1
/9/2
11/1
0-1/1
6/21
1/17-
1/23/
211/2
4-1/3
0/21
1/31-
2/6/
212/
7-2/
13/2
12/
14-2
/20/
212/
21-2
/27/
212/
28-3
/6/2
13/
7-3/
13/2
13/
14-3
/20/
213/
21-3
/27/
213/
28-4
/3/2
14/
4-4/
10/2
14/
11-4/
17/2
14/
18-4
/24/
214/
25-5
/1/21
5/2-
5/8/
215/
9-5/
15/2
15/
16-5
/22/
215/
23-5
/29/
215/
30-6
/5/2
16/
6-6/
12/2
16/
13-6
/19/2
16/
20-6
/26/
216/
27-7
/3/2
17/
4-7/
10/2
17/
11-7/
17/2
17/
18-7
/24/
217/
25-7
/31/2
18/
1-8/
7/21
8/8-
8/14
/21
8/15
-8/2
1/21
8/22
-8/2
8/21
8/29
-9/4
/21
9/5-
9/11/
219/
12-9
/18/2
19/
19-9
/25/
219/
26-1
0/2/
2110
/3-1
0/9/
2110
/10-1
0/16
/21
10/17
-10/
23/2
110
/24-
10/3
0/21
10/3
1-11/
6/21
11/7-
11/13
/21
11/14
-11/2
0/21
11/21
-11/2
7/21
11/28
-12/
4/21
12/5
-12/
11/21
12/12
-12/
18/2
112
/19-1
2/25
/21
12/2
6-1/1
/22
1/2-1
/8/2
21/9
-1/15
/22
1/16-
1/22/
221/2
3-1/2
9/22
1/30-
2/5/
222/
6-2/
12/2
22/
13-2
/19/2
22/
20-2
/26/
222/
27-3
/5/2
2
Minnesota Department of Health Weekly COVID-19 Report: Updated 3/3/2022 with data current as of 4 a.m. the previous business day unless specifically noted. Page 12
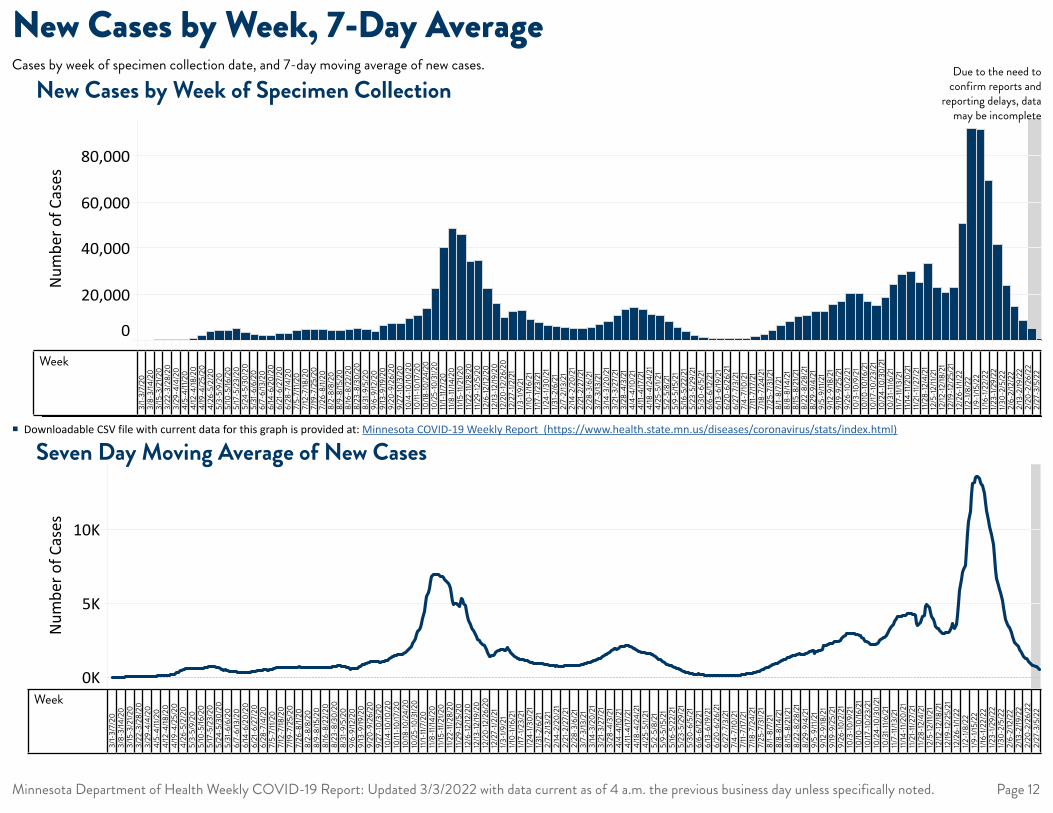
New Cases by Week, 7-Day AverageCases by week of specimen collection date, and 7-day moving average of new cases.
New Cases by Week of Specimen Collection
Seven Day Moving Average of New Cases
Due to the need to confirm reports and
reporting delays, data may be incomplete
� Downloadable CSV file with current data for this graph is provided at: Minnesota COVID-19 Weekly Report (https://www.health.state.mn.us/diseases/coronavirus/stats/index.html)
© 2022 Mapbox © OpenStreetMap
Cases by County of Residence
541 294,230
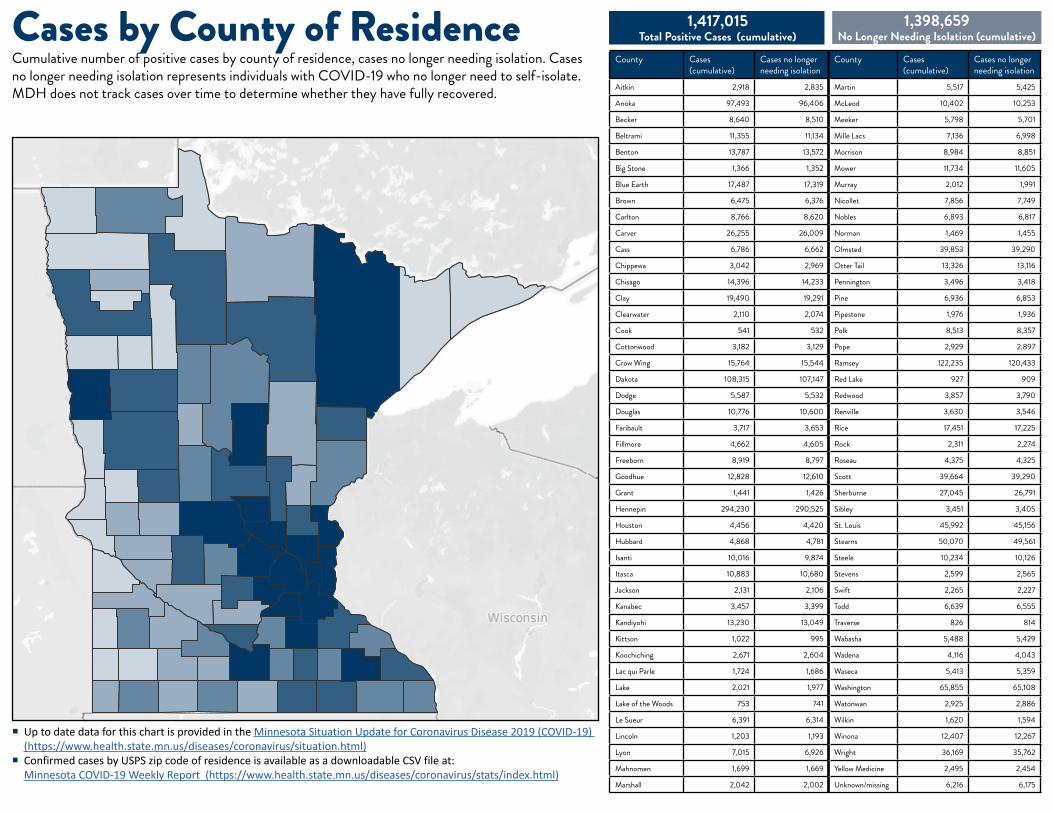
Cases by County of ResidenceCumulative number of positive cases by county of residence, cases no longer needing isolation. Cases no longer needing isolation represents individuals with COVID-19 who no longer need to self-isolate. MDH does not track cases over time to determine whether they have fully recovered.
County Cases (cumulative)
Cases no longer needing isolation
County Cases (cumulative)
Cases no longer needing isolation
Aitkin 2,918 2,835 Martin 5,517 5,425
Anoka 97,493 96,406 McLeod 10,402 10,253
Becker 8,640 8,510 Meeker 5,798 5,701
Beltrami 11,355 11,134 Mille Lacs 7,136 6,998
Benton 13,787 13,572 Morrison 8,984 8,851
Big Stone 1,366 1,352 Mower 11,734 11,605
Blue Earth 17,487 17,319 Murray 2,012 1,991
Brown 6,475 6,376 Nicollet 7,856 7,749
Carlton 8,766 8,620 Nobles 6,893 6,817
Carver 26,255 26,009 Norman 1,469 1,455
Cass 6,786 6,662 Olmsted 39,853 39,290
Chippewa 3,042 2,969 Otter Tail 13,326 13,116
Chisago 14,396 14,233 Pennington 3,496 3,418
Clay 19,490 19,291 Pine 6,936 6,853
Clearwater 2,110 2,074 Pipestone 1,976 1,936
Cook 541 532 Polk 8,513 8,357
Cottonwood 3,182 3,129 Pope 2,929 2,897
Crow Wing 15,764 15,544 Ramsey 122,235 120,433
Dakota 108,315 107,147 Red Lake 927 909
Dodge 5,587 5,532 Redwood 3,857 3,790
Douglas 10,776 10,600 Renville 3,630 3,546
Faribault 3,717 3,653 Rice 17,451 17,225
Fillmore 4,662 4,605 Rock 2,311 2,274
Freeborn 8,919 8,797 Roseau 4,375 4,325
Goodhue 12,828 12,610 Scott 39,664 39,290
Grant 1,441 1,426 Sherburne 27,045 26,791
Hennepin 294,230 290,525 Sibley 3,451 3,405
Houston 4,456 4,420 St. Louis 45,992 45,156
Hubbard 4,868 4,781 Stearns 50,070 49,561
Isanti 10,016 9,874 Steele 10,234 10,126
Itasca 10,883 10,680 Stevens 2,599 2,565
Jackson 2,131 2,106 Swift 2,265 2,227
Kanabec 3,457 3,399 Todd 6,639 6,555
Kandiyohi 13,230 13,049 Traverse 826 814
Kittson 1,022 995 Wabasha 5,488 5,429
Koochiching 2,671 2,604 Wadena 4,116 4,043
Lac qui Parle 1,724 1,686 Waseca 5,413 5,359
Lake 2,021 1,977 Washington 65,855 65,108
Lake of the Woods 753 741 Watonwan 2,925 2,886
Le Sueur 6,391 6,314 Wilkin 1,620 1,594
Lincoln 1,203 1,193 Winona 12,407 12,267
Lyon 7,015 6,926 Wright 36,169 35,762
Mahnomen 1,699 1,669 Yellow Medicine 2,495 2,454
Marshall 2,042 2,002 Unknown/missing 6,216 6,175
1,417,015 Total Positive Cases (cumulative)
1,398,659 No Longer Needing Isolation (cumulative)
� Up to date data for this chart is provided in the Minnesota Situation Update for Coronavirus Disease 2019 (COVID-19) (https://www.health.state.mn.us/diseases/coronavirus/situation.html)
� Confirmed cases by USPS zip code of residence is available as a downloadable CSV file at: Minnesota COVID-19 Weekly Report (https://www.health.state.mn.us/diseases/coronavirus/stats/index.html)
© 2022 Mapbox © OpenStreetMap
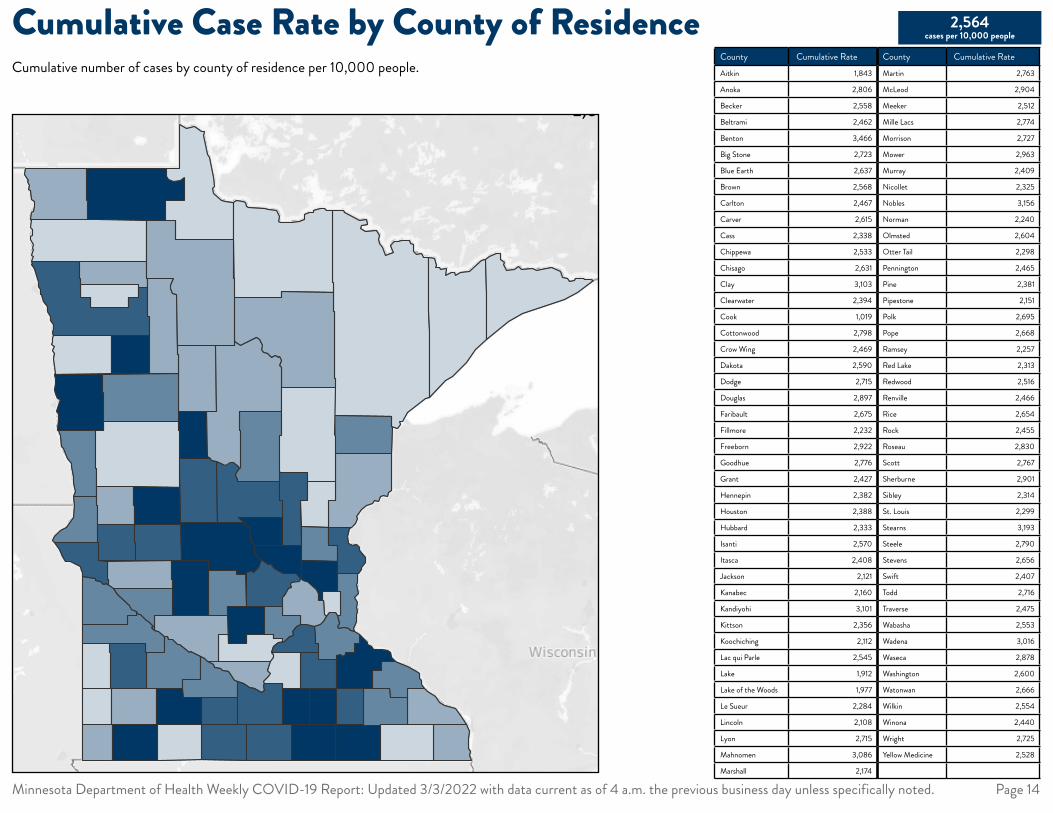
Cumula�ve Case Rate per 10,000 People1,019 3,466
Minnesota Department of Health Weekly COVID-19 Report: Updated 3/3/2022 with data current as of 4 a.m. the previous business day unless specifically noted. Page 14
Cumulative Case Rate by County of ResidenceCumulative number of cases by county of residence per 10,000 people.
2,564 cases per 10,000 people
County Cumulative Rate County Cumulative Rate Aitkin 1,843 Martin 2,763
Anoka 2,806 McLeod 2,904
Becker 2,558 Meeker 2,512
Beltrami 2,462 Mille Lacs 2,774
Benton 3,466 Morrison 2,727
Big Stone 2,723 Mower 2,963
Blue Earth 2,637 Murray 2,409
Brown 2,568 Nicollet 2,325
Carlton 2,467 Nobles 3,156
Carver 2,615 Norman 2,240
Cass 2,338 Olmsted 2,604
Chippewa 2,533 Otter Tail 2,298
Chisago 2,631 Pennington 2,465
Clay 3,103 Pine 2,381
Clearwater 2,394 Pipestone 2,151
Cook 1,019 Polk 2,695
Cottonwood 2,798 Pope 2,668
Crow Wing 2,469 Ramsey 2,257
Dakota 2,590 Red Lake 2,313
Dodge 2,715 Redwood 2,516
Douglas 2,897 Renville 2,466
Faribault 2,675 Rice 2,654
Fillmore 2,232 Rock 2,455
Freeborn 2,922 Roseau 2,830
Goodhue 2,776 Scott 2,767
Grant 2,427 Sherburne 2,901
Hennepin 2,382 Sibley 2,314
Houston 2,388 St. Louis 2,299
Hubbard 2,333 Stearns 3,193
Isanti 2,570 Steele 2,790
Itasca 2,408 Stevens 2,656
Jackson 2,121 Swift 2,407
Kanabec 2,160 Todd 2,716
Kandiyohi 3,101 Traverse 2,475
Kittson 2,356 Wabasha 2,553
Koochiching 2,112 Wadena 3,016
Lac qui Parle 2,545 Waseca 2,878
Lake 1,912 Washington 2,600
Lake of the Woods 1,977 Watonwan 2,666
Le Sueur 2,284 Wilkin 2,554
Lincoln 2,108 Winona 2,440
Lyon 2,715 Wright 2,725
Mahnomen 3,086 Yellow Medicine 2,528
Marshall 2,174
County
County Week 3: 1/16/22-1/22/22 Week 4: 1/23/22-1/29/22 Week 5: 1/30/22-2/5/22 Week 6: 2/6/22-2/12/22 Week 7: 2/13/22-2/19/22
Aitkin 60.6 46.7 32.2 17.1 19.6
Anoka 127.0 72.7 39.8 22.9 13.9
Becker 149.8 100.4 64.8 32.3 19.5
Beltrami 123.2 82.4 45.1 29.1 22.8
Benton 184.0 135.2 77.7 47.8 23.4
Big Stone 129.6 131.6 85.7 35.9 27.9
Blue Earth 148.5 90.2 54.4 25.6 15.2
Brown 133.7 84.1 50.0 28.2 9.1
Carlton 166.0 169.7 84.1 45.6 20.0
Carver 119.2 72.4 38.1 25.6 15.4
Cass 103.7 81.3 47.9 32.4 23.4
Chippewa 144.0 100.7 62.4 41.6 30.0
Chisago 104.9 83.5 71.4 44.0 16.4
Clay 231.2 160.2 78.5 40.9 22.5
Clearwater 111.2 78.3 60.1 28.4 10.2
Cook 52.7 49.0 20.7 18.8 7.5
Cottonwood 148.6 77.4 36.1 35.2 22.0
Crow Wing 118.7 89.1 63.4 36.0 16.6
Dakota 128.6 67.9 38.9 22.6 12.6
Dodge 170.5 86.5 61.7 34.5 23.8
Douglas 121.5 93.5 61.0 43.3 20.4
Faribault 153.3 97.2 55.4 19.4 18.0
Fillmore 111.1 75.2 47.9 38.3 18.7
Freeborn 156.3 102.5 51.1 41.3 30.5
Goodhue 149.9 95.2 57.8 40.9 24.7
Grant 146.5 107.8 43.8 30.3 11.8
Hennepin 101.1 55.3 31.5 19.9 12.1
Houston 132.9 73.9 46.6 41.8 22.5
Hubbard 120.8 70.9 45.1 33.6 20.1
Isanti 112.4 73.9 40.8 31.8 14.1
Itasca 107.5 76.5 54.4 27.0 17.7
Jackson 97.5 52.8 30.9 17.9 7.0
Kanabec 85.6 61.9 40.0 24.4 14.4
Kandiyohi 121.4 75.0 58.8 38.0 25.1
Kittson 73.8 69.2 39.2 27.7 2.3
Koochiching 131.3 91.7 53.0 30.1 18.2
Lac qui Parle 107.8 75.3 57.6 45.8 31.0
Lake 114.5 64.3 40.7 22.7 11.4
Lake of the Woods 68.3 86.6 39.4 26.3 10.5
Le Sueur 98.3 54.3 40.0 23.2 13.2
Lincoln 113.9 63.1 33.3 14.0 10.5
Lyon 109.9 69.3 30.2 17.8 15.5
Mahnomen 326.9 179.8 65.4 32.7 43.6
Marshall 90.5 60.7 50.0 26.6 26.6
Martin 136.7 99.7 57.6 45.1 26.0
McLeod 140.7 101.6 68.9 31.8 23.2
Meeker 94.5 71.9 42.9 23.0 15.6
Mille Lacs 108.4 71.5 38.1 23.3 18.7
Morrison 122.3 91.4 56.5 40.1 20.0
Mower 155.3 77.3 40.1 30.8 20.7
Murray 83.8 38.3 25.1 20.4 12.0
Nicollet 122.8 84.7 49.4 26.9 12.1
Nobles 114.0 83.8 39.8 18.3 7.3
Norman 175.3 134.2 51.8 33.5 7.6
Olmsted 171.2 94.3 55.5 41.0 28.7
Otter Tail 111.4 95.0 53.1 32.8 17.4
Pennington 139.6 84.6 55.0 35.3 23.3
Pine 82.4 79.6 50.8 26.8 16.8
Pipestone 80.6 66.4 26.1 10.9 4.4
Polk 164.0 123.1 76.3 30.7 18.7
Pope 133.9 114.8 71.0 40.1 17.3
Ramsey 104.6 55.4 31.6 20.8 12.4
Red Lake 89.8 102.3 47.4 25.0 10.0
Redwood 122.0 75.7 54.1 31.3 12.4
Renville 120.9 64.5 50.3 37.4 29.2
Rice 155.1 68.0 40.9 28.3 13.5
Rock 106.2 42.5 31.9 9.6 4.2
Roseau 129.3 71.1 44.6 22.0 9.1
Scott 119.6 67.4 36.0 25.8 11.3
Sherburne 124.9 72.7 41.3 25.7 15.1
Sibley 83.8 65.0 38.9 21.5 22.8
St Louis 134.7 90.0 53.6 34.0 23.3
Stearns 160.8 89.3 49.7 32.0 16.5
Steele 151.3 90.8 54.8 39.8 27.0
Stevens 175.8 110.4 74.6 25.6 17.4
Swift 115.8 73.3 82.9 46.8 9.6
Todd 93.7 87.2 66.7 38.5 29.1
Traverse 98.9 107.9 122.9 74.9 21.0
Wabasha 119.1 86.0 52.6 26.5 21.4
Wadena 144.4 102.6 68.9 43.2 25.6
Waseca 135.0 110.1 57.4 23.4 11.7
Washington 141.7 75.4 42.8 24.9 13.9
Watonwan 175.9 101.2 75.6 40.1 17.3
Wilkin 129.3 77.3 50.4 33.1 23.6
Winona 121.9 80.6 52.7 31.9 21.4
Wright 105.8 63.6 37.4 24.6 13.3
Yellow Medicine 80.1 81.1 44.6 24.3 19.3
Statewide 125.8 75.4 43.8 27.1 15.8
Week 3: 1/16/22-1/22/22
Week 4: 1/23/22-1/29/22
Week 5: 1/30/22-2/5/22
Week 6: 2/6/22-2/12/22
Week 7: 2/13/22-2/19/22
Minnesota Department of Health Weekly COVID-19 Report: Updated 3/3/2022 with data current as of 4 a.m. the previous business day unless specifically noted. Page 15
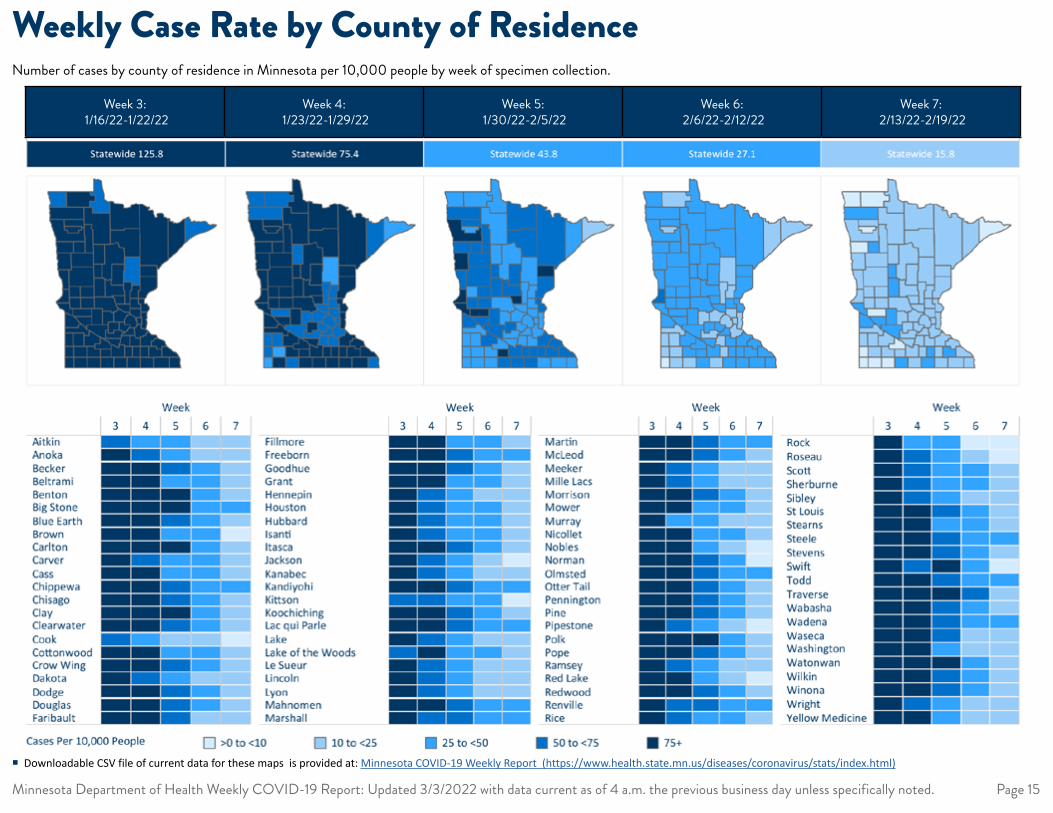
Weekly Case Rate by County of ResidenceNumber of cases by county of residence in Minnesota per 10,000 people by week of specimen collection.
� Downloadable CSV file of current data for these maps is provided at: Minnesota COVID-19 Weekly Report (https://www.health.state.mn.us/diseases/coronavirus/stats/index.html)
Minnesota Department of Health Weekly COVID-19 Report: Updated 3/3/2022 with data current as of 4 a.m. the previous business day unless specifically noted. Page 16
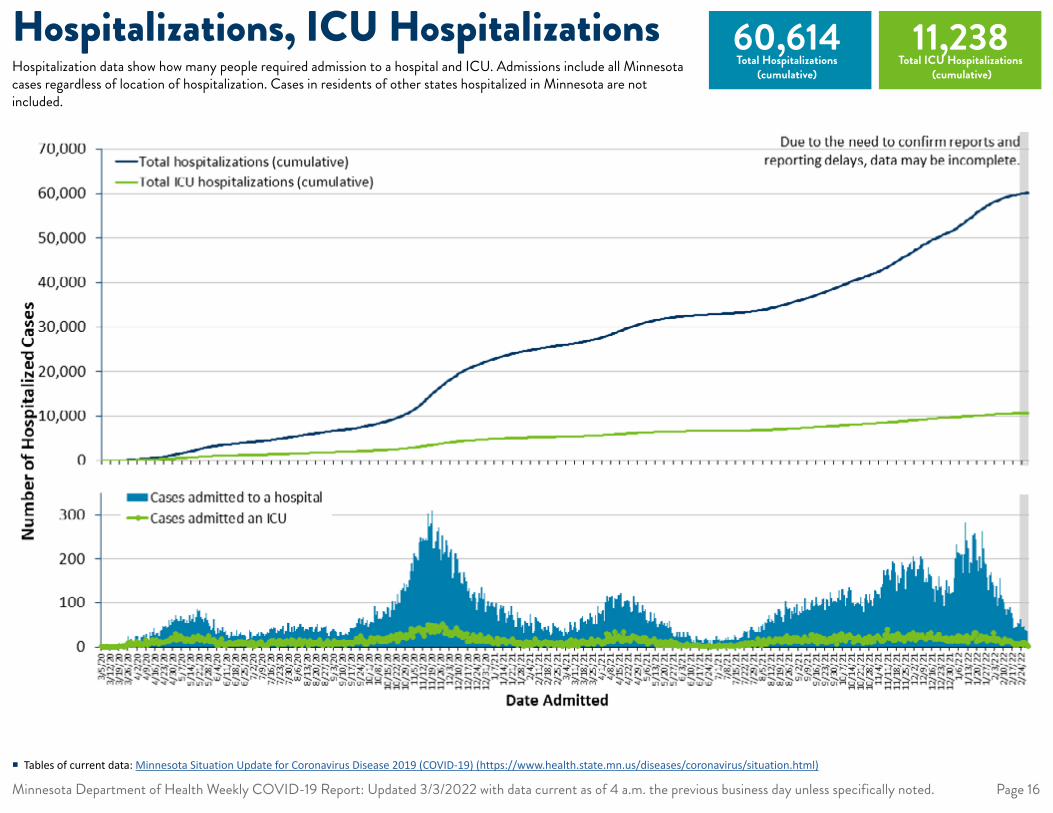
Hospitalizations, ICU Hospitalizations 60,614 Total Hospitalizations
(cumulative)
11,238 Total ICU Hospitalizations
(cumulative)
� Tables of current data: Minnesota Situation Update for Coronavirus Disease 2019 (COVID-19) (https://www.health.state.mn.us/diseases/coronavirus/situation.html)
Hospitalization data show how many people required admission to a hospital and ICU. Admissions include all Minnesota cases regardless of location of hospitalization. Cases in residents of other states hospitalized in Minnesota are not included.
May 10, 20 Jul 19, 20 Sep 27, 20 Dec 6, 20 Feb 14, 21 Apr 25, 21 Jul 4, 21 Sep 12, 21 Nov 21, 21 Jan 30, 22First Admit Date
0
100
200
Num
ber o
f Cas
es
Seven Day Moving Average of New Hospitaliza�ons
May 10, 20 Jul 19, 20 Sep 27, 20 Dec 6, 20 Feb 14, 21 Apr 25, 21 Jul 4, 21 Sep 12, 21 Nov 21, 21 Jan 30, 22Week of first_admit_date
0
500
1000
1500
Num
ber o
f Cas
es
New Hospitaliza�ons by Week of First Admission
Week
3/1-
3/7/
203/
8-3/
14/2
03/
15-3
/21/2
03/
22-3
/28/
203/
29-4
/4/2
04/
5-4/
11/20
4/12
-4/18
/20
4/19
-4/2
5/20
4/26
-5/2
/20
5/3-
5/9/
205/
10-5
/16/2
05/
17-5
/23/
205/
24-5
/30/
205/
31-6
/6/2
06/
7-6/
13/2
06/
14-6
/20/
206/
21-6
/27/
206/
28-7
/4/2
07/
5-7/
11/20
7/12
-7/18
/20
7/19
-7/2
5/20
7/26
-8/1/
208/
2-8/
8/20
8/9-
8/15
/20
8/16
-8/2
2/20
8/23
-8/3
0/20
8/31
-9/5
/20
9/6-
9/12
/20
9/13
-9/19
/20
9/20
-9/2
6/20
9/27
-10/
3/20
10/4
-10/
10/2
010
/11-1
0/17
/20
10/18
-10/2
4/20
10/2
5-10
/31/2
011/
1-11/
7/20
11/8-
11/14
/20
11/15
-11/2
1/20
11/22
-11/2
8/20
11/29
-12/
5/20
12/6
-12/
12/2
012
/13-12
/19/2
012
/20-
12/2
6/20
12/2
7-1/2
/21
1/3-1
/9/2
11/1
0-1/1
6/21
1/17-
1/23/
211/2
4-1/3
0/21
1/31-
2/6/
212/
7-2/
13/2
12/
14-2
/20/
212/
21-2
/27/
212/
28-3
/6/2
13/
7-3/
13/2
13/
14-3
/20/
213/
21-3
/27/
213/
28-4
/3/2
14/
4-4/
10/2
14/
11-4/
17/2
14/
18-4
/24/
214/
25-5
/1/21
5/2-
5/8/
215/
9-5/
15/2
15/
16-5
/22/
215/
23-5
/29/
215/
30-6
/5/2
16/
6-6/
12/2
16/
13-6
/19/2
16/
20-6
/26/
216/
27-7
/3/2
17/
4-7/
10/2
17/
11-7/
17/2
17/
18-7
/24/
217/
25-7
/31/2
18/
1-8/
7/21
8/8-
8/14
/21
8/15
-8/2
1/21
8/22
-8/2
8/21
8/29
-9/4
/21
9/5-
9/11/
219/
12-9
/18/2
19/
19-9
/25/
219/
26-1
0/2/
2110
/3-1
0/9/
2110
/10-1
0/16
/21
10/17
-10/
23/2
110
/24-
10/3
0/21
10/3
1-11/
6/21
11/7-
11/13
/21
11/14
-11/2
0/21
11/21
-11/2
7/21
11/28
-12/
4/21
12/5
-12/
11/21
12/12
-12/
18/2
112
/19-1
2/25
/21
12/2
6-1/1
/22
1/2-1
/8/2
21/9
-1/15
/22
1/16-
1/22/
221/2
3-1/2
9/22
1/30-
2/5/
222/
6-2/
12/2
22/
13-2
/19/2
22/
20-2
/26/
222/
27-3
/5/2
2
Minnesota Department of Health Weekly COVID-19 Report: Updated 3/3/2022 with data current as of 4 a.m. the previous business day unless specifically noted. Page 17
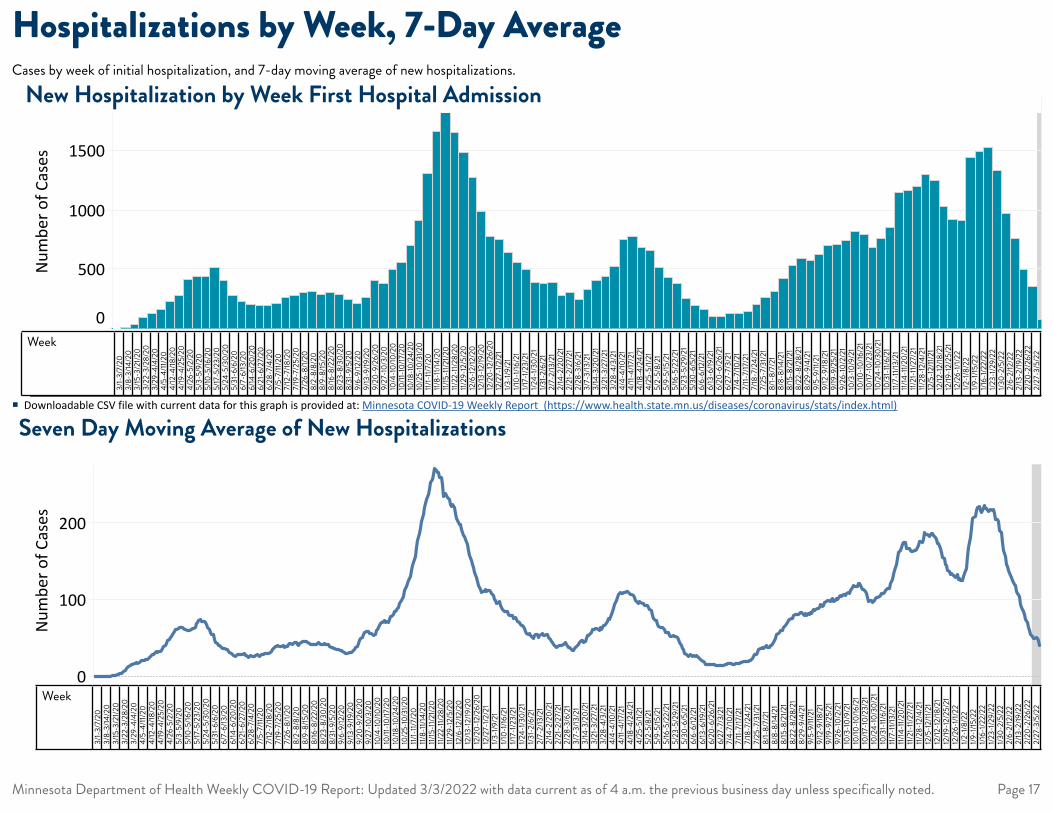
Hospitalizations by Week, 7-Day AverageCases by week of initial hospitalization, and 7-day moving average of new hospitalizations.
New Hospitalization by Week First Hospital Admission
Seven Day Moving Average of New Hospitalizations � Downloadable CSV file with current data for this graph is provided at: Minnesota COVID-19 Weekly Report (https://www.health.state.mn.us/diseases/coronavirus/stats/index.html)
May 10, 20 Jul 19, 20 Sep 27, 20 Dec 6, 20 Feb 14, 21 Apr 25, 21 Jul 4, 21 Sep 12, 21 Nov 21, 21 Jan 30, 22Week of icu_admission_date
0
100
200
300
Num
ber o
f Cas
esNew ICU Admissions by Week of ICU Admission
May 10, 20 Jul 19, 20 Sep 27, 20 Dec 6, 20 Feb 14, 21 Apr 25, 21 Jul 4, 21 Sep 12, 21 Nov 21, 21 Jan 30, 22Icu Admission Date
0
10
20
30
40
Num
ber o
f Cas
es
Seven Day Moving Average of New ICU Admissions
Week
3/1-
3/7/
203/
8-3/
14/2
03/
15-3
/21/2
03/
22-3
/28/
203/
29-4
/4/2
04/
5-4/
11/20
4/12
-4/18
/20
4/19
-4/2
5/20
4/26
-5/2
/20
5/3-
5/9/
205/
10-5
/16/2
05/
17-5
/23/
205/
24-5
/30/
205/
31-6
/6/2
06/
7-6/
13/2
06/
14-6
/20/
206/
21-6
/27/
206/
28-7
/4/2
07/
5-7/
11/20
7/12
-7/18
/20
7/19
-7/2
5/20
7/26
-8/1/
208/
2-8/
8/20
8/9-
8/15
/20
8/16
-8/2
2/20
8/23
-8/3
0/20
8/31
-9/5
/20
9/6-
9/12
/20
9/13
-9/19
/20
9/20
-9/2
6/20
9/27
-10/
3/20
10/4
-10/
10/2
010
/11-1
0/17
/20
10/18
-10/2
4/20
10/2
5-10
/31/2
011/
1-11/
7/20
11/8-
11/14
/20
11/15
-11/2
1/20
11/22
-11/2
8/20
11/29
-12/
5/20
12/6
-12/
12/2
012
/13-12
/19/2
012
/20-
12/2
6/20
12/2
7-1/2
/21
1/3-1
/9/2
11/1
0-1/1
6/21
1/17-
1/23/
211/2
4-1/3
0/21
1/31-
2/6/
212/
7-2/
13/2
12/
14-2
/20/
212/
21-2
/27/
212/
28-3
/6/2
13/
7-3/
13/2
13/
14-3
/20/
213/
21-3
/27/
213/
28-4
/3/2
14/
4-4/
10/2
14/
11-4/
17/2
14/
18-4
/24/
214/
25-5
/1/21
5/2-
5/8/
215/
9-5/
15/2
15/
16-5
/22/
215/
23-5
/29/
215/
30-6
/5/2
16/
6-6/
12/2
16/
13-6
/19/2
16/
20-6
/26/
216/
27-7
/3/2
17/
4-7/
10/2
17/
11-7/
17/2
17/
18-7
/24/
217/
25-7
/31/2
18/
1-8/
7/21
8/8-
8/14
/21
8/15
-8/2
1/21
8/22
-8/2
8/21
8/29
-9/4
/21
9/5-
9/11/
219/
12-9
/18/2
19/
19-9
/25/
219/
26-1
0/2/
2110
/3-1
0/9/
2110
/10-1
0/16
/21
10/17
-10/
23/2
110
/24-
10/3
0/21
10/3
1-11/
6/21
11/7-
11/13
/21
11/14
-11/2
0/21
11/21
-11/2
7/21
11/28
-12/
4/21
12/5
-12/
11/21
12/12
-12/
18/2
112
/19-1
2/25
/21
12/2
6-1/1
/22
1/2-1
/8/2
21/9
-1/15
/22
1/16-
1/22/
221/2
3-1/2
9/22
1/30-
2/5/
222/
6-2/
12/2
22/
13-2
/19/2
22/
20-2
/26/
222/
27-3
/5/2
2
Minnesota Department of Health Weekly COVID-19 Report: Updated 3/3/2022 with data current as of 4 a.m. the previous business day unless specifically noted. Page 18
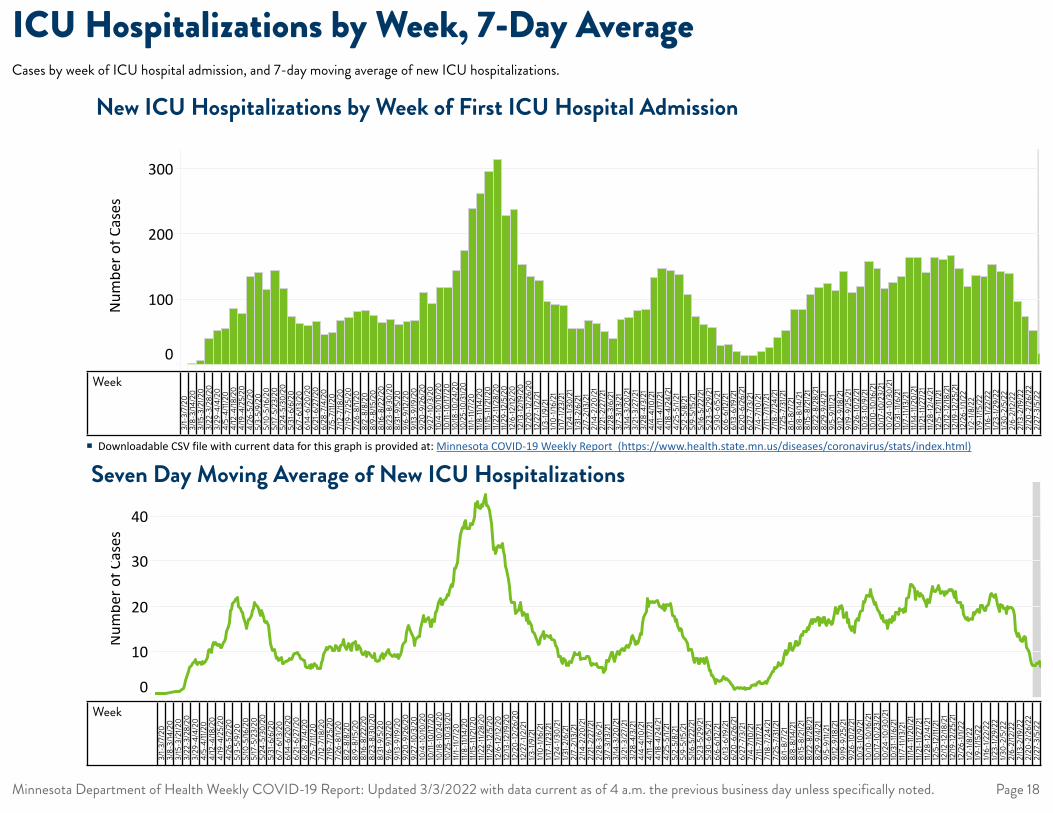
ICU Hospitalizations by Week, 7-Day AverageCases by week of ICU hospital admission, and 7-day moving average of new ICU hospitalizations.
New ICU Hospitalizations by Week of First ICU Hospital Admission
Seven Day Moving Average of New ICU Hospitalizations � Downloadable CSV file with current data for this graph is provided at: Minnesota COVID-19 Weekly Report (https://www.health.state.mn.us/diseases/coronavirus/stats/index.html)
Minnesota Department of Health Weekly COVID-19 Report: Updated 3/3/2022 with data current as of 4 a.m. the previous business day unless specifically noted. Page 19
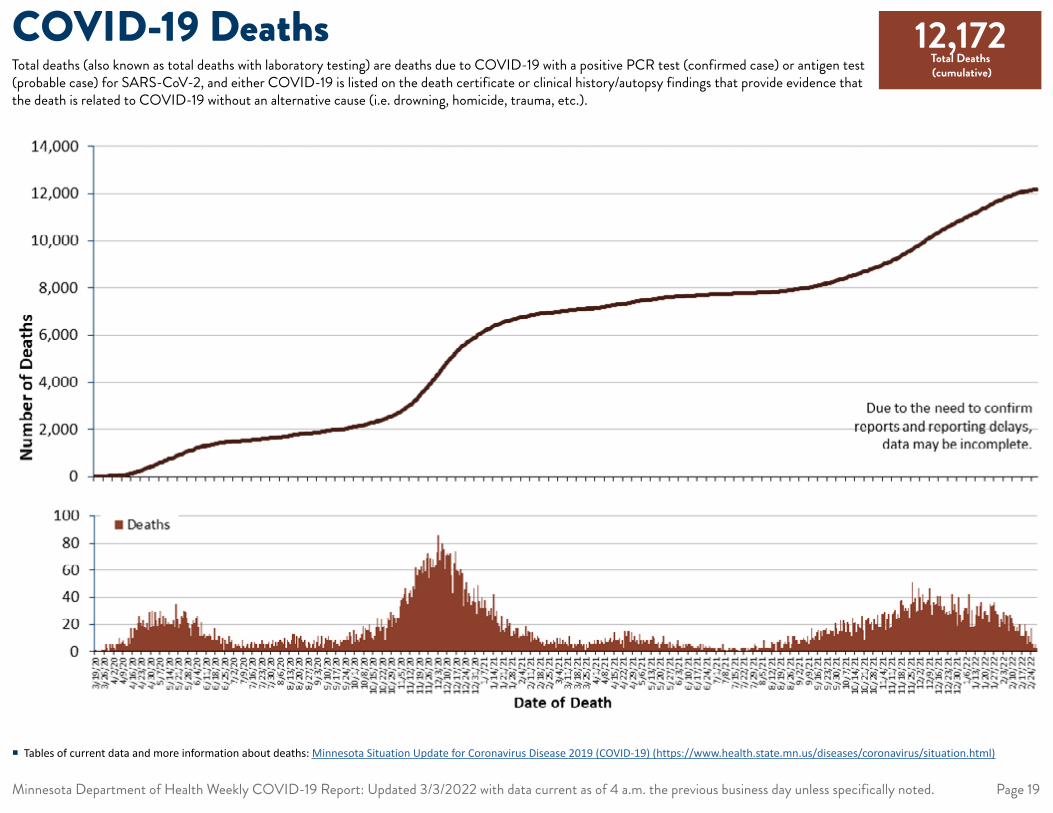
COVID-19 Deaths 12,172 Total Deaths (cumulative)
� Tables of current data and more information about deaths: Minnesota Situation Update for Coronavirus Disease 2019 (COVID-19) (https://www.health.state.mn.us/diseases/coronavirus/situation.html)
Total deaths (also known as total deaths with laboratory testing) are deaths due to COVID-19 with a positive PCR test (confirmed case) or antigen test (probable case) for SARS-CoV-2, and either COVID-19 is listed on the death certificate or clinical history/autopsy findings that provide evidence that the death is related to COVID-19 without an alternative cause (i.e. drowning, homicide, trauma, etc.).
May 10, 20 Jul 19, 20 Sep 27, 20 Dec 6, 20 Feb 14, 21 Apr 25, 21 Jul 4, 21 Sep 12, 21 Nov 21, 21 Jan 30, 22Week of DEATH_DATE
0
100
200
300
400
500
Num
ber o
f Dea
ths
New Deaths by Week of Death
May 10, 20 Jul 19, 20 Sep 27, 20 Dec 6, 20 Feb 14, 21 Apr 25, 21 Jul 4, 21 Sep 12, 21 Nov 21, 21 Jan 30, 22Death Date
0
20
40
60
Num
ber o
f Dea
ths
Seven Day Moving Average of New Deaths
Week
3/1-
3/7/
203/
8-3/
14/2
03/
15-3
/21/2
03/
22-3
/28/
203/
29-4
/4/2
04/
5-4/
11/20
4/12
-4/18
/20
4/19
-4/2
5/20
4/26
-5/2
/20
5/3-
5/9/
205/
10-5
/16/2
05/
17-5
/23/
205/
24-5
/30/
205/
31-6
/6/2
06/
7-6/
13/2
06/
14-6
/20/
206/
21-6
/27/
206/
28-7
/4/2
07/
5-7/
11/20
7/12
-7/18
/20
7/19
-7/2
5/20
7/26
-8/1/
208/
2-8/
8/20
8/9-
8/15
/20
8/16
-8/2
2/20
8/23
-8/3
0/20
8/31
-9/5
/20
9/6-
9/12
/20
9/13
-9/19
/20
9/20
-9/2
6/20
9/27
-10/
3/20
10/4
-10/
10/2
010
/11-1
0/17
/20
10/18
-10/2
4/20
10/2
5-10
/31/2
011/
1-11/
7/20
11/8-
11/14
/20
11/15
-11/2
1/20
11/22
-11/2
8/20
11/29
-12/
5/20
12/6
-12/
12/2
012
/13-12
/19/2
012
/20-
12/2
6/20
12/2
7-1/2
/21
1/3-1
/9/2
11/1
0-1/1
6/21
1/17-
1/23/
211/2
4-1/3
0/21
1/31-
2/6/
212/
7-2/
13/2
12/
14-2
/20/
212/
21-2
/27/
212/
28-3
/6/2
13/
7-3/
13/2
13/
14-3
/20/
213/
21-3
/27/
213/
28-4
/3/2
14/
4-4/
10/2
14/
11-4/
17/2
14/
18-4
/24/
214/
25-5
/1/21
5/2-
5/8/
215/
9-5/
15/2
15/
16-5
/22/
215/
23-5
/29/
215/
30-6
/5/2
16/
6-6/
12/2
16/
13-6
/19/2
16/
20-6
/26/
216/
27-7
/3/2
17/
4-7/
10/2
17/
11-7/
17/2
17/
18-7
/24/
217/
25-7
/31/2
18/
1-8/
7/21
8/8-
8/14
/21
8/15
-8/2
1/21
8/22
-8/2
8/21
8/29
-9/4
/21
9/5-
9/11/
219/
12-9
/18/2
19/
19-9
/25/
219/
26-1
0/2/
2110
/3-1
0/9/
2110
/10-1
0/16
/21
10/17
-10/
23/2
110
/24-
10/3
0/21
10/3
1-11/
6/21
11/7-
11/13
/21
11/14
-11/2
0/21
11/21
-11/2
7/21
11/28
-12/
4/21
12/5
-12/
11/21
12/12
-12/
18/2
112
/19-1
2/25
/21
12/2
6-1/1
/22
1/2-1
/8/2
21/9
-1/15
/22
1/16-
1/22/
221/2
3-1/2
9/22
1/30-
2/5/
222/
6-2/
12/2
22/
13-2
/19/2
22/
20-2
/26/
222/
27-3
/5/2
2
Week
3/1-
3/7/
203/
8-3/
14/2
03/
15-3
/21/2
03/
22-3
/28/
203/
29-4
/4/2
04/
5-4/
11/20
4/12
-4/18
/20
4/19
-4/2
5/20
4/26
-5/2
/20
5/3-
5/9/
205/
10-5
/16/2
05/
17-5
/23/
205/
24-5
/30/
205/
31-6
/6/2
06/
7-6/
13/2
06/
14-6
/20/
206/
21-6
/27/
206/
28-7
/4/2
07/
5-7/
11/20
7/12
-7/18
/20
7/19
-7/2
5/20
7/26
-8/1/
208/
2-8/
8/20
8/9-
8/15
/20
8/16
-8/2
2/20
8/23
-8/3
0/20
8/31
-9/5
/20
9/6-
9/12
/20
9/13
-9/19
/20
9/20
-9/2
6/20
9/27
-10/
3/20
10/4
-10/
10/2
010
/11-1
0/17
/20
10/18
-10/2
4/20
10/2
5-10
/31/2
011/
1-11/
7/20
11/8-
11/14
/20
11/15
-11/2
1/20
11/22
-11/2
8/20
11/29
-12/
5/20
12/6
-12/
12/2
012
/13-12
/19/2
012
/20-
12/2
6/20
12/2
7-1/2
/21
1/3-1
/9/2
11/1
0-1/1
6/21
1/17-
1/23/
211/2
4-1/3
0/21
1/31-
2/6/
212/
7-2/
13/2
12/
14-2
/20/
212/
21-2
/27/
212/
28-3
/6/2
13/
7-3/
13/2
13/
14-3
/20/
213/
21-3
/27/
213/
28-4
/3/2
14/
4-4/
10/2
14/
11-4/
17/2
14/
18-4
/24/
214/
25-5
/1/21
5/2-
5/8/
215/
9-5/
15/2
15/
16-5
/22/
215/
23-5
/29/
215/
30-6
/5/2
16/
6-6/
12/2
16/
13-6
/19/2
16/
20-6
/26/
216/
27-7
/3/2
17/
4-7/
10/2
17/
11/7/
17/2
17/
18-7
/24/
217/
25-7
/31/2
18/
1-8/
7/21
8/8-
8/14
/21
8/15
-8/2
1/21
8/22
-8/2
8/21
8/29
-9/4
/21
9/5-
9/11/
219/
12-9
/18/2
19/
19-9
/25/
219/
26-1
0/2/
2110
/3-1
0/9/
2110
/10-1
0/16
/21
10/17
-10/
23/2
110
/24-
10/3
0/21
10/3
1-11/
6/21
11/7-
11/13
/21
11/14
-11/2
0/21
11/21
-11/2
7/21
11/28
-12/
4/21
12/5
-12/
11/21
12/12
-12/
18/2
112
/19-1
2/25
/21
12/2
6-1/1
/22
1/2-1
/8/2
21/9
-1/15
/22
1/16-
1/22/
21/2
3-1/2
9/22
1/30-
2/5/
222/
6-2/
12/2
22/
13-2
/19/2
22/
20-2
/26/
222/
27-3
/5/2
2
Minnesota Department of Health Weekly COVID-19 Report: Updated 3/3/2022 with data current as of 4 a.m. the previous business day unless specifically noted. Page 20
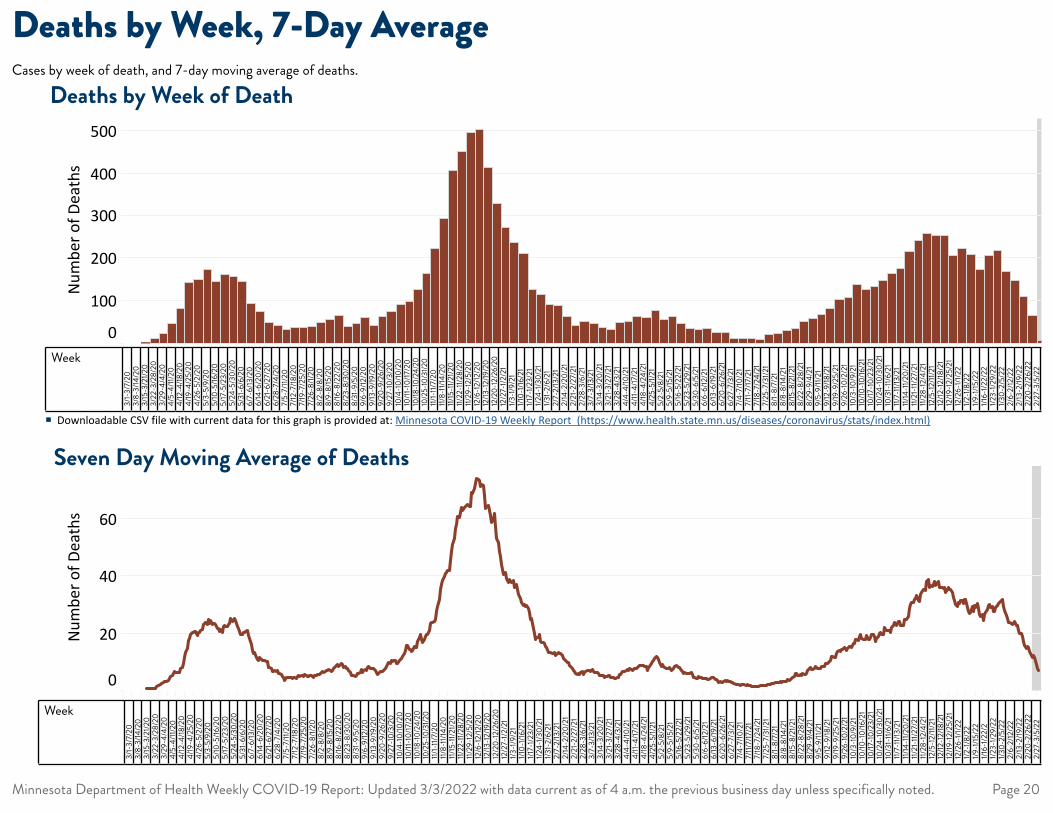
Deaths by Week, 7-Day AverageCases by week of death, and 7-day moving average of deaths.
Deaths by Week of Death
Seven Day Moving Average of Deaths � Downloadable CSV file with current data for this graph is provided at: Minnesota COVID-19 Weekly Report (https://www.health.state.mn.us/diseases/coronavirus/stats/index.html)
Minnesota Department of Health Weekly COVID-19 Report: Updated 3/3/2022 with data current as of 4 a.m. the previous business day unless specifically noted. Page 21
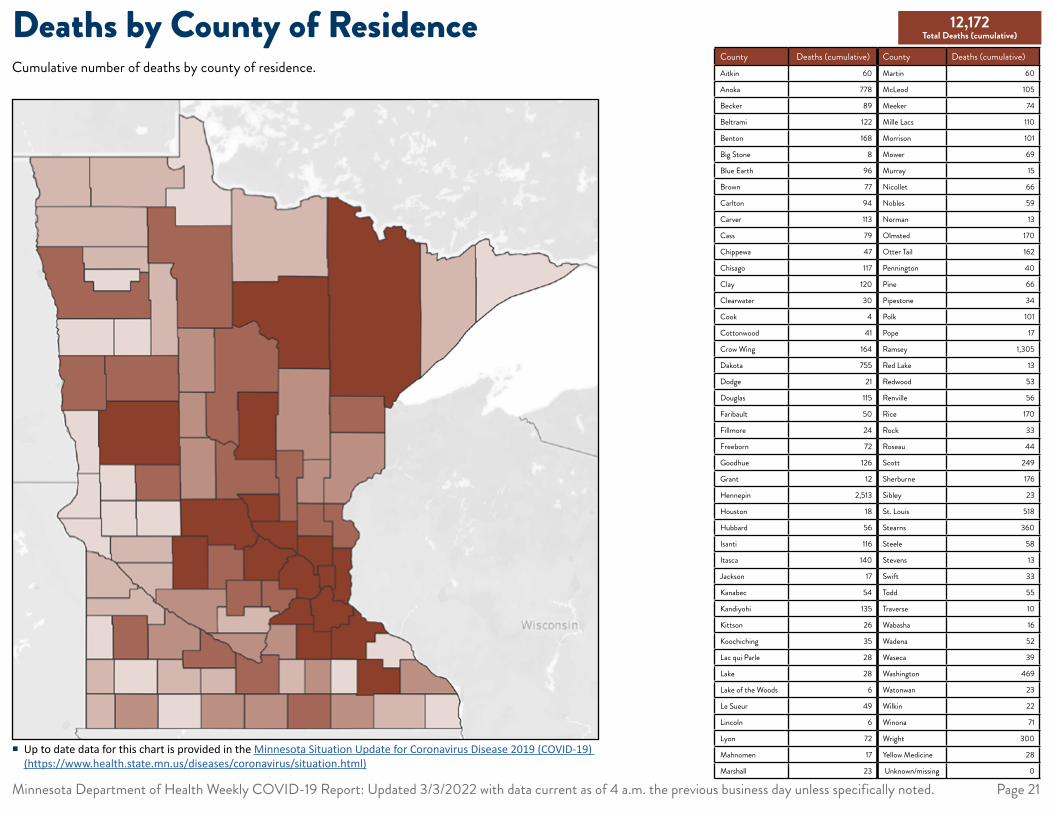
Deaths by County of Residence Cumulative number of deaths by county of residence.
12,172 Total Deaths (cumulative)
County Deaths (cumulative) County Deaths (cumulative)Aitkin 60 Martin 60
Anoka 778 McLeod 105
Becker 89 Meeker 74
Beltrami 122 Mille Lacs 110
Benton 168 Morrison 101
Big Stone 8 Mower 69
Blue Earth 96 Murray 15
Brown 77 Nicollet 66
Carlton 94 Nobles 59
Carver 113 Norman 13
Cass 79 Olmsted 170
Chippewa 47 Otter Tail 162
Chisago 117 Pennington 40
Clay 120 Pine 66
Clearwater 30 Pipestone 34
Cook 4 Polk 101
Cottonwood 41 Pope 17
Crow Wing 164 Ramsey 1,305
Dakota 755 Red Lake 13
Dodge 21 Redwood 53
Douglas 115 Renville 56
Faribault 50 Rice 170
Fillmore 24 Rock 33
Freeborn 72 Roseau 44
Goodhue 126 Scott 249
Grant 12 Sherburne 176
Hennepin 2,513 Sibley 23
Houston 18 St. Louis 518
Hubbard 56 Stearns 360
Isanti 116 Steele 58
Itasca 140 Stevens 13
Jackson 17 Swift 33
Kanabec 54 Todd 55
Kandiyohi 135 Traverse 10
Kittson 26 Wabasha 16
Koochiching 35 Wadena 52
Lac qui Parle 28 Waseca 39
Lake 28 Washington 469
Lake of the Woods 6 Watonwan 23
Le Sueur 49 Wilkin 22
Lincoln 6 Winona 71
Lyon 72 Wright 300
Mahnomen 17 Yellow Medicine 28
Marshall 23 Unknown/missing 0
� Up to date data for this chart is provided in the Minnesota Situation Update for Coronavirus Disease 2019 (COVID-19) (https://www.health.state.mn.us/diseases/coronavirus/situation.html)
0-4 5-9 10-14 15-19 20-24 25-29 30-34 35-39 40-44 45-49 50-54 55-59 60-64 65-69 70-74 75-79 80-84 85-89 90-94 95-99 100+ Miss..
0%
2%
4%
6%
8%
10%
12%
14%
16%
Perc
ent o
f Cas
es
Age
Propor�on of CasesPropor�on of Hospitaliza�onsPropor�on of ICU AdmissionsPropor�on of Deaths
Perc
ent o
f Cas
es
Minnesota Department of Health Weekly COVID-19 Report: Updated 3/3/2022 with data current as of 4 a.m. the previous business day unless specifically noted. Page 22
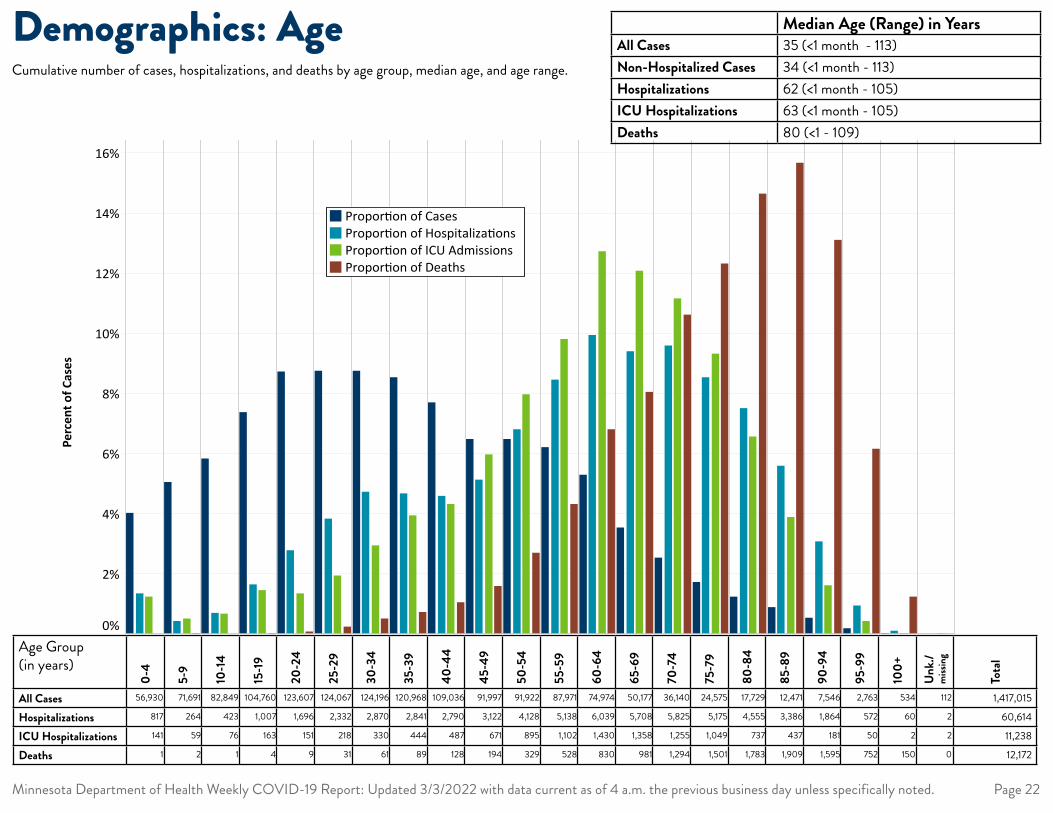
Demographics: AgeCumulative number of cases, hospitalizations, and deaths by age group, median age, and age range.
Median Age (Range) in YearsAll Cases 35 (<1 month - 113)Non-Hospitalized Cases 34 (<1 month - 113)Hospitalizations 62 (<1 month - 105)ICU Hospitalizations 63 (<1 month - 105)Deaths 80 (<1 - 109)
Age Group (in years)
0-4
5-9
10-1
4
15-1
9
20-2
4
25-2
9
30-3
4
35-3
9
40-4
4
45-4
9
50-5
4
55-5
9
60-6
4
65-6
9
70-7
4
75-7
9
80-8
4
85-8
9
90-9
4
95-9
9
100+
Unk.
/ m
issin
g
Tota
l
All Cases 56,930 71,691 82,849 104,760 123,607 124,067 124,196 120,968 109,036 91,997 91,922 87,971 74,974 50,177 36,140 24,575 17,729 12,471 7,546 2,763 534 112 1,417,015
Hospitalizations 817 264 423 1,007 1,696 2,332 2,870 2,841 2,790 3,122 4,128 5,138 6,039 5,708 5,825 5,175 4,555 3,386 1,864 572 60 2 60,614
ICU Hospitalizations 141 59 76 163 151 218 330 444 487 671 895 1,102 1,430 1,358 1,255 1,049 737 437 181 50 2 2 11,238
Deaths 1 2 1 4 9 31 61 89 128 194 329 528 830 981 1,294 1,501 1,783 1,909 1,595 752 150 0 12,172
data for this graphic can be found at https://www.health.state.mn.us/diseases/coronavirus/stats/#wagscd1
Mar 1, 20 Aug 30, 20 Feb 28, 21 Aug 29, 21 Feb 27, 22Week of specimen_date
0K
10K
20K
30K
40K
50K
60K
70K
80K
90K
Num
ber o
f Cas
es
0%
10%
20%
30%
40%
50%
60%
70%
Perc
ent o
f Cas
es B
elow
40
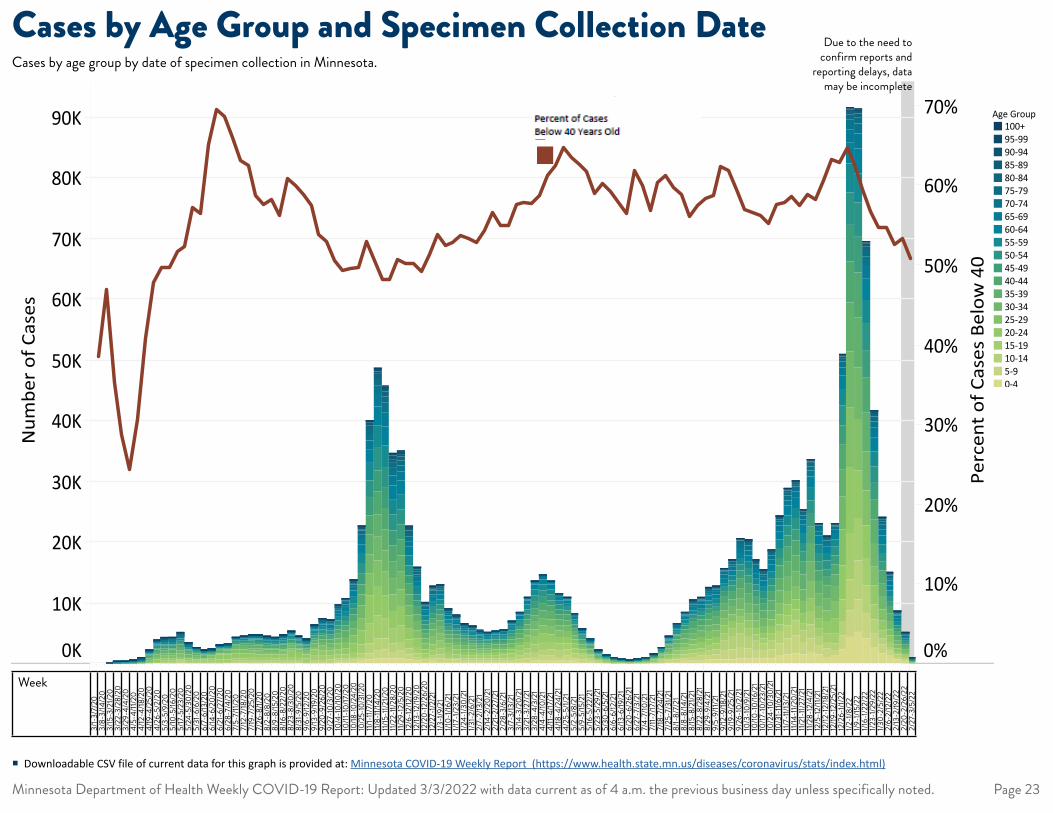
Cases Over Time by Age Group Age Group (5 yr in..100+95-9990-9485-8980-8475-7970-7465-6960-6455-5950-5445-4940-4435-3930-3425-2920-2415-1910-145-90-4
Percent of CasesBelow 40 Years Old
Mar 1, 20 Aug 30, 20 Feb 28, 21 Aug 29, 21 Feb 27, 22Week of specimen_date
0K
10K
20K
30K
40K
50K
60K
70K
80K
90K
Num
ber o
f Cas
es
0%
10%
20%
30%
40%
50%
60%
70%
Perc
ent o
f Cas
es B
elow
40
Cases Over Time by Age Group Age Group (5 yr in..100+95-9990-9485-8980-8475-7970-7465-6960-6455-5950-5445-4940-4435-3930-3425-2920-2415-1910-145-90-4
Percent of CasesBelow 40 Years Old
Week
3/1-
3/7/
203/
8-3/
14/2
03/
15-3
/21/2
03/
22-3
/28/
203/
29-4
/4/2
04/
5-4/
11/20
4/12
-4/18
/20
4/19
-4/2
5/20
4/26
-5/2
/20
5/3-
5/9/
205/
10-5
/16/2
05/
17-5
/23/
205/
24-5
/30/
205/
31-6
/6/2
06/
7-6/
13/2
06/
14-6
/20/
206/
21-6
/27/
206/
28-7
/4/2
07/
5-7/
11/20
7/12
-7/18
/20
7/19
-7/2
5/20
7/26
-8/1/
208/
2-8/
8/20
8/9-
8/15
/20
8/16
-8/2
2/20
8/23
-8/3
0/20
8/31
-9/5
/20
9/6-
9/12
/20
9/13
-9/19
/20
9/20
-9/2
6/20
9/27
-10/
3/20
10/4
-10/
10/2
010
/11-1
0/17
/20
10/18
-10/2
4/20
10/2
5-10
/31/2
011/
1-11/
7/20
11/8-
11/14
/20
11/15
-11/2
1/20
11/22
-11/2
8/20
11/29
-12/
5/20
12/6
-12/
12/2
012
/13-12
/19/2
012
/20-
12/2
6/20
12/2
7-1/2
/21
1/3-1
/9/2
11/1
0-1/1
6/21
1/17-
1/23/
211/2
4-1/3
0/21
1/31-
2/6/
212/
7-2/
13/2
12/
14-2
/20/
212/
21-2
/27/
212/
28-3
/6/2
13/
7-3/
13/2
13/
14-3
/20/
213/
21-3
/27/
213/
28-4
/3/2
14/
4-4/
10/2
14/
11-4/
17/2
14/
18-4
/24/
214/
25-5
/1/21
5/2-
5/8/
215/
9-5/
15/2
15/
16-5
/22/
215/
23-5
/29/
215/
30-6
/5/2
16/
6-6/
12/2
16/
13-6
/19/2
16/
20-6
/26/
216/
27-7
/3/2
17/
4-7/
10/2
17/
11-7/
17/2
17/
18-7
/24/
217/
25-7
/31/2
18/
1-8/
7/21
8/8-
8/14
/21
8/15
-8/2
1/21
8/22
-8/2
8/21
8/29
-9/4
/21
9/5-
9/11/
219/
12-9
/18/2
19/
19-9
/25/
219/
26-1
0/2/
2110
/3-1
0/9/
2110
/10-1
0/16
/21
10/17
-10/
23/2
110
/24-
10/3
0/21
10/3
1-11/
6/21
11/7-
11/13
/21
11/14
-11/2
0/21
11/21
-11/2
7/21
11/28
-12/
4/21
12/5
-12/
11/21
12/12
-12/
18/2
112
/19-1
2/25
/21
12/2
6-1/1
/22
1/2-1
/8/2
21/9
-1/15
/22
1/16-
1/22/
221/2
3-1/2
9/22
1/30-
2/5/
222/
6-2/
12/2
22/
13-2
/19/2
22/
20-2
/26/
222/
27-3
/5/2
2
Minnesota Department of Health Weekly COVID-19 Report: Updated 3/3/2022 with data current as of 4 a.m. the previous business day unless specifically noted. Page 23
Cases by Age Group and Specimen Collection DateCases by age group by date of specimen collection in Minnesota.
Due to the need to confirm reports and
reporting delays, data may be incomplete
� Downloadable CSV file of current data for this graph is provided at: Minnesota COVID-19 Weekly Report (https://www.health.state.mn.us/diseases/coronavirus/stats/index.html)
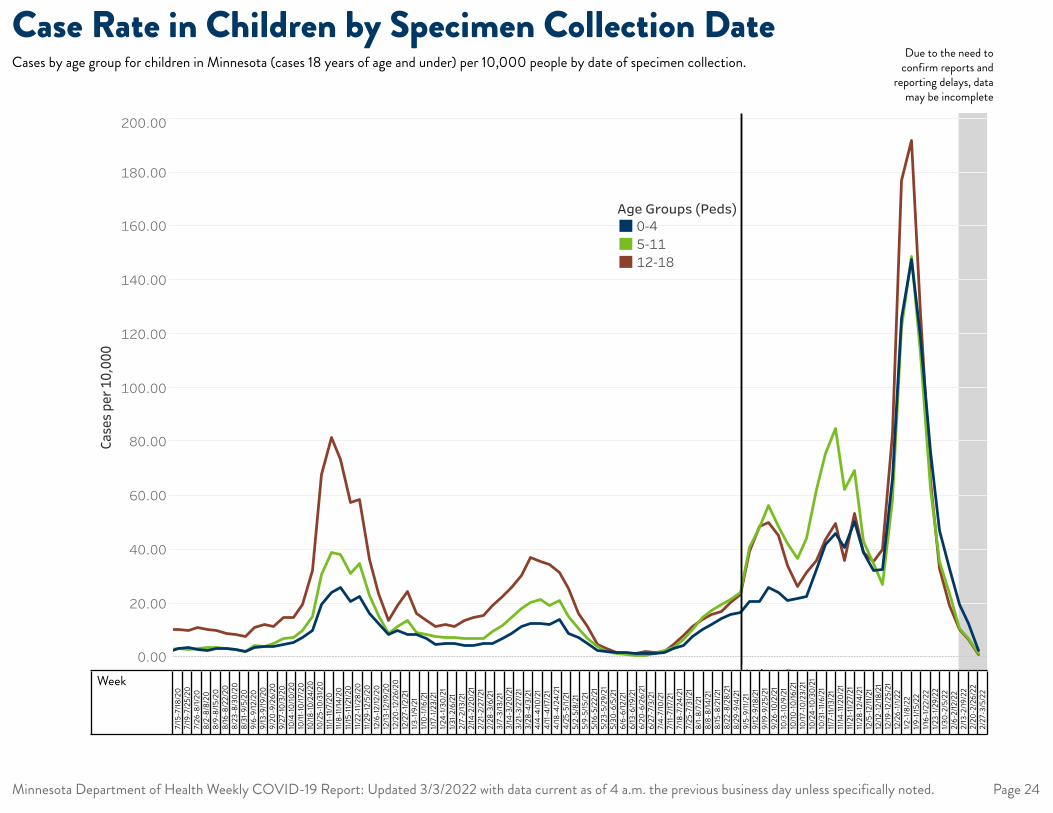
WEEK(specimen_date) Age Groups (Peds) AGG(Cases per 10,000 Age group) SUM(Number of Records)
WEEK(specimen_date) Age Groups (Peds) SUM(Number of Records) AGG(Cases per 10,000 Age group) 83,304 82,022 82,174 80,837 74,151 64,183 65,166 63,311 54,625 36,531 26,791 18,507 13,759 9,821 6,145 2,263 430 38 975,447
12-18 1 0.019740686 1,234 1,761 2,175 2,177 2,270 2,608 3,411 4,229 4,883 4,650 4,814 4,272 3,804 2,844 1,573 485 47 2 48,963
March 8, 2020 12-18 1 0.019740686 122 196 284 375 414 568 763 932 1,204 1,156 1,094 907 656 392 170 47 2 2 9,620
March 15, 2020 12-18 2 0.039481373 9 18 45 58 82 141 244 369 613 765 1,045 1,236 1,548 1,646 1,422 678 131 0 10,057
March 22, 2020 12-18 4 0.078962745
March 29, 2020 12-18 6 0.118444118
April 5, 2020 12-18 10 0.197406863
April 12, 2020 12-18 19 0.375073041
April 19, 2020 12-18 50 0.987034317
April 26, 2020 12-18 126 2.487326479
May 3, 2020 12-18 192 3.790211778
May 10, 2020 12-18 209 4.125803446
May 17, 2020 12-18 265 5.231281881
May 24, 2020 12-18 208 4.10606276
May 31, 2020 12-18 154 3.040065697
June 7, 2020 12-18 151 2.980843638
June 14, 2020 12-18 168 3.316435306
June 21, 2020 12-18 252 4.974652959
June 28, 2020 12-18 386 7.619904929
July 5, 2020 12-18 520 10.2651569
July 12, 2020 12-18 519 10.24541621
July 19, 2020 12-18 517 10.20593484
July 26, 2020 12-18 505 9.969046604
August 2, 2020 12-18 555 10.95608092
August 9, 2020 12-18 519 10.24541621
August 16, 2020 12-18 499 9.850602486
August 23, 2020 12-18 454 8.9622716
August 30, 2020 12-18 426 8.409532383
September 6, 2020 12-18 400 7.896274538
September 13, 2020 12-18 562 11.09426573
September 20, 2020 12-18 614 12.12078142
September 27, 2020 12-18 587 11.58778288
October 4, 2020 12-18 754 14.8844775
October 11, 2020 12-18 754 14.8844775
October 18, 2020 12-18 997 19.68146429
October 25, 2020 12-18 1628 32.13783737
November 1, 2020 12-18 3435 67.80925759
November 8, 2020 12-18 4140 81.72644146
November 15, 2020 12-18 3722 73.47483457
November 22, 2020 12-18 2920 57.64280413
November 29, 2020 12-18 2975 58.72854187
December 6, 2020 12-18 1843 36.38208493
December 13, 2020 12-18 1204 23.76778636
December 20, 2020 12-18 688 13.5815922
December 27, 2020 12-18 972 19.18794713
January 3, 2021 12-18 1236 24.39948832
January 10, 2021 12-18 823 16.24658486
January 17, 2021 12-18 685 13.52237015
January 24, 2021 12-18 572 11.29167259
January 31, 2021 12-18 611 12.06155936
February 7, 2021 12-18 578 11.41011671
February 14, 2021 12-18 687 13.56185152
February 21, 2021 12-18 741 14.62784858
February 28, 2021 12-18 783 15.45695741
March 7, 2021 12-18 974 19.2274285
March 14, 2021 12-18 1136 22.42541969
March 21, 2021 12-18 1321 26.07744666
March 28, 2021 12-18 1533 30.26247217
April 4, 2021 12-18 1870 36.91508346
April 11, 2021 12-18 1811 35.75038297
April 18, 2021 12-18 1741 34.36853493
April 25, 2021 12-18 1601 31.60483884
May 2, 2021 12-18 1301 25.68263293
May 9, 2021 12-18 819 16.16762212
May 16, 2021 12-18 571 11.2719319
May 23, 2021 12-18 238 4.69828335
May 30, 2021 12-18 164 3.23747256
June 6, 2021 12-18 96 1.895105889
June 13, 2021 12-18 77 1.520032849
June 20, 2021 12-18 69 1.362107358
June 27, 2021 12-18 100 1.974068634
July 4, 2021 12-18 95 1.875365203
July 11, 2021 12-18 114 2.250438243
July 18, 2021 12-18 236 4.658801977
July 25, 2021 12-18 402 7.93575591
WEEK(specimen_date) Age Groups (Peds) AGG(Cases per 10,000 Age group) SUM(Number of Records)
August 1, 2021 12-18 580 11.44959808
August 8, 2021 12-18 719 14.19355348
August 15, 2021 12-18 807 15.93073388
August 22, 2021 12-18 854 16.85854614
August 29, 2021 12-18 1030 20.33290693
September 5, 2021 12-18 1184 23.37297263
September 12, 2021 12-18 1992 39.3234472
September 19, 2021 12-18 2458 48.52260703
September 26, 2021 12-18 2533 50.00315851
October 3, 2021 12-18 2299 45.38383791
October 10, 2021 12-18 1726 34.07242463
October 17, 2021 12-18 1327 26.19589078
October 24, 2021 12-18 1600 31.58509815
October 31, 2021 12-18 1818 35.88856777
November 7, 2021 12-18 2221 43.84406437
November 14, 2021 12-18 2513 49.60834478
November 21, 2021 12-18 1816 35.8490864
November 28, 2021 12-18 2695 53.2011497
December 5, 2021 12-18 1966 38.81018935
December 12, 2021 12-18 1795 35.43453199
December 19, 2021 12-18 2027 40.01437122
December 26, 2021 12-18 4210 83.10828951
January 2, 2022 12-18 8957 176.8173276
January 9, 2022 12-18 9711 191.7018051
January 16, 2022 12-18 6457 127.4656117
January 23, 2022 12-18 3318 65.49959729
January 30, 2022 12-18 1676 33.08539031
February 6, 2022 12-18 965 19.04976232
February 13, 2022 12-18 516 10.18619415
February 20, 2022 12-18 75 1.480551476
5-11 1 0.019555197
March 8, 2020 5-11 1 0.019555197
March 22, 2020 5-11 3 0.058665592
March 29, 2020 5-11 1 0.019555197
April 5, 2020 5-11 5 0.097775987
April 12, 2020 5-11 2 0.039110395
April 19, 2020 5-11 17 0.332438357
April 26, 2020 5-11 45 0.879983887
May 3, 2020 5-11 72 1.407974218
May 10, 2020 5-11 97 1.896854155
May 17, 2020 5-11 128 2.503065277
May 24, 2020 5-11 90 1.759967773
May 31, 2020 5-11 80 1.564415798
June 7, 2020 5-11 70 1.368863823
June 14, 2020 5-11 92 1.799078168
June 21, 2020 5-11 95 1.85774376
June 28, 2020 5-11 78 1.525305403
July 5, 2020 5-11 143 2.796393239
July 12, 2020 5-11 139 2.718172449
July 19, 2020 5-11 174 3.402604361
July 26, 2020 5-11 149 2.913724424
August 2, 2020 5-11 167 3.265717979
August 9, 2020 5-11 185 3.617711533
August 16, 2020 5-11 180 3.519935546
August 23, 2020 5-11 173 3.383049164
August 30, 2020 5-11 146 2.855058832
September 6, 2020 5-11 116 2.268402907
September 13, 2020 5-11 225 4.399919433
September 20, 2020 5-11 204 3.989260286
September 27, 2020 5-11 256 5.006130554
October 4, 2020 5-11 355 6.942095105
October 11, 2020 5-11 382 7.470085437
October 18, 2020 5-11 513 10.03181631
October 25, 2020 5-11 779 15.23349884
November 1, 2020 5-11 1578 30.85810162
November 8, 2020 5-11 1989 38.89528778
November 15, 2020 5-11 1943 37.9957487
November 22, 2020 5-11 1584 30.97543281
November 29, 2020 5-11 1782 34.84736191
December 6, 2020 5-11 1170 22.87958105
December 13, 2020 5-11 786 15.37038522
December 20, 2020 5-11 443 8.662952483
December 27, 2020 5-11 577 11.28334894
January 3, 2021 5-11 698 13.64952784
January 10, 2021 5-11 467 9.132277222
WEEK(specimen_date) Age Groups (Peds) AGG(Cases per 10,000 Age group) SUM(Number of Records)
January 17, 2021 5-11 429 8.389179718
January 24, 2021 5-11 392 7.665637411
January 31, 2021 5-11 378 7.391864647
February 7, 2021 5-11 374 7.313643857
February 14, 2021 5-11 350 6.844319117
February 21, 2021 5-11 351 6.863874315
February 28, 2021 5-11 357 6.9812055
March 7, 2021 5-11 487 9.523381172
March 14, 2021 5-11 610 11.92867046
March 21, 2021 5-11 765 14.95972607
March 28, 2021 5-11 923 18.04944727
April 4, 2021 5-11 1043 20.39607097
April 11, 2021 5-11 1100 21.51071723
April 18, 2021 5-11 985 19.26186952
April 25, 2021 5-11 1082 21.15872367
May 2, 2021 5-11 773 15.11616765
May 9, 2021 5-11 549 10.73580342
May 16, 2021 5-11 357 6.9812055
May 23, 2021 5-11 200 3.911039496
May 30, 2021 5-11 113 2.209737315
June 6, 2021 5-11 67 1.310198231
June 13, 2021 5-11 62 1.212422244
June 20, 2021 5-11 41 0.801763097
June 27, 2021 5-11 40 0.782207899
July 4, 2021 5-11 75 1.466639811
July 11, 2021 5-11 121 2.366178895
July 18, 2021 5-11 190 3.715487521
July 25, 2021 5-11 343 6.707432735
August 1, 2021 5-11 519 10.14914749
August 8, 2021 5-11 754 14.7446189
August 15, 2021 5-11 881 17.22812898
August 22, 2021 5-11 1010 19.75074945
August 29, 2021 5-11 1090 21.31516525
September 5, 2021 5-11 1238 24.20933448
September 12, 2021 5-11 2083 40.73347635
September 19, 2021 5-11 2458 48.0666754
September 26, 2021 5-11 2874 56.20163755
October 3, 2021 5-11 2484 48.57511054
October 10, 2021 5-11 2161 42.25878175
October 17, 2021 5-11 1867 36.50955369
October 24, 2021 5-11 2264 44.27296709
October 31, 2021 5-11 3193 62.43974555
November 7, 2021 5-11 3865 75.58083825
November 14, 2021 5-11 4352 85.10421942
November 21, 2021 5-11 3189 62.36152476
November 28, 2021 5-11 3542 69.26450947
December 5, 2021 5-11 2198 42.98232406
December 12, 2021 5-11 1774 34.69092033
December 19, 2021 5-11 1378 26.94706212
December 26, 2021 5-11 2995 58.56781645
January 2, 2022 5-11 6254 122.298205
January 9, 2022 5-11 7589 148.4043937
January 16, 2022 5-11 5773 112.892155
January 23, 2022 5-11 3205 62.67440792
January 30, 2022 5-11 1815 35.49268342
February 6, 2022 5-11 1208 23.62267855
February 13, 2022 5-11 542 10.59891703
February 20, 2022 5-11 88 1.720857378
0-4 1 0.028562697
March 15, 2020 0-4 1 0.028562697
March 22, 2020 0-4 1 0.028562697
March 29, 2020 0-4 2 0.057125393
April 5, 2020 0-4 2 0.057125393
April 12, 2020 0-4 6 0.171376179
April 19, 2020 0-4 19 0.542691234
April 26, 2020 0-4 34 0.971131683
May 3, 2020 0-4 69 1.970826062
May 10, 2020 0-4 86 2.456391903
May 17, 2020 0-4 110 3.14189662
May 24, 2020 0-4 79 2.256453027
May 31, 2020 0-4 68 1.942263365
June 7, 2020 0-4 67 1.913700669
June 14, 2020 0-4 64 1.828012579
June 21, 2020 0-4 65 1.856575276
June 28, 2020 0-4 52 1.48526022
WEEK(specimen_date) Age Groups (Peds) AGG(Cases per 10,000 Age group) SUM(Number of Records)
July 5, 2020 0-4 80 2.285015724
July 12, 2020 0-4 71 2.027951455
July 19, 2020 0-4 110 3.14189662
July 26, 2020 0-4 124 3.541774372
August 2, 2020 0-4 103 2.941957744
August 9, 2020 0-4 91 2.599205386
August 16, 2020 0-4 113 3.22758471
August 23, 2020 0-4 113 3.22758471
August 30, 2020 0-4 100 2.856269655
September 6, 2020 0-4 78 2.227890331
September 13, 2020 0-4 126 3.598899765
September 20, 2020 0-4 135 3.855964034
September 27, 2020 0-4 143 4.084465606
October 4, 2020 0-4 168 4.79853302
October 11, 2020 0-4 189 5.398349647
October 18, 2020 0-4 263 7.511989192
October 25, 2020 0-4 345 9.854130309
November 1, 2020 0-4 690 19.70826062
November 8, 2020 0-4 839 23.9641024
November 15, 2020 0-4 908 25.93492846
November 22, 2020 0-4 728 20.79364309
November 29, 2020 0-4 788 22.50740488
December 6, 2020 0-4 573 16.36642512
December 13, 2020 0-4 433 12.3676476
December 20, 2020 0-4 291 8.311744695
December 27, 2020 0-4 348 9.939818398
January 3, 2021 0-4 299 8.540246268
January 10, 2021 0-4 290 8.283181999
January 17, 2021 0-4 250 7.140674137
January 24, 2021 0-4 168 4.79853302
January 31, 2021 0-4 186 5.312661558
February 7, 2021 0-4 175 4.998471896
February 14, 2021 0-4 160 4.570031448
February 21, 2021 0-4 154 4.398655268
February 28, 2021 0-4 178 5.084159985
March 7, 2021 0-4 180 5.141285378
March 14, 2021 0-4 246 7.026423351
March 21, 2021 0-4 307 8.76874784
March 28, 2021 0-4 405 11.5678921
April 4, 2021 0-4 433 12.3676476
April 11, 2021 0-4 439 12.53902378
April 18, 2021 0-4 429 12.25339682
April 25, 2021 0-4 494 14.10997209
May 2, 2021 0-4 310 8.85443593
May 9, 2021 0-4 256 7.312050316
May 16, 2021 0-4 186 5.312661558
May 23, 2021 0-4 85 2.427829206
May 30, 2021 0-4 73 2.085076848
June 6, 2021 0-4 60 1.713761793
June 13, 2021 0-4 58 1.6566364
June 20, 2021 0-4 50 1.428134827
June 27, 2021 0-4 47 1.342446738
July 4, 2021 0-4 56 1.599511007
July 11, 2021 0-4 69 1.970826062
July 18, 2021 0-4 119 3.398960889
July 25, 2021 0-4 157 4.484343358
August 1, 2021 0-4 269 7.683365371
August 8, 2021 0-4 356 10.16831997
August 15, 2021 0-4 421 12.02489525
August 22, 2021 0-4 498 14.22422288
August 29, 2021 0-4 551 15.7380458
September 5, 2021 0-4 582 16.62348939
September 12, 2021 0-4 721 20.59370421
September 19, 2021 0-4 720 20.56514151
September 26, 2021 0-4 912 26.04917925
October 3, 2021 0-4 847 24.19260398
October 10, 2021 0-4 744 21.25064623
October 17, 2021 0-4 767 21.90758825
October 24, 2021 0-4 790 22.56453027
October 31, 2021 0-4 1138 32.50434867
November 7, 2021 0-4 1466 41.87291314
November 14, 2021 0-4 1607 45.90025335
November 21, 2021 0-4 1421 40.58759179
November 28, 2021 0-4 1770 50.55597289
December 5, 2021 0-4 1358 38.78814191
WEEK(specimen_date) Age Groups (Peds) AGG(Cases per 10,000 Age group) SUM(Number of Records)
December 12, 2021 0-4 1129 32.2472844
December 19, 2021 0-4 1144 32.67572485
December 26, 2021 0-4 2318 66.2083306
January 2, 2022 0-4 4405 125.8186783
January 9, 2022 0-4 5157 147.2978261
January 16, 2022 0-4 4150 118.5351907
January 23, 2022 0-4 2671 76.29096248
January 30, 2022 0-4 1652 47.1855747
February 6, 2022 0-4 1150 32.84710103
February 13, 2022 0-4 675 19.27982017
February 20, 2022 0-4 111 3.170459317
Oct 4, 20 Dec 27, 20 Mar 21, 21 Jun 13, 21 Sep 5, 21 Nov 28, 21 Feb 20, 22
Week of specimen_date
0.00
20.00
40.00
60.00
80.00
100.00
120.00
140.00
160.00
180.00
200.00Ca
ses p
er 1
0,00
0
Labor Day
Cases per 10,000 People by Week of Specimen Date
Age Groups (Peds)0-45-1112-18
Week
7/15
-7/18
/20
7/19
-7/2
5/20
7/26
-8/1/
208/
2-8/
8/20
8/9-
8/15
/20
8/16
-8/2
2/20
8/23
-8/3
0/20
8/31
-9/5
/20
9/6-
9/12
/20
9/13
-9/19
/20
9/20
-9/2
6/20
9/27
-10/
3/20
10/4
-10/
10/2
010
/11-1
0/17
/20
10/18
-10/2
4/20
10/2
5-10
/31/2
011/
1-11/
7/20
11/8-
11/14
/20
11/15
-11/2
1/20
11/22
-11/2
8/20
11/29
-12/
5/20
12/6
-12/
12/2
012
/13-12
/19/2
012
/20-
12/2
6/20
12/2
7-1/2
/21
1/3-1
/9/2
11/1
0-1/1
6/21
1/17-
1/23/
211/2
4-1/3
0/21
1/31-
2/6/
212/
7-2/
13/2
12/
14-2
/20/
212/
21-2
/27/
212/
28-3
/6/2
13/
7-3/
13/2
13/
14-3
/20/
213/
21-3
/27/
213/
28-4
/3/2
14/
4-4/
10/2
14/
11-4/
17/2
14/
18-4
/24/
214/
25-5
/1/21
5/2-
5/8/
215/
9-5/
15/2
15/
16-5
/22/
215/
23-5
/29/
215/
30-6
/5/2
16/
6-6/
12/2
16/
13-6
/19/2
16/
20-6
/26/
216/
27-7
/3/2
17/
4-7/
10/2
17/
11-7/
17/2
17/
18-7
/24/
217/
25-7
/31/2
18/
1-8/
7/21
8/8-
8/14
/21
8/15
-8/2
1/21
8/22
-8/2
8/21
8/29
-9/4
/21
9/5-
9/11/
219/
12-9
/18/2
19/
19-9
/25/
219/
26-1
0/2/
2110
/3-1
0/9/
2110
/10-1
0/16
/21
10/17
-10/
23/2
110
/24-
10/3
0/21
10/3
1-11/
6/21
11/7-
11/13
/21
11/14
-11/2
0/21
11/21
-11/2
7/21
11/28
-12/
4/21
12/5
-12/
11/21
12/12
-12/
18/2
112
/19-1
2/25
/21
12/2
6-1/1
/22
1/2-1
/8/2
21/9
-1/15
/22
1/16-
1/22/
221/2
3-1/2
9/22
1/30-
2/5/
222/
6-2/
12/2
22/
13-2
/19/2
22/
20-2
/26/
222/
27-3
/5/2
2
Minnesota Department of Health Weekly COVID-19 Report: Updated 3/3/2022 with data current as of 4 a.m. the previous business day unless specifically noted. Page 24
Case Rate in Children by Specimen Collection DateCases by age group for children in Minnesota (cases 18 years of age and under) per 10,000 people by date of specimen collection.
Due to the need to confirm reports and
reporting delays, data may be incomplete
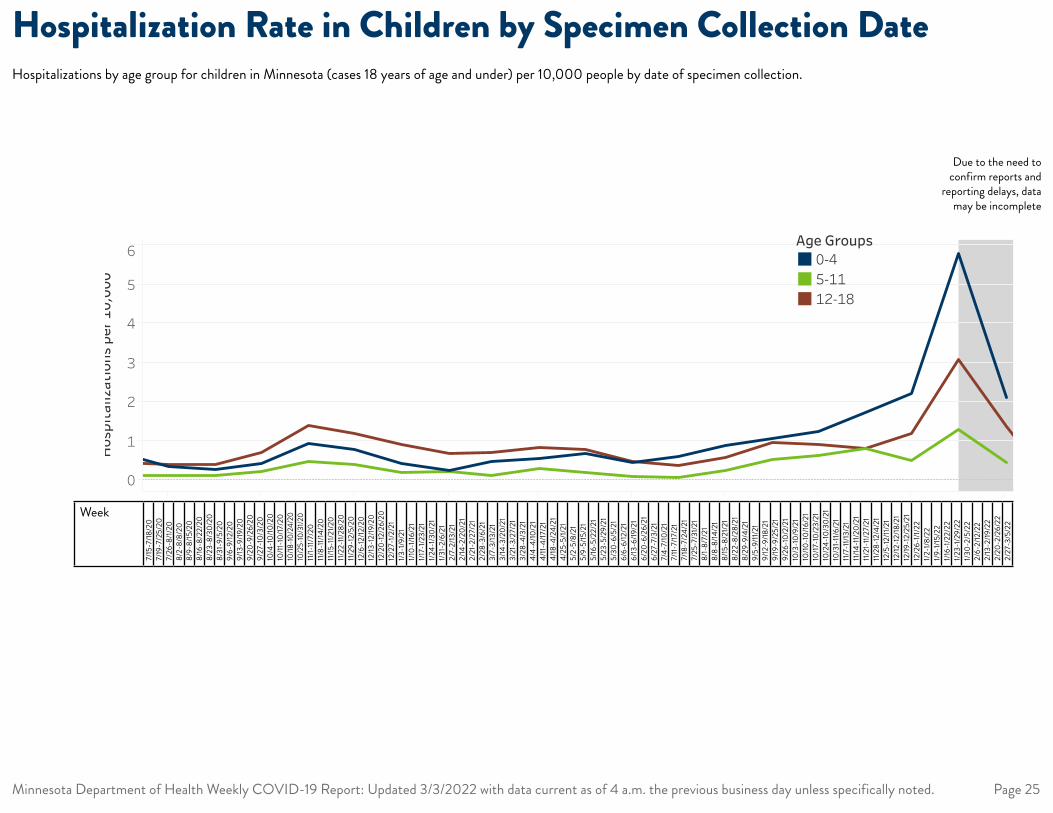
MONTH(first_admit_date) Age Groups (Peds) AGG(Cases per 10,000 Age group) SUM(Number of Hospitalizations)
MONTH(first_admit_date) Age Groups (Peds) SUM(Number of Hospitalizations) AGG(Cases per 10,000 Age group)
12-18 26 0.513257845
March 2020 12-18 1 0.019740686
April 2020 12-18 5 0.098703432
May 2020 12-18 22 0.4342951
June 2020 12-18 27 0.532998531
July 2020 12-18 23 0.454035786
August 2020 12-18 20 0.394813727
September 2020 12-18 21 0.414554413
October 2020 12-18 36 0.710664708
November 2020 12-18 71 1.40158873
December 2020 12-18 60 1.184441181
January 2021 12-18 47 0.927812258
February 2021 12-18 35 0.690924022
March 2021 12-18 36 0.710664708
April 2021 12-18 43 0.848849513
May 2021 12-18 40 0.789627454
June 2021 12-18 24 0.473776472
July 2021 12-18 19 0.375073041
August 2021 12-18 30 0.59222059
September 2021 12-18 49 0.967293631
October 2021 12-18 47 0.927812258
November 2021 12-18 41 0.80936814
December 2021 12-18 61 1.204181867
January 2022 12-18 157 3.099287756
February 2022 12-18 58 1.144959808
5-11 6 0.117331185
March 2020 5-11 1 0.019555197
April 2020 5-11 1 0.019555197
May 2020 5-11 7 0.136886382
June 2020 5-11 7 0.136886382
July 2020 5-11 6 0.117331185
August 2020 5-11 7 0.136886382
September 2020 5-11 7 0.136886382
October 2020 5-11 12 0.23466237
November 2020 5-11 25 0.488879937
December 2020 5-11 21 0.410659147
January 2021 5-11 10 0.195551975
February 2021 5-11 11 0.215107172
March 2021 5-11 7 0.136886382
April 2021 5-11 16 0.31288316
May 2021 5-11 10 0.195551975
June 2021 5-11 5 0.097775987
July 2021 5-11 4 0.07822079
August 2021 5-11 13 0.254217567
September 2021 5-11 27 0.527990332
October 2021 5-11 33 0.645321517
November 2021 5-11 42 0.821318294
December 2021 5-11 26 0.508435134
January 2022 5-11 65 1.271087836
February 2022 5-11 20 0.39110395
0-4 15 0.428440448
April 2020 0-4 2 0.057125393
May 2020 0-4 12 0.342752359
June 2020 0-4 17 0.485565841
July 2020 0-4 24 0.685504717
August 2020 0-4 12 0.342752359
September 2020 0-4 10 0.285626965
October 2020 0-4 15 0.428440448
November 2020 0-4 33 0.942568986
December 2020 0-4 28 0.799755503
January 2021 0-4 15 0.428440448
February 2021 0-4 9 0.257064269
March 2021 0-4 17 0.485565841
April 2021 0-4 20 0.571253931
May 2021 0-4 24 0.685504717
June 2021 0-4 16 0.457003145
July 2021 0-4 21 0.599816627
August 2021 0-4 31 0.885443593
September 2021 0-4 37 1.056819772
October 2021 0-4 44 1.256758648
November 2021 0-4 61 1.742324489
December 2021 0-4 76 2.170764938
January 2022 0-4 201 5.741102006
February 2022 0-4 59 1.685199096
MONTH(first_admit_date) Age Groups (Peds) AGG(Cases per 10,000 Age group) SUM(Number of Hospitalizations)
September 2021 0-4 37 1.056819772
October 2021 0-4 44 1.256758648
November 2021 0-4 61 1.742324489
December 2021 0-4 76 2.170764938
January 2022 0-4 98 2.799144262
8/20 9/20 10/20 11/20 12/20 1/21 2/21 3/21 4/21 5/21 6/21 7/21 8/21 9/21 10/21 11/21 12/21 1/22 2/22
Month of icu_admission_date
0.00
0.20
0.40
0.60
ICU
Adm
issi
ons
per 1
0,00
0
ICU Admissions per 10,000 by Month of Admit Date
8/20 10/20 12/20 2/21 4/21 6/21 8/21 10/21 12/21 2/22
Month of first_admit_date
0
1
2
3
4
5
6
Hos
pita
lizat
ions
per
10,
000
Hospitalizations per 10,000 by Month of Admit DateAge Groups
0-45-1112-18
Week
7/15
-7/18
/20
7/19
-7/2
5/20
7/26
-8/1/
208/
2-8/
8/20
8/9-
8/15
/20
8/16
-8/2
2/20
8/23
-8/3
0/20
8/31
-9/5
/20
9/6-
9/12
/20
9/13
-9/19
/20
9/20
-9/2
6/20
9/27
-10/
3/20
10/4
-10/
10/2
010
/11-1
0/17
/20
10/18
-10/2
4/20
10/2
5-10
/31/2
011/
1-11/
7/20
11/8-
11/14
/20
11/15
-11/2
1/20
11/22
-11/2
8/20
11/29
-12/
5/20
12/6
-12/
12/2
012
/13-12
/19/2
012
/20-
12/2
6/20
12/2
7-1/2
/21
1/3-1
/9/2
11/1
0-1/1
6/21
1/17-
1/23/
211/2
4-1/3
0/21
1/31-
2/6/
212/
7-2/
13/2
12/
14-2
/20/
212/
21-2
/27/
212/
28-3
/6/2
13/
7-3/
13/2
13/
14-3
/20/
213/
21-3
/27/
213/
28-4
/3/2
14/
4-4/
10/2
14/
11-4/
17/2
14/
18-4
/24/
214/
25-5
/1/21
5/2-
5/8/
215/
9-5/
15/2
15/
16-5
/22/
215/
23-5
/29/
215/
30-6
/5/2
16/
6-6/
12/2
16/
13-6
/19/2
16/
20-6
/26/
216/
27-7
/3/2
17/
4-7/
10/2
17/
11-7/
17/2
17/
18-7
/24/
217/
25-7
/31/2
18/
1-8/
7/21
8/8-
8/14
/21
8/15
-8/2
1/21
8/22
-8/2
8/21
8/29
-9/4
/21
9/5-
9/11/
219/
12-9
/18/2
19/
19-9
/25/
219/
26-1
0/2/
2110
/3-1
0/9/
2110
/10-1
0/16
/21
10/17
-10/
23/2
110
/24-
10/3
0/21
10/3
1-11/
6/21
11/7-
11/13
/21
11/14
-11/2
0/21
11/21
-11/2
7/21
11/28
-12/
4/21
12/5
-12/
11/21
12/12
-12/
18/2
112
/19-1
2/25
/21
12/2
6-1/1
/22
1/2-1
/8/2
21/9
-1/15
/22
1/16-
1/22/
221/2
3-1/2
9/22
1/30-
2/5/
222/
6-2/
12/2
22/
13-2
/19/2
22/
20-2
/26/
222/
27-3
/5/2
2
Minnesota Department of Health Weekly COVID-19 Report: Updated 3/3/2022 with data current as of 4 a.m. the previous business day unless specifically noted. Page 25
Hospitalization Rate in Children by Specimen Collection DateHospitalizations by age group for children in Minnesota (cases 18 years of age and under) per 10,000 people by date of specimen collection.
Due to the need to confirm reports and
reporting delays, data may be incomplete
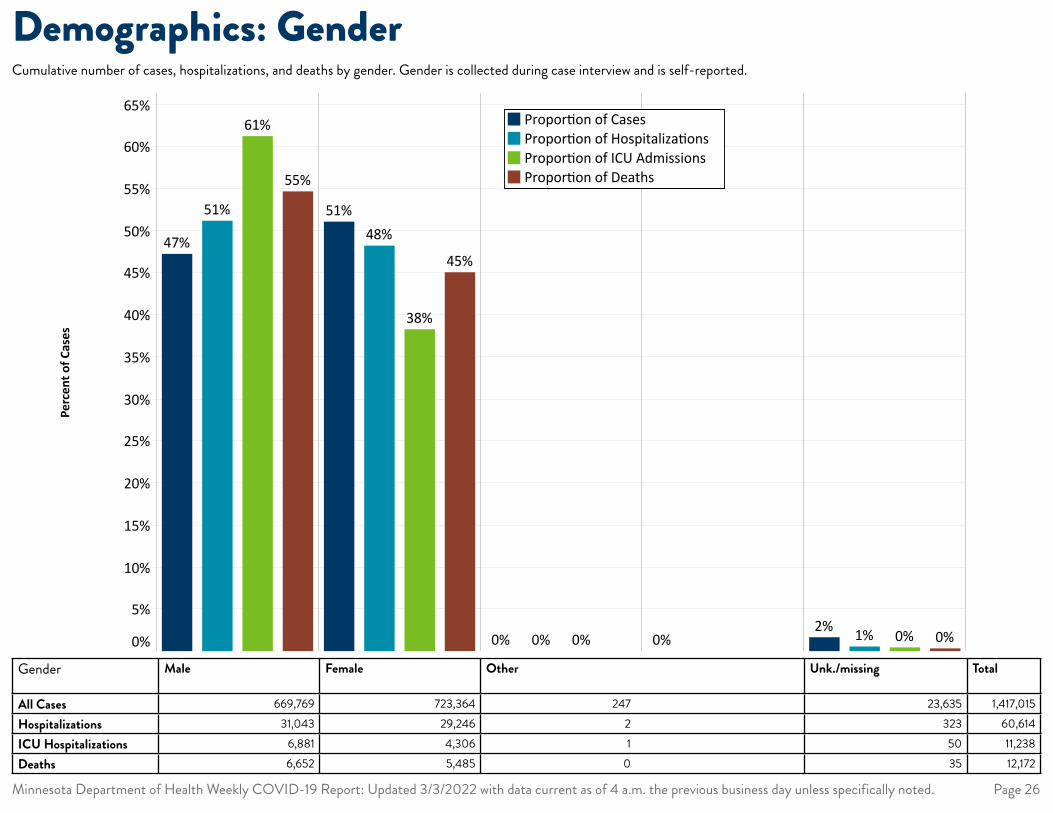
Male Female Other Transgender Missing/Unknown
0%
5%
10%
15%
20%
25%
30%
35%
40%
45%
50%
55%
60%
65%Va
lue
55%
61%
51%
47%45%
38%
48%51%
0%0%0% 0% 0%0%1%2%
Gender
Propor�on of CasesPropor�on of Hospitaliza�onsPropor�on of ICU AdmissionsPropor�on of Deaths
Perc
ent o
f Cas
es
Minnesota Department of Health Weekly COVID-19 Report: Updated 3/3/2022 with data current as of 4 a.m. the previous business day unless specifically noted. Page 26
Demographics: GenderCumulative number of cases, hospitalizations, and deaths by gender. Gender is collected during case interview and is self-reported.
Gender Male Female Other Unk./missing Total
All Cases 669,769 723,364 247 23,635 1,417,015Hospitalizations 31,043 29,246 2 323 60,614ICU Hospitalizations 6,881 4,306 1 50 11,238Deaths 6,652 5,485 0 35 12,172
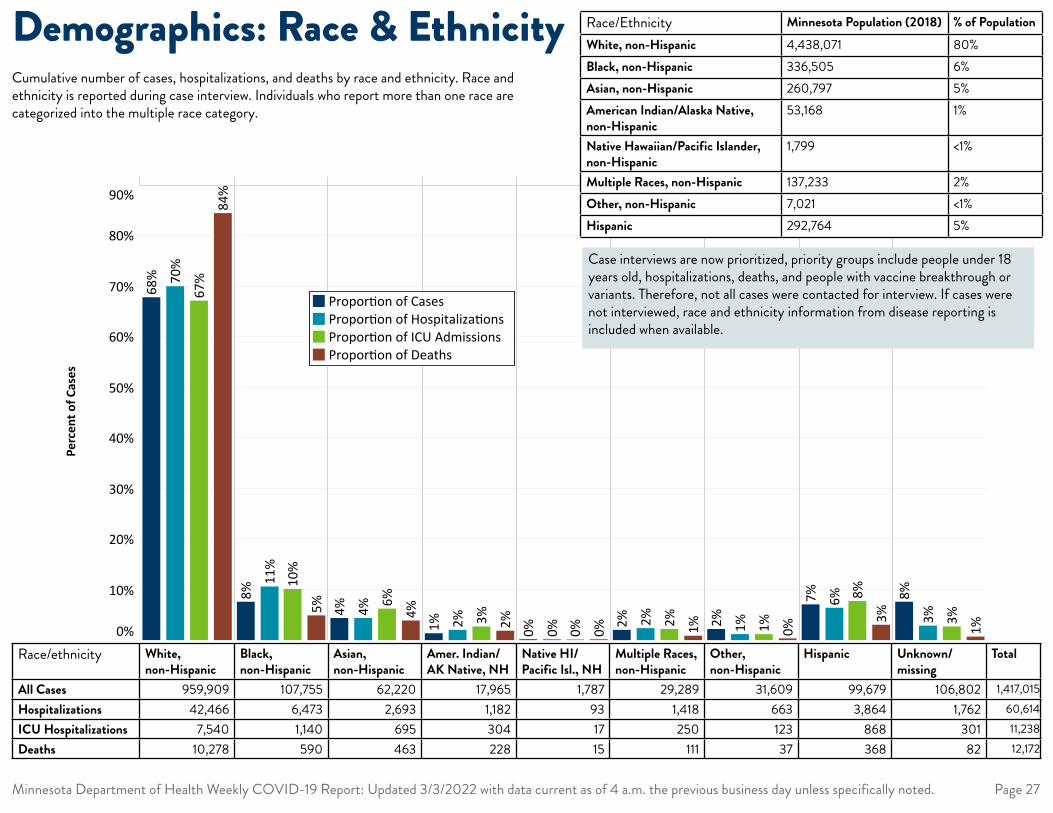
White Black AsianAmerican
Indian/AlaskaNa�ve
Na�veHawaiian/
Other PacificIslander
Mul�ple Races Other Hispanic Missing/Unknown
0%
10%
20%
30%
40%
50%
60%
70%
80%
90%
Valu
e
84%
67%70
%68
%
5%10
%11
%8%
4%6%4%4%
2%3%2%1% 0%0%0%0% 1%2%2%2% 0%1%1%2% 3%8%6%7%
1%3%3%
8%
Demographics: Race and Ethnicity
Propor�on of CasesPropor�on of Hospitaliza�onsPropor�on of ICU AdmissionsPropor�on of Deaths
Perc
ent o
f Cas
es
Minnesota Department of Health Weekly COVID-19 Report: Updated 3/3/2022 with data current as of 4 a.m. the previous business day unless specifically noted. Page 27
Demographics: Race & EthnicityCumulative number of cases, hospitalizations, and deaths by race and ethnicity. Race and ethnicity is reported during case interview. Individuals who report more than one race are categorized into the multiple race category.
Race/Ethnicity Minnesota Population (2018) % of PopulationWhite, non-Hispanic 4,438,071 80%Black, non-Hispanic 336,505 6%Asian, non-Hispanic 260,797 5%American Indian/Alaska Native, non-Hispanic
53,168 1%
Native Hawaiian/Pacific Islander, non-Hispanic
1,799 <1%
Multiple Races, non-Hispanic 137,233 2%Other, non-Hispanic 7,021 <1%Hispanic 292,764 5%
Race/ethnicity White, non-Hispanic
Black, non-Hispanic
Asian, non-Hispanic
Amer. Indian/AK Native, NH
Native HI/Pacific Isl., NH
Multiple Races, non-Hispanic
Other, non-Hispanic
Hispanic Unknown/missing
Total
All Cases 959,909 107,755 62,220 17,965 1,787 29,289 31,609 99,679 106,802 1,417,015 Hospitalizations 42,466 6,473 2,693 1,182 93 1,418 663 3,864 1,762 60,614 ICU Hospitalizations 7,540 1,140 695 304 17 250 123 868 301 11,238 Deaths 10,278 590 463 228 15 111 37 368 82 12,172
Case interviews are now prioritized, priority groups include people under 18 years old, hospitalizations, deaths, and people with vaccine breakthrough or variants. Therefore, not all cases were contacted for interview. If cases were not interviewed, race and ethnicity information from disease reporting is included when available.
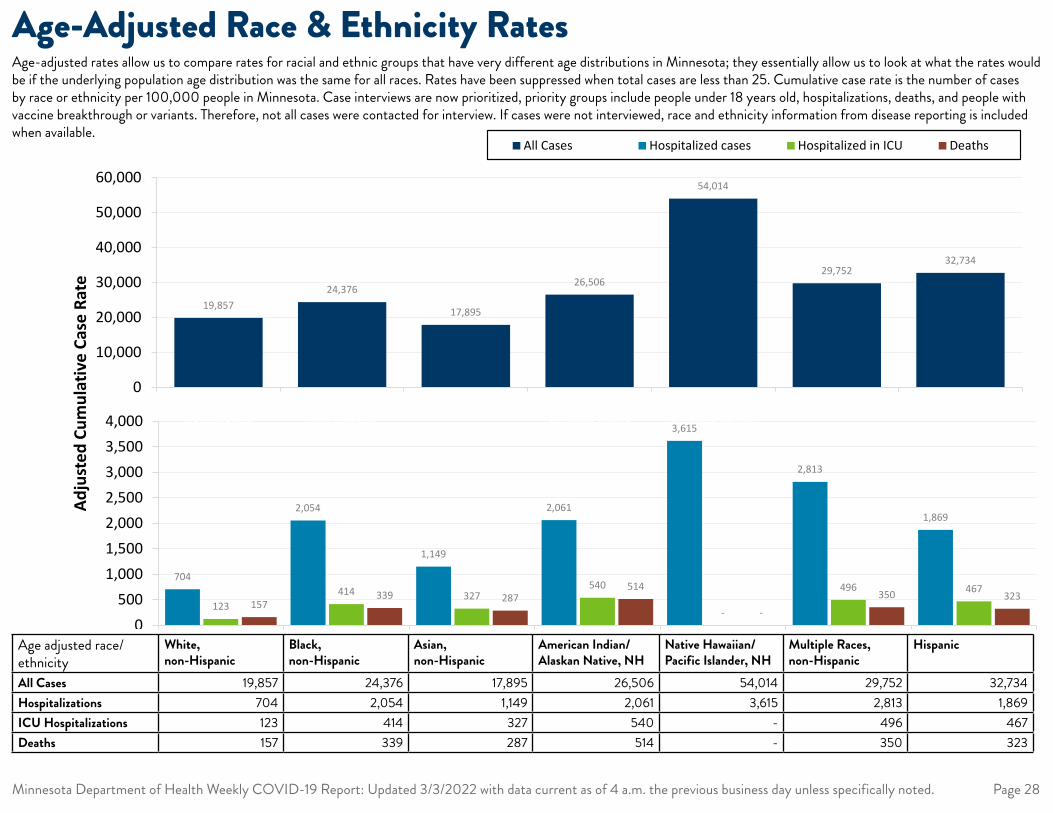
704
2,054
1,149
2,061
3,615
2,813
1,869
123414 327
540
-
496 467157
339 287514
-
350 323
0500
1,0001,5002,0002,5003,0003,5004,000
White,Non-Hispanic
Black,Non-Hispanic
Asian,Non-Hispanic
American Indian/Alaskan Native
Native Hawaiian/Pacific Islander
Multiple races,Non-Hispanic
Hispanic
Hospitalized cases Hospitalized in ICU Deaths
19,85724,376
17,895
26,506
54,014
29,75232,734
0
10,000
20,000
30,000
40,000
50,000
60,000
White,Non-Hispanic
Black,Non-Hispanic
Asian American Indianor Alaska Native
Native Hawaiianor Pacific Isander
Multiple races Hispanic
All Cases
Adju
sted
Cum
ulat
ive
Case
Rat
e
Minnesota Department of Health Weekly COVID-19 Report: Updated 3/3/2022 with data current as of 4 a.m. the previous business day unless specifically noted. Page 28
Age-Adjusted Race & Ethnicity RatesAge-adjusted rates allow us to compare rates for racial and ethnic groups that have very different age distributions in Minnesota; they essentially allow us to look at what the rates would be if the underlying population age distribution was the same for all races. Rates have been suppressed when total cases are less than 25. Cumulative case rate is the number of cases by race or ethnicity per 100,000 people in Minnesota. Case interviews are now prioritized, priority groups include people under 18 years old, hospitalizations, deaths, and people with vaccine breakthrough or variants. Therefore, not all cases were contacted for interview. If cases were not interviewed, race and ethnicity information from disease reporting is included when available.
Age adjusted race/ethnicity
White, non-Hispanic
Black, non-Hispanic
Asian, non-Hispanic
American Indian/Alaskan Native, NH
Native Hawaiian/Pacific Islander, NH
Multiple Races, non-Hispanic
Hispanic
All Cases 19,857 24,376 17,895 26,506 54,014 29,752 32,734Hospitalizations 704 2,054 1,149 2,061 3,615 2,813 1,869ICU Hospitalizations 123 414 327 540 - 496 467Deaths 157 339 287 514 - 350 323
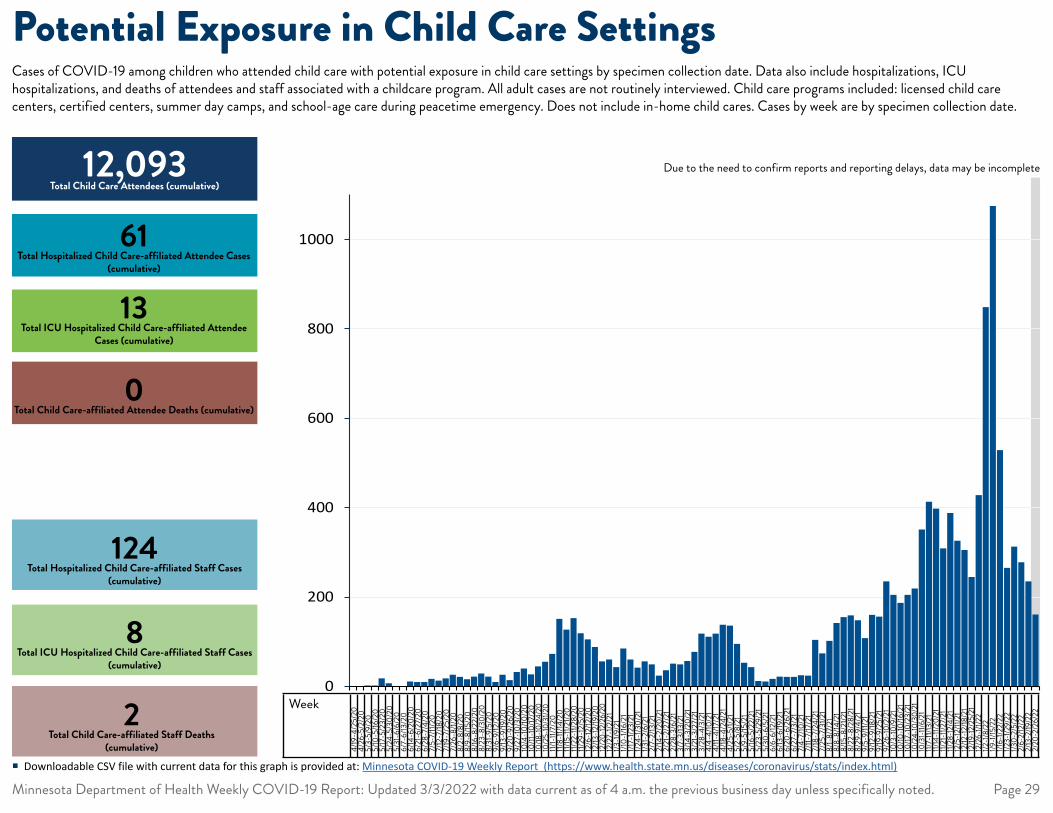
0
200
400
600
800
1000
17192123252729313335373941434547495153 2 4 6 8 10121416182022242628303234363840424446485052 2 4 6 8
Num
ber o
f Cas
es
Week
4/19
-4/2
5/20
4/26
-5/2
/20
5/3-
5/9/
205/
10-5
/16/2
05/
17-5
/23/
205/
24-5
/30/
205/
31-6
/6/2
06/
7-6/
13/2
06/
14-6
/20/
206/
21-6
/27/
206/
28-7
/4/2
07/
5-7/
11/20
7/12
-7/18
/20
7/19
-7/2
5/20
7/26
-8/1/
208/
2-8/
8/20
8/9-
8/15
/20
8/16
-8/2
2/20
8/23
-8/3
0/20
8/31
-9/5
/20
9/6-
9/12
/20
9/13
-9/19
/20
9/20
-9/2
6/20
9/27
-10/
3/20
10/4
-10/
10/2
010
/11-1
0/17
/20
10/18
-10/2
4/20
10/2
5-10
/31/2
011/
1-11/
7/20
11/8-
11/14
/20
11/15
-11/2
1/20
11/22
-11/2
8/20
11/29
-12/
5/20
12/6
-12/
12/2
012
/13-12
/19/2
012
/20-
12/2
6/20
12/2
7-1/2
/21
1/3-1
/9/2
11/1
0-1/1
6/21
1/17-
1/23/
211/2
4-1/3
0/21
1/31-
2/6/
212/
7-2/
13/2
12/
14-2
/20/
212/
21-2
/27/
212/
28-3
/6/2
13/
7-3/
13/2
13/
14-3
/20/
213/
21-3
/27/
213/
28-4
/3/2
14/
4-4/
10/2
14/
11-4/
17/2
14/
18-4
/24/
214/
25-5
/1/21
5/2-
5/8/
215/
9-5/
15/2
15/
16-5
/22/
215/
23-5
/29/
215/
30-6
/5/2
16/
6-6/
12/2
16/
13-6
/19/2
16/
20-6
/26/
216/
27-7
/3/2
17/
4-7/
10/2
17/
11-7/
17/2
17/
18-7
/24/
217/
25-7
/31/2
18/
1-8/
7/21
8/8-
8/14
/21
8/15
-8/2
1/21
8/22
-8/2
8/21
8/29
-9/4
/21
9/5-
9/11/
219/
12-9
/18/2
19/
19-9
/25/
219/
26-1
0/2/
2110
/3-1
0/9/
2110
/10-1
0/16
/21
10/17
-10/
23/2
110
/24-
10/3
0/21
10/3
1-11/6
/21
11/7-
11/13
/21
11/14
-11/2
0/21
11/21
-11/2
7/21
11/28
-12/4
/21
12/5
-12/11
/21
12/12
-12/18
/21
12/19
-12/2
5/21
12/2
6-1/1
/22
1/2-1/
8/22
1/9-1/
15/2
21/1
6-1/2
2/22
1/23-
1/29/
221/3
0-2/
5/22
2/6-
2/12
/22
2/13
-2/19
/22
2/20
-2/2
6/22
Minnesota Department of Health Weekly COVID-19 Report: Updated 3/3/2022 with data current as of 4 a.m. the previous business day unless specifically noted. Page 29
Potential Exposure in Child Care SettingsCases of COVID-19 among children who attended child care with potential exposure in child care settings by specimen collection date. Data also include hospitalizations, ICU hospitalizations, and deaths of attendees and staff associated with a childcare program. All adult cases are not routinely interviewed. Child care programs included: licensed child care centers, certified centers, summer day camps, and school-age care during peacetime emergency. Does not include in-home child cares. Cases by week are by specimen collection date.
12,093 Total Child Care Attendees (cumulative)
Due to the need to confirm reports and reporting delays, data may be incomplete
61 Total Hospitalized Child Care-affiliated Attendee Cases
(cumulative)
13 Total ICU Hospitalized Child Care-affiliated Attendee
Cases (cumulative)
0 Total Child Care-affiliated Attendee Deaths (cumulative)
124 Total Hospitalized Child Care-affiliated Staff Cases
(cumulative)
8 Total ICU Hospitalized Child Care-affiliated Staff Cases
(cumulative)
2 Total Child Care-affiliated Staff Deaths
(cumulative)
� Downloadable CSV file with current data for this graph is provided at: Minnesota COVID-19 Weekly Report (https://www.health.state.mn.us/diseases/coronavirus/stats/index.html)
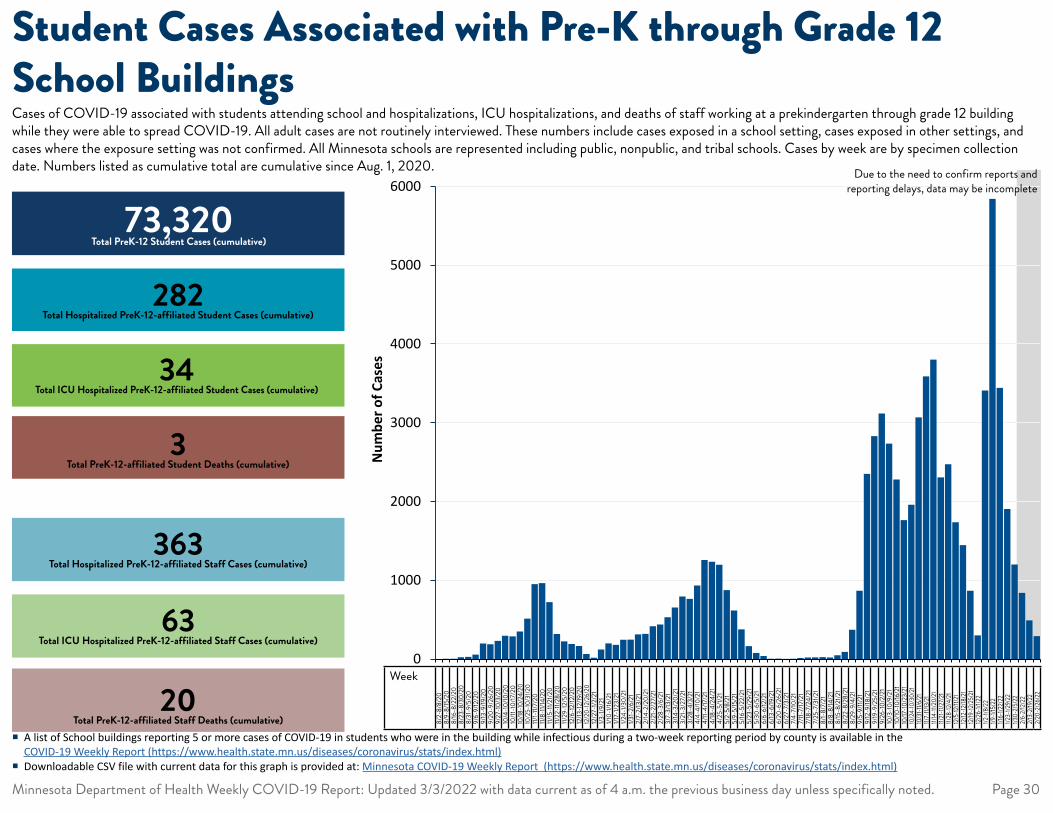
0
1000
2000
3000
4000
5000
6000
32 34 36 38 40 42 44 46 48 50 52 1 3 5 7 9 11 13 15 17 19 21 23 25 27 29 31 33 35 37 39 41 43 45 47 49 51 1 3 5 7
Num
ber o
f Cas
es
Week
8/2-
8/8/
208/
9-8/
15/2
08/
16-8
/22/
208/
23-8
/30/
208/
31-9
/5/2
09/
6-9/
12/2
09/
13-9
/19/2
09/
20-9
/26/
209/
27-1
0/3/
2010
/4-1
0/10
/20
10/11
-10/
17/2
010
/18-10
/24/
2010
/25-
10/3
1/20
11/1-
11/7/
2011/
8-11/
14/2
011/
15-1
1/21/2
011/
22-11
/28/
2011/
29-1
2/5/
2012
/6-1
2/12
/20
12/13
-12/19
/20
12/2
0-12
/26/
2012
/27-
1/2/2
11/3
-1/9
/21
1/10-
1/16/
211/1
7-1/2
3/21
1/24-
1/30/
211/3
1-2/
6/21
2/7-
2/13
/21
2/14
-2/2
0/21
2/21
-2/2
7/21
2/28
-3/6
/21
3/7-
3/13
/21
3/14
-3/2
0/21
3/21
-3/2
7/21
3/28
-4/3
/21
4/4-
4/10
/21
4/11-
4/17
/21
4/18
-4/2
4/21
4/25
-5/1/
215/
2-5/
8/21
5/9-
5/15
/21
5/16
-5/2
2/21
5/23
-5/2
9/21
5/30
-6/5
/21
6/6-
6/12
/21
6/13
-6/19
/21
6/20
-6/2
6/21
6/27
-7/3
/21
7/4-
7/10
/21
7/11-
7/17
/21
7/18
-7/2
4/21
7/25
-7/3
1/21
8/1-
8/7/
218/
8-8/
14/2
18/
15-8
/21/2
18/
22-8
/28/
218/
29-9
/4/2
19/
5-9/
11/21
9/12
-9/18
/21
9/19
-9/2
5/21
9/26
-10/
2/21
10/3
-10/
9/21
10/10
-10/16
/21
10/17
-10/2
3/21
10/2
4-10
/30/
2110
/31-1
1/6/2
111/
7-11/
13/2
111/
14-11
/20/
2111/
21-11
/27/2
111/
28-12
/4/2
112
/5-12
/11/2
112
/12-12
/18/2
112
/19-12
/25/
2112
/26-
1/1/2
21/2
-1/8/
221/9
-1/15
/22
1/16-
1/22/
221/2
3-1/2
9/22
1/30-
2/5/
222/
6-2/
12/2
22/
13-2
/19/2
22/
20-2
/26/
22
Minnesota Department of Health Weekly COVID-19 Report: Updated 3/3/2022 with data current as of 4 a.m. the previous business day unless specifically noted. Page 30
Student Cases Associated with Pre-K through Grade 12 School BuildingsCases of COVID-19 associated with students attending school and hospitalizations, ICU hospitalizations, and deaths of staff working at a prekindergarten through grade 12 building while they were able to spread COVID-19. All adult cases are not routinely interviewed. These numbers include cases exposed in a school setting, cases exposed in other settings, and cases where the exposure setting was not confirmed. All Minnesota schools are represented including public, nonpublic, and tribal schools. Cases by week are by specimen collection date. Numbers listed as cumulative total are cumulative since Aug. 1, 2020.
73,320 Total PreK-12 Student Cases (cumulative)
Due to the need to confirm reports and reporting delays, data may be incomplete
282 Total Hospitalized PreK-12-affiliated Student Cases (cumulative)
34 Total ICU Hospitalized PreK-12-affiliated Student Cases (cumulative)
3 Total PreK-12-affiliated Student Deaths (cumulative)
� A list of School buildings reporting 5 or more cases of COVID-19 in students who were in the building while infectious during a two-week reporting period by county is available in the COVID-19 Weekly Report (https://www.health.state.mn.us/diseases/coronavirus/stats/index.html)
363 Total Hospitalized PreK-12-affiliated Staff Cases (cumulative)
63 Total ICU Hospitalized PreK-12-affiliated Staff Cases (cumulative)
20 Total PreK-12-affiliated Staff Deaths (cumulative)
� Downloadable CSV file with current data for this graph is provided at: Minnesota COVID-19 Weekly Report (https://www.health.state.mn.us/diseases/coronavirus/stats/index.html)
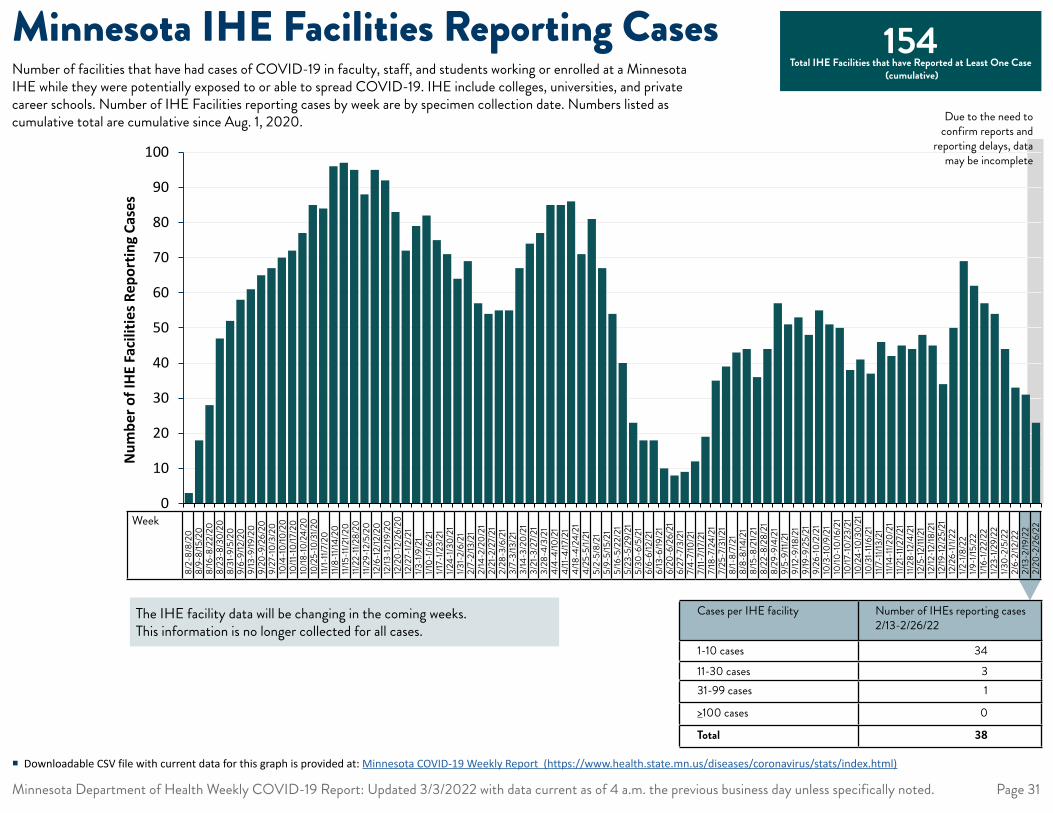
0
10
20
30
40
50
60
70
80
90
100
31 33 35 37 39 41 43 45 47 49 51 53 2 4 6 8 10 12 14 16 18 20 22 24 26 28 30 32 34 36 38 40 42 44 46 48 50 52 2 4 6 8
Num
ber o
f IHE
Fac
ilitie
s Rep
ortin
g Ca
ses
Week
8/2-
8/8/
208/
9-8/
15/2
08/
16-8
/22/
208/
23-8
/30/
208/
31-9
/5/2
09/
6-9/
12/2
09/
13-9
/19/2
09/
20-9
/26/
209/
27-1
0/3/
2010
/4-1
0/10
/20
10/11
-10/
17/2
010
/18-10
/24/
2010
/25-
10/3
1/20
11/1-
11/7/
2011/
8-11/
14/2
011/
15-1
1/21/2
011/
22-11
/28/
2011/
29-1
2/5/
2012
/6-1
2/12
/20
12/13
-12/19
/20
12/2
0-12
/26/
2012
/27-
1/2/2
11/3
-1/9
/21
1/10-
1/16/
211/1
7-1/2
3/21
1/24-
1/30/
211/3
1-2/
6/21
2/7-
2/13
/21
2/14
-2/2
0/21
2/21
-2/2
7/21
2/28
-3/6
/21
3/7-
3/13
/21
3/14
-3/2
0/21
3/21
-3/2
7/21
3/28
-4/3
/21
4/4-
4/10
/21
4/11-
4/17
/21
4/18
-4/2
4/21
4/25
-5/1/
215/
2-5/
8/21
5/9-
5/15
/21
5/16
-5/2
2/21
5/23
-5/2
9/21
5/30
-6/5
/21
6/6-
6/12
/21
6/13
-6/19
/21
6/20
-6/2
6/21
6/27
-7/3
/21
7/4-
7/10
/21
7/11-
7/17
/21
7/18
-7/2
4/21
7/25
-7/3
1/21
8/1-
8/7/
218/
8-8/
14/2
18/
15-8
/21/2
18/
22-8
/28/
218/
29-9
/4/2
19/
5-9/
11/21
9/12
-9/18
/21
9/19
-9/2
5/21
9/26
-10/
2/21
10/3
-10/
9/21
10/10
-10/
16/2
110
/17-1
0/23
/21
10/2
4-10
/30/
2110
/31-
11/6/
2111/
7-11/
13/2
111/
14-1
1/20/
2111/
21-1
1/27/
2111/
28-1
2/4/
2112
/5-1
2/11/
2112
/12-1
2/18
/21
12/19
-12/
25/2
112
/26-
1/1/2
21/2
-1/8
/22
1/9-1
/15/2
21/1
6-1/2
2/22
1/23-
1/29/
221/3
0-2/
5/22
2/6-
2/12
/22
2/13
-2/19
/22
2/20
-2/2
6/22
Minnesota Department of Health Weekly COVID-19 Report: Updated 3/3/2022 with data current as of 4 a.m. the previous business day unless specifically noted. Page 31
Minnesota IHE Facilities Reporting Cases 154 Total IHE Facilities that have Reported at Least One Case
(cumulative)Number of facilities that have had cases of COVID-19 in faculty, staff, and students working or enrolled at a Minnesota IHE while they were potentially exposed to or able to spread COVID-19. IHE include colleges, universities, and private career schools. Number of IHE Facilities reporting cases by week are by specimen collection date. Numbers listed as cumulative total are cumulative since Aug. 1, 2020. Due to the need to
confirm reports and reporting delays, data
may be incomplete
Cases per IHE facility Number of IHEs reporting cases 2/13-2/26/22
1-10 cases 3411-30 cases 331-99 cases 1
>100 cases 0
Total 38
The IHE facility data will be changing in the coming weeks. This information is no longer collected for all cases.
� Downloadable CSV file with current data for this graph is provided at: Minnesota COVID-19 Weekly Report (https://www.health.state.mn.us/diseases/coronavirus/stats/index.html)
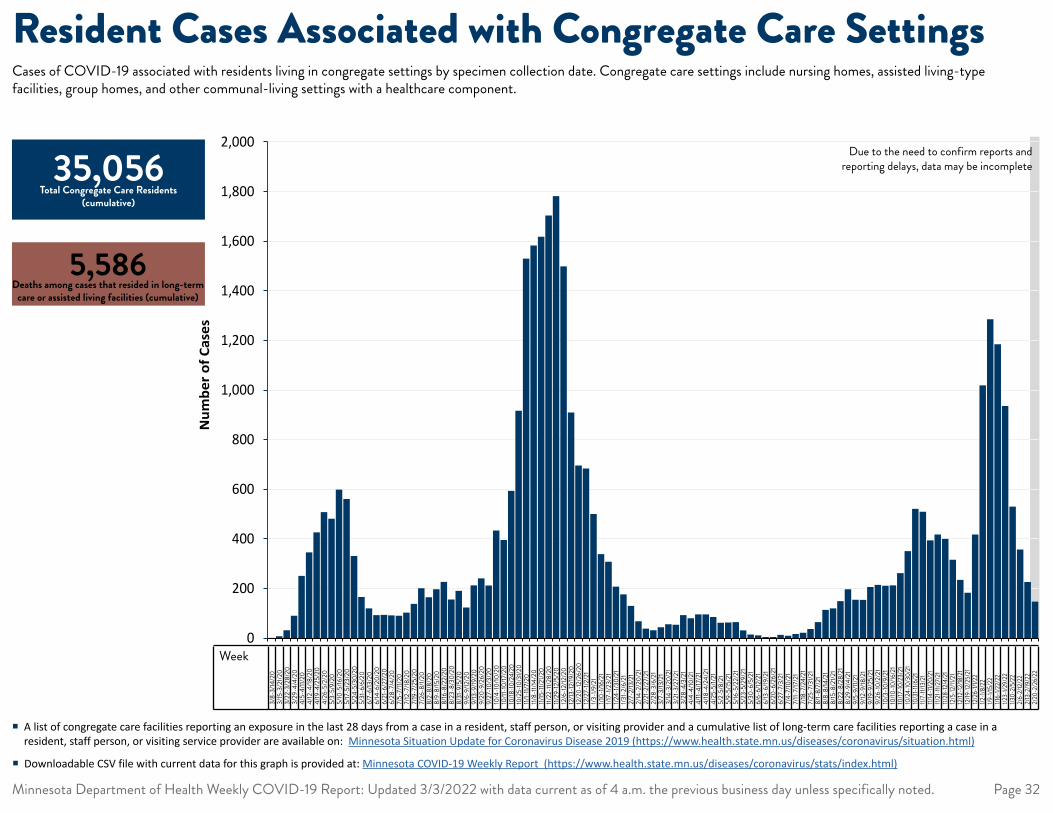
0
200
400
600
800
1,000
1,200
1,400
1,600
1,800
2,000
11 13 15 17 19 21 23 25 27 29 31 33 35 37 39 41 43 45 47 49 51 53 2 4 6 8 10 12 14 16 18 20 22 24 26 28 30 32 34 36 38 40 42 44 46 48 50 52 2 4 6 8
Num
ber o
f Cas
es
Week
3/8-
3/14
/20
3/15
-3/2
1/20
3/22
-3/2
8/20
3/29
-4/4
/20
4/5-
4/11/
204/
12-4
/18/2
04/
19-4
/25/
204/
26-5
/2/2
05/
3-5/
9/20
5/10
-5/16
/20
5/17
-5/2
3/20
5/24
-5/3
0/20
5/31
-6/6
/20
6/7-
6/13
/20
6/14
-6/2
0/20
6/21
-6/2
7/20
6/28
-7/4
/20
7/5-
7/11/
207/
12-7
/18/2
07/
19-7
/25/
207/
26-8
/1/20
8/2-
8/8/
208/
9-8/
15/2
08/
16-8
/22/
208/
23-8
/30/
208/
31-9
/5/2
09/
6-9/
12/2
09/
13-9
/19/2
09/
20-9
/26/
209/
27-1
0/3/
2010
/4-1
0/10
/20
10/11
-10/
17/2
010
/18-10
/24/
2010
/25-
10/3
1/20
11/1-
11/7/
2011/
8-11/
14/2
011/
15-1
1/21/2
011/
22-11
/28/
2011/
29-1
2/5/
2012
/6-1
2/12
/20
12/13
-12/19
/20
12/2
0-12
/26/
2012
/27-
1/2/2
11/3
-1/9
/21
1/10-
1/16/
211/1
7-1/2
3/21
1/24-
1/30/
211/3
1-2/
6/21
2/7-
2/13
/21
2/14
-2/2
0/21
2/21
-2/2
7/21
2/28
-3/6
/21
3/7-
3/13
/21
3/14
-3/2
0/21
3/21
-3/2
7/21
3/28
-4/3
/21
4/4-
4/10
/21
4/11-
4/17
/21
4/18
-4/2
4/21
4/25
-5/1/
215/
2-5/
8/21
5/9-
5/15
/21
5/16
-5/2
2/21
5/23
-5/2
9/21
5/30
-6/5
/21
6/6-
6/12
/21
6/13
-6/19
/21
6/20
-6/2
6/21
6/27
-7/3
/21
7/4-
7/10
/21
7/11-
7/17
/21
7/18
-7/2
4/21
7/25
-7/3
1/21
8/1-
8/7/
218/
8-8/
14/2
18/
15-8
/21/2
18/
22-8
/28/
218/
29-9
/4/2
19/
5-9/
11/21
9/12
-9/18
/21
9/19
-9/2
5/21
9/26
-10/
2/21
10/3
-10/
9/21
10/10
-10/16
/21
10/17
-10/2
3/21
10/2
4-10
/30/
2110
/31-1
1/6/2
111/
7-11/
13/2
111/
14-11
/20/
2111/
21-11
/27/
2111/
28-12
/4/2
112
/5-12
/11/2
112
/12-12
/18/2
112
/19-12
/25/
2112
/26-
1/1/2
21/2
-1/8/
221/9
-1/15
/22
1/16-
1/22/
221/2
3-1/2
9/22
1/30-
2/5/
222/
6-2/
12/2
22/
13-2
/19/2
22/
20-2
/26/
22
Minnesota Department of Health Weekly COVID-19 Report: Updated 3/3/2022 with data current as of 4 a.m. the previous business day unless specifically noted. Page 32
Resident Cases Associated with Congregate Care SettingsCases of COVID-19 associated with residents living in congregate settings by specimen collection date. Congregate care settings include nursing homes, assisted living-type facilities, group homes, and other communal-living settings with a healthcare component.
35,056 Total Congregate Care Residents
(cumulative)
Due to the need to confirm reports and reporting delays, data may be incomplete
5,586 Deaths among cases that resided in long-term
care or assisted living facilities (cumulative)
� A list of congregate care facilities reporting an exposure in the last 28 days from a case in a resident, staff person, or visiting provider and a cumulative list of long-term care facilities reporting a case in a resident, staff person, or visiting service provider are available on: Minnesota Situation Update for Coronavirus Disease 2019 (https://www.health.state.mn.us/diseases/coronavirus/situation.html)
� Downloadable CSV file with current data for this graph is provided at: Minnesota COVID-19 Weekly Report (https://www.health.state.mn.us/diseases/coronavirus/stats/index.html)
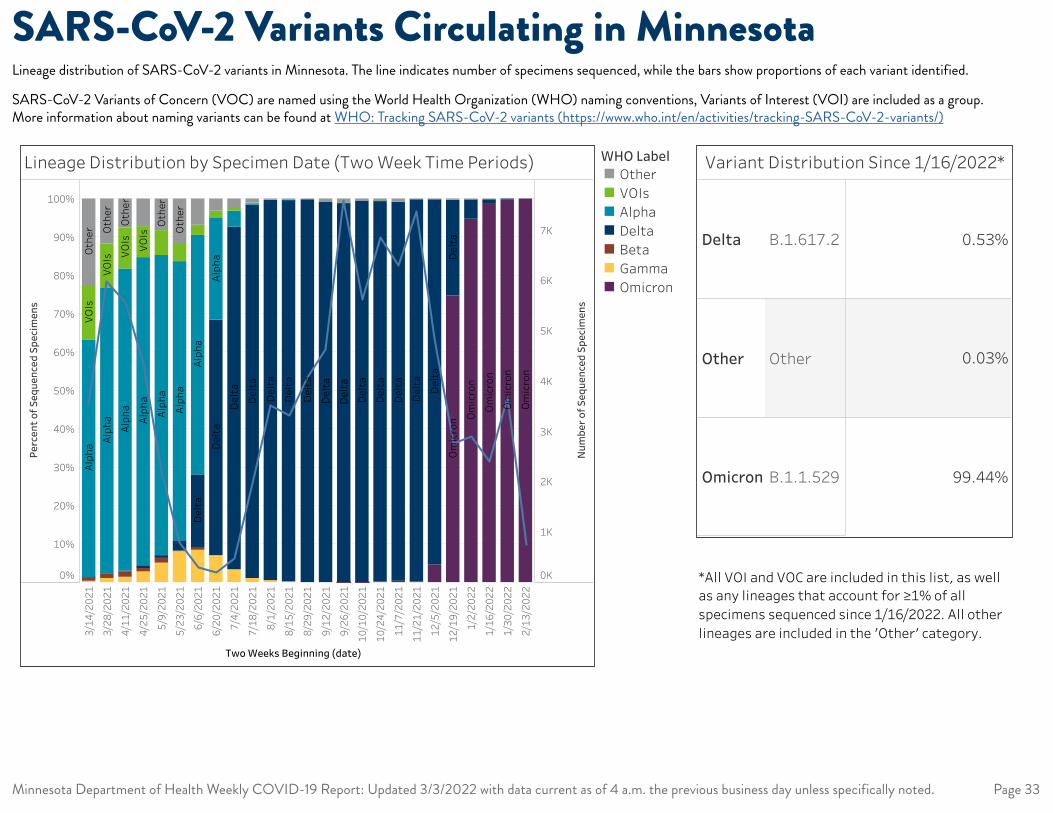
Date Range String WHO Label Condensed SUM(Number of Records)
2/13/2022 Omicron 748
1/30/2022 Omicron 3668
1/16/2022 Omicron 2376
1/2/2022 Omicron 2753
12/19/2021 Omicron 2071
12/5/2021 Omicron 225
11/21/2021 Omicron 19
11/7/2021 Omicron 23
10/24/2021 Omicron 7
10/10/2021 Omicron 4
9/26/2021 Omicron 3
8/15/2021 Gamma 6
8/1/2021 Gamma 16
7/18/2021 Gamma 19
7/4/2021 Gamma 16
6/20/2021 Gamma 14
6/6/2021 Gamma 25
5/23/2021 Gamma 64
5/9/2021 Gamma 113
4/25/2021 Gamma 124
4/11/2021 Gamma 82
3/28/2021 Gamma 58
3/14/2021 Gamma 13
6/6/2021 Beta 2
5/23/2021 Beta 1
5/9/2021 Beta 27
4/25/2021 Beta 37
4/11/2021 Beta 76
3/28/2021 Beta 71
3/14/2021 Beta 28
1/30/2022 Delta 6
1/16/2022 Delta 30
1/2/2022 Delta 144
12/19/2021 Delta 695
12/5/2021 Delta 4624
11/21/2021 Delta 7344
11/7/2021 Delta 6227
10/24/2021 Delta 6812
10/10/2021 Delta 5591
9/26/2021 Delta 7522
9/12/2021 Delta 4587
8/29/2021 Delta 4066
8/15/2021 Delta 3301
8/1/2021 Delta 3492
7/18/2021 Delta 1918
7/4/2021 Delta 418
6/20/2021 Delta 123
6/6/2021 Delta 57
5/23/2021 Delta 19
5/9/2021 Delta 16
4/25/2021 Delta 27
4/11/2021 Delta 6
3/28/2021 Delta 3
3/14/2021 Delta 3
12/5/2021 Alpha 1
11/21/2021 Alpha 1
9/12/2021 Alpha 1
8/15/2021 Alpha 2
7/18/2021 Alpha 8
7/4/2021 Alpha 20
6/20/2021 Alpha 53
6/6/2021 Alpha 187
SUM(Number of Records)WHO Label Condensed Variant Group 1
Delta B.1.617.2 0.005270864 0.53%
Other Other 0.000292826 0.03%
Omicron B.1.1.529 0.99443631 99.44%
5/23/2021 Alpha 577
5/9/2021 Alpha 1734
4/25/2021 Alpha 3510
4/11/2021 Alpha 4386
3/28/2021 Alpha 4452
3/14/2021 Alpha 2202
1/2/2022 VOIs 1
10/24/2021 VOIs 1
9/26/2021 VOIs 1
7/18/2021 VOIs 2
7/4/2021 VOIs 3
6/20/2021 VOIs 4
6/6/2021 VOIs 8
5/23/2021 VOIs 37
5/9/2021 VOIs 144
4/25/2021 VOIs 349
4/11/2021 VOIs 590
3/28/2021 VOIs 696
3/14/2021 VOIs 500
1/16/2022 Other 2
1/2/2022 Other 4
12/19/2021 Other 5
12/5/2021 Other 4
11/21/2021 Other 9
11/7/2021 Other 45
10/24/2021 Other 26
10/10/2021 Other 25
9/26/2021 Other 72
9/12/2021 Other 32
8/29/2021 Other 6
8/15/2021 Other 8
8/1/2021 Other 12
7/18/2021 Other 19
7/4/2021 Other 11
6/20/2021 Other 6
6/6/2021 Other 20
5/23/2021 Other 91
5/9/2021 Other 180
4/25/2021 Other 314
4/11/2021 Other 417
3/28/2021 Other 696
3/14/2021 Other 812
Delta B.1.617.2
Other Other
Omicron B.1.1.529
0.53%
0.03%
99.44%
Variant Distribution Since 1/16/2022*
*All VOI and VOC are included in this list, as wellas any lineages that account for ≥1% of allspecimens sequenced since 1/16/2022. All otherlineages are included in the 'Other' category.3/
14/2
021
3/28
/202
1
4/11
/202
1
4/25
/202
1
5/9/
2021
5/23
/202
1
6/6/
2021
6/20
/202
1
7/4/
2021
7/18
/202
1
8/1/
2021
8/15
/202
1
8/29
/202
1
9/12
/202
1
9/26
/202
1
10/1
0/20
21
10/2
4/20
21
11/7
/202
1
11/2
1/20
21
12/5
/202
1
12/1
9/20
21
1/2/
2022
1/16
/202
2
1/30
/202
2
2/13
/202
2
0%
10%
20%
30%
40%
50%
60%
70%
80%
90%
100%
Perc
ent o
f Seq
uenc
ed S
peci
men
s
0K
1K
2K
3K
4K
5K
6K
7K
Num
ber o
f Seq
uenc
ed S
peci
men
s
Om
icro
n
Om
icro
n
Om
icro
n
Om
icro
n
Om
icro
n
Oth
er
Oth
er
Oth
er
Oth
er
Oth
erAl
pha Al
pha
Alph
a
Alph
a
Alph
a
Alph
a
Alph
a
Alph
a
Del
ta
Del
ta
Del
ta
Del
ta
Del
ta
Del
ta
Del
ta
Del
ta
Del
ta
Del
ta
Del
ta
Del
ta
Del
ta
Del
ta
Del
ta
VOIs
VOIs VO
Is
VOIs
Lineage Distribution by Specimen Date (Two Week Time Periods) WHO LabelOtherVOIsAlphaDeltaBetaGammaOmicron
Two Weeks Beginning (date)
Minnesota Department of Health Weekly COVID-19 Report: Updated 3/3/2022 with data current as of 4 a.m. the previous business day unless specifically noted. Page 33
SARS-CoV-2 Variants Circulating in MinnesotaLineage distribution of SARS-CoV-2 variants in Minnesota. The line indicates number of specimens sequenced, while the bars show proportions of each variant identified.
SARS-CoV-2 Variants of Concern (VOC) are named using the World Health Organization (WHO) naming conventions, Variants of Interest (VOI) are included as a group. More information about naming variants can be found at WHO: Tracking SARS-CoV-2 variants (https://www.who.int/en/activities/tracking-SARS-CoV-2-variants/)
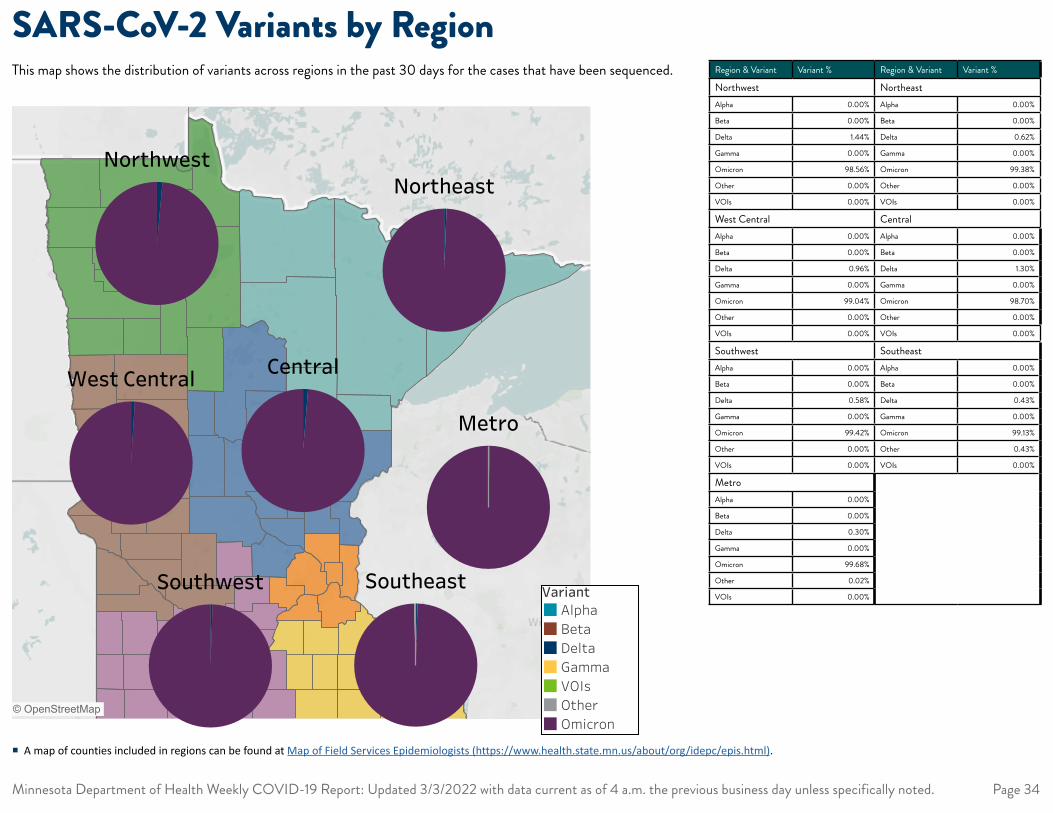
© 2022 Mapbox © OpenStreetMap
Lineage Distribution by Region: 1/16/2022 - Present
Central
Metro
NortheastNorthwest
SoutheastSouthwest
West Central
VariantAlphaBetaDeltaGammaVOIsOtherOmicron
© 2022 Mapbox © OpenStreetMap
Lineage Distribution by Region: 1/16/2022 - Present
Central
Metro
NortheastNorthwest
SoutheastSouthwest
West Central
VariantAlphaBetaDeltaGammaVOIsOtherOmicron
Minnesota Department of Health Weekly COVID-19 Report: Updated 3/3/2022 with data current as of 4 a.m. the previous business day unless specifically noted. Page 34
SARS-CoV-2 Variants by RegionThis map shows the distribution of variants across regions in the past 30 days for the cases that have been sequenced. Region & Variant Variant % Region & Variant Variant %
Northwest NortheastAlpha 0.00% Alpha 0.00%
Beta 0.00% Beta 0.00%
Delta 1.44% Delta 0.62%
Gamma 0.00% Gamma 0.00%
Omicron 98.56% Omicron 99.38%
Other 0.00% Other 0.00%
VOIs 0.00% VOIs 0.00%
West Central CentralAlpha 0.00% Alpha 0.00%
Beta 0.00% Beta 0.00%
Delta 0.96% Delta 1.30%
Gamma 0.00% Gamma 0.00%
Omicron 99.04% Omicron 98.70%
Other 0.00% Other 0.00%
VOIs 0.00% VOIs 0.00%
Southwest SoutheastAlpha 0.00% Alpha 0.00%
Beta 0.00% Beta 0.00%
Delta 0.58% Delta 0.43%
Gamma 0.00% Gamma 0.00%
Omicron 99.42% Omicron 99.13%
Other 0.00% Other 0.43%
VOIs 0.00% VOIs 0.00%
MetroAlpha 0.00%
Beta 0.00%
Delta 0.30%
Gamma 0.00%
Omicron 99.68%
Other 0.02%
VOIs 0.00%
� A map of counties included in regions can be found at Map of Field Services Epidemiologists (https://www.health.state.mn.us/about/org/idepc/epis.html).
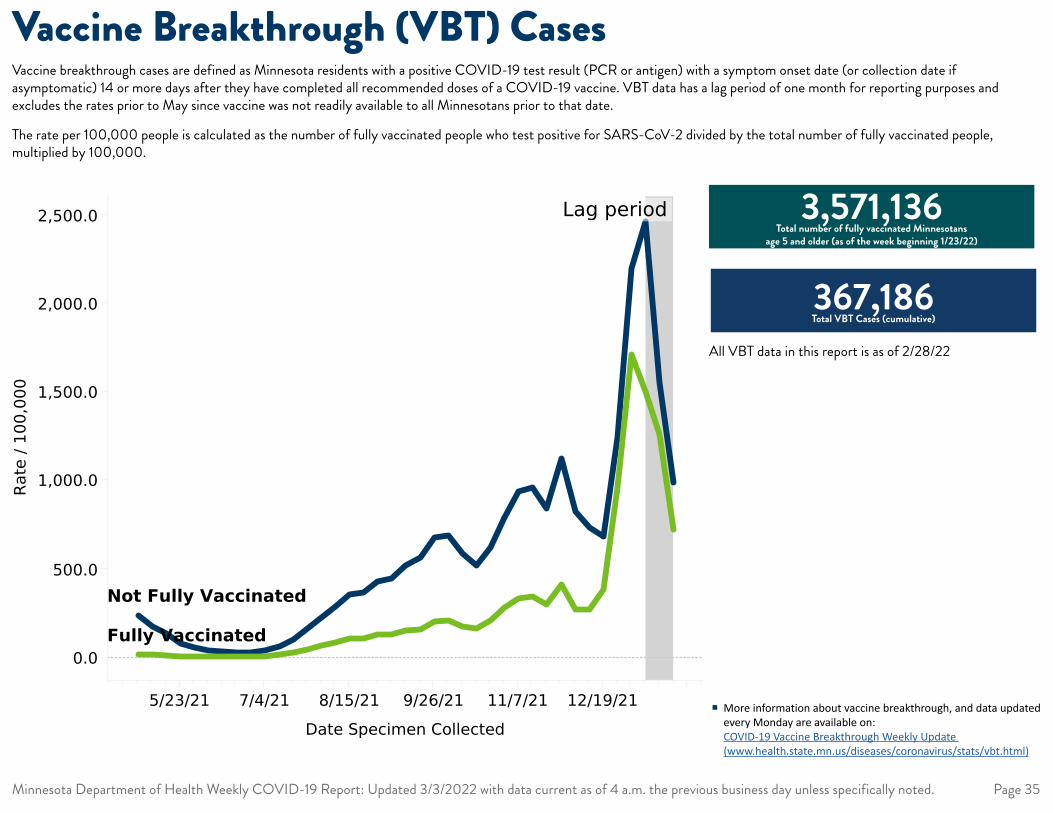
All VBT data in this report is as of 2/28/22
Minnesota Department of Health Weekly COVID-19 Report: Updated 3/3/2022 with data current as of 4 a.m. the previous business day unless specifically noted. Page 35
Vaccine Breakthrough (VBT) CasesVaccine breakthrough cases are defined as Minnesota residents with a positive COVID-19 test result (PCR or antigen) with a symptom onset date (or collection date if asymptomatic) 14 or more days after they have completed all recommended doses of a COVID-19 vaccine. VBT data has a lag period of one month for reporting purposes and excludes the rates prior to May since vaccine was not readily available to all Minnesotans prior to that date.
The rate per 100,000 people is calculated as the number of fully vaccinated people who test positive for SARS-CoV-2 divided by the total number of fully vaccinated people, multiplied by 100,000.
5/23/21 7/4/21 8/15/21 9/26/21 11/7/21 12/19/21
DateSpecimenCollected
0.0
500.0
1,000.0
1,500.0
2,000.0
2,500.0
Rate
/1
00,0
00
NotFullyVaccinated
FullyVaccinated
Lagperiod
Cases:WeeklyAge-AdjustedRateHover/clickoverlinesformoreinformation
SelectOutcomeforlinechartb..
Case
367,186 Total VBT Cases (cumulative)
� More information about vaccine breakthrough, and data updated every Monday are available on: COVID-19 Vaccine Breakthrough Weekly Update (www.health.state.mn.us/diseases/coronavirus/stats/vbt.html)
3,571,136 Total number of fully vaccinated Minnesotans
age 5 and older (as of the week beginning 1/23/22)
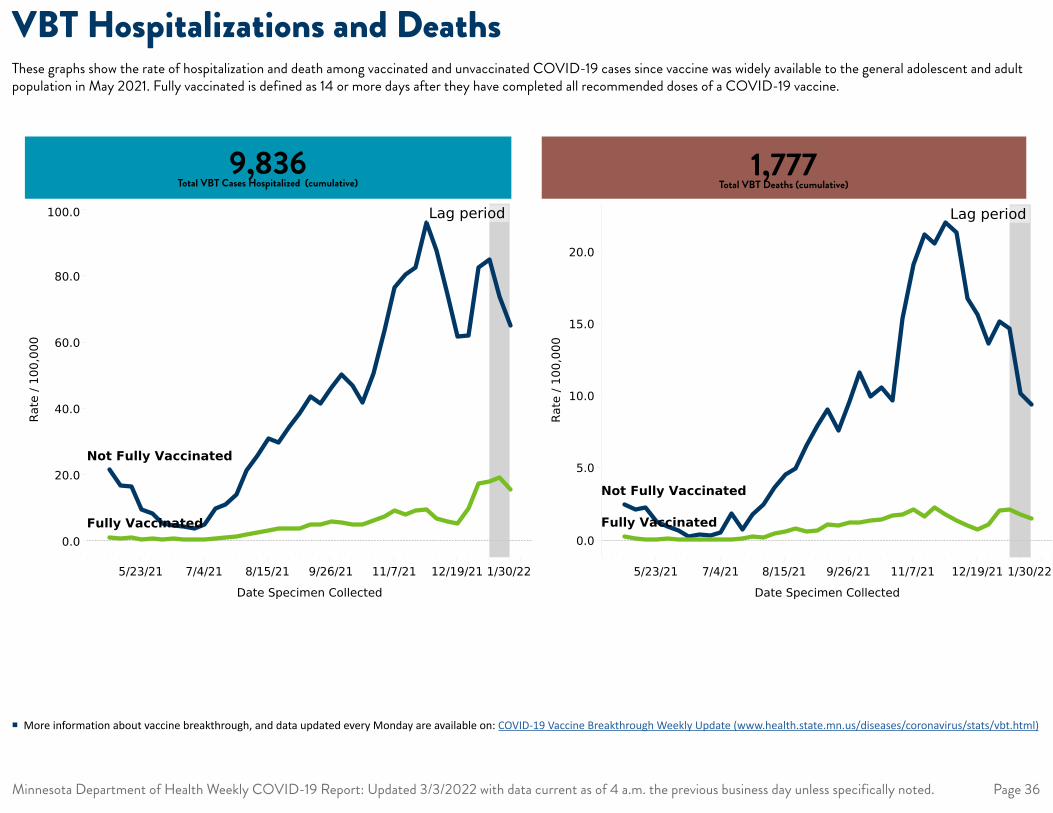
Minnesota Department of Health Weekly COVID-19 Report: Updated 3/3/2022 with data current as of 4 a.m. the previous business day unless specifically noted. Page 36
VBT Hospitalizations and DeathsThese graphs show the rate of hospitalization and death among vaccinated and unvaccinated COVID-19 cases since vaccine was widely available to the general adolescent and adult population in May 2021. Fully vaccinated is defined as 14 or more days after they have completed all recommended doses of a COVID-19 vaccine.
9,836 Total VBT Cases Hospitalized (cumulative)
1,777 Total VBT Deaths (cumulative)
5/23/21 7/4/21 8/15/21 9/26/21 11/7/21 12/19/21 1/30/22
DateSpecimenCollected
0.0
20.0
40.0
60.0
80.0
100.0
Rate
/1
00,0
00
NotFullyVaccinated
FullyVaccinated
Lagperiod
Hospitalizations:WeeklyAge-AdjustedRateHover/clickoverlinesformoreinformation
SelectOutcomeforlinechartb..
Hospitalization
5/23/21 7/4/21 8/15/21 9/26/21 11/7/21 12/19/21 1/30/22
DateSpecimenCollected
0.0
5.0
10.0
15.0
20.0
Rate
/1
00,0
00
NotFullyVaccinated
FullyVaccinated
Lagperiod
Deaths:WeeklyAge-AdjustedRateHover/clickoverlinesformoreinformation
SelectOutcomeforlinechartb..
Death
� More information about vaccine breakthrough, and data updated every Monday are available on: COVID-19 Vaccine Breakthrough Weekly Update (www.health.state.mn.us/diseases/coronavirus/stats/vbt.html)
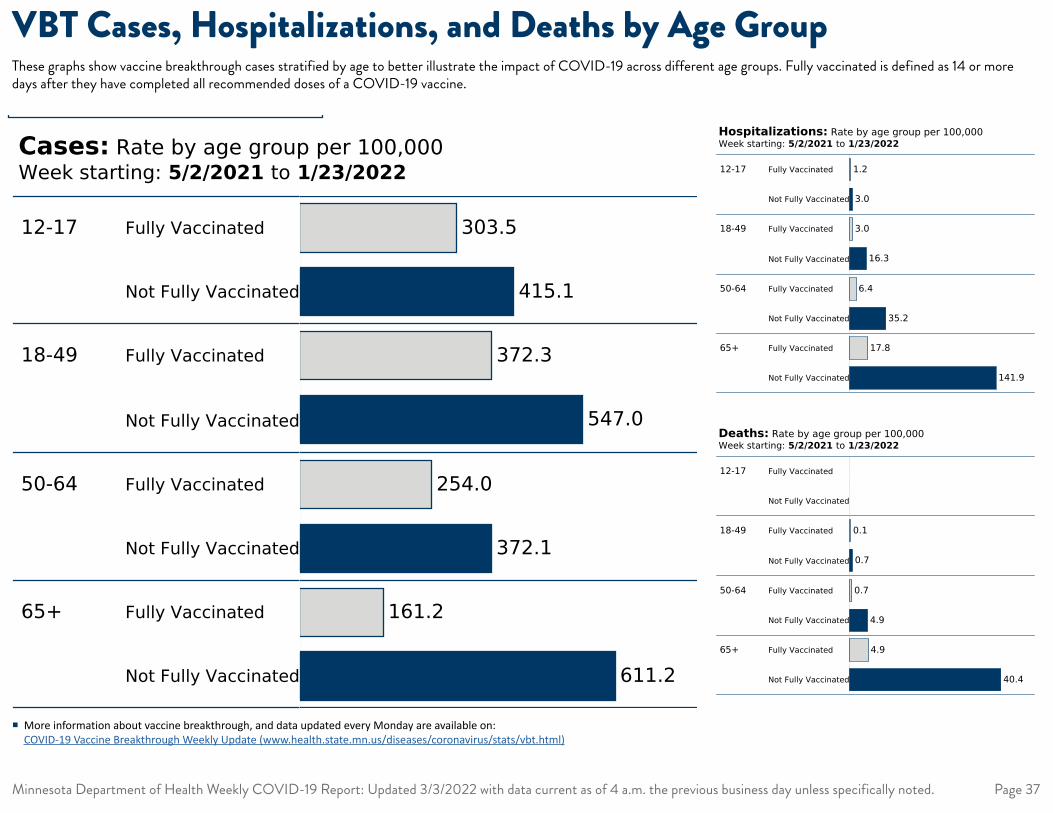
Minnesota Department of Health Weekly COVID-19 Report: Updated 3/3/2022 with data current as of 4 a.m. the previous business day unless specifically noted. Page 37
VBT Cases, Hospitalizations, and Deaths by Age Group
12-17 FullyVaccinated
NotFullyVaccinated
18-49 FullyVaccinated
NotFullyVaccinated
50-64 FullyVaccinated
NotFullyVaccinated
65+ FullyVaccinated
NotFullyVaccinated
303.5
415.1
372.3
547.0
254.0
372.1
161.2
611.2
Cases:Ratebyagegroupper100,000Weekstarting:5/2/2021to1/23/2022
SelectOutcomeforbarchartbelow
CaseSelectweekstartdataforchart
5/2/2021to1/23/2022
andNullvalues
12-17 FullyVaccinated
NotFullyVaccinated
18-49 FullyVaccinated
NotFullyVaccinated
50-64 FullyVaccinated
NotFullyVaccinated
65+ FullyVaccinated
NotFullyVaccinated
1.2
3.0
16.3
3.0
35.2
6.4
141.9
17.8
Hospitalizations:Ratebyagegroupper100,000Weekstarting:5/2/2021to1/23/2022
SelectOutcomeforbarchartbelow
HospitalizationSelectweekstartdataforchart
5/2/2021to1/23/2022
andNullvalues
12-17 FullyVaccinated
NotFullyVaccinated
18-49 FullyVaccinated
NotFullyVaccinated
50-64 FullyVaccinated
NotFullyVaccinated
65+ FullyVaccinated
NotFullyVaccinated
0.1
0.7
0.7
4.9
40.4
4.9
Deaths:Ratebyagegroupper100,000Weekstarting:5/2/2021to1/23/2022
SelectOutcomeforbarchartbelow
DeathSelectweekstartdataforchart
5/2/2021to1/23/2022
andNullvalues
These graphs show vaccine breakthrough cases stratified by age to better illustrate the impact of COVID-19 across different age groups. Fully vaccinated is defined as 14 or more days after they have completed all recommended doses of a COVID-19 vaccine.
� More information about vaccine breakthrough, and data updated every Monday are available on: COVID-19 Vaccine Breakthrough Weekly Update (www.health.state.mn.us/diseases/coronavirus/stats/vbt.html)
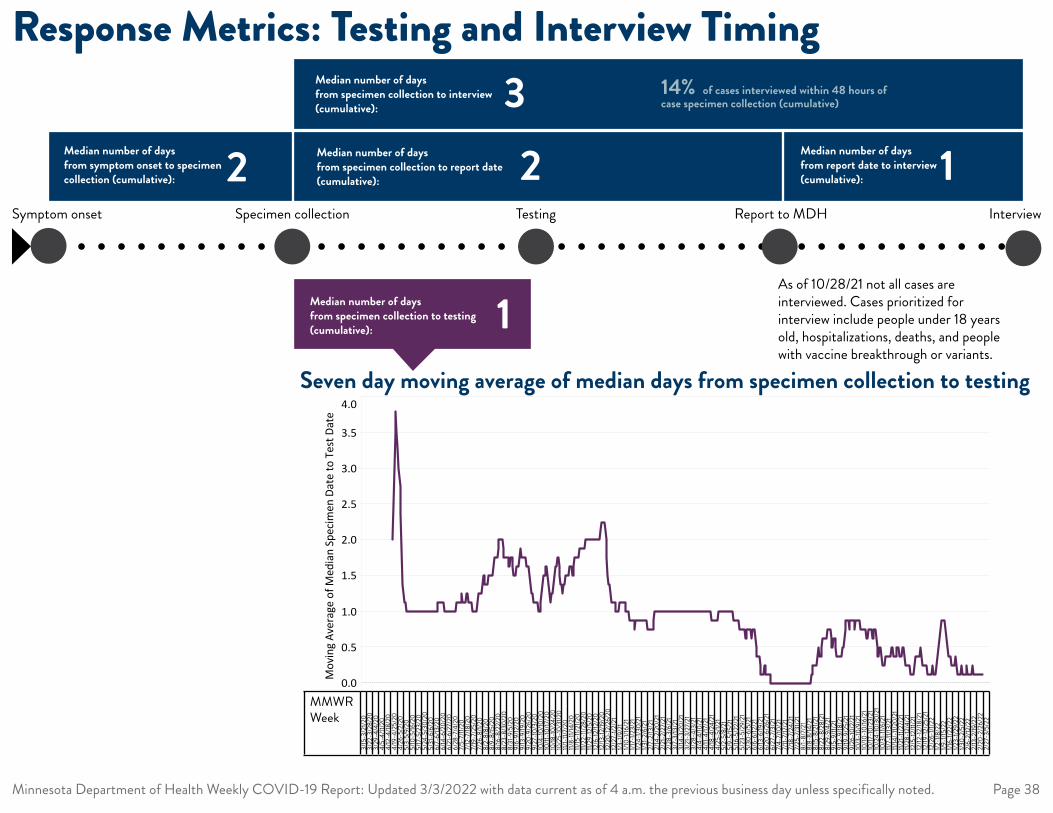
March 13, 2020 2
DAY(specimendate) MEDIAN(Specimen Date to Test Date)
March 13, 2020 2March 14, 2020 2.5March 15, 2020 3March 16, 2020 3.5March 17, 2020 3.8March 18, 2020 3.5March 19, 2020 3.285714286March 20, 2020 3March 21, 2020 2.875March 22, 2020 2.75March 23, 2020 2.375March 24, 2020 1.875March 25, 2020 1.375March 26, 2020 1.25March 27, 2020 1.125March 28, 2020 1.125March 29, 2020 1.125March 30, 2020 1March 31, 2020 1April 1, 2020 1April 2, 2020 1April 3, 2020 1April 4, 2020 1April 5, 2020 1April 6, 2020 1April 7, 2020 1April 8, 2020 1April 9, 2020 1April 10, 2020 1April 11, 2020 1April 12, 2020 1April 13, 2020 1April 14, 2020 1April 15, 2020 1April 16, 2020 1April 17, 2020 1April 18, 2020 1April 19, 2020 1April 20, 2020 1April 21, 2020 1April 22, 2020 1April 23, 2020 1April 24, 2020 1April 25, 2020 1April 26, 2020 1April 27, 2020 1April 28, 2020 1April 29, 2020 1April 30, 2020 1May 1, 2020 1May 2, 2020 1May 3, 2020 1May 4, 2020 1May 5, 2020 1May 6, 2020 1May 7, 2020 1.125May 8, 2020 1.125May 9, 2020 1.125May 10, 2020 1.125May 11, 2020 1.125May 12, 2020 1.125May 13, 2020 1.125May 14, 2020 1.125May 15, 2020 1May 16, 2020 1May 17, 2020 1May 18, 2020 1May 19, 2020 1May 20, 2020 1May 21, 2020 1May 22, 2020 1May 23, 2020 1May 24, 2020 1May 25, 2020 1May 26, 2020 1May 27, 2020 1May 28, 2020 1May 29, 2020 1.125May 30, 2020 1.125May 31, 2020 1.125June 1, 2020 1.125June 2, 2020 1.125June 3, 2020 1.125June 4, 2020 1.125June 5, 2020 1.25June 6, 2020 1.125June 7, 2020 1.125June 8, 2020 1.125June 9, 2020 1.125June 10, 2020 1.25June 11, 2020 1.25June 12, 2020 1.25June 13, 2020 1.125June 14, 2020 1.125June 15, 2020 1.125June 16, 2020 1.125June 17, 2020 1.125June 18, 2020 1June 19, 2020 1June 20, 2020 1June 21, 2020 1June 22, 2020 1June 23, 2020 1June 24, 2020 1.125June 25, 2020 1.25June 26, 2020 1.25June 27, 2020 1.25June 28, 2020 1.25June 29, 2020 1.25June 30, 2020 1.375July 1, 2020 1.5July 2, 2020 1.5July 3, 2020 1.375July 4, 2020 1.375July 5, 2020 1.375July 6, 2020 1.375July 7, 2020 1.5July 8, 2020 1.5July 9, 2020 1.5July 10, 2020 1.5July 11, 2020 1.5July 12, 2020 1.5July 13, 2020 1.625July 14, 2020 1.75July 15, 2020 1.75July 16, 2020 1.75July 17, 2020 1.75July 18, 2020 1.75July 19, 2020 1.875July 20, 2020 2July 21, 2020 2July 22, 2020 2July 23, 2020 2July 24, 2020 2July 25, 2020 1.875July 26, 2020 1.75July 27, 2020 1.75July 28, 2020 1.75July 29, 2020 1.75July 30, 2020 1.75July 31, 2020 1.75August 1, 2020 1.625August 2, 2020 1.625August 3, 2020 1.75August 4, 2020 1.75August 5, 2020 1.75August 6, 2020 1.625August 7, 2020 1.5August 8, 2020 1.5August 9, 2020 1.5August 10, 2020 1.625August 11, 2020 1.625August 12, 2020 1.625
August 13, 2020 1.625August 14, 2020 1.75August 15, 2020 1.875August 16, 2020 1.75August 17, 2020 1.75August 18, 2020 1.75August 19, 2020 1.75August 20, 2020 1.75August 21, 2020 1.75August 22, 2020 1.625August 23, 2020 1.625August 24, 2020 1.625August 25, 2020 1.625August 26, 2020 1.5August 27, 2020 1.375August 28, 2020 1.25August 29, 2020 1.25August 30, 2020 1.25August 31, 2020 1.125September 1, 2020 1.125September 2, 2020 1.125September 3, 2020 1.125September 4, 2020 1.125September 5, 2020 1.125September 6, 2020 1September 7, 2020 1September 8, 2020 1September 9, 2020 1.125September 10, 2020 1.25September 11, 2020 1.375September 12, 2020 1.5September 13, 2020 1.5September 14, 2020 1.5September 15, 2020 1.625September 16, 2020 1.625September 17, 2020 1.5September 18, 2020 1.375September 19, 2020 1.25September 20, 2020 1.125September 21, 2020 1.125September 22, 2020 1.25September 23, 2020 1.25September 24, 2020 1.375September 25, 2020 1.5September 26, 2020 1.5September 27, 2020 1.625September 28, 2020 1.625September 29, 2020 1.75September 30, 2020 1.75October 1, 2020 1.625October 2, 2020 1.5October 3, 2020 1.375October 4, 2020 1.375October 5, 2020 1.25October 6, 2020 1.375October 7, 2020 1.375October 8, 2020 1.375October 9, 2020 1.5October 10, 2020 1.5October 11, 2020 1.5October 12, 2020 1.5October 13, 2020 1.625October 14, 2020 1.625October 15, 2020 1.625October 16, 2020 1.625October 17, 2020 1.5October 18, 2020 1.5October 19, 2020 1.625October 20, 2020 1.75October 21, 2020 1.75October 22, 2020 1.75October 23, 2020 1.75October 24, 2020 1.75October 25, 2020 1.75October 26, 2020 1.875October 27, 2020 1.875October 28, 2020 1.875October 29, 2020 1.875October 30, 2020 1.875October 31, 2020 1.875November 1, 2020 1.875November 2, 2020 2November 3, 2020 2November 4, 2020 2November 5, 2020 2November 6, 2020 2November 7, 2020 2November 8, 2020 2November 9, 2020 2November 10, 2020 2November 11, 2020 2November 12, 2020 2November 13, 2020 2November 14, 2020 2November 15, 2020 2November 16, 2020 2November 17, 2020 2November 18, 2020 2November 19, 2020 2November 20, 2020 2.125November 21, 2020 2.25November 22, 2020 2.25November 23, 2020 2.25November 24, 2020 2.25November 25, 2020 2.25November 26, 2020 2.125November 27, 2020 2November 28, 2020 1.75November 29, 2020 1.5November 30, 2020 1.375December 1, 2020 1.375December 2, 2020 1.25December 3, 2020 1.125December 4, 2020 1.125December 5, 2020 1.125December 6, 2020 1.125December 7, 2020 1.125December 8, 2020 1.125December 9, 2020 1December 10, 2020 1December 11, 2020 1December 12, 2020 1December 13, 2020 1.125December 14, 2020 1.125December 15, 2020 1.125December 16, 2020 1.125December 17, 2020 1.125December 18, 2020 1.125December 19, 2020 1.125December 20, 2020 1.125December 21, 2020 1December 22, 2020 1December 23, 2020 1December 24, 2020 1December 25, 2020 0.875December 26, 2020 0.875December 27, 2020 0.875December 28, 2020 0.875December 29, 2020 0.875December 30, 2020 0.875December 31, 2020 0.875January 1, 2021 0.75January 2, 2021 0.875January 3, 2021 0.875January 4, 2021 0.875January 5, 2021 0.875January 6, 2021 0.875January 7, 2021 0.875January 8, 2021 0.875January 9, 2021 0.875January 10, 2021 0.875January 11, 2021 0.875January 12, 2021 0.875January 13, 2021 0.875January 14, 2021 0.875January 15, 2021 0.875
January 16, 2021 0.75January 17, 2021 0.75January 18, 2021 0.75January 19, 2021 0.75January 20, 2021 0.75January 21, 2021 0.75January 22, 2021 0.75January 23, 2021 0.75January 24, 2021 0.875January 25, 2021 1January 26, 2021 1January 27, 2021 1January 28, 2021 1January 29, 2021 1January 30, 2021 1January 31, 2021 1February 1, 2021 1February 2, 2021 1February 3, 2021 1February 4, 2021 1February 5, 2021 1February 6, 2021 1February 7, 2021 1February 8, 2021 1February 9, 2021 1February 10, 2021 1February 11, 2021 1February 12, 2021 1February 13, 2021 1February 14, 2021 1February 15, 2021 1February 16, 2021 1February 17, 2021 1February 18, 2021 1February 19, 2021 1February 20, 2021 1February 21, 2021 1February 22, 2021 1February 23, 2021 1February 24, 2021 1February 25, 2021 1February 26, 2021 1February 27, 2021 1February 28, 2021 1March 1, 2021 1March 2, 2021 1March 3, 2021 1March 4, 2021 1March 5, 2021 1March 6, 2021 1March 7, 2021 1March 8, 2021 1March 9, 2021 1March 10, 2021 1March 11, 2021 1March 12, 2021 1March 13, 2021 1March 14, 2021 1March 15, 2021 1March 16, 2021 1March 17, 2021 1March 18, 2021 1March 19, 2021 1March 20, 2021 1March 21, 2021 1March 22, 2021 1March 23, 2021 1March 24, 2021 1March 25, 2021 1March 26, 2021 1March 27, 2021 1March 28, 2021 1March 29, 2021 1March 30, 2021 1March 31, 2021 1April 1, 2021 1April 2, 2021 1April 3, 2021 1April 4, 2021 0.875April 5, 2021 0.875April 6, 2021 0.875April 7, 2021 0.875April 8, 2021 0.875April 9, 2021 0.875April 10, 2021 0.875April 11, 2021 0.875April 12, 2021 1April 13, 2021 1April 14, 2021 1April 15, 2021 1April 16, 2021 1April 17, 2021 1April 18, 2021 1April 19, 2021 1April 20, 2021 1April 21, 2021 1April 22, 2021 1April 23, 2021 1April 24, 2021 1April 25, 2021 1April 26, 2021 1April 27, 2021 1April 28, 2021 1April 29, 2021 1April 30, 2021 1May 1, 2021 0.875May 2, 2021 0.875May 3, 2021 0.875May 4, 2021 0.875May 5, 2021 0.875May 6, 2021 0.875May 7, 2021 0.875May 8, 2021 0.75May 9, 2021 0.75May 10, 2021 0.75May 11, 2021 0.75May 12, 2021 0.75May 13, 2021 0.75May 14, 2021 0.75May 15, 2021 0.625May 16, 2021 0.625May 17, 2021 0.75May 18, 2021 0.75May 19, 2021 0.75May 20, 2021 0.75May 21, 2021 0.75May 22, 2021 0.625May 23, 2021 0.625May 24, 2021 0.75May 25, 2021 0.75May 26, 2021 0.75May 27, 2021 0.625May 28, 2021 0.5May 29, 2021 0.375May 30, 2021 0.375May 31, 2021 0.375June 1, 2021 0.375June 2, 2021 0.25June 3, 2021 0.125June 4, 2021 0.125June 5, 2021 0.125June 6, 2021 0.125June 7, 2021 0.25June 8, 2021 0.25June 9, 2021 0.125June 10, 2021 0.125June 11, 2021 0.125June 12, 2021 0.125June 13, 2021 0.125June 14, 2021 0.125June 15, 2021 0June 16, 2021 0June 17, 2021 0June 18, 2021 0June 19, 2021 0June 20, 2021 0
June 21, 2021 0June 22, 2021 0June 23, 2021 0June 24, 2021 0June 25, 2021 0June 26, 2021 0June 27, 2021 0June 28, 2021 0June 29, 2021 0June 30, 2021 0July 1, 2021 0July 2, 2021 0July 3, 2021 0July 4, 2021 0July 5, 2021 0July 6, 2021 0July 7, 2021 0July 8, 2021 0July 9, 2021 0July 10, 2021 0July 11, 2021 0July 12, 2021 0July 13, 2021 0July 14, 2021 0July 15, 2021 0July 16, 2021 0July 17, 2021 0July 18, 2021 0July 19, 2021 0July 20, 2021 0July 21, 2021 0July 22, 2021 0July 23, 2021 0July 24, 2021 0July 25, 2021 0July 26, 2021 0July 27, 2021 0July 28, 2021 0July 29, 2021 0July 30, 2021 0July 31, 2021 0August 1, 2021 0August 2, 2021 0August 3, 2021 0.125August 4, 2021 0.125August 5, 2021 0.25August 6, 2021 0.25August 7, 2021 0.25August 8, 2021 0.25August 9, 2021 0.25August 10, 2021 0.375August 11, 2021 0.375August 12, 2021 0.5August 13, 2021 0.375August 14, 2021 0.375August 15, 2021 0.375August 16, 2021 0.5August 17, 2021 0.625August 18, 2021 0.625August 19, 2021 0.625August 20, 2021 0.625August 21, 2021 0.625August 22, 2021 0.625August 23, 2021 0.75August 24, 2021 0.75August 25, 2021 0.75August 26, 2021 0.75August 27, 2021 0.625August 28, 2021 0.5August 29, 2021 0.5August 30, 2021 0.625August 31, 2021 0.625September 1, 2021 0.625September 2, 2021 0.5September 3, 2021 0.375September 4, 2021 0.375September 5, 2021 0.375September 6, 2021 0.375September 7, 2021 0.375September 8, 2021 0.375September 9, 2021 0.375September 10, 2021 0.5September 11, 2021 0.5September 12, 2021 0.625September 13, 2021 0.75September 14, 2021 0.875September 15, 2021 0.875September 16, 2021 0.875September 17, 2021 0.875September 18, 2021 0.75September 19, 2021 0.875September 20, 2021 0.875September 21, 2021 0.875September 22, 2021 0.875September 23, 2021 0.875September 24, 2021 0.875September 25, 2021 0.75September 26, 2021 0.875September 27, 2021 0.875September 28, 2021 0.875September 29, 2021 0.875September 30, 2021 0.875October 1, 2021 0.875October 2, 2021 0.75October 3, 2021 0.75October 4, 2021 0.75October 5, 2021 0.75October 6, 2021 0.75October 7, 2021 0.75October 8, 2021 0.75October 9, 2021 0.625October 10, 2021 0.625October 11, 2021 0.75October 12, 2021 0.75October 13, 2021 0.75October 14, 2021 0.75October 15, 2021 0.75October 16, 2021 0.625October 17, 2021 0.625October 18, 2021 0.75October 19, 2021 0.75October 20, 2021 0.75October 21, 2021 0.625October 22, 2021 0.5October 23, 2021 0.375October 24, 2021 0.375October 25, 2021 0.5October 26, 2021 0.5October 27, 2021 0.5October 28, 2021 0.375October 29, 2021 0.375October 30, 2021 0.375October 31, 2021 0.375November 1, 2021 0.5November 2, 2021 0.5November 3, 2021 0.5November 4, 2021 0.375November 5, 2021 0.375November 6, 2021 0.375November 7, 2021 0.375November 8, 2021 0.5November 9, 2021 0.5November 10, 2021 0.5November 11, 2021 0.5November 12, 2021 0.5November 13, 2021 0.5November 14, 2021 0.5November 15, 2021 0.625November 16, 2021 0.625November 17, 2021 0.625November 18, 2021 0.5November 19, 2021 0.375November 20, 2021 0.375November 21, 2021 0.375November 22, 2021 0.5November 23, 2021 0.5
November 24, 2021 0.375November 25, 2021 0.25November 26, 2021 0.25November 27, 2021 0.25November 28, 2021 0.25November 29, 2021 0.375November 30, 2021 0.375December 1, 2021 0.375December 2, 2021 0.375December 3, 2021 0.5December 4, 2021 0.5December 5, 2021 0.5
Median Onset to Collec�onMedian Onset to InterviewMedian Specimen Date to InterviewMedian Report Date to Interview 1
352
Timeliness (in days)
14.22%
Percentage of Cases Interviewed within 2Days of Specimen Collec�on
Mar 1, 20 Jun 1, 20 Sep 1, 20 Dec 1, 20 Mar 1, 21 Jun 1, 21 Sep 1, 21 Dec 1, 21 Mar 1, 22Day of Specimendate
0.0
0.5
1.0
1.5
2.0
2.5
3.0
3.5
4.0
Mov
ing
Aver
age
of M
edia
n Sp
ecim
en D
ate
to T
est D
ate
Seven Day Moving Average of Median Days from Specimen Collec�on to Tes�ng
Median Specimen Date to Test Date
Median Sp to Create Date 1
1
Seven day moving average of median days from specimen collection to testing
Symptom onset Specimen collection Testing Report to MDH Interview
MMWR Week
3/15
-3/2
1/20
3/22
-3/2
8/20
3/29
-4/4
/20
4/5-
4/11/
204/
12-4
/18/2
04/
19-4
/25/
204/
26-5
/2/2
05/
3-5/
9/20
5/10
-5/16
/20
5/17
-5/2
3/20
5/24
-5/3
0/20
5/31
-6/6
/20
6/7-
6/13
/20
6/14
-6/2
0/20
6/21
-6/2
7/20
6/28
-7/4
/20
7/5-
7/11/
207/
12-7
/18/2
07/
19-7
/25/
207/
26-8
/1/20
8/2-
8/8/
208/
9-8/
15/2
08/
16-8
/22/
208/
23-8
/30/
208/
31-9
/5/2
09/
6-9/
12/2
09/
13-9
/19/2
09/
20-9
/26/
209/
27-1
0/3/
2010
/4-1
0/10
/20
10/11
-10/
17/2
010
/18-10
/24/
2010
/25-
10/3
1/20
11/1-
11/7/
2011/
8-11/
14/2
011/
15-1
1/21/2
011/
22-11
/28/
2011/
29-1
2/5/
2012
/6-1
2/12
/20
12/13
-12/19
/20
12/2
0-12
/26/
2012
/27-
1/2/2
11/3
-1/9
/21
1/10-
1/16/
211/1
7-1/2
3/21
1/24-
1/30/
211/3
1-2/
6/21
2/7-
2/13
/21
2/14
-2/2
0/21
2/21
-2/2
7/21
2/28
-3/6
/21
3/7-
3/13
/21
3/14
-3/2
0/21
3/21
-3/2
7/21
3/28
-4/3
/21
4/4-
4/10
/21
4/11-
4/17
/21
4/18
-4/2
4/21
4/25
-5/1/
215/
2-5/
8/21
5/9-
5/15
/21
5/16
-5/2
2/21
5/23
-5/2
9/21
5/30
-6/5
/21
6/6-
6/12
/21
6/13
-6/19
/21
6/20
-6/2
6/21
6/27
-7/3
/21
7/4-
7/10
/21
7/11-
7/17
/21
7/18
-7/2
4/21
7/25
-7/3
1/21
8/1-
8/7/
218/
8-8/
14/2
18/
15-8
/21/2
18/
22-8
/28/
218/
29-9
/4/2
19/
5-9/
11/21
9/12
-9/18
/21
9/19
-9/2
5/21
9/26
-10/
2/21
10/3
-10/
9/21
10/10
-10/
16/2
110
/17-1
0/23
/21
10/2
4-10
/30/
2110
/31-
11/6/
2111/
7-11/
13/2
111/
14/-
11/20
/21
11/21
-11/2
7/21
11/28
-12/
4/21
12/5
-12/
11/21
12/12
-12/
18/2
112
/19-1
2/25
/21
12/2
6-1/1
/22
1/2-1
/8/2
21/9
-1/15
/22
1/16-
1/22/
221/2
3-1/2
9/22
1/30-
2/5/
222/
6-2/
12/2
22/
13-2
/19/2
22/
20-2
/26/
222/
27-3
/5/2
2
Minnesota Department of Health Weekly COVID-19 Report: Updated 3/3/2022 with data current as of 4 a.m. the previous business day unless specifically noted. Page 38
Response Metrics: Testing and Interview Timing3Median number of days
from specimen collection to interview (cumulative):
14% of cases interviewed within 48 hours of case specimen collection (cumulative)
2Median number of days from symptom onset to specimen collection (cumulative): 2Median number of days
from specimen collection to report date (cumulative): 1Median number of days
from report date to interview (cumulative):
1Median number of days from specimen collection to testing (cumulative):
As of 10/28/21 not all cases are interviewed. Cases prioritized for interview include people under 18 years old, hospitalizations, deaths, and people with vaccine breakthrough or variants.
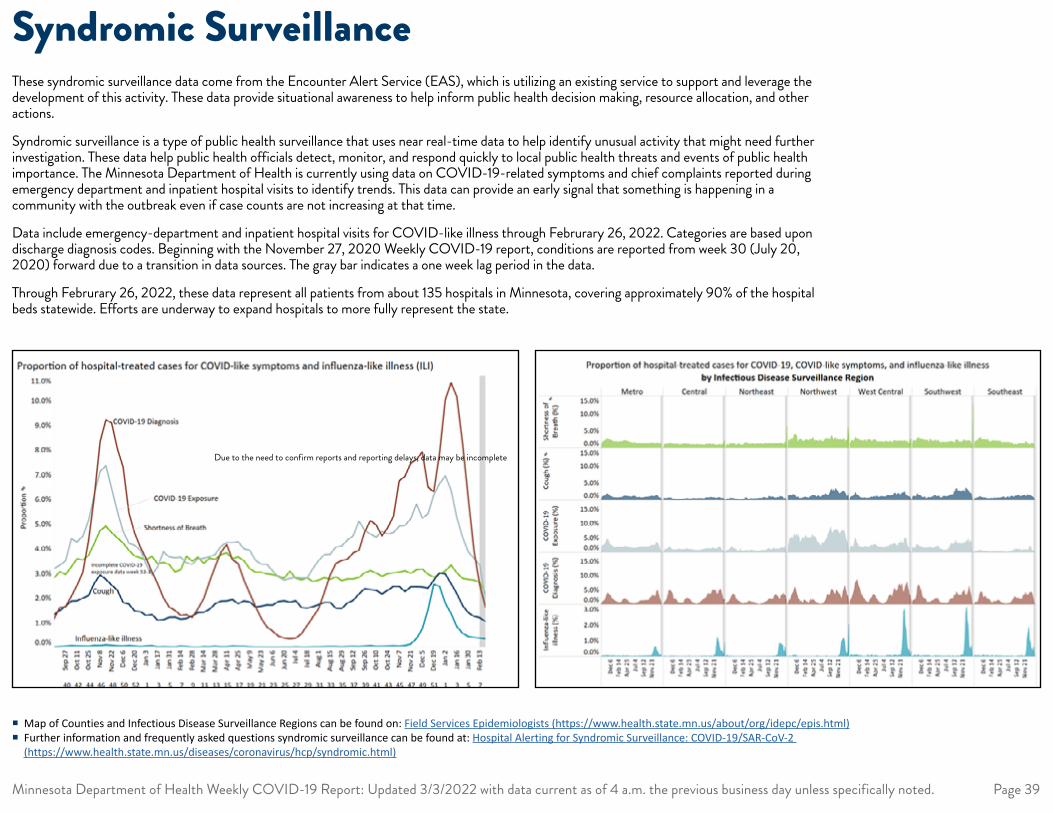
Week of visit_admit_datetime
COVID-19 Diagnosis (%) COVID-19 Exposure (%) Cough (%) Influenza-like illness (%)
Shortness of Breath (%)
Jul 19 1.3% 2.4% 1.6% 0.0% 3.3%
Jul 26 1.4% 2.5% 1.5% 0.0% 3.3%
Aug 2 1.5% 2.6% 1.7% 0.0% 3.4%
Aug 9 1.5% 3.3% 1.7% 0.0% 3.8%
Aug 16 1.3% 3.1% 1.3% 0.0% 2.9%
Aug 23 1.2% 2.7% 1.1% 0.0% 2.7%
Aug 30 1.1% 2.8% 1.1% 0.0% 2.7%
Sep 6 1.0% 3.1% 1.2% 0.0% 2.6%
Sep 13 1.2% 3.2% 1.3% 0.0% 2.8%
Sep 20 1.6% 3.3% 1.5% 0.0% 3.1%
Sep 27 1.6% 3.5% 1.7% 0.1% 3.0%
Oct 4 2.1% 4.4% 1.9% 0.1% 3.3%
Oct 11 2.5% 4.3% 1.9% 0.1% 3.6%
Oct 18 3.0% 4.5% 2.0% 0.1% 3.5%
Oct 25 4.3% 5.1% 2.1% 0.1% 3.7%
Nov 1 6.1% 6.2% 2.6% 0.1% 4.2%
Nov 8 8.3% 7.1% 2.9% 0.1% 4.7%
Nov 15 9.2% 7.4% 2.8% 0.1% 4.9%
Nov 22 9.1% 6.4% 2.5% 0.1% 4.7%
Nov 29 8.0% 5.5% 2.3% 0.1% 4.4%
Dec 6 7.3% 4.7% 1.8% 0.1% 4.2%
Dec 13 5.5% 4.2% 1.8% 0.1% 3.9%
Dec 20 4.6% 4.1% 1.5% 0.1% 3.7%
Dec 27 4.1% 3.9% 1.4% 0.0% 3.6%
Jan 3 3.6% 3.4% 1.3% 0.1% 3.6%
Jan 10 3.1% 2.9% 1.3% 0.1% 3.7%
Jan 17 2.6% 3.3% 1.1% 0.0% 3.4%
Jan 24 2.0% 3.9% 1.1% 0.0% 3.4%
Jan 31 1.6% 3.7% 1.2% 0.0% 3.4%
Feb 7 1.5% 3.6% 1.2% 0.0% 3.1%
Feb 14 1.3% 3.7% 1.1% 0.1% 3.1%
Feb 21 1.3% 3.4% 1.2% 0.0% 3.7%
Feb 28 1.2% 3.4% 1.3% 0.0% 3.5%
Mar 7 1.6% 3.6% 1.4% 0.0% 3.7%
Mar 14 2.0% 3.6% 1.4% 0.0% 3.4%
Mar 21 2.7% 3.7% 1.5% 0.0% 3.6%
Mar 28 3.3% 3.8% 1.8% 0.1% 3.6%
Apr 4 3.9% 4.1% 1.9% 0.0% 3.8%
Apr 11 4.2% 4.3% 1.9% 0.0% 3.8%
Apr 18 3.6% 4.2% 1.9% 0.1% 3.6%
Apr 25 3.4% 4.3% 1.8% 0.0% 3.7%
May 2 2.7% 4.0% 1.9% 0.0% 3.5%
May 9 2.2% 3.9% 1.8% 0.0% 3.2%
May 16 1.7% 3.5% 1.6% 0.0% 3.0%
May 23 1.2% 3.4% 1.7% 0.0% 3.0%
May 30 0.8% 3.4% 1.7% 0.0% 3.0%
Jun 6 0.6% 3.1% 1.7% 0.0% 3.0%
Jun 13 0.5% 2.8% 1.9% 0.0% 2.9%
Jun 20 0.4% 2.7% 1.9% 0.0% 2.8%
Jun 27 0.3% 2.8% 1.8% 0.0% 3.1%
Jul 4 0.4% 2.8% 1.9% 0.0% 2.8%
Jul 11 0.5% 2.8% 1.6% 0.0% 2.7%
Jul 18 0.9% 2.8% 1.6% 0.0% 2.8%
Jul 25 1.2% 3.2% 1.7% 0.0% 2.7%
Aug 1 1.6% 3.5% 1.7% 0.0% 2.7%
Aug 8 2.2% 3.8% 1.8% 0.0% 2.8%
Aug 15 2.9% 3.8% 1.8% 0.0% 2.8%
Aug 22 3.4% 4.1% 1.6% 0.0% 2.9%
Aug 29 3.5% 4.1% 1.6% 0.0% 2.7%
Sep 5 3.6% 4.3% 1.8% 0.0% 2.8%
Sep 12 3.8% 4.5% 1.9% 0.0% 2.8%
Sep 19 3.9% 5.1% 2.2% 0.0% 2.8%
Sep 26 4.7% 4.8% 2.4% 0.1% 3.0%
Oct 3 5.1% 4.6% 2.3% 0.1% 3.1%
Oct 10 5.0% 4.5% 2.3% 0.0% 3.0%
Oct 17 4.5% 4.7% 2.2% 0.0% 2.9%
Oct 24 4.9% 4.6% 2.3% 0.1% 3.0%
Oct 31 5.3% 4.7% 2.5% 0.1% 3.0%
Nov 7 6.8% 4.9% 2.5% 0.1% 3.0%
Nov 14 6.9% 4.9% 2.3% 0.1% 3.1%
Nov 21 7.5% 5.2% 2.5% 0.1% 3.0%
Nov 28 7.6% 5.8% 2.4% 0.4% 3.1%
Dec 5 7.9% 5.2% 2.4% 0.7% 3.2%
Dec 12 6.5% 5.4% 2.4% 1.5% 2.9%
Dec 19 6.3% 6.2% 2.7% 2.6% 2.8%
Dec 26 7.9% 6.6% 3.0% 2.5% 3.0%
Jan 2 10.0% 6.9% 3.0% 1.8% 3.1%
Jan 9 10.6% 6.2% 2.6% 1.4% 3.3%
Jan 16 9.9% 4.8% 2.1% 0.8% 3.0%
Jan 23 7.2% 2.2% 1.4% 0.5% 2.3%
MMWR Week Shortness of Breath (%)
Cough (%) COVID-19 Exposure (%)
COVID-19 Diagnosis (%)
Influenza-like illness (%)
Jul 19 4.5% 2.3% 3.7% 1.8% 0.1%
Jul 26 4.5% 2.2% 3.8% 2.0% 0.1%
Aug 2 4.8% 2.5% 3.9% 2.3% 0.0%
Aug 9 5.1% 2.5% 4.8% 2.3% 0.0%
Aug 16 3.6% 1.8% 4.4% 1.8% 0.1%
Aug 23 3.3% 1.4% 3.9% 1.5% 0.0%
Aug 30 3.3% 1.4% 4.0% 1.3% 0.0%
Sep 6 3.3% 1.5% 4.2% 1.1% 0.0%
Sep 13 3.4% 1.5% 4.1% 1.2% 0.0%
Sep 20 3.5% 1.7% 4.0% 1.4% 0.0%
Sep 27 3.2% 1.9% 4.1% 1.5% 0.0%
Oct 4 3.6% 2.2% 5.1% 1.9% 0.1%
Oct 11 4.0% 2.4% 5.0% 2.3% 0.1%
Oct 18 4.1% 2.4% 5.2% 2.6% 0.1%
Oct 25 4.4% 2.7% 6.2% 3.7% 0.0%
Nov 1 4.8% 3.3% 7.6% 5.3% 0.1%
Nov 8 5.4% 3.7% 8.9% 7.0% 0.1%
Nov 15 5.6% 3.6% 9.0% 8.1% 0.1%
Nov 22 5.1% 3.2% 8.2% 7.4% 0.1%
Nov 29 5.2% 2.7% 6.6% 6.6% 0.1%
Dec 6 4.7% 2.4% 5.7% 6.7% 0.1%
Dec 13 4.6% 2.3% 5.0% 5.0% 0.1%
Dec 20 4.2% 1.9% 4.7% 4.4% 0.1%
Dec 27 4.1% 1.9% 4.4% 3.8% 0.0%
Jan 3 3.9% 1.5% 4.0% 3.3% 0.1%
Jan 10 3.9% 1.7% 3.1% 2.7% 0.1%
Jan 17 3.5% 1.4% 3.2% 2.4% 0.0%
Jan 24 4.0% 1.4% 3.7% 2.0% 0.0%
Jan 31 3.7% 1.6% 3.8% 1.7% 0.0%
Feb 7 3.5% 1.5% 3.7% 1.7% 0.0%
Feb 14 3.5% 1.5% 3.6% 1.4% 0.1%
Feb 21 3.9% 1.4% 3.5% 1.4% 0.0%
Feb 28 3.9% 1.6% 3.5% 1.2% 0.0%
Mar 7 3.7% 1.6% 3.6% 1.5% 0.0%
Mar 14 3.8% 1.6% 3.7% 1.9% 0.1%
Mar 21 3.9% 1.8% 3.8% 2.8% 0.0%
Mar 28 4.0% 2.2% 4.0% 3.4% 0.1%
Apr 4 4.4% 2.3% 4.1% 3.9% 0.0%
Apr 11 4.5% 2.3% 4.4% 4.2% 0.1%
Apr 18 4.3% 2.4% 4.0% 3.3% 0.1%
Apr 25 4.0% 2.1% 3.9% 3.2% 0.0%
May 2 4.0% 2.4% 4.0% 2.6% 0.1%
May 9 3.7% 2.1% 3.8% 2.1% 0.0%
May 16 3.6% 2.0% 3.3% 1.4% 0.0%
May 23 3.6% 1.9% 3.3% 1.1% 0.0%
May 30 3.3% 1.9% 3.1% 0.6% 0.0%
Jun 6 3.1% 2.0% 2.9% 0.6% 0.0%
Jun 13 3.2% 2.1% 2.7% 0.4% 0.0%
Jun 20 3.0% 2.3% 3.0% 0.4% 0.0%
Jun 27 3.4% 2.1% 2.7% 0.4% 0.0%
Jul 4 3.1% 2.3% 2.9% 0.5% 0.0%
Jul 11 2.9% 1.8% 3.0% 0.6% 0.0%
Jul 18 2.9% 1.6% 2.8% 0.9% 0.0%
Jul 25 2.7% 1.7% 3.1% 1.3% 0.0%
Aug 1 2.7% 1.7% 3.3% 1.5% 0.0%
Aug 8 2.8% 1.8% 3.7% 1.9% 0.0%
Aug 15 2.5% 1.6% 3.4% 2.4% 0.1%
Aug 22 2.8% 1.5% 3.8% 2.7% 0.0%
Aug 29 2.6% 1.4% 3.6% 2.6% 0.0%
Sep 5 2.4% 1.6% 3.9% 2.4% 0.0%
Sep 12 2.6% 1.6% 3.9% 2.7% 0.1%
Sep 19 2.7% 1.5% 4.2% 2.5% 0.0%
Sep 26 2.7% 1.8% 3.7% 2.9% 0.1%
Oct 3 2.9% 1.9% 3.9% 2.8% 0.1%
Oct 10 2.7% 1.8% 3.9% 2.8% 0.1%
Oct 17 2.5% 1.8% 3.8% 2.7% 0.1%
Oct 24 2.7% 1.9% 4.0% 2.8% 0.1%
Oct 31 2.9% 2.0% 4.3% 3.3% 0.1%
Nov 7 3.0% 2.2% 4.4% 4.9% 0.0%
Nov 14 3.0% 2.1% 4.6% 4.8% 0.1%
Nov 21 3.0% 2.3% 4.9% 5.7% 0.2%
Nov 28 3.1% 2.3% 5.2% 6.2% 0.4%
Dec 5 3.1% 2.2% 4.9% 6.4% 0.6%
Dec 12 2.8% 2.1% 4.5% 5.2% 1.0%
Dec 19 2.5% 2.3% 5.2% 5.5% 1.2%
Dec 26 2.8% 2.5% 5.8% 7.1% 1.2%
Jan 2 3.0% 2.9% 7.3% 9.3% 0.9%
Jan 9 3.2% 2.5% 6.6% 9.7% 0.6%
Jan 16 2.8% 1.8% 5.1% 7.5% 0.4%
Jan 23 2.2% 1.2% 1.9% 5.5% 0.2%
Jul 19 1.8% 0.6% 0.8% 0.5% 0.0%
Jul 26 1.9% 0.7% 1.0% 0.4% 0.0%
Aug 2 1.6% 0.6% 0.6% 0.5% 0.0%
Aug 9 1.7% 0.8% 0.9% 0.3% 0.0%
Aug 16 1.6% 0.7% 0.6% 0.3% 0.0%
Aug 23 1.3% 0.6% 0.6% 0.6% 0.0%
Aug 30 1.4% 0.8% 0.6% 0.6% 0.0%
Sep 6 1.4% 0.7% 0.8% 0.5% 0.0%
Sep 13 1.6% 1.0% 0.7% 1.0% 0.0%
Sep 20 1.9% 1.0% 1.3% 1.5% 0.0%
Sep 27 1.8% 1.3% 1.5% 1.4% 0.0%
Oct 4 2.2% 1.2% 1.9% 1.9% 0.0%
Oct 11 2.2% 0.9% 2.0% 2.6% 0.0%
Oct 18 2.5% 1.2% 2.3% 3.4% 0.0%
Oct 25 2.0% 1.2% 2.3% 5.4% 0.0%
Nov 1 2.5% 1.5% 2.8% 7.4% 0.0%
Nov 8 2.7% 1.3% 3.6% 10.1% 0.0%
Nov 15 2.7% 1.4% 3.6% 9.5% 0.0%
Nov 22 3.0% 1.5% 2.8% 9.3% 0.0%
Nov 29 2.4% 1.4% 2.4% 8.6% 0.0%
Dec 6 2.4% 0.7% 1.7% 7.8% 0.0%
Dec 13 2.4% 0.8% 1.7% 4.7% 0.1%
Dec 20 2.3% 0.7% 2.0% 3.9% 0.0%
Dec 27 2.1% 0.7% 1.7% 3.6% 0.0%
Jan 3 2.1% 0.6% 1.5% 3.5% 0.0%
Jan 10 2.5% 0.7% 1.9% 3.0% 0.0%
Jan 17 2.4% 0.5% 2.1% 1.9% 0.0%
Jan 24 2.2% 0.6% 2.4% 1.3% 0.0%
Jan 31 1.9% 0.6% 2.3% 1.2% 0.0%
Feb 7 2.0% 0.5% 2.2% 1.0% 0.0%
Feb 14 1.8% 0.6% 2.1% 0.9% 0.0%
Feb 21 2.4% 0.6% 2.0% 1.0% 0.0%
Feb 28 2.0% 0.5% 1.7% 1.0% 0.0%
Mar 7 2.3% 1.0% 2.1% 1.2% 0.0%
Mar 14 2.2% 0.7% 2.0% 2.0% 0.0%
Mar 21 2.5% 0.9% 1.8% 3.1% 0.0%
Mar 28 2.6% 0.8% 2.1% 3.9% 0.0%
Apr 4 2.4% 1.0% 2.8% 4.3% 0.0%
Apr 11 2.3% 1.1% 2.2% 4.7% 0.0%
Apr 18 2.1% 0.9% 2.1% 4.1% 0.0%
Apr 25 2.4% 1.0% 2.3% 3.9% 0.1%
May 2 2.1% 0.6% 2.0% 3.5% 0.0%
May 9 1.9% 0.9% 1.9% 2.7% 0.0%
May 16 1.8% 0.7% 1.9% 2.1% 0.0%
May 23 2.0% 1.0% 1.8% 1.6% 0.0%
May 30 2.2% 1.1% 1.9% 1.0% 0.0%
Jun 6 1.9% 0.9% 1.7% 0.7% 0.0%
Jun 13 1.9% 1.0% 1.2% 0.4% 0.0%
Jun 20 1.8% 0.9% 1.5% 0.3% 0.0%
Jun 27 2.4% 0.9% 1.4% 0.2% 0.0%
Jul 4 1.8% 1.0% 1.2% 0.3% 0.0%
Jul 11 2.1% 1.0% 1.4% 0.5% 0.0%
Jul 18 1.9% 1.1% 1.3% 0.9% 0.0%
Jul 25 2.1% 1.2% 1.6% 1.1% 0.0%
Aug 1 2.1% 0.9% 1.7% 1.8% 0.0%
Aug 8 1.8% 1.0% 1.7% 2.3% 0.0%
Aug 15 2.1% 1.2% 2.1% 2.5% 0.0%
Aug 22 1.9% 0.8% 1.9% 3.4% 0.1%
Aug 29 1.7% 0.9% 1.9% 3.7% 0.0%
Sep 5 1.9% 1.1% 2.4% 4.4% 0.0%
Sep 12 2.0% 1.2% 2.3% 4.8% 0.0%
Sep 19 2.2% 1.6% 2.6% 4.9% 0.1%
Sep 26 2.1% 1.5% 2.4% 6.4% 0.0%
Oct 3 2.1% 1.3% 2.3% 7.7% 0.0%
Oct 10 2.3% 1.6% 2.6% 7.6% 0.0%
Oct 17 2.3% 1.3% 2.7% 7.2% 0.0%
Oct 24 2.1% 1.8% 2.2% 7.4% 0.0%
Oct 31 2.1% 1.7% 2.4% 7.9% 0.0%
Nov 7 2.0% 1.5% 3.1% 9.4% 0.0%
Nov 14 2.1% 1.4% 3.0% 9.8% 0.0%
Nov 21 2.2% 1.6% 2.5% 9.9% 0.1%
Nov 28 1.9% 1.2% 2.8% 9.0% 0.1%
Dec 5 1.7% 1.4% 2.3% 9.9% 0.4%
Dec 12 1.9% 1.2% 2.2% 8.1% 1.3%
Dec 19 1.8% 1.3% 2.4% 7.4% 2.5%
Dec 26 1.9% 1.4% 3.2% 7.6% 2.0%
Jan 2 2.0% 1.7% 3.7% 9.1% 1.8%
Jan 9 2.1% 1.5% 3.3% 9.9% 1.1%
Jan 16 2.0% 1.4% 2.7% 10.4% 0.7%
Jan 23 1.5% 0.9% 1.3% 8.2% 0.6%
Jul 19 1.3% 0.5% 1.2% 0.4% 0.0%
Jul 26 1.6% 0.6% 1.0% 0.6% 0.0%
MMWR Week Shortness of Breath (%)
Cough (%) COVID-19 Exposure (%)
COVID-19 Diagnosis (%)
Influenza-like illness (%)
Aug 2 2.1% 0.5% 0.9% 0.6% 0.0%
Aug 9 1.5% 0.7% 0.6% 0.6% 0.0%
Aug 16 2.3% 0.4% 0.7% 0.6% 0.1%
Aug 23 1.8% 0.4% 0.5% 0.4% 0.0%
Aug 30 1.6% 0.5% 0.7% 0.8% 0.0%
Sep 6 1.7% 0.4% 0.6% 0.8% 0.0%
Sep 13 1.5% 0.4% 0.8% 1.1% 0.0%
Sep 20 2.2% 0.5% 1.0% 0.9% 0.0%
Sep 27 1.6% 0.6% 0.9% 0.8% 0.0%
Oct 4 1.8% 0.9% 1.6% 1.4% 0.2%
Oct 11 2.2% 0.8% 1.7% 1.7% 0.0%
Oct 18 1.5% 0.7% 1.6% 1.8% 0.0%
Oct 25 1.9% 0.9% 2.0% 2.8% 0.1%
Nov 1 2.6% 1.4% 3.1% 3.6% 0.0%
Nov 8 2.5% 1.0% 2.8% 5.3% 0.0%
Nov 15 2.9% 1.2% 4.3% 6.3% 0.0%
Nov 22 2.3% 1.2% 2.6% 7.5% 0.0%
Nov 29 2.3% 1.1% 2.5% 7.2% 0.0%
Dec 6 2.9% 0.5% 2.8% 6.7% 0.0%
Dec 13 1.5% 0.8% 1.8% 4.6% 0.0%
Dec 20 1.7% 0.8% 2.2% 3.6% 0.0%
Dec 27 2.0% 0.7% 1.4% 3.4% 0.0%
Jan 3 2.3% 0.3% 1.0% 2.3% 0.0%
Jan 10 2.3% 0.3% 0.8% 2.3% 0.0%
Jan 17 2.4% 0.6% 1.1% 2.1% 0.0%
Jan 24 1.7% 0.4% 2.5% 1.4% 0.0%
Jan 31 1.8% 0.2% 1.3% 1.0% 0.0%
Feb 7 1.8% 0.3% 0.9% 0.6% 0.0%
Feb 14 1.6% 0.5% 1.1% 0.3% 0.0%
Feb 21 2.3% 0.7% 0.9% 0.7% 0.0%
Feb 28 3.1% 0.7% 1.3% 0.9% 0.0%
Mar 7 3.4% 1.4% 1.4% 0.7% 0.0%
Mar 14 2.7% 1.4% 1.3% 1.0% 0.0%
Mar 21 3.4% 1.3% 1.5% 1.4% 0.0%
Mar 28 2.6% 0.8% 1.1% 1.4% 0.0%
Apr 4 2.2% 0.5% 1.3% 2.5% 0.0%
Apr 11 2.6% 0.7% 1.4% 2.0% 0.0%
Apr 18 1.9% 0.9% 1.3% 2.1% 0.0%
Apr 25 2.4% 0.9% 1.7% 1.7% 0.0%
May 2 2.6% 1.1% 1.5% 1.5% 0.0%
May 9 2.7% 0.7% 1.3% 1.6% 0.0%
May 16 2.2% 1.0% 1.4% 1.7% 0.0%
May 23 2.0% 1.0% 1.1% 0.9% 0.0%
May 30 2.4% 0.9% 1.0% 0.9% 0.0%
Jun 6 2.5% 1.1% 1.0% 0.6% 0.0%
Jun 13 2.3% 0.9% 0.9% 0.3% 0.0%
Jun 20 2.4% 0.9% 0.8% 0.2% 0.0%
Jun 27 2.5% 1.3% 0.7% 0.1% 0.0%
Jul 4 2.1% 1.1% 0.6% 0.1% 0.0%
Jul 11 2.5% 1.2% 1.2% 0.3% 0.0%
Jul 18 2.4% 1.2% 1.1% 0.4% 0.0%
Jul 25 2.4% 1.4% 1.5% 0.6% 0.0%
Aug 1 2.3% 1.2% 1.6% 0.5% 0.0%
Aug 8 2.4% 1.6% 1.6% 1.1% 0.0%
Aug 15 2.1% 1.6% 1.3% 1.5% 0.0%
Aug 22 3.1% 1.4% 1.4% 1.9% 0.0%
Aug 29 2.9% 1.2% 1.4% 1.8% 0.0%
Sep 5 2.1% 1.2% 2.2% 2.4% 0.0%
Sep 12 2.6% 1.4% 2.3% 2.6% 0.0%
Sep 19 2.6% 2.1% 2.9% 3.5% 0.0%
Sep 26 2.6% 2.4% 2.5% 4.3% 0.0%
Oct 3 2.8% 2.1% 2.0% 3.8% 0.0%
Oct 10 2.6% 1.7% 1.8% 3.9% 0.0%
Oct 17 2.0% 2.0% 2.0% 3.0% 0.0%
Oct 24 3.0% 1.7% 2.4% 3.7% 0.0%
Oct 31 2.7% 1.8% 2.7% 4.6% 0.0%
Nov 7 2.9% 1.5% 3.1% 6.3% 0.0%
Nov 14 2.7% 1.3% 2.1% 6.5% 0.1%
Nov 21 2.6% 1.5% 1.9% 7.3% 0.1%
Nov 28 2.7% 1.3% 2.9% 5.7% 0.1%
Dec 5 2.4% 1.8% 1.9% 5.7% 0.3%
Dec 12 2.9% 1.6% 2.0% 4.9% 0.9%
Dec 19 2.9% 1.6% 2.7% 3.5% 1.7%
Dec 26 2.6% 2.3% 2.9% 4.1% 1.4%
Jan 2 2.7% 1.7% 2.6% 5.9% 1.7%
Jan 9 2.9% 2.1% 2.5% 6.2% 1.4%
Jan 16 2.4% 1.6% 3.2% 6.7% 1.3%
Jan 23 1.5% 1.0% 2.5% 7.7% 0.7%
Jul 19 1.3% 0.5% 0.6% 0.2% 0.1%
Jul 26 0.8% 0.2% 0.7% 0.1% 0.0%
Aug 2 1.0% 0.5% 1.0% 0.2% 0.0%
Aug 9 1.5% 0.4% 1.1% 0.4% 0.0%
Aug 16 0.7% 0.2% 1.0% 0.2% 0.0%
Aug 23 0.8% 0.6% 1.0% 0.2% 0.0%
Aug 30 0.6% 0.5% 1.3% 0.2% 0.0%
Sep 6 1.2% 0.8% 2.2% 0.2% 0.0%
Sep 13 0.9% 0.2% 2.3% 0.1% 0.0%
Sep 20 2.9% 2.2% 5.9% 0.9% 0.0%
Sep 27 4.8% 3.1% 5.5% 1.8% 0.0%
Oct 4 4.8% 2.2% 8.1% 3.3% 0.0%
Oct 11 3.8% 3.2% 9.8% 2.4% 0.1%
Oct 18 5.7% 3.1% 9.0% 4.6% 0.0%
Oct 25 5.4% 2.4% 10.7% 6.7% 0.0%
Nov 1 5.3% 3.0% 9.7% 8.1% 0.1%
Nov 8 6.2% 3.6% 10.3% 8.3% 0.2%
Nov 15 7.6% 2.8% 13.0% 10.8% 0.1%
Nov 22 8.4% 2.8% 11.0% 11.8% 0.2%
Nov 29 7.3% 1.9% 11.2% 9.7% 0.1%
Dec 6 7.0% 1.6% 13.0% 7.6% 0.1%
Dec 13 3.7% 1.6% 9.7% 6.1% 0.0%
Dec 20 4.2% 2.0% 12.1% 3.7% 0.0%
Dec 27 5.4% 0.9% 10.2% 3.4% 0.0%
Jan 3 4.5% 1.1% 6.6% 1.3% 0.0%
Jan 10 5.7% 1.3% 8.1% 2.4% 0.0%
Jan 17 4.5% 1.1% 8.8% 1.9% 0.0%
Jan 24 4.0% 1.4% 10.4% 1.0% 0.0%
Jan 31 4.1% 1.7% 9.8% 1.4% 0.0%
Feb 7 3.9% 1.3% 8.4% 3.1% 0.0%
Feb 14 4.6% 1.9% 11.2% 2.7% 0.0%
Feb 21 5.2% 1.6% 11.5% 2.2% 0.0%
Feb 28 4.7% 1.4% 10.0% 1.4% 0.0%
Mar 7 4.8% 1.7% 10.4% 2.1% 0.0%
Mar 14 4.0% 1.3% 10.5% 0.8% 0.0%
Mar 21 4.6% 1.2% 9.2% 1.4% 0.0%
Mar 28 5.5% 2.4% 10.5% 2.5% 0.0%
Apr 4 4.7% 1.5% 10.2% 3.4% 0.0%
Apr 11 5.6% 2.6% 10.7% 2.2% 0.0%
Apr 18 5.8% 3.0% 12.2% 3.5% 0.0%
Apr 25 6.3% 2.9% 11.0% 2.7% 0.0%
May 2 4.6% 2.3% 10.7% 3.1% 0.0%
May 9 4.3% 2.7% 11.2% 1.9% 0.0%
May 16 4.3% 2.5% 10.4% 1.8% 0.0%
May 23 4.3% 1.7% 7.8% 1.1% 0.1%
May 30 4.5% 2.4% 7.4% 1.0% 0.0%
Jun 6 3.9% 2.4% 6.6% 0.2% 0.1%
Jun 13 3.8% 2.5% 7.1% 0.5% 0.0%
Jun 20 4.6% 1.7% 5.1% 0.2% 0.0%
Jun 27 4.7% 2.0% 4.9% 0.3% 0.0%
Jul 4 3.9% 1.8% 4.9% 0.2% 0.0%
Jul 11 4.1% 2.9% 7.0% 0.5% 0.0%
Jul 18 3.7% 3.4% 6.8% 0.7% 0.0%
Jul 25 4.1% 2.1% 6.3% 1.1% 0.0%
Aug 1 5.4% 3.6% 8.0% 2.4% 0.0%
Aug 8 5.4% 3.8% 8.6% 2.6% 0.0%
Aug 15 6.0% 3.3% 8.9% 5.0% 0.1%
Aug 22 5.3% 3.1% 10.9% 7.0% 0.0%
Aug 29 5.3% 2.7% 13.0% 7.3% 0.0%
Sep 5 5.8% 3.4% 13.8% 6.5% 0.0%
Sep 12 4.8% 4.5% 15.9% 6.7% 0.0%
Sep 19 5.8% 5.6% 17.4% 8.3% 0.0%
Sep 26 7.3% 6.6% 14.3% 10.8% 0.0%
Oct 3 6.8% 4.1% 13.4% 10.3% 0.0%
Oct 10 5.3% 6.3% 13.7% 9.4% 0.0%
Oct 17 5.0% 5.3% 15.3% 7.6% 0.0%
Oct 24 6.2% 5.4% 15.7% 7.8% 0.0%
Oct 31 6.0% 6.8% 14.9% 7.2% 0.0%
Nov 7 4.2% 5.9% 16.2% 9.6% 0.0%
Nov 14 5.8% 5.7% 15.6% 8.9% 0.0%
Nov 21 5.1% 4.6% 14.4% 8.4% 0.0%
Nov 28 4.6% 4.0% 14.0% 7.2% 0.1%
Dec 5 5.4% 3.8% 12.4% 7.0% 0.1%
Dec 12 4.9% 4.3% 13.4% 5.2% 0.9%
Dec 19 4.8% 4.3% 14.3% 4.2% 1.8%
Dec 26 3.9% 4.6% 14.6% 5.2% 2.0%
Jan 2 5.2% 5.4% 14.3% 8.4% 2.2%
Jan 9 5.4% 4.9% 14.6% 10.0% 2.1%
Jan 16 3.9% 4.3% 12.7% 12.0% 1.8%
Jan 23 2.5% 2.9% 7.3% 8.3% 0.5%
Jul 19 2.4% 1.4% 1.8% 1.3% 0.0%
Jul 26 3.4% 1.2% 1.7% 1.7% 0.0%
Aug 2 3.5% 1.6% 2.1% 0.9% 0.0%
Aug 9 4.3% 1.6% 1.3% 1.1% 0.0%
MMWR Week Shortness of Breath (%)
Cough (%) COVID-19 Exposure (%)
COVID-19 Diagnosis (%)
Influenza-like illness (%)
Aug 16 2.7% 1.1% 1.7% 1.1% 0.1%
Aug 23 2.5% 1.3% 1.3% 1.1% 0.0%
Aug 30 2.3% 1.2% 1.6% 1.4% 0.2%
Sep 6 2.5% 1.3% 1.9% 1.3% 0.0%
Sep 13 3.6% 2.0% 2.8% 1.8% 0.0%
Sep 20 3.5% 2.1% 2.5% 2.9% 0.1%
Sep 27 3.5% 1.8% 3.2% 3.2% 0.2%
Oct 4 3.8% 2.0% 4.5% 3.9% 0.2%
Oct 11 4.5% 2.4% 4.4% 4.9% 0.3%
Oct 18 4.3% 2.1% 3.9% 7.4% 0.0%
Oct 25 3.7% 2.9% 4.3% 8.5% 0.1%
Nov 1 5.2% 2.8% 7.6% 11.1% 0.2%
Nov 8 6.4% 4.5% 9.9% 15.1% 0.2%
Nov 15 5.7% 3.5% 8.4% 16.0% 0.2%
Nov 22 5.7% 2.7% 6.0% 17.4% 0.3%
Nov 29 5.6% 3.3% 5.8% 14.7% 0.1%
Dec 6 5.4% 2.1% 4.0% 12.2% 0.0%
Dec 13 4.8% 2.0% 4.5% 11.4% 0.2%
Dec 20 4.1% 1.4% 3.3% 9.4% 0.0%
Dec 27 4.3% 1.4% 4.2% 6.7% 0.1%
Jan 3 4.5% 1.3% 3.6% 7.0% 0.0%
Jan 10 4.3% 1.5% 2.6% 5.3% 0.0%
Jan 17 3.6% 1.1% 4.1% 4.1% 0.0%
Jan 24 4.5% 1.7% 4.2% 4.1% 0.0%
Jan 31 4.9% 1.2% 3.8% 2.1% 0.0%
Feb 7 3.2% 1.3% 4.6% 2.2% 0.0%
Feb 14 3.8% 1.1% 3.9% 1.5% 0.1%
Feb 21 5.2% 1.5% 3.5% 1.8% 0.2%
Feb 28 4.2% 1.1% 3.2% 1.4% 0.0%
Mar 7 5.2% 1.4% 4.1% 2.4% 0.0%
Mar 14 4.6% 1.5% 4.5% 3.9% 0.1%
Mar 21 4.3% 1.9% 4.8% 4.6% 0.1%
Mar 28 3.8% 1.7% 5.0% 5.0% 0.2%
Apr 4 4.3% 1.8% 4.2% 6.5% 0.0%
Apr 11 4.9% 1.9% 5.4% 7.2% 0.0%
Apr 18 5.0% 2.3% 5.4% 6.7% 0.1%
Apr 25 4.6% 1.6% 5.4% 5.9% 0.1%
May 2 4.4% 2.1% 4.6% 4.1% 0.1%
May 9 3.7% 2.6% 4.8% 3.6% 0.1%
May 16 3.3% 2.0% 3.8% 2.7% 0.0%
May 23 4.0% 1.7% 3.9% 1.9% 0.0%
May 30 3.3% 2.1% 3.7% 1.6% 0.0%
Jun 6 3.9% 1.9% 3.3% 1.3% 0.0%
Jun 13 3.6% 2.4% 3.5% 0.7% 0.0%
Jun 20 3.6% 1.9% 3.4% 0.5% 0.0%
Jun 27 3.8% 2.0% 3.5% 0.3% 0.0%
Jul 4 3.4% 2.1% 2.8% 0.4% 0.0%
Jul 11 3.7% 1.9% 3.6% 0.7% 0.0%
Jul 18 3.9% 2.0% 3.3% 1.1% 0.0%
Jul 25 3.8% 2.0% 3.3% 1.8% 0.0%
Aug 1 4.1% 2.7% 4.5% 2.2% 0.1%
Aug 8 3.5% 2.6% 3.7% 3.6% 0.2%
Aug 15 3.7% 3.0% 4.7% 5.8% 0.0%
Aug 22 3.7% 2.4% 4.2% 6.1% 0.2%
Aug 29 4.0% 2.5% 5.6% 7.0% 0.1%
Sep 5 3.8% 2.7% 4.9% 5.8% 0.1%
Sep 12 3.3% 2.5% 5.3% 5.0% 0.0%
Sep 19 3.2% 2.9% 5.7% 7.0% 0.0%
Sep 26 4.3% 3.2% 6.0% 8.8% 0.1%
Oct 3 4.2% 4.2% 6.0% 11.3% 0.3%
Oct 10 4.3% 3.9% 5.9% 10.3% 0.1%
Oct 17 3.8% 3.6% 5.1% 8.6% 0.2%
Oct 24 4.2% 3.1% 5.0% 9.8% 0.1%
Oct 31 3.8% 4.0% 4.3% 10.6% 0.0%
Nov 7 4.3% 4.1% 6.6% 13.1% 0.2%
Nov 14 4.2% 3.4% 6.3% 14.1% 0.1%
Nov 21 3.9% 3.2% 7.0% 12.6% 0.2%
Nov 28 4.1% 3.5% 7.8% 13.1% 0.3%
Dec 5 4.4% 4.2% 6.6% 14.4% 1.1%
Dec 12 4.1% 4.2% 6.2% 9.9% 2.2%
Dec 19 3.8% 4.1% 6.7% 8.1% 5.7%
Dec 26 4.7% 4.9% 9.4% 10.0% 5.9%
Jan 2 3.9% 3.8% 9.2% 12.3% 4.0%
Jan 9 3.8% 2.9% 9.1% 13.8% 3.3%
Jan 16 4.2% 2.5% 5.3% 15.6% 1.5%
Jan 23 2.9% 2.2% 2.9% 11.6% 0.9%
Jul 19 2.6% 1.4% 1.2% 1.6% 0.0%
Jul 26 3.0% 1.2% 1.2% 1.2% 0.0%
Aug 2 2.8% 1.4% 1.9% 1.4% 0.0%
Aug 9 1.9% 1.2% 2.2% 1.5% 0.0%
Aug 16 2.8% 1.1% 1.7% 2.1% 0.0%
Aug 23 2.5% 0.8% 2.1% 1.4% 0.0%
Aug 30 3.5% 1.2% 2.0% 1.5% 0.0%
Sep 6 2.8% 1.2% 2.0% 1.7% 0.0%
Sep 13 3.1% 1.7% 2.9% 1.6% 0.1%
Sep 20 3.8% 1.9% 2.7% 3.6% 0.0%
Sep 27 3.6% 2.1% 3.5% 2.5% 0.0%
Oct 4 4.6% 2.3% 3.0% 2.7% 0.1%
Oct 11 4.3% 2.1% 2.3% 3.2% 0.1%
Oct 18 3.9% 2.0% 3.2% 3.0% 0.2%
Oct 25 4.4% 2.1% 4.2% 4.3% 0.1%
Nov 1 5.1% 3.1% 5.7% 7.2% 0.0%
Nov 8 5.8% 4.0% 5.3% 11.9% 0.1%
Nov 15 6.2% 2.6% 4.8% 13.7% 0.2%
Nov 22 5.8% 2.9% 4.0% 13.0% 0.1%
Nov 29 5.0% 2.9% 4.6% 11.2% 0.0%
Dec 6 5.8% 2.4% 3.9% 10.0% 0.1%
Dec 13 5.3% 1.8% 3.7% 7.3% 0.1%
Dec 20 5.2% 1.7% 3.8% 4.6% 0.0%
Dec 27 5.2% 1.4% 3.3% 5.1% 0.1%
Jan 3 5.0% 2.0% 2.3% 4.3% 0.1%
Jan 10 4.3% 1.8% 2.8% 4.2% 0.1%
Jan 17 4.8% 1.1% 3.3% 3.2% 0.1%
Jan 24 4.2% 0.9% 3.7% 1.9% 0.1%
Jan 31 4.7% 1.4% 2.5% 1.2% 0.1%
Feb 7 3.3% 1.8% 3.1% 2.1% 0.1%
Feb 14 3.7% 1.5% 3.7% 1.5% 0.1%
Feb 21 5.5% 1.5% 2.9% 1.8% 0.0%
Feb 28 4.6% 1.8% 3.6% 1.8% 0.0%
Mar 7 4.5% 1.7% 3.3% 2.6% 0.0%
Mar 14 3.9% 2.1% 2.3% 2.7% 0.0%
Mar 21 3.9% 1.6% 3.1% 2.6% 0.0%
Mar 28 4.0% 2.7% 2.6% 3.0% 0.0%
Apr 4 4.8% 3.1% 3.8% 4.1% 0.1%
Apr 11 4.3% 2.5% 4.1% 4.3% 0.1%
Apr 18 3.6% 2.0% 3.8% 4.0% 0.0%
Apr 25 4.7% 2.5% 4.7% 4.5% 0.0%
May 2 4.1% 2.1% 4.2% 3.3% 0.1%
May 9 3.7% 2.5% 3.5% 2.3% 0.0%
May 16 3.6% 1.6% 2.2% 1.7% 0.0%
May 23 3.1% 1.3% 2.2% 1.0% 0.1%
May 30 3.2% 1.5% 2.2% 0.7% 0.0%
Jun 6 3.9% 1.8% 1.8% 1.0% 0.0%
Jun 13 3.5% 2.1% 1.5% 0.6% 0.0%
Jun 20 3.3% 2.3% 1.6% 0.6% 0.0%
Jun 27 3.7% 2.2% 1.7% 0.6% 0.0%
Jul 4 3.4% 2.0% 1.7% 0.4% 0.1%
Jul 11 3.4% 1.9% 1.3% 0.6% 0.0%
Jul 18 3.6% 2.4% 2.2% 1.2% 0.0%
Jul 25 3.6% 2.2% 2.5% 1.3% 0.1%
Aug 1 3.4% 2.4% 2.0% 1.7% 0.0%
Aug 8 4.1% 3.0% 4.8% 3.5% 0.1%
Aug 15 3.6% 3.6% 5.2% 4.1% 0.0%
Aug 22 4.1% 2.6% 6.5% 4.2% 0.0%
Aug 29 3.7% 3.3% 5.6% 4.4% 0.1%
Sep 5 3.6% 3.4% 5.3% 4.3% 0.0%
Sep 12 3.4% 4.8% 6.8% 6.3% 0.0%
Sep 19 3.2% 4.9% 6.2% 6.5% 0.0%
Sep 26 4.8% 6.5% 8.5% 6.1% 0.0%
Oct 3 4.5% 6.9% 6.7% 8.8% 0.0%
Oct 10 4.6% 5.6% 5.7% 7.5% 0.1%
Oct 17 4.3% 5.2% 6.4% 6.6% 0.0%
Oct 24 3.3% 5.7% 6.2% 6.1% 0.0%
Oct 31 4.1% 5.4% 5.6% 6.8% 0.1%
Nov 7 3.2% 5.1% 6.1% 5.7% 0.1%
Nov 14 3.8% 4.5% 5.9% 6.7% 0.2%
Nov 21 3.9% 5.7% 5.2% 8.6% 0.2%
Nov 28 4.1% 6.0% 7.3% 8.6% 0.2%
Dec 5 5.0% 4.8% 5.5% 9.8% 0.8%
Dec 12 3.7% 4.4% 6.3% 7.5% 2.1%
Dec 19 4.4% 7.0% 7.6% 6.7% 5.6%
Dec 26 3.9% 6.4% 7.5% 6.0% 6.3%
Jan 2 4.0% 6.0% 7.8% 7.6% 4.5%
Jan 9 4.6% 5.5% 8.5% 8.7% 3.6%
Jan 16 3.8% 4.4% 5.5% 11.3% 1.2%
Jan 23 3.1% 3.0% 6.5% 7.9% 1.0%
Jul 19 4.1% 1.3% 0.4% 1.0% 0.0%
Jul 26 3.4% 1.2% 0.3% 1.0% 0.0%
Aug 2 3.0% 1.2% 0.6% 0.7% 0.1%
Aug 9 4.9% 1.2% 0.9% 0.8% 0.0%
Aug 16 3.8% 1.2% 0.9% 1.2% 0.0%
Aug 23 3.7% 0.9% 0.6% 1.1% 0.0%
MMWR Week Shortness of Breath (%)
Cough (%) COVID-19 Exposure (%)
COVID-19 Diagnosis (%)
Influenza-like illness (%)
Aug 30 3.8% 1.0% 0.6% 1.1% 0.0%
Sep 6 3.1% 1.3% 0.6% 0.6% 0.0%
Sep 13 3.3% 1.1% 0.5% 0.8% 0.0%
Sep 20 3.7% 1.2% 0.4% 1.4% 0.1%
Sep 27 4.0% 1.3% 0.6% 1.3% 0.1%
Oct 4 3.9% 1.4% 0.7% 1.6% 0.1%
Oct 11 4.4% 1.0% 0.5% 1.7% 0.0%
Oct 18 4.0% 1.8% 0.7% 1.5% 0.1%
Oct 25 5.4% 1.3% 1.0% 2.3% 0.1%
Nov 1 5.7% 1.7% 1.5% 4.7% 0.1%
Nov 8 5.8% 2.1% 1.3% 7.1% 0.0%
Nov 15 6.4% 2.1% 1.6% 8.6% 0.1%
Nov 22 5.2% 1.5% 1.3% 8.8% 0.1%
Nov 29 5.1% 1.8% 0.9% 8.0% 0.0%
Dec 6 5.2% 1.4% 0.7% 4.7% 0.2%
Dec 13 4.7% 1.4% 0.8% 5.0% 0.2%
Dec 20 5.5% 1.4% 0.6% 5.7% 0.1%
Dec 27 4.2% 1.3% 0.7% 5.4% 0.0%
Jan 3 4.5% 1.5% 0.7% 4.5% 0.0%
Jan 10 5.5% 1.0% 0.6% 4.0% 0.2%
Jan 17 5.0% 1.1% 0.6% 4.0% 0.0%
Jan 24 3.3% 0.9% 0.4% 3.2% 0.1%
Jan 31 3.9% 1.1% 0.5% 3.1% 0.0%
Feb 7 3.5% 1.1% 0.2% 1.4% 0.0%
Feb 14 4.2% 1.2% 0.4% 1.5% 0.0%
Feb 21 3.8% 1.0% 0.3% 1.6% 0.2%
Feb 28 4.4% 1.1% 0.5% 1.4% 0.0%
Mar 7 4.5% 1.0% 0.4% 2.2% 0.0%
Mar 14 3.7% 1.6% 0.4% 1.9% 0.0%
Mar 21 4.5% 1.1% 0.5% 1.9% 0.1%
Mar 28 3.9% 1.1% 0.5% 2.2% 0.0%
Apr 4 4.4% 1.5% 0.4% 2.5% 0.1%
Apr 11 4.0% 1.6% 0.7% 3.0% 0.0%
Apr 18 3.9% 1.3% 0.4% 2.5% 0.1%
Apr 25 4.1% 1.4% 0.3% 2.4% 0.0%
May 2 3.9% 1.5% 0.6% 1.5% 0.1%
May 9 3.5% 1.6% 0.5% 1.3% 0.0%
May 16 3.2% 1.6% 0.5% 1.1% 0.0%
May 23 3.0% 2.1% 0.3% 0.9% 0.0%
May 30 3.4% 2.0% 0.4% 0.4% 0.1%
Jun 6 3.5% 1.3% 0.3% 0.3% 0.0%
Jun 13 3.5% 1.3% 0.2% 0.3% 0.0%
Jun 20 3.1% 1.6% 0.1% 0.1% 0.0%
Jun 27 3.2% 1.6% 0.2% 0.4% 0.0%
Jul 4 3.9% 2.3% 0.3% 0.5% 0.1%
Jul 11 3.0% 1.3% 0.4% 0.4% 0.1%
Jul 18 3.5% 1.5% 0.1% 1.0% 0.0%
Jul 25 2.6% 2.3% 0.4% 1.3% 0.0%
Aug 1 3.1% 2.3% 0.5% 1.8% 0.0%
Aug 8 3.1% 2.4% 1.0% 2.4% 0.1%
Aug 15 2.0% 2.1% 1.3% 3.6% 0.0%
Aug 22 2.1% 1.6% 2.1% 3.9% 0.0%
Aug 29 1.8% 2.2% 1.1% 5.7% 0.0%
Sep 5 2.4% 2.6% 2.3% 4.7% 0.0%
Sep 12 1.8% 2.2% 2.3% 4.9% 0.0%
Sep 19 2.1% 2.7% 2.3% 4.1% 0.1%
Sep 26 2.1% 2.4% 1.5% 4.5% 0.1%
Oct 3 3.0% 3.3% 2.1% 4.6% 0.1%
Oct 10 2.9% 2.3% 2.6% 3.2% 0.0%
Oct 17 2.4% 2.0% 1.6% 3.4% 0.1%
Oct 24 2.6% 2.3% 1.4% 3.9% 0.1%
Oct 31 2.5% 2.4% 1.6% 4.0% 0.1%
Nov 7 2.8% 2.6% 2.1% 5.7% 0.1%
Nov 14 2.8% 2.8% 1.6% 6.6% 0.0%
Nov 21 2.1% 3.2% 1.9% 5.8% 0.1%
Nov 28 3.9% 2.1% 1.9% 8.2% 0.0%
Dec 5 3.8% 2.4% 1.3% 7.0% 0.8%
Dec 12 2.7% 2.6% 2.0% 6.6% 2.2%
Dec 19 2.6% 3.5% 1.5% 7.0% 3.0%
Dec 26 2.1% 2.6% 2.6% 6.7% 3.7%
Jan 2 1.9% 2.6% 3.6% 8.4% 2.1%
Jan 9 2.4% 2.8% 4.5% 8.2% 1.8%
Jan 16 2.2% 1.9% 2.0% 8.4% 0.7%
Jan 23 3.2% 2.3% 1.3% 7.8% 1.0%
Minnesota Department of Health Weekly COVID-19 Report: Updated 3/3/2022 with data current as of 4 a.m. the previous business day unless specifically noted. Page 39
Syndromic SurveillanceThese syndromic surveillance data come from the Encounter Alert Service (EAS), which is utilizing an existing service to support and leverage the development of this activity. These data provide situational awareness to help inform public health decision making, resource allocation, and other actions.
Syndromic surveillance is a type of public health surveillance that uses near real-time data to help identify unusual activity that might need further investigation. These data help public health officials detect, monitor, and respond quickly to local public health threats and events of public health importance. The Minnesota Department of Health is currently using data on COVID-19-related symptoms and chief complaints reported during emergency department and inpatient hospital visits to identify trends. This data can provide an early signal that something is happening in a community with the outbreak even if case counts are not increasing at that time.
Data include emergency-department and inpatient hospital visits for COVID-like illness through Februrary 26, 2022. Categories are based upon discharge diagnosis codes. Beginning with the November 27, 2020 Weekly COVID-19 report, conditions are reported from week 30 (July 20, 2020) forward due to a transition in data sources. The gray bar indicates a one week lag period in the data.
Through Februrary 26, 2022, these data represent all patients from about 135 hospitals in Minnesota, covering approximately 90% of the hospital beds statewide. Efforts are underway to expand hospitals to more fully represent the state.
Due to the need to confirm reports and reporting delays, data may be incomplete
� Map of Counties and Infectious Disease Surveillance Regions can be found on: Field Services Epidemiologists (https://www.health.state.mn.us/about/org/idepc/epis.html) � Further information and frequently asked questions syndromic surveillance can be found at: Hospital Alerting for Syndromic Surveillance: COVID-19/SAR-CoV-2 (https://www.health.state.mn.us/diseases/coronavirus/hcp/syndromic.html)
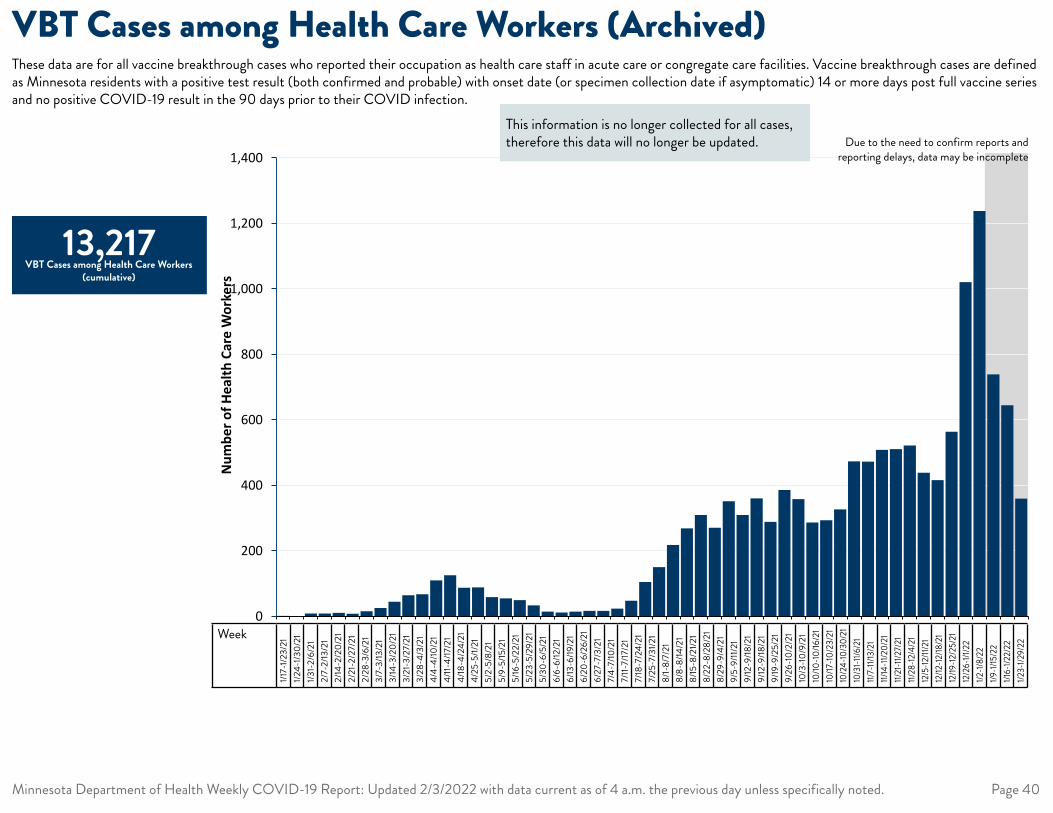
MMWR Week Vaccine Breakthrough in Health Care WOrkers
Week 3: 1/17/2021 - 1/23/2021 2
Week 4: 1/24/2021 - 1/30/2021 0
Week 5: 1/31/2021 - 2/6/2021 9
Week 6: 2/7/2021 - 2/13/2021 9
Week 7: 2/14/2021 - 2/20/2021 11
Week 8: 2/21/2021 - 2/27/2021 8
Week 9: 2/28/2021 - 3/6/2021 16
Week 10: 3/7/2021 - 3/13/2021 26
Week 11: 3/14/2021 - 3/20/2021 45
Week 12: 3/21/2021 - 3/27/2021 65
Week 13: 3/28/2021 - 4/3/2021 68
Week 14: 4/4/2021 - 4/10/2021 110
Week 15: 4/11/2021 - 4/17/2021 126
Week 16: 4/18/2021 - 4/24/2021 88
Week 17: 4/25/2021 - 5/1/2021 89
Week 18: 5/2/2021 - 5/8/2021 59
Week 19: 5/9/2021 - 5/15/2021 55
Week 20: 5/16/2021 - 5/22/2021 50
Week 21: 5/23/2021 - 5/29/2021 34
Week 22: 5/30/2021 - 6/5/2021 15
Week 23: 6/6/2021 - 6/12/2021 12
Week 24: 6/13/2021 - 6/19/2021 15
Week 25: 6/20/2021 - 6/26/2021 17
Week 26: 6/27/2021 - 7/3/2021 17
Week 27: 7/4/2021 - 7/10/2021 24
Week 28: 7/11/2021 - 7/17/2021 48
Week 29: 7/18/2021 - 7/24/2021 105
Week 30: 7/25/2021 - 7/31/2021 151
Week 31: 8/1/2021 - 8/7/2021 218
Week 32: 8/8/2021 - 8/14/2021 269
Week 33: 8/15/2021 - 8/21/2021 310
Week 34: 8/22/2021 - 8/28/2021 271
Week 35: 8/29/2021 - 9/4/2021 352
Week 36: 9/5/2021 - 9/11/2021 310
Week 37: 9/12/2021 - 9/18/2021 361
Week 38: 9/19/2021 - 9/25/2021 289
Week 39: 9/26/2021 - 10/2/2021 386
Week 40: 10/3/2021 - 10/9/2021 358
Week 41: 10/10/2021 - 10/16/2021 287
Week 42: 10/17/2021 - 10/23/2021 294
Week 43: 10/24/2021 - 10/30/2021 327
Week 44: 10/31/2021 - 11/6/2021 474
Week 45: 11/7/2021 - 11/13/2021 473
Week 46: 11/14/2021 - 11/20/2021 509
Week 47: 11/21/2021 - 11/27/2021 511
Week 48: 11/28/2021 - 12/4/2021 522
Week 49: 12/5/2021 - 12/11/2021 439
Week 50: 12/12/2021 - 12/18/2021 416
Week 51: 12/19/2021 - 12/25/2021 564
Week 52: 12/26/2021 - 1/1/2022 1,021
Week 1: 1/2/2022 - 1/8/2022 1,238
Week 2: 1/9/2022 - 1/15/2022 739
Week 3: 1/16/2022 - 1/22/2022 645
Week 4: 1/23/2022 - 1/29/2022 360
0
200
400
600
800
1,000
1,200
1,400
3 4 5 6 7 8 9 10 11 12 13 14 15 16 17 18 19 20 21 22 23 24 25 26 27 28 29 30 31 32 33 34 35 36 37 38 39 40 41 42 43 44 45 46 47 48 49 50 51 52 1 2 3 4
Num
ber o
f Cas
es
Week
1/17-
1/23/
211/2
4-1/3
0/21
1/31-
2/6/
212/
7-2/
13/2
12/
14-2
/20/
212/
21-2
/27/
212/
28-3
/6/2
13/
7-3/
13/2
13/
14-3
/20/
213/
21-3
/27/
213/
28-4
/3/2
14/
4-4/
10/2
14/
11-4/
17/2
14/
18-4
/24/
214/
25-5
/1/21
5/2-
5/8/
215/
9-5/
15/2
15/
16-5
/22/
215/
23-5
/29/
215/
30-6
/5/2
16/
6-6/
12/2
16/
13-6
/19/2
16/
20-6
/26/
216/
27-7
/3/2
17/
4-7/
10/2
17/
11-7/
17/2
17/
18-7
/24/
217/
25-7
/31/2
18/
1-8/
7/21
8/8-
8/14
/21
8/15
-8/2
1/21
8/22
-8/2
8/21
8/29
-9/4
/21
9/5-
9/11/
219/
12-9
/18/2
19/
12-9
/18/2
19/
19-9
/25/
219/
26-1
0/2/
2110
/3-1
0/9/
2110
/10-10
/16/2
110
/17-10
/23/
2110
/24-
10/3
0/21
10/3
1-11/6
/21
11/7-
11/13
/21
11/14
-11/2
0/21
11/21
-11/2
7/21
11/28
-12/4
/21
12/5
-12/11
/21
12/12
-12/18
/21
12/19
-12/2
5/21
12/2
6-1/1
/22
1/2-1/
8/22
1/9-1/
15/2
21/1
6-1/2
2/22
1/23-
1/29/
22
Num
ber o
f Hea
lth C
are
Wor
kers
Minnesota Department of Health Weekly COVID-19 Report: Updated 2/3/2022 with data current as of 4 a.m. the previous day unless specifically noted. Page 40
VBT Cases among Health Care Workers (Archived)These data are for all vaccine breakthrough cases who reported their occupation as health care staff in acute care or congregate care facilities. Vaccine breakthrough cases are defined as Minnesota residents with a positive test result (both confirmed and probable) with onset date (or specimen collection date if asymptomatic) 14 or more days post full vaccine series and no positive COVID-19 result in the 90 days prior to their COVID infection.
Due to the need to confirm reports and reporting delays, data may be incomplete
13,217 VBT Cases among Health Care Workers
(cumulative)
This information is no longer collected for all cases, therefore this data will no longer be updated.
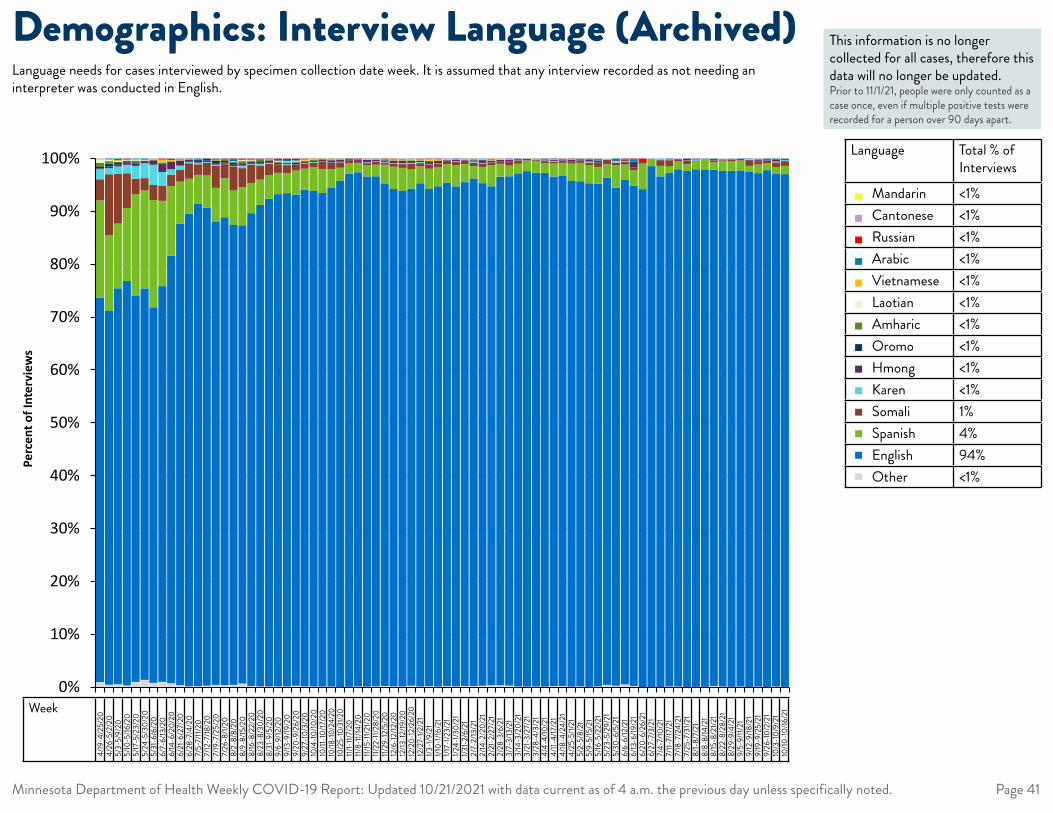
MMWR Week English Other Spanish Somali Karen Hmong Oromo Amharic Laotian Vietnamese Arabic Russian Cantonese Mandarin
Week 17: 4/19-4/25 0.9% 72.6% 18.4% 4.0% 1.9% 0.1% 0.3% 0.8% 0.6% 0.2% 0.0% 0.0% 0.0% 0.0%
Week 18: 4/26-5/2 0.4% 70.7% 14.3% 11.6% 1.2% 0.3% 0.5% 0.5% 0.2% 0.2% 0.1% 0.0% 0.0% 0.0%
Week 19: 5/3-5/9 0.5% 74.9% 12.2% 9.4% 1.4% 0.4% 0.4% 0.1% 0.1% 0.2% 0.3% 0.0% 0.0% 0.0%
Week 20: 5/10-5/16 0.3% 76.6% 13.8% 6.6% 1.6% 0.5% 0.2% 0.1% 0.1% 0.1% 0.1% 0.1% 0.0% 0.0%
Week 21: 5/17-5/23 1.0% 73.0% 19.3% 2.9% 2.4% 0.5% 0.2% 0.3% 0.1% 0.2% 0.1% 0.0% 0.0% 0.0%
Week 22: 5/24-5/30 1.4% 74.1% 18.5% 2.3% 2.8% 0.3% 0.2% 0.0% 0.1% 0.1% 0.2% 0.0% 0.0% 0.0%
Week 23: 5/31-6/6 0.8% 71.0% 20.3% 2.8% 3.8% 0.8% 0.1% 0.0% 0.0% 0.3% 0.0% 0.0% 0.0% 0.0%
Week 24: 6/7-6/13 1.0% 74.9% 16.1% 2.8% 2.7% 1.5% 0.1% 0.2% 0.1% 0.3% 0.1% 0.1% 0.0% 0.0%
Week 25: 6/14-6/20 0.7% 80.9% 13.2% 2.1% 1.1% 1.4% 0.1% 0.0% 0.0% 0.2% 0.2% 0.0% 0.0% 0.0%
Week 26: 6/21-6/27 0.4% 87.3% 8.0% 2.3% 0.7% 0.9% 0.1% 0.0% 0.1% 0.0% 0.1% 0.1% 0.0% 0.0%
Week 27: 6/28-7/4 0.1% 89.5% 6.6% 2.9% 0.3% 0.3% 0.1% 0.0% 0.0% 0.0% 0.1% 0.1% 0.0% 0.0%
Week 28: 7/5-7/11 0.2% 91.3% 5.5% 2.0% 0.3% 0.4% 0.2% 0.0% 0.0% 0.0% 0.1% 0.0% 0.0% 0.0%
Week 29: 7/12-7/18 0.2% 90.5% 6.0% 2.4% 0.2% 0.3% 0.3% 0.0% 0.0% 0.0% 0.0% 0.0% 0.0% 0.0%
Week 30: 7/19-7/25 0.4% 87.6% 6.4% 4.2% 0.2% 0.3% 0.5% 0.1% 0.0% 0.1% 0.2% 0.1% 0.0% 0.0%
Week 31: 7/26-8/1 0.4% 88.5% 7.3% 2.7% 0.1% 0.3% 0.2% 0.3% 0.0% 0.0% 0.1% 0.1% 0.0% 0.0%
Week 32: 8/2-8/8 0.4% 87.0% 6.5% 4.6% 0.1% 0.4% 0.2% 0.3% 0.0% 0.1% 0.2% 0.2% 0.0% 0.0%
Week 33: 8/9-8/15 0.7% 86.7% 7.2% 3.6% 0.5% 0.5% 0.0% 0.4% 0.2% 0.1% 0.1% 0.1% 0.0% 0.0%
Week 34: 8/16-8/22 0.2% 89.5% 5.7% 3.5% 0.1% 0.4% 0.0% 0.2% 0.1% 0.0% 0.1% 0.1% 0.0% 0.0%
Week 35: 8/23-8/29 0.2% 91.1% 4.8% 2.7% 0.3% 0.4% 0.1% 0.3% 0.0% 0.0% 0.0% 0.2% 0.0% 0.0%
Week 36: 8/30-9/5 0.1% 92.3% 4.4% 2.2% 0.1% 0.5% 0.0% 0.2% 0.0% 0.0% 0.1% 0.1% 0.0% 0.0%
Week 37: 9/6-9/12 0.1% 93.1% 4.0% 1.6% 0.0% 0.3% 0.0% 0.1% 0.1% 0.1% 0.1% 0.3% 0.0% 0.0%
Week 38: 9/13-9/19 0.1% 93.4% 3.8% 1.5% 0.2% 0.2% 0.1% 0.1% 0.1% 0.2% 0.2% 0.3% 0.0% 0.0%
Week 39: 9/20-9/26 0.2% 92.9% 4.5% 1.1% 0.0% 0.4% 0.0% 0.1% 0.1% 0.2% 0.1% 0.3% 0.0% 0.0%
Week 40: 9/27-10/3 0.2% 93.9% 4.0% 1.0% 0.1% 0.2% 0.0% 0.2% 0.0% 0.2% 0.1% 0.1% 0.0% 0.0%
Week 41: 10/4-10/10 0.1% 93.7% 4.5% 0.8% 0.2% 0.2% 0.0% 0.2% 0.1% 0.1% 0.0% 0.1% 0.0% 0.0%
Week 42: 10/11-10/17 0.1% 93.4% 4.4% 1.4% 0.1% 0.4% 0.0% 0.1% 0.0% 0.0% 0.0% 0.0% 0.0% 0.0%
Week 43: 10/18-10/24 0.1% 94.5% 3.4% 1.2% 0.1% 0.4% 0.1% 0.1% 0.0% 0.0% 0.1% 0.1% 0.0% 0.0%
Week 44: 10/25-10/31 0.0% 95.7% 2.5% 1.0% 0.1% 0.4% 0.0% 0.0% 0.0% 0.1% 0.1% 0.0% 0.0% 0.0%
Week 45: 11/1-11/7 0.0% 97.1% 2.0% 0.6% 0.0% 0.2% 0.0% 0.0% 0.0% 0.0% 0.0% 0.0% 0.0% 0.0%
Week 46: 11/8-11/14 0.1% 97.3% 1.7% 0.4% 0.1% 0.3% 0.0% 0.0% 0.0% 0.1% 0.0% 0.0% 0.0% 0.0%
Week 47: 11/15-11/21 0.1% 96.5% 2.1% 0.4% 0.1% 0.5% 0.0% 0.1% 0.0% 0.1% 0.0% 0.0% 0.0% 0.0%
Week 48: 11/22-11/28 0.1% 96.5% 2.2% 0.5% 0.1% 0.3% 0.0% 0.1% 0.0% 0.1% 0.1% 0.0% 0.0% 0.0%
Week 49: 11/29-12/5 0.2% 95.0% 3.6% 0.4% 0.2% 0.3% 0.0% 0.0% 0.0% 0.1% 0.1% 0.1% 0.0% 0.0%
Week 50: 12/6-12/12 0.2% 94.1% 4.2% 0.6% 0.1% 0.5% 0.0% 0.0% 0.0% 0.1% 0.1% 0.1% 0.0% 0.0%
Week 51: 12/13-12/19 0.1% 93.7% 4.4% 0.7% 0.2% 0.5% 0.0% 0.0% 0.0% 0.1% 0.1% 0.1% 0.0% 0.0%
Week 52: 12/20-12/26 0.2% 94.1% 3.7% 1.0% 0.1% 0.4% 0.0% 0.1% 0.0% 0.2% 0.0% 0.1% 0.0% 0.0%
Week 53: 12/27-1/2 0.1% 95.2% 3.2% 0.6% 0.2% 0.3% 0.0% 0.0% 0.0% 0.2% 0.1% 0.1% 0.0% 0.0%
Week 1: 1/3-1/9 0.2% 94.1% 3.8% 0.9% 0.1% 0.5% 0.0% 0.1% 0.0% 0.3% 0.1% 0.1% 0.0% 0.0%
Week 2: 1/10-1/16 0.1% 94.6% 3.6% 0.7% 0.1% 0.4% 0.0% 0.0% 0.0% 0.2% 0.0% 0.1% 0.0% 0.0%
Week 3: 1/17-1/23 0.2% 95.3% 3.5% 0.6% 0.1% 0.2% 0.0% 0.1% 0.0% 0.1% 0.0% 0.0% 0.0% 0.0%
Week 4: 1/24-1/30 0.1% 94.6% 4.0% 0.7% 0.1% 0.3% 0.0% 0.0% 0.0% 0.1% 0.1% 0.0% 0.0% 0.0%
Week 5: 1/31-2/6 0.2% 95.3% 3.4% 0.6% 0.0% 0.1% 0.1% 0.0% 0.0% 0.1% 0.0% 0.0% 0.0% 0.0%
Week 6: 2/7-2/13 0.2% 96.0% 2.4% 0.6% 0.2% 0.2% 0.0% 0.1% 0.0% 0.1% 0.1% 0.0% 0.0% 0.0%
Week 7: 2/14-2/20 0.3% 95.1% 3.1% 0.6% 0.1% 0.5% 0.1% 0.1% 0.0% 0.1% 0.1% 0.0% 0.1% 0.0%
Week 8: 2/21-2/27 0.3% 94.4% 4.0% 0.5% 0.0% 0.3% 0.0% 0.0% 0.0% 0.1% 0.1% 0.0% 0.0% 0.0%
Week 9: 2/28-3/6 0.3% 96.2% 2.4% 0.4% 0.1% 0.3% 0.0% 0.0% 0.0% 0.1% 0.1% 0.0% 0.0% 0.0%
Week 10: 3/7-3/13 0.3% 96.4% 2.0% 0.8% 0.0% 0.3% 0.0% 0.0% 0.0% 0.0% 0.1% 0.0% 0.0% 0.0%
Week 11: 3/14-3/20 0.1% 97.1% 1.8% 0.7% 0.0% 0.2% 0.0% 0.0% 0.0% 0.0% 0.1% 0.0% 0.0% 0.0%
Week 12: 3/21-3/27 0.1% 97.5% 1.9% 0.2% 0.1% 0.2% 0.0% 0.0% 0.0% 0.0% 0.0% 0.0% 0.0% 0.0%
Week 13: 3/28-4/3 0.1% 97.3% 2.1% 0.2% 0.0% 0.1% 0.0% 0.0% 0.0% 0.0% 0.0% 0.1% 0.0% 0.0%
Week 14: 4/4-4/10 0.1% 97.2% 1.9% 0.4% 0.1% 0.2% 0.0% 0.0% 0.0% 0.0% 0.1% 0.0% 0.0% 0.0%
Week 15: 4/11-4/17 0.2% 96.4% 2.5% 0.4% 0.1% 0.2% 0.0% 0.1% 0.0% 0.0% 0.1% 0.0% 0.0% 0.0%
Week 16: 4/18-4/24 0.2% 96.5% 2.5% 0.4% 0.0% 0.2% 0.0% 0.0% 0.0% 0.0% 0.0% 0.1% 0.1% 0.0%
Week 17: 4/25-5/1 0.1% 95.7% 3.3% 0.5% 0.0% 0.2% 0.0% 0.1% 0.0% 0.0% 0.1% 0.1% 0.0% 0.0%
Week 18: 5/2-5/8 0.1% 95.6% 3.4% 0.4% 0.1% 0.2% 0.0% 0.1% 0.0% 0.0% 0.0% 0.0% 0.0% 0.0%
Week 19: 5/9-5/15 0.1% 95.3% 3.4% 0.5% 0.2% 0.3% 0.0% 0.1% 0.0% 0.0% 0.1% 0.0% 0.0% 0.0%
Week 20: 5/16-5/22 0.2% 95.1% 3.2% 0.9% 0.0% 0.3% 0.0% 0.0% 0.0% 0.0% 0.2% 0.2% 0.1% 0.0%
Week 21: 5/23-5/29 0.4% 95.9% 2.5% 0.8% 0.1% 0.1% 0.0% 0.0% 0.1% 0.0% 0.0% 0.0% 0.0% 0.1%
Week 22: 5/30-6/5 0.2% 94.2% 4.3% 0.5% 0.3% 0.1% 0.0% 0.0% 0.0% 0.0% 0.3% 0.0% 0.0% 0.0%
Week 23: 6/6-6/12 0.5% 95.5% 2.9% 0.5% 0.2% 0.2% 0.0% 0.2% 0.0% 0.0% 0.0% 0.2% 0.0% 0.0%
Week 24: 6/13-6/19 0.2% 94.7% 2.9% 0.6% 0.0% 0.8% 0.2% 0.0% 0.0% 0.0% 0.4% 0.2% 0.0% 0.0%
Week 25: 6/20-6/26 0.0% 94.2% 4.8% 0.5% 0.0% 0.0% 0.0% 0.0% 0.0% 0.0% 0.0% 0.5% 0.0% 0.0%
Week 26: 6/27-7/3 0.0% 98.5% 1.5% 0.0% 0.0% 0.0% 0.0% 0.0% 0.0% 0.0% 0.0% 0.0% 0.0% 0.0%
Week 27: 7/4-7/10 0.0% 96.6% 2.0% 1.1% 0.3% 0.0% 0.0% 0.0% 0.0% 0.0% 0.0% 0.0% 0.0% 0.0%
Week 28: 7/11-7/17 0.1% 97.2% 1.3% 1.1% 0.0% 0.0% 0.0% 0.0% 0.1% 0.0% 0.2% 0.0% 0.0% 0.0%
Week 29: 7/18-7/24 0.1% 97.9% 1.5% 0.4% 0.0% 0.0% 0.0% 0.0% 0.0% 0.0% 0.0% 0.0% 0.1% 0.0%
Week 30: 7/25-7/31 0.0% 97.7% 1.3% 0.7% 0.0% 0.3% 0.0% 0.0% 0.0% 0.0% 0.0% 0.0% 0.0% 0.0%
0.0% 97.9% 1.5% 0.1% 0.1% 0.0% 0.0% 0.2% 0.0% 0.0% 0.0% 0.1% 0.0% 0.0%
0.0% 97.8% 1.9% 0.1% 0.0% 0.0% 0.0% 0.1% 0.0% 0.0% 0.0% 0.0% 0.0% 0.0%
0.2% 97.7% 1.4% 0.4% 0.0% 0.2% 0.0% 0.0% 0.0% 0.0% 0.0% 0.0% 0.0% 0.0%
0.1% 97.6% 1.9% 0.0% 0.0% 0.2% 0.0% 0.0% 0.0% 0.1% 0.0% 0.0% 0.0% 0.0%
0.0% 97.6% 1.8% 0.3% 0.0% 0.0% 0.0% 0.1% 0.0% 0.0% 0.0% 0.0% 0.0% 0.0%
0.1% 97.7% 1.8% 0.3% 0.0% 0.0% 0.0% 0.0% 0.0% 0.0% 0.0% 0.0% 0.0% 0.0%
0.0% 97.4% 1.2% 0.9% 0.0% 0.2% 0.0% 0.0% 0.1% 0.1% 0.1% 0.0% 0.0% 0.0%
0.1% 97.1% 1.6% 0.6% 0.0% 0.3% 0.0% 0.0% 0.0% 0.0% 0.0% 0.0% 0.0% 0.0%
0.0% 97.8% 1.3% 0.4% 0.0% 0.3% 0.0% 0.0% 0.0% 0.0% 0.1% 0.0% 0.0% 0.0%
0.1% 97.0% 1.3% 0.9% 0.2% 0.4% 0.1% 0.1% 0.0% 0.0% 0.0% 0.0% 0.0% 0.0%
0.0% 97.0% 1.6% 0.9% 0.2% 0.2% 0.0% 0.1% 0.0% 0.0% 0.0% 0.0% 0.0% 0.0%
Perc
ent o
f Int
ervi
ews
0%
10%
20%
30%
40%
50%
60%
70%
80%
90%
100%
ek 1
7: 4
/19-
4/25
ek 2
2: 5
/24-
5/30
eek
27: 6
/28-
7/4
Wee
k 32
: 8/2
-8/8
eek
37: 9
/6-9
/12
42:
10/
11-1
0/17
47:
11/
15-1
1/21
52:
12/
20-1
2/26
eek
4: 1
/24-
1/30
Wee
k 9:
2/2
8-3/
6
eek
14: 4
/4-4
/10
eek
19: 5
/9-5
/15
ek 2
4: 6
/13-
6/19
ek 2
9: 7
/18-
7/24
ek 3
4: 8
/22-
8/28
ek 3
9: 9
/26-
10/2
Perc
ent o
f Int
ervi
ews
Mandarin
Cantonese
Russian
Arabic
Vietnamese
Laotian
Amharic
Oromo
Hmong
Karen
Somali
Spanish
English
Other0%
10%
20%
30%
40%
50%
60%
70%
80%
90%
100%
ek 1
7: 4
/19-
4/25
ek 2
2: 5
/24-
5/30
eek
27: 6
/28-
7/4
Wee
k 32
: 8/2
-8/8
eek
37: 9
/6-9
/12
42:
10/
11-1
0/17
47:
11/
15-1
1/21
52:
12/
20-1
2/26
eek
4: 1
/24-
1/30
Wee
k 9:
2/2
8-3/
6
eek
14: 4
/4-4
/10
eek
19: 5
/9-5
/15
ek 2
4: 6
/13-
6/19
ek 2
9: 7
/18-
7/24
ek 3
4: 8
/22-
8/28
ek 3
9: 9
/26-
10/2
Perc
ent o
f Int
ervi
ews
Mandarin
Cantonese
Russian
Arabic
Vietnamese
Laotian
Amharic
Oromo
Hmong
Karen
Somali
Spanish
English
Other
Week
4/19
-4/2
5/20
4/26
-5/2
/20
5/3-
5/9/
205/
10-5
/16/2
05/
17-5
/23/
205/
24-5
/30/
205/
31-6
/6/2
06/
7-6/
13/2
06/
14-6
/20/
206/
21-6
/27/
206/
28-7
/4/2
07/
5-7/
11/20
7/12
-7/18
/20
7/19
-7/2
5/20
7/26
-8/1/
208/
2-8/
8/20
8/9-
8/15
/20
8/16
-8/2
2/20
8/23
-8/3
0/20
8/31
-9/5
/20
9/6-
9/12
/20
9/13
-9/19
/20
9/20
-9/2
6/20
9/27
-10/
3/20
10/4
-10/
10/2
010
/11-1
0/17
/20
10/18
-10/2
4/20
10/2
5-10
/31/2
011/
1-11/
7/20
11/8-
11/14
/20
11/15
-11/2
1/20
11/22
-11/2
8/20
11/29
-12/
5/20
12/6
-12/
12/2
012
/13-12
/19/2
012
/20-
12/2
6/20
12/2
7-1/2
/21
1/3-1
/9/2
11/1
0-1/1
6/21
1/17-
1/23/
211/2
4-1/3
0/21
1/31-
2/6/
212/
7-2/
13/2
12/
14-2
/20/
212/
21-2
/27/
212/
28-3
/6/2
13/
7-3/
13/2
13/
14-3
/20/
213/
21-3
/27/
213/
28-4
/3/2
14/
4-4/
10/2
14/
11-4/
17/2
14/
18-4
/24/
214/
25-5
/1/21
5/2-
5/8/
215/
9-5/
15/2
15/
16-5
/22/
215/
23-5
/29/
215/
30-6
/5/2
16/
6-6/
12/2
16/
13-6
/19/2
16/
20-6
/26/
216/
27-7
/3/2
17/
4-7/
10/2
17/
11-7/
17/2
17/
18-7
/24/
217/
25-7
/31/2
18/
1-8/
7/21
8/8-
8/14
/21
8/15
-8/2
1/21
8/22
-8/2
8/21
8/29
-9/4
/21
9/5-
9/11/
219/
12-9
/18/2
19/
19-9
/25/
219/
26-1
0/2/
2110
/3-1
0/9/
2110
/10-1
0/16
/21
Minnesota Department of Health Weekly COVID-19 Report: Updated 10/21/2021 with data current as of 4 a.m. the previous day unless specifically noted. Page 41
Demographics: Interview Language (Archived)Language needs for cases interviewed by specimen collection date week. It is assumed that any interview recorded as not needing an interpreter was conducted in English.
Language Total % of Interviews
Mandarin <1%Cantonese <1%Russian <1%Arabic <1%Vietnamese <1%Laotian <1%Amharic <1%Oromo <1%Hmong <1%Karen <1%Somali 1%Spanish 4%English 94%Other <1%
This information is no longer collected for all cases, therefore this data will no longer be updated. Prior to 11/1/21, people were only counted as a case once, even if multiple positive tests were recorded for a person over 90 days apart.
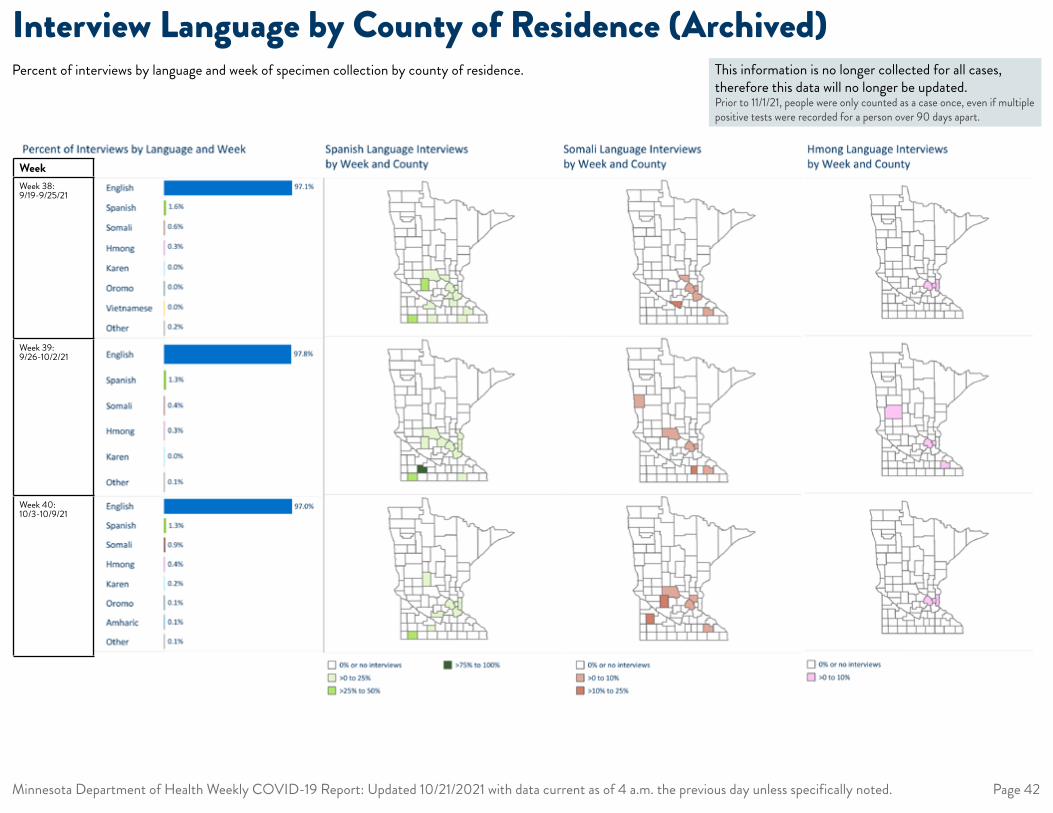
Language Week 37 Week 38 Week 39
English 97.4% 97.1% 97.7%
Spanish 1.2% 1.6% 1.4%
Somali 0.9% 0.6% 0.5%
Hmong 0.2% 0.3% 0.3%
Other 0.2% 0.2% 0.1%
Vietnamese 0.1% 0.0%
Karen 0.0% 0.0%
Oromo 0.0%
Spanish Language Interviews Somali Language Interviews Karen Language Interviews
County Week 37 Week 38 Week 39 Week 37 Week 38 Week 39 Week 37 Week 38 Week 39
Aitkin 0.0% 0.0% 0.0% 0.0% 0.0% 0.0% 0.0% 0.0% 0.0%
Anoka 0.0% 0.0% 0.0% 1.2% 0.0% 0.0% 0.0% 0.0% 0.0%
Becker 0.0% 0.0% 0.0% 0.0% 0.0% 0.0% 0.0% 0.0% 0.0%
Beltrami 0.0% 0.0% 0.0% 0.0% 0.0% 0.0% 0.0% 0.0% 0.0%
Benton 0.0% 0.0% 0.0% 0.0% 0.0% 0.0% 0.0% 0.0% 0.0%
Big Stone 0.0% 0.0% 0.0% 0.0% 0.0% 0.0% 0.0% 0.0% 0.0%
Blue Earth 5.6% 0.0% 0.0% 0.0% 0.0% 0.0% 0.0% 0.0% 0.0%
Brown 0.0% 1.6% 0.0% 0.0% 0.0% 0.0% 0.0% 0.0% 0.0%
Carlton 0.0% 0.0% 0.0% 0.0% 0.0% 0.0% 0.0% 0.0% 0.0%
Carver 2.3% 0.0% 0.0% 0.0% 0.0% 0.0% 0.0% 0.0% 0.0%
Cass 0.0% 0.0% 0.0% 0.0% 0.0% 0.0% 0.0% 0.0% 0.0%
Chippewa 0.0% 0.0% 0.0% 0.0% 0.0% 0.0% 0.0% 0.0% 0.0%
Chisago 0.0% 0.0% 5.0% 0.0% 0.0% 0.0% 0.0% 0.0% 0.0%
Clay 2.0% 0.0% 0.0% 0.0% 0.0% 2.2% 0.0% 0.0% 0.0%
Clearwater 0.0% 0.0% 0.0% 0.0% 0.0% 0.0% 0.0% 0.0% 0.0%
Cook 0.0% 0.0% 0.0% 0.0% 0.0% 0.0% 0.0% 0.0% 0.0%
Cottonwood 0.0% 0.0% 100.0% 0.0% 0.0% 0.0% 0.0% 0.0% 0.0%
Crow Wing 0.0% 0.0% 0.0% 0.0% 0.0% 0.0% 0.0% 0.0% 0.0%
Dakota 2.7% 2.6% 1.2% 3.6% 1.3% 0.0% 1.8% 0.0% 0.0%
Dodge 0.0% 0.0% 0.0% 0.0% 0.0% 0.0% 0.0% 0.0% 0.0%
Douglas 0.0% 0.0% 0.0% 0.0% 0.0% 0.0% 0.0% 0.0% 0.0%
Faribault 0.0% 0.0% 0.0% 0.0% 0.0% 0.0% 0.0% 0.0% 0.0%
Fillmore 0.0% 0.0% 0.0% 0.0% 0.0% 0.0% 0.0% 0.0% 0.0%
Freeborn 0.0% 0.0% 0.0% 0.0% 0.0% 0.0% 0.0% 0.0% 0.0%
Goodhue 0.0% 0.0% 0.0% 0.0% 0.0% 0.0% 0.0% 0.0% 0.0%
Grant 0.0% 0.0% 0.0%
Hennepin 2.1% 2.7% 3.0% 2.5% 1.1% 0.6% 0.0% 0.9% 0.6%
Houston 0.0% 0.0% 0.0% 0.0% 0.0% 0.0% 0.0% 0.0% 0.0%
Hubbard 0.0% 0.0% 0.0% 0.0% 0.0% 0.0% 0.0% 0.0% 0.0%
Isanti 0.0% 0.0% 0.0% 0.0% 0.0% 0.0% 0.0% 0.0% 0.0%
Itasca 0.0% 0.0% 0.0% 0.0% 0.0% 0.0% 0.0% 0.0% 0.0%
Jackson 0.0% 0.0% 0.0% 0.0% 0.0% 0.0% 0.0% 0.0% 0.0%
Kanabec 0.0% 0.0% 0.0% 0.0% 0.0% 0.0% 0.0% 0.0% 0.0%
Kandiyohi 0.0% 30.8% 4.5% 0.0% 0.0% 0.0% 0.0% 0.0% 0.0%
Kittson 0.0% 0.0% 0.0% 0.0% 0.0% 0.0% 0.0% 0.0% 0.0%
Koochiching 0.0% 0.0% 0.0% 0.0% 0.0% 0.0% 0.0% 0.0% 0.0%
Lac qui Parle 0.0% 0.0% 0.0% 0.0% 0.0% 0.0% 0.0% 0.0% 0.0%
Lake 0.0% 0.0% 0.0% 0.0% 0.0% 0.0%
Lake of the Woods 0.0% 0.0% 0.0%
Le Sueur 0.0% 0.0% 0.0% 0.0% 0.0% 0.0% 0.0% 0.0% 0.0%
Lincoln 0.0% 0.0% 0.0% 0.0% 0.0% 0.0% 0.0% 0.0% 0.0%
Lyon 0.0% 0.0% 0.0% 0.0% 0.0% 0.0% 7.1% 0.0% 0.0%
Mahnomen 0.0% 0.0% 0.0% 0.0% 0.0% 0.0%
Marshall 0.0% 0.0% 0.0% 0.0% 0.0% 0.0% 0.0% 0.0% 0.0%
Martin 0.0% 22.2% 0.0% 0.0% 0.0% 0.0% 0.0% 0.0% 0.0%
McLeod 0.0% 0.0% 0.0% 0.0% 0.0% 0.0% 0.0% 0.0% 0.0%
Meeker 0.0% 0.0% 0.0% 0.0% 0.0% 0.0% 0.0% 0.0% 0.0%
Mille Lacs 0.0% 0.0% 0.0% 0.0% 0.0% 0.0% 0.0% 0.0% 0.0%
Morrison 0.0% 0.0% 0.0% 0.0% 0.0% 0.0% 0.0% 0.0% 0.0%
Mower 10.0% 7.7% 2.8% 0.0% 0.0% 0.0% 0.0% 0.0% 0.0%
Murray 0.0% 0.0% 0.0% 0.0% 0.0% 0.0%
Nicollet 0.0% 0.0% 0.0% 0.0% 14.3% 0.0% 0.0% 0.0% 0.0%
Nobles 0.0% 50.0% 50.0% 0.0% 0.0% 0.0% 0.0% 0.0% 0.0%
Norman 0.0% 0.0% 0.0%
Olmsted 0.4% 0.4% 0.0% 0.0% 0.4% 0.8% 0.0% 0.0% 0.4%
Otter Tail 0.0% 0.0% 0.0% 0.0% 0.0% 0.0% 0.0% 0.0% 5.6%
Out of State
Pennington 0.0% 0.0% 0.0%
Pine 0.0% 0.0% 0.0% 0.0% 0.0% 0.0% 0.0% 0.0% 0.0%
Pipestone 0.0% 0.0% 0.0%
Polk 0.0% 0.0% 0.0% 0.0% 0.0% 0.0% 0.0% 0.0% 0.0%
Pope 0.0% 0.0% 0.0% 0.0% 0.0% 0.0% 0.0% 0.0% 0.0%
Ramsey 1.1% 2.7% 2.9% 1.6% 2.7% 1.1% 0.5% 0.5% 0.6%
Red Lake 0.0% 0.0% 0.0%
Redwood 0.0% 0.0% 0.0% 0.0% 0.0% 0.0% 0.0% 0.0% 0.0%
Renville 0.0% 0.0% 0.0% 0.0% 0.0% 0.0% 0.0% 0.0% 0.0%
Rice 4.8% 5.3% 0.0% 0.0% 0.0% 0.0% 0.0% 0.0% 0.0%
Rock 0.0% 0.0% 0.0% 0.0% 0.0% 0.0% 0.0% 0.0% 0.0%
Roseau 0.0% 0.0% 0.0% 0.0% 0.0% 0.0% 0.0% 0.0% 0.0%
Scott 0.0% 4.9% 0.0% 2.7% 0.0% 0.0% 0.0% 0.0% 0.0%
Sherburne 0.0% 1.8% 0.0% 0.0% 1.8% 0.0% 0.0% 0.0% 0.0%
Sibley 50.0% 0.0% 0.0% 0.0% 0.0% 0.0% 0.0% 0.0% 0.0%
St Louis 0.0% 0.0% 0.0% 0.0% 0.0% 0.0% 0.0% 0.0% 0.0%
Statewide
Stearns 2.0% 2.8% 1.6% 0.0% 0.0% 1.6% 0.0% 0.0% 0.0%
Steele 5.3% 0.0% 0.0% 0.0% 0.0% 12.5% 0.0% 0.0% 0.0%
Stevens 0.0% 0.0% 0.0% 0.0% 0.0% 0.0%
Swift 0.0% 0.0% 0.0% 0.0% 0.0% 0.0% 0.0% 0.0% 0.0%
Todd 16.7% 0.0% 0.0% 0.0% 0.0% 0.0% 0.0% 0.0% 0.0%
Traverse 0.0% 0.0% 0.0% 0.0% 0.0% 0.0%
Wabasha 0.0% 0.0% 0.0% 0.0% 0.0% 0.0% 0.0% 0.0% 0.0%
Wadena 0.0% 0.0% 0.0% 0.0% 0.0% 0.0% 0.0% 0.0% 0.0%
Waseca 0.0% 0.0% 0.0% 0.0% 0.0% 0.0% 0.0% 0.0% 0.0%
Washington 0.0% 0.0% 4.3% 0.0% 0.0% 0.0% 0.0% 1.8% 0.0%
Watonwan 0.0% 0.0% 0.0% 0.0% 0.0% 0.0% 0.0% 0.0% 0.0%
Wilkin 0.0% 0.0% 0.0% 0.0% 0.0% 0.0%
Winona 0.0% 0.0% 0.0% 0.0% 0.0% 0.0% 0.0% 0.0% 0.0%
Wright 0.0% 0.0% 2.5% 0.0% 0.0% 0.0% 0.0% 0.0% 0.0%
Yellow Medicine 0.0% 0.0% 0.0% 0.0% 0.0% 0.0% 0.0% 0.0% 0.0%
WeekWeek 38: 9/19-9/25/21
Week 39: 9/26-10/2/21
Week 40: 10/3-10/9/21
Minnesota Department of Health Weekly COVID-19 Report: Updated 10/21/2021 with data current as of 4 a.m. the previous day unless specifically noted. Page 42
Interview Language by County of Residence (Archived)Percent of interviews by language and week of specimen collection by county of residence. This information is no longer collected for all cases,
therefore this data will no longer be updated. Prior to 11/1/21, people were only counted as a case once, even if multiple positive tests were recorded for a person over 90 days apart.
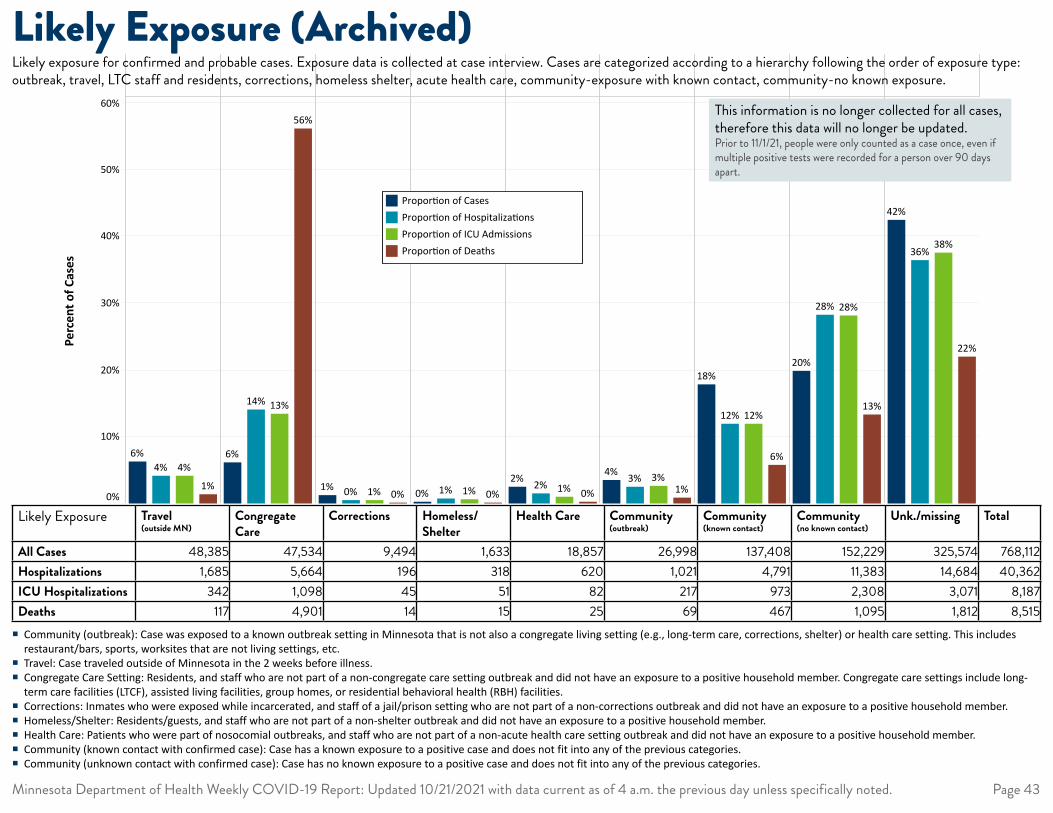
Trav
el o
uts
ide
ofM
inne
sota
Long
-te
rmCa
re/
Assis
ted
Livin
g/Gr
oup
Hom
e/..
Corr
ec�.
.
Hom
ele.
.
Heal
thc.
.
Com
mun
ity (O
utb
reak
)
Com
mun
ity (k
now
n co
ntac
tw
it..
Com
mun
ity (n
o kn
own
cont
act .
.
Unkn
o..
0%
10%
20%
30%
40%
50%
60%Va
lue
1%
4%4%6%
56%
13%14%
6%
0%1%0%1%0%1%1%0% 0%1%2%2%
1%3%3%4%
6%
12%12%
18%
13%
28%28%
20%22%
38%36%
42%
Likely Exposure
Propor�on of CasesPropor�on of Hospitaliza�onsPropor�on of ICU AdmissionsPropor�on of Deaths
Perc
ent o
f Cas
es
Minnesota Department of Health Weekly COVID-19 Report: Updated 10/21/2021 with data current as of 4 a.m. the previous day unless specifically noted. Page 43
Likely Exposure (Archived)
� Community (outbreak): Case was exposed to a known outbreak setting in Minnesota that is not also a congregate living setting (e.g., long-term care, corrections, shelter) or health care setting. This includes restaurant/bars, sports, worksites that are not living settings, etc.
� Travel: Case traveled outside of Minnesota in the 2 weeks before illness. � Congregate Care Setting: Residents, and staff who are not part of a non-congregate care setting outbreak and did not have an exposure to a positive household member. Congregate care settings include long-term care facilities (LTCF), assisted living facilities, group homes, or residential behavioral health (RBH) facilities.
� Corrections: Inmates who were exposed while incarcerated, and staff of a jail/prison setting who are not part of a non-corrections outbreak and did not have an exposure to a positive household member. � Homeless/Shelter: Residents/guests, and staff who are not part of a non-shelter outbreak and did not have an exposure to a positive household member. � Health Care: Patients who were part of nosocomial outbreaks, and staff who are not part of a non-acute health care setting outbreak and did not have an exposure to a positive household member. � Community (known contact with confirmed case): Case has a known exposure to a positive case and does not fit into any of the previous categories. � Community (unknown contact with confirmed case): Case has no known exposure to a positive case and does not fit into any of the previous categories.
Likely Exposure Travel (outside MN)
Congregate Care
Corrections Homeless/Shelter
Health Care Community (outbreak)
Community (known contact)
Community (no known contact)
Unk./missing Total
All Cases 48,385 47,534 9,494 1,633 18,857 26,998 137,408 152,229 325,574 768,112 Hospitalizations 1,685 5,664 196 318 620 1,021 4,791 11,383 14,684 40,362 ICU Hospitalizations 342 1,098 45 51 82 217 973 2,308 3,071 8,187 Deaths 117 4,901 14 15 25 69 467 1,095 1,812 8,515
Likely exposure for confirmed and probable cases. Exposure data is collected at case interview. Cases are categorized according to a hierarchy following the order of exposure type: outbreak, travel, LTC staff and residents, corrections, homeless shelter, acute health care, community-exposure with known contact, community-no known exposure.
This information is no longer collected for all cases, therefore this data will no longer be updated. Prior to 11/1/21, people were only counted as a case once, even if multiple positive tests were recorded for a person over 90 days apart.
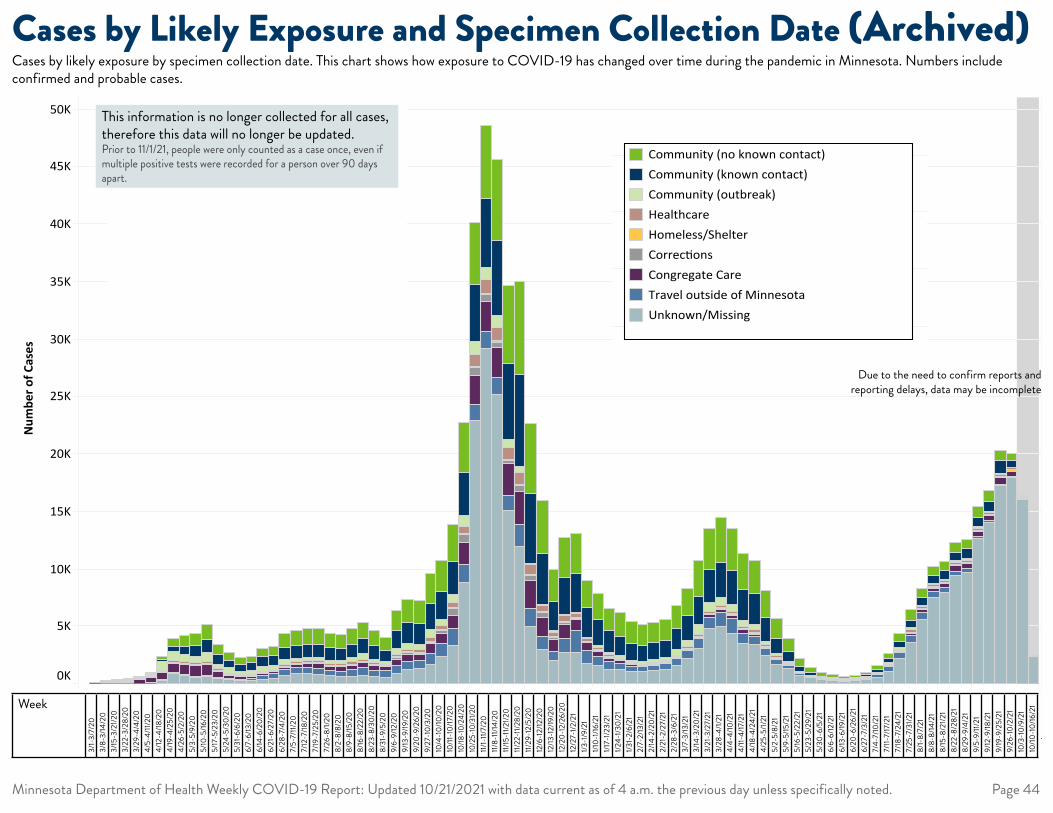
Unknown/Missing August 8, 2021 1564
Unknown/Missing September 12, 2021 2702
Unknown/Missing September 5, 2021 11967
Unknown/Missing August 29, 2021 10660
Unknown/Missing August 22, 2021 8114
Unknown/Missing August 15, 2021 7602
Unknown/Missing August 8, 2021 5608
Unknown/Missing August 1, 2021 3616
Unknown/Missing July 25, 2021 2238
Unknown/Missing July 18, 2021 1066
Unknown/Missing July 11, 2021 523
Unknown/Missing July 4, 2021 309
Unknown/Missing June 27, 2021 234
Unknown/Missing June 20, 2021 208
Unknown/Missing June 13, 2021 263
Unknown/Missing June 6, 2021 324
Unknown/Missing May 30, 2021 506
Unknown/Missing May 23, 2021 697
Unknown/Missing May 16, 2021 1288
Unknown/Missing May 9, 2021 1687
Unknown/Missing May 2, 2021 2486
Unknown/Missing April 25, 2021 3436
Unknown/Missing April 18, 2021 3545
Unknown/Missing April 11, 2021 4441
Unknown/Missing April 4, 2021 4939
Unknown/Missing March 28, 2021 4715
Unknown/Missing March 21, 2021 3062
Unknown/Missing March 14, 2021 2183
Unknown/Missing March 7, 2021 1594
Unknown/Missing February 28, 2021 1213
Unknown/Missing February 21, 2021 1139
Unknown/Missing February 14, 2021 1074
Unknown/Missing February 7, 2021 1083
Unknown/Missing January 31, 2021 1218
Unknown/Missing January 24, 2021 1246
Unknown/Missing January 17, 2021 1551
Unknown/Missing January 10, 2021 1811
Unknown/Missing January 3, 2021 2707
Unknown/Missing December 27, 2020 2715
Unknown/Missing December 20, 2020 1997
Unknown/Missing December 13, 2020 3002
Unknown/Missing December 6, 2020 5005
Unknown/Missing November 29, 2020 11924
Unknown/Missing November 22, 2020 15153
Unknown/Missing November 15, 2020 25282
Unknown/Missing November 8, 2020 29266
Unknown/Missing November 1, 2020 22968
Unknown/Missing October 25, 2020 8855
Unknown/Missing October 18, 2020 3382
Unknown/Missing October 11, 2020 2364
Unknown/Missing October 4, 2020 1687
Unknown/Missing September 27, 2020 1295
Unknown/Missing September 20, 2020 1213
Unknown/Missing September 13, 2020 888
Unknown/Missing September 6, 2020 539
Unknown/Missing August 30, 2020 601
Unknown/Missing August 23, 2020 746
Unknown/Missing August 16, 2020 633
Unknown/Missing August 9, 2020 646
Unknown/Missing August 2, 2020 675
Unknown/Missing July 26, 2020 851
Unknown/Missing July 19, 2020 892
Unknown/Missing July 12, 2020 856
Unknown/Missing July 5, 2020 676
Unknown/Missing June 28, 2020 474
Unknown/Missing June 21, 2020 368
Unknown/Missing June 14, 2020 285
Unknown/Missing June 7, 2020 236
Unknown/Missing May 31, 2020 309
Unknown/Missing May 24, 2020 448
Unknown/Missing May 17, 2020 596
Unknown/Missing May 10, 2020 540
Unknown/Missing May 3, 2020 765
Unknown/Missing April 26, 2020 902
Unknown/Missing April 19, 2020 288
Unknown/Missing April 12, 2020 53
Unknown/Missing April 5, 2020 9
Unknown/Missing March 29, 2020 9
Unknown/Missing March 22, 2020 1
Unknown/Missing March 15, 2020 1
Unknown/Missing March 8, 2020 1
Unknown/Missing 17
Travel outside of Minnesota September 5, 2021 20
Travel outside of Minnesota August 29, 2021 193
Travel outside of Minnesota August 22, 2021 450
Travel outside of Minnesota August 15, 2021 503
Travel outside of Minnesota August 8, 2021 578
Travel outside of Minnesota August 1, 2021 655
Travel outside of Minnesota July 25, 2021 517
Travel outside of Minnesota July 18, 2021 474
Travel outside of Minnesota July 11, 2021 297
Travel outside of Minnesota July 4, 2021 198
Travel outside of Minnesota June 27, 2021 115
Travel outside of Minnesota June 20, 2021 77
Travel outside of Minnesota June 13, 2021 98
Travel outside of Minnesota June 6, 2021 90
Travel outside of Minnesota May 30, 2021 128
Travel outside of Minnesota May 23, 2021 183
Travel outside of Minnesota May 16, 2021 287
Travel outside of Minnesota May 9, 2021 418
Travel outside of Minnesota May 2, 2021 565
Travel outside of Minnesota April 25, 2021 709
Travel outside of Minnesota April 18, 2021 839
Travel outside of Minnesota April 11, 2021 1210
Travel outside of Minnesota April 4, 2021 1227
Travel outside of Minnesota March 28, 2021 1013
Travel outside of Minnesota March 21, 2021 895
Travel outside of Minnesota March 14, 2021 738
Travel outside of Minnesota March 7, 2021 567
Travel outside of Minnesota February 28, 2021 526
Travel outside of Minnesota February 21, 2021 498
Travel outside of Minnesota February 14, 2021 434
Travel outside of Minnesota February 7, 2021 438
Travel outside of Minnesota January 31, 2021 537
Travel outside of Minnesota January 24, 2021 669
Travel outside of Minnesota January 17, 2021 826
Travel outside of Minnesota January 10, 2021 1148
Travel outside of Minnesota January 3, 2021 1894
Travel outside of Minnesota December 27, 2020 1234
Travel outside of Minnesota December 20, 2020 837
Travel outside of Minnesota December 13, 2020 1190
Travel outside of Minnesota December 6, 2020 1617
Travel outside of Minnesota November 29, 2020 1948
Travel outside of Minnesota November 22, 2020 1299
Travel outside of Minnesota November 15, 2020 1390
Travel outside of Minnesota November 8, 2020 1431
Travel outside of Minnesota November 1, 2020 1379
Travel outside of Minnesota October 25, 2020 1567
Travel outside of Minnesota October 18, 2020 1390
Travel outside of Minnesota October 11, 2020 1131
Travel outside of Minnesota October 4, 2020 930
Travel outside of Minnesota September 27, 2020 758
Travel outside of Minnesota September 20, 2020 743
Travel outside of Minnesota September 13, 2020 727
Travel outside of Minnesota September 6, 2020 641
Travel outside of Minnesota August 30, 2020 577
Travel outside of Minnesota August 23, 2020 693
Travel outside of Minnesota August 16, 2020 568
Travel outside of Minnesota August 9, 2020 459
Travel outside of Minnesota August 2, 2020 468
Travel outside of Minnesota July 26, 2020 487
Travel outside of Minnesota July 19, 2020 510
Travel outside of Minnesota July 12, 2020 577
Travel outside of Minnesota July 5, 2020 556
Travel outside of Minnesota June 28, 2020 406
Travel outside of Minnesota June 21, 2020 338
Travel outside of Minnesota June 14, 2020 189
Travel outside of Minnesota June 7, 2020 112
Travel outside of Minnesota May 31, 2020 109
Travel outside of Minnesota May 24, 2020 95
Travel outside of Minnesota May 17, 2020 99
Travel outside of Minnesota May 10, 2020 51
Travel outside of Minnesota May 3, 2020 55
Travel outside of Minnesota April 26, 2020 50
Travel outside of Minnesota April 19, 2020 22
Travel outside of Minnesota April 12, 2020 21
Travel outside of Minnesota April 5, 2020 23
Travel outside of Minnesota March 29, 2020 66
Travel outside of Minnesota March 22, 2020 120
Travel outside of Minnesota March 15, 2020 145
Travel outside of Minnesota March 8, 2020 73
Travel outside of Minnesota March 1, 2020 2
Congregate Care September 5, 2021 15
Congregate Care August 29, 2021 310
Congregate Care August 22, 2021 340
Congregate Care August 15, 2021 345
Congregate Care August 8, 2021 290
Congregate Care August 1, 2021 166
Congregate Care July 25, 2021 103
Congregate Care July 18, 2021 73
Congregate Care July 11, 2021 48
Congregate Care July 4, 2021 25
Congregate Care June 27, 2021 16
Congregate Care June 20, 2021 18
Congregate Care June 13, 2021 26
Congregate Care June 6, 2021 29
Congregate Care May 30, 2021 40
Congregate Care May 23, 2021 70
Congregate Care May 16, 2021 143
Congregate Care May 9, 2021 181
Congregate Care May 2, 2021 172
Congregate Care April 25, 2021 259
Congregate Care April 18, 2021 273
Congregate Care April 11, 2021 286
Congregate Care April 4, 2021 277
Congregate Care March 28, 2021 220
Congregate Care March 21, 2021 171
Congregate Care March 14, 2021 131
Congregate Care March 7, 2021 132
Congregate Care February 28, 2021 111
Congregate Care February 21, 2021 75
Congregate Care February 14, 2021 123
Congregate Care February 7, 2021 231
Congregate Care January 31, 2021 297
Congregate Care January 24, 2021 355
Congregate Care January 17, 2021 505
Congregate Care January 10, 2021 617
Congregate Care January 3, 2021 916
Congregate Care December 27, 2020 1179
Congregate Care December 20, 2020 1058
Congregate Care December 13, 2020 1558
Congregate Care December 6, 2020 2391
Congregate Care November 29, 2020 2882
Congregate Care November 22, 2020 2634
Congregate Care November 15, 2020 2591
Congregate Care November 8, 2020 2543
Congregate Care November 1, 2020 2465
Congregate Care October 25, 2020 1799
Congregate Care October 18, 2020 1165
Congregate Care October 11, 2020 890
Congregate Care October 4, 2020 863
Congregate Care September 27, 2020 528
Congregate Care September 20, 2020 586
Congregate Care September 13, 2020 542
Congregate Care September 6, 2020 341
Congregate Care August 30, 2020 455
Congregate Care August 23, 2020 409
Congregate Care August 16, 2020 474
Congregate Care August 9, 2020 430
Congregate Care August 2, 2020 366
Congregate Care July 26, 2020 446
Congregate Care July 19, 2020 347
Congregate Care July 12, 2020 299
Congregate Care July 5, 2020 236
Congregate Care June 28, 2020 217
Congregate Care June 21, 2020 257
Congregate Care June 14, 2020 226
Congregate Care June 7, 2020 237
Congregate Care May 31, 2020 326
Congregate Care May 24, 2020 600
Congregate Care May 17, 2020 1016
Congregate Care May 10, 2020 1053
Congregate Care May 3, 2020 902
Congregate Care April 26, 2020 859
Congregate Care April 19, 2020 637
Congregate Care April 12, 2020 492
Congregate Care April 5, 2020 364
Congregate Care March 29, 2020 138
Congregate Care March 22, 2020 65
Congregate Care March 15, 2020 9
Congregate Care March 8, 2020 1
Corrections September 5, 2021 48
Corrections August 29, 2021 62
Corrections August 22, 2021 50
Corrections August 15, 2021 37
Corrections August 8, 2021 42
Corrections August 1, 2021 43
Corrections July 25, 2021 15
Corrections July 18, 2021 11
Corrections July 11, 2021 5
Corrections July 4, 2021 2
Corrections June 27, 2021 4
Corrections June 13, 2021 2
Corrections June 6, 2021 4
Corrections May 30, 2021 3
Corrections May 23, 2021 5
Corrections May 16, 2021 7
Corrections May 9, 2021 15
Corrections May 2, 2021 26
Corrections April 25, 2021 31
Corrections April 18, 2021 86
Corrections April 11, 2021 118
Corrections April 4, 2021 118
Corrections March 28, 2021 135
Corrections March 21, 2021 29
Corrections March 14, 2021 60
Corrections March 7, 2021 104
Corrections February 28, 2021 66
Corrections February 21, 2021 31
Corrections February 14, 2021 8
Corrections February 7, 2021 23
Corrections January 31, 2021 28
Corrections January 24, 2021 58
Corrections January 17, 2021 61
Corrections January 10, 2021 82
Corrections January 3, 2021 163
Corrections December 27, 2020 230
Corrections December 20, 2020 249
Corrections December 13, 2020 434
Corrections December 6, 2020 483
Corrections November 29, 2020 503
Corrections November 22, 2020 289
Corrections November 15, 2020 472
Corrections November 8, 2020 598
Corrections November 1, 2020 761
Corrections October 25, 2020 798
Corrections October 18, 2020 609
Corrections October 11, 2020 276
Corrections October 4, 2020 242
Corrections September 27, 2020 166
Corrections September 20, 2020 263
Corrections September 13, 2020 198
Corrections September 6, 2020 73
Corrections August 30, 2020 65
Corrections August 23, 2020 51
Corrections August 16, 2020 36
Corrections August 9, 2020 18
Corrections August 2, 2020 63
Corrections July 26, 2020 43
Corrections July 19, 2020 93
Corrections July 12, 2020 54
Corrections July 5, 2020 39
Corrections June 28, 2020 17
Corrections June 21, 2020 7
Corrections June 14, 2020 48
Corrections June 7, 2020 99
Corrections May 31, 2020 92
Corrections May 24, 2020 16
Corrections May 17, 2020 20
Corrections May 10, 2020 30
Corrections May 3, 2020 23
Corrections April 26, 2020 37
Corrections April 19, 2020 78
Corrections April 12, 2020 20
Corrections April 5, 2020 23
Corrections March 29, 2020 15
Corrections March 22, 2020 1
Homeless/Shelter August 29, 2021 5
Homeless/Shelter August 22, 2021 13
Homeless/Shelter August 15, 2021 29
Homeless/Shelter August 8, 2021 24
Homeless/Shelter August 1, 2021 9
Homeless/Shelter July 25, 2021 8
Homeless/Shelter July 18, 2021 5
Homeless/Shelter July 11, 2021 5
Homeless/Shelter July 4, 2021 3
Homeless/Shelter June 27, 2021 1
Homeless/Shelter June 20, 2021 2
Homeless/Shelter June 13, 2021 3
Homeless/Shelter June 6, 2021 11
Homeless/Shelter May 30, 2021 4
Homeless/Shelter May 23, 2021 7
Homeless/Shelter May 16, 2021 8
Homeless/Shelter May 9, 2021 13
Homeless/Shelter May 2, 2021 16
Homeless/Shelter April 25, 2021 30
Homeless/Shelter April 18, 2021 21
Homeless/Shelter April 11, 2021 14
Homeless/Shelter April 4, 2021 19
Homeless/Shelter March 28, 2021 14
Homeless/Shelter March 21, 2021 8
Homeless/Shelter March 14, 2021 8
Homeless/Shelter March 7, 2021 10
Homeless/Shelter February 28, 2021 7
Homeless/Shelter February 21, 2021 9
Homeless/Shelter February 14, 2021 6
Homeless/Shelter February 7, 2021 7
Homeless/Shelter January 31, 2021 10
Homeless/Shelter January 24, 2021 23
Homeless/Shelter January 17, 2021 16
Homeless/Shelter January 10, 2021 14
Homeless/Shelter January 3, 2021 28
Homeless/Shelter December 27, 2020 31
Homeless/Shelter December 20, 2020 33
Homeless/Shelter December 13, 2020 54
Homeless/Shelter December 6, 2020 53
Homeless/Shelter November 29, 2020 84
Homeless/Shelter November 22, 2020 73
Homeless/Shelter November 15, 2020 111
Homeless/Shelter November 8, 2020 108
Homeless/Shelter November 1, 2020 46
Homeless/Shelter October 25, 2020 27
Homeless/Shelter October 18, 2020 16
Homeless/Shelter October 11, 2020 10
Homeless/Shelter October 4, 2020 11
Homeless/Shelter September 27, 2020 15
Homeless/Shelter September 20, 2020 22
Homeless/Shelter September 13, 2020 41
Homeless/Shelter September 6, 2020 10
Homeless/Shelter August 30, 2020 9
Homeless/Shelter August 23, 2020 15
Homeless/Shelter August 16, 2020 9
Homeless/Shelter August 9, 2020 11
Homeless/Shelter August 2, 2020 28
Homeless/Shelter July 26, 2020 13
Homeless/Shelter July 19, 2020 17
Homeless/Shelter July 12, 2020 13
Homeless/Shelter July 5, 2020 15
Homeless/Shelter June 28, 2020 13
Homeless/Shelter June 21, 2020 9
Homeless/Shelter June 14, 2020 5
Homeless/Shelter June 7, 2020 11
Homeless/Shelter May 31, 2020 22
Homeless/Shelter May 24, 2020 22
Homeless/Shelter May 17, 2020 25
Homeless/Shelter May 10, 2020 22
Homeless/Shelter May 3, 2020 18
Homeless/Shelter April 26, 2020 23
Homeless/Shelter April 19, 2020 22
Homeless/Shelter April 12, 2020 5
Homeless/Shelter April 5, 2020 5
Healthcare September 5, 2021 4
Healthcare August 29, 2021 104
Healthcare August 22, 2021 95
Healthcare August 15, 2021 128
Healthcare August 8, 2021 133
Healthcare August 1, 2021 157
Healthcare July 25, 2021 104
Healthcare July 18, 2021 69
Healthcare July 11, 2021 39
Healthcare July 4, 2021 18
Healthcare June 27, 2021 23
Healthcare June 20, 2021 19
Healthcare June 13, 2021 23
Healthcare June 6, 2021 23
Healthcare May 30, 2021 39
Healthcare May 23, 2021 51
Healthcare May 16, 2021 105
Healthcare May 9, 2021 144
Healthcare May 2, 2021 135
Healthcare April 25, 2021 189
Healthcare April 18, 2021 171
Healthcare April 11, 2021 197
Healthcare April 4, 2021 211
Healthcare March 28, 2021 172
Healthcare March 21, 2021 146
Healthcare March 14, 2021 126
Healthcare March 7, 2021 89
Healthcare February 28, 2021 74
Healthcare February 21, 2021 74
Healthcare February 14, 2021 74
Healthcare February 7, 2021 87
Healthcare January 31, 2021 128
Healthcare January 24, 2021 176
Healthcare January 17, 2021 202
Healthcare January 10, 2021 295
Healthcare January 3, 2021 460
Healthcare December 27, 2020 500
Healthcare December 20, 2020 415
Healthcare December 13, 2020 622
Healthcare December 6, 2020 885
Healthcare November 29, 2020 1114
Healthcare November 22, 2020 1079
Healthcare November 15, 2020 1167
Healthcare November 8, 2020 1228
Healthcare November 1, 2020 1021
Healthcare October 25, 2020 615
Healthcare October 18, 2020 450
Healthcare October 11, 2020 333
Healthcare October 4, 2020 324
Healthcare September 27, 2020 256
Healthcare September 20, 2020 213
Healthcare September 13, 2020 194
Healthcare September 6, 2020 112
Healthcare August 30, 2020 153
Healthcare August 23, 2020 179
Healthcare August 16, 2020 194
Healthcare August 9, 2020 159
Healthcare August 2, 2020 147
Healthcare July 26, 2020 175
Healthcare July 19, 2020 152
Healthcare July 12, 2020 150
Healthcare July 5, 2020 144
Healthcare June 28, 2020 85
Healthcare June 21, 2020 73
Healthcare June 14, 2020 56
Healthcare June 7, 2020 77
Healthcare May 31, 2020 63
Healthcare May 24, 2020 99
Healthcare May 17, 2020 142
Healthcare May 10, 2020 132
Healthcare May 3, 2020 168
Healthcare April 26, 2020 146
Healthcare April 19, 2020 96
Healthcare April 12, 2020 67
Healthcare April 5, 2020 57
Healthcare March 29, 2020 81
Healthcare March 22, 2020 69
Healthcare March 15, 2020 24
Healthcare March 8, 2020 3
Community (outbreak) August 29, 2021 12
Community (outbreak) August 22, 2021 68
Community (outbreak) August 15, 2021 106
Community (outbreak) August 8, 2021 108
Community (outbreak) August 1, 2021 156
Community (outbreak) July 25, 2021 161
Community (outbreak) July 18, 2021 109
Community (outbreak) July 11, 2021 83
Community (outbreak) July 4, 2021 23
Community (outbreak) June 27, 2021 14
Community (outbreak) June 20, 2021 16
Community (outbreak) June 13, 2021 9
Community (outbreak) June 6, 2021 27
Community (outbreak) May 30, 2021 17
Community (outbreak) May 23, 2021 46
Community (outbreak) May 16, 2021 99
Community (outbreak) May 9, 2021 174
Community (outbreak) May 2, 2021 293
Community (outbreak) April 25, 2021 461
Community (outbreak) April 18, 2021 548
Community (outbreak) April 11, 2021 626
Community (outbreak) April 4, 2021 701
Community (outbreak) March 28, 2021 804
Community (outbreak) March 21, 2021 798
Community (outbreak) March 14, 2021 573
Community (outbreak) March 7, 2021 483
Community (outbreak) February 28, 2021 276
Community (outbreak) February 21, 2021 245
Community (outbreak) February 14, 2021 208
Community (outbreak) February 7, 2021 186
Community (outbreak) January 31, 2021 231
Community (outbreak) January 24, 2021 241
Community (outbreak) January 17, 2021 174
Community (outbreak) January 10, 2021 76
Community (outbreak) January 3, 2021 39
Community (outbreak) December 27, 2020 62
Community (outbreak) December 20, 2020 17
Community (outbreak) December 13, 2020 33
Community (outbreak) December 6, 2020 79
Community (outbreak) November 29, 2020 365
Community (outbreak) November 22, 2020 711
Community (outbreak) November 15, 2020 1056
Community (outbreak) November 8, 2020 1039
Community (outbreak) November 1, 2020 1107
Community (outbreak) October 25, 2020 998
Community (outbreak) October 18, 2020 745
Community (outbreak) October 11, 2020 567
Community (outbreak) October 4, 2020 583
Community (outbreak) September 27, 2020 447
Community (outbreak) September 20, 2020 442
Community (outbreak) September 13, 2020 477
Community (outbreak) September 6, 2020 204
Community (outbreak) August 30, 2020 263
Community (outbreak) August 23, 2020 539
Community (outbreak) August 16, 2020 361
Community (outbreak) August 9, 2020 295
Community (outbreak) August 2, 2020 276
Community (outbreak) July 26, 2020 289
Community (outbreak) July 19, 2020 249
Community (outbreak) July 12, 2020 290
Community (outbreak) July 5, 2020 413
Community (outbreak) June 28, 2020 374
Community (outbreak) June 21, 2020 489
Community (outbreak) June 14, 2020 335
Community (outbreak) June 7, 2020 287
Community (outbreak) May 31, 2020 455
Community (outbreak) May 24, 2020 415
Community (outbreak) May 17, 2020 827
Community (outbreak) May 10, 2020 584
Community (outbreak) May 3, 2020 636
Community (outbreak) April 26, 2020 817
Community (outbreak) April 19, 2020 835
Community (outbreak) April 12, 2020 165
Community (outbreak) April 5, 2020 26
Community (outbreak) March 29, 2020 10
Community (outbreak) March 22, 2020 6
Community (outbreak) March 15, 2020 8
Community (outbreak) March 8, 2020 1
Community (known contact) September 5, 2021 49
Community (known contact) August 29, 2021 396
Community (known contact) August 22, 2021 759
Community (known contact) August 15, 2021 664
Community (known contact) August 8, 2021 654
Community (known contact) August 1, 2021 681
Community (known contact) July 25, 2021 557
Community (known contact) July 18, 2021 363
Community (known contact) July 11, 2021 232
Community (known contact) July 4, 2021 174
Community (known contact) June 27, 2021 116
Community (known contact) June 20, 2021 93
Community (known contact) June 13, 2021 116
Community (known contact) June 6, 2021 126
Community (known contact) May 30, 2021 243
Community (known contact) May 23, 2021 481
Community (known contact) May 16, 2021 911
Community (known contact) May 9, 2021 1353
Community (known contact) May 2, 2021 2015
Community (known contact) April 25, 2021 2715
Community (known contact) April 18, 2021 2734
Community (known contact) April 11, 2021 2999
Community (known contact) April 4, 2021 3118
Community (known contact) March 28, 2021 2890
Community (known contact) March 21, 2021 2495
Community (known contact) March 14, 2021 2121
Community (known contact) March 7, 2021 1745
Community (known contact) February 28, 2021 1497
Community (known contact) February 21, 2021 1506
Community (known contact) February 14, 2021 1442
Community (known contact) February 7, 2021 1478
Community (known contact) January 31, 2021 1713
Community (known contact) January 24, 2021 1802
Community (known contact) January 17, 2021 2211
Community (known contact) January 10, 2021 2533
Community (known contact) January 3, 2021 3379
Community (known contact) December 27, 2020 3272
Community (known contact) December 20, 2020 2558
Community (known contact) December 13, 2020 4479
Community (known contact) December 6, 2020 6085
Community (known contact) November 29, 2020 8085
Community (known contact) November 22, 2020 6630
Community (known contact) November 15, 2020 6540
Community (known contact) November 8, 2020 5966
Community (known contact) November 1, 2020 4950
Community (known contact) October 25, 2020 3728
Community (known contact) October 18, 2020 2890
Community (known contact) October 11, 2020 2414
Community (known contact) October 4, 2020 2297
Community (known contact) September 27, 2020 1733
Community (known contact) September 20, 2020 1799
Community (known contact) September 13, 2020 1478
Community (known contact) September 6, 2020 969
Community (known contact) August 30, 2020 1229
Community (known contact) August 23, 2020 1330
Community (known contact) August 16, 2020 1152
Community (known contact) August 9, 2020 1077
Community (known contact) August 2, 2020 1171
Community (known contact) July 26, 2020 1120
Community (known contact) July 19, 2020 1150
Community (known contact) July 12, 2020 1134
Community (known contact) July 5, 2020 1100
Community (known contact) June 28, 2020 835
Community (known contact) June 21, 2020 822
Community (known contact) June 14, 2020 694
Community (known contact) June 7, 2020 646
Community (known contact) May 31, 2020 649
Community (known contact) May 24, 2020 825
Community (known contact) May 17, 2020 1124
Community (known contact) May 10, 2020 895
Community (known contact) May 3, 2020 713
Community (known contact) April 26, 2020 441
Community (known contact) April 19, 2020 171
Community (known contact) April 12, 2020 69
Community (known contact) April 5, 2020 55
Community (known contact) March 29, 2020 54
Community (known contact) March 22, 2020 42
Community (known contact) March 15, 2020 21
Community (known contact) March 8, 2020 2
Community (no known contact) September 12, 2021 1
Community (no known contact) September 5, 2021 37
Community (no known contact) August 29, 2021 413
Community (no known contact) August 22, 2021 773
Community (no known contact) August 15, 2021 791
Community (no known contact) August 8, 2021 815
Community (no known contact) August 1, 2021 923
Community (no known contact) July 25, 2021 700
Community (no known contact) July 18, 2021 507
Community (no known contact) July 11, 2021 316
Community (no known contact) July 4, 2021 221
Community (no known contact) June 27, 2021 206
Community (no known contact) June 20, 2021 200
Community (no known contact) June 13, 2021 225
Community (no known contact) June 6, 2021 319
Community (no known contact) May 30, 2021 414
Community (no known contact) May 23, 2021 631
Community (no known contact) May 16, 2021 1147
Community (no known contact) May 9, 2021 1627
Community (no known contact) May 2, 2021 2384
Community (no known contact) April 25, 2021 2954
Community (no known contact) April 18, 2021 3177
Community (no known contact) April 11, 2021 3618
Community (no known contact) April 4, 2021 3805
Community (no known contact) March 28, 2021 3526
Community (no known contact) March 21, 2021 3169
Community (no known contact) March 14, 2021 2316
Community (no known contact) March 7, 2021 2046
Community (no known contact) February 28, 2021 1744
Community (no known contact) February 21, 2021 1738
Community (no known contact) February 14, 2021 1705
Community (no known contact) February 7, 2021 1847
Community (no known contact) January 31, 2021 1978
Community (no known contact) January 24, 2021 1959
Community (no known contact) January 17, 2021 2337
Community (no known contact) January 10, 2021 2377
Community (no known contact) January 3, 2021 3428
Community (no known contact) December 27, 2020 3485
Community (no known contact) December 20, 2020 2799
Community (no known contact) December 13, 2020 4532
Community (no known contact) December 6, 2020 6065
Community (no known contact) November 29, 2020 8036
Community (no known contact) November 22, 2020 6796
Community (no known contact) November 15, 2020 7038
Community (no known contact) November 8, 2020 6399
Community (no known contact) November 1, 2020 5353
Community (no known contact) October 25, 2020 4306
Community (no known contact) October 18, 2020 3198
Community (no known contact) October 11, 2020 2731
Community (no known contact) October 4, 2020 2706
Community (no known contact) September 27, 2020 2069
Community (no known contact) September 20, 2020 2077
Community (no known contact) September 13, 2020 1814
Community (no known contact) September 6, 2020 1146
Community (no known contact) August 30, 2020 1270
Community (no known contact) August 23, 2020 1358
Community (no known contact) August 16, 2020 1366
Community (no known contact) August 9, 2020 1264
Community (no known contact) August 2, 2020 1251
Community (no known contact) July 26, 2020 1378
Community (no known contact) July 19, 2020 1343
Community (no known contact) July 12, 2020 1240
Community (no known contact) July 5, 2020 1252
Community (no known contact) June 28, 2020 822
Community (no known contact) June 21, 2020 743
Community (no known contact) June 14, 2020 541
Community (no known contact) June 7, 2020 591
Community (no known contact) May 31, 2020 707
Community (no known contact) May 24, 2020 938
Community (no known contact) May 17, 2020 1243
Community (no known contact) May 10, 2020 1087
Community (no known contact) May 3, 2020 991
Community (no known contact) April 26, 2020 698
Community (no known contact) April 19, 2020 225
Community (no known contact) April 12, 2020 107
Community (no known contact) April 5, 2020 88
Community (no known contact) March 29, 2020 100
Community (no known contact) March 22, 2020 57
Community (no known contact) March 15, 2020 29
Community (no known contact) March 8, 2020 7
Community (no known contact) 1
Mar 1, 20 Apr 26, 20 Jun 21, 20 Aug 16, 20 Oct 11, 20 Dec 6, 20 Jan 31, 21 Mar 28, 21 May 23, 21 Jul 18, 21 Sep 12, 21
Week of specimen_date
0K
5K
10K
15K
20K
25K
30K
35K
40K
45K
50K
Num
ber o
f Rec
ords
Likely Exposure Epi CurveCommunity (no known contact)Community (known contact)Community (outbreak)HealthcareHomeless/ShelterCorrec�onsCongregate CareTravel outside of MinnesotaUnknown/Missing
Num
ber o
f Cas
es
Week
3/1-
3/7/
203/
8-3/
14/2
03/
15-3
/21/2
03/
22-3
/28/
203/
29-4
/4/2
04/
5-4/
11/20
4/12
-4/18
/20
4/19
-4/2
5/20
4/26
-5/2
/20
5/3-
5/9/
205/
10-5
/16/2
05/
17-5
/23/
205/
24-5
/30/
205/
31-6
/6/2
06/
7-6/
13/2
06/
14-6
/20/
206/
21-6
/27/
206/
28-7
/4/2
07/
5-7/
11/20
7/12
-7/18
/20
7/19
-7/2
5/20
7/26
-8/1/
208/
2-8/
8/20
8/9-
8/15
/20
8/16
-8/2
2/20
8/23
-8/3
0/20
8/31
-9/5
/20
9/6-
9/12
/20
9/13
-9/19
/20
9/20
-9/2
6/20
9/27
-10/
3/20
10/4
-10/
10/2
010
/11-1
0/17
/20
10/18
-10/2
4/20
10/2
5-10
/31/2
011/
1-11/
7/20
11/8-
11/14
/20
11/15
-11/2
1/20
11/22
-11/2
8/20
11/29
-12/
5/20
12/6
-12/
12/2
012
/13-12
/19/2
012
/20-
12/2
6/20
12/2
7-1/2
/21
1/3-1
/9/2
11/1
0-1/1
6/21
1/17-
1/23/
211/2
4-1/3
0/21
1/31-
2/6/
212/
7-2/
13/2
12/
14-2
/20/
212/
21-2
/27/
212/
28-3
/6/2
13/
7-3/
13/2
13/
14-3
/20/
213/
21-3
/27/
213/
28-4
/1/21
4/4-
4/10
/21
4/11-
4/17
/21
4/18
-4/2
4/21
4/25
-5/1/
215/
2-5/
8/21
5/9-
5/15
/21
5/16
-5/2
2/21
5/23
-5/2
9/21
5/30
-6/5
/21
6/6-
6/12
/21
6/13
-6/19
/21
6/20
-6/2
6/21
6/27
-7/3
/21
7/4-
7/10
/21
7/11-
7/17
/21
7/18
-7/2
4/21
7/25
-7/3
1/21
8/1-
8/7/
218/
8-8/
14/2
18/
15-8
/21/2
18/
22-8
/28/
218/
29-9
/4/2
19/
5-9/
11/21
9/12
-9/18
/21
9/19
-9/2
5/21
9/26
-10/
2/21
10/3
-10/
9/21
10/10
-10/
16/2
1
Minnesota Department of Health Weekly COVID-19 Report: Updated 10/21/2021 with data current as of 4 a.m. the previous day unless specifically noted. Page 44
Cases by Likely Exposure and Specimen Collection Date (Archived)Cases by likely exposure by specimen collection date. This chart shows how exposure to COVID-19 has changed over time during the pandemic in Minnesota. Numbers include confirmed and probable cases.
Due to the need to confirm reports and reporting delays, data may be incomplete
This information is no longer collected for all cases, therefore this data will no longer be updated. Prior to 11/1/21, people were only counted as a case once, even if multiple positive tests were recorded for a person over 90 days apart.
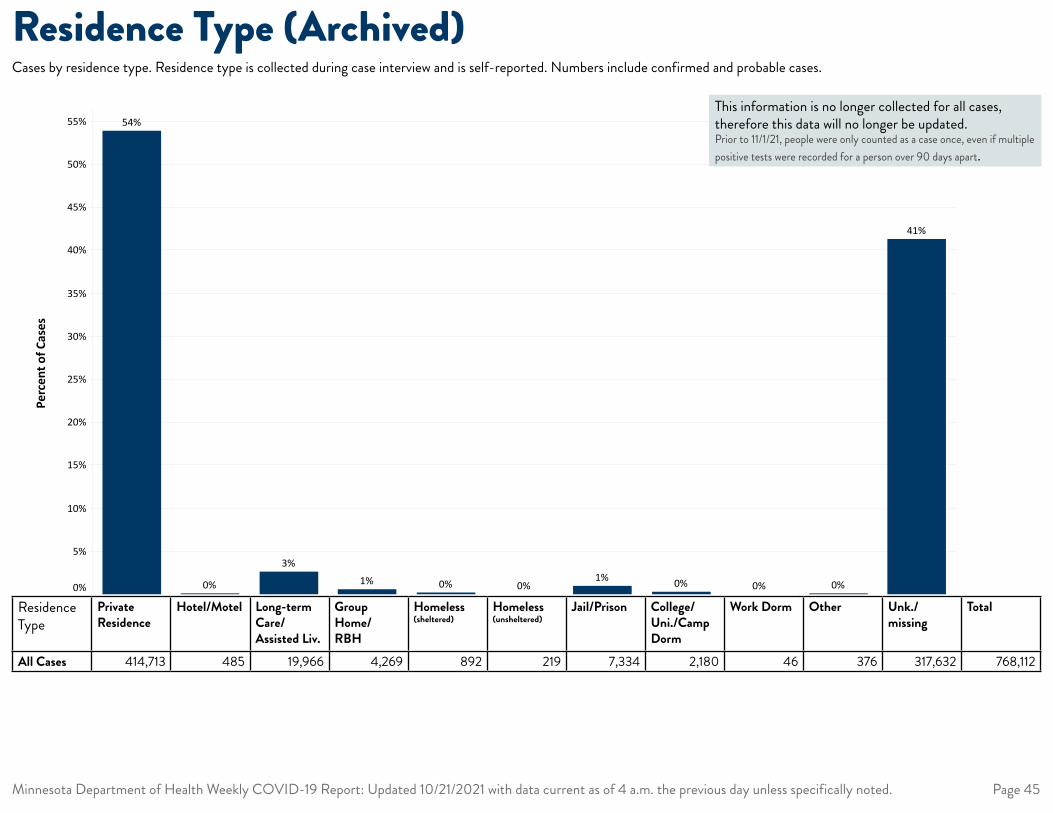
PrivateResidence
Hotel/Motel Long-term carefacility/Assiste..
Group Home/Residen�al b..
Homeless/Shelt.. Homeless/Unsh.. Prison/Jail College/University/Cam..
Work dormitory Other Unknown/Missi..0%
5%
10%
15%
20%
25%
30%
35%
40%
45%
50%
55%
% o
f Tot
al N
umbe
r of R
ecor
ds
54%
41%
0%
3%1% 0% 0%
1% 0% 0% 0%
Residence TypeCases by residence type. Residence type is collected during case interview and is self-reported. Numbers include confirmed and probable cases.
Perc
ent o
f Cas
es
Minnesota Department of Health Weekly COVID-19 Report: Updated 10/21/2021 with data current as of 4 a.m. the previous day unless specifically noted. Page 45
Residence Type (Archived)
Residence Type
Private Residence
Hotel/Motel Long-term Care/Assisted Liv.
Group Home/ RBH
Homeless (sheltered)
Homeless (unsheltered)
Jail/Prison College/Uni./Camp Dorm
Work Dorm Other Unk./missing
Total
All Cases 414,713 485 19,966 4,269 892 219 7,334 2,180 46 376 317,632 768,112
This information is no longer collected for all cases, therefore this data will no longer be updated. Prior to 11/1/21, people were only counted as a case once, even if multiple positive tests were recorded for a person over 90 days apart.
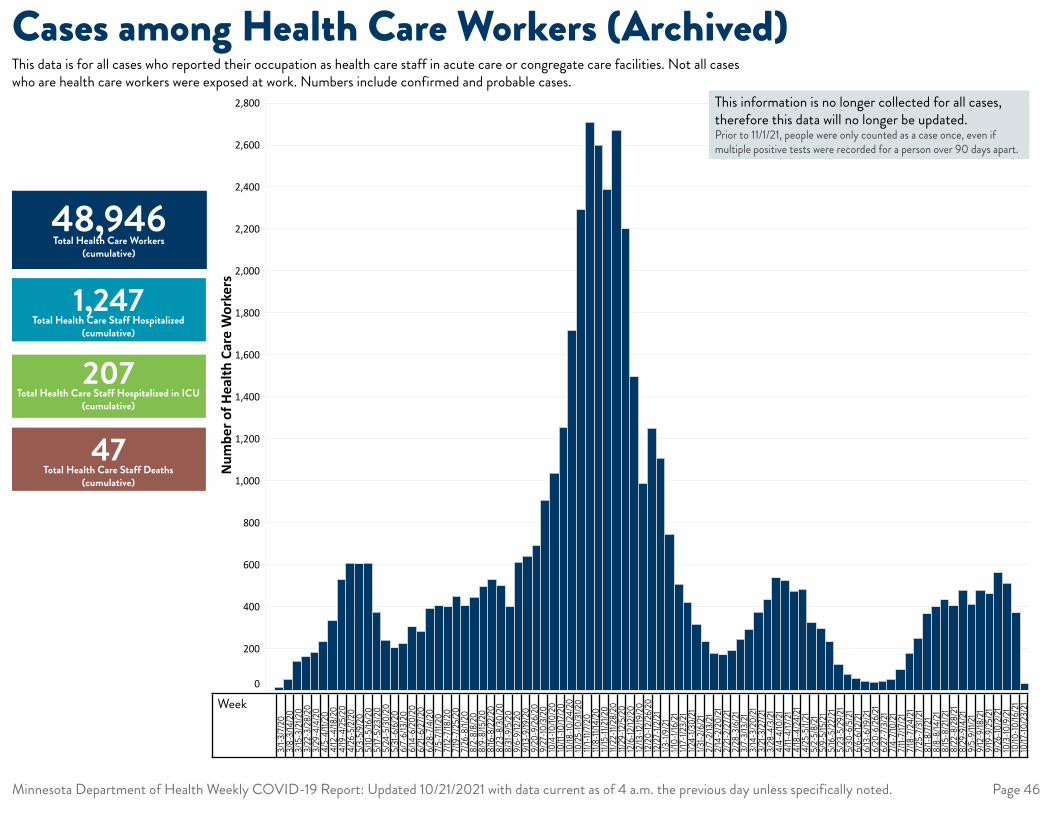
WEEK(specimen_date) SUM(Number of Healthcare Workers)
Week 11: 3/8-3/14 16
Week 12: 3/15-3/21 53
Week 13: 3/22-3/28 143
Week 14: 3/29-4/4 161
Week 15: 4/5-4/11 182
Week 16: 4/12-4/18 232
Week 17: 4/19-4/25 333
Week 18: 4/26-5/2 528
Week 19: 5/3-5/9 610
Week 20: 5/10-5/16 602
Week 21: 5/17-5/23 608
Week 22: 5/24-5/30 374
Week 23: 5/31-6/6 241
Week 24: 6/7-6/13 206
Week 25: 6/14-6/20 223
Week 26: 6/21-6/27 302
Week 27: 6/28-7/4 281
Week 28: 7/5-7/11 391
Week 29: 7/12-7/18 406
Week 30: 7/19-7/25 399
Week 31: 7/26-8/1 448
Week 32: 8/2-8/8 404
Week 33: 8/9-8/15 444
Week 34: 8/16-8/22 495
Week 35: 8/23-8/29 531
Week 36: 8/30-9/5 498
Week 37: 9/6-9/12 399
Week 38: 9/13-9/19 612
Week 39: 9/20-9/26 640
Week 40: 9/27-10/3 689
Week 41: 10/4-10/10 909
Week 42: 10/11-10/17 1036
Week 43: 10/18-10/24 1252
Week 44: 10/25-10/31 1719
Week 45: 11/1-11/7 2289
Week 46: 11/8-11/14 2707
Week 47: 11/15-11/21 2600
Week 48: 11/22-11/28 2387
Week 49: 11/29-12/5 2672
Week 50: 12/6-12/12 2200
Week 51: 12/13-12/19 1494
Week 52: 12/20-12/26 987
Week 53: 12/27-1/2/21 1249
Week 1: 1/3-1/9 1108
Week 2: 1/10-1/16 744
Week 3: 1/17-1/23 510
Week 4: 1/24-1/30 419
Week 5: 1/31-2/6 317
Week 6: 2/7-2/13 234
Week 7: 2/14-2/20 181
Week 8: 2/21-2/27 171
Week 9: 2/28-3/6 192
Week 10: 3/7-3/13 247
Week 11: 3/14-3/20 290
Week 12: 3/21-3/27 374
Week 13: 3/28-4/3 433
Week 14: 4/4-4/10 542
Week 15: 4/11-4/17 526
Week 16: 4/18-4/24 474
Week 17: 4/25-5/1 485
Week 18: 5/2-5/8 323
Week 19: 5/9-5/15 297
Week 20: 5/16-5/22 234
Week 21: 5/23-5/29 124
Week 22: 5/30-6/5 81
Week 23: 6/6-6/12 58
Week 24: 6/13-6/19 46
Week 25: 6/20-6/26 43
Week 26: 6/27-7/3 47
Week 27: 7/4-7/10 53
Week 28: 7/11-7/17 99
Week 29: 7/18-7/24 181
Week 30: 7/25-7/31 246
Week 31: 8/1-8/7 344
Week 32: 8/8-8/14 369
WEEK(specimen_date) SUM(Number of Healthcare Workers)
Week 33: 8/15-8/21 364
Week 34: 8/22-8/28 340
412
268
40
Mar 1, 20 Apr 26, 20 Jun 21, 20 Aug 16, 20 Oct 11, 20 Dec 6, 20 Jan 31, 21 Mar 28, 21 May 23, 21 Jul 18, 21 Sep 12, 21
Week of specimen_date
0
200
400
600
800
1,000
1,200
1,400
1,600
1,800
2,000
2,200
2,400
2,600
2,800
Num
ber o
f Hea
lthca
re W
orke
rs
Occupa�onal Related Cases: Health Care
Num
ber o
f Hea
lth C
are
Wor
kers
Week
3/1-3
/7/2
03/
8-3/
14/2
03/
15-3
/21/2
03/
22-3
/28/
203/
29-4
/4/2
04/
5-4/
11/20
4/12
-4/18
/20
4/19
-4/2
5/20
4/26
-5/2
/20
5/3-
5/9/
205/
10-5
/16/2
05/
17-5
/23/
205/
24-5
/30/
205/
31-6
/6/2
06/
7-6/
13/2
06/
14-6
/20/
206/
21-6
/27/
206/
28-7
/4/2
07/
5-7/
11/20
7/12
-7/18
/20
7/19
-7/2
5/20
7/26
-8/1/
208/
2-8/
8/20
8/9-
8/15
/20
8/16
-8/2
2/20
8/23
-8/3
0/20
8/31
-9/5
/20
9/6-
9/12
/20
9/13
-9/19
/20
9/20
-9/2
6/20
9/27
-10/3
/20
10/4
-10/10
/20
10/11
-10/17
/20
10/18
-10/2
4/20
10/2
5-10
/31/2
011/
1-11/7
/20
11/8-
11/14
/20
11/15
-11/2
1/20
11/22
-11/2
8/20
11/29
-12/5
/20
12/6
-12/12
/20
12/13
-12/19
/20
12/2
0-12
/26/
2012
/27-
1/2/2
11/3
-1/9/
211/1
0-1/1
6/21
1/17-
1/23/
211/2
4-1/3
0/21
1/31-2
/6/2
12/
7-2/
13/2
12/
14-2
/20/
212/
21-2
/27/
212/
28-3
/6/2
13/
7-3/
13/2
13/
14-3
/20/
213/
21-3
/27/
213/
28-4
/3/2
14/
4-4/
10/2
14/
11-4/
17/2
14/
18-4
/24/
214/
25-5
/1/21
5/2-
5/8/
215/
9-5/
15/2
15/
16-5
/22/
215/
23-5
/29/
215/
30-6
/5/2
16/
6-6/
12/2
16/
13-6
/19/2
16/
20-6
/26/
216/
27-7
/3/2
17/
4-7/
10/2
17/
11-7/
17/2
17/
18-7
/24/
217/
25-7
/31/2
18/
1-8/7
/21
8/8-
8/14
/21
8/15
-8/2
1/21
8/22
-8/2
8/21
8/29
-9/4
/21
9/5-
9/11/
219/
12-9
/18/2
19/
19-9
/25/
219/
26-10
/2/2
110
/3-10
/9/2
110
/10-10
/16/2
110
/17-10
/23/
21
Minnesota Department of Health Weekly COVID-19 Report: Updated 10/21/2021 with data current as of 4 a.m. the previous day unless specifically noted. Page 46
Cases among Health Care Workers (Archived)This data is for all cases who reported their occupation as health care staff in acute care or congregate care facilities. Not all cases who are health care workers were exposed at work. Numbers include confirmed and probable cases.
48,946 Total Health Care Workers
(cumulative)
1,247 Total Health Care Staff Hospitalized
(cumulative)
207 Total Health Care Staff Hospitalized in ICU
(cumulative)
47 Total Health Care Staff Deaths
(cumulative)
This information is no longer collected for all cases, therefore this data will no longer be updated. Prior to 11/1/21, people were only counted as a case once, even if multiple positive tests were recorded for a person over 90 days apart.
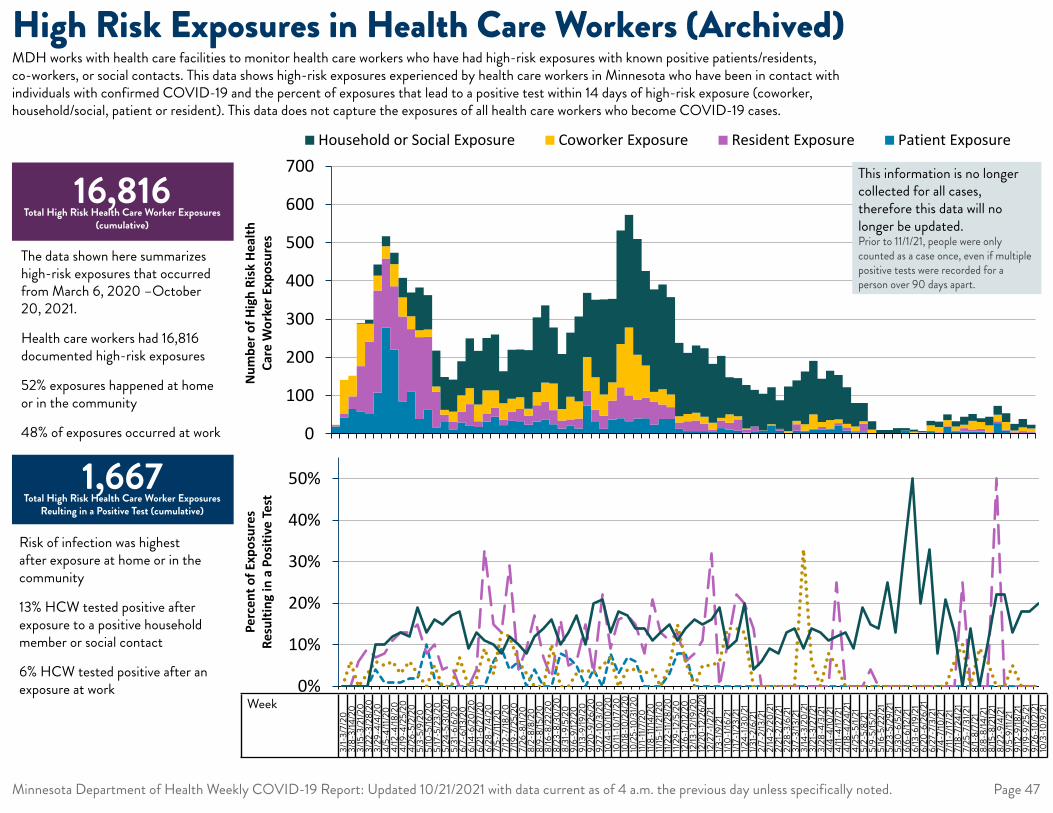
Exposure Week Number of HR HCW tested with likely Patient Exposure % positive (patient exposure) Number of HR HCW tested with likely Resident Exposure % positive (resident exposure) Number of HR HCW tested with likely Coworker Exposure % positive (coworker exposure) Number of HR HCW tested with likely Household or Social Exposure % positive(household or social exposure)
Exposure Week, start date Exposed Postive Exposed Postive Exposed Postive Exposed Postive Exposed (n) Postive
01Mar2020 19 0% 4 0% 1 0% 0 . 24 0
08Mar2020 43 0% 9 0% 89 6% 0 . 141 5
15Mar2020 65 0% 33 6% 54 0% 0 . 152 2
22Mar2020 59 0% 118 9% 111 3% 2 0% 290 14
29Mar2020 52 4% 189 7% 47 6% 10 10% 298 19
05Apr2020 108 1% 267 7% 39 5% 29 10% 443 26
12Apr2020 278 1% 181 11% 32 6% 26 12% 517 27
19Apr2020 220 1% 166 13% 58 3% 30 13% 474 29
26Apr2020 85 2% 222 12% 50 6% 51 12% 408 38
03May2020 110 2% 164 15% 34 3% 62 19% 370 40
10May2020 39 10% 214 8% 18 0% 112 13% 383 35
17May2020 63 2% 191 10% 19 5% 90 16% 363 35
24May2020 17 0% 93 4% 14 0% 94 15% 218 18
31May2020 31 0% 19 5% 13 0% 86 17% 149 16
07Jun2020 12 0% 19 0% 27 7% 84 17% 142 16
14Jun2020 30 0% 28 0% 43 0% 89 9% 190 8
21Jun2020 21 0% 57 4% 42 2% 130 11% 250 17
28Jun2020 18 0% 15 33% 44 7% 140 11% 217 24
05Jul2020 32 6% 20 15% 62 3% 137 8% 251 18
12Jul2020 45 9% 23 13% 46 11% 146 8% 260 24
19Jul2020 23 4% 14 21% 43 12% 84 12% 164 19
26Jul2020 34 6% 24 4% 34 6% 128 9% 220 17
02Aug2020 33 0% 32 9% 31 3% 125 7% 221 13
09Aug2020 24 4% 24 17% 18 0% 153 10% 219 21
16Aug2020 32 0% 43 7% 34 0% 196 13% 305 29
23Aug2020 38 0% 46 2% 50 10% 202 15% 336 37
30Aug2020 25 8% 37 16% 70 0% 146 10% 278 22
06Sep2020 14 7% 21 5% 30 0% 144 13% 209 21
13Sep2020 21 5% 17 6% 59 3% 168 17% 265 33
20Sep2020 14 0% 26 15% 45 4% 222 10% 307 29
27Sep2020 74 4% 39 3% 88 3% 168 20% 369 41
04Oct2020 31 0% 32 22% 85 5% 203 21% 351 53
11Oct2020 13 8% 35 9% 55 7% 249 12% 352 39
18Oct2020 37 3% 50 14% 48 0% 218 18% 353 48
25Oct2020 41 7% 81 17% 113 4% 297 17% 532 73
01Nov2020 33 6% 67 15% 178 4% 295 14% 573 61
08Nov2020 40 0% 50 8% 117 3% 303 14% 510 49
15Nov2020 41 0% 53 21% 85 4% 247 11% 426 41
22Nov2020 24 0% 60 13% 26 0% 268 13% 378 44
29Nov2020 39 3% 38 11% 40 5% 275 15% 392 48
06Dec2020 39 8% 31 13% 33 15% 255 11% 358 40
13Dec2020 13 8% 17 6% 16 6% 192 14% 238 30
20Dec2020 7 0% 26 8% 19 0% 160 16% 212 28
27Dec2020 7 0% 28 11% 20 5% 176 15% 231 31
03Jan2021 7 0% 19 32% 19 5% 179 16% 224 36
10Jan2021 5 0% 6 0% 18 6% 154 19% 183 31
17Jan2021 15 0% 20 10% 7 14% 162 9% 204 17
24Jan2021 11 0% 18 22% 22 14% 97 11% 148 18
31Jan2021 8 0% 30 20% 8 13% 100 20% 146 27
07Feb2021 3 0% 7 14% 4 0% 114 4% 128 6
14Feb2021 5 0% 14 0% 0 . 96 6% 115 6
21Feb2021 8 0% 0 . 1 0% 96 9% 105 9
28Feb2021 21 0% 2 0% 2 0% 97 8% 122 8
07Mar2021 8 0% 5 0% 0 . 75 13% 88 10
14Mar2021 2 0% 1 0% 4 0% 117 14% 124 16
21Mar2021 8 0% 17 0% 9 33% 106 9% 140 13
28Mar2021 5 0% 3 0% 17 6% 138 14% 163 20
04Apr2021 12 0% 1 0% 38 0% 140 13% 191 18
11Apr2021 12 0% 6 0% 13 8% 113 11% 144 13
18Apr2021 10 0% 4 25% 22 5% 129 12% 165 17
25Apr2021 21 0% 7 0% 10 0% 116 13% 154 15
02May2021 9 0% 8 0% 9 0% 96 9% 122 9
09May2021 4 0% 3 0% 12 0% 62 19% 81 12
16May2021 4 0% 23 4% 6 0% 48 15% 81 8
23May2021 0 . 2 0% 9 0% 22 14% 33 3
30May2021 1 0% 1 0% 0 . 8 25% 10 2
06Jun2021 2 0% 0 . 0 . 8 13% 10 1
13Jun2021 2 0% 0 . 0 . 13 31% 15 4
20Jun2021 9 0% 0 . 0 . 6 50% 15 3
27Jun2021 3 0% 0 . 3 0% 5 20% 11 1
04Jul2021 3 0% 1 0% 0 . 3 33% 7 1
11Jul2021 7 0% 0 . 15 0% 12 8% 34 1
18Jul2021 0 . 4 0% 14 0% 14 21% 32 3
25Jul2021 18 0% 2 0% 16 6% 15 13% 51 3
01Aug2021 5 0% 4 25% 10 10% 14 0% 33 2
08Aug2021 6 0% 9 0% 9 0% 21 14% 45 3
15Aug2021 6 0% 6 0% 22 9% 18 0% 52 2
22Aug2021 6 0% 7 0% 18 0% 10 10% 41 1
29Aug2021 2 0% 2 0% 17 0% 22 9% 43 2
Date Exposed (MMWR Week)
Num
ber o
f Hig
h Ri
skHe
alth
Ca
re W
orke
r Exp
osur
es
0
100
200
300
400
500
600
700
10 11 12 13 14 15 16 17 18 19 20 21 22 23 24 25 26 27 28 29 30 31 32 33 34 35 36 37 38 39 40 41 42 43 44 45 46 47 48 49 50 51 52 53 1 2 3 4 5 6 7 8 9 10 11 12 13 14 15 16 17 18 19 20 21 22 23 24 25 26 27 28 29 30 31 32 33 34 35 36 37 38 39 40
Household or Social Exposure Coworker Exposure Resident Exposure Patient Exposure
Perc
ent o
f Exp
osur
es
Resu
lting
in a
Pos
itive
Test
0%
10%
20%
30%
40%
50%
10 11 12 13 14 15 16 17 18 19 20 21 22 23 24 25 26 27 28 29 30 31 32 33 34 35 36 37 38 39 40 41 42 43 44 45 46 47 48 49 50 51 52 53 1 2 3 4 5 6 7 8 9 10 11 12 13 14 15 16 17 18 19 20 21 22 23 24 25 26 27 28 29 30 31 32 33 34 35 36 37 38 39 40
The data shown here summarizes high-risk exposures that occurred from March 6, 2020 –October 20, 2021.
Health care workers had 16,816 documented high-risk exposures
52% exposures happened at home or in the community
48% of exposures occurred at work
Risk of infection was highest after exposure at home or in the community
13% HCW tested positive after exposure to a positive household member or social contact
6% HCW tested positive after an exposure at work
Week
3/1-
3/7/
203/
8-3/
14/2
03/
15-3
/21/2
03/
22-3
/28/
203/
29-4
/4/2
04/
5-4/
11/20
4/12
-4/18
/20
4/19
-4/2
5/20
4/26
-5/2
/20
5/3-
5/9/
205/
10-5
/16/2
05/
17-5
/23/
205/
24-5
/30/
205/
31-6
/6/2
06/
7-6/
13/2
06/
14-6
/20/
206/
21-6
/27/
206/
28-7
/4/2
07/
5-7/
11/20
7/12
-7/18
/20
7/19
-7/2
5/20
7/26
-8/1/
208/
2-8/
8/20
8/9-
8/15
/20
8/16
-8/2
2/20
8/23
-8/3
0/20
8/31
-9/5
/20
9/6-
9/12
/20
9/13
-9/19
/20
9/20
-9/2
6/20
9/27
-10/
3/20
10/4
-10/
10/2
010
/11-1
0/17
/20
10/18
-10/2
4/20
10/2
5-10
/31/2
011/
1-11/
7/20
11/8-
11/14
/20
11/15
-11/2
1/20
11/22
-11/2
8/20
11/29
-12/
5/20
12/6
-12/
12/2
012
/13-12
/19/2
012
/20-
12/2
6/20
12/2
7-1/2
/21
1/3-1
/9/2
11/1
0-1/1
6/21
1/17-
1/23/
211/2
4-1/3
0/21
1/31-
2/6/
212/
7-2/
13/2
12/
14-2
/20/
212/
21-2
/27/
212/
28-3
/6/2
13/
7-3/
13/2
13/
14-3
/20/
213/
21-3
/27/
213/
28-4
/3/2
14/
4-4/
10/2
14/
11-4/
17/2
14/
18-4
/24/
214/
25-5
/1/21
5/2-
5/8/
215/
9-5/
15/2
15/
16-5
/22/
215/
23-5
/29/
215/
30-6
/5/2
16/
6-6/
12/2
16/
13-6
/19/2
16/
20-6
/26/
216/
27-7
/3/2
17/
4-7/
10/2
17/
11-7/
17/2
17/
18-7
/24/
217/
25-7
/31/2
18/
1-8/
7/21
8/8-
8/14
/21
8/15
-8/2
1/21
8/22
-9/4
/21
9/5-
9/11/
219/
12-9
/18/2
19/
19-9
/25/
219/
26-1
0/2/
2110
/3-1
0/9/
21
Minnesota Department of Health Weekly COVID-19 Report: Updated 10/21/2021 with data current as of 4 a.m. the previous day unless specifically noted. Page 47
High Risk Exposures in Health Care Workers (Archived)MDH works with health care facilities to monitor health care workers who have had high-risk exposures with known positive patients/residents, co-workers, or social contacts. This data shows high-risk exposures experienced by health care workers in Minnesota who have been in contact with individuals with confirmed COVID-19 and the percent of exposures that lead to a positive test within 14 days of high-risk exposure (coworker, household/social, patient or resident). This data does not capture the exposures of all health care workers who become COVID-19 cases.
16,816 Total High Risk Health Care Worker Exposures
(cumulative)
1,667 Total High Risk Health Care Worker Exposures
Reulting in a Positive Test (cumulative)
This information is no longer collected for all cases, therefore this data will no longer be updated. Prior to 11/1/21, people were only counted as a case once, even if multiple positive tests were recorded for a person over 90 days apart.
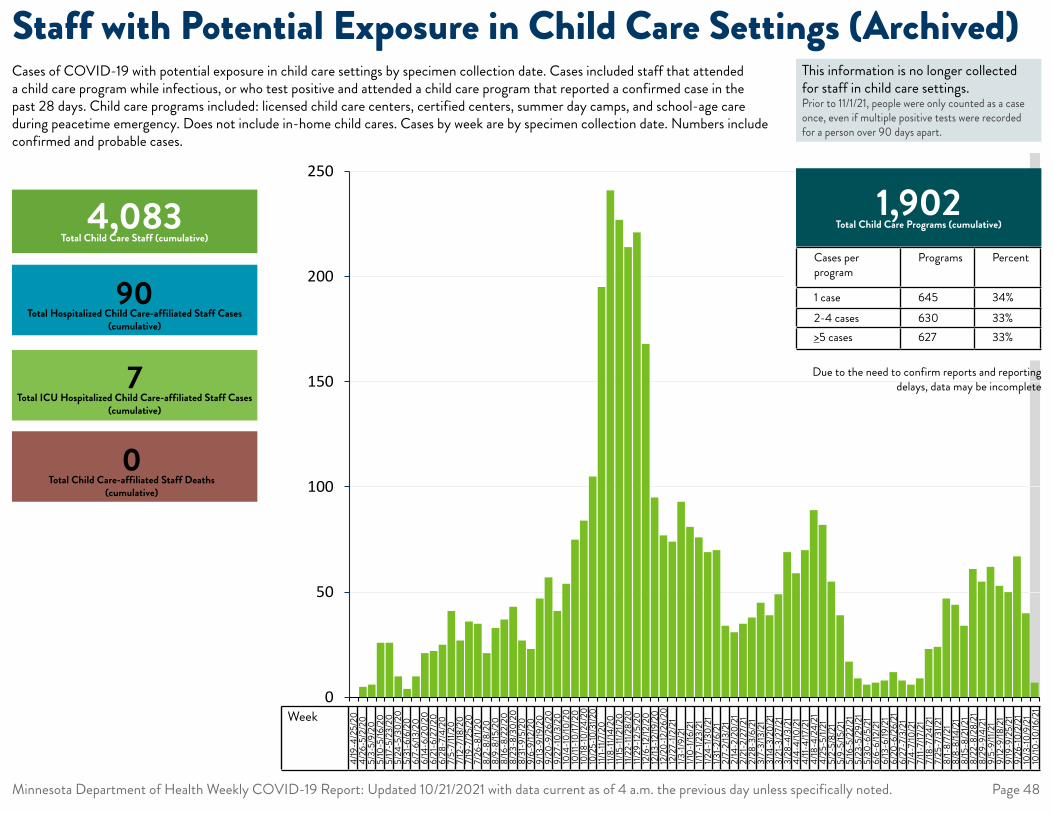
MMWR Week Start Date child care staff
Week 17: 4/19-4/25
Week 18: 4/26-5/2 5
Week 19: 5/3-5/9 6
Week 20: 5/10-5/16 26
Week 21: 5/17-5/23 26
Week 22: 5/24-5/30 10
Week 23: 5/31-6/6 4
Week 24: 6/7-6/13 10
Week 25: 6/14-6/20 21
Week 26: 6/21-6/27 22
Week 27: 6/28-7/4 25
Week 28: 7/5-7/11 41
Week 29: 7/12-7/18 27
Week 30: 7/19-7/25 36
Week 31: 7/26-8/1 35
Week 32: 8/2-8/8 21
Week 33: 8/9-8/15 33
Week 34: 8/16-8/22 37
Week 35: 8/23-8/29 43
Week 36: 8/30-9/5 27
Week 37: 9/6-9/12 23
Week 38: 9/13-9/19 47
Week 39: 9/20-9/26 57
Week 40: 9/27-10/3 41
Week 41: 10/4-10/10 54
Week 42: 10/11-10/17 75
Week 43: 10/18-10/24 84
Week 44: 10/25-10/31 105
Week 45: 11/1-11/7 195
Week 46: 11/8-11/14 241
Week 47: 11/15-11/21 227
Week 48: 11/22-11/28 214
Week 49: 11/29-12/5 221
Week 50: 12/6-12/12 168
Week 51: 12/13-12/19 95
Week 52: 12/20-12/26 77
Week 53: 12/27-1/2/21 74
Week 1: 1/3-1/9 93
Week 2: 1/10-1/16 81
Week 3: 1/17-1/23 76
Week 4: 1/24-1/30 69
Week 5: 1/31-2/6 70
Week 6: 2/7-2/13 34
Week 7: 2/14-2/20 31
Week 8: 2/21-2/27 35
Week 9: 2/28-3/6 38
Week 10: 3/7-3/13 45
Week 11: 3/14-3/20 39
Week 12: 3/21-3/27 49
Week 13: 3/28-4/3 69
Week 14: 4/4-4/10 59
Week 15: 4/11-4/17 70
Week 16: 4/18-4/24 89
Week 17: 4/25-5/1 82
Week 18: 5/2-5/8 55
Week 19: 5/9-5/15 39
Week 20: 5/16-5/22 17
Week 21: 5/23-5/29 9
Week 22: 5/30-6/5 6
Week 23: 6/6-6/12 7
Week 24: 6/13-6/19 8
Week 25: 6/20-6/26 12
Week 26: 6/27-7/3 8
Week 27: 7/4-7/10 6
Week 28: 7/11-7/17 9
Week 29: 7/18-7/24 23
Week 30: 7/25-7/31 24
Week 31: 8/1-8/7 47
Week 32: 8/8-8/14 44
Week 33: 8/15-8/21 34
Week 34: 8/22-8/28 61
Week 35: 8/29-9/4 55
Week 36: 9/5-9/11 62
Week 37: 9/12-9/18 53
Week 38: 9/19-9/25 50
Week 39: 9/26-10/2 67
Week 40: 10/3-10/9 40
Week 41: 10/10-10/16 7
0
50
100
150
200
250
17 19 21 23 25 27 29 31 33 35 37 39 41 43 45 47 49 51 53 2 4 6 8 10 12 14 16 18 20 22 24 26 28 30 32 34 36 38 40
Num
ber o
f Cas
es
Week
4/19
-4/2
5/20
4/26
-5/2
/20
5/3-
5/9/
205/
10-5
/16/2
05/
17-5
/23/
205/
24-5
/30/
205/
31-6
/6/2
06/
7-6/
13/2
06/
14-6
/20/
206/
21-6
/27/
206/
28-7
/4/2
07/
5-7/
11/20
7/12
-7/18
/20
7/19
-7/2
5/20
7/26
-8/1/
208/
2-8/
8/20
8/9-
8/15
/20
8/16
-8/2
2/20
8/23
-8/3
0/20
8/31
-9/5
/20
9/6-
9/12
/20
9/13
-9/19
/20
9/20
-9/2
6/20
9/27
-10/
3/20
10/4
-10/
10/2
010
/11-1
0/17
/20
10/18
-10/2
4/20
10/2
5-10
/31/2
011/
1-11/
7/20
11/8-
11/14
/20
11/15
-11/2
1/20
11/22
-11/2
8/20
11/29
-12/
5/20
12/6
-12/
12/2
012
/13-12
/19/2
012
/20-
12/2
6/20
12/2
7-1/2
/21
1/3-1
/9/2
11/1
0-1/1
6/21
1/17-
1/23/
211/2
4-1/3
0/21
1/31-
2/6/
212/
7-2/
13/2
12/
14-2
/20/
212/
21-2
/27/
212/
28-3
/6/2
13/
7-3/
13/2
13/
14-3
/20/
213/
21-3
/27/
213/
28-4
/3/2
14/
4-4/
10/2
14/
11-4/
17/2
14/
18-4
/24/
214/
25-5
/1/21
5/2-
5/8/
215/
9-5/
15/2
15/
16-5
/22/
215/
23-5
/29/
215/
30-6
/5/2
16/
6-6/
12/2
16/
13-6
/19/2
16/
20-6
/26/
216/
27-7
/3/2
17/
4-7/
10/2
17/
11-7/
17/2
17/
18-7
/24/
217/
25-7
/31/2
18/
1-8/
7/21
8/8-
8/14
/21
8/15
-8/2
1/21
8/22
-8/2
8/21
8/29
-9/4
/21
9/5-
9/11/
219/
12-9
/18/2
19/
19-9
/25/
219/
26-1
0/2/
2110
/3-1
0/9/
2110
/10-1
0/16
/21
Minnesota Department of Health Weekly COVID-19 Report: Updated 10/21/2021 with data current as of 4 a.m. the previous day unless specifically noted. Page 48
Staff with Potential Exposure in Child Care Settings (Archived)Cases of COVID-19 with potential exposure in child care settings by specimen collection date. Cases included staff that attended a child care program while infectious, or who test positive and attended a child care program that reported a confirmed case in the past 28 days. Child care programs included: licensed child care centers, certified centers, summer day camps, and school-age care during peacetime emergency. Does not include in-home child cares. Cases by week are by specimen collection date. Numbers include confirmed and probable cases.
Due to the need to confirm reports and reporting delays, data may be incomplete
This information is no longer collected for staff in child care settings. Prior to 11/1/21, people were only counted as a case once, even if multiple positive tests were recorded for a person over 90 days apart.
1,902 Total Child Care Programs (cumulative)
Cases per program
Programs Percent
1 case 645 34%2-4 cases 630 33%>5 cases 627 33%
4,083 Total Child Care Staff (cumulative)
90 Total Hospitalized Child Care-affiliated Staff Cases
(cumulative)
7 Total ICU Hospitalized Child Care-affiliated Staff Cases
(cumulative)
0 Total Child Care-affiliated Staff Deaths
(cumulative)
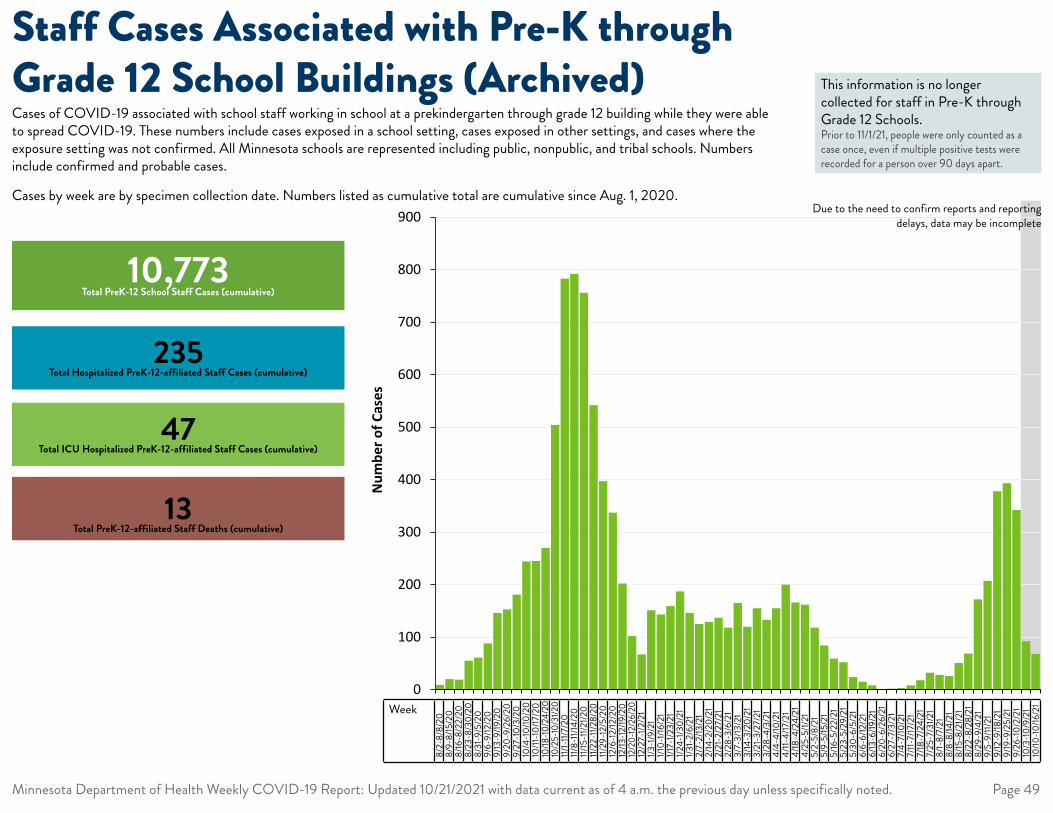
MMWR Week k12 staff
Week 32: 8/2-8/8 9Week 33: 8/9-8/15 20Week 34: 8/16-8/22 19Week 35: 8/23-8/29 55Week 36: 8/30-9/5 61Week 37: 9/6-9/12 88Week 38: 9/13-9/19 146Week 39: 9/20-9/26 153Week 40: 9/27-10/3 181Week 41: 10/4-10/10 244Week 42: 10/11-10/17 245Week 43: 10/18-10/24 270Week 44: 10/25-10/31 504Week 45: 11/1-11/7 783Week 46: 11/8-11/14 792Week 47: 11/15-11/21 756Week 48: 11/22-11/28 542Week 49: 11/29-12/5 397Week 50: 12/6-12/12 337Week 51: 12/13-12/19 202Week 52: 12/20-12/26 102Week 53: 12/27-1/2/21 67Week 1: 1/3-1/9 151Week 2: 1/10-1/16 143Week 3: 1/17-1/23 159Week 4: 1/24-1/30 187Week 5: 1/31-2/6 146Week 6: 2/7-2/13 125Week 7: 2/14-2/20 129Week 8: 2/21-2/27 137Week 9: 2/28-3/6 118Week 10: 3/7-3/13 165Week 11: 3/14-3/20 120Week 12: 3/21-3/27 155Week 13: 3/28-4/3 133Week 14: 4/4-4/10 155Week 15: 4/11-4/17 200Week 16: 4/18-4/24 166Week 17: 4/25-5/1 162Week 18: 5/2-5/8 118Week 19: 5/9-5/15 84Week 20: 5/16-5/22 59Week 21: 5/23-5/29 52Week 22: 5/30-6/5 24Week 23: 6/6-6/12 15Week 24: 6/13-6/19 8Week 25: 6/20-6/26 0Week 26: 6/27-7/3 2Week 27: 7/4-7/10 3Week 28: 7/11-7/17 8Week 29: 7/18-7/24 18Week 30: 7/25-7/31 32Week 31: 8/1-8/7 28Week 32: 8/8-8/14 26Week 33: 8/15-8/21 51Week 34: 8/22-8/28 69Week 35: 8/29-9/4 172Week 36: 9/5-9/11 207Week 37: 9/12-9/18 378Week 38: 9/19-9/25 393Week 39: 9/26-10/2 342Week 40: 10/3-10/9 92Week 41: 10/10-10/16 68
0
100
200
300
400
500
600
700
800
900
32 34 36 38 40 42 44 46 48 50 52 1 3 5 7 9 11 13 15 17 19 21 23 25 27 29 31 33 35 37 39 41
Num
ber o
f Cas
es
Week
8/2-
8/8/
208/
9-8/
15/2
08/
16-8
/22/
208/
23-8
/30/
208/
31-9
/5/2
09/
6-9/
12/2
09/
13-9
/19/2
09/
20-9
/26/
209/
27-1
0/3/
2010
/4-1
0/10
/20
10/11
-10/
17/2
010
/18-10
/24/
2010
/25-
10/3
1/20
11/1-
11/7/
2011/
8-11/
14/2
011/
15-1
1/21/2
011/
22-11
/28/
2011/
29-1
2/5/
2012
/6-1
2/12
/20
12/13
-12/19
/20
12/2
0-12
/26/
2012
/27-
1/2/2
11/3
-1/9
/21
1/10-
1/16/
211/1
7-1/2
3/21
1/24-
1/30/
211/3
1-2/
6/21
2/7-
2/13
/21
2/14
-2/2
0/21
2/21
-2/2
7/21
2/28
-3/6
/21
3/7-
3/13
/21
3/14
-3/2
0/21
3/21
-3/2
7/21
3/28
-4/3
/21
4/4-
4/10
/21
4/11-
4/17
/21
4/18
-4/2
4/21
4/25
-5/1/
215/
2-5/
8/21
5/9-
5/15
/21
5/16
-5/2
2/21
5/23
-5/2
9/21
5/30
-6/5
/21
6/6-
6/12
/21
6/13
-6/19
/21
6/20
-6/2
6/21
6/27
-7/3
/21
7/4-
7/10
/21
7/11-
7/17
/21
7/18
-7/2
4/21
7/25
-7/3
1/21
8/1-
8/7/
218/
8-8/
14/2
18/
15-8
/21/2
18/
22-8
/28/
218/
29-9
/4/2
19/
5-9/
11/21
9/12
-9/18
/21
9/19
-9/2
5/21
9/26
-10/
2/21
10/3
-10/
9/21
10/10
-10/16
/21
Minnesota Department of Health Weekly COVID-19 Report: Updated 10/21/2021 with data current as of 4 a.m. the previous day unless specifically noted. Page 49
Staff Cases Associated with Pre-K through Grade 12 School Buildings (Archived)Cases of COVID-19 associated with school staff working in school at a prekindergarten through grade 12 building while they were able to spread COVID-19. These numbers include cases exposed in a school setting, cases exposed in other settings, and cases where the exposure setting was not confirmed. All Minnesota schools are represented including public, nonpublic, and tribal schools. Numbers include confirmed and probable cases.
Cases by week are by specimen collection date. Numbers listed as cumulative total are cumulative since Aug. 1, 2020. Due to the need to confirm reports and reporting
delays, data may be incomplete
This information is no longer collected for staff in Pre-K through Grade 12 Schools. Prior to 11/1/21, people were only counted as a case once, even if multiple positive tests were recorded for a person over 90 days apart.
10,773 Total PreK-12 School Staff Cases (cumulative)
235 Total Hospitalized PreK-12-affiliated Staff Cases (cumulative)
47 Total ICU Hospitalized PreK-12-affiliated Staff Cases (cumulative)
13 Total PreK-12-affiliated Staff Deaths (cumulative)
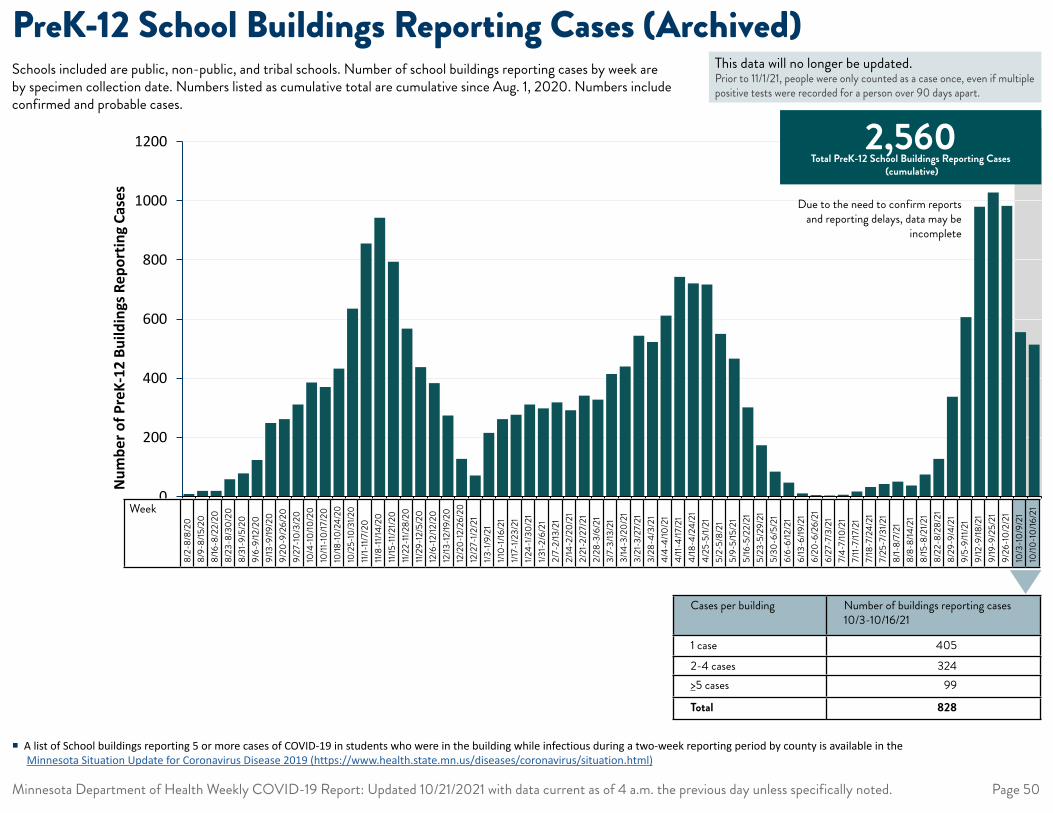
MMWR Week Number of PreK-12 School Buildings reporting case
Week 32: 8/2-8/8 9
Week 33: 8/9-8/15 20
Week 34: 8/16-8/22 20Week 35: 8/23-8/29 59Week 36: 8/30-9/5 79
Week 37: 9/6-9/12 124Week 38: 9/13-9/19 249Week 39: 9/20-9/26 262Week 40: 9/27-10/3 312Week 41: 10/4-10/10 386Week 42: 10/11-10/17 371Week 43: 10/18-10/24 433Week 44: 10/25-10/31 636Week 45: 11/1-11/7 856Week 46: 11/8-11/14 943Week 47: 11/15-11/21 794Week 48: 11/22-11/28 568Week 49: 11/29-12/5 438Week 50: 12/6-12/12 384Week 51: 12/13-12/19 275Week 52: 12/20-12/26 128Week 53: 12/27-1/2/21 72Week 1: 1/3-1/9 216Week 2: 1/10-1/16 262Week 3: 1/17-1/23 277Week 4: 1/24-1/30 312Week 5: 1/31-2/6 299Week 6: 2/7-2/13 319Week 7: 2/14-2/20 292Week 8: 2/21-2/27 342Week 9: 2/28-3/6 328Week 10: 3/7-3/13 415Week 11: 3/14-3/20 440Week 12: 3/21-3/27 544Week 13: 3/28-4/3 523Week 14: 4/4-4/10 612Week 15: 4/11-4/17 743Week 16: 4/18-4/24 721Week 17: 4/25-5/1 717Week 18: 5/2-5/8 550Week 19: 5/9-5/15 467Week 20: 5/16-5/22 302Week 21: 5/23-5/29 174Week 22: 5/30-6/5 85Week 23: 6/6-6/12 48Week 24: 6/13-6/19 11Week 25: 6/20-6/26 5Week 26: 6/27-7/3 4Week 27: 7/4-7/10 7Week 28: 7/11-7/17 18Week 29: 7/18-7/24 33Week 30: 7/25-7/31 43Week 31: 8/1-8/7 51Week 32: 8/8-8/14 38Week 33: 8/15-8/21 75Week 34: 8/22-8/28 128Week 35: 8/29-9/4 338Week 36: 9/5-9/11 607Week 37: 9/12-9/18 980Week 38: 9/19-9/25 1,028Week 39: 9/26-10/2 983Week 40: 10/3-10/9 556Week 41: 10/10-10/16 514
0
200
400
600
800
1000
1200
32333435363738394041424344454647484950515253 1 2 3 4 5 6 7 8 9 1011121314151617181920212223242526272829303132333435363738394041
Num
ber o
f Pre
K-12
Bui
ldin
gs R
epor
ting
Case
s
Week
8/2-
8/8/
208/
9-8/
15/2
08/
16-8
/22/
208/
23-8
/30/
208/
31-9
/5/2
09/
6-9/
12/2
09/
13-9
/19/2
09/
20-9
/26/
209/
27-1
0/3/
2010
/4-1
0/10
/20
10/11
-10/
17/2
010
/18-10
/24/
2010
/25-
10/3
1/20
11/1-
11/7/
2011/
8-11/
14/2
011/
15-1
1/21/2
011/
22-11
/28/
2011/
29-1
2/5/
2012
/6-1
2/12
/20
12/13
-12/19
/20
12/2
0-12
/26/
2012
/27-
1/2/2
11/3
-1/9
/21
1/10-
1/16/
211/1
7-1/2
3/21
1/24-
1/30/
211/3
1-2/
6/21
2/7-
2/13
/21
2/14
-2/2
0/21
2/21
-2/2
7/21
2/28
-3/6
/21
3/7-
3/13
/21
3/14
-3/2
0/21
3/21
-3/2
7/21
3/28
-4/3
/21
4/4-
4/10
/21
4/11-
4/17
/21
4/18
-4/2
4/21
4/25
-5/1/
215/
2-5/
8/21
5/9-
5/15
/21
5/16
-5/2
2/21
5/23
-5/2
9/21
5/30
-6/5
/21
6/6-
6/12
/21
6/13
-6/19
/21
6/20
-6/2
6/21
6/27
-7/3
/21
7/4-
7/10
/21
7/11-
7/17
/21
7/18
-7/2
4/21
7/25
-7/3
1/21
8/1-
8/7/
218/
8-8/
14/2
18/
15-8
/21/2
18/
22-8
/28/
218/
29-9
/4/2
19/
5-9/
11/21
9/12
-9/18
/21
9/19
-9/2
5/21
9/26
-10/
2/21
10/3
-10/
9/21
10/10
-10/
16/2
1
Minnesota Department of Health Weekly COVID-19 Report: Updated 10/21/2021 with data current as of 4 a.m. the previous day unless specifically noted. Page 50
PreK-12 School Buildings Reporting Cases (Archived)Schools included are public, non-public, and tribal schools. Number of school buildings reporting cases by week are by specimen collection date. Numbers listed as cumulative total are cumulative since Aug. 1, 2020. Numbers include confirmed and probable cases.
2,560 Total PreK-12 School Buildings Reporting Cases
(cumulative)
Due to the need to confirm reports and reporting delays, data may be
incomplete
Cases per building Number of buildings reporting cases 10/3-10/16/21
1 case 4052-4 cases 324>5 cases 99
Total 828
� A list of School buildings reporting 5 or more cases of COVID-19 in students who were in the building while infectious during a two-week reporting period by county is available in the Minnesota Situation Update for Coronavirus Disease 2019 (https://www.health.state.mn.us/diseases/coronavirus/situation.html)
This data will no longer be updated. Prior to 11/1/21, people were only counted as a case once, even if multiple positive tests were recorded for a person over 90 days apart.
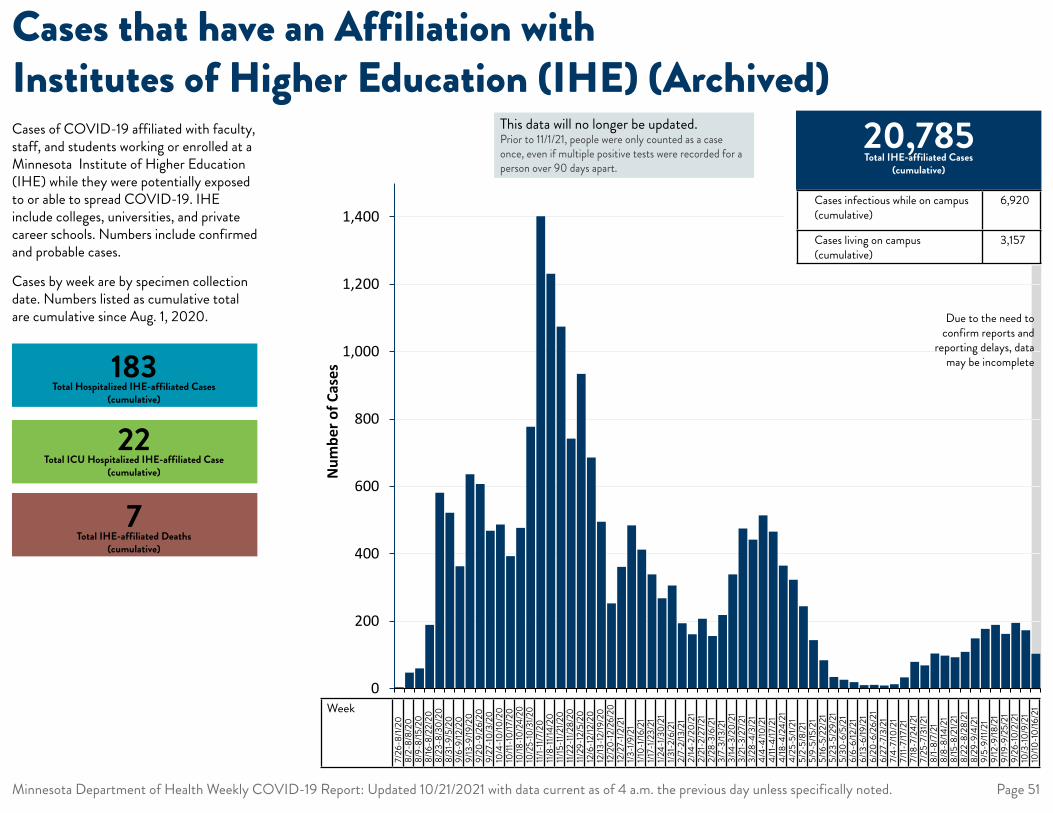
MMWR Week (Specimen Collection Date)
Cases
Week 31: 7/26-8/1 4
Week 32: 8/2-8/8 47
Week 33: 8/9-8/15 60
Week 34: 8/16-8/22 189
Week 35: 8/23-8/29 581
Week 36: 8/30-9/5 522
Week 37: 9/6-9/12 363
Week 38: 9/13-9/19 636
Week 39: 9/20-9/26 607
Week 40: 9/27-10/3 468
Week 41: 10/4-10/10 487
Week 42: 10/11-10/17 393
Week 43: 10/18-10/24 477
Week 44: 10/25-10/31 777
Week 45: 11/1-11/7 1,402
Week 46: 11/8-11/14 1,231
Week 47: 11/15-11/21 1,074
Week 48: 11/22-11/28 742
Week 49: 11/29-12/5 934
Week 50: 12/6-12/12 686
Week 51: 12/13-12/19 495
Week 52: 12/20-12/26 253
Week 53: 12/27-1/2/21 361
Week 1: 1/3-1/9 484
Week 2: 1/10-1/16 412
Week 3: 1/17-1/23 339
Week 4: 1/24-1/30 268
Week 5: 1/31-2/6 306
Week 6: 2/7-2/13 194
Week 7: 2/14-2/20 161
Week 8: 2/21-2/27 207
Week 9: 2/28-3/6 156
Week 10: 3/7-3/13 218
Week 11: 3/14-3/20 339
Week 12: 3/21-3/27 475
Week 13: 3/28-4/3 442
Week 14: 4/4-4/10 514
Week 15: 4/11-4/17 466
Week 16: 4/18-4/24 365
Week 17: 4/25-5/1 323
Week 18: 5/2-5/8 244
Week 19: 5/9-5/15 144
Week 20: 5/16-5/22 84
Week 21: 5/23-5/29 34
Week 22: 5/30-6/5 26
Week 23: 6/6-6/12 19
Week 24: 6/13-6/19 10
Week 25: 6/20-6/26 11
Week 26: 6/27-7/3 9
Week 27: 7/4-7/10 13
Week 28: 7/11-7/17 33
MMWR Week (Specimen Collection Date)
Cases
Week 29: 7/18-7/24 79
Week 30: 7/25-7/31 69
Week 31: 8/1-8/7 104
Week 32: 8/8-8/14 98
Week 33: 8/15-8/21 93
Week 34: 8/22-8/28 109
Week 35: 8/29-9/4 149
Week 36: 9/5-9/11 177
Week 37: 9/12-9/18 189
Week 38: 9/19-9/25 162
Week 39: 9/26-10/2 195
Week 40: 10/3-10/9 173
Week 41: 10/10-10/16 103
0
200
400
600
800
1,000
1,200
1,400
31 33 35 37 39 41 43 45 47 49 51 53 2 4 6 8 10 12 14 16 18 20 22 24 26 28 30 32 34 36 38 40
Num
ber o
f Cas
es
Week
7/26
-8/1/
208/
2-8/
8/20
8/9-
8/15
/20
8/16
-8/2
2/20
8/23
-8/3
0/20
8/31
-9/5
/20
9/6-
9/12
/20
9/13
-9/19
/20
9/20
-9/2
6/20
9/27
-10/
3/20
10/4
-10/
10/2
010
/11-1
0/17
/20
10/18
-10/2
4/20
10/2
5-10
/31/2
011/
1-11/
7/20
11/8-
11/14
/20
11/15
-11/2
1/20
11/22
-11/2
8/20
11/29
-12/
5/20
12/6
-12/
12/2
012
/13-12
/19/2
012
/20-
12/2
6/20
12/2
7-1/2
/21
1/3-1
/9/2
11/1
0-1/1
6/21
1/17-
1/23/
211/2
4-1/3
0/21
1/31-
2/6/
212/
7-2/
13/2
12/
14-2
/20/
212/
21-2
/27/
212/
28-3
/6/2
13/
7-3/
13/2
13/
14-3
/20/
213/
21-3
/27/
213/
28-4
/3/2
14/
4-4/
10/2
14/
11-4/
17/2
14/
18-4
/24/
214/
25-5
/1/21
5/2-
5/8/
215/
9-5/
15/2
15/
16-5
/22/
215/
23-5
/29/
215/
30-6
/5/2
16/
6-6/
12/2
16/
13-6
/19/2
16/
20-6
/26/
216/
27-7
/3/2
17/
4-7/
10/2
17/
11-7/
17/2
17/
18-7
/24/
217/
25-7
/31/2
18/
1-8/
7/21
8/8-
8/14
/21
8/15
-8/2
1/21
8/22
-8/2
8/21
8/29
-9/4
/21
9/5-
9/11/
219/
12-9
/18/2
19/
19-9
/25/
219/
26-1
0/2/
2110
/3-1
0/9/
2110
/10-1
0/16
/21
Minnesota Department of Health Weekly COVID-19 Report: Updated 10/21/2021 with data current as of 4 a.m. the previous day unless specifically noted. Page 51
Cases that have an Affiliation with Institutes of Higher Education (IHE) (Archived)Cases of COVID-19 affiliated with faculty, staff, and students working or enrolled at a Minnesota Institute of Higher Education (IHE) while they were potentially exposed to or able to spread COVID-19. IHE include colleges, universities, and private career schools. Numbers include confirmed and probable cases.
Cases by week are by specimen collection date. Numbers listed as cumulative total are cumulative since Aug. 1, 2020.
20,785 Total IHE-affiliated Cases
(cumulative)
Cases infectious while on campus (cumulative)
6,920
Cases living on campus (cumulative)
3,157
Due to the need to confirm reports and
reporting delays, data may be incomplete183
Total Hospitalized IHE-affiliated Cases (cumulative)
22 Total ICU Hospitalized IHE-affiliated Case
(cumulative)
7 Total IHE-affiliated Deaths
(cumulative)
This data will no longer be updated. Prior to 11/1/21, people were only counted as a case once, even if multiple positive tests were recorded for a person over 90 days apart.
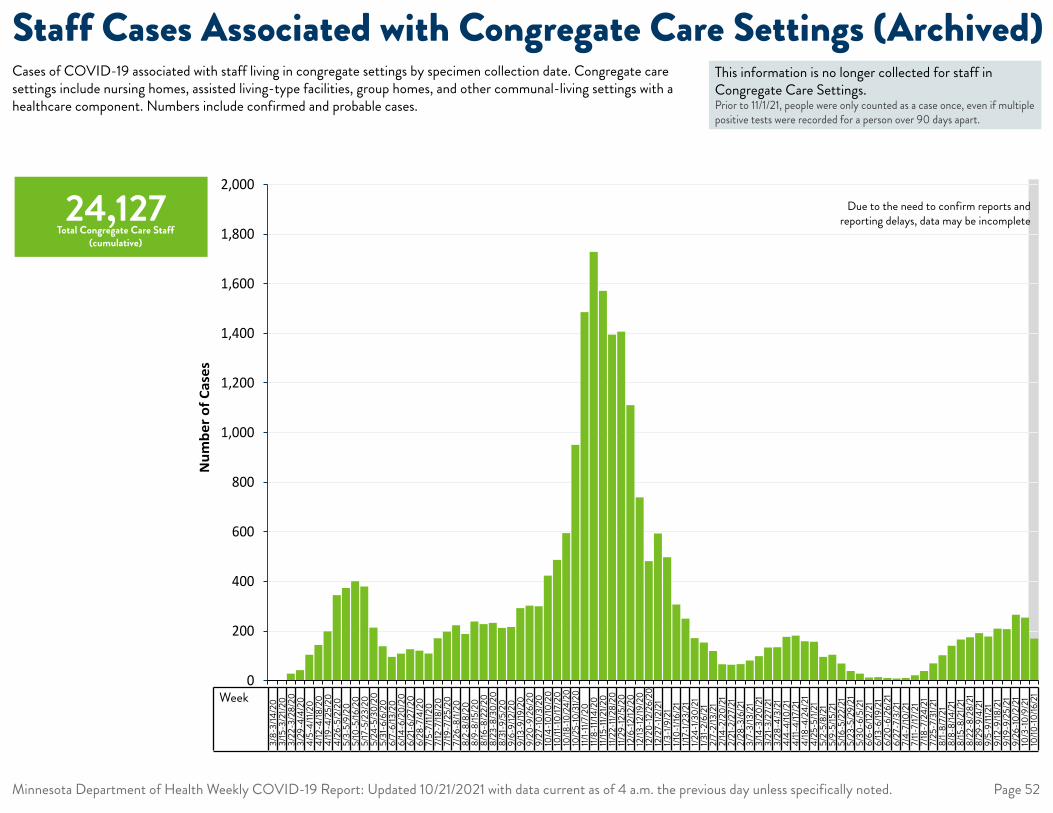
MMWR Week cc staff
Week 11: 3/8-3/14 0
Week 12: 3/15-3/21 1
Week 13: 3/22-3/28 29
Week 14: 3/29-4/4 43
Week 15: 4/5-4/11 105
Week 16: 4/12-4/18 144
Week 17: 4/19-4/25 199
Week 18: 4/26-5/2 345
Week 19: 5/3-5/9 374
Week 20: 5/10-5/16 401
Week 21: 5/17-5/23 380
Week 22: 5/24-5/30 214
Week 23: 5/31-6/6 139
Week 24: 6/7-6/13 96
Week 25: 6/14-6/20 109
Week 26: 6/21-6/27 127
Week 27: 6/28-7/4 121
Week 28: 7/5-7/11 110
Week 29: 7/12-7/18 171
Week 30: 7/19-7/25 198
Week 31: 7/26-8/1 224
Week 32: 8/2-8/8 188
Week 33: 8/9-8/15 239
Week 34: 8/16-8/22 228
Week 35: 8/23-8/29 233
Week 36: 8/30-9/5 213
Week 37: 9/6-9/12 217
Week 38: 9/13-9/19 293
Week 39: 9/20-9/26 303
Week 40: 9/27-10/3 300
Week 41: 10/4-10/10 424
Week 42: 10/11-10/17 487
Week 43: 10/18-10/24 595
Week 44: 10/25-10/31 951
Week 45: 11/1-11/7 1,486
Week 46: 11/8-11/14 1,729
Week 47: 11/15-11/21 1,572
Week 48: 11/22-11/28 1,395
Week 49: 11/29-12/5 1,407
Week 50: 12/6-12/12 1,111
Week 51: 12/13-12/19 739
Week 52: 12/20-12/26 482
Week 53: 12/27-1/2/21 593
Week 1: 1/3-1/9 498
Week 2: 1/10-1/16 307
Week 3: 1/17-1/23 250
Week 4: 1/24-1/30 172
Week 5: 1/31-2/6 154
Week 6: 2/7-2/13 120
Week 7: 2/14-2/20 66
Week 8: 2/21-2/27 64
Week 9: 2/28-3/6 67
Week 10: 3/7-3/13 81
Week 11: 3/14-3/20 99
Week 12: 3/21-3/27 134
Week 13: 3/28-4/3 135
Week 14: 4/4-4/10 177
Week 15: 4/11-4/17 182
Week 16: 4/18-4/24 159
Week 17: 4/25-5/1 157
Week 18: 5/2-5/8 96
Week 19: 5/9-5/15 105
Week 20: 5/16-5/22 69
Week 21: 5/23-5/29 39
Week 22: 5/30-6/5 29
Week 23: 6/6-6/12 13
Week 24: 6/13-6/19 14
Week 25: 6/20-6/26 11
Week 26: 6/27-7/3 9
Week 27: 7/4-7/10 11
Week 28: 7/11-7/17 22
Week 29: 7/18-7/24 39
Week 30: 7/25-7/31 70
Week 31: 8/1-8/7 103
Week 32: 8/8-8/14 141
Week 33: 8/15-8/21 166
Week 34: 8/22-8/28 175
Week 35: 8/29-9/4 192
Week 36: 9/5-9/11 178
Week 37: 9/12-9/18 210
Week 38: 9/19-9/25 208
Week 39: 9/26-10/2 266
Week 40: 10/3-10/9 254
Week 41: 10/10-10/16 170
0
200
400
600
800
1,000
1,200
1,400
1,600
1,800
2,000
11 13 15 17 19 21 23 25 27 29 31 33 35 37 39 41 43 45 47 49 51 53 2 4 6 8 10 12 14 16 18 20 22 24 26 28 30 32 34 36 38 40
Num
ber o
f Cas
es
Week
3/8-
3/14
/20
3/15
-3/2
1/20
3/22
-3/2
8/20
3/29
-4/4
/20
4/5-
4/11/
204/
12-4
/18/2
04/
19-4
/25/
204/
26-5
/2/2
05/
3-5/
9/20
5/10
-5/16
/20
5/17
-5/2
3/20
5/24
-5/3
0/20
5/31
-6/6
/20
6/7-
6/13
/20
6/14
-6/2
0/20
6/21
-6/2
7/20
6/28
-7/4
/20
7/5-
7/11/
207/
12-7
/18/2
07/
19-7
/25/
207/
26-8
/1/20
8/2-
8/8/
208/
9-8/
15/2
08/
16-8
/22/
208/
23-8
/30/
208/
31-9
/5/2
09/
6-9/
12/2
09/
13-9
/19/2
09/
20-9
/26/
209/
27-1
0/3/
2010
/4-1
0/10
/20
10/11
-10/
17/2
010
/18-10
/24/
2010
/25-
10/3
1/20
11/1-
11/7/
2011/
8-11/
14/2
011/
15-1
1/21/2
011/
22-11
/28/
2011/
29-1
2/5/
2012
/6-1
2/12
/20
12/13
-12/19
/20
12/2
0-12
/26/
2012
/27-
1/2/2
11/3
-1/9
/21
1/10-
1/16/
211/1
7-1/2
3/21
1/24-
1/30/
211/3
1-2/
6/21
2/7-
2/13
/21
2/14
-2/2
0/21
2/21
-2/2
7/21
2/28
-3/6
/21
3/7-
3/13
/21
3/14
-3/2
0/21
3/21
-3/2
7/21
3/28
-4/3
/21
4/4-
4/10
/21
4/11-
4/17
/21
4/18
-4/2
4/21
4/25
-5/1/
215/
2-5/
8/21
5/9-
5/15
/21
5/16
-5/2
2/21
5/23
-5/2
9/21
5/30
-6/5
/21
6/6-
6/12
/21
6/13
-6/19
/21
6/20
-6/2
6/21
6/27
-7/3
/21
7/4-
7/10
/21
7/11-
7/17
/21
7/18
-7/2
4/21
7/25
-7/3
1/21
8/1-
8/7/
218/
8-8/
14/2
18/
15-8
/21/2
18/
22-8
/28/
218/
29-9
/4/2
19/
5-9/
11/21
9/12
-9/18
/21
9/19
-9/2
5/21
9/26
-10/
2/21
10/3
-10/
9/21
10/10
-10/16
/21
Minnesota Department of Health Weekly COVID-19 Report: Updated 10/21/2021 with data current as of 4 a.m. the previous day unless specifically noted. Page 52
Staff Cases Associated with Congregate Care Settings (Archived)Cases of COVID-19 associated with staff living in congregate settings by specimen collection date. Congregate care settings include nursing homes, assisted living-type facilities, group homes, and other communal-living settings with a healthcare component. Numbers include confirmed and probable cases.
Due to the need to confirm reports and reporting delays, data may be incomplete
This information is no longer collected for staff in Congregate Care Settings. Prior to 11/1/21, people were only counted as a case once, even if multiple positive tests were recorded for a person over 90 days apart.
24,127 Total Congregate Care Staff
(cumulative)
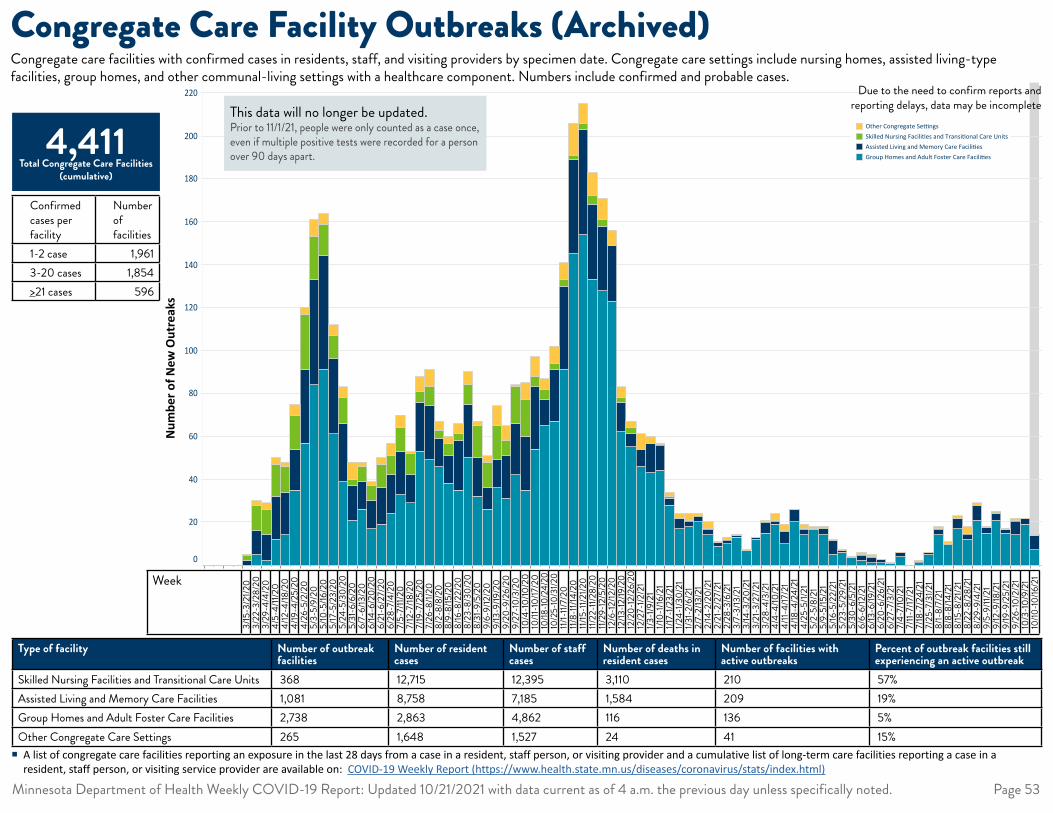
Week reported
Assis
ted
livin
g-ty
pe fa
cilit
ies
Grou
p ho
mes
Oth
er c
ongr
egat
e ca
re fa
cilit
ies
Skill
ed n
ursin
g fa
cilit
ies
Week 12: 3/15-3/21 0 3 2 0
Week 13: 3/22-3/28 2 12 11 5
Week 14: 3/29-4/4 3 12 12 2
Week 15: 4/5-4/11 3 15 20 12
Week 16: 4/12-4/18 2 12 20 14
Week 17: 4/19-4/25 5 16 19 35
Week 18: 4/26-5/2 3 26 34 57
Week 19: 5/3-5/9 8 20 49 84
Week 20: 5/10-5/16 5 15 53 91
Week 21: 5/17-5/23 5 11 35 61
Week 22: 5/24-5/30 5 12 27 39
Week 23: 5/31-6/6 8 3 16 21
Week 24: 6/7-6/13 2 7 13 26
Week 25: 6/14-6/20 2 7 13 17
Week 26: 6/21-6/27 3 11 17 19
Week 27: 6/28-7/4 6 9 18 24
Week 28: 7/5-7/11 6 11 20 33
Week 29: 7/12-7/18 1 10 13 29
Week 30: 7/19-7/25 7 5 23 53
Week 31: 7/26-8/1 8 9 25 49
Week 32: 8/2-8/8 4 4 13 46
Week 33: 8/9-8/15 3 6 13 38
Week 34: 8/16-8/22 5 3 23 35
Week 35: 8/23-8/29 6 9 25 50
Week 36: 8/30-9/5 2 15 18 32
Week 37: 9/6-9/12 3 12 10 26
Week 38: 9/13-9/19 9 16 13 36
Week 39: 9/20-9/26 7 7 20 31
Week 40: 9/27-10/3 1 17 24 42
Week 41: 10/4-10/10 8 17 25 35
Week 42: 10/11-10/17 9 5 29 54
Week 43: 10/18-10/24 5 5 12 65
Week 44: 10/25-10/31 8 3 24 67
Week 45: 11/1-11/7 8 3 39 91
Week 46: 11/8-11/14 15 2 44 145
Week 47: 11/15-11/21 9 3 49 154
Week 48: 11/22-11/28 11 4 35 133
Week 49: 11/29-12/5 10 3 30 128
Week 50: 12/6-12/12 7 0 26 123
Week 51: 12/13-12/19 5 2 14 62
Week 52: 12/20-12/26 3 3 6 55
Week 53: 12/27-1/2/21 7 0 8 46
Week 1: 1/3-1/9 3 0 14 43
Week 2: 1/10-1/16 1 0 12 44
Week 3: 1/17-1/23 2 1 3 28
Week 4: 1/24-1/30 2 0 5 17
Week 5: 1/31-2/6 3 0 3 18
Week 6: 2/7-2/13 1 0 3 20
Week 7: 2/14-2/20 3 0 3 14
Week 8: 2/21-2/27 0 0 2 9
Week 9: 2/28-3/6 1 0 2 10
Week 10: 3/7-3/13 0 0 1 13
Week 11: 3/14-3/20 0 0 0 7
Week 12: 3/21-3/27 0 0 1 12
Week 13: 3/28-4/3 1 0 5 15
Week 14: 4/4-4/10 3 0 2 19
Week 15: 4/11-4/17 3 0 6 10
Week 16: 4/18-4/24 0 0 6 20
Week 17: 4/25-5/1 2 0 3 14
Week 18: 5/2-5/8 1 0 0 17
Week 19: 5/9-5/15 0 1 3 14
Week 20: 5/16-5/22 0 0 7 5
Week 21: 5/23-5/29 0 0 1 6
Week 22: 5/30-6/5 0 0 0 4
Week 23: 6/6-6/12 1 0 3 2
Week 24: 6/13-6/19 1 0 3 1
Week 25: 6/20-6/26 0 0 2 1
Week 26: 6/27-7/3 0 0 0 1
Week 27: 7/4-7/10 0 0 2 4
Week 28: 7/11-7/17 0 0 0 0
Week 29: 7/18-7/24 0 0 1 1
Week 30: 7/25-7/31 0 0 1 5
Week 31: 8/1-8/7 1 0 3 14
Week 32: 8/8-8/14 1 0 0 10
Week 33: 8/15-8/21 1 0 5 17
Week 34: 8/22-8/28 3 0 3 12
Week 35: 8/29-9/4 1 0 7 21
Week 36: 9/5-9/11 0 0 3 15
Week 37: 9/12-9/18 0 1 3 21
Week 38: 9/19-9/25 0 0 2 15
Week 39: 9/26-10/2 1 0 7 14
Week 40: 10/3-10/9 0 0 3 19
Week 41: 10/10-10/16 0 0 7 7
Feb 16, 20 Mar 29, 20 May 10, 20 Jun 21, 20 Aug 2, 20 Sep 13, 20 Oct 25, 20 Dec 6, 20 Jan 17, 21 Feb 28, 21 Apr 11, 21 May 23, 21 Jul 4, 21 Aug 15, 21 Sep 26, 21 Nov 7, 21
MMWR Week, by start date
0
20
40
60
80
100
120
140
160
180
200
220
Num
ber o
f New
Out
brea
ks
lag_endlag_start
New Outbreaks at Congregate Living Facili�esby Facility Type and Over Time
Facility TypeOther Congregate Se�ngsSkilled Nursing Facili�es and Transi�onal Care UnitsAssisted Living and Memory Care Facili�esGroup Homes and Adult Foster Care Facili�es
Source: MDH COVID-19 Case Database. Each facility with an outbreak is listed only once. Data are currently displayed by the date the outbreak was reported and are current as of 10/19/2021. Date noted is the star�ng day of that week. Other CongregateSe�ngs includes Hospice, Substance Abuse, Mental Health, and other long-term care facilites.
Num
ber o
f New
Out
reak
s
Feb 16, 20 Mar 29, 20 May 10, 20 Jun 21, 20 Aug 2, 20 Sep 13, 20 Oct 25, 20 Dec 6, 20 Jan 17, 21 Feb 28, 21 Apr 11, 21 May 23, 21 Jul 4, 21 Aug 15, 21 Sep 26, 21 Nov 7, 21
MMWR Week, by start date
0
20
40
60
80
100
120
140
160
180
200
220
Num
ber o
f New
Out
brea
ks
lag_endlag_start
New Outbreaks at Congregate Living Facili�esby Facility Type and Over Time
Facility TypeOther Congregate Se�ngsSkilled Nursing Facili�es and Transi�onal Care UnitsAssisted Living and Memory Care Facili�esGroup Homes and Adult Foster Care Facili�es
Source: MDH COVID-19 Case Database. Each facility with an outbreak is listed only once. Data are currently displayed by the date the outbreak was reported and are current as of 10/19/2021. Date noted is the star�ng day of that week. Other CongregateSe�ngs includes Hospice, Substance Abuse, Mental Health, and other long-term care facilites.
Week
3/15
-3/2
1/20
3/22
-3/2
8/20
3/29
-4/4
/20
4/5-
4/11/
204/
12-4
/18/2
04/
19-4
/25/
204/
26-5
/2/2
05/
3-5/
9/20
5/10
-5/16
/20
5/17
-5/2
3/20
5/24
-5/3
0/20
5/31
-6/6
/20
6/7-
6/13
/20
6/14
-6/2
0/20
6/21
-6/2
7/20
6/28
-7/4
/20
7/5-
7/11/
207/
12-7
/18/2
07/
19-7
/25/
207/
26-8
/1/20
8/2-
8/8/
208/
9-8/
15/2
08/
16-8
/22/
208/
23-8
/30/
208/
31-9
/5/2
09/
6-9/
12/2
09/
13-9
/19/2
09/
20-9
/26/
209/
27-1
0/3/
2010
/4-1
0/10
/20
10/11
-10/
17/2
010
/18-10
/24/
2010
/25-
10/3
1/20
11/1-
11/7/
2011/
8-11/
14/2
011/
15-1
1/21/2
011/
22-11
/28/
2011/
29-1
2/5/
2012
/6-1
2/12
/20
12/13
-12/19
/20
12/2
0-12
/26/
2012
/27-
1/2/2
11/3
-1/9
/21
1/10-
1/16/
211/1
7-1/2
3/21
1/24-
1/30/
211/3
1-2/
6/21
2/7-
2/13
/21
2/14
-2/2
0/21
2/21
-2/2
7/21
2/28
-3/6
/21
3/7-
3/13
/21
3/14
-3/2
0/21
3/21
-3/2
7/21
3/28
-4/3
/21
4/4-
4/10
/21
4/11-
4/17
/21
4/18
-4/2
4/21
4/25
-5/1/
215/
2-5/
8/21
5/9-
5/15
/21
5/16
-5/2
2/21
5/23
-5/2
9/21
5/30
-6/5
/21
6/6-
6/12
/21
6/13
-6/19
/21
6/20
-6/2
6/21
6/27
-7/3
/21
7/4-
7/10
/21
7/11-
7/17
/21
7/18
-7/2
4/21
7/25
-7/3
1/21
8/1-
8/7/
218/
8-8/
14/2
18/
15-8
/21/2
18/
22-8
/28/
218/
29-9
/4/2
19/
5-9/
11/21
9/12
-9/18
/21
9/19
-9/2
5/21
9/26
-10/
2/21
10/3
-10/
9/21
10/10
-10/16
/21
Minnesota Department of Health Weekly COVID-19 Report: Updated 10/21/2021 with data current as of 4 a.m. the previous day unless specifically noted. Page 53
Congregate Care Facility Outbreaks (Archived)Congregate care facilities with confirmed cases in residents, staff, and visiting providers by specimen date. Congregate care settings include nursing homes, assisted living-type facilities, group homes, and other communal-living settings with a healthcare component. Numbers include confirmed and probable cases.
Due to the need to confirm reports and reporting delays, data may be incomplete
� A list of congregate care facilities reporting an exposure in the last 28 days from a case in a resident, staff person, or visiting provider and a cumulative list of long-term care facilities reporting a case in a resident, staff person, or visiting service provider are available on: COVID-19 Weekly Report (https://www.health.state.mn.us/diseases/coronavirus/stats/index.html)
This data will no longer be updated. Prior to 11/1/21, people were only counted as a case once, even if multiple positive tests were recorded for a person over 90 days apart.4,411
Total Congregate Care Facilities (cumulative)
Confirmed cases per facility
Number of facilities
1-2 case 1,9613-20 cases 1,854>21 cases 596
Type of facility Number of outbreak facilities
Number of resident cases
Number of staff cases
Number of deaths in resident cases
Number of facilities with active outbreaks
Percent of outbreak facilities still experiencing an active outbreak
Skilled Nursing Facilities and Transitional Care Units 368 12,715 12,395 3,110 210 57% Assisted Living and Memory Care Facilities 1,081 8,758 7,185 1,584 209 19% Group Homes and Adult Foster Care Facilities 2,738 2,863 4,862 116 136 5% Other Congregate Care Settings 265 1,648 1,527 24 41 15%
Related Documents


