SECOND QUARTER RESULTS * July 21, 2021 * Mexico City * Ticker BMV: IENOVA

Welcome message from author
This document is posted to help you gain knowledge. Please leave a comment to let me know what you think about it! Share it to your friends and learn new things together.
Transcript

SEC
ON
D Q
UA
RTE
R
RES
ULT
S*
July
21,
202
1*
Mex
ico
City
*Ti
cker
BM
V: IE
NO
VA

Executive Summary
Three months ended June 30, Six months ended June 30,
(millions of US$) 2021 2020 % Var. 2021 2020 % Var.(unaudited) (unaudited)
IEnova Adjusted EBITDA 280.2 250.4 12 % 541.2 501.7 8 %Profit for the period 121.3 126.2 (4) % 231.8 172.6 34 %Revenues 408.6 276.4 48 % 774.2 589.6 31 %
• In the second quarter of 2021, IEnova Adjusted EBITDA increased 12 percent to $280.2 million, compared with $250.4 million in the same period of 2020. The increase of $29.8 million was mainly due to the consolidation of Energía Sierra Juarez after the acquisition of the remaining 50-percent interest in March 2021, higher margin at the gas segment, the start of operations of Don Diego, Border Solar and the Veracruz Terminal, and higher results at Termoeléctrica de Mexicali power plant, offset by higher operating expenses.
• In the six months ended June 30, 2021, IEnova Adjusted EBITDA increased 8 percent to $541.2 million compared with $501.7 million in the same period of 2020. The increase of $39.5 million was mainly due to higher margin at the gas segment, the consolidation of Energía Sierra Juarez after the acquisition of the remaining 50-percent interest in March 2021, the start of operations of Don Diego, Border Solar and the Veracruz Terminal, offset by lower results at Termoeléctrica de Mexicali power plant and higher operating expenses.
• In the second quarter of 2021, profit was $121.3 million, compared with $126.2 million in the same period of 2020. The decrease of $4.9 million was mainly due to non-cash exchange rate effects and higher depreciation, offset by IEnova Adjusted EBITDA drivers mentioned above.
• In the six months ended June 30, 2021, profit was $231.8 million, compared with $172.6 million in the same period of 2020. The increase of $59.2 million was mainly due to non-cash exchange rate effects and IEnova Adjusted EBITDA drivers mentioned above, offset by higher depreciation and higher finance cost.
• In the second quarter of 2021, revenues were $408.6 million, compared with $276.4 million in the same period of 2020. The increase of $132.2 million was mainly related to higher revenues at the gas segment, higher results at Termoeléctrica de Mexicali power plant, the consolidation of Energía Sierra Juarez after the acquisition of the remaining 50-percent interest in March 2021, the start of operations of Don Diego, Border Solar and the Veracruz Terminal.
• In the six months ended June 30, 2021, revenues were $774.2 million, compared with $589.6 million in the same period of 2020. The increase of $184.6 million was mainly related to higher revenues at the gas segment, the consolidation of Energía Sierra Juarez after the acquisition of the remaining 50-percent interest in March 2021, higher results at Termoeléctrica de Mexicali power plant, the start of operations of Don Diego, Border Solar and the Veracruz Terminal.
• The Company maintains strong level of liquidity with approximately $1.8 billion, including cash and available committed credit lines.
Page | 2

• In May 24th, 2021, the Company announced that Casa de Bolsa BBVA Bancomer, S.A. de C.V., Grupo Financiero BBVA Bancomer, as exchange agent, published through the electronic information system “Emisnet” of the Mexican Stock Exchange (Bolsa Mexicana de Valores), on behalf of Sempra Energy (“Sempra”), the notice of results of the exchange offer launched by Sempra on April 26, 2021, to acquire all of the IEnova's ordinary shares not owned directly or indirectly by Sempra (the “IEnova Public Shares”), in exchange for shares of Sempra´s common stock at an exchange ratio of 0.0323 shares of Sempra´s common stock for each IEnova Public Share.
• In May 28th, 2021, the Company announced that the exchange offer launched by Sempra on April 26th, 2021, to acquire all of the issued and outstanding ordinary shares of IEnova not owned directly or indirectly by Sempra (“IEnova Public Shares”), in exchange for shares of Sempra common stock, was settled through S.D. Indeval, Institución para el Depósito de Valores, S.A. de C.V., at an exchange ratio of 0.0323 shares of Sempra's common stock for each IEnova Public Share.
• Sempra announced the completion of their exchange tender offer, and the increase of their ownership interest in IEnova to 96.4%.
Page | 3

Segment Information
Revenue is presented after eliminating inter-company transactions.
Gas Segment Three months ended June 30,
Six months ended June 30,
(millions of US$) 2021 2020 2021 2020(unaudited) (unaudited)
Revenues $ 261.3 $ 179.5 $ 521.3 $ 378.5 IEnova EBITDA 113.6 101.6 241.6 205.9
Revenues
In the second quarter of 2021, Gas segment revenues were $261.3 million, compared with $179.5 million in the same period of 2020. The increase of $81.8 million was mainly due to $68.6 million from higher volume and price of natural gas sold (partially offset in cost of revenues), $7.2 million from higher distribution rates and volume and $6.9 million from higher revenue in transportation business.
In the six months ended June 30, 2021, Gas segment revenues were $521.3 million, compared with $378.5 million in the same period of 2020. The increase of $142.8 million was mainly due to $125.1 million from higher price and volume of natural gas sold (partially offset in cost of revenues), $11.7 million from higher distribution rates and volume and $6.9 million from higher revenue in transportation business.
IEnova EBITDA
In the second quarter of 2021, Gas segment IEnova EBITDA was $113.6 million, compared with $101.6 million in the same period of 2020. In the six months ended June 30, 2020, Gas segment IEnova EBITDA was $241.6 million, compared with $205.9 million in the same period of 2020. The increases of $12.0 million and $35.7 million were mainly due to higher margin at gas business, higher distribution rates and volume and higher revenue in transportation business, partially offset by higher operating expenses.
Storage Segment Three months ended June 30,
Six months ended June 30,
(millions of US$) 2021 2020 2021 2020(unaudited) (unaudited)
Revenues $ 47.1 $ 40.1 $ 87.3 $ 79.4 IEnova EBITDA 48.3 47.3 96.2 94.5
Revenues
In the second quarter of 2021, Storage segment revenues were $47.1 million, compared with $40.1 million in the same period of 2020. In the six months ended June 30, 2021, Storage segment revenues were $87.3 million, compared with $79.4 million for the same period of 2020. The increases of $7.0 million and $7.9 million were mainly due to the start of operation of the Veracruz Terminal.
Page | 4

IEnova EBITDA
In the second quarter of 2021, Storage segment IEnova EBITDA was $48.3 million, compared with $47.3 million in the same period of 2020. In the six months ended June 30, 2021, Storage segment IEnova EBITDA was $96.2 million, compared with $94.5 million for the same period of 2020. The increases of $1.0 million and $1.7 million were mainly due to the start of operation of the Veracruz Terminal.
Power Segment Three months ended June 30,
Six months ended June 30,
(millions of US$) 2021 2020 2021 2020(unaudited) (unaudited)
Revenues $ 98.3 $ 54.4 $ 162.2 $ 127.0 IEnova EBITDA 47.9 27.9 60.4 59.3
Revenues
In the second quarter of 2021, Power segment revenues were $98.3 million, compared with $54.4 million for the same period of 2020. The increase of $43.9 million was mainly due to $22.2 million from higher volume and prices at the Termoeléctrica de Mexicali power plant, $13.5 million from the consolidation of Energía Sierra Juarez after the acquisition of the remaining 50-percent interest in March 2021, and $6.2 million from the start of operations of Don Diego and Border Solar facilities.
In the six months ended June 30, 2021, Power segment revenues were $162.2 million, compared with $127.0 million for the same period of 2020. The increase of $35.2 million was mainly due to $15.7 million from the consolidation of Energía Sierra Juarez after the acquisition of the remaining 50-percent interest in March 2021, $9.3 million in Termoeléctrica de Mexicali power plant from higher prices and volume and $8.5 million from the start of operations of Don Diego and Border Solar facilities.
IEnova EBITDA
In the second quarter of 2021, Power segment IEnova EBITDA was $47.9 million, compared with $27.9 million for the same period of 2020. The increase of $20.0 million was mainly due the consolidation of Energía Sierra Juarez after the acquisition of the remaining 50-percent interest in March 2021, the start of operations of Don Diego and Border Solar facilities and higher results at Termoeléctrica de Mexicali power plant.
In the six months ended June 30, 2021, Power segment IEnova EBITDA was $60.4 million, compared with $59.3 million for the same period of 2020. The increase of $1.1 million was mainly due to the consolidation of Energía Sierra Juarez after the acquisition of the remaining 50-percent interest in March 2021 and the start of operations of Don Diego and Border Solar facilities, offset by lower results at Termoeléctrica de Mexicali power plant mainly due to mark to market valuation related to hedge positions due to higher volatility of energy forward prices that should be reversed as hedges are realized.
Page | 5

Joint Ventures IEnova EBITDA and Share of Profits from Joint Ventures
Three months ended June 30,
Six months ended June 30,
(millions of US$)Joint Venture
with 2021 2020 2021 2020
(unaudited) (unaudited)
Joint Ventures IEnova EBITDA $ 66.9 $ 71.7 $ 140.9 $ 141.0
Los Ramones Norte pipeline Brookfield $ 13.8 $ 13.0 $ 26.6 $ 16.3 South Texas - Tuxpan pipeline TC Energy 0.2 9.4 36.2 115.7 Energía Sierra Juárez wind generation facility Actis (1) — 2.0 1.6 3.0 ECA Liquefaction Sempra Energy (0.2) (1.2) (1.2) (2.6) Share of Profits from Joint Ventures, net of Income Tax $ 13.8 $ 23.2 $ 63.2 $ 132.4
(1) On March 19, 2021, IEnova acquired the remaining 50-percent interest in Energia Sierra Juárez wind generation facility.
Joint Ventures IEnova EBITDA
In the second quarter of 2021, Joint Ventures IEnova EBITDA was $66.9 million compared with $71.7 million in the same period of 2020. The decrease of $4.8 million was mainly due to the consolidation of Energía Sierra Juarez after the acquisition of the remaining 50-percent interest in March 2021, which is now reported in consolidation section.
In the six months ended June 30, 2021, Joint Ventures IEnova EBITDA was $140.9 million compared with $141.0 in line compared with the same period of 2020. The decrease of $0.1 million was mainly due to higher results in the South Texas - Tuxpan pipeline and Ramones Norte, offset by the consolidation of Energía Sierra Juarez after the acquisition of the remaining 50-percent interest in March 2021, which is now reported in consolidation section.
Share of Profits from Joint Ventures, net of Income Tax
In the second quarter of 2021, our Share of Profit from Joint Ventures, net of Income Tax was $13.8 million, compared with $23.2 million for the same period of 2020. The decrease of $9.4 million was mainly due to the South Texas - Tuxpan pipeline foreign exchange rate effects primarily related to a peso-denominated shareholder’s loan offset by its lower finance cost. The foreign exchange rate effects are offset in Other Gains (Losses), net.
In the six months ended June 30, 2021, our Share of Profit from Joint Ventures, net of Income Tax was $63.2 million compared with $132.4 million in the same period of 2020. The decrease of $69.2 million was mainly due to the South Texas - Tuxpan pipeline foreign exchange rate effects primarily related to a peso-denominated shareholder’s loan offset by its lower finance cost and non-cash exchange rate effects at Los Ramones Norte pipeline. The foreign exchange rate effects are offset in Other Gains (Losses), net.
Page | 6

Consolidated Results
Depreciation and Amortization
In the second quarter of 2021, depreciation and amortization was $53.5 million, compared with $39.7 million in the same period of 2020. The increase of $13.8 million was mainly due to the consolidation of Energía Sierra Juarez after the acquisition of the remaining 50-percent interest in March 2021 and the new assets in operation in gas, power and storage segments.
In the six months ended June 30, 2021, depreciation and amortization was $97.4 million, compared with $80.4 million in the same period of 2020. The increase of $17.0 million was mainly due to new assets in operation in gas segment, the consolidation of Energía Sierra Juarez after the acquisition of the remaining 50-percent interest in March 2021 and the new assets in operation in power and storage segments.
Financing Cost, Net
In the second quarter of 2021, financing cost, net was $26.2 million, compared with $21.6 million in the same period of 2020. In the six months ended June 30, 2021, financing cost, net was $50.4 million, compared with $38.7 million in the same period of 2020. The increases of $4.6 million and $11.7 million were mainly due to lower interest income related to the shareholder's loan to fund to the South Texas – Tuxpan pipeline.
Other gains (losses), Net
In the second quarter of 2021, other gains were $30.5 million, compared with other gains of $15.1 million in the same period of 2020. In the six months ended June 30, 2021, other gains were $5.3 million, compared with other losses of $133.0 million in the same period of 2020. The variances of $15.4 million and $138.3 million were mainly related to exchange rate effects, mainly due to a peso-denominated shareholder's loan to fund the South Texas – Tuxpan pipeline, which is offset in Share of Profits from Joint Ventures.
Income Tax Expense
In the second quarter of 2021, income tax expense was $56.6 million, compared with $29.5 million in the same period of 2020. The increase of $27.1 million is primarily due to the effect of exchange rate and inflation on monetary assets and liabilities and tax incentives, partially offset by the effect of the deferred income tax balance from the fluctuation in the tax basis of property, plant and equipment at our U.S. dollar functional currency, which we are required to remeasure in each reporting period based on changes in the Mexican peso exchange rate.
In the six months ended June 30, 2021, income tax expense was $89.2 million, compared with $68.4 million in the same period of 2020. The increase of $20.8 million was mainly due to higher profit before tax, the effect of exchange rate and inflation on monetary assets and liabilities and tax incentives, partially offset by the effect of the deferred income tax balance from the fluctuation in the tax basis of property, plant and equipment at our U.S. dollar functional currency, which we are required to remeasure in each reporting period based on changes in the Mexican peso exchange rate.
Page | 7

Liquidity and Capital Resources
We are a holding company. As a result, our ability to meet our obligations and to fund our capital needs depends on our ongoing ability to generate cash from operations, the terms of our financing arrangements, and our access to financing sources.
Sources and Uses of Cash Three months ended June 30,
Six months ended June 30,
(millions of US$) 2021 2020 2021 2020(unaudited) (unaudited)
Cash, cash equivalents and restricted cash at the beginning of the period $ 334.8 $ 564.7 $ 316.3 $ 91.5
Net cash provided by operating activities 159.8 84.0 334.2 199.2 Net cash used in investing activities (71.7) (134.5) (214.3) (301.9) Net cash (used in) provided by financing
activities (257.9) 75.6 (284.0) 639.1 Effects of exchange rate changes on cash
and cash equivalents 1.2 11.0 14.0 (27.1)
Cash, cash equivalents and restricted cash at the end of the period $ 166.2 $ 600.8 $ 166.2 $ 600.8
Operating Activities
In the second quarter of 2021, net cash provided by operating activities was $159.8 million, compared with $84.0 million in the same period of 2020. In the six months ended June 31, 2020 net cash provided by operating activities was $334.2 million, compared with $199.2 million in the same period of 2020. The variances were mainly due to lower income tax payments, higher operational results offset by changes in working capital.
Investing Activities
In the second quarter of 2021, net cash used in investing activities was $71.7 million mainly due to capital expenditures of $79.4 million primarily related to the liquid terminals projects, the funding of $4.0 million for the ECA liquefaction project, partially offset by $11.6 million interest received from the shareholder's loan granted to the South Texas – Tuxpan pipeline.
In the second quarter of 2020, net cash used in investing activities was $134.5 million mainly due to capital expenditures of $143.3 million primarily related to the liquid terminals and solar projects, the funding of $3.5 million for the ECA liquefaction project and $2.3 million in the ESJ Expansion project, partially offset by $14.5 million interest payments from the shareholder's loan granted to the South Texas – Tuxpan pipeline.
In the six months ended June 30, 2021 net cash used in investing activities was $214.3 million, mainly due to capital expenditures of $159.7 million primarily related to the liquid terminals projects, the acquisition of Energia Sierra Juarez net of cash acquired of $65.0 million, the funding of $4.0 million for
Page | 8

the ESJ Expansion before the acquisition and $7.2 million for the ECA liquefaction project, partially offset by $22.9 million interest received from the shareholder's loan granted to the South Texas – Tuxpan pipeline.
In the six months ended June 30, 2020 net cash used in investing activities was $301.9 million, mainly due to capital expenditures of $303.0 million primarily related to the liquid terminals and solar projects, the funding of $22.6 million in ESJ Expansion project and $8.5 million in the ECA liquefaction project, partially offset by $30.2 million interest payments from the shareholder's loan granted to the South Texas – Tuxpan pipeline.
Financing Activities
In the second quarter of 2021, net cash used by financing activities was $257.9 million mainly due to $229.9 million of payments net of proceeds from bank financing, $25.5 million of interest paid, and $2.4 million for finance lease payments.
In the second quarter of 2020, net cash provided by financing activities was $75.6 million mainly due to $112.3 million of net proceeds from bank financing, partially offset by $22.8 million of interest paid, $10.3 million of share repurchases and $2.5 million from finance lease payments.
In the six months ended June 30, 2021 net cash provided by financing activities was $284.0 million, mainly due to $245.4 million of payments net of proceeds from bank financing, $53.5 million of interest paid, and $5.1 million for finance lease payments, partially offset by $20.0 million from a loan received from unconsolidated affiliates.
In the six months ended June 30, 2020 net cash used by financing activities was $639.1 million, mainly due to a $667.8 million of net proceeds from revolving credit lines and $64.0 million net proceeds of loans from unconsolidated affiliates, partially offset by $66.6 million of interest paid, $10.3 million of share repurchases and $5.3 million from finance lease payments.
The Company ended the second quarter with $166.2 million of cash, including restricted cash and short term investments. More over the Company had approximately $1.8 billion of liquidity, including cash and available committed credit lines.
Page | 9

Condensed Consolidated Financial Statements
Amounts are presented in U.S. dollars, the functional currency of the Company, unless otherwise noted, and in accordance with International Financial Reporting Standards (IFRS) as issued by the International Accounting Standards Board (IASB). All amounts are unaudited, unless otherwise noted. Numbers may not add up due to rounding.
Statements of Profits Three months ended June 30,
Six months ended June 30,
(millions of US$) 2021 2020 2021 2020(unaudited) (unaudited)
Revenues $ 408.6 $ 276.4 $ 774.2 $ 589.6 Cost of revenues (124.9) (47.6) (249.5) (120.3) Operating, administrative and other expenses (70.4) (50.1) (124.4) (108.6) IEnova EBITDA 213.3 178.7 400.3 360.7 Depreciation and amortization (53.5) (39.7) (97.4) (80.4) Operating profit 159.8 139.0 302.9 280.3 Financing cost, net (26.2) (21.6) (50.4) (38.7) Other gains (losses), net 30.5 15.1 5.3 (133.0) Profit before income tax and share of profits of joint ventures 164.1 132.5 257.8 108.6
Income tax expense (56.6) (29.5) (89.2) (68.4) Share of profits of joint ventures, net of income tax 13.8 23.2 63.2 132.4 Profit for the period $ 121.3 $ 126.2 $ 231.8 $ 172.6
Page | 10

Statements of Financial Position June 30, 2021 December 31, 2020(thousands of US$) (unaudited) (audited)AssetsCurrent assets Cash and cash equivalents $ 130,709 $ 291,993 Trade and other receivables, net 239,460 182,587 Taxes receivable 209,500 198,189 Other current assets (1) 180,852 136,861 Total current assets 760,521 809,630 Non-current assets Due from unconsolidated affiliates 714,546 787,183 Finance lease receivables 920,017 926,795 Deferred income tax assets 80,007 100,650 Investments in joint ventures 839,126 783,428 Property, plant and equipment, net 5,407,116 5,048,512 Goodwill 1,638,091 1,638,091 Other non-current assets (2) 497,818 372,135 Total non-current assets 10,096,721 9,656,794 Total assets $ 10,857,242 $ 10,466,424
Liabilities and Stockholders’ Equity Short-term debt $ 650,349 $ 839,287 Due to unconsolidated affiliates 96,713 61,817 Other current liabilities (3) 444,181 338,272 Total current liabilities 1,191,243 1,239,376 Non-current liabilities Long-term debt 2,963,270 2,838,711 Due to unconsolidated affiliates 300,704 272,857 Deferred income tax liabilities 608,996 604,229 Other non-current liabilities(4) 405,027 389,454 Total non-current liabilities 4,277,997 4,105,251 Total liabilities 5,469,240 5,344,627 Stockholders’ equity Common stock 743,501 743,501 Additional paid-in capital 2,322,631 2,320,385 Accumulated other comprehensive (loss) (154,073) (186,241) Retained earnings 2,471,259 2,239,395 Total equity attributable to owners 5,383,318 5,117,040 Non-controlling interests 4,684 4,757 Total equity of the company $ 5,388,002 $ 5,121,797 Total liabilities and equity $ 10,857,242 $ 10,466,424
(1) Other current assets includes finance lease receivables - current, amounts due from unconsolidated affiliates, natural gas inventories, derivative financial instruments, carbon allowances - current, other current assets and restricted cash.
(2) Other non-current assets includes derivative financial instruments, other non-current assets, right of use assets, carbon allowances - non-current, intangible assets and restricted cash.
(3) Other current liabilities includes trade and other payables, income tax liabilities, lease liabilities - current, derivative financial instruments, other financial liabilities, provisions current, other taxes payable, carbon allowances - current and other current liabilities.
(4) Other non-current liabilities includes lease liabilities - non current, carbon allowances - non current, provisions - non current, derivative financial instruments, employee benefits and other non-current liabilities.
Page | 11

Reconciliation of Profit for the Period to IEnova EBITDA and IEnova Adjusted EBITDA
We present “IEnova EBITDA” and “IEnova Adjusted EBITDA” in this earnings report for the convenience of investors. IEnova EBITDA and IEnova Adjusted EBITDA, however, are not measures of financial performance under IFRS and should not be considered as alternatives to profit or operating income as a measure of operating performance or to cash flows from operating activities as a measure of liquidity.
Our definition of IEnova EBITDA is profit for the period after adding back or subtracting, as the case may be, (1) depreciation and amortization, (2) financing cost, net, (3) other losses (gains), net, (4) income tax expense and (5) share of profits of joint ventures, net of income tax.
We define IEnova Adjusted EBITDA as IEnova EBITDA plus Joint Ventures (JV) IEnova EBITDA adjustment.
We define the JV IEnova EBITDA adjustment as our share of the profit of joint ventures, after adding back or subtracting, as the case may be, our share of: (1) depreciation and amortization, (2) financing cost, net, (3) other (gains) losses, net, and (4) income tax expense.
IEnova EBITDA and IEnova Adjusted EBITDA
Three months ended June 30,
Six months ended June 30,
(millions of US$) 2021 2020 2021 2020(unaudited) (unaudited)
Gas Segment $ 113.6 $ 101.6 $ 241.6 $ 205.9 Storage Segment 48.3 47.3 96.2 94.5 Power Segment 47.9 27.9 60.4 59.3 Corporate & Others 3.5 1.9 2.1 1.0 IEnova EBITDA $ 213.3 $ 178.7 $ 400.3 $ 360.7 JV EBITDA adjustment 66.9 71.7 140.9 141.0 IEnova Adjusted EBITDA $ 280.2 $ 250.4 $ 541.2 $ 501.7
Page | 12
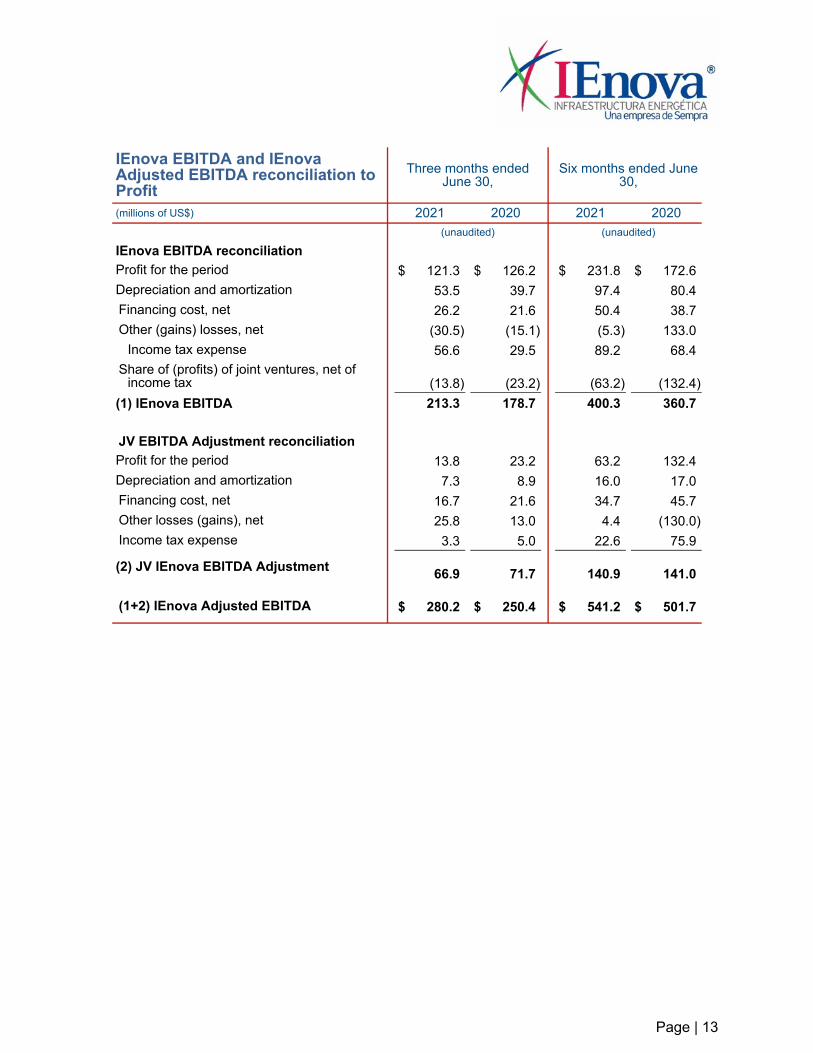
IEnova EBITDA and IEnova Adjusted EBITDA reconciliation to Profit
Three months ended June 30,
Six months ended June 30,
(millions of US$) 2021 2020 2021 2020(unaudited) (unaudited)
IEnova EBITDA reconciliationProfit for the period $ 121.3 $ 126.2 $ 231.8 $ 172.6 Depreciation and amortization 53.5 39.7 97.4 80.4 Financing cost, net 26.2 21.6 50.4 38.7 Other (gains) losses, net (30.5) (15.1) (5.3) 133.0
Income tax expense 56.6 29.5 89.2 68.4 Share of (profits) of joint ventures, net of
income tax (13.8) (23.2) (63.2) (132.4) (1) IEnova EBITDA 213.3 178.7 400.3 360.7
JV EBITDA Adjustment reconciliationProfit for the period 13.8 23.2 63.2 132.4 Depreciation and amortization 7.3 8.9 16.0 17.0 Financing cost, net 16.7 21.6 34.7 45.7 Other losses (gains), net 25.8 13.0 4.4 (130.0) Income tax expense 3.3 5.0 22.6 75.9
(2) JV IEnova EBITDA Adjustment 66.9 71.7 140.9 141.0
(1+2) IEnova Adjusted EBITDA $ 280.2 $ 250.4 $ 541.2 $ 501.7
Page | 13

Internal Controls
Our management is responsible for maintaining a system of internal control over financial reporting. This system gives our shareholders reasonable assurance that our transactions are executed and maintained in accordance with the guidelines set forth by our management and that our financial records are reliable as a basis for preparing our financial statements.
The system of internal control over financial reporting is supported by ongoing audits, the results of which are reported to management throughout the year. In addition, we maintain reliable databases and have systems designed to generate key financial information.
In January 2021, the Company implemented a new enterprise resource planning system (ERP system) to replace its legacy system. The implementation increases user access security and automation of internal controls in certain of IEnova’s business processes, including accounting, back office and financial reporting, which we consider to be material to the Company. Management has taken steps to help ensure that controls were appropriately designed and implemented in connection with the integration of and transition to the new ERP system. In the second quarter of 2021, IEnova has continued to review and enhance the design and related documentation of its internal control over financial reporting in connection with its implementation of the new ERP system in order to maintain an effective control framework.
Page | 14
Related Documents