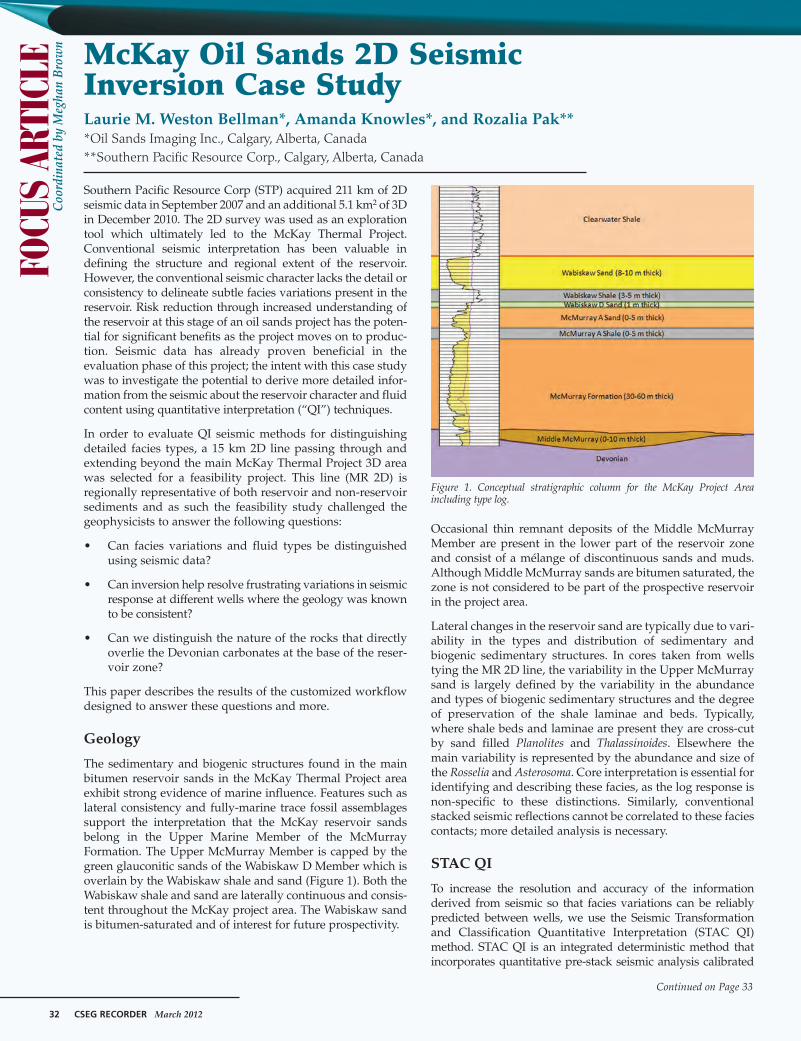
McKay Oil Sands 2D Seismic Inversion Case Study Laurie M. Weston Bellman*, Amanda Knowles*, and Rozalia Pak** *Oil Sands Imaging Inc., Calgary, Alberta, Canada **Southern Pacific Resource Corp., Calgary, Alberta, Canada Southern Pacific Resource Corp (STP) acquired 211 km of 2D seismic data in September 2007 and an additional 5.1 km 2 of 3D in December 2010. The 2D survey was used as an exploration tool which ultimately led to the McKay Thermal Project. Conventional seismic interpretation has been valuable in defining the structure and regional extent of the reservoir. However, the conventional seismic character lacks the detail or consistency to delineate subtle facies variations present in the reservoir. Risk reduction through increased understanding of the reservoir at this stage of an oil sands project has the poten- tial for significant benefits as the project moves on to produc- tion. Seismic data has already proven beneficial in the evaluation phase of this project; the intent with this case study was to investigate the potential to derive more detailed infor- mation from the seismic about the reservoir character and fluid content using quantitative interpretation (“QI”) techniques. In order to evaluate QI seismic methods for distinguishing detailed facies types, a 15 km 2D line passing through and extending beyond the main McKay Thermal Project 3D area was selected for a feasibility project. This line (MR 2D) is regionally representative of both reservoir and non-reservoir sediments and as such the feasibility study challenged the geophysicists to answer the following questions: • Can facies variations and fluid types be distinguished using seismic data? • Can inversion help resolve frustrating variations in seismic response at different wells where the geology was known to be consistent? • Can we distinguish the nature of the rocks that directly overlie the Devonian carbonates at the base of the reser- voir zone? This paper describes the results of the customized workflow designed to answer these questions and more. Geology The sedimentary and biogenic structures found in the main bitumen reservoir sands in the McKay Thermal Project area exhibit strong evidence of marine influence. Features such as lateral consistency and fully-marine trace fossil assemblages support the interpretation that the McKay reservoir sands belong in the Upper Marine Member of the McMurray Formation. The Upper McMurray Member is capped by the green glauconitic sands of the Wabiskaw D Member which is overlain by the Wabiskaw shale and sand (Figure 1). Both the Wabiskaw shale and sand are laterally continuous and consis- tent throughout the McKay project area. The Wabiskaw sand is bitumen-saturated and of interest for future prospectivity. Occasional thin remnant deposits of the Middle McMurray Member are present in the lower part of the reservoir zone and consist of a mélange of discontinuous sands and muds. Although Middle McMurray sands are bitumen saturated, the zone is not considered to be part of the prospective reservoir in the project area. Lateral changes in the reservoir sand are typically due to vari- ability in the types and distribution of sedimentary and biogenic sedimentary structures. In cores taken from wells tying the MR 2D line, the variability in the Upper McMurray sand is largely defined by the variability in the abundance and types of biogenic sedimentary structures and the degree of preservation of the shale laminae and beds. Typically, where shale beds and laminae are present they are cross-cut by sand filled Planolites and Thalassinoides. Elsewhere the main variability is represented by the abundance and size of the Rosselia and Asterosoma. Core interpretation is essential for identifying and describing these facies, as the log response is non-specific to these distinctions. Similarly, conventional stacked seismic reflections cannot be correlated to these facies contacts; more detailed analysis is necessary. STAC QI To increase the resolution and accuracy of the information derived from seismic so that facies variations can be reliably predicted between wells, we use the Seismic Transformation and Classification Quantitative Interpretation (STAC QI) method. STAC QI is an integrated deterministic method that incorporates quantitative pre-stack seismic analysis calibrated 32 CSEG RECORDER March 2012 Continued on Page 33 Coordinated by Meghan Brown FOCUS ARTICLE Figure 1. Conceptual stratigraphic column for the McKay Project Area including type log.

Welcome message from author
This document is posted to help you gain knowledge. Please leave a comment to let me know what you think about it! Share it to your friends and learn new things together.
Transcript
McKay Oil Sands 2D Seismic Inversion Case StudyLaurie M. Weston Bellman*, Amanda Knowles*, and Rozalia Pak***Oil Sands Imaging Inc., Calgary, Alberta, Canada**Southern Pacific Resource Corp., Calgary, Alberta, Canada
Southern Pacific Resource Corp (STP) acquired 211 km of 2Dseismic data in September 2007 and an additional 5.1 km2 of 3Din December 2010. The 2D survey was used as an explorationtool which ultimately led to the McKay Thermal Project.Conventional seismic interpretation has been valuable indefining the structure and regional extent of the reservoir.However, the conventional seismic character lacks the detail orconsistency to delineate subtle facies variations present in thereservoir. Risk reduction through increased understanding ofthe reservoir at this stage of an oil sands project has the poten-tial for significant benefits as the project moves on to produc-tion. Seismic data has already proven beneficial in theevaluation phase of this project; the intent with this case studywas to investigate the potential to derive more detailed infor-mation from the seismic about the reservoir character and fluidcontent using quantitative interpretation (“QI”) techniques.
In order to evaluate QI seismic methods for distinguishingdetailed facies types, a 15 km 2D line passing through andextending beyond the main McKay Thermal Project 3D areawas selected for a feasibility project. This line (MR 2D) isregionally representative of both reservoir and non-reservoirsediments and as such the feasibility study challenged thegeophysicists to answer the following questions:
• Can facies variations and fluid types be distinguishedusing seismic data?
• Can inversion help resolve frustrating variations in seismicresponse at different wells where the geology was knownto be consistent?
• Can we distinguish the nature of the rocks that directlyoverlie the Devonian carbonates at the base of the reser-voir zone?
This paper describes the results of the customized workflowdesigned to answer these questions and more.
Geology
The sedimentary and biogenic structures found in the mainbitumen reservoir sands in the McKay Thermal Project areaexhibit strong evidence of marine influence. Features such aslateral consistency and fully-marine trace fossil assemblagessupport the interpretation that the McKay reservoir sandsbelong in the Upper Marine Member of the McMurrayFormation. The Upper McMurray Member is capped by thegreen glauconitic sands of the Wabiskaw D Member which isoverlain by the Wabiskaw shale and sand (Figure 1). Both theWabiskaw shale and sand are laterally continuous and consis-tent throughout the McKay project area. The Wabiskaw sandis bitumen-saturated and of interest for future prospectivity.
Occasional thin remnant deposits of the Middle McMurrayMember are present in the lower part of the reservoir zoneand consist of a mélange of discontinuous sands and muds.Although Middle McMurray sands are bitumen saturated, thezone is not considered to be part of the prospective reservoirin the project area.
Lateral changes in the reservoir sand are typically due to vari-ability in the types and distribution of sedimentary andbiogenic sedimentary structures. In cores taken from wellstying the MR 2D line, the variability in the Upper McMurraysand is largely defined by the variability in the abundanceand types of biogenic sedimentary structures and the degreeof preservation of the shale laminae and beds. Typically,where shale beds and laminae are present they are cross-cutby sand filled Planolites and Thalassinoides. Elsewhere themain variability is represented by the abundance and size ofthe Rosselia and Asterosoma. Core interpretation is essential foridentifying and describing these facies, as the log response isnon-specific to these distinctions. Similarly, conventionalstacked seismic reflections cannot be correlated to these faciescontacts; more detailed analysis is necessary.
STAC QI
To increase the resolution and accuracy of the informationderived from seismic so that facies variations can be reliablypredicted between wells, we use the Seismic Transformationand Classification Quantitative Interpretation (STAC QI)method. STAC QI is an integrated deterministic method thatincorporates quantitative pre-stack seismic analysis calibrated
32 CSEG RECORDER March 2012
Continued on Page 33
Coo
rdin
ated
by
Meg
han
Bro
wn
FOCU
S AR
TICL
E
Figure 1. Conceptual stratigraphic column for the McKay Project Areaincluding type log.
March 2012 CSEG RECORDER 33
to well control to predict lithology and fluid content away from thewell bore. It is systematic and grounded in the reality of the rocks.
More generally, quantitative interpretation combines rockphysics, empirical geological parameters, petrophysical informa-tion, and geophysical inversion techniques to predict reservoircharacter from seismically derived attributes. From the end-userpoint of view (interpreter, geologist, engineer, investor) this canlead to a bewildering maze of confusing geophysical products.We address this bewilderment with a systematic, common-senseattribute classification method based on real geology. Such anintegrated method leads to more powerful results than can beobserved from any single technique and contributes directly togeological understanding. Before starting the serious analysishowever, we need to have confidence in our input data in orderto have confidence in our output.
Data Integrity and Quality Control
Without a doubt, one of the most important steps of the quanti-tative interpretation process is the affirmation of quality data atthe onset of the project. This is not a trivial exercise and encom-passes everything from seismic processing QC to log data vali-dation to confirmation of geological preconceptions. This casestudy illustrates the importance of being ruthless with data (aftera fair and thorough assessment of quality) and eliminating, or atleast flagging, untrustworthy data in order to achieve superiorresults. At the same time, we need to work with what we have.This may sound contradictory, but the entire process is non-linear – some might say circular – and requires informed inter-pretive judgment throughout.
Log data can be particularly complicated. The general belief isthat logs represent the truth because they come from the well.However quantitative analysis requires faith in the numbers andnumbers can vary depending on normalization, calibration,depth inconsistency, processing and geology. Aside fromgeology, uncertainty in anything else on this list confuses theanalysis, jeopardizes the validity of the outcome, and thereforemust be either remedied or eliminated.
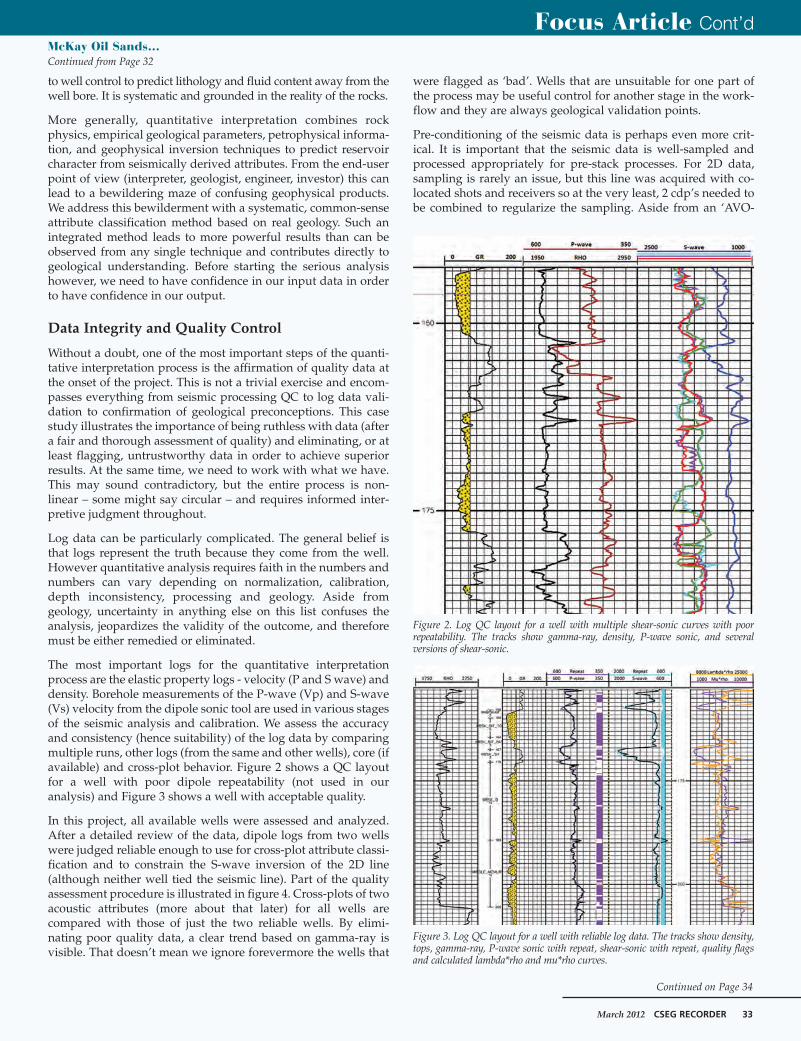
The most important logs for the quantitative interpretationprocess are the elastic property logs - velocity (P and S wave) anddensity. Borehole measurements of the P-wave (Vp) and S-wave(Vs) velocity from the dipole sonic tool are used in various stagesof the seismic analysis and calibration. We assess the accuracyand consistency (hence suitability) of the log data by comparingmultiple runs, other logs (from the same and other wells), core (ifavailable) and cross-plot behavior. Figure 2 shows a QC layoutfor a well with poor dipole repeatability (not used in ouranalysis) and Figure 3 shows a well with acceptable quality.
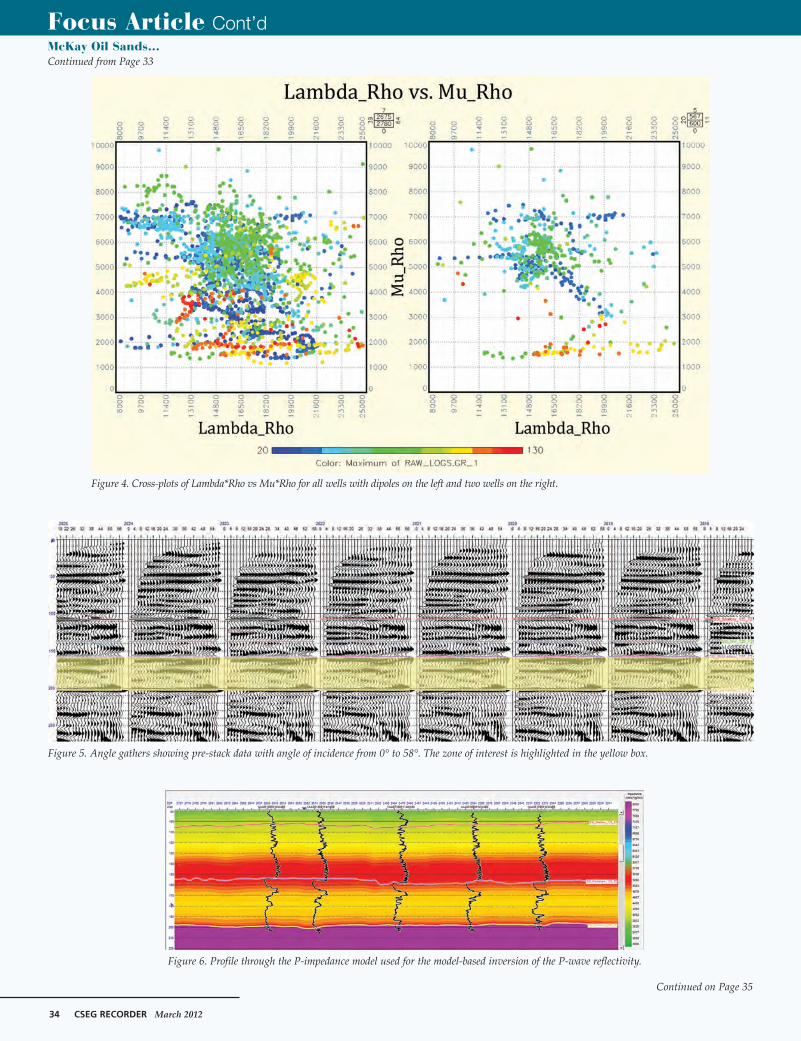
In this project, all available wells were assessed and analyzed.After a detailed review of the data, dipole logs from two wellswere judged reliable enough to use for cross-plot attribute classi-fication and to constrain the S-wave inversion of the 2D line(although neither well tied the seismic line). Part of the qualityassessment procedure is illustrated in figure 4. Cross-plots of twoacoustic attributes (more about that later) for all wells arecompared with those of just the two reliable wells. By elimi-nating poor quality data, a clear trend based on gamma-ray isvisible. That doesn’t mean we ignore forevermore the wells that
were flagged as ‘bad’. Wells that are unsuitable for one part ofthe process may be useful control for another stage in the work-flow and they are always geological validation points.
Pre-conditioning of the seismic data is perhaps even more crit-ical. It is important that the seismic data is well-sampled andprocessed appropriately for pre-stack processes. For 2D data,sampling is rarely an issue, but this line was acquired with co-located shots and receivers so at the very least, 2 cdp’s needed tobe combined to regularize the sampling. Aside from an ‘AVO-
Focus Article Cont’dMcKay Oil Sands…Continued from Page 32
Continued on Page 34
Figure 3. Log QC layout for a well with reliable log data. The tracks show density,tops, gamma-ray, P-wave sonic with repeat, shear-sonic with repeat, quality flagsand calculated lambda*rho and mu*rho curves.
Figure 2. Log QC layout for a well with multiple shear-sonic curves with poorrepeatability. The tracks show gamma-ray, density, P-wave sonic, and severalversions of shear-sonic.
34 CSEG RECORDER March 2012
Focus Article Cont’dMcKay Oil Sands…Continued from Page 33
Continued on Page 35
Figure 5. Angle gathers showing pre-stack data with angle of incidence from 0° to 58°. The zone of interest is highlighted in the yellow box.
Figure 4. Cross-plots of Lambda*Rho vs Mu*Rho for all wells with dipoles on the left and two wells on the right.
Figure 6. Profile through the P-impedance model used for the model-based inversion of the P-wave reflectivity.
March 2012 CSEG RECORDER 35
compliant processing flow, the basicssuch as NMO correction, static correc-tions, scaling, and migration needcareful attention. Noise is almost alwaysan issue on pre-stack data and shows upin various ways such as random, linear,multiples, side-swipe and converted-wave energy. This 2D line was reason-ably clean and required only a fewmodifications to the conventionalprocessing flow to preserve relativeamplitudes for AVO compliance,followed by a pre-stack time migrationand random noise reduction. A nearbyVSP was useful in determining thecorrect phase (-72°) and time shiftrequired of the seismic.
AVO
Amplitude vs Offset (AVO) analysisseparates the measured pre-stackreflected amplitude into componentsrepresenting P-wave, S-wave and some-times density. The first practical step inthe AVO process is to convert the pre-stack input data from offset domain toincident angle domain which requiresan estimate of the Vp/Vs background(non-hydrocarbon) relationship and a P-wave velocity model. The velocitymodel is derived from P-wave soniclogs at well locations converted fromdepth to time and related to the inter-preted seismic horizons. The Vp/Vstrend is normally determined from highquality well data, but in this case, a two-well sample was not considered suffi-cient to determine a locally-specificVp/Vs trend. Based on experience, atrend was established that was guidedby a regional oil-sands relationship. Anexample of the resulting angle gathers isshown in Figure 5. Derived incidentangle is annotated at the top, rangingfrom 0° to 58°.
Inversion
The output volumes from AVO repre-sent P-waves, S-waves and densityhowever they still relate only to relativeimpedance contrasts at layer bound-aries – reflectivities. Changing reflectiv-ities to rock layer properties requiresconversion from the observed relativemeasurements to absolute values. Theinversion method used to accomplishthis for the McKay project was themodel-based method (Hampson andRussell, 1990). In this approach, an
Focus Article Cont’dMcKay Oil Sands…Continued from Page 34
Continued on Page 36
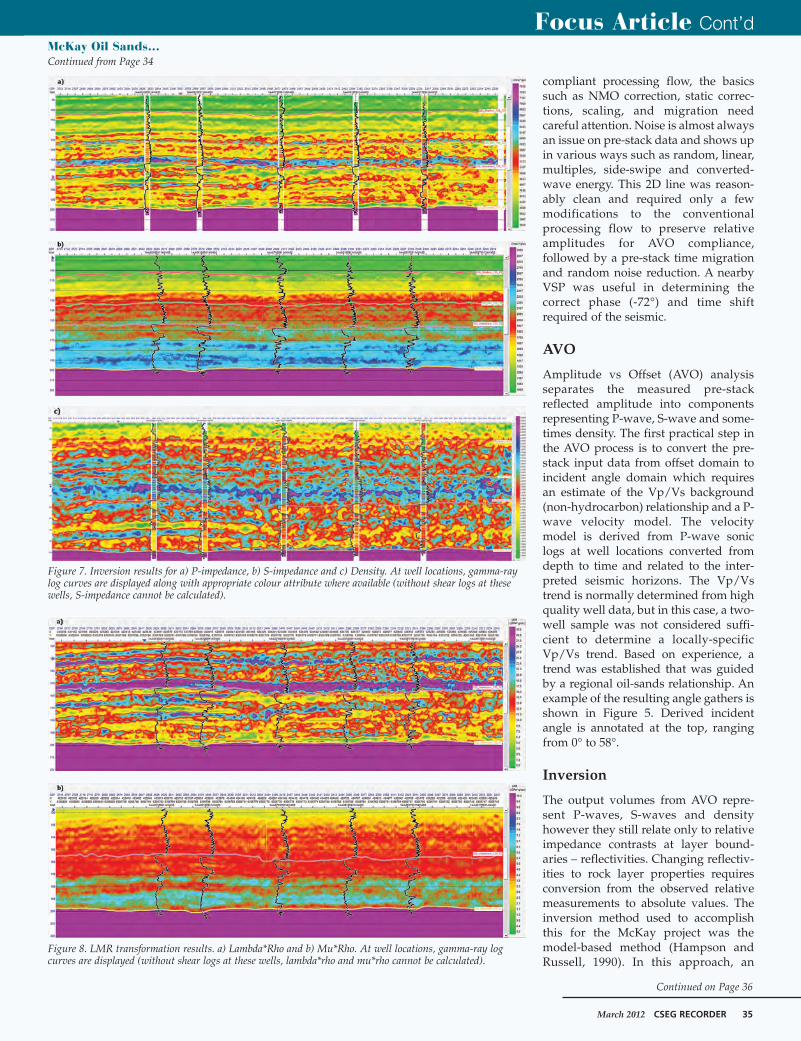
Figure 8. LMR transformation results. a) Lambda*Rho and b) Mu*Rho. At well locations, gamma-ray logcurves are displayed (without shear logs at these wells, lambda*rho and mu*rho cannot be calculated).
Figure 7. Inversion results for a) P-impedance, b) S-impedance and c) Density. At well locations, gamma-raylog curves are displayed along with appropriate colour attribute where available (without shear logs at thesewells, S-impedance cannot be calculated).
36 CSEG RECORDER March 2012
initial smooth impedance model is derived from the well dataand interpreted seismic horizons. The model constrains theacceptable absolute impedance range as well as supplying a lowfrequency trend from well logs that is lacking in seismic data.The number of wells and quality of log data incorporated at this
stage has a significant effect on the accuracy and usefulness ofthe outcome. How many of the wells do we use in an inversionmodel? As Einstein said (or may have said with respect toseismic inversion): ‘Make your model as simple as possible butno simpler’. Figure 6 shows our P-impedance model for this 2Dline. Figure 7 shows the inversion results for P-impedance, S-impedance and density.
The P-impedance (Ip) and S-impedance (Is) volumes can betransformed into additional rock property volumes: Lambda*rho(incompressibility) and Mu*rho (shear rigidity) (Goodway et al.,1997) using the following equations:
µρ = Is2
λρ = Ip2 – 2Is2
The results of the transformation are shown in Figure 8.
This is all very interesting so far, but what does it mean?
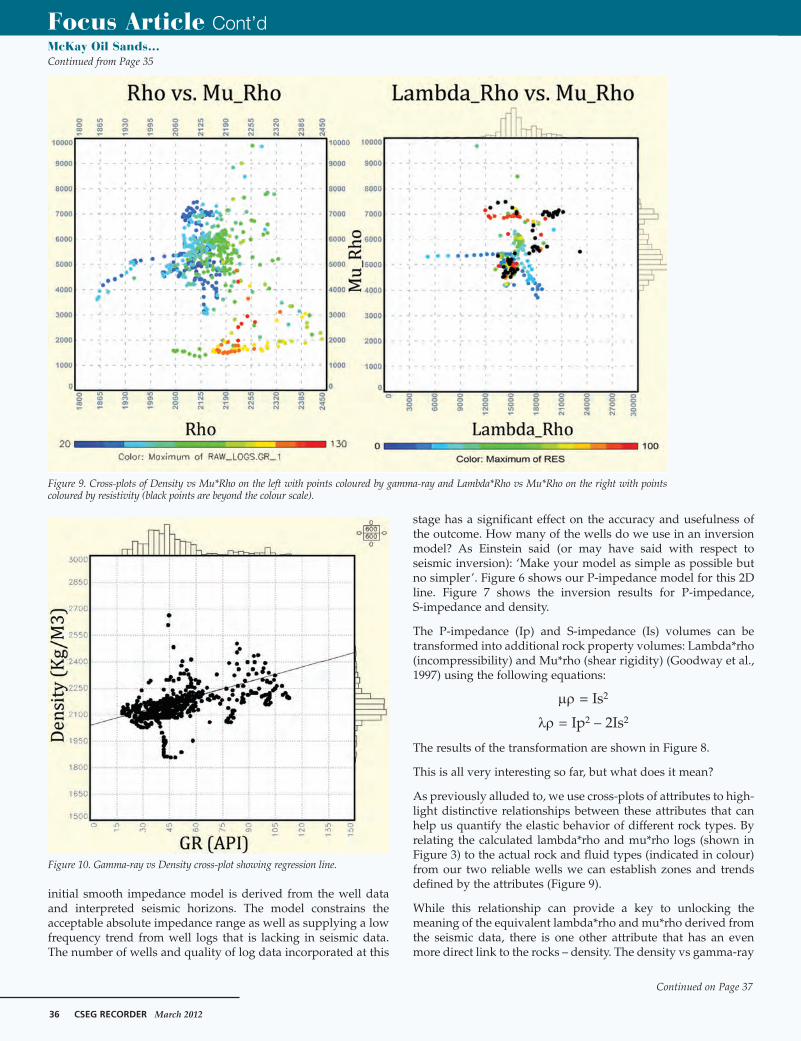
As previously alluded to, we use cross-plots of attributes to high-light distinctive relationships between these attributes that canhelp us quantify the elastic behavior of different rock types. Byrelating the calculated lambda*rho and mu*rho logs (shown inFigure 3) to the actual rock and fluid types (indicated in colour)from our two reliable wells we can establish zones and trendsdefined by the attributes (Figure 9).
While this relationship can provide a key to unlocking themeaning of the equivalent lambda*rho and mu*rho derived fromthe seismic data, there is one other attribute that has an evenmore direct link to the rocks – density. The density vs gamma-ray
Focus Article Cont’dMcKay Oil Sands…Continued from Page 35
Continued on Page 37
Figure 10. Gamma-ray vs Density cross-plot showing regression line.
Figure 9. Cross-plots of Density vs Mu*Rho on the left with points coloured by gamma-ray and Lambda*Rho vs Mu*Rho on the right with pointscoloured by resistivity (black points are beyond the colour scale).

March 2012 CSEG RECORDER 37
plot shown in Figure 10 indicates the strong correlation betweenthe gamma-ray indicator and the density log.
Given this link, it is definitely worth some effort to estimatedensity from seismic data. The density volume created byinverting an AVO estimate of density reflectivity (shown inFigure 7c) is quite noisy and uncertain (typical for this method)but appears to contain some indication of real density. We canbuild on that by combining it with other seismic attributes in astatistical multi-attribute analysis (Russell, et al., 1997).
Multi-attribute analysis is another form of inversion. It is atargeted process specific to a geological zone within which aparticular seismic response can reasonably be expected to
consistently correspond to a commongeological parameter. In this analysis,the 10 wells tying the seismic data areused to statistically determine a trans-formation of a number of seismically-derived attributes to reproduce aknown density log at each well loca-tion. Figure 11 shows the ‘training’ dataor external seismic attributes input tothe process. A ranking of the attributesbased on their effectiveness at reducingthe error between the real log and theestimated log is created. A function
incorporating the top-ranked attributes is then used to trans-form every trace location in the volume to a pseudo-density log(Figure 12).
Classification
To summarize the process so far: we have rigorously investi-gated the data for integrity and suitability. We have createdattributes from seismic data as accurately as possible (calibratedby comparison with existing wells and informed judgment). Andwe’ve determined what those attributes mean by relating themto the rock types encountered in the wells. The next step in the
Focus Article Cont’dMcKay Oil Sands…Continued from Page 36
Continued on Page 38
Figure 11. Target density log for a well shown in red with corresponding traces from input seismic volumes.The horizontal red boundaries indicate the training zone.
38 CSEG RECORDER March 2012
Focus Article Cont’dMcKay Oil Sands…Continued from Page 37
Continued on Page 39
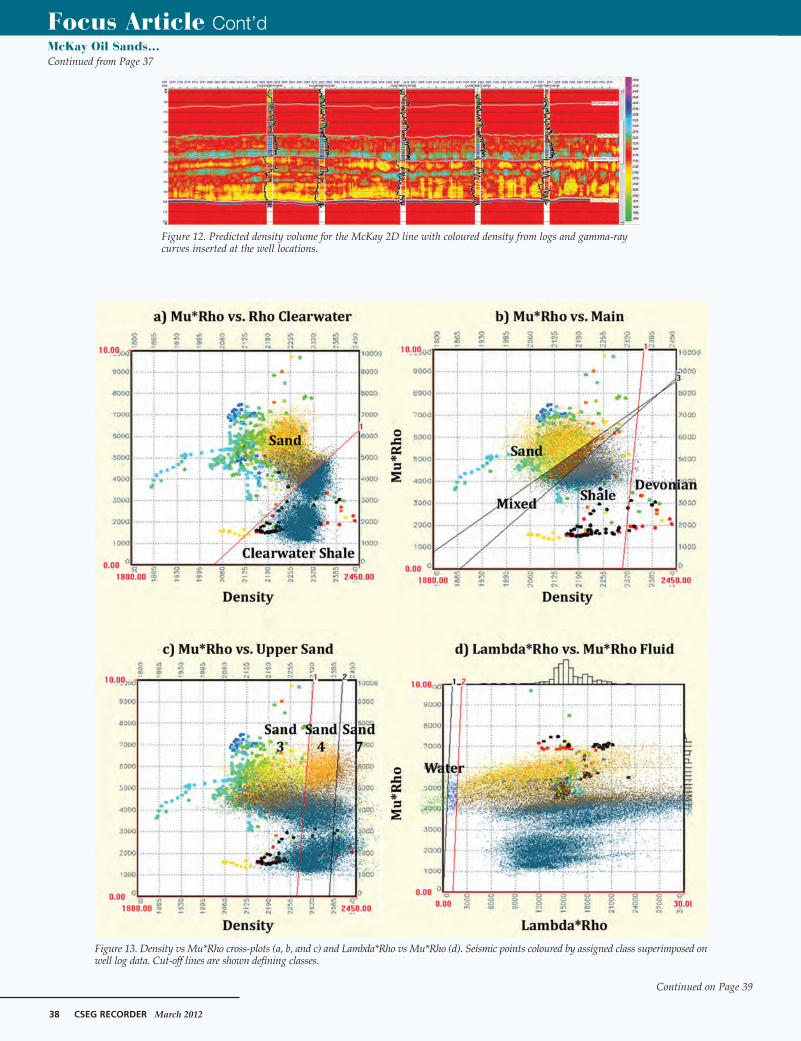
Figure 13. Density vs Mu*Rho cross-plots (a, b, and c) and Lambda*Rho vs Mu*Rho (d). Seismic points coloured by assigned class superimposed onwell log data. Cut-off lines are shown defining classes.
Figure 12. Predicted density volume for the McKay 2D line with coloured density from logs and gamma-raycurves inserted at the well locations.
March 2012 CSEG RECORDER 39
process is to translate this information into spatial classificationin the seismic volume.
We achieve this interactively by overlaying the seismic attributepoints on the well-data cross-plots and assigning facies and fluidclasses to seismic samples based on attribute cut-offs. Figure 13shows the steps in this process. Sand and shale can be effectivelyseparated using the density and mu*rho attributes as shown inFigure 13a which distinguishes the Clearwater shale from allother types of rock. Cross-plot (b) distinguishes the Devonian(purple) and a more detailed Wabiskaw/McMurray classificationof interbedded shale (grey), mixed sand/shale facies (brown) andsand (yellow). Cross-plot (c) further distinguishes the sand intothree different types which can be related to core (shown later).
Well analysis for fluid-related attributes resulted in some encour-agement that bitumen zones and low-saturation zones could beseparated using the lambda*rho vs mu*rho cross-plots (shown inFigure 9). However there is insufficient representative data tohave confidence in the relationship, so a regional theoreticalapproximation based on prior experience was applied to repre-sent the fluid estimation. The fluid cut-offs are shown on cross-plot (13d) and distinguish the depleted (or wet) zones (blue) andpotential gas zones (green) from bitumen-saturated sand alreadyclassified (orange, yellow and brown).
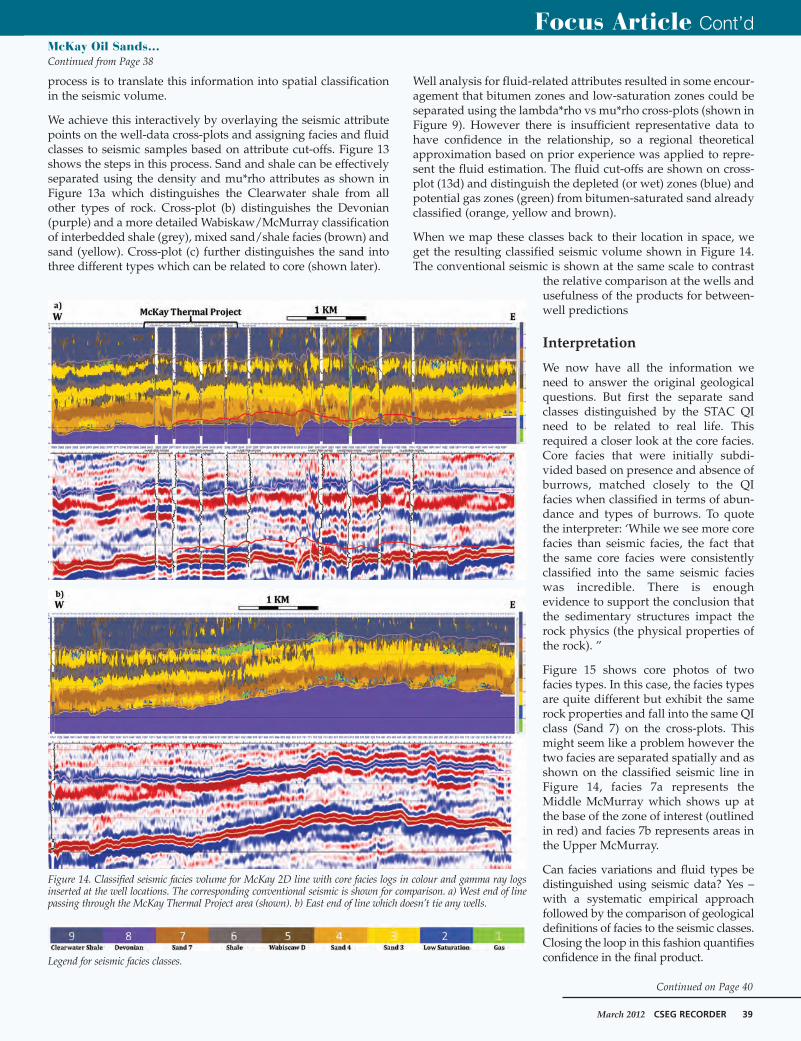
When we map these classes back to their location in space, weget the resulting classified seismic volume shown in Figure 14.The conventional seismic is shown at the same scale to contrast
the relative comparison at the wells andusefulness of the products for between-well predictions
Interpretation
We now have all the information weneed to answer the original geologicalquestions. But first the separate sandclasses distinguished by the STAC QIneed to be related to real life. Thisrequired a closer look at the core facies.Core facies that were initially subdi-vided based on presence and absence ofburrows, matched closely to the QIfacies when classified in terms of abun-dance and types of burrows. To quotethe interpreter: ‘While we see more corefacies than seismic facies, the fact thatthe same core facies were consistentlyclassified into the same seismic facieswas incredible. There is enoughevidence to support the conclusion thatthe sedimentary structures impact therock physics (the physical properties ofthe rock). ”
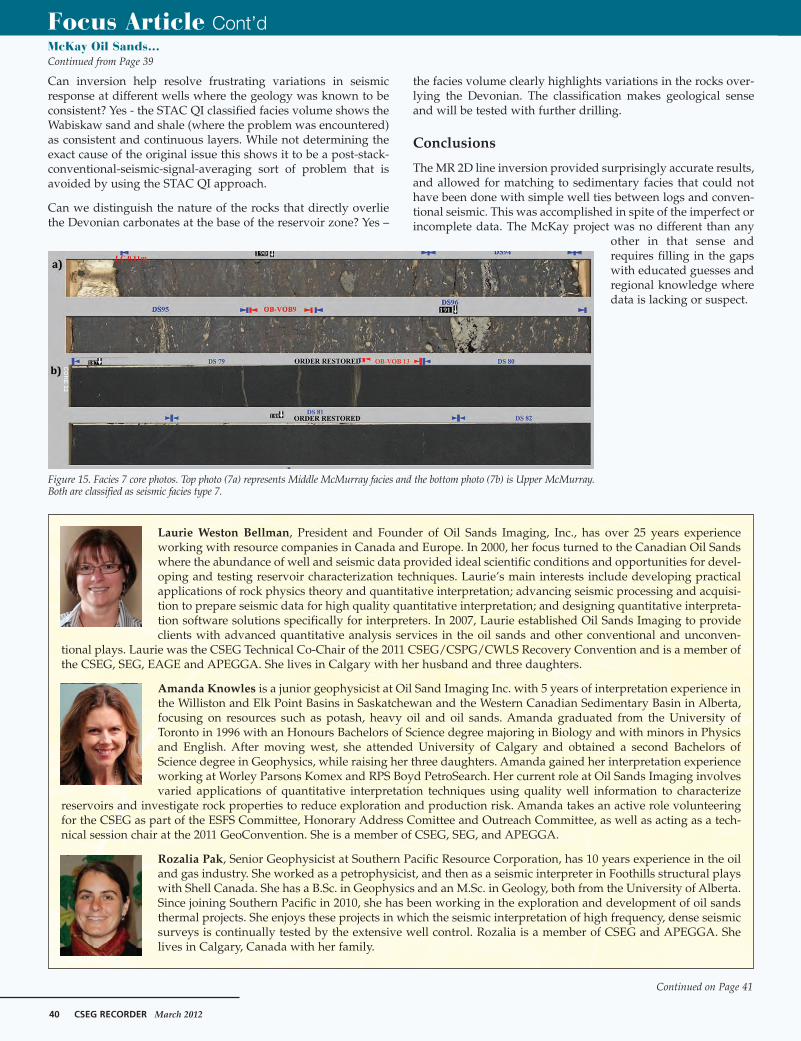
Figure 15 shows core photos of twofacies types. In this case, the facies typesare quite different but exhibit the samerock properties and fall into the same QIclass (Sand 7) on the cross-plots. Thismight seem like a problem however thetwo facies are separated spatially and asshown on the classified seismic line inFigure 14, facies 7a represents theMiddle McMurray which shows up atthe base of the zone of interest (outlinedin red) and facies 7b represents areas inthe Upper McMurray.
Can facies variations and fluid types bedistinguished using seismic data? Yes –with a systematic empirical approachfollowed by the comparison of geologicaldefinitions of facies to the seismic classes.Closing the loop in this fashion quantifiesconfidence in the final product.
Focus Article Cont’dMcKay Oil Sands…Continued from Page 38
Continued on Page 40
Figure 14. Classified seismic facies volume for McKay 2D line with core facies logs in colour and gamma ray logsinserted at the well locations. The corresponding conventional seismic is shown for comparison. a) West end of linepassing through the McKay Thermal Project area (shown). b) East end of line which doesn’t tie any wells.
Legend for seismic facies classes.
40 CSEG RECORDER March 2012
Can inversion help resolve frustrating variations in seismicresponse at different wells where the geology was known to beconsistent? Yes - the STAC QI classified facies volume shows theWabiskaw sand and shale (where the problem was encountered)as consistent and continuous layers. While not determining theexact cause of the original issue this shows it to be a post-stack-conventional-seismic-signal-averaging sort of problem that isavoided by using the STAC QI approach.
Can we distinguish the nature of the rocks that directly overliethe Devonian carbonates at the base of the reservoir zone? Yes –
the facies volume clearly highlights variations in the rocks over-lying the Devonian. The classification makes geological senseand will be tested with further drilling.
Conclusions
The MR 2D line inversion provided surprisingly accurate results,and allowed for matching to sedimentary facies that could nothave been done with simple well ties between logs and conven-tional seismic. This was accomplished in spite of the imperfect orincomplete data. The McKay project was no different than any
other in that sense andrequires filling in the gapswith educated guesses andregional knowledge wheredata is lacking or suspect.
Focus Article Cont’dMcKay Oil Sands…Continued from Page 39
Continued on Page 41
Laurie Weston Bellman, President and Founder of Oil Sands Imaging, Inc., has over 25 years experienceworking with resource companies in Canada and Europe. In 2000, her focus turned to the Canadian Oil Sandswhere the abundance of well and seismic data provided ideal scientific conditions and opportunities for devel-oping and testing reservoir characterization techniques. Laurie’s main interests include developing practicalapplications of rock physics theory and quantitative interpretation; advancing seismic processing and acquisi-tion to prepare seismic data for high quality quantitative interpretation; and designing quantitative interpreta-tion software solutions specifically for interpreters. In 2007, Laurie established Oil Sands Imaging to provideclients with advanced quantitative analysis services in the oil sands and other conventional and unconven-
tional plays. Laurie was the CSEG Technical Co-Chair of the 2011 CSEG/CSPG/CWLS Recovery Convention and is a member ofthe CSEG, SEG, EAGE and APEGGA. She lives in Calgary with her husband and three daughters.
Amanda Knowles is a junior geophysicist at Oil Sand Imaging Inc. with 5 years of interpretation experience inthe Williston and Elk Point Basins in Saskatchewan and the Western Canadian Sedimentary Basin in Alberta,focusing on resources such as potash, heavy oil and oil sands. Amanda graduated from the University ofToronto in 1996 with an Honours Bachelors of Science degree majoring in Biology and with minors in Physicsand English. After moving west, she attended University of Calgary and obtained a second Bachelors ofScience degree in Geophysics, while raising her three daughters. Amanda gained her interpretation experienceworking at Worley Parsons Komex and RPS Boyd PetroSearch. Her current role at Oil Sands Imaging involvesvaried applications of quantitative interpretation techniques using quality well information to characterize
reservoirs and investigate rock properties to reduce exploration and production risk. Amanda takes an active role volunteeringfor the CSEG as part of the ESFS Committee, Honorary Address Comittee and Outreach Committee, as well as acting as a tech-nical session chair at the 2011 GeoConvention. She is a member of CSEG, SEG, and APEGGA.
Rozalia Pak, Senior Geophysicist at Southern Pacific Resource Corporation, has 10 years experience in the oiland gas industry. She worked as a petrophysicist, and then as a seismic interpreter in Foothills structural playswith Shell Canada. She has a B.Sc. in Geophysics and an M.Sc. in Geology, both from the University of Alberta.Since joining Southern Pacific in 2010, she has been working in the exploration and development of oil sandsthermal projects. She enjoys these projects in which the seismic interpretation of high frequency, dense seismicsurveys is continually tested by the extensive well control. Rozalia is a member of CSEG and APEGGA. Shelives in Calgary, Canada with her family.
Figure 15. Facies 7 core photos. Top photo (7a) represents Middle McMurray facies and the bottom photo (7b) is Upper McMurray.Both are classified as seismic facies type 7.

March 2012 CSEG RECORDER 41
The STAC QI approach is not directedto answer specific geological questionsin an isolated way. The process ofdiscovering the geological ‘truth’ issystematic, integrated, and determin-istic. The interpretation is done in theclassification where questions can beaddressed and sensitivities tested. Theprocess is most effective when thegeoscientists ‘close the loop’ by recon-ciling the apriori geological interpreta-tion with the empirical evidence fromthe seismic QI.
This project was a feasibility study thatdemonstrated the effectiveness of theprocess and exceeded the initial expec-tations. Given the considerable cost ofhorizontal well pairs for steam injectionand production in the oil sands theSTAC QI results provide significantinput into the geological understandingof the reservoir away from the existingwells. Investment in detailed reservoirunderstanding at this early stage of adevelopment can provide the informa-tion required for informed and respon-sible ongoing reservoir managementand monitoring. R
Acknowledgements
The authors would like to thankSouthern Pacific Resource Corp. forgenerous permission to publish theseresults. We would also like to acknowl-edge the specific contributions ofRegan Kennedy at Earth SignalProcessing Ltd., Chad Harris atSouthern Pacific Resources Corp. andNeil Praught at Oil Sands Imaging Inc.
ReferencesGoodway, W., Chen, T., and Downton, J., 1997,Improved AVO fluid detection and lithology discrimi-nation using Lame petrophysical parameters;“Lambda*rho”, “mu*rho” and “lambda/mu fluidstack”, from P and S inversions: 1997, 67th AnnualInternational Meeting., SEG Expanded Abstracts,p183-186.
Russell, B., Hampson, D., Schuelke, J., and Quirein,J., [1997], Multi-attribute Seismic Analysis, TheLeading Edge, October, 1997, 1439.
Focus Article Cont’dMcKay Oil Sands…Continued from Page 40
Related Documents