McGraw-Hill/Irwin Introduction to QuickBooks Pro, 2004 © 2005 The McGraw-Hill Companies, Inc., All Rights Reserved. Chapter 5 Reports and Graphs

McGraw-Hill/Irwin Introduction to QuickBooks Pro, 2004 © 2005 The McGraw-Hill Companies, Inc., All Rights Reserved. Chapter 5 Reports and Graphs.
Dec 23, 2015
Welcome message from author
This document is posted to help you gain knowledge. Please leave a comment to let me know what you think about it! Share it to your friends and learn new things together.
Transcript

McGraw-Hill/IrwinIntroduction to QuickBooks Pro, 2004
© 2005 The McGraw-Hill Companies, Inc., All Rights Reserved.
Chapter 5
Reports and Graphs
Chapter
5
Textbook page
ref.
2
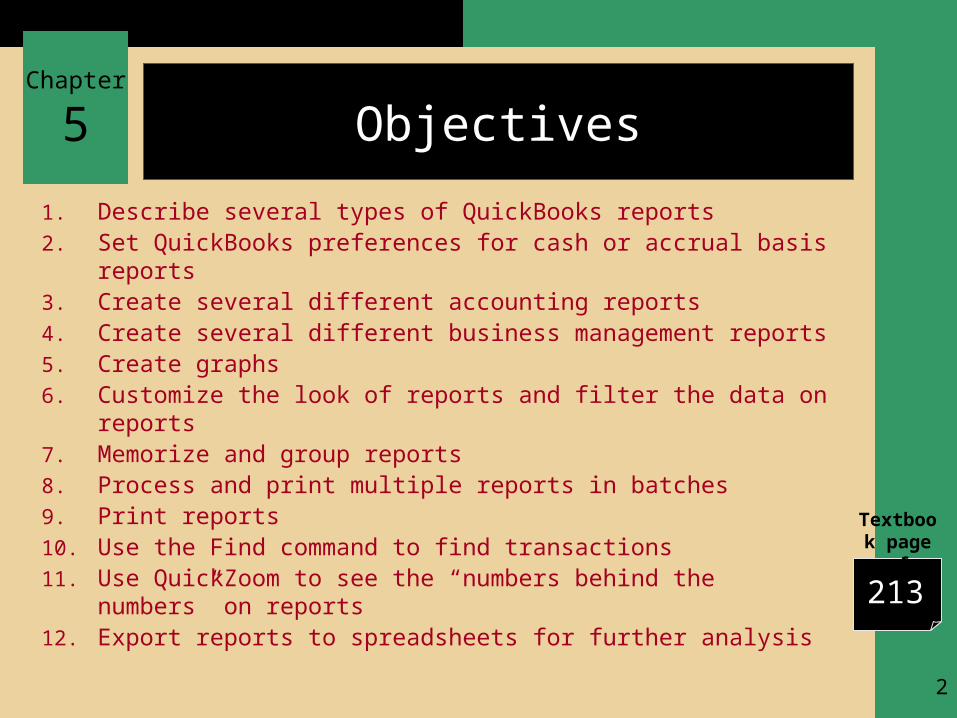
Objectives
1. Describe several types of QuickBooks reports2. Set QuickBooks preferences for cash or accrual basis reports3. Create several different accounting reports4. Create several different business management reports5. Create graphs6. Customize the look of reports and filter the data on reports7. Memorize and group reports8. Process and print multiple reports in batches9. Print reports10. Use the Find command to find transactions11. Use QuickZoom to see the “numbers behind the numbers” on
reports12. Export reports to spreadsheets for further analysis
213

Chapter
5
3
Objective
1. Describe several types of QuickBooks reports

Chapter
5
Textbook page
ref.
4
Types of Reports
1. There are two major types of reports in QuickBooks2. Accounting Reports
These reports contain information about transactions and accounts
Example: The Profit & Loss report is a summary report of all transactions coded to income and expense accounts for a specified period of time
3. Business Management Reports These reports are used to monitor different activities of a
business to help plan workflow and review transactions that have already occurred
These reports provide critical information that you need to operate your business
Example: the Customer Contact List report shows addresses, phone numbers, fax numbers, and other information about Customers
214

Chapter
5
5
Objective
2. Set QuickBooks preferences for cash or accrual basis reports
Chapter
5
Textbook page
ref.
6
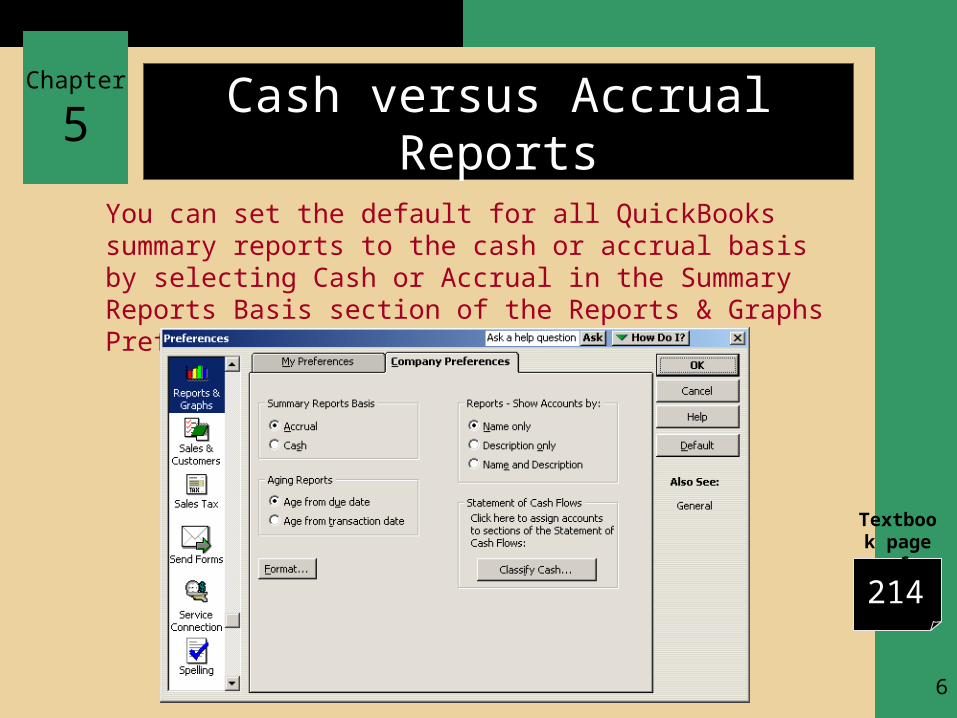
Cash versus Accrual Reports
You can set the default for all QuickBooks summary reports to the cash or accrual basis by selecting Cash or Accrual in the Summary Reports Basis section of the Reports & Graphs Preferences window
214

Chapter
5
7
Objective
3. Create several different accounting reports

Chapter
5
Textbook page
ref.
8
Accounting Reports
1. Profit & Loss 2. Profit & Loss by Class Report 3. Profit & Loss by Job Report 4. Balance Sheet 5. Statement of Cash Flows 6. General Ledger 7. Trial Balance
216

Chapter
5
Textbook page
ref.
9
Analyzing the Profit & Loss Report
1. The first section of the report shows the total of each of your income accounts
2. The next section of the report shows your Cost of Goods Sold accounts which is the costs of the products you sell in your business
3. At the bottom of the report, QuickBooks calculates your Net Income – the amount of your revenue less your Cost of Goods Sold and your operating expenses
4. To find the details behind any of these numbers, you can use QuickZoom 217

Chapter
5
10
Objective
4. Create several different business management reports

Chapter
5
Textbook page
ref.
11
Business Management Reports
1. Customer Phone List 2. Vendor Contact List 3. Item Price List 4. Check Detail Report 5. Accounts Receivable and Accounts Payable
Reports Collections Report Customer Balance Detail Report Vendor Balance Detail Report Sales Tax Liability Report
226

Chapter
5
12
Objective
5. Create graphs
Chapter
5
Textbook page
ref.
13
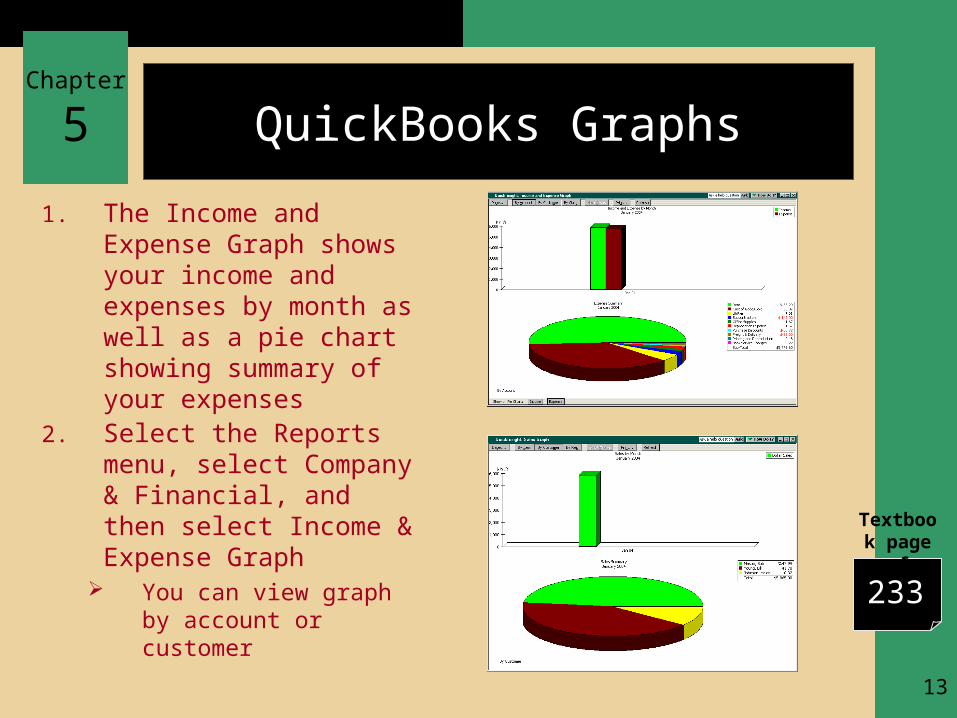
QuickBooks Graphs
1. The Income and Expense Graph shows your income and expenses by month as well as a pie chart showing summary of your expenses
2. Select the Reports menu, select Company & Financial, and then select Income & Expense Graph
You can view graph by account or customer
233
Chapter
5
14
Objective
6. Customize the look of reports and filter the data on reports

Chapter
5
Textbook page
ref.
15
Building Custom Reports
1. To make your reports show only the information you want, use the Modify Report button to add or delete columns and change several other formats of the report
2. Use the Filters tab on the Modify Report window to narrow the contents of reports so that you can analyze specific areas of your business
235

Chapter
5
16
Objective
7. Memorize and group reports

Chapter
5
Textbook page
ref.
17
Memorizing Reports
1. After you’ve modified a report, you can memorize the format and filtering so that you don’t have to perform all of the modification steps the next time you want to view the report
2. Memorizing reports doesn’t memorize the data on the report, only the format, dates, and filtering
3. With your report displayed, click Memorize at the top of the report
241

Chapter
5
18
Objective
8. Process and print multiple reports in batches

Chapter
5
Textbook page
ref.
19
Processing Multiple Reports
1. Report Groups QuickBooks allows you to combine several reports into a group,
so that you can later display and/or print the reports in the group as a batch
2. Processing Multiple Reports QuickBooks allows you to print reports as a batch Select the Reports menu and then select Process Multiple
Reports Select the group from the Select Memorized Reports From drop-
down list If you don’t want to display or print all the reports in the group,
click the checkmark (√) in the left column to remove it Click Display to show the reports on the window or click Print to
print all the reports
243

Chapter
5
20
Objective
9. Print reports

Chapter
5
Textbook page
ref.
21
Printing Reports
1. Every report in QuickBooks is printable2. To print the report, click Print at the top of the
window3. When you print reports, QuickBooks allows you to
specify the orientation (landscape or portrait) and page-count characteristics for the reports
4. When you select Fit report to 1 pages wide option, QuickBooks reduces the font size of the report so the width of all columns does not exceed 8½” (in portrait mode) or 11” (in landscape mode)
244
Chapter
5
22
Objective
10. Use the Find command to find transactions

Chapter
5
Textbook page
ref.
23
Finding Transactions
1. Finding Transactions in Registers If you know that the transaction you’re looking for is in the
Checking account register, display the register and scroll up or down until you find it
2. Using the Find Command you can search by several criteria in order to find the transactions you want
3. There are two tabs on the Find window: Simple and Advanced
4. Simple Use this tab if you want to search for the transaction type,
Customer:Job name, approximate date of the transaction, number of the transaction (e.g., Invoice #), or Amount
5. Advanced If you need to search based on any other criteria (e.g., account
name, Item name, or memo), use the Advanced tab
248

Chapter
5
Textbook page
ref.
24
QuickReports
1. A QuickReport can quickly give you information about a customer, vendor, or Item
2. You can generate QuickReports from account registers, forms, or lists
251
Chapter
5
25
Objective
11. Use QuickZoom to see the “numbers behind the numbers” on reports

Chapter
5
Textbook page
ref.
26
Using QuickZoom
1. QuickBooks provides a convenient feature called QuickZoom, which allows you to see the detail behind numbers on reports
2. When you point to a number on a report, the cursor changes to a magnifying glass with a “z” in the middle, this indicates that you can double-click to see the details behind the number
252

Chapter
5
27
Objective
12. Export reports to spreadsheets for further analysis

Chapter
5
Textbook page
ref.
28
Exporting Reports to Spreadsheets
1. When you need to modify reports in ways that QuickBooks does not allow (e.g., changing the name of a column heading), you will need to export the report to a spreadsheet program
2. Exporting a Report to Microsoft Excel Click Export at the top of the report Select a new Excel workbook to export your report to a new
Excel worksheet Click Export in the Export Report window, QuickBooks will export
your report directly to an Excel spreadsheet 3. Exporting to Other Spreadsheet Programs
Open the report in QuickBooks, click Print In the Print to section of the Print Reports window, click File Select Tab delimited file from the File drop-down list, then click
Print Give the file a name that will be recognized by your spreadsheet
program, the file extension will be “.txt”
254

Chapter
5
Textbook page
ref.
29
Summary of Key Points
1. Describe several types of QuickBooks reports2. Set QuickBooks preferences for cash or accrual basis reports3. Create several different accounting reports4. Create several different business management reports5. Create graphs6. Customize the look of reports and filter the data on reports7. Memorize and group reports8. Process and print multiple reports in batches9. Print reports10. Use the Find command to find transactions11. Use QuickZoom to see the “numbers behind the numbers” on
reports12. Export reports to spreadsheets for further analysis
257
Related Documents