Atmos. Meas. Tech., 6, 2403–2418, 2013 www.atmos-meas-tech.net/6/2403/2013/ doi:10.5194/amt-6-2403-2013 © Author(s) 2013. CC Attribution 3.0 License. Atmospheric Measurement Techniques Open Access McClear: a new model estimating downwelling solar radiation at ground level in clear-sky conditions M. Lef` evre 1 , A. Oumbe 1,2 , P. Blanc 1 , B. Espinar 1 , B. Gschwind 1 , Z. Qu 1 , L. Wald 1 , M. Schroedter-Homscheidt 2 , C. Hoyer-Klick 2 , A. Arola 3 , A. Benedetti 4 , J. W. Kaiser 4,5,6 , and J.-J. Morcrette 4 1 MINES ParisTech, CS10207, 06904 Sophia Antipolis, France 2 German Aerospace Center (DLR), Wessling, Germany 3 Finnish Meteorological Institute, Kuopio, Finland 4 ECMWF, Reading, UK 5 King’s College London, London, UK 6 Max Planck Institute for Chemistry, Mainz, Germany Correspondence to: L. Wald ([email protected]) Received: 30 January 2013 – Published in Atmos. Meas. Tech. Discuss.: 10 April 2013 Revised: 24 July 2013 – Accepted: 9 August 2013 – Published: 17 September 2013 Abstract. A new fast clear-sky model called McClear was developed to estimate the downwelling shortwave direct and global irradiances received at ground level under clear skies. It is a fully physical model replacing empirical relations or simpler models used before. It exploits the recent results on aerosol properties, and total column content in water vapour and ozone produced by the MACC project (Monitoring At- mosphere Composition and Climate). It accurately repro- duces the irradiance computed by the libRadtran reference radiative transfer model with a computational speed approx- imately 10 5 times greater by adopting the abaci, or look-up table, approach combined with interpolation functions. It is therefore suited for geostationary satellite retrievals or nu- merical weather prediction schemes with many pixels or grid points, respectively. McClear irradiances were compared to 1 min measurements made in clear-sky conditions at several stations within the Baseline Surface Radiation Network in various climates. The bias for global irradiance comprises be- tween -6 and 25 W m -2 . The RMSE ranges from 20 W m -2 (3 % of the mean observed irradiance) to 36 W m -2 (5 %) and the correlation coefficient ranges between 0.95 and 0.99. The bias for the direct irradiance comprises between -48 and +33 W m -2 . The root mean square error (RMSE) ranges from 33 W m -2 (5 %) to 64 W m -2 (10 %). The correlation coefficient ranges between 0.84 and 0.98. This work demon- strates the quality of the McClear model combined with MACC products, and indirectly the quality of the aerosol properties modelled by the MACC reanalysis. 1 Introduction The downwelling solar irradiance observed at ground level on horizontal surfaces and integrated over the whole spec- trum (total irradiance) is called surface solar irradiance (SSI). It is the sum of the direct irradiance, from the direction of the sun, and the diffuse, from the rest of the sky vault, and is also called the global irradiance. The SSI is an essential climate variable (ECV) as established by the Global Climate Observ- ing System in August 2010 (GCOS, 2012). Knowledge of the SSI and its geographical distribution is of prime importance for numerous domains where SSI plays a major role as e.g. weather, climate, biomass, and energy. Accurate assessments of SSI can be retrieved from satellite data, and several studies demonstrate the superiority of satel- lite data over interpolation methods applied to sparse mea- surements performed within a radiometric network (Perez et al., 1997; Zelenka et al., 1999). Given the scarcity of long-term SSI measurements made at ground level, several authors mention that satellite-derived SSI may supplement these measurements (Ba et al., 2001; Blanc et al., 2010; Cano et al., 1986; Darnell et al., 1996; Diabat´ e et al., 1988; Elias and Roujean, 2008; Lef` evre et al., 2007; Posselt et al., 2012; Raschke et al., 1987; Schiffer and Rossow, 1985; Schmetz, 1989). Hereafter, a model estimating the SSI under clear sky is called a clear-sky model. As it describes the SSI in a cloud- free atmosphere, it estimates a realistic upper limit of the Published by Copernicus Publications on behalf of the European Geosciences Union.

Welcome message from author
This document is posted to help you gain knowledge. Please leave a comment to let me know what you think about it! Share it to your friends and learn new things together.
Transcript
Atmos. Meas. Tech., 6, 2403–2418, 2013www.atmos-meas-tech.net/6/2403/2013/doi:10.5194/amt-6-2403-2013© Author(s) 2013. CC Attribution 3.0 License.
EGU Journal Logos (RGB)
Advances in Geosciences
Open A
ccess
Natural Hazards and Earth System
Sciences
Open A
ccess
Annales Geophysicae
Open A
ccess
Nonlinear Processes in Geophysics
Open A
ccess
Atmospheric Chemistry
and Physics
Open A
ccess
Atmospheric Chemistry
and Physics
Open A
ccess
Discussions
Atmospheric Measurement
TechniquesO
pen Access
Atmospheric Measurement
Techniques
Open A
ccess
Discussions
Biogeosciences
Open A
ccess
Open A
ccess
BiogeosciencesDiscussions
Climate of the Past
Open A
ccess
Open A
ccess
Climate of the Past
Discussions
Earth System Dynamics
Open A
ccess
Open A
ccess
Earth System Dynamics
Discussions
GeoscientificInstrumentation
Methods andData Systems
Open A
ccess
GeoscientificInstrumentation
Methods andData Systems
Open A
ccess
Discussions
GeoscientificModel Development
Open A
ccess
Open A
ccess
GeoscientificModel Development
Discussions
Hydrology and Earth System
Sciences
Open A
ccess
Hydrology and Earth System
Sciences
Open A
ccess
Discussions
Ocean Science
Open A
ccess
Open A
ccess
Ocean ScienceDiscussions
Solid Earth
Open A
ccess
Open A
ccess
Solid EarthDiscussions
The Cryosphere
Open A
ccess
Open A
ccess
The CryosphereDiscussions
Natural Hazards and Earth System
Sciences
Open A
ccess
Discussions
McClear: a new model estimating downwelling solar radiation atground level in clear-sky conditions
M. Lef evre1, A. Oumbe1,2, P. Blanc1, B. Espinar1, B. Gschwind1, Z. Qu1, L. Wald1, M. Schroedter-Homscheidt2,C. Hoyer-Klick 2, A. Arola3, A. Benedetti4, J. W. Kaiser4,5,6, and J.-J. Morcrette4
1MINES ParisTech, CS10207, 06904 Sophia Antipolis, France2German Aerospace Center (DLR), Wessling, Germany3Finnish Meteorological Institute, Kuopio, Finland4ECMWF, Reading, UK5King’s College London, London, UK6Max Planck Institute for Chemistry, Mainz, Germany
Correspondence to:L. Wald ([email protected])
Received: 30 January 2013 – Published in Atmos. Meas. Tech. Discuss.: 10 April 2013Revised: 24 July 2013 – Accepted: 9 August 2013 – Published: 17 September 2013
Abstract. A new fast clear-sky model called McClear wasdeveloped to estimate the downwelling shortwave direct andglobal irradiances received at ground level under clear skies.It is a fully physical model replacing empirical relations orsimpler models used before. It exploits the recent results onaerosol properties, and total column content in water vapourand ozone produced by the MACC project (Monitoring At-mosphere Composition and Climate). It accurately repro-duces the irradiance computed by the libRadtran referenceradiative transfer model with a computational speed approx-imately 105 times greater by adopting the abaci, or look-uptable, approach combined with interpolation functions. It istherefore suited for geostationary satellite retrievals or nu-merical weather prediction schemes with many pixels or gridpoints, respectively. McClear irradiances were compared to1 min measurements made in clear-sky conditions at severalstations within the Baseline Surface Radiation Network invarious climates. The bias for global irradiance comprises be-tween−6 and 25 W m−2. The RMSE ranges from 20 W m−2
(3 % of the mean observed irradiance) to 36 W m−2 (5 %)and the correlation coefficient ranges between 0.95 and 0.99.The bias for the direct irradiance comprises between−48and+33 W m−2. The root mean square error (RMSE) rangesfrom 33 W m−2 (5 %) to 64 W m−2 (10 %). The correlationcoefficient ranges between 0.84 and 0.98. This work demon-strates the quality of the McClear model combined withMACC products, and indirectly the quality of the aerosolproperties modelled by the MACC reanalysis.
1 Introduction
The downwelling solar irradiance observed at ground levelon horizontal surfaces and integrated over the whole spec-trum (total irradiance) is called surface solar irradiance (SSI).It is the sum of the direct irradiance, from the direction of thesun, and the diffuse, from the rest of the sky vault, and is alsocalled the global irradiance. The SSI is an essential climatevariable (ECV) as established by the Global Climate Observ-ing System in August 2010 (GCOS, 2012). Knowledge of theSSI and its geographical distribution is of prime importancefor numerous domains where SSI plays a major role as e.g.weather, climate, biomass, and energy.
Accurate assessments of SSI can be retrieved from satellitedata, and several studies demonstrate the superiority of satel-lite data over interpolation methods applied to sparse mea-surements performed within a radiometric network (Perezet al., 1997; Zelenka et al., 1999). Given the scarcity oflong-term SSI measurements made at ground level, severalauthors mention that satellite-derived SSI may supplementthese measurements (Ba et al., 2001; Blanc et al., 2010; Canoet al., 1986; Darnell et al., 1996; Diabate et al., 1988; Eliasand Roujean, 2008; Lefevre et al., 2007; Posselt et al., 2012;Raschke et al., 1987; Schiffer and Rossow, 1985; Schmetz,1989).
Hereafter, a model estimating the SSI under clear sky iscalled a clear-sky model. As it describes the SSI in a cloud-free atmosphere, it estimates a realistic upper limit of the
Published by Copernicus Publications on behalf of the European Geosciences Union.
2404 M. Lefevre et al.: McClear: a new model estimating downwelling solar radiation
SSI (Gueymard, 2012; Long and Ackerman, 2000). In manymethods for the assessment of the SSI, all-sky irradiance isderived from the modelled clear-sky SSI by the attenuationor a modification factor due to clouds (Cano et al., 1986;Posselt et al., 2012; Raschke et al., 1987; Rigollier et al.,2004). While the all-sky SSI changes mainly with clouds, theSSI under clear sky is strongly dependent on the compositionof the atmosphere, namely the variable parameters aerosoland water vapour. Aerosols play a major role due to the di-versity in scattering and absorbing properties according totheir type, and the spatial and temporal heterogeneity of theirnumber, size, chemical composition, and shape (Deepshikhaet al., 2006; Deneke et al., 2008; Elias and Roujean, 2008;Gueymard, 2005; Xu et al., 2011).
The MACC project (Monitoring Atmosphere Composi-tion and Climate), funded by the European Commission, ispreparing the operational provision of global aerosol prop-erty forecasts together with physically consistent total col-umn content in water vapour and ozone (Kaiser et al., 2012a;Peuch et al., 2009). Up to now a multi-annual reanalysis dataset is provided and used here (Inness et al., 2013). Such in-formation has not been available so far from any operationalnumerical weather prediction (NWP) centre.
A new clear-sky model called McClear has been devel-oped to exploit this new input data source for estimatingthe downwelling shortwave direct and global irradiances re-ceived at ground level. The aim of this article is to describethis model (Sect. 2) and its implementation (Sect. 3), andto establish its performance (Sects. 4 to 6) with respect tohigh-quality measurements of SSI and the existing literature(Sect. 7).
2 The McClear model
Let Ediff denote the diffuse irradiance on the horizontalplane,Edir the direct (or beam) irradiance on the horizontalplane, andEglo the global irradiance:
Eglo= Ediff
+ Edir. (1)
If E0 denotes the irradiance that is received on a horizontalsurface at the top of the atmosphere for the location and timeunder consideration, the clearness index KT is defined as
KT = Eglo/E0. (2)
The clearness index is also called global transmissivity ofthe atmosphere, or atmospheric transmitance, or atmospherictransmission. In the same way, we define the direct clearnessindex KTdir as
KTdir= Edir/E0. (3)
The model McClear aims at producing bothEglo andEdir.The first constraint put in its development is that it should
sufficiently accurately reproduce the SSI estimated by accu-rate radiative transfer models (RTM). The RTM libRadtran(Mayer and Kylling, 2005; Mayer et al., 2010) is taken hereas a reference. The deviations between McClear and libRad-tran outputs must obey constraints similar to those for radia-tion measurements (WMO, 2008): the bias shall be less than3 W m−2, and 95 % of the differences should be less than20 W m−2.
The major constraint is that it should deliver time series ofirradiance much faster than libRadtran. The computationalspeed should be approximately 105 times greater in order toenable routine production in real-time forecasting systems.
One solution to obey these constraints is to adopt the abaciapproach combined with interpolation functions. The use ofabaci – also known as look-up tables (LUT) – is not new inthis domain (Deneke et al., 2008; Huang et al., 2011; Muelleret al., 2009; Schulz et al., 2009). It reveals an efficient andfast means to provide estimates of values otherwise avail-able from complex and slow models. One drawback is theresources and time needed to compute the abaci that mayamount to months. Another drawback is that the abaci for-mulation has to be adapted to the available input data source.Therefore, this paper deals with the specifics of an abaci ap-proach for typical numerical weather prediction output char-acteristics as represented in the MACC reanalysis data set.
A set of abaci and interpolation functions to speed up thesolution of the radiative transfer equations is designed, de-veloped and implemented. This ensemble of abaci and inter-polation functions as well as functions to exploit them foraggregation in time and computation of the sun position isthe model McClear.
Inputs to McClear are the solar zenith angle, the groundalbedo and 6 parameters describing the optical state of theatmosphere:
– total column content of ozone and water vapour,
– vertical profile of temperature, pressure, density, andvolume mixing ratio for gases as a function of altitudetaken in the AFGL data sets (see Sect. 3.2),
– aerosol optical depth (AOD) at 550 nm,Angstrom coef-ficient, and aerosol type: urban, continental clean, con-tinental polluted, continental average, maritime clean,maritime polluted, maritime tropical, Antarctic, anddesert (see Sect. 3.4),
and other parameters describing the geographical locationand the time:
– latitude, longitude and elevation above mean sea level(a.s.l.) of the site of interest,
– period of time requested,
– integration period, also known as the summarization pe-riod, of the radiation: 1 min, 15 min, 1 h, and 1 day,
Atmos. Meas. Tech., 6, 2403–2418, 2013 www.atmos-meas-tech.net/6/2403/2013/
M. Lef evre et al.: McClear: a new model estimating downwelling solar radiation 2405
– and time sampling step, usually identical to the integra-tion period.
Aerosols are described by standard aerosol types instead ofusing modelled AOD at different wavelengths explicitly. Atthe first glance this can be criticized as making no use ofavailable additional aerosol type information and it createsthe need of a transition matrix from MACC output to aerosoltype (see Sect. 3.4). However, it enhances the flexibility ofthe McClear use for other future sources of input data us-ing other internal aerosol models and/or other output wave-lengths. Additionally, it avoids the increase of the abaci di-mensions in order to cover all AOD wavelengths and the shiftfor spectral interpolation assumptions from the AOD level onthe irradiance level afterwards in the broadband irradiancegeneration.
The abaci contain
– the clearness index KT for ground albedo equal to 0,0.1, and 0.9 (see Sect. 3.1),
– the direct clearness index KTdir for null ground albedo,
for selected values of the 10 following parameters:
– solar zenith angle2S,
– ground albedo,
– the altitude of the ground level and elevation above theground,
– and the 6 parameters describing the optical state of theclear atmosphere and already listed above.
These values are called node points. The clearness indices areobtained by running libRadtran for these node points. Inter-polation functions permit to interpolate between node points.
Altitude of the ground level and elevation above theground are both needed because the 6 clear-sky parametersare computed in the MACC analysis for a very smooth ter-rain and therefore represent the atmospheric properties forthis atmospheric column. The altitude of this smooth terrainmodel may differ from the elevation of the more local site ofinterest and the SSI should be corrected, assuming that thedifference in SSI between the local elevation and the smoothterrain is equivalent to the difference in SSI between a simi-lar elevation above ground level, i.e. in the atmosphere, andthe smooth terrain. The correction is explained in Sect. 3.3.
An optimization was made for the selection of the nodepoints and interpolation functions with the following con-straints: (i) minimize the number of node points in order tohave abaci as small as possible, (ii) select/design interpola-tion/extrapolation functions as fast as possible, and (iii) inter-polated values must be close to the libRadran results with al-ready mentioned constraints. The last constraints on the dif-ference with libRadtran were checked for each input sepa-rately as well as the combination of all inputs using all nodepoints and interpolation functions.
The optimization was done for each of the 10 inputs listedabove. A Monte Carlo technique is applied to randomly gen-erate sets of inputs to libRadtran within the 10-D space, withthe exception of the current parameter which is regularlysampled with a small step. The optical properties were se-lected by considering their observed marginal distribution.More precisely, the uniform distribution is chosen as a modelfor marginal probability for all parameters except aerosoloptical thickness,Angstrom coefficient, and total columnozone. The chi-square law for aerosol optical thickness, thenormal law for theAngstrom coefficient, and the beta law fortotal column ozone have been selected. The parameters of thelaws are empirically determined from the analyses of the ob-servations made in the AERONET network for aerosol prop-erties and from meteorological satellite-based ozone prod-ucts.
For all inputs, the selected interpolation/extrapolationfunctions are linear interpolators/extrapolators, except for thesolar zenith angle2S. For the latter, the modified Beer–Lambert (MLB) function proposed by Mueller et al. (2009)has been studied. To obey the constraints, a 5-piecewiseMLB was retained with the following angles: 0◦, 60◦, 75◦,80◦, 85◦, and 89.9◦ instead of the originally proposed twoangles 0 and 60◦. Shortly after the design of the abaci wasfrozen, Qu et al. (2011) demonstrated that a 4-piecewiseMLB with the angles 0◦, 60◦, 75◦, 85◦, and 89.9◦ would havebeen applicable as well.
Following Oumbe et al. (2011), the efficiency and accu-racy of piecewise linear functions to estimate changes inEglo
andEdir with altitude above the ground is sufficient.The formula of Vermote et al. (1994, 1997),
KT(ρg) = KT(ρg = 0)/(1− ρgS), (4)
describes the change in KT as a function of the ground albedoρg and the atmospheric spherical albedoS. ρg is an inputwhile S is unknown. In principle,S can be computed know-ing KT for any value ofρg using Eq. (4). In practice, betterresults are attained ifS is computed for two values ofρg– 0.1, and 0.9 using Eq. (4) – and then is linearly interpo-lated/extrapolated for the actualρg:
a = [S(ρg = 0.9) − S(ρg = 0.1)]/0.8 (5)
b = S(ρg = 0.1) − 0.1a
S = aρg + b.
In total, this design results in 1674 abaci. One abacus cor-responds to a given atmospheric profile and a given type ofaerosol. In an abacus, the list of node points is as follows:
– total column content in ozone (in Dobson unit): 200,300, 400, 500,
– total column content in water vapour (kg m−2): 0.1, 3,5, 7, 10, 15, 20, 30, 40, 60, 80, and 100,
www.atmos-meas-tech.net/6/2403/2013/ Atmos. Meas. Tech., 6, 2403–2418, 2013
2406 M. Lefevre et al.: McClear: a new model estimating downwelling solar radiation
– aerosol optical depth at 550 nm: 0.01, 0.05, 0.1, 0.2, 0.3,0.5, 1, 1.5, 2, and 5,
– aerosolAngstrom coefficient:−1, −0.5, 0, 0.5, 1, 1.5,2, 3, and 4,
– site elevation above mean sea level (km): 0, 1, 2, 3, 4, 5,6, and 7,
– elevation above ground level (km): 0, 0.5, 1, 1.5, and 2,
– solar zenith angle (deg): 0, 60, 75, 80, 85, and 89.9.
3 Practical implementation of McClear
McClear can be run with self-defined inputs. More inter-estingly, it is capable of ingesting atmospheric data fromthe MACC modelling and from the MODIS (Moderate Res-olution Imaging Spectroradiometer) estimates for groundalbedo. This section details the practical implementation ofMcClear.
3.1 Ground albedo
The MCD43C1 and MCD43C2 data, derived from MODISimages, are 16-day composites provided as a level-3 productprojected to a 0.05◦ grid in latitude/longitude. They are pro-duced every 8 days with 16 days of acquisition, where thegiven date is that of the first day of the 16-day period. Thesedata sets contain three model parameters, calledfiso, fvol,andfgeo(Schaaf et al., 2002). fiso describes the isotropic partof the bidirectional reflectance distribution function (BRDF);the two other parameters are linked to the viewing and il-luminating geometry to describe the anisotropic part of theBRDF. The directional hemispherical reflectance (DHR) –also known as black-sky albedo – and the bihemisphericalreflectance (BHR) – also known as white-sky albedo – (e.g.Schaepman-Strub et al., 2006) are computed from the BRDFusing formulas in Schaaf et al. (2002). DefiningKdir(ρg) as
Kdir(ρg) = Edir/Eglo(ρg) (6)
whereEdir does not depend onρg, the ground albedoρg isgiven by
ρg = BHR+ Kdir(ρg)(DHR− BHR). (7)
The major difficulty in Eq. (7) is thatρg depends uponKdir, which depends itself onρg. By combining Eqs. (4)–(7),and denoting1 = (DHR− BHR), one obtains a second-orderequation in KT which is the quantity of interest:
a12KTdir2+ KT[KT(ρg = 0) + (2aBHR+ b)1KTdir
]
+(aBHR2+ bBHR− 1)KT2
= 0. (8)
Using the Monte Carlo technique to randomly select 100 000samples, it is found that Eq. (8) has only one solution that
respects KT> KTdir. Therefore, Eq. (8) is used to computeKT and Eq. (7) providesρg.
In a practical manner, once a request is made for a givensite, the three BRDF parameters fiso, fvol, and fgeo are takenfrom the closest MCD43C1 or MCD43C2 grid point. Then,Eq. (8) is solved for KT for each minute of the day.
The difference between the MCD43C1 and MCD43C2products is that MCD43C2 is a snow-free version ofMCD43C1. Both products exhibit gaps in time and space.Two approaches have been tested to palliate the lack of data.
In the first approach, the three BRDF parameters weretaken from the MCD43C2 product for the previous, currentand following months for the current day. They were interpo-lated in time for each minute of the day, taking into accountthe possible absence of data. Sometimes, data may not beavailable for three months in a row. In these cases, the pa-rameters were replaced by their mean values computed forthe given month over the period 2004–2011. Over the ocean,fiso was set to 0.02 (Wald and Monget, 1983) and the twoparameters to 0. Several gaps in space and time were still ob-served. Presence of snow is not accounted for, and this mayinduce errors in the diffuse irradiance in some cases.
The second approach consisted in computing mean valuesof the three BRDF parameters from the MCD43C1 productfor each of the twelve months of the year over the period2004–2011. Each mean value was allotted to the mid-day ofeach month. The values for the current day were computed bylinear interpolation using the current month and that beforeor after depending on the case. A great deal of effort has beenmade on the completion of data which are missing mostly inwater-covered areas. The “Land Cover Type” product is alsoa MODIS product using the same grid as MCD43C1. It al-lows the identification of pixels containing water and the pro-portion of water in this pixel. LetW denote the binary maskfor water;W = 1 if the pixel has been classified as “water”at least once for the given month during the period 2001–2009 covered by the “Land Cover Type” product, and is 0otherwise. LetP be the average proportion of the water. Thetypical tripletfW = (fiso, fvol, fgeo) for water areas was de-fined by the mode of the valid triplets (fiso, fvol, fgeo) forwater pixels comprised between latitude−45◦ and latitude45◦. fW was allotted to each unknown water pixel for whichP = 1. Then, if a water pixel exhibited a valid tripletf anda proportion of waterP less than 1,f was replaced by a lin-ear combinationP fW + (1−P)f . A moving average of±1month was applied followed by a median filter of 11×11 pix-els to fill gaps. This two-step filtering was repeated but with awindow of±2 months. Then, a median filter of 21×21 pixelswas applied. Still unknown were a few pixels in the middle ofthe ocean, extreme southern part of the Antarctic Ocean, andGreenland. They were treated manually and were allotted themean value of the tripletsf averaged in their neighbourhood.
When compared to ground-based measurements of the SSIas discussed later, both approaches gave the same results withvery small differences not taking into account the gaps. The
Atmos. Meas. Tech., 6, 2403–2418, 2013 www.atmos-meas-tech.net/6/2403/2013/
M. Lef evre et al.: McClear: a new model estimating downwelling solar radiation 2407
second approach is used in the following. It has the advantagethat it makes easier the implementation of McClear.
3.2 Atmospheric profile
The five vertical profiles of temperature, pressure, density,and volume mixing ratio for gases as a function of alti-tude used in McClear are those from the USA Air ForceGeophysics Laboratory (AFGL) as implemented in libRad-tran: tropics, mid-latitude summer and winter, and sub-Arcticsummer and winter. A mask has been constructed for the au-tomatic selection of the atmospheric profile for any site. TheKoeppen climate classification map (FAO, 1997) has beenmanually modified for North America, China and Africa fol-lowing Trewartha (1954). Other maps of climate classifica-tion could have been suitable and possibly more accurate.But aiming at partitioning the world into five classes only, avery limited level of detail is sufficient. The sub-Arctic pro-files are allotted to climate zones noted EF, ET, Dc, Dd inTrewartha (1954), the tropical profile to Aw, As, Af, and Am,and the mid-latitude profiles are allotted to the rest. Oceansare not covered by these climate maps; extension was manu-ally made. As for the seasons, November to April is consid-ered as boreal winter (austral summer).
3.3 Altitude correction
The 6 inputs from MACC are given for grid nodes, whichare separated by approximately 100 km. A very smooth ele-vation model is used in MACC analyses, and each node has aknown local mean elevation above mean sea level (a.s.l.). TheMACC-equivalent elevation for the local site under consider-ation is computed by linear interpolation of the MACC eleva-tions of the 4 neighbouring grid nodes. Then, interpolation inthe clearness index is made for this MACC-equivalent eleva-tion using the two closest nodes “site elevation” in the abaci.If the actual elevation of the local site is less than the MACC-equivalent elevation, the clearness index is set to that corre-sponding to the MACC-equivalent elevation. Otherwise, anadditional linear interpolation/extrapolation is performed us-ing the nodes “elevation above ground level”.
3.4 Aerosols properties
Inputs to McClear are the aerosol optical depth at 550 nm,Angstrom coefficient, and aerosol type. The MACC reanal-ysis delivers total aerosol optical depth at 550 and 1240 nm,from which theAngstrom coefficient is derived. It deliversalso partial optical depths at 550 nm for dust, organic, seasalt, sulphate, and black carbon aerosol species (Benedetti etal., 2009; Kaiser et al., 2012b; Morcrette et al., 2008, 2009).
These partial optical depths are used to automatically de-termine the aerosol type, and more exactly the mixture whosename describes the typical origin of the particle ensembles:urban, continental clean, continental polluted, continental av-erage, maritime clean, maritime polluted, maritime tropical,
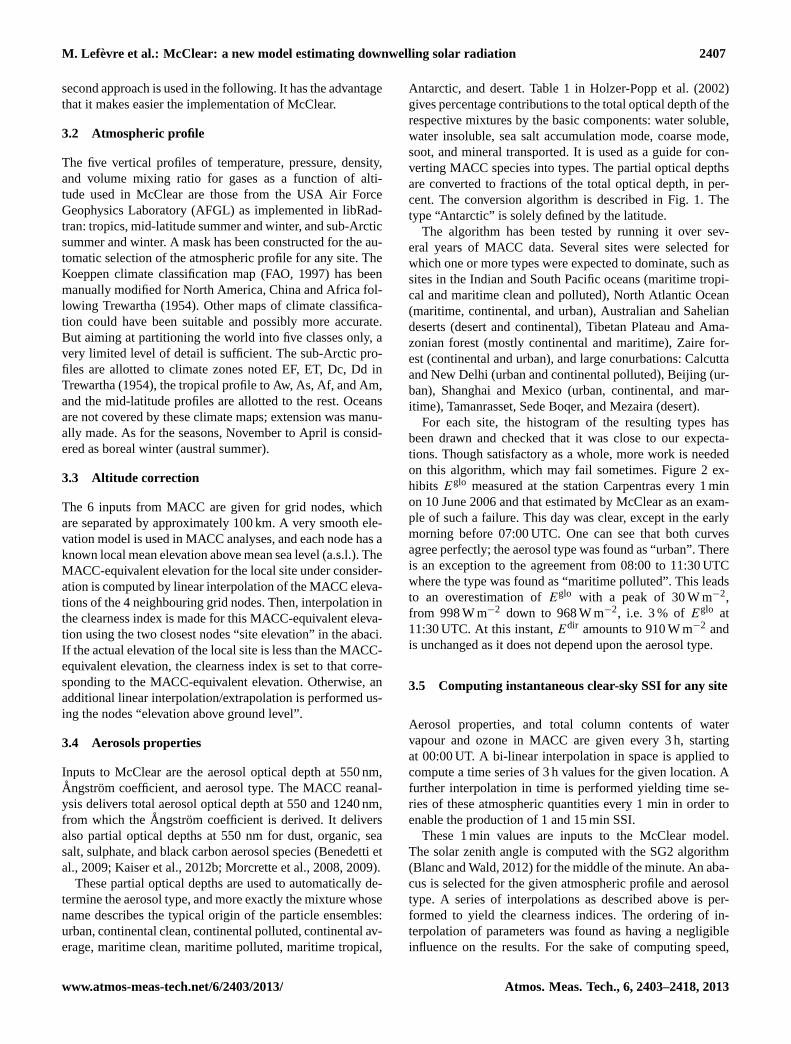
Antarctic, and desert. Table 1 in Holzer-Popp et al. (2002)gives percentage contributions to the total optical depth of therespective mixtures by the basic components: water soluble,water insoluble, sea salt accumulation mode, coarse mode,soot, and mineral transported. It is used as a guide for con-verting MACC species into types. The partial optical depthsare converted to fractions of the total optical depth, in per-cent. The conversion algorithm is described in Fig. 1. Thetype “Antarctic” is solely defined by the latitude.
The algorithm has been tested by running it over sev-eral years of MACC data. Several sites were selected forwhich one or more types were expected to dominate, such assites in the Indian and South Pacific oceans (maritime tropi-cal and maritime clean and polluted), North Atlantic Ocean(maritime, continental, and urban), Australian and Saheliandeserts (desert and continental), Tibetan Plateau and Ama-zonian forest (mostly continental and maritime), Zaire for-est (continental and urban), and large conurbations: Calcuttaand New Delhi (urban and continental polluted), Beijing (ur-ban), Shanghai and Mexico (urban, continental, and mar-itime), Tamanrasset, Sede Boqer, and Mezaira (desert).
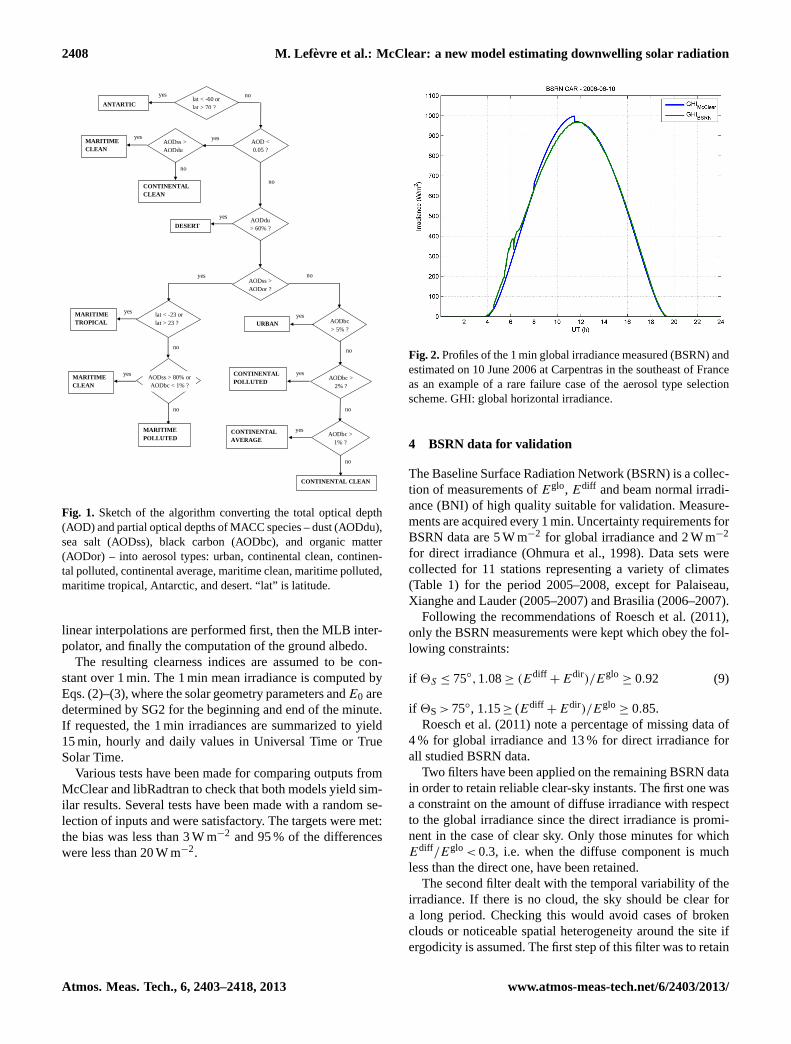
For each site, the histogram of the resulting types hasbeen drawn and checked that it was close to our expecta-tions. Though satisfactory as a whole, more work is neededon this algorithm, which may fail sometimes. Figure 2 ex-hibits Eglo measured at the station Carpentras every 1 minon 10 June 2006 and that estimated by McClear as an exam-ple of such a failure. This day was clear, except in the earlymorning before 07:00 UTC. One can see that both curvesagree perfectly; the aerosol type was found as “urban”. Thereis an exception to the agreement from 08:00 to 11:30 UTCwhere the type was found as “maritime polluted”. This leadsto an overestimation ofEglo with a peak of 30 W m−2,from 998 W m−2 down to 968 W m−2, i.e. 3 % of Eglo at11:30 UTC. At this instant,Edir amounts to 910 W m−2 andis unchanged as it does not depend upon the aerosol type.
3.5 Computing instantaneous clear-sky SSI for any site
Aerosol properties, and total column contents of watervapour and ozone in MACC are given every 3 h, startingat 00:00 UT. A bi-linear interpolation in space is applied tocompute a time series of 3 h values for the given location. Afurther interpolation in time is performed yielding time se-ries of these atmospheric quantities every 1 min in order toenable the production of 1 and 15 min SSI.
These 1 min values are inputs to the McClear model.The solar zenith angle is computed with the SG2 algorithm(Blanc and Wald, 2012) for the middle of the minute. An aba-cus is selected for the given atmospheric profile and aerosoltype. A series of interpolations as described above is per-formed to yield the clearness indices. The ordering of in-terpolation of parameters was found as having a negligibleinfluence on the results. For the sake of computing speed,
www.atmos-meas-tech.net/6/2403/2013/ Atmos. Meas. Tech., 6, 2403–2418, 2013
2408 M. Lefevre et al.: McClear: a new model estimating downwelling solar radiation
33
yes
yes yes
no AODss >
AODor ?
no
no
no
yes
yes
yes
AODbc
> 5% ?
URBAN
CONTINENTAL
POLLUTED AODbc >
2% ?
CONTINENTAL
AVERAGE
CONTINENTAL CLEAN
AODbc >
1% ?
no
no
yes
yes lat < -23 or
lat > 23 ?
MARITIME
TROPICAL
MARITIME
CLEAN
MARITIME
POLLUTED
no
AODss >
AODdu
?
MARITIME
CLEAN
CONTINENTAL
CLEAN
AOD <
0.05 ?
AODdu
> 60% ?
DESERT
lat < -60 or
lat > 70 ?
no yes
ANTARTIC
no
yes
AODss > 80% or
AODbc < 1% ?
1
Fig. 1 2
3 Fig. 1. Sketch of the algorithm converting the total optical depth(AOD) and partial optical depths of MACC species – dust (AODdu),sea salt (AODss), black carbon (AODbc), and organic matter(AODor) – into aerosol types: urban, continental clean, continen-tal polluted, continental average, maritime clean, maritime polluted,maritime tropical, Antarctic, and desert. “lat” is latitude.
linear interpolations are performed first, then the MLB inter-polator, and finally the computation of the ground albedo.
The resulting clearness indices are assumed to be con-stant over 1 min. The 1 min mean irradiance is computed byEqs. (2)–(3), where the solar geometry parameters andE0 aredetermined by SG2 for the beginning and end of the minute.If requested, the 1 min irradiances are summarized to yield15 min, hourly and daily values in Universal Time or TrueSolar Time.
Various tests have been made for comparing outputs fromMcClear and libRadtran to check that both models yield sim-ilar results. Several tests have been made with a random se-lection of inputs and were satisfactory. The targets were met:the bias was less than 3 W m−2 and 95 % of the differenceswere less than 20 W m−2.
34
1
Fig. 2 2
3
Fig. 2.Profiles of the 1 min global irradiance measured (BSRN) andestimated on 10 June 2006 at Carpentras in the southeast of Franceas an example of a rare failure case of the aerosol type selectionscheme. GHI: global horizontal irradiance.
4 BSRN data for validation
The Baseline Surface Radiation Network (BSRN) is a collec-tion of measurements ofEglo, Ediff and beam normal irradi-ance (BNI) of high quality suitable for validation. Measure-ments are acquired every 1 min. Uncertainty requirements forBSRN data are 5 W m−2 for global irradiance and 2 W m−2
for direct irradiance (Ohmura et al., 1998). Data sets werecollected for 11 stations representing a variety of climates(Table 1) for the period 2005–2008, except for Palaiseau,Xianghe and Lauder (2005–2007) and Brasilia (2006–2007).
Following the recommendations of Roesch et al. (2011),only the BSRN measurements were kept which obey the fol-lowing constraints:
if 2S ≤ 75◦,1.08≥ (Ediff+ Edir)/Eglo
≥ 0.92 (9)
if 2S> 75◦, 1.15≥ (Ediff+ Edir)/Eglo
≥ 0.85.Roesch et al. (2011) note a percentage of missing data of
4 % for global irradiance and 13 % for direct irradiance forall studied BSRN data.
Two filters have been applied on the remaining BSRN datain order to retain reliable clear-sky instants. The first one wasa constraint on the amount of diffuse irradiance with respectto the global irradiance since the direct irradiance is promi-nent in the case of clear sky. Only those minutes for whichEdiff/Eglo < 0.3, i.e. when the diffuse component is muchless than the direct one, have been retained.
The second filter dealt with the temporal variability of theirradiance. If there is no cloud, the sky should be clear fora long period. Checking this would avoid cases of brokenclouds or noticeable spatial heterogeneity around the site ifergodicity is assumed. The first step of this filter was to retain
Atmos. Meas. Tech., 6, 2403–2418, 2013 www.atmos-meas-tech.net/6/2403/2013/
M. Lef evre et al.: McClear: a new model estimating downwelling solar radiation 2409
Table 1.List of BSRN stations used for validation.
Elevation MACC meanStation Code Country Latitude Longitude a.s.l. (m) altitude (m)
Barrow BAR USA (Alaska) 71.323 −156.607 8 31Palaiseau PAL France 48.713 2.208 156 126Carpentras CAR France 44.083 5.059 100 538Payerne PAY Switzerland 46.815 6.944 491 943Xianghe XIA China 39.754 116.962 32 326Tateno TAT Japan 36.050 140.133 25 246Sede Boqer SBO Israel 30.905 34.782 500 450Tamanrasset TAM Algeria 22.780 5.510 1385 1012Brasilia BRB Brazil −15.601 −47.713 1023 808Alice Springs ASP Australia −23.798 133.888 547 554Lauder LAU New Zealand −45.045 +169.689 350 509
only periods with enough measurements that have passed thefirst filter. A given instantt , expressed in min, was kept onlyif at least 30 % of the 1 min observations in both intervals[t − 90, t ] and [t , t + 90] have been retained after the firstfilter. A corrected clearness index, KT′ (Ineichen and Perez,1999) is computed for this instant:
KT′= KT/[1.031exp(−1.4/(0.9+ 9.4/m)) + 0.1], (10)
wherem is the air mass defined by Kasten and Young (1989):
m(2S) = (p/p0)/[cos(2S) + 0.50572(2S+ 6.07995)−1.6364], (11)
where2S is expressed in degree, andp andp0 are respec-tively the pressure at the site under consideration and that atsea level.
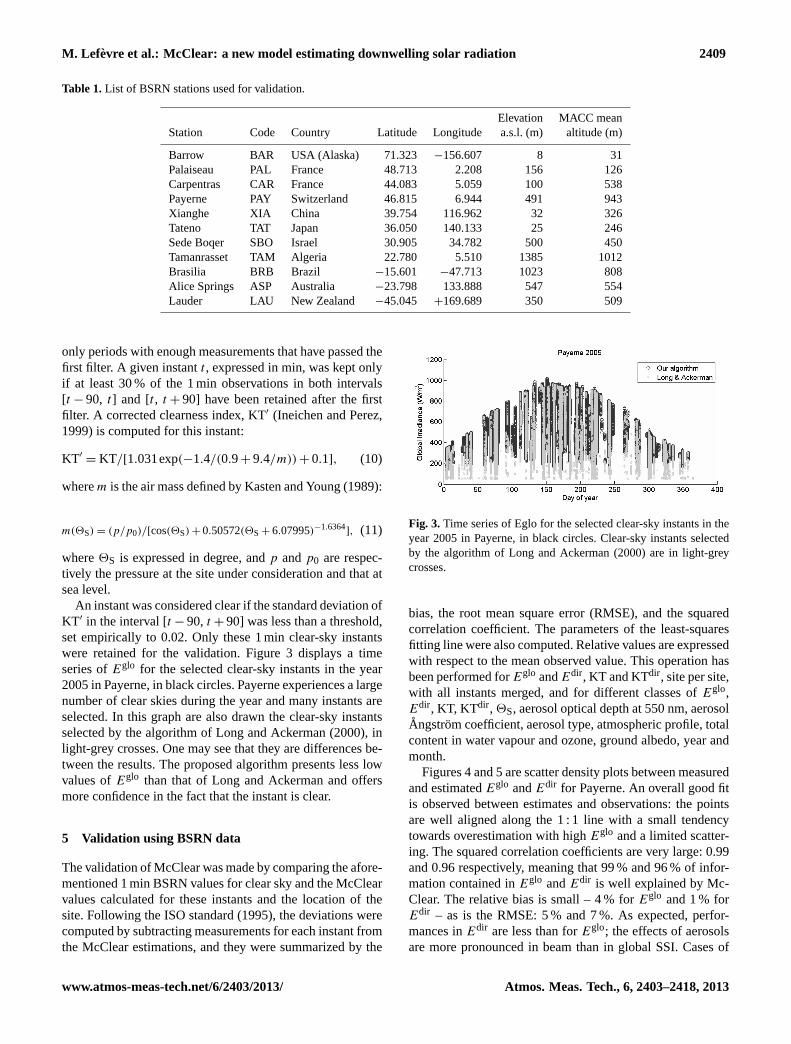
An instant was considered clear if the standard deviation ofKT′ in the interval [t − 90, t + 90] was less than a threshold,set empirically to 0.02. Only these 1 min clear-sky instantswere retained for the validation. Figure 3 displays a timeseries ofEglo for the selected clear-sky instants in the year2005 in Payerne, in black circles. Payerne experiences a largenumber of clear skies during the year and many instants areselected. In this graph are also drawn the clear-sky instantsselected by the algorithm of Long and Ackerman (2000), inlight-grey crosses. One may see that they are differences be-tween the results. The proposed algorithm presents less lowvalues ofEglo than that of Long and Ackerman and offersmore confidence in the fact that the instant is clear.
5 Validation using BSRN data
The validation of McClear was made by comparing the afore-mentioned 1 min BSRN values for clear sky and the McClearvalues calculated for these instants and the location of thesite. Following the ISO standard (1995), the deviations werecomputed by subtracting measurements for each instant fromthe McClear estimations, and they were summarized by the
35
1
Fig. 3 2
3 Fig. 3. Time series of Eglo for the selected clear-sky instants in theyear 2005 in Payerne, in black circles. Clear-sky instants selectedby the algorithm of Long and Ackerman (2000) are in light-greycrosses.
bias, the root mean square error (RMSE), and the squaredcorrelation coefficient. The parameters of the least-squaresfitting line were also computed. Relative values are expressedwith respect to the mean observed value. This operation hasbeen performed forEglo andEdir, KT and KTdir, site per site,with all instants merged, and for different classes ofEglo,Edir, KT, KTdir, 2S, aerosol optical depth at 550 nm, aerosolAngstrom coefficient, aerosol type, atmospheric profile, totalcontent in water vapour and ozone, ground albedo, year andmonth.
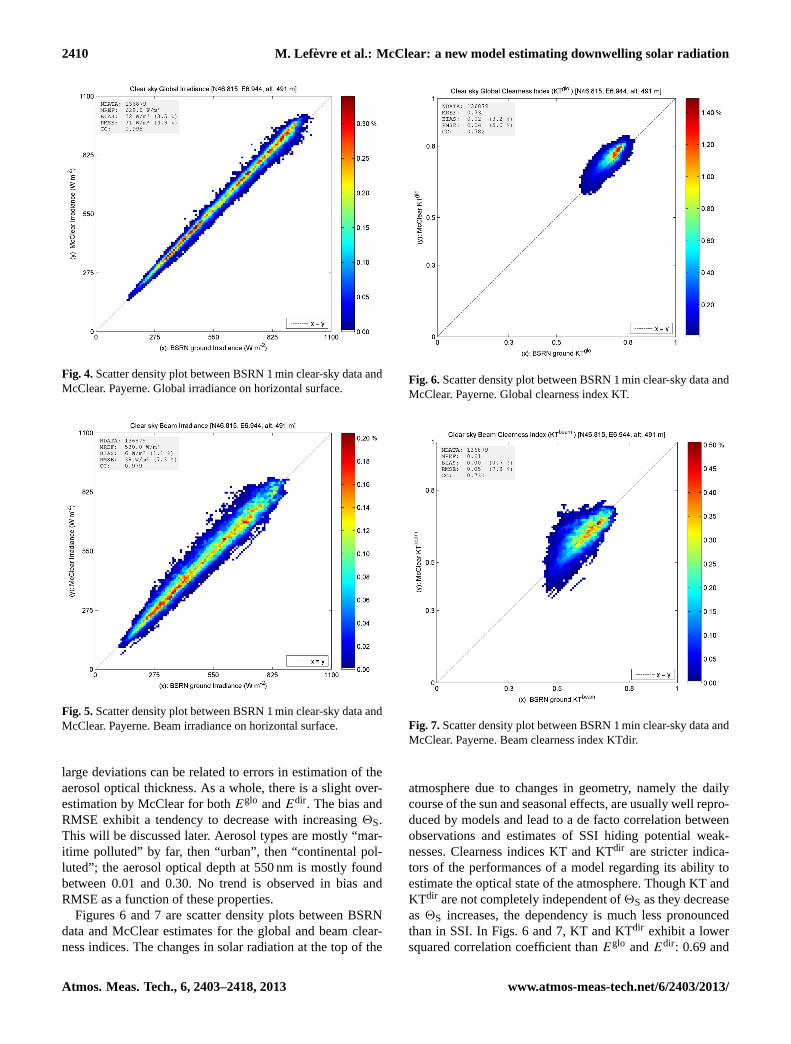
Figures 4 and 5 are scatter density plots between measuredand estimatedEglo andEdir for Payerne. An overall good fitis observed between estimates and observations: the pointsare well aligned along the 1 : 1 line with a small tendencytowards overestimation with highEglo and a limited scatter-ing. The squared correlation coefficients are very large: 0.99and 0.96 respectively, meaning that 99 % and 96 % of infor-mation contained inEglo andEdir is well explained by Mc-Clear. The relative bias is small – 4 % forEglo and 1 % forEdir – as is the RMSE: 5 % and 7 %. As expected, perfor-mances inEdir are less than forEglo; the effects of aerosolsare more pronounced in beam than in global SSI. Cases of
www.atmos-meas-tech.net/6/2403/2013/ Atmos. Meas. Tech., 6, 2403–2418, 2013
2410 M. Lefevre et al.: McClear: a new model estimating downwelling solar radiation
36
1
Fig. 4 2
3
Fig. 4.Scatter density plot between BSRN 1 min clear-sky data andMcClear. Payerne. Global irradiance on horizontal surface.
37
1
Fig. 5 2
3
Fig. 5.Scatter density plot between BSRN 1 min clear-sky data andMcClear. Payerne. Beam irradiance on horizontal surface.
large deviations can be related to errors in estimation of theaerosol optical thickness. As a whole, there is a slight over-estimation by McClear for bothEglo andEdir. The bias andRMSE exhibit a tendency to decrease with increasing2S.This will be discussed later. Aerosol types are mostly “mar-itime polluted” by far, then “urban”, then “continental pol-luted”; the aerosol optical depth at 550 nm is mostly foundbetween 0.01 and 0.30. No trend is observed in bias andRMSE as a function of these properties.
Figures 6 and 7 are scatter density plots between BSRNdata and McClear estimates for the global and beam clear-ness indices. The changes in solar radiation at the top of the
38
1
Fig. 6 2
3
Fig. 6.Scatter density plot between BSRN 1 min clear-sky data andMcClear. Payerne. Global clearness index KT.
39
1
Fig. 7 2
3
Fig. 7.Scatter density plot between BSRN 1 min clear-sky data andMcClear. Payerne. Beam clearness index KTdir.
atmosphere due to changes in geometry, namely the dailycourse of the sun and seasonal effects, are usually well repro-duced by models and lead to a de facto correlation betweenobservations and estimates of SSI hiding potential weak-nesses. Clearness indices KT and KTdir are stricter indica-tors of the performances of a model regarding its ability toestimate the optical state of the atmosphere. Though KT andKTdir are not completely independent of2S as they decreaseas 2S increases, the dependency is much less pronouncedthan in SSI. In Figs. 6 and 7, KT and KTdir exhibit a lowersquared correlation coefficient thanEglo andEdir: 0.69 and
Atmos. Meas. Tech., 6, 2403–2418, 2013 www.atmos-meas-tech.net/6/2403/2013/
M. Lef evre et al.: McClear: a new model estimating downwelling solar radiation 2411
40
1
Fig. 8 2
3
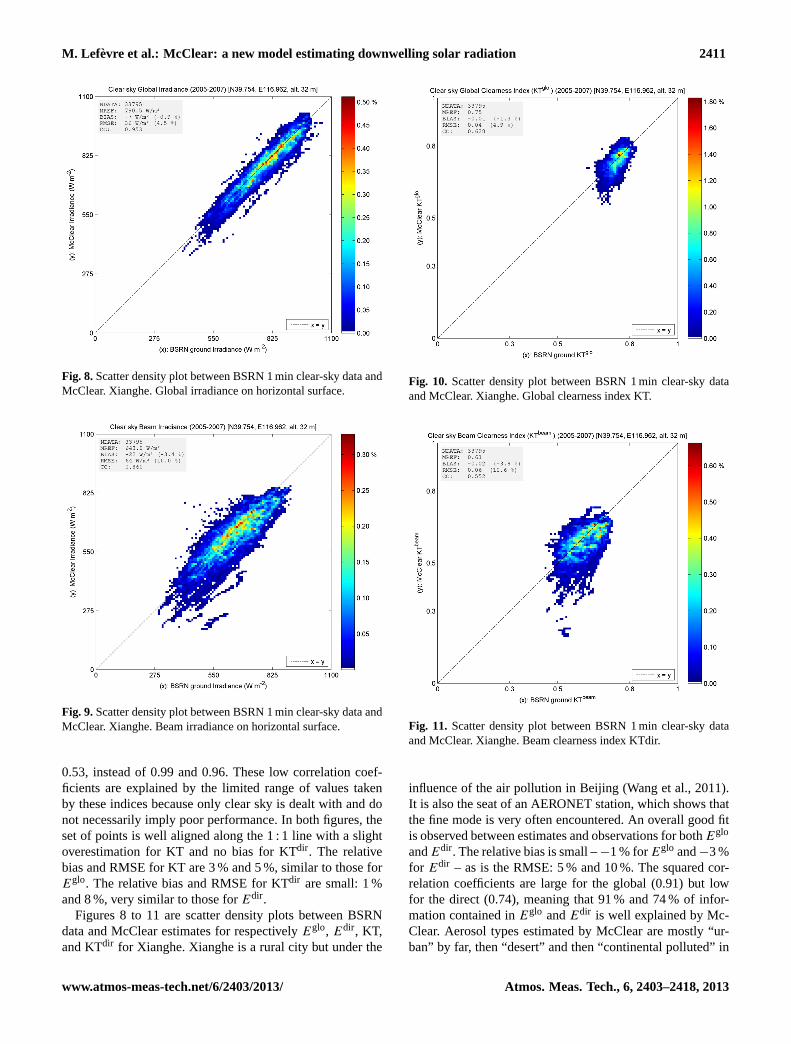
Fig. 8.Scatter density plot between BSRN 1 min clear-sky data andMcClear. Xianghe. Global irradiance on horizontal surface.
41
1
Fig. 9 2
3
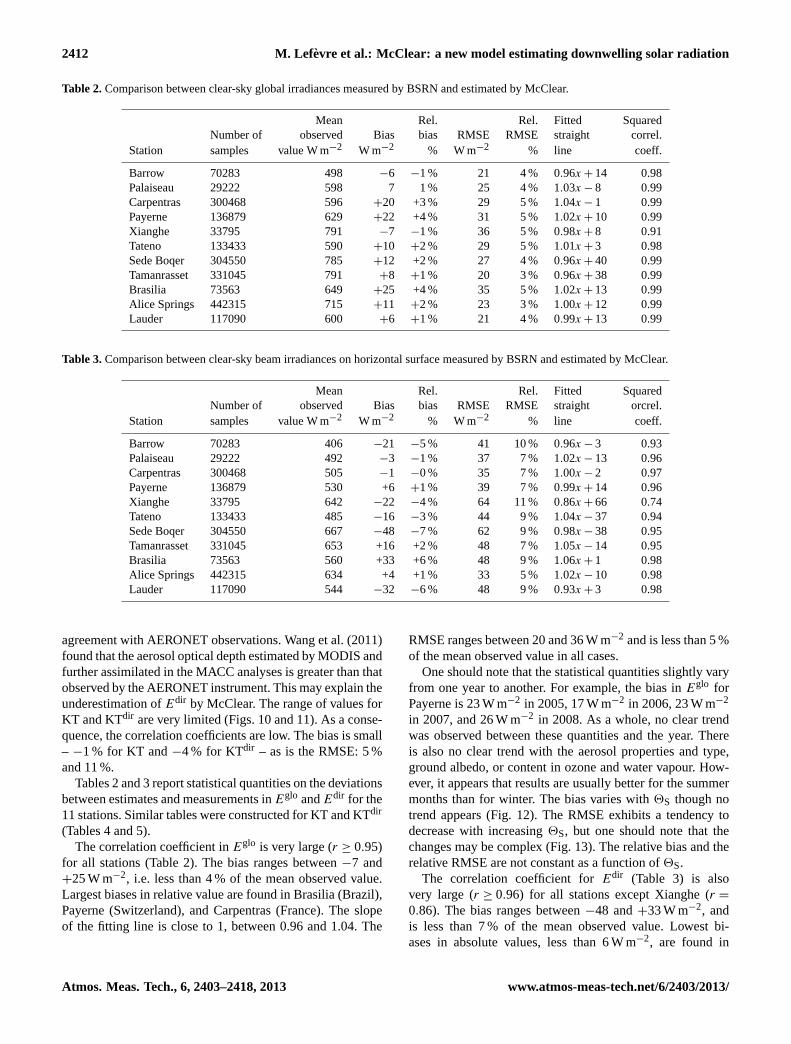
Fig. 9.Scatter density plot between BSRN 1 min clear-sky data andMcClear. Xianghe. Beam irradiance on horizontal surface.
0.53, instead of 0.99 and 0.96. These low correlation coef-ficients are explained by the limited range of values takenby these indices because only clear sky is dealt with and donot necessarily imply poor performance. In both figures, theset of points is well aligned along the 1 : 1 line with a slightoverestimation for KT and no bias for KTdir. The relativebias and RMSE for KT are 3 % and 5 %, similar to those forEglo. The relative bias and RMSE for KTdir are small: 1 %and 8 %, very similar to those forEdir.
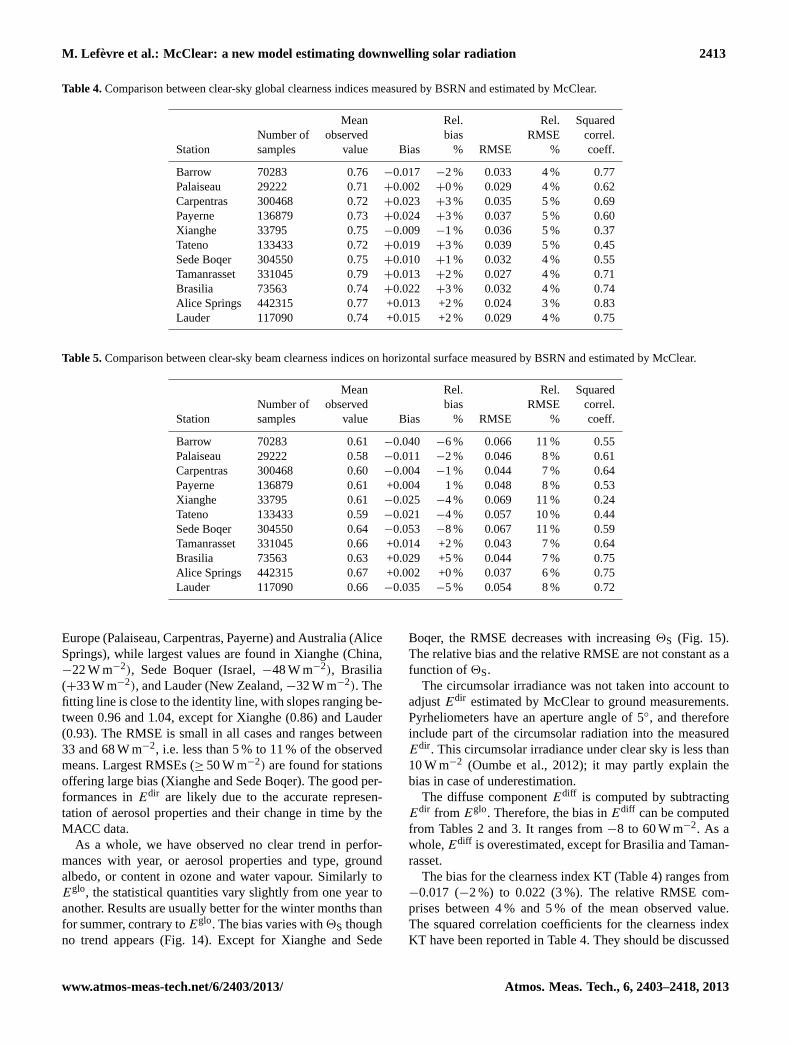
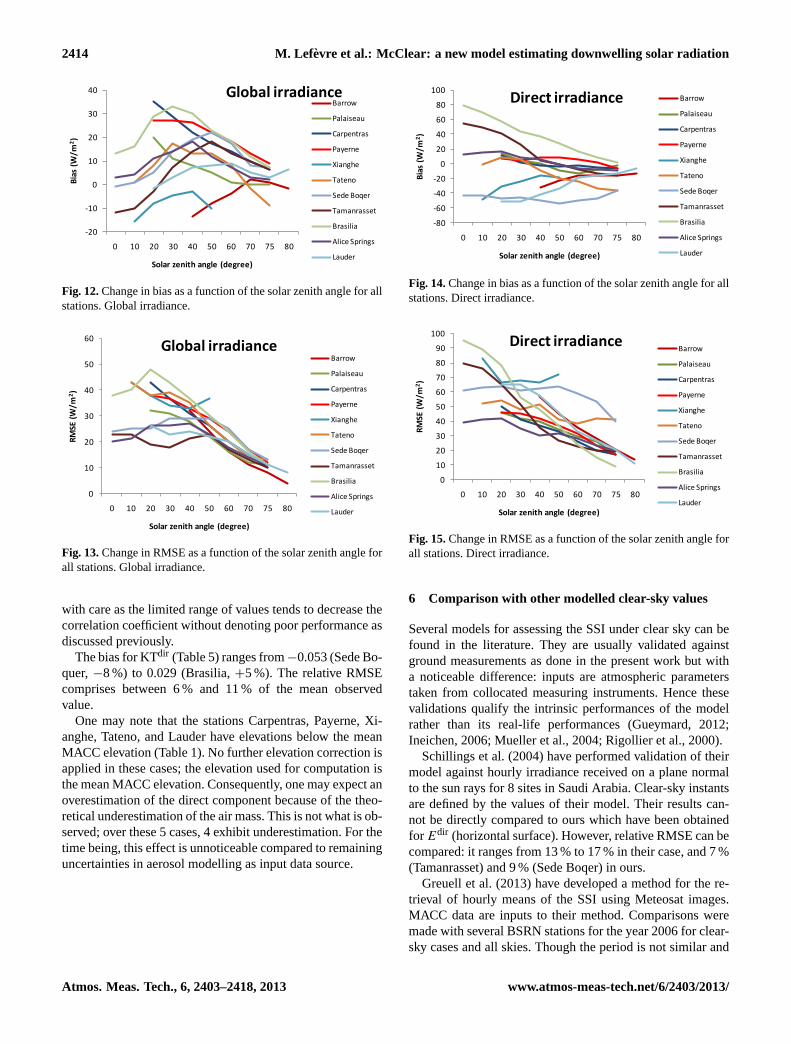
Figures 8 to 11 are scatter density plots between BSRNdata and McClear estimates for respectivelyEglo, Edir, KT,and KTdir for Xianghe. Xianghe is a rural city but under the
42
1
Fig. 10 2
3
Fig. 10. Scatter density plot between BSRN 1 min clear-sky dataand McClear. Xianghe. Global clearness index KT.
43
1
Fig. 11 2
3
Fig. 11. Scatter density plot between BSRN 1 min clear-sky dataand McClear. Xianghe. Beam clearness index KTdir.
influence of the air pollution in Beijing (Wang et al., 2011).It is also the seat of an AERONET station, which shows thatthe fine mode is very often encountered. An overall good fitis observed between estimates and observations for bothEglo
andEdir. The relative bias is small –−1 % forEglo and−3 %for Edir – as is the RMSE: 5 % and 10 %. The squared cor-relation coefficients are large for the global (0.91) but lowfor the direct (0.74), meaning that 91 % and 74 % of infor-mation contained inEglo andEdir is well explained by Mc-Clear. Aerosol types estimated by McClear are mostly “ur-ban” by far, then “desert” and then “continental polluted” in
www.atmos-meas-tech.net/6/2403/2013/ Atmos. Meas. Tech., 6, 2403–2418, 2013
2412 M. Lefevre et al.: McClear: a new model estimating downwelling solar radiation
Table 2.Comparison between clear-sky global irradiances measured by BSRN and estimated by McClear.
Mean Rel. Rel. Fitted SquaredNumber of observed Bias bias RMSE RMSE straight correl.
Station samples value W m−2 W m−2 % W m−2 % line coeff.
Barrow 70283 498 −6 −1 % 21 4 % 0.96x + 14 0.98Palaiseau 29222 598 7 1 % 25 4 % 1.03x − 8 0.99Carpentras 300468 596 +20 +3 % 29 5 % 1.04x − 1 0.99Payerne 136879 629 +22 +4 % 31 5 % 1.02x + 10 0.99Xianghe 33795 791 −7 −1 % 36 5 % 0.98x + 8 0.91Tateno 133433 590 +10 +2 % 29 5 % 1.01x + 3 0.98Sede Boqer 304550 785 +12 +2 % 27 4 % 0.96x + 40 0.99Tamanrasset 331045 791 +8 +1 % 20 3 % 0.96x + 38 0.99Brasilia 73563 649 +25 +4 % 35 5 % 1.02x + 13 0.99Alice Springs 442315 715 +11 +2 % 23 3 % 1.00x + 12 0.99Lauder 117090 600 +6 +1 % 21 4 % 0.99x + 13 0.99
Table 3.Comparison between clear-sky beam irradiances on horizontal surface measured by BSRN and estimated by McClear.
Mean Rel. Rel. Fitted SquaredNumber of observed Bias bias RMSE RMSE straight orcrel.
Station samples value W m−2 W m−2 % W m−2 % line coeff.
Barrow 70283 406 −21 −5 % 41 10 % 0.96x − 3 0.93Palaiseau 29222 492 −3 −1 % 37 7 % 1.02x − 13 0.96Carpentras 300468 505 −1 −0 % 35 7 % 1.00x − 2 0.97Payerne 136879 530 +6 +1 % 39 7 % 0.99x + 14 0.96Xianghe 33795 642 −22 −4 % 64 11 % 0.86x + 66 0.74Tateno 133433 485 −16 −3 % 44 9 % 1.04x − 37 0.94Sede Boqer 304550 667 −48 −7 % 62 9 % 0.98x − 38 0.95Tamanrasset 331045 653 +16 +2 % 48 7 % 1.05x − 14 0.95Brasilia 73563 560 +33 +6 % 48 9 % 1.06x + 1 0.98Alice Springs 442315 634 +4 +1 % 33 5 % 1.02x − 10 0.98Lauder 117090 544 −32 −6 % 48 9 % 0.93x + 3 0.98
agreement with AERONET observations. Wang et al. (2011)found that the aerosol optical depth estimated by MODIS andfurther assimilated in the MACC analyses is greater than thatobserved by the AERONET instrument. This may explain theunderestimation ofEdir by McClear. The range of values forKT and KTdir are very limited (Figs. 10 and 11). As a conse-quence, the correlation coefficients are low. The bias is small– −1 % for KT and−4 % for KTdir – as is the RMSE: 5 %and 11 %.
Tables 2 and 3 report statistical quantities on the deviationsbetween estimates and measurements inEglo andEdir for the11 stations. Similar tables were constructed for KT and KTdir
(Tables 4 and 5).The correlation coefficient inEglo is very large (r ≥ 0.95)
for all stations (Table 2). The bias ranges between−7 and+25 W m−2, i.e. less than 4 % of the mean observed value.Largest biases in relative value are found in Brasilia (Brazil),Payerne (Switzerland), and Carpentras (France). The slopeof the fitting line is close to 1, between 0.96 and 1.04. The
RMSE ranges between 20 and 36 W m−2 and is less than 5 %of the mean observed value in all cases.
One should note that the statistical quantities slightly varyfrom one year to another. For example, the bias inEglo forPayerne is 23 W m−2 in 2005, 17 W m−2 in 2006, 23 W m−2
in 2007, and 26 W m−2 in 2008. As a whole, no clear trendwas observed between these quantities and the year. Thereis also no clear trend with the aerosol properties and type,ground albedo, or content in ozone and water vapour. How-ever, it appears that results are usually better for the summermonths than for winter. The bias varies with2S though notrend appears (Fig. 12). The RMSE exhibits a tendency todecrease with increasing2S, but one should note that thechanges may be complex (Fig. 13). The relative bias and therelative RMSE are not constant as a function of2S.
The correlation coefficient forEdir (Table 3) is alsovery large (r ≥ 0.96) for all stations except Xianghe (r =
0.86). The bias ranges between−48 and+33 W m−2, andis less than 7 % of the mean observed value. Lowest bi-ases in absolute values, less than 6 W m−2, are found in
Atmos. Meas. Tech., 6, 2403–2418, 2013 www.atmos-meas-tech.net/6/2403/2013/
M. Lef evre et al.: McClear: a new model estimating downwelling solar radiation 2413
Table 4.Comparison between clear-sky global clearness indices measured by BSRN and estimated by McClear.
Mean Rel. Rel. SquaredNumber of observed bias RMSE correl.
Station samples value Bias % RMSE % coeff.
Barrow 70283 0.76 −0.017 −2 % 0.033 4 % 0.77Palaiseau 29222 0.71 +0.002 +0 % 0.029 4 % 0.62Carpentras 300468 0.72 +0.023 +3 % 0.035 5 % 0.69Payerne 136879 0.73 +0.024 +3 % 0.037 5 % 0.60Xianghe 33795 0.75 −0.009 −1 % 0.036 5 % 0.37Tateno 133433 0.72 +0.019 +3 % 0.039 5 % 0.45Sede Boqer 304550 0.75 +0.010 +1 % 0.032 4 % 0.55Tamanrasset 331045 0.79+0.013 +2 % 0.027 4 % 0.71Brasilia 73563 0.74 +0.022 +3 % 0.032 4 % 0.74Alice Springs 442315 0.77 +0.013 +2 % 0.024 3 % 0.83Lauder 117090 0.74 +0.015 +2 % 0.029 4 % 0.75
Table 5.Comparison between clear-sky beam clearness indices on horizontal surface measured by BSRN and estimated by McClear.
Mean Rel. Rel. SquaredNumber of observed bias RMSE correl.
Station samples value Bias % RMSE % coeff.
Barrow 70283 0.61 −0.040 −6 % 0.066 11 % 0.55Palaiseau 29222 0.58 −0.011 −2 % 0.046 8 % 0.61Carpentras 300468 0.60 −0.004 −1 % 0.044 7 % 0.64Payerne 136879 0.61 +0.004 1 % 0.048 8 % 0.53Xianghe 33795 0.61 −0.025 −4 % 0.069 11 % 0.24Tateno 133433 0.59 −0.021 −4 % 0.057 10 % 0.44Sede Boqer 304550 0.64 −0.053 −8 % 0.067 11 % 0.59Tamanrasset 331045 0.66 +0.014 +2 % 0.043 7 % 0.64Brasilia 73563 0.63 +0.029 +5 % 0.044 7 % 0.75Alice Springs 442315 0.67 +0.002 +0 % 0.037 6 % 0.75Lauder 117090 0.66 −0.035 −5 % 0.054 8 % 0.72
Europe (Palaiseau, Carpentras, Payerne) and Australia (AliceSprings), while largest values are found in Xianghe (China,−22 W m−2), Sede Boquer (Israel,−48 W m−2), Brasilia(+33 W m−2), and Lauder (New Zealand,−32 W m−2). Thefitting line is close to the identity line, with slopes ranging be-tween 0.96 and 1.04, except for Xianghe (0.86) and Lauder(0.93). The RMSE is small in all cases and ranges between33 and 68 W m−2, i.e. less than 5 % to 11 % of the observedmeans. Largest RMSEs (≥ 50 W m−2) are found for stationsoffering large bias (Xianghe and Sede Boqer). The good per-formances inEdir are likely due to the accurate represen-tation of aerosol properties and their change in time by theMACC data.
As a whole, we have observed no clear trend in perfor-mances with year, or aerosol properties and type, groundalbedo, or content in ozone and water vapour. Similarly toEglo, the statistical quantities vary slightly from one year toanother. Results are usually better for the winter months thanfor summer, contrary toEglo. The bias varies with2S thoughno trend appears (Fig. 14). Except for Xianghe and Sede
Boqer, the RMSE decreases with increasing2S (Fig. 15).The relative bias and the relative RMSE are not constant as afunction of2S.
The circumsolar irradiance was not taken into account toadjustEdir estimated by McClear to ground measurements.Pyrheliometers have an aperture angle of 5◦, and thereforeinclude part of the circumsolar radiation into the measuredEdir. This circumsolar irradiance under clear sky is less than10 W m−2 (Oumbe et al., 2012); it may partly explain thebias in case of underestimation.
The diffuse componentEdiff is computed by subtractingEdir from Eglo. Therefore, the bias inEdiff can be computedfrom Tables 2 and 3. It ranges from−8 to 60 W m−2. As awhole,Ediff is overestimated, except for Brasilia and Taman-rasset.
The bias for the clearness index KT (Table 4) ranges from−0.017 (−2 %) to 0.022 (3 %). The relative RMSE com-prises between 4 % and 5 % of the mean observed value.The squared correlation coefficients for the clearness indexKT have been reported in Table 4. They should be discussed
www.atmos-meas-tech.net/6/2403/2013/ Atmos. Meas. Tech., 6, 2403–2418, 2013
2414 M. Lefevre et al.: McClear: a new model estimating downwelling solar radiation
44
-20
-10
0
10
20
30
40
0 10 20 30 40 50 60 70 75 80
Bia
s (W
/m2)
Solar zenith angle (degree)
Global irradianceBarrow
Palaiseau
Carpentras
Payerne
Xianghe
Tateno
Sede Boqer
Tamanrasset
Brasilia
Alice Springs
Lauder
1
Fig. 12 2
3
4
0
10
20
30
40
50
60
0 10 20 30 40 50 60 70 75 80
RM
SE (
W/m
2)
Solar zenith angle (degree)
Global irradianceBarrow
Palaiseau
Carpentras
Payerne
Xianghe
Tateno
Sede Boqer
Tamanrasset
Brasilia
Alice Springs
Lauder
5
Fig. 13 6
7
Fig. 12.Change in bias as a function of the solar zenith angle for allstations. Global irradiance.
44
-20
-10
0
10
20
30
40
0 10 20 30 40 50 60 70 75 80
Bia
s (W
/m2)
Solar zenith angle (degree)
Global irradianceBarrow
Palaiseau
Carpentras
Payerne
Xianghe
Tateno
Sede Boqer
Tamanrasset
Brasilia
Alice Springs
Lauder
1
Fig. 12 2
3
4
0
10
20
30
40
50
60
0 10 20 30 40 50 60 70 75 80
RM
SE (
W/m
2)
Solar zenith angle (degree)
Global irradianceBarrow
Palaiseau
Carpentras
Payerne
Xianghe
Tateno
Sede Boqer
Tamanrasset
Brasilia
Alice Springs
Lauder
5
Fig. 13 6
7
Fig. 13.Change in RMSE as a function of the solar zenith angle forall stations. Global irradiance.
with care as the limited range of values tends to decrease thecorrelation coefficient without denoting poor performance asdiscussed previously.
The bias for KTdir (Table 5) ranges from−0.053 (Sede Bo-quer,−8 %) to 0.029 (Brasilia,+5 %). The relative RMSEcomprises between 6 % and 11 % of the mean observedvalue.
One may note that the stations Carpentras, Payerne, Xi-anghe, Tateno, and Lauder have elevations below the meanMACC elevation (Table 1). No further elevation correction isapplied in these cases; the elevation used for computation isthe mean MACC elevation. Consequently, one may expect anoverestimation of the direct component because of the theo-retical underestimation of the air mass. This is not what is ob-served; over these 5 cases, 4 exhibit underestimation. For thetime being, this effect is unnoticeable compared to remaininguncertainties in aerosol modelling as input data source.
45
-80
-60
-40
-20
0
20
40
60
80
100
0 10 20 30 40 50 60 70 75 80
Bia
s (W
/m2)
Solar zenith angle (degree)
Direct irradiance Barrow
Palaiseau
Carpentras
Payerne
Xianghe
Tateno
Sede Boqer
Tamanrasset
Brasilia
Alice Springs
Lauder
1
Fig. 14 2
3
4
0
10
20
30
40
50
60
70
80
90
100
0 10 20 30 40 50 60 70 75 80
RM
SE (
W/m
2)
Solar zenith angle (degree)
Direct irradianceBarrow
Palaiseau
Carpentras
Payerne
Xianghe
Tateno
Sede Boqer
Tamanrasset
Brasilia
Alice Springs
Lauder
5
Fig. 15 6
Fig. 14.Change in bias as a function of the solar zenith angle for allstations. Direct irradiance.
45
-80
-60
-40
-20
0
20
40
60
80
100
0 10 20 30 40 50 60 70 75 80
Bia
s (W
/m2)
Solar zenith angle (degree)
Direct irradiance Barrow
Palaiseau
Carpentras
Payerne
Xianghe
Tateno
Sede Boqer
Tamanrasset
Brasilia
Alice Springs
Lauder
1
Fig. 14 2
3
4
0
10
20
30
40
50
60
70
80
90
100
0 10 20 30 40 50 60 70 75 80
RM
SE (
W/m
2)
Solar zenith angle (degree)
Direct irradianceBarrow
Palaiseau
Carpentras
Payerne
Xianghe
Tateno
Sede Boqer
Tamanrasset
Brasilia
Alice Springs
Lauder
5
Fig. 15 6 Fig. 15.Change in RMSE as a function of the solar zenith angle forall stations. Direct irradiance.
6 Comparison with other modelled clear-sky values
Several models for assessing the SSI under clear sky can befound in the literature. They are usually validated againstground measurements as done in the present work but witha noticeable difference: inputs are atmospheric parameterstaken from collocated measuring instruments. Hence thesevalidations qualify the intrinsic performances of the modelrather than its real-life performances (Gueymard, 2012;Ineichen, 2006; Mueller et al., 2004; Rigollier et al., 2000).
Schillings et al. (2004) have performed validation of theirmodel against hourly irradiance received on a plane normalto the sun rays for 8 sites in Saudi Arabia. Clear-sky instantsare defined by the values of their model. Their results can-not be directly compared to ours which have been obtainedfor Edir (horizontal surface). However, relative RMSE can becompared: it ranges from 13 % to 17 % in their case, and 7 %(Tamanrasset) and 9 % (Sede Boqer) in ours.
Greuell et al. (2013) have developed a method for the re-trieval of hourly means of the SSI using Meteosat images.MACC data are inputs to their method. Comparisons weremade with several BSRN stations for the year 2006 for clear-sky cases and all skies. Though the period is not similar and
Atmos. Meas. Tech., 6, 2403–2418, 2013 www.atmos-meas-tech.net/6/2403/2013/
M. Lef evre et al.: McClear: a new model estimating downwelling solar radiation 2415
Table 6. Comparison between clear-sky global irradiances on a horizontal surface measured by BSRN and estimated by HelioClim-3v3(HC3v3, in italics) or by McClear.
Mean Rel. Rel. SquaredNumber of observed Bias bias RMSE RMSE correl.
Station samples value W m−2 W m−2 % W m−2 % coeff.
Palaiseau HC3v3 28292 598 −1 −0 % 62 10 % 0.97McClear 29222 598 +7 +1 % 25 4 % 0.99
Carpentras HC3v3 298410 596 −11 −2 % 45 8 % 0.98McClear 300468 596 +20 +3 % 29 5 % 0.99
Payerne HC3v3 136225 629 −43 −7 % 62 10 % 0.96McClear 136879 629 +23 +4 % 31 5 % 0.99
Sede Boqer HC3v3 303869 784 −35 −4 % 54 7 % 0.96McClear 304550 785 +12 +2 % 27 4 % 0.99
Tamanrasset HC3v3 330194 791 −24 −3 % 37 5 % 0.99McClear 331045 791 +8 +1 % 20 3 % 0.99
Table 7. Comparison between clear-sky beam irradiances on a horizontal surface measured by BSRN and estimated by HelioClim-3v3(HC3v3, in italics) or by McClear.
Mean Rel. Rel. SquaredNumber of observed Bias bias RMSE RMSE correl.
Station samples value W m−2 W m−2 % W m−2 % coeff.
Palaiseau HC3v3 28292 492 −14 −3 % 79 16 % 0.91McClear 29222 492 −3 −1 % 37 7 % 0.96
Carpentras HC3v3 298410 505 −46 −9 % 76 15 % 0.93McClear 300468 505 −1 −0 % 35 7 % 0.97
Payerne HC3v3 136225 530 −94 −18 % 111 21 % 0.90McClear 136879 530 +6 +1 % 39 7 % 0.96
Sede Boqer HC3v3 303869 667 −89 −13 % 118 18 % 0.85McClear 304550 667 −48 −7 % 62 9 % 0.95
Tamanrasset HC3v3 330194 653 −14 −2% 87 13% 0.86McClear 331045 653 +16 +2 % 48 7 % 0.95
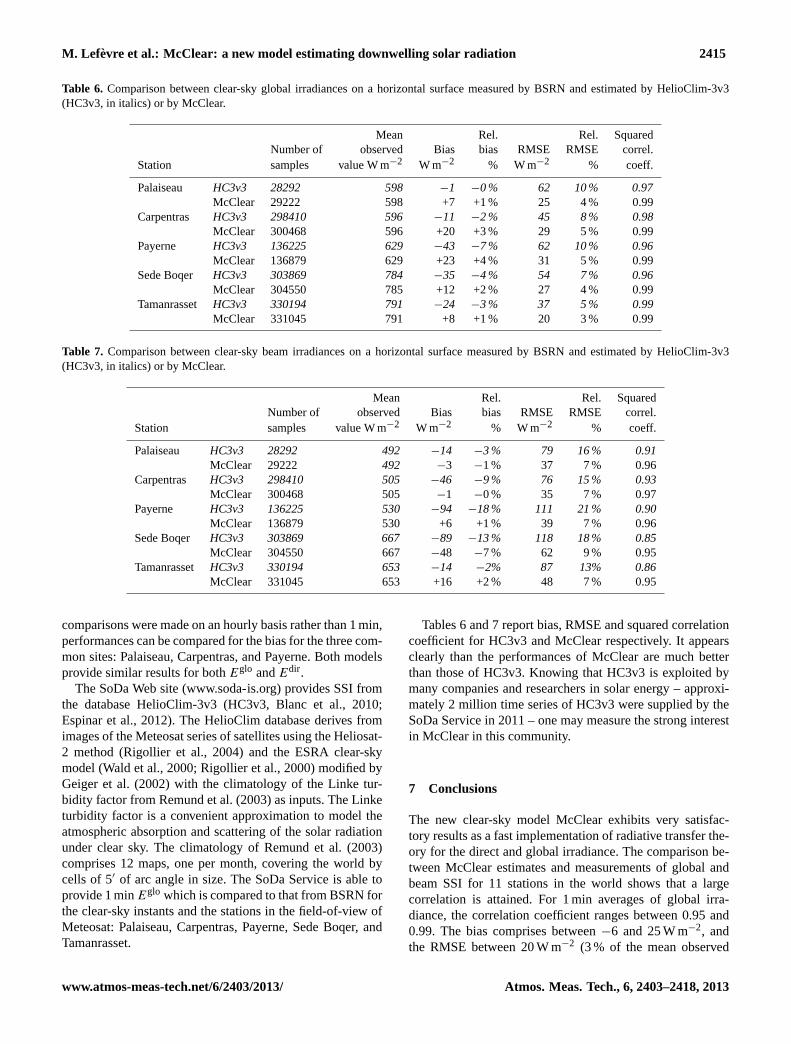
comparisons were made on an hourly basis rather than 1 min,performances can be compared for the bias for the three com-mon sites: Palaiseau, Carpentras, and Payerne. Both modelsprovide similar results for bothEglo andEdir.
The SoDa Web site (www.soda-is.org) provides SSI fromthe database HelioClim-3v3 (HC3v3, Blanc et al., 2010;Espinar et al., 2012). The HelioClim database derives fromimages of the Meteosat series of satellites using the Heliosat-2 method (Rigollier et al., 2004) and the ESRA clear-skymodel (Wald et al., 2000; Rigollier et al., 2000) modified byGeiger et al. (2002) with the climatology of the Linke tur-bidity factor from Remund et al. (2003) as inputs. The Linketurbidity factor is a convenient approximation to model theatmospheric absorption and scattering of the solar radiationunder clear sky. The climatology of Remund et al. (2003)comprises 12 maps, one per month, covering the world bycells of 5′ of arc angle in size. The SoDa Service is able toprovide 1 minEglo which is compared to that from BSRN forthe clear-sky instants and the stations in the field-of-view ofMeteosat: Palaiseau, Carpentras, Payerne, Sede Boqer, andTamanrasset.
Tables 6 and 7 report bias, RMSE and squared correlationcoefficient for HC3v3 and McClear respectively. It appearsclearly than the performances of McClear are much betterthan those of HC3v3. Knowing that HC3v3 is exploited bymany companies and researchers in solar energy – approxi-mately 2 million time series of HC3v3 were supplied by theSoDa Service in 2011 – one may measure the strong interestin McClear in this community.
7 Conclusions
The new clear-sky model McClear exhibits very satisfac-tory results as a fast implementation of radiative transfer the-ory for the direct and global irradiance. The comparison be-tween McClear estimates and measurements of global andbeam SSI for 11 stations in the world shows that a largecorrelation is attained. For 1 min averages of global irra-diance, the correlation coefficient ranges between 0.95 and0.99. The bias comprises between−6 and 25 W m−2, andthe RMSE between 20 W m−2 (3 % of the mean observed
www.atmos-meas-tech.net/6/2403/2013/ Atmos. Meas. Tech., 6, 2403–2418, 2013
2416 M. Lefevre et al.: McClear: a new model estimating downwelling solar radiation
irradiance) and 36 W m−2 (5 %). For direct irradiance, thecorrelation coefficient ranges between 0.84 and 0.99. Thebias comprises between−48 and 33 W m−2, and the RMSEbetween 33 W m−2 (5 % of the mean observed irradiance)and 64 W m−2 (10 %). As a whole, 95 % of the deviations areless than approximately 50 W m−2 for global and 70 W m−2
for direct irradiance.Comparisons with state-of-the-art clear-sky models show
that McClear offers similar or better performances. Thesevery good results demonstrate the quality of the McClearmodel and indirectly the quality of the aerosol propertiesmodelled by the MACC reanalysis.
Performances are still far from WMO standards: bias lessthan 3 W m−2 and 95 % of the deviations less than 20 W m−2.Uncertainties in aerosol properties from MACC are still toolarge, and more efforts are necessary for a better modellingof the aerosols.
The novelty of the McClear model is the inclusion of vari-able aerosol optical properties, water vapour, and ozone witha high update frequency of 3 h compared to the previouslyused monthly climatologies in clear-sky models. The largecorrelation coefficient and the low standard deviation, com-puted from the RMSE and bias, demonstrate that McClearoffers accurate estimates of changes in time of the SSI.
Since MACC provides also forecasts of the aerosol proper-ties and ozone, and various meteorological services provideforecasts of water vapour from any NWP centre, McClearcan also be used for forecasting of clear-sky irradiances infuture.
The McClear model with inputs from MACC and MODISis available as a Web service, i.e. an application that can beinvoked via the Web. It obeys the OGC (Open GeospatialConsortium) standard for Web processing services (WPS)(Percivall et al., 2011). An interface has been developed tolaunch McClear within a standard Web browser and to ob-tain time series of global and beam SSI under clear sky fora given point and a given period for the following summa-rizations: 1 min, 15 min, 1 h and 1 day. This interface can belaunched via the catalogue of products on the MACC Website (www.gmes-atmosphere.eu).
Acknowledgements.The research leading to these results hasreceived funding from the European Union’s Seventh FrameworkProgramme (FP7/2007-2013) under grant agreement no. 218793(MACC project) and no. 283576 (MACC-II project). The authorsthank all ground station operators of the BSRN network for theirvaluable measurements and the Alfred Wegener Institute forhosting the BSRN website. The authors thank the team developinglibRadtran (http://www.libradtran.org) and Laurent Saboret for hisvaluable help in setting up the McClear application on the Web.They also thank the anonymous reviewers whose efforts help inbringing clarity in our work.
Edited by: G. de Leeuw
References
Ba, M., Frouin, R., Nicholson, S., and Dedieu, G.: Satellite-derivedsurface radiation budget over the African continent. Part I: Esti-mation of downward solar irradiance and albedo, J. Climate, 14,60–76, 2001.
Benedetti, A., Morcrette, J.-J., Boucher, O., Dethof, A., Engelen,R. J., Fisher, M., Flentje, H., Huneeus, N., Jones, L., Kaiser,J. W., Kinne, S., Manglold, A., Razinger, M., Simmons, A. J.,and Suttie, M.: Aerosol analysis and forecast in the EuropeanCentre for Medium-Range Weather Forecasts Integrated ForecastSystem: 2. Data assimilation, J. Geophys. Res., 114, D13205,doi:10.1029/2008JD011115, 2009.
Blanc, P. and Wald, L.: The SG2 algorithm for a fast and accuratecomputation of the position of the Sun, Sol. Energy, 86, 3072–3083, doi:10.1016/j.solener.2012.07.018, 2012.
Blanc, P., Gschwind, B., Lefevre, M., and Wald, L.: The HelioClimproject: Surface solar irradiance data for climate applications,Remote Sens., 3, 343–361, doi:10.3390/rs3020343, 2010.
Cano, D., Monget, J. M., Albuisson, M., Guillard, H., Regas, N.,and Wald, L.: A method for the determination of the global so-lar radiation from meteorological satellites data, Sol. Energy, 37,31–39, 1986.
Darnell, W. L., Staylor, W. F., Ritchey, N. A., Gupta, S. K., andWilber, A. C.: Surface radiation budget: A long-term globaldataset of shortwave and longwave fluxes, EOS T. Am. Geophys.Un., available at:http://www.agu.org/eoselec/95206.html(lastaccess: 17 September 2013), 27 February 1996.
Deepshikha, S., Satheesh, S. K., and Srinivasan, J.: Dust aerosolsover India and adjacent continents retrieved using METEOSATinfrared radiance Part I: sources and regional distribution, Ann.Geophys., 24, 37–61, doi:10.5194/angeo-24-37-2006, 2006.
Deneke, H. M., Feijt, A. J., and Roebeling, R. A.: Estimating sur-face solar irradiance from Meteosat SEVIRI-derived cloud prop-erties, Remote Sens. Environ., 12, 3131–3141, 2008.
Diabate, L., Demarcq, H., Michaud-Regas, N., and Wald, L.: Es-timating incident solar radiation at the surface from images ofthe Earth transmitted by geostationary satellites: the HeliosatProject, Int. J. Solar Energy, 5, 261–278, 1988.
Elias, T. and Roujean, J.-L.: Estimation of the aerosol radiativeforcing at ground level, over land, and in cloudless atmosphere,from METEOSAT-7 observation: method and case study, Atmos.Chem. Phys., 8, 625–636, doi:10.5194/acp-8-625-2008, 2008.
Espinar, B., Wald, L., Blanc, P., Lefevre, M., Gschwind,B., Menard, L., Wey, E., Thomas, C., and Saboret, L.:HELIOCLIM-3: A near-real time and long-term surface so-lar irradiance database, Workshop on Remote Sensing Mea-surements for Renewable Energy, 22–23 May 2012, availableat: http://hal-ensmp.archives-ouvertes.fr/docs/00/74/15/64/PDF/2012COSTWIRE HC3 extendedabstractv2.pdf (last access:24 January 2013), Risoe, Denmark, 2012.
FAO: Koeppen climate classification map, available at:www.fao.org/sd/EIdirect/climate/EIsp0002.htm(last access: 21 December2012), 1997.
GCOS – Global Climate Observing System Essential ClimateVariables: available at:www.wmo.int/pages/prog/gcos/index.php?name=EssentialClimateVariables, last access: 16 November2012.
Geiger, M., Diabate, L., Menard, L., and Wald, L.: A web servicefor controlling the quality of measurements of global solar irra-
Atmos. Meas. Tech., 6, 2403–2418, 2013 www.atmos-meas-tech.net/6/2403/2013/
M. Lef evre et al.: McClear: a new model estimating downwelling solar radiation 2417
diation, Sol. Energy, 73, 475–480, 2002.Gruell, W., Meirink, J. F., and Wang, P.: Retrieval and validation
of global, direct, and diffuse irradiance derived from SEVIRIsatellite observations, J. Geophys. Res. Atmos., 118, 2340–2361,doi:10.1002/jgrd.50194, 2013.
Gueymard, C.: Importance of atmospheric turbidity and associateduncertainties in solar radiation and luminous efficacy modelling,Energy, 30, 1603–1621, 2005.
Gueymard, C.: Clear-sky irradiance predictions for solar re-source mapping and large-scale applications: Improved val-idation methodology and detailed performance analysis of18 broadband radiative models, Sol. Energy, 86, 2145–2169,doi:10.1016/j.solener.2011.11.011, 2012.
Holzer-Popp, T., Schroedter, M., and Gesell, G.: Retrieving aerosoloptical depth and type in the boundary layer over land and oceanfrom simultaneous GOME spectrometer and ATSR-2 radiome-ter measurements, 1, Method description, J. Geophys. Res., 107,4578, doi:10.1029/2001JD002013, 2002.
Huang, G. H., Ma, M. G., Liang, S. L., Liu, S. M., and Li, X.: ALUT-based approach to estimate surface solar irradiance by com-bining MODIS and MTSAT data, J. Geophys. Res.-Atmos., 116,D22201, doi:10.1029/2011JD016120, 2011.
Ineichen, P.: Comparison of eight clear sky broadband modelsagainst 16 independent data banks, Sol. Energy, 80, 468–478,2006.
Ineichen, P. and Perez, R.: Derivation of cloud index from geosta-tionary satellites and application to the production of solar irradi-ance and daylight illuminance data, Theor. Appl. Climatol., 64,119–130, 1999.
Inness, A., Baier, F., Benedetti, A., Bouarar, I., Chabrillat, S., Clark,H., Clerbaux, C., Coheur, P., Engelen, R. J., Errera, Q., Flem-ming, J., George, M., Granier, C., Hadji-Lazaro, J., Huijnen,V., Hurtmans, D., Jones, L., Kaiser, J. W., Kapsomenakis, J.,Lefever, K., Leitao, J., Razinger, M., Richter, A., Schultz, M. G.,Simmons, A. J., Suttie, M., Stein, O., Thepaut, J.-N., Thouret, V.,Vrekoussis, M., Zerefos, C., and the MACC team: The MACCreanalysis: an 8 yr data set of atmospheric composition, Atmos.Chem. Phys., 13, 4073–4109, doi:10.5194/acp-13-4073-2013,2013.
ISO Guide to the Expression of Uncertainty in Measurement: firstedition, International Organization for Standardization, Geneva,Switzerland, 1995.
Kaiser, J. W., Peuch, V.-H., Benedetti, A., Boucher, O., Enge-len, R. J., Holzer-Popp, T., Morcrette, J.-J., Wooster, M. J.,and the MACC-II Management Board: The pre-operationalGMES Atmospheric Service in MACC-II and its potential us-age of Sentinel-3 observations, ESA Special Publication SP-708, Proceedings of the 3rd MERIS/(A)ATSR and OCLI-SLSTR(Sentinel-3) Preparatory Workshop, held in ESA-ESRIN, Fras-cati, Italy, 15–19 October 2012, 2012a.
Kaiser, J. W., Heil, A., Andreae, M. O., Benedetti, A., Chubarova,N., Jones, L., Morcrette, J.-J., Razinger, M., Schultz, M. G.,Suttie, M., and van der Werf, G. R.: Biomass burning emis-sions estimated with a global fire assimilation system basedon observed fire radiative power, Biogeosciences, 9, 527–554,doi:10.5194/bg-9-527-2012, 2012b.
Kasten, F. and Young, A. T.: Revised optical air mass tables andapproximation formula, Appl. Optics, 28, 4735–4738, 1989.
Lefevre, M., Diabate, L., and Wald, L.: Using reduced data setsISCCP-B2 from the Meteosat satellites to assess surface solarirradiance, Sol. Energy, 81, 240–253, 2007.
Long, C. N. and Ackerman, T. P.: Identification of clear skies frombroadband pyranometer measurements and calculation of down-welling shortwave cloud effects, J. Geophys. Res., 105, 15609,doi:10.1029/2000JD900077, 2000.
Mayer, B. and Kylling, A.: Technical note: The libRadtran soft-ware package for radiative transfer calculations – descriptionand examples of use, Atmos. Chem. Phys., 5, 1855–1877,doi:10.5194/acp-5-1855-2005, 2005.
Mayer, B., Kylling, A., Emde, C., Buras, R., and Hamann, U.: li-bRadtran: library for radiative transfer calculations, Edition 1.0for libRadtran version 1.5-beta,http://www.libradtran.org(lastaccess: 10 April 2013), 2010.
Morcrette, J.-J., Beljaars, A., Benedetti, A., Jones, L., and Boucher,O.: Sea-salt and dust aerosols in the ecmwf ifs model, Geophys.Res. Lett., 35, L24813, doi:10.1029/2008GL036041, 2008.
Morcrette, J.-J., Boucher, O., Jones, L., Salmond, D., Bechtold, P.,Beljaars, A., Benedetti, A., Bonet, A., Kaiser, J. W., Razinger,M., Schulz, M., Serrar, S., Simmons, A. J., Sofiev, M., Suttie, M.,Tompkins, A. M., and Untch, A.: Aerosol analysis and forecastin the European Centre for Medium-Range Weather Forecasts In-tegrated Forecast System: Forward modelling, J. Geophys. Res.,114, D06206, doi:10.1029/2008JD011235, 2009.
Mueller, R., Dagestad, K. F., Ineichen, P., Schroedter, M., Cros,S., Dumortier, D., Kuhlemann, R., Olseth, J. A., Piernavieja, G.,Reise, C., Wald, L., and Heinnemann, D.: Rethinking satellitebased solar irradiance modelling – The SOLIS clear sky module,Remote Sens. Environ., 91, 160–174, 2004.
Mueller, R., Matsoukas, C., Gratzki, A., Behr, H., and Hollmann,R.: The CM-SAF operational scheme for the satellite basedretrieval of solar surface irradiance – a LUT based eigenvec-tor hybrid approach, Remote Sens. Environ., 113, 1012–1024,doi:10.1016/j.rse.2009.01.012, 2009.
Ohmura, A., Gilgen, H., Hegner, H., Mueller, G., Wild, M., Dut-ton, E. G., Forgan, B., Froelich, C., Philipona, R., Heimo,A., Koenig-Langlo, G., McArthur, B., Pinker, R., Whitlock,C. H., and Dehne, K.: Baseline Surface Radiation Network(BSRN/WCRP): New precision radiometry for climate research,B. Am. Meteorol. Soc., 79, 2115–2136, doi:10.1175/1520-0477(1998)079<2115:BSRNBW>2.0.CO;2, 1998.
Oumbe, A., Blanc, P., Gschwind, B., Lefevre, M., Qu, Z.,Schroedter-Homscheidt, M., and Wald, L.: Solar irradiance inclear atmosphere: study of parameterisations of change with al-titude, Adv. Sci. Res., 6, 199–203, doi:10.5194/asr-6-199-2011,2011.
Oumbe, A., Qu, Z., Blanc, P., Bru, H., Lefevre, M., and Wald, L.:Modeling circumsolar irradiance to adjust beam irradiances fromradiative transfer models to measurements, EMS Annual Meet-ing 2012, 10–14 September 2012, Lodz, Poland, 2012.
Percivall, G., Menard, L., Chung, L.-K., Nativi, S., and Pearl-man, J.: Geo-processing in cyberinfrastructure: making the weban easy to use geospatial computational platform, in: Proceed-ings, 34th International Symposium on Remote Sensing ofEnvironment, 10–15 April 2011, available at:www.isprs.org/proceedings/2011/ISRSE-34/211104015Final00671.pdf(last ac-cess: 29 December 2012), Sydney, Australia, 2011.
www.atmos-meas-tech.net/6/2403/2013/ Atmos. Meas. Tech., 6, 2403–2418, 2013
2418 M. Lefevre et al.: McClear: a new model estimating downwelling solar radiation
Perez, R., Seals, R., and Zelenka, A.: Comparing satellite remotesensing and ground network measurements for the production ofsite/time specific irradiance data, Sol. Energy, 60, 89–96, 1997.
Peuch, V.-H., Rouil, L., Tarrason, L., and Elbern, H.: TowardsEuropean-scale Air Quality operational services for GMES At-mosphere, 9th EMS Annual Meeting, EMS2009-511, 9th Euro-pean Conference on Applications of Meteorology (ECAM) Ab-stracts, held 28 September–2 October 2009, Toulouse, France,2009.
Posselt, R., Mueller, R. W., Stockli, R., and Trentmann, J.: Re-mote sensing of solar surface radiation for climate monitoring –the CM-SAF retrieval in international comparison, Remote Sens.Environ., 118, 186–198, 2012.
Qu, Z., Blanc, P., Lefevre, M., Wald, L., and Oumbe, A.: Study ofthe MLB parameterisation for change in surface solar irradiancewith sun zenith angle in clear sky, Adv. Sci. Res., 6, 233–236,doi:10.5194/asr-6-233-2011, 2011.
Raschke, E., Gratzki, A., and Rieland, M.: Estimates of global ra-diation at the ground from the reduced data sets of the Interna-tional Satellite Cloud Climatology Project, J. Climate, 7, 205–213, 1987.
Remund, J., Wald, L., Lefevre, M., Ranchin, T., and Page, J.: World-wide Linke turbidity information, CD-ROM published by Inter-national Solar Energy Society, Proceedings of ISES Solar WorldCongress, 16–19 June, Goteborg, Sweden, 2003.
Rigollier, C., Bauer, O., and Wald, L.: On the clear sky model of the4th European Solar Radiation Atlas with respect to the Heliosatmethod, Sol. Energy, 68, 33–48, 2000.
Rigollier, C., Lefevre, M., and Wald, L.: The method Heliosat-2for deriving shortwave solar radiation from satellite images, Sol.Energy, 77, 159–169, 2004.
Roesch, A., Wild, M., Ohmura, A., Dutton, E. G., Long, C. N., andZhang, T.: Assessment of BSRN radiation records for the com-putation of monthly means, Atmos. Meas. Tech., 4, 339–354,doi:10.5194/amt-4-339-2011, 2011.
Schaepman-Strub, G., Schaepman, M. E., Painter, T. H., Dangel,S., and Martonchik, J. V.: Reflectance quantities in optical re-mote sensing: Definitions and case studies, Remote Sens. Envi-ron., 103, 27–42, doi:10.1016/j.rse.2006.03.002, 2006.
Schaaf, C. B., Gao, F., Strahler, A. H., Lucht, W., Li, X. W., Tsang,T., Strugnell, N. C., Zhang, X. Y., Jin, Y. F., Muller, J. P., Lewis,P., Barnsley, M., Hobson, P., Disney, M., Roberts, G., Dun-derdale, M., Doll, C., d’Entremont, R. P., Hu, B. X., Liang, S.L., Privette, J. L., and Roy, D.: First operational BRDF, albedonadir reflectance products from MODIS, Remote Sens. Environ.,83, 135–148, doi:10.1016/S0034-4257(02)00091-3, 2002.
Schiffer, R. and Rossow, W. B.: ISCCP global radiance data set: Anew resource for climate research, B. Am. Meteorol. Soc., 66,1498–1503, 1985.
Schillings, C., Meyer, R., and Mannstein, H.: Validation of a methodfor deriving high resolution direct normal irradiance from satel-lite data and application for the Arabian Peninsula, Sol. Energy,76, 485–497, 2004.
Schmetz, J.: Towards a surface radiation climatology: retrieval ofdownward irradiances from satellites, Atmos. Res., 23, 287–321,1989.
Schulz, J., Albert, P., Behr, H.-D., Caprion, D., Deneke, H., Dewitte,S., Durr, B., Fuchs, P., Gratzki, A., Hechler, P., Hollmann, R.,Johnston, S., Karlsson, K.-G., Manninen, T., Muller, R., Reuter,M., Riihela, A., Roebeling, R., Selbach, N., Tetzlaff, A., Thomas,W., Werscheck, M., Wolters, E., and Zelenka, A.: Operational cli-mate monitoring from space: the EUMETSAT Satellite Applica-tion Facility on Climate Monitoring (CM-SAF), Atmos. Chem.Phys., 9, 1687–1709, doi:10.5194/acp-9-1687-2009, 2009.
Trewartha, G. T.: An Introduction to Climate, 3rd Edn., McGrawHill Book Co., 1954.
Vermote, E. F., Tanre, D., Deuze, J. L., Herman, M., and Morcrette,J. J.: Second Simulation of the satellite signal in the solar spec-trum (6S), 6S User Guide, NASA-Goddard Space Flight Center-Code 923, Greenbelt, USA, 1994.
Vermote, E. F., Tanre, D., Deuze, J. L., Herman, M., and Morcrette,J. J.: Second simulation of the satellite signal in the solar spec-trum: An overview, IEEE T. Geosci. Remote, 35, 675–686, 1997.
Wald, L. and Monget, J. M.: Remote sensing of the sea-state usingthe 0.8–1.1 microns channel (Comments by P. Koepke and reply,6, 787–799, 1985), Int. J. Remote Sens., 4, 433–446, 1983.
Wald, L., Albuisson, M., Czeplak, G., Bourges, B., Aguiar, R.,Lund, H., Joukoff, A., Terzenbach, U., Beyer, H. G., andBorisenko, E. P.: ESRA – European Solar Radiation Atlas, 4thEdn., includ. CD-ROM, edited by: Scharmer, K. and Greif, J.,Scientific advisors: Dogniaux, R. and Page, J. K., published forthe Commission of the European Communities by Presses del’Ecole, Ecole des Mines de Paris, Paris, France, 2000.
Wang, Y., Zhao, F., and Li, Z.: Comparison of aerosol radiativeforcing observed by AERONET and MODIS at Xianghe Sta-tion – Comparison of the aerosol product and its radiative forc-ing between AERONET and MODIS, PIERS Proceedings, heldin Suzhou, China, 12–16 September 2011, available at:http://piers.org/piersproceedings/piers2011SuzhouProc.php(last ac-cess: 24 July 2013), 2011.
WMO: Guide to meteorological instruments and methods of ob-servation, World Meteorological Organization, WMO-No 8, 7thEdn., Geneva, Switzerland, 2008.
Xu, J., Li, C., Shi, H., He, Q., and Pan, L.: Analysis on the im-pact of aerosol optical depth on surface solar radiation in theShanghai megacity, China, Atmos. Chem. Phys., 11, 3281–3289,doi:10.5194/acp-11-3281-2011, 2011.
Zelenka, A., Perez, R., Seals, R., and Renne, D.: Effective accu-racy of satellite-derived hourly irradiances, Theor. Appl. Clima-tol., 62, 199–207, 1999.
Atmos. Meas. Tech., 6, 2403–2418, 2013 www.atmos-meas-tech.net/6/2403/2013/
Related Documents


