Sikkim Manipal University Page No. 99 Research Methodology Unit 5 Unit 5 Attitude Measurement and Scaling Structure 5. 1 Intr od ucti on Objectives 5.2 T ypes of Measureme nt Scale s Attitude 5.3 Cla ssi ficati on of Scales Single Item vs Multiple Item Scale Comparative vs Non-comparative Scales 5.4 Mea sur eme nt Err or Criteria for Good Measurement 5. 5 Case Study 5.6 Summar y 5.7 Glossary 5.8 T ermina l Ques tio ns 5.9 Answers 5.10 References 5. 1 Intr oductio n In the previous unit, we studied the various types, sources and methods of collecting data. In this unit, we will focus on different types of measurements and the statistical techniques that are applicable for the same. The various formats of a rating scale and the construction of the attitude measurement scale, along with the description of the distinct criteria involved in analysing a good measurement scale, are elaborated in this unit. The term ‘measurement’ means assigning numbers or some other symbols to the characteristics of certain objects. When numbers are used, the researcher must have a rule for assigning a number t o an observation in a way that provides an accurate description. We do not measure the object but some characteristic s of it. Therefore, in research, people/consumers are not measured; what is measured only are their perceptions, attitude or any other relevant characteristics. There are two reasons for which numbers are usually assigned. First of all, numbers permit statistical analysis of the resulting data and secondly, they facilitate the communication of measurement results. Scaling is an extension of measurement. Scaling involves creating a continuum on which measurements on objects are located. Suppose you want

Welcome message from author
This document is posted to help you gain knowledge. Please leave a comment to let me know what you think about it! Share it to your friends and learn new things together.
Transcript
8/9/2019 Mb0050 Slm Unit05
http://slidepdf.com/reader/full/mb0050-slm-unit05 1/26
Sikkim Manipal University Page No. 99
Research Methodology Unit 5
Unit 5 Attitude Measurement and Scaling
Structure
5.1 Introduction
Objectives
5.2 Types of Measurement Scales
Attitude
5.3 Classification of Scales
Single Item vs Multiple Item Scale
Comparative vs Non-comparative Scales5.4 Measurement Error
Criteria for Good Measurement
5.5 Case Study
5.6 Summary
5.7 Glossary
5.8 Terminal Questions
5.9 Answers
5.10 References
5.1 Introduction
In the previous unit, we studied the various types, sources and methods of
collecting data. In this unit, we will focus on different types of measurements
and the statistical techniques that are applicable for the same. The various
formats of a rating scale and the construction of the attitude measurement scale,
along with the description of the distinct criteria involved in analysing a good
measurement scale, are elaborated in this unit.
The term ‘measurement’ means assigning numbers or some other symbols
to the characteristics of certain objects. When numbers are used, the researcher
must have a rule for assigning a number to an observation in a way that provides
an accurate description. We do not measure the object but some characteristics
of it. Therefore, in research, people/consumers are not measured; what is
measured only are their perceptions, attitude or any other relevant characteristics.
There are two reasons for which numbers are usually assigned. First of all,
numbers permit statistical analysis of the resulting data and secondly, they
facilitate the communication of measurement results.
Scaling is an extension of measurement. Scaling involves creating a
continuum on which measurements on objects are located. Suppose you want

8/9/2019 Mb0050 Slm Unit05
http://slidepdf.com/reader/full/mb0050-slm-unit05 2/26
Sikkim Manipal University Page No. 100
Research Methodology Unit 5
to measure the satisfaction level towards Kingfisher Airlines and a scale of 1 to
11 is used for the said purpose. This scale indicates the degree of dissatisfaction,
with 1 = extremely dissatisfied and 11 = extremely satisfied.
Objectives
After studying this unit, you should be able to:
• define measurement.
• distinguish between the four types of measurement scales.
• define attitude and its three components.
• discuss the various classifications of scales.
• define measurement error and explain the criteria for good measurement.
5.2 Types of Measurement Scales
There are four types of measurement scales—nominal, ordinal, interval and
ratio. We will discuss each one of them in detail. The choice of the measurement
scale has implications for the statistical technique to be used for data analysis.
Nominal scale: This is the lowest level of measurement. Here, numbers are
assigned for the purpose of identification of the objects. Any object which is
assigned a higher number is in no way superior to the one which is assigned a
lower number. Each number is assigned to only one object and each object has
only one number assigned to it. It may be noted that the objects are divided into
mutually exclusive and collectively exhaustive categories.
Example:
• What is your religion?
(a) Hinduism
(b) Sikhism
(c) Christianity
(d) Islam
(e) Any other, (please specify)
A Hindu may be assigned a number 1, a Sikh may be assigned a number
2, a Christian may be assigned a number 3 and so on. Any religion which is
assigned a higher number is in no way superior to the one which is assigned a
lower number. The assignment of numbers is only for the purpose of identification.
8/9/2019 Mb0050 Slm Unit05
http://slidepdf.com/reader/full/mb0050-slm-unit05 3/26
Sikkim Manipal University Page No. 101
Research Methodology Unit 5
Nominal scale measurements are used for identifying food habits (vegetarian
or non-vegetarian), gender (male/female), caste, respondents, marital status,
brands, attributes, stores, the players of a hockey team and so on.
The assigned numbers cannot be added, subtracted, multiplied or divided.
The only arithmetic operations that can be carried out are the count of each
category. Therefore, a frequency distribution table can be prepared for the
nominal scale variables and mode of the distribution can be worked out. One
can also use chi-square test and compute contingency coefficient using nominal
scale variables.
Ordinal scale: This is the next higher level of measurement than the nominal
scale measurement. One of the limitations of the nominal scale measurements
is that we cannot say whether the assigned number to an object is higher or
lower than the one assigned to another option. The ordinal scale measurement
takes care of this limitation. An ordinal scale measurement tells whether an
object has more or less of characteristics than some other objects. However, it
cannot answer how much more or how much less.
Example:
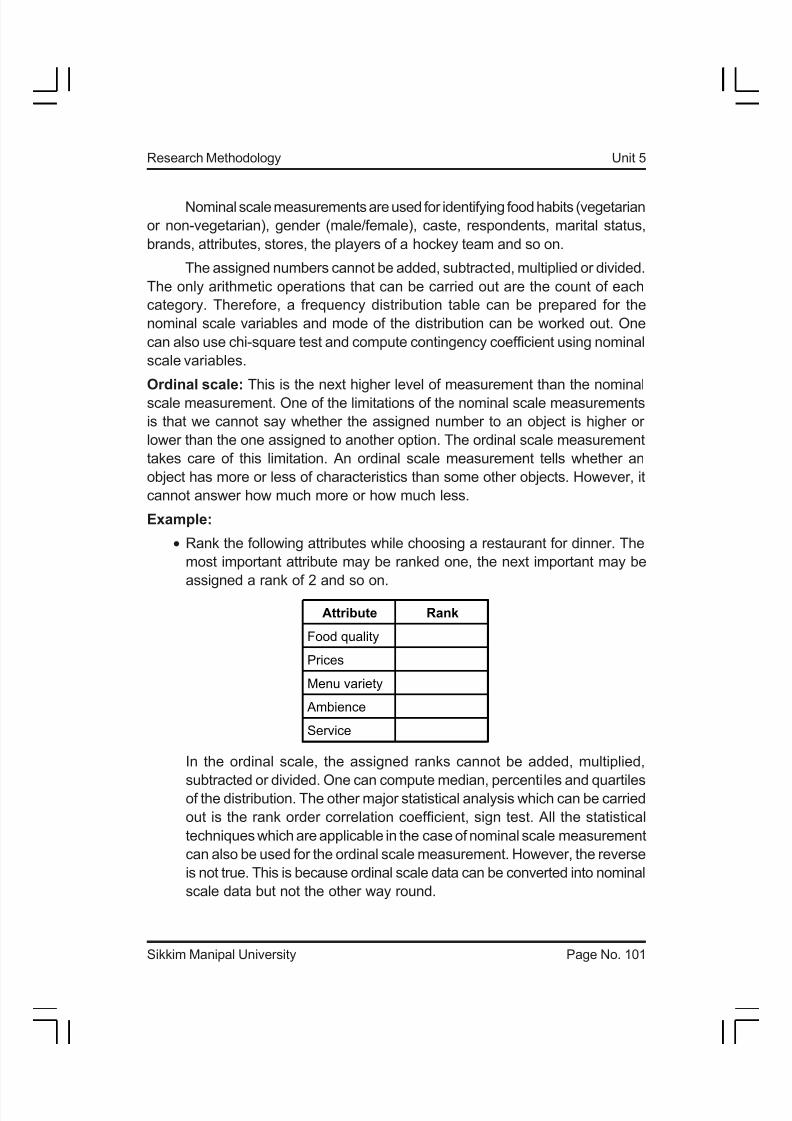
• Rank the following attributes while choosing a restaurant for dinner. The
most important attribute may be ranked one, the next important may be
assigned a rank of 2 and so on.
Attribute Rank
Food quality
Prices
Menu variety
Ambience
Service
In the ordinal scale, the assigned ranks cannot be added, multiplied,
subtracted or divided. One can compute median, percentiles and quartilesof the distribution. The other major statistical analysis which can be carried
out is the rank order correlation coefficient, sign test. All the statistical
techniques which are applicable in the case of nominal scale measurement
can also be used for the ordinal scale measurement. However, the reverse
is not true. This is because ordinal scale data can be converted into nominal
scale data but not the other way round.
8/9/2019 Mb0050 Slm Unit05
http://slidepdf.com/reader/full/mb0050-slm-unit05 4/26
Sikkim Manipal University Page No. 102
Research Methodology Unit 5
Interval scale: The interval scale measurement is the next higher level of
measurement. It takes care of the limitation of the ordinal scale measurement
where the difference between the score on the ordinal scale does not have any
meaningful interpretation. In the interval scale the difference of the score on the
scale has meaningful interpretation. It is assumed that the respondent is able to
answer the questions on a continuum scale. The mathematical form of the data
on the interval scale may be written as
Y = a + b X Where a ≠ 0
In the interval scale, the difference in score has a meaningful interpretation
while the ratio of the score on this scale does not have a meaningful interpretation.
This can be seen from the following interval scale question:
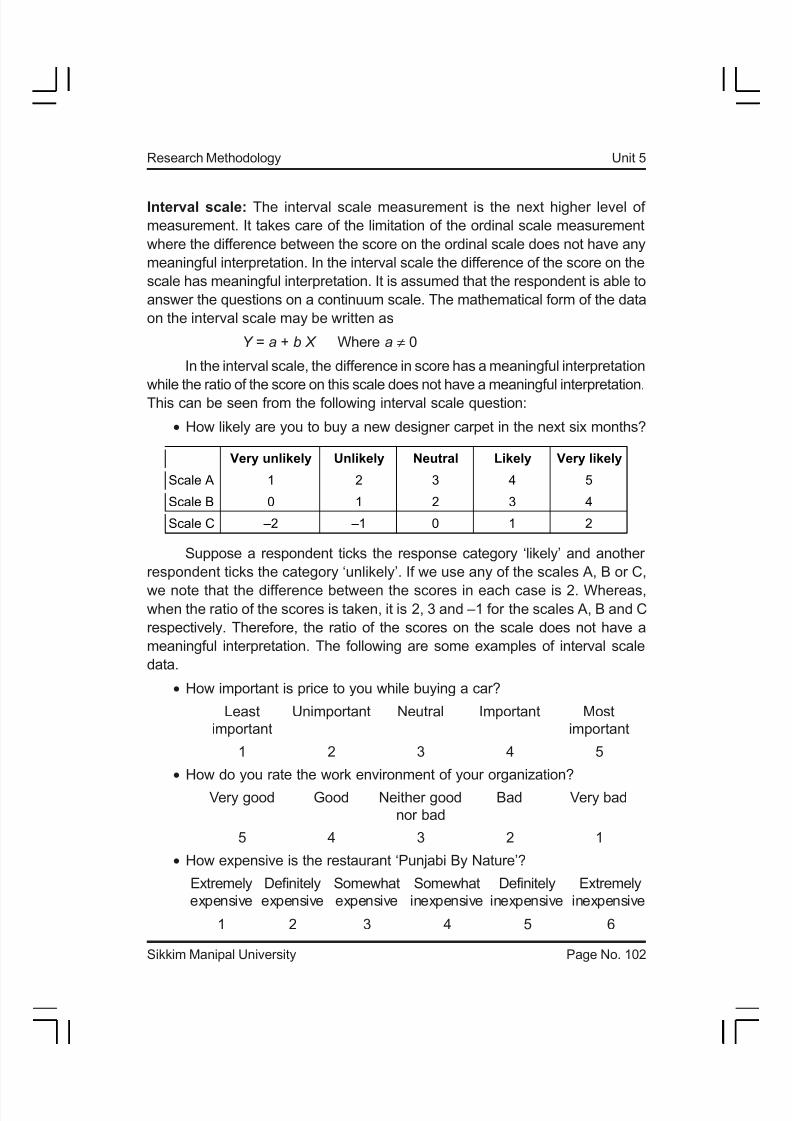
• How likely are you to buy a new designer carpet in the next six months?
Very unlikely Unlikely Neutral Likely Very likely
Scale A 1 2 3 4 5
Scale B 0 1 2 3 4
Scale C –2 –1 0 1 2
Suppose a respondent ticks the response category ‘likely’ and another
respondent ticks the category ‘unlikely’. If we use any of the scales A, B or C,
we note that the difference between the scores in each case is 2. Whereas,when the ratio of the scores is taken, it is 2, 3 and –1 for the scales A, B and C
respectively. Therefore, the ratio of the scores on the scale does not have a
meaningful interpretation. The following are some examples of interval scale
data.
• How important is price to you while buying a car?
Least Unimportant Neutral Important Most
important important
1 2 3 4 5
• How do you rate the work environment of your organization?
Very good Good Neither good Bad Very bad
nor bad
5 4 3 2 1
• How expensive is the restaurant ‘Punjabi By Nature’?
Extremely Definitely Somewhat Somewhat Definitely Extremely
expensive expensive expensive inexpensive inexpensive inexpensive
1 2 3 4 5 6
8/9/2019 Mb0050 Slm Unit05
http://slidepdf.com/reader/full/mb0050-slm-unit05 5/26
Sikkim Manipal University Page No. 103
Research Methodology Unit 5
The numbers on this scale can be added, subtracted, multiplied or divided.
One can compute arithmetic mean, standard deviation, correlation coefficient
and conduct a t-test, Z-test, regression analysis and factor analysis. As the
interval scale data can be converted into the ordinal and the nominal scale
data, therefore all the techniques applicable for the ordinal and the nominal
scale data can also be used for interval scale data.
Ratio scale: This is the highest level of measurement and takes care of the
limitations of the interval scale measurement, where the ratio of the
measurements on the scale does not have a meaningful interpretation. The
ratio scale measurement can be converted into interval, ordinal and nominal
scale. But the other way round is not possible. The mathematical form of the
ratio scale data is given by Y = b X . In this case, there is a natural zero (origin),
whereas in the interval scale we had an arbitrary zero. Examples of the ratio
scale data are weight, distance travelled, income and sales of a company, to
mention a few.
All the mathematical operations can be carried out using the ratio scale
data. In addition to the statistical analysis mentioned in the interval, the ordinal
and the nominal scale data, one can compute coefficient of variation, geometric
mean and harmonic mean using the ratio scale measurement.
5.2.1 Attitude An attitude is viewed as an enduring disposition to respond consistently in a
given manner to various aspects of the world, including persons, events and
objects. A company is able to sell its products or services when its customers
have a favourable attitude towards its products/services. In the reverse scenario,
the company will not be able to sustain itself for long. It, therefore, becomes
very important to measure the attitude of the customers towards the company’s
products/services. Unfortunately, attitude cannot be measured directly. In order
to measure an attitude, we make an inference based on the perceptions the
customers have about the product/services. The attitude is derived from the
perceptions. If the consumers have a favourable perception towards the products/services, the attitude will be favourable. Therefore, the attitudes are indirectly
observed.
Basically, attitude has three components: cognitive, affective and intention
(or action) components.
Cognitive component: This component represents an individual’s information
and knowledge about an object. It includes awareness of the existence of the
object, beliefs about the characteristics or attributes of the object and judgement

8/9/2019 Mb0050 Slm Unit05
http://slidepdf.com/reader/full/mb0050-slm-unit05 6/26
Sikkim Manipal University Page No. 104
Research Methodology Unit 5
about the relative importance of each of the attributes. In a survey, if the
respondents are asked to name the companies manufacturing plastic products,
some respondents may remember names like Tupperware, Modicare and Pearl
Pet. This is called unaided recall awareness. More names are likely to be
remembered when the investigator makes a mention of them. This is aided
recall. The examples of beliefs or judgements could be that the products of
Tupperware are of high quality, non-toxic and can be used in parties; a mutton
dish can be cooked in a pressure cooker in less than 30 minutes and so on.
Affective component: The affective component summarizes a person’s overall
feeling or emotions towards the objects. The examples for this component could
be: the food cooked in a pressure cooker is tasty, taste of orange juice is good
or the taste of bitter gourd is very bad.
Intention or action component: This component of an aptitude, also called
the behavioural component, reflects a predisposition to an action by reflecting
the consumer’s buying or purchase intention. It also reflects a person’s
expectations of future behaviour towards an object.
There is a relationship between attitude and behaviour. If a consumer
does not have a favourable attitude towards the product, he/she will certainly
not buy the product. However, having a favourable attitude does not mean that
it would be reflected in the purchase behaviour. This is because intention to buy
a product has to be backed by the purchasing power of the consumer. Therefore,the relationship between the attitude and the purchase behaviour is a necessary
condition for the purchase of the product but it is not a sufficient condition. This
relationship could hold true at the aggregate level but not at the individual level.
Activity 1
Pick up any questionnaire used by an organization to conduct a research
study. Indicate the type of measurement used for each question.
Self-Assessment Questions
1. The arithmetic mean cannot be computed for ordinal scale data. (True/
False)
2. Branded shirts are more expensive than unbranded shirts – this is an
example of affective components. (True/False)
3. The _________ scale measurement has a natural zero.

8/9/2019 Mb0050 Slm Unit05
http://slidepdf.com/reader/full/mb0050-slm-unit05 7/26
Sikkim Manipal University Page No. 105
Research Methodology Unit 5
4. The difference between the score on ________ scale does not have
meaningful interpretation.
5.3 Classification of Scales
One of the ways of classifications of scales is in terms of the number of items in
the scale. Based upon this, the following classification may be proposed:
5.3.1 Single Item vs Multiple Item Scale
Single item scale: In the single item scale, there is only one item to measure agiven construct. For example:
Consider the following question:
• How satisfied are you with your current job?
Very Dissatisfied
Dissatisfied
Neutral
Satisfied
Very satisfied
The problem with the above question is that there are many aspects to a
job, like pay, work environment, rules and regulations, security of job and
communication with the seniors. The respondent may be satisfied on some of
the factors but may not on others. By asking a question as stated above, it will
be difficult to analyse the problem areas. To overcome this problem, a multiple
item scale is proposed.
Multiple item scale: In multiple item scale, there are many items that play a
role in forming the underlying construct that the researcher is trying to measure.
This is because each of the item forms some part of the construct (satisfaction)
which the researcher is trying to measure. As an example, some of the following
questions may be asked in a multiple item scale.
• How satisfied are you with the pay you are getting on your current job?
Very dissatisfied
Dissatisfied
Neutral
Satisfied
Very satisfied

8/9/2019 Mb0050 Slm Unit05
http://slidepdf.com/reader/full/mb0050-slm-unit05 8/26
Sikkim Manipal University Page No. 106
Research Methodology Unit 5
• How satisfied are you with the rules and regulations of your organization?
Very dissatisfied
Dissatisfied
Neutral
Satisfied
Very satisfied
5.3.2 Comparative vs Non-comparative Scales
The scaling techniques used in research can also be classified into comparativeand non-comparative scales (Figure 5.1).
Scaling Techniques
Comparative Scales Non-comparative Scales
Itemized Rating ScaleGraphic Rating Scale
(Continuous Rating Scale)
Paired Comparison
Constant Sum
Rank Order
Q-Sort and other Procedures
Likert
Semantic Differential
Stapel
Figure 5.1 Types of Scaling Techniques
Comparative scales
In comparative scales it is assumed that respondents make use of a standard
frame of reference before answering the question. For example:
A question like ‘How do you rate Barista in comparison to Cafe Coffee
Day on quality of beverages?’ is an example of the comparative rating scale. It
involves the direct comparison of stimulus objects. Example:
8/9/2019 Mb0050 Slm Unit05
http://slidepdf.com/reader/full/mb0050-slm-unit05 9/26
Sikkim Manipal University Page No. 107
Research Methodology Unit 5
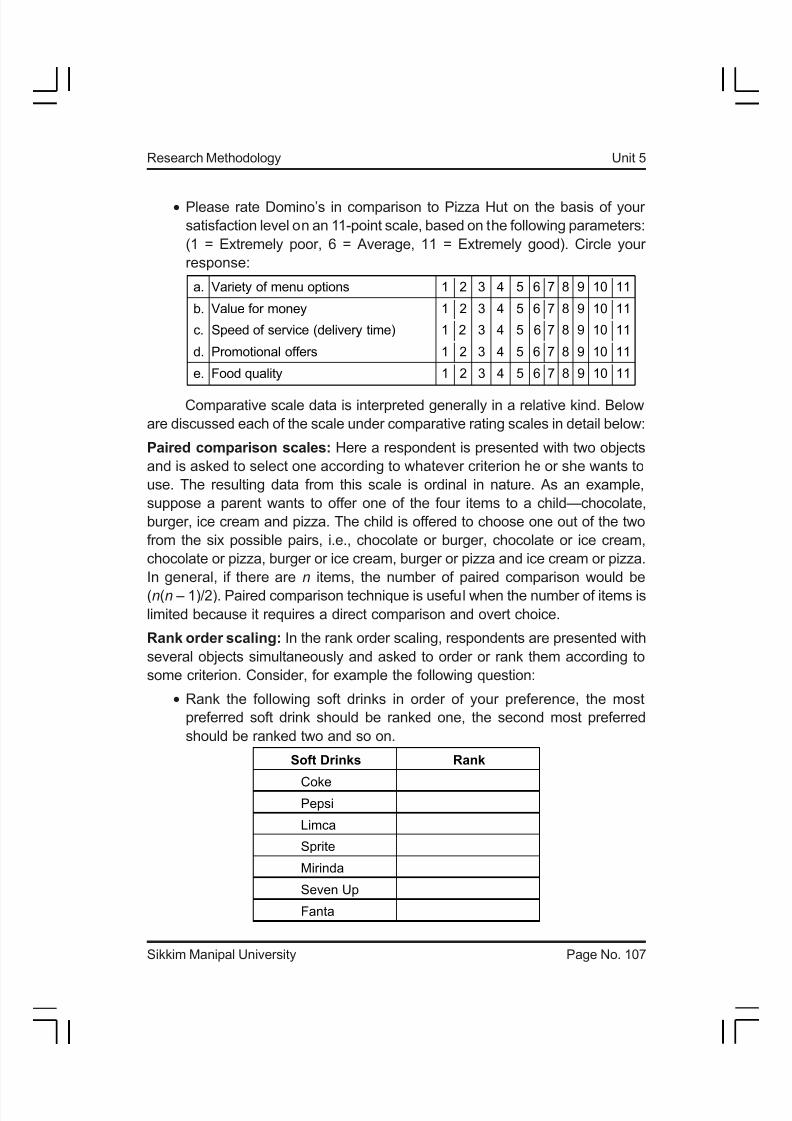
• Please rate Domino’s in comparison to Pizza Hut on the basis of your
satisfaction level on an 11-point scale, based on the following parameters:
(1 = Extremely poor, 6 = Average, 11 = Extremely good). Circle your
response:
a. Variety of menu options 1 2 3 4 5 6 7 8 9 10 11
b. Value for money 1 2 3 4 5 6 7 8 9 10 11
c. Speed of service (delivery time) 1 2 3 4 5 6 7 8 9 10 11
d. Promotional offers 1 2 3 4 5 6 7 8 9 10 11
e. Food quality 1 2 3 4 5 6 7 8 9 10 11
Comparative scale data is interpreted generally in a relative kind. Below
are discussed each of the scale under comparative rating scales in detail below:
Paired comparison scales: Here a respondent is presented with two objects
and is asked to select one according to whatever criterion he or she wants to
use. The resulting data from this scale is ordinal in nature. As an example,
suppose a parent wants to offer one of the four items to a child—chocolate,
burger, ice cream and pizza. The child is offered to choose one out of the two
from the six possible pairs, i.e., chocolate or burger, chocolate or ice cream,
chocolate or pizza, burger or ice cream, burger or pizza and ice cream or pizza.
In general, if there are n items, the number of paired comparison would be
(n(n – 1)/2). Paired comparison technique is useful when the number of items is
limited because it requires a direct comparison and overt choice.
Rank order scaling: In the rank order scaling, respondents are presented with
several objects simultaneously and asked to order or rank them according to
some criterion. Consider, for example the following question:
• Rank the following soft drinks in order of your preference, the most
preferred soft drink should be ranked one, the second most preferred
should be ranked two and so on.
Soft Drinks Rank
CokePepsi
Limca
Sprite
Mirinda
Seven Up
Fanta
8/9/2019 Mb0050 Slm Unit05
http://slidepdf.com/reader/full/mb0050-slm-unit05 10/26
Sikkim Manipal University Page No. 108
Research Methodology Unit 5
Like paired comparison, this approach is also comparative in nature. The
problem with this scale is that if a respondent does not like any of the above-
mentioned soft drink and is forced to rank them in the order of his choice, then,
the soft drink which is ranked one should be treated as the least disliked soft
drink and similarly, the other rankings can be interpreted. The rank order scaling
results in the ordinal data.
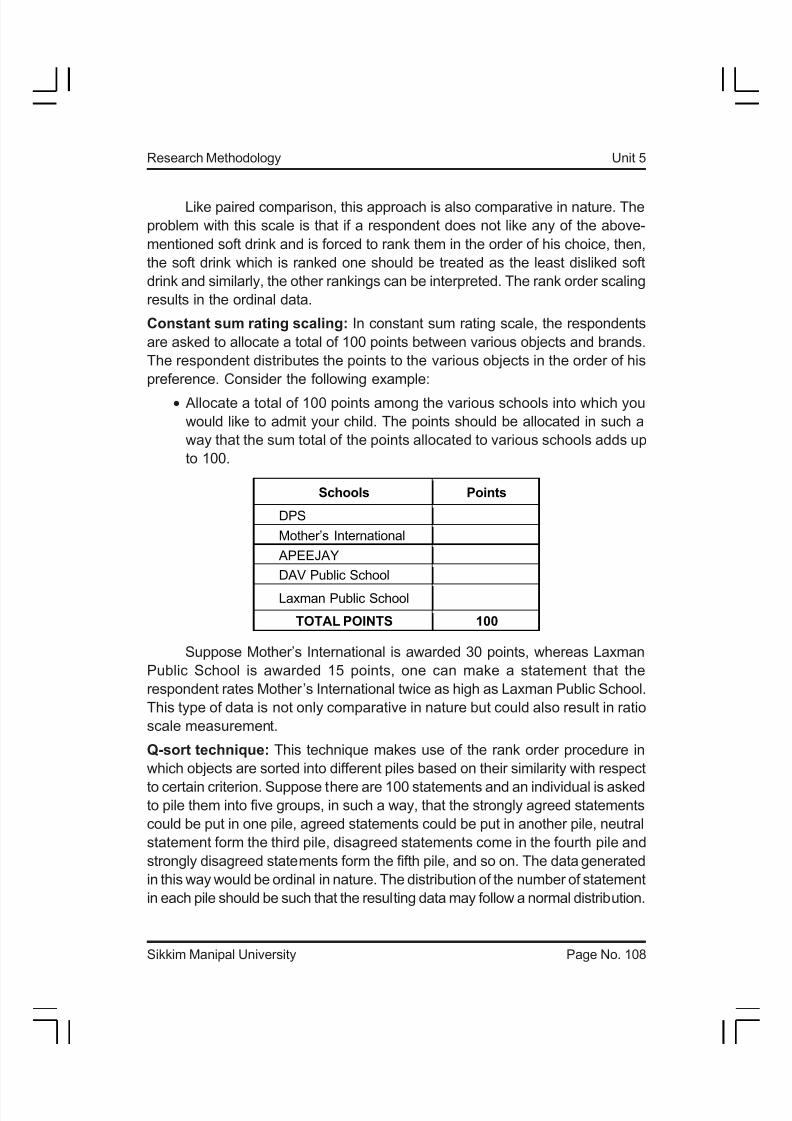
Constant sum rating scaling: In constant sum rating scale, the respondents
are asked to allocate a total of 100 points between various objects and brands.
The respondent distributes the points to the various objects in the order of his
preference. Consider the following example:
• Allocate a total of 100 points among the various schools into which you
would like to admit your child. The points should be allocated in such a
way that the sum total of the points allocated to various schools adds up
to 100.
Schools Points
DPS
Mother’s International
APEEJAY
DAV Public School
Laxman Public School
TOTAL POINTS 100
Suppose Mother’s International is awarded 30 points, whereas Laxman
Public School is awarded 15 points, one can make a statement that the
respondent rates Mother’s International twice as high as Laxman Public School.
This type of data is not only comparative in nature but could also result in ratio
scale measurement.
Q-sort technique: This technique makes use of the rank order procedure in
which objects are sorted into different piles based on their similarity with respect
to certain criterion. Suppose there are 100 statements and an individual is askedto pile them into five groups, in such a way, that the strongly agreed statements
could be put in one pile, agreed statements could be put in another pile, neutral
statement form the third pile, disagreed statements come in the fourth pile and
strongly disagreed statements form the fifth pile, and so on. The data generated
in this way would be ordinal in nature. The distribution of the number of statement
in each pile should be such that the resulting data may follow a normal distribution.
8/9/2019 Mb0050 Slm Unit05
http://slidepdf.com/reader/full/mb0050-slm-unit05 11/26
Sikkim Manipal University Page No. 109
Research Methodology Unit 5
Non-comparative scales
In the non-comparative scales, the respondents do not make use of any frame
of reference before answering the questions. The resulting data is generally
assumed to be interval or ratio scale.
The non-comparative scales are divided into two categories, namely, the
graphic rating scales and the itemized rating scales. A useful and widely used
itemized rating scale is the Likert scale.
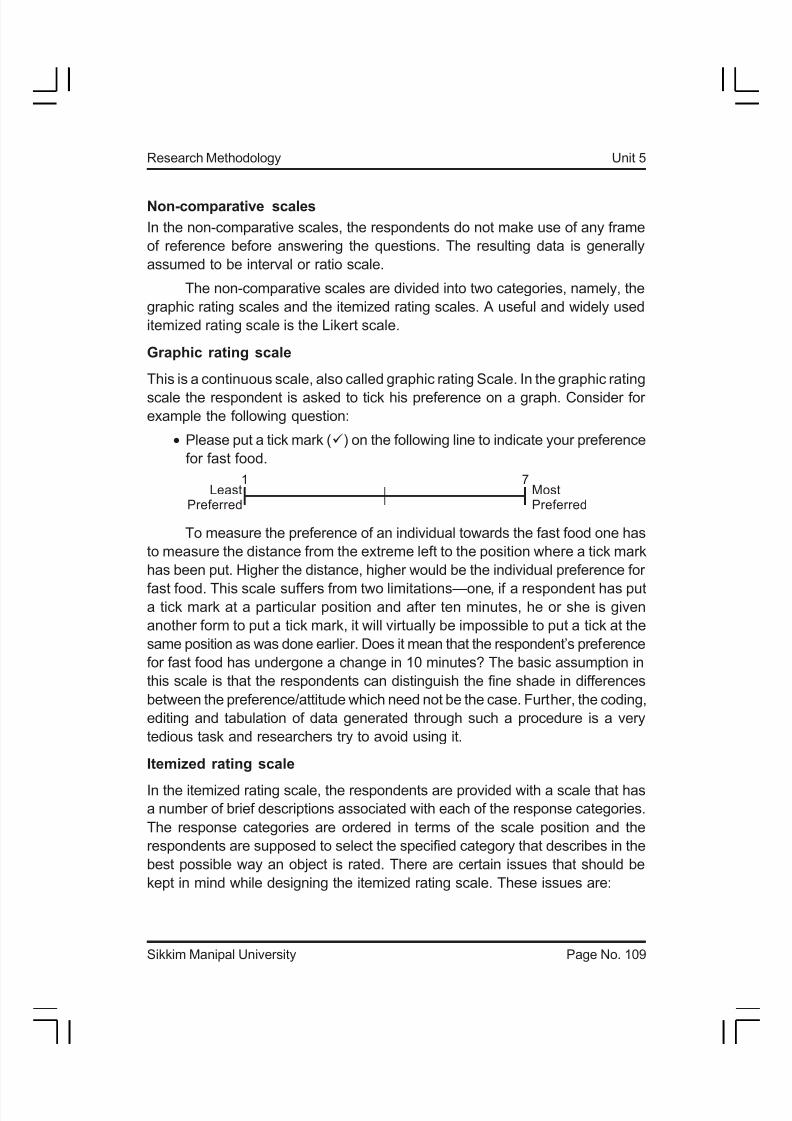
Graphic rating scale
This is a continuous scale, also called graphic rating Scale. In the graphic rating
scale the respondent is asked to tick his preference on a graph. Consider for
example the following question:
• Please put a tick mark () on the following line to indicate your preference
for fast food.
Least
Preferred
Most
Preferred
1 7
To measure the preference of an individual towards the fast food one has
to measure the distance from the extreme left to the position where a tick mark
has been put. Higher the distance, higher would be the individual preference for
fast food. This scale suffers from two limitations—one, if a respondent has puta tick mark at a particular position and after ten minutes, he or she is given
another form to put a tick mark, it will virtually be impossible to put a tick at the
same position as was done earlier. Does it mean that the respondent’s preference
for fast food has undergone a change in 10 minutes? The basic assumption in
this scale is that the respondents can distinguish the fine shade in differences
between the preference/attitude which need not be the case. Further, the coding,
editing and tabulation of data generated through such a procedure is a very
tedious task and researchers try to avoid using it.
Itemized rating scale
In the itemized rating scale, the respondents are provided with a scale that hasa number of brief descriptions associated with each of the response categories.
The response categories are ordered in terms of the scale position and the
respondents are supposed to select the specified category that describes in the
best possible way an object is rated. There are certain issues that should be
kept in mind while designing the itemized rating scale. These issues are:
8/9/2019 Mb0050 Slm Unit05
http://slidepdf.com/reader/full/mb0050-slm-unit05 12/26
Sikkim Manipal University Page No. 110
Research Methodology Unit 5
Number of categories to be used: There is no hard and fast rule as to how
many categories should be used in an itemized rating scale. However, it is a
practice to use five or six categories. Some researches are of the opinion that
more than five categories should be used in situations where small changes in
attitudes are to be measured. There are others that argue that the respondents
would find it difficult to distinguish between more than five categories.
Odd or even number of categories: It has been a matter of debate among the
researchers as to whether odd or even number of categories are to be used. By
using even number of categories the scale would not have a neutral category
and the respondent will be forced to choose either the positive or the negative
side of the attitude. If odd numbers of categories are used, the respondent has
the freedom to be neutral if he wants to be so.
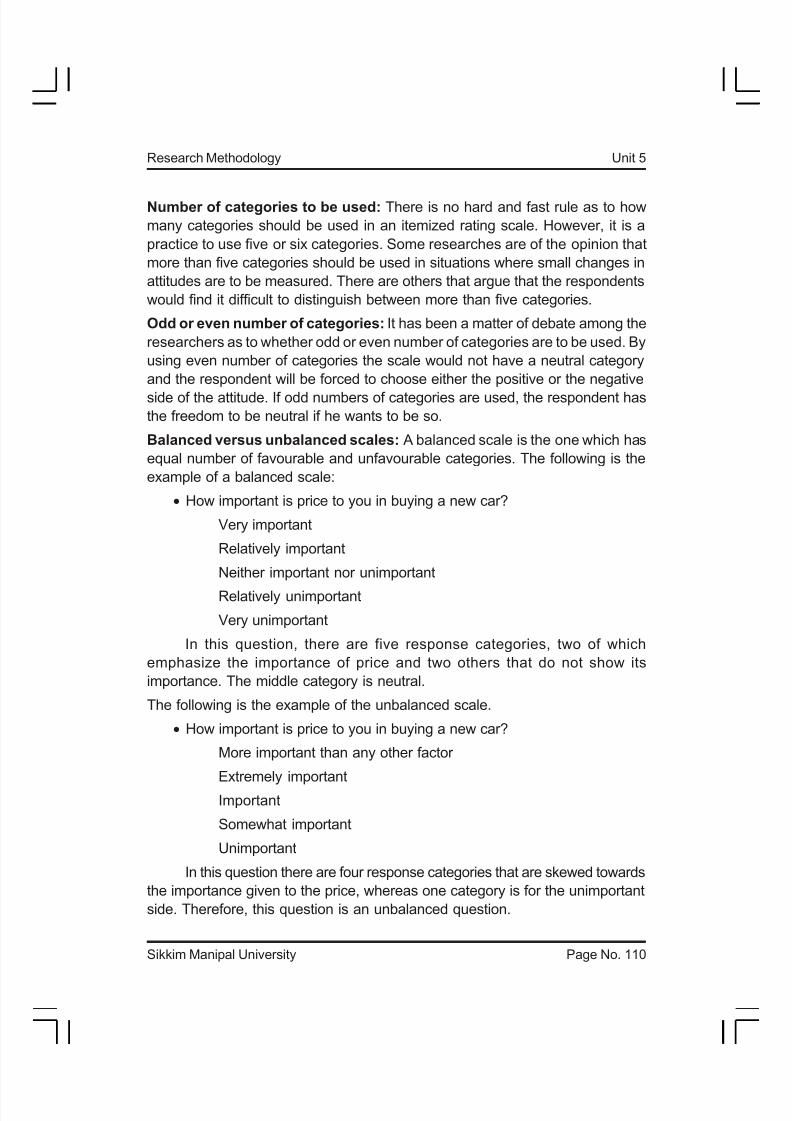
Balanced versus unbalanced scales: A balanced scale is the one which has
equal number of favourable and unfavourable categories. The following is the
example of a balanced scale:
• How important is price to you in buying a new car?
Very important
Relatively important
Neither important nor unimportant
Relatively unimportant
Very unimportant
In this question, there are five response categories, two of which
emphasize the importance of price and two others that do not show its
importance. The middle category is neutral.
The following is the example of the unbalanced scale.
• How important is price to you in buying a new car?
More important than any other factor
Extremely important
Important
Somewhat important
Unimportant
In this question there are four response categories that are skewed towards
the importance given to the price, whereas one category is for the unimportant
side. Therefore, this question is an unbalanced question.
8/9/2019 Mb0050 Slm Unit05
http://slidepdf.com/reader/full/mb0050-slm-unit05 13/26
Sikkim Manipal University Page No. 111
Research Methodology Unit 5
Nature and degree of verbal description: Many researchers believe that each
category must have a verbal, numerical or pictorial description. Verbal description
should be clearly and precisely worded so that the respondents are able to
differentiate between them. Further, the researcher must decide whether to
label every scale category, some scale categories, or only extreme scale
categories.
Forced versus non-forced scales: In the forced scale, the respondent is forced
to take a stand, whereas in the non-forced scale, the respondent can be neutral
if he/she so desires. The argument for a forced scale is that those who are
reluctant to reveal their attitude are encouraged to do so with the forced scale.
Paired comparison scale, rank order scale and constant sum rating scales are
examples of forced scales.
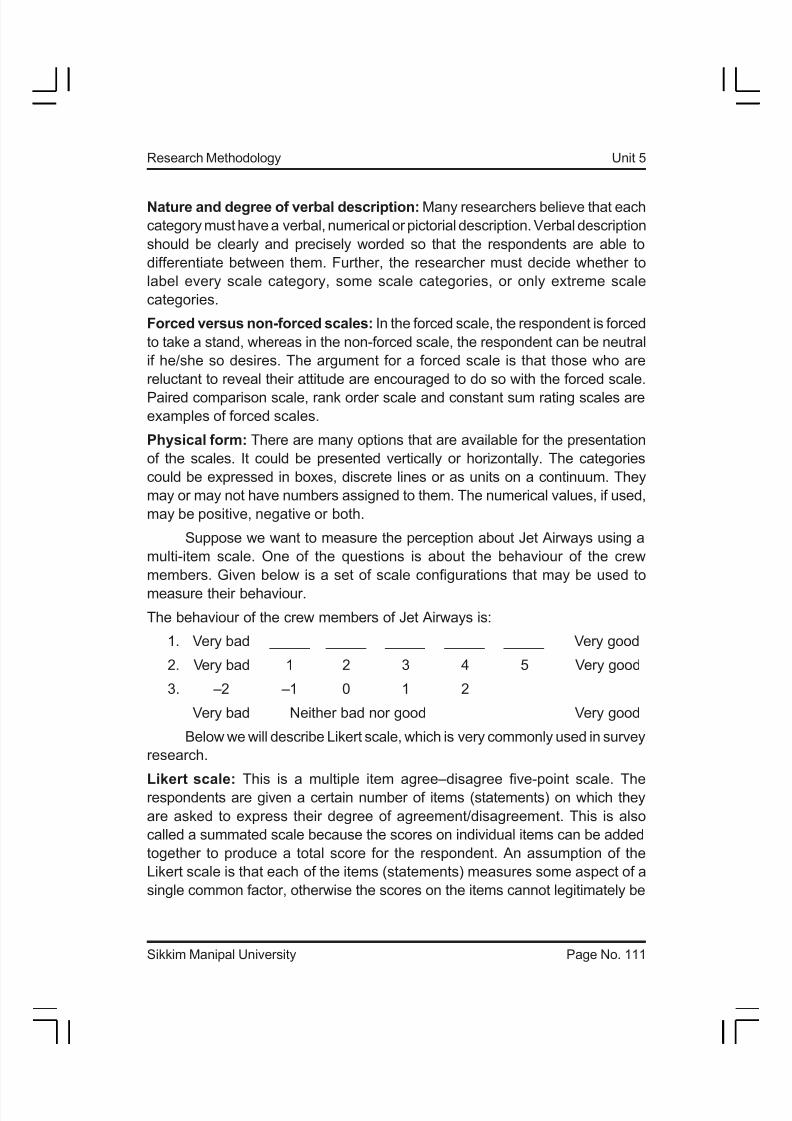
Physical form: There are many options that are available for the presentation
of the scales. It could be presented vertically or horizontally. The categories
could be expressed in boxes, discrete lines or as units on a continuum. They
may or may not have numbers assigned to them. The numerical values, if used,
may be positive, negative or both.
Suppose we want to measure the perception about Jet Airways using a
multi-item scale. One of the questions is about the behaviour of the crew
members. Given below is a set of scale configurations that may be used to
measure their behaviour.
The behaviour of the crew members of Jet Airways is:
1. Very bad _____ _____ _____ _____ _____ Very good
2. Very bad 1 2 3 4 5 Very good
3. –2 –1 0 1 2
Very bad Neither bad nor good Very good
Below we will describe Likert scale, which is very commonly used in survey
research.
Likert scale: This is a multiple item agree–disagree five-point scale. Therespondents are given a certain number of items (statements) on which they
are asked to express their degree of agreement/disagreement. This is also
called a summated scale because the scores on individual items can be added
together to produce a total score for the respondent. An assumption of the
Likert scale is that each of the items (statements) measures some aspect of a
single common factor, otherwise the scores on the items cannot legitimately be
8/9/2019 Mb0050 Slm Unit05
http://slidepdf.com/reader/full/mb0050-slm-unit05 14/26

8/9/2019 Mb0050 Slm Unit05
http://slidepdf.com/reader/full/mb0050-slm-unit05 15/26
Sikkim Manipal University Page No. 113
Research Methodology Unit 5
It may be noted that only anchor labels and no numerical values are
assigned to the response categories. Once the scale is administered, numerical
values are assigned to the response categories. The scale contains statements’
some of which are favourable to the construct we are trying to measure and
some are unfavourable to it.
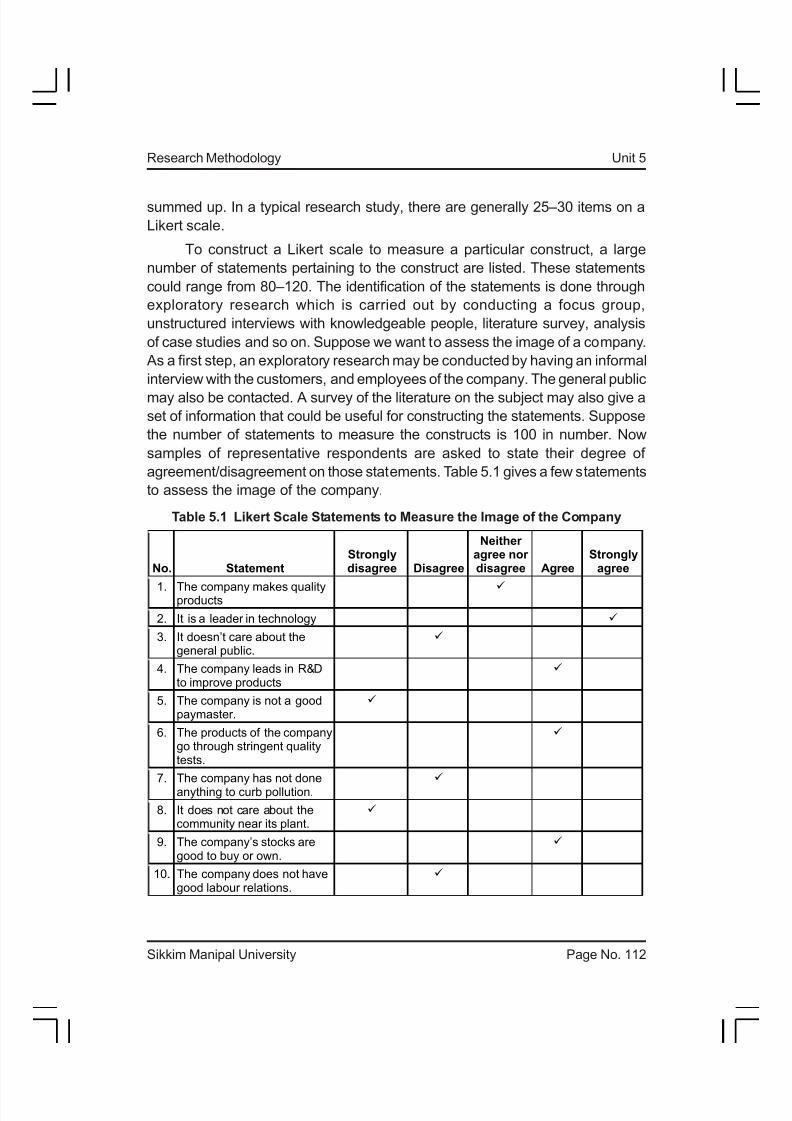
For example, out of the ten statements given, statements numbering 1, 2,
4, 6 and 9 in Table 5.1 are favourable statements, whereas the remaining are
unfavourable statements. The reason for having a mixture of favourable and
unfavourable statements in a Likert scale is that the responses by the respondent
should not become monotonous while answering the questions. Generally, in a
Likert scale, there is an approximately equal number of favourable and
unfavourable statements. Once the scale is administered, numerical values are
assigned to the responses. The rule is that a ‘strongly agree’ response for a
favourable statement should get the same numerical value as the ‘strongly
disagree’ response of the unfavourable statement. Suppose for a favourable
statement the numbering is done as Strongly disagree = 1, Disagree = 2, Neither
agree nor disagree = 3, Agree = 4 and Strongly agree = 5. Accordingly,
an unfavourable statement would get the numerical values as Strongly disagree
= 5, Disagree = 4, Neither agree nor disagree = 3, Agree = 2 and Strongly agree
= 1. In order to measure the image that the respondent has about the company,
the scores are added.For example, if a respondent has ticked () statements numbering from
one to ten as shown in Table 5.1, his total score would be 3 + 5 + 4 + 4 + 5 + 4
+ 4 + 5 + 4 + 4 = 42 out of 50. Now if there are 100 respondents and 100
statements, the score on the image of the company can be worked out for each
respondent by adding his/her scores on the 100 statements. The minimum score
for each respondent will be 100, whereas the maximum score would be 500.
As mentioned earlier, a typical Likert scale comprises about 25–30
statements. In order to select 25 statements from the 100 statements, we need
to discard some of them. The rule behind discarding the statements is that
those items that are non-discriminating should be removed. The procedure for choosing 25 (say number of statements) is shown.
As mentioned earlier, the score for each of the respondents on each of
the statements can be used to measure his/her total score about the image of
the company. The data may look as given in Table 5.2.

8/9/2019 Mb0050 Slm Unit05
http://slidepdf.com/reader/full/mb0050-slm-unit05 16/26
Sikkim Manipal University Page No. 114
Research Methodology Unit 5
Table 5.2 Total Score and Individual Score of
Each Respondent on Various Statements
Scores of Statements
Resp. No. 1 2 3 .......... i .......... .
j ........... 100 Total Score
1 - - - .......... 5 .......... .
4 ........... - 410
2 - - - .......... 4 .......... .
2 ........... - 209
3 - - - .......... - .......... .
- ........... - -
- - - - .......... - .......... .
- ........... - -
100 - - - .......... - ...........
- ........... - -
Table 5.2 shows that the total score for respondent no. 1 is 410, whereas
for respondent no. 2 it is 209. This means that respondent no. 1 has a more
favourable image for the company as compared to respondent no. 2. Now, in
order to select 25 statements, let us consider statements numbering i and j. We
note that the statement no. j is more discriminating as compared to statement
no. i. This is because the score on statement j is very highly correlated with the
total score as compared to the scores on statement i. Therefore, if we have to
choose between i and j, we will choose statement no. j. From this we can conclude
that only those statements will be selected which have a very high correlationwith the total score. Therefore, the 100 correlations are to be arranged in the
descending order of magnitudes corresponding to each statement and only top
25 statements having a high correlation with the total score need to be selected.
Activity 2
If you were to conduct a survey to examine the job satisfaction level of
different categories of employees, how would you proceed to construct a
Likert scale?
Self-Assessment Questions
5. Coding and analysis of attitudinal data obtained through the use of pure
graphic rating scale can be done very quickly. (True/False)
6. A comparative rating scale attempts to provide a common frame of
reference to all respondents. (True/False)
7. The Likert scale is a single item scale. (True/False)
8/9/2019 Mb0050 Slm Unit05
http://slidepdf.com/reader/full/mb0050-slm-unit05 17/26
Sikkim Manipal University Page No. 115
Research Methodology Unit 5
8. The Likert scale is a balanced rating scale with an ________ number of
categories and a neutral point.
9. In _________ scale, if an attribute is twice as important as some other
attribute it receives twice as many points.
5.4 Measurement Error
Measurement error occurs when the observed measurement on a construct or
concept deviates from its true values. The following is a list of the sources of
measurement errors.• There are factors like mood, fatigue and health of the respondent which
may influence the observed response while the instrument is being
administered. The other factors could be education, job, awareness of
topic and reluctance to express an opinion.
• The variations in the environment in which measurements are taken may
also result in a departure from the true value.
• At times, the errors may be committed at the time of coding, entering of
data from questionnaire to the spreadsheet on the computer and at the
tabulation stage. The other reasons could be defective instrument for
data collection like lengthy and ambiguous questionnaire with leadingquestions (suggestive responses) in the instrument.
The observed measurement in any research need not be equal to the
true measurement. The observed measurement can be written as
O = T + S + R
Where, O = Observed measurement
T = True score
S = Systematic error
R = Random error
It may be noted that the total error consists of two components—systematic
error and random error. Systematic error causes a constant bias in the
measurement. Suppose there is a weighing scale that weighs 50 gm less for
every one kg of product being weighed. The error would consistently remain
the same irrespective of the kind of product and the time at which product is
weighed. Random error on the other hand involves influences that bias the
measurements but are not systematic. Suppose we use different weighing scales
8/9/2019 Mb0050 Slm Unit05
http://slidepdf.com/reader/full/mb0050-slm-unit05 18/26
Sikkim Manipal University Page No. 116
Research Methodology Unit 5
to weigh one kg of a product and if systematic error is assumed to be absent,
we may find that recorded weights may fall within a range around the true value
of the weight, thereby causing random error.
5.4.1 Criteria for Good Measurement
There are three criteria for evaluating measurements: reliability, validity and
sensitivity. It may be noted that there is a relationship between reliability and
sensitivity. If we want to make an item more sensitive, it may be achieved at the
cost of reliability. This means to get more sensitivity, the researcher might have
to compromise with reliability.
1. Reliability
Reliability is concerned with consistency, accuracy and predictability of the scale.
It refers to the extent to which a measurement process is free from random
errors. The reliability of a scale can be measured using the following methods:
Test–retest reliability: In this method, repeated measurements of the same
person or group using the same scale under similar conditions are taken. A very
high correlation between the two scores indicates that the scale is reliable. The
researcher has to be careful in deciding the time difference between two
observations. If the time difference between two observations is very small it is
very likely that the respondent would give same answer which could result in
higher correlation. Further if the difference is too large, the attitude might have
undergone a change during that period, resulting in a weak correlation and
hence poor reliability. Therefore researcher have to be very careful in deciding
the time difference between observation. Generally, a time difference of about
5-6 months is considered as an ideal period.
Split-half reliability method: This method is used in the case of multiple item
scales. Here the number of items is randomly divided into two parts and a
correlation coefficient between the two is obtained. A high correlation indicates
that the internal consistency of the construct leads to greater reliability.
2. Validity
The validity of a scale refers to the question whether we are measuring what we
want to measure. Validity of the scale refers to the extent to which the
measurement process is free from both systematic and random errors. The
validity of a scale is a more serious issue than reliability. There are different
ways to measure validity.
Content validity: This is also called face validity. It involves subjective judgement
by an expert for assessing the appropriateness of the construct. For example,

8/9/2019 Mb0050 Slm Unit05
http://slidepdf.com/reader/full/mb0050-slm-unit05 19/26
Sikkim Manipal University Page No. 117
Research Methodology Unit 5
to measure the perception of a customer towards Kingfisher Airlines, a multiple
item scale is developed. A set of 15 items is proposed. These items when
combined in an index measure the perception of Kingfisher Airlines. In order to
judge the content validity of these 15 items, a set of experts may be requested
to examine the representativeness of the 15 items. The items covered may be
lacking in the content validity if we have omitted behaviour of the crew, food
quality, and food quantity, etc., from the list. In fact, conducting the exploratory
research to exhaust the list of items measuring perception of the airline would
be of immense help in such a case.
Predictive validity: This involves the ability of a measured phenomena at one
point of time to predict another phenomenon at a future point of time. If the
correlation coefficient between the two is high, the initial measure is said to
have a high predictive ability. As an example, consider the use of the common
admission test (CAT) to shortlist candidates for admission to the MBA programme
in a business school. The CAT scores are supposed to predict the candidate’s
aptitude for studies towards business education.
3. Sensitivity
Sensitivity refers to an instrument’s ability to accurately measure the variability
in a concept. A dichotomous response category such as agree or disagree
does not allow the recording of any attitude changes. A more sensitive measure
with numerous categories on the scale may be required. For example, adding‘strongly agree’, ‘agree’, ‘neither agree nor disagree’, ‘disagree and ‘strongly
disagree’ categories will increase the sensitivity of the scale.
The sensitivity of scale based on a single question or a single item can be
increased by adding questions or items. In other words, because composite
measures allow for a greater range of possible scores, they are more sensitive
than a single-item scale.
Self-Assessment Questions
10. A scale is said to be valid if it measures what it is supposed to measure.
(True/False)
11. A scale is said to be reliable if it is free from systematic errors. (True/
False)
12. The _________ of a scale can be increased by adding more number of
questions to it.
8/9/2019 Mb0050 Slm Unit05
http://slidepdf.com/reader/full/mb0050-slm-unit05 20/26
Sikkim Manipal University Page No. 118
Research Methodology Unit 5
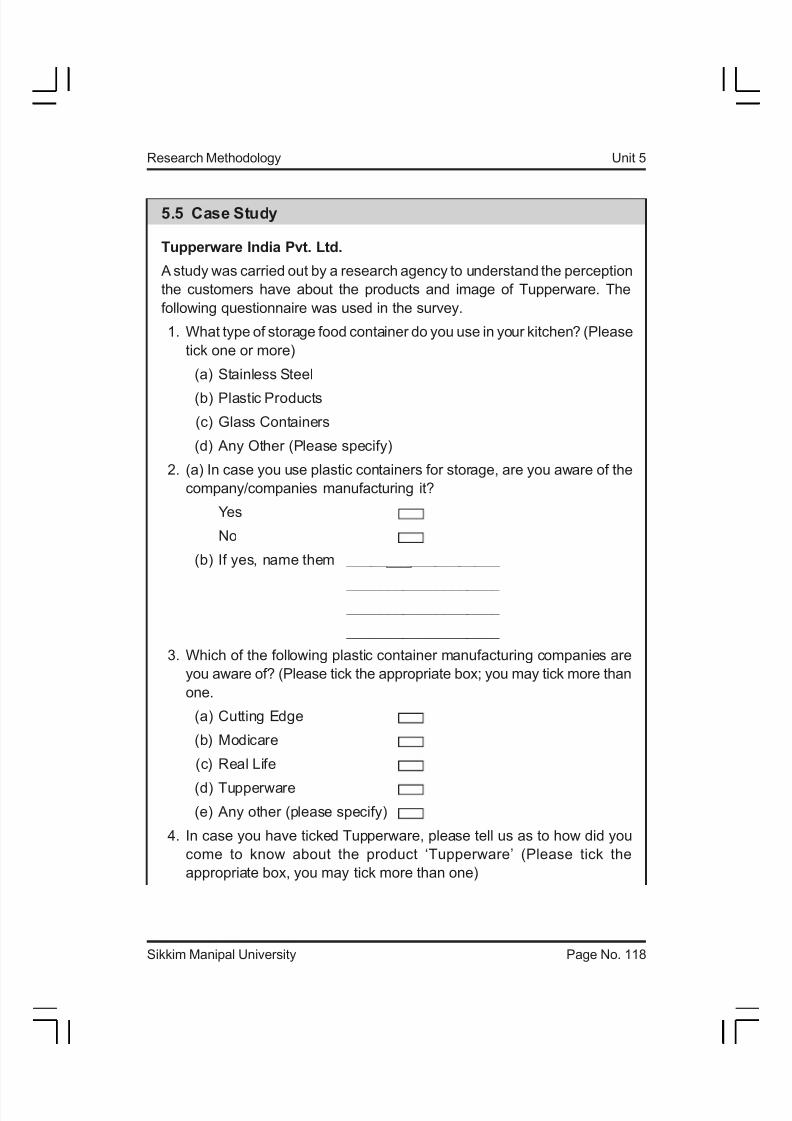
5.5 Case Study
Tupperware India Pvt. Ltd.
A study was carried out by a research agency to understand the perception
the customers have about the products and image of Tupperware. The
following questionnaire was used in the survey.
1. What type of storage food container do you use in your kitchen? (Please
tick one or more)
(a) Stainless Steel
(b) Plastic Products
(c) Glass Containers
(d) Any Other (Please specify)
2. (a) In case you use plastic containers for storage, are you aware of the
company/companies manufacturing it?
Yes
No
(b) If yes, name them ___________________
___________________ ___________________
___________________
3. Which of the following plastic container manufacturing companies are
you aware of? (Please tick the appropriate box; you may tick more than
one.
(a) Cutting Edge
(b) Modicare
(c) Real Life
(d) Tupperware
(e) Any other (please specify)
4. In case you have ticked Tupperware, please tell us as to how did you
come to know about the product ‘Tupperware’ (Please tick the
appropriate box, you may tick more than one)

8/9/2019 Mb0050 Slm Unit05
http://slidepdf.com/reader/full/mb0050-slm-unit05 21/26
Sikkim Manipal University Page No. 119
Research Methodology Unit 5
(a) Advertisements
(b) Party plan
(c) Internet
(d) Women’s magazines
(e) Word of mouth
(f) Any other (please specify)
5. Do you use Tupperware products?
Yes
No
(If the answer is No, you will still be having some perception about
Tupperware’s products, its quality and price. Therefore, please move
to question 11 directly)
6. If answer to the above question is yes, did you
(a) Buy the product
(b) Received as a gift
(c) Both
7. If you bought the product as mentioned in the question 6 above, did
you buy
(a) Through party plan
(b) Telephoning the dealer
(c) Both
8. How often do you buy Tupperware products?
(a) Once a month
(b) Twice a month
(c) More than two times in a month
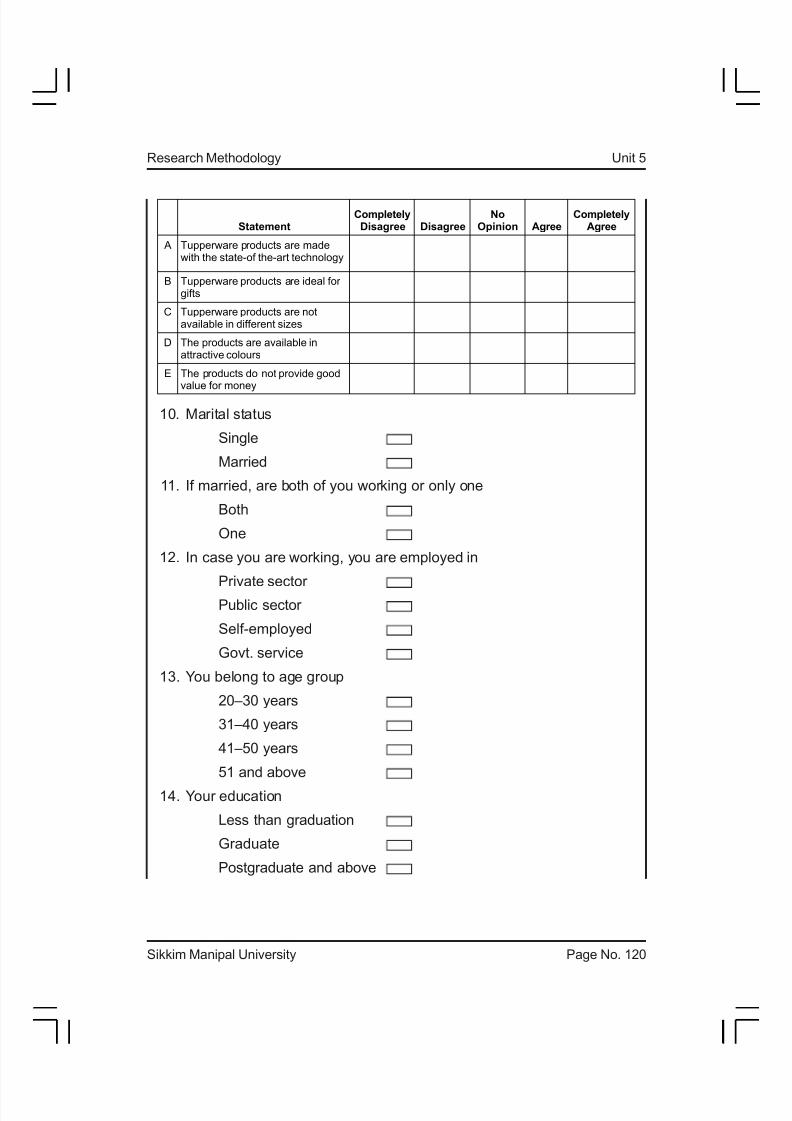
9. Given below are some statements, you are requested to state your degree of agreement/disagreement on each of the statements as
mentioned below on a 5-point scale.
8/9/2019 Mb0050 Slm Unit05
http://slidepdf.com/reader/full/mb0050-slm-unit05 22/26
Sikkim Manipal University Page No. 120
Research Methodology Unit 5
Statement Completely
Disagree Disagree No
Opinion Agree Completely
Agree
A Tupperware products are madewith the state-of the-art technology
B Tupperware products are ideal forgifts
C Tupperware products are notavailable in different sizes
D The products are available inattractive colours
E The products do not provide goodvalue for money
10. Marital status
Single
Married
11. If married, are both of you working or only one
Both
One
12. In case you are working, you are employed in
Private sector
Public sector
Self-employed
Govt. service
13. You belong to age group
20–30 years
31–40 years
41–50 years
51 and above
14. Your education
Less than graduation
Graduate
Postgraduate and above
8/9/2019 Mb0050 Slm Unit05
http://slidepdf.com/reader/full/mb0050-slm-unit05 23/26
Sikkim Manipal University Page No. 121
Research Methodology Unit 5
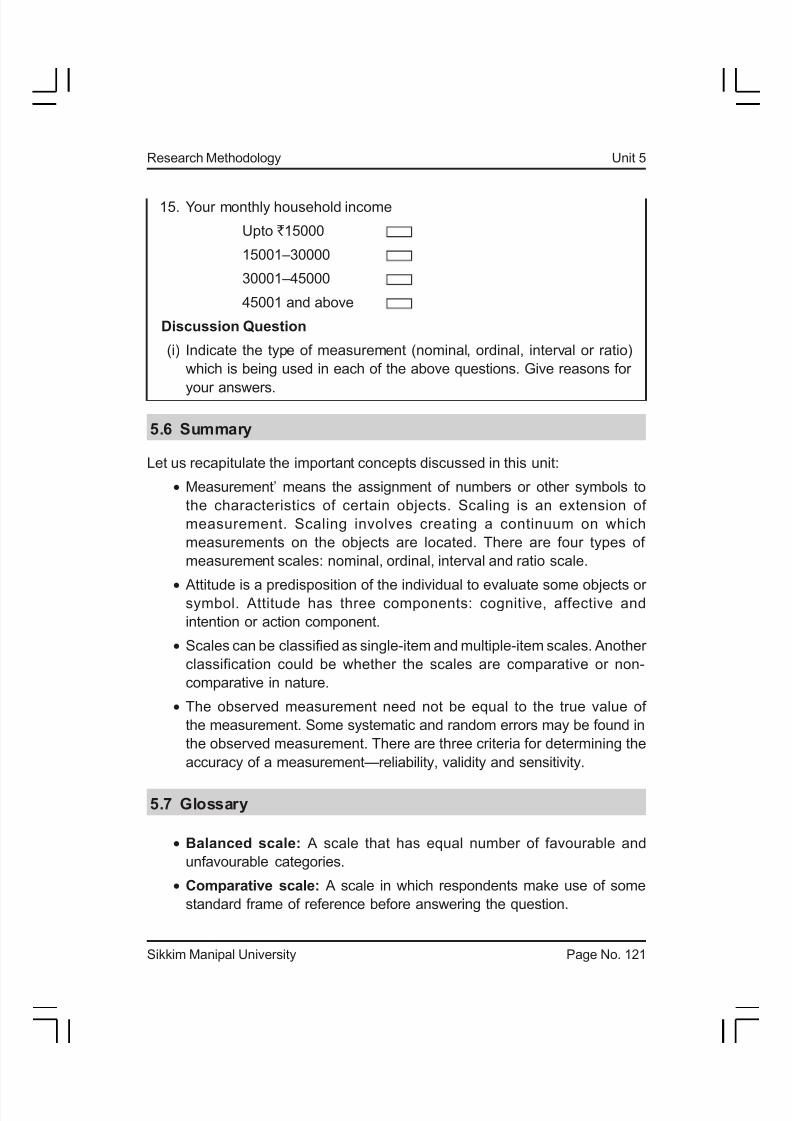
15. Your monthly household income
Upto `15000
15001–30000
30001–45000
45001 and above
Discussion Question
(i) Indicate the type of measurement (nominal, ordinal, interval or ratio)
which is being used in each of the above questions. Give reasons for
your answers.
5.6 Summary
Let us recapitulate the important concepts discussed in this unit:
• Measurement’ means the assignment of numbers or other symbols to
the characteristics of certain objects. Scaling is an extension of
measurement. Scaling involves creating a continuum on which
measurements on the objects are located. There are four types of
measurement scales: nominal, ordinal, interval and ratio scale.
• Attitude is a predisposition of the individual to evaluate some objects or symbol. Attitude has three components: cognitive, affective and
intention or action component.
• Scales can be classified as single-item and multiple-item scales. Another
classification could be whether the scales are comparative or non-
comparative in nature.
• The observed measurement need not be equal to the true value of
the measurement. Some systematic and random errors may be found in
the observed measurement. There are three criteria for determining the
accuracy of a measurement—reliability, validity and sensitivity.
5.7 Glossary
• Balanced scale: A scale that has equal number of favourable and
unfavourable categories.
• Comparative scale: A scale in which respondents make use of some
standard frame of reference before answering the question.
8/9/2019 Mb0050 Slm Unit05
http://slidepdf.com/reader/full/mb0050-slm-unit05 24/26
Sikkim Manipal University Page No. 122
Research Methodology Unit 5
• Forced scale: A scale in which the respondent is forced to take a stand
• Interval scale: A scale that makes use of an arbitrary origin.
• Validity: It deals with whether a scale measures what it is supposed to
measure.
5.8 Terminal Questions
1. What is the meaning of measurement in research? Give examples.
2. Discuss four types of measurements using examples.
3. Define attitude. What are its various components?
4. Explain an itemized rating scale. What are the various issues involved in
constructing an itemized rating scale?
5. Outline the steps involved in constructing a Likert scale.
6. Briefly explain the concepts of reliability, validity and sensitivity
5.9 Answers
Answers to Self-Assessment Questions
1. True
2. False
3. Ratio
4. Ordinal
5. False
6. True
7. False
8. Odd
9. Constant sum rating10. True
11. False
12. Sensitivity

8/9/2019 Mb0050 Slm Unit05
http://slidepdf.com/reader/full/mb0050-slm-unit05 25/26
Sikkim Manipal University Page No. 123
Research Methodology Unit 5
Answers to Terminal Questions
1. The term ‘measurement’ means assigning numbers or some other symbols
to the characteristics of certain objects.Refer to Section 5.1 for further
details.
2. There are four types of measurement scales—nominal, ordinal, interval
and ratio. Refer to Section 5.2 for further details.
3. An attitude is viewed as an enduring disposition to respond consistently
in a given manner to various aspects of the world, including persons,
events and objects. Refer to Section 5.2.1 for further details.
4. In the itemized rating scale, the respondents are provided with a scale
that has a number of brief descriptions associated with each of the
response categories.Refer to Section 5.3.2 for further details.
5. The Likert scale is a multiple item agree–disagree five-point scale. Refer
to Section 5.3.2 for further details.
6. There are three criteria for evaluating measurements: reliability, validity
and sensitivity.Refer to Section 5.4.1 for further details.
5.10 References
1. Beri, G C. 2000. Marketing Research. 3rd edn. New Delhi: Tata McGraw-
Hill Publishing Company Ltd,.
2. Chawla, D and Sondhi, N. 2011. Research Methodology: Concepts and
Cases. New Delhi: Vikas Publishing House.
3. Cooper, Donald R and Schindler, PS. 1998. Business Research Method .
6th edn. Tata McGraw Hill Publishing Company Ltd.
4. Malhotra, N K. 2007. Marketing Research – An Applied Orientation. 5th
edn. Pearson Education.
5. Tripathi, P C. 2007. A Textbook of Research Methodology in Social
Sciences. New Delhi: Sultan Chand & Sons.

8/9/2019 Mb0050 Slm Unit05
http://slidepdf.com/reader/full/mb0050-slm-unit05 26/26
Related Documents