A SCHEDULE Mamusa Local Municipality Draft Budget 2016/17 – 2018/19 MTREF March 2016 1

Welcome message from author
This document is posted to help you gain knowledge. Please leave a comment to let me know what you think about it! Share it to your friends and learn new things together.
Transcript

A SCHEDULE Mamusa Local Municipality Draft
Budget 2016/17 – 2018/19 MTREF
1.1 Mayor’s Report
March 20161

1.2 Council Resolutions
Council of Mamusa Local Municipality to meet in the Council Chambers to consider the draft annual budget of the municipality for the financial year 2016/17 and MTREF. The Council considers the following resolutions:
1. The Council of Mamusa Local Municipality, acting in terms of section 24 of the Municipal Finance Management Act, (Act 56 of 2003) Considers that:
1.1. The draft annual budget of the municipality for the financial year 2016/17 and single-year capital appropriations as set out in the following tables:
1.1.1. Budgeted Financial Performance (revenue and expenditure by standard classification) ;
1.1.2. Budgeted Financial Performance (revenue and expenditure by municipal vote) ;1.1.3. Budgeted Financial Performance (revenue by source and expenditure by type);
and1.1.4. Single-year capital appropriations by municipal vote and standard classification
and associated funding by source.
1.2. The financial position, cash flow budget, cash-backed reserve/accumulated surplus, asset management and basic service delivery targets are approved as set out in the following tables:
1.2.1. Budgeted Financial Position;1.2.2. Budgeted Cash Flows;1.2.3. Cash backed reserves and accumulated surplus reconciliation;1.2.4. Asset management; and1.2.5. Basic service delivery measurement.
2. The Council of Mamusa Local Municipality, acting in terms of section 75A of the Local Government: Municipal Systems Act (Act 32 of 2000) considers with effect from 1 July 2016: 2.1. the tariff schedule.
1.3 Executive Summary
The application of sound financial management principles for the compilation of the Municipality’s financial plan is essential and critical to ensure that the municipality remains financially viable and that municipal services are provided sustainably, economically and equitably to all communities.
The Municipality’s business and service delivery priorities were reviewed as part of this year’s planning and budget process. Where appropriate, funds were transferred from low- to high-priority programmes so as to maintain sound financial stewardship. A critical review was also undertaken of expenditures on noncore and ‘nice to have’ items. Key areas where savings needs be implemented on telephone and internet usage, printing, workshops, local travel, accommodation, and catering.
The Municipality has embarked on implementing a range of revenue collection strategies to optimize the collection of debt owed by consumers. Furthermore, the municipality has
March 20162

undertaken various customer care initiatives to ensure the municipality truly involves all citizens in the process of ensuring a people lead government.
Though an IDP is a five year strategic document of council, municipalities should note that when a new council takes office after each local government election, the norm has been that the first year of such a new council is primarily confined to implementing the last adopted IDP. Subsequent to this, it is normally in the second year of the new council where the newly elected council will adopt its new and thoroughly interrogated and consulted IDP. This process mostly leads to an overlap of the last year of outgoing council into the new council. It is each municipal council’s prerogative to decide when to approve its annual budget.
National Treasury’s MFMA Circular No. 51 and 54 were used to guide the compilation of the 2016/17 MTREF.National Treasury’s MFMA Circular No. 78 also was used during the draft budget with regard to cost containment and avoid commitment to long term contracts.
The main challenges experienced during the compilation of the 2016/17 MTREF can be summarized as follows:
• The ongoing difficulties in the national and local economy;• Drought in the province and South African as whole• Aging and poorly maintained water, roads and electricity infrastructure; • The need to reprioritize projects and expenditure within the existing resource envelope
given the cash flow realities and declining cash position of the municipality;• The increased cost of bulk electricity, which is placing upward pressure on service tariffs
to residents. Continuous high tariff increases are not sustainable - as there will be point where services will no-longer be affordable;
• Wage increases for municipal staff that continue to exceed consumer inflation, as well as the need to fill critical vacancies;
• Affordability of capital projects – original allocations had to be reduced and the operational expenditure associated with prior year’s capital investments needed to be factored into the budget as part of the 2016/17 MTREF process; and
• Availability of affordable capital/borrowing.
The following budget principles and guidelines directly informed the compilation of the 2016/17 MTREF:
• The 2015/16 Adjustments Budget priorities and targets, as well as the base line allocations contained in that Adjustments Budget were adopted as the upper limits for the new baselines for the 2016/17 annual budget;
• Intermediate service level standards were used to inform the measurable objectives, targets and backlog eradication goals;
• Tariff and property rate increases should be affordable and should generally not exceed inflation as measured by the CPI, except where there are price increases in the inputs of services that are beyond the control of the municipality, for instance the cost of bulk water and electricity. In addition, tariffs need to remain or move towards being cost reflective, and should take into account the need to address infrastructure backlogs;
• There will be no budget allocated to national and provincial funded projects unless the necessary grants to the municipality are reflected in the national and provincial budget and have been gazetted as required by the annual Division of Revenue Act;
March 20163

• Municipality to introduce a winter tariff for electricity as council has applied for it during the completion of Nersa D-Form.
• Municipality’s readiness to implement the mSCOA
In view of the aforementioned, the following table is a consolidated overview of the proposed 2016/17 Medium-term Revenue and Expenditure Framework:
Table 1 Consolidated Overview of the 2016/17 MTREF
R ThousandsAdjustment
BudgetBudget year
2016/17Budget Year
2017/18Budget Year
2018/19Total Revenue R 164 511 791 R 137 527 453 R 143 764 981 R 151 609 283Total Expenditure R 188 377 110 R 193 285 308 R 196 960 180 R 204 988 672Surplus(Deficit) -R 23 865 319 -R 55 757 855 -R 53 195 200 -R 53 379 389Total Capital Expenditure R 31 079 475 R 20 455 000 R 15 972 000 R 16 652 000
Total operating revenue has declined by 19.6 per cent or R26.9 million for the 2016/17 financial year when compared to the 2015/16 Adjustments Budget. For the two outer years, operational revenue will increase by 4.3 and 5.2 per cent respectively. Council to notice that municipality is operating at a deficit for all the financial years.
Total operating expenditure for the 2016/17 financial year has been appropriated at R193.2 million and translates into a budgeted deficit of R55.7 million. When compared to the 2015/16 Adjustments Budget, operational expenditure has grown by 20.5 per cent in the 2016/17 budget and by 2 and 3.9 per cent for each of the respective outer years of the MTREF.
It should be noted that the budget is not funded and council will not be able to meet end needs.
The capital budget of R20.4 million for 2016/17 is 34.2 per cent less when compared to the 2015/16 Adjustment Budget. The reduction is due to various departments not finalizing their assets for next financial year as well as affordability constraints. The council is yet to provide for MIG projects that the municipality needs undertake, the allocation for MIG is Budget at R19 million as per DORA allocation.
1.4 Operating Revenue Framework
For Mamusa Local to continue improving the quality of services provided to its citizens it needs to generate the required revenue. In these tough economic times strong revenue management is fundamental to the financial sustainability of every municipality. The reality is that we are faced with development backlogs and poverty. The expenditure required to address these challenges will inevitably always exceed available funding; hence difficult choices have to be made in relation to tariff increases and balancing expenditures against realistically anticipated revenues.
The municipality’s revenue strategy is built around the following key components:
• National Treasury’s guidelines and macroeconomic policy;• Growth in the Municipality and continued economic development;
March 20164

• Efficient revenue management, which aims to ensure a 95 per cent annual collection rate for property rates and other key service charges;
• Electricity tariff increases as approved by the National Electricity Regulator of South Africa (NERSA);
• Achievement of full cost recovery of specific user charges especially in relation to trading services;
• Determining the tariff escalation rate by establishing/calculating the revenue requirement of each service;
• The municipality’s Property Rates Policy approved in terms of the Municipal Property Rates Act, 2004 (Act 6 of 2004) (MPRA);
• Increase ability to extend new services and recover costs;• The municipality’s Indigent Policy and rendering of free basic services; and• Tariff policies of the Municipality.
The following table is a summary of the 2016/17 MTREF (classified by main revenue source):
Table 2 Summary of revenue classified by main revenue source
March 20165

Choose name from list - Table A4 Budgeted Financial Performance (revenue and expenditure)
Description Ref 2012/13 2013/14 2014/15
R thousand 1Audited
OutcomeAudited
OutcomeAudited
OutcomeOriginal Budget
Adjusted Budget
Full Year Forecast
Pre-audit outcome
Budget Year 2016/17
Budget Year +1 2017/18
Budget Year +2 2018/19
Revenue By SourceProperty rates 2 7 127 7 596 12 868 8 726 8 726 – – 12 387 13 154 13 931
Property rates - penalties & collection charges –
Serv ice charges - electricity rev enue 2 21 241 24 124 28 042 32 103 32 103 – – 35 185 37 366 39 571
Serv ice charges - w ater rev enue 2 12 140 8 489 11 443 13 486 13 486 – – 4 852 5 153 5 457
Serv ice charges - sanitation rev enue 2 8 848 9 214 10 143 9 774 9 774 – – 5 514 5 856 6 201
Serv ice charges - refuse rev enue 2 5 251 5 583 6 077 6 084 6 084 – – 6 486 6 888 7 294
Serv ice charges - other – – – – – – – –
Rental of facilities and equipment 158 380 1 018 372 382 666 707 749
Interest earned - ex ternal inv estments 572 232 169 162 62 4 4 4
Interest earned - outstanding debtors 12 314 12 893 14 087 14 393 17 393 16 461 17 481 18 513
Div idends receiv ed – – – – – – – – – –
Fines 13 42 301 864 789 628 666 706
Licences and permits 2 348 2 264 1 240 1 219 2 093 2 345 2 490 2 637
Agency serv ices 72 – 1 472 1 553 1 553 1 401 1 488 1 576
Transfers recognised - operational 69 266 39 805 61 930 48 284 70 284 50 550 51 392 53 786
Other rev enue 2 3 086 882 6 472 1 401 1 783 – – 1 050 1 118 1 184
Gains on disposal of PPE – – – –
Total Revenue (excluding capital transfers and contributions)
142 436 111 503 155 260 138 420 164 512 – – 137 527 143 765 151 609
2016/17 Medium Term Revenue & Expenditure Framework
Current Year 2015/16
In line with the formats prescribed by the Municipal Budget and Reporting Regulations, capital transfers and contributions are excluded from the operating statement, as inclusion of these revenue sources would distort the calculation of the operating surplus/deficit.
Revenue generated from rates and services charges forms a significant percentage of the revenue basket for the Municipality. Rates and service charge revenues comprise more than two thirds of the total revenue mix. In the 2015/16 financial year, revenue from rates and services charges amounts to R75.1 million. Council to note that our main source of revenue for now is electricity, the increased share that the sale of electricity contributes to the total revenue mix, which in turn is due to rapid increases in the Eskom tariffs for bulk electricity. The projected billing that is stated on water and sanitation is only basic charge. Since we are faced with drought, council would note charge for consumption till the situation improves.
March 20166

Category Number of Properties Tariff Water Tariff Sanitation Water Billing Mothly Yearly Water Sewer Billing Monthly Yearly SewerBusiness SR 209 48.68 58.66 R 10 174.12 R 122 089.44 R 12 259.94 R 147 119.28Business 105 24.96 27.46 R 2 620.80 R 31 449.60 R 2 883.30 R 34 599.60Government 73 48.68 58.66 R 3 553.64 R 42 643.68 R 4 282.18 R 51 386.16Industrial 6 48.68 58.66 R 292.08 R 3 504.96 R 351.96 R 4 223.52Residential SR 847 48.68 58.66 R 41 231.96 R 494 783.52 R 49 685.02 R 596 220.24Residential 10066 24.96 27.46 R 251 247.36 R 3 014 968.32 R 276 412.36 R 3 316 948.32Worship 60 24.96 27.46 R 1 497.60 R 17 971.20 R 1 647.60 R 19 771.20Municipality 386 24.96 27.46 R 9 634.56 R 115 614.72 R 10 599.56 R 127 194.72Agric 1728 48.68 58.66 R 84 119.04 R 1 009 428.48 R 101 364.48 R 1 216 373.76
13480 R 4 852 453.92 R 5 513 836.80
Property rates is the second largest revenue source totaling R12 million rand for Financial year 2016/17 and increases to R13 million for financial year 2017/18. Farmers are given 50% rebate as a form of drought relief and council to engage with farmers union in order to implement the rebate. Residential properties with a value of R 68 000 or less are given rebates. Indigents will apply as per the indigent policy.
Category/Description Proposed rebate
Council’s adopted rebate
Adopted Rebates
State Properties 0.0%Residential Properties R68 000Public schools 0.0%Public Service Infrastructure 100%Rebate on payment of Rates before 30 September
Rebates on Agricultural Land 50% No municipal roads next to property No municipal sewerage to the property No municipal electricity to the property No water supply to the property by the municipality No refuse removal provided by the municipality Contribution to job creation
1 to 10 workers 11 to 50 workers 51 workers and moreContribution to social and economic welfare of farm workers:
Residential property provide with potable water Residential property provide with electricity Availing land/buildings for: education purposes
recreational purposes Retired and disabled person on residential properties only :
Owner with income less than R 2 500 per month 100%
The third largest sources is ‘other revenue’ which consists of various items such as income received from permits and licenses, building plan fees, connection fees, transport fees and
March 20167

advertisement fees. Departments have been urged to review the tariffs of these items on an annual basis to ensure they are cost reflective and market related.
PROPERTY RATES [9/5] 2013/14 2014/15 2015/16 2016/17 2017/18 2018/19
2.1
Residential/ Household/Vacant 0.00644 0.00679 0.00644 0.00687 0.00729 0.007724Business 0.01940 0.02044 0.01940 0.02068 0.02196 0.023255Industrial 0.00248 0.00261 0.00248 0.00264 0.00281 0.002974Government Sector 0.01480 0.01559 0.01480 0.01577 0.01675 0.017738Other 0.01480 0.01559 0.01480 0.01577 0.01675 0.017738Non urban land 0.00161 0.00170 0.00161 0.00172 0.00182 0.001931Agricultural 0.00177 0.00186 0.00177 0.00172 0.00182 0.001931Business and industrial use non-urban land 0.00786 0.00828 0.00786 0.00838 0.00890 0.009421
2.2
That in terms of section 46(1) of the Municipal Property Rates Act of 2004 property rates will be levied on the market value of the taxable properties listed in the valuation roll of Mamusa Local Municipality, for the year 1 July 2016 to 30 June 2017 at the following tariffs;
That in terms of section 46(1) of the Municipal Property Rates Act of 2004 determine that the rates due be paid in twelve (12) equal monthly instalments for all residents and businessess before the 7th day of every month from July 2016 until June 2017 and that Non Urban Land ( Agricultural) and government be
levied annually in July.
Operating grants and transfers totals R50.5 million in the 2016/17 financial year and steadily increases. Council to note that grants from the district is not included as we have not received any communication.
Tariff-setting is a pivotal and strategic part of the compilation of any budget. When rates, tariffs and other charges were revised, local economic conditions, input costs and the affordability of services were taken into account to ensure the financial sustainability of the Municipality.
Council has increase the fees for license and permits for tuck shops around the townships at Ipelegeng, Amalia, Migdol, and Glaudina from R180 to R 768 to cover the cost of refuse collection and amount of refuse collected is more than that of normal residential place. The other reason for this increase is to cover basic services as most of the household that have tuck shops do not pay for services rendered to them.
BUSINESS LICENCE TARIFFS AND FINES 2013/14 2014/15 2015/16 2016/17 2017/18 2018/19
30.A.1 Trading Licences 0 172.00 180.26 768.80 816.47 864.637130.A.2 Trading without a Linceces 0 1500.00 1572 1675.75 1779.65 1884.64830.A.3 Trading or hawking in meals without a licence 0 500.00 524 558.58 593.22 628.21630.A.4 Trading contrary to to terms and conditions 0 1000.00 1048 1117.17 1186.43 1256.432
March 20168
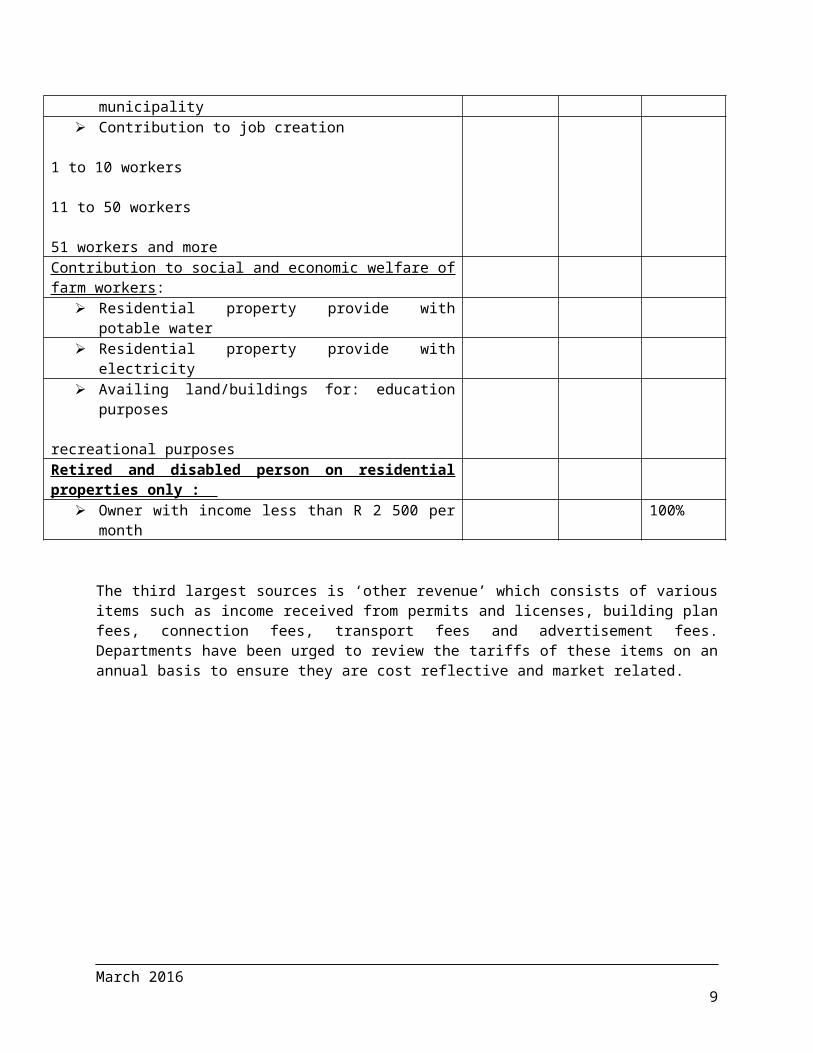
Table 3 Operating Transfers and Grant ReceiptsChoose name from list - Supporting Table SA18 Transfers and grant receipts
Description Ref 2012/13 2013/14 2014/15
R thousandAudited
OutcomeAudited
OutcomeAudited
OutcomeOriginal Budget
Adjusted Budget
Full Year Forecast
Budget Year 2016/17
Budget Year +1 2017/18
Budget Year +2 2018/19
RECEIPTS: 1, 2
Operating Transfers and Grants
National Government: 33 579 38 715 57 574 47 809 57 809 – 49 000 51 392 53 786 Local Gov ernment Equitable Share 29 825 33 675 53 454 43 070 53 070 45 162 48 260 51 186
– – – – Municipal Sy stems Improv ement 800 890 934 930 930 750 787 – Finance Management 673 1 650 1 800 1 875 1 875 2 010 2 345 2 600 EPWP Incentiv e 2 281 2 500 1 386 1 169 1 169 1 078 – –
–
Other transfers/grants [PMU 5% MIG] 765 765
Provincial Government: 500 550 550 1 240 1 240 – – – – – – – –
Prov incial Library Grant 500 550 550 1 240 1 240
District Municipality: – 170 430 12 000 12 000 – – – – [insert description] 170 430 –
12 000 12 000
Other grant providers: – 370 409 – – – – – – LG Seta 28 90 NGO 343 319
Total Operating Transfers and Grants 5 34 079 39 805 58 964 61 049 71 049 – 49 000 51 392 53 786
Current Year 2015/162016/17 Medium Term Revenue &
Expenditure Framework
.
It must also be appreciated that the consumer price index, as measured by CPI, is not a good measure of the cost increases of goods and services relevant to municipalities. The basket of goods and services utilized for the calculation of the CPI consist of items such as food, petrol and medical services, whereas the cost drivers of a municipality are informed by items such as the cost of remuneration, bulk purchases of electricity and water, petrol, diesel, chemicals, cement etc. The current challenge facing the Municipality is managing the gap between cost drivers and tariffs levied, as any shortfall must be made up by either operational efficiency gains or service level reductions. Within this framework the Municipality has undertaken the tariff setting process relating to service charges as follows.
1.4.1 Property Rates
Property rates cover the cost of the provision of general services. Determining the effective property rate tariff is therefore an integral part of the municipality’s budgeting process.
National Treasury’s MFMA Circular No. 51 deals, inter alia with the implementation of the Municipal Property Rates Act, with the regulations issued by the Department of Co-operative Governance. These regulations came into effect on 1 July 2009 and prescribe the rate ratio for the non-residential categories, public service infrastructure and agricultural properties relative to residential properties to be 0,25:1. The implementation of these regulations was done in the previous budget process and the Property Rates Policy of the Municipality has been amended accordingly.
March 20169
The following stipulations in the Property Rates Policy are highlighted:
• The first R68 000 of the market value of a property used for residential purposes is excluded from the rate-able value (Section 17(h) of the MPRA
• 100 per cent rebate will be granted to registered indigents in terms of the Indigent Policy;• For pensioners, physically and mentally disabled persons, a maximum/total rebate of 50
per cent (calculated on a sliding scale) will be granted to owners of rate-able property if the total gross income of the applicant and/or his/her spouse, if any, does not to exceed the amount equal to twice the annual state pension as approved by the National Government for a financial year. In this regard the following stipulations are relevant:
- The rate-able property concerned must be occupied only by the applicant and his/her spouse, if any, and by dependents without income;
- The applicant must submit proof of his/her age and identity and, in the case of a physically or mentally handicapped person, proof of certification by a Medical Officer of Health, also proof of the annual income from a social pension;
- The applicant’s account must be paid in full, or if not, an arrangement to pay the debt should be in place; and
- The property must be categorized as residential.
Billing Ratable RebateRESIDENTIAL R 5 198 552.00 R 3 427 594.00 R 1 770 958.00GOVERNMENT PROP R 1 777 508.00 R 1 777 508.00 R 0.00INDUSTRIAL(IND) R 2 843.00 R 2 843.00 R 0.00MUNICIPAL PROPE R 399 452.00 R 0.00 R 399 452.00PUBLIC WORSHIP R 903 350.00 R 903 350.00 R 0.00AGRICULTURAL LA R 3 504 269.00 R 1 752 134.50 R 1 752 134.50Business R 4 523 097.00 R 4 523 097.00 R 0.00Total R 16 309 071.00 R 12 386 526.50 R 3 922 544.50
• The Municipality may award a 100 per cent grant-in-aid on the assessment rates of rate-able properties of certain classes such as registered welfare organizations, institutions or organizations performing charitable work, sports grounds used for purposes of amateur sport. The owner of such a property must apply to the Chief Financial Officer in the prescribed format for such a grant.
The categories of rate-able properties for purposes of levying rates and the proposed rates for the 2016/17 financial year based on a 6 per cent increase from 1 July 2016.
March 201610

Choose name from list - Supporting Table SA13a Service Tariffs by category2016/17 Medium Term Revenue &
Expenditure FrameworkBudget Year
2016/17Budget Year +1 2017/18
Budget Year +2 2018/19
Property rates (rate in the Rand) 1
Residential properties 050009 0.006079 0.0064 0.0068 0.0064 0.0069 0.0073 0.0077
Residential properties - v acant land 050010 0.097830 0.1037 0.1093 0.1037 - - -
Formal/informal settlements -
Small holdings -
Farm properties - used 050013 0.001668 0.0018 0.0019 0.0018 0.0017 0.0018 0.0019
Farm properties - not used - - - -
Industrial properties 050005 0.002340 0.0025 0.0026 0.0025 0.0026 0.0028 0.0030
Business and commercial properties 050002 0.018300 0.0194 0.0204 0.0194 0.0207 0.0220 0.0233
Communal land - residential -
Communal land - small holdings -
Communal land - farm property -
Communal land - business and commercial -
Communal land - other -
State-ow ned properties 050004 0.013958 0.0148 0.0156 0.0015 0.0158 0.0167 0.0177
Municipal properties
Public serv ice infrastructure
Priv ately ow ned tow ns serv iced by the
State trust land
Restitution and redistribution properties
Protected areas
National monuments properties
Current Year 2015/16
Description RefProvide description of tariff structure where
appropriate2012/13 2013/14 2014/15
1.4.2 Overall impact of tariff increases on households
The following table shows the overall expected impact of the tariff increases on a large and small household, as well as an indigent household receiving free basic services.
Note that in all instances the overall impact of the tariff increases on household’s bills has been kept to between 12 and 13 per cent, with the increase for indigent households closer to 12 per cent.
1.4.3 Service Charges
Water and Sanitation projected billing is based on the fixed basic charge that is determined on the tariff schedule. We bring to the attention of council that even the basic charge that is to be implemented, the actual revenue is not to be realized based on the trend of payment of services. The drought will heat the municipality hard financially. Council to take into consideration that we are unable to accurately measure consumption as required by section 95(d) of the Municipal systems act 32 of 2000. The proposal is the council to apply for water and sanitation authority status or transfer back the services to the water services authority.
March 201611

Table 4 MBRR Table SA14 – Household billsChoose name from list - Supporting Table SA14 Household bills
2012/13 2013/14 2014/152016/17 Medium Term Revenue & Expenditure
FrameworkAudited
OutcomeAudited
OutcomeAudited
OutcomeOriginal Budget
Adjusted Budget
Full Year Forecast
Budget Year 2016/17
Budget Year 2016/17
Budget Year +1 2017/18
Budget Year +2 2018/19
Rand/cent % incr.Monthly Account for Household - 'Middle Income Range'
1
Rates and services charges:Property rates 780.00 899.00 948.00 993.50 993.50 6.6% 1 059.08 1 124.74 1 191.10
Electricity : Basic lev y 110.00 113.00 119.78 127.33 127.33 9.5% 139.42 148.07 156.80
Electricity : Consumption 970.85 1 020.55 1 180.00 1 254.34 1 254.34 9.5% 1 373.50 1 458.66 1 544.72
Water: Basic lev y 38.00 41.30 43.57 45.66 45.66 6.6% 3.01 3.20 3.39
Water: Consumption 437.11 456.00 480.60 503.67 503.67 6.6% 33.24 35.30 37.39
Sanitation 46.00 47.00 49.50 51.88 51.88 6.6% 55.30 58.73 62.19
Refuse remov al 55.70 58.30 61.40 64.35 64.35 6.6% 68.59 72.85 77.14
Other – – – –
sub-total 2 437.66 2 635.15 2 882.85 3 040.72 3 040.72 – (10.1%) 2 732.15 2 901.54 3 072.73 VAT on Serv ices
Total large household bill: 2 437.66 2 635.15 2 882.85 3 040.72 3 040.72 – (10.1%) 2 732.15 2 901.54 3 072.73 % increase/-decrease 8.1% 9.4% 5.5% – (100.0%) – 6.2% 5.9%
Ref
Current Year 2015/16Description
The billing of a high income category on a monthly basis is at R 3 700.
1.5 Operating Expenditure Framework
The Municipality’s expenditure framework for the 2016/17 budget and MTREF is informed by the following:
• The asset renewal strategy and the repairs and maintenance plan;• Balanced budget constraint (operating expenditure should not exceed operating
revenue) unless there are existing uncommitted cash-backed reserves to fund any deficit;
• Funding of the budget over the medium-term as informed by Section 18 and 19 of the MFMA;
• The capital programme is aligned to the asset renewal strategy and backlog eradication plan;
• Operational gains and efficiencies will be directed to funding the capital budget and other core services; and
• Strict adherence to the principle of no project plan no budget. If there is no business plan no funding allocation can be made.
The following table is a high level summary of the 2016/17 budget and MTREF (classified per main type of operating expenditure):
March 201612

Table 5 Summary of operating expenditure by standard classification itemChoose name from list - Table A4 Budgeted Financial Performance (revenue and expenditure)
Description Ref 2012/13 2013/14 2014/15
R thousand 1Audited
OutcomeAudited
OutcomeAudited
OutcomeOriginal Budget
Adjusted Budget
Full Year Forecast
Pre-audit outcome
Budget Year 2016/17
Budget Year +1 2017/18
Budget Year +2 2018/19
Expenditure By Type
Employ ee related costs 2 33 853 43 469 44 288 43 527 50 601 – – 54 146 56 625 58 458
Remuneration of councillors 3 272 5 022 4 111 5 000 5 038 4 767 4 981 5 143
Debt impairment 3 89 639 23 736 9 331 30 777 40 496 40 496 42 318 43 693
Depreciation & asset impairment 2 852 10 943 27 483 10 325 27 903 – – 27 903 29 159 30 106
Finance charges 190 290 43 500 1 500 1 821 500 530
Bulk purchases 2 23 449 21 609 23 093 28 001 26 402 – – 28 462 30 177 31 957
Other materials 8 6 363 5 179 4 728 3 156 4 905 5 006 4 042 4 281
Contracted serv ices 3 073 4 285 5 212 5 568 8 398 – – 12 154 11 508 12 187
Transfers and grants 243 6 850 4 858 – 8 262 – – 8 262 8 774 9 292
Other ex penditure 4, 5 18 701 21 502 31 244 11 773 14 873 – – 10 269 8 877 9 343
Loss on disposal of PPE – – – – – – –
Total Expenditure 179 634 142 885 154 391 138 627 188 377 – – 193 285 196 960 204 989
Current Year 2015/162016/17 Medium Term Revenue &
Expenditure Framework
The budgeted allocation for employee related costs for the 2016/17 financial year totals R54 million, which equals 28 per cent of the total operating expenditure. Based on the three year collective SALGBC agreement, salary increases have been factored into this budget at a percentage increase of 7 per cent for the 2016/17 financial year. An annual increase of average plus 1 per cent has been included in the two outer years of the MTREF. The draft before council on employee related cost does not allow for any appointments and as no submissions were made to the existing structure.
The cost associated with the remuneration of Councillors is determined by the Minister of Co-operative Governance and Traditional Affairs in accordance with the Remuneration of Public Office Bearers Act, 1998 (Act 20 of 1998). The most recent proclamation in this regard has been taken into account in compiling the Municipality’s budget.
The provision of debt impairment was determined based on an annual collection rate of 54 per cent and the Debt Write-off Policy of the Municipality. Municipality to finalize the debt impairment before the final budget is approved
Provision for depreciation and asset impairment has been informed by the Municipality’s Asset Management Policy. Depreciation is widely considered a proxy for the measurement of the rate asset consumption.
Travel and Subsistence policy must be reviewed as most employee are making money out of the policy. And there is lack of proper monitoring of travels. It is also proposed that the Accounting Officer with the advice of other section 56 managers approve travels that are beneficial to the community and municipality.
Finance charges consist primarily of the repayment of interest on Eskom accounts, AG and other Creditors. Finance charges make up 0.9 per cent (R1.8 million) of operating expenditure MTREF.
Bulk purchases are directly informed by the purchase of electricity from Eskom and water license. The annual price increases have been factored into the budget appropriations and directly inform the revenue provisions.
March 201613

In line with the Municipality’s repairs and maintenance, expenditure has not been prioritized to ensure sustainability of the Municipality’s infrastructure. For 2016/17 the appropriation against this group of expenditure has grown by 2 per cent (R5 million) and the reason why the growth is not significant is that maintenance plan is not developed in accordance with the ageing infrastructure.
Contracted services has been identified as a cost saving area for the Municipality. As part of the compilation of the 2016/17 MTREF this group of expenditure was critically evaluated and operational efficiencies were enforced. The services such as maintenance of sewer and water plant needs to be placed on contracted as it will assist on cost savings
Other expenditure comprises of various line items relating to the daily operations of the municipality. This group of expenditure has also been identified as an area in which cost savings and efficiencies can be achieved.
The table below provides a breakdown of the repairs and maintenance in relation to asset class:
Table 6 Repairs and maintenance per asset class
Choose name from list - Supporting Table SA34c Repairs and maintenance expenditure by asset class
Description Ref 2012/13 2013/14 2014/15
R thousand 1Audited
OutcomeAudited
OutcomeAudited
OutcomeOriginal Budget
Adjusted Budget
Full Year Forecast
Budget Year 2016/17
Budget Year +1 2017/18
Budget Year +2 2018/19
Repairs and maintenance expenditure by Asset Class/Sub-class
Infrastructure 2 494 3 082 2 289 2 389 2 977 – 2 722 1 842 1 951 Infrastructure - Road transport 1 413 – 23 298 403 – 454 252 266
Roads, Pavements & Bridges 627 23 298 403 454 252 266
Storm water 787 –
Infrastructure - Electricity 596 1 415 1 494 1 725 1 300 – 54 57 60
Generation –
Transmission & Reticulation 963 1 494 1 725 1 300 54 57 60
Street Lighting 596 452 –
Infrastructure - Water 485 1 141 2 – 0 – 21 22 24
Dams & Reservoirs 485
Water purificationReticulation 1 141 2 0 21 22 24
Infrastructure - Sanitation – 526 744 367 1 258 – 2 182 1 500 1 589
Reticulation 744 367 1 258 2 182 1 500 1 589
Sewerage purification 526 –
Infrastructure - Other – – 26 – 16 – 10 11 12
Waste Management –
Transportation 2 –
Gas –
Other 3 26 16 10 11 12
Current Year 2015/162016/17 Medium Term Revenue &
Expenditure Framework
For the 2016/17 financial year, R2.7 million of total repairs and maintenance will be spent on infrastructure assets. Sanitation infrastructure has received a significant proportion of this allocation.
March 201614

2 Cash Flow Statement
The cash flow below indicates a net decrease of R11.8 million which it will not cover our creditors. Our projected creditors for the financial year 2016/17 is at R 63.9 million. Mainly Eskom is the contributor to such a huge creditor’s book. Council should note that the salary projections are for the current staff, if we to include other possible appointments the cash flow projections will further have a net decrease.
March 201615

Choose name from list - Supporting Table SA30 Budgeted monthly cash flow
MONTHLY CASH FLOWS
R thousand July August Sept. October November December January February March April May JuneBudget Year
2016/17Budget Year
+1 2017/18Budget Year
+2 2018/19Cash Receipts By Source 1
Property rates 236 270 510 404 1 753 900 800 560 600 500 400 623 7 556 8 024 8 498
Property rates - penalties & collection charges – – – – – – – – – – – – – – –
Serv ice charges - electricity rev enue 3 200 1 400 1 600 1 300 1 500 1 900 1 100 2 000 1 500 2 500 3 500 3 833 25 333 26 904 28 491
Serv ice charges - w ater rev enue 63 100 75 242 240 110 180 165 170 120 80 105 1 650 1 752 1 855
Serv ice charges - sanitation rev enue 81 121 72 52 44 35 108 108 108 81 81 101 992 1 054 1 116
Serv ice charges - refuse rev enue 87 81 97 80 85 93 88 82 73 71 80 121 1 038 1 102 1 167
Serv ice charges - other – – – – – – – – – – – – – – –
Rental of facilities and equipment 33 36 35 28 31 30 30 36 24 39 24 320 666 707 749
Interest earned - ex ternal inv estments 0 0 0 0 0 0 0 0 0 0 0 1 4 4 4
Interest earned - outstanding debtors – – – – – – – – – – – – – – –
Div idends receiv ed – – – – – – – – – – – – – – –
Fines 35 75 45 68 25 35 45 58 60 83 50 49 628 666 706
Licences and permits 100 95 80 90 95 95 85 110 105 120 130 1 240 2 345 2 490 2 637
Agency serv ices 145 132 120 168 153 10 105 110 135 120 135 68 1 401 1 488 1 576
Transfer receipts - operational 19 240 6 000 10 768 4 000 6 542 4 000 (0) 50 550 53 684 56 851
Other rev enue 1 050 1 050 1 115 1 181
Cash Receipts by Source 23 220 2 310 8 634 2 432 14 694 3 208 6 541 3 229 9 318 7 634 4 480 7 510 93 212 98 991 104 832
Other Cash Flows by SourceTransfer receipts - capital 4 995 4 995 4 995 4 995 19 979 15 972 16 652 Contributions recognised - capital & Contributed assets – Proceeds on disposal of PPE – Short term loans – Borrow ing long term/refinancing – Increase (decrease) in consumer deposits – Decrease (Increase) in non-current debtors – Decrease (increase) other non-current receiv ables – Decrease (increase) in non-current inv estments –
Total Cash Receipts by Source 23 220 2 310 13 629 2 432 14 694 8 203 6 541 3 229 9 318 12 629 4 480 12 504 113 191 114 963 121 484
Cash Payments by TypeEmploy ee related costs 4 200 3 700 4 700 4 500 4 700 4 600 3 848 4 200 4 200 4 300 4 200 6 998 54 146 56 625 58 458
Remuneration of councillors 395 450 385 385 382 382 386 381 382 440 390 409 4 767 4 981 5 143
Finance charges 195 196 100 197 198 195 111 110 112 98 110 199 1 821 500 530
Bulk purchases - Electricity 1 800 1 500 1 900 1 800 1 810 1 300 1 800 1 700 1 950 1 300 2 700 1 855 21 415 22 743 24 085
Bulk purchases - Water & Sew er – 6 – 6 – 6 6 – 6 – 6 11 47 – –
Other materials 250 275 445 650 246 245 475 250 260 575 560 775 5 006 4 042 4 281
Contracted serv ices 890 570 940 975 510 470 820 895 495 470 1 290 429 8 754 9 297 9 846
Transfers and grants - other municipalities – – – – – – – – – – – – – – –
Transfers and grants - other – – – – – – – – – – – – – – –
Other ex penditure 900 975 850 870 750 790 850 750 1 050 950 870 664 10 269 8 877 9 343
Cash Payments by Type 8 630 7 672 9 320 9 383 8 596 7 988 8 296 8 286 8 455 8 133 10 126 11 341 106 225 107 065 111 684
Other Cash Flows/Payments by TypeCapital assets 4 995 4 995 4 995 4 995 19 979 15 972 16 652
Repay ment of borrow ing –
Other Cash Flow s/Pay ments –
Total Cash Payments by Type 8 630 7 672 14 315 9 383 8 596 12 983 8 296 8 286 8 455 13 128 10 126 16 335 126 204 123 037 128 336
NET INCREASE/(DECREASE) IN CASH HELD 14 590 (5 362) (686) (6 951) 6 098 (4 780) (1 755) (5 057) 863 (499) (5 645) (3 831) (13 013) (8 073) (6 852) Cash/cash equiv alents at the month/y ear begin: 1 200 15 790 10 429 9 743 2 793 8 891 4 111 2 357 (2 700) (1 837) (2 336) (7 982) 1 200 (11 813) (19 886) Cash/cash equiv alents at the month/y ear end: 15 790 10 429 9 743 2 793 8 891 4 111 2 357 (2 700) (1 837) (2 336) (7 982) (11 813) (11 813) (19 886) (26 738)
Medium Term Revenue and Expenditure Framework
Budget Year 2016/17
March 201616

2.1.1 Free Basic Services: Basic Social Services Package
The social package assists households that are poor or face other circumstances that limit their ability to pay for services. To receive these free services the households are required to register in terms of the Municipality’s Indigent Policy. The target is to register 10 000 or more indigent households during the 2016/17 financial year, a process reviewed annually. Transfers and Grants are for free basic services which is a non cash transfer to indigent household, budgeted FBS amounts to R8.2 million
The cost of the social package of the registered indigent households is largely financed by national government through the local government equitable share received in terms of the annual Division of Revenue Act.
2.2 Annual Budget Tables – Mamusa Local Municipality
The following eighteen pages present the ten main budget tables as required in terms of section 8 of the Municipal Budget and Reporting Regulations. These tables set out the municipality’s 2016/17 budget and MTREF as approved by the Council. Each table is accompanied by explanatory notes on the facing page.
3. Readiness to implement the mSCOA
The municipality has already commitment to implement mSCOA as agreed with the system vendor. The budget cost are submitted by the system vendor. All the necessary process have being implemented according to the implementation plan. Official have shown interest and council is also involved in every steps through the submission of documents for council approval and consideration. The municipality has also committed to the early implementation of the mSCOA on the 1 st
July 2016.
March 201617

Table 7 MBRR Table A1 - Budget Summary
March 201618

Description 2012/13 2013/14 2014/15
R thousandsAudited
OutcomeAudited
OutcomeAudited
OutcomeOriginal Budget
Adjusted Budget
Full Year Forecast
Pre-audit outcome
Budget Year 2016/17
Budget Year +1 2017/18
Budget Year +2 2018/19
Financial PerformanceProperty rates 7 127 7 596 12 868 8 726 8 726 – – 12 387 13 154 13 931 Serv ice charges 47 480 47 410 55 705 61 447 61 447 – – 52 037 55 263 58 524 Inv estment rev enue 572 232 169 162 62 – – 4 4 4 Transfers recognised - operational 69 266 39 805 61 930 48 284 70 284 – – 50 550 51 392 53 786 Other ow n rev enue 17 991 16 461 24 589 19 802 23 994 – – 22 550 23 951 25 365
Total Revenue (excluding capital transfers and contributions)
142 436 111 503 155 260 138 420 164 512 – – 137 527 143 765 151 609
Employ ee costs 33 853 43 469 44 288 43 527 50 601 – – 54 146 56 625 58 458 Remuneration of councillors 3 272 5 022 4 111 5 000 5 038 – – 4 767 4 981 5 143 Depreciation & asset impairment 852 10 943 27 483 10 325 27 903 – – 27 903 29 159 30 106 Finance charges 190 290 43 500 1 500 – – 1 821 500 530 Materials and bulk purchases 29 812 26 789 27 822 31 157 31 307 – – 33 468 34 219 36 238 Transfers and grants 243 6 850 4 858 – 8 262 – – 8 262 8 774 9 292 Other ex penditure 111 413 49 523 45 787 48 119 63 767 – – 62 919 62 703 65 223
Total Expenditure 179 634 142 885 154 391 138 627 188 377 – – 193 285 196 960 204 989 Surplus/(Deficit) (37 198) (31 382) 869 (208) (23 865) – – (55 758) (53 195) (53 379)
Transfers recognised - capital – 13 446 20 183 17 616 18 843 – – 19 979 15 972 16 652 Contributions recognised - capital & contributed assets – – – – – – – – – –
Surplus/(Deficit) after capital transfers & contributions
(37 198) (17 936) 21 052 17 408 (5 022) – – (35 779) (37 223) (36 727)
Share of surplus/ (deficit) of associate – – – – – – – – – –
Surplus/(Deficit) for the year (37 198) (17 936) 21 052 17 408 (5 022) – – (35 779) (37 223) (36 727)
Capital expenditure & funds sourcesCapital expenditure 23 031 13 905 29 262 28 623 31 079 – – 20 455 15 972 16 652
Transfers recognised - capital 22 537 12 853 26 736 17 516 18 888 – – 20 419 15 972 16 652 Public contributions & donations – – – – – – – – – – Borrow ing – – – – – – – – – – Internally generated funds 495 1 052 2 527 11 107 12 191 – – 36 – –
Total sources of capital funds 23 031 13 905 29 262 28 623 31 079 – – 20 455 15 972 16 652
Financial positionTotal current assets 27 987 32 089 52 401 49 723 43 823 43 823 – 30 750 38 879 48 558 Total non current assets 263 552 254 113 388 137 275 060 277 784 277 784 – 157 038 166 070 175 709 Total current liabilities 68 095 80 469 73 738 37 260 68 106 66 606 – 63 960 67 926 71 933 Total non current liabilities 19 093 20 906 16 190 23 000 26 958 26 958 – 28 737 30 519 32 320 Community w ealth/Equity 204 351 184 827 350 609 264 523 226 543 228 043 – – – –
Cash flowsNet cash from (used) operating 13 241 (18 199) 23 874 24 694 33 749 33 749 – 6 966 7 899 9 800 Net cash from (used) inv esting (21 091) – – (28 023) (28 050) (28 050) – (19 979) (15 972) (16 652) Net cash from (used) financing – – – – – – – – – –
Cash/cash equivalents at the year end 1 982 (14 457) 25 004 1 747 10 775 10 775 – (11 813) (19 886) (26 738)
Cash backing/surplus reconciliationCash and inv estments av ailable 1 907 118 1 130 4 500 (1 400) 100 – 100 100 100 Application of cash and inv estments 49 409 54 060 42 064 22 451 47 186 60 000 – 48 927 48 907 48 166
Balance - surplus (shortfall) (47 501) (53 942) (40 933) (17 951) (48 586) (59 900) – (48 827) (48 807) (48 066)
Asset managementAsset register summary (WDV) 116 525 35 074 21 811 275 060 277 784 277 784 268 968 268 968 284 940 301 592 Depreciation & asset impairment 852 10 943 27 483 10 325 27 903 – 27 903 27 903 29 159 30 106 Renewal of Ex isting Assets – – – 3 200 2 760 – – 300 – – Repairs and Maintenance 6 363 5 179 4 728 3 979 4 904 – 5 007 5 007 4 042 4 281
Free servicesCost of Free Basic Serv ices prov ided – – – – – – – – – – Rev enue cost of free serv ices prov ided – – – 4 053 4 053 – – – 3 923 4 166 Households below minimum service level
Water: 1 1 0 0 0 – – – – – Sanitation/sew erage: 1 1 1 1 1 – – – – – Energy : – – – – – – – – – – Refuse: 6 6 5 5 5 – – – – –
2016/17 Medium Term Revenue & Expenditure Framework
Current Year 2015/16
Choose name from list - Table A1 Budget Summary
Explanatory notes to MBRR Table A1 - Budget Summary
1. Table A1 is a budget summary and provides a concise overview of the Municipality’s budget from all of the major financial perspectives (operating, capital expenditure, financial position, cash flow, and MFMA funding compliance).
2. The table provides an overview of the amounts approved by Council for operating performance, resources deployed to capital expenditure, financial position, cash and funding
March 201619

compliance, as well as the municipality’s commitment to eliminating basic service delivery backlogs.
3. Financial management reforms emphasizes the importance of the municipal budget being funded. This requires the simultaneous assessment of the Financial Performance, Financial Position and Cash Flow Budgets, along with the Capital Budget. The Budget Summary provides the key information in this regard:
a. The operating surplus/deficit (after Total Expenditure) is positive over the MTREFb. Capital expenditure is balanced by capital funding sources, of which
i. Transfers recognized is reflected on the Financial Performance Budget;ii. Borrowing is incorporated in the net cash from financing on the Cash Flow
Budgetiii. Internally generated funds is financed from a combination of the current
operating surplus and accumulated cash-backed surpluses from previous years. The amount is incorporated in the Net cash from investing on the Cash Flow Budget. The fact that the municipality’s cash flow remains positive, and is improving indicates that the necessary cash resources are available to fund the Capital Budget.
March 201620

Table 8 MBRR Table A2 - Budgeted Financial Performance (revenue and expenditure by standard classification)Choose name from list - Table A2 Budgeted Financial Performance (revenue and expenditure by standard classification)
Standard Classification Description Ref 2012/13 2013/14 2014/15
R thousand 1Audited
OutcomeAudited
OutcomeAudited
OutcomeOriginal Budget
Adjusted Budget
Full Year Forecast
Budget Year 2016/17
Budget Year +1 2017/18
Budget Year +2 2018/19
Revenue - StandardGovernance and administration 89 829 61 377 85 364 70 156 95 139 – 77 729 83 047 87 309
Ex ecutiv e and council 3 008 – – – – – – – – Budget and treasury office 86 821 60 997 84 263 69 783 94 767 – 77 097 82 376 86 598 Corporate serv ices – 380 1 100 372 372 – 632 671 711
Community and public safety 2 770 3 097 14 011 6 658 8 050 – 7 607 5 288 5 600 Community and social serv ices 409 791 11 034 3 056 3 416 – 3 259 670 710 Sport and recreation – – – – – – – – – Public safety 2 361 2 306 2 977 3 602 4 634 – 4 348 4 617 4 890 Housing – – – – – – – – – Health – – – – – – – – –
Economic and environmental services 23 12 913 20 204 15 326 16 568 – 20 031 16 027 16 710 Planning and dev elopment 23 12 912 20 196 15 315 16 547 – 19 997 15 991 16 672 Road transport – 0 8 11 21 – 34 36 38 Env ironmental protection – – – – – – – – –
Trading services 49 814 47 563 55 865 63 896 63 598 – 52 139 55 375 58 643 Electricity 23 543 24 232 28 169 34 525 34 226 – 35 248 37 437 39 645 Water 12 162 8 516 11 459 13 500 13 500 – 4 881 5 184 5 490 Waste w ater management 8 858 9 231 10 160 9 788 9 788 – 5 524 5 867 6 214 Waste management 5 251 5 583 6 077 6 084 6 084 – 6 486 6 888 7 294
Other 4 – – – – – – – – – Total Revenue - Standard 2 142 436 124 949 175 443 156 036 183 355 – 157 506 159 737 168 261
Expenditure - StandardGovernance and administration 72 388 68 730 61 665 71 232 114 434 – 115 458 117 888 122 259
Ex ecutiv e and council 6 916 8 969 15 723 8 243 16 227 – 16 033 16 780 17 515 Budget and treasury office 54 181 43 111 27 079 49 819 82 582 – 82 510 84 193 87 055 Corporate serv ices 11 291 16 650 18 864 13 169 15 625 – 16 915 16 916 17 689
Community and public safety 9 444 12 520 18 541 10 189 14 085 – 14 022 13 835 14 339 Community and social serv ices 4 440 8 805 14 657 6 442 9 903 – 9 512 9 111 9 444 Sport and recreation – – – – – – – – – Public safety 5 004 3 715 3 884 3 747 4 181 – 4 510 4 723 4 895 Housing – – – – – – – – – Health – – – – – – – – –
Economic and environmental services 48 281 17 683 26 231 8 944 8 624 – 9 299 9 507 9 844 Planning and dev elopment 11 360 7 844 20 778 4 432 4 156 – 4 552 4 764 4 932 Road transport 36 921 9 839 5 453 4 512 4 468 – 4 748 4 743 4 912 Env ironmental protection – – – – – – – – –
Trading services 49 522 43 952 47 953 48 263 51 234 – 54 506 55 730 58 548 Electricity 27 223 27 564 28 989 32 775 32 049 – 33 829 35 166 37 188 Water 7 937 5 566 5 789 4 236 4 959 – 5 470 5 690 5 912 Waste w ater management 7 996 6 543 8 550 6 767 9 316 – 9 773 9 359 9 741 Waste management 6 366 4 278 4 625 4 484 4 910 – 5 434 5 515 5 707
Other 4 – – – – – – – – – Total Expenditure - Standard 3 179 634 142 885 154 391 138 628 188 377 – 193 285 196 960 204 989 Surplus/(Deficit) for the year (37 198) (17 936) 21 052 17 408 (5 022) – (35 778) (37 222) (36 728)
Current Year 2015/162016/17 Medium Term Revenue &
Expenditure Framework
March 201621

Explanatory notes to MBRR Table A2 - Budgeted Financial Performance (revenue and expenditure by standard classification)
1. Table A2 is a view of the budgeted financial performance in relation to revenue and expenditure per standard classification. The modified GFS standard classification divides the municipal services into 15 functional areas. Municipal revenue, operating expenditure and capital expenditure are then classified in terms if each of these functional areas which enables the National Treasury to compile ‘whole of government’ reports.
2. Note the Total Revenue on this table includes capital revenues (Transfers recognised – capital) and so does not balance to the operating revenue shown on Table A4.
3. Note that as a general principle the revenues for the Trading Services should exceed their expenditures. The table highlights that this is the case for Electricity, Water and Waste water functions, but not the Waste management function. As already noted above, the municipality will be undertaking a detailed study of this function to explore ways of improving efficiencies and provide a basis for re-evaluating the function’s tariff structure.
4. Other functions that show a deficit between revenue and expenditure are being financed from rates revenues and other revenue sources reflected under the Corporate Services.
March 201622

Table 9 MBRR Table A3 - Budgeted Financial Performance (revenue and expenditure by municipal vote)
Choose name from list - Table A3 Budgeted Financial Performance (revenue and expenditure by municipal vote)
Vote Description Ref 2012/13 2013/14 2014/15
R thousandAudited
OutcomeAudited
OutcomeAudited
OutcomeOriginal Budget
Adjusted Budget
Full Year Forecast
Budget Year 2016/17
Budget Year +1 2017/18
Budget Year +2 2018/19
Revenue by Vote 1Vote 1 - [MUNICIPAL MANAGER VOTE 1] – – – – – – – – – Vote 2 - [COUNCIL VOTE 2] 1 200 – – – – – – – – Vote 3 - [BUDGET & TREASURY VOTE 3] 81 576 60 997 84 263 69 783 94 767 – 77 097 82 376 86 598 Vote 4 - [COMMUNITY SERVICES VOTE 4] 169 – 1 963 1 514 1 514 – 1 366 306 324 Vote 5 - [LIBRARY VOTE 5] 0 551 8 788 1 554 1 554 – 1 558 8 9 Vote 6 - [CEMETARY VOTE 6] 247 240 283 298 348 – 335 356 377 Vote 7 - [TRAFFIC VOTE 7] 2 362 2 306 2 977 3 602 4 634 – 4 348 4 617 4 890 Vote 8 - [REFUSE REMOVAL VOTE 8] 5 260 5 583 6 077 6 084 6 084 – 6 486 6 888 7 294 Vote 9 - [TECHNICAL SERVICES VOTE 9] 23 12 912 20 196 15 315 16 547 – 19 997 15 991 16 672 Vote 10 - [PUBLIC WORKS VOTE 10] 6 191 0 8 11 21 – 34 36 38 Vote 11 - [CORPORATE SERVICES VOTE 11] – 380 1 100 372 372 – 632 671 711 Vote 12 - [WORKSHOP VOTE 12] 164 – – – – – – – – Vote 13 - [ELECTRICITY VOTE 13] 24 223 24 232 28 169 34 216 34 226 – 35 248 37 437 39 645 Vote 14 - [SEWERAGE VOTE 14] 8 858 9 231 10 160 9 788 9 788 – 5 524 5 867 6 214 Vote 15 - [WATER VOTE 15] 12 162 8 516 11 459 13 500 13 500 – 4 881 5 184 5 490
Total Revenue by Vote 2 142 436 124 949 175 443 156 036 183 355 – 157 506 159 737 168 261
Expenditure by Vote to be appropriated 1Vote 1 - [MUNICIPAL MANAGER VOTE 1] 3 972 2 177 8 979 1 951 10 100 – 10 421 11 032 11 600 Vote 2 - [COUNCIL VOTE 2] 4 956 6 792 6 743 6 292 6 127 – 5 612 5 748 5 915 Vote 3 - [BUDGET & TREASURY VOTE 3] 51 444 43 111 27 079 49 819 82 582 – 82 510 84 193 87 055 Vote 4 - [COMMUNITY SERVICES VOTE 4] 3 445 6 763 12 945 4 750 7 841 – 7 374 6 890 7 140 Vote 5 - [LIBRARY VOTE 5] 1 128 1 341 1 166 1 047 1 522 – 1 564 1 621 1 684 Vote 6 - [CEMETARY VOTE 6] 591 700 546 645 541 – 575 601 620 Vote 7 - [TRAFFIC VOTE 7] 5 004 3 715 3 884 3 747 4 181 – 4 510 4 723 4 895 Vote 8 - [REFUSE REMOVAL VOTE 8] 6 366 4 278 4 625 4 484 4 910 – 5 434 5 515 5 707 Vote 9 - [TECHNICAL SERVICES VOTE 9] 11 360 7 844 20 778 4 432 4 156 – 4 552 4 764 4 932 Vote 10 - [PUBLIC WORKS VOTE 10] 26 495 9 839 5 453 4 512 4 468 – 4 748 4 743 4 912 Vote 11 - [CORPORATE SERVICES VOTE 11] 11 291 16 650 18 864 13 127 15 625 – 16 915 16 916 17 689 Vote 12 - [WORKSHOP VOTE 12] 10 426 – – 41 – – – – – Vote 13 - [ELECTRICITY VOTE 13] 27 223 27 564 28 989 32 775 32 049 – 33 829 35 166 37 188 Vote 14 - [SEWERAGE VOTE 14] 7 996 6 543 8 550 6 767 9 316 – 9 773 9 359 9 741 Vote 15 - [WATER VOTE 15] 7 937 5 566 5 789 4 237 4 959 – 5 470 5 690 5 912
Total Expenditure by Vote 2 179 634 142 885 154 391 138 627 188 377 – 193 285 196 960 204 989 Surplus/(Deficit) for the year 2 (37 198) (17 936) 21 052 17 408 (5 022) – (35 778) (37 222) (36 728)
Current Year 2015/162016/17 Medium Term Revenue &
Expenditure Framework
2.6 CLOSURE
The picture given above reflects that the Council budget remains unfunded as the expected cash is lower than the projected expenditure. Recommendation is that the council must halt all the non key posts or administration to demonstrate before council how they will fund the said vacancies. That appointments will be made when the situation of cash flow improves drastically.
March 201623
Related Documents