Mayor’s Proposed May Budget 2010–2011 GAVIN NEWSOM, MAYOR Mayor’s Ofce o Public Policy and Finance Greg Wagner, Mayor’s Budget Director Kate Howard, Deputy Budget Director Rebekah Krell, Senior Fiscal And Policy Analyst Rick Wilson, Senior Fiscal And Policy Analyst Meghan Wallace, Fiscal And Policy Analyst Manish Goyal, Fiscal And Policy Analyst Leo Chyi, Fiscal And Policy Analyst Renee Willette, Fiscal And Policy Analyst Jonathan Lyens, Fiscal And Policy Assistant Dee Schexnayder, Fiscal And Policy Assistant CY Ad COY Of SAN FANISO, AIFONIA

Welcome message from author
This document is posted to help you gain knowledge. Please leave a comment to let me know what you think about it! Share it to your friends and learn new things together.
Transcript

8/9/2019 Mayor's Proposed 2010-11 May Budget
http://slidepdf.com/reader/full/mayors-proposed-2010-11-may-budget 1/107
Mayor’sProposed May Budget
2010–2011
GAVIN NEWSOM, MAYOR
Mayor’s Ofce o Public Policy and FinanceGreg Wagner, Mayor’s Budget Director
Kate Howard,Deputy Budget Director
Rebekah Krell, Senior Fiscal And Policy Analyst
Rick Wilson, Senior Fiscal And Policy Analyst
Meghan Wallace, Fiscal And Policy Analyst
Manish Goyal, Fiscal And Policy Analyst
Leo Chyi, Fiscal And Policy Analyst
Renee Willette, Fiscal And Policy Analyst
Jonathan Lyens, Fiscal And Policy Assistant
Dee Schexnayder, Fiscal And Policy Assistant
CY Ad COY Of SAN FANISO, AIFONIA

8/9/2019 Mayor's Proposed 2010-11 May Budget
http://slidepdf.com/reader/full/mayors-proposed-2010-11-may-budget 2/107

8/9/2019 Mayor's Proposed 2010-11 May Budget
http://slidepdf.com/reader/full/mayors-proposed-2010-11-may-budget 3/107
Acknowledgements
ontroller’s OfceBen Roseneld, Controller
Monique Zmuda, Deputy Controller
Leo Levenson
Andrew Murray
Jef Pera
Michelle Allersma
Nadia Feeser
Aimee Fribourg
Joe Nurisso
Keith DeMartini
Dennis McCormick
apital PlanningProgramBrian Strong
Adam Van de Water
Fran Breeding
Brian Benson
iezebos Holzbaur Group(HDG)Yvo Riezebos
Gregg Holzbaur
Catharina Koh
Tim Borjas
Tim Heraldo
Christopher Harris
Angelyn Navasca
Brieanna Hattey
Bill Alexander
Erik Eaves
Department oTechnologySalla Vaerma-Jadlos
Rubia Alvarez-Murillo
Ana Borja
Ely Bulanadi
Julie CreerRoldan Ditan
Abraham Nazareno

8/9/2019 Mayor's Proposed 2010-11 May Budget
http://slidepdf.com/reader/full/mayors-proposed-2010-11-may-budget 4/107

8/9/2019 Mayor's Proposed 2010-11 May Budget
http://slidepdf.com/reader/full/mayors-proposed-2010-11-may-budget 5/107
How to Use the Mayor's Proposed Budget v
How to Use theMayor’s Proposed Budget
Budget and Other ResourcesMayor’s Proposed May 1 Budgete Mayor’s proposed May 1 budget or the City and County o San Francisco (“City”) containsdepartmental budget submissions rom selected General Fund Departments and Enterprise Departmentsincluding Airport, Board o Appeals, Child Support Services, Children and Families Commission (First 5San Francisco), Law Library, Municipal Transportation Agency, Port, Public Utilities Commission, RentArbitration Board and Retirement System. e proposed budget is organized into the ollowing sections:
Mayor’s Budget Introduction: is provides an overview o the Mayor’s proposed budget includinghighlights and priorities or the 2010–11 budget year.
Budget Summary Tables: ese provide high-level summaries o the Mayor’s proposed budget, detailingchanges over a three-year period: 2008–09 actual data; 2009–10 budgetary data; and 2010–11 proposedbudgetary data and 2011-12 proposed budgetary data, when applicable. e variance columns measure thedollar and percentage diference between the proposed year and current year data.
• Uses by Service Area, Department and Program: is lists citywide expenses at the program levelby Major Service Area (MSA). e seven MSAs include: Public Protection; Public Works; Transportationand Commerce; Human Welare and Neighborhood Development; Community Health; Culture andRecreation; General Administration and Finance; and General City Responsibilities.
• Funded Positions, Grand Recap by MSA and Department: is lists year-to-year change inunded positions by department. e count o unded positions is determined by the total authorizedpositions minus budgeted attrition savings.
Department Budgets: ese provide budgetary inormation and operational priorities or each o the City’sdepartments. Department inormation is organized alphabetically and includes the ollowing sections:
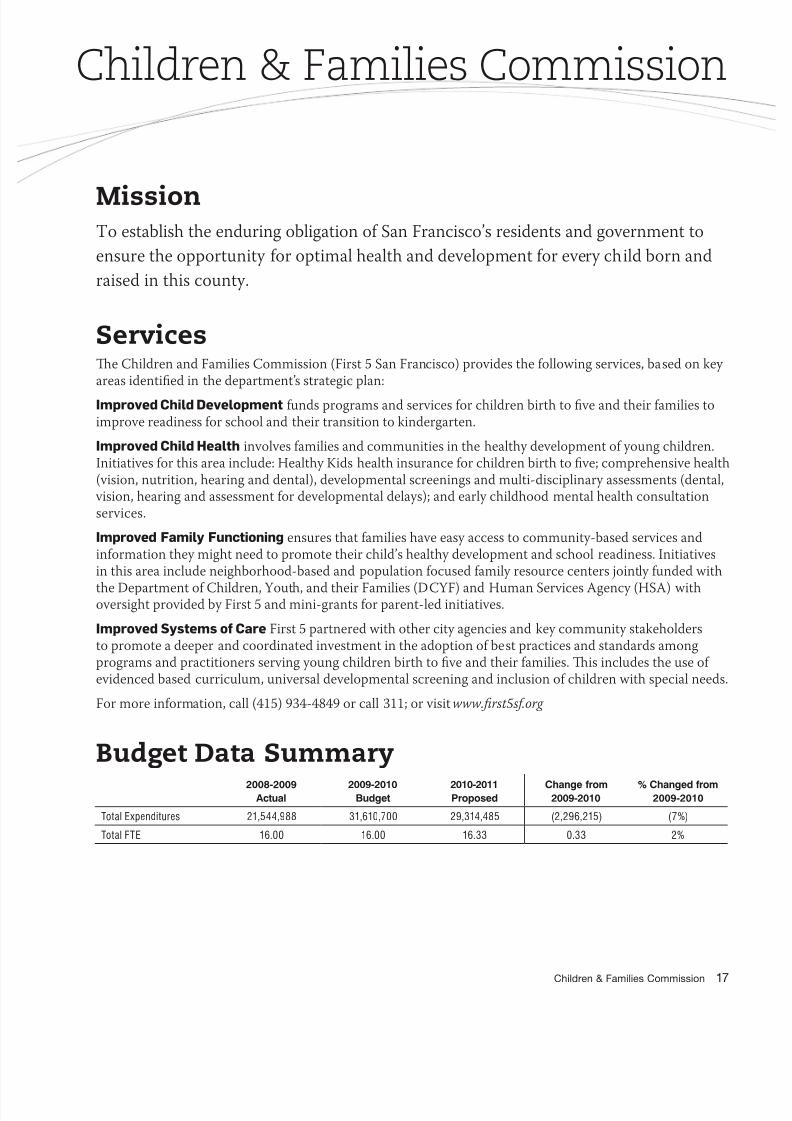
• Mission Statement: Describes the general objective o the department.
• Description of Services Provided: Includes key services or divisions and unctions.
• Budget Data Summary: Shows a summary o total expenditures and unded positions over time.
• Budget Issues and Details: Explains any signicant service level changes in the 2010–11 budget yearand highlights key areas o ocus.
• Organizational Chart: Depicts the department’s organizational structure.
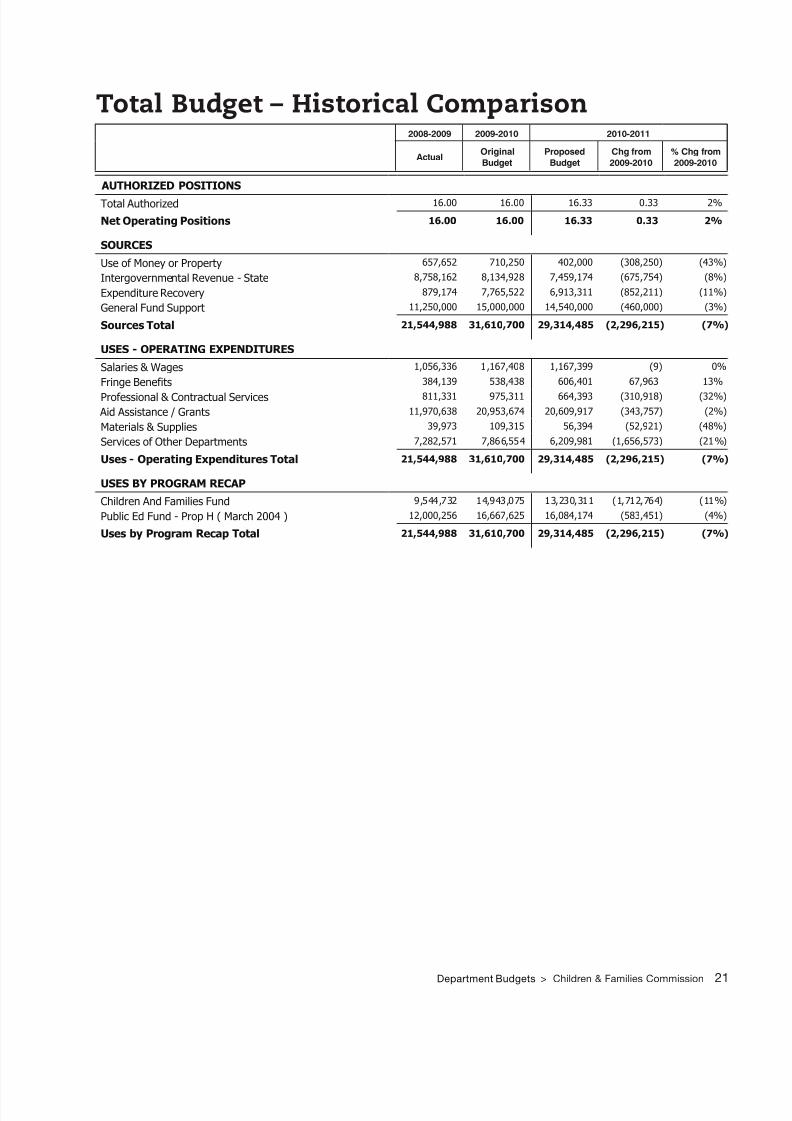
• Total Budget (Historical Comparison): Illustrates the department’s total revenue sources,expenditures and unded positions over time.
• Performance Measures: Illustrates the department’s progress in meeting specic goals.
apital Projects: is provides inormation on capital projects unded in the proposed budget. e 2010–11 Capital Budget is reviewed and proposed by the Capital Planning Committee (CPC) organized under theCity Administrator’s Oce (CAO). Capital projects are supported by General Fund and Non-General Fundsources. Capital projects generally include major construction o new or existing buildings, roads and otherinvestments in our City’s physical inrastructure. Specic projects are detailed in this section and within thecorresponding department section.
8/9/2019 Mayor's Proposed 2010-11 May Budget
http://slidepdf.com/reader/full/mayors-proposed-2010-11-may-budget 6/107
vi Mayor’s Proposed Budget 2010-11
ere will be an additional Mayor’s Proposed Budget introduced on June 1st, which will include all remainingdepartmental budget submissions.
onsolidated Budget and Annual Appropriation Ordinance, Fiscal Year2010–11e Consolidated Budget and Annual Appropriation Ordinance (AAO) contains the sources o unds andtheir uses, detailed by department. is document provides the legal authority or the City to spend undsduring the Fiscal Year.
Annual Salary Ordinance, Fiscal Year 2010–11e Annual Salary Ordinance (ASO) is the legal document that authorizes the number o positions and jobclassications in departments or the Fiscal Year. e ASO is passed at the same time as the AAO.
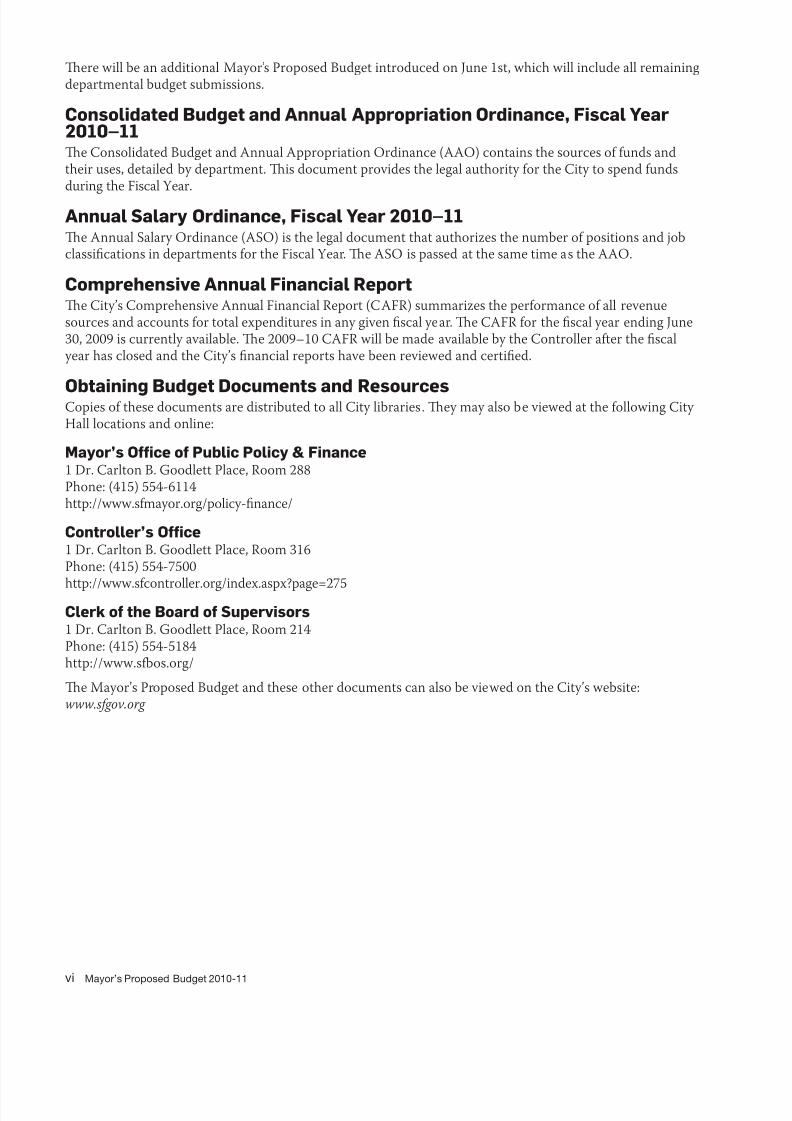
omprehensive Annual Financial eporte City’s Comprehensive Annual Financial Report (CAFR) summarizes the perormance o all revenuesources and accounts or total expenditures in any given scal year. e CAFR or the scal year ending June30, 2009 is currently available. e 2009–10 CAFR will be made available by the Controller ater the scal year has closed and the City’s nancial reports have been reviewed and certied.
Obtaining Budget Documents and esourcesCopies o these documents are distributed to all City libraries. ey may also be viewed at the ollowing CityHall locations and online:
Mayor’s Ofce o Public Policy & Finance1 Dr. Carlton B. Goodlett Place, Room 288Phone: (415) 554-6114http://www.smayor.org/policy-nance/
ontroller’s Ofce1 Dr. Carlton B. Goodlett Place, Room 316Phone: (415) 554-7500
http://www.scontroller.org/index.aspx?page=275lerk o the Board o Supervisors1 Dr. Carlton B. Goodlett Place, Room 214Phone: (415) 554-5184http://www.sbos.org/
e Mayor’s Proposed Budget and these other documents can also be viewed on the City’s website:www.sgov.org
8/9/2019 Mayor's Proposed 2010-11 May Budget
http://slidepdf.com/reader/full/mayors-proposed-2010-11-may-budget 7/107
How to Use the Mayor's Proposed Budget vii
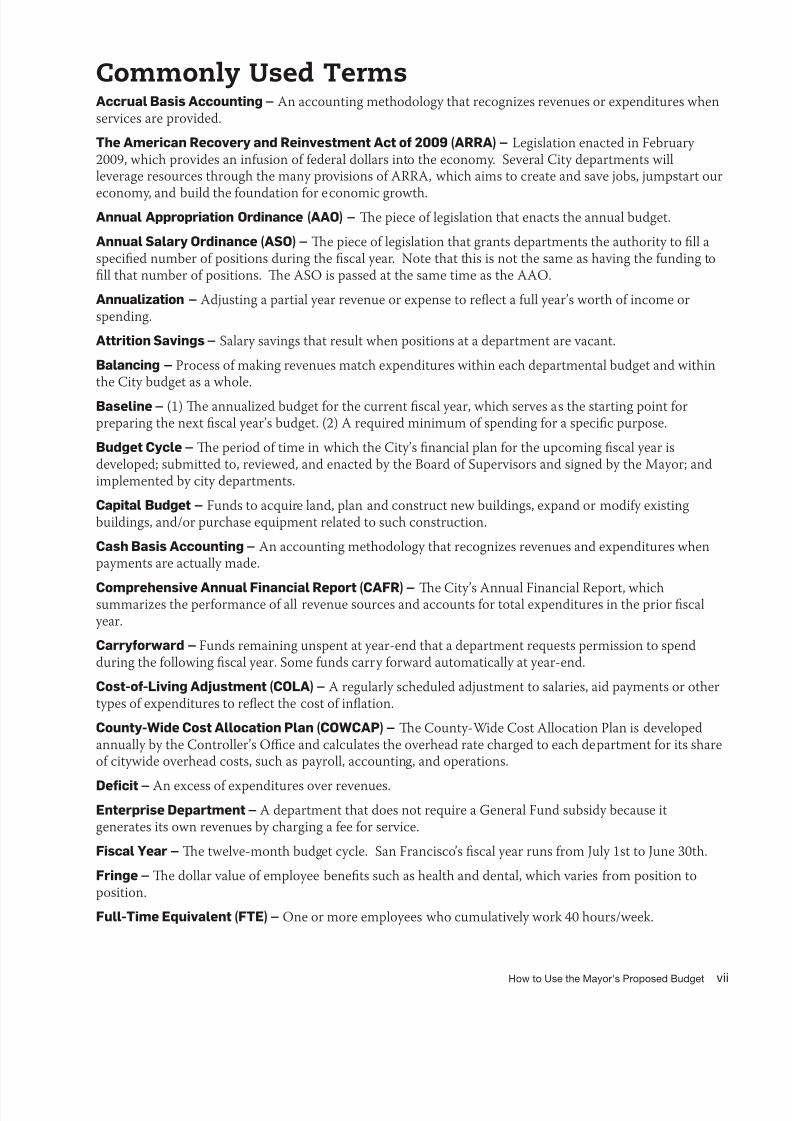
Commonly Used TermsAccrual Basis Accounting – An accounting methodology that recognizes revenues or expenditures whenservices are provided.
The American ecovery and einvestment Act o 2009 (AA) – Legislation enacted in February2009, which provides an inusion o ederal dollars into the economy. Several City departments willleverage resources through the many provisions o ARRA, which aims to create and save jobs, jumpstart our
economy, and build the oundation or economic growth.Annual Appropriation Ordinance (AAO) – e piece o legislation that enacts the annual budget.
Annual Salary Ordinance (ASO) – e piece o legislation that grants departments the authority to ll aspecied number o positions during the scal year. Note that this is not the same as having the unding toll that number o positions. e ASO is passed at the same time as the AAO.
Annualization – Adjusting a partial year revenue or expense to reect a ull year’s worth o income orspending.
Attrition Savings – Salary savings that result when positions at a department are vacant.
Balancing – Process o making revenues match expenditures within each departmental budget and withinthe City budget as a whole.
Baseline – (1) e annualized budget or the current scal year, which serves as the starting point orpreparing the next scal year’s budget. (2) A required minimum o spending or a specic purpose.
Budget ycle – e period o time in which the City’s nancial plan or the upcoming scal year isdeveloped; submitted to, reviewed, and enacted by the Board o Supervisors and signed by the Mayor; andimplemented by city departments.
apital Budget – Funds to acquire land, plan and construct new buildings, expand or modiy existingbuildings, and/or purchase equipment related to such construction.
ash Basis Accounting – An accounting methodology that recognizes revenues and expenditures whenpayments are actually made.
omprehensive Annual Financial eport (AF) – e City’s Annual Financial Report, whichsummarizes the perormance o all revenue sources and accounts or total expenditures in the prior scal year.
arryorward – Funds remaining unspent at year-end that a department requests permission to spendduring the ollowing scal year. Some unds carry orward automatically at year-end.
ost-o-iving Adjustment (OA) – A regularly scheduled adjustment to salaries, aid payments or othertypes o expenditures to reect the cost o ination.
ounty-Wide ost Allocation Plan (OWAP) – e County-Wide Cost Allocation Plan is developedannually by the Controller’s Oce and calculates the overhead rate charged to each department or its shareo citywide overhead costs, such as payroll, accounting, and operations.
Defcit – An excess o expenditures over revenues.
Enterprise Department – A department that does not require a General Fund subsidy because itgenerates its own revenues by charging a ee or service.
Fiscal Year – e twelve-month budget cycle. San Francisco’s scal year runs rom July 1st to June 30th.
Fringe – e dollar value o employee benets such as health and dental, which varies rom position toposition.
Full-Time Equivalent (FTE) – One or more employees who cumulatively work 40 hours/week.
8/9/2019 Mayor's Proposed 2010-11 May Budget
http://slidepdf.com/reader/full/mayors-proposed-2010-11-may-budget 8/107
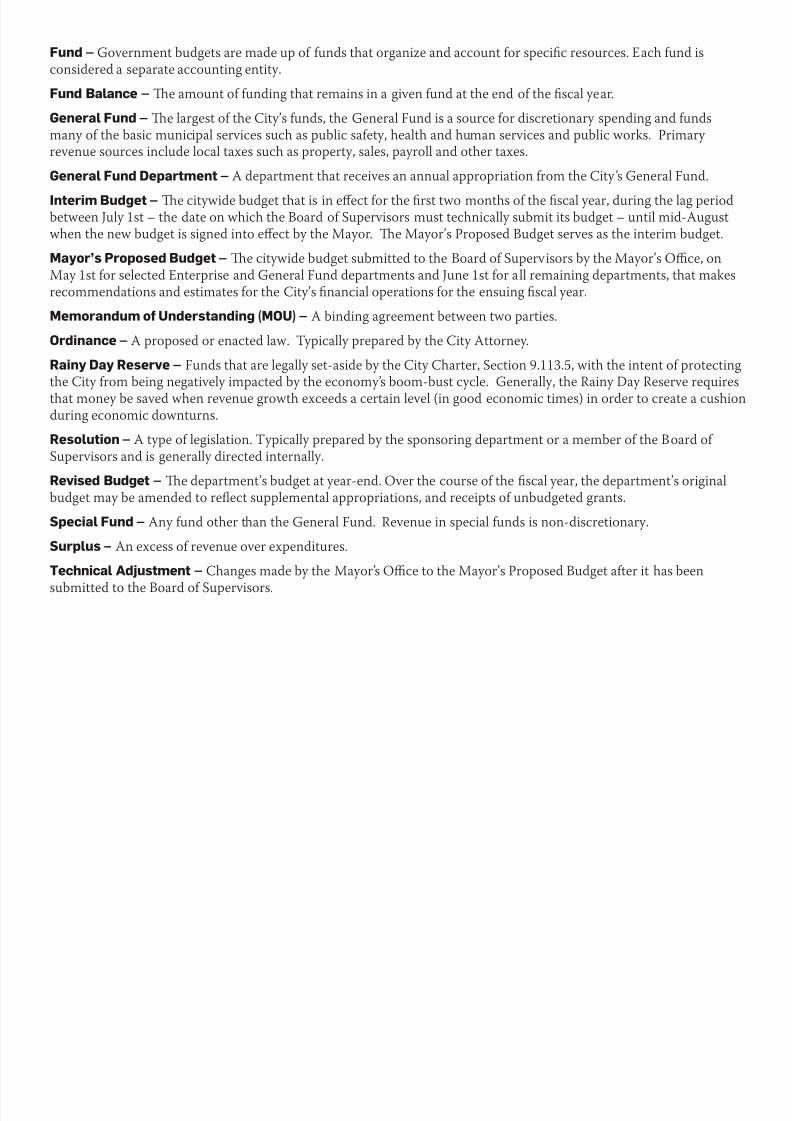
Fund – Government budgets are made up o unds that organize and account or specic resources. Each und isconsidered a separate accounting entity.
Fund Balance – e amount o unding that remains in a given und at the end o the scal year.
General Fund – e largest o the City’s unds, the General Fund is a source or discretionary spending and undsmany o the basic municipal services such as public saety, health and human services and public works. Primaryrevenue sources include local taxes such as property, sales, payroll and other taxes.
General Fund Department – A department that receives an annual appropriation rom the City’s General Fund.
Interim Budget – e citywide budget that is in efect or the rst two months o the scal year, during the lag periodbetween July 1st – the date on which the Board o Supervisors must technically submit its budget – until mid-Augustwhen the new budget is signed into efect by the Mayor. e Mayor’s Proposed Budget serves as the interim budget.
Mayor’s Proposed Budget – e citywide budget submitted to the Board o Supervisors by the Mayor’s Oce, onMay 1st or selected Enterprise and General Fund departments and June 1st or all remaining departments, that makesrecommendations and estimates or the City’s nancial operations or the ensuing scal year.
Memorandum o Understanding (MOU) – A binding agreement between two parties.
Ordinance – A proposed or enacted law. Typically prepared by the City Attorney.
ainy Day eserve – Funds that are legally set-aside by the City Charter, Section 9.113.5, with the intent o protectingthe City rom being negatively impacted by the economy’s boom-bust cycle. Generally, the Rainy Day Reserve requiresthat money be saved when revenue growth exceeds a certain level (in good economic times) in order to create a cushionduring economic downturns.
esolution – A type o legislation. Typically prepared by the sponsoring department or a member o the Board o Supervisors and is generally directed internally.
evised Budget – e department’s budget at year-end. Over the course o the scal year, the department’s originalbudget may be amended to reect supplemental appropriations, and receipts o unbudgeted grants.
Special Fund – Any und other than the General Fund. Revenue in special unds is non-discretionary.
Surplus – An excess o revenue over expenditures.
Technical Adjustment – Changes made by the Mayor’s Oce to the Mayor’s Proposed Budget ater it has been
submitted to the Board o Supervisors.

8/9/2019 Mayor's Proposed 2010-11 May Budget
http://slidepdf.com/reader/full/mayors-proposed-2010-11-may-budget 9/107
Contents ix
Contents
How to Use the
Mayor’s Proposed Budget v
Mayor’s Budget Introduction xiMayor’s Letter xiii
Budget Summary Tables xv
Department Budgets 1Airport 3
Board of Appeals 11
Children & Families Commission 17
Child Support Services 23
Law Library 29Municipal Transportation Agency 35
Port 43
Public Utilities Commission 51
Retirement 61
Rent Arbitration Board 67
Capital Projects 73Capital Projects 75

8/9/2019 Mayor's Proposed 2010-11 May Budget
http://slidepdf.com/reader/full/mayors-proposed-2010-11-may-budget 10/107

8/9/2019 Mayor's Proposed 2010-11 May Budget
http://slidepdf.com/reader/full/mayors-proposed-2010-11-may-budget 11/107
Mayor's Budget Introduction

8/9/2019 Mayor's Proposed 2010-11 May Budget
http://slidepdf.com/reader/full/mayors-proposed-2010-11-may-budget 12/107

8/9/2019 Mayor's Proposed 2010-11 May Budget
http://slidepdf.com/reader/full/mayors-proposed-2010-11-may-budget 13/107
Mayor's Letter xiii
Mayor's Letter
May 1, 2010
Dear Residents o San Francisco:
Like amilies and businesses across the country, San Francisco is acingsignicant nancial challenges as a result o the troubled nationaleconomy. Unemployment levels have risen, businesses are struggling tostay above water, and amilies are ghting to make ends meet. Our Citygovernment revenues, which are generated by economic activity, arein decline. Over the next month, we must make plans to close a $482.7
million General Fund budget decit – the highest in recent history.But despite these challenges, we remain committed to ensuringthat our City government actively leads our economic recovery –by creating jobs, implementing nancial reorms, and laying thegroundwork or a healthy, stable economy or decades to come.
Today, I am privileged to present my May 1 proposed budget. is document provides a ramework orseveral critical components o our strategy to put San Francisco on a path to economic recovery andnancial stability. Contained in these pages are plans or major inrastructure investments that will keep SanFrancisco competitive as its economy evolves. e May budget submission includes $226.5 million in capitalprojects or Fiscal Year 2010-11 and $274.0 million or Fiscal Year 2011-12, creating thousands o jobs to helpstimulate our economic recovery. Over the next ten years, the departments included in this book will invest
$14.4 billion in new inrastructure, creating over 1,000 jobs each year. is budget also includes the next stepin our efort to reorm City government’s nancial practices by implementing two-year budgets, ve-yearnancial planning, and nancial policies to compel a higher standard o scal discipline in City government.
e May 1 proposed budget is the rst o two documents that comprise my proposed budget or Fiscal Year2010-11. is rst submission includes proposed budgets or ten “enterprise” departments – agencies withinCity government that generate their own revenue or are unded with special unds, rather than by general taxrevenues. ese departments include:
ese departments are at the center o many o our city’s largest planned inrastructure projects. SanFrancisco’s economy could not have grown to be what it is today without major public works projects by pastgenerations. Public investments in transportation systems, utilities, our airport and port created a oundationor our economy to grow and evolve. Despite the global economic downturn, we will continue to investin and expand this inrastructure to ensure San Francisco can remain an economic leader or generations
• Airport
• Board o Appeals
• Child Support Services• Children and Families Commission
• Law Library
• Municipal Transportation Agency (MTA)
• Port
• Public Utilities Commission (PUC)• Rent Arbitration Board
• Retirement System
8/9/2019 Mayor's Proposed 2010-11 May Budget
http://slidepdf.com/reader/full/mayors-proposed-2010-11-may-budget 14/107
xiv Mayor’s Proposed Budget 2010-11
to come. Over the next 10 years, the Public Utilities Commission will invest $6.7 billion in upgrades toour utility inrastructure, including completion o a seismic retrot o the regional water system and ourcity’s wastewater system. San Francisco International Airport will invest $1.1 billion in upgrades such ascompletion o the new Terminal 2, strengthening San Francisco’s position as our regional economic centerand international tourist destination. e Municipal Transportation Agency will invest $5.8 billion in projectssuch as the Central Subway, technology upgrades or the transit system, and replacement o the aging transit vehicle eet. We will continue to invest in revitalizing our city’s eastern waterront, with $762 million inplanned projects at the Port o San Francisco, including the international Cruise Terminal at Pier 27, seismic
upgrades to piers, and improvements to the Blue Greenway, the network o parks and open spaces along thewaterront.
We are also working to implement budget reorms that will strengthen our City’s nancial practices. Last year, I worked with the Controller and Board o Supervisors to propose a Charter amendment, PropositionA, that ocused on creating a more responsible and sustainable budget. e voters instructed policymakers,with the adoption o this measure, to implement a two-year budget cycle, adopt a ve-year nancial plan andadopt long-range nancial policies or the City. e message rom the voters was clear: the budget processrequires long-term vision and stewardship o our City’s nances.
As an important step in the implementation o Proposition A, we are including in this document two-yearbudgets or the Airport, Port, and Public Utilities Commission. ese two-year budgets are based on the ve- year nancial plans also required under Proposition A, and will provide a test-run or two year budgeting,which will be implemented citywide in two years.
Despite the continuing challenges our City aces, I am committed to take the necessary steps to ensurethe long-term nancial health o the City while preserving the ideals that make San Francisco unique.Investments in our inrastructure and establishing orward-looking nancial policies ensures San Franciscowill emerge rom this economic downturn positioned stronger than other municipalities and with lessonslearned or the uture. I look orward to working with you, the residents, as well as the members o the Boardo Supervisors and all elected ocials to create a budget that reects the needs and values o San Franciscansnot only or FY 2010-2011, but or years to come as well.
Sincerely,
Mayor Gavin Newsom

8/9/2019 Mayor's Proposed 2010-11 May Budget
http://slidepdf.com/reader/full/mayors-proposed-2010-11-may-budget 15/107
Budget Summary Tables

8/9/2019 Mayor's Proposed 2010-11 May Budget
http://slidepdf.com/reader/full/mayors-proposed-2010-11-may-budget 16/107

8/9/2019 Mayor's Proposed 2010-11 May Budget
http://slidepdf.com/reader/full/mayors-proposed-2010-11-may-budget 17/107
Budget Summary Tables xvii
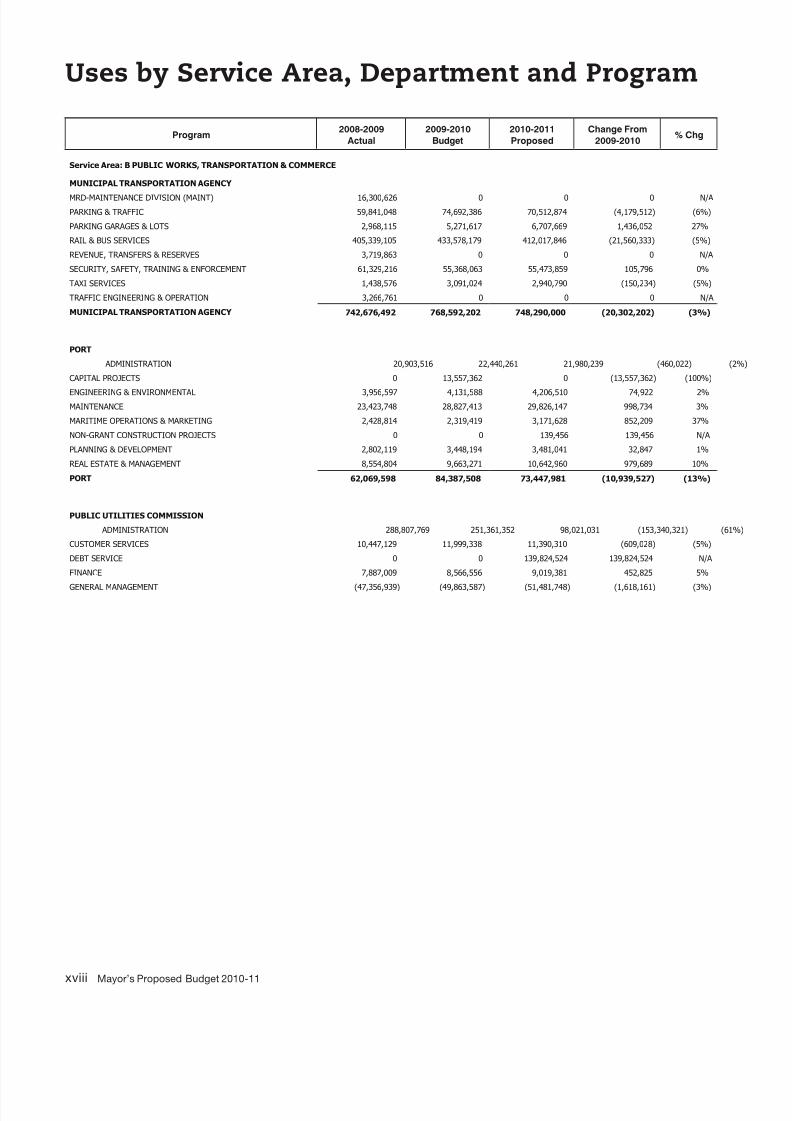
Uses by Service Area, Department and Program
Program2008-2009
Actual
2009-2010
Budget
2010-2011
Proposed
Change From
2009-2010% Chg
Service Area: B PUBLIC WORKS, TRANSPORTATION & COMMERCE
AIRPORT COMMISSION
ADMINISTRATION 30,602,934 34,160,797 37,321,887 3,161,090
AIRPORT DIRECTOR 9,058,529 11,607,150 11,076,481 (530,669) (
BUREAU OF DESIGN AND CONSTRUCTION 6,232,021 2,833,439 2,904,941 71,502 3%
BUSINESS & FINANCE 365,839,595 410,834,031 413,458,418 2,624,387 1%
CAPITAL PROJECTS AND GRANTS 0 77,501,541 68,164,937 (9,336,604) (12%)
CHIEF OPERATING OFFICER 3,662,959 3,705,432 4,003,920 298,488 8%
COMMUNICATIONS & MARKETING 6,418,759 7,191,612 7,192,228 616 0%
CONTINUING PROJECTS, MAINT AND RENEWAL 8,708,482 4,000,000 6,000,000 2,000,000 50%
FACILITIES 125,817,887 131,518,254 139,861,374 8,343,120 6%
FACILITIES MAINTENANCE,CONSTRUCTION 130,221,403 0 209,182 209,182 N/A
FIRE AIRPORT BUR NON-PERSONNEL COST 713,277 1,009,991 895,314 (114,677) (11%)
OPERATIONS AND SECURITY 47,068,886 48,868,662 51,467,929 2,599,267 5%
PLANNING DIVISION 2,643,094 2,850,732 2,630,136 (220,596) (8%)
POLICE AIRPORT BUR NON-PERSONNEL COST 2,750,123 3,372,271 4,231,743 859,472 25%
SAFETY & SECURITY 2,962,571 0 0 0 N/A
AIRPORT COMMISSION 742,700,520 739,453,912 749,418,490 9,964,578 1%
BOARD OF APPEALS
APPEALS PROCESSING 751,645 834,412 930,494 96,082 1
BOARD OF APPEALS 751,645 834,412 930,494 96,082 12%
MUNICIPAL TRANSPORTATION AGENCY
ACCESSIBLE SERVICES 20,929,335 21,625,361 21,525,109 (100,252)
ADMINISTRATION 66,219,947 67,625,166 56,401,118 (11,224,048) (
AGENCY WIDE EXPENSES 96,511,634 104,415,585 122,111,972 17,696,387 17%
CUSTOMER SERVICE 852,202 1,292,649 0 (1,292,649) (100%)
DEVELOPMENT AND PLANNING 3,960,064 1,632,172 598,763 (1,033,409) (63%)
8/9/2019 Mayor's Proposed 2010-11 May Budget
http://slidepdf.com/reader/full/mayors-proposed-2010-11-may-budget 18/107
xviii Mayor’s Proposed Budget 2010-11
Uses by Service Area, Department and Program
Service Area: B PUBLIC WORKS, TRANSPORTATION & COMMERCE
MUNICIPAL TRANSPORTATION AGENCY
MRD-MAINTENANCE DIVISION (MAINT) 16,300,626 0 0 0 N/A
PARKING & TRAFFIC 59,841,048 74,692,386 70,512,874 (4,179,512) (6%)
PARKING GARAGES & LOTS 2,968,115 5,271,617 6,707,669 1,436,052 27%
RAIL & BUS SERVICES 405,339,105 433,578,179 412,017,846 (21,560,333) (5%)
REVENUE, TRANSFERS & RESERVES 3,719,863 0 0 0 N/A
SECURITY, SAFETY, TRAINING & ENFORCEMENT 61,329,216 55,368,063 55,473,859 105,796 0%
TAXI SERVICES 1,438,576 3,091,024 2,940,790 (150,234) (5%)
TRAFFIC ENGINEERING & OPERATION 3,266,761 0 0 0 N/A
MUNICIPAL TRANSPORTATION AGENCY 742,676,492 768,592,202 748,290,000 (20,302,202) (3%)
PORT
ADMINISTRATION 20,903,516 22,440,261 21,980,239 (460,022) (2%
CAPITAL PROJECTS 0 13,557,362 0 (13,557,362) (100%)
ENGINEERING & ENVIRONMENTAL 3,956,597 4,131,588 4,206,510 74,922 2%
MAINTENANCE 23,423,748 28,827,413 29,826,147 998,734 3%
MARITIME OPERATIONS & MARKETING 2,428,814 2,319,419 3,171,628 852,209 37%
NON-GRANT CONSTRUCTION PROJECTS 0 0 139,456 139,456 N/A
PLANNING & DEVELOPMENT 2,802,119 3,448,194 3,481,041 32,847 1%
REAL ESTATE & MANAGEMENT 8,554,804 9,663,271 10,642,960 979,689 10%
PORT 62,069,598 84,387,508 73,447,981 (10,939,527) (13%)
PUBLIC UTILITIES COMMISSION
ADMINISTRATION 288,807,769 251,361,352 98,021,031 (153,340,321) (61%
CUSTOMER SERVICES 10,447,129 11,999,338 11,390,310 (609,028) (5%)
DEBT SERVICE 0 0 139,824,524 139,824,524 N/A
FINANCE 7,887,009 8,566,556 9,019,381 452,825 5%
GENERAL MANAGEMENT (47,356,939) (49,863,587) (51,481,748) (1,618,161) (3%)
Program2008-2009
Actual
2009-2010
Budget
2010-2011
Proposed
Change From
2009-2010% Chg

8/9/2019 Mayor's Proposed 2010-11 May Budget
http://slidepdf.com/reader/full/mayors-proposed-2010-11-may-budget 19/107
Budget Summary Tables xix
Uses by Service Area, Department and Program
Service Area: B PUBLIC WORKS, TRANSPORTATION & COMMERCE
PUBLIC UTILITIES COMMISSION
HETCH HETCHY CAPITAL PROJECTS 61,510,287 61,347,928 71,227,000 9,879,072 16%
HETCH HETCHY POWER 4,972,745 0 0 0 N/A
HETCHY WATER OPERATIONS 11,226,836 44,090,267 47,686,454 3,596,187 8%
HUMAN RESOURCES 8,689,826 7,630,447 8,284,547 654,100 9%
MANAGEMENT INFORMATION 17,753,595 17,881,439 19,218,149 1,336,710 7%
OPERATING RESERVE 0 0 36,423,480 36,423,480 N/A
POWER INFRASTRUCTURE DEVELOPMENT 4,460,347 6,299,178 9,498,865 3,199,687 51%
POWER PURCHASING/ SCHEDULING 22,937,469 44,819,404 42,740,874 (2,078,530) (5%)
POWER UTILITY FIELD SERVICES 6,527,425 493,319 493,319 0 0%
POWER UTILITY SERVICES 75,752,187 15,754,214 13,052,160 (2,702,054) (17%)
STRATEGIC PLANNING/COMPLIANCE 5,074,548 6,308,215 9,399,679 3,091,464 49%
WASTEWATER CAPITAL PROJECTS 0 0 14,067,180 14,067,180 N/A
WASTEWATER COLLECTION 28,935,815 29,513,841 30,679,950 1,166,109 4%
WASTEWATER DISPOSAL 4,747,195 0 0 0 N/A
WASTEWATER OPERATIONS 25,569,625 24,352,376 5,979,925 (18,372,451) (75%)
WASTEWATER TREATMENT 59,420,504 64,727,590 65,137,526 409,936 1%
WATER CAPITAL PROJECTS 51,200,786 41,347,520 38,974,865 (2,372,655) (6%)
WATER DISTRIBUTION 1,387,380 0 0 0 N/A
WATER PUMPING 2,025,663 0 0 0 N/A
WATER SOURCE OF SUPPLY 12,689,820 17,715,237 20,635,767 2,920,530 16%
WATER TRANSMISSION/ DISTRIBUTION 56,710,689 47,407,454 50,791,466 3,384,012 7%
WATER TREATMENT 28,525,003 32,851,655 37,184,899 4,333,244 13%
PUBLIC UTILITIES COMMISSION 749,902,713 684,603,743 728,249,603 43,645,860 6%
Service Area: B Subtotals 2,298,100,968 2,277,871,777 2,300,336,568 22,464,791 1%
Program2008-2009
Actual
2009-2010
Budget
2010-2011
Proposed
Change From
2009-2010% Chg
Service Area: C HUMAN WELFARE & NEIGHBORHOOD DEVELOPMENT
CHILD SUPPORT SERVICES
CHILD SUPPORT SERVICES PROGRAM 14,477,632 15,019,609 14,492,158 (527,451) (4%)
CHILD SUPPORT SERVICES 14,477,632 15,019,609 14,492,158 (527,451) (4%)
CHILDREN AND FAMILIES COMMISSION
CHILDREN AND FAMILIES FUND 9,544,732 14,943,075 13,230,311 (1,712,764) (11%)
PUBLIC ED FUND - PROP H ( MARCH 2004 ) 12,000,256 16,667,625 16,084,174 (583,451) (4%)
CHILDREN AND FAMILIES COMMISSION 21,544,988 31,610,700 29,314,485 (2,296,215) (7%)
RENT ARBITRATION BOARD
RENT BOARD 5,223,560 5,381,683 5,517,200 135,517 3%
RENT ARBITRATION BOARD 5,223,560 5,381,683 5,517,200 135,517 3%
Service Area: C Subtotals 41,246,180 52,011,992 49,323,843 (2,688,149) (5%)
Service Area: E CULTURE & RECREATION
LAW LIBRARY
LAW LIBRARY 488,515 705,954 734,438 28,484 4%
LAW LIBRARY 488,515 705,954 734,438 28,484 4%
Service Area: E Subtotals 488,515 705,954 734,438 28,484 4%
8/9/2019 Mayor's Proposed 2010-11 May Budget
http://slidepdf.com/reader/full/mayors-proposed-2010-11-may-budget 20/107
xx Mayor’s Proposed Budget 2010-11
Uses by Service Area, Department and Program
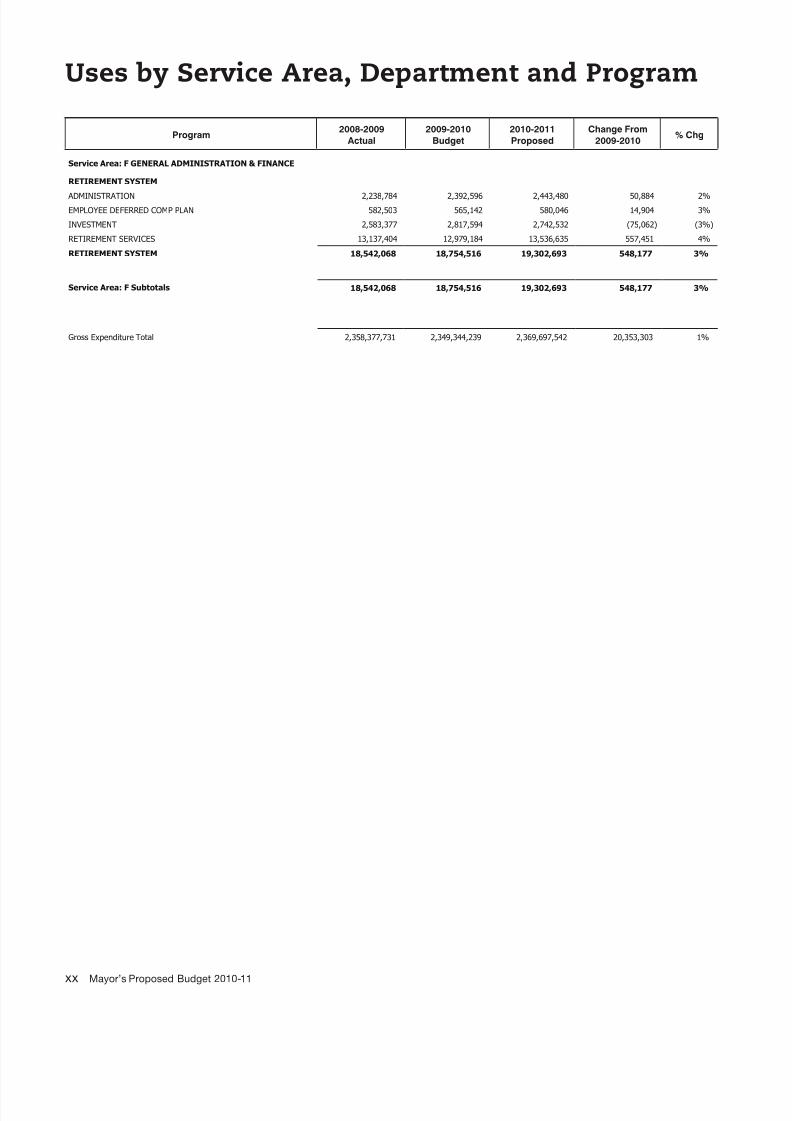
Service Area: F GENERAL ADMINISTRATION & FINANCE
RETIREMENT SYSTEM
ADMINISTRATION 2,238,784 2,392,596 2,443,480 50,884 2%
EMPLOYEE DEFERRED COMP PLAN 582,503 565,142 580,046 14,904 3%
INVESTMENT 2,583,377 2,817,594 2,742,532 (75,062) (3%)
RETIREMENT SERVICES 13,137,404 12,979,184 13,536,635 557,451 4%
RETIREMENT SYSTEM 18,542,068 18,754,516 19,302,693 548,177 3%
Service Area: F Subtotals 18,542,068 18,754,516 19,302,693 548,177 3%
Gross Expenditure Total 2,358,377,731 2,349,344,239 2,369,697,542 20,353,303 1%
Program2008-2009
Actual
2009-2010
Budget
2010-2011
Proposed
Change From
2009-2010% Chg

8/9/2019 Mayor's Proposed 2010-11 May Budget
http://slidepdf.com/reader/full/mayors-proposed-2010-11-may-budget 21/107
Budget Summary Tables xxi
Uses by Service Area and Department
Department2008-2009
Actual
2009-2010
Budget
2010-2011
Projected
Change From
2009-2010% Chg
Service Area: B PUBLIC WORKS, TRANSPORTATION & COMMERCE
AIRPORT COMMISSION 742,700,520 739,453,912 749,418,490 9,964,578 1%
BOARD OF APPEALS 751,645 834,412 930,494 96,082 12%MUNICIPAL TRANSPORTATION AGENCY 742,676,492 768,592,202 748,290,000 (20,302,202) (3%)
PORT 62,069,598 84,387,508 73,447,981 (10,939,527) (13%)
PUBLIC UTILITIES COMMISSION 749,902,713 684,603,743 728,249,603 43,645,860 6%
Service Area: B Subtotals 2,298,100,968 2,277,871,777 2,300,336,568 22,464,791 1%
Service Area: C HUMAN WELFARE & NEIGHBORHOOD DEVELOPMENT
CHILD SUPPORT SERVICES 14,477,632 15,019,609 14,492,158 (527,451) (4%)
CHILDREN AND FAMILIES COMMISSION 21,544,988 31,610,700 29,314,485 (2,296,215) (7%)
RENT ARBITRATION BOARD 5,223,560 5,381,683 5,517,200 135,517 3%
Service Area: C Subtotals 41,246,180 52,011,992 49,323,843 (2,688,149) (5%)
Service Area: E CULTURE & RECREATION
LAW LIBRARY 488,515 705,954 734,438 28,484 4%
Service Area: E Subtotals 488,515 705,954 734,438 28,484 4%
Service Area: F GENERAL ADMINISTRATION & FINANCE
RETIREMENT SYSTEM 18,542,068 18,754,516 19,302,693 548,177 3%
Service Area: F Subtotals 18,542,068 18,754,516 19,302,693 548,177 3%
Gross Expenditure Total 2,358,377,731 2,349,344,239 2,369,697,542 20,353,303 1%
8/9/2019 Mayor's Proposed 2010-11 May Budget
http://slidepdf.com/reader/full/mayors-proposed-2010-11-may-budget 22/107
xxii Mayor’s Proposed Budget 2010-11
Funded Positions, Grand Recap by Major
Service Area and Department Title
Department2008-2009
Actual
2009-2010
Budget
2010-2011
Projected
Change From
2009-2010% Chg
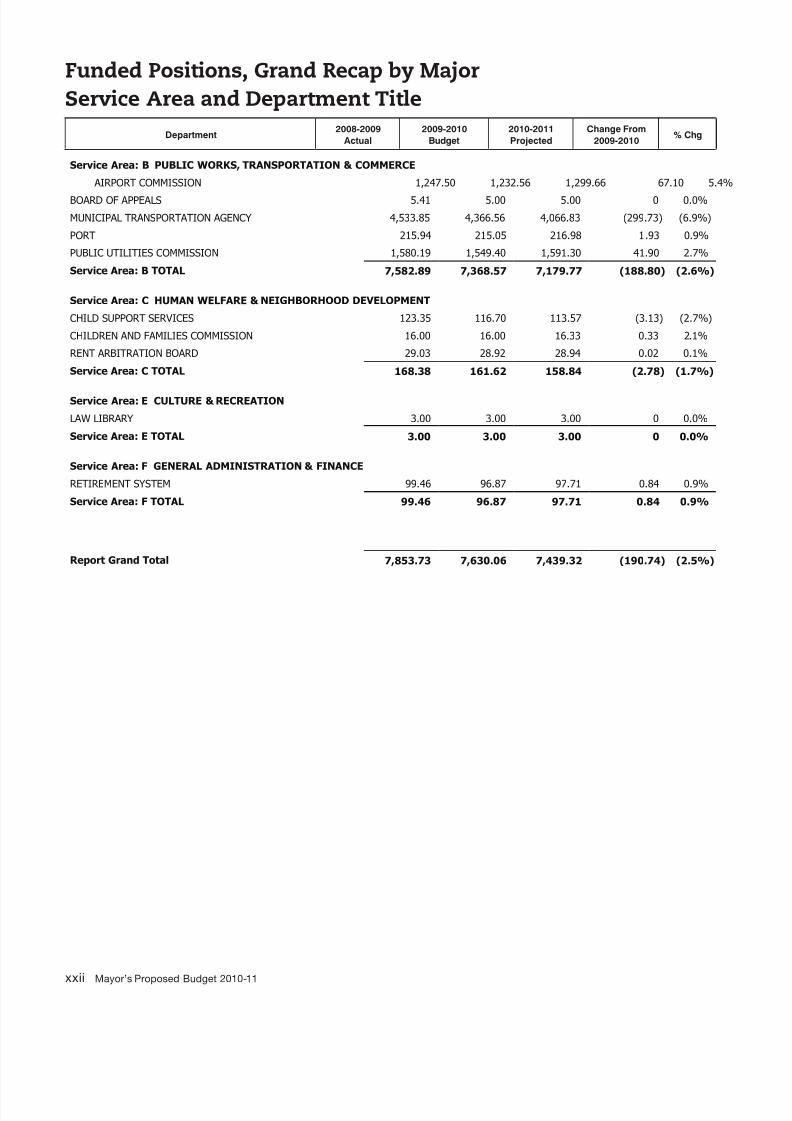
Service Area: B PUBLIC WORKS, TRANSPORTATION & COMMERCE
AIRPORT COMMISSION 1,247.50 1,232.56 1,299.66 67.10 5.4%
BOARD OF APPEALS 5.41 5.00 5.00 0 0.0%
MUNICIPAL TRANSPORTATION AGENCY 4,533.85 4,366.56 4,066.83 (299.73) (6.9%)
PORT 215.94 215.05 216.98 1.93 0.9%
PUBLIC UTILITIES COMMISSION 1,580.19 1,549.40 1,591.30 41.90 2.7%
Service Area: B TOTAL 7,582.89 7,368.57 7,179.77 (188.80) (2.6%)
Service Area: C HUMAN WELFARE & NEIGHBORHOOD DEVELOPMENT
CHILD SUPPORT SERVICES 123.35 116.70 113.57 (3.13) (2.7%)
CHILDREN AND FAMILIES COMMISSION 16.00 16.00 16.33 0.33 2.1%
RENT ARBITRATION BOARD 29.03 28.92 28.94 0.02 0.1%
Service Area: C TOTAL 168.38 161.62 158.84 (2.78) (1.7%)
Service Area: E CULTURE & RECREATION
LAW LIBRARY 3.00 3.00 3.00 0 0.0%
Service Area: E TOTAL 3.00 3.00 3.00 0 0.0%
Service Area: F GENERAL ADMINISTRATION & FINANCE
RETIREMENT SYSTEM 99.46 96.87 97.71 0.84 0.9%
Service Area: F TOTAL 99.46 96.87 97.71 0.84 0.9%
Report Grand Total 7,853.73 7,630.06 7,439.32 (190.74) (2.5%)
8/9/2019 Mayor's Proposed 2010-11 May Budget
http://slidepdf.com/reader/full/mayors-proposed-2010-11-may-budget 23/107
Department Budgets

8/9/2019 Mayor's Proposed 2010-11 May Budget
http://slidepdf.com/reader/full/mayors-proposed-2010-11-may-budget 24/107

8/9/2019 Mayor's Proposed 2010-11 May Budget
http://slidepdf.com/reader/full/mayors-proposed-2010-11-may-budget 25/107
Airport 3
Airport
MissionTo provide sae, secure, accessible and convenient acilities or airlines, tenants,
employees and the public; to provide superior customer service; to be scally
responsible and contribute to the local economy; to be environmentally responsible
and to operate in harmony with the Bay Area community.
Services
e San Francisco International Airport (Airport or SFO) provides the ollowing services:ommunications and Marketing provides timely and accurate inormation regarding the Airport to thepublic, media, airlines, and neighboring communities; and markets the Airport’s parking, concessions, andairline growth opportunities to support Airport revenue growth.
Business and Finance ensures that the Airport property and acilities are used to achieve maximumrevenue return, and to provide the proper environment or existing and new businesses; develops andimplements innovative scal policies and solutions; and is responsible or enhancing the Airport’s nancialperormance.
hie Operating Ofcer provides executive oversight to our major Airport Divisions and the Museumsin order to: ensure the delivery o sae, secure and ecient services to the traveling public; promotehigh standards o customer service; protect the environment; and work with the Director and ExecutiveCommittee in developing Airport-wide policy, vision, and strategy.
Operations and Security manages the aireld, public transportation, terminals, Airport SecurityProgram and emergency procedures to provide the public with a sae, secure, ecient, and customer-riendly Airport.
Facilities manages numerous utility systems, buildings and layout plans while keeping acilities clean, saeand running eciently.
Planning prepares long-range acility development planning studies and analyses to support thedevelopment o Airport capital improvement projects.
Design and onstruction plans and implements capital improvement projects and programs at theAirport, ocusing on controlling and maintaining project cost and schedules.
Museums provides a broad range o attractions or the traveling public and creates an ambiance in theAirport that reects the sophistication and cultural diversity o San Francisco.
Administration provides services to the Airport’s traveling public, staf, and tenants, including creatingand enhancing partnerships within the City and with the Airport’s neighbors, providing and maintaining acompetent workorce, and providing medical services at the Airport.
For more inormation, call (650) 821-5042 or 311; or visit www.yso.com

8/9/2019 Mayor's Proposed 2010-11 May Budget
http://slidepdf.com/reader/full/mayors-proposed-2010-11-may-budget 26/107
4 Mayor’s Proposed Budget 2010-11
Budget Data Summary2008-2009
Actual
2009-2010
Budget
2010-2011
Proposed
2011-2012
Proposed
Change from
2009-2010
% Change from
2009-2010
Total Expenditures 742,700,520 739,418,490 749,418,490 810,647,874 9,964,578 1%
Total FTE 1,247.50 1,232,56 1,299.66 1,348.91 67.10 5%
Budget Issues and DetailsDriven by the opening o Terminal 2, the Airport’s proposed operating budget o $675.0 million represents anincrease o $17.1 million (2.6%) over the Fiscal Year 2009-10 budget o $658.0 million, as well as an increaseo 67.1 FTE, largely Custodian and Food Service Cleaner positions. e Airport budget also includes $68.4million or capital projects and an additional $6.0 million or acilities maintenance as part o a planned $1.1billion inrastructure investment over the next 10 years.
American ecovery and einvestment Act (AA) o 2009e Airport secured $29.8 million in ederal unds provided in the ederal stimulus legislation or three“shovel ready” projects. e Federal Aviation Administration (FAA) awarded $5.5 million and $9.0 millionto partially und each o two runway reconstruction projects that include repairing pavement, upgrading
the runway and taxiway lighting systems, and repainting runway markings to increase visibility and improvesaety or aircrat on the aireld. e Airport also received $15.3 million rom the Transportation SecurityAdministration (TSA) or a baggage system Explosives Detection System as part o the $383 million Terminal2 renovation project.
Airport apital ProgramOver the next 10 years, the Airport plans $1.1 billion in capital projects. As part o this planned investment,the Fiscal Year 2010-2011 Airport budget includes $68.4 million to und various capital projects includingaireld runway and taxiway reconstruction, a new air trac control tower, runway saety area planning,and terminal renovation. Funding sources or these projects comes rom grants, interest earnings rom theissuance o new bonds, and old bond proceeds.
Grant unds will support $51.1 million in projects or aireld pavement and inrastructure improvementsto enhance saety and eciency in compliance with Federal Aviation Administration (FAA) requirements,a new air trac control tower, noise insulation or housing in the surrounding community, and roadway viaduct improvements that serve the Airport terminal complex.
e Airport is entering the third and nal year o its $383 million Terminal 2 project that is renovating theormer 10-gate international terminal into a third domestic terminal with 14 gates. e Terminal 2 projectentails renovating the boarding areas, concession areas, building systems and baggage systems, and wasdriven by demand or additional domestic gates and the need to relocate airlines rom Terminal 1, whichneeds signicant renovations. e newly renovated Terminal 2 is expected to open to the public in spring o 2011. ese projects will create over 2,900 jobs or the local economy.
Improving Business, Financial, and Marketing OperationsIn Fiscal Year 2010-2011, the Department will increase debt service payments by $37.1 million to coverincreased costs associated with bond liabilities and other indebtedness incurred rom investing in theAirport’s physical inrastructure. e Airport continues its various initiatives to restructure existing debt andlower its annual debt service requirements, and to enhance its credit standing. ARRA gives the Airport theability to issue new money private activity bonds and to reund private activity bonds in calendar years 2009and 2010 without being subject to the alternative minimum tax (AMT), which reduces the interest costs orthe lie o any bonds issued during that period.

8/9/2019 Mayor's Proposed 2010-11 May Budget
http://slidepdf.com/reader/full/mayors-proposed-2010-11-may-budget 27/107
Airport 5
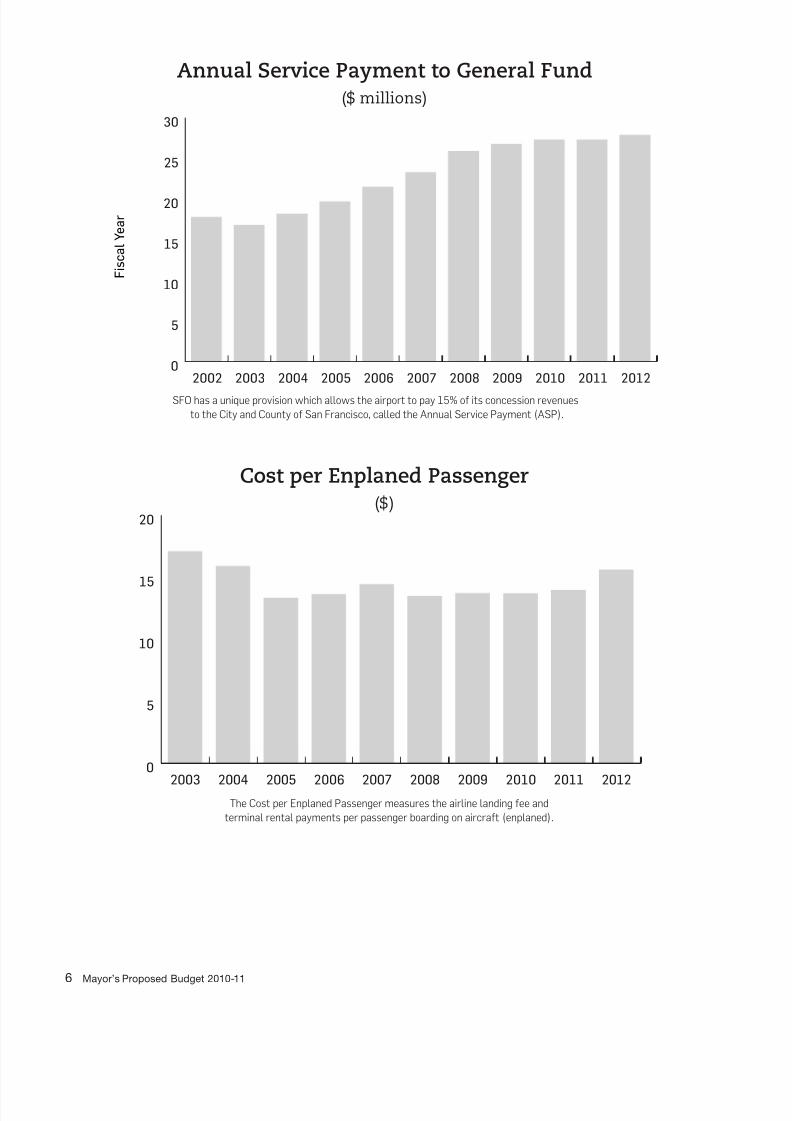
Passenger Trafc TrendsPassenger trac is expected to increase in Fiscal Year 2010-2011. Fiscal Year 2009-2010 is projected toend 3.8 percent higher than the prior year actual, with a total o 18.9 million enplanements, the number o passengers boarding an airplane. Enplanements are orecast to increase an additional 2.4 percent to 19.4million in Fiscal Year 2010-2011, and then increase by another 2.3 percent to 19.8 million in Fiscal Year 2011-2012. In the short term, domestic travel is orecast to increase, but the growth rate in domestic air tracis orecast to slow over time. Long-term growth in enplanements is projected to be driven by international
trac, as the world economy recovers rom the global recession.Recent new service at SFO reects growth in domestic and international travel, with new ights by VirginAmerica and Jet Blue, new seasonal international service rom Air Berlin, Swiss International, and LAN Peru,increased requency o service by Air France, and the restoration o seasonal ights by United Airlines. eAirport will continue its marketing eforts to attract new international and domestic air carriers to SFO andto expand the operations o existing air carriers.
Saety and SecuritySaety and security remain undamental to the operation o SFO. For more than a decade, the Airport hasactively sought, developed and deployed cost-efective technology solutions to enhance saety, securityand eciency. As a result, SFO continues to exceed the TSA regulations or baggage inspection. With theimplementation o an integrated access control and networked digital video system, SFO ar exceeds ederalsecurity requirements.
e Airport’s Aviation Security and Emergency Planning divisions conduct exercises with the TSA, SanFrancisco Fire Department, and the San Francisco Police Department to continually evaluate and improvecoordinated emergency preparedness and procedures. e Airport will be adding a special weapons andtactics (SWAT) team to the San Francisco Police Department, Airport Bureau. is new team will enhancethe airport’s rapid response capabilities and is consistent with the best practices in aviation security.
Two-Year Budgetinge Airport has developed a two-year budget as part o the early implementation o Proposition A, the voter-approved Charter amendment in November 2009. In the second budget year, the Airport’s proposal reectsa ull year o operating costs or Terminal 2, including public saety and maintenance positions, contractual
services or operations, and maintenance services or new equipment and systems. e budget also proposesnew positions or terminal maintenance, includes an anticipated increase in debt service due to completedacility improvements and a ull year o debt service or Terminal 2 and other newly completed capitalprojects, and increases unding or acilities maintenance to renew the Airports physical assets.
Five-Year Financial PlanBecause the Airport maintains a Five-Year Financial Plan, the Department has transitioned to the requiredtwo-year budgeting process with relative ease. e Plan achieves key objectives including a balanced budgetin each year, as well as debt service coverage levels exceeding requirements. It reects the Department’spriorities and strategic initiatives, including capital projects, through Fiscal Year 2014-2015. Additionally,the Plan achieves the Airport’s goal o keeping airline costs per enplaned passenger low, enhancing SFO’s
competitiveness with other airports.
8/9/2019 Mayor's Proposed 2010-11 May Budget
http://slidepdf.com/reader/full/mayors-proposed-2010-11-may-budget 28/107
6 Mayor’s Proposed Budget 2010-11
Cost per Enplaned Passenger($)
0
5
10
15
20
25
30
20122011201020092008200720062005200420032002
F i s c a l Y e a r
Annual Service Payment to General Fund($ millions)
SfO has a unique provision which allows the airport to pay 15% o its concession revenues
to the City an County o San francisco, calle the Annual Service Payment (ASP).
he Cost per Enplane Passenger measures the airline laning ee an
terminal rental payments per passenger boaring on aircrat (enplane).
0
5
10
15
20
2012201120102009200820072006200520042003

8/9/2019 Mayor's Proposed 2010-11 May Budget
http://slidepdf.com/reader/full/mayors-proposed-2010-11-may-budget 29/107
Department Budgets > Airport 7
Airport
E x e c u t i v e
d e s i g n &
C o n s t r u c t i o n
P l a n n i n g
A m i n i s t r a t i o n
f a c i l i t i e s
O p e r a t i o n s &
S e c u r i t y
S f O M u s e u m s
B u s i n e s s &
f i n a n c e
C o m m u n i c a t i o n s
& M a r k e t i n g
C h i e O p e r a t i n g O c e r
A i r p o r t C o m m i s i o
n
C o m m i s s i o n S e c r e t a
r y
E q u a l E m p l o y m e n t O p p o
r t u n i t y
& r a i n i n g
G e n e r a l C o u n s e
l

8/9/2019 Mayor's Proposed 2010-11 May Budget
http://slidepdf.com/reader/full/mayors-proposed-2010-11-may-budget 30/107
8 Mayor’s Proposed Budget 2010-11
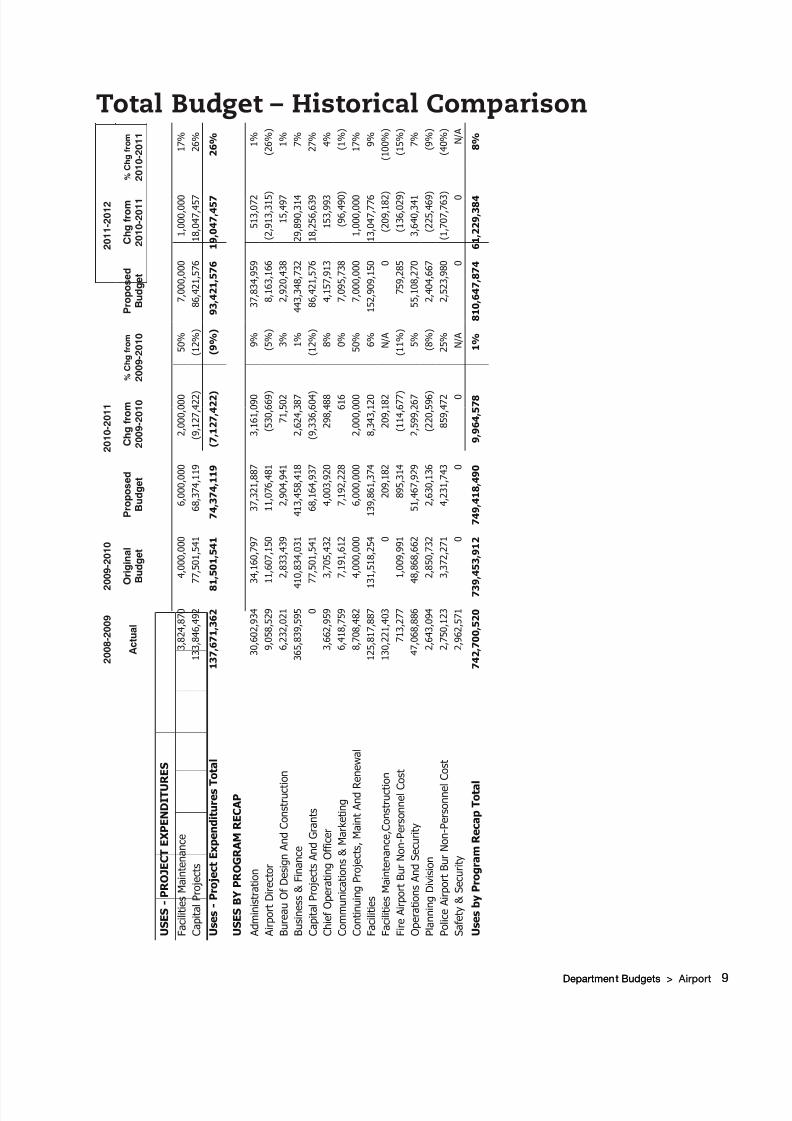
Total Budget – Historical Comparison
8 Mayor’s Proposed Budget 2010-11
2 0 0 8 - 2 0 0 9
2
0 0 9 - 2 0 1 0
2 0 1 0 - 2 0 1 1
2 0 1 1 - 2 0 1 2
A c t u a l
O r i g i n a l
B u d g e t
P r o p o s e d
B u d g e t
C h g f r o m
2 0 0 9 - 2 0 1 0
% C
h g f r o m
2 0 0 9 - 2 0 1 0
P r o p o s e d
B u d g e t
C h g f r o m
2 0 1 0 - 2 0 1 1
% C
h g f r o m
2 0 1 0 - 2 0 1 1
A U T H O R I Z E D P O S I T I O N S
T o t a l A u t h o r i z e d
1 , 3
7 1 . 7
4
1 , 3
5 9 . 5
6
1 , 4
2 7 . 2
0
6 7 . 6 4
5 %
1 , 4
7 6 . 9
1
4 9 . 7 1
3 %
N o n - o p e r a t i n g P o s i t i o n s ( c a p / o t h
e r )
( 1 2 4 . 2
4 )
( 1 2 7 . 0
0 )
( 1 2 7 . 5
4 )
( 0 . 5 4 )
0 %
( 1 2 8 . 0
0 )
( 0 . 4 6
)
0 %
N e t O p e r a t i n g P o s i t i o n s
1 , 2 4 7 . 5 0
1 , 2 3 2 . 5 6
1 , 2 9 9 . 6 6
6 7 . 1 0
5 %
1 , 3 4 8 . 9 1
4 9 . 2 5
4 %
S O U R C E S
L i c e n s e s & F i n e s
5 9 3 , 7
5 8
3 0 1 , 0
0 0
2 6 3 , 0
0 0
( 3 8 , 0
0 0 )
( 1 3 % )
2 6 8 , 0
0 0
5 , 0 0 0
2 %
U s e o f M o n e y o r P r o p e r t y
2 1 3 , 6
5 9 , 6
0 7
2 1 5 , 4
8 0 , 4
8 4
2 2 1 , 7
8 4 , 1
8 9
6 , 3
0 3 , 7
0 5
3 %
2 2 9 , 1
0 2 , 6
1 2
7 , 3
1 8 , 4 2 3
3 %
I n t e r g o v e r n m e n t a l R e v e n u e - F e d e r a l
5 9 , 7
7 6 , 6
1 8
6 0 , 1
6 5 , 0
4 8
5 1 , 1
3 9 , 5
5 8
( 9 , 0
2 5 , 4
9 0 )
( 1 5 % )
6 8 , 9
2 1 , 5
7 6
1 7 , 7
8 2 , 0 1 8
3 5 %
I n t e r g o v e r n m e n t a l R e v e n u e - S t a
t e
9 7 8 , 5
7 7
1 , 7
2 1 , 0
0 9
0
( 1 , 7
2 1 , 0
0 9 )
( 1 0 0 % )
0
0
N / A
C h a r g e s f o r S e r v i c e s
4 0 9 , 9
2 9 , 8
5 5
4 0 8 , 0
1 6 , 0
0 0
4 5 6 , 2
4 7 , 5
8 9
4 8 , 2
3 1 , 5
8 9
1 2 %
5 2 1 , 4
6 1 , 2
1 1
6 5 , 2
1 3 , 6 2 2
1 4 %
O t h e r R e v e n u e s
3 8 , 1
6 3 , 5
5 1
4 0 , 8
3 7 , 0
0 0
3 6 , 8
8 8 , 8
1 6
( 3 , 9
4 8 , 1
8 4 )
( 1 0 % )
5 2 , 7
1 9 , 5
7 0
1 5 , 8
3 0 , 7 5 4
4 3 %
T r a n s f e r s I n
1 1 8 , 6
7 9 , 7
1 4
1 1 7 , 2
3 2 , 0
5 7
1 1 8 , 1
8 6 , 6
9 1
9 5 4 , 6
3 4
1 %
1 2 7 , 4
8 1 , 1
0 3
9 , 2
9 4 , 4 1 2
8 %
E x p e n d i t u r e R e c o v e r y
3 1 , 8
1 1
2 0 , 0
0 0
2 2 , 0
0 0
2 , 0
0 0
1 0 %
2 5 , 0
0 0
3 , 0 0 0
1 4 %
T r a n s f e r A d j u s t m e n t s - S o u r c e s
( 1 1 9 , 5
6 3 , 3
2 2 ) ( 1 7 3 , 8
8 0 , 0
4 8 )
( 1 7 6 , 9
8 3 , 4
1 7 )
( 3 , 1
0 3 , 3
6 9 )
2 %
( 1 8 9 , 3
3 1 , 1
9 8 )
( 1 2 , 3
4 7 , 7 8 1
)
7 %
F u n d B a l a n c e
2 0 , 4
5 0 , 3
5 1
6 9 , 5
6 1 , 3
6 2
4 1 , 8
7 0 , 0
6 4
( 2 7 , 6
9 1 , 2
9 8 )
( 4 0 % )
0
( 4 1 , 8
7 0 , 0 6 4
)
( 1 0 0 % )
S o u r c e s T o t a l
7 4 2 , 7 0 0 , 5 2 0
7 3
9 , 4 5 3 , 9 1 2
7 4 9 , 4 1 8 , 4 9 0
9 , 9 6 4 , 5 7 8
1 %
8 1 0 , 6 4 7 , 8 7 4
6 1 , 2 2 9 , 3 8 4
8 %
U S E S - O P E R A T I N G E X P E N D I
T U R E S
S a l a r i e s & W a g e s
9 8 , 7
4 9 , 6
3 6
9 8 , 7
5 3 , 0
9 1
1 0 0 , 2
3 2 , 5
4 9
1 , 4
7 9 , 4
5 8
1 %
1 0 2 , 8
9 9 , 4
2 9
2 , 6
6 6 , 8 8 0
3 %
F r i n g e B e n e f i t s
3 9 , 0
9 8 , 4
3 1
7 8 , 2
4 5 , 1
6 7
5 7 , 6
7 1 , 0
4 4
( 2 0 , 5
7 4 , 1
2 3 )
( 2 6 % )
6 4 , 0
8 1 , 8
7 5
6 , 4
1 0 , 8 3 1
1 1 %
P r o f e s s i o n a l & C o n t r a c t u a l S e r v i c
e s
7 8 , 9
3 1 , 8
4 7
8 2 , 2
4 0 , 5
1 5
9 1 , 1
4 2 , 5
1 2
8 , 9
0 1 , 9
9 7
1 1 %
9 0 , 3
6 2 , 0
4 4
( 7 8 0 , 4 6 8
)
( 1 % )
M a t e r i a l s & S u p p l i e s
1 2 , 8
6 8 , 8
8 9
1 3 , 6
7 4 , 1
1 9
1 4 , 4
2 9 , 9
8 3
7 5 5 , 8
6 4
6 %
1 4 , 8
4 8 , 1
0 8
4 1 8 , 1 2 5
3 %
E q u i p m e n t
3 , 6
9 7 , 7
1 3
3 , 7
5 1 , 4
7 0
2 , 2
7 1 , 3
3 9
( 1 , 4
8 0 , 1
3 1 )
( 3 9 % )
3 , 0
0 0 , 0
0 0
7 2 8 , 6 6 1
3 2 %
D e b t S e r v i c e
2 9 7 , 3
8 4 , 5
7 8
3 0 4 , 4
6 8 , 1
1 5
3 2 8 , 2
9 1 , 1
5 4
2 3 , 8
2 3 , 0
3 9
8 %
3 4 1 , 5
5 0 , 5
3 7
1 3 , 2
5 9 , 3 8 3
4 %
S e r v i c e s o f O t h e r D e p a r t m e n t s
4 7 , 4
4 8 , 6
9 4
5 0 , 5
9 3 , 8
9 4
5 2 , 5
3 6 , 7
9 0
1 , 9
4 2 , 8
9 6
4 %
5 5 , 4
1 0 , 7
5 6
2 , 8
7 3 , 9 6 6
5 %
T r a n s f e r s O u t
9 4 , 4
2 0 , 1
5 4
1 4 3 , 4
5 8 , 0
5 7
1 4 6 , 6
5 5 , 6
9 1
3 , 1
9 7 , 6
3 4
2 %
1 5 6 , 3
4 9 , 1
0 3
9 , 6
9 3 , 4 1 2
7 %
B u d g e t a r y R e s e r v e s
0
0
0
0
N / A
1 6 , 2
0 5 , 5
4 9
1 6 , 2
0 5 , 5 4 9
N / A
T r a n s f e r A d j u s t m e n t s - U s e s
( 6 7 , 5
7 0 , 7
8 4 ) ( 1 1 7 , 2
3 2 , 0
5 7 )
( 1 1 8 , 1
8 6 , 6
9 1 )
( 9 5 4 , 6
3 4 )
1 %
( 1 2 7 , 4
8 1 , 1
0 3 )
( 9 , 2
9 4 , 4 1 2
)
8 %
U s e s - O p e r a t i n g E x p e n d i t u r e s T o t a l
6 0 5 , 0 2 9 , 1 5 8
6 5
7 , 9 5 2 , 3 7 1
6 7 5 , 0 4 4 , 3 7 1
1 7 , 0 9 2 , 0 0 0
3 %
7 1 7 , 2 2 6 , 2 9 8
4 2 , 1 8 1 , 9 2 7
6 %
8/9/2019 Mayor's Proposed 2010-11 May Budget
http://slidepdf.com/reader/full/mayors-proposed-2010-11-may-budget 31/107
Department Budgets > Airport 9Department Budgets > Airport 9
Total Budget – Historical Comparison
2 0 0 8 - 2 0 0 9
2
0 0 9 - 2 0 1 0
2 0 1 0 - 2 0 1 1
2 0 1 1 - 2 0 1 2
A c t u a l
O r i g i n a l
B u d g e t
P r o p o s e d
B u d g e t
C h g f r o m
2 0 0 9 - 2 0 1 0
% C
h g f r o m
2 0 0 9 - 2 0 1 0
P r o p o s e d
B u d g e t
C h g f r o m
2 0 1 0 - 2 0 1 1
% C
h g f r o m
2 0 1 0 - 2 0 1 1
U S E S - P R O J E C T E X P E N D I T U R E S
F a c i l i t i e s M a i n t e n a n c e
3 , 8
2 4 , 8
7 0
4 , 0
0 0 , 0
0 0
6 , 0
0 0 , 0
0 0
2 , 0
0 0 , 0
0 0
5 0 %
7 , 0
0 0 , 0
0 0
1 , 0
0 0 , 0
0 0
1 7 %
C a p i t a l P r o j e c t s
1 3 3 , 8
4 6 , 4
9 2
7 7 , 5
0 1 , 5
4 1
6 8 , 3
7 4 , 1
1 9
( 9 , 1
2 7 , 4
2 2 )
( 1 2 % )
8 6 , 4
2 1 , 5
7 6
1 8 , 0
4 7 , 4
5 7
2 6 %
U s e s - P r o j e c t E x p e n d i t u r e s T
o t a l
1 3 7 , 6 7 1 , 3 6 2
8
1 , 5 0 1 , 5 4 1
7 4 , 3 7 4 , 1 1 9
( 7 , 1 2 7 , 4 2 2 )
( 9 % )
9 3 , 4 2 1 , 5 7 6
1 9 , 0 4 7 , 4 5 7
2 6 %
U S E S B Y P R O G R A M R E C A P
A d m i n i s t r a t i o n
3 0 , 6
0 2 , 9
3 4
3 4 , 1
6 0 , 7
9 7
3 7 , 3
2 1 , 8
8 7
3 , 1
6 1 , 0
9 0
9 %
3 7 , 8
3 4 , 9
5 9
5 1 3 , 0
7 2
1 %
A i r p o r t D i r e c t o r
9 , 0
5 8 , 5
2 9
1 1 , 6
0 7 , 1
5 0
1 1 , 0
7 6 , 4
8 1
( 5 3 0 , 6
6 9 )
( 5 % )
8 , 1
6 3 , 1
6 6
( 2 , 9
1 3 , 3
1 5 )
( 2 6 % )
B u r e a u O f D e s i g n A n d C o n s t r u c t i o n
6 , 2
3 2 , 0
2 1
2 , 8
3 3 , 4
3 9
2 , 9
0 4 , 9
4 1
7 1 , 5
0 2
3 %
2 , 9
2 0 , 4
3 8
1 5 , 4
9 7
1 %
B u s i n e s s & F i n a n c e
3 6 5 , 8
3 9 , 5
9 5
4 1 0 , 8
3 4 , 0
3 1
4 1 3 , 4
5 8 , 4
1 8
2 , 6
2 4 , 3
8 7
1 %
4 4 3 , 3
4 8 , 7
3 2
2 9 , 8
9 0 , 3
1 4
7 %
C a p i t a l P r o j e c t s A n d G r a n t s
0
7 7 , 5
0 1 , 5
4 1
6 8 , 1
6 4 , 9
3 7
( 9 , 3
3 6 , 6
0 4 )
( 1 2 % )
8 6 , 4
2 1 , 5
7 6
1 8 , 2
5 6 , 6
3 9
2 7 %
C h i e f O p e r a t i n g O f f i c e r
3 , 6
6 2 , 9
5 9
3 , 7
0 5 , 4
3 2
4 , 0
0 3 , 9
2 0
2 9 8 , 4
8 8
8 %
4 , 1
5 7 , 9
1 3
1 5 3 , 9
9 3
4 %
C o m m u n i c a t i o n s & M a r k e t i n g
6 , 4
1 8 , 7
5 9
7 , 1
9 1 , 6
1 2
7 , 1
9 2 , 2
2 8
6 1 6
0 %
7 , 0
9 5 , 7
3 8
( 9 6 , 4
9 0 )
( 1 % )
C o n t i n u i n g P r o j e c t s ,
M a i n t A n d R
e n e w a l
8 , 7
0 8 , 4
8 2
4 , 0
0 0 , 0
0 0
6 , 0
0 0 , 0
0 0
2 , 0
0 0 , 0
0 0
5 0 %
7 , 0
0 0 , 0
0 0
1 , 0
0 0 , 0
0 0
1 7 %
F a c i l i t i e s
1 2 5 , 8
1 7 , 8
8 7
1 3 1 , 5
1 8 , 2
5 4
1 3 9 , 8
6 1 , 3
7 4
8 , 3
4 3 , 1
2 0
6 %
1 5 2 , 9
0 9 , 1
5 0
1 3 , 0
4 7 , 7
7 6
9 %
F a c i l i t i e s M a i n t e n a n c e , C o n s t r u c t i o n
1 3 0 , 2
2 1 , 4
0 3
0
2 0 9 , 1
8 2
2 0 9 , 1
8 2
N / A
0
( 2 0 9 , 1
8 2 )
( 1 0 0 % )
F i r e A i r p o r t B u r N o n - P e r s o n n e l C o s t
7 1 3 , 2
7 7
1 , 0
0 9 , 9
9 1
8 9 5 , 3
1 4
( 1 1 4 , 6
7 7 )
( 1 1 % )
7 5 9 , 2
8 5
( 1 3 6 , 0
2 9 )
( 1 5 % )
O p e r a t i o n s A n d S e c u r i t y
4 7 , 0
6 8 , 8
8 6
4 8 , 8
6 8 , 6
6 2
5 1 , 4
6 7 , 9
2 9
2 , 5
9 9 , 2
6 7
5 %
5 5 , 1
0 8 , 2
7 0
3 , 6
4 0 , 3
4 1
7 %
P l a n n i n g D i v i s i o n
2 , 6
4 3 , 0
9 4
2 , 8
5 0 , 7
3 2
2 , 6
3 0 , 1
3 6
( 2 2 0 , 5
9 6 )
( 8 % )
2 , 4
0 4 , 6
6 7
( 2 2 5 , 4
6 9 )
( 9 % )
P o l i c e A i r p o r t B u r N o n - P e r s o n n e l C
o s t
2 , 7
5 0 , 1
2 3
3 , 3
7 2 , 2
7 1
4 , 2
3 1 , 7
4 3
8 5 9 , 4
7 2
2 5 %
2 , 5
2 3 , 9
8 0
( 1 , 7
0 7 , 7
6 3 )
( 4 0 % )
S a f e t y & S e c u r i t y
2 , 9
6 2 , 5
7 1
0
0
0
N / A
0
0
N / A
U s e s b y P r o g r a m R e c a p T o t a l
7 4 2 , 7 0 0 , 5 2 0
7 3
9 , 4 5 3 , 9 1 2
7 4 9 , 4 1 8 , 4 9 0
9 , 9 6 4 , 5 7 8
1 %
8 1 0 , 6 4 7 , 8 7 4
6 1 , 2 2 9 , 3 8 4
8 %
8/9/2019 Mayor's Proposed 2010-11 May Budget
http://slidepdf.com/reader/full/mayors-proposed-2010-11-may-budget 32/107
10 Mayor’s Proposed Budget 2010-11
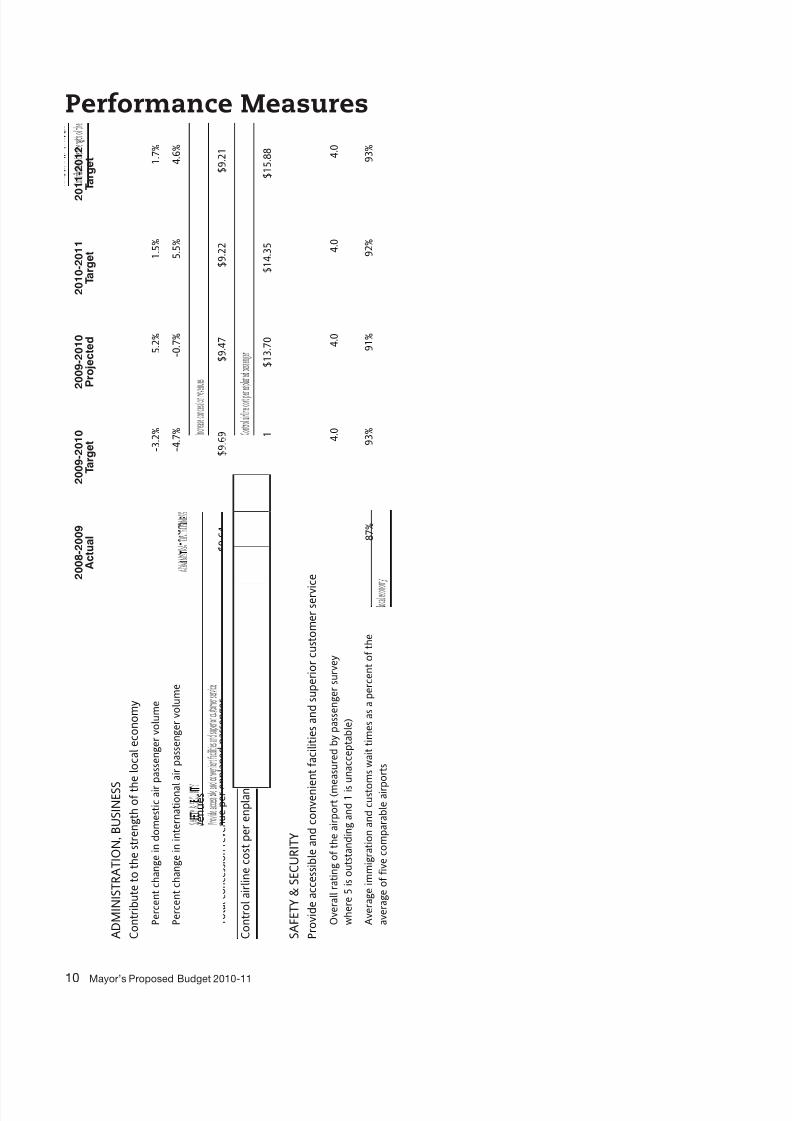
Performance Measures
2 0 0 8 - 2 0 0 9
A c t u a l
2 0 0 9 - 2 0 1 0
T a r g e t
2 0 0 9 - 2 0 1 0
P r o j e c t e d
2 0 1 0 - 2 0 1 1
T a r g e t
2 0 1 1 - 2 0 1 2
T a r g e t
A D M I N I S T R A T I O N , B U S I N E S S
C o n t r i b u t e t o t h e s t r e n g t h o f t h
e l o c a l e c o n o m y
P e r c e n t c h a n g e i n d o m e s t i c a i r
p a s s e n g e r v o l u m e
1 . 4 %
- 3 . 2 %
5 . 2 %
1 . 5 %
1 . 7 %
P e r c e n t c h a n g e i n i n t e r n a t i o n a l
a i r p a s s e n g e r v o l u m e
- 7 . 6 %
- 4 . 7 %
- 0 . 7 %
5 . 5 %
4 . 6 %
I n c r e a s e c o n c e s s i o n r e v e n u e s
T o t a l c o n c e s s i o n r e v e n u e p e r e n p l a n e d p a s s e n g e r
$ 9 . 6 4
$ 9 . 6 9
$ 9 . 4 7
$ 9 . 2 2
$ 9 . 2 1
C o n t r o l a i r l i n e c o s t p e r e n p l a n e
d p a s s e n g e r
A i r l i n e c o s t p e r e n p l a n e d p a s s e n g e r ( i n c o n s t a n t 2 0 0 8 d o l l a r s )
$ 1 3 . 7 2
$ 1 5 . 0 1
$ 1 3 . 7 0
$ 1 4 . 3 5
$ 1 5 . 8 8
S A F E T Y & S E C U R I T Y
P r o v i d e a c c e s s i b l e a n d c o n v e n i e
n t f a c i l i t i e s a n d s u p e r i o r c u s t o m e r s e r v i c e
O v e r a l l r a t i n g o f t h e a i r p o r t ( m e a s u r e d b y p a s s e n g e r s u r v e y
w h e r e 5 i s o u t s t a n d i n g a n d 1 i s
u n a c c e p t a b l e )
4 . 0
4 . 0
4 . 0
4 . 0
4 . 0
A v e r a g e i m m i g r a t i o n a n d c u s t o
m s w a i t t i m e s a s a p e r c e n t o f t h e
a v e r a g e o f f i v e c o m p a r a b l e a i r p
o r t s
8 7 %
9 3 %
9 1 %
9 2 %
9 3 %

8/9/2019 Mayor's Proposed 2010-11 May Budget
http://slidepdf.com/reader/full/mayors-proposed-2010-11-may-budget 33/107
Board of Appeals 11
Board of Appeals
MissionTo provide the public with a nal administrative review process or the issuance,
denial, suspension and revocation o City permits. Reviews include an ecient, air,
and expeditious public hearing and decision-making process beore an impartial panel
as a last step in the City’s permit issuance process.
Services
e Board o Appeals provides the ollowing services:Appeals Processing or residents as required by the Charter. Inormation about appealing a permitdecision is available through a variety o outlets, including the Internet, brochures, phone, ax and in-person. Appeals processing includes duly noticed public hearings and timely decisions to uphold, overrule orconditionally uphold departmental decisions.
ustomer Service includes: (1) creating a air and impartial orum within which appeals may be consideredand decided; (2) satisying the legal requirements surrounding the processing o appeals and providingnotication o public hearings on appeals; and (3) providing appropriate access to inormation regarding allappeals and the appeal process.
e benchmarks used by the Board o Appeals to assess the quality o its customer service include clearlyarticulated timelines or assigning hearing dates, and established brieng schedules and hearing protocols thatare designed to create a air and accessible process that allows all parties an equal opportunity to present theircase. To ensure the appeal process is carried out in a timely manner, the Board o Appeals also benchmarks thespeed with which the Board makes its determinations and how quickly written decisions are issued.
For more inormation, call (415) 575-6880 or 311; or visit www.sgov.org/BOA
Budget Data Summary2008-2009
Actual
2009-2010
Budget
2010-2011
Proposed
Change from
2009-2010
% Changed from
2009-2010
Total Expenditures 751,645 834,412 930,494 96,082 12%
Total FTE 5.41 5.00 5.00 0.00 --
Budget Issues and DetailsIn Fiscal Year 2010-11, the Board o Appeals proposes a $930,494 budget, which represents a 12 percentincrease rom the Fiscal Year 2009-10 budget. is change is primarily due to changes to citywide overheadcost allocations and an increase in anticipated need or legal services.

8/9/2019 Mayor's Proposed 2010-11 May Budget
http://slidepdf.com/reader/full/mayors-proposed-2010-11-may-budget 34/107
12 Mayor’s Proposed Budget 2010-11
As a result o the economic downturn that began in 2008, the Board o Appeals saw a decline in permit volumes in Fiscal Year 2009-10. In Fiscal Year 2010-11, despite this continuing downturn, the Departmentexpects to continue its eforts to simpliy the tracking o appealable permits and adjudicate appeals in atimely manner.
e Department continues to cross-train staf in all aspects o the appeal process to improve service quality,reduce processing delays, ensure continuity o operations and maintain institutional memory. In Fiscal Year2010–11, the implementation o a database designed to track and report on appeals led with the Board will
allow deeper analysis o the Board’s work and costs, and will improve work ow management.
evenue hangese majority o appeals led with the Board ocus on land use disputes arising out o permits and otherdeterminations issued by the City’s Planning Department and Department o Building Inspection. Due to adramatic decline in the number o permit applications being led throughout the City, the volume o permitappeals has dropped. Until the economy improves, this reduction is expected to continue.
e Board’s budget is derived rom two sources: 95 percent rom surcharges placed on permit applicationsand ve percent rom ees paid by individuals and businesses ling appeals. Due to an adjustment made tothe Board’s ling ees in Fiscal Year 2009-10, that revenue source is on target or the year. However, the sharpdecrease in permit applications continues to cause the Board to experience a signicant reduction in the
collection o surcharges. City law allows the Board’s surcharges to be automatically adjusted on an annualbasis to reect changes in ination. Because this adjustment is insucient to cover the Board’s operatingexpenses, the Mayor’s Budget includes legislation to make a modest increase to the surcharges.
0%
20%
40%
60%
80%
100%
2009-102008-092007-082006-072005-062004-052003-04
Pecentage of On-Time Decisions
he department continues to release written ecisions within 15 ays o nal action or more than 90 percent o appeals.
8/9/2019 Mayor's Proposed 2010-11 May Budget
http://slidepdf.com/reader/full/mayors-proposed-2010-11-may-budget 35/107
Department Budgets > Board of Appeals 13
0
50
100
150
200
250
300
2009-102008-092007-082006-072005-062004-052003-04
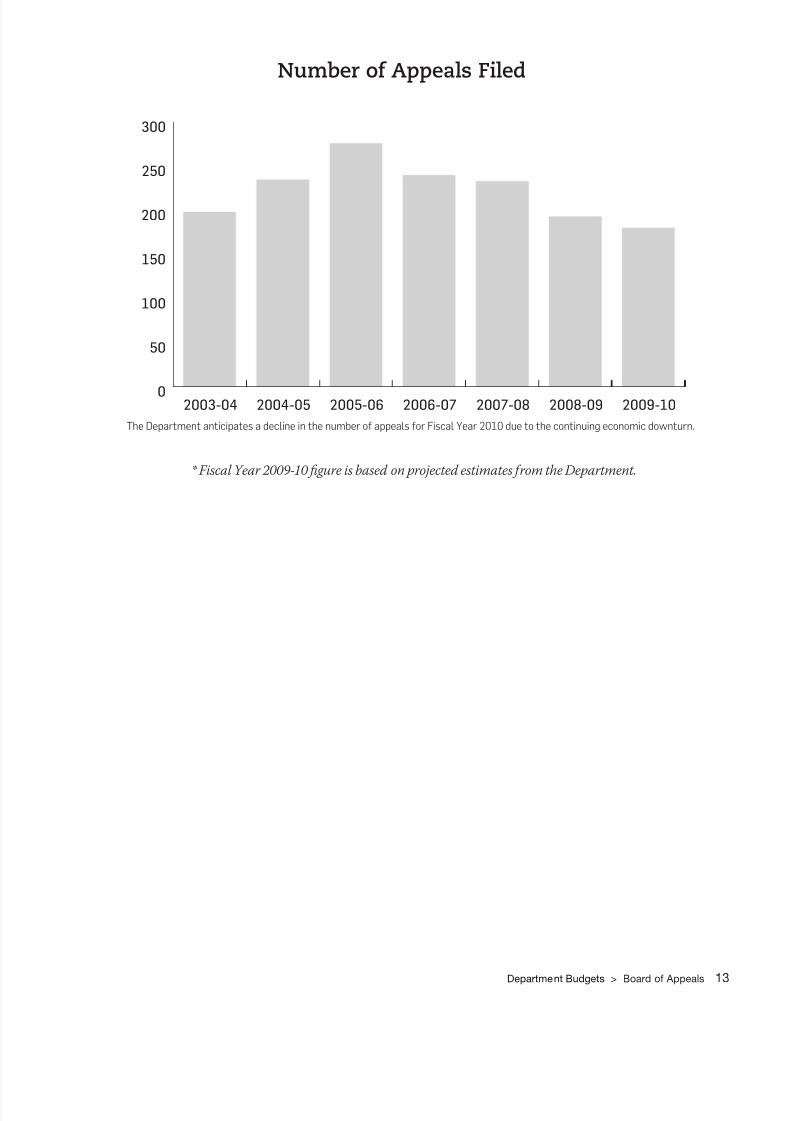
Number of Appeals Filed
he department anticipates a ecline in the number o appeals or fiscal Year 2010 ue to the continuing economic ownturn.
* Fiscal Year 2009-10 fgure is based on projected estimates rom the Department.

8/9/2019 Mayor's Proposed 2010-11 May Budget
http://slidepdf.com/reader/full/mayors-proposed-2010-11-may-budget 36/107
14 Mayor’s Proposed Budget 2010-11
Board of Appeals
d e p a r t m e n t H e a
B o a r M e m b e r s
L e g a l A s s i s t a n c e
A m i n i s t r a t i o n
& f i n a n c e

8/9/2019 Mayor's Proposed 2010-11 May Budget
http://slidepdf.com/reader/full/mayors-proposed-2010-11-may-budget 37/107
Department Budgets > Board of Appeals 15
Total Budget – Historical Comparison2008-2009 2009-2010 2010-2011
ActualOriginal
Budget
Proposed
Budget
Chg from
2009-2010
% Chg from
2009-2010
AUTHORIZED POSITIONS
Total Authorized 5.41 5.00 5.00 0.00 0
Net Operating Positions 5.41 5.00 5.00 0.00 --
SOURCES
Charges for Services 751,645 834,412 930,494 96,082 12%
Sources Total 751,645 834,412 930,494 96,082 12%
USES - OPERATING EXPENDITURES
Salaries & Wages 357,076 381,884 369,421 (12,463) (3%)
Fringe Benefits 115,520 159,606 176,677 17,071 11%
Overhead 0 36,928 45,121 8,193 22%
Professional & Contractual Services 37,393 47,192 47,192 0 0
Materials & Supplies 10,607 10,459 9,398 (1,061) (10%)
Services of Other Departments 231,049 198,343 282,685 84,342 43%
Uses - Operating Expenditures Total 751,645 834,412 930,494 96,082 12%
USES BY PROGRAM RECAP
Appeals Processing 751,645 834,412 930,494 96,082 12%
Uses by Program Recap Total 751,645 834,412 930,494 96,082 12%
8/9/2019 Mayor's Proposed 2010-11 May Budget
http://slidepdf.com/reader/full/mayors-proposed-2010-11-may-budget 38/107
16 Mayor’s Proposed Budget 2010-11
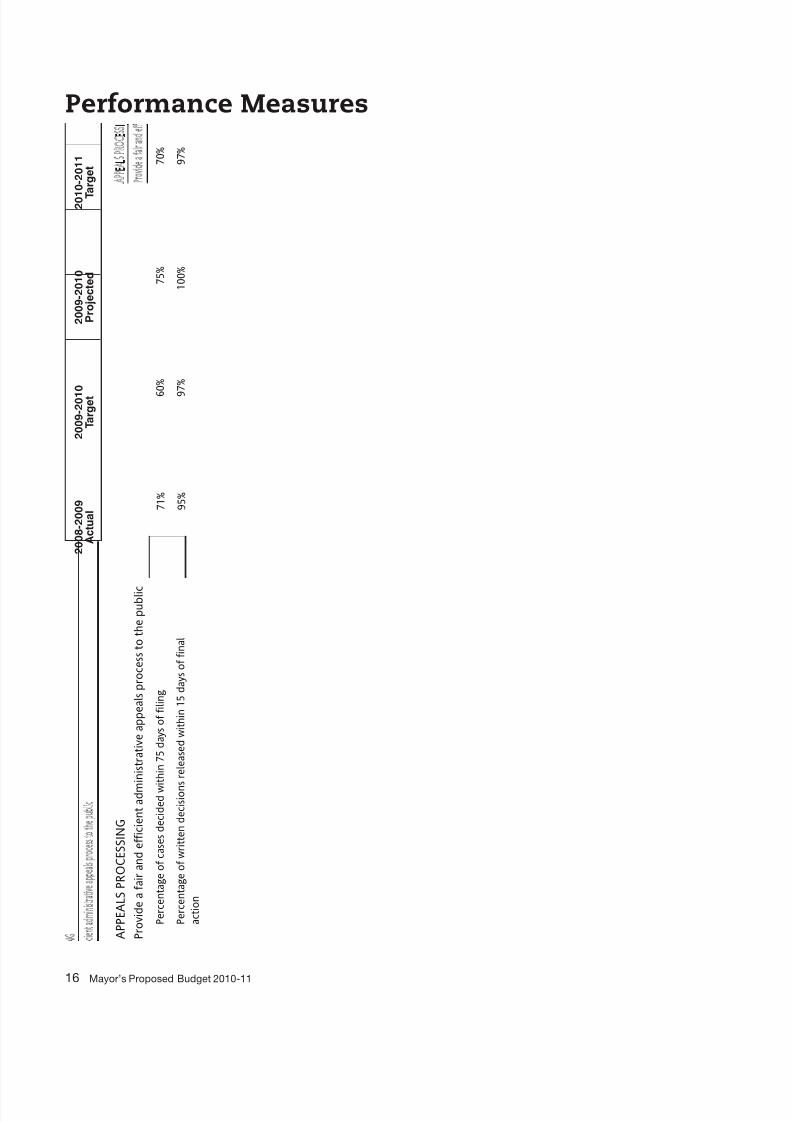
Performance Measures
2 0 0 8 - 2 0 0 9
A c t u a l
2 0 0 9 - 2 0 1 0
T a r g e t
2 0 0 9 - 2 0 1 0
P r o j e c t e d
2 0 1
0 - 2 0 1 1
T
a r g e t
A P P E A L S P R O C E S S I N G
P r o v i d e a f a i r a n d e f f i c i e n t a d m
i n i s t r a t i v e a p p e a l s p r o c e s s t o t h e p u b l i c
P e r c e n t a g e o f c a s e s d e c i d e d w i t h i n 7 5 d a y s o f f i l i n g
7 1 %
6 0 %
7 5 %
7 0 %
P e r c e n t a g e o f w r i t t e n d e c i s i o n s r e l e a s e d w i t h i n 1 5 d a y s o f f i n a l
a c t i o n
9 5 %
9 7 %
1 0 0 %
9 7 %
8/9/2019 Mayor's Proposed 2010-11 May Budget
http://slidepdf.com/reader/full/mayors-proposed-2010-11-may-budget 39/107

8/9/2019 Mayor's Proposed 2010-11 May Budget
http://slidepdf.com/reader/full/mayors-proposed-2010-11-may-budget 40/107
18 Mayor’s Proposed Budget 2010-11
Budget Issues and DetailsFirst 5 San Francisco, established in 2000, is part o the statewide First 5 Caliornia movement to assist publicagencies, non-prot organizations and amilies in supporting early education, pediatric healthcare and amilysupport. In Fiscal Year 2010-11, First 5 San Francisco aces declining revenue sources, including statewidetobacco tax revenue (Prop 10). is decline is not unexpected–the department has created a sustainabilityplan and reserve to guide its unding decisions. During Fiscal Year 2010-11, First 5’s Prop 10 allocation isprojected to decline rom $6.3 million to $5.6 million. Also in Fiscal Year 2010-11, the City will deer 25percent o the mandated $20 million allocation to First 5 San Francisco or Preschool or All (PFA), providinga $14.6 million allocation or PFA. To partially ofset these declining revenues, First 5 will use $2.4 million o its sustainability und.
Preschool For All ImplementationFirst 5 San Francisco is also responsible or overseeing and implementing Proposition H, the City’sUniversal Preschool or All Program (PFA) unded by local General Fund revenues. e Department beganthe implementation o PFA in Fiscal Year 2005–2006 and has integrated PFA into the overall work o theDepartment. Preschool For All expanded citywide in Fiscal Year 2008–2009, to serve all neighborhoodsand zip codes. In 2009-10, the City deerred 25 percent o its mandated allocation to Preschool For All dueto a budget shortall. In Fiscal Year 2010-11, the allocation or PFA will be $14.6 million. e Department
anticipates unding a hal-day o ree preschool or approximately 3,100 our-year-olds and will continue totarget children rom low income amilies. PFA now includes a special Pre-PFA allocation to assist centersserving low income children to become eligible or PFA.
Departmental ollaborationApproximately 25% o First 5 San Francisco unds are committed to joint unding with other citydepartments to better coordinate and streamline systems o care and support children birth to ve years o age and their amilies. In Fiscal Year 2009-10 over $6 million was work ordered to Department o PublicHealth (DPH), Department o Children, Youth, and eir Families (DCYF), Human Services Agency (HSA)and Mayor’s Oce o Housing (MOH).
Fiscal Year 2009-2010 was the rst year o a three-year $9 million initiative by First 5, HSA and DCYF
to support neighborhood-based and population-ocused amily resource centers. ese centers are inneighborhoods throughout the City with varying levels o service based on the needs o amilies in thoseneighborhoods. Population based amily resource centers will be citywide with a ocus on children andamilies who are homeless and under housed, recent immigrants, special needs, LGBTQ and teen amiliesand amilies with children exposed to violence.
In Fiscal Year 2010-11, First 5 will continue to contribute approximately $16.5 million to jointly und EarlyCare and Education Initiatives with DCYF and H.SA. ese eforts include unding or health screeningand early childhood mental health consultation, childcare subsidies or low-income amilies with inants andtoddlers, a variety o proessional development and education attainment activities or teachers and inclusionstrategies or children with special needs.
Five-Year Strategic PlanFirst 5 San Francisco is charged with implementing services in San Francisco or children ages birth to veand their amilies with Proposition 10 tobacco tax revenues. e Prop 10 cigarette tax unds are a decliningrevenue stream. e First 5 San Francisco Commission developed a sustainability plan in 2007 to respond tothe anticipated revenue decline. As projected in the sustainability plan, the department’s Prop 10 allocationis projected to decline rom $6.3 million to $5.6 million. In order to strategically reduce expenditures, theCommission’s portolio will be reduced by $1.6 million.
In 2006, First 5 San Francisco approved a ve-year strategic plan or 2007–2012. e strategic plan ocuses onour areas: improved child development; improved child health; improved amily unctioning; and improved

8/9/2019 Mayor's Proposed 2010-11 May Budget
http://slidepdf.com/reader/full/mayors-proposed-2010-11-may-budget 41/107
Department Budgets > Children & Families Commission 19
Preschool for All 71%
Administrative Support 3%
Parent ACTION Program 1%
CARES 4%School Readiness 4%
Family Support Program 1%
Health Programs 11%
Civic Engagement Program 0%
Evaluation 1%
Total CFC Spending by Program Area
Administrative Support 11%
Civic Engagement Program 1%
Parent ACTION Program 5%
School Readiness 15%
CARES 14%
Health Programs 38%
Evaluation 3%
Family Support Program 5%
Early Childhood Education 8%
Total Prop 10 Spending by Program Area
he majority o CfCs spening is on Preschool or All.
n fiscal Year 2010-11, CfC will receive $5.6 million rom Prop 10 cigarette tax revenue.
he above chart shows how CfC will allocate Prop 10 uns.
systems o care. All o the department’s work is done in partnership with other city departments, specicallythe Department o Public Health (DPH), the Department o Children, Youth and eir Families (DCYF)and the Human Services Agency (HSA). In addition to unding services, First 5 invests in proessionaldevelopment, capacity building and the adoption o evidenced-based practices and standards or the earlychildhood, amily support and health workorce. All First 5 unded programs adhere to an evaluationramework that includes logic models and perormance measures.

8/9/2019 Mayor's Proposed 2010-11 May Budget
http://slidepdf.com/reader/full/mayors-proposed-2010-11-may-budget 42/107
20 Mayor’s Proposed Budget 2010-11
Children & Families Commission
E x e c u t i v e
C h i l r e n & f a m i l i e s C o m m i s s i o n
G r a n t s a n P r o g r a m
M a n a g e m e n t
P r e s c h o o l o r A l l
A m i n i s t r a t i o n
8/9/2019 Mayor's Proposed 2010-11 May Budget
http://slidepdf.com/reader/full/mayors-proposed-2010-11-may-budget 43/107
Department Budgets > Children & Families Commission 21
Total Budget – Historical Comparison2008-2009 2009-2010 2010-2011
ActualOriginal
Budget
Proposed
Budget
Chg from
2009-2010
% Chg from
2009-2010
AUTHORIZED POSITIONS
Total Authorized 16.00 16.00 16.33 0.33 2%
Net Operating Positions 16.00 16.00 16.33 0.33 2%
SOURCES
Use of Money or Property 657,652 710,250 402,000 (308,250) (43%)
Intergovernmental Revenue - State 8,758,162 8,134,928 7,459,174 (675,754) (8%)
Expenditure Recovery 879,174 7,765,522 6,913,311 (852,211) (11%)
General Fund Support 11,250,000 15,000,000 14,540,000 (460,000) (3%)
Sources Total 21,544,988 31,610,700 29,314,485 (2,296,215) (7%)
USES - OPERATING EXPENDITURES
Salaries & Wages 1,056,336 1,167,408 1,167,399 (9) 0%
Fringe Benefits 384,139 538,438 606,401 67,963 13%
Professional & Contractual Services 811,331 975,311 664,393 (310,918) (32%)
Aid Assistance / Grants 11,970,638 20,953,674 20,609,917 (343,757) (2%)
Materials & Supplies 39,973 109,315 56,394 (52,921) (48%)
Services of Other Departments 7,282,571 7,866,554 6,209,981 (1,656,573) (21%)
Uses - Operating Expenditures Total 21,544,988 31,610,700 29,314,485 (2,296,215) (7%)
USES BY PROGRAM RECAP
Children And Families Fund 9,544,732 14,943,075 13,230,311 (1,712,764) (11%)
Public Ed Fund - Prop H ( March 2004 ) 12,000,256 16,667,625 16,084,174 (583,451) (4%)
Uses by Program Recap Total 21,544,988 31,610,700 29,314,485 (2,296,215) (7%)

8/9/2019 Mayor's Proposed 2010-11 May Budget
http://slidepdf.com/reader/full/mayors-proposed-2010-11-may-budget 44/107
22 Mayor’s Proposed Budget 2010-11
Performance Measures
2 0 0 8 - 2 0 0 9
A c t u a l
2 0 0 9 - 2 0 1 0
T a r g e t
2 0 0 9 - 2 0 1 0
P r o j e c t e d
2 0 1
0 - 2 0 1 1
T
a r g e t
C H I L D R E N A N D F A M I L I E S F U N D
P r o v i d e h i g h q u a l i t y c h i l d c a r e f
o r S a n F r a n c i s c o ' s c h i l d r e n
N u m b e r o f e a r l y c h i l d h o o d w o r k e r s w h o p a r t i c i p a t e i n q u a l i t y a n d
c u l t u r a l l y a p p r o p r i a t e t r a i n i n g a n d / o r e a r n c o l l e g e c r e d i t i n u n i t -
b e a r i n g c o u r s e s o r c l a s s e s .
1 , 1 5 9
1 , 0
0 0
9 5 0
9 5 0
P e r c e n t o f l i c e n s e d c h i l d c a r e c e n t e r s t h a t h a v e a c u r r e n t q u a l i t y
a s s e s s m e n t
5 7 %
6 3 %
5 3 %
3 8 %
P U B L I C E D U C A T I O N F U N D - P R O P H
I n c r e a s e a c c e s s t o h i g h q u a l i t y p
r e s c h o o l
N u m b e r o f f o u r - y e a r o l d s e n r o
l l e d i n P r e s c h o o l F o r A l l ( P F A )
p r o g r a m
2 , 3 8 7
3 , 0
0 0
2 , 8 0 0
3 , 1 0 0
I m p r o v e q u a l i t y o f p r e s c h o o l s e
r v i c e s
N u m b e r o f c h i l d r e n s c r e e n e d f
o r s p e c i a l n e e d s
1 , 7 9 0
2 , 2
5 0
2 , 1 0 0
2 , 3 2 5
N u m b e r o f n e w c l a s s r o o m s a s s
e s s e d t h r o u g h t h e G a t e w a y t o
Q u a l i t y P r o j e c t f o r P r e s c h o o l f o
r A l l
2 9
2 2
2 0
5
P r o v i d e p r e s c h o o l s i t e s w i t h e n h a n c e m e n t s t o i m p r o v e c h i l d r e n ' s r e a d i
n e s s f o r s c h o o l
N u m b e r o f c l a s s r o o m s p a r t i c i p
a t i n g i n a r t s i n i t i a t i v e
1 3 6
1
5 4
1 4 3
1 4 3
N u m b e r o f c l a s s r o o m s p a r t i c i p
a t i n g i n s c i e n c e i n i t i a t i v e
1 6 4
1
6 3
1 4 3
1 4 3
I n c r e a s e p r e s c h o o l w o r k f o r c e d
e v e l o p m e n t o p p o r t u n i t i e s
N u m b e r o f P r e s c h o o l F o r A l l ( P
F A ) s t a f f p a r t i c i p a t i n g i n P F A
p r o f e s s i o n a l d e v e l o p m e n t a c t i v
i t i e s
5 3 9
4
5 0
5 0 0
6 0 0

8/9/2019 Mayor's Proposed 2010-11 May Budget
http://slidepdf.com/reader/full/mayors-proposed-2010-11-may-budget 45/107
Child Support Services 23
Child Support Services
MissionTo empower parents to provide economic and medical support or their children,
thereby contributing to the well-being o amilies and children.
Servicese San Francisco Department o Child Support Services (CSS) provides the ollowing services:
hild Support Program puts the security o children above all else, based on the legal duty o both parentsto provide nancial support or their child. e Child Support Program services include:
• Locating parents and establishing paternity.
• Requesting and modiying child and medical support orders through the court.
• Establishing and enorcing child support orders.
• Outreach to the local community to increase knowledge and understanding o the child support program.
Technical Assistance and Programmatic Support to the State Department o Child Support Servicesand numerous local child support agencies o various counties. Services include:
• Providing on-going education, training and technical support regarding changes to the case managementsotware application.
• Providing analysis, design and testing changes needed or the case management application as mandatedby state and ederal law.
• Providing technical expertise regarding the Child Support Enorcement automated system and technicalguidance or the development o training materials and the testing o new system unctionality.
For more inormation, call (415) 356-2700 or 311; or visit www.sgov.org/DCSS
Budget Data Summary2008-2009
Actual
2009-2010
Budget
2010-2011
Proposed
Change from
2009-2010
% Changed from
2009-2010
Total Expenditures 14,477,632 15,019,609 14,492,158 (527,451) (4%)
Total FTE 123.35 116.70 113.57 (3.13) (3%)

8/9/2019 Mayor's Proposed 2010-11 May Budget
http://slidepdf.com/reader/full/mayors-proposed-2010-11-may-budget 46/107
24 Mayor’s Proposed Budget 2010-11
Budget Issues and Detailsis year, in anticipation o declining state revenue, the Department o Child Support Services (CSS)is reducing its operating budget by 4%. To balance their budget, CSS eliminated 6 vacant positions toreduce increased salary and benet costs. In Fiscal Year 2010-11, CSS will continue to reduce programoverhead costs while maintaining direct services. e Department engaged in proactive planning, includingrenegotiating pricing o proessional services and reducing use o materials, supplies and discretionary workorders. e Department’s administrative salary and ringe costs continue to be less than 10 percent o thetotal operating budget.
Increasing lients’ Knowledge and Understanding o Their ightsIn order to decrease barriers to program participation, the Department is aware o the important role thatcustomer service plays in enhancing program awareness and accessibility. e Department has a strongcommitment to providing high quality services that will not diminish in the ace o limited resources.rough the Enhanced Parental Involvement Collaborative (EPIC), the Compromise o Arrears Program(COAP), and through improved complaint resolution initiatives, clients will be better inormed o their rightsand responsibilities and will receive individual assessments that can lead to debt resolution.
Increasing Opportunities or Parents to Provide Better Support
In January, 2010, the San Francisco Department o Child Support Services (CSS) in partnership with eMayor’s Oce o Workorce Development and the Goodwill One Stop Career Link Center at 1500 MissionStreet, launched a pilot program, the Job Support Program. Job Support was developed to assist unemployedcustodial and noncustodial parents with child support cases to obtain hands-on and tailored assistance innding employment in this dicult economy.
Although still in its early stages, the Job Support Program has already shown signs o success. ere arecurrently over 36 active participants in the program and many more signing with up an average o 16new parents monthly. At least 5 participants have ound ulltime employment. In April, the Departmentexpanded its orientations and administrative review hearings to the Civic Center One Stop Career LinkCenter, with urther expansions scheduled in May at the Western Addition Center, in June at the SoutheastCenter, in July at the Mission Center and in August at the Visitation Valley Center.
Increasing Outreach to Incarcerated and eleased ParentsIn March 2008, CSS and the Sherif ’s Department met to restructure their partnership. As o April 2008, achild support attorney, caseworker, and outreach specialist team spends a ull day in one o ve jails everyweek to identiy absent parents, assist them in addressing child support issues and educate them aboutthe child support program. As o March, 2010 incarcerated parents have avoided over $4.4 million dollarsin interest accrued on welare arrears. In Fiscal Year 2010-11, the program will be expanded to includeoutreach to those parents transitioning rom incarceration, providing them with individual case support,reerrals to workorce development programs, and assistance with debt reduction. is expansion will leadto the re-introduction o child support through realistic orders providing a reliable source o income orchildren.
Increasing Efciencies through Improved ollaboration with the SanFrancisco Unifed Family ourte San Francisco Department o Child Support Services (CSS), with the assistance o the CaliorniaDepartment o Child Support Services and in partnership with the San Francisco Unied Family Courtwill be implementing the electronic ling o a number o the Department’s legal documents. e plannedimplementation date is August 8, 2010. By implementing E-Filing, it is estimated that over 1,500 legaldocuments will be led electronically per month.
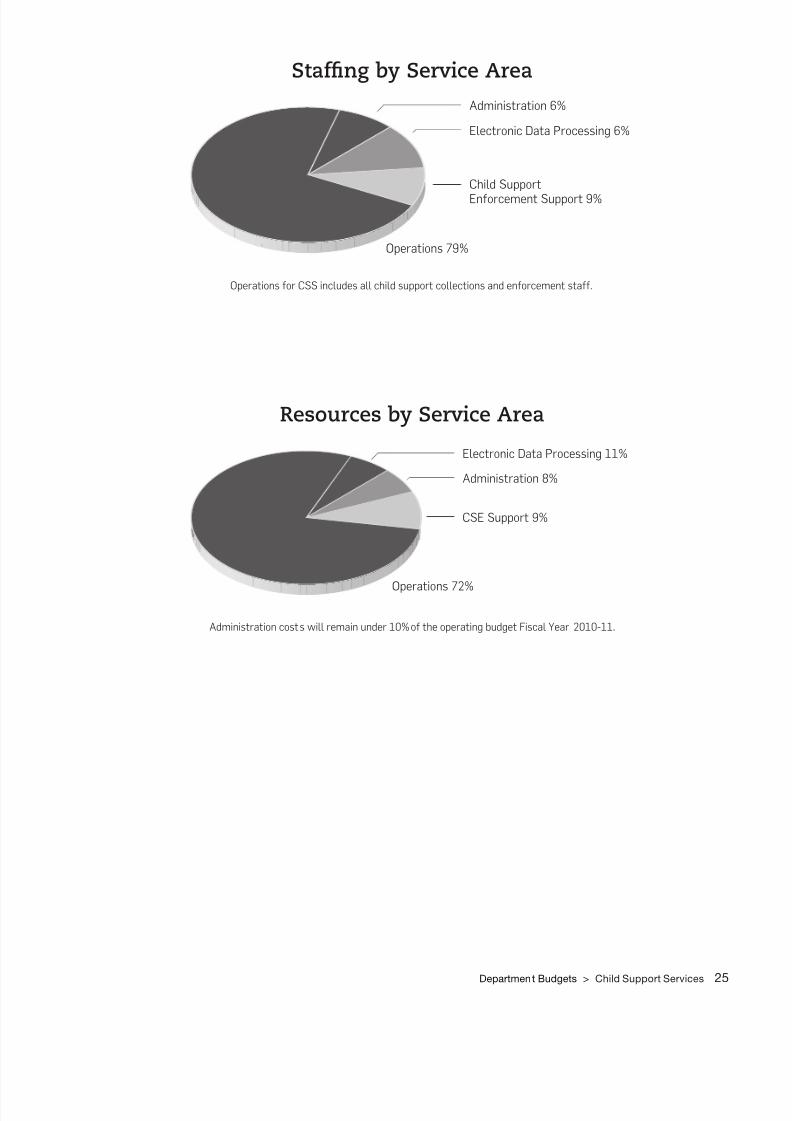
8/9/2019 Mayor's Proposed 2010-11 May Budget
http://slidepdf.com/reader/full/mayors-proposed-2010-11-may-budget 47/107
Department Budgets > Child Support Services 25
Child Support
Enforcement Support 9%
Electronic Data Processing 6%
Administration 6%
Operations 79%
CSE Support 9%
Administration 8%
Electronic Data Processing 11%
Operations 72%
Stafng by Service Area
Resources by Service Area
Operations or CSS inclues all chil support collections an enorcement sta.
Aministration costs will remain uner 10% o the operating buget fiscal Year 2010-11.
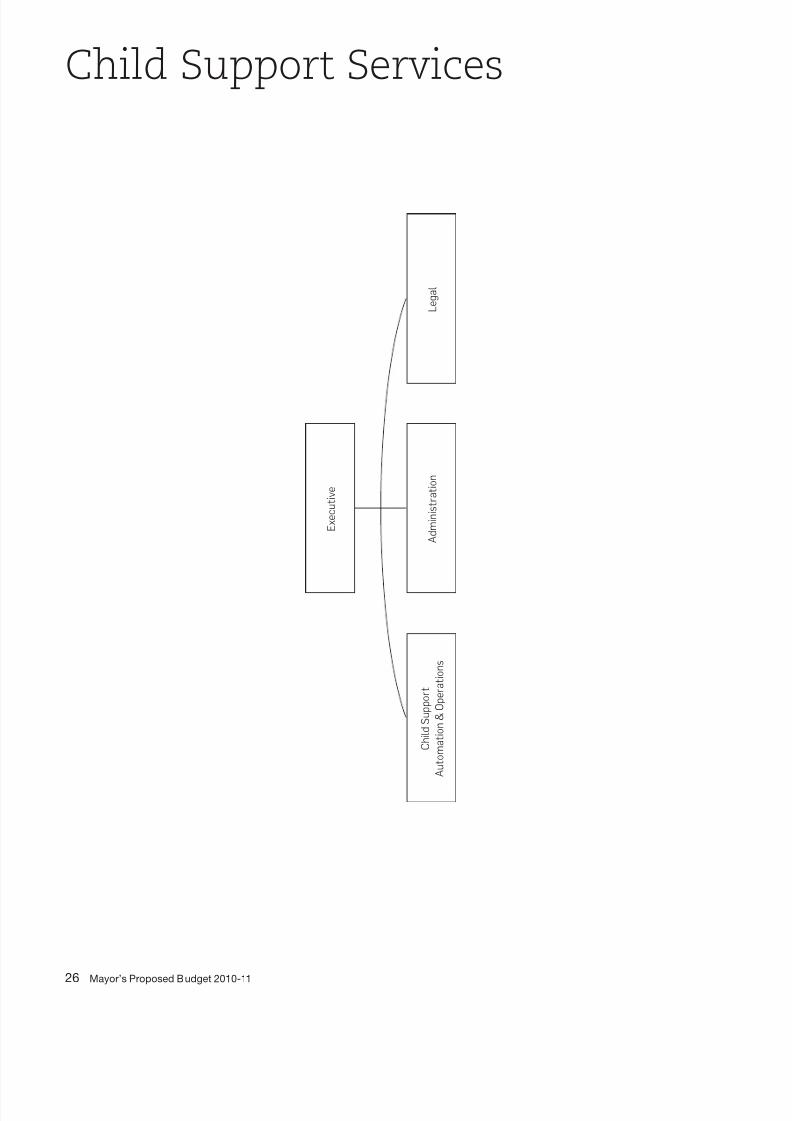
8/9/2019 Mayor's Proposed 2010-11 May Budget
http://slidepdf.com/reader/full/mayors-proposed-2010-11-may-budget 48/107
26 Mayor’s Proposed Budget 2010-11
Child Support Services
E x e c u t i v e
C h i l S u p p o r t
A u t o m a t i o n & O p e r a t i o n s
A m i n i s t r a t i o n
L e g a l

8/9/2019 Mayor's Proposed 2010-11 May Budget
http://slidepdf.com/reader/full/mayors-proposed-2010-11-may-budget 49/107
Department Budgets > Child Support Services 27
Total Budget – Historical Comparison2008-2009 2009-2010 2010-2011
ActualOriginal
Budget
Proposed
Budget
Chg from
2009-2010
% Chg from
2009-2010
AUTHORIZED POSITIONS
Total Authorized 123.35 116.70 113.57 (3.13) (3%)
Net Operating Positions 123.35 116.70 113.57 (3.13) (3%)
SOURCES
Intergovernmental Revenue - Federal 9,642,750 9,903,702 9,565,119 (338,583) (3%)
Intergovernmental Revenue - State 4,803,397 5,101,907 4,920,539 (181,368) (4%)
Charges for Services 6,485 6,500 6,500 0 0
Expenditure Recovery 25,000 7,500 0 (7,500) (100%)
Sources Total 14,477,632 15,019,609 14,492,158 (527,451) (4%)
USES - OPERATING EXPENDITURES
Salaries & Wages 8,570,612 8,559,902 8,360,898 (199,004) (2%)
Fringe Benefits 3,556,503 3,740,573 4,040,468 299,895 8%
Professional & Contractual Services 1,269,388 1,399,271 973,952 (425,319) (30%)
Materials & Supplies 175,250 265,374 166,500 (98,874) (37%)
Services of Other Departments 905,879 1,054,489 950,340 (104,149) (10%)
Uses - Operating Expenditures Total 14,477,632 15,019,609 14,492,158 (527,451) (4%)
USES BY PROGRAM RECAP
Child Support Services Program 14,477,632 15,019,609 14,492,158 (527,451) (4%)
Uses by Program Recap Total 14,477,632 15,019,609 14,492,158 (527,451) (4%)

8/9/2019 Mayor's Proposed 2010-11 May Budget
http://slidepdf.com/reader/full/mayors-proposed-2010-11-may-budget 50/107

8/9/2019 Mayor's Proposed 2010-11 May Budget
http://slidepdf.com/reader/full/mayors-proposed-2010-11-may-budget 51/107
Law Library 29
Law Library
MissionTo provide access to legal inormation materials to the public, elected ocials,
members o the judiciary and the bar.
Servicese Law Library (LLB) provides the ollowing services:
Provides omprehensive egal Inormation Services or all San Franciscans. Reerence assistanceand services are essential components in the provision o legal inormation. Attorney and non-attorney
patrons require staf assistance to navigate the law and nd the inormation and resources they need;however, non-lawyers require more in-depth assistance because they are not amiliar with the legal process.Electronic resources require particular support rom library proessionals to instruct, train and guide patronsin the use o these complex tools. Reerence services supporting the Department’s primary ocus includeorientations or the use o legal resources, bibliographies, pathnders, and one-on-one assistance, which isprovided via phone, email, Internet and in-person.
Maintains Access to urrent egal Materials or aw ibrary patrons. e Department continues tomaintain a comprehensive collection o legal resources which includes current and archived state, local andederal laws, ordinances, regulations and cases; legal and court orms; sel-help materials; legal treatises, texts,encyclopedias and practice manuals; legal periodicals; electronic and Internet legal databases; and aids andreerence tools or nding legal inormation.
Maintains urrent ollections with the technical services staf processing, cataloging and updatingincoming materials daily to ensure their availability and accuracy in the Law Library’s database system.Specialized library sotware systems are maintained and regularly enhanced to support accurate and ecientlibrary data and programs.
etains Archival egal Materials o cases, precedents, laws and regulations. It is essential that the LawLibrary maintain comprehensive archives o the essential portions o its collection.
For more inormation, call (415) 554-6821 or 311; or visit www.sawlibrary.com
Budget Data Summary2008-2009
Actual
2009-2010
Budget
2010-2011
Proposed
Change from
2009-2010
% Changed from
2009-2010
Total Expenditures 488,515 705,954 734,438 28,484 4%
Total FTE 3.00 3.00 3.00 0.00 --
e Law Library proposes a $734,438 budget or Fiscal Year 2010-11. is represents a our percentincrease rom the Fiscal Year 2009-10 budget. e Department anticipates no changes in stang levels. eexpenditure increases are primarily due to increases in employee benets costs and rent.

8/9/2019 Mayor's Proposed 2010-11 May Budget
http://slidepdf.com/reader/full/mayors-proposed-2010-11-may-budget 52/107
30 Mayor’s Proposed Budget 2010-11
Budget Issues and Detailse Law Library operates at three locations including the Main Law Library at Civic Center, the downtownbranch library and the courthouse branch. e CCSF appropriation primarily unds rent or the Main LawLibrary, utilities, and three positions. A portion o civil court ling ees unds all other operating expenses.e downtown branch provides evening and weekend services, while the courthouse branch library haslimited materials and services. In Fiscal Year 2010-11, the Law Library expects an increase in rent at its CivicCenter location. In addition to providing the existing services or the next scal year, the Law Library will alsoprovide new and enhanced services.
e Law Library is unded mainly by civil court ling ees, but there have been no rate increases the pastseveral years, and ee revenue has declined 17% in Fiscal Year 2009-2010. e Department must nonethelesscontinue to provide up-to-date legal inormation and reerence services concerning ederal, state andlocal laws to its customers who include the general public, attorneys, the judiciary, elected ocials, Citydepartments, state, local and ederal agencies, nonprots, legal services organizations, the Courts, small andlarge businesses, corporations, law rms and students. Approximately hal o those served are members o the general public who do not have a legal background, training, or an attorney to represent them. Because o the rules governing it, the Law Library provides ree access to legal inormation to all users.
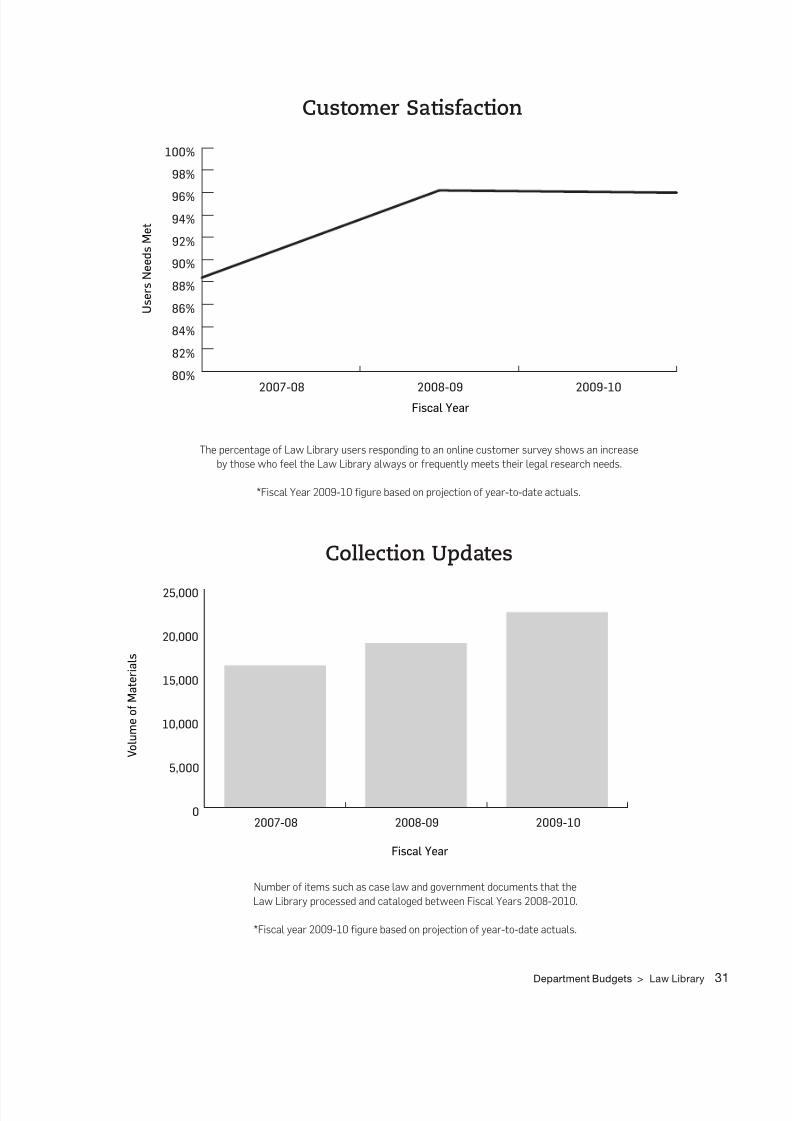
8/9/2019 Mayor's Proposed 2010-11 May Budget
http://slidepdf.com/reader/full/mayors-proposed-2010-11-may-budget 53/107
Department Budgets > Law Library 31
Customer Satisfaction
Collection Updates
he percentage o Law Library users responing to an online customer survey shows an increase
by those who eel the Law Library always or requently meets their legal research nees.
*fiscal Year 2009-10 gure base on projection o year-to-ate actuals.
umber o items such as case law an government ocuments that the
Law Library processe an cataloge between fiscal Years 2008-2010.
*fiscal year 2009-10 gure base on projection o year-to-ate actuals.
0
5,000
10,000
15,000
20,000
25,000
2009-102008-092007-08
V o l u m e o f M a t e r i a l s
Fiscal Year
80%
82%
84%
86%
88%
90%
92%
94%
96%
98%
100%
2009-102008-092007-08
U s e r s N e e d s M e t
Fiscal Year
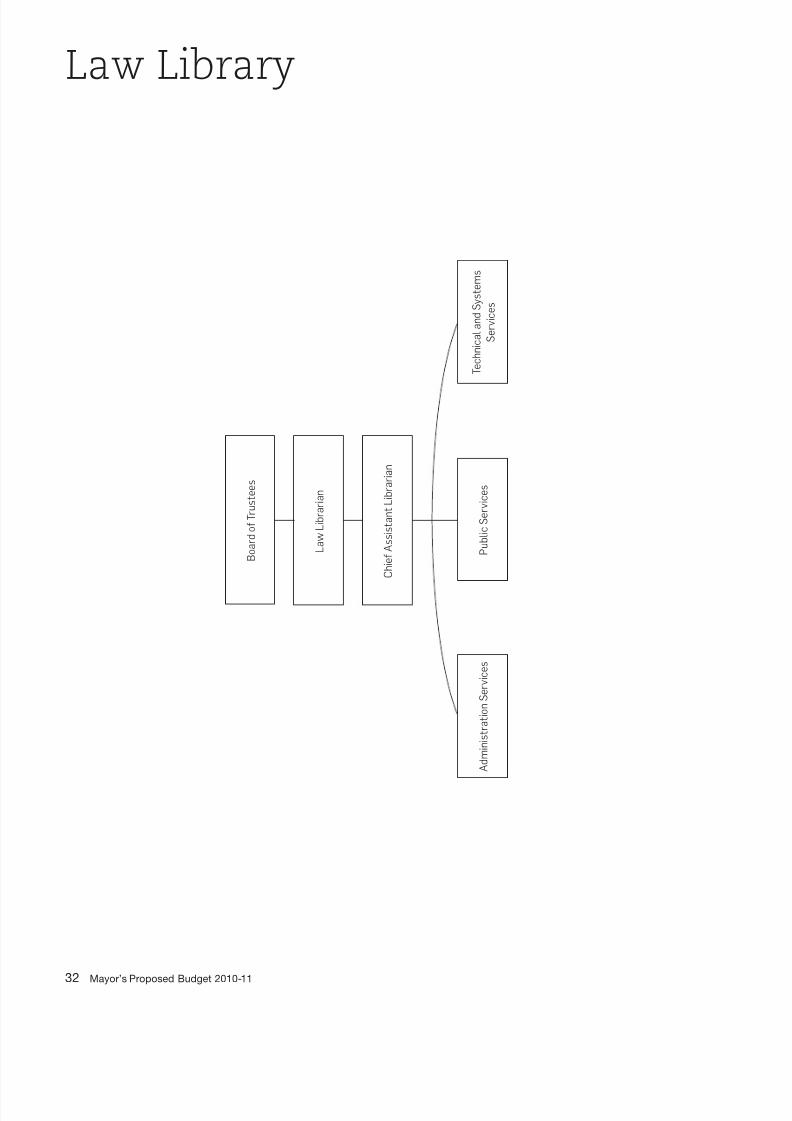
8/9/2019 Mayor's Proposed 2010-11 May Budget
http://slidepdf.com/reader/full/mayors-proposed-2010-11-may-budget 54/107
32 Mayor’s Proposed Budget 2010-11
Law Library
L a w L i b r a r i a n
C h i e A s s i s t a n t L i b r a r i a n
B o a r o r u s t e e s
A m i n i s t r a t i o n S e r v i c e s
P u b l i c S e r v i c e s
e c h n i c a l a n S y s t e m s
S e r v i c e s
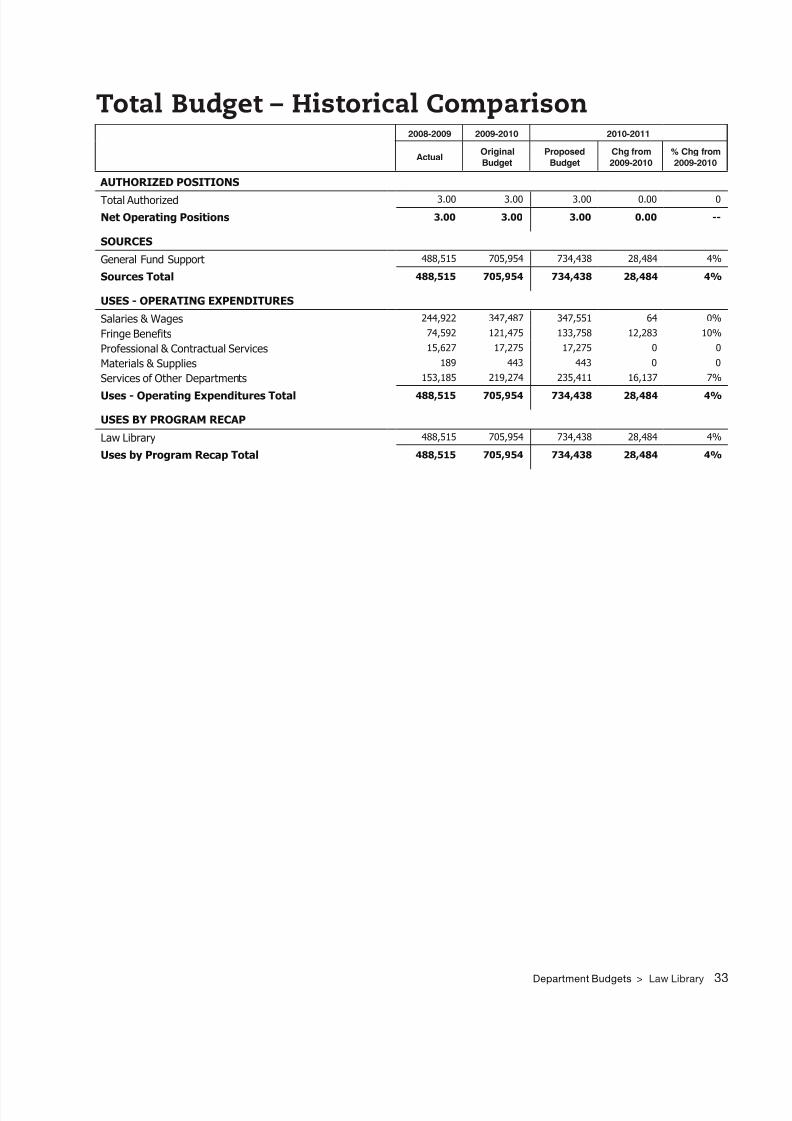
8/9/2019 Mayor's Proposed 2010-11 May Budget
http://slidepdf.com/reader/full/mayors-proposed-2010-11-may-budget 55/107
Department Budgets > Law Library 33
Total Budget – Historical Comparison2008-2009 2009-2010 2010-2011
ActualOriginal
Budget
Proposed
Budget
Chg from
2009-2010
% Chg from
2009-2010
AUTHORIZED POSITIONS
Total Authorized 3.00 3.00 3.00 0.00 0
Net Operating Positions 3.00 3.00 3.00 0.00 --
SOURCES
General Fund Support 488,515 705,954 734,438 28,484 4%
Sources Total 488,515 705,954 734,438 28,484 4%
USES - OPERATING EXPENDITURES
Salaries & Wages 244,922 347,487 347,551 64 0%
Fringe Benefits 74,592 121,475 133,758 12,283 10%
Professional & Contractual Services 15,627 17,275 17,275 0 0
Materials & Supplies 189 443 443 0 0
Services of Other Departments 153,185 219,274 235,411 16,137 7%
Uses - Operating Expenditures Total 488,515 705,954 734,438 28,484 4%
USES BY PROGRAM RECAP
Law Library 488,515 705,954 734,438 28,484 4%
Uses by Program Recap Total 488,515 705,954 734,438 28,484 4%

8/9/2019 Mayor's Proposed 2010-11 May Budget
http://slidepdf.com/reader/full/mayors-proposed-2010-11-may-budget 56/107
34 Mayor’s Proposed Budget 2010-11
Performance Measures
2 0 0 8 - 2 0 0 9
A c t u a l
2 0 0 9 - 2 0 1 0
T a r g e t
2 0 0 9 - 2 0 1 0
P r o j e c t e d
2 0 1
0 - 2 0 1 1
T
a r g e t
L A W
L I B R A R Y
P r o v i d e c o m p r e h e n s i v e a n d r e a
d i l y a c c e s s i b l e l e g a l i n f o r m a t i o n r e s o u r c e s a n d s e r v i c e s
A m o u n t o f i n - l i b
r a r y p u b l i c c o m
p u t e r l e g a l r e s e a r c h u s e a g e ( N e w
M e a s u r e )
n / a
9 , 7
0 0
9 , 7
0 0
9 , 8
5 0

8/9/2019 Mayor's Proposed 2010-11 May Budget
http://slidepdf.com/reader/full/mayors-proposed-2010-11-may-budget 57/107
Municipal Transportation Agency 35
Municipal Transportation Agency
MissionTo provide a sae and ecient surace transportation network or pedestrians,
bicyclists, transit customers, motorists and taxi customers. e Municipal
Transportation Agency (SFMTA) operates the Municipal Railway (Muni) and
manages parking, trac and taxi regulation as well as pedestrian, bicycle and better
streets programs. On a daily basis, the SFMTA endeavors to improve the quality o
lie or residents and visitors alike through implementation o the City’s Transit First
policy.
Servicese SFMTA provides the ollowing services:
Municipal ailway provides trolley bus, motor coach, light rail, cable car, historic streetcar and paratransitservices in the City.
Sustainable Streets enorces all local and state parking laws; issues parking permits; manages publicparking garages and parking meters; installs and maintains trac signals, trac signs and street markings;coordinates sae trac ow at school intersections on high-use transit corridors and in neighborhoods andcommercial districts; and processes and adjudicates all parking citations and tow appeals.
Taxi Services ensures the provision o taxi service to residents o and visitors to San Francisco by enactingand enorcing rules concerning drivers, medallions (permits) and taxi companies.
Accessible Services manages contracted paratransit (door-to-door) service or customers who cannotavail themselves o regular Muni service due to disability as well as assist those customers with disabilitieswho are able to ride Muni services.
Pedestrian and Bicycle Programs are ocused on improving conditions to encourage increased walkingand bicycling to improve saety, ease congestion, reduce emissions, promote personal health and enhance thequality o lie in this world-class city.
For more inormation call 311 or visit www.smta.com
Budget Data Summary2008-2009
Actual
2009-2010
Budget
2010-2011
Proposed
2011-2012
Proposed
Change from
2009-2010
% Change from
2009-2010
Total Expenditures 752,483,163 768,592,202 781,974,297 802,194,234 13,382,095 2%
Total FTE 4,533.85 4,366.56 4,066.83 3,988.36 (299.73) (7%)
8/9/2019 Mayor's Proposed 2010-11 May Budget
http://slidepdf.com/reader/full/mayors-proposed-2010-11-may-budget 58/107
36 Mayor’s Proposed Budget 2010-11
Budget Issues and DetailsPursuant to the Charter, in the spring o 2010 the SFMTA adopted its second, two-year operating budget orFiscal Years 2010-11 and 2011-12. As was the case in the previous year, the agency aced projected decitso $56 million or Fiscal Year 2010-11 and $45 million in Fiscal Year 2011-12, based on estimated increasedcosts and declining revenues driven by the lingering recession in Caliornia and the Bay Area.
While it is assumed that cost reduction initiatives and revenue enhancements approved by the SFMTA Board
to ofset the Fiscal Year 2009-10 operating budget decit will provide some relie in the ensuing two scal years, these measures will not be sucient to eliminate the projected decits. ereore, the proposed budgetor Fiscal Year 2010-11 and 2011-12 includes a number o measures to close the operating budget decitincluding:
• Further reducing work orders
• Imposing cost recovery ees
• Enorcing parking meters on Sundays in certain areas
• Installing more parking meters in certain areas
• Eliminating ree reserved on-street parking spaces and permits
• Enorcing existing garage pricing ordinance by eliminating daily, early bird, monthly and annual rates• Applying parking garage ordinance citywide
• Raising regulatory penalties or taxi violations
• Applying automatic indexing to Muni ares
• Consolidating transit stops
• Reducing service levels
Despite the detrimental efects o the nationwide recession, the SFMTA remains ocused on improvingthe City’s surace transportation network. is includes ongoing programs, pilots and services aimed atprotecting the public’s investment in the City’s transportation system, keeping it in a state o good repair and
making it more convenient while also advancing towards congestion and emissions reduction goals.
State and Federal Fundinge ederal stimulus package enacted by Congress last year provided an initial allocation o $67 million to theSFMTA--the largest transit agency allocation in the region. It is underwriting a dozen “shovel ready” projectsdesigned to update and renew transit vehicles, acilities and vital systems as well as to improve customerconvenience eatures. e SFMTA also is ully poised to compete or urther ederal stimulus unds as theybecome available.
At the same time, the SFMTA joined with transit advocates across Caliornia to advocate or reinstatemento State Transit Assistance unding. e Governor signed these bills in March 2010, resulting in $36 millionin additional revenue in Fiscal Year 2010-11 and $31 million in Fiscal Year 2011-12. e SFMTA lost
approximately $130 million in State Transit Assistance unding between Fiscal Year 2008-09 and Fiscal Year2009-10.
e Agency urther benetted rom an unanticipated $17 million in ederal unds that became available aterthe Federal Transit Administration withdrew unding or the BART Oakland Airport Connector.
Concurrent with these opportunities, the SFMTA has received ederal approval to proceed with nal designo the Central Subway along with a line item in President Barack Obama’s proposed budget which alsoincludes unding to advance the Van Ness Bus Rapid Transit Project.

8/9/2019 Mayor's Proposed 2010-11 May Budget
http://slidepdf.com/reader/full/mayors-proposed-2010-11-may-budget 59/107
Municipal Transportation Agency 37
Improved Transit Shelterse dynamic, new “Wave” transit stop shelters are starting to appear in the City and are ofering customersa new era o comort and technology as they wait or busses or trains. e existing 1,200 shelters are beingreplaced at a rate o 175 per year. Approximately hal o them eature solar power and a push-to-talk eatureto ensure that visually impaired people receive messages generated by the NextMuni displays. e newshelters are unded through an advertising contract and do not rely on the MTA’s operational budget.
SFparkSFpark, the ederally-unded program to optimize parking management, is on track to roll out pilots aroundthe City. is program will use state-o-the-art technology to reduce trac congestion or public transit byguiding motorists to available street parking spaces and municipal garages as quickly and conveniently aspossible. Advanced parking management allows SFpark to monitor parking supply and demand to providedrivers with real-time parking availability and practical inormation about where to park in San Francisco.It will also make payment more convenient through acceptance o credit and smart cards. e pilot projectswill launch in the current scal year and will cover a quarter o the City’s metered spaces and thousands o spaces in parking garages.
SFgoe citywide Intelligent Transportation program, SFgo, will roll out a number o ambitious initiatives.
Two major projects include the Parking Guidance System, which will support SFpark and also broadcasttraveler inormation over diferent media, and an upgrade o the communications inrastructure required toimplement Bus Rapid Transit in the Van Ness corridor.
TaxisProposition E, passed by voters in 1999, created the SFMTA and also gave the Board o Supervisors theoption to transer oversight o the Taxicab Commission to the Agency. As o March 1, 2009, the TaxicabCommission has merged with the SFMTA as the Taxi Services Section. e SFMTA Board now has theauthority to regulate the taxi industry and other vehicles or hire in San Francisco. is merger completesthe integration o surace transportation management that will enable the SFMTA to urther promoteTransit First in San Francisco and to improve Muni’s on-time perormance. e SFMTA this year alreadyhas approved a Taxi Medallion Sales pilot project that will change the way some Taxi Medallions are sold,marking the rst step to reorm in this area ater decades o debate.
Pedestrian SaetyProjects alling under the pedestrian program ocus on increased pedestrian saety, accessibility andconvenience. Following public review and input, the Golden Gate Park Pedestrian Improvement Studywas approved by the Concourse Authority and Recreation and Park Commission. e study provides aramework or pedestrian access and circulation improvements in the park or the next several years. eBetter Streets Plan is expected to be approved by the Board o Supervisors in the spring o 2010 and willprovide a comprehensive blueprint or greater saety and enjoyment o the City’s streetscapes.
Making San Francisco More Bicycle Friendly
e SFMTA continues to aggressively pursue the Mayor’s goal o having bicycles account or 10 percent o all trips in the City. In 2009 the injunction which had delayed implementation o the Bike Plan or three yearswas partially lited, allowing or a number o bicycle projects to commence, including new bike lanes. It isanticipated that the entire injunction will be lited by summer 2010, spurring another wave o improvementprojects, including an innovative bicycle sharing program that has been successul in a number o Europeanand American cities.

8/9/2019 Mayor's Proposed 2010-11 May Budget
http://slidepdf.com/reader/full/mayors-proposed-2010-11-may-budget 60/107
38 Mayor’s Proposed Budget 2010-11
0
10
20
30
40
50
60
70
80
2009-102008-092007-082006-072005-062004-052003-042002-03
Percentage of Muni Vehicles MeetingOn-Time Standards
Motor Coach 42%
Electric Trolley Coach 32%
Cable Car 4%
Light Rail 22%
Muni Passengers by Service Type
Each year, Muni carries over 200 million passengers–over hal a million per ay. Seventy-ve
percent o passengers use the electric an motor buses that make up the bulk o the network. Just
a hanul o light rail lines account or one th o total riership.
On-time perormance or Muni vehicles is projecte to excee 70 percent or the thir year in a row.
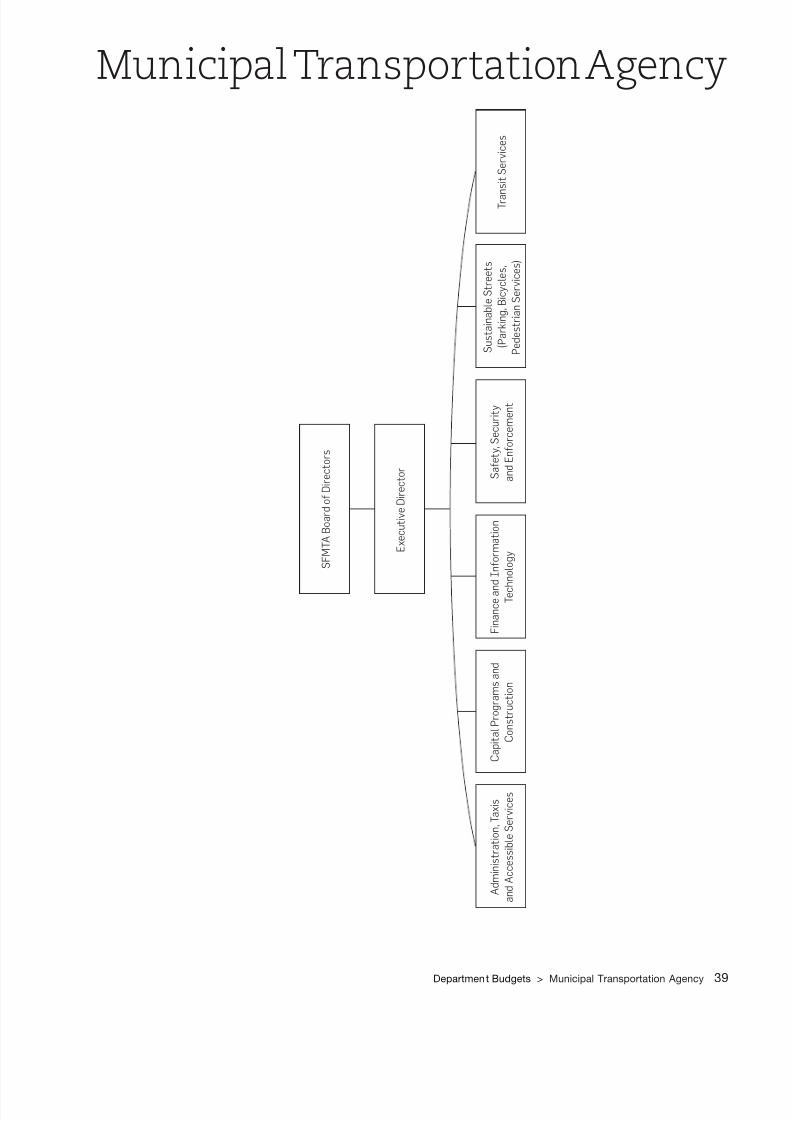
8/9/2019 Mayor's Proposed 2010-11 May Budget
http://slidepdf.com/reader/full/mayors-proposed-2010-11-may-budget 61/107
Department Budgets > Municipal Transportation Agency 39
Municipal Transportation Agency
E x e c u t i v e d i r e c t o r
S f M A B o a r o d i r e c t o r s
A m i n i s t r a t i o n , a x i s
a n A c c e s s i b l e S e r v i c e s
C a p i t a l P r o g r a m s a n
C o n s t r u c t i o n
S a e t y , S e c u r i t y
a n E n o r c e m e n t
f i n a n c e a n
n o r m a t i o n
e c h n o l o g y
S u s t a i n a b l e S t r e e t s
( P a r k i n g , B
i c y c l e s ,
P e e s t r i a n S e r v i c e s )
r a n s i t S e r v i c e s
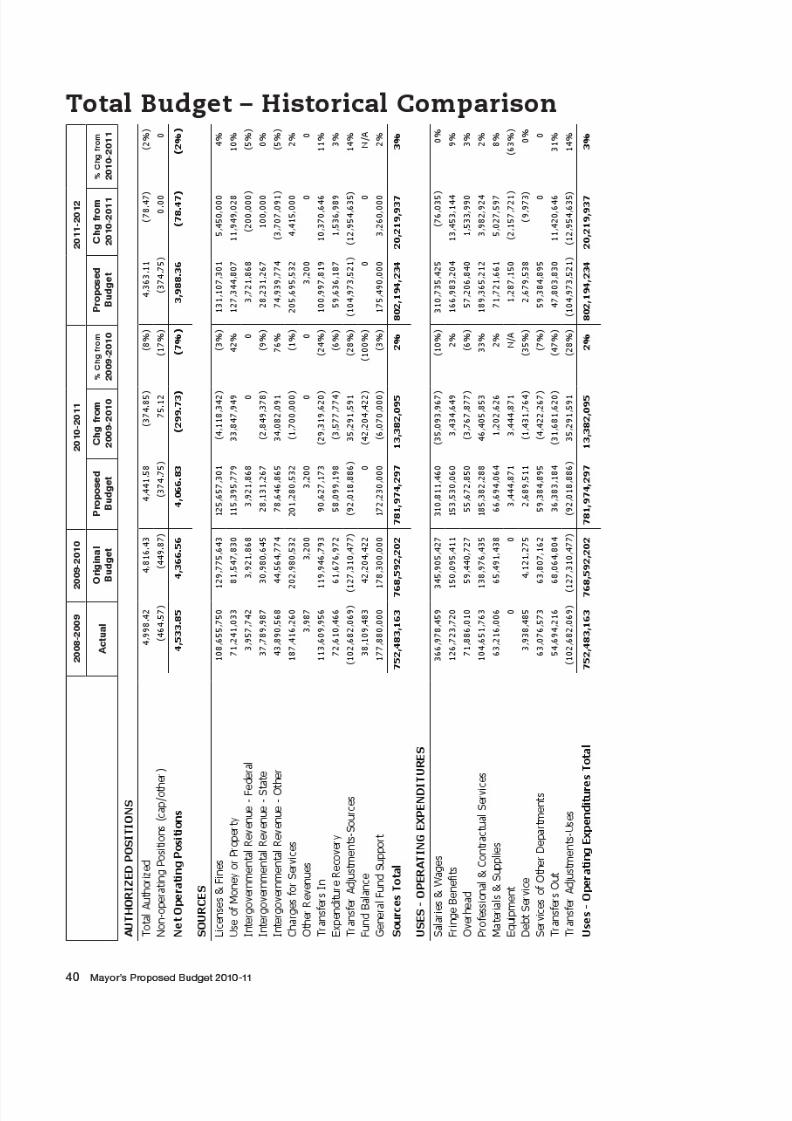
8/9/2019 Mayor's Proposed 2010-11 May Budget
http://slidepdf.com/reader/full/mayors-proposed-2010-11-may-budget 62/107
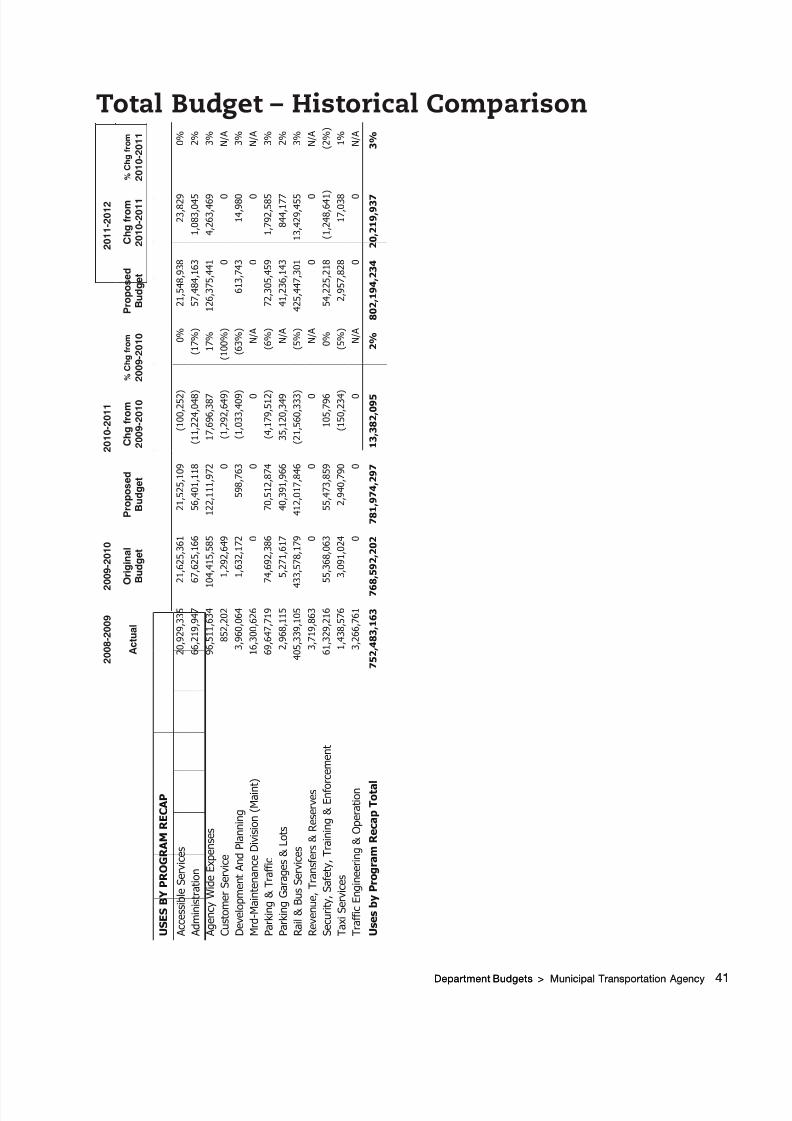
8/9/2019 Mayor's Proposed 2010-11 May Budget
http://slidepdf.com/reader/full/mayors-proposed-2010-11-may-budget 63/107
Department Budgets > Municipal Transportation Agency 41Department Budgets > Municipal Transportation Agency 41
Total Budget – Historical Comparison
2 0 0 8 - 2 0 0 9
2
0 0 9 - 2 0 1 0
2 0 1 0 - 2 0 1 1
2 0 1 1 - 2 0 1 2
A c t u a l
O r i g i n a l
B u d g e t
P r o p o s e d
B u d g e t
C h g f r o m
2 0 0 9 - 2 0 1 0
% C
h g f r o m
2 0 0 9 - 2 0 1 0
P r o p o s e d
B u d g e t
C h g f r o m
2 0 1 0 - 2 0 1 1
% C
h g f r o m
2 0 1 0 - 2 0 1 1
U S E S B Y P R O G R A M R E C A P
A c c e s s i b l e S e r v i c e s
2 0 , 9
2 9 , 3
3 5
2 1 , 6
2 5 , 3
6 1
2 1 , 5
2 5 , 1
0 9
( 1 0 0 , 2
5 2 )
0 %
2 1 , 5
4 8 , 9
3 8
2 3 , 8 2 9
0 %
A d m i n i s t r a t i o n
6 6 , 2
1 9 , 9
4 7
6 7 , 6
2 5 , 1
6 6
5 6 , 4
0 1 , 1
1 8
( 1 1 , 2
2 4 , 0
4 8 )
( 1 7 % )
5 7 , 4
8 4 , 1
6 3
1 , 0
8 3 , 0 4 5
2 %
A g e n c y W i d e E x p e n s e s
9 6 , 5
1 1 , 6
3 4
1 0 4 , 4
1 5 , 5
8 5
1 2 2 , 1
1 1 , 9
7 2
1 7 , 6
9 6 , 3
8 7
1 7 %
1 2 6 , 3
7 5 , 4
4 1
4 , 2
6 3 , 4 6 9
3 %
C u s t o m e r S e r v i c e
8 5 2 , 2
0 2
1 , 2
9 2 , 6
4 9
0
( 1 , 2
9 2 , 6
4 9 )
( 1 0 0 % )
0
0
N / A
D e v e l o p m e n t A n d P l a n n i n g
3 , 9
6 0 , 0
6 4
1 , 6
3 2 , 1
7 2
5 9 8 , 7
6 3
( 1 , 0
3 3 , 4
0 9 )
( 6 3 % )
6 1 3 , 7
4 3
1 4 , 9 8 0
3 %
M r d - M a i n t e n a n c e D i v i s i o n ( M a i n t
)
1 6 , 3
0 0 , 6
2 6
0
0
0
N / A
0
0
N / A
P a r k i n g & T r a f f i c
6 9 , 6
4 7 , 7
1 9
7 4 , 6
9 2 , 3
8 6
7 0 , 5
1 2 , 8
7 4
( 4 , 1
7 9 , 5
1 2 )
( 6 % )
7 2 , 3
0 5 , 4
5 9
1 , 7
9 2 , 5 8 5
3 %
P a r k i n g G a r a g e s & L o t s
2 , 9
6 8 , 1
1 5
5 , 2
7 1 , 6
1 7
4 0 , 3
9 1 , 9
6 6
3 5 , 1
2 0 , 3
4 9
N / A
4 1 , 2
3 6 , 1
4 3
8 4 4 , 1 7 7
2 %
R a i l & B u s S e r v i c e s
4 0 5 , 3
3 9 , 1
0 5
4 3 3 , 5
7 8 , 1
7 9
4 1 2 , 0
1 7 , 8
4 6
( 2 1 , 5
6 0 , 3
3 3 )
( 5 % )
4 2 5 , 4
4 7 , 3
0 1
1 3 , 4
2 9 , 4 5 5
3 %
R e v e n u e ,
T r a n s f e r s & R e s e r v e s
3 , 7
1 9 , 8
6 3
0
0
0
N / A
0
0
N / A
S e c u r i t y ,
S a f e t y ,
T r a i n i n g & E n f o r c e m e n t
6 1 , 3
2 9 , 2
1 6
5 5 , 3
6 8 , 0
6 3
5 5 , 4
7 3 , 8
5 9
1 0 5 , 7
9 6
0 %
5 4 , 2
2 5 , 2
1 8
( 1 , 2
4 8 , 6 4 1
)
( 2 % )
T a x i S e r v i c e s
1 , 4
3 8 , 5
7 6
3 , 0
9 1 , 0
2 4
2 , 9
4 0 , 7
9 0
( 1 5 0 , 2
3 4 )
( 5 % )
2 , 9
5 7 , 8
2 8
1 7 , 0 3 8
1 %
T r a f f i c E n g i n e e r i n g & O p e r a t i o n
3 , 2
6 6 , 7
6 1
0
0
0
N / A
0
0
N / A
U s e s b y P r o g r a m R e c a p T o t a l
7 5 2 , 4 8 3 , 1 6 3
7 6
8 , 5 9 2 , 2 0 2
7 8 1 , 9 7 4 , 2 9 7
1 3 , 3 8 2 , 0 9 5
2 %
8 0 2 , 1 9 4 , 2 3 4
2 0 , 2 1 9 , 9 3 7
3 %

8/9/2019 Mayor's Proposed 2010-11 May Budget
http://slidepdf.com/reader/full/mayors-proposed-2010-11-may-budget 64/107
42 Mayor’s Proposed Budget 2010-11
Performance Measures
2 0 0 8 - 2 0 0 9
A c t u a l
2 0 0 9 - 2 0 1 0
T a r g e t
2 0 0 9 - 2 0 1 0
P r o j e c t e d
2 0 1
0 - 2 0 1 1
T
a r g e t
E N F O R C E M E N T
T o e a s e t r a f f i c c o n g e s t i o n a n d p r o m o t e p a r k i n g t u r n o v e r t h r o u
g h o u t t h e C i t y b y e n f o r c i n g r e g u l a t
i o n s
A b a n d o n e d a u t o m o b i l e r e p
o r t s : % r e s p o n d e d t o w i t h i n 4 8 h o u r s
9 9 %
1 0 0 %
9 8 %
1 0 0 %
T o p r o c e s s c i t a t i o n s a n d h e a
r i n g s i n a t i m e l y m a n n e r
W a l k - i n c i t a t i o n a n d r e s i d e n t i a l p a r k i n g p e r m i t c u s t o m e r s : %
s e r v e d w i t h i n 2 0 m i n u t e s ( F Y 0 9 : 1 5 m i n u t e s )
7 9 %
8 2 %
6 0 %
8 2 %
M R D - M U N I C I P A L R A I L W A
Y E X E C O F F I C E ( M R E O )
I m p r o v e t h e s a f e t y o f p a s s e n g e r s , d r i v e r s , p e d e s t r i a n s , a n d o t h e r s
M u n i c o l l i s i o n s p e r 1 0 0 , 0 0 0
v e h i c l e m i l e s
5 . 4 6
5 . 9 0
5 . 8 5
5 . 0 2
P A R K I N G
T o p r o v i d e c l e a n , s a f e a n d c
o n v e n i e n t p a r k i n g a t r e a s o n a b l e r a t e s t o m a x i m i z e r e v e n u e s
P a r k i n g m e t e r m a l f u n c t i o n
r e p o r t s : % r e s p o n d e d t o a n d r e p a i r e d
w i t h i n 4 8 h o u r s
8 5 %
8 5 %
8 5 %
8 5 %
R A I L & B U S S E R V I C E S
P r o v i d e r e l i a b l e a n d t i m e l y t r a n s i t s e r v i c e
S c h e d u l e a d h e r e n c e
7 4 . 4 %
8 5 . 0 %
7 3 . 0 %
8 5 . 0 %
% o f s c h e d u l e d s e r v i c e h o u r s d e l i v e r e d
9 6 . 9 %
9 8 . 5 %
9 7 . 0 %
9 8 . 5 %
I m p r o v e c u s t o m e r s a t i s f a c t i o n
T R A F F I C E N G I N E E R I N G & O P E
R A T I O N
T o p r o m o t e t h e s a f e a n d e f f i c i e n t m o v e m e n t o f p e o p l e a n d g o o d s t h r o u g h o u t t h e C i t y
T r a f f i c a n d p a r k i n g c o n t r o l r e q u
e s t s : % i n v e s t i g a t e d a n d
r e s p o n d e d t o w i t h i n 9 0 d a y s
8 2 %
8 2 %
8 2 %
8 2 %
8 3 %
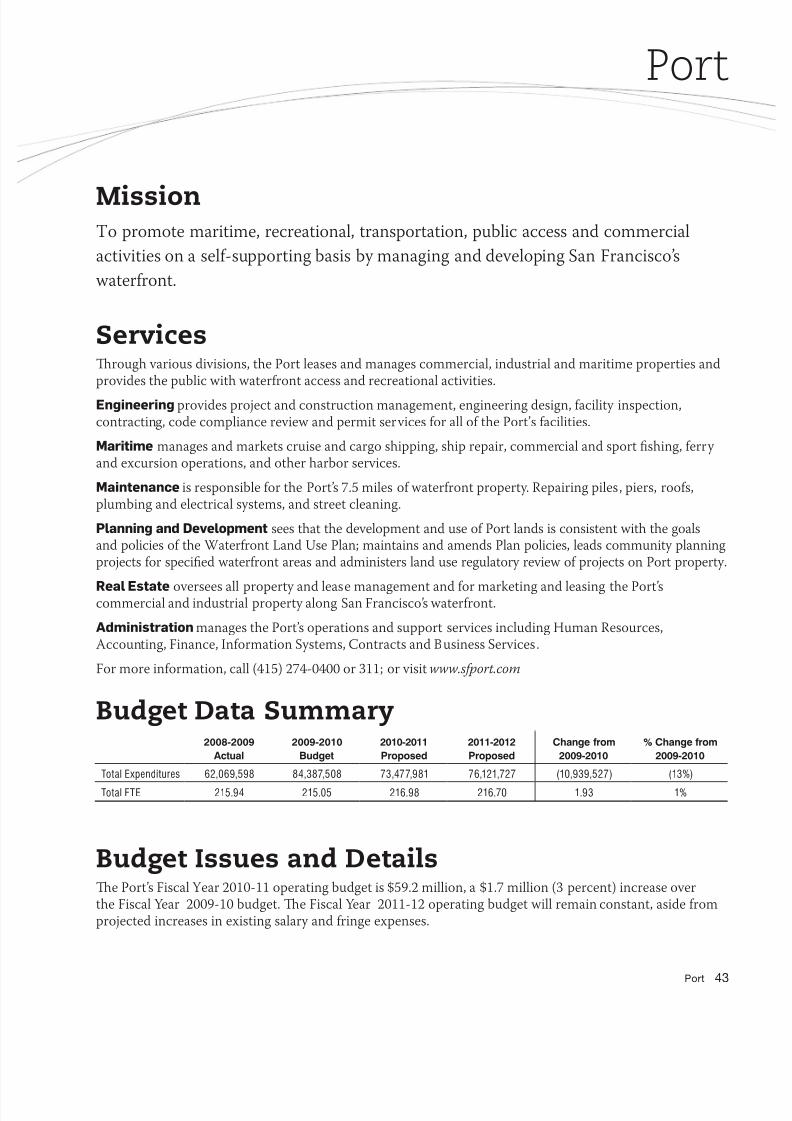
8/9/2019 Mayor's Proposed 2010-11 May Budget
http://slidepdf.com/reader/full/mayors-proposed-2010-11-may-budget 65/107
Port 43
Port
MissionTo promote maritime, recreational, transportation, public access and commercial
activities on a sel-supporting basis by managing and developing San Francisco’s
waterront.
Servicesrough various divisions, the Port leases and manages commercial, industrial and maritime properties andprovides the public with waterront access and recreational activities.
Engineering provides project and construction management, engineering design, acility inspection,contracting, code compliance review and permit services or all o the Port’s acilities.
Maritime manages and markets cruise and cargo shipping, ship repair, commercial and sport shing, erryand excursion operations, and other harbor services.
Maintenance is responsible or the Port’s 7.5 miles o waterront property. Repairing piles, piers, roos,plumbing and electrical systems, and street cleaning.
Planning and Development sees that the development and use o Port lands is consistent with the goalsand policies o the Waterront Land Use Plan; maintains and amends Plan policies, leads community planningprojects or specied waterront areas and administers land use regulatory review o projects on Port property.
eal Estate oversees all property and lease management and or marketing and leasing the Port’scommercial and industrial property along San Francisco’s waterront.
Administration manages the Port’s operations and support services including Human Resources,Accounting, Finance, Inormation Systems, Contracts and Business Services.
For more inormation, call (415) 274-0400 or 311; or visit www.sport.com
Budget Data Summary2008-2009
Actual
2009-2010
Budget
2010-2011
Proposed
2011-2012
Proposed
Change from
2009-2010
% Change from
2009-2010
Total Expenditures 62,069,598 84,387,508 73,477,981 76,121,727 (10,939,527) (13%)
Total FTE 215.94 215.05 216.98 216.70 1.93 1%
Budget Issues and Detailse Port’s Fiscal Year 2010-11 operating budget is $59.2 million, a $1.7 million (3 percent) increase overthe Fiscal Year 2009-10 budget. e Fiscal Year 2011-12 operating budget will remain constant, aside romprojected increases in existing salary and ringe expenses.

8/9/2019 Mayor's Proposed 2010-11 May Budget
http://slidepdf.com/reader/full/mayors-proposed-2010-11-may-budget 66/107
44 Mayor’s Proposed Budget 2010-11
A key ocus o the Port is implementing its $30.4 million capital budget, which is the Port’s largest capitalbudget in over 20 years using newly issued revenue bonds, voter approved park bonds, grant unds, as well asPort revenue. Over the next 10 years, the Port plans to invest $762 million in inrastructure projects along thewaterront.
In accordance with Proposition A, establishing two-year budgets, the Port prepared budgets or FiscalYear 2010-11 and Fiscal Year 2011-12. In the second budget year, the Port’s budgeted revenues increaseby 4 percent, primarily rom an increase in commercial and industrial rent and growth in harbor services
revenue. e operating expense budget will increase by less than 2 percent over the prior year. is increaseis primarily driven by personnel costs, which includes the cost o a new gardener position that was addedto help maintain the newly created public open space built with 2008 Clean and Sae Neighborhood ParksBonds.
Improving the Port’s InrastructureOne o the most challenging issues acing the Port is the condition o its physical inrastructure, much o which is 80 to 100 years old and well past its usable lie. e estimated amount o deerred maintenance port-wide is approximately $2 billion. In response to this need or repairs, the Port has developed a 10-year capitalplan with a multi-year capital nance plan that identies and prioritizes capital projects to complete in thecoming years. In Fiscal Year 2009-10 the Port successully issued $36.65 million in Port o San Francisco
revenue bonds. e sale o the revenue bonds will provide $10 million or the design o a state o the artinternational Cruise Terminal at Pier 27 in Fiscal Year 2010-11. ese unds will also provide unding in thecoming years or projects including: $5 million or urgent repairs to the Port’s current cruise terminal at Pier35; and $8 million or improvements to the Pier 90-94 Backlands, among other projects. e Series 2010Revenue Bonds represent the rst issuance o new-money bonds by the Port since 1984.
Improving Security on the Porte Port is currently designing a Closed Circuit Television (CCTV) and Access Control network, with $2.7million o unding rom the 2007 and 2008 State o Caliornia Port and Maritime Security Grant Program. isproject will consist o CCTV and/or Access Control equipment installation at up to 28 locations throughoutthe Port. It will improve perimeter security and enhance prevention, detection, response to, and recovery romincidents throughout the Port. e system will run on a ber optic backbone that will be installed by the SanFrancisco Department o Technology. e CCTV system will be web-based, utilizing video analytics whereappropriate. It will be accessible to selected Port personnel as well as Port partners such as the San FranciscoPolice Department via designated stations, as well as through the internet. CCTV system video eeds, andAccess Control System sensors, will be monitored on an ongoing basis by the Department o Technology.
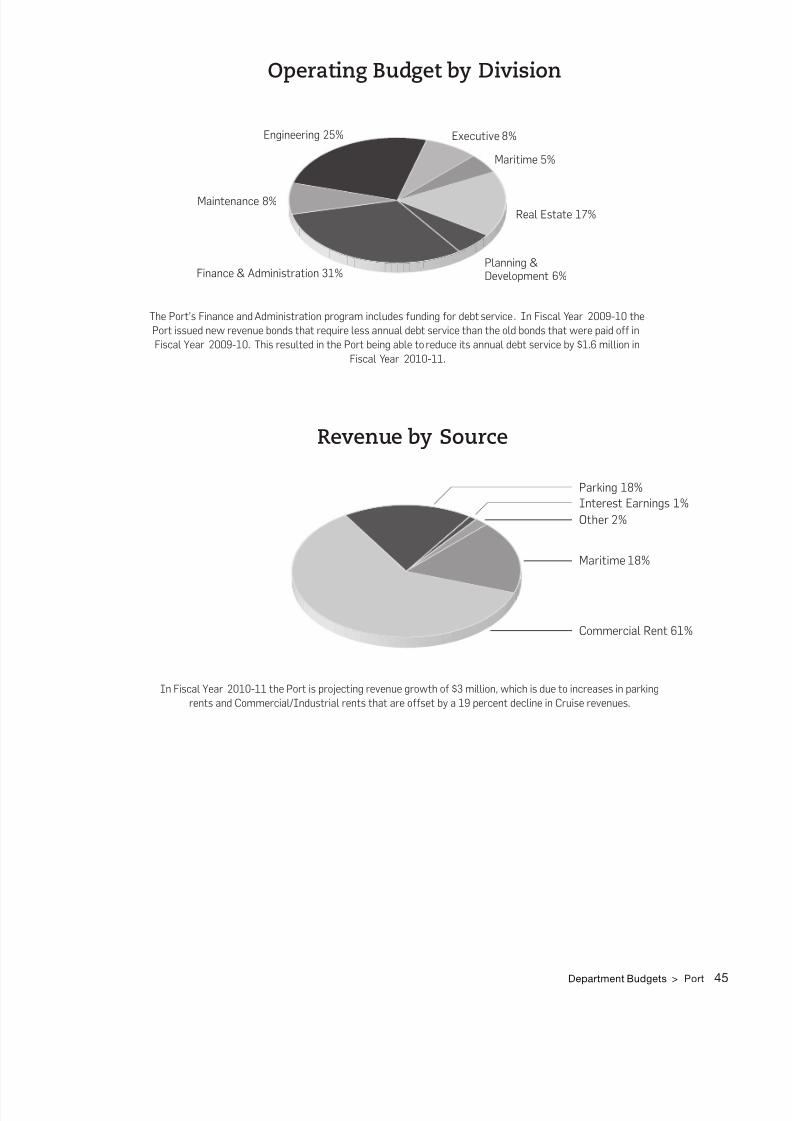
8/9/2019 Mayor's Proposed 2010-11 May Budget
http://slidepdf.com/reader/full/mayors-proposed-2010-11-may-budget 67/107
Department Budgets > Port 45
Operating Budget by Division
Executive 8%
Real Estate 17%
Maritime 5%
Planning &Development 6%
Engineering 25%
Maintenance 8%
Finance & Administration 31%
Revenue by Source
Parking 18%
Interest Earnings 1%
Other 2%
Maritime 18%
Commercial Rent 61%
he Port’s finance an Aministration program inclues uning or ebt service. n fiscal Year 2009-10 the
Port issue new revenue bons that require less annual ebt service than the ol bons that were pai o in
fiscal Year 2009-10. his resulte in the Port being able to reuce its annual ebt service by $1.6 million in
fiscal Year 2010-11.
n fiscal Year 2010-11 the Port is projecting revenue growth o $3 million, which is ue to increases in parking
rents an Commercial/nustrial rents that are oset by a 19 percent ecline in Cruise revenues.

8/9/2019 Mayor's Proposed 2010-11 May Budget
http://slidepdf.com/reader/full/mayors-proposed-2010-11-may-budget 68/107
46 Mayor’s Proposed Budget 2010-11
Port
E x e c u t i v e
P o r t C o m m i s s i o n
R e a l E s t a t e
E n g i n e e r i n g
M a r i t i m e
M a i n t e n a n c e
P l a n n i n g
& d e v e l o p m e n t
f i n
a n c e &
A m i n i s t r a t i o n

8/9/2019 Mayor's Proposed 2010-11 May Budget
http://slidepdf.com/reader/full/mayors-proposed-2010-11-may-budget 69/107
Department Budgets > Port 47Department Budgets > Port 47
Total Budget – Historical Comparison
2 0 0 8 - 2 0 0 9
2
0 0 9 - 2 0 1 0
2 0 1 0 - 2 0 1 1
2 0 1 1 - 2 0 1 2
A c t u a l
O r i g i n a l
B u d g e t
P r o p o s e d
B u d g e t
C h g f r o m
2 0 0 9 - 2 0 1 0
% C
h g f r o m
2 0 0 9 - 2 0 1 0
P r o p o s e d
B u d g e t
C h g f r o m
2 0 1 0 - 2 0 1 1
% C
h g f r o m
2 0 1 0 - 2 0 1 1
A U T H O R I Z E D P O S I T I O N S
T o t a l A u t h o r i z e d
2 3 0 . 9
4
2 3 1 . 0
5
2 3 6 . 0
6
5 . 0 1
2 %
2 3 6 . 7
0
0 . 6 4
0 %
N o n - o p e r a t i n g P o s i t i o n s ( c a p / o t h
e r )
( 1 5 . 0
0 )
( 1 6 . 0
0 )
( 1 9 . 0
8 )
( 3 . 0 8 )
1 9 %
( 2 0 . 0
0 )
( 0 . 9 2
)
5 %
N e t O p e r a t i n g P o s i t i o n s
2 1 5 . 9 4
2 1 5 . 0 5
2 1 6 . 9 8
1 . 9 3
1 %
2 1 6 . 7 0
( 0 . 2 8 )
0 %
S O U R C E S
L i c e n s e s & F i n e s
1 , 7
3 9 , 8
5 1
1 , 6
0 0 , 0
0 0
1 , 6
0 0 , 0
0 0
0
0
1 , 6
0 0 , 0
0 0
0
0
U s e o f M o n e y o r P r o p e r t y
4 6 , 4
7 0 , 2
2 5
4 8 , 9
3 5 , 0
0 0
5 2 , 1
7 3 , 0
0 0
3 , 2
3 8 , 0
0 0
7 %
5 3 , 5
3 6 , 0
0 0
1 , 3
6 3 , 0
0 0
3 %
C h a r g e s f o r S e r v i c e s
6 , 8
0 3 , 2
6 9
1 2 , 4
8 1 , 5
0 0
1 2 , 2
5 4 , 0
0 0
( 2 2 7 , 5
0 0 )
( 2 % )
1 3 , 2
0 3 , 0
0 0
9 4 9 , 0
0 0
8 %
O t h e r R e v e n u e s
9 6 1 , 4
1 8
9 1 0 , 3
0 0
9 9 9 , 7
5 6
8 9 , 4
5 6
1 0 %
9 9 4 , 3
0 0
( 5 , 4
5 6 )
( 1 % )
T r a n s f e r s I n
1 0 , 9
2 7 , 8
3 1
2 5 , 4
6 2 , 4
8 8
1 4 , 2
6 8 , 4
3 4
( 1 1 , 1
9 4 , 0
5 4 )
( 4 4 % )
1 5 , 6
8 4 , 2
9 8
1 , 4
1 5 , 8
6 4
1 0 %
E x p e n d i t u r e R e c o v e r y
3 8 , 8
1 9
3 0 3 , 0
0 0
3 3 4 , 1
6 8
3 1 , 1
6 8
1 0 %
3 3 4 , 1
6 8
0
0
T r a n s f e r A d j u s t m e n t s - S o u r c e s
( 1 0 , 9
2 6 , 8
4 8 )
( 1 4 , 6
8 0 , 2
5 7 )
( 1 7 , 3
9 9 , 2
8 1 )
( 2 , 7
1 9 , 0
2 4 )
1 9 %
( 1 8 , 8
7 3 , 0
3 5 )
( 1 , 4
7 3 , 7
5 4 )
8 %
F u n d B a l a n c e
6 , 0
5 5 , 0
3 3
9 , 3
7 5 , 4
7 7
9 , 2
1 7 , 9
0 4
( 1 5 7 , 5
7 3 )
( 2 % )
9 , 6
4 2 , 9
9 6
4 2 5 , 0
9 2
5 %
S o u r c e s T o t a l
6 2 , 0 6 9 , 5 9 8
8
4 , 3 8 7 , 5 0 8
7 3 , 4 4 7 , 9 8 1
( 1 0 , 9 3 9 , 5 2 7 )
( 1 3 % )
7 6 , 1 2 1 , 7 2 7
2 , 6 7 3 , 7 4 6
4 %
U S E S - O P E R A T I N G E X P E N D I T U R E S
S a l a r i e s & W a g e s
2 0 , 6
1 8 , 3
7 9
2 0 , 4
6 2 , 4
6 6
2 0 , 1
5 3 , 2
5 1
( 3 0 9 , 2
1 5 )
( 2 % )
2 0 , 1
5 4 , 4
7 5
1 , 2
2 4
0 %
F r i n g e B e n e f i t s
6 , 5
6 8 , 4
6 5
7 , 7
3 4 , 4
9 5
8 , 7
8 3 , 8
3 3
1 , 0
4 9 , 3
3 8
1 4 %
9 , 7
1 9 , 7
3 7
9 3 5 , 9
0 4
1 1 %
O v e r h e a d
5 3 5 , 7
0 0
2 6 1 , 2
1 9
1 0 0 , 1
9 1
( 1 6 1 , 0
2 8 )
( 6 2 % )
1 0 0 , 1
9 1
0
0
P r o f e s s i o n a l & C o n t r a c t u a l S e r v i c e s
8 , 4
8 1 , 1
6 1
9 , 6
5 0 , 3
7 5
1 0 , 9
4 4 , 8
3 6
1 , 2
9 4 , 4
6 1
1 3 %
1 1 , 5
3 9 , 2
2 7
5 9 4 , 3
9 1
5 %
M a t e r i a l s & S u p p l i e s
1 , 3
4 4 , 3
8 2
1 , 4
5 7 , 6
5 9
1 , 4
8 3 , 5
1 0
2 5 , 8
5 1
2 %
1 , 5
4 3 , 1
8 7
5 9 , 6
7 7
4 %
E q u i p m e n t
6 9 , 2
5 4
2 4 2 , 9
8 2
5 6 9 , 6
2 5
3 2 6 , 6
4 3
N / A
5 2 5 , 0
0 0
( 4 4 , 6
2 5 )
( 8 % )
D e b t S e r v i c e
4 , 7
0 1 , 8
4 3
4 , 7
0 2 , 7
6 0
3 , 0
7 5 , 0
5 0
( 1 , 6
2 7 , 7
1 0 )
( 3 5 % )
3 , 0
7 6 , 6
7 2
1 , 6
2 2
0 %
S e r v i c e s o f O t h e r D e p a r t m e n t s
1 1 , 4
5 8 , 7
7 5
1 2 , 4
0 6 , 8
2 1
1 3 , 5
4 5 , 7
4 6
1 , 1
3 8 , 9
2 5
9 %
1 3 , 3
1 1 , 2
5 5
( 2 3 4 , 4
9 1 )
( 2 % )
T r a n s f e r s O u t
1 1 , 5
1 0 , 8
3 7
1 2 , 4
8 9 , 1
1 5
1 4 , 8
5 2 , 4
2 3
2 , 3
6 3 , 3
0 8
1 9 %
1 6 , 2
6 8 , 2
8 7
1 , 4
1 5 , 8
6 4
1 0 %
T r a n s f e r A d j u s t m e n t s - U s e s
( 1 0 , 9
2 6 , 8
4 8 )
( 1 1 , 9
0 5 , 1
2 6 )
( 1 4 , 2
6 8 , 4
3 4 )
( 2 , 3
6 3 , 3
0 8 )
2 0 %
( 1 5 , 6
8 4 , 2
9 8 )
( 1 , 4
1 5 , 8
6 4 )
1 0 %
U s e s - O p e r a t i n g E x p e n d i t u r e s T o t a l
5 4 , 3 6 1 , 9 4 8
5
7 , 5 0 2 , 7 6 6
5 9 , 2 4 0 , 0 3 1
1 , 7 3 7 , 2 6 5
3 %
6 0 , 5 5 3 , 7 3 3
1 , 3 1 3 , 7 0 2
2 %
U S E S - P R O J E C T E X P E N D I T U
R E S
F a c i l i t i e s M a i n t e n a n c e
1 , 7
3 6 , 3
8 3
3 , 7
2 7 , 5
0 0
4 , 5
1 1 , 4
9 4
7 8 3 , 9
9 4
2 1 %
3 , 0
2 4 , 9
9 4
( 1 , 4
8 6 , 5
0 0 )
( 3 3 % )
C a p i t a l P r o j e c t s
5 , 9
7 1 , 2
6 7
2 3 , 1
5 7 , 2
4 2
9 , 6
9 6 , 4
5 6
( 1 3 , 4
6 0 , 7
8 6 )
( 5 8 % )
1 2 , 5
4 3 , 0
0 0
2 , 8
4 6 , 5
4 4
2 9 %
U s e s - P r o j e c t E x p e n d i t u r e s T o t a l
7 , 7 0 7 , 6 5 0
2
6 , 8 8 4 , 7 4 2
1 4 , 2 0 7 , 9 5 0
( 1 2 , 6 7 6 , 7 9 2 )
( 4 7 % )
1 5 , 5 6 7 , 9 9 4
1 , 3 6 0 , 0 4 4
1 0 %

8/9/2019 Mayor's Proposed 2010-11 May Budget
http://slidepdf.com/reader/full/mayors-proposed-2010-11-may-budget 70/107
48 Mayor’s Proposed Budget 2010-11
Total Budget – Historical Comparison
48 Mayor’s Proposed Budget 2010-11
2 0 0 8 - 2 0 0 9
2
0 0 9 - 2 0 1 0
2 0 1 0 - 2 0 1 1
2 0 1 1 - 2 0 1 2
A c t u a l
O r i g i n a l
B u d g e t
P r o p o s e d
B u d g e t
C h g f r o m
2 0 0 9 - 2 0 1 0
% C
h g f r o m
2 0 0 9 - 2 0 1 0
P r o p o s e d
B u d g e t
C h g f r o m
2 0 1 0 - 2 0 1 1
% C
h g f r o m
2 0 1 0 - 2 0 1 1
U S E S B Y P R O G R A M R E C A P
A d m i n i s t r a t i o n
2 0 , 9
0 3 , 5
1 6
2 2 , 4
4 0 , 2
6 1
2 1 , 9
8 0 , 2
3 9
( 4 6 0 , 0
2 2 )
( 2 % )
2 2 , 2
7 4 , 8
7 1
2 9 4 , 6 3 2
1 %
C a p i t a l P r o j e c t s
0
1 3 , 5
5 7 , 3
6 2
0
( 1 3 , 5
5 7 , 3
6 2 )
( 1 0 0 % )
0
0
N / A
E n g i n e e r i n g & E n v i r o n m e n t a l
3 , 9
5 6 , 5
9 7
4 , 1
3 1 , 5
8 8
4 , 2
0 6 , 5
1 0
7 4 , 9
2 2
2 %
4 , 3
2 3 , 3
1 9
1 1 6 , 8 0 9
3 %
M a i n t e n a n c e
2 3 , 4
2 3 , 7
4 8
2 8 , 8
2 7 , 4
1 3
2 9 , 8
2 6 , 1
4 7
9 9 8 , 7
3 4
3 %
3 1 , 7
4 9 , 6
2 7
1 , 9
2 3 , 4 8 0
6 %
M a r i t i m e O p e r a t i o n s & M a r k e t i n g
2 , 4
2 8 , 8
1 4
2 , 3
1 9 , 4
1 9
3 , 1
7 1 , 6
2 8
8 5 2 , 2
0 9
3 7 %
3 , 3
0 6 , 7
6 0
1 3 5 , 1 3 2
4 %
N o n - G r a n t C o n s t r u c t i o n P r o j e c t s
0
0
1 3 9 , 4
5 6
1 3 9 , 4
5 6
N / A
0
( 1 3 9 , 4 5 6
)
( 1 0 0 % )
P l a n n i n g & D e v e l o p m e n t
2 , 8
0 2 , 1
1 9
3 , 4
4 8 , 1
9 4
3 , 4
8 1 , 0
4 1
3 2 , 8
4 7
1 %
3 , 4
2 4 , 1
5 0
( 5 6 , 8 9 1
)
( 2 % )
R e a l E s t a t e & M a n a g e m e n t
8 , 5
5 4 , 8
0 4
9 , 6
6 3 , 2
7 1
1 0 , 6
4 2 , 9
6 0
9 7 9 , 6
8 9
1 0 %
1 1 , 0
4 3 , 0
0 0
4 0 0 , 0 4 0
4 %
U s e s b y P r o g r a m R e c a p T o t a l
6 2 , 0 6 9 , 5 9 8
8
4 , 3 8 7 , 5 0 8
7 3 , 4 4 7 , 9 8 1
( 1 0 , 9 3 9 , 5 2 7 )
( 1 3 % )
7 6 , 1 2 1 , 7 2 7
2 , 6 7 3 , 7 4 6
4 %
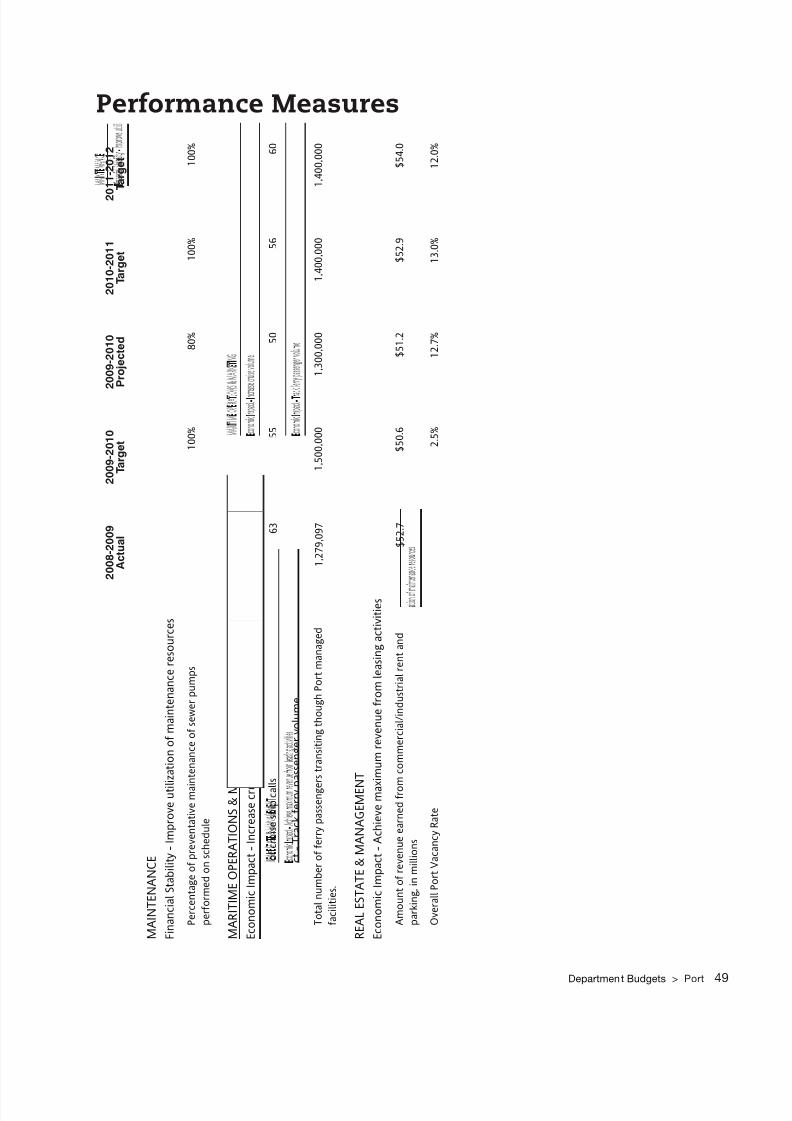
8/9/2019 Mayor's Proposed 2010-11 May Budget
http://slidepdf.com/reader/full/mayors-proposed-2010-11-may-budget 71/107
Department Budgets > Port 49
Performance Measures
2 0 0 8 - 2 0 0 9
A c t u a l
2 0 0 9 - 2 0 1 0
T a r g e t
2 0 0 9 - 2 0 1 0
P r o j e c t e d
2 0 1 0 - 2 0 1 1
T a r g e t
2 0 1 1 - 2 0 1 2
T a r g e t
M A I N T E N A N C E
F i n a n c i a l S t a b i l i t y - I m p r o v e u t i l
i z a t i o n o f m a i n t e n a n c e r e s o u r c e s
P e r c e n t a g e o f p r e v e n t a t i v e m a i n t e n a n c e o f s e w e r p u m p s
p e r f o r m e d o n s c h e d u l e
9 1 %
1 0 0 %
8 0 %
1 0 0 %
1 0 0 %
M A R I T I M E O P E R A T I O N S & M A R K E T I N G
E c o n o m i c I m p a c t - I n c r e a s e c r u i s e v o l u m e
T o t a l n u m b e r o f c r u i s e s h i p c a l l s
6 3
5 5
5 0
5 6
6 0
E c o n o m i c I m p a c t - T r a c k f e r r y p
a s s e n g e r v o l u m e
T o t a l n u m b e r o f f e r r y p a s s e n g e
r s t r a n s i t i n g t h o u g h P o r t m a n a g e d
f a c i l i t i e s .
1 , 2 7 9 , 0 9 7
1 , 5 0 0 , 0 0 0
1 , 3 0 0 , 0 0 0
1 , 4 0 0 , 0 0 0
1 , 4 0 0 , 0 0 0
R E A L E S T A T E & M A N A G E M E N
T
E c o n o m i c I m p a c t - A c h i e v e m a x
i m u m r
e v e n u e f r o m l
e a s i n g a c t i v i t i e s
A m o u n t o f r e v e n u e e a r n e d f r o m
c o m m e r c i a l / i n d u s t r i a l r e n t a n d
p a r k i n g , i n m i l l i o n s
$ 5 2 . 7
$ 5 0 . 6
$ 5 1 . 2
$ 5 2 . 9
$ 5 4 . 0
O v e r a l l P o r t V a c a n c y R a t e
1 0 . 9 %
2 . 5 %
1 2 . 7 %
1 3 . 0 %
1 2 . 0 %

8/9/2019 Mayor's Proposed 2010-11 May Budget
http://slidepdf.com/reader/full/mayors-proposed-2010-11-may-budget 72/107

8/9/2019 Mayor's Proposed 2010-11 May Budget
http://slidepdf.com/reader/full/mayors-proposed-2010-11-may-budget 73/107
Public Utilities Commission 51
Public Utilities Commission
MissionTo serve San Francisco and Bay Area customers with reliable, high-quality, afordable
water while maximizing benets rom power operations; to protect public health
and the aquatic environment by saely, reliably and eciently collecting, treating and
disposing o San Francisco’s waste and storm water.
Services
e San Francisco Public Utilities Commission (SFPUC) consists o the Water Enterprise, WastewaterEnterprise, Hetch Hetchy Water & Power and the SFPUC Bureaus.
Water Enterprise is responsible or collecting, treating and distributing 250 million gallons o water perday to 2.5 million people, including retail customers in the City and 27 wholesale customers located in SanMateo, Santa Clara, and Alameda Counties. Retail customers include residential, commercial, industrial andgovernmental users. e Water Enterprise operates and maintains the ollowing:
Regional Water System In-City Water Delivery System
Pipelines 280 miles 1,250 miles
Tunnels 60 miles NA
Pump Stations 5 12
Reservoirs and/or Water Tanks 11 12/9
Treatment Plants 2 NA
Wastewater Enterprise collects, transmits, treats, and discharges sanitary and stormwater ows generatedwithin the City or the protection o public health and environmental saety. is involves operating, cleaningand maintaining 933 miles o city sewers, 27 pump stations, 3 wastewater treatment plants and respondingto sewer-related service calls. e Wastewater Enterprise serves approximately 150,000 residential accounts,which discharge about 19.0 million units o sanitary ow per year (measured in hundreds o cubic eet, orcc) and approximately 22,000 non-residential accounts, which discharge about 9.2 million units o sanitaryow per year.
Hetch Hetchy Water and Power operates the collection and conveyance o approximately 85% o the City’swater supply and the generation and transmission o electricity rom that source. Approximately 63% o the electricity generated by Hetch Hetchy Water and Power is used by the City’s municipal customers. ebalance o electricity generated is sold to other publicly-owned utilities, such as the Turlock and ModestoIrrigation Districts. Hetch Hetchy Water and Power includes a system o reservoirs, hydroelectric powerplants, aqueducts, pipelines, and transmission lines, carrying water and power rom the Sierra Nevada tocustomers in the City and portions o the surrounding San Francisco Bay Area.
SFPU Bureaus provide inrastructure planning, managerial and administrative support or all SFPUCoperations.
For more inormation, call (415) 554-3155 or 311; or visit www.swater.org

8/9/2019 Mayor's Proposed 2010-11 May Budget
http://slidepdf.com/reader/full/mayors-proposed-2010-11-may-budget 74/107
52 Mayor’s Proposed Budget 2010-11
Budget Data Summary2008-2009
Actual
2009-2010
Budget
2010-2011
Proposed
2011-2012
Proposed
Change from
2009-2010
% Change from
2009-2010
Total Expenditures 749,902,713 684,603,743 728,249,603 796,927,891 43,645,860 6%
Total FTE 1,580.19 1,549.40 1,591.30 1,602.20 41.90 3%
Budget Issues and DetailsService evel hangese SFPUC budget request or Fiscal Year 2010-11 is 6% higher than the Fiscal Year 2009-10 approvedbudget. e increase is mostly due to growth in Debt Service and reserves or the Water and WastewaterEnterprises. ese increases are consistant with the SFPUC’s 5-year nancial plan. is growth helpsto ensure the Enterprises maintain high investment grade credit ratings, and provide sucient capacityto bridge cash ow needs related to lower water consumption and covers expenditure contingencies.Importantly this growth in reserves also protects ratepayers rom emergency rate increases due to revenueshortalls. Over the next 10 years, the PUC plans to invest $6.7 billion in inrastructure projects, creating and
preserving thousands o jobs.
Water Enterprise
Water System Improvement Programe rebuild and retrot o the Hetch Hetchy Water System, also reerred to as the Water SystemImprovement Program (WSIP), remains the highest priority capital project or the SFPUC. e $4.6 billionefort has a projected Fiscal Year 2014-15 completion with many projects within San Francisco alreadycompleted and key projects in the Bay Area already under construction.
Water onservatione SFPUC has been implementing conservation activities or almost 20 years. Over that time, water use
per person in San Francisco has gone rom a peak o over 160 gallons per capita per day (gpcd) to currentlevels o just under 88.9 gpcd or residential, commercial and industrial, and municipal customers combined.Residential customer use only 52 gallons per person per day. is compares to the Caliornia residentialaverage o 155 gallons per person per day.
While the SFPUC has made great strides in encouraging its customers to conserve water, urtheropportunities can be tapped. In response to conservation opportunities, the SFPUC’s conservation programexpenditures have signicantly increased over the past three years, including a 60 percent increase in thenumber o rebates or toilets, washers and other xtures processed in the last three years. is budgetunds $8.8 million and $8.9 million or Fiscal Year 2010-11 and Fiscal Year 2011-12 respectively, towardsconservation goals.
Going orward, the SFPUC’s water conservation program is planned to expand even more to ensure it
meets the goals to satisy demands o 10 million gallons a day (mgd) by 2018 through a combination o conservation, groundwater, and recycled water. Recently passed State law requires urban water agencies toreduce statewide per capita water consumption by twenty percent by 2020.
Key ocus areas or Fiscal Year 2010-11 and Fiscal Year 2011-12 include:
• Increasing water savings in all sectors
• Educating customers
• Coordinating conservation programs
8/9/2019 Mayor's Proposed 2010-11 May Budget
http://slidepdf.com/reader/full/mayors-proposed-2010-11-may-budget 75/107
Department Budgets > Public Utilities Commission 53
Advanced Meter Inrastructure (AMI)e SFPUC has started implementation o the Advanced Meter Inrastructure (AMI) Project to retrot orreplace all o the SFPUC’s 180,000 existing visual-read water meters with advanced digital water meters, withan estimated completion date o April 2012. Benets include automated meter reading, timely leak detection,hourly customer water usage inormation and increases in meter accuracy and revenues. e proposedbudget includes $5.4 million or the completion o the program.
Wastewater EnterpriseBiouel / Alternative Energy Programe Biouel / Alternative Energy Program will determine the easibility and cost efectiveness or theSFPUC to generate bio-energy (e.g. biouel or cogenerated power) as a byproduct o processing the ats, oilsand grease (FOG) and ood waste collected throughout the City. Inormation will be developed throughpilot studies and analysis to evaluate i adoption o biouel energy programs into the SFPUC’s Wastewatercollection system and treatment processes would reliably and cost-efectively enhance perormance andsustainability. Funding o $4.0 million and $4.6 million are included in Fiscal Year 2010-11 and Fiscal Year2011-12 respectively to support the program.
e specic projects identied to date include:
• Development o a Business Plan to determine the cost efectiveness and potential benets rom new sourceso alternative energy. Evaluation o the market and assessment o the impacts to the Wastewater Enterprise.
• Continuation o the pilot project evaluating the conversion o brown grease into biodiesel.
• Pilot studies evaluating collection and treatment o ood waste and cost benet analysis regarding co-digestion versus separate digestion in a dedicated of-site acility.
• Participation in the Bay Area Regional Biosolids to Energy Project.
• Local FOG collection and handling projects.
ow Impact Design Programrough the Low Impact Design (LID) Program projects and polices will store or divert stormwater orbenecial use prior to entry into the sewer system. e LID Program enhances local neighborhoods, reduceslocalized ooding, and improves the operating eciency o San Francisco’s combined sewer system.
Potential project partnerships are being pursued with Department o Recreation and Parks, the SF UniedSchool District and other public and private entities to divert, store and/or use stormwater on site. Activitieswill include planning and investigation to identiy potential LID projects and opportunities, design andconstruction o projects. In some cases uture easible projects may be public/private partnerships (pavementremoval, swale installation etc.). e LID Program will also include neighborhood demonstration projects.Ancillary benets rom LID projects include: reduction o energy use (reduced pumping), potable waterconservation, natural habitat restoration and improved community aesthetics.
Sewer ondition Assessment EnhancementsA major enhancement or the Wastewater Enterprise is the sewer condition assessment program to ensure
that large scale sewer replacement is targeted to ensure that critical health and saety needs are met.e current condition assessment is necessary to increase the value o sewer assets by providing sewerreplacement prioritization. e Sewer System Improvement Program (SSIP) will urther inorm the strategyor replacing the aging sewer inrastructure. Current average age o the collection system is over 70 years. eplan is to increase sewer replacement rom the current rate o 4.5 miles per year to 15 miles per year by 2013.e sewer condition assessment project will provide 150 miles annually o closed circuit television (CCTV) video o the sewer system in order to determine i the sewers are sae or near ailure. e unding o $1.5million and $0.7 million are included Fiscal Year 2010-11 and Fiscal Year 2011-12 respectively to carry outthis vital assessment work.

8/9/2019 Mayor's Proposed 2010-11 May Budget
http://slidepdf.com/reader/full/mayors-proposed-2010-11-may-budget 76/107
54 Mayor’s Proposed Budget 2010-11
Hetch HetchyTo deliver low-cost, reliable electricity to its customers, the Power Enterprise relies on power generation atthe Hetch Hetchy hydroelectric powerhouses, solar generation, and third-party purchases. In accordancewith the requirements o City policies and directives relating to renewable energy and goals to reducegreenhouse gases, the Power Enterprise is continuously researching, developing and implementing newelectricity generation resources to provide clean, local generation where it is needed and ensuring reliablepower services.
Energy Efciency ProgramEnergy eciency investments are an important component o an electric utility’s resource portolio byreducing acility operating costs and electric bills or customers, improving system unctionality, and reducingthe environmental impact o energy use. For Fiscal Year 2010–11, the Power Enterprise budget includes $5.9million in energy eciency programs targeting General Fund departments, including the planning, designand construction o a green energy district in Civic Center, and implementation o energy eciency projects(lighting, heating and ventilation, energy management system and demand response projects).
Streetlighting epair, eplacement & ImprovementIn accordance with Mayor’s priority, the Power Enterprise has started the conversion o the City’s 17,600
owned and maintained cobra-head street lights rom High Pressure Sodium Vapor (HPSV) to Light EmittingDiode (LED) technologies and installation o a smart lighting controls system. e conversion o HPSV toLED will result in the ollowing benets:
• 50% energy savings
• reduced maintenance costs
• greater color, denition and uniormity
• longer useul lie, 15-20 years
Funding o $8.0 million is included in each o the Fiscal Year 2010-11 and Fiscal Year 2011-12 budgets. Inaddition, $13.5 million is budgeted in the next two scal years or design and streetlight replacement or Van
Ness Bus Rapid Transit (BRT) project.
GoSolar SFGoSolarSF encourages installations o solar power systems in San Francisco by ofering incentives to reduceproject costs. Incentives are available or residences, businesses, and nonprot organizations. e City’sGoSolarSF incentives, combined with State and Federal subsidies, cover about hal o the cost o a residentialsolar system, providing many San Franciscans the ability to go solar.
Launched on July 1, 2008, GoSolarSF contributed to a dramatic increase in solar projects planned andinstalled in San Francisco. Between July 2008 and March 2010, the program received over 1,150 applicationsand created 40 new green jobs. Funding o $5.0 million is included in each o the Fiscal Year 2010-11 andFiscal Year 2011-12 budgets.
Power Inrastructure Investmente HHWP acilities include three impoundment reservoirs, three regulating reservoirs, our powerhouses,two switchyards, three substations, 170 miles o pipeline and tunnels, almost 100 miles o paved road, over170 miles o transmission lines, watershed land and right-o-way property.
HHWP acilities are in the ourth year o a 20-year rehabilitation program, with many acilities suferingrom deerred maintenance. HHWP recently completed the Power Asset Master Plan, which prioritizedand recommended a plan o action or rehabilitation o the power system to minimize risk to HHWP powerrevenues, regulatory nes and saety.
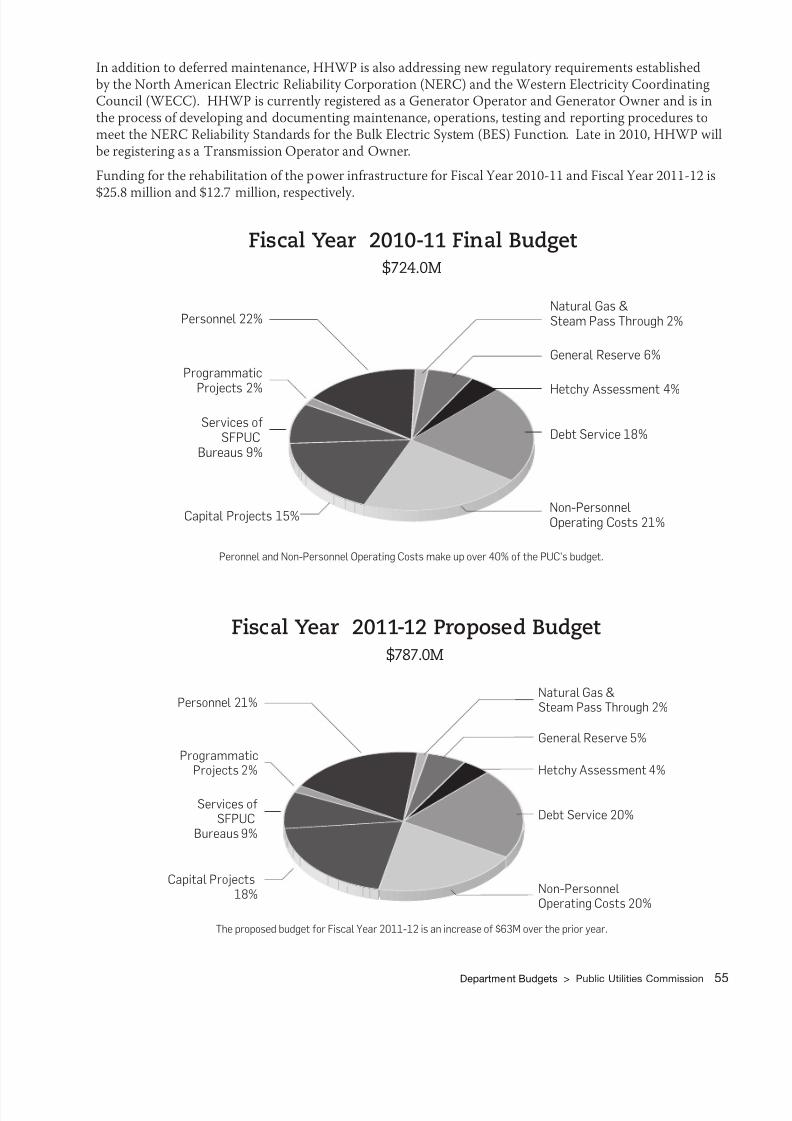
8/9/2019 Mayor's Proposed 2010-11 May Budget
http://slidepdf.com/reader/full/mayors-proposed-2010-11-may-budget 77/107
Department Budgets > Public Utilities Commission 55
In addition to deerred maintenance, HHWP is also addressing new regulatory requirements establishedby the North American Electric Reliability Corporation (NERC) and the Western Electricity CoordinatingCouncil (WECC). HHWP is currently registered as a Generator Operator and Generator Owner and is inthe process o developing and documenting maintenance, operations, testing and reporting procedures tomeet the NERC Reliability Standards or the Bulk Electric System (BES) Function. Late in 2010, HHWP willbe registering as a Transmission Operator and Owner.
Funding or the rehabilitation o the power inrastructure or Fiscal Year 2010-11 and Fiscal Year 2011-12 is
$25.8 million and $12.7 million, respectively.
Services ofSFPUC
Bureaus 9%
Capital Projects 15%
Programmatic
Projects 2%
Personnel 22%Natural Gas &Steam Pass Through 2%
Hetchy Assessment 4%
General Reserve 6%
Non-PersonnelOperating Costs 21%
Debt Service 18%
Fiscal Year 2010-11 Final Budget$724.0M
Peronnel an on-Personnel Operating Costs make up over 40% o the PC’s buget.
Services ofSFPUC
Bureaus 9%
Capital Projects18%
ProgrammaticProjects 2%
Personnel 21%Natural Gas &Steam Pass Through 2%
Hetchy Assessment 4%
General Reserve 5%
Non-PersonnelOperating Costs 20%
Debt Service 20%
Fiscal Year 2011-12 Proposed Budget$787.0M
he propose buget or fiscal Year 2011-12 is an increase o $63M over the prior year.

8/9/2019 Mayor's Proposed 2010-11 May Budget
http://slidepdf.com/reader/full/mayors-proposed-2010-11-may-budget 78/107
56 Mayor’s Proposed Budget 2010-11
Public Utilities Commission
G e n e r a l M a n a g e r
d e p u t
y G e n e r a l M a n a g e r
C h i e
O p e r a t i n g O c e r
S e c u r i t y & E m e
r g e n c y
C o o r i n a t i o n
S a n f r a n c i s c o P u b l i c
t i l i t i e s C o m m i s s i o n
B u s i n e s s S e r v i c e s
E x t e r n a l A a i r s
P o w e r E n t e r p r i s e
n r a s t r u
c t u r e d i v i s i o n
P o w e r E n t e r p r i s e
W
a s t e w a t e r
E n t e r p r i s e
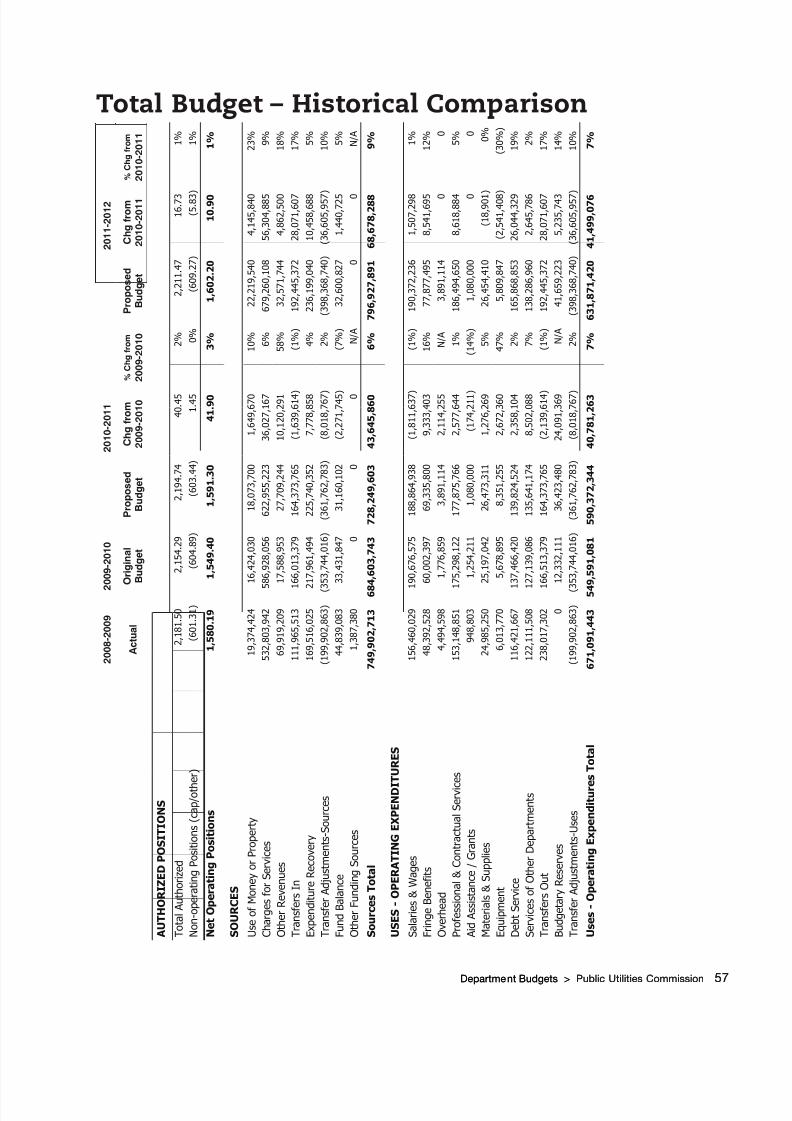
8/9/2019 Mayor's Proposed 2010-11 May Budget
http://slidepdf.com/reader/full/mayors-proposed-2010-11-may-budget 79/107
Department Budgets > Public Utilities Commission 57Department Budgets > Public Utilities Commission 57
Total Budget – Historical Comparison
2 0 0 8 - 2 0 0 9
2
0 0 9 - 2 0 1 0
2 0 1 0 - 2 0 1 1
2 0 1 1 - 2 0 1 2
A c t u a l
O r i g i n a l
B u d g e t
P r o p o s e d
B u d g e t
C h g f r o m
2 0 0 9 - 2 0 1 0
% C
h g f r o m
2 0 0 9 - 2 0 1 0
P r o p o s e d
B u d g e t
C h g f r o m
2 0 1 0 - 2 0 1 1
% C
h g f r o m
2 0 1 0 - 2 0 1 1
A U T H O R I Z E D P O S I T I O N S
T o t a l A u t h o r i z e d
2 , 1
8 1 . 5
0
2 , 1
5 4 . 2
9
2 , 1
9 4 . 7
4
4 0 . 4 5
2 %
2 , 2
1 1 . 4
7
1 6 . 7 3
1 %
N o n - o p e r a t i n g P o s i t i o n s ( c a p / o t h
e r )
( 6 0 1 . 3
1 )
( 6 0 4 . 8
9 )
( 6 0 3 . 4
4 )
1 . 4 5
0 %
( 6 0 9 . 2
7 )
( 5 . 8 3
)
1 %
N e t O p e r a t i n g P o s i t i o n s
1 , 5 8 0 . 1 9
1 , 5 4 9 . 4 0
1 , 5 9 1 . 3 0
4 1 . 9 0
3 %
1 , 6 0 2 . 2 0
1 0 . 9 0
1 %
S O U R C E S
U s e o f M o n e y o r P r o p e r t y
1 9 , 3
7 4 , 4
2 4
1 6 , 4
2 4 , 0
3 0
1 8 , 0
7 3 , 7
0 0
1 , 6
4 9 , 6
7 0
1 0 %
2 2 , 2
1 9 , 5
4 0
4 , 1
4 5 , 8 4 0
2 3 %
C h a r g e s f o r S e r v i c e s
5 3 2 , 8
0 3 , 9
4 2
5 8 6 , 9
2 8 , 0
5 6
6 2 2 , 9
5 5 , 2
2 3
3 6 , 0
2 7 , 1
6 7
6 %
6 7 9 , 2
6 0 , 1
0 8
5 6 , 3
0 4 , 8 8 5
9 %
O t h e r R e v e n u e s
6 9 , 9
1 9 , 2
0 9
1 7 , 5
8 8 , 9
5 3
2 7 , 7
0 9 , 2
4 4
1 0 , 1
2 0 , 2
9 1
5 8 %
3 2 , 5
7 1 , 7
4 4
4 , 8
6 2 , 5 0 0
1 8 %
T r a n s f e r s I n
1 1 1 , 9
6 5 , 5
1 3
1 6 6 , 0
1 3 , 3
7 9
1 6 4 , 3
7 3 , 7
6 5
( 1 , 6
3 9 , 6
1 4 )
( 1 % )
1 9 2 , 4
4 5 , 3
7 2
2 8 , 0
7 1 , 6 0 7
1 7 %
E x p e n d i t u r e R e c o v e r y
1 6 9 , 5
1 6 , 0
2 5
2 1 7 , 9
6 1 , 4
9 4
2 2 5 , 7
4 0 , 3
5 2
7 , 7
7 8 , 8
5 8
4 %
2 3 6 , 1
9 9 , 0
4 0
1 0 , 4
5 8 , 6 8 8
5 %
T r a n s f e r A d j u s t m e n t s - S o u r c e s
( 1 9 9 , 9
0 2 , 8
6 3 ) ( 3 5 3 , 7
4 4 , 0
1 6 )
( 3 6 1 , 7
6 2 , 7
8 3 )
( 8 , 0
1 8 , 7
6 7 )
2 %
( 3 9 8 , 3
6 8 , 7
4 0 )
( 3 6 , 6
0 5 , 9 5 7
)
1 0 %
F u n d B a l a n c e
4 4 , 8
3 9 , 0
8 3
3 3 , 4
3 1 , 8
4 7
3 1 , 1
6 0 , 1
0 2
( 2 , 2
7 1 , 7
4 5 )
( 7 % )
3 2 , 6
0 0 , 8
2 7
1 , 4
4 0 , 7 2 5
5 %
O t h e r F u n d i n g S o u r c e s
1 , 3
8 7 , 3
8 0
0
0
0
N / A
0
0
N / A
S o u r c e s T o t a l
7 4 9 , 9 0 2 , 7 1 3
6 8
4 , 6 0 3 , 7 4 3
7 2 8 , 2 4 9 , 6 0 3
4 3 , 6 4 5 , 8 6 0
6 %
7 9 6 , 9 2 7 , 8 9 1
6 8 , 6 7 8 , 2 8 8
9 %
U S E S - O P E R A T I N G E X P E N D I
T U R E S
S a l a r i e s & W a g e s
1 5 6 , 4
6 0 , 0
2 9
1 9 0 , 6
7 6 , 5
7 5
1 8 8 , 8
6 4 , 9
3 8
( 1 , 8
1 1 , 6
3 7 )
( 1 % )
1 9 0 , 3
7 2 , 2
3 6
1 , 5
0 7 , 2 9 8
1 %
F r i n g e B e n e f i t s
4 8 , 3
9 2 , 5
2 8
6 0 , 0
0 2 , 3
9 7
6 9 , 3
3 5 , 8
0 0
9 , 3
3 3 , 4
0 3
1 6 %
7 7 , 8
7 7 , 4
9 5
8 , 5
4 1 , 6 9 5
1 2 %
O v e r h e a d
4 , 4
9 4 , 5
9 8
1 , 7
7 6 , 8
5 9
3 , 8
9 1 , 1
1 4
2 , 1
1 4 , 2
5 5
N / A
3 , 8
9 1 , 1
1 4
0
0
P r o f e s s i o n a l & C o n t r a c t u a l S e r v i c e s
1 5 3 , 1
4 8 , 8
5 1
1 7 5 , 2
9 8 , 1
2 2
1 7 7 , 8
7 5 , 7
6 6
2 , 5
7 7 , 6
4 4
1 %
1 8 6 , 4
9 4 , 6
5 0
8 , 6
1 8 , 8 8 4
5 %
A i d A s s i s t a n c e / G r a n t s
9 4 8 , 8
0 3
1 , 2
5 4 , 2
1 1
1 , 0
8 0 , 0
0 0
( 1 7 4 , 2
1 1 )
( 1 4 % )
1 , 0
8 0 , 0
0 0
0
0
M a t e r i a l s & S u p p l i e s
2 4 , 9
8 5 , 2
5 0
2 5 , 1
9 7 , 0
4 2
2 6 , 4
7 3 , 3
1 1
1 , 2
7 6 , 2
6 9
5 %
2 6 , 4
5 4 , 4
1 0
( 1 8 , 9 0 1
)
0 %
E q u i p m e n t
6 , 0
1 3 , 7
7 0
5 , 6
7 8 , 8
9 5
8 , 3
5 1 , 2
5 5
2 , 6
7 2 , 3
6 0
4 7 %
5 , 8
0 9 , 8
4 7
( 2 , 5
4 1 , 4 0 8
)
( 3 0 % )
D e b t S e r v i c e
1 1 6 , 4
2 1 , 6
6 7
1 3 7 , 4
6 6 , 4
2 0
1 3 9 , 8
2 4 , 5
2 4
2 , 3
5 8 , 1
0 4
2 %
1 6 5 , 8
6 8 , 8
5 3
2 6 , 0
4 4 , 3 2 9
1 9 %
S e r v i c e s o f O t h e r D e p a r t m e n t s
1 2 2 , 1
1 1 , 5
0 8
1 2 7 , 1
3 9 , 0
8 6
1 3 5 , 6
4 1 , 1
7 4
8 , 5
0 2 , 0
8 8
7 %
1 3 8 , 2
8 6 , 9
6 0
2 , 6
4 5 , 7 8 6
2 %
T r a n s f e r s O u t
2 3 8 , 0
1 7 , 3
0 2
1 6 6 , 5
1 3 , 3
7 9
1 6 4 , 3
7 3 , 7
6 5
( 2 , 1
3 9 , 6
1 4 )
( 1 % )
1 9 2 , 4
4 5 , 3
7 2
2 8 , 0
7 1 , 6 0 7
1 7 %
B u d g e t a r y R e s e r v e s
0
1 2 , 3
3 2 , 1
1 1
3 6 , 4
2 3 , 4
8 0
2 4 , 0
9 1 , 3
6 9
N / A
4 1 , 6
5 9 , 2
2 3
5 , 2
3 5 , 7 4 3
1 4 %
T r a n s f e r A d j u s t m e n t s - U s e s
( 1 9 9 , 9
0 2 , 8
6 3 ) ( 3 5 3 , 7
4 4 , 0
1 6 )
( 3 6 1 , 7
6 2 , 7
8 3 )
( 8 , 0
1 8 , 7
6 7 )
2 %
( 3 9 8 , 3
6 8 , 7
4 0 )
( 3 6 , 6
0 5 , 9 5 7
)
1 0 %
U s e s - O p e r a t i n g E x p e n d i t u r e
s T o t a l
6 7 1 , 0 9 1 , 4 4 3
5 4
9 , 5 9 1 , 0 8 1
5 9 0 , 3 7 2 , 3 4 4
4 0 , 7 8 1 , 2 6 3
7 %
6 3 1 , 8 7 1 , 4 2 0
4 1 , 4 9 9 , 0 7 6
7 %

8/9/2019 Mayor's Proposed 2010-11 May Budget
http://slidepdf.com/reader/full/mayors-proposed-2010-11-may-budget 80/107
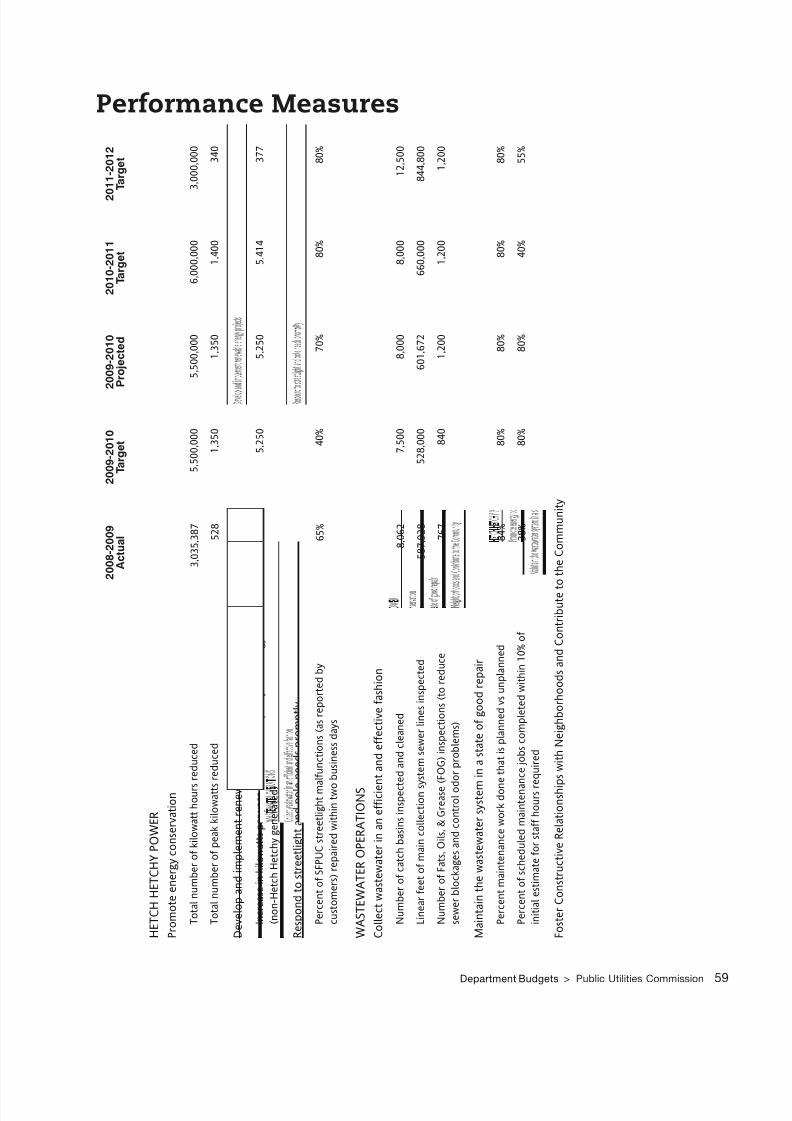
8/9/2019 Mayor's Proposed 2010-11 May Budget
http://slidepdf.com/reader/full/mayors-proposed-2010-11-may-budget 81/107
Department Budgets > Public Utilities Commission 59
Performance Measures
2 0 0 8 - 2 0 0 9
A c t u a l
2 0 0 9 - 2 0 1 0
T a r g e t
2 0 0 9 - 2 0 1 0
P r o j e c t e d
2 0 1 0 - 2 0 1 1
T a r g e t
2 0 1 1 - 2 0 1 2
T a r g e t
H E T C H H E T C H Y P O W E R
P r o m o t e e n e r g y c o n s e r v a t i o n
T o t a l n u m b e r o f k i l o w a t t h o u r s
r e d u c e d
3 , 0 3 5 , 3 8 7
5 , 5 0 0 , 0 0 0
5 , 5 0 0 , 0 0 0
6 , 0 0 0 , 0 0 0
3 , 0 0 0 , 0 0 0
T o t a l n u m b e r o f p e a k k i l o w a t t s
r e d u c e d
5 2 8
1 , 3 5 0
1 , 3 5 0
1 , 4 0 0
3 4 0
D e v e l o p a n d i m p l e m e n t r e n e w a
b l e e n e r g y p r o j e c t s
I n c r e a s e i n k i l o w a t t s p e r y e a r o f r e n e w a b l e c a p a c i t y a n d e n e r g y
( n o n - H e t c h H e t c h y g e n e r a t e d )
0
5 , 2 5 0
5 , 2 5 0
5 , 4 1 4
3 7 7
R e s p o n d t o s t r e e t l i g h t a n d p o l e
n e e d s p r o m p t l y
P e r c e n t o f S F P U C s t r e e t l i g h t m a l f u n c t i o n s ( a s r e p o r t e d b y
c u s t o m e r s ) r e p a i r e d w i t h i n t w o
b u s i n e s s d a y s
6 5 %
4 0 %
7 0 %
8 0 %
8 0 %
W A S T E W A T E R O P E R A T I O N S
C o l l e c t w a s t e w a t e r i n a n e f f i c i e n t a n d e f f e c t i v e f a s h i o n
N u m b e r o f c a t c h b a s i n s i n s p e c t
e d a n d c l e a n e d
8 , 0 6 2
7 , 5 0 0
8 , 0 0 0
8 , 0 0 0
1 2 , 5 0 0
L i n e a r f e e t o f m a i n c o l l e c t i o n s y s t e m s e w e r l i n e s i n s p e c t e d
5 8 7 , 9 2 8
5 2 8 , 0 0 0
6 0 1 , 6 7 2
6 6 0 , 0 0 0
8 4 4 , 8 0 0
N u m b e r o f F a t s , O i l s , & G r e a s e ( F O G ) i n s p e c t i o n s ( t o r e d u c e
s e w e r b l o c k a g e s a n d c o n t r o l o d
o r p r o b l e m s )
7 6 7
8 4 0
1 , 2 0 0
1 , 2 0 0
1 , 2 0 0
M a i n t a i n t h e w a s t e w a t e r s y s t e m
i n a s t a t e o f g o o d r e p a i r
P e r c e n t m a i n t e n a n c e w o r k d o n
e t h a t i s p l a n n e d v s u n p l a n n e d
8 4 %
8 0 %
8 0 %
8 0 %
8 0 %
P e r c e n t o f s c h e d u l e d m a i n t e n a n c e j o b s c o m p l e t e d w i t h i n 1 0 % o f
i n i t i a l e s t i m a t e f o r s t a f f h o u r s r e q u i r e d
3 8 %
8 0 %
8 0 %
4 0 %
5 5 %
F o s t e r C o n s t r u c t i v e R e l a t i o n s h i p s w i t h N e i g h b o r h o o d s a n d C o n t r i b u t e t
o t h e C o m m u n i t y

8/9/2019 Mayor's Proposed 2010-11 May Budget
http://slidepdf.com/reader/full/mayors-proposed-2010-11-may-budget 82/107
60 Mayor’s Proposed Budget 2010-11
Performance Measures
2 0 0 8 - 2 0 0 9
A c t u a l
2 0 0 9 - 2 0 1 0
T a r g e t
2 0 0 9 - 2 0 1 0
P r o j e c t e d
2 0 1
0 - 2 0 1 1
T
a r g e t
W A T E R D I S T R I B U T I O N
M a i n t a i n a n d i m p r o v e c u s t o m e r s e r v i c e
P e r c e n t o f c u s t o m e r i n q u i r i e s o
r c o m p l a i n t s r e s p o n d e d t o w i t h i n
2 b u s i n e s s h o u r s o f i n i t i a l c o n t a
c t
1 0 0 %
1 0 0 %
1 0 0 %
1 0 0 %
1 0 0 %
U n p l a n n e d d i s r u p t i o n s o f l e s s t h a n 4 h o u r s i n S a n F r a n c i s c o ( p e r
1 , 0 0 0 c u s t o m e r a c c o u n t s )
0 . 6 3
1 . 1 0
1 . 1 0
1 . 1 0
1 . 1 0
M a i n t a i n i n f r a s t r u c t u r e t o k e e p
w a t e r s y s t e m i n a s t a t e o f g o o d r e p a i r a n d o p e r a t i o n
N u m b e r o f r e s i d e n t i a l a n d c o m m e r c i a l w a t e r m e t e r s r e p l a c e d i n
S a n F r a n c i s c o
1 , 1 1 5
5 0 0
1 , 2 5 0
5 0 0
5 0 0
M i l e s o f w a t e r m a i n r e p l a c e d i n
S a n F r a n c i s c o
8 . 0
6 . 0
6 . 0
6 . 0
6 . 0
P e r c e n t o f m a i n t e n a n c e t h a t i s s c h e d u l e d r a t h e r t h a n
u n s c h e d u l e d i n t h e H e t c h H e t c h y s y s t e m
4 8 %
4 5 %
5 0 %
5 0 %
5 0 %
G e n e r a t e p o w e r t o h e l p m e e t t h
e n e e d s o f t h e C i t y a n d C o u n t y o f S a n F
r a n c i s c o
P o w e r g e n e r a t e d t o m e e t S a n F
r a n c i s c o ' s n e e d s , i n g i g a w a t t h o u r s
( a n n u a l t a r g e t s e t a s s u m i n g a v e
r a g e a n n u a l h y d r o l o g y )
1 , 5 2 7
1 , 6 0 0
1 , 3 8 3
1 , 6 0 0
1 , 6 0 0

8/9/2019 Mayor's Proposed 2010-11 May Budget
http://slidepdf.com/reader/full/mayors-proposed-2010-11-may-budget 83/107
Retirement 61
Retirement
MissionTo secure, protect and prudently invest the City’s pension trust assets; administer
mandated benet programs; and provide promised benets.
Servicese San Francisco City and County Employees’ Retirement System (SFERS) provides the ollowing services:
Administration Division directs the overall administration o the Retirement System includingimplementation o Retirement Board policies and directives; implementation o legislative changes to the
Retirement System; legal and procedural compliance o all activities o the Retirement System; administrationo member pension benets counseling and payment processing; administration o the disability retirementhearing ocer process; and management o the Retirement System’s inormation technology, budget andnancial systems.
etirement Services Division provides retirement counseling or active and retired members; maintainshistorical employment data and retirement accounts or both active and retired members; calculates andprocesses all benets payable as a result o a member’s retirement, death or termination o employment;disburses monthly retirement allowances to more than 22,000 retirees and beneciaries; and maintainsRetirement System nancial records and reporting in compliance with all applicable legal provisions.
Investment Division manages and invests the $13.3 billion (as o February 28, 2010) Retirement Trustin accordance with the investment policy o the Retirement Board; monitors the perormance o externalinvestment managers; and maintains inormation and analysis o capital markets and institutional investmentopportunities.
Deerred ompensation Division oversees and administers the City’s $1.7 billion Deerred CompensationPlan (a “457” plan). e 457 Plan and trust are established separately rom, and independent o the denedbenet pension plan .
For more inormation, call (415) 487-7020; or visit www.sers.org
Budget Data Summary2008-2009
Actual
2009-2010
Budget
2010-2011
Proposed
Change from
2009-2010
% Changed from
2009-2010
Total Expenditures 18,542,068 18,754,516 19,302,693 548,177 3%
Total FTE 99.46 96.87 97.71 0.84 1%

8/9/2019 Mayor's Proposed 2010-11 May Budget
http://slidepdf.com/reader/full/mayors-proposed-2010-11-may-budget 84/107
62 Mayor’s Proposed Budget 2010-11
Administration 8%
Retirement Service & Accounting 71%
Deferred Compensation 3%
Investment 18%
Deferred Compensation 3%
Investment 14%
Administration 8%
Retirement Services& Accounting 75%
Stafng by Service Area
Resources by Service Area
n fiscal Year 2010-11, only 8% o the Retirement System sta works in Aministration.
he majority o the Retirement System’s resources are allocate to Services an Accounting.
Budget Issues and DetailsIn Fiscal Year 2010-11, the Retirement System’s operating budget will remain relatively at, with no staf additions and a slight increase o operating expenses o 4% due to salary and ringe adjustments. In FiscalYear 2010-11, the percent o employer contributions to retirement accounts will increase rom 9.49% to13.56%. As a result, the City and County o San Francisco is projected to make a contribution o $381 millionin Fiscal Year 2010-11, an increase o $88.3 million (24%) rom Fiscal Year 2009-10.
educing ity ostse Employees’ Retirement System (SFERS) will continue to work to maintain superior levels o investmentreturns on SFERS Trust assets. e SFERS’ goal is to achieve a return on trust investments that will be rankedin the top 50th percentile or better, based on average ve-year returns, among public pension unds with $1billion or more in trust assets. SFERS has exceeded this goal or the past ve years and anticipates that it willcontinue to meet or exceed this target over the next three years.
hanges to Employer ontributionsFor Fiscal Year 2010-11, the SFERS employer contributions rate will increase rom 9.49 percent to 13.56percent. is increase reects plan amendments rom Proposition B, passed in June 2008, investment lossesor Fiscal Years 2007-08 and 2008-09, and the Retirement Board’s lowering o the expected rate o earnings
on plan assets rom 8.0% to 7.75% efective July 1, 2008.
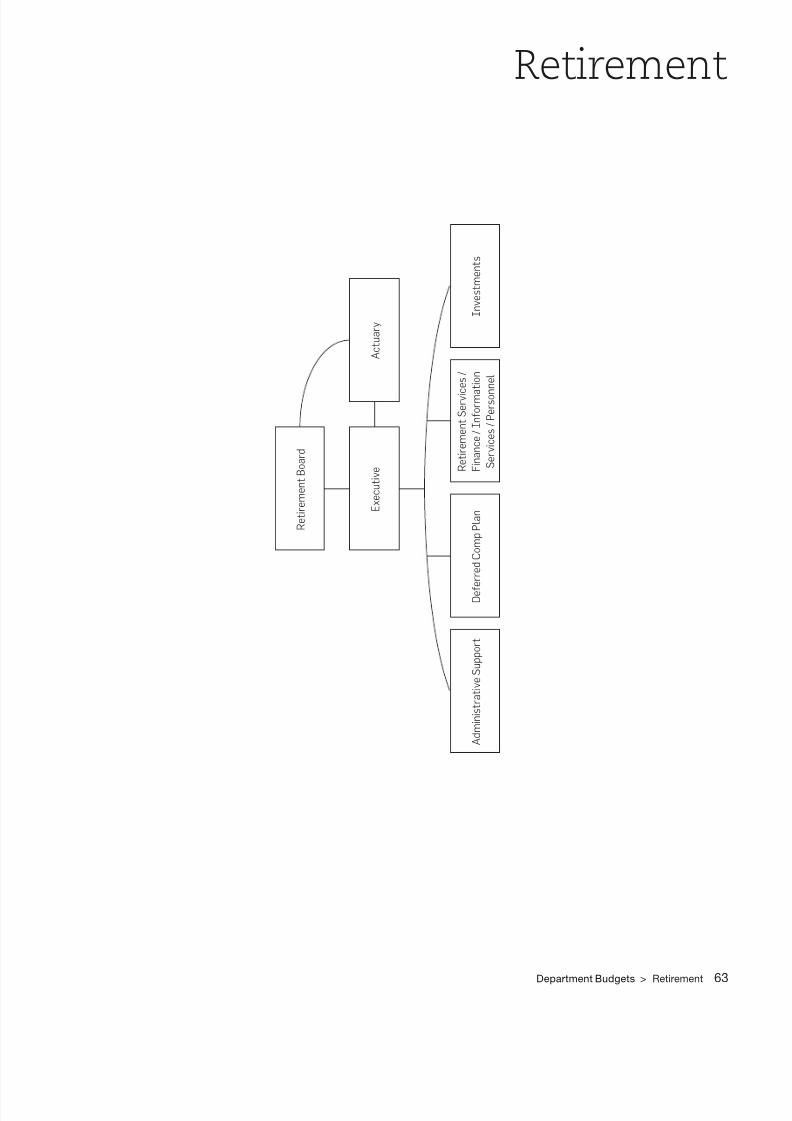
8/9/2019 Mayor's Proposed 2010-11 May Budget
http://slidepdf.com/reader/full/mayors-proposed-2010-11-may-budget 85/107
Department Budgets > Retirement 63
Retirement
E x e c u t i v e
A c t u a r y
R e t i r e m e n t B o a r
A m i n i s t r a t i v e S u p p o r t
d e
e r r e C o m p P l a n
n v e s t m e n t s
R e t i r e m e n t S e r v i c
e s /
f i n a n c e / n o r m a
t i o n
S e r v i c e s / P e r s o n
n e l

8/9/2019 Mayor's Proposed 2010-11 May Budget
http://slidepdf.com/reader/full/mayors-proposed-2010-11-may-budget 86/107
Total Budget – Historical Comparison
64 Mayor’s Proposed Budget 2010-11
2008-2009 2009-2010 2010-2011
ActualOriginal
Budget
Proposed
Budget
Chg from
2009-2010
% Chg from
2009-2010
AUTHORIZED POSITIONS
Total Authorized 99.46 96.87 97.71 0.84 1%
Net Operating Positions 99.46 96.87 97.71 0.84 1%
SOURCES
Use of Money or Property 246,138 251,762 253,000 1,238 0%
Charges for Services 582,503 562,142 577,046 14,904 3%
Other Revenues 17,688,440 17,915,612 18,447,647 532,035 3%
Expenditure Recovery 24,987 25,000 25,000 0 0
Sources Total 18,542,068 18,754,516 19,302,693 548,177 3%
USES - OPERATING EXPENDITURES
Salaries & Wages 8,821,477 8,872,822 8,721,071 (151,751) (2%)
Fringe Benefits 3,164,970 3,231,374 3,637,139 405,765 13%
Overhead 0 0 225,716 225,716 N/A
Professional & Contractual Services 3,721,301 3,640,255 3,724,769 84,514 2%
Materials & Supplies 146,579 161,000 187,317 26,317 16%
Equipment 38,770 92,253 44,013 (48,240) (52%)
Services of Other Departments 2,648,971 2,756,812 2,762,668 5,856 0%
Uses - Operating Expenditures Total 18,542,068 18,754,516 19,302,693 548,177 3%
USES BY PROGRAM RECAP
Administration 2,238,784 2,392,596 2,443,480 50,884 2%
Employee Deferred Comp Plan 582,503 565,142 580,046 14,904 3%
Investment 2,583,377 2,817,594 2,742,532 (75,062) (3%)
Retirement Services 13,137,404 12,979,184 13,536,635 557,451 4%
Uses by Program Recap Total 18,542,068 18,754,516 19,302,693 548,177 3%

8/9/2019 Mayor's Proposed 2010-11 May Budget
http://slidepdf.com/reader/full/mayors-proposed-2010-11-may-budget 87/107
Department Budgets > Retirement 65
Performance Measures
2 0 0 8 - 2 0 0 9
A c t u a l
2 0 0 9 - 2 0 1 0
T a r g e t
2 0 0 9 - 2 0 1 0
P r o j e c t e d
2 0 1
0 - 2 0 1 1
T
a r g e t
E M P L O Y E E D E F E R R E D C O M P
P L A N
P r o v i d e e f f e c t i v e a d m i n i s t r a t i o n o f t h e D e f e r r e d C o m p e n s a t i o n P l a n
P e r c e n t a g e o f e l i g i b l e C i t y e m p
l o y e e s w h o p a r t i c i p a t e i n t h e
D e f e r r e d C o m p e n s a t i o n P l a n
5 2 %
5
5 %
5 4 %
5 0 %
I N V E S T M E N T
M a x i m i z e i n v e s t m e n t r e t u r n s a t a n a c c e p t a b l e r i s k l e v e l f o r P l a n p a r t i c i p a n t s
R e t u r n o n i n v e s t m e n t r a n k i n g o f 5 0 t h p e r c e n t i l e o r b e t t e r a m o n g
p u b l i c p e n s i o n p l a n s w i t h a s s e t s i n e x c e s s o f $ 1 b i l l i o n , u s i n g 5 -
y e a r a v e r a g e r e t u r n ( 1 e q u a l s y
e s )
1
1
1
1

8/9/2019 Mayor's Proposed 2010-11 May Budget
http://slidepdf.com/reader/full/mayors-proposed-2010-11-may-budget 88/107

8/9/2019 Mayor's Proposed 2010-11 May Budget
http://slidepdf.com/reader/full/mayors-proposed-2010-11-may-budget 89/107
Rent Arbitration Board 67
Rent Arbitration Board
MissionTo protect tenants rom excessive rent increases and unjust evictions while assuring
landlords o air and adequate rents; provide air and even-handed treatment or both
tenants and landlords through ecient and consistent administration o the rent law;
and promote the preservation o sound, afordable housing and enhance the ethnic
and cultural diversity that is unique to San Francisco.
Servicese Rent Arbitration Board provides the ollowing services:
Public Inormation and ounseling to provide inormation to the public regarding the Rent Ordinanceand Rules and Regulations, as well as other municipal, state and ederal ordinances in the area o landlord/tenant law.
Hearings and Appeals, which consists o ten Administrative Law Judges (ALJs) who are supervised bytwo Senior Administrative Law Judges. e ALJs are attorneys who conduct arbitrations and mediations toresolve disputes between landlords and tenants and issue decisions in accordance with applicable laws.
For more inormation, call (415) 252-4601 or 311; or visit www.srb.org
Budget Data Summary2008-2009
Actual
2009-2010
Budget
2010-2011
Proposed
Change from
2009-2010
% Changed from
2009-2010
Total Expenditures 5,223,560 5,381,683 5,517,200 135,517 3%
Total FTE 29.03 28.92 28.94 0.02 0%
Budget Issues and Detailse Rent Arbitration Board proposes a $5.5 million budget, which represents a three percent increase rom
the Fiscal Year 2009-10 budget. is change is driven by increasing salary and ringe costs.
ent Board Feese Rent Board ee is currently applied to all rental units in the City that come under the jurisdiction o theRent Ordinance with the exception o Section 8 units. Annually, ater taking into account any operatingsavings rom previous years, the Controller’s Oce adjusts the Rent Board ee to cover the operating costso the Department. In Fiscal Year 2010–11, the ee will increase rom $29 per unit to $30 per unit to covermandatory increases in compensation, ringe benets, possible increased litigation due to changes in the lawand a reduction in prior-year und balances.
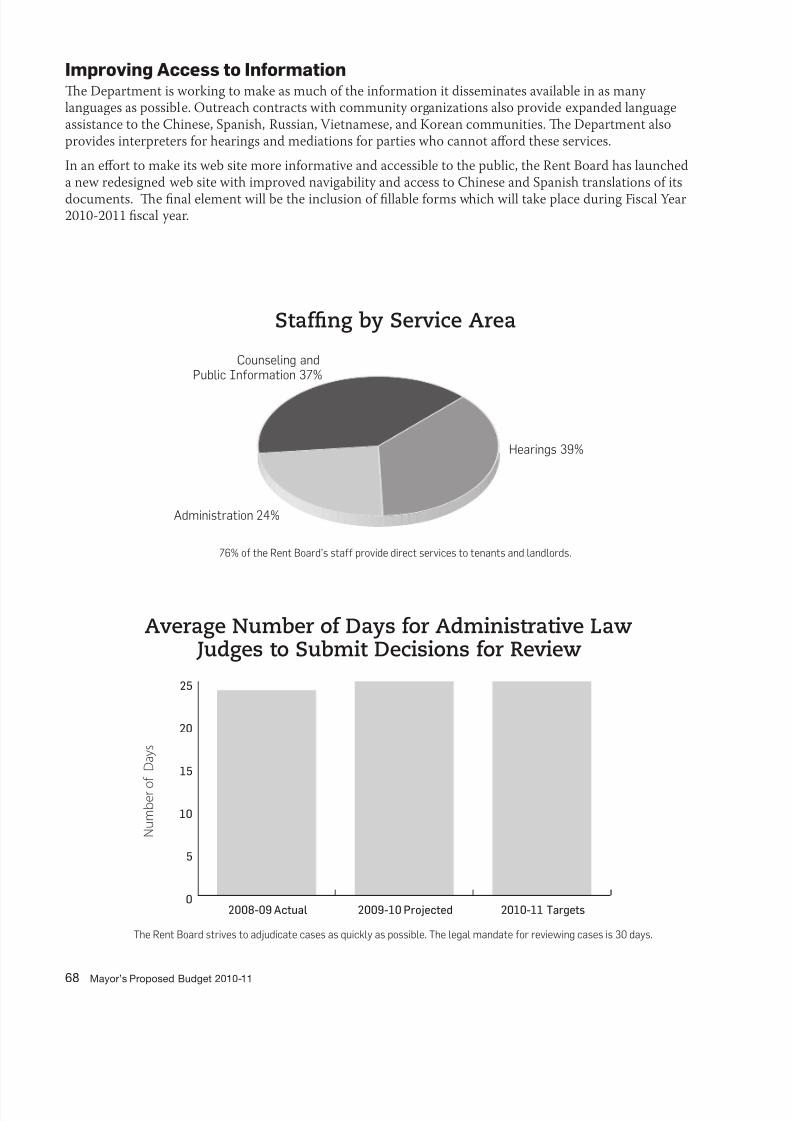
8/9/2019 Mayor's Proposed 2010-11 May Budget
http://slidepdf.com/reader/full/mayors-proposed-2010-11-may-budget 90/107
68 Mayor’s Proposed Budget 2010-11
0
5
10
15
20
25
2010-11 Targets2009-10 Projected2008-09 Actual
N u m b e r o
f D a y s
he Rent Boar strives to ajuicate cases as quickly as possible. he legal manate or reviewing cases is 30 ays.
Administration 24%
Hearings 39%
Counseling andPublic Information 37%
Stafng by Service Area
76% o the Rent Boar’s sta provie irect services to tenants an lanlors.
Average Number of Days for Administrative Law Judges to Submit Decisions for Review
Improving Access to Inormatione Department is working to make as much o the inormation it disseminates available in as manylanguages as possible. Outreach contracts with community organizations also provide expanded languageassistance to the Chinese, Spanish, Russian, Vietnamese, and Korean communities. e Department alsoprovides interpreters or hearings and mediations or parties who cannot aford these services.
In an efort to make its web site more inormative and accessible to the public, the Rent Board has launcheda new redesigned web site with improved navigability and access to Chinese and Spanish translations o its
documents. e nal element will be the inclusion o llable orms which will take place during Fiscal Year2010-2011 scal year.

8/9/2019 Mayor's Proposed 2010-11 May Budget
http://slidepdf.com/reader/full/mayors-proposed-2010-11-may-budget 91/107
Department Budgets > Rent Arbitration Board 69
Rent Arbitration Board
E x e c u t i v e
R e n t B o a r
C o m m i s s i o n
A m i n i s t r a t i v e
L a w J u g e s
C i t i z e n s C o m p l a i n t s
A
m i n i s t r a t i o n

8/9/2019 Mayor's Proposed 2010-11 May Budget
http://slidepdf.com/reader/full/mayors-proposed-2010-11-may-budget 92/107
Total Budget – Historical Comparison
70 Mayor’s Proposed Budget 2010-11
2008-2009 2009-2010 2010-2011
ActualOriginal
Budget
Proposed
Budget
Chg from
2009-2010
% Chg from
2009-2010
AUTHORIZED POSITIONS
Total Authorized 29.03 28.92 28.94 0.02 0%
Net Operating Positions 29.03 28.92 28.94 0.02 0%
SOURCES
Charges for Services 4,502,536 4,833,612 4,911,619 78,007 2%
Expenditure Recovery 52,145 50,000 71,085 21,085 42%
Fund Balance 668,879 498,071 534,496 36,425 7%
Sources Total 5,223,560 5,381,683 5,517,200 135,517 3%
USES - OPERATING EXPENDITURES
Salaries & Wages 2,971,398 2,945,746 2,967,502 21,756 1%
Fringe Benefits 846,895 1,041,067 1,202,555 161,488 16%
Overhead 66,742 61,601 17,509 (44,092) (72%)
Professional & Contractual Services 82,832 105,120 109,058 3,938 4%
Aid Assistance / Grants 120,000 120,000 120,000 0 0
Materials & Supplies 27,833 28,029 26,967 (1,062) (4%)
Services of Other Departments 1,107,860 1,080,120 1,073,609 (6,511) (1%)
Uses - Operating Expenditures Total 5,223,560 5,381,683 5,517,200 135,517 3%
USES BY PROGRAM RECAP
Rent Board 5,223,560 5,381,683 5,517,200 135,517 3%
Uses by Program Recap Total 5,223,560 5,381,683 5,517,200 135,517 3%
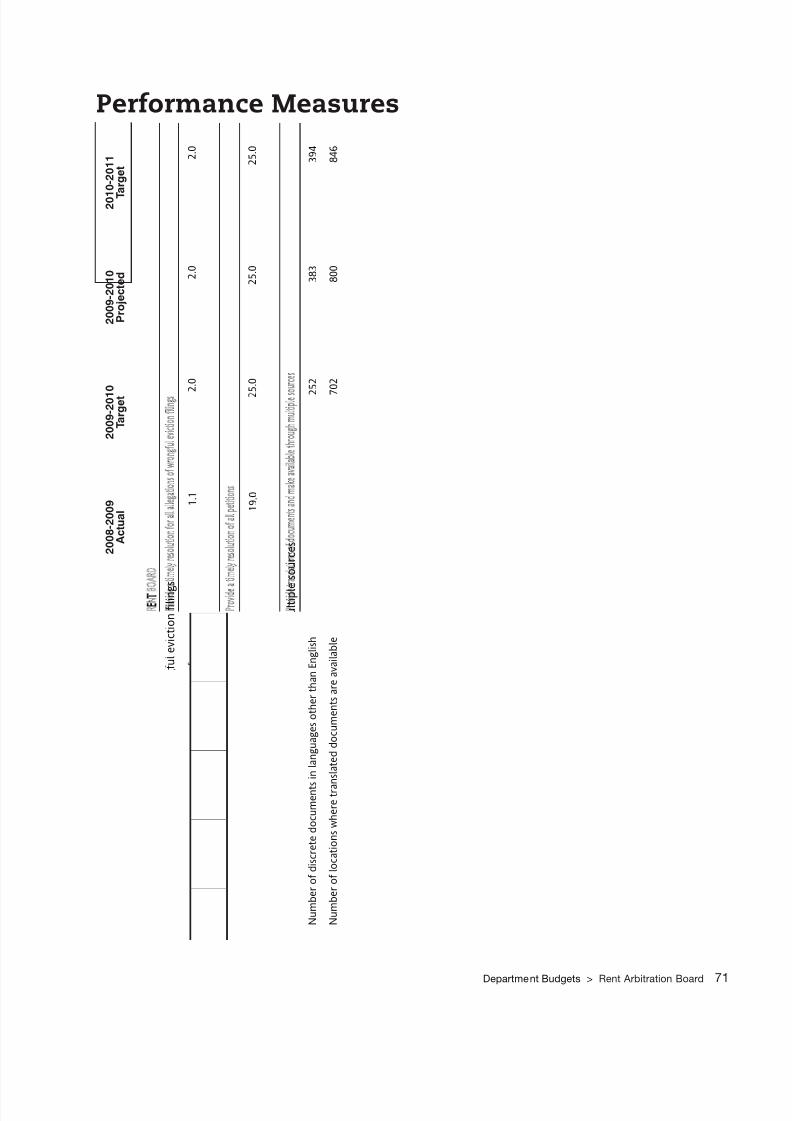
8/9/2019 Mayor's Proposed 2010-11 May Budget
http://slidepdf.com/reader/full/mayors-proposed-2010-11-may-budget 93/107
Department Budgets > Rent Arbitration Board 71
Performance Measures
2 0 0 8 - 2 0 0 9
A c t u a l
2 0 0 9 - 2 0 1 0
T a r g e t
2 0 0 9 - 2 0 1 0
P r o j e c t e d
2 0 1
0 - 2 0 1 1
T
a r g e t
R E N T B O A R D
P r o v i d e a t i m e l y r e s o l u t i o n f o r a
l l a l l e g a t i o n s o f w r o n g f u l e v i c t i o n f i l i n g
s
A v e r a g e n u m b e r o f d a y s n e e d e
d t o p r o c e s s a l l e g a t i o n s o f
w r o n g f u l e v i c t i o n s
1 . 1
2 . 0
2 . 0
2 . 0
P r o v i d e a t i m e l y r e s o l u t i o n o f a l l p e t i t i o n s
A v e r a g e n u m b e r o f d a y s f o r A d
m i n i s t r a t i v e L a w J u d g e s t o s u b m i t
d e c i s i o n s f o r r e v i e w
1 9 . 0
2 5 . 0
2 5 . 0
2 5 . 0
P r o v i d e t r a n s l a t i o n s o f d o c u m e n t s a n d m a k e a v a i l a b l e t h r o u g h m u l t i p l e
s o u r c e s
N u m b e r o f d i s c r e t e d o c u m e n t s
i n l a n g u a g e s o t h e r t h a n E n g l i s h
2 4 3
2
5 2
3 8 3
3 9 4
N u m b e r o f l o c a t i o n s w h e r e t r a n s l a t e d d o c u m e n t s a r e a v a i l a b l e
6 2 9
7
0 2
8 0 0
8 4 6

8/9/2019 Mayor's Proposed 2010-11 May Budget
http://slidepdf.com/reader/full/mayors-proposed-2010-11-may-budget 94/107
8/9/2019 Mayor's Proposed 2010-11 May Budget
http://slidepdf.com/reader/full/mayors-proposed-2010-11-may-budget 95/107
Capital Projects

8/9/2019 Mayor's Proposed 2010-11 May Budget
http://slidepdf.com/reader/full/mayors-proposed-2010-11-may-budget 96/107

8/9/2019 Mayor's Proposed 2010-11 May Budget
http://slidepdf.com/reader/full/mayors-proposed-2010-11-may-budget 97/107
Capital Projects 75
Capital Projects
Summary of May 1 Capital Projects
A key role o the City and County o San Francisco is to provide the acilities and inrastructure that maintainand improve San Francisco’s quality o lie, environment, and economy. ese include the City’s re stations,hospitals, libraries, parks, police stations, roads and public transit systems — the physical assets that shapeurban lie. Each year, the Capital Planning Program, under the direction o the City Administrator, updatesthe City’s 10-year Capital Plan, which outlines a long-term strategy or these investments. e Capital Planor Fiscal Years 2011 through 2020 was adopted by the Board o Supervisors in April, 2010 and providesinormation to help guide the Mayor’s budget submission.
e Mayor’s proposed May budget submission includes $226.5 million in capital projects or Fiscal Year
2010-2011 and $274.0 million or Fiscal Year 2011-12, generating over 1,500 local jobs over the lie o theprojects. Under the City’s 10-year Capital Plan, the departments in the Mayor’s May 1 budget submissionplan to invest $14.4 billion in capital projects over the next decade, creating over 1,000 jobs per year. eseprojects are unded by various revenue sources, including ee and concession revenue, bond proceeds, andstate and ederal grants. Major projects included in this submission are the renovation o Terminal 2 at SanFrancisco International Airport, open space improvements along the Port’s southern waterront, and theinstallation o energy-ecient Light Emitting Diode (LED) bulbs in over 17,000 streetlights operated by thePublic Utilities Commission. A list o proposed projects is presented on the ollowing pages.
Not included in this submission are several major Enterprise Department projects that are expected to beginor make signicant progress over the next two scal years, including the Central Subway, Doyle Drive, theWater System Improvement Project, and the Transbay Terminal. ese projects are unded outside o the
budget process through supplemental appropriations or grant resolutions.A complete capital project submission covering all City departments will be included in the Mayor’sproposed June budget. For more inormation on the City’s Capital Planning Program visit www.sgov.org/cpp.
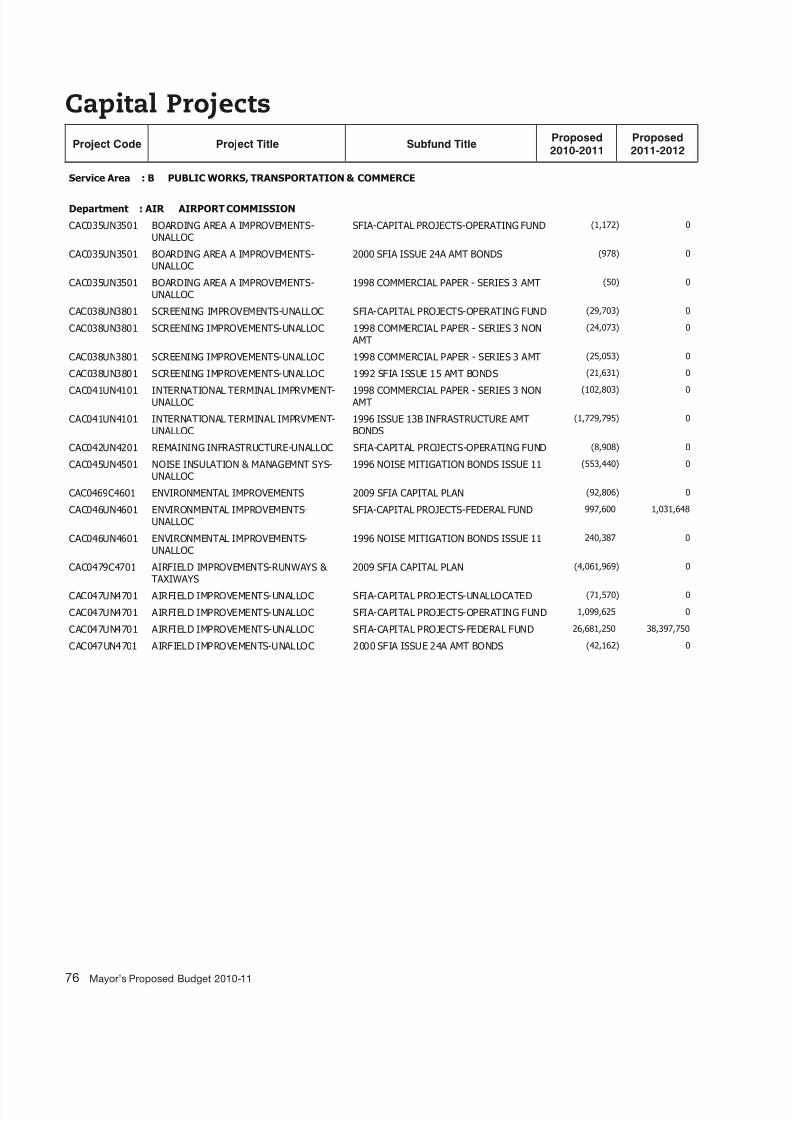
8/9/2019 Mayor's Proposed 2010-11 May Budget
http://slidepdf.com/reader/full/mayors-proposed-2010-11-may-budget 98/107
76 Mayor’s Proposed Budget 2010-11
Capital Projects
Project Code Project Title Subfund TitleProposed2010-2011
Proposed2011-2012
Service Area : B PUBLIC WORKS, TRANSPORTATION & COMMERCE
Department : AIR AIRPORT COMMISSION
CAC035UN3501 BOARDING AREA A IMPROVEMENTS-UNALLOC
SFIA-CAPITAL PROJECTS-OPERATING FUND (1,172) 0
CAC035UN3501 BOARDING AREA A IMPROVEMENTS-UNALLOC
2000 SFIA ISSUE 24A AMT BONDS (978) 0
CAC035UN3501 BOARDING AREA A IMPROVEMENTS-UNALLOC
1998 COMMERCIAL PAPER - SERIES 3 AMT (50) 0
CAC038UN3801 SCREENING IMPROVEMENTS-UNALLOC SFIA-CAPITAL PROJECTS-OPERATING FUND (29,703) 0
CAC038UN3801 SCREENING IMPROVEMENTS-UNALLOC 1998 COMMERCIAL PAPER - SERIES 3 NON AMT
(24,073) 0
CAC038UN3801 SCREENING IMPROVEMENTS-UNALLOC 1998 COMMERCIAL PAPER - SERIES 3 AMT (25,053) 0
CAC038UN3801 SCREENING IMPROVEMENTS-UNALLOC 1992 SFIA ISSUE 15 AMT BONDS (21,631) 0
CAC041UN4101 INTERNATIONAL TERMINAL IMPRVMENT-UNALLOC
1998 COMMERCIAL PAPER - SERIES 3 NON AMT
(102,803) 0
CAC041UN4101 INTERNATIONAL TERMINAL IMPRVMENT-UNALLOC
1996 ISSUE 13B INFRASTRUCTURE AMTBONDS
(1,729,795) 0
CAC042UN4201 REMAINING INFRASTRUCTURE-UNALLOC SFIA-CAPITAL PROJECTS-OPERATING FUND (8,908) 0
CAC045UN4501 NOISE INSULATION & MANAGEMNT SYS-UNALLOC
1996 NOISE MITIGATION BONDS ISSUE 11 (553,440) 0
CAC0469C4601 ENVIRONMENTAL IMPROVEMENTS 2009 SFIA CAPITAL PLAN (92,806) 0
CAC046UN4601 ENVIRONMENTAL IMPROVEMENTS-UNALLOC
SFIA-CAPITAL PROJECTS-FEDERAL FUND 997,600 1,031,648
CAC046UN4601 ENVIRONMENTAL IMPROVEMENTS-UNALLOC
1996 NOISE MITIGATION BONDS ISSUE 11 240,387 0
CAC0479C4701 AIRFIELD IMPROVEMENTS-RUNWAYS & TAXIWAYS
2009 SFIA CAPITAL PLAN (4,061,969) 0
CAC047UN4701 AIRFIELD IMPROVEMENTS-UNALLOC SFIA-CAPITAL PROJECTS-UNALLOCATED (71,570) 0
CAC047UN4701 AIRFIELD IMPROVEMENTS-UNALLOC SFIA-CAPITAL PROJECTS-OPERATING FUND 1,099,625 0
CAC047UN4701 AIRFIELD IMPROVEMENTS-UNALLOC SFIA-CAPITAL PROJECTS-FEDERAL FUND 26,681,250 38,397,750
CAC047UN4701 AIRFIELD IMPROVEMENTS-UNALLOC 2000 SFIA ISSUE 24A AMT BONDS (42,162) 0

8/9/2019 Mayor's Proposed 2010-11 May Budget
http://slidepdf.com/reader/full/mayors-proposed-2010-11-may-budget 99/107
Department Budgets > Capital Projects 77
Capital Projects
Project Code Project Title Subfund TitleProposed2010-2011
Proposed2011-2012
Service Area : B PUBLIC WORKS, TRANSPORTATION & COMMERCE
CAC047UN4701 AIRFIELD IMPROVEMENTS-UNALLOC 1998 COMMERCIAL PAPER - SERIES 3 NON AMT
(4,346) 0
CAC047UN4701 AIRFIELD IMPROVEMENTS-UNALLOC 1993 SFIA-ISSUE 4-REFUNDING BONDS FD (3,995) 0
CAC047UN4701 AIRFIELD IMPROVEMENTS-UNALLOC 1992 SFIA-ISSUE 12B-AMT BONDS (3,755) 0
CAC047UN4701 AIRFIELD IMPROVEMENTS-UNALLOC 1992 SFIA ISSUE 26B-NON-AMT BONDS (72) 0
CAC047UN4701 AIRFIELD IMPROVEMENTS-UNALLOC 1992 SFIA ISSUE 23B-NON AMT BONDS (84,553) 0
CAC047UN4701 AIRFIELD IMPROVEMENTS-UNALLOC 1992 SFIA ISSUE 15 AMT BONDS (781) 0
CAC0489C4801 SAFETY AND SECURITY IMPROVEMENTS 2009 SFIA CAPITAL PLAN (2,000,000) 0
CAC048UN4801 SAFETY & SECURITY IMPROVEMENTS-UNALLOC
SFIA-CAPITAL PROJECTS-UNALLOCATED (103,553) 0
CAC048UN4801 SAFETY & SECURITY IMPROVEMENTS-UNALLOC
SFIA-CAPITAL PROJECTS-OPERATING FUND 1,853,222 0
CAC048UN4801 SAFETY & SECURITY IMPROVEMENTS-UNALLOC
2004 SFIA ISSUE 31A AMT BONDS 7,405,779 0
CAC048UN4801 SAFETY & SECURITY IMPROVEMENTS-UNALLOC
1998 COMMERCIAL PAPER - SERIES 3 NON AMT
(45,365) 0
CAC048UN4801 SAFETY & SECURITY IMPROVEMENTS-UNALLOC
1998 COMMERCIAL PAPER - SERIES 3 AMT (159,846) 0
CAC048UN4801 SAFETY & SECURITY IMPROVEMENTS-UNALLOC
1992 SFIA ISSUE 23B-NON AMT BONDS 84,553 0
CAC048UN4801 SAFETY & SECURITY IMPROVEMENTS-UNALLOC
1992 SFIA ISSUE 15 AMT BONDS (1,889) 0
CAC0509C5001 AIRPORT SUPPORT IMPROVEMENTS 2009 SFIA CAPITAL PLAN (4,565,000) 0
CAC050UN5001 AIRPORT SUPPORT-UNALLOC SFIA-CAPITAL PROJECTS-UNALLOCATED (86,379) 0
CAC050UN5001 AIRPORT SUPPORT-UNALLOC SFIA-CAPITAL PROJECTS-OPERATING FUND 22,165 0
CAC050UN5001 AIRPORT SUPPORT-UNALLOC SFIA-CAPITAL PROJECTS-FEDERAL FUND 20,730,000 27,972,559
CAC050UN5001 AIRPORT SUPPORT-UNALLOC 2009 SFIA CAPITAL PLAN 0 16,000,000
CAC050UN5001 AIRPORT SUPPORT-UNALLOC 2004 SFIA ISSUE 31A AMT BONDS 7,825,462 0
CAC050UN5001 AIRPORT SUPPORT-UNALLOC 2000 SFIA ISSUE 24A AMT BONDS (55,895) 0

8/9/2019 Mayor's Proposed 2010-11 May Budget
http://slidepdf.com/reader/full/mayors-proposed-2010-11-may-budget 100/107
78 Mayor’s Proposed Budget 2010-11
Capital Projects
Project Code Project Title Subfund TitleProposed2010-2011
Proposed2011-2012
Service Area : B PUBLIC WORKS, TRANSPORTATION & COMMERCE
CAC050UN5001 AIRPORT SUPPORT-UNALLOC 1998 COMMERCIAL PAPER - SERIES 3 NON AMT
24,073 0
CAC050UN5001 AIRPORT SUPPORT-UNALLOC 1998 COMMERCIAL PAPER - SERIES 3 AMT (46,032) 0
CAC050UN5001 AIRPORT SUPPORT-UNALLOC 1997 COMMERCIAL PAPER FUND (AMT) (57) 0
CAC050UN5001 AIRPORT SUPPORT-UNALLOC 1996 ISSUE 13B INFRASTRUCTURE AMTBONDS
(29,487) 0
CAC050UN5001 AIRPORT SUPPORT-UNALLOC 1993 SFIA-ISSUE 2-REFUNDING BONDS FD (4,983) 0
CAC050UN5001 AIRPORT SUPPORT-UNALLOC 1992 SFIA ISSUE 15 AMT BONDS 21,631 0
CAC052UN5201 DRAINAGE AND PONDING IMPRVMENTS-
UNALLOC
SFIA-CAPITAL PROJECTS-UNALLOCATED (66,217) 0
CAC052UN5201 DRAINAGE AND PONDING IMPRVMENTS-UNALLOC
SFIA-CAPITAL PROJECTS-OPERATING FUND (2,487) 0
CAC052UN5201 DRAINAGE AND PONDING IMPRVMENTS-UNALLOC
2000 SFIA ISSUE 24A AMT BONDS (202) 0
CAC052UN5201 DRAINAGE AND PONDING IMPRVMENTS-UNALLOC
1998 COMMERCIAL PAPER - SERIES 3 AMT (5,441) 0
CAC052UN5201 DRAINAGE AND PONDING IMPRVMENTS-
UNALLOC
1992 SFIA-ISSUE 9A-AMT BOND (6,432) 0
CAC052UN5201 DRAINAGE AND PONDING IMPRVMENTS-UNALLOC
1992 SFIA ISSUE 18A AMT BONDS (3,685) 0
CAC052UN5201 DRAINAGE AND PONDING IMPRVMENTS-UNALLOC
1977 SFIA-REVENUE BOND FUND (2,076) 0
CAC0549C5401 GROUNSIDE IMPROVEMENTS-VIADUCTIMPV
2009 SFIA CAPITAL PLAN (700,000) 0
CAC0549C5402 GROUNSIDE IMPROVEMENTS-ROADWAY
IMPV
2009 SFIA CAPITAL PLAN (400,000) 0
CAC054UN5401 ROADWAY IMPROVEMENTS-UNALLOC SFIA-CAPITAL PROJECTS-FEDERAL FUND 2,480,381 1,519,619
CAC0559C5501 PARKING IMPROVEMENTS 2009 SFIA CAPITAL PLAN (4,405,000) 0
CAC055UN5501 PUBLIC PARKING LOTS & GARAGES-UNALLOC
1998 COMMERCIAL PAPER - SERIES 3 AMT (161,666) 0

8/9/2019 Mayor's Proposed 2010-11 May Budget
http://slidepdf.com/reader/full/mayors-proposed-2010-11-may-budget 101/107
Department Budgets > Capital Projects 79
Capital Projects
Project Code Project Title Subfund TitleProposed2010-2011
Proposed2011-2012
Service Area : B PUBLIC WORKS, TRANSPORTATION & COMMERCE
CAC0579C5701 TERMINAL IMPROVEMENTS-T2 BOARDING AREA
2009 SFIA CAPITAL PLAN 30,915,769 0
CAC0579C5702 TERMINAL SAFETY IMPROVEMENTS 2009 SFIA CAPITAL PLAN (2,915,000) 0
CAC0579C5703 TERMINAL FACILITY RENOVATIONS 2009 SFIA CAPITAL PLAN 1,917,006 0
CAC057UN5701 TERMINAL RENOVATIONS-UNALLOC TAXABLE COMMERCIAL PAPER 284,197 0
CAC057UN5701 TERMINAL RENOVATIONS-UNALLOC SFIA-CAPITAL PROJECTS-UNALLOCATED 327,719 0
CAC057UN5701 TERMINAL RENOVATIONS-UNALLOC SFIA-CAPITAL PROJECTS-OPERATING FUND 73,404 0
CAC057UN5701 TERMINAL RENOVATIONS-UNALLOC 2009E NON-AMT/PRIVATE ACTIVITY BONDS
2,200,000 1,500,000
CAC057UN5701 TERMINAL RENOVATIONS-UNALLOC 2008 CP SERIES A-AMT JUL-DEC 10,290 0
CAC057UN5701 TERMINAL RENOVATIONS-UNALLOC 2005 SFIA ISSUE 32 AUCTION RATE BONDS 76,775 0
CAC057UN5701 TERMINAL RENOVATIONS-UNALLOC 2004 SFIA ISSUE 31A AMT BONDS 245,614 0
CAC057UN5701 TERMINAL RENOVATIONS-UNALLOC 2003 SFIA ISSUE 29B NON AMT BONDS 453,112 0
CAC057UN5701 TERMINAL RENOVATIONS-UNALLOC 2002 SFIA ISSUE 28B NON AMT BONDS 3,849 0
CAC057UN5701 TERMINAL RENOVATIONS-UNALLOC 2001 SFIA ISSUE 27B NON AMT BONDS 68,747 0
CAC057UN5701 TERMINAL RENOVATIONS-UNALLOC 2000 SFIA ISSUE 24B NON AMT BONDS 173,856 0
CAC057UN5701 TERMINAL RENOVATIONS-UNALLOC 2000 SFIA ISSUE 24A AMT BONDS 99,350 0
CAC057UN5701 TERMINAL RENOVATIONS-UNALLOC 1998 COMMERCIAL PAPER - SERIES 3 NON AMT
739,866 0
CAC057UN5701 TERMINAL RENOVATIONS-UNALLOC 1998 COMMERCIAL PAPER - SERIES 3 AMT 2,113,308 0
CAC057UN5701 TERMINAL RENOVATIONS-UNALLOC 1997 COMMERCIAL PAPER FUND (AMT) 346,151 0
CAC057UN5701 TERMINAL RENOVATIONS-UNALLOC 1996 NOISE MITIGATION BONDS ISSUE 11 313,053 0
CAC057UN5701 TERMINAL RENOVATIONS-UNALLOC 1996 ISSUE 13T INFRASTRUCTURE BONDS 187,916 0
CAC057UN5701 TERMINAL RENOVATIONS-UNALLOC 1996 ISSUE 13B INFRASTRUCTURE AMT
BONDS
2,183,350 0
CAC057UN5701 TERMINAL RENOVATIONS-UNALLOC 1993 SFIA-ISSUE 4-REFUNDING BONDS FD 15,880 0
CAC057UN5701 TERMINAL RENOVATIONS-UNALLOC 1993 SFIA-ISSUE 3-REFUNDING BONDS FD 21,266 0
CAC057UN5701 TERMINAL RENOVATIONS-UNALLOC 1993 SFIA-ISSUE 2-REFUNDING BONDS FD 58,682 0
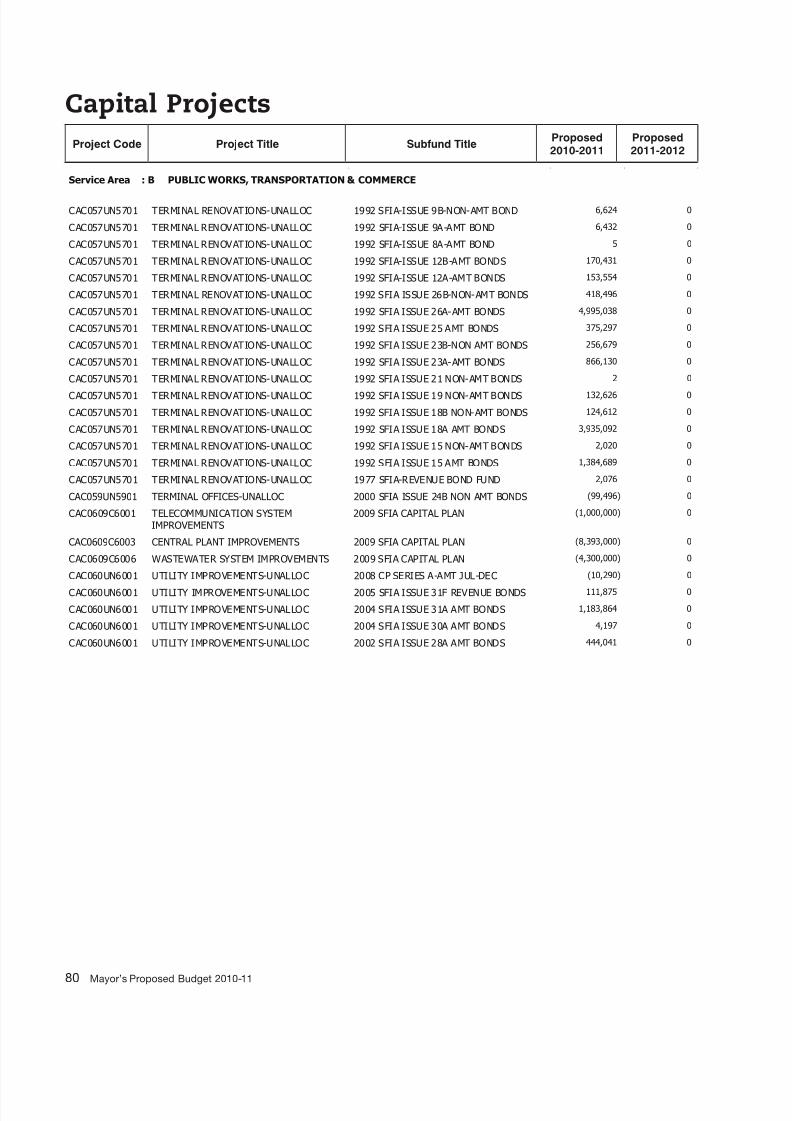
8/9/2019 Mayor's Proposed 2010-11 May Budget
http://slidepdf.com/reader/full/mayors-proposed-2010-11-may-budget 102/107
80 Mayor’s Proposed Budget 2010-11
Capital Projects
Project Code Project Title Subfund TitleProposed2010-2011
Proposed2011-2012
Service Area : B PUBLIC WORKS, TRANSPORTATION & COMMERCE
CAC057UN5701 TERMINAL RENOVATIONS-UNALLOC 1992 SFIA-ISSUE 9B-NON-AMT BOND 6,624 0
CAC057UN5701 TERMINAL RENOVATIONS-UNALLOC 1992 SFIA-ISSUE 9A-AMT BOND 6,432 0
CAC057UN5701 TERMINAL RENOVATIONS-UNALLOC 1992 SFIA-ISSUE 8A-AMT BOND 5 0
CAC057UN5701 TERMINAL RENOVATIONS-UNALLOC 1992 SFIA-ISSUE 12B-AMT BONDS 170,431 0
CAC057UN5701 TERMINAL RENOVATIONS-UNALLOC 1992 SFIA-ISSUE 12A-AMT BONDS 153,554 0
CAC057UN5701 TERMINAL RENOVATIONS-UNALLOC 1992 SFIA ISSUE 26B-NON-AMT BONDS 418,496 0
CAC057UN5701 TERMINAL RENOVATIONS-UNALLOC 1992 SFIA ISSUE 26A-AMT BONDS 4,995,038 0
CAC057UN5701 TERMINAL RENOVATIONS-UNALLOC 1992 SFIA ISSUE 25 AMT BONDS 375,297 0
CAC057UN5701 TERMINAL RENOVATIONS-UNALLOC 1992 SFIA ISSUE 23B-NON AMT BONDS 256,679 0
CAC057UN5701 TERMINAL RENOVATIONS-UNALLOC 1992 SFIA ISSUE 23A-AMT BONDS 866,130 0
CAC057UN5701 TERMINAL RENOVATIONS-UNALLOC 1992 SFIA ISSUE 21 NON-AMT BONDS 2 0
CAC057UN5701 TERMINAL RENOVATIONS-UNALLOC 1992 SFIA ISSUE 19 NON-AMT BONDS 132,626 0
CAC057UN5701 TERMINAL RENOVATIONS-UNALLOC 1992 SFIA ISSUE 18B NON-AMT BONDS 124,612 0
CAC057UN5701 TERMINAL RENOVATIONS-UNALLOC 1992 SFIA ISSUE 18A AMT BONDS 3,935,092 0
CAC057UN5701 TERMINAL RENOVATIONS-UNALLOC 1992 SFIA ISSUE 15 NON-AMT BONDS 2,020 0
CAC057UN5701 TERMINAL RENOVATIONS-UNALLOC 1992 SFIA ISSUE 15 AMT BONDS 1,384,689 0
CAC057UN5701 TERMINAL RENOVATIONS-UNALLOC 1977 SFIA-REVENUE BOND FUND 2,076 0
CAC059UN5901 TERMINAL OFFICES-UNALLOC 2000 SFIA ISSUE 24B NON AMT BONDS (99,496) 0
CAC0609C6001 TELECOMMUNICATION SYSTEMIMPROVEMENTS
2009 SFIA CAPITAL PLAN (1,000,000) 0
CAC0609C6003 CENTRAL PLANT IMPROVEMENTS 2009 SFIA CAPITAL PLAN (8,393,000) 0
CAC0609C6006 WASTEWATER SYSTEM IMPROVEMENTS 2009 SFIA CAPITAL PLAN (4,300,000) 0
CAC060UN6001 UTILITY IMPROVEMENTS-UNALLOC 2008 CP SERIES A-AMT JUL-DEC (10,290) 0
CAC060UN6001 UTILITY IMPROVEMENTS-UNALLOC 2005 SFIA ISSUE 31F REVENUE BONDS 111,875 0
CAC060UN6001 UTILITY IMPROVEMENTS-UNALLOC 2004 SFIA ISSUE 31A AMT BONDS 1,183,864 0
CAC060UN6001 UTILITY IMPROVEMENTS-UNALLOC 2004 SFIA ISSUE 30A AMT BONDS 4,197 0
CAC060UN6001 UTILITY IMPROVEMENTS-UNALLOC 2002 SFIA ISSUE 28A AMT BONDS 444,041 0

8/9/2019 Mayor's Proposed 2010-11 May Budget
http://slidepdf.com/reader/full/mayors-proposed-2010-11-may-budget 103/107
Department Budgets > Capital Projects 81
Capital Projects
Project Code Project Title Subfund TitleProposed2010-2011
Proposed2011-2012
Service Area : B PUBLIC WORKS, TRANSPORTATION & COMMERCE
CAC060UN6001 UTILITY IMPROVEMENTS-UNALLOC 2000 SFIA ISSUE 24A AMT BONDS 1,046,148 0
CAC060UN6001 UTILITY IMPROVEMENTS-UNALLOC 1992 SFIA-ISSUE 12A-AMT BONDS 209,762 0
CAC060UN6001 UTILITY IMPROVEMENTS-UNALLOC 1992 SFIA ISSUE 15 AMT BONDS (29,984) 0
CAC063UN6301 CAPITAL EQUIPMENT-UNALLOC 1992 SFIA ISSUE 23A-AMT BONDS (7,142) 0
CAC07001 PASSENGER BRIDGE CONNECTOR T1- AIRTRAIN
1992 SFIA ISSUE 26B-NON-AMT BONDS (5,468) 0
CAC07001 PASSENGER BRIDGE CONNECTOR T1-
AIRTRAIN
1992 SFIA ISSUE 23A-AMT BONDS (4,668) 0
CAC07001 PASSENGER BRIDGE CONNECTOR T1- AIRTRAIN
1992 SFIA ISSUE 15 AMT BONDS (839) 0
CAC071UN7101 CARGO FACILITY IMPROVEMENTS-
UNALLOCATED
2004 SFIA ISSUE 31A AMT BONDS (15,476,854) 0
CAC071UN7101 CARGO FACILITY IMPROVEMENTS-UNALLOCATED
1992 SFIA ISSUE 26A-AMT BONDS (4,524,605) 0
CAC071UN7101 CARGO FACILITY IMPROVEMENTS-UNALLOCATED
1992 SFIA ISSUE 18A AMT BONDS (3,518,533) 0
CACGRA01 MASTR PROJECT-GRANT FUNDED PROJECT SFIA-CAPITAL PROJECTS-FEDERAL FUND 250,327 0
FAC20099 AIRFIELD FAC MAINT SFIA-CONTINUING PROJ-OPERATING FD 0 584,000
FAC30099 TERMINAL FAC MAINT SFIA-CONTINUING PROJ-OPERATING FD 4,530,000 4,380,000
FAC40099 GROUNDSIDE FAC MAINT SFIA-CONTINUING PROJ-OPERATING FD 0 584,000
FAC45099 UTILITIES FAC MAINT SFIA-CONTINUING PROJ-OPERATING FD 900,000 680,000
FAC50099 SUPPORT FAC MAINT SFIA-CONTINUING PROJ-OPERATING FD 345,000 577,000
FAC55099 WEST OF BAYSHORE FACILITY
MAINTENANCE
SFIA-CONTINUING PROJ-OPERATING FD 225,000 195,000
Department : AIR Subtotal 74,374,119 93,421,576

8/9/2019 Mayor's Proposed 2010-11 May Budget
http://slidepdf.com/reader/full/mayors-proposed-2010-11-may-budget 104/107
82 Mayor’s Proposed Budget 2010-11
Capital Projects
Project Code Project Title Subfund TitleProposed2010-2011
Proposed2011-2012
Service Area : B PUBLIC WORKS, TRANSPORTATION & COMMERCE
Department : PRT PORT
CPO62518 MAINTENANCE DREDGING FY10/11 & FY11/12
PORT-CONTINUING PROJ-OPERATING FD 1,873,000 2,987,000
CPO67702 RNDHOUSE PAINT;WTHRPROOF & WNDOWUPGRADE
PORT-CONTINUING PROJ-OPERATING FD 200,000 0
CPO68001 PORT ADA TRANSITION PLAN PORT-CONTINUING PROJ-OPERATING FD 150,000 200,000
CPO72710 MATERIALS TESTING FY 10/11 & FY 11/12 PORT-CONTINUING PROJ-OPERATING FD 409,000 731,000
CPO75201 AMADOR ST FORCED SEWER MAIN PORT-CONTINUING PROJ-OPERATING FD 450,000 1,000,000
CPO76101 UTILITIES PROJECT PORT-CONTINUING PROJ-OPERATING FD 245,000 175,000
CPO7699A27CT CRUISE TERMNL P27 REV BOND SERIES2010A
REV BONDS 2009-SERIES 2010A - TAXEXEMPT
87,435 0
CPO7699B27CT CRUISE TERMNL P27 REV BOND SERIES
2010B
REV BONDS 2009 - SERIES 2010B -
TAXABLE
52,021 0
CPO77401 GREENING/BEAUTIFICATION IMP -S.WATERFNT
PORT-CONTINUING PROJ-OPERATING FD 205,000 150,000
CPO77601 LEASING CAPITAL IMPROVEMENT PROJECT PORT-CONTINUING PROJ-OPERATING FD 150,000 150,000
CPO77701 PIER 33-35 CURB CUT PROJECT PORT-CONTINUING PROJ-OPERATING FD 75,000 0
CPO77801 PIER STRUCTURE RPR PRJT PH II PORT-CONTINUING PROJ-OPERATING FD 2,500,000 5,600,000
CPO78501 FERRY TERMINAL FLOAT REPAIRS PORT-CONTINUING PROJ-OPERATING FD 350,000 350,000
CPO78801 WATERFRONT SEWER PUMP-PHASE IIPROJECT
PORT-CONTINUING PROJ-OPERATING FD 0 100,000
CPO78901 PIER 80 CRANE PAINTING & UPGRADE
PROJECT
PORT-CONTINUING PROJ-OPERATING FD 200,000 0
CPO79101 PIER 70 HISTORIC BUILDING CLEAN-UP PORT-CONTINUING PROJ-OPERATING FD 100,000 50,000
CPO79201 PIER 70 BUILDING 2 REPAIRS PORT-CONTINUING PROJ-OPERATING FD 1,200,000 0
CPO79301 PIER 70 HISTORIC BLDGS STBLN ANDREPAIRS
PORT-CONTINUING PROJ-OPERATING FD 500,000 0
CPO79401 SO WATERFRNT OPEN SPACEENHNCMNTS/ALTERN
PORT-CONTINUING PROJ-OPERATING FD 550,000 550,000
CPO79501 PRT ELEVATOR/ESCALATOR PORT-CONTINUING PROJ-OPERATING FD 400,000 500,000

8/9/2019 Mayor's Proposed 2010-11 May Budget
http://slidepdf.com/reader/full/mayors-proposed-2010-11-may-budget 105/107
Department Budgets > Capital Projects 83
Capital Projects
Project Code Project Title Subfund TitleProposed2010-2011
Proposed2011-2012
Service Area : B PUBLIC WORKS, TRANSPORTATION & COMMERCE
UPGR;REP&REPLMNT
GPO22801 STORMWATER POLLUTION CONTROL PORT-OPERATING-ANNUAL PROJECTS 175,000 130,000
GPO23601 PUBLIC ACCESS IMPROVEMENTS PORT-OPERATING-ANNUAL PROJECTS 50,000 50,000
GPO53601 MISCELLANEOUS TENANT FACILITY IMPROVEMNT
PORT-OPERATING-ANNUAL PROJECTS 183,000 183,000
GPO53701 FISHERMAN'S WHARF WATER QUALITY
MONITORG
PORT-OPERATING-ANNUAL PROJECTS 20,000 20,000
GPO54301 FACILITY MAINTENANCE AND REPAIR PORT-OPERATING-ANNUAL PROJECTS 380,000 380,000
GPO54701 WHARF J-10 OVERSIGHT PORT-OPERATING-ANNUAL PROJECTS 70,000 70,000
GPO54801 ABANDONED MAT/ILLEGAL DUMPINGCLEANUP-RE
PORT-OPERATING-ANNUAL PROJECTS 150,000 150,000
GPO54901 ICS TRAINING DVLPMNT &
IMPLEMENTATION
PORT-OPERATING-ANNUAL PROJECTS 25,000 25,000
GPO55001 HAZARDOUS WASTE ASSESSMENT &
REMOVAL
PORT-OPERATING-ANNUAL PROJECTS 50,000 50,000
GPO55101 A/E CNSLTNG PRJT PLNNING; DSG & COSTEST
PORT-OPERATING-ANNUAL PROJECTS 500,000 500,000
GPO55401 CMMS PRJT (AVANTIS REPLACEMENT) PORT-OPERATING-ANNUAL PROJECTS 910,000 164,800
GPO55601 UTILITY ANNUAL MAINTENANCE PORT-OPERATING-ANNUAL PROJECTS 50,000 50,000
GPO55701 OIL SPILL RESPONSE TRAINING & INVSTGTION
PORT-OPERATING-ANNUAL PROJECTS 90,000 90,000
GPO55901 EMERGENCY OPERATIONS EQUIPT & DOCSUPPLI
PORT-OPERATING-ANNUAL PROJECTS 25,000 25,000
GPO56101 PIER 94/96 BACKLANDS SITE
INVESTIGATION
PORT-OPERATING-ANNUAL PROJECTS 60,000 60,000
GPO56201 PROPWORKS UPGRADE PROJECT PORT-OPERATING-ANNUAL PROJECTS310,000 0
GPO56301 EMERGE CITYWIDE PAYROLL PROJECT PORT-OPERATING-ANNUAL PROJECTS 186,300 0
GPO56401 INVENTORY ANALYSIS;COUNT&IMPLEMENTATION
PORT-OPERATING-ANNUAL PROJECTS 150,000 150,000
GPO56501 SANITARY SEWER MANAGEMENT PLAN PORT-OPERATING-ANNUAL PROJECTS 100,000 0
Service Area : B PUBLIC WORKS, TRANSPORTATION & COMMERCE
GPO56601 PORT RESILIENCE & RECOVERY PROJECT PORT-OPERATING-ANNUAL PROJECTS 200,000 100,000
GPO62401 CARGO FAC REPAIR PORT-OPERATING-ANNUAL PROJECTS 109,000 109,000
GPO63201 PIER 98 MAINTENANCE PORT-OPERATING-ANNUAL PROJECTS 105,000 105,000
GPO72801 FISHERMANS WHARF-TRIANGLE PARKINGLOT
PORT-OPERATING-ANNUAL PROJECTS 65,000 65,000
PPO10101 RINCON PARK-MAINT. & MGT. ACCOUNT PORT-OPERATING-ANNUAL PROJECTS 248,194 248,194
PYEAES06 YOUTH EMPLOYMENT & ENVIRON BUDGET PORT-OPERATING-ANNUAL PROJECTS 300,000 300,000
Department : PRT Subtotal 14,207,950 15,567,994

8/9/2019 Mayor's Proposed 2010-11 May Budget
http://slidepdf.com/reader/full/mayors-proposed-2010-11-may-budget 106/107
84 Mayor’s Proposed Budget 2010-11
Capital Projects
Project Code Project Title Subfund TitleProposed2010-2011
Proposed2011-2012
Service Area : B PUBLIC WORKS, TRANSPORTATION & COMMERCE
Department : PUC PUBLIC UTILITIES COMMISSION
CUH89601 STREETLIGHT REPLACEMENT HETCHY CONTINUING PROJ-OPERATING FD 10,105,000 22,110,000
CUH94763 SOLAR ENERGY INCENTIVE FUND HETCHY CONTINUING PROJ-OPERATING FD 5,000,000 5,000,000
CUH97101 ALTERNATIVE TRANSMISSION PROJECT HETCHY CONTINUING PROJ-OPERATING FD 2,000,000 2,000,000
CUH97500 WATER INFRASTRUCTURE - BUDGET WHOLESALE CUSTOMER CAPITAL FUND(HETCHY)
3,570,000 8,500,000
CUH97500 WATER INFRASTRUCTURE - BUDGET HETCHY CAPITAL PROJECTS-LOCAL FUND 1,680,000 4,000,000
CUH97600 POWER INFRASTRUCTURE - BUDGET HETCHY CONTINUING PROJ-OPERATING FD 25,760,000 12,740,000
CUH97700 FACILITIES RENEWALS - BUDGET WHOLESALE CUSTOMER CAPITAL FUND
(HETCHY)
3,060,000 3,978,000
CUH97700 FACILITIES RENEWALS - BUDGET HETCHY CAPITAL PROJECTS-LOCAL FUND 6,940,000 9,022,000
CUH98001 TREASURE ISLAND CAPITAL
IMPROVEMENTS
HETCHY CONTINUING PROJ-OPERATING FD 1,000,000 2,900,000
CUH98301 CIVIC CENTER DISTRICT - BUDGET HETCHY CONTINUING PROJ-OPERATING FD 1,412,000 962,000
CUH98601 SEA - ENERGY EFFICIENCY GENERAL FUND HETCHY CONTINUING PROJ-OPERATING FD 4,200,000 5,632,500
CUH99201 GENERATION/OCEAN - BUDGET HETCHY CONTINUING PROJ-OPERATING FD 200,000 200,000
CUH99301 SMALL RENEWABLE - BUDGET HETCHY CONTINUING PROJ-OPERATING FD 3,000,000 3,000,000
CUH99401 SMALL HYDRO - BUDGET HETCHY CONTINUING PROJ-OPERATING FD 3,000,000 1,000,000
CUH99501 ENTERPRISE DEPTS- ENERGY EFFICIENCY HETCHY CONTINUING PROJ-OPERATING FD 300,000 300,000
CUW22701 WATERSHED FENCES/FACILITES SFWD-CONTINUING PROJ-OPERATING FD (175,000) 0
CUW25701 WATERSHED PROTECTION SFWD-CONTINUING PROJ-OPERATING FD 875,000 0
CUW2600001 LOCAL REPAIR & REPLACEMENT PROGRAM SFWD-CONTINUING PROJ-OPERATING FD 12,800,865 8,401,307
CUW26200 REGIONAL WATER RNR - TREATMENTFACILITY
WHOLESALE CUSTOMER CAPITAL FUND(WATER)
2,176,000 1,496,000
CUW26200 REGIONAL WATER RNR - TREATMENTFACILITY
SFWD-CAPITAL PROJECTS-LOCAL FUND 1,024,000 704,000
CUW26300 REGIONAL RNR -CONVEYANCE/TRANSMISSION
WHOLESALE CUSTOMER CAPITAL FUND(WATER)
3,978,000 7,548,000
CUW26300 REGIONAL RNR - SFWD-CAPITAL PROJECTS-LOCAL FUND 1,872,000 3,552,000

8/9/2019 Mayor's Proposed 2010-11 May Budget
http://slidepdf.com/reader/full/mayors-proposed-2010-11-may-budget 107/107
Capital Projects
Project Code Project Title Subfund TitleProposed2010-2011
Proposed2011-2012
Service Area : B PUBLIC WORKS, TRANSPORTATION & COMMERCE
CONVEYANCE/TRANSMISSION
CUW26400 WATERSHED & ROW MANAGEMENT
PROGRAM
WHOLESALE CUSTOMER CAPITAL FUND
(WATER)
340,000 1,700,000
CUW26400 WATERSHED & ROW MANAGEMENTPROGRAM
SFWD-CAPITAL PROJECTS-LOCAL FUND 160,000 800,000
CUW26501 LANDSCAPE CONSERVATION PROGRAM SFWD-CONTINUING PROJ-OPERATING FD 2,000,000 2,000,000
CUW27001 TREASURE ISLAND CAPITALIMPROVEMENTS
SFWD-CONTINUING PROJ-OPERATING FD 500,000 6,525,000
CUW68601 AUTOMATED METER READING SYSTEM SFWD-CONTINUING PROJ-OPERATING FD 5,400,000 0
CUW69501 PACIFICA RECYCLED WATER PROJECT SFWD-CONTINUING PROJ-OPERATING FD 5,124,000 0
CUW91201 BAYLANDS PROJECT SFWD-CONTINUING PROJ-OPERATING FD (700,000) 0
CWW10000 PROPERTY PURCHASE CWP-CAPITAL PROJECTS-LOCAL FUND 3,250,000 3,250,000
CWWRNRCS0000 WWE RNR COLLECTION SYSTEM CWP-CAPITAL PROJECTS-REPAIR & REPLACE
7,033,590 22,759,734
CWWRNRTF0000 WWE RNR TREATMENT FACILITIES CWP-CAPITAL PROJECTS-REPAIR & REPLACE
7,033,590 11,017,716
FUW10001 FACILITIES MAINTENANCE - WSTD WHOLESALE CUSTOMER CAPITAL FUND
(WATER)
2,448,000 2,448,000
FUW10001 FACILITIES MAINTENANCE - WSTD SFWD-CAPITAL PROJECTS-LOCAL FUND 1,152,000 1,152,000
FUW10101 AWSS MAINTENANCE - CDD SFWD-OPERATING-ANNUAL PROJECTS 1,100,000 1,100,000
PUH50101 SF ENVIRONMENT ENERGY & GREENBUILDING
HETCHY OPERATING-ANNUAL PROJECTS 493,319 493,319
PUW50201 WATER RESOURCES PLANNING ANDDEVELOPMENT
SFWD-OPERATING-ANNUAL PROJECTS 2,100,000 2,100,000
PUW51100 TREASURE ISLAND - MAINTENANCE SFWD-OPERATING-ANNUAL PROJECTS 874,000 874,000
PUW51100 TREASURE ISLAND - MAINTENANCE HETCHY OPERATING-ANNUAL PROJECTS 2,909,500 2,909,500
PUW51101 TREASURE ISLAND - WASTEWATER CWP-OPERATING-ANNUAL PROJECTS 1,200,000 1,200,000
PWW10001 LOW IMPACT DEVELOPMENT CWP-OPERATING-ANNUAL PROJECTS 681,395 681,395
PYEAES06 YOUTH EMPLOYMENT & ENVIRON BUDGET SFWD-OPERATING-ANNUAL PROJECTS 850,000 850,000
Service Area : B PUBLICWORKS, TRANSPORTATION & COMMERCE
Related Documents