Photo © Youth in Focus students Appendices

Welcome message from author
This document is posted to help you gain knowledge. Please leave a comment to let me know what you think about it! Share it to your friends and learn new things together.
Transcript
Photo © Youth in Focus students
Appendices

405Seattle 2035Appendices Growth Strategy Appendix
Growth Strategy Appendix
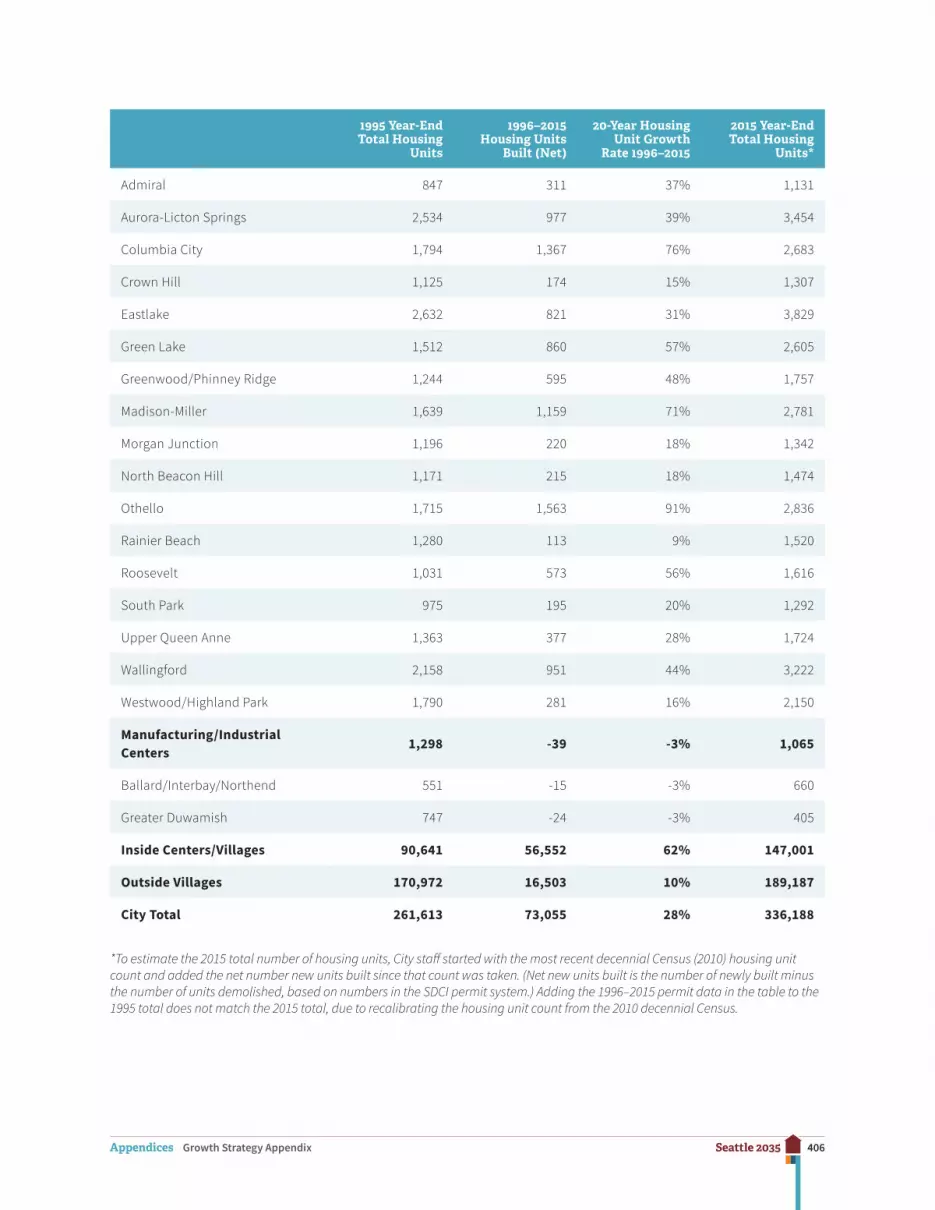
Growth Strategy Appendix Figure A-1Housing Units in Seattle, 1995–2015
1995 Year-End Total Housing
Units
1996–2015 Housing Units
Built (Net)
20-Year Housing Unit Growth
Rate 1996–2015
2015 Year-End Total Housing
Units*
Urban Centers 47,040 33,167 71% 80,322
Downtown Urban Center 10,618 13,478 127% 24,347
First Hill/Capitol Hill Urban Center 21,562 7,907 37% 29,619
University District Urban Center 6,583 3,168 48% 9,802
Northgate 3,559 1,167 33% 4,535
South Lake Union 809 3,954 489% 4,536
Uptown 3,909 3,493 89% 7,483
Hub Villages 14,253 10,654 75% 24,505
Ballard 4,772 3,963 83% 9,168
Bitter Lake Village 2,364 1,380 58% 3,257
Fremont 2,194 1,111 51% 3,200
Lake City 1,391 1,138 82% 2,546
Mt. Baker (North Rainier ) 1,568 875 56% 2,454
West Seattle Junction 1,964 2,187 111% 3,880
Residential Villages 29,348 12,731 43% 42,174
23rd & Union-Jackson 3,342 1,979 59% 5,451
406Seattle 2035Appendices Growth Strategy Appendix
1995 Year-End Total Housing
Units
1996–2015 Housing Units
Built (Net)
20-Year Housing Unit Growth
Rate 1996–2015
2015 Year-End Total Housing
Units*
Admiral 847 311 37% 1,131
Aurora-Licton Springs 2,534 977 39% 3,454
Columbia City 1,794 1,367 76% 2,683
Crown Hill 1,125 174 15% 1,307
Eastlake 2,632 821 31% 3,829
Green Lake 1,512 860 57% 2,605
Greenwood/Phinney Ridge 1,244 595 48% 1,757
Madison-Miller 1,639 1,159 71% 2,781
Morgan Junction 1,196 220 18% 1,342
North Beacon Hill 1,171 215 18% 1,474
Othello 1,715 1,563 91% 2,836
Rainier Beach 1,280 113 9% 1,520
Roosevelt 1,031 573 56% 1,616
South Park 975 195 20% 1,292
Upper Queen Anne 1,363 377 28% 1,724
Wallingford 2,158 951 44% 3,222
Westwood/Highland Park 1,790 281 16% 2,150
Manufacturing/Industrial Centers
1,298 -39 -3% 1,065
Ballard/Interbay/Northend 551 -15 -3% 660
Greater Duwamish 747 -24 -3% 405
Inside Centers/Villages 90,641 56,552 62% 147,001
Outside Villages 170,972 16,503 10% 189,187
City Total 261,613 73,055 28% 336,188
*To estimate the 2015 total number of housing units, City staff started with the most recent decennial Census (2010) housing unit count and added the net number new units built since that count was taken. (Net new units built is the number of newly built minus the number of units demolished, based on numbers in the SDCI permit system.) Adding the 1996–2015 permit data in the table to the 1995 total does not match the 2015 total, due to recalibrating the housing unit count from the 2010 decennial Census.

407Seattle 2035Appendices Growth Strategy Appendix
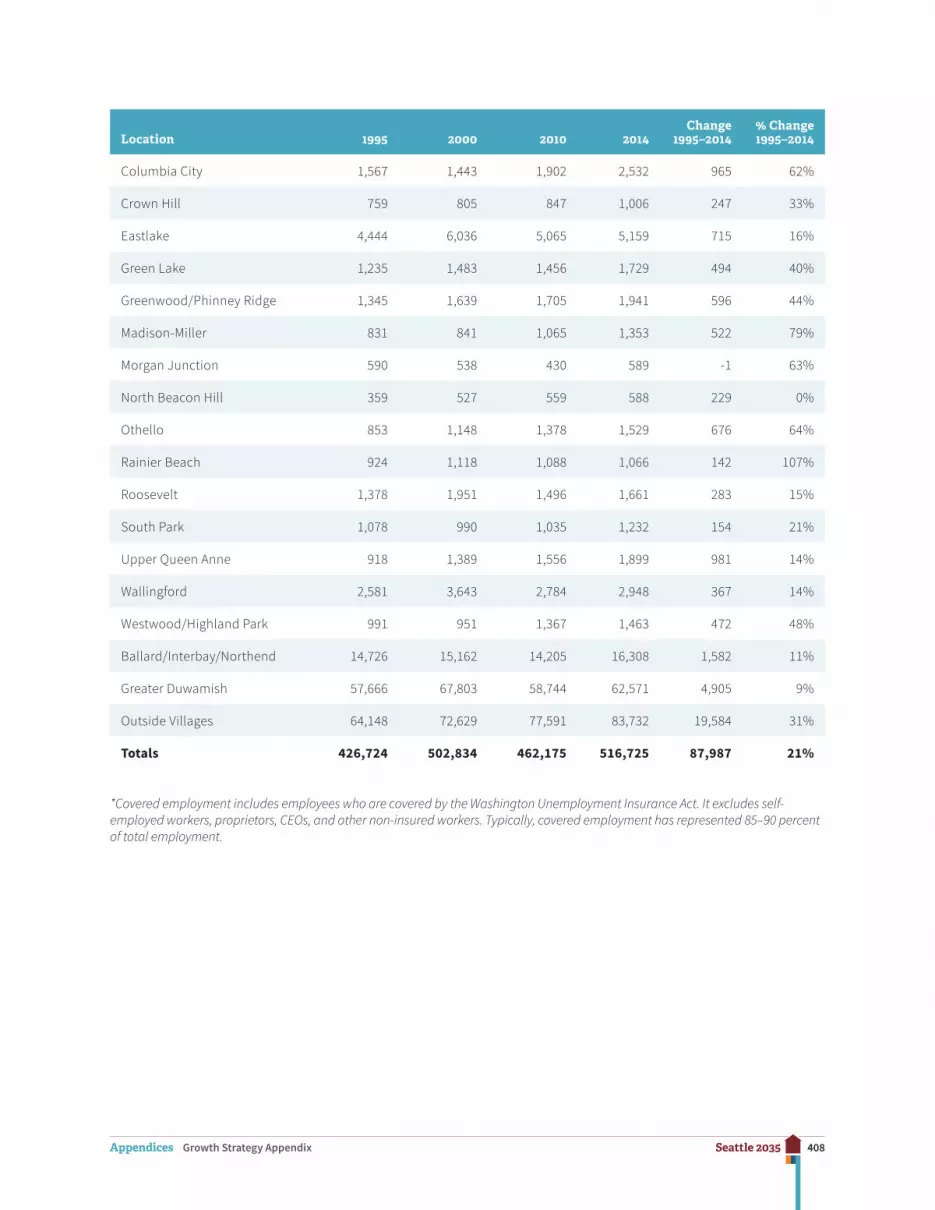
Growth Strategy Appendix Figure A-2Total Covered Employment by Location in Seattle 1995–2014*
Location 1995 2000 2010 2014Change
1995–2014% Change 1995–2014
Belltown 17,382 23,526 17,988 18,647 1,265 7%
Denny Triangle 15,407 20,910 16,120 19,708 4,301 28%
Commercial Core 90,375 100,706 84,080 92,205 1,830 2%
Pioneer Square 10,887 16,424 10,454 11,807 920 8%
Chinatown/International District
4,099 4,858 7,739 8,327 4,228 103%
Capitol Hill 6,986 7,848 5,444 5,770 -1,216 -17%
Pike/Pine 3,581 6,325 5,033 6,404 2,823 79%
First Hill 18,194 19,197 26,106 21,540 3,346 18%
12th Avenue 3,577 4,486 5,054 5,333 1,756 49%
Northgate 9,432 11,006 11,430 12,288 2,856 30%
South Lake Union 15,166 22,735 19,644 35,859 20,693 136%
Uptown 16,377 16,161 13,911 14,592 -1,785 -11%
Ravenna 1,327 2,206 2,708 3,503 2,176 164%
University Campus 19,982 23,070 25,568 27,395 7,413 37%
University District Northwest 7,020 7,887 4,696 5,358 -1,662 -24%
Ballard 4,699 5,126 5,447 7,199 2,500 53%
Bitter Lake Village 3,145 4,315 3,100 3,549 404 13%
Fremont 4,862 5,745 7,468 8,489 3,627 75%
Lake City 1,688 1,831 1,600 1,323 -365 -22%
Mt. Baker (North Rainier) 4,995 5,357 3,614 4,254 -741 -15%
West Seattle Junction 2,504 2,825 2,695 3,334 830 33%
23rd & Union-Jackson 5,030 6,248 4,269 4,913 -117 -2%
Admiral 882 1,089 1,400 1,390 508 58%
Aurora-Licton Springs 2,734 2,857 2,334 2,218 -516 -19%
408Seattle 2035Appendices Growth Strategy Appendix
Location 1995 2000 2010 2014Change
1995–2014% Change 1995–2014
Columbia City 1,567 1,443 1,902 2,532 965 62%
Crown Hill 759 805 847 1,006 247 33%
Eastlake 4,444 6,036 5,065 5,159 715 16%
Green Lake 1,235 1,483 1,456 1,729 494 40%
Greenwood/Phinney Ridge 1,345 1,639 1,705 1,941 596 44%
Madison-Miller 831 841 1,065 1,353 522 79%
Morgan Junction 590 538 430 589 -1 63%
North Beacon Hill 359 527 559 588 229 0%
Othello 853 1,148 1,378 1,529 676 64%
Rainier Beach 924 1,118 1,088 1,066 142 107%
Roosevelt 1,378 1,951 1,496 1,661 283 15%
South Park 1,078 990 1,035 1,232 154 21%
Upper Queen Anne 918 1,389 1,556 1,899 981 14%
Wallingford 2,581 3,643 2,784 2,948 367 14%
Westwood/Highland Park 991 951 1,367 1,463 472 48%
Ballard/Interbay/Northend 14,726 15,162 14,205 16,308 1,582 11%
Greater Duwamish 57,666 67,803 58,744 62,571 4,905 9%
Outside Villages 64,148 72,629 77,591 83,732 19,584 31%
Totals 426,724 502,834 462,175 516,725 87,987 21%
*Covered employment includes employees who are covered by the Washington Unemployment Insurance Act. It excludes self-employed workers, proprietors, CEOs, and other non-insured workers. Typically, covered employment has represented 85–90 percent of total employment.
409Seattle 2035Appendices Land Use Appendix
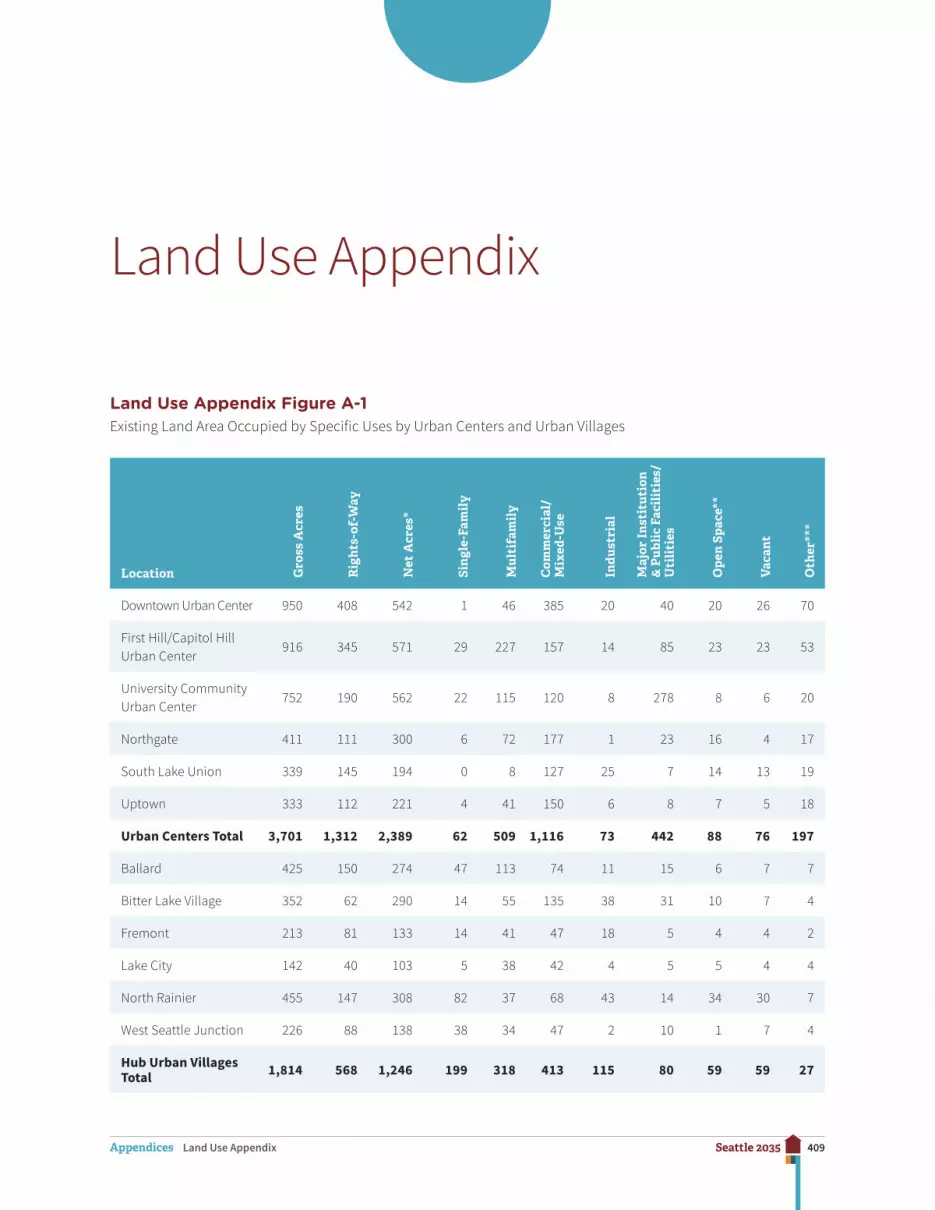
Land Use Appendix
Land Use Appendix Figure A-1Existing Land Area Occupied by Specific Uses by Urban Centers and Urban Villages
Location Gro
ss A
cres
Rig
hts-
of-W
ay
Net
Acr
es*
Sin
gle-
Fam
ily
Mul
tifa
mil
y
Com
mer
cial
/ M
ixed
-Use
Indu
stri
al
Maj
or I
nst
itut
ion
& P
ubli
c Fa
cili
ties
/U
tili
ties
Ope
n S
pace
**
Vac
ant
Oth
er**
*
Downtown Urban Center 950 408 542 1 46 385 20 40 20 26 70
First Hill/Capitol Hill Urban Center
916 345 571 29 227 157 14 85 23 23 53
University Community Urban Center
752 190 562 22 115 120 8 278 8 6 20
Northgate 411 111 300 6 72 177 1 23 16 4 17
South Lake Union 339 145 194 0 8 127 25 7 14 13 19
Uptown 333 112 221 4 41 150 6 8 7 5 18
Urban Centers Total 3,701 1,312 2,389 62 509 1,116 73 442 88 76 197
Ballard 425 150 274 47 113 74 11 15 6 7 7
Bitter Lake Village 352 62 290 14 55 135 38 31 10 7 4
Fremont 213 81 133 14 41 47 18 5 4 4 2
Lake City 142 40 103 5 38 42 4 5 5 4 4
North Rainier 455 147 308 82 37 68 43 14 34 30 7
West Seattle Junction 226 88 138 38 34 47 2 10 1 7 4
Hub Urban Villages Total 1,814 568 1,246 199 318 413 115 80 59 59 27

410Seattle 2035Appendices Land Use Appendix
Location Gro
ss A
cres
Rig
hts-
of-W
ay
Net
Acr
es*
Sin
gle-
Fam
ily
Mul
tifa
mil
y
Com
mer
cial
/ M
ixed
-Use
Indu
stri
al
Maj
or I
nst
itut
ion
& P
ubli
c Fa
cili
ties
/U
tili
ties
Ope
n S
pace
**
Vac
ant
Oth
er**
*
23rd & Union-Jackson 516 167 350 129 81 39 8 40 32 21 7
Admiral 98 30 68 12 11 17 13 14 1
Aurora-Licton Springs 327 95 232 54 76 40 23 25 9 5 7
Columbia City 313 95 217 68 49 32 4 14 17 32 6
Crown Hill 173 50 123 75 18 22 1 4 2 1 1
Eastlake 200 91 109 13 48 36 2 2 5 3 1
Green Lake 109 49 60 11 25 12 0 9 2 0 1
Greenwood/Phinney Ridge
94 31 63 4 12 40 1 2 0 2 2
Othello 375 94 281 87 58 27 5 27 9 64 4
Madison-Miller 145 50 95 27 36 15 0 5 8 4 3
Morgan Junction 114 39 75 40 18 11 0 4 0 0 0
North Beacon Hill 131 51 80 35 25 9 0 4 3 3 0
Upper Queen Anne 53 21 32 1 13 13 0 4 0 0
Rainier Beach 290 70 219 48 43 34 4 44 16 30 2
Roosevelt 158 61 97 51 9 18 1 13 0 6 2
South Park 263 80 184 116 20 6 5 5 15 15 1
Wallingford 257 99 158 79 29 31 2 12 4 1 2
Westwood/Highland Park
275 81 194 99 40 37 2 11 6 1
Residential Urban Villages Total
3,891 1,254 2,638 949 611 440 58 240 139 193 40
Ballard/Interbay/Northend
932 218 713 4 2 154 166 283 5 97 9
Greater Duwamish 4,928 1,126 3,802 13 4 283 1,457 1,493 30 502 82
411Seattle 2035Appendices Land Use Appendix
Location Gro
ss A
cres
Rig
hts-
of-W
ay
Net
Acr
es*
Sin
gle-
Fam
ily
Mul
tifa
mil
y
Com
mer
cial
/ M
ixed
-Use
Indu
stri
al
Maj
or I
nst
itut
ion
& P
ubli
c Fa
cili
ties
/U
tili
ties
Ope
n S
pace
**
Vac
ant
Oth
er**
*
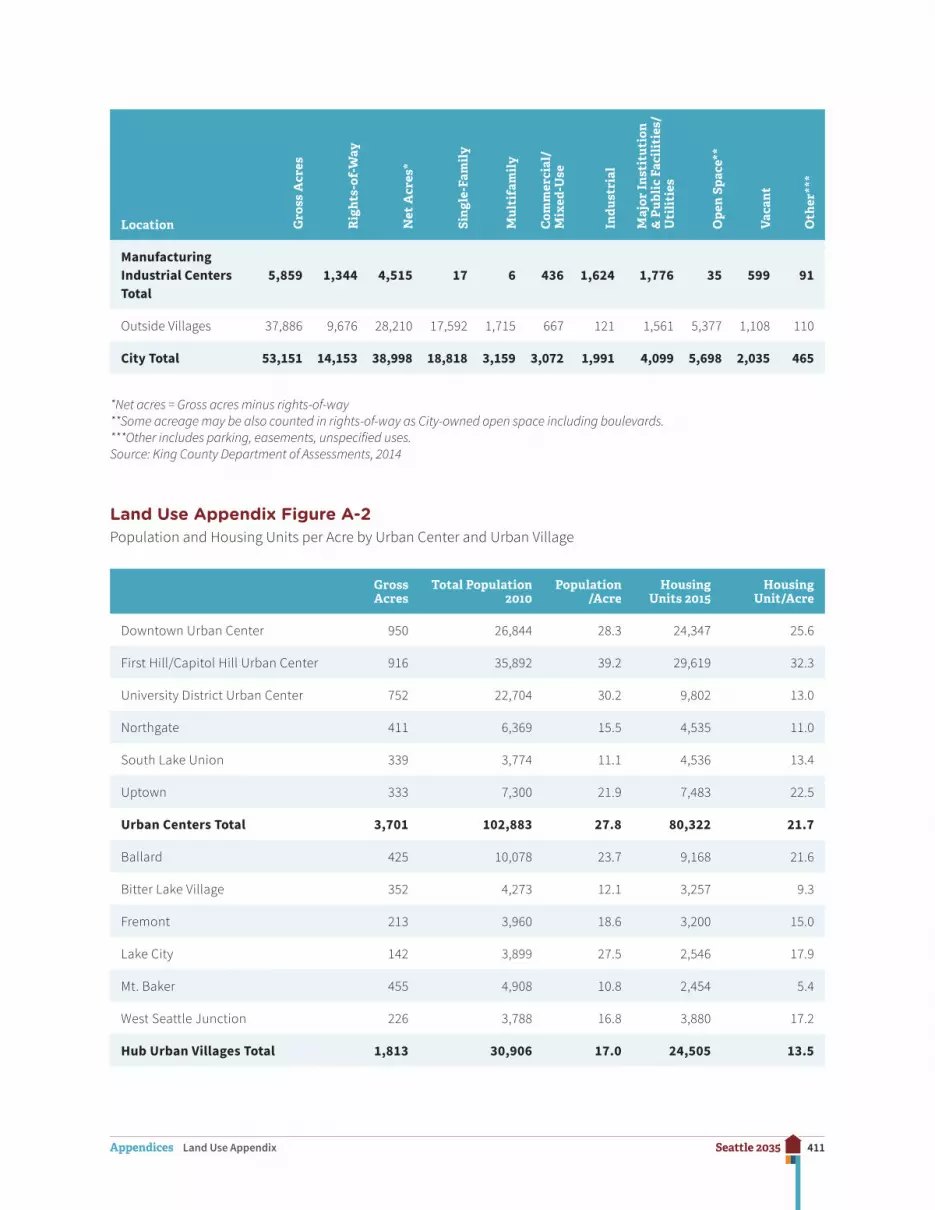
Manufacturing Industrial Centers Total
5,859 1,344 4,515 17 6 436 1,624 1,776 35 599 91
Outside Villages 37,886 9,676 28,210 17,592 1,715 667 121 1,561 5,377 1,108 110
City Total 53,151 14,153 38,998 18,818 3,159 3,072 1,991 4,099 5,698 2,035 465
*Net acres = Gross acres minus rights-of-way **Some acreage may be also counted in rights-of-way as City-owned open space including boulevards. ***Other includes parking, easements, unspecified uses. Source: King County Department of Assessments, 2014
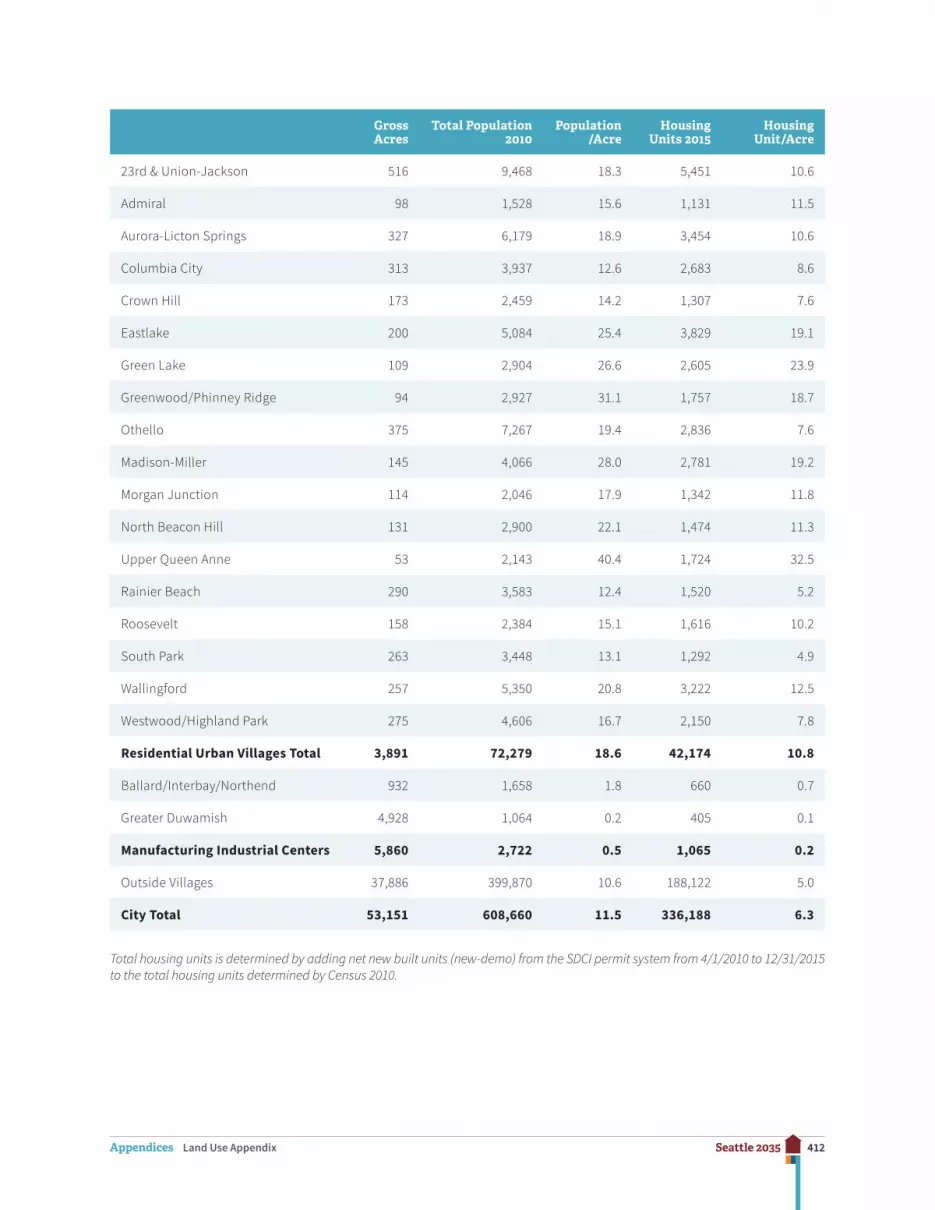
Land Use Appendix Figure A-2Population and Housing Units per Acre by Urban Center and Urban Village
Gross Acres
Total Population 2010
Population /Acre
Housing Units 2015
Housing Unit/Acre
Downtown Urban Center 950 26,844 28.3 24,347 25.6
First Hill/Capitol Hill Urban Center 916 35,892 39.2 29,619 32.3
University District Urban Center 752 22,704 30.2 9,802 13.0
Northgate 411 6,369 15.5 4,535 11.0
South Lake Union 339 3,774 11.1 4,536 13.4
Uptown 333 7,300 21.9 7,483 22.5
Urban Centers Total 3,701 102,883 27.8 80,322 21.7
Ballard 425 10,078 23.7 9,168 21.6
Bitter Lake Village 352 4,273 12.1 3,257 9.3
Fremont 213 3,960 18.6 3,200 15.0
Lake City 142 3,899 27.5 2,546 17.9
Mt. Baker 455 4,908 10.8 2,454 5.4
West Seattle Junction 226 3,788 16.8 3,880 17.2
Hub Urban Villages Total 1,813 30,906 17.0 24,505 13.5
412Seattle 2035Appendices Land Use Appendix
Gross Acres
Total Population 2010
Population /Acre
Housing Units 2015
Housing Unit/Acre
23rd & Union-Jackson 516 9,468 18.3 5,451 10.6
Admiral 98 1,528 15.6 1,131 11.5
Aurora-Licton Springs 327 6,179 18.9 3,454 10.6
Columbia City 313 3,937 12.6 2,683 8.6
Crown Hill 173 2,459 14.2 1,307 7.6
Eastlake 200 5,084 25.4 3,829 19.1
Green Lake 109 2,904 26.6 2,605 23.9
Greenwood/Phinney Ridge 94 2,927 31.1 1,757 18.7
Othello 375 7,267 19.4 2,836 7.6
Madison-Miller 145 4,066 28.0 2,781 19.2
Morgan Junction 114 2,046 17.9 1,342 11.8
North Beacon Hill 131 2,900 22.1 1,474 11.3
Upper Queen Anne 53 2,143 40.4 1,724 32.5
Rainier Beach 290 3,583 12.4 1,520 5.2
Roosevelt 158 2,384 15.1 1,616 10.2
South Park 263 3,448 13.1 1,292 4.9
Wallingford 257 5,350 20.8 3,222 12.5
Westwood/Highland Park 275 4,606 16.7 2,150 7.8
Residential Urban Villages Total 3,891 72,279 18.6 42,174 10.8
Ballard/Interbay/Northend 932 1,658 1.8 660 0.7
Greater Duwamish 4,928 1,064 0.2 405 0.1
Manufacturing Industrial Centers 5,860 2,722 0.5 1,065 0.2
Outside Villages 37,886 399,870 10.6 188,122 5.0
City Total 53,151 608,660 11.5 336,188 6.3
Total housing units is determined by adding net new built units (new-demo) from the SDCI permit system from 4/1/2010 to 12/31/2015 to the total housing units determined by Census 2010.

413Seattle 2035Appendices Land Use Appendix
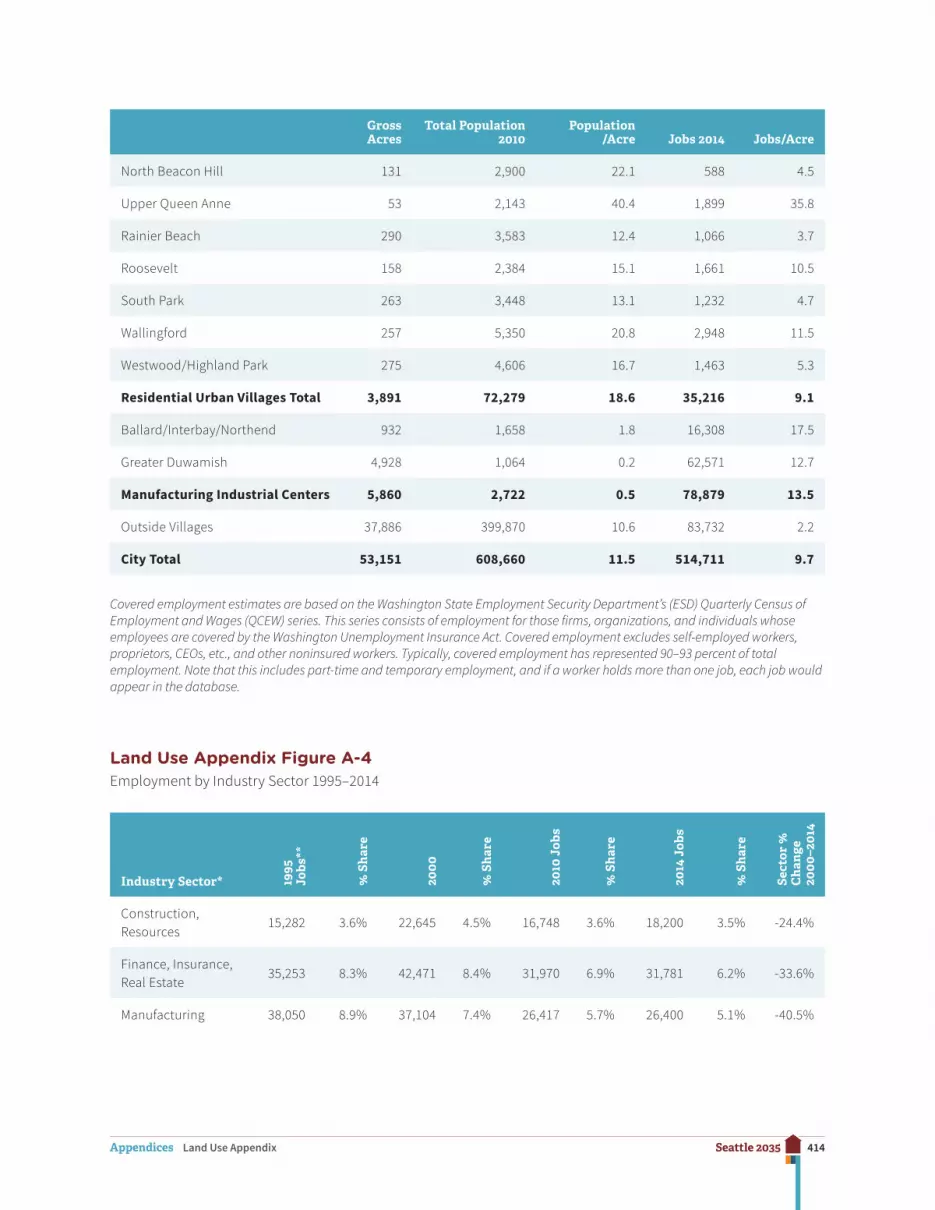
Land Use Appendix Figure A-3Jobs per Acre by Urban Center and Urban Village
Gross Acres
Total Population 2010
Population /Acre Jobs 2014 Jobs/Acre
Downtown Urban Center 950 26,844 28.3 150,694 158.6
First Hill/Capitol Hill Urban Center 916 35,892 39.2 39,047 42.6
University District Urban Center 752 22,704 30.2 36,256 48.2
Northgate 411 6,369 15.5 12,288 29.9
South Lake Union 339 3,774 11.1 35,859 105.8
Uptown 333 7,300 21.9 14,592 43.8
Urban Centers Total 3,701 102,883 27.8 288,736 78.0
Ballard 425 10,078 23.7 7,199 16.9
Bitter Lake Village 352 4,273 12.1 3,549 10.1
Fremont 213 3,960 18.6 8,489 39.9
Lake City 142 3,899 27.5 1,323 9.3
Mt. Baker 455 4,908 10.8 4,254 9.3
West Seattle Junction 226 3,788 16.8 3,334 14.8
Hub Urban Villages Total 1,813 30,906 17.0 28,148 15.5
23rd & Union-Jackson 516 9,468 18.3 4,913 9.5
Admiral 98 1,528 15.6 1,390 14.2
Aurora-Licton Springs 327 6,179 18.9 2,218 6.8
Columbia City 313 3,937 12.6 2,532 8.1
Crown Hill 173 2,459 14.2 1,006 5.8
Eastlake 200 5,084 25.4 5,159 25.8
Green Lake 109 2,904 26.6 1,729 15.9
Greenwood/Phinney Ridge 94 2,927 31.1 1,941 20.6
Othello 375 7,267 19.4 1,529 4.1
Madison-Miller 145 4,066 28.0 1,353 9.3
Morgan Junction 114 2,046 17.9 589 5.2
414Seattle 2035Appendices Land Use Appendix
Gross Acres
Total Population 2010
Population /Acre Jobs 2014 Jobs/Acre
North Beacon Hill 131 2,900 22.1 588 4.5
Upper Queen Anne 53 2,143 40.4 1,899 35.8
Rainier Beach 290 3,583 12.4 1,066 3.7
Roosevelt 158 2,384 15.1 1,661 10.5
South Park 263 3,448 13.1 1,232 4.7
Wallingford 257 5,350 20.8 2,948 11.5
Westwood/Highland Park 275 4,606 16.7 1,463 5.3
Residential Urban Villages Total 3,891 72,279 18.6 35,216 9.1
Ballard/Interbay/Northend 932 1,658 1.8 16,308 17.5
Greater Duwamish 4,928 1,064 0.2 62,571 12.7
Manufacturing Industrial Centers 5,860 2,722 0.5 78,879 13.5
Outside Villages 37,886 399,870 10.6 83,732 2.2
City Total 53,151 608,660 11.5 514,711 9.7
Covered employment estimates are based on the Washington State Employment Security Department’s (ESD) Quarterly Census of Employment and Wages (QCEW) series. This series consists of employment for those firms, organizations, and individuals whose employees are covered by the Washington Unemployment Insurance Act. Covered employment excludes self-employed workers, proprietors, CEOs, etc., and other noninsured workers. Typically, covered employment has represented 90–93 percent of total employment. Note that this includes part-time and temporary employment, and if a worker holds more than one job, each job would appear in the database.
Land Use Appendix Figure A-4Employment by Industry Sector 1995–2014
Industry Sector* 1995
Jo
bs**
% S
har
e
2000
% S
har
e
2010
Job
s
% S
har
e
2014
Job
s
% S
har
e
Sect
or %
C
han
ge
2000
–201
4
Construction, Resources
15,282 3.6% 22,645 4.5% 16,748 3.6% 18,200 3.5% -24.4%
Finance, Insurance, Real Estate
35,253 8.3% 42,471 8.4% 31,970 6.9% 31,781 6.2% -33.6%
Manufacturing 38,050 8.9% 37,104 7.4% 26,417 5.7% 26,400 5.1% -40.5%
415Seattle 2035Appendices Land Use Appendix
Industry Sector* 1995
Jo
bs**
% S
har
e
2000
% S
har
e
2010
Job
s
% S
har
e
2014
Job
s
% S
har
e
Sect
or %
C
han
ge
2000
–201
4
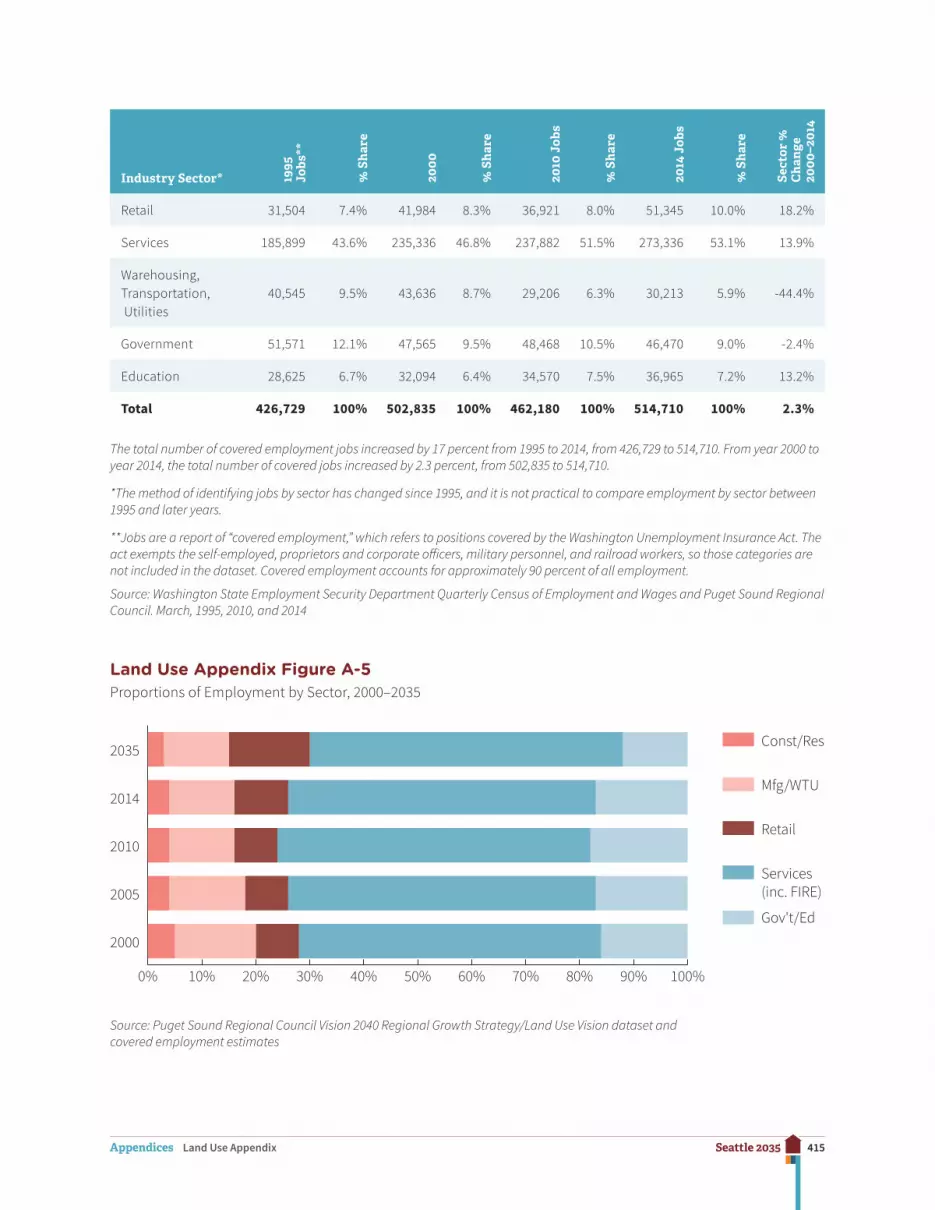
Retail 31,504 7.4% 41,984 8.3% 36,921 8.0% 51,345 10.0% 18.2%
Services 185,899 43.6% 235,336 46.8% 237,882 51.5% 273,336 53.1% 13.9%
Warehousing, Transportation, Utilities
40,545 9.5% 43,636 8.7% 29,206 6.3% 30,213 5.9% -44.4%
Government 51,571 12.1% 47,565 9.5% 48,468 10.5% 46,470 9.0% -2.4%
Education 28,625 6.7% 32,094 6.4% 34,570 7.5% 36,965 7.2% 13.2%
Total 426,729 100% 502,835 100% 462,180 100% 514,710 100% 2.3%
The total number of covered employment jobs increased by 17 percent from 1995 to 2014, from 426,729 to 514,710. From year 2000 to year 2014, the total number of covered jobs increased by 2.3 percent, from 502,835 to 514,710.
*The method of identifying jobs by sector has changed since 1995, and it is not practical to compare employment by sector between 1995 and later years.
**Jobs are a report of “covered employment,” which refers to positions covered by the Washington Unemployment Insurance Act. The act exempts the self-employed, proprietors and corporate officers, military personnel, and railroad workers, so those categories are not included in the dataset. Covered employment accounts for approximately 90 percent of all employment.
Source: Washington State Employment Security Department Quarterly Census of Employment and Wages and Puget Sound Regional Council. March, 1995, 2010, and 2014
Land Use Appendix Figure A-5Proportions of Employment by Sector, 2000–2035
0% 10% 20% 30% 40% 50% 60% 70% 80% 90% 100%
2000
2005
2010
2014
2035
Gov't/Ed
Services (inc. FIRE)
Retail
Mfg/WTU
Const/Res
Source: Puget Sound Regional Council Vision 2040 Regional Growth Strategy/Land Use Vision dataset and covered employment estimates
416Seattle 2035Appendices Land Use Appendix
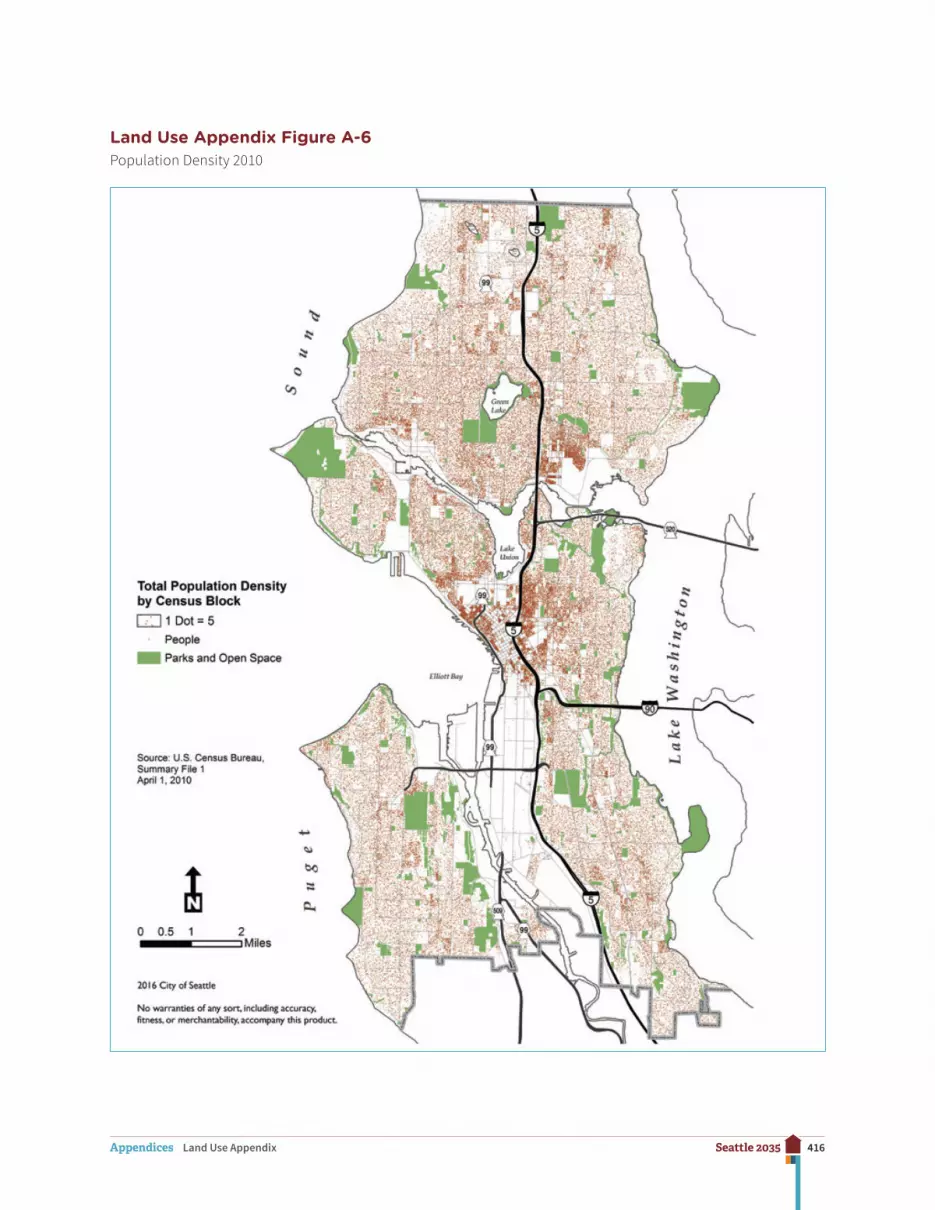
Land Use Appendix Figure A-6Population Density 2010

417Seattle 2035Appendices Land Use Appendix
Land Use Appendix Figure A-7Household Density 2010
418Seattle 2035Appendices Land Use Appendix
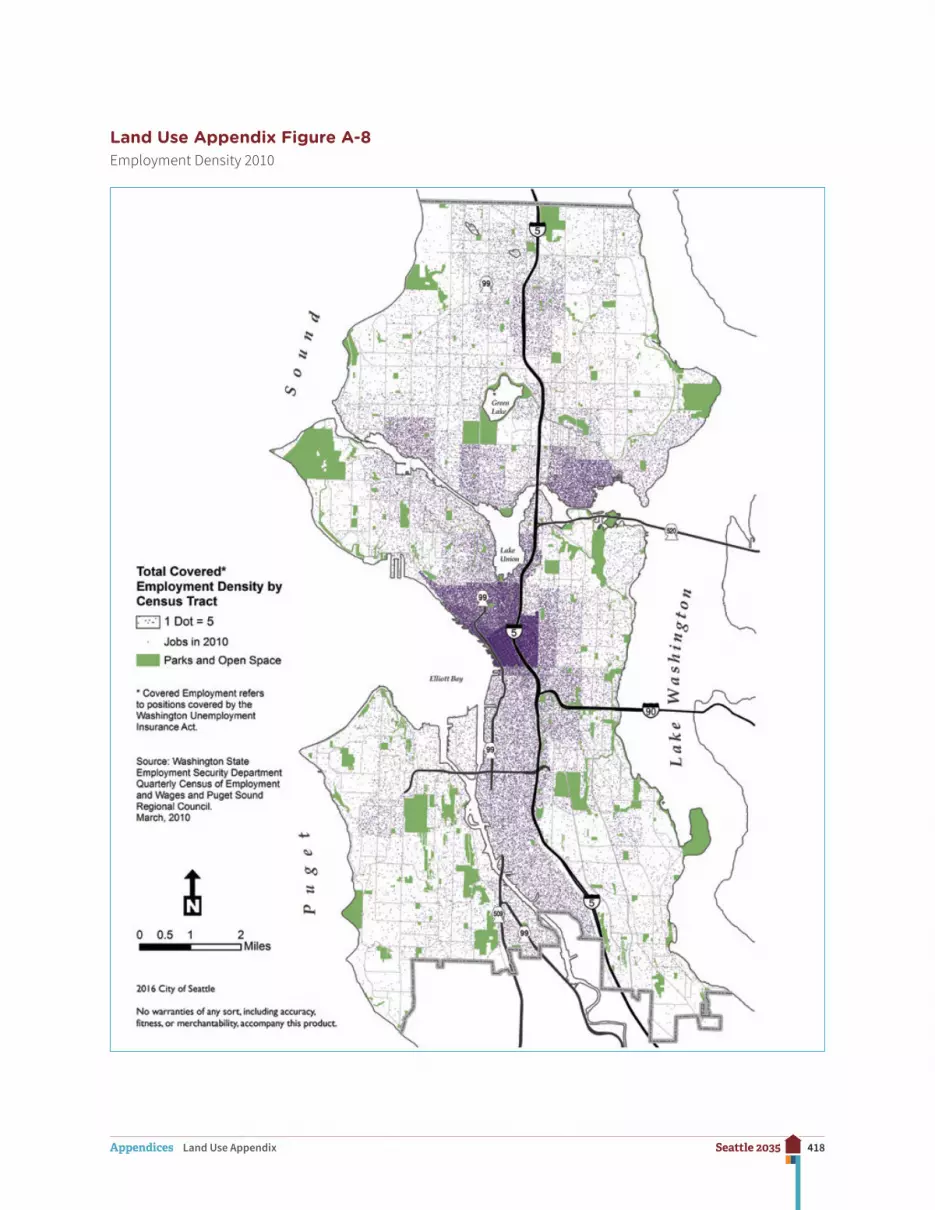
Land Use Appendix Figure A-8Employment Density 2010
419Seattle 2035Appendices Land Use Appendix
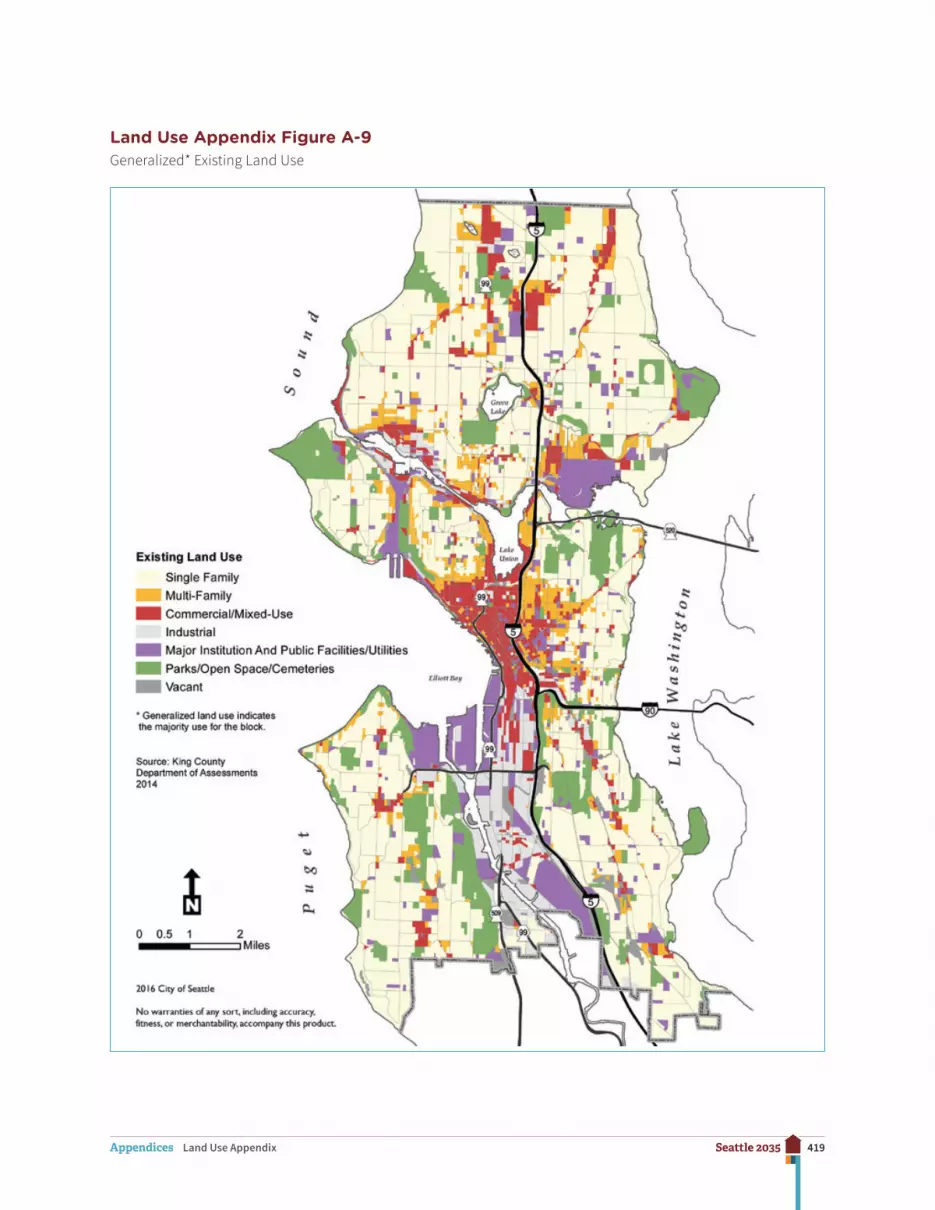
Land Use Appendix Figure A-9Generalized* Existing Land Use
420Seattle 2035Appendices Transportation Appendix
Transportation Appendix
Introduction
Many of the terms used in the Transportation element and appendix may be unfamiliar to the casual reader. The purpose of providing the information in this appendix, and related information in the Transportation element, is to comply with the requirements of the state Growth Management Act (GMA), RCW Chapter 36.70A, by showing land use assumptions used in estimating travel; estimated traffic impacts to state-owned transportation facilities based on those assumptions; facilities and service needs, including level of service stan-dards for local arterials and state highways; forecasts of traffic; and a financing plan to show how these needs will be met.
There are useful glossaries in the State of Washington Department of Commerce’s Transportation Guidebook (http://www.commerce.wa.gov/Services/localgovernment/GrowthManagement/Growth-Management-Planning-Topics/Pages/Transportation.aspx), Washington State Department of Transportation’s (WSDOT) website titled Growth Management Act (GMA); http://www.wsdot.wa.gov/Publications/Manuals/index.htm and at Comprehensive Plan Resources (http://www.wsdot.wa.gov/planning/community/GMA).
Land Use Assumptions Used in Estimating Travel
To estimate future travel levels, assumptions were made for a variety of factors related to future population, employment, and transportation facilities. These include the number and geographic distribution of both households and employment in Seattle and the region, characteristics of households and jobs (e.g., number of residents per household, household income), and the transportation network (e.g., streets, transit routes). Then, a computer model was used to predict the total number of person-trips between various travel zones, the number of trips that would use various modes (e.g., car, bus, bike, walk), and the result-ing vehicle traffic volumes on various streets throughout the city.
http://www.commerce.wa.gov/Services/localgovernment/GrowthManagement/Growth-Management-Planning-Topi
http://www.commerce.wa.gov/Services/localgovernment/GrowthManagement/Growth-Management-Planning-Topi
421Seattle 2035Appendices Transportation Appendix
Existing Conditions
In 2010, the Census counted 608,660 people living in Seattle and 308,500 housing units. The State Office of Financial Management (OFM) provided an estimate in April 2015 of approx-imately 662,400 residents, 314,326 households, and 332,694 housing units. Many people visit Seattle for various purposes, such as working, shopping, education, tourism, medical appointments, pass-through travel, and other reasons.
Regional Land Use Assumptions
The Puget Sound Regional Council (PSRC) conducts regional planning for the four-county (Snohomish, King, Pierce, and Kitsap) central Puget Sound region. The PSRC’s Vision 2040 and Transportation 2040 present a vision of growth management and an array of transpor-tation policies to guide transportation investment decisions. The PSRC provides population and employment forecasts for the region, and encourages growth in ways that focus future population and employment growth into urban centers, including those urban centers defined in this Comprehensive Plan.
Seattle Land Use Assumptions
Seattle’s growth assumptions for the period from 2015 through 2035 are 70,000 net new housing units and 115,000 net new jobs. This is Seattle’s share of the region’s projected housing and employment growth between 2015 and 2035, allocated through the county-wide planning process conducted by the Growth Management Planning Council.
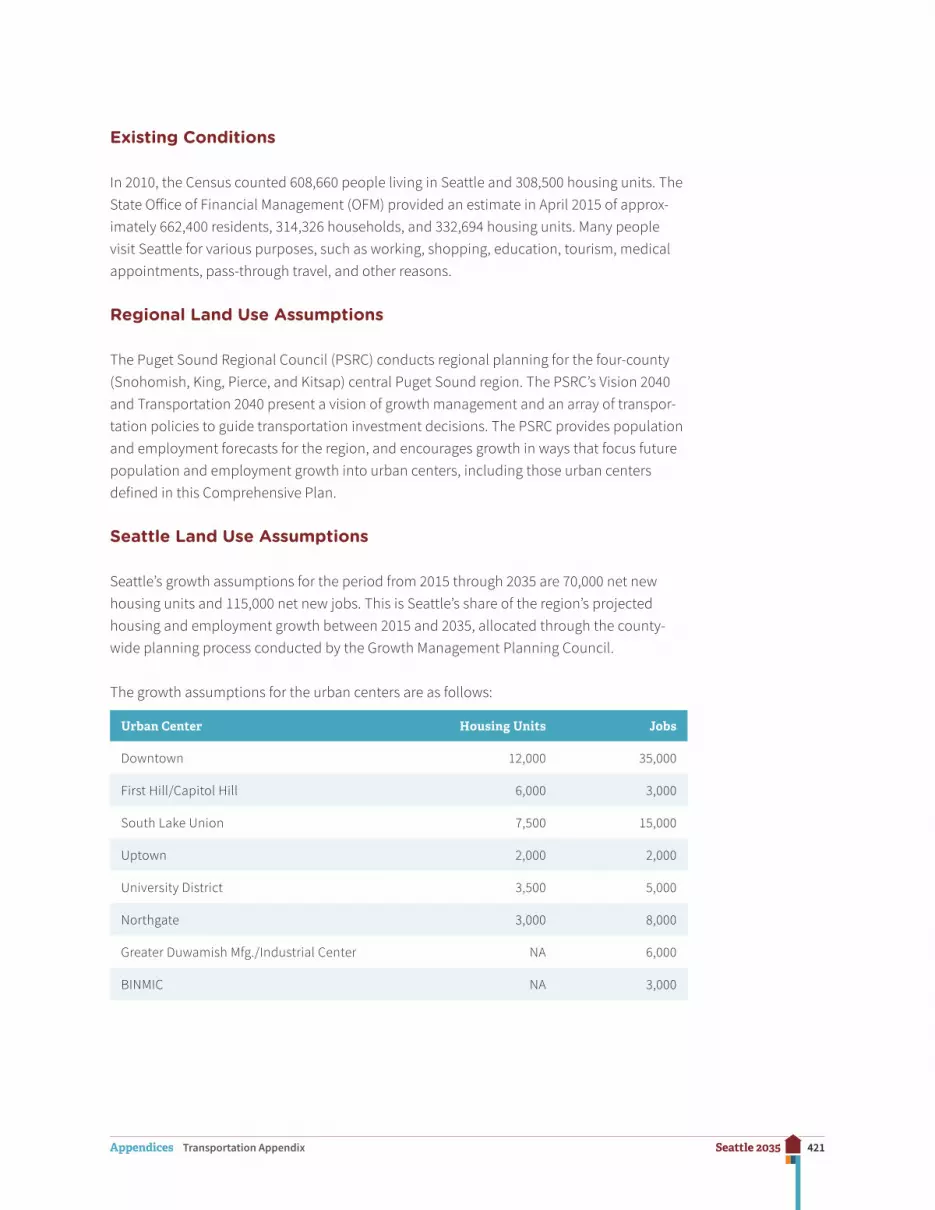
The growth assumptions for the urban centers are as follows:
Urban Center Housing Units Jobs
Downtown 12,000 35,000
First Hill/Capitol Hill 6,000 3,000
South Lake Union 7,500 15,000
Uptown 2,000 2,000
University District 3,500 5,000
Northgate 3,000 8,000
Greater Duwamish Mfg./Industrial Center NA 6,000
BINMIC NA 3,000
422Seattle 2035Appendices Transportation Appendix
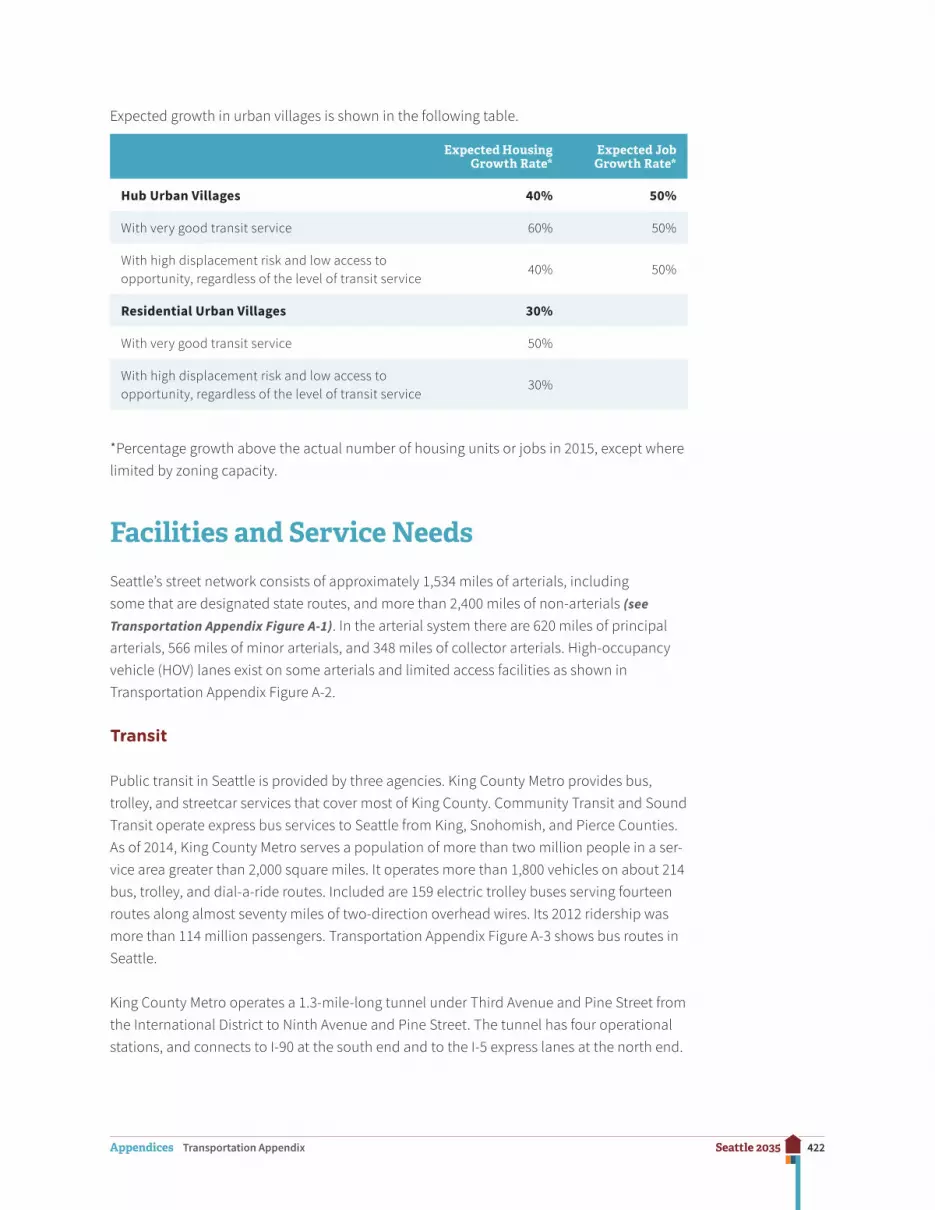
Expected growth in urban villages is shown in the following table.
Expected Housing Growth Rate*
Expected Job Growth Rate*
Hub Urban Villages 40% 50%
With very good transit service 60% 50%
With high displacement risk and low access to opportunity, regardless of the level of transit service
40% 50%
Residential Urban Villages 30%
With very good transit service 50%
With high displacement risk and low access to opportunity, regardless of the level of transit service
30%
*Percentage growth above the actual number of housing units or jobs in 2015, except where limited by zoning capacity.
Facilities and Service Needs
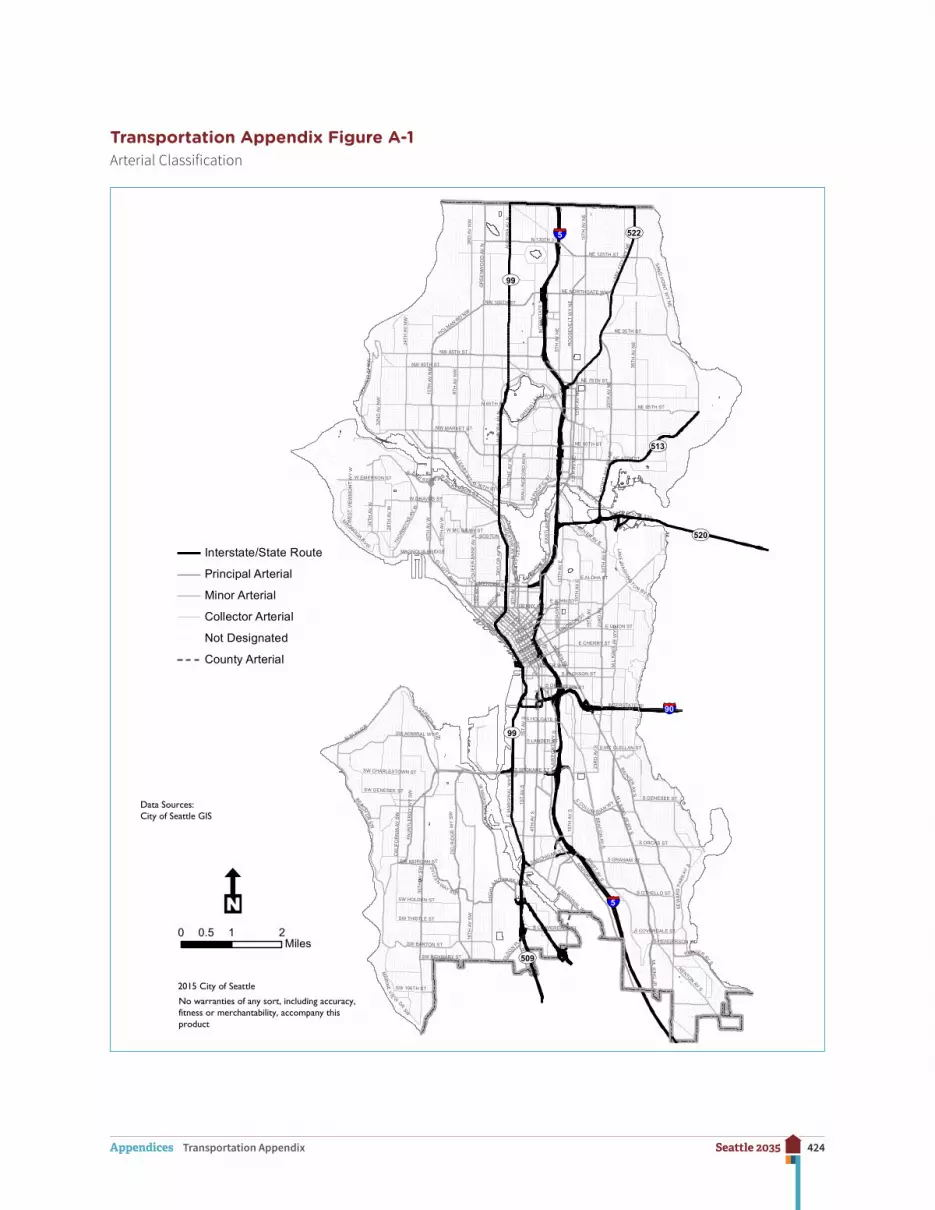
Seattle’s street network consists of approximately 1,534 miles of arterials, including some that are designated state routes, and more than 2,400 miles of non-arterials (see Transportation Appendix Figure A-1). In the arterial system there are 620 miles of principal arterials, 566 miles of minor arterials, and 348 miles of collector arterials. High-occupancy vehicle (HOV) lanes exist on some arterials and limited access facilities as shown in Transportation Appendix Figure A-2.
Transit
Public transit in Seattle is provided by three agencies. King County Metro provides bus, trolley, and streetcar services that cover most of King County. Community Transit and Sound Transit operate express bus services to Seattle from King, Snohomish, and Pierce Counties. As of 2014, King County Metro serves a population of more than two million people in a ser-vice area greater than 2,000 square miles. It operates more than 1,800 vehicles on about 214 bus, trolley, and dial-a-ride routes. Included are 159 electric trolley buses serving fourteen routes along almost seventy miles of two-direction overhead wires. Its 2012 ridership was more than 114 million passengers. Transportation Appendix Figure A-3 shows bus routes in Seattle.
King County Metro operates a 1.3-mile-long tunnel under Third Avenue and Pine Street from the International District to Ninth Avenue and Pine Street. The tunnel has four operational stations, and connects to I-90 at the south end and to the I-5 express lanes at the north end.

423Seattle 2035Appendices Transportation Appendix
The tunnel supports joint bus and light rail service until such time as light rail train service is too frequent to safely operate joint services in the tunnel.
Sound Transit is the regional transit authority for the Puget Sound area (which includes portions of King, Snohomish, and Pierce Counties.) Sound Transit operates light rail service connecting Downtown Seattle with SeaTac Airport and has construction under way to extend service northward to Lynnwood. Stations serving Capitol Hill and Husky Stadium opened in March 2016. Light rail will serve additional stations in the University District, Roosevelt, and Northgate by 2021. Routing is shown on Transportation Appendix Figure A-4.
There are thirteen Link light rail stations currently in Seattle: in Rainier Beach, Othello, Columbia City, North Rainier/Mt. Baker, Beacon Hill, SODO/Lander Street, and SODO/Royal Brougham Way, Capitol Hill, Husky Stadium, and four in the Downtown transit tunnel. Weekday ridership averaged more than 37,000 passengers in 2014.
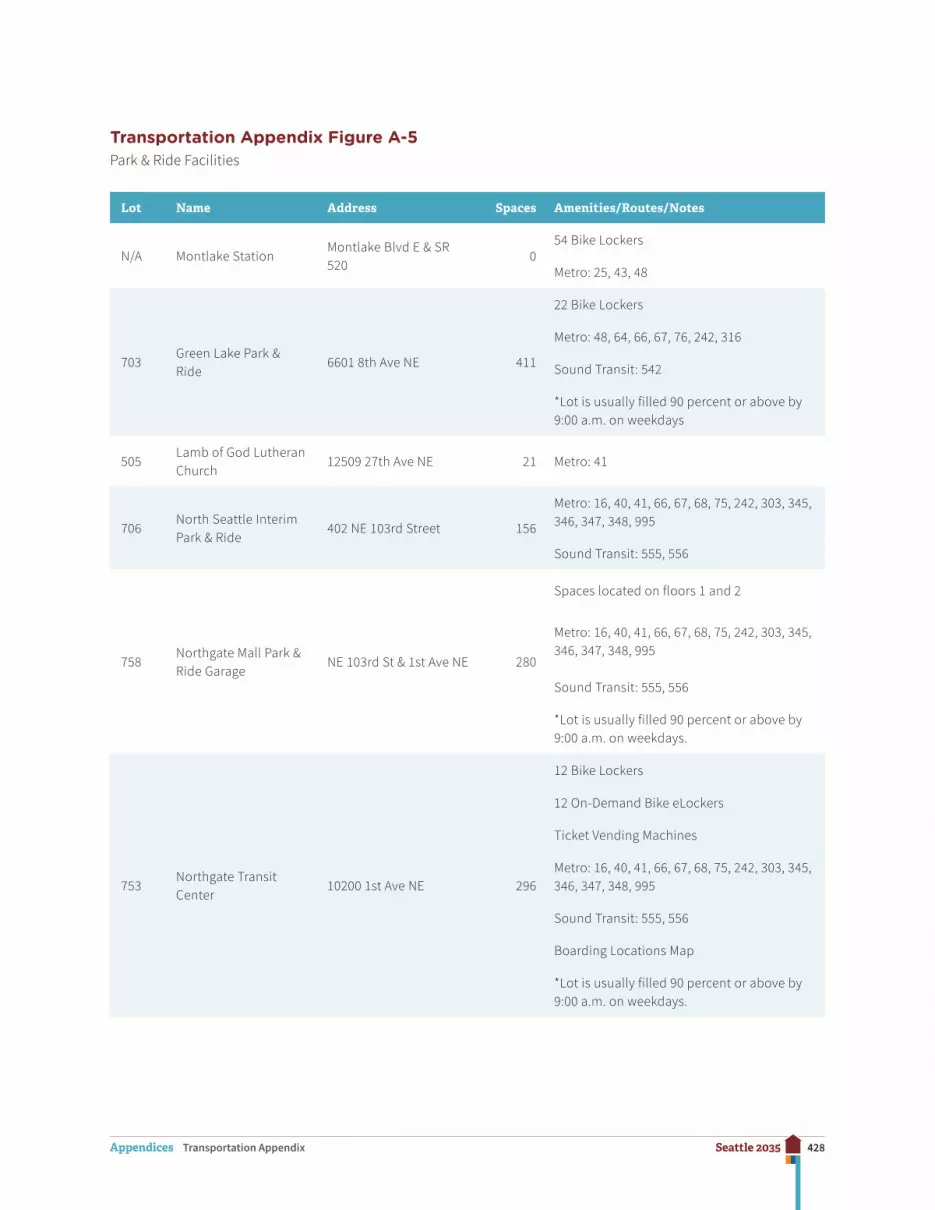
Sound Transit also provides Sounder commuter rail services during peak hours along existing rail lines from Downtown Seattle northward to Everett and southward to Tacoma and Lakewood. Metro, Sound Transit, and WSDOT operate approximately eighteen park-and-ride facilities with approximately 2,262 parking spaces in Seattle. (See Transportation Appendix Figure A-5.)
424Seattle 2035Appendices Transportation Appendix
Transportation Appendix Figure A-1Arterial Classification
WE
ST
VIE
WM
ON
T W
Y W
SW GENESEE ST
SW CHARLESTOWN ST
SEAV
IEW
AVN
W
16TH
AV
SW
3RD
AV
NW
1ST
AV N
OLS
ON
PL SW
DENNY WY
S MICHIGAN ST
YESLER WAY
AIR
PO
RT
WY
S5T
H A
V N
E
23R
D A
V S
24TH
AV
E
RAI NIER
AVS
S ORCAS ST
BEACHD
RSW
34TH
AV
W
CA
LIFO
RN
IA A
V S
W
SW THISTLE ST
W MC GRAW ST
N 36TH ST
NW 105TH ST
TAY
LOR
AV
NA
UR
OR
A A
V N
DE
XTERAV
N
MARION STUNION STPINE ST
FAIR
VIEW
AVN
NE 75TH ST
BE
AC
ON
AV S
E UNION ST
MO
NTL
AKE
BV
NE
LAK
EW
ASHING
TO N BV E
S COVERDALE ST
S OTHELLO ST
S HENDERSON ST
SE
WA
RD
PAR
KAV
S
SW MORGAN ST
THO
RNDY
KE A
V W
NW 85TH ST
GR
EE
NW
OO
D A
V N
STO
NE
AV
N9T
H A
V N
MYER
S WY S
S LANDER ST
1ST
AV S
S CLOVERDALE ST
4TH
AV
S
E MADISON ST
AIRPORTW
YS
12TH
AV
NE
RO
OS
EV
ELT
WY
NE
SWIFT
AVS
E CHERRY ST
E ALOHA ST
M L KIN
G JR
WY S
ML
KIN
GJ R
WY
S
32N
D A
V N
W
ALASKAN WY
WA
LLIN
GFO
RD
AV
N
NE NORTHGATE WY
NE 50TH ST
INTERSTATE 90
25TH
AVN
ELA
KEC
ITY
WY
NE
S GENESEE ST
RAINIER AVS
MA
RIN
EV
IE
W
DRSW
MAGNOLIA BRIDGE
24TH
AV
NW
SW BARTON ST
NW 80TH ST
HARBOR
AVS
W
15TH
AV
W
ELLIOTTAV
W
WNICKERSON ST
NW MARKET ST
DE
LRID
GE
WY
SW
NW LEARY W
Y
8TH
A VN
WW
MA
RG
INA
LW
Y
SW
2ND AV
JAMES ST
S DEARBORN ST
EA
STL
AK
E A
V E
EMARGINAL W
YS
12TH
AV
NE
NE 125TH ST
NE 145TH ST
S GRAHAM ST
NE 65TH ST
SAN
DPO
INT
WY
NE
RENTONAV
S
ALKI AV SW
W EMERSON ST
SW 106TH ST
SW HOLDEN ST
SW ROXBURY ST
35TH
AV
SW
SYLV
AN
WAY SW
15TH
AVN
W
1 0TH
A VW
HIG
HLA
ND PARK WY SW
AU
RO
RA
AV
N
S SPOKANE ST
BOYER AV E
NE PACIFIC ST
NE 95TH ST
35TH
AV
NE
ML K
ING
JR W
Y S
MAGNOLIA
BV
W
28TH
AV
W
SW ADMIRAL WY
W DRAVUS ST
W EME
RSON PL
HOLMAN RD NW
BROADST
E M
AR
GIN
AL
WY
S
WE
STLA
KE
AVN
EGREEN
LA
KE WY N
1ST
AV S
4TH
AV
S
N 130TH ST
BOR
ENAV
BR
OA
DW
AY
E JOHN ST
15TH
AV
S
S
COLUM B IAN WY
19TH
AV
STATE ROUTE 520
NE 45TH ST
FAU
NTL
ER
OY
WY
SW
MERCER ST
QU
EE
NA
NN
EA V
N BOSTON ST
N 65TH ST
4TH AV
6THAV
S HOLGATE ST
COLUMBIA ST
NPA
CIFIC
STIN
TER
STA
TE 5
S JACKSON ST
10TH
AV
E
15TH
AV
E15
TH A
V N
E
S MC CLELLAN ST
23R
DA
V
Interstate/State Route
Principal Arterial
Minor Arterial
Collector Arterial
Not Designated
County Arterial
2015 City of Seattle
0 1 20.5Miles
L
§̈¦5
§̈¦5
§̈¦90
UV520
UV99
UV522
UV99
UV513
UV509
No warranties of any sort, including accuracy,fitness or merchantability, accompany thisproduct
Data Sources:City of Seattle GIS

425Seattle 2035Appendices Transportation Appendix
Transportation Appendix Figure A-2Transit/High-Occupancy Vehicle Lanes
!!
!!
!!
!!
!!
!!
!!
!!
!!
!!
!!
!!
!!
!!
!!
!!
!!
! !
!!
!
!
!!
!!
!
!!
!
!
!!!!
!!!!
!!
!
!
!!!!!
!!
!
!!
!!!!
!
!!
! !
!!
!!
!!
!!
!
!!
!
!
!!
!!
!
!!
!!!
!
!!
!
!
!
!
!!
!
!
!
!
!!
!!!
!!
!
!!
!!
!!
!
!
!
!
!!
!
!
!
!!
!!
!!
!!
!!
!!
!!
!!
!!
!!
!!
!!
!!
!
!
WE
ST
VIE
WM
ON
T W
Y W
SW GENESEE ST
SW CHARLESTOWN ST
SEAV
IEW
A VN
W
16TH
AV
SW
3RD
AV
NW
1ST
AV N
OLS
ON
PL SW
DENNY WY
S MICHIGAN ST
YESLER WAY
AIR
PO
RT
WY
S5T
H A
V N
E
23R
D A
V S
24TH
AV
E
RAI NIERAV
S
S ORCAS ST
BEACH
DR
SW
34TH
AV
W
CA
LIFO
RN
IA A
V S
W
SW THISTLE ST
W MC GRAW ST
N 36TH ST
NW 105TH ST
TAY
LOR
AV
NAU
RO
RA
AV N
DEX
TER
AVN
MARION STUNION STPINE ST
FAIR
VIEW
AVN
NE 75TH ST
BEA
CO
N AV
S
E UNION ST
MO
NTL
AKE
BV
NE
L AK
EW
ASHINGTO N BV E
S COVERDALE ST
S OTHELLO ST
S HENDERSON ST
SE
WA
RD
PAR
KAV
S
SW MORGAN ST
THO
RNDY
KE A
V W
NW 85TH ST
GR
EE
NW
OO
D A
V N
STO
NE
AV N
9TH
AV
N
MYER
S WY S
S LANDER ST
1ST
AV S
S CLOVERDALE ST
4TH
AV
S
E MADISON ST
AIRPORTW
YS
12TH
AV
NE
RO
OS
EVE
LT W
Y N
E
SWIFT
AVS
E CHERRY ST
E ALOHA ST
M L KIN
G JR
WY S
ML
KIN
GJ R
WY
S
32N
D A
V N
W
ALASKAN WY
WA
LLIN
GFO
RD
AV
N
NE NORTHGATE WY
NE 50TH ST
INTERSTATE 90
25TH
AVN
ELA
KEC
ITY
WY
NE
S GENESEE ST
RAINIER AVS
MA
RIN
EV
IE
W
DRSW
MAGNOLIA BRIDGE
24TH
AV
NW
SW BARTON ST
NW 80TH ST
HARBOR
AVSW
15TH
AV
W
ELLIOTTAVW
WNICKERSON ST
NW MARKET ST
DE
L RID
GE
WY
SW
NW LEARY W
Y
8TH
A VN
WW
MAR
GIN
AL
WY
SW
2ND AV
JAMES ST
S DEARBORN ST
EAS
TLA
KE
AV
E
E MARGINAL WYS
12TH
AV
NE
NE 125TH ST
NE 145TH ST
S GRAHAM ST
NE 65TH ST
SAN
DPO
INT
WY
NE
RENTONAV
S
ALKI AV SW
W EMERSON ST
SW 106TH ST
SW HOLDEN ST
SW ROXBURY ST
35TH
AV
SW
SYLVAN
WAY SW
15TH
AVN
W
1 0TH
A VW
HIG
HLA
ND PARK WY SW
AUR
OR
A AV
N
S SPOKANE ST
BOYER AV E
NE PACIFIC ST
NE 95TH ST
35TH
AV
NE
ML K
ING
JR W
Y S
MAGNOLIA BV
W
28TH
AV
W
SW ADMIRAL WY
W DRAVUS ST
W EME
RSON PL
HOLMAN RD NW
BROADST
E M
ARG
INA
L W
Y S
WE
STLA
KE
AVN
EGREEN
LA
KE WY N
1ST
AV S
4TH
AV
S
N 130TH ST
BOREN
AV
BRO
AD
WAY
E JOHN ST
15TH
AV
S
S
COLUM B IAN WY
19TH
AV
STATE ROUTE 520
NE 45TH ST
FAU
NTL
ER
OY
WY
SW
MERCER ST
QU
EEN
AN
NE
AVN BOSTON ST
N 65TH ST
4TH AV
6TH AV
S HOLGATE ST
COLUMBIA ST
NPA
CIFIC
STIN
TER
STAT
E 5
S JACKSON ST
10TH
AV
E
15TH
AV
E15
TH A
V N
E
S MC CLELLAN ST
23R
DA
V
Bus Lane
! ! ! HOV Lane
2015 City of Seattle
0 1 20.5Miles
L
No warranties of any sort, including accuracy,fitness or merchantability, accompany thisproduct
Data Sources:City of Seattle GISSeattle Department of Transportation GIS

426Seattle 2035Appendices Transportation Appendix
Transportation Appendix Figure A-3Bus Routes
WE
ST
VIE
WM
ON
T W
Y W
SW GENESEE ST
SW CHARLESTOWN ST
SEAV
IEW
A VN
W
16TH
AV
SW
3RD
AV
NW
1ST
AV N
OLS
ON
PL SW
DENNY WY
S MICHIGAN ST
YESLER WAY
AIR
PO
RT
WY
S5T
H A
V N
E
23R
D A
V S
24TH
AV
E
RAI NIERAV
S
S ORCAS ST
BEACH
DR
SW
34TH
AV
W
CA
LIFO
RN
IA A
V S
W
SW THISTLE ST
W MC GRAW ST
N 36TH ST
NW 105TH ST
TAY
LOR
AV
NAU
RO
RA
AV N
DEX
TER
AVN
MARION STUNION STPINE ST
FAIR
VIEW
AVN
NE 75TH ST
BEA
CO
N AV
S
E UNION ST
MO
NTL
AKE
BV
NE
L AK
EW
ASHINGTO N BV E
S COVERDALE ST
S OTHELLO ST
S HENDERSON ST
SE
WA
RD
PAR
KAV
S
SW MORGAN ST
THO
RNDY
KE A
V W
NW 85TH ST
GR
EE
NW
OO
D A
V N
STO
NE
AV N
9TH
AV
N
MYER
S WY S
S LANDER ST
1ST
AV S
S CLOVERDALE ST
4TH
AV
S
E MADISON ST
AIRPORTW
YS
12TH
AV
NE
RO
OS
EVE
LT W
Y N
E
SWIFT
AVS
E CHERRY ST
E ALOHA ST
M L KIN
G JR
WY S
ML
KIN
GJ R
WY
S
32N
D A
V N
W
ALASKAN WY
WA
LLIN
GFO
RD
AV
N
NE NORTHGATE WY
NE 50TH ST
INTERSTATE 90
25TH
AVN
ELA
KEC
ITY
WY
NE
S GENESEE ST
RAINIER AVS
MA
RIN
EV
IE
W
DRSW
MAGNOLIA BRIDGE
24TH
AV
NW
SW BARTON ST
NW 80TH ST
HARBOR
AVSW
15TH
AV
W
ELLIOTTAVW
WNICKERSON ST
NW MARKET ST
DE
L RID
GE
WY
SW
NW LEARY W
Y8T
HA V
NW
WM
ARG
INA
LW
Y
SW
2ND AV
JAMES ST
S DEARBORN ST
EAS
TLA
KE
AV
E
E MARGINAL WYS
12TH
AV
NE
NE 125TH ST
NE 145TH ST
S GRAHAM ST
NE 65TH ST
SAN
DPO
INT
WY
NE
RENTONAV
S
ALKI AV SW
W EMERSON ST
SW 106TH ST
SW HOLDEN ST
SW ROXBURY ST
35TH
AV
SW
SYLVAN
WAY SW
15TH
AVN
W
1 0TH
A VW
HIG
HLA
ND PARK WY SW
AUR
OR
A AV
N
S SPOKANE ST
BOYER AV E
NE PACIFIC ST
NE 95TH ST
35TH
AV
NE
ML K
ING
JR W
Y S
MAGNOLIA BV
W
28TH
AV
W
SW ADMIRAL WY
W DRAVUS ST
W EME
RSON PL
HOLMAN RD NW
BROADST
E M
ARG
INA
L W
Y S
WE
STLA
KE
AVN
EGREEN
LA
KE WY N
1ST
AV S
4TH
AV
S
N 130TH ST
BOREN
AV
BRO
AD
WAY
E JOHN ST
15TH
AV
S
S
COLUM B IAN WY
19TH
AV
STATE ROUTE 520
NE 45TH ST
FAU
NTL
ER
OY
WY
SW
MERCER ST
QU
EEN
AN
NE
AVN BOSTON ST
N 65TH ST
4TH AV
6TH AV
S HOLGATE ST
COLUMBIA ST
NPA
CIFIC
STIN
TER
STAT
E 5
S JACKSON ST
10TH
AV
E
15TH
AV
E15
TH A
V N
E
S MC CLELLAN ST
23R
DA
V
Bus Route
2015 City of Seattle
0 1 20.5Miles
L
No warranties of any sort, including accuracy,fitness or merchantability, accompany thisproduct
Data Sources:King County GISCity of Seattle GIS

427Seattle 2035Appendices Transportation Appendix
Transportation Appendix Figure A-4Rail & Ferry Routes
WE
ST
VIE
WM
ON
T W
Y W
SW GENESEE ST
SW CHARLESTOWN ST
SEAV
IEW
A VN
W
16TH
AV
SW
3RD
AV
NW
1ST
AV N
OLS
ON
PL SW
DENNY WY
S MICHIGAN ST
YESLER WAY
AIR
PO
RT
WY
S5T
H A
V N
E
23R
D A
V S
24TH
AV
E
RAI NIERAV
S
S ORCAS ST
BEACH
DR
SW
34TH
AV
W
CA
LIFO
RN
IA A
V S
W
SW THISTLE ST
W MC GRAW ST
N 36TH ST
NW 105TH ST
TAY
LOR
AV
NAU
RO
RA
AV N
DEX
TER
AVN
MARION STUNION STPINE ST
FAIR
VIEW
AVN
NE 75TH ST
BEA
CO
N AV
S
E UNION ST
MO
NTL
AKE
BV
NE
L AK
EW
ASHINGTO N BV E
S COVERDALE ST
S OTHELLO ST
S HENDERSON ST
SE
WA
RD
PAR
KAV
S
SW MORGAN ST
THO
RNDY
KE A
V W
NW 85TH ST
GR
EE
NW
OO
D A
V N
STO
NE
AV N
9TH
AV
N
MYER
S WY S
S LANDER ST
1ST
AV S
S CLOVERDALE ST
4TH
AV
S
E MADISON ST
AIRPORTW
YS
12TH
AV
NE
RO
OS
EVE
LT W
Y N
E
SWIFT
AVS
E CHERRY ST
E ALOHA ST
M L KIN
G JR
WY S
ML
KIN
GJ R
WY
S
32N
D A
V N
W
ALASKAN WY
WA
LLIN
GFO
RD
AV
N
NE NORTHGATE WY
NE 50TH ST
INTERSTATE 90
25TH
AVN
ELA
KEC
ITY
WY
NE
S GENESEE ST
RAINIER AVS
MA
RIN
EV
IE
W
DRSW
MAGNOLIA BRIDGE
24TH
AV
NW
SW BARTON ST
NW 80TH ST
HARBOR
AVSW
15TH
AV
W
ELLIOTTAVW
WNICKERSON ST
NW MARKET ST
DE
L RID
GE
WY
SW
NW LEARY W
Y8T
HA V
NW
WM
ARG
INA
LW
Y
SW
2ND AV
JAMES ST
S DEARBORN ST
EAS
TLA
KE
AV
E
E MARGINAL WYS
12TH
AV
NE
NE 125TH ST
NE 145TH ST
S GRAHAM ST
NE 65TH ST
SAN
DPO
INT
WY
NE
RENTONAV
S
ALKI AV SW
W EMERSON ST
SW 106TH ST
SW HOLDEN ST
SW ROXBURY ST
35TH
AV
SW
SYLVAN
WAY SW
15TH
AVN
W
1 0TH
A VW
HIG
HLA
ND PARK WY SW
AUR
OR
A AV
N
S SPOKANE ST
BOYER AV E
NE PACIFIC ST
NE 95TH ST
35TH
AV
NE
ML K
ING
JR W
Y S
MAGNOLIA BV
W
28TH
AV
W
SW ADMIRAL WY
W DRAVUS ST
W EME
RSON PL
HOLMAN RD NW
BROADST
E M
ARG
INA
L W
Y S
WE
STLA
KE
AVN
EGREEN
LA
KE WY N
1ST
AV S
4TH
AV
S
N 130TH ST
BOREN
AV
BRO
AD
WAY
E JOHN ST
15TH
AV
S
S
COLUM B IAN WY
19TH
AV
STATE ROUTE 520
NE 45TH ST
FAU
NTL
ER
OY
WY
SW
MERCER ST
QU
EEN
AN
NE
AVN BOSTON ST
N 65TH ST
4TH AV
6TH AV
S HOLGATE ST
COLUMBIA ST
NPA
CIFIC
STIN
TER
STAT
E 5
S JACKSON ST
10TH
AV
E
15TH
AV
E15
TH A
V N
E
S MC CLELLAN ST
23R
DA
V
Monorail
Ferry Route
Light Rail
Streetcar
Sounder Commuter Rail
Rail
2015 City of Seattle
0 1 20.5Miles
L
No warranties of any sort, including accuracy,fitness or merchantability, accompany thisproduct
Data Sources:City of Seattle GISSeattle Department of Transportation GISKing County GISSound Transit GIS
428Seattle 2035Appendices Transportation Appendix
Transportation Appendix Figure A-5Park & Ride Facilities
Lot Name Address Spaces Amenities/Routes/Notes
N/A Montlake StationMontlake Blvd E & SR 520
054 Bike Lockers
Metro: 25, 43, 48
703Green Lake Park & Ride
6601 8th Ave NE 411
22 Bike Lockers
Metro: 48, 64, 66, 67, 76, 242, 316
Sound Transit: 542
*Lot is usually filled 90 percent or above by 9:00 a.m. on weekdays
505Lamb of God Lutheran Church
12509 27th Ave NE 21 Metro: 41
706North Seattle Interim Park & Ride
402 NE 103rd Street 156
Metro: 16, 40, 41, 66, 67, 68, 75, 242, 303, 345, 346, 347, 348, 995
Sound Transit: 555, 556
758Northgate Mall Park & Ride Garage
NE 103rd St & 1st Ave NE 280
Spaces located on floors 1 and 2
Metro: 16, 40, 41, 66, 67, 68, 75, 242, 303, 345, 346, 347, 348, 995
Sound Transit: 555, 556
*Lot is usually filled 90 percent or above by 9:00 a.m. on weekdays.
753Northgate Transit Center
10200 1st Ave NE 296
12 Bike Lockers
12 On-Demand Bike eLockers
Ticket Vending Machines
Metro: 16, 40, 41, 66, 67, 68, 75, 242, 303, 345, 346, 347, 348, 995
Sound Transit: 555, 556
Boarding Locations Map
*Lot is usually filled 90 percent or above by 9:00 a.m. on weekdays.

429Seattle 2035Appendices Transportation Appendix
Lot Name Address Spaces Amenities/Routes/Notes
753.1 and 753.2
Northgate Transit Center East Park & Ride
3rd Ave NE & NE 103rd St 448
Spaces include 50 for carpool
Metro: 16, 40, 41, 66, 67, 68, 75, 242, 303, 345, 346, 347, 348, 995
Sound Transit: 555, 556
*Lot is usually filled 90 percent or above by 9:00 a.m. on weekdays.
710South Jackson Park Park & Ride
5th Ave NE & NE 133rd St 46 Metro: 242
760Thornton Place Garage
3rd Ave NE & NE 100th St 350
Garage Floors P1 & P2
Hours: Monday-Friday 6 a.m. - 8 p.m.
Metro: 16, 40, 41, 66, 67, 68, 75, 242, 303, 345, 346, 347, 348, 995
Sound Transit: 555, 556
*Lot is usually filled 90 percent or above by 9:00 a.m. on weekdays.
749Airport & Spokane Park & Ride
Airport Way S & S Spokane St
25Metro: 101, 102, 106, 131, 150, 177, 178, 190
Sound Transit: 590, 592, 593, 594, 595
550Beverly Park First Baptist Church
11659 1st Ave S 12 Metro: 128, 131
N/A Columbia City Station4818 Martin Luther King Jr. Way S
0
37 Bike Lockers
No Metro or Sound Transit Parking Available
Paid Parking Nearby
Ticket Vending Machines
Sound Transit: Central Link Light Rail
Closest Bus Route: Metro: 8
591Community Bible Fellowship
11227 Renton Ave S 29 Metro: 106
562 Holy Family Church 9641 20th Ave SW 23Metro: 22, 113, 125
Sound Transit: 560
738Olson Place & Myers Way Park & Ride
9000 Olson Pl SW 100 Metro: 60, 113
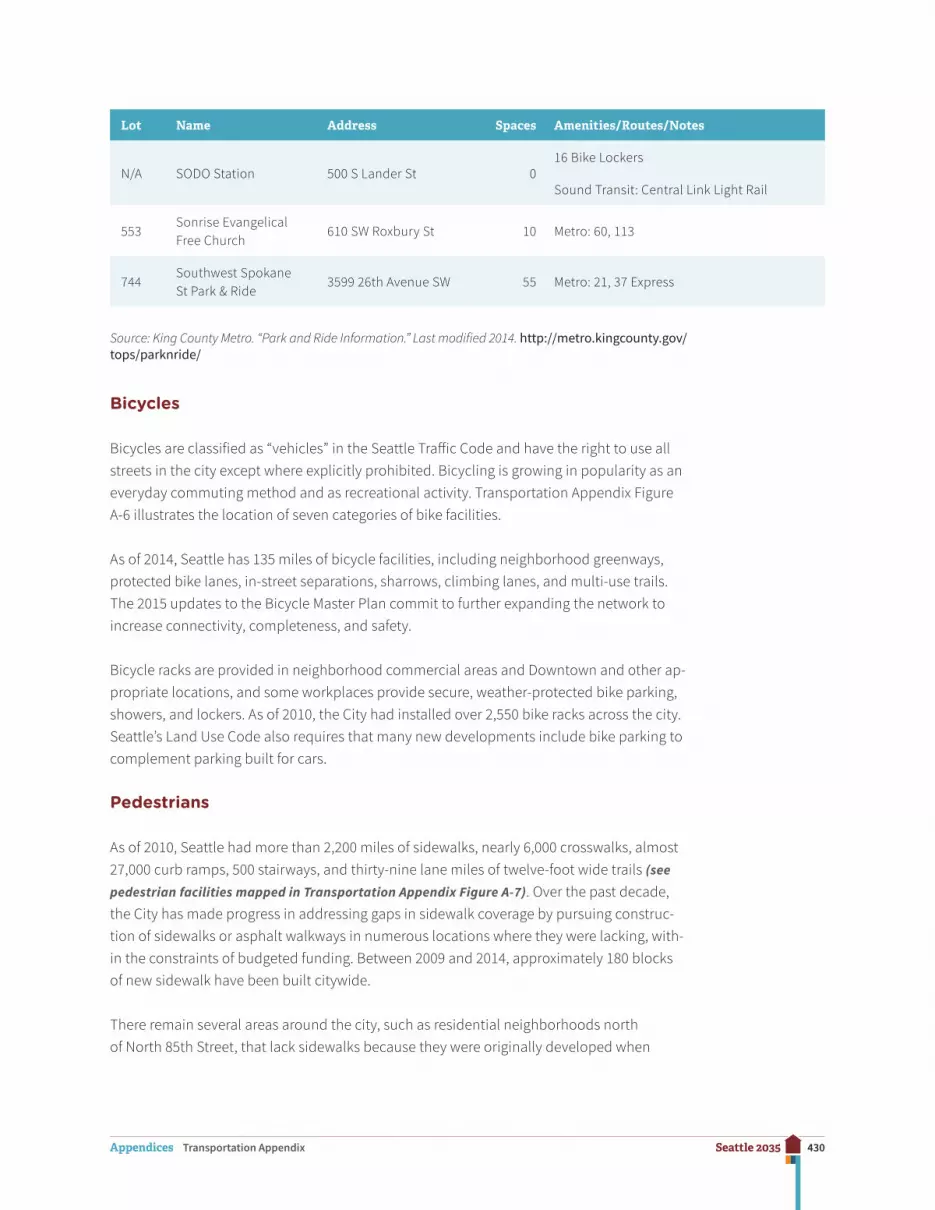
430Seattle 2035Appendices Transportation Appendix
Lot Name Address Spaces Amenities/Routes/Notes
N/A SODO Station 500 S Lander St 016 Bike Lockers
Sound Transit: Central Link Light Rail
553Sonrise Evangelical Free Church
610 SW Roxbury St 10 Metro: 60, 113
744Southwest Spokane St Park & Ride
3599 26th Avenue SW 55 Metro: 21, 37 Express
Source: King County Metro. “Park and Ride Information.” Last modified 2014. http://metro.kingcounty.gov/tops/parknride/
Bicycles
Bicycles are classified as “vehicles” in the Seattle Traffic Code and have the right to use all streets in the city except where explicitly prohibited. Bicycling is growing in popularity as an everyday commuting method and as recreational activity. Transportation Appendix Figure A-6 illustrates the location of seven categories of bike facilities.
As of 2014, Seattle has 135 miles of bicycle facilities, including neighborhood greenways, protected bike lanes, in-street separations, sharrows, climbing lanes, and multi-use trails. The 2015 updates to the Bicycle Master Plan commit to further expanding the network to increase connectivity, completeness, and safety.
Bicycle racks are provided in neighborhood commercial areas and Downtown and other ap-propriate locations, and some workplaces provide secure, weather-protected bike parking, showers, and lockers. As of 2010, the City had installed over 2,550 bike racks across the city. Seattle’s Land Use Code also requires that many new developments include bike parking to complement parking built for cars.
Pedestrians
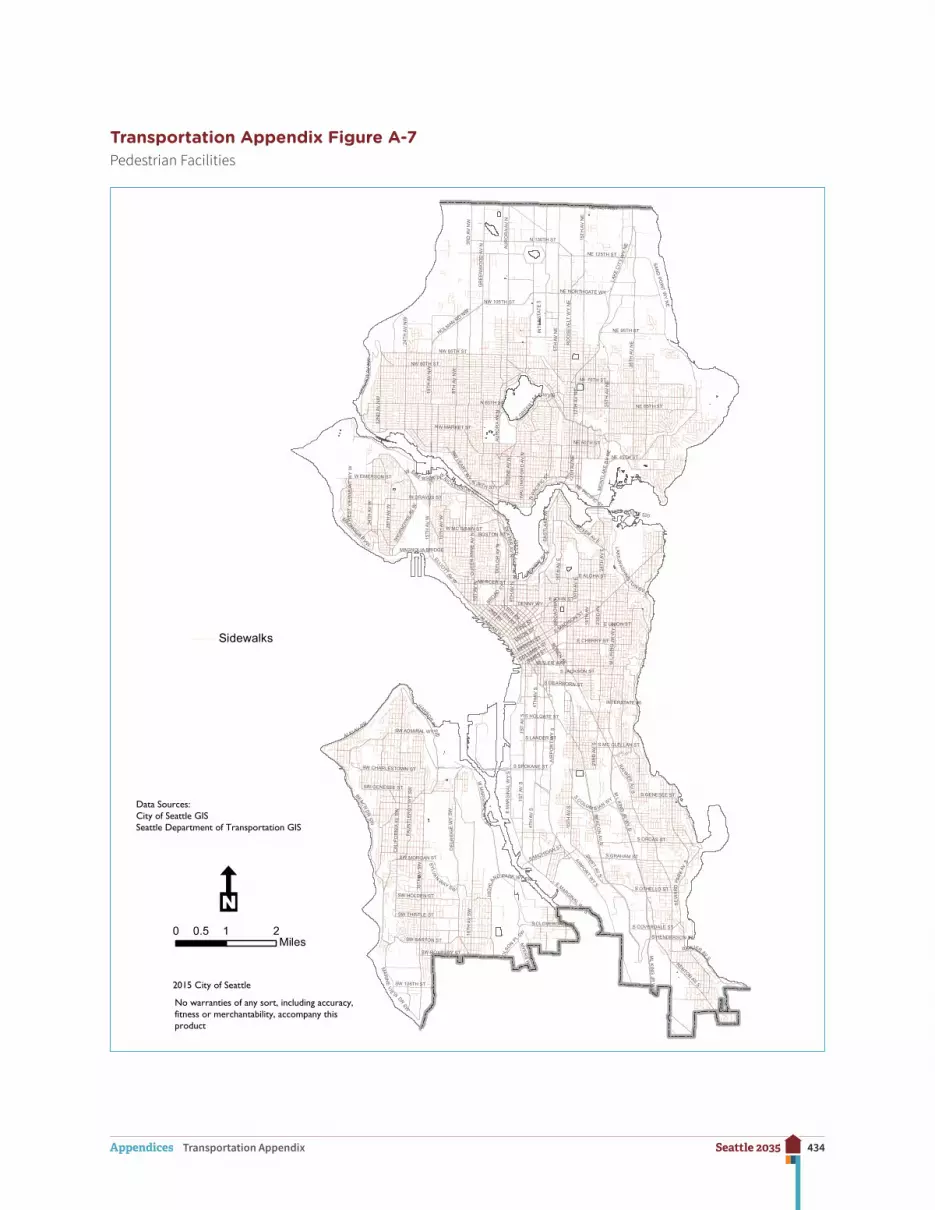
As of 2010, Seattle had more than 2,200 miles of sidewalks, nearly 6,000 crosswalks, almost 27,000 curb ramps, 500 stairways, and thirty-nine lane miles of twelve-foot wide trails (see pedestrian facilities mapped in Transportation Appendix Figure A-7). Over the past decade, the City has made progress in addressing gaps in sidewalk coverage by pursuing construc-tion of sidewalks or asphalt walkways in numerous locations where they were lacking, with-in the constraints of budgeted funding. Between 2009 and 2014, approximately 180 blocks of new sidewalk have been built citywide.
There remain several areas around the city, such as residential neighborhoods north of North 85th Street, that lack sidewalks because they were originally developed when

431Seattle 2035Appendices Transportation Appendix
sidewalks were not required. The City has levy funding to build approximately 250 blocks of sidewalk over the next nine years.
Parking
On-street parking occurs in the public right-of-way and is therefore regulated by the City through the creation of no-parking and special-use parking zones, time-of-day restrictions, parking duration limits, pay stations/meters, and restricted parking zones (RPZs). Over the past decade, the City has modernized its pay stations/meters and continues to do so with innovations such as pay-by-phone. It also has pursued more active management of on-street parking rates in order to accomplish goals for availability of on-street parking for motorists wishing to park. This makes it easier for people to find parking when and where they need it.
RPZs are designed to protect Seattle’s residential neighborhoods from parking impacts and congestion from major employment and/or retail centers. In an RPZ, on-street parking is generally restricted to one or two hours, except for residents and guests who display special RPZ decals. Existing RPZs include the following communities: Montlake, Squire Park, West Seattle-Fauntleroy, Capitol Hill, Wallingford, University District, First Hill, Eastlake, Magnolia, North Queen Anne, North Capitol Hill, Uptown (Seattle Center), Central District (Garfield High School), Belmont/ Harvard, Mount Baker (Franklin High School), North Beacon Hill, Licton Springs (North Seattle Community College), Cowen Park/Roosevelt, and Ravenna Bryant. The RPZ program is under review in 2016, with the objective to identify refinements that will respond to current needs and priorities with respect to neighborhoods’ on-street parking.
Off-street parking facilities are usually privately owned and operated. The City regulates the location and size of garages and lots through the Land Use Code. Facilities with paid parking pay a licensing fee.
Carpools receive preferential parking treatment through City programs, allocation of on-street parking spaces, and Land Use Code requirements for carpool parking in new developments.
Rail
Passenger Rail: Amtrak operates trains over 900 miles of Burlington Northern tracks in the state and provides service to sixteen cities. The Empire Builder provides daily service from Seattle to Spokane and on to Chicago; the Amtrak Cascades runs four times a day to/from Portland, and twice daily to/from Vancouver, B.C. The Coast Starlight runs daily connecting Seattle to Portland, Oakland, and on to Los Angeles. Sound Transit operates two Sounder train routes on the same tracks between Seattle/Tacoma-Lakewood and Seattle/Everett.
Freight: Transportation Appendix Figure A-17 shows a map of Freight Assets located in Seattle. Among these, Burlington Northern Santa Fe (BNSF) owns and operates a mainline
432Seattle 2035Appendices Transportation Appendix
dual-track from Portland to Seattle. Union Pacific owns and operates a single mainline track with two-way train operations between Tacoma and Seattle. BNSF owns and operates tracks that extend north from Downtown Seattle to Snohomish County and then east to Spokane.
There are four intermodal terminals servicing the Duwamish Industrial area: BNSF Railway operates the Seattle International Gateway yard north of South Hanford Street. Union Pacific Railroad operates the Seattle Argo Yard just south of Spokane Street off Diagonal/Denver Avenues in the Duwamish Manufacturing/Industrial Center. Port of Seattle termi-nals include intermodal facilities at Terminals 5 and 18. BNSF’s Interbay rail yard is north of Downtown Seattle. The Ballard Terminal is a shortline operator that connects from the BNSF railway bridge crossing of the ship canal with a three-mile spur that runs along Shilshole Way. This is an important rail operation for local freight.
Rail-line capacity depends on train length, operating speeds, the number of switch cross-over points, and whether the line has one- or two-way traffic. Current train speed limits in the City are ten, twenty, or forty mph depending on the segment.
Port of Seattle and other intermodal facilities
The Port of Seattle owns, operates, or supports marine, rail, and air intermodal facilities. Port of Seattle facilities include nine commercial marine terminals, four ocean container terminals with thirty-one container cranes, and a deep-draft grain terminal. Steamship operators have direct service to Asia, Europe, Latin America, and domestic markets (Alaska and Hawaii).
Services are offered by seventeen ocean carriers, about thirty tug and barge operators, and BNSF Railway and Union Pacific railroads, operating intermodal yards. Transportation Appendix Figure A-8 shows Port of Seattle facilities located in Seattle.
Air Transportation
There are five commercial aircraft landing facilities in the greater Seattle metropolitan area: Seattle-Tacoma International Airport (Sea-Tac), operated by the Port of Seattle and located in the City of SeaTac; King County International Airport, located partly in Seattle; the Kenmore Air Harbor and Seattle Seaplanes facilities based in Seattle’s Lake Union; and the Lake Washington sea-plane base near Kenmore. Transportation Appendix Figure A-9 shows air facilities in Seattle.
Water Transportation
The Washington State Ferry (WSF) system operates two terminals in Seattle: Colman Dock in Downtown Seattle, and the Fauntleroy terminal in West Seattle. Passenger-and-vehicle service is provided on two ferry routes from Colman Dock to Bainbridge Island and to Bremerton. Passenger-and-vehicle ferries link Fauntleroy with Vashon Island and Southworth. King County operates the Water Taxi service in Elliott Bay that connects to West Seattle.

433Seattle 2035Appendices Transportation Appendix
Transportation Appendix Figure A-6Bicycle Facilities
WE
ST
VIE
WM
ON
T W
Y W
SW GENESEE ST
SW CHARLESTOWN ST
SEAV
IEW
A VN
W
16TH
AV
SW
3RD
AV
NW
1ST
AV N
OLS
ON
PL SW
DENNY WY
S MICHIGAN ST
YESLER WAY
AIR
PO
RT
WY
S5T
H A
V N
E
23R
D A
V S
24TH
AV
E
RAI NIERAV
S
S ORCAS ST
BEACH
DR
SW
34TH
AV
W
CA
LIFO
RN
IA A
V S
W
SW THISTLE ST
W MC GRAW ST
N 36TH ST
NW 105TH ST
TAY
LOR
AV
NAU
RO
RA
AV N
DEX
TER
AVN
MARION STUNION STPINE ST
FAIR
VIEW
AVN
NE 75TH ST
BEA
CO
N AV
S
E UNION ST
MO
NTL
AKE
BV
NE
L AK
EW
ASHINGTO N BV E
S COVERDALE ST
S OTHELLO ST
S HENDERSON ST
SE
WA
RD
PAR
KAV
S
SW MORGAN ST
THO
RNDY
KE A
V W
NW 85TH ST
GR
EE
NW
OO
D A
V N
STO
NE
AV N
9TH
AV
N
MYER
S WY S
S LANDER ST
1ST
AV S
S CLOVERDALE ST
4TH
AV
S
E MADISON ST
AIRPORTW
YS
12TH
AV
NE
RO
OS
EVE
LT W
Y N
E
SWIFT
AVS
E CHERRY ST
E ALOHA ST
M L KIN
G JR
WY S
ML
KIN
GJ R
WY
S
32N
D A
V N
W
ALASKAN WY
WA
LLIN
GFO
RD
AV
N
NE NORTHGATE WY
NE 50TH ST
INTERSTATE 90
25TH
AVN
ELA
KEC
ITY
WY
NE
S GENESEE ST
RAINIER AVS
MA
RIN
EV
IE
W
DRSW
MAGNOLIA BRIDGE
24TH
AV
NW
SW BARTON ST
NW 80TH ST
HARBOR
AVSW
15TH
AV
W
ELLIOTTAVW
WNICKERSON ST
NW MARKET ST
DE
L RID
GE
WY
SW
NW LEARY W
Y8T
HA V
NW
WM
ARG
INA
LW
Y
SW
2ND AV
JAMES ST
S DEARBORN ST
EAS
TLA
KE
AV
E
E MARGINAL WYS
12TH
AV
NE
NE 125TH ST
NE 145TH ST
S GRAHAM ST
NE 65TH ST
SAN
DPO
INT
WY
NE
RENTONAV
S
ALKI AV SW
W EMERSON ST
SW 106TH ST
SW HOLDEN ST
SW ROXBURY ST
35TH
AV
SW
SYLVAN
WAY SW
15TH
AVN
W
1 0TH
A VW
HIG
HLA
ND PARK WY SW
AUR
OR
A AV
N
S SPOKANE ST
BOYER AV E
NE PACIFIC ST
NE 95TH ST
35TH
AV
NE
ML K
ING
JR W
Y S
MAGNOLIA BV
W
28TH
AV
W
SW ADMIRAL WY
W DRAVUS ST
W EME
RSON PL
HOLMAN RD NW
BROADST
E M
ARG
INA
L W
Y S
WE
STLA
KE
AVN
EGREEN
LA
KE WY N
1ST
AV S
4TH
AV
S
N 130TH ST
BOREN
AV
BRO
AD
WAY
E JOHN ST
15TH
AV
S
S
COLUM B IAN WY
19TH
AV
STATE ROUTE 520
NE 45TH ST
FAU
NTL
ER
OY
WY
SW
MERCER ST
QU
EEN
AN
NE
AVN BOSTON ST
N 65TH ST
4TH AV
6TH AV
S HOLGATE ST
COLUMBIA ST
NPA
CIFIC
STIN
TER
STAT
E 5
S JACKSON ST
10TH
AV
E
15TH
AV
E15
TH A
V N
E
S MC CLELLAN ST
23R
DA
V
Bike Lane
Buffered Bike Lane
Climbing Lane
Multi-Use Trail
Neighborhood Greenway
Protected Bike Lane
Sharrow
2015 City of Seattle
0 1 20.5Miles
L
No warranties of any sort, including accuracy,fitness or merchantability, accompany thisproduct
Data Sources:City of Seattle GISSeattle Department of Transportation GIS
434Seattle 2035Appendices Transportation Appendix
Transportation Appendix Figure A-7Pedestrian Facilities
WE
ST
VIE
WM
ON
T W
Y W
SW GENESEE ST
SW CHARLESTOWN ST
SEAV
IEW
A VN
W
16TH
AV
SW
3RD
AV
NW
1ST
AV N
OLS
ON
PL SW
DENNY WY
S MICHIGAN ST
YESLER WAY
AIR
PO
RT
WY
S5T
H A
V N
E
23R
D A
V S
24TH
AV
E
RAI NIERAV
S
S ORCAS ST
BEACH
DR
SW
34TH
AV
W
CA
LIFO
RN
IA A
V S
W
SW THISTLE ST
W MC GRAW ST
N 36TH ST
NW 105TH ST
TAY
LOR
AV
NAU
RO
RA
AV N
DEX
TER
AVN
MARION STUNION STPINE ST
FAIR
VIEW
AVN
NE 75TH ST
BEA
CO
N AV
S
E UNION ST
MO
NTL
AKE
BV
NE
L AK
EW
ASHINGTO N BV E
S COVERDALE ST
S OTHELLO ST
S HENDERSON ST
SE
WA
RD
PAR
KAV
S
SW MORGAN ST
THO
RNDY
KE A
V W
NW 85TH ST
GR
EE
NW
OO
D A
V N
STO
NE
AV N
9TH
AV
N
MYER
S WY S
S LANDER ST
1ST
AV S
S CLOVERDALE ST
4TH
AV
S
E MADISON ST
AIRPORTW
YS
12TH
AV
NE
RO
OS
EVE
LT W
Y N
E
SWIFT
AVS
E CHERRY ST
E ALOHA ST
M L KIN
G JR
WY S
ML
KIN
GJ R
WY
S
32N
D A
V N
W
ALASKAN WY
WA
LLIN
GFO
RD
AV
N
NE NORTHGATE WY
NE 50TH ST
INTERSTATE 90
25TH
AVN
ELA
KEC
ITY
WY
NE
S GENESEE ST
RAINIER AVS
MA
RIN
EV
IE
W
DRSW
MAGNOLIA BRIDGE
24TH
AV
NW
SW BARTON ST
NW 80TH ST
HARBOR
AVSW
15TH
AV
W
ELLIOTTAVW
WNICKERSON ST
NW MARKET ST
DE
L RID
GE
WY
SW
NW LEARY W
Y
8TH
A VN
WW
MAR
GIN
AL
WY
SW
2ND AV
JAMES ST
S DEARBORN ST
EAS
TLA
KE
AV
E
E MARGINAL WYS
12TH
AV
NE
NE 125TH ST
NE 145TH ST
S GRAHAM ST
NE 65TH ST
SAN
DPO
INT
WY
NE
RENTONAV
S
ALKI AV SW
W EMERSON ST
SW 106TH ST
SW HOLDEN ST
SW ROXBURY ST
35TH
AV
SW
SYLVAN
WAY SW
15TH
AVN
W
1 0TH
A VW
HIG
HLA
ND PARK WY SW
AUR
OR
A AV
N
S SPOKANE ST
BOYER AV E
NE PACIFIC ST
NE 95TH ST
35TH
AV
NE
ML K
ING
JR W
Y S
MAGNOLIA BV
W
28TH
AV
W
SW ADMIRAL WY
W DRAVUS ST
W EME
RSON PL
HOLMAN RD NW
BROADST
E M
ARG
INA
L W
Y S
WE
STLA
KE
AVN
EGREEN
LA
KE WY N
1ST
AV S
4TH
AV
S
N 130TH ST
BOREN
AV
BRO
AD
WAY
E JOHN ST
15TH
AV
S
S
COLUM B IAN WY
19TH
AV
STATE ROUTE 520
NE 45TH ST
FAU
NTL
ER
OY
WY
SW
MERCER ST
QU
EEN
AN
NE
AVN BOSTON ST
N 65TH ST
4TH AV
6TH AV
S HOLGATE ST
COLUMBIA ST
NPA
CIFIC
STIN
TER
STAT
E 5
S JACKSON ST
10TH
AV
E
15TH
AV
E15
TH A
V N
E
S MC CLELLAN ST
23R
DA
V
Sidewalks
2015 City of Seattle
0 1 20.5Miles
L
No warranties of any sort, including accuracy,fitness or merchantability, accompany thisproduct
Data Sources:City of Seattle GISSeattle Department of Transportation GIS

435Seattle 2035Appendices Transportation Appendix
Transportation Appendix Figure A-8Port of Seattle Facilities
WE
ST
VIE
WM
ON
T W
Y W
SW GENESEE ST
SW CHARLESTOWN ST
SEAV
IEW
A VN
W
16TH
AV
SW
3RD
AV
NW
1ST
AV N
OLS
ON
PL SW
DENNY WY
S MICHIGAN ST
YESLER WAY
AIR
PO
RT
WY
S5T
H A
V N
E
23R
D A
V S
24TH
AV
E
RAI NIERAV
S
S ORCAS ST
BEACH
DR
SW
34TH
AV
W
CA
LIFO
RN
IA A
V S
W
SW THISTLE ST
W MC GRAW ST
N 36TH ST
NW 105TH ST
TAY
LOR
AV
NAU
RO
RA
AV N
DEX
TER
AVN
MARION STUNION STPINE ST
FAIR
VIEW
AVN
NE 75TH ST
BEA
CO
N AV
S
E UNION ST
MO
NTL
AKE
BV
NE
L AK
EW
ASHINGTO N BV E
S COVERDALE ST
S OTHELLO ST
S HENDERSON ST
SE
WA
RD
PAR
KAV
S
SW MORGAN ST
THO
RNDY
KE A
V W
NW 85TH ST
GR
EE
NW
OO
D A
V N
STO
NE
AV N
9TH
AV
N
MYER
S WY S
S LANDER ST
1ST
AV S
S CLOVERDALE ST
4TH
AV
S
E MADISON ST
AIRPORTW
YS
12TH
AV
NE
RO
OS
EVE
LT W
Y N
E
SWIFT
AVS
E CHERRY ST
E ALOHA ST
M L KIN
G JR
WY S
ML
KIN
GJ R
WY
S
32N
D A
V N
W
ALASKAN WY
WA
LLIN
GFO
RD
AV
N
NE NORTHGATE WY
NE 50TH ST
INTERSTATE 90
25TH
AVN
ELA
KEC
ITY
WY
NE
S GENESEE ST
RAINIER AVS
MA
RIN
EV
IE
W
DRSW
MAGNOLIA BRIDGE
24TH
AV
NW
SW BARTON ST
NW 80TH ST
HARBOR
AVSW
15TH
AV
W
ELLIOTTAVW
WNICKERSON ST
NW MARKET ST
DE
L RID
GE
WY
SW
NW LEARY W
Y
8TH
A VN
WW
MAR
GIN
AL
WY
SW
2ND AV
JAMES ST
S DEARBORN ST
EAS
TLA
KE
AV
E
E MARGINAL WYS
12TH
AV
NE
NE 125TH ST
NE 145TH ST
S GRAHAM ST
NE 65TH ST
SAN
DPO
INT
WY
NE
RENTONAV
S
ALKI AV SW
W EMERSON ST
SW 106TH ST
SW HOLDEN ST
SW ROXBURY ST
35TH
AV
SW
SYLVAN
WAY SW
15TH
AVN
W
1 0TH
A VW
HIG
HLA
ND PARK WY SW
AUR
OR
A AV
N
S SPOKANE ST
BOYER AV E
NE PACIFIC ST
NE 95TH ST
35TH
AV
NE
ML K
ING
JR W
Y S
MAGNOLIA BV
W
28TH
AV
W
SW ADMIRAL WY
W DRAVUS ST
W EME
RSON PL
HOLMAN RD NW
BROADST
E M
ARG
INA
L W
Y S
WE
STLA
KE
AVN
EGREEN
LA
KE WY N
1ST
AV S
4TH
AV
S
N 130TH ST
BOREN
AV
BRO
AD
WAY
E JOHN ST
15TH
AV
S
S
COLUM B IAN WY
19TH
AV
STATE ROUTE 520
NE 45TH ST
FAU
NTL
ER
OY
WY
SW
MERCER ST
QU
EEN
AN
NE
AVN BOSTON ST
N 65TH ST
4TH AV
6TH AV
S HOLGATE ST
COLUMBIA ST
NPA
CIFIC
STIN
TER
STAT
E 5
S JACKSON ST
10TH
AV
E
15TH
AV
E15
TH A
V N
E
S MC CLELLAN ST
23R
DA
V
Port of Seattle Facilities
2015 City of Seattle
0 1 20.5Miles
L
No warranties of any sort, including accuracy,fitness or merchantability, accompany thisproduct
Data Sources:City of Seattle GISPort of Seattle

436Seattle 2035Appendices Transportation Appendix
Transportation Appendix Figure A-9Airports
"Z
"Z"Z
King CountyAirport
KenmoreAir Harbor
SeattleSeaplanes
"Z Airport
2015 City of Seattle
No warranties of any sort, including accuracy,fitness or merchantability, accompany thisproduct
0 1 20.5Miles
L
Data Sources:King County GISCity of Seattle GIS
437Seattle 2035Appendices Transportation Appendix
Local Level of Service Standards for
Arterials and Transit Routes
Overview
The City measures level of service (LOS) based on the percentage of all trips that are made by single-occupant vehicle (SOV). This measure focuses on increasing the people-moving capacity of the city’s roadways by reducing the SOV share of travel. The SOV share of travel is the least space-efficient mode and occurs during the most congested period of the day.
The performance of the overall system will be measured in relation to the reduced share of SOV travel. There are different performance levels defined for eight geographic sectors in the city, recognizing the diverse land use patterns and transportation contexts.
These performance levels differ from the prior screenline-based system. A target SOV mode share has been established for each of the eight sectors of the city and will be applied to every development project. The City’s regulatory review will be reduced for each new unit of development.
This mode share measure is consistent with Seattle’s comprehensive planning approach be-cause it uses strategies other than adding new capacity for general-purpose travel. Adding vehicle capacity can be costly, and can lead to community disruption and environmental impacts. In many cases, widening arterials may not even be practical or feasible in a mature, developed urban environment. This mode share method of measuring LOS allows the City to use existing current street rights-of-way as efficiently as possible and encourages travel modes other than single-occupant vehicle, especially in peak hours.
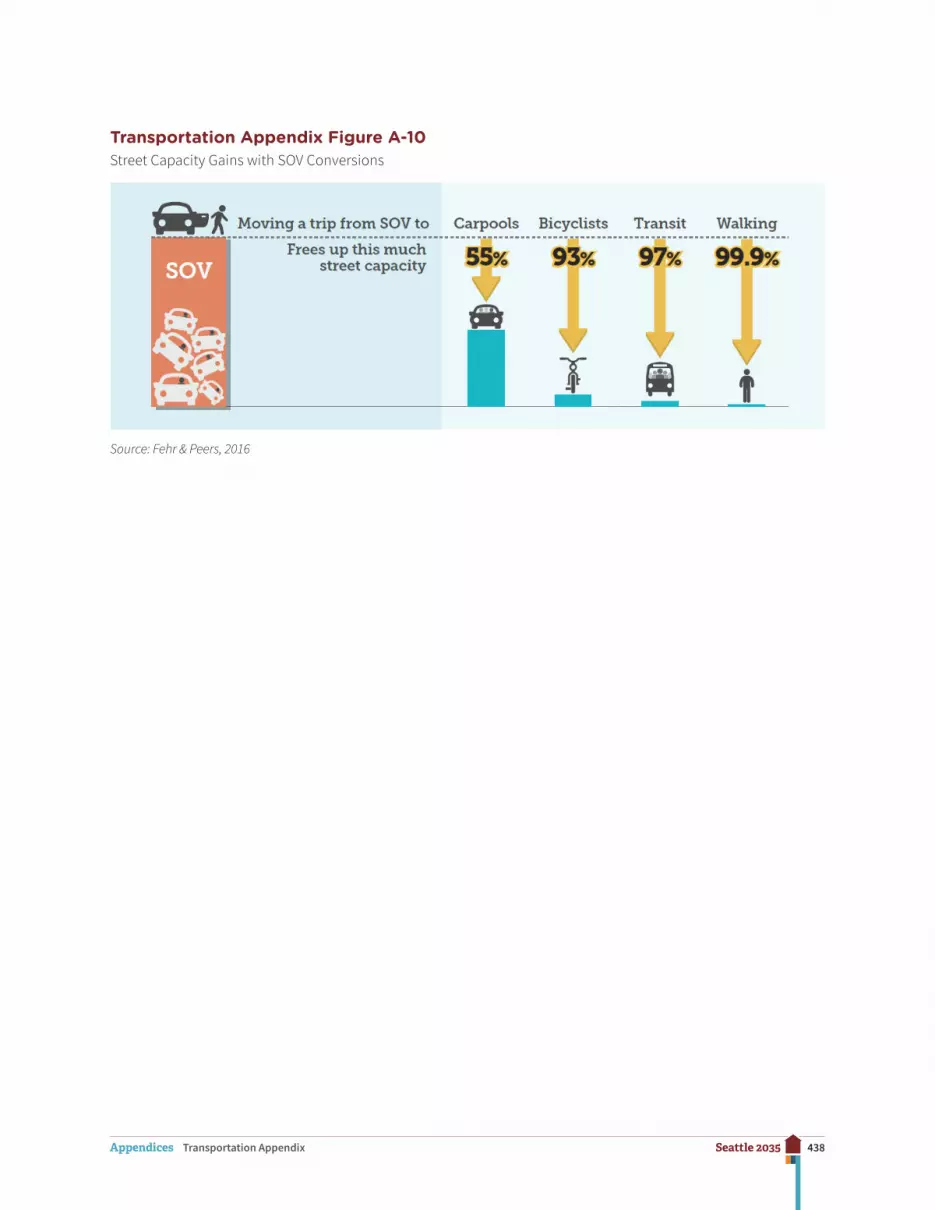
Transportation Appendix Figure A-10 summarizes the assumptions about capacity savings and illustrates how lowering the SOV mode share provides “an established minimum capac-ity of public facilities or services that must be provided per unit of demand or other appro-priate measure of need.” Transportation Appendix Figure A-11 shows for each city sector the existing condition of SOV mode share and a future SOV target.
438Seattle 2035Appendices Transportation Appendix
Transportation Appendix Figure A-10Street Capacity Gains with SOV Conversions
Source: Fehr & Peers, 2016

439Seattle 2035Appendices Transportation Appendix
Transportation Appendix Figure A-11SOV Mode Share 2015 Performance and 2035 Targets by City Sector
NortheastSeattle
35%
Capitol Hill/CentralDistrict
28%Downtown/Lake
Union18%
SoutheastSeattle
38%
Duwamish51%
WestSeattle
35%
Magnolia/QueenAnne38%
NorthwestSeattle
37%
XX% 2035 Drive Alone Mode Share Target
Source: Fehr & Peers, 2016
440Seattle 2035Appendices Transportation Appendix
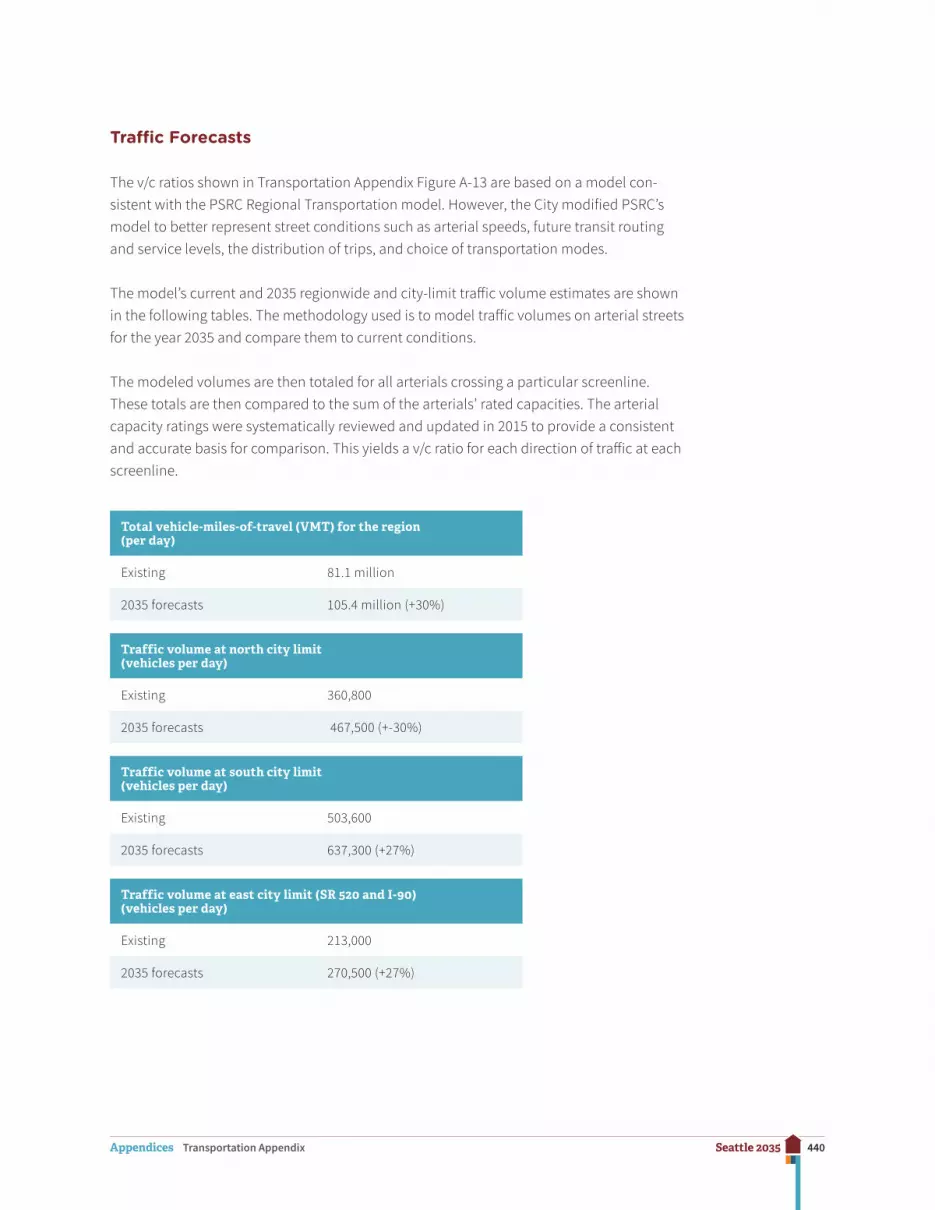
Traffic Forecasts
The v/c ratios shown in Transportation Appendix Figure A-13 are based on a model con-sistent with the PSRC Regional Transportation model. However, the City modified PSRC’s model to better represent street conditions such as arterial speeds, future transit routing and service levels, the distribution of trips, and choice of transportation modes.
The model’s current and 2035 regionwide and city-limit traffic volume estimates are shown in the following tables. The methodology used is to model traffic volumes on arterial streets for the year 2035 and compare them to current conditions.
The modeled volumes are then totaled for all arterials crossing a particular screenline. These totals are then compared to the sum of the arterials’ rated capacities. The arterial capacity ratings were systematically reviewed and updated in 2015 to provide a consistent and accurate basis for comparison. This yields a v/c ratio for each direction of traffic at each screenline.
Total vehicle-miles-of-travel (VMT) for the region (per day)
Existing 81.1 million
2035 forecasts 105.4 million (+30%)
Traffic volume at north city limit (vehicles per day)
Existing 360,800
2035 forecasts 467,500 (+-30%)
Traffic volume at south city limit (vehicles per day)
Existing 503,600
2035 forecasts 637,300 (+27%)
Traffic volume at east city limit (SR 520 and I-90) (vehicles per day)
Existing 213,000
2035 forecasts 270,500 (+27%)
441Seattle 2035Appendices Transportation Appendix
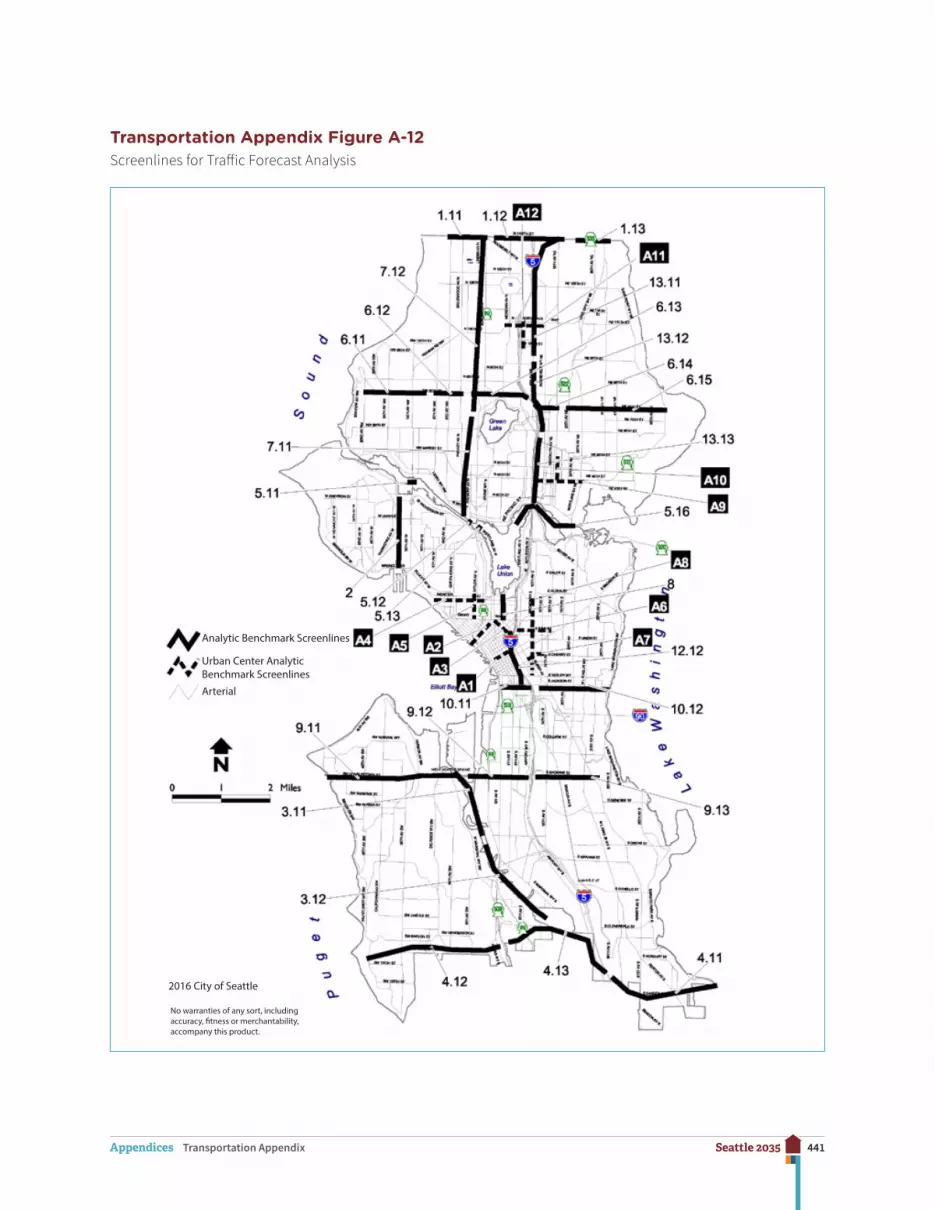
Transportation Appendix Figure A-12Screenlines for Traffic Forecast Analysis
Analytic Benchmark Screenlines
Urban Center Analytic Benchmark Screenlines
Arterial
2016 City of Seattle
No warranties of any sort, including accuracy, �tness or merchantability, accompany this product.

442Seattle 2035Appendices Transportation Appendix
Transportation Appendix Figure A-12 is a map illustrating the location of forty-two screen-lines. Thirty of these screenlines were used until 2016 to evaluate level of service perfor-mance, and twelve other screenlines (labeled as A1–A12) provide supplemental information about performance in and near Seattle’s urban centers.
A screenline methodology continues to be shown here because it highlights the trend in citywide and regional travel patterns. This methodology recognizes that no single inter-section or arterial operates in isolation. Motorists have choices, and they select particular routes based on a wide variety of factors such as avoiding blocking conditions, and minimiz-ing travel times. Accordingly, this analytic methodology focuses on a “traffic-shed” where the screenlines measure groups of arterials among which drivers logically can choose to travel.
Transportation Appendix Figure A-11 lists for each screenline the current conditions and modeled traffic results for the evening peak hour in year 2035, in comparison to analytic benchmarks. These benchmarks are expressed as v/c ratios of 1.0 or 1.20, which indicates a level of use equivalent to 100 percent or 120 percent of rated roadway capacity, measured during peak commute times.
With the anticipated implementation of the Comprehensive Plan, and with the future trans-portation and circulation conditions in the 2035 evening peak hour, traffic volumes will not exceed any of the screenline benchmarks. These results are evaluated in more detail below.
The forecasted screenline v/c ratios for the year 2035 evening peak hour range from 0.38 to 1.18.
• Future peak hour traffic conditions will continue to reflect patterns similar to today, with the heaviest congestion at bridge locations including the Ballard Bridge (v/c = 1.18 northbound), the West Seattle Freeway and Spokane Street Bridges (collectively a v/c = 1.15 westbound), the University and Montlake Bridges (collectively a v/c = 0.95 northbound and 1.05 southbound), and the Aurora Bridge (v/c = 0.92 northbound and 0.82 southbound).
• Congestion is also projected to increase in other locations as well. This is due to growth or, in some cases, related to future planned road improvements addressing automobiles and bicycles. With respect to the latter factor, this analysis makes conservative assumptions about potential loss of automobile travel lanes. As part of future projects such as bicycle-serving “cycle tracks,” a determination would be made contemporaneous with that project whether and how automobile travel lanes would be diminished. This caveat applies to all references below to future bicycle projects.
• Volumes on Aurora Avenue North, Lake City Way North, Greenwood Avenue North, and Third Avenue NW near the north city limits will continue to be heavy during evening
443Seattle 2035Appendices Transportation Appendix
commutes, and will contribute to conditions that approach or slightly exceed the rated capacity level by 2035 (screenlines 1.11, 1.13).
• Volumes on MLK Jr. Way South, Rainier Avenue South, and Renton Avenue South near the south city limits will continue to grow, and will contribute to greater use of capacity in the southbound peak direction, approaching but remaining below the rated capacity level for the entire screenline by 2035 (screenline 4.11).
• Southbound volumes toward southeast Seattle measured at South Jackson Street and at South Spokane Street will contribute to conditions that reach a v/c ratio of approximately 0.90, or using about 90 percent of rated capacity by 2035. This partly reflects the potential for changes in capacity related to future possible bicycle improvements (screenlines 9.13 and 10.12). See above caveat about future bicycle improvements.

444Seattle 2035Appendices Transportation Appendix
Transportation Appendix Figure A-13Freight Assets
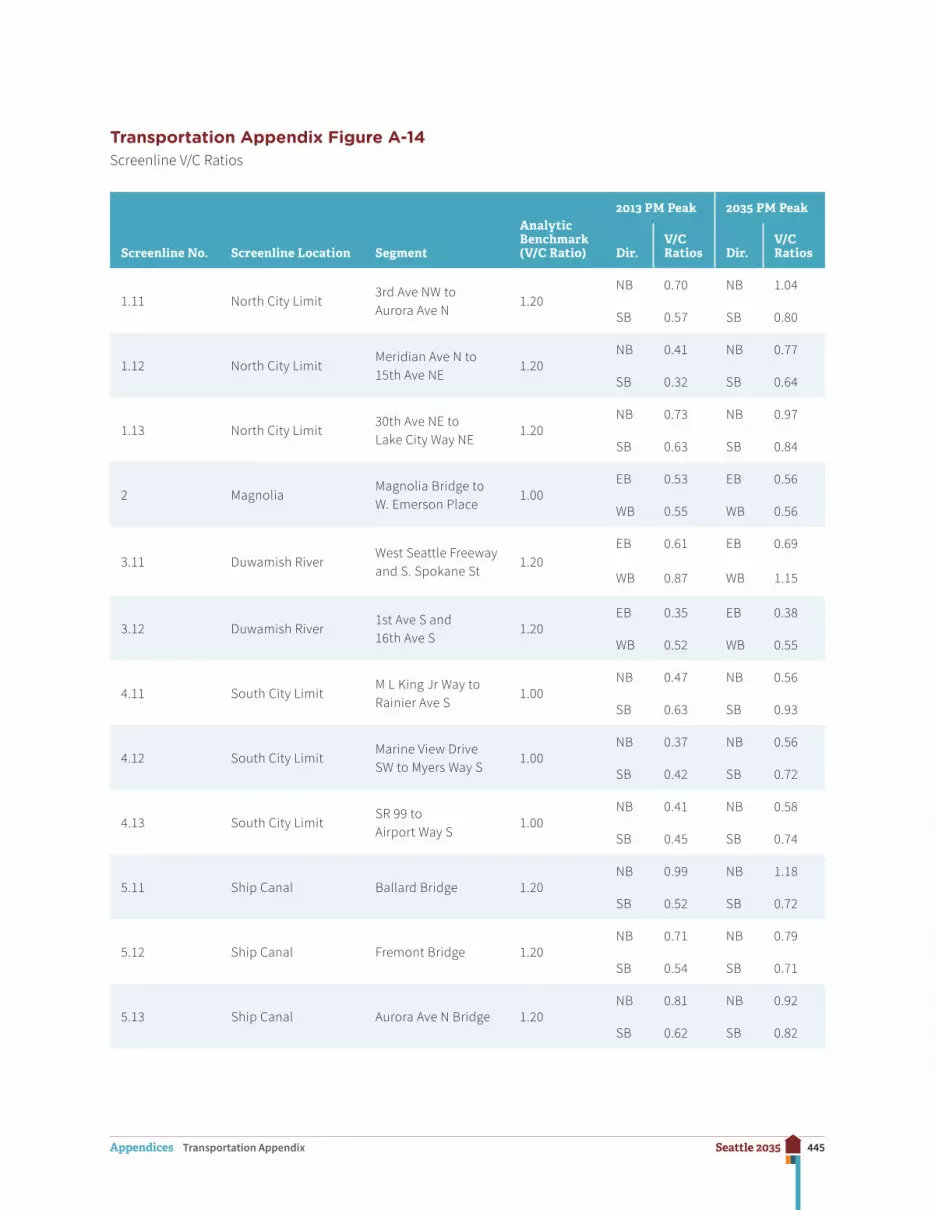
445Seattle 2035Appendices Transportation Appendix
Transportation Appendix Figure A-14Screenline V/C Ratios
Screenline No. Screenline Location Segment
Analytic Benchmark (V/C Ratio)
2013 PM Peak 2035 PM Peak
Dir.V/C Ratios Dir.
V/C Ratios
1.11 North City Limit3rd Ave NW to Aurora Ave N
1.20NB 0.70 NB 1.04
SB 0.57 SB 0.80
1.12 North City LimitMeridian Ave N to 15th Ave NE
1.20NB 0.41 NB 0.77
SB 0.32 SB 0.64
1.13 North City Limit30th Ave NE to Lake City Way NE
1.20NB 0.73 NB 0.97
SB 0.63 SB 0.84
2 MagnoliaMagnolia Bridge to W. Emerson Place
1.00EB 0.53 EB 0.56
WB 0.55 WB 0.56
3.11 Duwamish RiverWest Seattle Freeway and S. Spokane St
1.20EB 0.61 EB 0.69
WB 0.87 WB 1.15
3.12 Duwamish River1st Ave S and 16th Ave S
1.20EB 0.35 EB 0.38
WB 0.52 WB 0.55
4.11 South City LimitM L King Jr Way to Rainier Ave S
1.00NB 0.47 NB 0.56
SB 0.63 SB 0.93
4.12 South City LimitMarine View Drive SW to Myers Way S
1.00NB 0.37 NB 0.56
SB 0.42 SB 0.72
4.13 South City LimitSR 99 to Airport Way S
1.00NB 0.41 NB 0.58
SB 0.45 SB 0.74
5.11 Ship Canal Ballard Bridge 1.20NB 0.99 NB 1.18
SB 0.52 SB 0.72
5.12 Ship Canal Fremont Bridge 1.20NB 0.71 NB 0.79
SB 0.54 SB 0.71
5.13 Ship Canal Aurora Ave N Bridge 1.20NB 0.81 NB 0.92
SB 0.62 SB 0.82
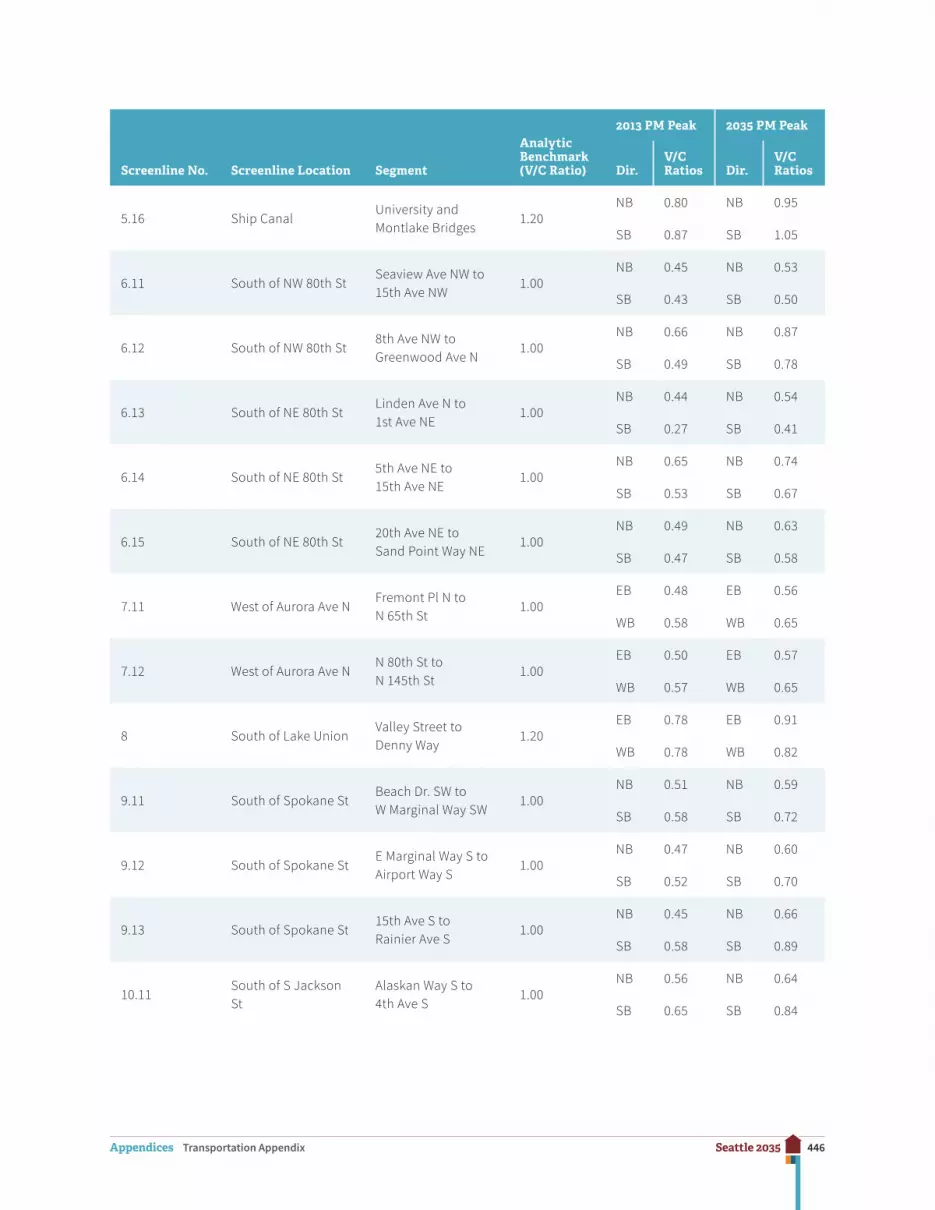
446Seattle 2035Appendices Transportation Appendix
Screenline No. Screenline Location Segment
Analytic Benchmark (V/C Ratio)
2013 PM Peak 2035 PM Peak
Dir.V/C Ratios Dir.
V/C Ratios
5.16 Ship CanalUniversity and Montlake Bridges
1.20NB 0.80 NB 0.95
SB 0.87 SB 1.05
6.11 South of NW 80th StSeaview Ave NW to 15th Ave NW
1.00NB 0.45 NB 0.53
SB 0.43 SB 0.50
6.12 South of NW 80th St8th Ave NW to Greenwood Ave N
1.00NB 0.66 NB 0.87
SB 0.49 SB 0.78
6.13 South of NE 80th StLinden Ave N to 1st Ave NE
1.00NB 0.44 NB 0.54
SB 0.27 SB 0.41
6.14 South of NE 80th St5th Ave NE to 15th Ave NE
1.00NB 0.65 NB 0.74
SB 0.53 SB 0.67
6.15 South of NE 80th St20th Ave NE to Sand Point Way NE
1.00NB 0.49 NB 0.63
SB 0.47 SB 0.58
7.11 West of Aurora Ave NFremont Pl N to N 65th St
1.00EB 0.48 EB 0.56
WB 0.58 WB 0.65
7.12 West of Aurora Ave NN 80th St to N 145th St
1.00EB 0.50 EB 0.57
WB 0.57 WB 0.65
8 South of Lake UnionValley Street to Denny Way
1.20EB 0.78 EB 0.91
WB 0.78 WB 0.82
9.11 South of Spokane StBeach Dr. SW to W Marginal Way SW
1.00NB 0.51 NB 0.59
SB 0.58 SB 0.72
9.12 South of Spokane StE Marginal Way S to Airport Way S
1.00NB 0.47 NB 0.60
SB 0.52 SB 0.70
9.13 South of Spokane St15th Ave S to Rainier Ave S
1.00NB 0.45 NB 0.66
SB 0.58 SB 0.89
10.11South of S Jackson St
Alaskan Way S to 4th Ave S
1.00NB 0.56 NB 0.64
SB 0.65 SB 0.84

447Seattle 2035Appendices Transportation Appendix
Screenline No. Screenline Location Segment
Analytic Benchmark (V/C Ratio)
2013 PM Peak 2035 PM Peak
Dir.V/C Ratios Dir.
V/C Ratios
10.12South of S Jackson St
12th Ave S to Lakeside Ave S
1.00NB 0.48 NB 0.75
SB 0.58 SB 0.91
12.12 East of CBDS Jackson St to Howell St
1.20EB 0.35 EB 0.39
WB 0.45 WB 0.52
13.11 East of I-5NE Northgate Way to NE 145th St
1.00EB 0.71 EB 0.86
WB 0.59 WB 0.79
13.12 East of I-5NE 65th St to NE 80th St
1.00EB 0.44 EB 0.51
WB 0.41 WB 0.53
13.13 East of I-5NE Pacific St to NE Ravenna Blvd
1.00EB 0.55 EB 0.63
WB 0.54 WB 0.65
A1 North of Seneca St 1st Ave to 6th Ave NANB 0.55 NB 0.67
SB 0.40 SB 0.59
A2 North of BlanchardElliott Ave to Westlake Ave
NANB 0.43 NB 0.55
SB 0.36 SB 0.51
A3 East of 9th Ave Lenora St to Pike St NAEB 0.36 EB 0.44
WB 0.32 WB 0.43
A4 South of Mercer StElliott Ave W to Aurora Ave N
NANB 0.78 NB 0.92
SB 0.51 SB 0.78
A5 East of 5th Ave NDenny Way to Valley St
NAEB 0.39 EB 0.54
WB 0.40 WB 0.46
A6 North of Pine StMelrose Ave E to 15th Ave E
NANB 0.45 NB 0.53
SB 0.50 SB 0.62
A7North of James St– E Cherry St
Boren Ave to 14th Ave
NANB 0.62 NB 0.72
SB 0.57 SB 0.77
A8 West of BroadwayYesler Way to E Roy St
NAEB 0.50 EB 0.56
WB 0.60 WB 0.71

448Seattle 2035Appendices Transportation Appendix
Screenline No. Screenline Location Segment
Analytic Benchmark (V/C Ratio)
2013 PM Peak 2035 PM Peak
Dir.V/C Ratios Dir.
V/C Ratios
A9 South of NE 45th St7th Ave NE to Montlake Blvd NE
NANB 0.70 NB 0.78
SB 0.70 SB 0.74
A10 East of 15th Ave NENE 45th St to NE 52nd St
NAEB 0.52 EB 0.53
WB 0.46 WB 0.49
A11South of Northgate Way (N/NE 110th St)
N Northgate Way to Roosevelt Way NE
NANB 0.50 NB 0.65
SB 0.49 SB 0.65
A12 East of 1st Ave NENE 100th St to NE Northgate Way
NAEB 0.48 EB 0.65
WB 0.62 WB 0.95
Results for areas around Seattle’s six urban centers are summarized as follows.
Downtown: Screenlines 10.11, 12.12, A1, A2, and A3 pass through or along the edge of the Downtown Urban Center, some encompassing north–south avenues, and some encompass-ing east–west streets. Higher v/c ratios reflect higher future volumes on most avenues and streets, and increased congestion. However, for all five of these screenlines, the future v/c ratios will remain below 1.0 in 2035 with Comprehensive Plan implementation.
Uptown: For the Uptown Urban Center, screenline A4 is an east–west screenline south of Mercer Street extending as far west as Elliott Avenue West and east to include Aurora Avenue North, while screenline A5 is drawn north–south between Fifth Avenue North and Taylor Avenue North. The predicted increase in congestion, above a v/c ratio of 0.90 for north-bound traffic, relates to major traffic volumes on Elliott Avenue West and Aurora Avenue North.
It also relates to a possible reduction in capacity on Fifth Avenue North if bicycle improve-ments reduce lanes for motorized vehicle travel. Measures of east–west travel congestion will worsen but remain well below a 1.0 v/c ratio; improvements enabling a two-way Mercer Street add capacity in the westbound direction.
South Lake Union: For the South Lake Union Urban Center, screenline 8 is drawn north–south at Fairview Avenue North. Volumes will continue to increase, and road improvements will continue to occur for a number of years into this planning period. The v/c ratios for both directions along this screenline will decline by 2035, with higher evening congestion levels in the eastbound direction reflected by a v/c ratio of 0.91. However, the ratio will remain below the 1.20 v/c ratio.
449Seattle 2035Appendices Transportation Appendix
First Hill/Capitol Hill: Screenlines A6, A7, and A8 are drawn through the First Hill/Capitol Hill Urban Center. Screenline 12.12 is on the west edge of the First Hill/Capitol Hill Urban Center adjacent to Downtown. For all four of these screenlines, the year 2035 v/c ratios un-der the Comprehensive Plan will remain well below the 1.20 v/c ratio that applies to screen-line 12.12. Although the findings for screenline A7 and A8 illustrate a somewhat elevated congestion level in all directions in the area between Boren Avenue and 14th Avenue by 2035, near James Street, and for travel east–west across Broadway, these areas are currently often congested at peak hours.
University District: For the University District Urban Center, screenlines 5.16 and 13.13 cover the south and west boundaries of the urban center, while screenline A9 passes east–west through the center and screenline A10 is drawn north–south through the center. Higher v/c ratios suggest higher volumes and a degree of increased congestion by 2035. However, the year 2035 v/c ratios will be below 1.0 for all four of these screenlines in the peak commuting directions, and at screenline A-10, the v/c ratio is projected to be .49 in the year 2035. At the University and Montlake Bridges, evening peak hour volumes will continue to be high, and the southbound volumes on the University Bridge are projected to exceed the northbound volumes. This may reflect the diverse range of destinations of university employees and stu-dents. Given the pass-through nature of many evening commuters, the projected volumes for Roosevelt Way NE and Montlake Boulevard NE would continue to be high and grow slightly by 2035.
Northgate: For the Northgate Urban Center, screenline A11 is drawn east–west just south of Northgate Way, while screenline A12 passes north–south just east of First Avenue NE. Screenline 13.11 also measures east–west traffic crossing Fifth Avenue NE. The year 2035 v/c ratios for these three screenlines will worsen but remain below 1.0, with the most significant increase in volume over capacity being at screenline A-12, westbound, with an increase in v/c from .88 to .95. The measures of east–west traffic both indicate increasing congestion that will reach v/c ratio levels of approximately 0.8 to 0.9, meaning much of the available capacity will be used by 2035. The analysis also shows relatively high volumes west of I-5, for westbound Northgate Way, and for both directions of Meridian Avenue North.
State Highway Level of Service Standards
There are two different types of State highways with segments in Seattle with two different LOS standards. The larger facilities are “Highways of Statewide Significance” (HSS). These are I-5, I-90, SR 99, SR 509, SR 519, SR 520, and SR 522. Highways of Statewide Significance include, at a minimum, interstate highways and other principal arterials needed to connect major communities in the state.
For all the HSS, the State defines a LOS standard of “D.” RCW 36.70A.070(6)(a)(iii)(C) pro-vides that local jurisdictions’ Comprehensive Plans should indicate a LOS for State-owned facilities, but specifies that local concurrency requirements do not apply to the HSS routes.
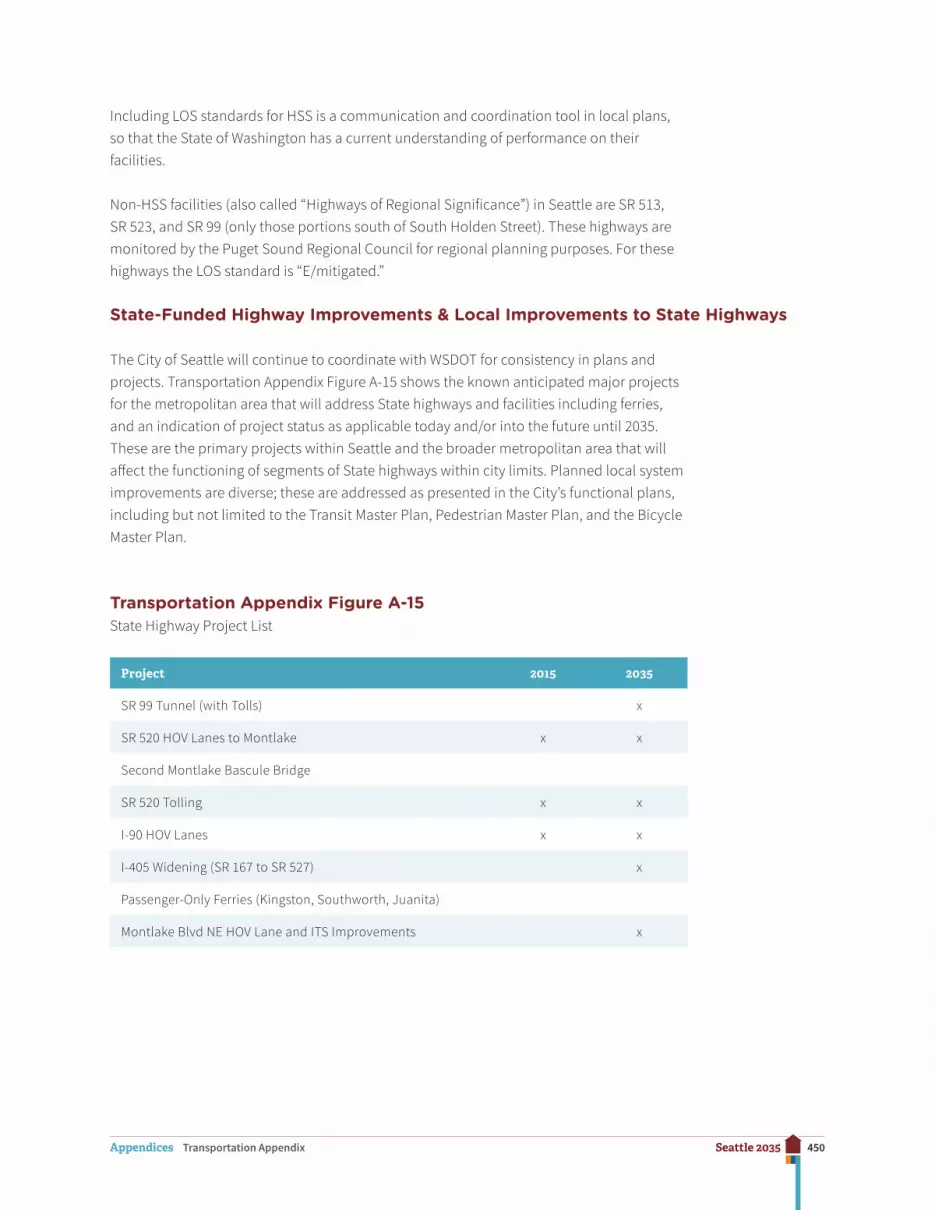
450Seattle 2035Appendices Transportation Appendix
Including LOS standards for HSS is a communication and coordination tool in local plans, so that the State of Washington has a current understanding of performance on their facilities.
Non-HSS facilities (also called “Highways of Regional Significance”) in Seattle are SR 513, SR 523, and SR 99 (only those portions south of South Holden Street). These highways are monitored by the Puget Sound Regional Council for regional planning purposes. For these highways the LOS standard is “E/mitigated.”
State-Funded Highway Improvements & Local Improvements to State Highways
The City of Seattle will continue to coordinate with WSDOT for consistency in plans and projects. Transportation Appendix Figure A-15 shows the known anticipated major projects for the metropolitan area that will address State highways and facilities including ferries, and an indication of project status as applicable today and/or into the future until 2035. These are the primary projects within Seattle and the broader metropolitan area that will affect the functioning of segments of State highways within city limits. Planned local system improvements are diverse; these are addressed as presented in the City’s functional plans, including but not limited to the Transit Master Plan, Pedestrian Master Plan, and the Bicycle Master Plan.
Transportation Appendix Figure A-15State Highway Project List
Project 2015 2035
SR 99 Tunnel (with Tolls) x
SR 520 HOV Lanes to Montlake x x
Second Montlake Bascule Bridge
SR 520 Tolling x x
I-90 HOV Lanes x x
I-405 Widening (SR 167 to SR 527) x
Passenger-Only Ferries (Kingston, Southworth, Juanita)
Montlake Blvd NE HOV Lane and ITS Improvements x
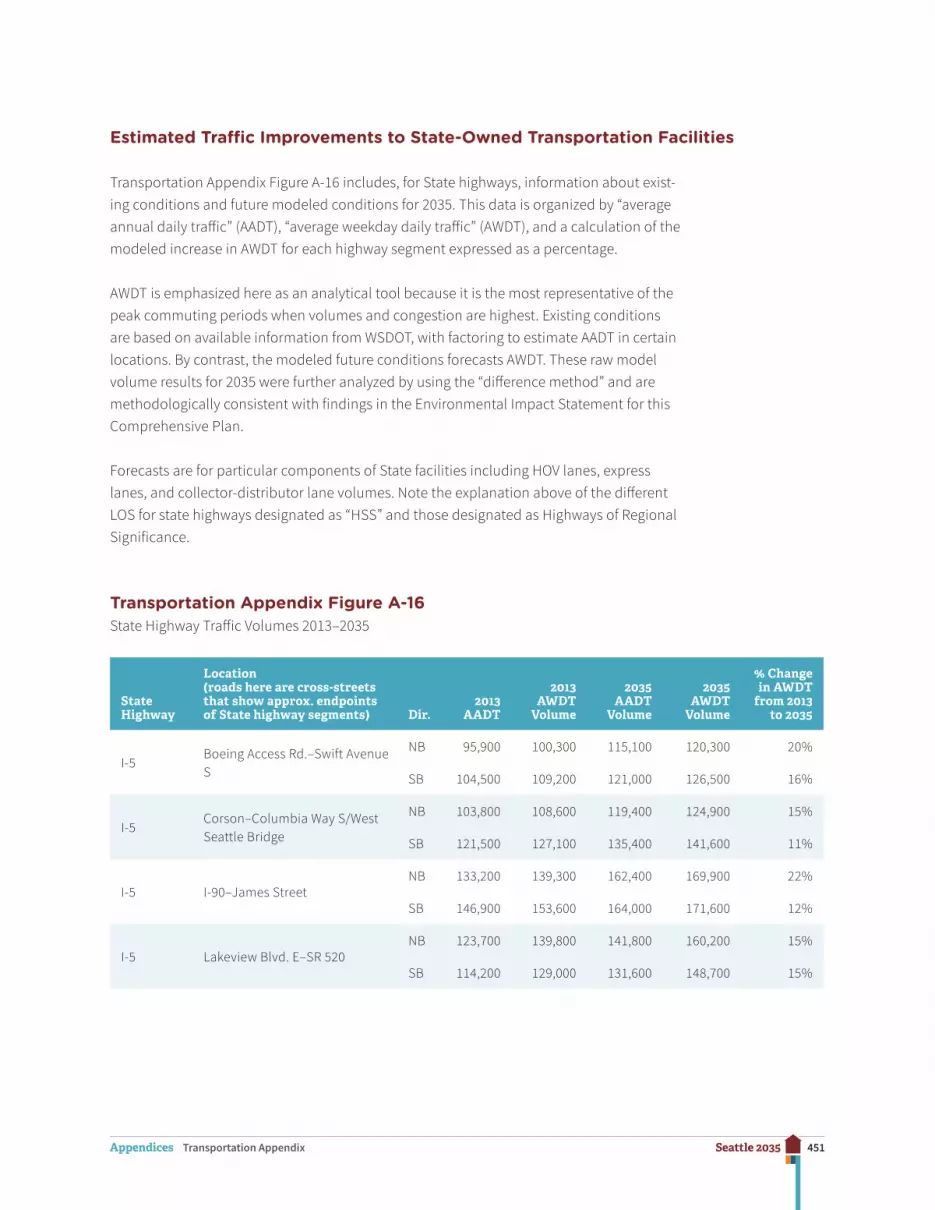
451Seattle 2035Appendices Transportation Appendix
Estimated Traffic Improvements to State-Owned Transportation Facilities
Transportation Appendix Figure A-16 includes, for State highways, information about exist-ing conditions and future modeled conditions for 2035. This data is organized by “average annual daily traffic” (AADT), “average weekday daily traffic” (AWDT), and a calculation of the modeled increase in AWDT for each highway segment expressed as a percentage.
AWDT is emphasized here as an analytical tool because it is the most representative of the peak commuting periods when volumes and congestion are highest. Existing conditions are based on available information from WSDOT, with factoring to estimate AADT in certain locations. By contrast, the modeled future conditions forecasts AWDT. These raw model volume results for 2035 were further analyzed by using the “difference method” and are methodologically consistent with findings in the Environmental Impact Statement for this Comprehensive Plan.
Forecasts are for particular components of State facilities including HOV lanes, express lanes, and collector-distributor lane volumes. Note the explanation above of the different LOS for state highways designated as “HSS” and those designated as Highways of Regional Significance.
Transportation Appendix Figure A-16State Highway Traffic Volumes 2013–2035
State Highway
Location (roads here are cross-streets that show approx. endpoints of State highway segments) Dir.
2013 AADT
2013 AWDT
Volume
2035 AADT
Volume
2035 AWDT
Volume
% Change in AWDT
from 2013 to 2035
I-5Boeing Access Rd.–Swift Avenue S
NB 95,900 100,300 115,100 120,300 20%
SB 104,500 109,200 121,000 126,500 16%
I-5Corson–Columbia Way S/West Seattle Bridge
NB 103,800 108,600 119,400 124,900 15%
SB 121,500 127,100 135,400 141,600 11%
I-5 I-90–James StreetNB 133,200 139,300 162,400 169,900 22%
SB 146,900 153,600 164,000 171,600 12%
I-5 Lakeview Blvd. E–SR 520NB 123,700 139,800 141,800 160,200 15%
SB 114,200 129,000 131,600 148,700 15%

452Seattle 2035Appendices Transportation Appendix
State Highway
Location (roads here are cross-streets that show approx. endpoints of State highway segments) Dir.
2013 AADT
2013 AWDT
Volume
2035 AADT
Volume
2035 AWDT
Volume
% Change in AWDT
from 2013 to 2035
I-5 SR 520–NE 50th StreetNB 133,400 135,900 155,200 158,000 16%
SB 121,900 124,100 137,600 140,100 13%
I-5 NE 65th Street–SR 522NB 117,700 119,900 137,300 139,800 17%
SB 119,000 121,200 135,400 137,800 14%
I-5 NE 130th Street–NE 145th StreetNB 98,000 99,800 114,500 116,600 17%
SB 98,700 100,400 116,100 118,200 18%
I-90Rainier Avenue S–Lk. Washington (mainline)
EB 65,000 70,300 82,600 89,300 27%
WB 68,100 72,500 89,900 95,800 32%
SR 99114th Avenue S–S Cloverdale Street
NB 16,300 19,200 21,200 25,000 30%
SB 13,700 16,200 15,900 18,700 15%
SR 99W Marginal Wy S–S Michigan Street (1st Avenue S Bridge)
NB 44,000 48,500 56,900 62,800 29%
SB 42,000 46,300 54,200 59,800 29%
SR 99 E Marginal Wy–W. Seattle BridgeNB 21,300 23,500 30,100 33,200 41%
SB 17,700 19,500 25,400 28,100 44%
SR 991st Avenue S Ramps–Seneca/Spring
NB 33,900 37,400 30,900 34,000 -9%
SB 36,100 39,800 29,200 32,200 -19%
SR 99 Raye Street–Bridge Way NNB 32,900 36,000 42,100 46,000 27%
SB 36,100 39,500 46,400 50,800 28%
SR 99 Winona Avenue N–N 80th StreetNB 14,700 16,100 18,600 20,300 26%
SB 17,300 18,900 22,900 25,000 32%
SR 99 Roosevelt Way N–N 145th StreetNB 14,400 15,700 20,900 22,800 45%
SB 14,600 16,000 21,800 23,800 48%
SR 509S 112th Street–S Cloverdale Street
NB 18,200 21,400 25,200 29,800 39%
SB 14,900 17,500 18,600 22,000 26%
SR 513SR 520 Ramps–NE Pacific Street (Montlake Br.)
NB 16,600 18,100 20,300 22,200 23%
SB 19,400 21,300 22,600 24,700 16%
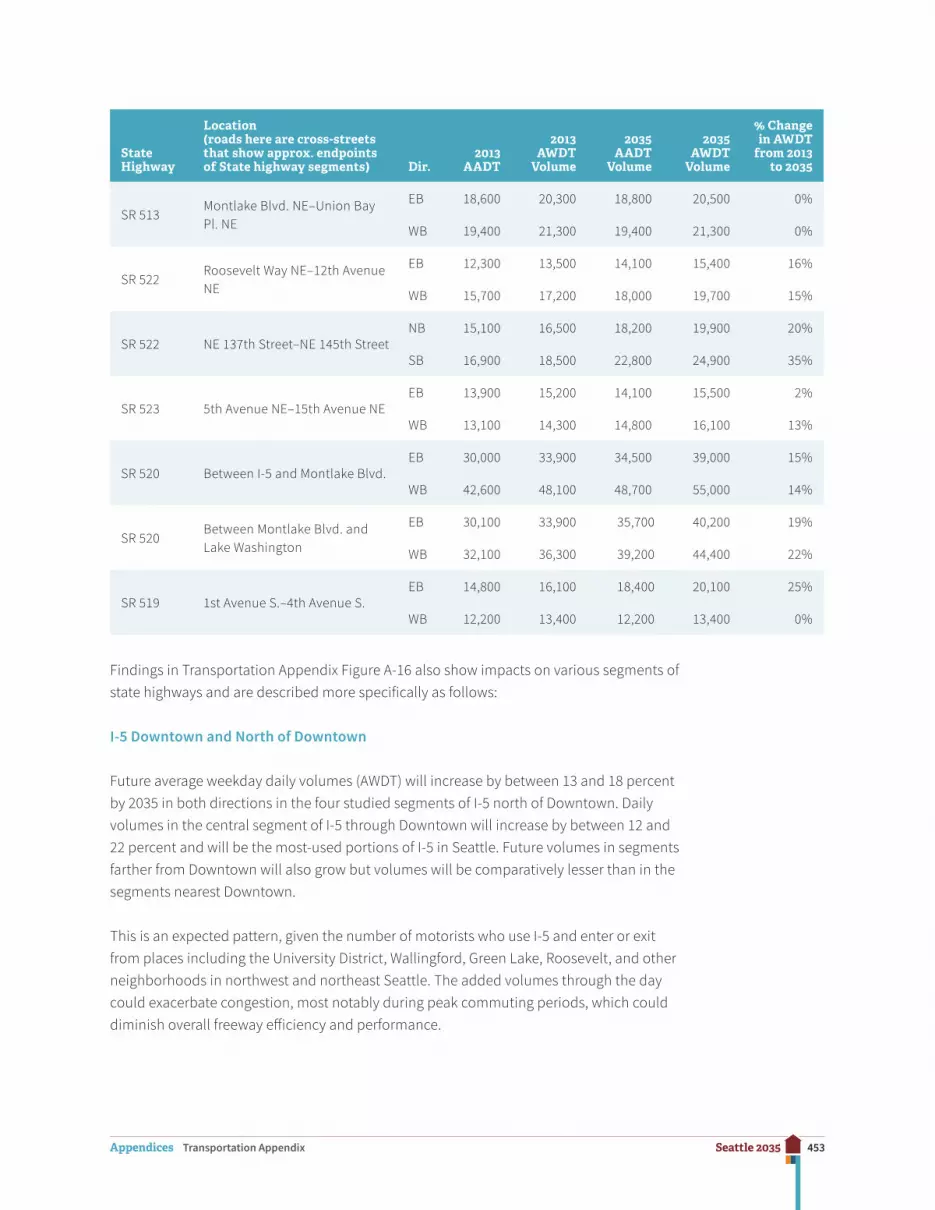
453Seattle 2035Appendices Transportation Appendix
State Highway
Location (roads here are cross-streets that show approx. endpoints of State highway segments) Dir.
2013 AADT
2013 AWDT
Volume
2035 AADT
Volume
2035 AWDT
Volume
% Change in AWDT
from 2013 to 2035
SR 513Montlake Blvd. NE–Union Bay Pl. NE
EB 18,600 20,300 18,800 20,500 0%
WB 19,400 21,300 19,400 21,300 0%
SR 522Roosevelt Way NE–12th Avenue NE
EB 12,300 13,500 14,100 15,400 16%
WB 15,700 17,200 18,000 19,700 15%
SR 522 NE 137th Street–NE 145th StreetNB 15,100 16,500 18,200 19,900 20%
SB 16,900 18,500 22,800 24,900 35%
SR 523 5th Avenue NE–15th Avenue NEEB 13,900 15,200 14,100 15,500 2%
WB 13,100 14,300 14,800 16,100 13%
SR 520 Between I-5 and Montlake Blvd.EB 30,000 33,900 34,500 39,000 15%
WB 42,600 48,100 48,700 55,000 14%
SR 520Between Montlake Blvd. and Lake Washington
EB 30,100 33,900 35,700 40,200 19%
WB 32,100 36,300 39,200 44,400 22%
SR 519 1st Avenue S.–4th Avenue S.EB 14,800 16,100 18,400 20,100 25%
WB 12,200 13,400 12,200 13,400 0%
Findings in Transportation Appendix Figure A-16 also show impacts on various segments of state highways and are described more specifically as follows:
I-5 Downtown and North of Downtown
Future average weekday daily volumes (AWDT) will increase by between 13 and 18 percent by 2035 in both directions in the four studied segments of I-5 north of Downtown. Daily volumes in the central segment of I-5 through Downtown will increase by between 12 and 22 percent and will be the most-used portions of I-5 in Seattle. Future volumes in segments farther from Downtown will also grow but volumes will be comparatively lesser than in the segments nearest Downtown.
This is an expected pattern, given the number of motorists who use I-5 and enter or exit from places including the University District, Wallingford, Green Lake, Roosevelt, and other neighborhoods in northwest and northeast Seattle. The added volumes through the day could exacerbate congestion, most notably during peak commuting periods, which could diminish overall freeway efficiency and performance.

454Seattle 2035Appendices Transportation Appendix
I-5 South of Downtown
Future AWDT volumes will increase by between 15 and 20 percent northbound and by be-tween 11 and 16 percent southbound by 2035 in two studied segments south of Downtown. Approaching Downtown from the south, the segment between I-90 and James Street would experience an approximately 22 percent increase in AWDT, likely due to volume contribu-tions from I-90 and other local sources. AWDT volumes on I-5 south of Downtown, ranging from approximately 120,000 to 140,000 vehicle trips, would be about 25 percent lower than for the segment of I-5 just north of Downtown.
I-90
I-90 will experience AWDT increases of between 27 and 32 percent by 2035, with westbound volumes increasing to about 96,000 per day, slightly exceeding eastbound volumes.
SR 520
For this highway that has experienced volume decreases due to the initiation of tolling and construction east of Lake Washington, the projected future conditions are for increases in AWDT volumes of between 15 to 23 percent by 2035. This will be equivalent to an increase of about 5,000 to 6,000 vehicles in the eastbound direction, reaching about 40,000 vehicles per day east of Montlake, and about 44,500 vehicles per day in the westbound direction east of Montlake. Closer to I-5, the projected AWDT will reach approximately 55,000 vehicles in the westbound direction by 2035. Tolling is likely to continue to limit the rate of growth in usage over time on SR 520.
SR 99 Downtown and North of Downtown
This highway is anticipated to operate in a tunnel through Downtown by 2035, which may mean a change in volume trends compared to current operations. For three studied segments of SR 99 north of Downtown, future AWDT would increase by between 28 to 34 percent between the lower Queen Anne and Green Lake vicinities, and would increase by between 45 to 50 percent in the segment near the north city limits at North 145th Street.
The projected volumes in this vicinity would be highest in the portion nearest Lake Union and the Ship Canal, reaching between 46,000 to 50,000 vehicles per day AWDT in each direction, while in more northern segments, volumes would range between 20,000 to 25,000 vehicles per day in each direction.
SR 99 South of Downtown
South of Downtown, SR 99 provides access to the SODO and Greater Duwamish industrial areas, as well as southwest Seattle and points south including Burien and Tukwila. South

455Seattle 2035Appendices Transportation Appendix
of South Park, SR 99 reconnects to I-5 in Tukwila. The First Avenue South Bridge crosses the Duwamish Waterway and accommodates traffic to/from Georgetown and the King County International Airport vicinity as well. The variety of its connections and configurations leads to different trends for projected AWDT.
These include (1) anticipated AWDT increases of about 29 percent in each direction at the First Avenue South Bridge (approximately 60,000 to 63,000 vehicles in each direction); (2) increased volumes in the SODO area north of Georgetown of 40 to 44 percent (28,000 to 33,000 vehicles in each direction) and similar gains in the southern direction. These trends likely reflect anticipated increases in commuting traffic and projected traffic growth over time, contributed by nearby neighborhoods like Lake City and Northgate.
SR 513 (Montlake Boulevard to Sand Point Way)
Future AWDT volumes would increase by about 17 to 25 percent in this segment that in-cludes the Montlake Bridge just north of SR 520. This would represent AWDT volumes of ap-proximately 25,000 vehicles per day southbound and 22,600 vehicles per day northbound. This would exacerbate congestion during peak hours in this route that is used heavily for daily commuting. However, other analysis indicates that the future 2035 conditions would still meet the v/c ratio analytic benchmark for the applicable screenline that covers both the University Bridge and the Montlake Bridge.
SR 519 (Edgar Martinez Way)
Future volumes (AWDT) would increase by about 23 percent in the eastbound direction for this segment that provides access to/from the Port of Seattle and SODO industrial area near the major sports stadiums. No increase in the westbound direction was projected in the modeling.
SR 523 (NE 145th Street East of I-5)
This route provides east–west access from Lake City and Lake Forest Park to I-5 and is at the north city limits. Future volumes (AWDT) would increase modestly by 3 to 13 percent, reach-ing volumes of about 16,000 vehicles in each direction by 2035.
Impacts on Adjacent Jurisdictions
Four jurisdictions are adjacent to the City of Seattle: the cities of Shoreline and Lake Forest Park along Seattle’s north boundary and Tukwila and King County along Seattle’s south boundary. Several major arterials that connect to streets in these jurisdictions near the Seattle borders were selected for analysis. For each arterial, the existing PM peak hour traffic volume and forecasted year 2035 traffic volumes were compared to the rated capacity of the arterial, yielding a v/c ratio. The results of this analysis are shown in Transportation Appendix Figure A-17.
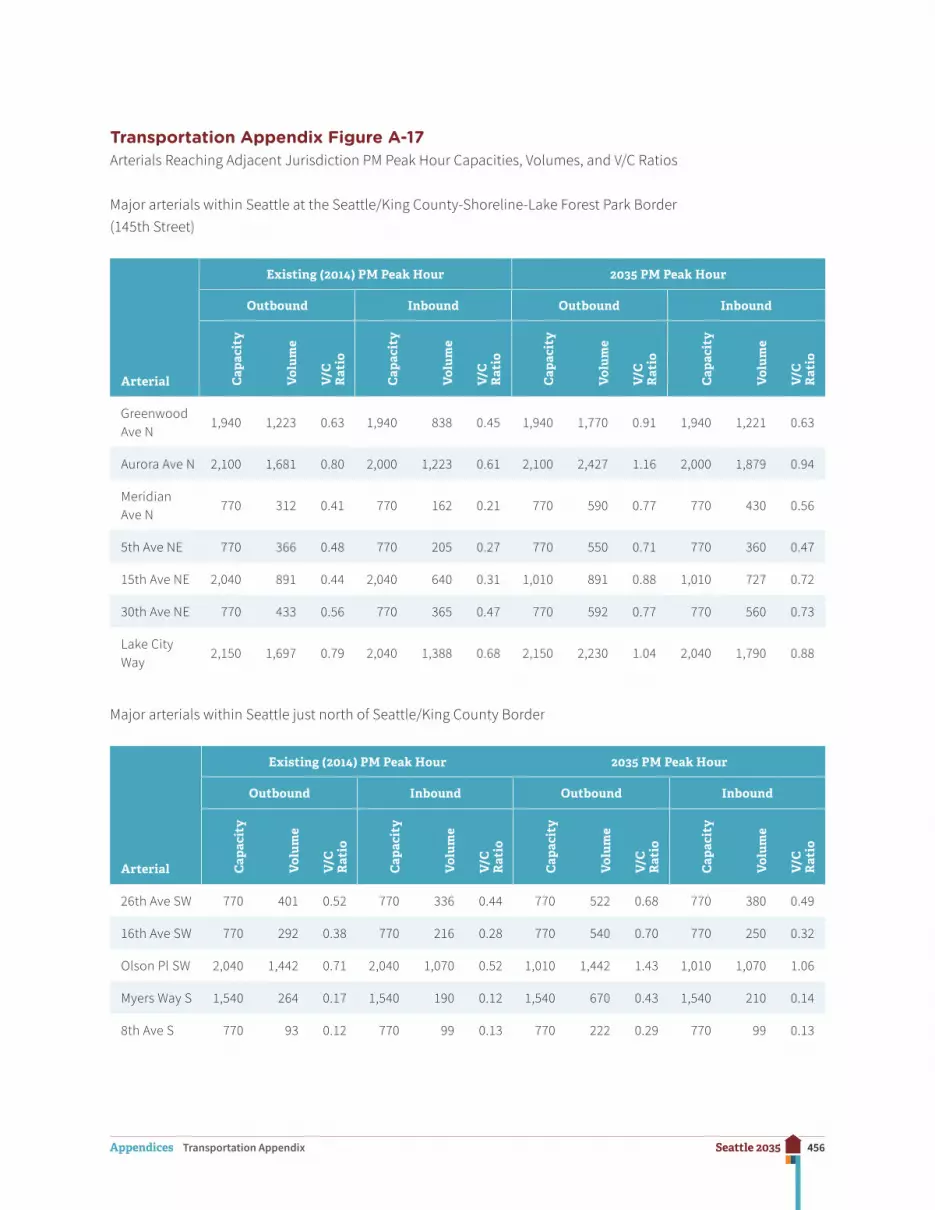
456Seattle 2035Appendices Transportation Appendix
Transportation Appendix Figure A-17 Arterials Reaching Adjacent Jurisdiction PM Peak Hour Capacities, Volumes, and V/C Ratios
Major arterials within Seattle at the Seattle/King County-Shoreline-Lake Forest Park Border (145th Street)
Arterial
Existing (2014) PM Peak Hour 2035 PM Peak Hour
Outbound Inbound Outbound Inbound
Cap
acit
y
Vol
ume
V/C
R
atio
Cap
acit
y
Vol
ume
V/C
R
atio
Cap
acit
y
Vol
ume
V/C
R
atio
Cap
acit
y
Vol
ume
V/C
R
atio
Greenwood Ave N
1,940 1,223 0.63 1,940 838 0.45 1,940 1,770 0.91 1,940 1,221 0.63
Aurora Ave N 2,100 1,681 0.80 2,000 1,223 0.61 2,100 2,427 1.16 2,000 1,879 0.94
Meridian Ave N
770 312 0.41 770 162 0.21 770 590 0.77 770 430 0.56
5th Ave NE 770 366 0.48 770 205 0.27 770 550 0.71 770 360 0.47
15th Ave NE 2,040 891 0.44 2,040 640 0.31 1,010 891 0.88 1,010 727 0.72
30th Ave NE 770 433 0.56 770 365 0.47 770 592 0.77 770 560 0.73
Lake City Way
2,150 1,697 0.79 2,040 1,388 0.68 2,150 2,230 1.04 2,040 1,790 0.88
Major arterials within Seattle just north of Seattle/King County Border
Arterial
Existing (2014) PM Peak Hour 2035 PM Peak Hour
Outbound Inbound Outbound Inbound
Cap
acit
y
Vol
ume
V/C
R
atio
Cap
acit
y
Vol
ume
V/C
R
atio
Cap
acit
y
Vol
ume
V/C
R
atio
Cap
acit
y
Vol
ume
V/C
R
atio
26th Ave SW 770 401 0.52 770 336 0.44 770 522 0.68 770 380 0.49
16th Ave SW 770 292 0.38 770 216 0.28 770 540 0.70 770 250 0.32
Olson Pl SW 2,040 1,442 0.71 2,040 1,070 0.52 1,010 1,442 1.43 1,010 1,070 1.06
Myers Way S 1,540 264 0.17 1,540 190 0.12 1,540 670 0.43 1,540 210 0.14
8th Ave S 770 93 0.12 770 99 0.13 770 222 0.29 770 99 0.13

457Seattle 2035Appendices Transportation Appendix
Arterial
Existing (2014) PM Peak Hour 2035 PM Peak Hour
Outbound Inbound Outbound Inbound
Cap
acit
y
Vol
ume
V/C
R
atio
Cap
acit
y
Vol
ume
V/C
R
atio
Cap
acit
y
Vol
ume
V/C
R
atio
Cap
acit
y
Vol
ume
V/C
R
atio
14th Ave S 1,540 498 0.32 1,540 394 0.26 1,540 830 0.54 1,540 590 0.38
Renton Ave S 770 570 0.74 770 393 0.51 770 940 1.22 770 501 0.65
Rainier Ave S 1,460 967 0.66 1,460 663 0.45 1,460 1,410 0.97 1,460 991 0.68
E Marginal Way S
2,040 699 0.34 2,040 703 0.34 2,040 1,020 0.50 2,040 779 0.38
Airport Way S 2,000 756 0.38 2,000 356 0.18 1,000 1,123 1.12 1,000 822 0.82
M L King Jr. Way S
2,040 1,297 0.64 2,040 1,076 0.53 2,040 1,650 0.81 2,040 1,078 0.53
51st Ave S 770 351 0.46 770 219 0.28 770 690 0.90 770 270 0.35
For all but five instances for the arterials shown in Transportation Appendix Figure A-17, the PM peak hour v/c ratio is below 1.0, indicating that there currently is remaining vehicle capacity and that the capacity will continue into the forecasted future. Exceptions are:
Aurora Avenue North (SR 99), as the primary north–south highway arterial to/from Shoreline, is projected to experience considerable growth in evening peak hour volumes by 2035 (nearly 750 added vehicles), which will raise the projected northbound v/c ratio from 0.80 to 1.16.
Lake City Way (SR 522), as the primary north–south highway arterial in north Seattle to/from Lake Forest Park, is projected to experience considerable growth in evening peak hour volumes by 2035 (530 added vehicles), which will raise the projected northbound v/c ratio from 0.79 to 1.04.
Olson Place SW, a route to/from White Center and Burien, may experience a projected v/c ratio of 1.43 in the peak westbound direction by 2035, but this is tempered by a recognition that the conservative analysis of road capacity predicts a reduced capacity with a possible future bicycle improvement, and the future volumes for 2035 are not otherwise projected to increase over existing 2014 volumes. A similar effect on the eastbound direction of travel on Olson Place SW leads to a projected congestion level measured as a 1.06 v/c ratio. Future bicycle facility design would determine whether vehicle lanes would actually be reduced; given the street’s width, such reductions ultimately might not be needed.
458Seattle 2035Appendices Transportation Appendix
Renton Avenue South, a route to/from Skyway and the city of Renton, is projected to experi-ence growth of approximately 370 vehicles in the southbound direction by 2035, which will raise the corresponding v/c ratio to 1.22.
Airport Way (a route to/from Tukwila), like Olson Place SW, may be affected in its capacity by a future possible bicycle improvement, and given projected increases in peak hour traffic southbound (nearly 370 added vehicles) could experience congestion measured as a v/c ratio of 1.12.
In other locations, including Rainier Avenue South and MLK Jr. Way South, both routes to Renton, projected v/c ratios of 0.97 and 0.81 respectively, indicating future increases in volume and probable congestion.
These modeled traffic volume and v/c findings for 2035 reflect growth not only under Seattle’s Comprehensive Plan, but also the probable growth in the adjacent jurisdictions and throughout the central Puget Sound region that contributes to total traffic growth. Much of the traffic on these arterials is and will continue to be through-traffic, although the destinations of some motorists will be to and from Seattle as well as the neighboring jurisdictions.
Intergovernmental Coordination Efforts
This section describes the City’s intergovernmental coordination efforts during the devel-opment of the Comprehensive Plan and potential impacts of the plan on the transportation systems of adjacent jurisdictions.
Seattle is an active member of the PSRC, which is charged with certifying that local transporta-tion plans are consistent with regional plans and goals. The City supports PSRC’s Vision 2040, the regional growth strategy that describes linking high-density residential and employment centers throughout the region by high-capacity transit and promoting a multimodal transpor-tation system. Vision 2040’s goals are carried forward by this Comprehensive Plan.
The PSRC provides population, employment, and transportation data to Seattle and other jurisdictions. Coordination is established via this centralized information resource. The PSRC is charged with allocating certain federal funds. Seattle has participated in establish-ing the criteria and selection process to determine how funds will be distributed among transportation projects.
The City of Seattle cooperates with WSDOT and the PSRC regarding improvements to State transportation facilities and services and to ensure that the City’s plans are consistent with the State Transportation Plan and the Transportation 2040 plan. The PSRC monitors State highways of regional significance for regional planning purposes.

459Seattle 2035Appendices Housing Appendix
Housing Appendix
Introduction
Broad Policy Framework
The state Growth Management Act (GMA) requires each local jurisdiction to include an inventory and analysis of existing and projected housing needs in its Comprehensive Plan. King County’s Countywide Planning Policies (CPPs) provide additional direction and guid-ance for the inventory and analysis of local housing supply and housing needs.
As required, the analysis provided in the Housing Appendix addresses existing and pro-jected housing needs for all economic segments in Seattle as well as for the special-needs populations in the community.
Contents of Housing Appendix
The first sections of the appendix describe the City’s projections for the total amount of housing needed to accommodate growth in Seattle and the amount of capacity within the city for future residential development at a range of housing densities.
The next sections of this appendix provide information on the characteristics of Seattle’s population and households. This includes data on the extent of housing cost burdens and other indicators of housing-related needs experienced by Seattle’s extremely low, very-low, and low-income households. Information is also presented on Seattle’s special-needs popu-lations, including homeless people. Information on disparities in housing cost burdens and homelessness by race and ethnicity is presented in order to support planning consistent with the City’s Race and Social Justice Initiative (RSJI) and the Seattle Comprehensive Plan core value of social equity.

460Seattle 2035Appendices Housing Appendix
Subsequent sections in this appendix describe recent growth and characteristics of Seattle’s existing housing market, and present information on the affordability of the existing rental and owner housing supply. An analysis is included on the gaps between existing housing need and the amount of rental housing affordable and available to lower-income house-holds. Projections are then provided on the amount of housing needed to accommodate growth by income level.
Sections near the end of the appendix describe the City’s strategies for addressing afford-able housing, inventory rent/income-restricted housing within Seattle, and provide rough projections for continued production of rent/income-restricted housing.
Information on the data sources employed in the Housing Analysis is provided below.
Data Sources
One of the main sources used is a special tabulation of American Community Survey (ACS) prepared by the US Census Bureau for the US Department of Housing and Urban Development (HUD), otherwise known as the Consolidated Housing Affordability Strategy (CHAS) data.
Certain aspects of the CHAS data are important to note. As sample-based estimates, the CHAS estimates, like other ACS estimates, carry margins of error. These margins of error can be substantial, particularly for small groups of households. To provide reasonably reliable statistics at the local level, HUD obtains CHAS tabulations based on ACS data pooled over a period of five years.
The five-year CHAS estimates from the 2006–2010 American Community Survey (ACS) provide the main data source for analyses in this appendix regarding household income, housing cost burden, and affordability of Seattle’s housing supply. There is a considerable lag time between the collection of data and the time HUD publishes the CHAS estimates. The 2006–2010 CHAS estimates were the most recent tabulation of CHAS data available at the time the analysis for this appendix began.
The CHAS data, like other ACS data, do not distinguish whether housing units are income- and rent-restricted. The ACS does not provide official numerical population estimates, but is designed to provide insights into the characteristics of the population.
Other key sources of data reported and analyzed in this appendix include the following.
• Standard tabulations of decennial Census and American Community Survey (ACS) estimates published by the US Census Bureau;

461Seattle 2035Appendices Housing Appendix
• Rental market data from Dupre+Scott (D+S) Apartment Advisors, Inc. and home sales data from the Northwest Multiple Listing Service (NWMLS);
• The City’s Office of Planning and Community Development (OPCD) permit database that provides information on recent housing growth;
• OPCD’s development capacity model, which provides estimates regarding capacity for additional residential growth under current zoning;
• Seattle’s 2014–2017 Consolidated Plan for Housing and Community Development (Consolidated Plan), and
• City Office of Housing (OH) information on rent/income-restricted housing.
The time periods for the data reported from these sources vary and so do the population, household, and housing unit totals. This is due to several reasons including differences in data release schedules and data availability at the time analysis for this appendix was performed. With some sample-based data sources such as the ACS, data also needed to be pooled over several years in order to report reliable results.
For purposes of the Comprehensive Plan, the City refers to 60 percent of AMI instead of 50 percent of AMI because 60 percent of AMI is a more common income limit for many funding sources for rent/income-restricted housing. However, much of the analysis in this Housing Appendix refers to income levels bounded by 50 percent of AMI (for example, 30–50 percent of AMI, and 50–80 percent of AMI) due to the way key data sources including the CHAS tabu-late the AMI income categories.
Housing Needed to Accommodate Growth
The King County Countywide Planning Policies (CPPs) are prepared by the Growth Management Planning Council and ratified by local jurisdictions in the county. The CPPs provide cities in the county with a common set of policies and guidelines for developing local comprehensive plans. The CPPs also facilitate coordinated planning for growth by a collaborative process to allocate expected housing and employment growth to local juris-dictions within the county.
The Washington State Office of Financial Management (OFM) provides forecasts of popula-tion growth for each county. (In King County, the population forecast is converted to hous-ing units because local governments can more reliably track housing units on a frequent basis.) In 2010, the CPPs were updated to include twenty-five-year housing and employ-ment growth allocations for all jurisdictions in the county. For Seattle, the twenty-five-year housing growth allocation was 86,000 net new housing units.
462Seattle 2035Appendices Housing Appendix
Compared with the previous growth estimates, the updated growth estimates in the CPPs reflect greater residential growth rates in the county as a whole as forecast by OFM. The allocation of twenty-year growth estimates was also based on the Puget Sound Regional Council’s (PSRC) regional growth strategy, which emphasizes growth in “Metropolitan Cities,” including Seattle and Bellevue. The allocation to Seattle was further informed by other factors such as demographic and development trends, zoned capacity, and local policy and market factors.
To correspond with the twenty-year planning period in Seattle’s Comprehensive Plan, the City of Seattle translated the twenty-five-year housing and employment growth allocations of 86,000 housing units into a twenty-year growth estimate of 70,000 net new housing units. The housing units needed to satisfy affordability needs for lower-income households are discussed below.
Residential Capacity
OPCD’s development capacity model estimates the amount of development that could be accommodated in Seattle. The model is based on current zoning and makes assumptions about likelihood of redevelopment and ultimate development densities achievable in those zones. The City uses development capacity estimates to inform regional and countywide growth planning and to determine potential outcomes of planning efforts conducted for areas of the city.
Housing Appendix Figure A-1 contains residential estimates generated from the develop-ment capacity model. This figure shows the amount of residential development capacity for Seattle as a whole. It also shows the capacity in major zoning categories as well as in the city’s urban centers and villages.
Seattle’s current zoning provides development capacity to accommodate more than 220,000 additional housing units. This capacity is ample for the City’s residential growth estimate of 70,000 net new units between 2015 and 2035.
Seattle’s mixed-use and residential zones allow a wide range of housing types and densi-ties. About 75 percent of Seattle’s residential development capacity is in zones allowing a mix of residential and commercial uses. Of this 75 percent, Commercial, Neighborhood Commercial, and Seattle Mixed zones account for 60 percent of capacity, with Downtown zones accounting for the other 15 percent.
The remaining 25 percent of Seattle’s residential development capacity is in zones that allow only residential uses—meaning these zones do not allow a mix of residential and commercial uses. Of this 25 percent, 20 percent is in zones allowing multifamily structures. The remaining 5 percent is in single-family zones.
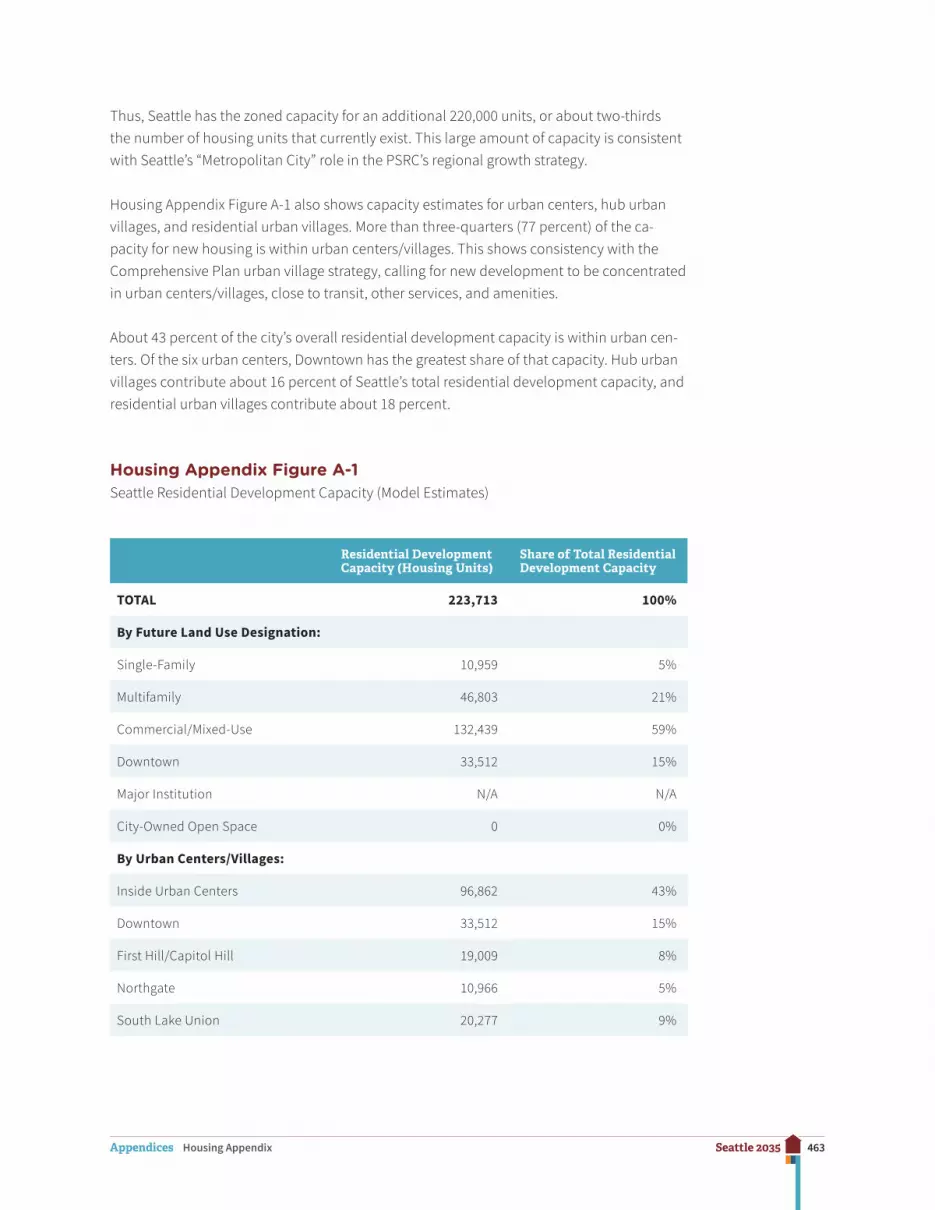
463Seattle 2035Appendices Housing Appendix
Thus, Seattle has the zoned capacity for an additional 220,000 units, or about two-thirds the number of housing units that currently exist. This large amount of capacity is consistent with Seattle’s “Metropolitan City” role in the PSRC’s regional growth strategy.
Housing Appendix Figure A-1 also shows capacity estimates for urban centers, hub urban villages, and residential urban villages. More than three-quarters (77 percent) of the ca-pacity for new housing is within urban centers/villages. This shows consistency with the Comprehensive Plan urban village strategy, calling for new development to be concentrated in urban centers/villages, close to transit, other services, and amenities.
About 43 percent of the city’s overall residential development capacity is within urban cen-ters. Of the six urban centers, Downtown has the greatest share of that capacity. Hub urban villages contribute about 16 percent of Seattle’s total residential development capacity, and residential urban villages contribute about 18 percent.
Housing Appendix Figure A-1Seattle Residential Development Capacity (Model Estimates)
Residential Development Capacity (Housing Units)
Share of Total Residential Development Capacity
TOTAL 223,713 100%
By Future Land Use Designation:
Single-Family 10,959 5%
Multifamily 46,803 21%
Commercial/Mixed-Use 132,439 59%
Downtown 33,512 15%
Major Institution N/A N/A
City-Owned Open Space 0 0%
By Urban Centers/Villages:
Inside Urban Centers 96,862 43%
Downtown 33,512 15%
First Hill/Capitol Hill 19,009 8%
Northgate 10,966 5%
South Lake Union 20,277 9%

464Seattle 2035Appendices Housing Appendix
Residential Development Capacity (Housing Units)
Share of Total Residential Development Capacity
Uptown 4,165 2%
University District 8,933 4%
Inside Hub Urban Villages 36,227 16%
Inside Residential Urban Villages 39,386 18%
Outside Centers and Villages 51,207 23%
Source: Development Capacity Report, DPD, September 2014
Broad Trends in Seattle’s Population and Households
This section summarizes recent trends in the basic characteristics of Seattle’s population and households, using estimates from the 2000 and 2010 censuses and the most recent three-year tabulation of ACS data spanning 2011 to 2013.1 This is the most recent set of ACS multiyear estimates since the 2010 Census. This summary provides broad context for the more detailed analysis of household characteristics and housing needs discussed below.
Seattle has the largest population of cities in the state of Washington and is the twenty-third most populous city in the US. The 2010 Census counted Seattle’s population at 608,660. From 2000 to 2010, Seattle’s population grew by 8 percent.
Seattle has seen substantial growth in population, households, and housing units since the 2010 Census. OFM produces official population estimates for cities and counties on an annual basis. As of April 2015, OFM estimates that Seattle contained approximately 662,400 residents, 314,326 households, and 332,694 housing units.
Population Characteristics
The 2010 Census results showed that more than a third (33.7 percent) of Seattle residents are people of color, up from 32.1 percent in 2000.2 ACS estimates for the period 2011 to 2013 indicate that the number and share of Seattle’s residents who are people of color has con-tinued to increase since 2010. However, these ACS estimates show that the increase in the population of color has occurred much more slowly in Seattle than in the balance of King County. (See Housing Appendix Figure A-2.)
1. The analysis uses the 2011–2013 ACS estimates because they are the most recent multiyear estimates avail-able spanning the years after the 2010 census.
2. The Census collects information on Hispanic/Latino ethnicity in a separate question from race. “People of col-or” encompass Hispanics and Latinos of any race as well as people who are any race other than white alone.

465Seattle 2035Appendices Housing Appendix
Although the population of color in the city as a whole increased between 2000 and 2010, the population of color declined in many of the census tracts located in the central and southeast portions of Seattle.
The 2010 Census indicates that children under eighteen make up roughly 15 percent of the city’s population. Between 2000 and 2010, the number of children in Seattle increased, but at a slightly slower pace than the overall population increased. However, the number of young children (under age five) increased much more quickly.
Families with children are substantially underrepresented in Seattle compared with the balance of King County. Data indicate that this is starting to change, but trends differ greatly by race. Increases in Seattle’s population of children have mainly been from the growing numbers of white, non-Hispanic children living in the city. In the balance of King County, increases in the child population have, in contrast, been driven by a rapid rise in the number of children of color.
Housing Appendix Figure A-2Growth in Total Population and Population Under 18 (Includes Detail for the Population of Color and for the White, Non-Hispanic Population)
Population Growth in Seattle Pop. Growth in Remainder of King Co.
2000–2010 Census
2010 to 2011–2013 ACS
2000–2010 Census
2010 to 2011–2013 ACS
Total population 45,286 8.0% 27,610 4.5% 148,929 12.7% 48,920 3.7%
Pop. of color 24,240 13.4% 11,152 5.4% 193,802 69.0% 40,009 8.4%
White, non-Hispanic pop. 21,046 5.5% 16,458 4.1% -44,873 -5.0% 8,911 1.1%
Pop. under 18 yrs. of age 5,686 6.5% 6,917 7.4% 17,170 5.7% 4,723 1.5%
Pop. of color under 18 896 2.1% 1,399 3.2% 59,062 63.8% 10,150 6.7%
White, non-Hispanic pop. under 18
4,790 10.7% 5,518 11.2% -41,892 -19.9% -5,427 -3.2%
Sources: 2000 Census and 2010 Census estimates; 2011–2013 ACS estimates.
Census estimates show that young adults (i.e., adults between eighteen and thirty-four years of age) make up a large share of Seattle’s population. In 2010, young adults were 33 percent of Seattle’s population compared to 22 percent in the remainder of King County.
The 2010 Census found that seniors (people age sixty-five and over) are about 11 percent of Seattle’s population. The number of seniors in Seattle, as well as the percentage share of
466Seattle 2035Appendices Housing Appendix
the city’s population who are seniors, declined between 2000 and 2010. However, ACS esti-mates for the period 2011 to 2013 suggest that the number of seniors in the city is starting to increase as individuals in the baby boom generation begin reaching their senior years.
Household Characteristics
The 2010 Census tallied 283,510 households in Seattle. This was an increase of roughly 25,000 households, or 9.7 percent, since the 2000 Census.
Between 2000 and 2010, the average number of people per household in Seattle declined from 2.08 to 2.06. This slight decline reflects the continuation, but marked slowing, of a long-term trend toward smaller household sizes locally and nationally.3
Census 2010 found that about 43 percent of households in Seattle are family households, less than half of which are families with children. About 19 percent of Seattle’s households are families with related children.4 The majority (57 percent) of Seattle’s households is non-family households, and most of these non-family households are people living alone. In 2010, one-person households made up 41 percent of Seattle’s total households. The increasing number of one-person households has been a key driver contributing to the broader decline in the city’s household size.
In Seattle, renter households outnumber households who own their home. Of Seattle households counted in Census 2010, 52 percent were renter households and 48 percent were owner households. The trend in recent decades has been one of gradually declining homeownership rates and increasing shares of renter households.5 The ACS (2011–2013) estimates show that approximately 54 percent of Seattle’s households rent, continuing a long-term increase in the share of Seattle households who rent. The share of households in Seattle who are renters is likely to increase as multifamily housing units (which are more commonly renter-occupied than owner-occupied) continue to increase as a share of the city’s housing stock.
3. The 2011 to 2013 ACS shows an average household size in Seattle of about 2.12 people, which is higher than the household size in 2010. That recent increase in Seattle’s household size reflects a decrease in the rate of household formation that occurred in the US as a whole in the wake of the Great Recession. It is likely that the increase in household size will be temporary.
4. These figures on family households with children refer to households in which there is at least one child under eighteen years of age who is related to the householder.
5. Single-year ACS estimates indicate that the downward trend in homeownership rates was interrupted temporarily during the housing bubble that occurred in the latter half of the last decade. However, estimated homeownership rates in the city began to decline again after the effects of the Great Recession took hold.

467Seattle 2035Appendices Housing Appendix
Population in Group Quarters
The 2010 Census found that one in twenty Seattle residents lived in group quarters such as college/university student housing (with about 11,800 people), nursing facilities (2,600 people), and correctional facilities (2,000 people).
Analysis of Key Household Characteristics
The analysis provided below is based on CHAS data from ACS surveys (2006–2010) reflecting approximately 280,470 total households in Seattle. The household total from the CHAS is lower than the number of households who currently reside in Seattle. Today, Seattle con-tains almost 315,000 households.6
Tenure refers to whether a household owns or rents the housing unit in which they live. As indicated in Housing Appendix Figure A-3, approximately 51 percent of households in the 2006–2010 CHAS estimates are renters. It is important to view these estimates in the context of the period in which they were collected. The 2006–2010 CHAS estimates include the housing boom in the mid-2000s, the Great Recession, and the steep downturn in the hous-ing market in the wake of that recession. As noted above, the share of Seattle households who rent is now closer to 54 percent.
Housing Appendix Figure A-3Total Households and Household by Tenure, Seattle
Total households 280,470 100.0%
Owner households 137,090 48.9%
Renter households 143,380 51.1%
Source: CHAS (2006–2010)
Income Distribution
There is a wide distribution of incomes among Seattle households as shown in the pie chart in Housing Appendix Figure A-4.
6. The previous section of the appendix summarizes more recent data available from other sources. OFM esti-mates that Seattle contained 314,326 households as of April 2015.
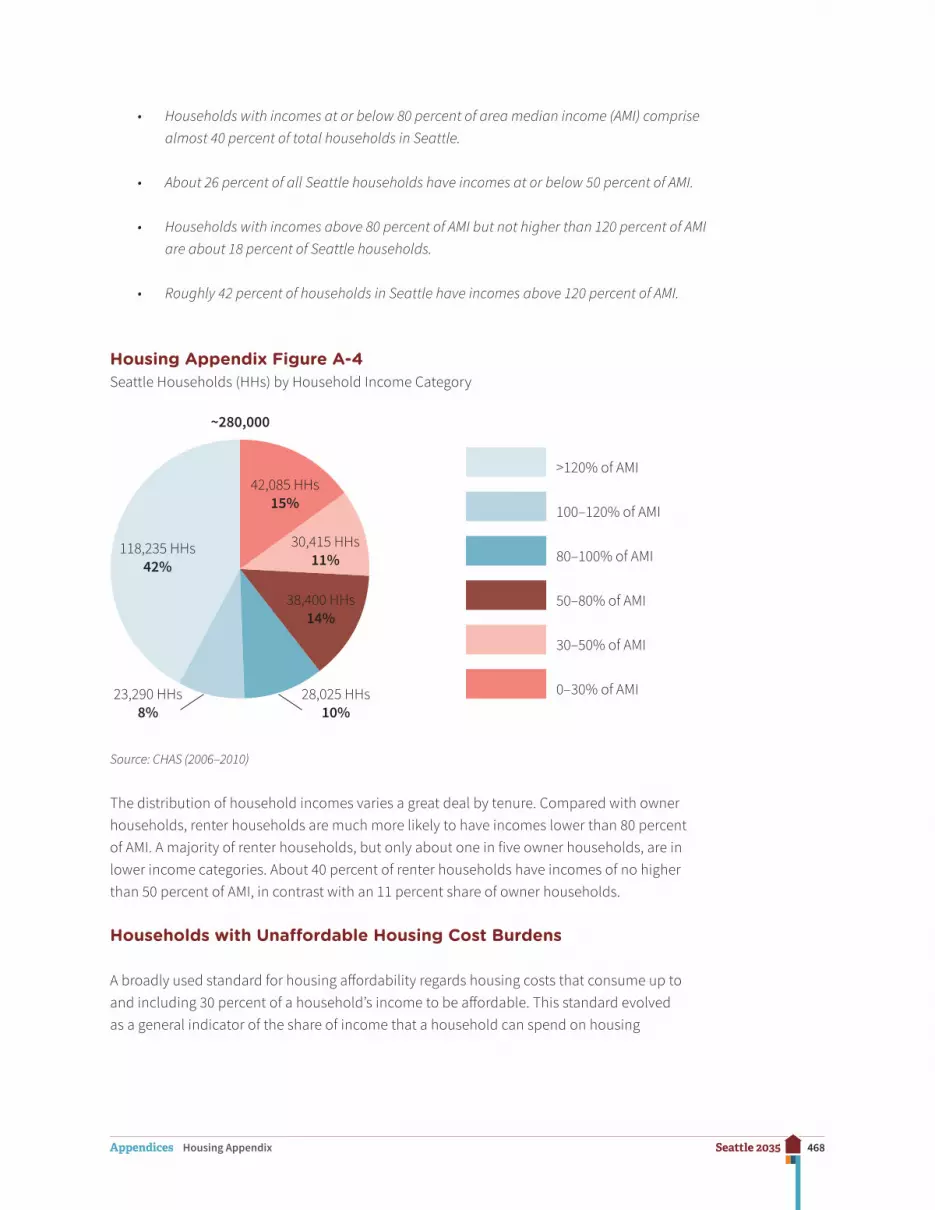
468Seattle 2035Appendices Housing Appendix
• Households with incomes at or below 80 percent of area median income (AMI) comprise almost 40 percent of total households in Seattle.
• About 26 percent of all Seattle households have incomes at or below 50 percent of AMI.
• Households with incomes above 80 percent of AMI but not higher than 120 percent of AMI are about 18 percent of Seattle households.
• Roughly 42 percent of households in Seattle have incomes above 120 percent of AMI.
Housing Appendix Figure A-4Seattle Households (HHs) by Household Income Category
>120% of AMI
100–120% of AMI
80–100% of AMI
50–80% of AMI
30–50% of AMI
0–30% of AMI
118,235 HHs 42%
23,290 HHs 8%
28,025 HHs 10%
38,400 HHs 14%
30,415 HHs 11%
42,085 HHs 15%
~280,000
Source: CHAS (2006–2010)
The distribution of household incomes varies a great deal by tenure. Compared with owner households, renter households are much more likely to have incomes lower than 80 percent of AMI. A majority of renter households, but only about one in five owner households, are in lower income categories. About 40 percent of renter households have incomes of no higher than 50 percent of AMI, in contrast with an 11 percent share of owner households.
Households with Unaffordable Housing Cost Burdens
A broadly used standard for housing affordability regards housing costs that consume up to and including 30 percent of a household’s income to be affordable. This standard evolved as a general indicator of the share of income that a household can spend on housing
469Seattle 2035Appendices Housing Appendix
and still have enough income left over for other essentials such as food, clothing, and transportation.
Based on the 30 percent standard, HUD considers households to be cost-burdened if they spend more than 30 percent of their household income on housing costs and severely cost-burdened if they spend more than 50 percent of their household income on housing costs. (This appendix refers to households as “moderately” cost-burdened if the households spend more than 30 percent but not more than 50 percent of their income on housing.)
Based on the CHAS data, approximately 38 percent of all households in Seattle are cost- burdened at either a moderate or a severe level. About 21 percent of all Seattle households are “moderately” cost-burdened. Approximately 17 percent of all Seattle households are severely cost-burdened.
Cost Burdens by Tenure and Household Income
Renter households are more likely than owner households to be burdened by housing costs they cannot afford.
• About 42 percent of renter households are cost-burdened.
• A lower, but still sizable, 33 percent share of owner households is cost-burdened.
The greater prevalence of cost burdens among renter households is primarily due to the higher prevalence of severe burdens among these households: roughly 21 percent of renter households, compared to 13 percent of owner households, are severely cost-burdened.
Housing Appendix Figure A-5 shows that more than three-quarters of households in both the 0–30 percent of AMI and 30–50 percent of AMI categories spend more than 30 percent of income on housing and that more than 60 percent of households with incomes of 0–30 percent of AMI spend more than half of their income on housing.
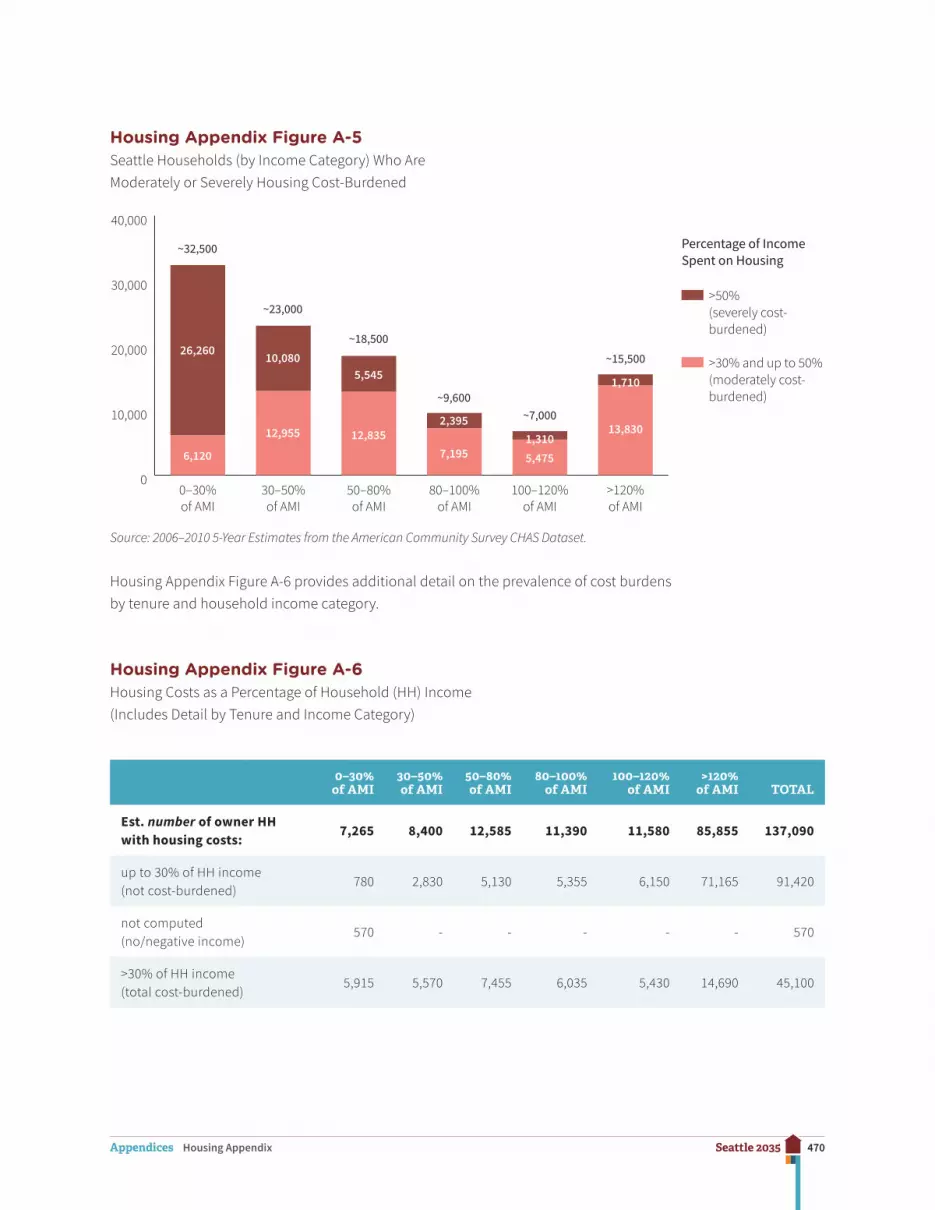
470Seattle 2035Appendices Housing Appendix
Housing Appendix Figure A-5Seattle Households (by Income Category) Who Are Moderately or Severely Housing Cost-Burdened
0
10,000
20,000
30,000
40,000
>120%of AMI
100–120%of AMI
80–100%of AMI
50–80%of AMI
30–50%of AMI
0–30%of AMI
Percentage of IncomeSpent on Housing
>50%(severely cost- burdened)
>30% and up to 50%(moderately cost- burdened)
26,260
1,710
1,3102,395
5,545
13,830
5,4757,19512,835
~18,500
~7,000
~15,500
~9,600
10,080
12,955
~23,000
~32,500
6,120
Source: 2006–2010 5-Year Estimates from the American Community Survey CHAS Dataset.
Housing Appendix Figure A-6 provides additional detail on the prevalence of cost burdens by tenure and household income category.
Housing Appendix Figure A-6Housing Costs as a Percentage of Household (HH) Income (Includes Detail by Tenure and Income Category)
0–30% of AMI
30–50% of AMI
50–80% of AMI
80–100% of AMI
100–120% of AMI
>120% of AMI TOTAL
Est. number of owner HH with housing costs:
7,265 8,400 12,585 11,390 11,580 85,855 137,090
up to 30% of HH income (not cost-burdened)
780 2,830 5,130 5,355 6,150 71,165 91,420
not computed (no/negative income)
570 - - - - - 570
>30% of HH income (total cost-burdened)
5,915 5,570 7,455 6,035 5,430 14,690 45,100
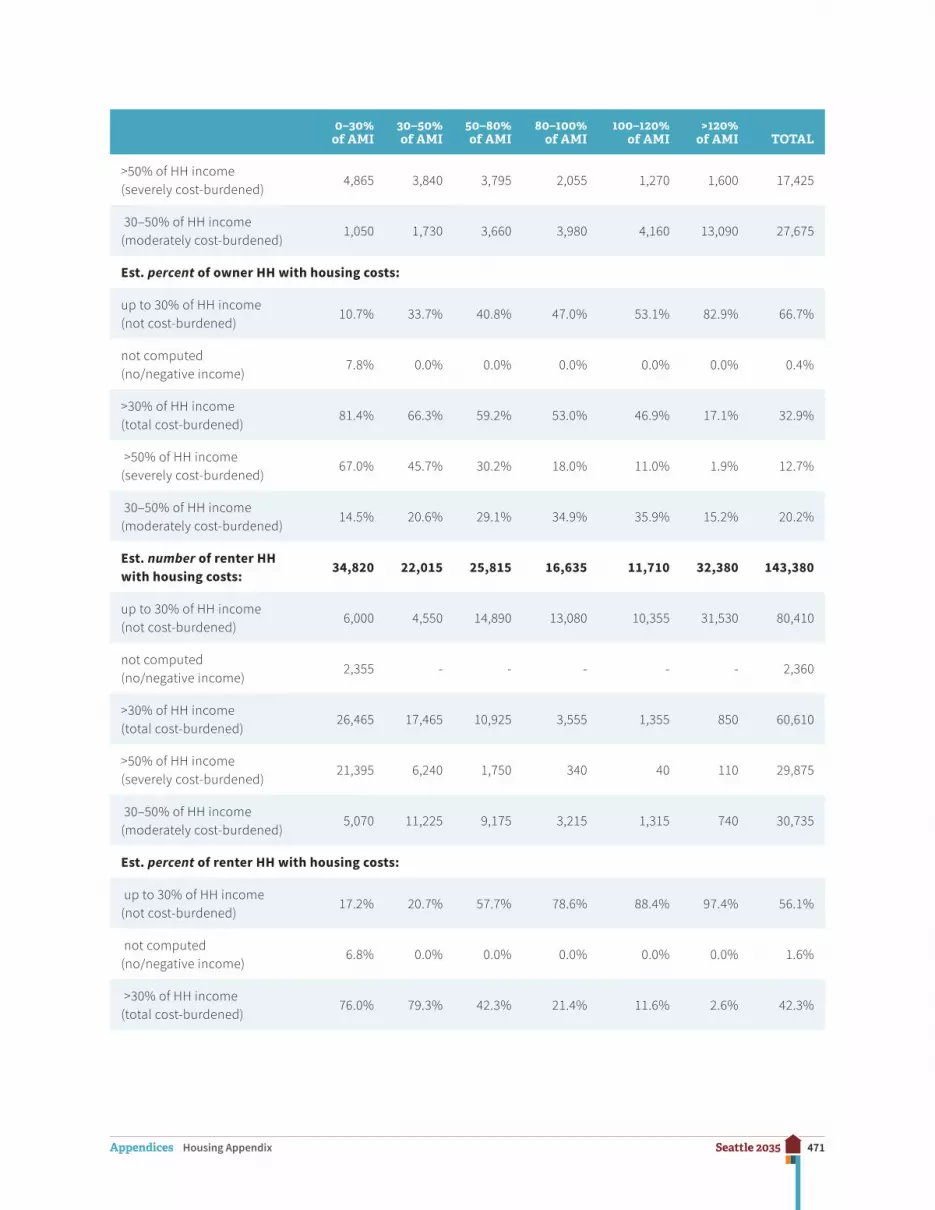
471Seattle 2035Appendices Housing Appendix
0–30% of AMI
30–50% of AMI
50–80% of AMI
80–100% of AMI
100–120% of AMI
>120% of AMI TOTAL
>50% of HH income (severely cost-burdened)
4,865 3,840 3,795 2,055 1,270 1,600 17,425
30–50% of HH income (moderately cost-burdened)
1,050 1,730 3,660 3,980 4,160 13,090 27,675
Est. percent of owner HH with housing costs:
up to 30% of HH income (not cost-burdened)
10.7% 33.7% 40.8% 47.0% 53.1% 82.9% 66.7%
not computed (no/negative income)
7.8% 0.0% 0.0% 0.0% 0.0% 0.0% 0.4%
>30% of HH income (total cost-burdened)
81.4% 66.3% 59.2% 53.0% 46.9% 17.1% 32.9%
>50% of HH income (severely cost-burdened)
67.0% 45.7% 30.2% 18.0% 11.0% 1.9% 12.7%
30–50% of HH income (moderately cost-burdened)
14.5% 20.6% 29.1% 34.9% 35.9% 15.2% 20.2%
Est. number of renter HH with housing costs:
34,820 22,015 25,815 16,635 11,710 32,380 143,380
up to 30% of HH income (not cost-burdened)
6,000 4,550 14,890 13,080 10,355 31,530 80,410
not computed (no/negative income)
2,355 - - - - - 2,360
>30% of HH income (total cost-burdened)
26,465 17,465 10,925 3,555 1,355 850 60,610
>50% of HH income (severely cost-burdened)
21,395 6,240 1,750 340 40 110 29,875
30–50% of HH income (moderately cost-burdened)
5,070 11,225 9,175 3,215 1,315 740 30,735
Est. percent of renter HH with housing costs:
up to 30% of HH income (not cost-burdened)
17.2% 20.7% 57.7% 78.6% 88.4% 97.4% 56.1%
not computed (no/negative income)
6.8% 0.0% 0.0% 0.0% 0.0% 0.0% 1.6%
>30% of HH income (total cost-burdened)
76.0% 79.3% 42.3% 21.4% 11.6% 2.6% 42.3%

472Seattle 2035Appendices Housing Appendix
0–30% of AMI
30–50% of AMI
50–80% of AMI
80–100% of AMI
100–120% of AMI
>120% of AMI TOTAL
>50% of HH income (severely cost-burdened)
61.4% 28.3% 6.8% 2.0% 0.3% 0.3% 20.8%
30–50% of HH income (moderately cost-burdened)
14.6% 51.0% 35.5% 19.3% 11.2% 2.3% 21.4%
Source: CHAS (2006–2010)
Household Characteristics by Race and Ethnicity
Shortly after taking office, Mayor Murray issued Executive Order 2014–02 to reaffirm and further detail the City’s commitment to RSJI, meaning that the City will incorporate a racial equity lens in citywide initiatives including those related to affordable housing and planning for equitable growth and development.
Data are presented in the following pages to identify the extent of disparities in housing needs and opportunities by race and ethnicity. Consideration of these disparities is vital to informing planning for housing consistent with RSJI.
Tenure by Race and Ethnicity
While a slight majority (53 percent) of white, non-Hispanic households own their homes, most households of color7 (63 percent) are renters. The share of Asian households who rent is only slightly more than half, but renting is much more prevalent for households in which the householder is Hispanic or Latino, Native American, Pacific Islander, or black or African American. More than two-thirds of each of these groups of households rent.
Household Income Distribution by Race and Ethnicity
Seattle’s households of color are disproportionately likely to have incomes that are under 50 percent of AMI, a pattern that applies not only to households of color overall, but also to each of the individual racial and ethnic groups of color for which the CHAS data are tabulated.
• Households of color as a group are twice as likely as white, non-Hispanic households to have a household income that is 0–30 percent of AMI: about 24 percent of households of
7. Households of color are households in which the householder is a person of color. The Census Bureau tabu-lates race and ethnicity of households based on the characteristics of the householder. For convenience, this Appendix refers sometimes refers to households by race or ethnicity, but this is not intended to imply that all household members are of the same race or ethnicity as the householder.
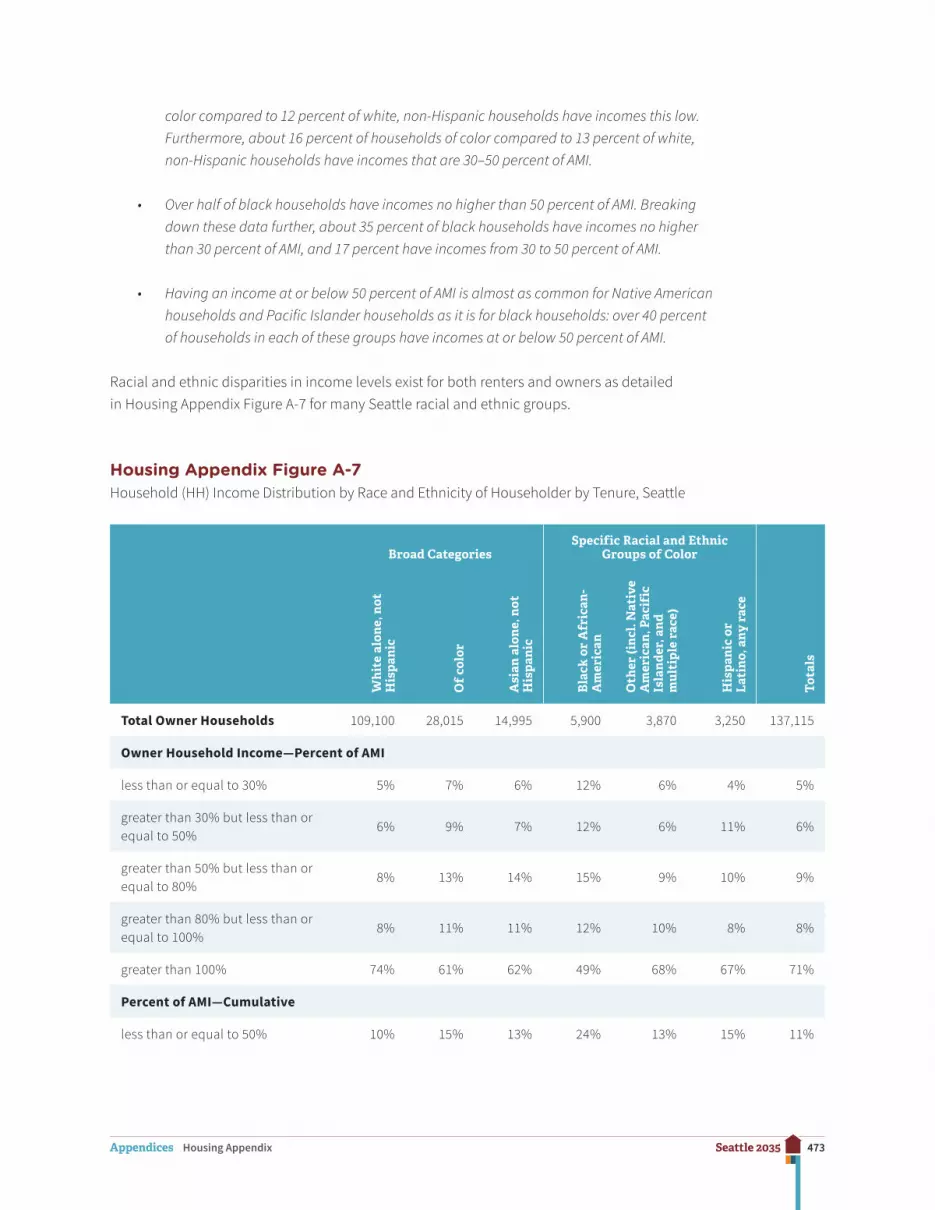
473Seattle 2035Appendices Housing Appendix
color compared to 12 percent of white, non-Hispanic households have incomes this low. Furthermore, about 16 percent of households of color compared to 13 percent of white, non-Hispanic households have incomes that are 30–50 percent of AMI.
• Over half of black households have incomes no higher than 50 percent of AMI. Breaking down these data further, about 35 percent of black households have incomes no higher than 30 percent of AMI, and 17 percent have incomes from 30 to 50 percent of AMI.
• Having an income at or below 50 percent of AMI is almost as common for Native American households and Pacific Islander households as it is for black households: over 40 percent of households in each of these groups have incomes at or below 50 percent of AMI.
Racial and ethnic disparities in income levels exist for both renters and owners as detailed in Housing Appendix Figure A-7 for many Seattle racial and ethnic groups.
Housing Appendix Figure A-7Household (HH) Income Distribution by Race and Ethnicity of Householder by Tenure, Seattle
Broad CategoriesSpecific Racial and Ethnic
Groups of Color
Tot
als
Wh
ite
alon
e, n
ot
His
pan
ic
Of
colo
r
Asi
an a
lon
e, n
ot
His
pan
ic
Bla
ck o
r A
fric
an-
Am
eric
an
Oth
er (i
ncl
. Nat
ive
Am
eric
an, P
acif
ic
Isla
nde
r, a
nd
mul
tipl
e ra
ce)
His
pan
ic o
r L
atin
o, a
ny r
ace
Total Owner Households 109,100 28,015 14,995 5,900 3,870 3,250 137,115
Owner Household Income—Percent of AMI
less than or equal to 30% 5% 7% 6% 12% 6% 4% 5%
greater than 30% but less than or equal to 50%
6% 9% 7% 12% 6% 11% 6%
greater than 50% but less than or equal to 80%
8% 13% 14% 15% 9% 10% 9%
greater than 80% but less than or equal to 100%
8% 11% 11% 12% 10% 8% 8%
greater than 100% 74% 61% 62% 49% 68% 67% 71%
Percent of AMI—Cumulative
less than or equal to 50% 10% 15% 13% 24% 13% 15% 11%
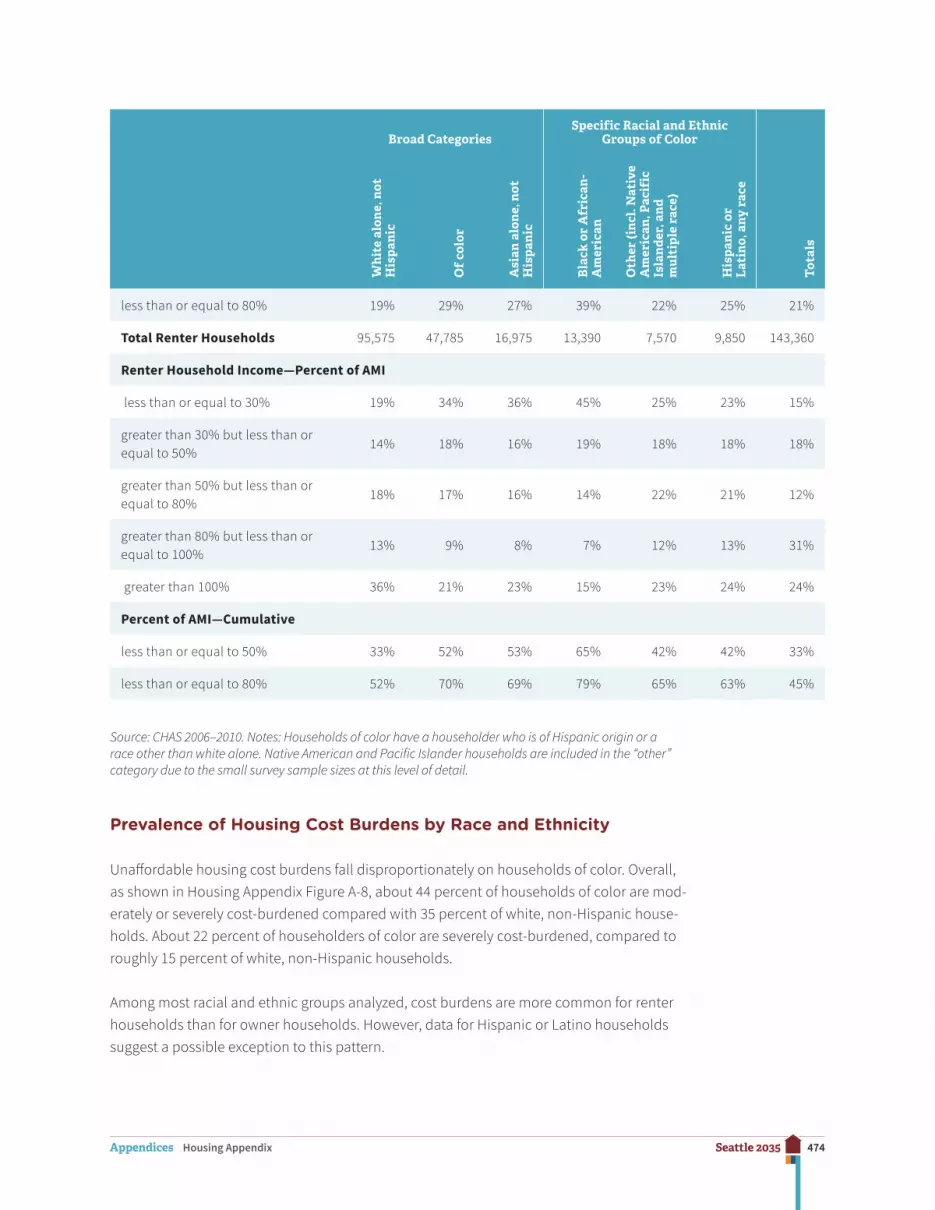
474Seattle 2035Appendices Housing Appendix
Broad CategoriesSpecific Racial and Ethnic
Groups of Color
Tot
als
Wh
ite
alon
e, n
ot
His
pan
ic
Of
colo
r
Asi
an a
lon
e, n
ot
His
pan
ic
Bla
ck o
r A
fric
an-
Am
eric
an
Oth
er (i
ncl
. Nat
ive
Am
eric
an, P
acif
ic
Isla
nde
r, a
nd
mul
tipl
e ra
ce)
His
pan
ic o
r L
atin
o, a
ny r
ace
less than or equal to 80% 19% 29% 27% 39% 22% 25% 21%
Total Renter Households 95,575 47,785 16,975 13,390 7,570 9,850 143,360
Renter Household Income—Percent of AMI
less than or equal to 30% 19% 34% 36% 45% 25% 23% 15%
greater than 30% but less than or equal to 50%
14% 18% 16% 19% 18% 18% 18%
greater than 50% but less than or equal to 80%
18% 17% 16% 14% 22% 21% 12%
greater than 80% but less than or equal to 100%
13% 9% 8% 7% 12% 13% 31%
greater than 100% 36% 21% 23% 15% 23% 24% 24%
Percent of AMI—Cumulative
less than or equal to 50% 33% 52% 53% 65% 42% 42% 33%
less than or equal to 80% 52% 70% 69% 79% 65% 63% 45%
Source: CHAS 2006–2010. Notes: Households of color have a householder who is of Hispanic origin or a race other than white alone. Native American and Pacific Islander households are included in the “other” category due to the small survey sample sizes at this level of detail.
Prevalence of Housing Cost Burdens by Race and Ethnicity
Unaffordable housing cost burdens fall disproportionately on households of color. Overall, as shown in Housing Appendix Figure A-8, about 44 percent of households of color are mod-erately or severely cost-burdened compared with 35 percent of white, non-Hispanic house-holds. About 22 percent of householders of color are severely cost-burdened, compared to roughly 15 percent of white, non-Hispanic households.
Among most racial and ethnic groups analyzed, cost burdens are more common for renter households than for owner households. However, data for Hispanic or Latino households suggest a possible exception to this pattern.

475Seattle 2035Appendices Housing Appendix
Housing Appendix Figure A-8Shares of Seattle Households, by Race of Householder, Who Are Moderately or Severely Housing Cost-Burdened
Percentage of IncomeSpent on Housing
Up to 30%(not cost-burdened)
Not Computed(no/negative income)
>50%(severely cost-burdened) 17% of HHs overall
>30% and up to 50% (moderately cost-burdened) 21% of HHs overall
Total share whoare cost-burdened(38% of HHs overall)
0%
10%
20%
30%
40%
50%
60%
70%
80%
90%
100%
Of colorWhite alone, non-Hispanic
20% 22%
22%
2%
54%
1%
64%
15%
35%44%
Source: 2006–2010 5-Year Estimates from the American Community Survey CHAS Dataset.
Overall, about 47 percent of renter households of color are burdened by unaffordable housing costs compared with 40 percent of white, non-Hispanic renter households.
Housing Appendix Figure A-9 illustrates this finding and provides additional detail on how rates of cost burden vary among renter households by race and ethnicity.
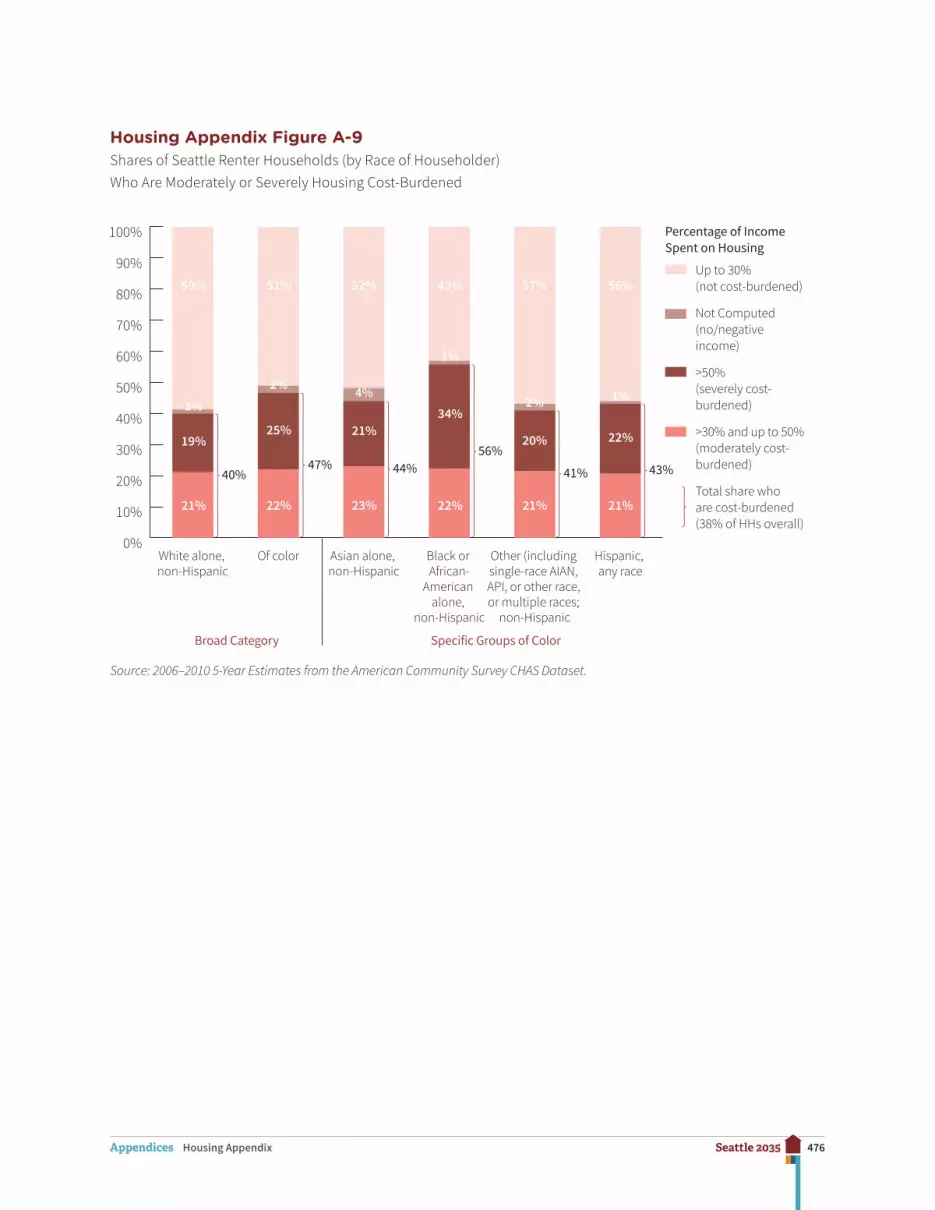
476Seattle 2035Appendices Housing Appendix
Housing Appendix Figure A-9Shares of Seattle Renter Households (by Race of Householder) Who Are Moderately or Severely Housing Cost-Burdened
0%
10%
20%
30%
40%
50%
60%
70%
80%
90%
100%
Hispanic, any race
Other (including single-race AIAN, API, or other race, or multiple races;
non-Hispanic
Black or African-
American alone,
non-Hispanic
Asian alone, non-Hispanic
Of colorWhite alone, non-Hispanic
Percentage of IncomeSpent on Housing
Up to 30%(not cost-burdened)
Not Computed(no/negative income)
>50%(severely cost- burdened)
>30% and up to 50% (moderately cost- burdened)
Total share whoare cost-burdened(38% of HHs overall)
21%
1%
59%
19%
40%
22%
2%
51%
25%
47%
23%
4%
52%
21%
44%
22%
1%
43%
34%
56%
21%
2%
57%
20%
41%
21%
1%
56%
22%
43%
Broad Category Specific Groups of Color
Source: 2006–2010 5-Year Estimates from the American Community Survey CHAS Dataset.
477Seattle 2035Appendices Housing Appendix
Prevalence of Housing Cost Burden by Household Type
The CHAS (2006–2010) tabulations include income and prevalence of cost burden for five household types8, 9 This data is also broken out by tenure (Housing Appendix Figure A-10). Insights for Seattle are summarized below.
• Renter households comprised of elderly non-family households stand out as particularly likely to be cost-burdened: 54 percent of these households are cost-burdened compared to 42 percent of renter households overall.
• Renter households that are large families also have a higher estimated prevalence of cost burden (roughly 47 percent) than do renter households generally.
• The higher prevalence of cost burdens found among elderly non-family households and large families correlates with the fact that these households are also disproportionately likely to have very low-incomes: 64 percent of elderly non-family renter households, and 57 percent of large families renter households, compared to 40 percent of all renter households, have incomes at or below 50 percent of AMI.
• Within the category of owner households, elderly non-family households are also one of the household types most likely to be cost-burdened.10 About 39 percent of elderly non-family owner households are cost-burdened, compared to 33 percent of owner households overall. Elderly non-family households are much more likely than owners generally to have a household income no higher than 50 percent of AMI (37 percent of elderly non-family households have incomes this low compared to only 11 percent of owner households overall).
8. The five household types tabulated in CHAS (2006–2010) data are as follows.
• Elderly family households, which are defined as families of two people, with either or both age sixty-two or over.
• Elderly non-family households, which are one- or two-person non-family households in which either person is sixty-two years or over. The CHAS data do not include more detail on the composition of these households, but other ACS tables suggest that a large majority of these households are elderly women living alone.
• Small family households, defined as families comprised of two people, neither of which is sixty-two years or over, or three or four people.
• Large family households, which are families with five or more people. • Other household types, referred to in this appendix as non-elderly, non-family. This includes non-elderly
people living alone and most other households with non-related individuals who are not elderly.
9. Disability questions on the ACS were changed between 2007 and 2008, which rendered the previous data on disability noncomparable after the change. Consequently, estimates for households with disabled people are not available in the CHAS (2006–2010) tabulations.
10. Non-elderly, non-family households are the other type of owner household disproportionately likely to be cost-burdened. However, they are no more likely than other owner households to have incomes at or below 50 percent of AMI.
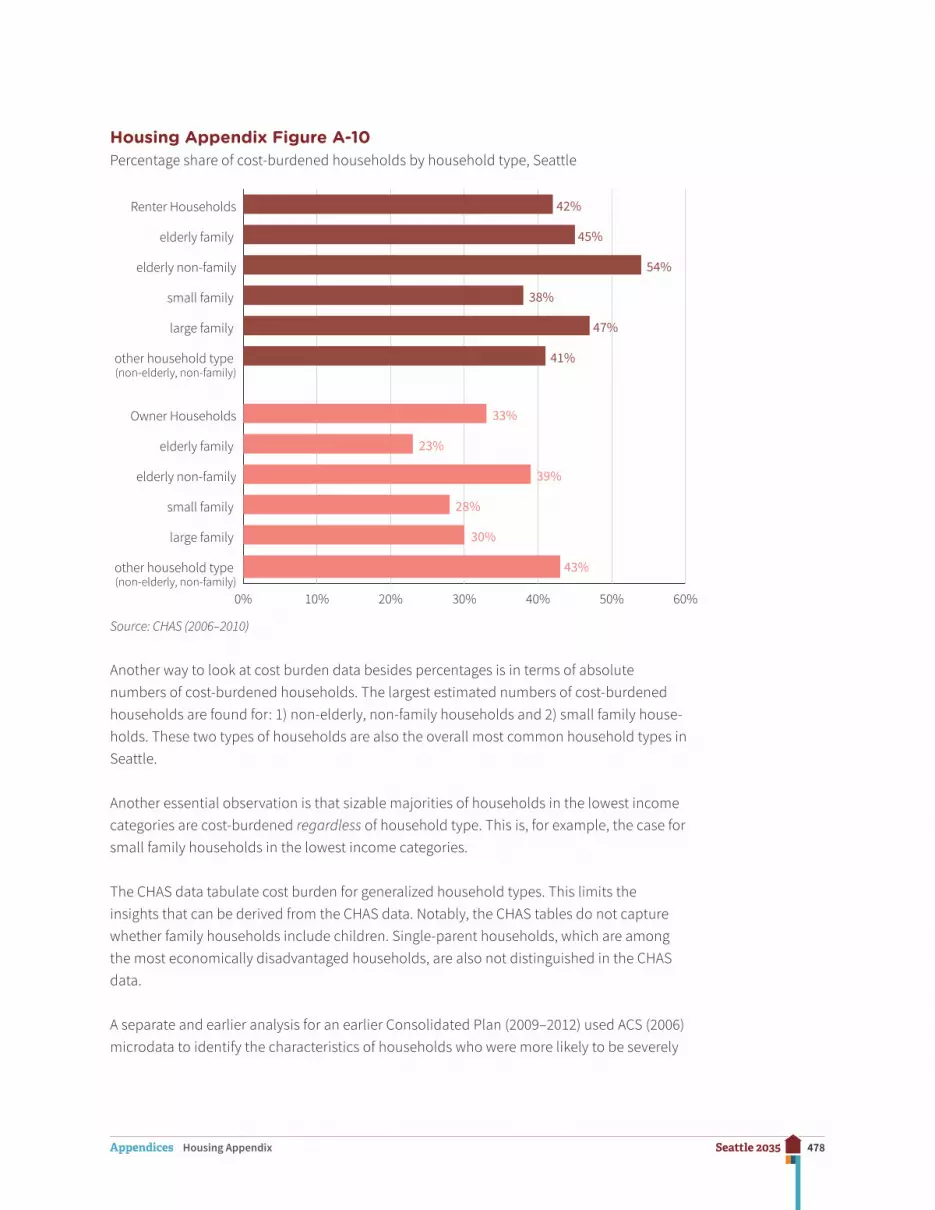
478Seattle 2035Appendices Housing Appendix
Housing Appendix Figure A-10 Percentage share of cost-burdened households by household type, Seattle
0% 10% 20% 30% 40% 50% 60%
other household type (non-elderly, non-family)
large family
small family
elderly non-family
elderly family
Owner Households
other household type (non-elderly, non-family)
large family
small family
elderly non-family
elderly family
Renter Households
43%
30%
28%
39%
23%
33%
41%
47%
38%
54%
45%
42%
Source: CHAS (2006–2010)
Another way to look at cost burden data besides percentages is in terms of absolute numbers of cost-burdened households. The largest estimated numbers of cost-burdened households are found for: 1) non-elderly, non-family households and 2) small family house-holds. These two types of households are also the overall most common household types in Seattle.
Another essential observation is that sizable majorities of households in the lowest income categories are cost-burdened regardless of household type. This is, for example, the case for small family households in the lowest income categories.
The CHAS data tabulate cost burden for generalized household types. This limits the insights that can be derived from the CHAS data. Notably, the CHAS tables do not capture whether family households include children. Single-parent households, which are among the most economically disadvantaged households, are also not distinguished in the CHAS data.
A separate and earlier analysis for an earlier Consolidated Plan (2009–2012) used ACS (2006) microdata to identify the characteristics of households who were more likely to be severely

479Seattle 2035Appendices Housing Appendix
cost-burdened. That analysis included some household categories not isolated in the CHAS tabulations and found that households in which there was a female single parent, and households composed of a family with two or more children, were among the groups of renter households disproportionately likely to be shouldering severe housing cost burdens.
Household cost burdens are a key indicator of affordability problems within a community but must be considered in context of other housing data and in light of broader regional demographics. Cost burden data provided for Seattle households only refer to those house-holds living within the city and are blind to the housing needs of households who may wish to live in Seattle, but have located outside of the city of Seattle likely due to affordability considerations.
For example, family households with children are a demographic substantially underrepre-sented in Seattle relative to the region. As previously noted, the population of color under eighteen in Seattle is increasing much more slowly than this population segment is increas-ing in the remainder of King County. These factors suggest that Seattle’s housing affordabil-ity challenges may be affecting the locational decisions made by families with children and families of color.
Maps Showing Selected Household Characteristics
HUD’s Community Planning and Development (CPD) Office provides an online set of map-ping tools for analyzing housing needs at the local and neighborhood level. Screenshots of selected CPD maps for census tracts in and around Seattle are included in several sections of this appendix. Maps showing household income and cost burden are in the subsections that follow immediately below, while maps about the affordability of the housing supply are included in Section G—Affordability of Seattle’s Overall Housing Supply.
The shading for the CPD maps in this appendix was generated using the default “natural breaks” setting for highlighting variation within a region. The resulting data ranges are differ-ent from one map to the other and are shown in the legend accompanying each map.
The CPD maps are based on the CHAS data collected from 2007 to 2011, which is a slightly later period than the period for other CHAS data analyzed in this appendix.11
Shares of Households by Income Category by Census Tract
The trio of maps (Housing Appendix Figures A-11, A-12, and A-13) that follow show estimat-ed shares of households within each census tract with incomes equal to or below three AMI-based income thresholds: 30 percent of AMI, 50 percent of AMI, and 80 percent of AMI.
11. The interactive CPD mapping tool is online at http://egis.hud.gov/cpdmaps/. More information about the tool and the data that populate the maps is available in the CPD Maps Desk Guide.
480Seattle 2035Appendices Housing Appendix
These maps reveal a great deal of variation between census tracts. In Seattle, the census tracts with the largest shares of lower-income households (meaning at or below 80 percent of AMI) tend to be in and around Seattle’s Downtown, the University District, in Delridge, and along Rainier Valley. A similar pattern applies to neighborhoods to the south, and slightly southeast, of Seattle’s city limits, where more than half of the households in many census tracts are lower income (at or below 80 percent of AMI).
There are also some census tracts in North Seattle where relatively large shares of house-holds are lower income (at or below 80 percent of AMI), i.e., in the Broadview/Bitter Lake area and in a grouping of tracts running from the Aurora-Licton Springs neighborhood through Northgate and into Lake City.
Census tracts where substantial shares of households have incomes no higher than 30 per-cent of AMI are smaller in number and found in more distinct concentrations in and around Seattle compared to the more diffuse patterns described above.
Prevalence of Housing Cost Burdens by Census Tract
Housing Appendix Figure A-14 shows the estimated percentages of households in each census tract with housing costs that are more than 30 percent of their income. Not surpris-ingly, high percentages of cost-burdened households are found in many of the census tracts where there are large shares of lower-income households.

481Seattle 2035Appendices Housing Appendix
Housing Appendix Figure A-11Share of Households with Income at or Below 30 Percent of AMI
Source: CHAS (2007–2011)
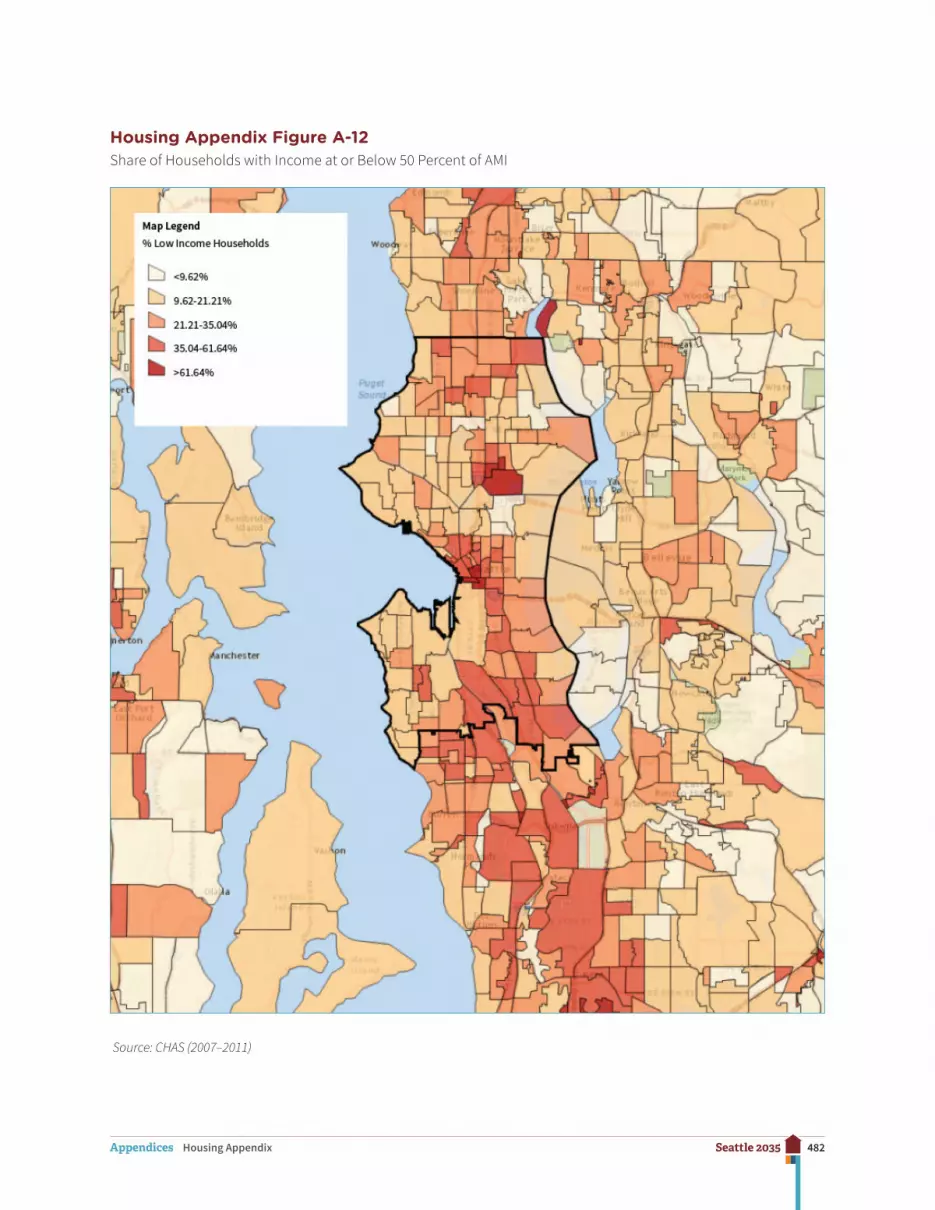
482Seattle 2035Appendices Housing Appendix
Housing Appendix Figure A-12Share of Households with Income at or Below 50 Percent of AMI
Source: CHAS (2007–2011)

483Seattle 2035Appendices Housing Appendix
Housing Appendix Figure A-13Share of Households with Income at or Below 80 Percent of AMI
Source: CHAS (2007–2011)

484Seattle 2035Appendices Housing Appendix
Housing Appendix Figure A-14Share of Households with Housing Cost Burden
Source: CHAS (2007–2011)
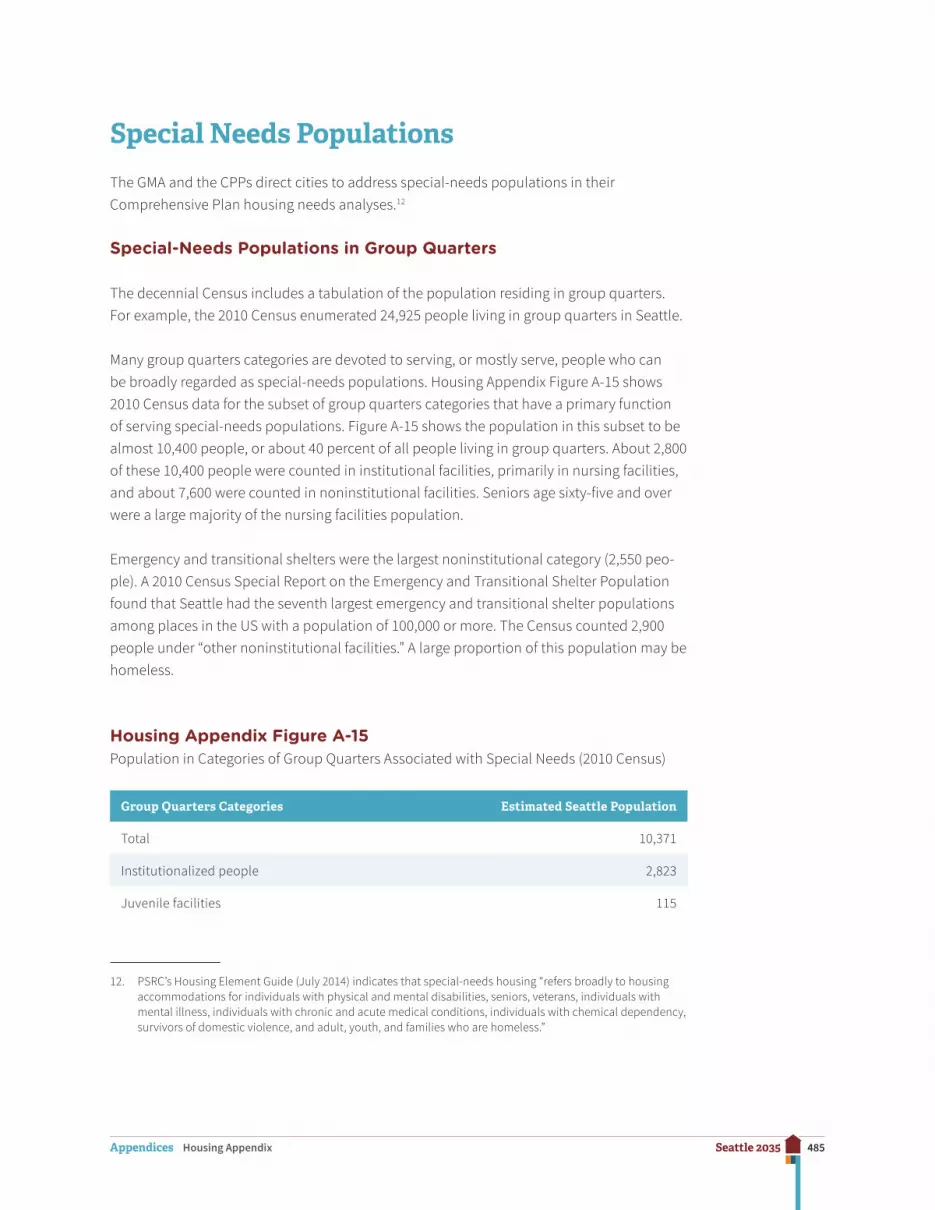
485Seattle 2035Appendices Housing Appendix
Special Needs Populations
The GMA and the CPPs direct cities to address special-needs populations in their Comprehensive Plan housing needs analyses.12
Special-Needs Populations in Group Quarters
The decennial Census includes a tabulation of the population residing in group quarters. For example, the 2010 Census enumerated 24,925 people living in group quarters in Seattle.
Many group quarters categories are devoted to serving, or mostly serve, people who can be broadly regarded as special-needs populations. Housing Appendix Figure A-15 shows 2010 Census data for the subset of group quarters categories that have a primary function of serving special-needs populations. Figure A-15 shows the population in this subset to be almost 10,400 people, or about 40 percent of all people living in group quarters. About 2,800 of these 10,400 people were counted in institutional facilities, primarily in nursing facilities, and about 7,600 were counted in noninstitutional facilities. Seniors age sixty-five and over were a large majority of the nursing facilities population.
Emergency and transitional shelters were the largest noninstitutional category (2,550 peo-ple). A 2010 Census Special Report on the Emergency and Transitional Shelter Population found that Seattle had the seventh largest emergency and transitional shelter populations among places in the US with a population of 100,000 or more. The Census counted 2,900 people under “other noninstitutional facilities.” A large proportion of this population may be homeless.
Housing Appendix Figure A-15Population in Categories of Group Quarters Associated with Special Needs (2010 Census)
Group Quarters Categories Estimated Seattle Population
Total 10,371
Institutionalized people 2,823
Juvenile facilities 115
12. PSRC’s Housing Element Guide (July 2014) indicates that special-needs housing “refers broadly to housing accommodations for individuals with physical and mental disabilities, seniors, veterans, individuals with mental illness, individuals with chronic and acute medical conditions, individuals with chemical dependency, survivors of domestic violence, and adult, youth, and families who are homeless.”

486Seattle 2035Appendices Housing Appendix
Group Quarters Categories Estimated Seattle Population
Group homes for juveniles (noncorrectional) 58
Residential treatment centers for juveniles (noncorrectional) 57
Nursing facilities/Skilled-nursing facilities 2,588
Other institutional facilities 120
Mental (psychiatric) hospitals and psychiatric units in other hospitals
53
Hospitals with patients who have no usual home elsewhere 2
In-patient hospice facilities 65
Noninstitutionalized people: 7,548
Emergency and transitional shelters (with sleeping facilities) for homeless people
2,550
Group homes intended for adults 1,387
Residential treatment centers for adults 637
Workers’ group living quarters & Job Corps centers 70
Other noninstitutional facilities:
• Soup kitchens• Regularly scheduled mobile food vans• Targeted nonsheltered outdoor locations• Living quarters for victims of natural disaster• Religious group quarters• Domestic violence shelters
2,904
Source: 2010 Census
Homeless People from One Night Count and Agency Data
One night each January a count of homeless people is conducted at locations in Seattle and elsewhere in King County to identify the extent and nature of homelessness. The One Night Count has two components: a count of unsheltered homeless, which is conducted by the Seattle/King County Coalition on Homelessness, and a count (by agency staff) of people being served that same night in emergency shelters and transitional housing programs. Agency staff also collect information about those people being served.
Unsheltered Homeless
Housing Appendix Figure A-16 summarizes the gender, age, and location of unsheltered homeless people counted during the January 2016 One Night Count in locations within
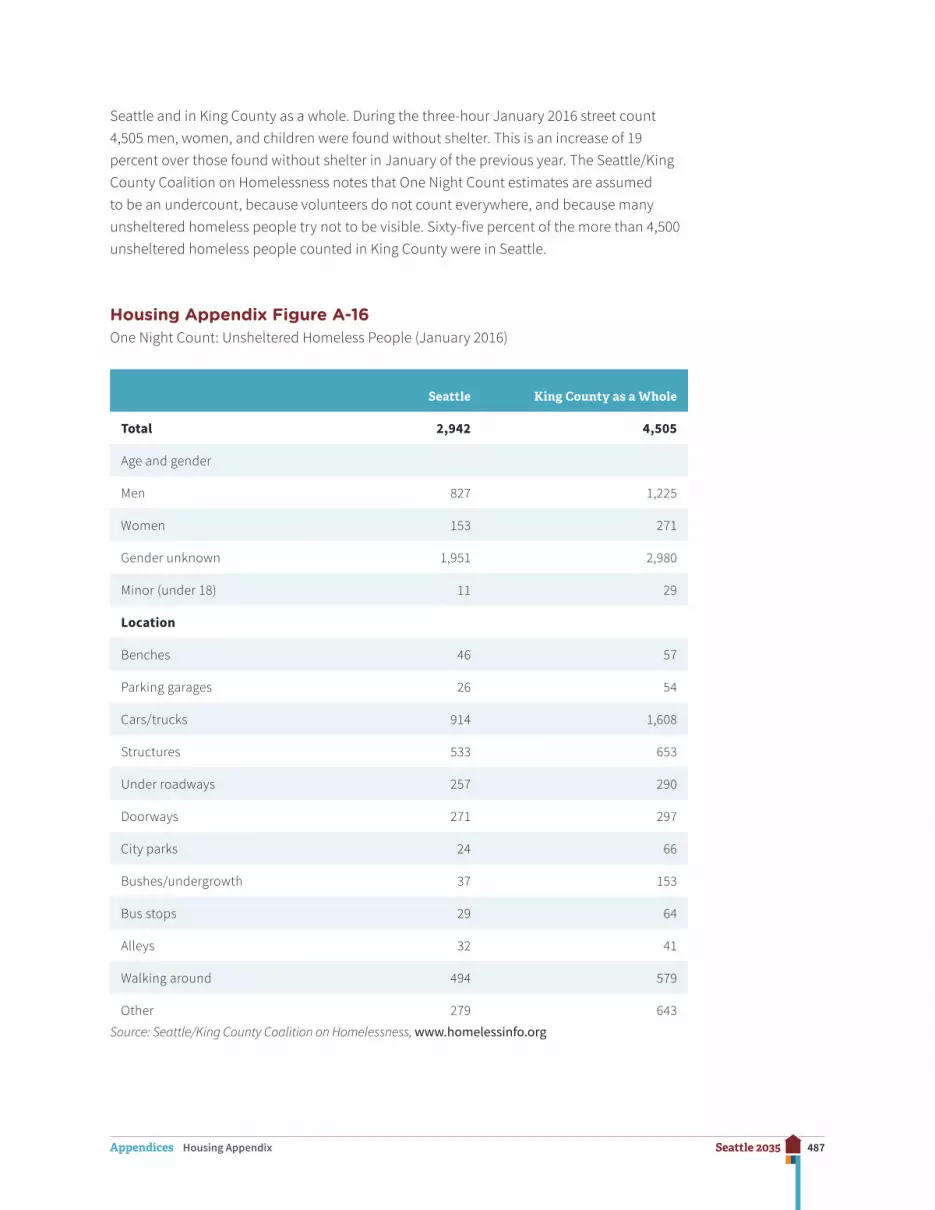
487Seattle 2035Appendices Housing Appendix
Seattle and in King County as a whole. During the three-hour January 2016 street count 4,505 men, women, and children were found without shelter. This is an increase of 19 percent over those found without shelter in January of the previous year. The Seattle/King County Coalition on Homelessness notes that One Night Count estimates are assumed to be an undercount, because volunteers do not count everywhere, and because many unsheltered homeless people try not to be visible. Sixty-five percent of the more than 4,500 unsheltered homeless people counted in King County were in Seattle.
Housing Appendix Figure A-16One Night Count: Unsheltered Homeless People (January 2016)
Seattle King County as a Whole
Total 2,942 4,505
Age and gender
Men 827 1,225
Women 153 271
Gender unknown 1,951 2,980
Minor (under 18) 11 29
Location
Benches 46 57
Parking garages 26 54
Cars/trucks 914 1,608
Structures 533 653
Under roadways 257 290
Doorways 271 297
City parks 24 66
Bushes/undergrowth 37 153
Bus stops 29 64
Alleys 32 41
Walking around 494 579
Other 279 643
Source: Seattle/King County Coalition on Homelessness, www.homelessinfo.org
488Seattle 2035Appendices Housing Appendix
Sheltered Homeless
At the time this Housing Appendix was being written, the portion of the 2016 One Night Count focusing on the sheltered population had yet to be released. A previous homeless needs assessment, including the sheltered population, was included in the 2014–2017 Consolidated Plan.
As described in that plan, King County Community Services Division tabulates information about the sheltered homeless population for the One Night Count. This information indi-cated that the two largest demographic segments of the sheltered homeless population in King County are 1) people in families with children and 2) single adult men age twenty-five years or older. While members of families with children comprise the majority (69 percent) of the transitional housing population, single adult men are the majority (57 percent) in emergency shelters. A substantial number of people identified as veterans. Reporting on issues such as disabilities and health conditions is voluntary. The most commonly reported disabilities and health conditions reported were mental illness, alcohol or substance abuse, and physical disability.
During the course of the 2012 Annual Homeless Assessment Report (AHAR) reporting year, Seattle shelters participating in the Safe Harbors system assisted more than 7,486 people in single-individual shelters (for households without children) as well as more than 1,072 people within families with one or more children.
The Consolidated Plan highlights a number of key findings regarding the characteristics of the sheltered homeless population, including:
• Over half (58 percent) of the individuals in shelters for adults without children report having a disability.
• There were more than 643 children under the age of eighteen served in emergency shelters in Seattle, and over 43 percent of these were less than five years old.
• More than a third of the people in transitional housing programs for families with children were in a household with five or more people.
• People of color, particularly black/African Americans, are disproportionately represented among those who are homeless in the shelter/transitional housing system, representing 28 percent of people served in single-adult emergency shelters and 71 percent of people served in family shelters.
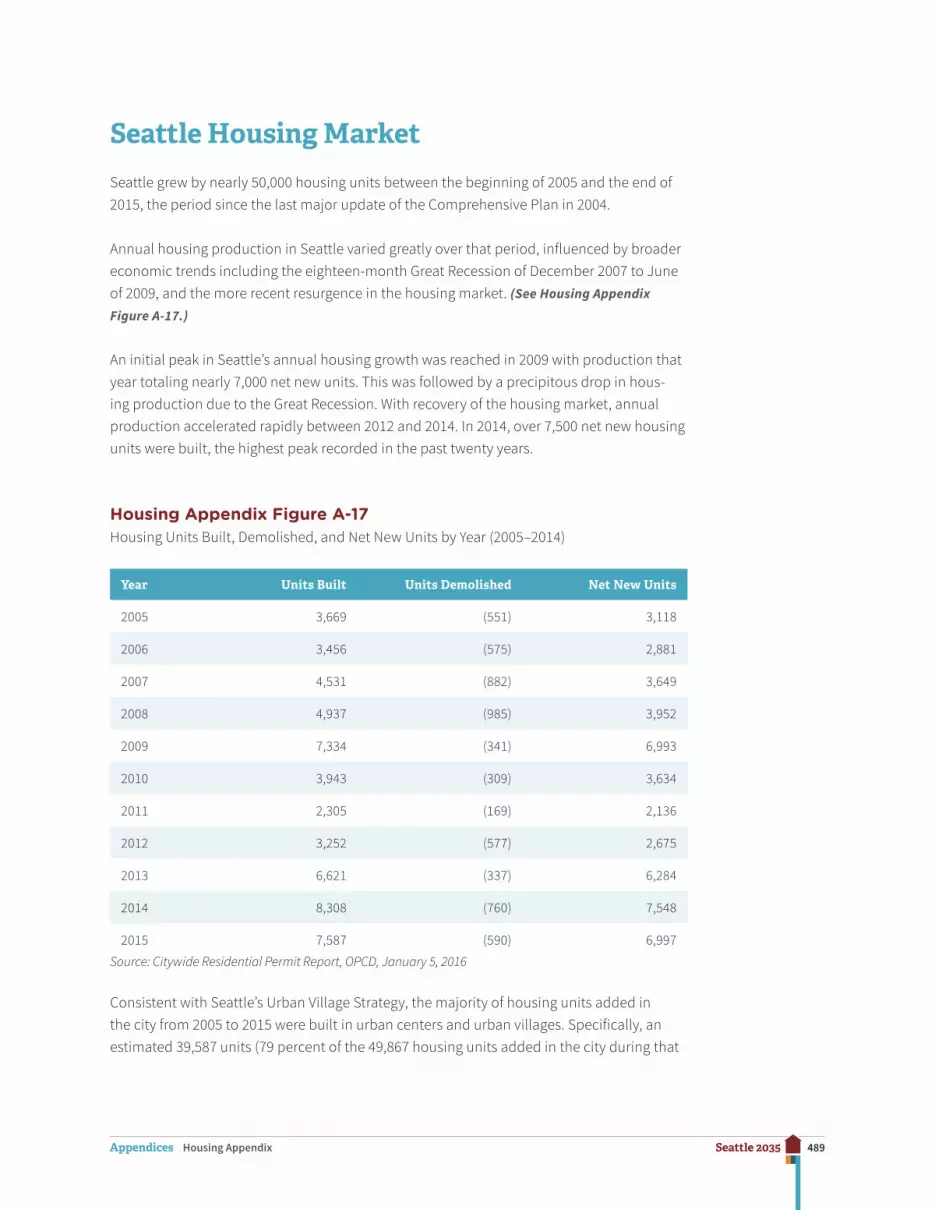
489Seattle 2035Appendices Housing Appendix
Seattle Housing Market
Seattle grew by nearly 50,000 housing units between the beginning of 2005 and the end of 2015, the period since the last major update of the Comprehensive Plan in 2004.
Annual housing production in Seattle varied greatly over that period, influenced by broader economic trends including the eighteen-month Great Recession of December 2007 to June of 2009, and the more recent resurgence in the housing market. (See Housing Appendix Figure A-17.)
An initial peak in Seattle’s annual housing growth was reached in 2009 with production that year totaling nearly 7,000 net new units. This was followed by a precipitous drop in hous-ing production due to the Great Recession. With recovery of the housing market, annual production accelerated rapidly between 2012 and 2014. In 2014, over 7,500 net new housing units were built, the highest peak recorded in the past twenty years.
Housing Appendix Figure A-17Housing Units Built, Demolished, and Net New Units by Year (2005–2014)
Year Units Built Units Demolished Net New Units
2005 3,669 (551) 3,118
2006 3,456 (575) 2,881
2007 4,531 (882) 3,649
2008 4,937 (985) 3,952
2009 7,334 (341) 6,993
2010 3,943 (309) 3,634
2011 2,305 (169) 2,136
2012 3,252 (577) 2,675
2013 6,621 (337) 6,284
2014 8,308 (760) 7,548
2015 7,587 (590) 6,997
Source: Citywide Residential Permit Report, OPCD, January 5, 2016
Consistent with Seattle’s Urban Village Strategy, the majority of housing units added in the city from 2005 to 2015 were built in urban centers and urban villages. Specifically, an estimated 39,587 units (79 percent of the 49,867 housing units added in the city during that

490Seattle 2035Appendices Housing Appendix
period) were built in urban centers and urban villages. This includes the addition of 23,186 units (46 percent of the city’s total growth) in urban centers and the 16,429 units (33 percent of the city’s total growth) in urban villages outside of centers.13
Owner Housing Market
Housing Appendix Figure A-18 provides a key to the eight NWMLS market areas in Seattle referred to in Housing Appendix Figures A-19, A-20, and A-21.
Housing Appendix Figures A-19 to A-21 provide data on median sales prices for closed sales from 2005 through 2014 for these areas. The home sales reflected in these Housing Appendix Figures include condominiums as well as other homes. Note that in the Downtown submarket area (#701), condominiums comprise 100 percent of home sales. Prices in all Housing Appendix Figures are inflation-adjusted to 2014 dollars.
Housing Appendix Figure A-18Key to NWMLS Market Areas in Seattle
# Area
140 West Seattle
380 Central Seattle SE, Leschi, Mt Baker, Seward Park
385 Central Seattle SW, Beacon Hill
390 Central Seattle, Madison Park, Capitol Hill
700 Queen Anne, Magnolia
701 Downtown Seattle
705 Ballard, Greenlake, Greenwood
710 North Seattle
Source: NWMLS King County statistical report for December 2014
As reflected in Housing Appendix Figure A-19, median sale prices in years following the Great Recession increased more slowly in South Seattle compared to the rest of the city. Median sale prices for 2014 were lower in the NWMLS market areas of West Seattle (area #140), Southeast Seattle (area #380), and Beacon Hill (area #385) compared to their previous peak highs in 2006 or 2007.
13. Source: Urban Center/Village Residential Growth Report, OPCD, January 5, 2016.

491Seattle 2035Appendices Housing Appendix
Housing Appendix Figure A-19Median Sales Price for Residential Sales, Including Condos (NWMLS Area)
NWMLS area 2014 2013 2012 2011 2010 2009 2008 2007 2006 2005
140 $400K $382K $339K $315K $374K $376K $427K $459K $462K $431K
380 $391K $361K $309K $312K $354K $370K $410K $456K $450K $406K
385 $340K $326K $266K $269K $322K $343K $385K $434K $415K $380K
390 $660K $630K $618K $538K $562K $544K $608K $673K $687K $657K
700 $710K $663K $582K $558K $636K $615K $701K $770K $767K $710K
701* $- $728K $340K $- $- $1.3M $- $793K $1M $653K
705 $512K $475K $438K $422K $450K $435K $493K $548K $533K $492K
710 $510K $479K $456K $433K $475K $465K $520K $570K $549K $516K
Source: NWMLS King County statistical report for December 2005 through 2014 (December 2014) *Some data not shown in NWMLS report.
Housing Appendix Figure A-20 shows how median sale prices for new construction homes compare to the median sale prices for all residential sales in Seattle’s submarkets. Based on NWMLS data for total residential sales closing in 2014, most market areas are showing substantially higher median sales prices for new construction homes.
Housing Appendix Figure A-20New Construction Residential Sales (Compared to All Residential Sales)
NWMLS Submarket Area
New Construction: Median Sale Price Compared to All Residential Sales
New Construction: Share of Total Residential Sales
140 11% higher 11%
380 27% higher 9%
385 42% higher 9%
390 2% lower 11%
700 1% lower 6%
705 19% higher 4%
710 27% higher 11%
Source: NWMLS King County statistical report (December 2014)

492Seattle 2035Appendices Housing Appendix
Housing Appendix Figure A-21 displays median sales prices for new construction homes (again, including condominiums). Median sales prices for new-construction homes dipped after the Great Recession in all submarkets, but increased substantially in 2013 and 2014 in five of the seven neighborhood market areas outside of Downtown Seattle (area #701). Median sales prices in 2014 were still lower in the Southwest Seattle/Beacon Hill (area #385) and Queen Anne/Magnolia (area #700) market areas compared to 2006 peaks.
Housing Appendix Figure A-21Median Sales Price by Seattle NWMLS Market Area for New-Construction Residential Sales, Including New-Construction Condominiums
NWMLS Market Area 2014 2013 2012 2011 2010 2009 2008 2007 2006 2005
140 $444K $448K $309K $316K $358K $354K $411K $433K $444K $429K
380 $497K $474K $350K $317K $402K $401K $395K $445K $468K $465K
385 $482K $407K $313K $328K $422K $387K $471K $491K $498K $463K
390 $650K $662K $586K $370K $495K $522K $493K $541K $551K $466K
700 $700K $562K $590K $421K $488K $596K $625K $684K $782K $564K
701* $- $- $- $- $- $2.2M $- $- $- $-
705 $607K $564K $531K $364K $391K $381K $449K $467K $514K $429K
710 $650K $685K $457K $372K $396K $416K $437K $427K $580K $481K
Source: NWMLS King County statistical report for December 2005 through 2014 (December 2014) *Some data not shown in NWMLS report.
Rental Housing Market
Average rents for market-rate apartments in Seattle have increased and are substantially higher in fall 2014 compared to 2005. Although they dipped slightly following the Great Recession, average rents resumed rising in 2011. Average rents then rose at an accelerated pace from 2011 to 2014.
One-bedroom apartments are the most common size of apartment unit in Seattle. Between 2005 and 2014, the average rent for one-bedroom apartments increased an estimated 35 percent. In these units, the average rent as measured per net rentable square foot (NRSF) increased an estimated 27 percent (see Housing Appendix Figure A-22).
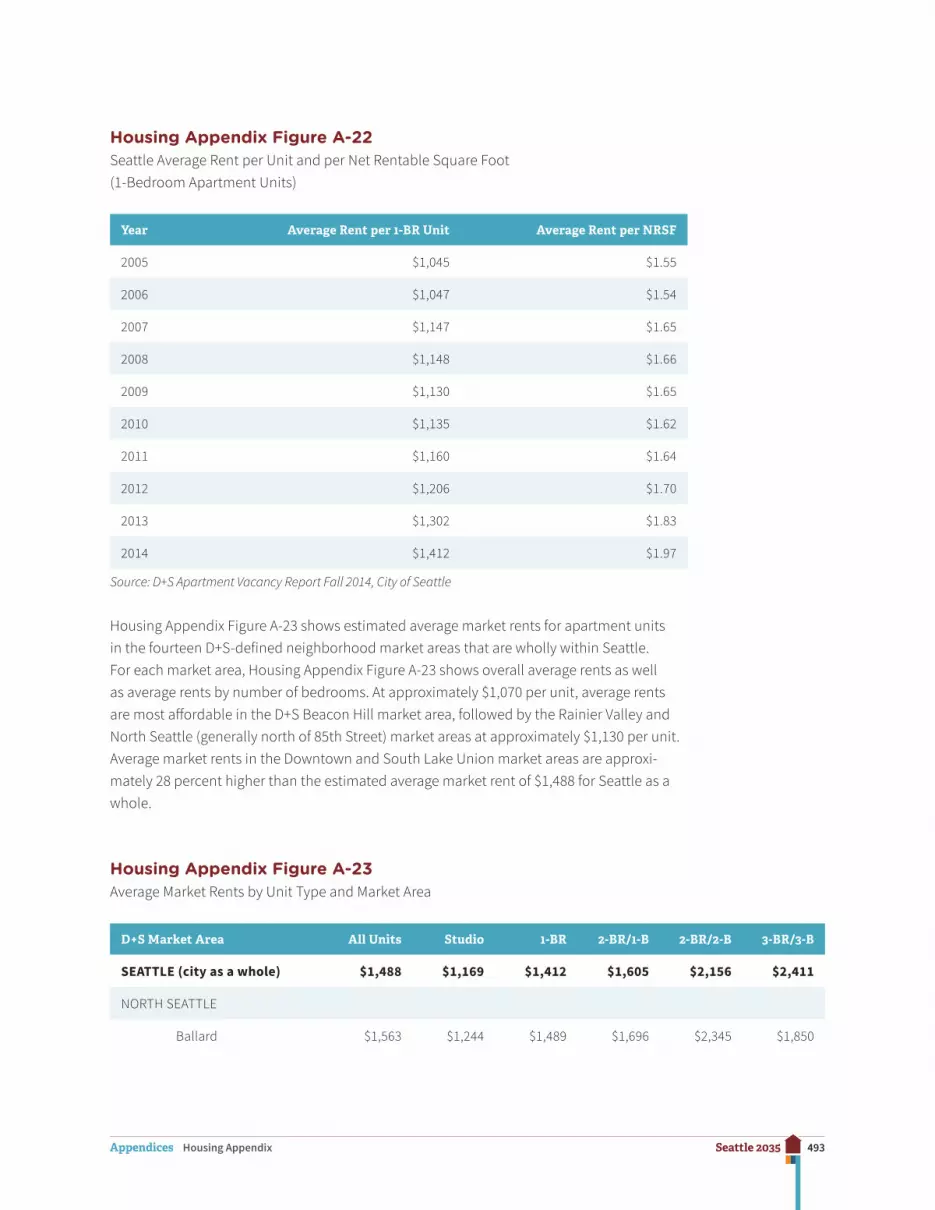
493Seattle 2035Appendices Housing Appendix
Housing Appendix Figure A-22Seattle Average Rent per Unit and per Net Rentable Square Foot (1-Bedroom Apartment Units)
Year Average Rent per 1-BR Unit Average Rent per NRSF
2005 $1,045 $1.55
2006 $1,047 $1.54
2007 $1,147 $1.65
2008 $1,148 $1.66
2009 $1,130 $1.65
2010 $1,135 $1.62
2011 $1,160 $1.64
2012 $1,206 $1.70
2013 $1,302 $1.83
2014 $1,412 $1.97
Source: D+S Apartment Vacancy Report Fall 2014, City of Seattle
Housing Appendix Figure A-23 shows estimated average market rents for apartment units in the fourteen D+S-defined neighborhood market areas that are wholly within Seattle. For each market area, Housing Appendix Figure A-23 shows overall average rents as well as average rents by number of bedrooms. At approximately $1,070 per unit, average rents are most affordable in the D+S Beacon Hill market area, followed by the Rainier Valley and North Seattle (generally north of 85th Street) market areas at approximately $1,130 per unit. Average market rents in the Downtown and South Lake Union market areas are approxi-mately 28 percent higher than the estimated average market rent of $1,488 for Seattle as a whole.
Housing Appendix Figure A-23Average Market Rents by Unit Type and Market Area
D+S Market Area All Units Studio 1-BR 2-BR/1-B 2-BR/2-B 3-BR/3-B
SEATTLE (city as a whole) $1,488 $1,169 $1,412 $1,605 $2,156 $2,411
NORTH SEATTLE
Ballard $1,563 $1,244 $1,489 $1,696 $2,345 $1,850
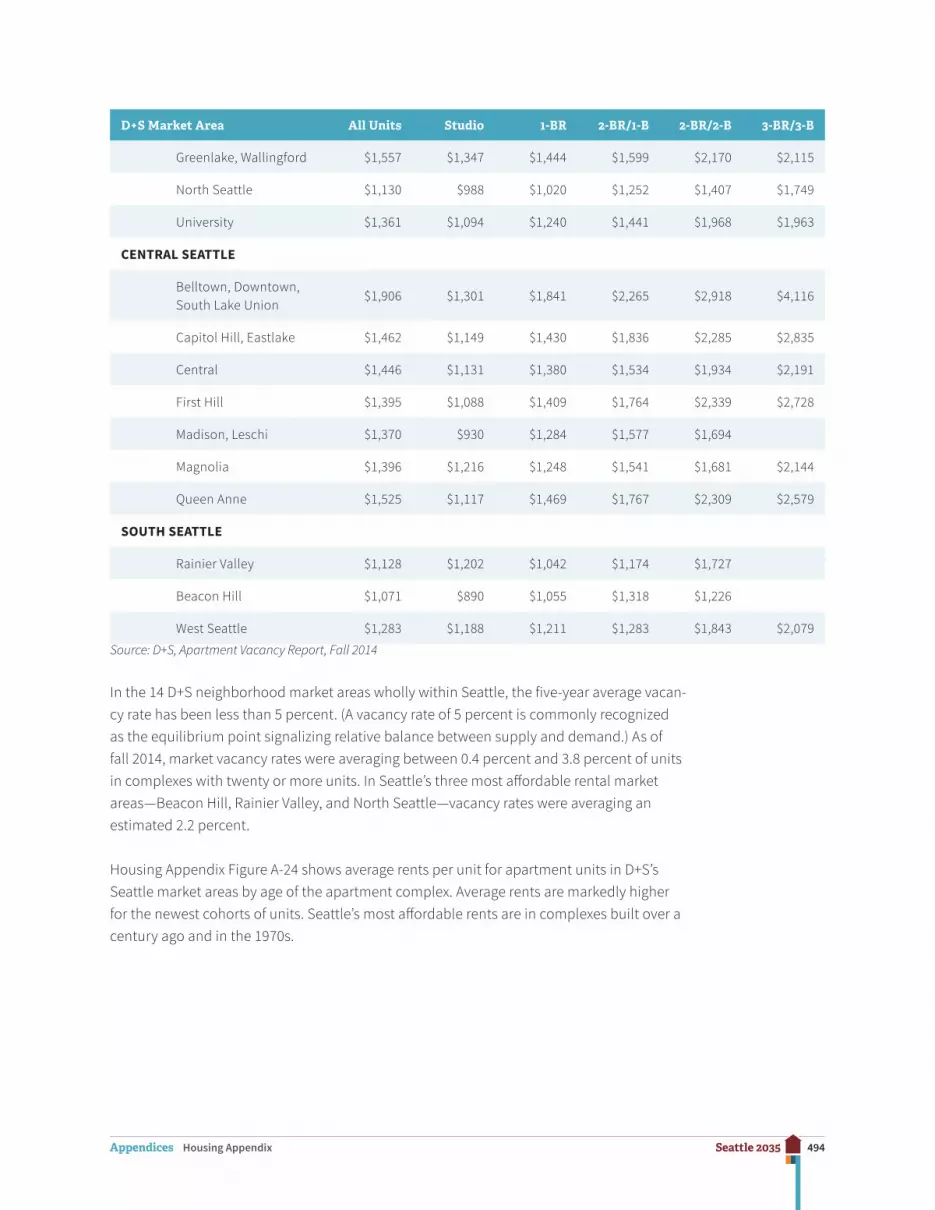
494Seattle 2035Appendices Housing Appendix
D+S Market Area All Units Studio 1-BR 2-BR/1-B 2-BR/2-B 3-BR/3-B
Greenlake, Wallingford $1,557 $1,347 $1,444 $1,599 $2,170 $2,115
North Seattle $1,130 $988 $1,020 $1,252 $1,407 $1,749
University $1,361 $1,094 $1,240 $1,441 $1,968 $1,963
CENTRAL SEATTLE
Belltown, Downtown, South Lake Union
$1,906 $1,301 $1,841 $2,265 $2,918 $4,116
Capitol Hill, Eastlake $1,462 $1,149 $1,430 $1,836 $2,285 $2,835
Central $1,446 $1,131 $1,380 $1,534 $1,934 $2,191
First Hill $1,395 $1,088 $1,409 $1,764 $2,339 $2,728
Madison, Leschi $1,370 $930 $1,284 $1,577 $1,694
Magnolia $1,396 $1,216 $1,248 $1,541 $1,681 $2,144
Queen Anne $1,525 $1,117 $1,469 $1,767 $2,309 $2,579
SOUTH SEATTLE
Rainier Valley $1,128 $1,202 $1,042 $1,174 $1,727
Beacon Hill $1,071 $890 $1,055 $1,318 $1,226
West Seattle $1,283 $1,188 $1,211 $1,283 $1,843 $2,079
Source: D+S, Apartment Vacancy Report, Fall 2014
In the 14 D+S neighborhood market areas wholly within Seattle, the five-year average vacan-cy rate has been less than 5 percent. (A vacancy rate of 5 percent is commonly recognized as the equilibrium point signalizing relative balance between supply and demand.) As of fall 2014, market vacancy rates were averaging between 0.4 percent and 3.8 percent of units in complexes with twenty or more units. In Seattle’s three most affordable rental market areas—Beacon Hill, Rainier Valley, and North Seattle—vacancy rates were averaging an estimated 2.2 percent.
Housing Appendix Figure A-24 shows average rents per unit for apartment units in D+S’s Seattle market areas by age of the apartment complex. Average rents are markedly higher for the newest cohorts of units. Seattle’s most affordable rents are in complexes built over a century ago and in the 1970s.
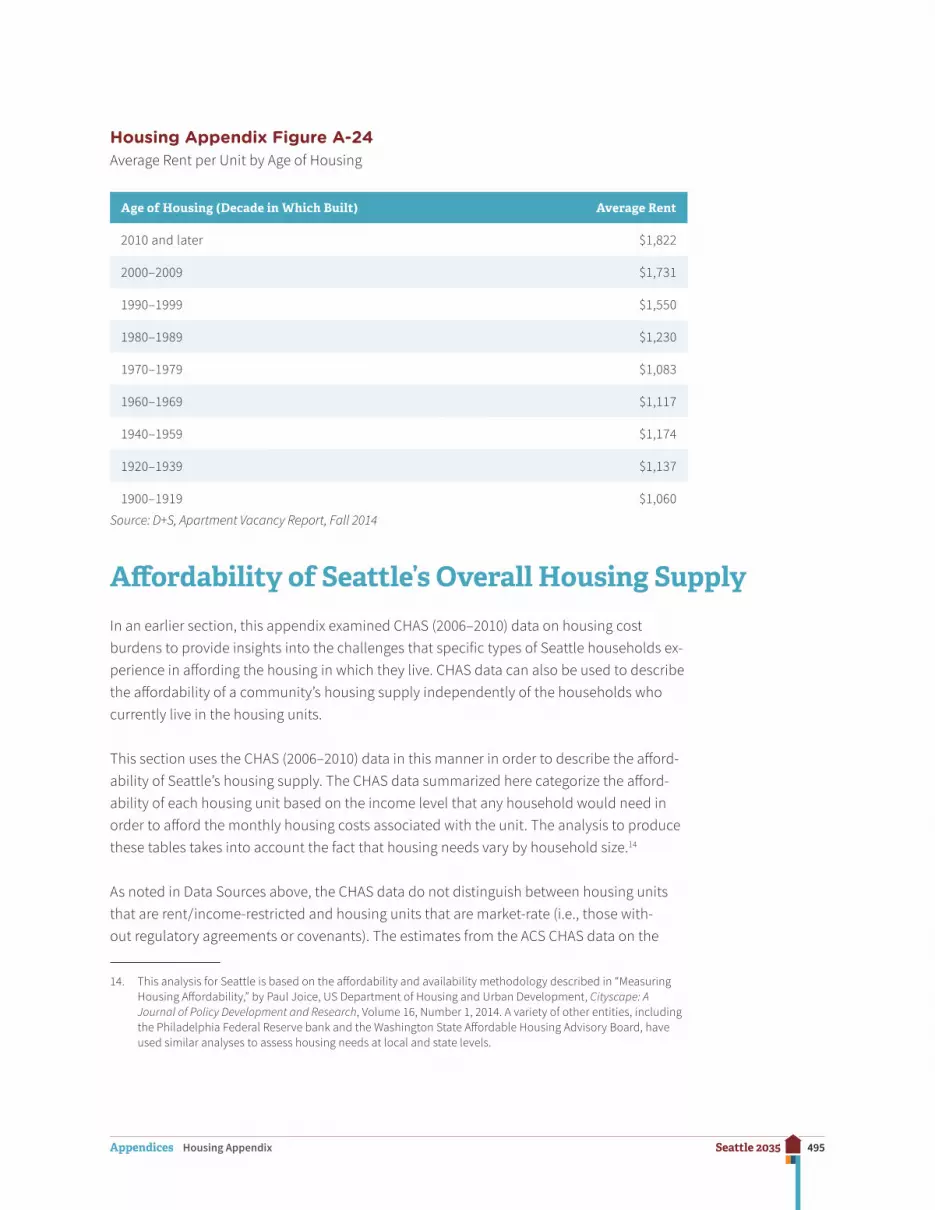
495Seattle 2035Appendices Housing Appendix
Housing Appendix Figure A-24Average Rent per Unit by Age of Housing
Age of Housing (Decade in Which Built) Average Rent
2010 and later $1,822
2000–2009 $1,731
1990–1999 $1,550
1980–1989 $1,230
1970–1979 $1,083
1960–1969 $1,117
1940–1959 $1,174
1920–1939 $1,137
1900–1919 $1,060
Source: D+S, Apartment Vacancy Report, Fall 2014
Affordability of Seattle’s Overall Housing Supply
In an earlier section, this appendix examined CHAS (2006–2010) data on housing cost burdens to provide insights into the challenges that specific types of Seattle households ex-perience in affording the housing in which they live. CHAS data can also be used to describe the affordability of a community’s housing supply independently of the households who currently live in the housing units.
This section uses the CHAS (2006–2010) data in this manner in order to describe the afford-ability of Seattle’s housing supply. The CHAS data summarized here categorize the afford-ability of each housing unit based on the income level that any household would need in order to afford the monthly housing costs associated with the unit. The analysis to produce these tables takes into account the fact that housing needs vary by household size.14
As noted in Data Sources above, the CHAS data do not distinguish between housing units that are rent/income-restricted and housing units that are market-rate (i.e., those with-out regulatory agreements or covenants). The estimates from the ACS CHAS data on the
14. This analysis for Seattle is based on the affordability and availability methodology described in “Measuring Housing Affordability,” by Paul Joice, US Department of Housing and Urban Development, Cityscape: A Journal of Policy Development and Research, Volume 16, Number 1, 2014. A variety of other entities, including the Philadelphia Federal Reserve bank and the Washington State Affordable Housing Advisory Board, have used similar analyses to assess housing needs at local and state levels.

496Seattle 2035Appendices Housing Appendix
affordability of Seattle’s housing supply refer to affordability in a broad sense; units tabulat-ed as affordable to households at specified income levels may include market-rate as well as rent/income-restricted housing.
Affordability of Owner Units
In order to represent the monthly costs associated with an owner-housing unit in a way that is independent of any household currently in the unit, the CHAS tabulations simulate a situation in which a household has recently purchased the unit and is making payments on an FHA-insured, thirty-year mortgage under prevailing interest rates.15 In the CHAS tabula-tions, HUD considers monthly mortgage payments to be affordable at a given income level when these payments consume no more than 31 percent of monthly income. The analytical approach reflected in these tabulations provides a useful, but limited picture of ownership housing affordability in Seattle.16
For owner units, the CHAS data estimates the number of owner units affordable with household incomes of 0–50 percent of AMI, 50–80 percent of AMI, 80–100 percent of AMI, and above 100 percent of AMI. Housing Appendix Figure A-25 shows the estimated number of owner units in Seattle that are affordable within each of these affordability categories. Cumulative estimates are also shown for units affordable with household incomes at or below 80 percent AMI, and units affordable at or below 100 percent of AMI. Occupied owner units and vacant for-sale units are shown in separate columns and summed in the third column.
The analysis shows that very small numbers of owner units are affordable within the income categories of 0–50 percent of AMI and 50–80 percent of AMI. On a cumulative basis, only about 4,500 owner units, or 3 percent of the total owner units, are estimated to be afford-able at or below 80 percent of AMI. Another 5 percent are estimated to be affordable at 80–100 percent of AMI.
15. CHAS tabulations on affordability of owner units use the home value that respondents provided on the ACS questionnaire. To categorize owner units by affordability, the CHAS tabulations assume that the hypothetical owner has purchased the home at a sales price equal to the home value provided in the ACS, and—as noted—is currently making mortgage payments.
16. CHAS tabulations on affordability of owner housing supply do not capture the ways that accumulation of equity in a home after purchase can affect a home’s affordability over time. These tabulations also ignore the question of whether the down payments involved would be affordable to households.
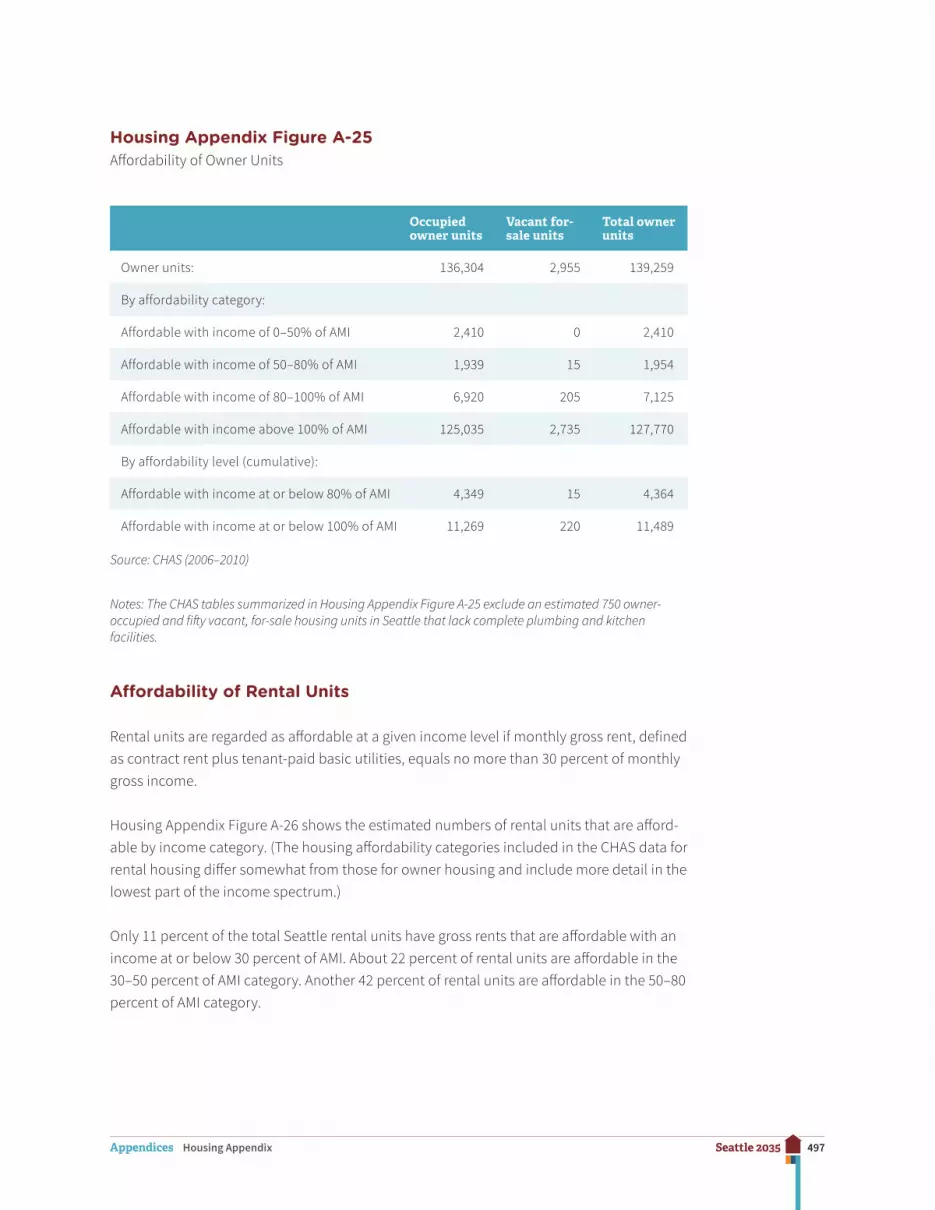
497Seattle 2035Appendices Housing Appendix
Housing Appendix Figure A-25Affordability of Owner Units
Occupied owner units
Vacant for-sale units
Total owner units
Owner units: 136,304 2,955 139,259
By affordability category:
Affordable with income of 0–50% of AMI 2,410 0 2,410
Affordable with income of 50–80% of AMI 1,939 15 1,954
Affordable with income of 80–100% of AMI 6,920 205 7,125
Affordable with income above 100% of AMI 125,035 2,735 127,770
By affordability level (cumulative):
Affordable with income at or below 80% of AMI 4,349 15 4,364
Affordable with income at or below 100% of AMI 11,269 220 11,489
Source: CHAS (2006–2010)
Notes: The CHAS tables summarized in Housing Appendix Figure A-25 exclude an estimated 750 owner-occupied and fifty vacant, for-sale housing units in Seattle that lack complete plumbing and kitchen facilities.
Affordability of Rental Units
Rental units are regarded as affordable at a given income level if monthly gross rent, defined as contract rent plus tenant-paid basic utilities, equals no more than 30 percent of monthly gross income.
Housing Appendix Figure A-26 shows the estimated numbers of rental units that are afford-able by income category. (The housing affordability categories included in the CHAS data for rental housing differ somewhat from those for owner housing and include more detail in the lowest part of the income spectrum.)
Only 11 percent of the total Seattle rental units have gross rents that are affordable with an income at or below 30 percent of AMI. About 22 percent of rental units are affordable in the 30–50 percent of AMI category. Another 42 percent of rental units are affordable in the 50–80 percent of AMI category.
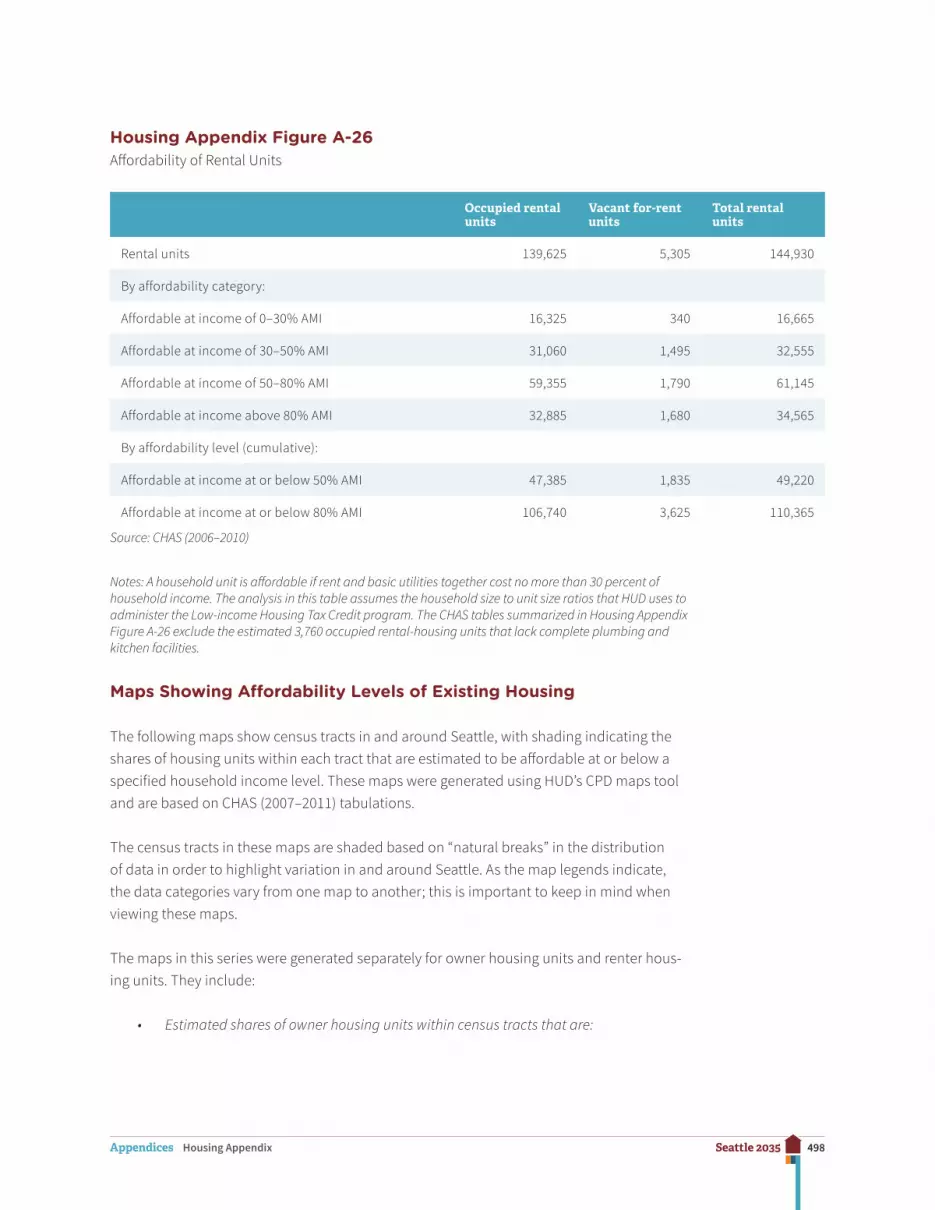
498Seattle 2035Appendices Housing Appendix
Housing Appendix Figure A-26Affordability of Rental Units
Occupied rental units
Vacant for-rent units
Total rental units
Rental units 139,625 5,305 144,930
By affordability category:
Affordable at income of 0–30% AMI 16,325 340 16,665
Affordable at income of 30–50% AMI 31,060 1,495 32,555
Affordable at income of 50–80% AMI 59,355 1,790 61,145
Affordable at income above 80% AMI 32,885 1,680 34,565
By affordability level (cumulative):
Affordable at income at or below 50% AMI 47,385 1,835 49,220
Affordable at income at or below 80% AMI 106,740 3,625 110,365
Source: CHAS (2006–2010)
Notes: A household unit is affordable if rent and basic utilities together cost no more than 30 percent of household income. The analysis in this table assumes the household size to unit size ratios that HUD uses to administer the Low-income Housing Tax Credit program. The CHAS tables summarized in Housing Appendix Figure A-26 exclude the estimated 3,760 occupied rental-housing units that lack complete plumbing and kitchen facilities.
Maps Showing Affordability Levels of Existing Housing
The following maps show census tracts in and around Seattle, with shading indicating the shares of housing units within each tract that are estimated to be affordable at or below a specified household income level. These maps were generated using HUD’s CPD maps tool and are based on CHAS (2007–2011) tabulations.
The census tracts in these maps are shaded based on “natural breaks” in the distribution of data in order to highlight variation in and around Seattle. As the map legends indicate, the data categories vary from one map to another; this is important to keep in mind when viewing these maps.
The maps in this series were generated separately for owner housing units and renter hous-ing units. They include:
• Estimated shares of owner housing units within census tracts that are:
499Seattle 2035Appendices Housing Appendix
− affordable at or below 80 percent of AMI (Housing Appendix Figure A-27) − affordable at or below 100 percent of AMI (Housing Appendix Figure A-28)
• Estimated shares of rental housing units within census tracts that are
− affordable at or below 30 percent of AMI (Housing Appendix Figure A-29) − affordable at or below 50 percent of AMI (Housing Appendix Figure A-30) − affordable at or below 80 percent of AMI (Housing Appendix Figure A-31)
As reflected in these maps, the affordability of housing varies a great deal between areas within Seattle and surrounding cities.
Shares of Owner Housing Units by Affordability Level
Owner units affordable at or below 80 percent of AMI are very scarce within Seattle and in neighboring cities east of Lake Washington. The vast majority of census tracts in Seattle and these Eastside cities are tracts where only 6 percent or fewer of the owner units are afford-able at or below 80 percent of AMI.
Owner units affordable at or below 100 percent of AMI are also scarce in most census tracts within Seattle and Eastside cities. Census tracts to the south of Seattle and to the north-east of Seattle have larger proportions of owner units affordable at or below these income thresholds.
Shares of Rental Housing Units by Affordability Level
The large majority of census tracts in and around Seattle have very low shares of rental units affordable at or below 30 percent of AMI. Rental units affordable at or below 50 percent of AMI make up 21 percent or less of the residential rental units in most Seattle census tracts. Within the mapped area, the largest shares of rental units affordable at or below 50 percent of AMI are primarily found in Southeast Seattle and south of Seattle.
Rental units affordable at or below 80 percent of AMI are notably more common in and around Seattle than are rental units affordable at or below the lower income thresholds. Still, rental units affordable at or below 80 percent of AMI make up well below half of the rental units in portions of Seattle and in large areas of neighboring cities to the east. Furthermore, units affordable at or below 80 percent of AMI make up large majorities of rental units in only a small number of census tracts, most of which are south of Seattle’s city limits.
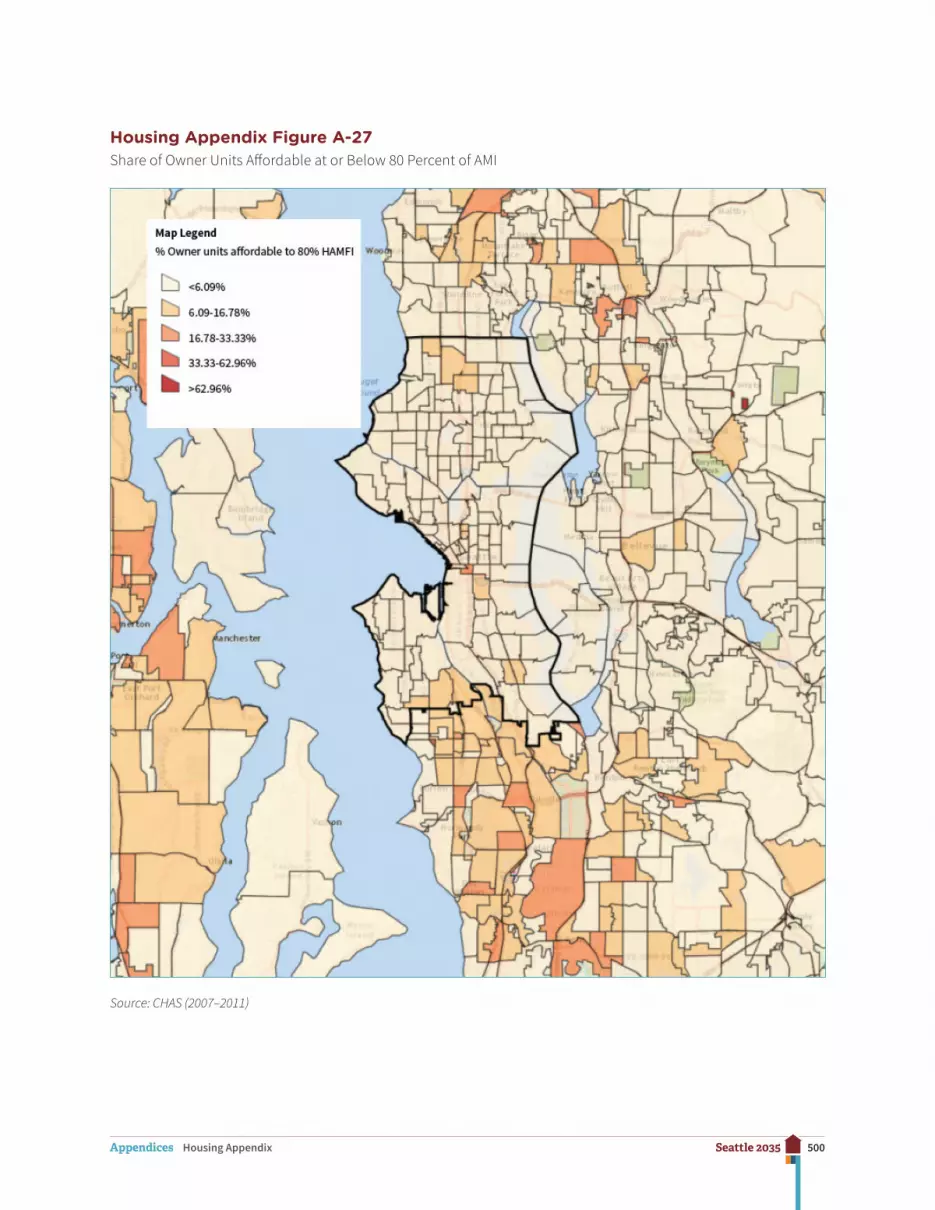
500Seattle 2035Appendices Housing Appendix
Housing Appendix Figure A-27Share of Owner Units Affordable at or Below 80 Percent of AMI
Source: CHAS (2007–2011)
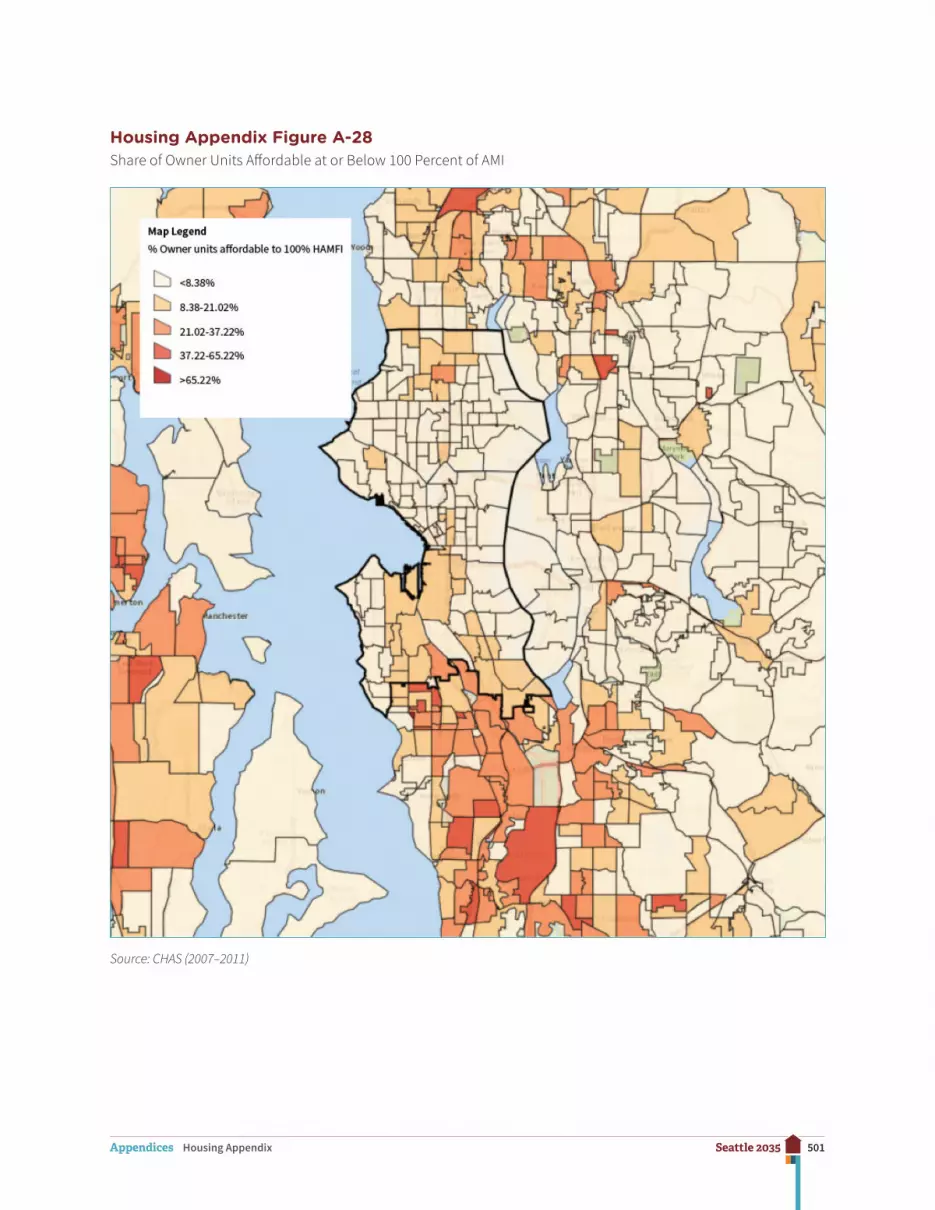
501Seattle 2035Appendices Housing Appendix
Housing Appendix Figure A-28Share of Owner Units Affordable at or Below 100 Percent of AMI
Source: CHAS (2007–2011)

502Seattle 2035Appendices Housing Appendix
Housing Appendix Figure A-29Share of Rental Units Affordable at or Below 30 Percent of AMI
Source: CHAS (2007–2011)
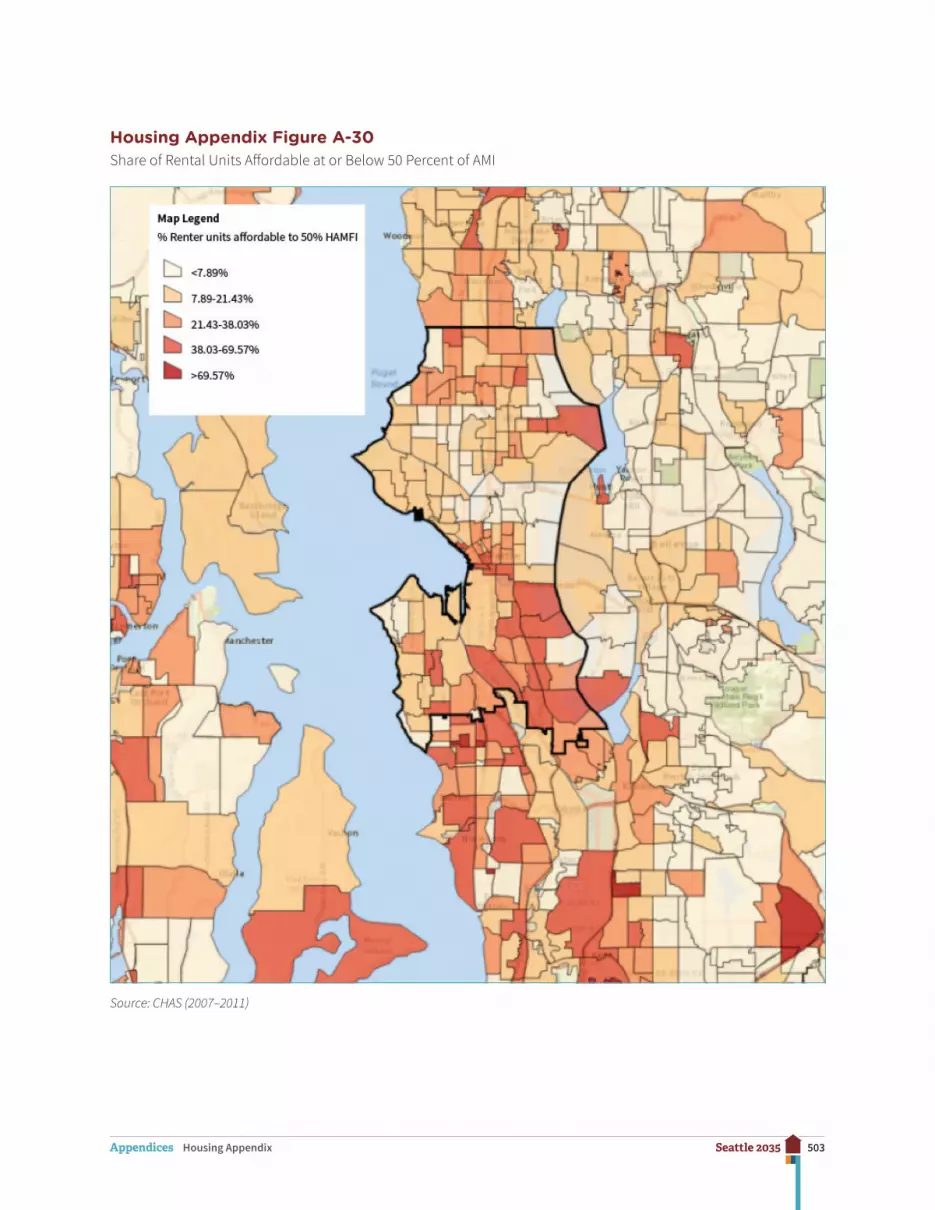
503Seattle 2035Appendices Housing Appendix
Housing Appendix Figure A-30Share of Rental Units Affordable at or Below 50 Percent of AMI
Source: CHAS (2007–2011)

504Seattle 2035Appendices Housing Appendix
Housing Appendix Figure A-31Share of Rental Units Affordable at or Below 80 Percent of AMI
Source: CHAS (2007–2011)
505Seattle 2035Appendices Housing Appendix
Affordability and Availability of Rental Units in Seattle
The city-level analysis of affordability presented earlier in this appendix used the CHAS (2006–2010) tabulations to estimate how much of Seattle’s overall rental housing supply is affordable within lower income categories. Those findings provide useful but incomplete information about the degree to which the current affordability profile of rental housing in Seattle meets existing needs.
As previously described, both market-rate and rent/income-restricted housing units are included in the CHAS data used to analyze affordability. This helps provide a broad picture of the affordability of rental housing in the city. At the same time, it is important to consider that market-rate rental units affordable at or below a given income threshold can be occu-pied by households with incomes higher than that threshold.
Understanding whether rental housing is affordable to renters requires finding out if hous-ing units affordable to households with incomes at or below the 30 percent, 50 percent, and 80 percent of AMI thresholds are actually available to households with incomes at or below these thresholds.
Therefore, this section dives deeper into the CHAS data to analyze the number of rental units both affordable and available to households at these income levels. In this analysis, units that are affordable are also considered available if they are either vacant or occupied by a household whose income is at or below the specified threshold.
Housing Appendix Figure A-32 shows the total number of renter households in each income category, the number of rental units with rents that are affordable in that category, and the number of those units that are occupied by households in that category. These numbers are used to estimate the effective shortage or surplus of affordable and available rental units that exists at or below each of the specified income levels.
For example, 5,300 of the roughly 16,665 (occupied or vacant) units “affordable” at or below 30 percent of AMI are occupied by a household with an income that is higher than 30 per-cent of AMI. Thus, although those 5,300 units are nominally affordable, they are not actually available to households with incomes at or below 30 percent of AMI.
That leaves roughly 11,365 affordable and available rental units (Housing Appendix Figure A-32, Row G) to serve approximately 34,820 renter households (Row A) and thus an effective shortage of approximately 23,455 units (Row I). This effective shortage is substantially worse than the nominal shortage of approximately 18,155 units (Row H) because the nominal shortage does not account for availability.
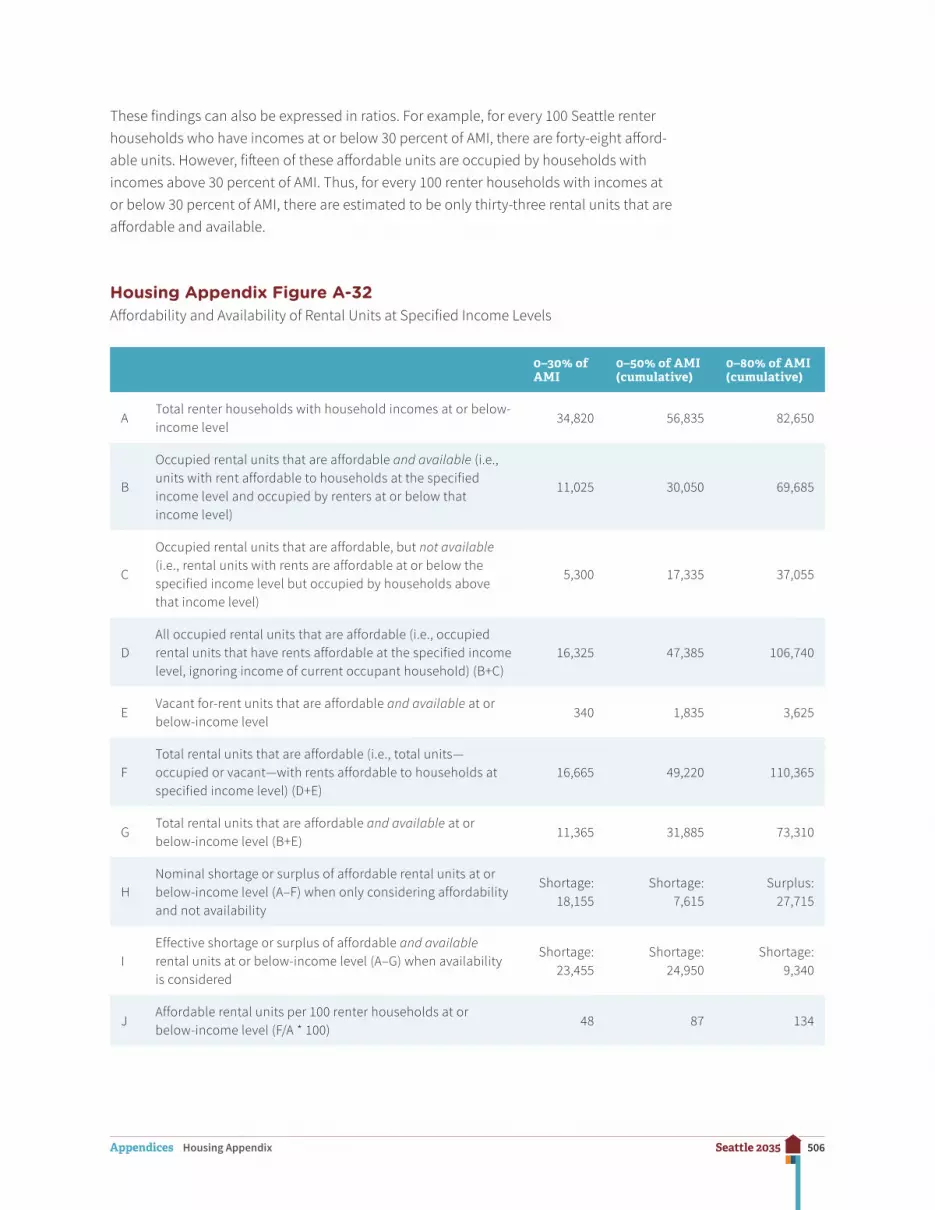
506Seattle 2035Appendices Housing Appendix
These findings can also be expressed in ratios. For example, for every 100 Seattle renter households who have incomes at or below 30 percent of AMI, there are forty-eight afford-able units. However, fifteen of these affordable units are occupied by households with incomes above 30 percent of AMI. Thus, for every 100 renter households with incomes at or below 30 percent of AMI, there are estimated to be only thirty-three rental units that are affordable and available.
Housing Appendix Figure A-32Affordability and Availability of Rental Units at Specified Income Levels
0–30% of AMI
0–50% of AMI (cumulative)
0–80% of AMI (cumulative)
ATotal renter households with household incomes at or below-income level
34,820 56,835 82,650
B
Occupied rental units that are affordable and available (i.e., units with rent affordable to households at the specified income level and occupied by renters at or below that income level)
11,025 30,050 69,685
C
Occupied rental units that are affordable, but not available (i.e., rental units with rents are affordable at or below the specified income level but occupied by households above that income level)
5,300 17,335 37,055
DAll occupied rental units that are affordable (i.e., occupied rental units that have rents affordable at the specified income level, ignoring income of current occupant household) (B+C)
16,325 47,385 106,740
EVacant for-rent units that are affordable and available at or below-income level
340 1,835 3,625
FTotal rental units that are affordable (i.e., total units—occupied or vacant—with rents affordable to households at specified income level) (D+E)
16,665 49,220 110,365
GTotal rental units that are affordable and available at or below-income level (B+E)
11,365 31,885 73,310
HNominal shortage or surplus of affordable rental units at or below-income level (A–F) when only considering affordability and not availability
Shortage: 18,155
Shortage: 7,615
Surplus: 27,715
IEffective shortage or surplus of affordable and available rental units at or below-income level (A–G) when availability is considered
Shortage: 23,455
Shortage: 24,950
Shortage: 9,340
JAffordable rental units per 100 renter households at or below-income level (F/A * 100)
48 87 134

507Seattle 2035Appendices Housing Appendix
0–30% of AMI
0–50% of AMI (cumulative)
0–80% of AMI (cumulative)
KAffordable and available rental units per 100 renter households at or below-income level (G/A * 100)
33 56 89
Source: CHAS (2006–2010). Notes: Housing estimated 3,760 occupied rental housing units and 300 vacant for-rent units that lack complete plumbing and kitchen facilities. The household estimates, however, encompass all renter households, including those who live in rental units lacking complete plumbing.
Examining affordability and availability reveals substantially larger gaps between existing rental supply and the need for housing at these income levels than the gaps found when considering affordability alone.
However, even this affordability and availability analysis in some ways underestimates un-met needs in Seattle for affordable housing.
• The estimated shortages of rental housing at each income threshold do not reveal the likely variation in the size of shortages within each of the constituent income ranges under the threshold. For example, the size of the shortage confronted by households at 60 percent of AMI is likely closer to the shortage found at 50 percent of AMI than it is to the shortage at 80 percent of AMI; and this is likely the case even though 60 percent of AMI is under the same income range as 80 percent of AMI.17
• Rents in Seattle have risen substantially since the 2006–2010 period captured in the analysis summarized by Housing Appendix Figure A-32.
• This affordability and availability analysis only addresses rental housing and renter households.18 The information presented in earlier sections on the affordability of owner housing and the high prevalence of housing cost burdens among lower-income households are indicators that, similarly, there is scant availability of owner housing affordable to lower-income households, including households specifically in the low-income category.
• The households in the analysis are limited to those living in housing units; as a result, the estimated shortages do not factor in the housing needs of homeless people in Seattle who are living on the streets or in temporary shelters.
17. Tabulations needed to estimate shortages at finer income increments are not provided in the CHAS dataset. However, other tabulations in the CHAS show that the estimated prevalence of cost burdens and other housing problems tends to be higher for households closer to the bottom than the top of the 30 percent to 50 percent of AMI range as well as closer to the bottom than the top of the 50 percent to 80 percent of AMI income range.
18. Results from a similar analysis of owner housing affordability and availability would be difficult to interpret due to the way that households pay for and consume owner-occupied housing over time, which is very differ-ent than the way renters pay for housing.

508Seattle 2035Appendices Housing Appendix
• Furthermore, the data used for this analysis—like much of the other data analyzed in this appendix—is only about Seattle households. This excludes households (such as those whose members work in Seattle) who may desire to live inside of Seattle but live in surrounding areas. Some households outside of Seattle likely do so to access housing they can afford.
Estimated Household Growth and Projected Housing Needs by Income Level
As described earlier in this appendix, the City is planning for the net addition of 70,000 households in the next twenty years. In order to project the amount of housing that will be needed by income level within the planning period, this analysis makes some simplifying assumptions.
Housing Appendix Figure A-33 takes the income distribution of Seattle’s existing house-holds, which is based on the income distribution found in the CHAS (2006–2010) estimates, and overlays this income distribution on the planned net new 70,000 households.
Assuming that the income distribution for the net new households would be the same as for existing Seattle households, Housing Appendix Figure A-33 shows that:
• approximately 15 percent (or about 10,500) of the 70,000 additional households would have incomes of 0–30 percent of AMI,
• an additional 11 percent of the 70,000 (about 7,500) would have incomes of 30–50 percent of AMI, and
• 14 percent (about 9,500) would have incomes of 50–80 percent of AMI.
On a cumulative basis, 26 percent (or 18,000) of the net new households would have in-comes at or below 50 percent of AMI, and 40 percent (or 28,000) would have incomes at or below 80 percent of AMI.
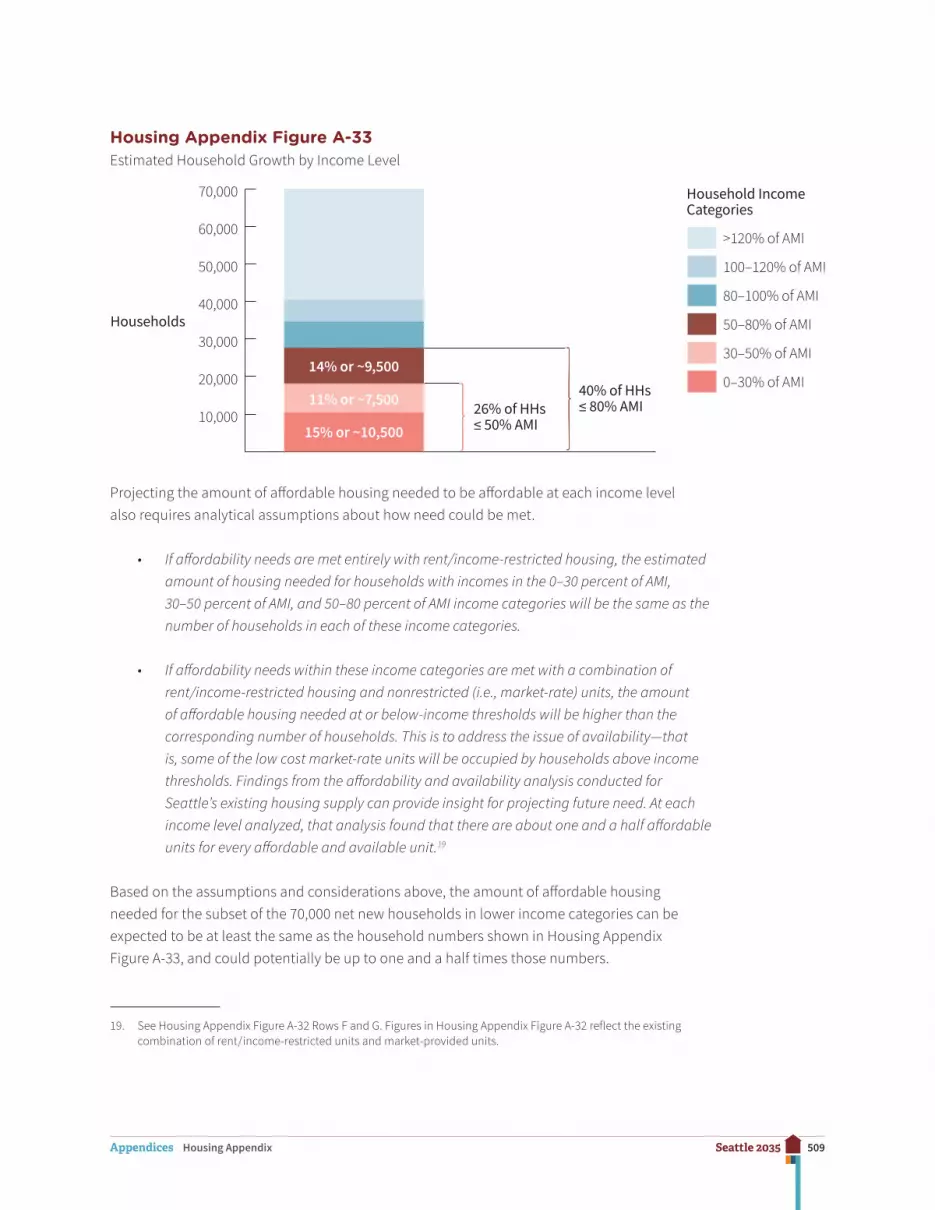
509Seattle 2035Appendices Housing Appendix
Housing Appendix Figure A-33Estimated Household Growth by Income Level
10,000
20,000
30,000
40,000
50,000
60,000
70,000
>120% of AMI
100–120% of AMI
80–100% of AMI
50–80% of AMI
30–50% of AMI
0–30% of AMI
Households
Household Income Categories
26% of HHs≤ 50% AMI
40% of HHs≤ 80% AMI
15% or ~10,500
11% or ~7,500
14% or ~9,500
Projecting the amount of affordable housing needed to be affordable at each income level also requires analytical assumptions about how need could be met.
• If affordability needs are met entirely with rent/income-restricted housing, the estimated amount of housing needed for households with incomes in the 0–30 percent of AMI, 30–50 percent of AMI, and 50–80 percent of AMI income categories will be the same as the number of households in each of these income categories.
• If affordability needs within these income categories are met with a combination of rent/income-restricted housing and nonrestricted (i.e., market-rate) units, the amount of affordable housing needed at or below-income thresholds will be higher than the corresponding number of households. This is to address the issue of availability—that is, some of the low cost market-rate units will be occupied by households above income thresholds. Findings from the affordability and availability analysis conducted for Seattle’s existing housing supply can provide insight for projecting future need. At each income level analyzed, that analysis found that there are about one and a half affordable units for every affordable and available unit.19
Based on the assumptions and considerations above, the amount of affordable housing needed for the subset of the 70,000 net new households in lower income categories can be expected to be at least the same as the household numbers shown in Housing Appendix Figure A-33, and could potentially be up to one and a half times those numbers.
19. See Housing Appendix Figure A-32 Rows F and G. Figures in Housing Appendix Figure A-32 reflect the existing combination of rent/income-restricted units and market-provided units.
510Seattle 2035Appendices Housing Appendix
Following are the estimated numbers of units at each income level that would be needed in order to address affordability needs associated with the addition of 70,000 households.20
• For households with incomes of 0–30 percent of AMI: 10,500 rent/income-restricted housing units (assumes that all units affordable within this category would be rent/income-restricted housing, given that it would be extremely unlikely that the market would produce new units affordable at this income level without subsidy or regulatory intervention).
• For households with incomes of 30–50 percent of AMI: 7,500 rent/income-restricted housing units (with need met entirely by rent/income-restricted housing) or an additional 11,500 affordable units (if need could be met with a combination of rent/income-restricted housing and nonrestricted units21).
• For households with incomes of 50–80 percent of AMI: 9,500 rent/income-restricted housing units (if need met entirely with rent/income-restricted housing) or 14,500 affordable units (if need could be met with a combination of rent/income-restricted housing and nonrestricted units).
Summing these figures together indicates that addressing the affordability needs of the 70,000 new households would require production of roughly 27,500 to 36,500 housing units affordable at or below 80 percent of AMI. This is in addition to affordable housing to address existing unmet need.
The foregoing discussion underscores the vital role that subsidized housing and other types of rent/income-restricted housing will continue to play in addressing the affordability needs of lower-income households. Over the next twenty years, the production of rent/income-re-stricted housing will continue to be essential, especially at the lowest income levels, which the housing market—particularly newly built market-rate housing—rarely addresses.
The following section describes the City’s strategies for addressing affordable housing needs. Through these strategies, Seattle responds to local needs within our city and helps address countywide need as required by the CPPs.
20. Figures given for the units needed in each income category assume needs in previous categories are met.
21. The 11,500 figure is provided as a reminder that availability as well as affordability must be factored in when a portion of affordable units are not rent/income-restricted. However, it is unlikely that any sizable number of market-rate units would be affordable in this range.
511Seattle 2035Appendices Housing Appendix
Strategies for Addressing Housing Needs
The City of Seattle’s Office of Housing administers several affordable housing programs, which all help lower income families and individuals to thrive, and enable neighborhoods to provide a full range of housing choice and opportunity. The City’s housing programs help build strong, healthy communities. The rent/income-restricted housing achieved through production and preservation of affordable housing, through both capital subsidies and developer incentives, help to stabilize lower-income residents in their neighborhoods and increase opportunities for people to live in our City. These strategies are informed by knowl-edge of local needs as well as an understanding of the needs in King County as a whole.
Office of Housing Programs: Rental Housing Program
OH’s Rental Housing Program provides capital funding for the development of affordable rental housing in Seattle using funds from the Seattle Housing Levy, payments contributed by developers through the incentive zoning program, and federal grants. OH coordinates with other public and private funders to leverage these resources 3 to 1, with the largest sources of leverage coming from low-income housing tax credits and tax-exempt bond in-vestment. Funding is generally provided in the form of low-interest, deferred-payment loans and is awarded on a competitive basis. It is available to parties from both the nonprofit and for-profit sectors, although the former have been the most active in the development and ownership of Seattle’s rent/income-restricted housing to date.
• 2014 Funding: $29.6 million, including $17.5 million in Housing Levy, $5.1 million in federal grants, $4.9 million of incentive zoning funds, and $2.1 million in other funding
• 2014 Production: 445 rent/income-restricted housing units, including 315 new construction units and rehab of 130 units in the existing portfolio
• Total Portfolio: Cumulative production of nearly 12,000 rent/income-restricted housing units since 1981, largely funded by voter-approved housing levies
• Affordability Term: Minimum fifty years
• Income Limits: Generally at or below 60 percent of AMI, with over half of all rent/income-restricted housing units reserved for households with incomes less than 30 percent of AMI. Of actual households served, 76 percent have incomes 0 to 30 percent of AMI, 17 percent have incomes 30 to 50 percent of AMI, and 6 percent have incomes 50 to 80 percent of AMI.
• Populations Served: General priorities include formerly homeless individuals and families, seniors and people with disabilities, and low-wage working households.
512Seattle 2035Appendices Housing Appendix
• Web Link: http://www.seattle.gov/housing/housing-developers/rental-housing-program
Incentive Zoning for Affordable Housing
In certain zones, Seattle’s incentive zoning program enables development to achieve extra floor area beyond a base limit when affordable units are provided (“performance option”) or when a fee is paid to support the development of affordable housing (“payment option”). With the latter option, the affordable units can be built either in that same neighborhood or in other neighborhoods with light rail or other direct frequent transit connections to areas experiencing employment and residential growth.
• 2014 Production: Fifty-one units produced on-site in six projects, and $21.5 million of in-lieu payments
• Total Portfolio: 115 rent/income-restricted housing units in twenty-one projects since 2010, and $52.9 million of in-lieu payments since 2001
• Affordability Term: Minimum fifty years
• Income Limits: Up to 80 percent of AMI for rental and 100 percent of AMI for owner-occupied housing; in-lieu payments support the Rental Housing and Homeownership Programs
• Web Link: http://www.seattle.gov/housing/housing-developers/incentive-zoning
Multifamily Tax Exemption
Multifamily tax exemption is a voluntary program providing a property tax exemption to property owners on residential improvements for up to twelve years. Until recently, 20 per-cent of the housing units in participating buildings were required as rent/income-restricted housing. Beginning in November 2015, eligible buildings must set aside 25 percent of all units as rent/income-restricted housing, unless the buildings provide a minimum number of two-bedroom or larger apartments, in which case a 20 percent set-aside is required. The tax exemption is currently available in all multifamily zoned parcels in Seattle. Approximately 40 percent of all eligible projects currently in development are opting to participate in the multifamily tax exemption program. The program complements a separate State property tax exemption for residential development with 75 percent of units serving households at or below 50 percent of AMI.
• 2014 Production: 485 rent/income-restricted housing units in twenty-nine projects approved
513Seattle 2035Appendices Housing Appendix
• Total Portfolio: 3,841 rent/income-restricted housing units in 123 projects since 1998, with another 2,346 units in 106 projects expected to be complete by 2018
• Affordability Term: Up to twelve years
• Income Limits: Up to 40–90 percent of AMI, depending on the housing type
• Web Link: http://www.seattle.gov/housing/housing-developers/multifamily-tax-exemption
Homeownership Program
OH provides up to $45,000 per household in down payment assistance to low-income first-time homebuyers, typically in the form of low-interest, deferred-payment second mortgages. For resale-restricted homes, OH will provide up to $55,000. The program is marketed through partner nonprofits and lending institutions, who often supplement City funds with subsi-dies from additional federal and local sources. OH also funds homebuyer counseling and recently launched a foreclosure prevention outreach campaign to connect homeowners with needed resources.
• 2014 Funding: $1.5 million awarded, including $1.3 million in Housing Levy and $124,000 in other funding
• 2014 Production: Forty homebuyers assisted
• Total Portfolio: 982 homebuyers assisted since 2004, largely funded through voter-approved Housing Levies
• Income Limits: Up to 80 percent of AMI
• Web Link: http://www.seattle.gov/housing/renters/buy-a-home
HomeWise Weatherization
The HomeWise program provides energy efficiency, and health and safety improvements to houses and apartment buildings with lower-income households. Typical investment ranges from $6,000 to $12,000 per unit.
• 2014 Funding: $3.2 million total, including $112,000 from the State, $1.2 million from utilities, and $1.9 million in federal funds
• 2014 Production: 499 units, including 191 single-family and 308 multifamily units

514Seattle 2035Appendices Housing Appendix
• Total Portfolio: 16,345 units since 2000
• Affordability Term: Three years for rental housing weatherization; no ongoing affordability requirement for homeowners
• Income Limits: Eligibility varies depending on source of funding.
• Web Link: http://www.seattle.gov/housing/homeowners/weatherization
Home Repair Loan Program
The Home Repair Loan Program helps low-income homeowners finance critical home re-pairs. Eligible homeowners apply for a zero percent or 3 percent loan of up to $24,000 (with a maximum lifetime benefit of $45,000) for a term of up to twenty years. The program’s goals are to identify and make health, safety, and code-related repairs, increase home energy-effi-ciency, and help revitalize neighborhoods.
• 2014 Funding: $225,000 total from CDBG
• 2014 Production: Thirteen loans
• Total Portfolio: ~2,900 loans to date
• Affordability Term: No ongoing affordability requirement
• Income Limits: Up to 80 percent of AMI
• Web Link: http://www.seattle.gov/housing/homeowners/home-repair
Seattle’s Rent/Income-Restricted Housing Inventory
OH estimates that Seattle has over 27,000 rent/income-restricted housing units for lower- income households. The middle columns in Housing Appendix Figure A-34 provide a summary of Seattle’s approximate rental housing inventory with housing covenants, agreements, or other restrictions by rent/income limit and location of the housing by type of urban center/urban village. This 27,000-unit estimate does not include portable tenant-based Section 8 vouchers.

515Seattle 2035Appendices Housing Appendix
Housing Appendix Figure A-34Estimated Rent/Income-Restricted Housing by Income Category and Location
Rent/Income-Restricted Housing Units by Income Category
Estimated Total Housing UnitsUrban Centers/Villages ≤ 30% AMI
>30 to 60% AMI
>60 to 80% AMI
Total ≤80% AMI
Outside of Urban Center/Village 2,642 1,357 712 4,711 183,037
Urban Centers 6,403 4,101 1,087 11,591 65,412
Hub Urban Villages 976 2,677 364 4,017 20,886
Residential Urban Villages 2,507 3,318 1,031 6,856 38,377
Manufacturing Industrial Centers 41 1 0 42 345
Grand Total 12,569 11,454 3,194 27,217 308,057
Sources: Office of Housing: Survey of Rent/Income-restricted Housing 2008 and Multifamily Database 2014; Development Capacity Report, DPD, September 2014, p. 5.
Based on OH rent/income-restricted housing and DPD total housing unit estimates, slight-ly less than 9 percent of Seattle’s total housing units are rent/income-restricted housing. Specifically, 4.1 percent are rent restricted for households with incomes ≤ 30 percent of AMI, 3.7 percent are rent restricted for households with incomes ≤ 60 percent of AMI, and 1.0 percent are rent restricted for households with incomes ≤ 80 percent of AMI. Over 80 percent of Seattle’s 27,000-plus rent/income-restricted housing units are located in urban centers and villages helping lower income households with better access to retail, transit, and other services and amenities.
Seattle’s estimated rent/income-restricted housing inventory of over 27,000 units includes approximately 15,000 rental units in the City of Seattle’s portfolio of housing. Funding for these units comes from OH’s Rental Housing Program or Multifamily Tax Exemption Program, incentive zoning programs in which residential building owners have participated, or through other agreements.
A HUD inventory identifies roughly seventy-five buildings totaling 3,500 rent/income-restricted housing units with regulatory agreements that could expire between now and 2035. However, it is important to note that the actual universe of units in Seattle that may be at risk of loss of affordability is smaller for a number of reasons. The actual universe is smaller because the HUD list includes buildings that (a) are located outside of the city of Seattle; (b) have been funded by the Seattle Office of Housing (OH), which routinely monitors the long-term afford-ability restrictions for OH-funded housing; (c) have mortgage loans insured under Section 221(d)(4), for which affordable housing set asides are not required; and (d) are owned by enti-ties with a mission of providing long-term affordable housing for lower-income households.

516Seattle 2035Appendices Capital Facilities Appendix
Capital Facilities Appendix
The following sections contain the inventory and anticipated needs for various capital facilities. Information for utilities, such as drinking water, drainage and sewer, solid waste, and electricity, is included in the Utilities Appendix. Information for transportation facilities is included in the Transportation Appendix.
Fire Department
Inventory
The Seattle Fire Department (SFD) provides fire protection and emergency medical ser-vices throughout the City from thirty-three fire stations, marine facilities, and Harborview Medical Center. SFD headquarters is in an historic building in Pioneer Square. SFD shares the Joint Training Facility with Seattle Public Utilities. Each station provides a full range of fire protective services including fire suppression, emergency medical, and rescue. Each station is equipped with at least one fire engine. Many stations include other equipment and special units. SFD has thirty-three engine companies, twelve ladder truck companies, four fire boats, five aid units, eight paramedic units, and other specialized units including heavy rescue, hazardous materials, and tunnel rescue that provide a broad range of emergency services. Existing fire facilities are shown in Capital Facilities Appendix Figures A-1 and A-2.
Planning Goals
SFD evaluates emergency medical capabilities and staffing or equipment additions and in-stitutes operation changes each year as a part of the budget process. State law requires that fire departments report yearly on established emergency response standards. SFD reports response time for fire response and emergency medical services (EMS), which includes basic life support (BLS) and advanced life support (ALS). Response standards are:
517Seattle 2035Appendices Capital Facilities Appendix
• Call Processing Time: Sixty seconds for phone answered to first unit assigned, for 90 percent of calls.
• Fire Response Time: Arrival within four minutes for first-arriving engine at a fire for 90 percent of calls, and arrival within eight minutes of the full first alarm assignment of fifteen firefighters, for 90 percent of calls.
• Basic Life Support: Arrival within four minutes of the first medical unit with two EMTs, for 90 percent of calls.
• Advanced Life Support: Arrival within eight minutes for 90 percent of calls.
Response time is influenced directly by the availability of fire personnel, equipment, traffic conditions, and the number and location of fire stations. Firefighter and equipment require-ments indirectly affect station requirements.
The City plans for asset preservation through a capital maintenance program. Minor and major capital facility projects are included in the City’s six-year Capital Improvement Plan (CIP).
Forecast of Future Needs
The City has added capacity and renovated or replaced many of the fire stations in the past ten years as part of the 2003 Fire Facilities levy, which provided about $167 million to upgrade, renovate, or replace thirty-two neighborhood fire stations, construct a new training facility, and upgrade SFD’s Fire Alarm Center, among other things. The new facilities have been built with excess physical capacity.
The City anticipates it will need to replace Fire Station No. 3 and the Fire Marshal office, and replace or expand the commissary and fire garage, as well as continue maintenance on the remaining existing buildings. To support existing operations, a new fire administration building and expanded training facilities are needed. To support SFD’s desired goal of timely emergency response in all areas of the city, a new South Lake Union fire station and a fresh-water marine fire suppression facility are desired under existing conditions.
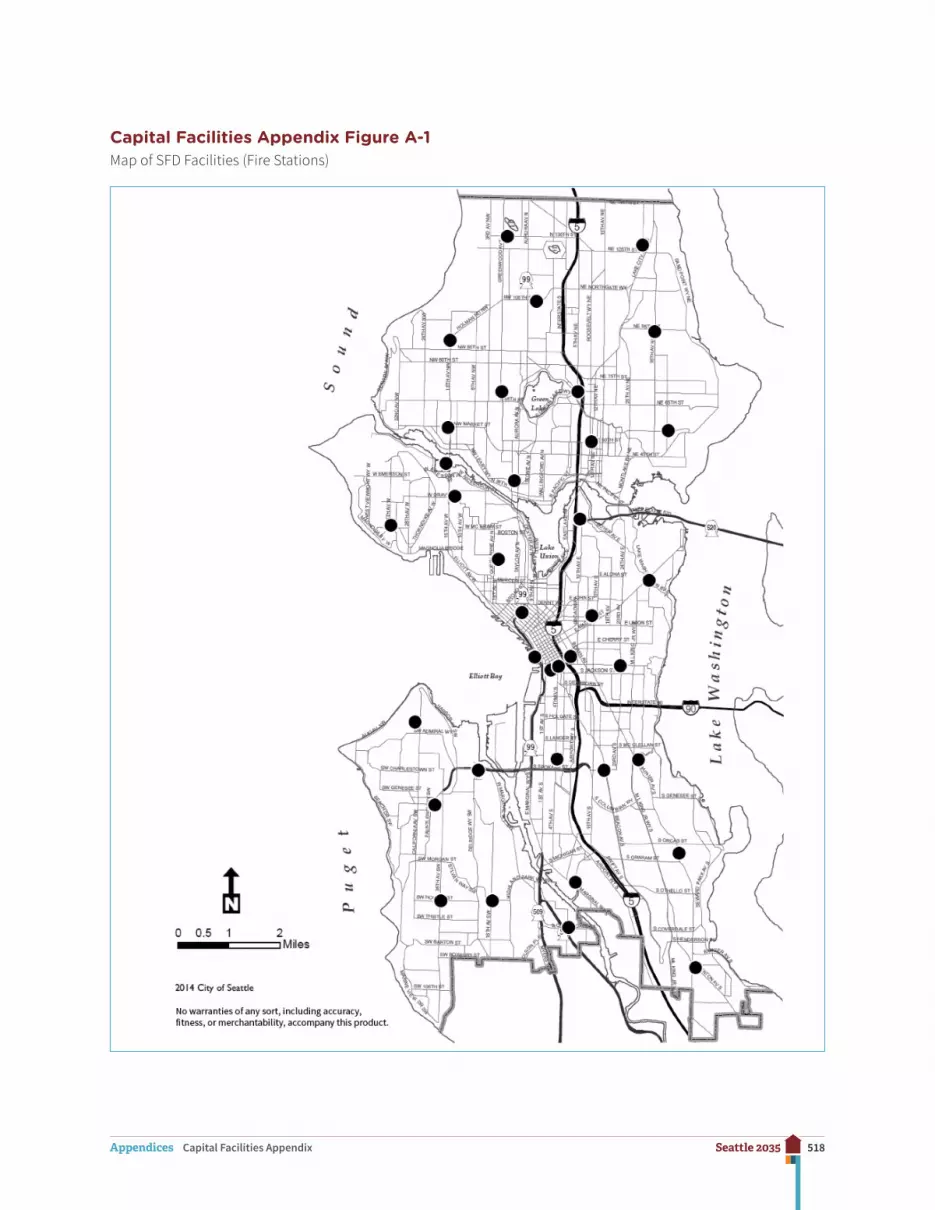
518Seattle 2035Appendices Capital Facilities Appendix
Capital Facilities Appendix Figure A-1Map of SFD Facilities (Fire Stations)
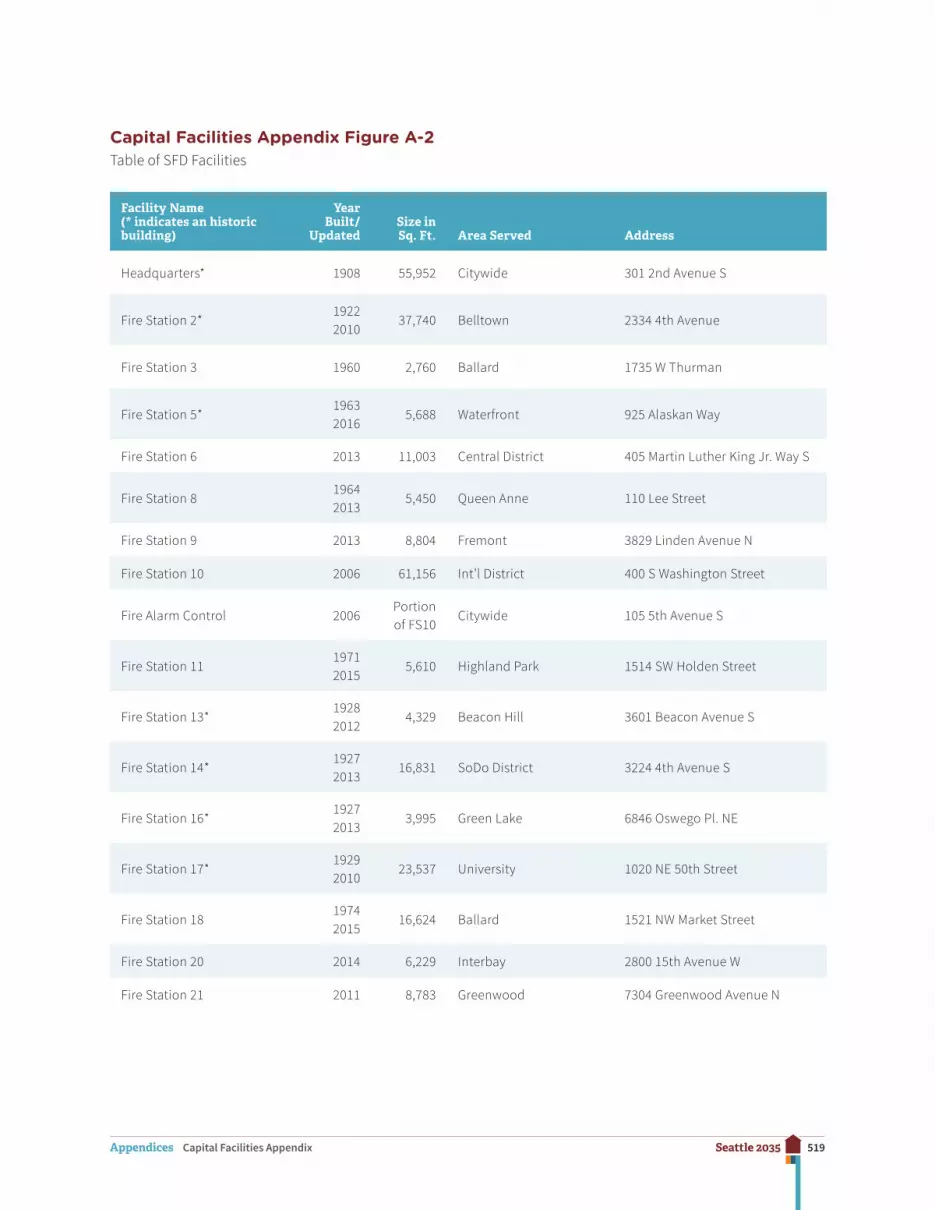
519Seattle 2035Appendices Capital Facilities Appendix
Capital Facilities Appendix Figure A-2Table of SFD Facilities
Facility Name (* indicates an historic building)
Year Built/
UpdatedSize in Sq. Ft. Area Served Address
Headquarters* 1908 55,952 Citywide 301 2nd Avenue S
Fire Station 2*19222010
37,740 Belltown 2334 4th Avenue
Fire Station 3 1960 2,760 Ballard 1735 W Thurman
Fire Station 5*19632016
5,688 Waterfront 925 Alaskan Way
Fire Station 6 2013 11,003 Central District 405 Martin Luther King Jr. Way S
Fire Station 819642013
5,450 Queen Anne 110 Lee Street
Fire Station 9 2013 8,804 Fremont 3829 Linden Avenue N
Fire Station 10 2006 61,156 Int’l District 400 S Washington Street
Fire Alarm Control 2006Portion of FS10
Citywide 105 5th Avenue S
Fire Station 1119712015
5,610 Highland Park 1514 SW Holden Street
Fire Station 13*19282012
4,329 Beacon Hill 3601 Beacon Avenue S
Fire Station 14*19272013
16,831 SoDo District 3224 4th Avenue S
Fire Station 16*19272013
3,995 Green Lake 6846 Oswego Pl. NE
Fire Station 17*19292010
23,537 University 1020 NE 50th Street
Fire Station 1819742015
16,624 Ballard 1521 NW Market Street
Fire Station 20 2014 6,229 Interbay 2800 15th Avenue W
Fire Station 21 2011 8,783 Greenwood 7304 Greenwood Avenue N

520Seattle 2035Appendices Capital Facilities Appendix
Facility Name (* indicates an historic building)
Year Built/
UpdatedSize in Sq. Ft. Area Served Address
Fire Station 2219652016
4,110 Roanoke 901 E Roanoke Street
Fire Station 2419772014
3,630 Bitter Lake 401 N 130th Street
Fire Station 2519692014
20,824 Capitol Hill 1300 E Pine Street
Fire Station 2619702014
5,960 South Park 800 S Cloverdale Street
Fire Station 2719702014
5,960 Georgetown 1000 S Myrtle Street
Fire Station 28 2010 13,638 Rainer Valley 5968 Rainer Avenue S
Fire Station 2919702014
5,049 Admiral District 2139 Ferry Avenue SW
Fire Station 30 2011 9,100 Mount Baker 2931 S Mount Baker Blvd.
Fire Station 3119742009
12,452 Northgate 1319 N Northgate Way
Fire Station 32 2016 6.646 West Seattle 3715 SW Alaska Street
Fire Station 3319712010
5,061 Rainer Beach 9645 Renton Avenue S
Fire Station 34 2014 4,625 Madison Park 633 32nd Avenue E
Fire Station 35 2010 11,532 Crown Hill 8729 15th Avenue NW
Fire Station 3619712014
4,676 Delridge/Harbor Island 3600 23rd Avenue SW
Fire Station 37 2010 9,000 West Seattle/High Point 7700 35th Avenue SW
Fire Station 38 2011 8,700 Hawthorne Hills 4004 NE 55th Street
Fire Station 39 2010 9,593 Lake City 2806 NE 127th Street
Fire Station 4019652013
6,500 Wedgwood 9401 35th Avenue NE
Fire Station 4119362010
6,146 Magnolia 2416 34th Avenue W
Fire Marshal 2000 9,462 Downtown 220 3rd Avenue S

521Seattle 2035Appendices Capital Facilities Appendix
Facility Name (* indicates an historic building)
Year Built/
UpdatedSize in Sq. Ft. Area Served Address
Training Facility 2009 53,402 Citywide 9401 Myers Way S
Commissary 1985 37,606 Citywide 3601 21nd Avenue S
Fire Garage 1975 15,000 Citywide 815 Dearborn Street
Harborview Medical Center 1,000 Citywide 325 9th Avenue
South Lake Union Station South Lake Union Not Determined
Police Department
Inventory
The Seattle Police Department (SPD) currently provides law enforcement patrol services to the city from five precincts and the Harbor Patrol Unit, which covers fifty-nine square miles of waterways. SPD also provides for parking and traffic enforcement as well as specialized units including SWAT, gang unit, mounted patrol, and canine. Information on these pre-cincts and facilities is shown in Capital Facilities Appendix Figures A-3 and A-4.
Planning Goals
Uniform patrol law enforcement services are generally allocated based on workload, time, and location. The exact location of facilities is usually not critical to the provision of uniform patrol services since police officers are on patrol in the various sectors and calls for service are dispatched by radio. The location of facilities can be important because the distance traveled at shift change time impacts the availability of officers and because locations can enhance interaction with the community. Because of the many changing factors that affect staffing and space objectives of police departments, there are no universally accepted plan-ning goals for the location and distribution of police facilities.
The City plans for asset preservation through a capital maintenance program. Minor and major capital facility projects are programmed in the City’s six-year capital improvement program.
Forecast of Future Needs
The City is expected to maintain, replace, or expand some police facilities as shown in Capital Facilities Appendix Figure A-4. To support existing police operations citywide, SPD expects that it may upgrade, expand, or replace Harbor Patrol, rifle range, and training

522Seattle 2035Appendices Capital Facilities Appendix
facilities. The existing North Precinct is currently overcrowded and does not meet the needs of precinct personnel; therefore, a new consolidated facility is proposed to be built. The City has purchased property for a new North Precinct. In the next twenty-year period, the City may also elect to build its own correctional facility, rather than to continue leasing space from King County at its jail.
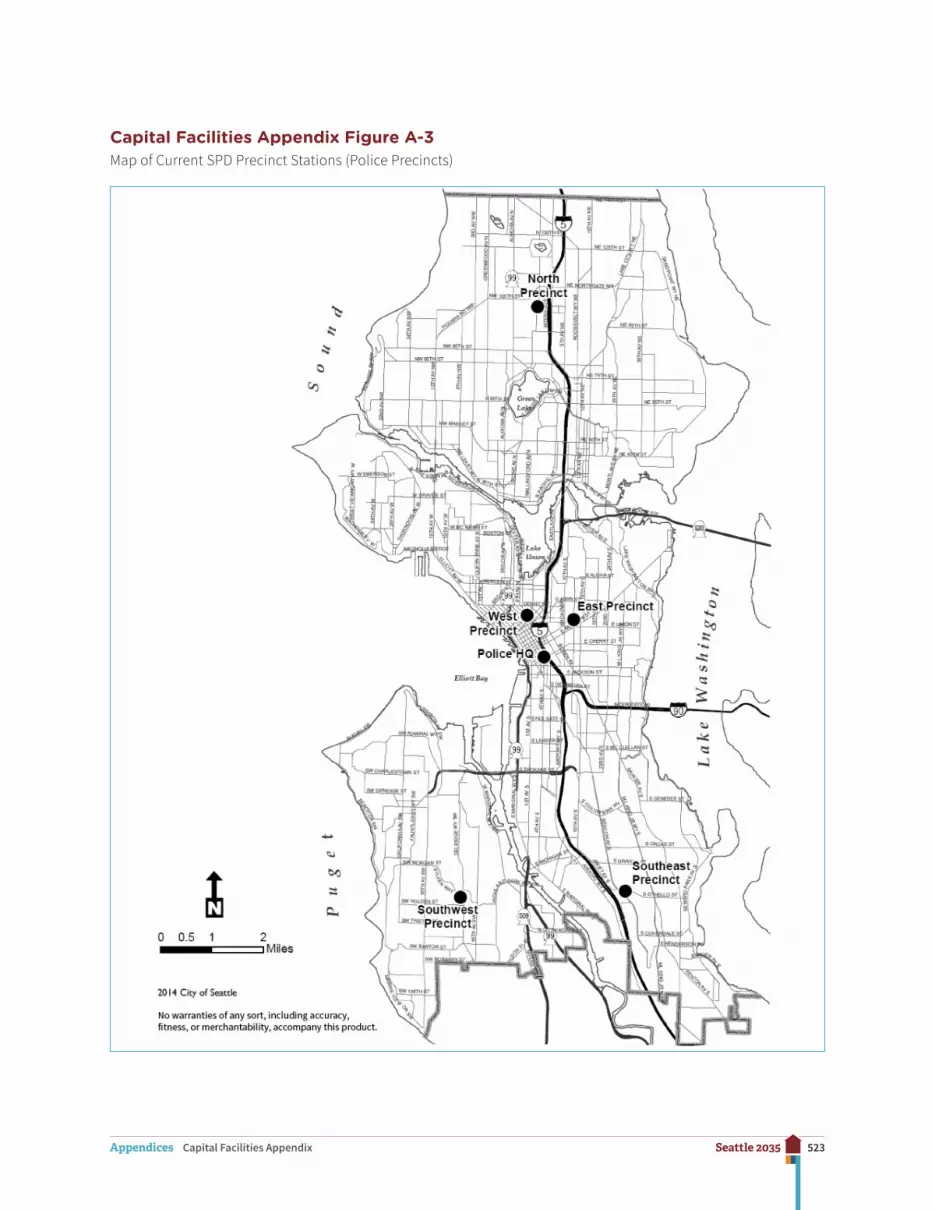
523Seattle 2035Appendices Capital Facilities Appendix
Capital Facilities Appendix Figure A-3Map of Current SPD Precinct Stations (Police Precincts)

524Seattle 2035Appendices Capital Facilities Appendix
Capital Facilities Appendix Figure A-4Table of Police Department Facilities
Facility Name
Year Built/
UpdatedSize in Sq. Ft. Description
Area Served Address
Police Headquarters
2002Police Headquarters shares Justice Center building
Citywide 610 5th Avenue
Justice Center 2005 310,490Justice Center includes municipal courts
Citywide 600 5th Avenue
Professional Accountability
1970 6,300Leased space in Pacific Building
Citywide 712 3rd Avenue
North Precinct 1984 16,434Serves area north of the Ship Canal to city limits
Northgate 10049 College Way N
Emergency Operations Center/911 Call center
2006 61,156Shared facility with Fire Alarm Center and FS 10
Citywide400 S Washington Street
North Precinct Annex
1983 4,474 Leased office space Northgate10303 Meridian Avenue N
West Precinct 1999 50,960Serves Queen Anne, Magnolia, the Downtown core, and the area west of I-5
Downtown 810 Virginia Street
West Precinct Garage
1948 53,336Condo garage located in adjacent building
Capitol Hill 2021 9th Avenue
East Precinct1926
198561,580
Serves the area north of I-90 to the Ship Canal and east of I-5, Eastlake Community
East Precinct
1519 12th Avenue
East Precinct Garage
2014 29,058Garage located under 12th Avenue Arts building
Capitol Hill 1624 12th Avenue
South Precinct 1983 13,688Serves area south of 1–90 to city limits and west of Duwamish
Beacon Hill 3001 S Myrtle Street
Southwest Precinct
2002 28,531Serves West Seattle and Duwamish Industrial area
Delridge 2300 SW Webster
Mounted Patrol 2001 39,04112 full-time horse stalls and related equipment
Citywide 9200 8th Avenue SW
Police Training Center
Practice range is an open-air range
Citywide 11026 E Marginal Way S
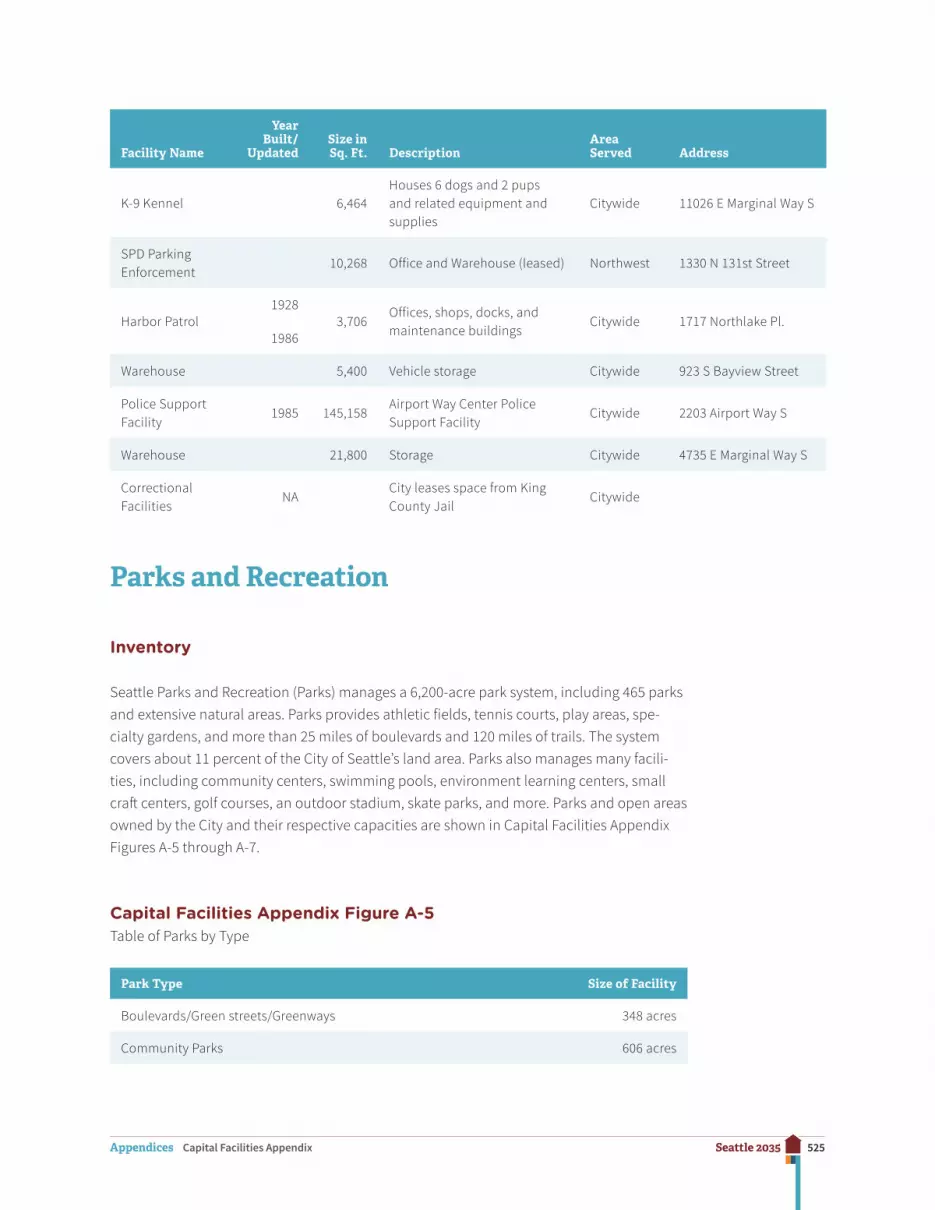
525Seattle 2035Appendices Capital Facilities Appendix
Facility Name
Year Built/
UpdatedSize in Sq. Ft. Description
Area Served Address
K-9 Kennel 6,464Houses 6 dogs and 2 pups and related equipment and supplies
Citywide 11026 E Marginal Way S
SPD Parking Enforcement
10,268 Office and Warehouse (leased) Northwest 1330 N 131st Street
Harbor Patrol1928
19863,706
Offices, shops, docks, and maintenance buildings
Citywide 1717 Northlake Pl.
Warehouse 5,400 Vehicle storage Citywide 923 S Bayview Street
Police Support Facility
1985 145,158Airport Way Center Police Support Facility
Citywide 2203 Airport Way S
Warehouse 21,800 Storage Citywide 4735 E Marginal Way S
Correctional Facilities
NACity leases space from King County Jail
Citywide
Parks and Recreation
Inventory
Seattle Parks and Recreation (Parks) manages a 6,200-acre park system, including 465 parks and extensive natural areas. Parks provides athletic fields, tennis courts, play areas, spe-cialty gardens, and more than 25 miles of boulevards and 120 miles of trails. The system covers about 11 percent of the City of Seattle’s land area. Parks also manages many facili-ties, including community centers, swimming pools, environment learning centers, small craft centers, golf courses, an outdoor stadium, skate parks, and more. Parks and open areas owned by the City and their respective capacities are shown in Capital Facilities Appendix Figures A-5 through A-7.
Capital Facilities Appendix Figure A-5Table of Parks by Type
Park Type Size of Facility
Boulevards/Green streets/Greenways 348 acres
Community Parks 606 acres
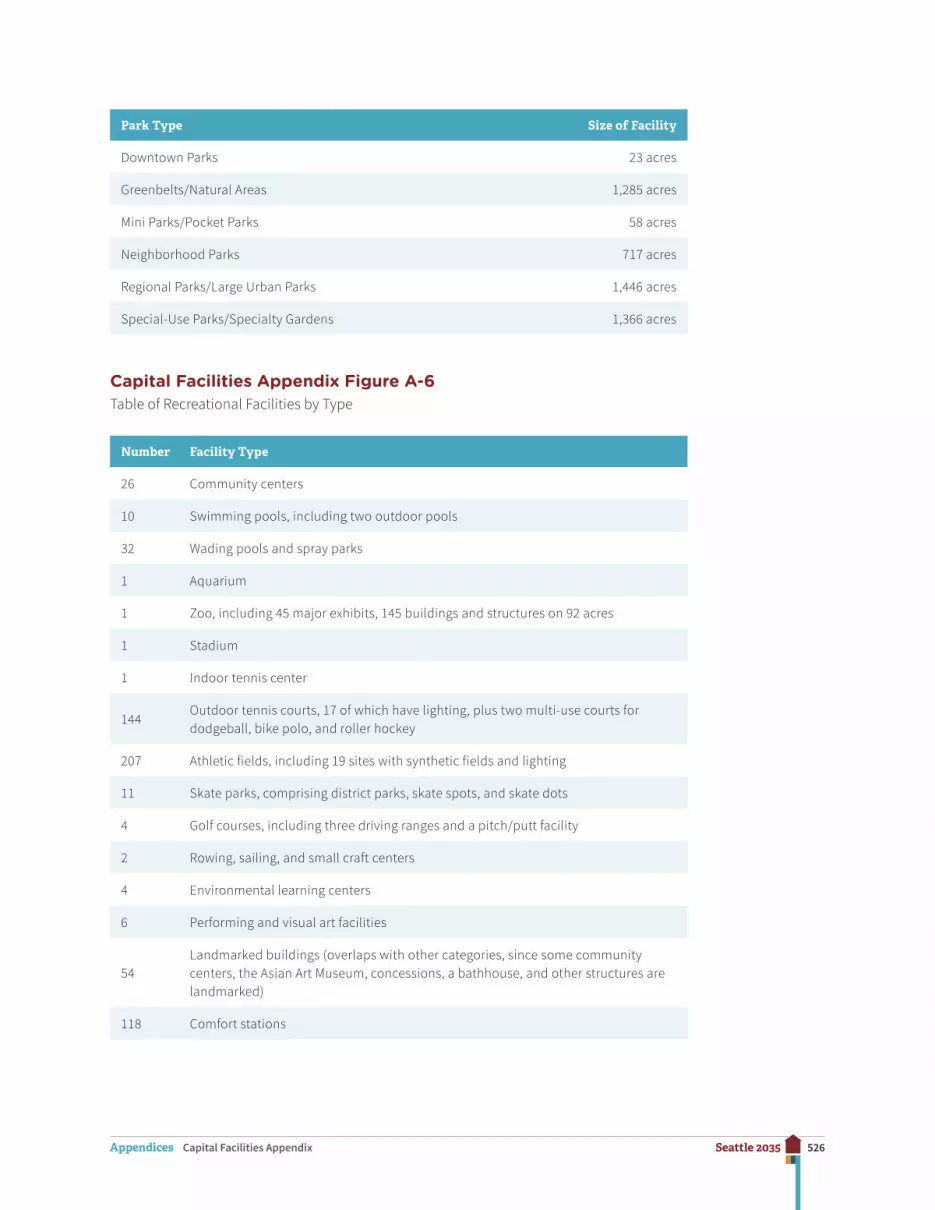
526Seattle 2035Appendices Capital Facilities Appendix
Park Type Size of Facility
Downtown Parks 23 acres
Greenbelts/Natural Areas 1,285 acres
Mini Parks/Pocket Parks 58 acres
Neighborhood Parks 717 acres
Regional Parks/Large Urban Parks 1,446 acres
Special-Use Parks/Specialty Gardens 1,366 acres
Capital Facilities Appendix Figure A-6Table of Recreational Facilities by Type
Number Facility Type
26 Community centers
10 Swimming pools, including two outdoor pools
32 Wading pools and spray parks
1 Aquarium
1 Zoo, including 45 major exhibits, 145 buildings and structures on 92 acres
1 Stadium
1 Indoor tennis center
144Outdoor tennis courts, 17 of which have lighting, plus two multi-use courts for dodgeball, bike polo, and roller hockey
207 Athletic fields, including 19 sites with synthetic fields and lighting
11 Skate parks, comprising district parks, skate spots, and skate dots
4 Golf courses, including three driving ranges and a pitch/putt facility
2 Rowing, sailing, and small craft centers
4 Environmental learning centers
6 Performing and visual art facilities
54Landmarked buildings (overlaps with other categories, since some community centers, the Asian Art Museum, concessions, a bathhouse, and other structures are landmarked)
118 Comfort stations
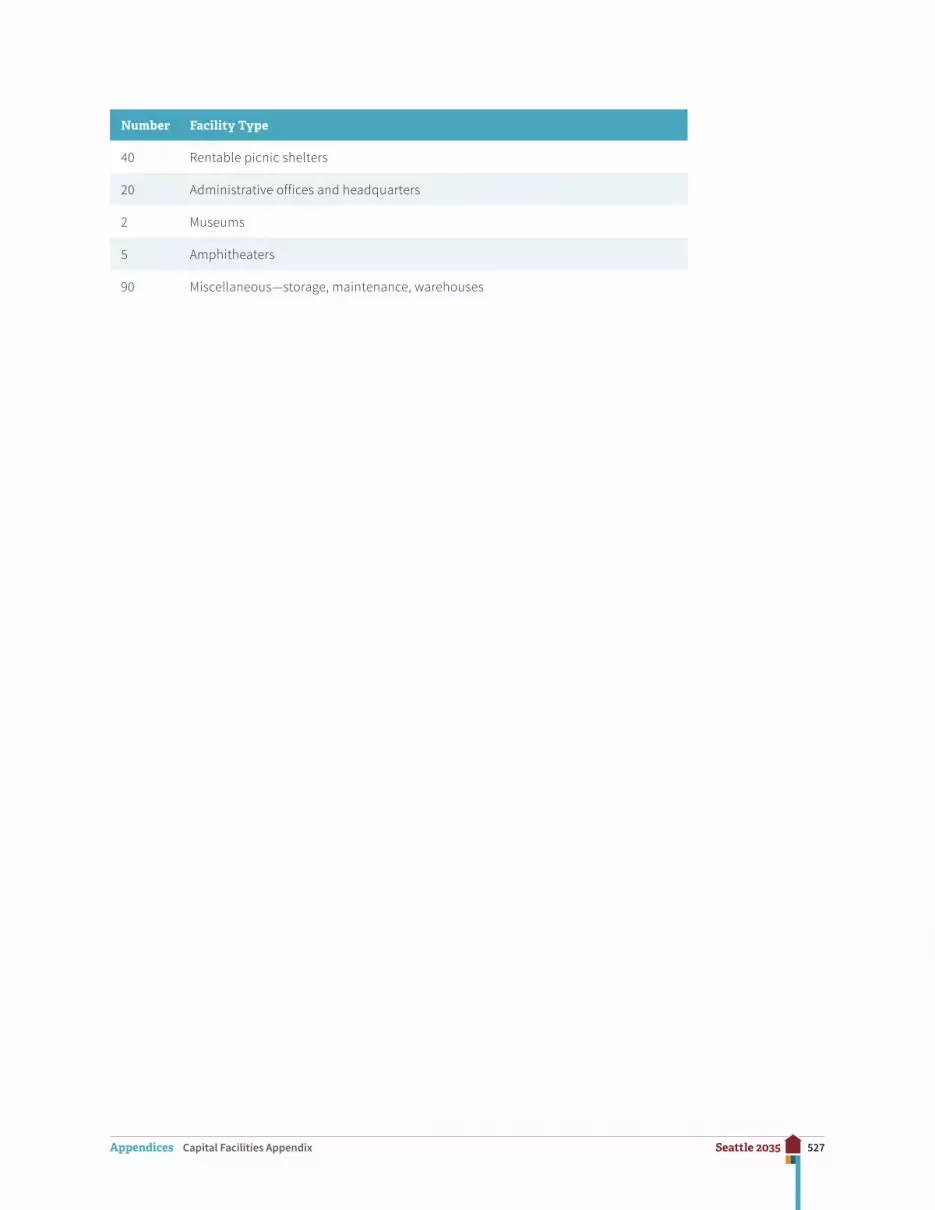
527Seattle 2035Appendices Capital Facilities Appendix
Number Facility Type
40 Rentable picnic shelters
20 Administrative offices and headquarters
2 Museums
5 Amphitheaters
90 Miscellaneous—storage, maintenance, warehouses
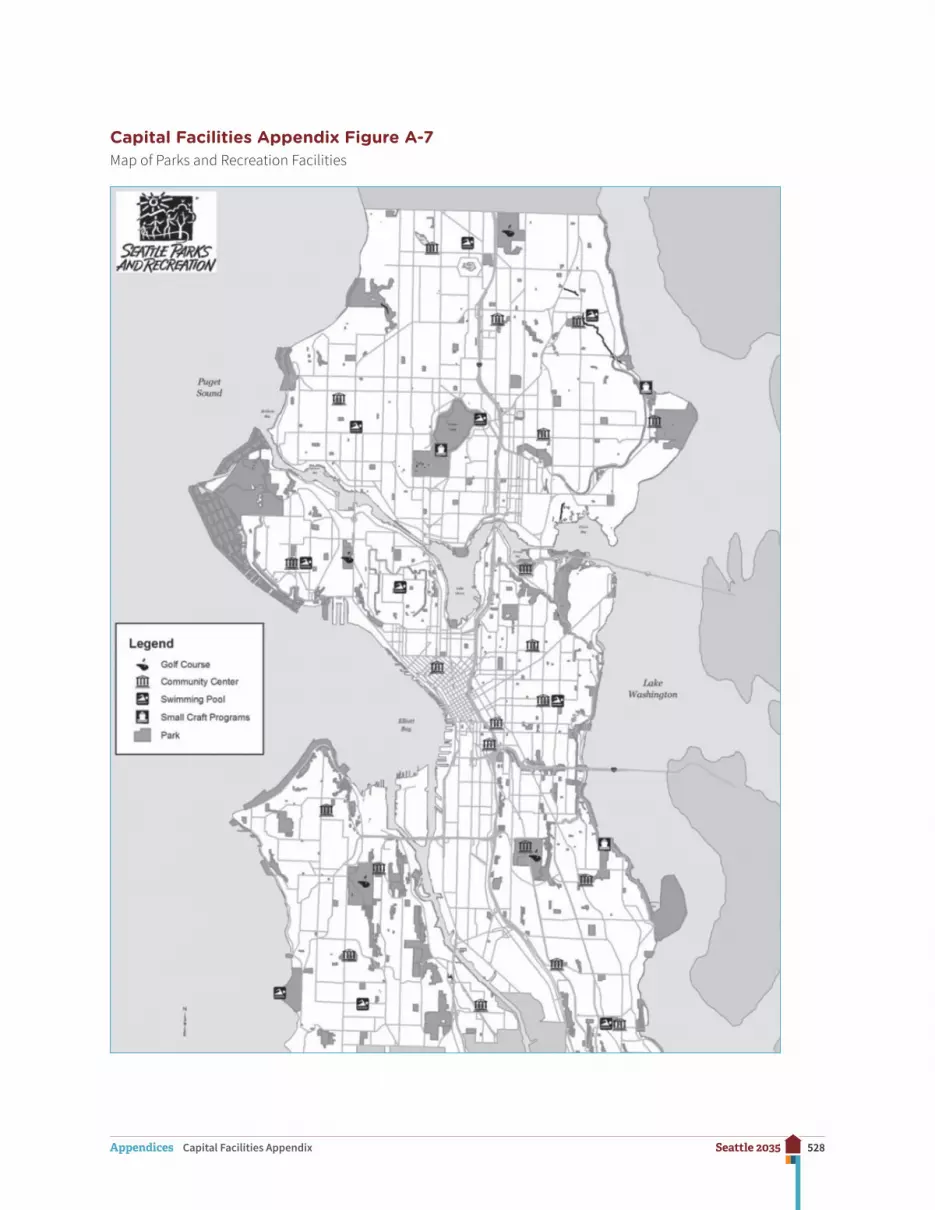
528Seattle 2035Appendices Capital Facilities Appendix
Capital Facilities Appendix Figure A-7Map of Parks and Recreation Facilities
529Seattle 2035Appendices Capital Facilities Appendix
Forecast of Future Needs
The City has a robust citywide park system, which is available and accessible for use by all of the City’s residents. To enhance Seattle’s quality of life, the City seeks to add parks and open space to the City’s system as additional amenities for all of the City’s residents. To that end, the City continues to fund park acquisition with the primary goals of:
1. pursuing usable open space acquisition in areas where the acreage and distribution of parks is lowest on a per capita basis. These are mostly found within urban centers and villages; and
2. acquiring properties that can complete or expand existing parks.
Park acquisitions are opportunity-driven. Additions to the park facilities would enhance the City’s quality of life. However, such additions are not necessary to accommodate new households in urban centers, urban villages, or citywide.
Planned investments in the maintenance of existing facilities are provided in the CIP and updated annually according to asset management priorities and available funds.
General Government
Inventory
The Department of Finance and Administrative Services (FAS) provides facility management and planning for general government facilities. These facilities include vehicle repair shops, office space, warehouses, communication facilities, social services facilities, and the animal shelter. The City also owns property that is leased to social service organizations. Capital Facilities Appendix Figures A-8 and A-9 show an inventory of existing general government facilities.
Planning Goals
The City does not have general planning goals for general government facilities, which are instead driven by the needs of specific departments and programs. These governmental facilities are not related to or necessary for future growth. The City plans for asset preserva-tion through a capital maintenance program. Minor and major capital facility projects are programed in the City’s six-year CIP.

530Seattle 2035Appendices Capital Facilities Appendix
Forecast of Future Needs
FAS has identified a need for expanded facilities that support vehicle maintenance and department operations over the twenty-year planning horizon. Additional warehouse and office space may be needed as the City grows; this need is driven primarily by budget rev-enue and departmental priorities. Additional space needs can be accommodated through leasing as well as building new space. General facilities that support citywide functions such as the animal shelter and Consumer Affairs need new and expanded facilities to enhance quality of life.
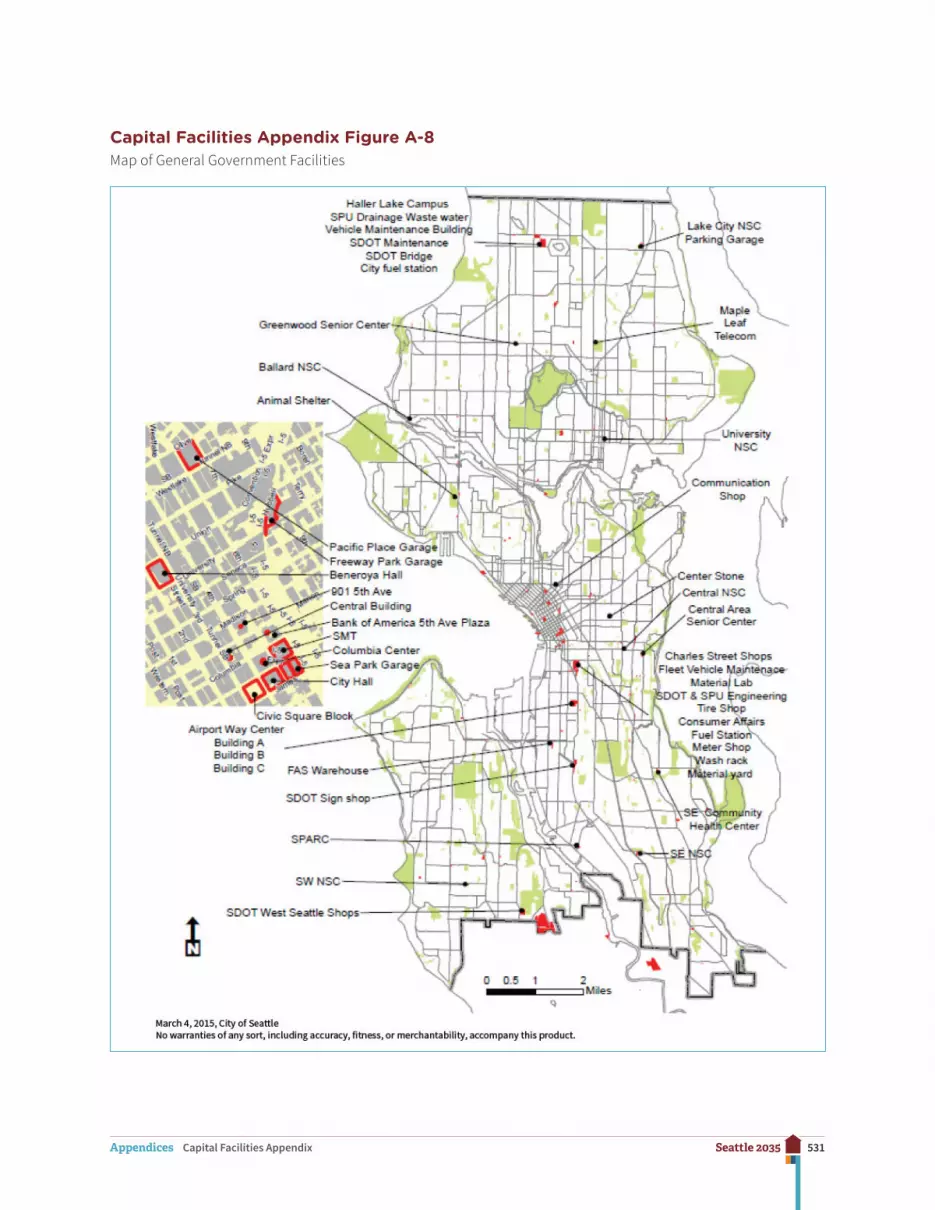
531Seattle 2035Appendices Capital Facilities Appendix
Capital Facilities Appendix Figure A-8Map of General Government Facilities

532Seattle 2035Appendices Capital Facilities Appendix
Capital Facilities Appendix Figure A-9Table of General Government Facilities
Facility NameYear Built /Updated
Size in Sq. Ft. Description
Area Served Address
Seattle Municipal Tower
1989 1,223,577 Administrative offices Citywide 700 5th Avenue
SMT/Parking Garage 1989 193,891 SMT parking Citywide 700 5th Avenue
City Hall 2003 153,502 Council and Mayor offices Citywide 600 4th Avenue
Sea Park Garage 1993 213,346Parking garage for City Campus
Downtown 609 6th Avenue
Columbia Center 9,294 Leased office Citywide 400 4th Avenue
Central Building 28,523 Leased office Citywide 810 3rd Avenue
Bank of America Building 5th Ave Plaza
42,578 Leased office Citywide 800 5th Avenue
901 5th Ave Building
28,721 Leased office Citywide 901 5th Avenue
Pacific Building 6,800 Leased office Citywide 720 3rd Avenue
FAS Warehouse 21,898 Records and surplus Citywide 3807 2nd Avenue
Airport Way Center Bldg. A
19441981
102,075 Office building Citywide 2203 Airport Way S
Airport Way Center Bldg. B
1985 16,800 FAS shop space Citywide 2203 Airport Way S
Airport Way Center Bldg. D
1985 22,803 FAS paint shops Citywide 2203 Airport Way S
Seattle Animal Shelter
1981 1,567Animal shelter and spay and neuter clinic
Citywide 2189 15th Avenue W
West Seattle Shops
1956 5,122 SDOT Street Maintenance Citywide 9200 8th Avenue SW
1980 1,200SDOT Urban Forestry trailer
Citywide 9200 8th Avenue SW

533Seattle 2035Appendices Capital Facilities Appendix
Facility NameYear Built /Updated
Size in Sq. Ft. Description
Area Served Address
Haller Lake Campus
1975 2,436SPU Drainage Waste Water buildings
North 12600 Stone Avenue N
1958 24,588Vehicle Maintenance Building A
North12555 Ashworth Avenue N
1998 5,979SPU Hazardous Waste buildings
North 12550 Stone Avenue N
1996 6,725SDOT Street Maintenance Building B
North12599 Ashworth Avenue N
1973 3,640 SDOT equipment storage North12535 Ashworth Avenue N
1973 3,724SDOT bridge maintenance and paint shop buildings
Citywide1328 & 1324 N 125th Street
1975 1,991 Fuel station North 12600 Stone Avenue N
Charles Street Campus
1950 2008
67,356Fleet Vehicle Maintenance
Citywide 805 Charles Street
1973 7,400Materials Testing Lab (SPU)
Citywide 707 S Plummer
1974 21,315SPU and SDOT Engineering
Citywide 714 Charles Street
1967 5,450 Fleet Tire Shop Citywide 814 8th Avenue S
1950 1,624 Weights and Measures Citywide 805 Charles Street
2,000 Equipment wash rack Citywide 1011 8th Avenue S
1994 200 Fuel station Citywide 1040 7th Avenue S
1967 22,058 Meter Shop, bridges Citywide 1010 8th Avenue
1960 20,000 Material yard Citywide 717 S Plummer Street
1960 185,046 Yard and parking Citywide 1099 S Airport Way
SDOT Sign Shop19601970
45,036 SDOT Sign Shop Citywide 4200 Airport Way S
DOIT Com. Shop 1951 4,964 Communications ShopDenny Triangle
1933 Minor Avenue
NE Telecom Building
2014 6,000 Communications building Northeast 8526 Roosevelt Way NE

534Seattle 2035Appendices Capital Facilities Appendix
Facility NameYear Built /Updated
Size in Sq. Ft. Description
Area Served Address
Ballard Service Center
2005 3,100Neighborhood Service Center
Ballard 5604 22nd Avenue NW
Lake City Service Center and Garage
2005 12,409Neighborhood Service Center and parking garage
Lake City12525 & 12509 28th Avenue NE
Central Service Center
1980 2,235Central Area Service Center
Central 2301 S Jackson Street
SW Service Center 1975 400Neighborhood Service Center
Junction 2801 SW Thistle Street
SE Service Center 2003 1,500SE Neighborhood Services Center
Southeast 3815 S Othello Street
University Service Center
1,400University Neighborhood Service Center
University 4534 University
Pacific Place Garage 1999 526,850Condo ownership of garage portion of Pacific Place
Downtown 600 Pine Street
Freeway Park Garage
1975 63,750Leased to Washington State Convention Center
Downtown 609 9th Avenue
Central Area Senior Center
1959 9,478Central Area Senior Center
Central 500 30th Avenue S
Greenwood Senior Center
1950 9,587 Greenwood Senior Center Greenwood 525 N 85th Street
Northwest Senior Center
1950 8,400 Northwest Senior Center Ballard 5431 32nd Avenue NW
Center Stone 1908 15,360Lease to social services agency
Central 722 18th Avenue
SPARC 1919 5,848South Park Community Center
South Park 8201 10th Avenue S
Benaroya Hall Ground lease Citywide 200 University
535Seattle 2035Appendices Capital Facilities Appendix
Public Library
Inventory
The Seattle Public Library (SPL) operates the Central Downtown Library, twenty-six neigh-borhood libraries, and a fleet of four bookmobiles. The State-funded Washington Talking Book and Braille Library (WTBBL) is also administered by SPL. SPL rents space for three fa-cilities it does not own. Capital Facilities Appendix Figures A-10 and A-11 show SPL facilities.
Planning Goals
In 2009, SPL completed a decade of building renewal and expansion. The voter-approved Libraries for All capital program renovated or replaced all twenty-two branches that were in the system as of 1998, added four new branch libraries, and built the new Central Library. The expansion also allowed for an increase in the number of public access computers, large community meeting areas, and study rooms. The focus has shifted from buildings to services as provided in the 2011 Library Strategic Plan.
Forecast of Future Needs
The Seattle Public Library will need maintenance and support facilities to support the exist-ing library facilities.
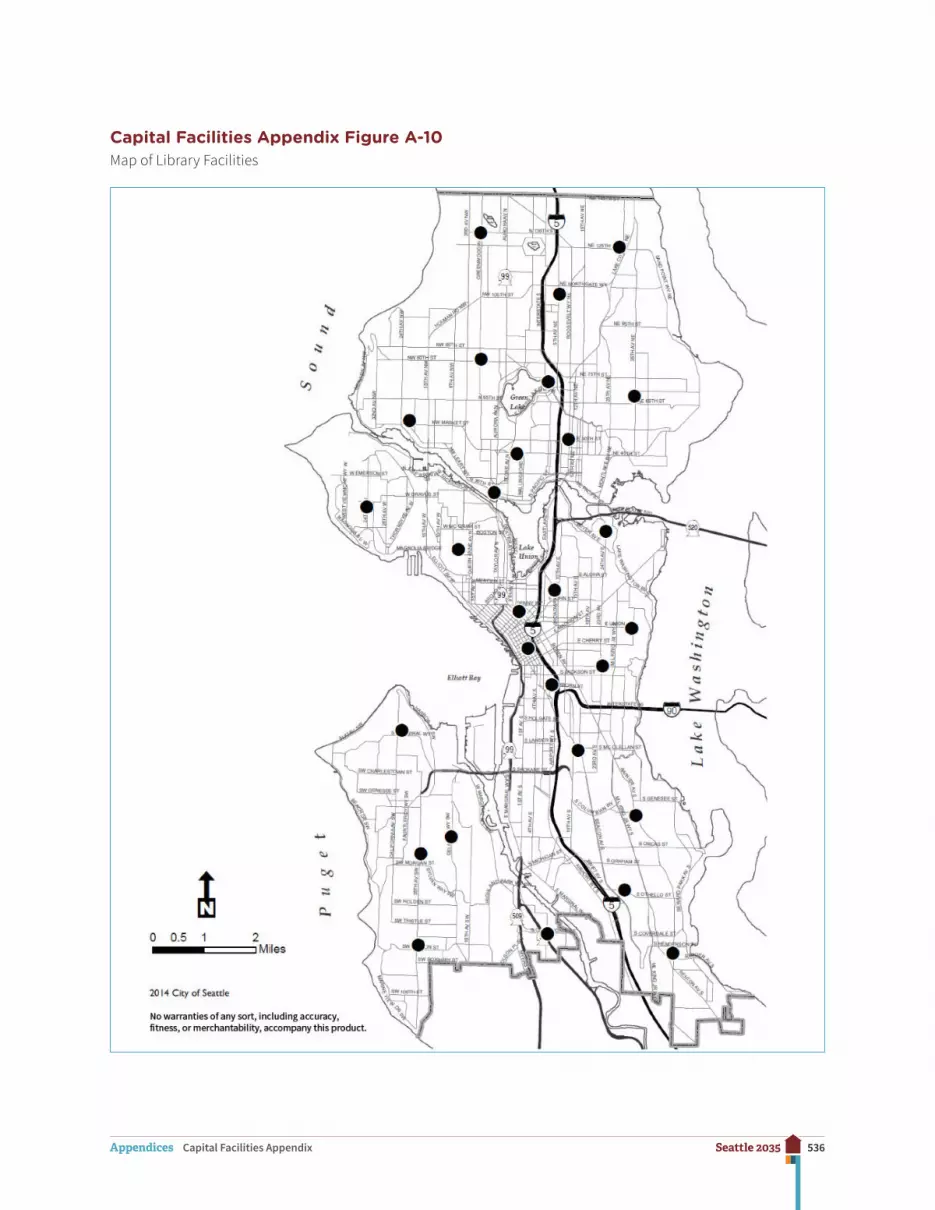
536Seattle 2035Appendices Capital Facilities Appendix
Capital Facilities Appendix Figure A-10Map of Library Facilities

537Seattle 2035Appendices Capital Facilities Appendix
Capital Facilities Appendix Figure A-11Table of Library Facilities
Branch Name Address Size in Sq. Ft.
Ballard 5711 24th Avenue NW 7,296
Beacon Hill 2519 15th Avenue S 10,800
Broadview 12755 Greenwood Avenue N 8,405
Capitol Hill 425 Harvard Avenue E 11,615
Central 1000 4th Avenue 363,000
Columbia* 4721 Rainier Avenue S 12,420
Delridge 5423 Delridge Way SW 5,600
Douglass-Truth* 2300 E Yesler 8,008
Fremont* 731 N 35th Street 6,060
Green Lake* 7364 E Green Lake Dr. N 8,090
Greenwood 8016 Greenwood Avenue N 7,085
High Point 6302 35th Avenue SW 7,000
Lake City* 12501 28th Avenue NE 9,013
Madrona-Sally Goldmark‡ 1134 33rd Avenue 1,701
Magnolia* 2801 34th Avenue W 5,859
Mobile Services 2025 9th Avenue 5,056
Montlake 2300 24th Avenue E 1,574
New Holly 7058 32nd Avenue S 4,000
Northeast* 6801 35th Avenue NE 15,000
Queen Anne* 400 W Garfield Street 7,931
Rainier Beach 9125 Rainier Avenue S 15,000
Southwest 9010 35th Avenue SW 7,557
University* 5009 Roosevelt Way NE 8,104
Wallingford 1501 N 45th Street 2,000
Wash. Talking Book and Braille Library‡ 2021 9th Avenue 10,000
538Seattle 2035Appendices Capital Facilities Appendix
Branch Name Address Size in Sq. Ft.
West Seattle* 2306 42nd Avenue SW 8,970
*City of Seattle Landmark or located in City landmark/special review district ‡City historic resource survey properties
Seattle Center
Inventory (See Capital Facilities Appendix Figure A-12)
Seattle Center serves as an extraordinary arts, civic, and public family gathering place for our region, located on a seventy-four-acre campus in the middle of the Seattle urban core. Over thirty cultural, educational, sports, and entertainment resident organizations at Seattle Center, together with a broad range of public and community programs, offer 5,000 events attracting twelve million visits each year. Seattle Center’s purpose is “to create exceptional events, experiences, and environments that delight and inspire the human spirit to build stronger communities.” Seattle Center activities generate $1.15 billion of business activity and $387 million of labor income a year.
The center is home to twelve theater spaces ranging in capacity from 200 seats in the Center Theatre to 2,900 at Marion Oliver McCaw Hall and totaling nearly 6,000 seats for theatrical performances. Sports facilities include the Key Arena with a capacity of 17,000 and Memorial Stadium with a capacity of 12,000 for field events. There are three schools on the campus—a ballet school, a school for 3-D animation and gaming, and a public high school. There are ten fountains on the grounds and approximately 40 acres of landscaped and green open space and pedestrian ways. There are also active outdoor spaces, including a children’s playground and a skate park. Seattle Center’s outdoor open spaces, gardens, and fountains are a major urban oasis for active or passive and individual or group enjoyment.
The center owns and manages two surface parking lots and three parking garages totaling more than 3,500 spaces. The center is served by multiple King County Metro bus routes and by the Monorail, which runs between Downtown and Seattle Center and carries more than 2 million riders a year over a 0.9-mile route.
Notable buildings and facilities on the Seattle Center campus include: KEXP; Seattle Center Armory; Key Arena; the Space Needle; International Fountain; Chihuly Garden and Glass; Experience Music Project; Memorial Stadium; Pacific Science Center; KCTS; McCaw Hall; Phelps Center and Ballet School; Seattle Children’s Theatre; Seattle Repertory Theatre; Seattle Children’s Museum; Fisher Pavilion; SIFF Film Center; The VERA Project; Pottery Northwest; the Northwest Rooms; Center Playground; Mercer Arena, and the Seattle Center Pavilion.
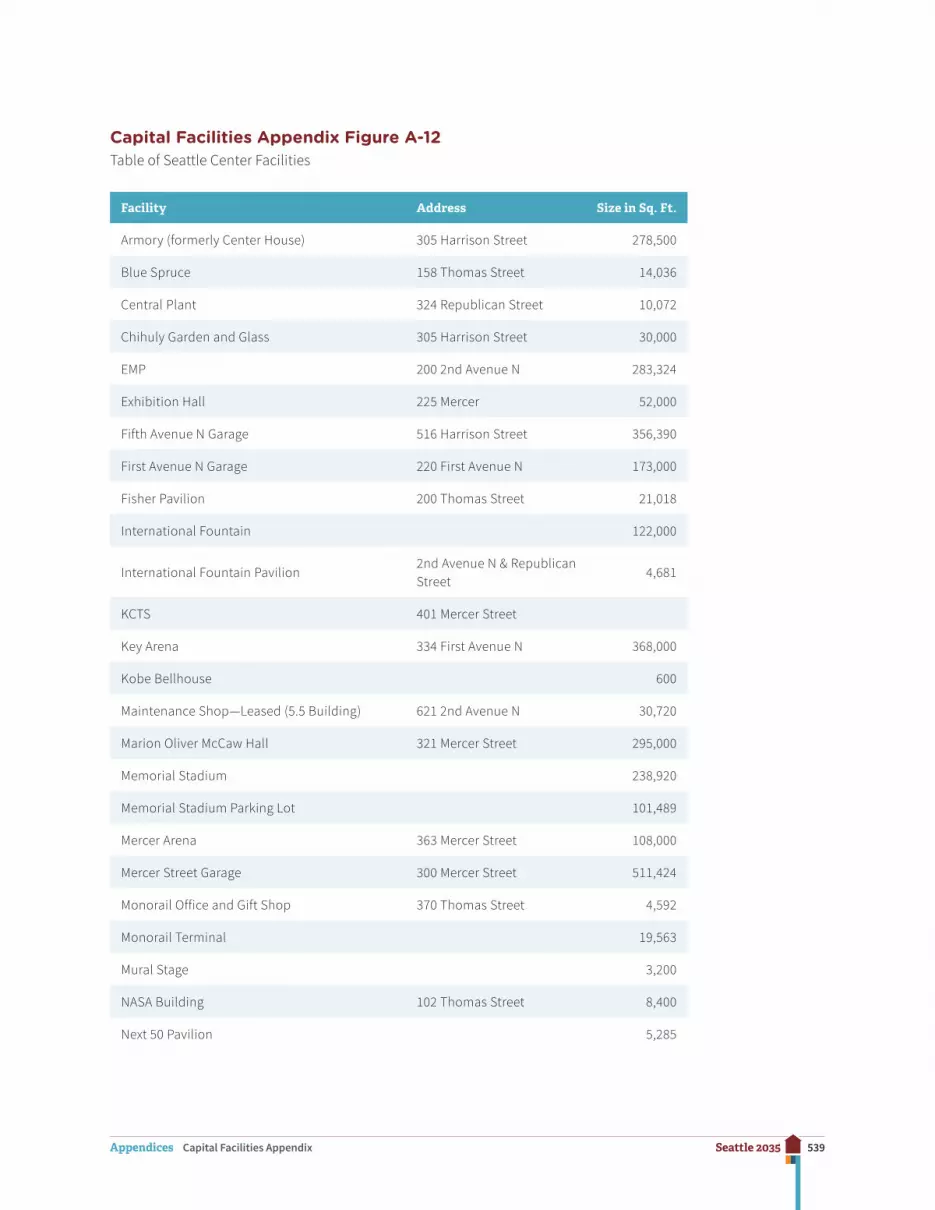
539Seattle 2035Appendices Capital Facilities Appendix
Capital Facilities Appendix Figure A-12Table of Seattle Center Facilities
Facility Address Size in Sq. Ft.
Armory (formerly Center House) 305 Harrison Street 278,500
Blue Spruce 158 Thomas Street 14,036
Central Plant 324 Republican Street 10,072
Chihuly Garden and Glass 305 Harrison Street 30,000
EMP 200 2nd Avenue N 283,324
Exhibition Hall 225 Mercer 52,000
Fifth Avenue N Garage 516 Harrison Street 356,390
First Avenue N Garage 220 First Avenue N 173,000
Fisher Pavilion 200 Thomas Street 21,018
International Fountain 122,000
International Fountain Pavilion2nd Avenue N & Republican Street
4,681
KCTS 401 Mercer Street
Key Arena 334 First Avenue N 368,000
Kobe Bellhouse 600
Maintenance Shop—Leased (5.5 Building) 621 2nd Avenue N 30,720
Marion Oliver McCaw Hall 321 Mercer Street 295,000
Memorial Stadium 238,920
Memorial Stadium Parking Lot 101,489
Mercer Arena 363 Mercer Street 108,000
Mercer Street Garage 300 Mercer Street 511,424
Monorail Office and Gift Shop 370 Thomas Street 4,592
Monorail Terminal 19,563
Mural Stage 3,200
NASA Building 102 Thomas Street 8,400
Next 50 Pavilion 5,285
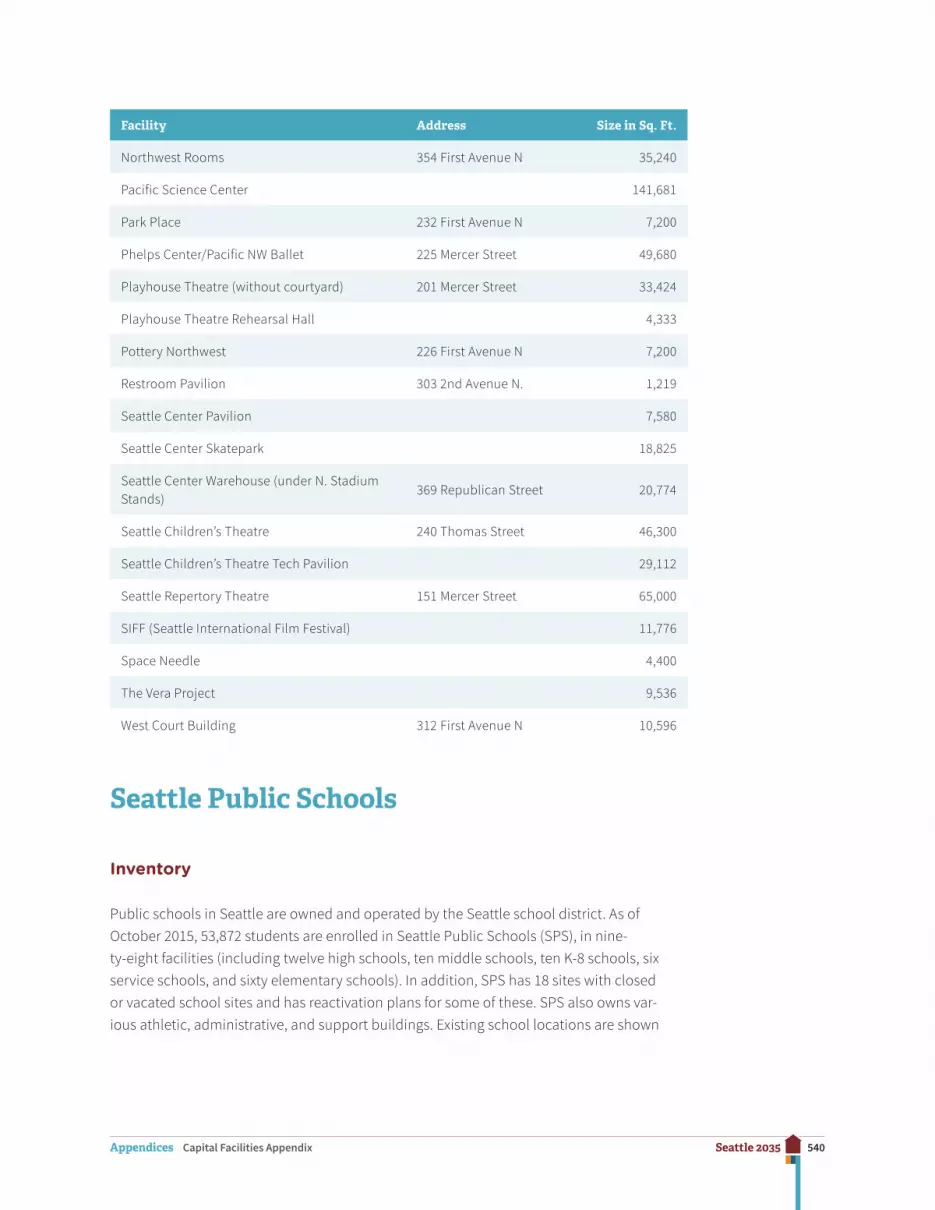
540Seattle 2035Appendices Capital Facilities Appendix
Facility Address Size in Sq. Ft.
Northwest Rooms 354 First Avenue N 35,240
Pacific Science Center 141,681
Park Place 232 First Avenue N 7,200
Phelps Center/Pacific NW Ballet 225 Mercer Street 49,680
Playhouse Theatre (without courtyard) 201 Mercer Street 33,424
Playhouse Theatre Rehearsal Hall 4,333
Pottery Northwest 226 First Avenue N 7,200
Restroom Pavilion 303 2nd Avenue N. 1,219
Seattle Center Pavilion 7,580
Seattle Center Skatepark 18,825
Seattle Center Warehouse (under N. Stadium Stands)
369 Republican Street 20,774
Seattle Children’s Theatre 240 Thomas Street 46,300
Seattle Children’s Theatre Tech Pavilion 29,112
Seattle Repertory Theatre 151 Mercer Street 65,000
SIFF (Seattle International Film Festival) 11,776
Space Needle 4,400
The Vera Project 9,536
West Court Building 312 First Avenue N 10,596
Seattle Public Schools
Inventory
Public schools in Seattle are owned and operated by the Seattle school district. As of October 2015, 53,872 students are enrolled in Seattle Public Schools (SPS), in nine-ty-eight facilities (including twelve high schools, ten middle schools, ten K-8 schools, six service schools, and sixty elementary schools). In addition, SPS has 18 sites with closed or vacated school sites and has reactivation plans for some of these. SPS also owns var-ious athletic, administrative, and support buildings. Existing school locations are shown
541Seattle 2035Appendices Capital Facilities Appendix
in Capital Facilities Appendix Figure A-13. (https://www.seattleschools.org/cms/one.aspx?portalId=627&pageId=665322)
Facilities Master Plan and Forecast of Future Needs
Capital facility planning is driven by a number of factors, including projected student popu-lation, curriculum goals, educational specifications (including classroom size and necessary facilities), and specialized needs of specific students. The SPS 2012 Facilities Master Plan is the latest plan. It provides planning information for a period of ten years through school year 2021–22. The plan guides future facilities improve-ments based on a needs analysis at the level of individual school service area. According to the 2012 plan, by 2022, over 57,000 students are projected to attend schools that have a present capacity of approximately 51,700. A facilities prioritization plan was adopted in 2015.
Strategies to Address Future Needs
For the majority of funding for facility construction and renovation, SPS relies on two voter-approved capital levies. These run on alternating six-year schedules and are called Building Excellence (BEX) and Buildings, Technology and Academics (BTA). BEX funds the renovation and replacement of schools, and BTA provides capital monies to repair existing building envelopes, replace roofs, improve mechanical/electrical/life-safety systems, and provide technology improvements.
Because capacity management continues to be an SPS priority, BEX and BTA help fund strategies to address capacity needs. These strategies include repurposing existing spaces, opening new schools, and adding portables. For example, some preschools are being re-opened, as is Lincoln High School. BTA IV was approved by Seattle voters in February 2016. It will provide funding for capacity improvements to four elementary schools, two middle schools, and one high school. Future BEX and BTA levies are planned through 2037, consis-tent with the 2035 horizon year of this Comprehensive Plan.
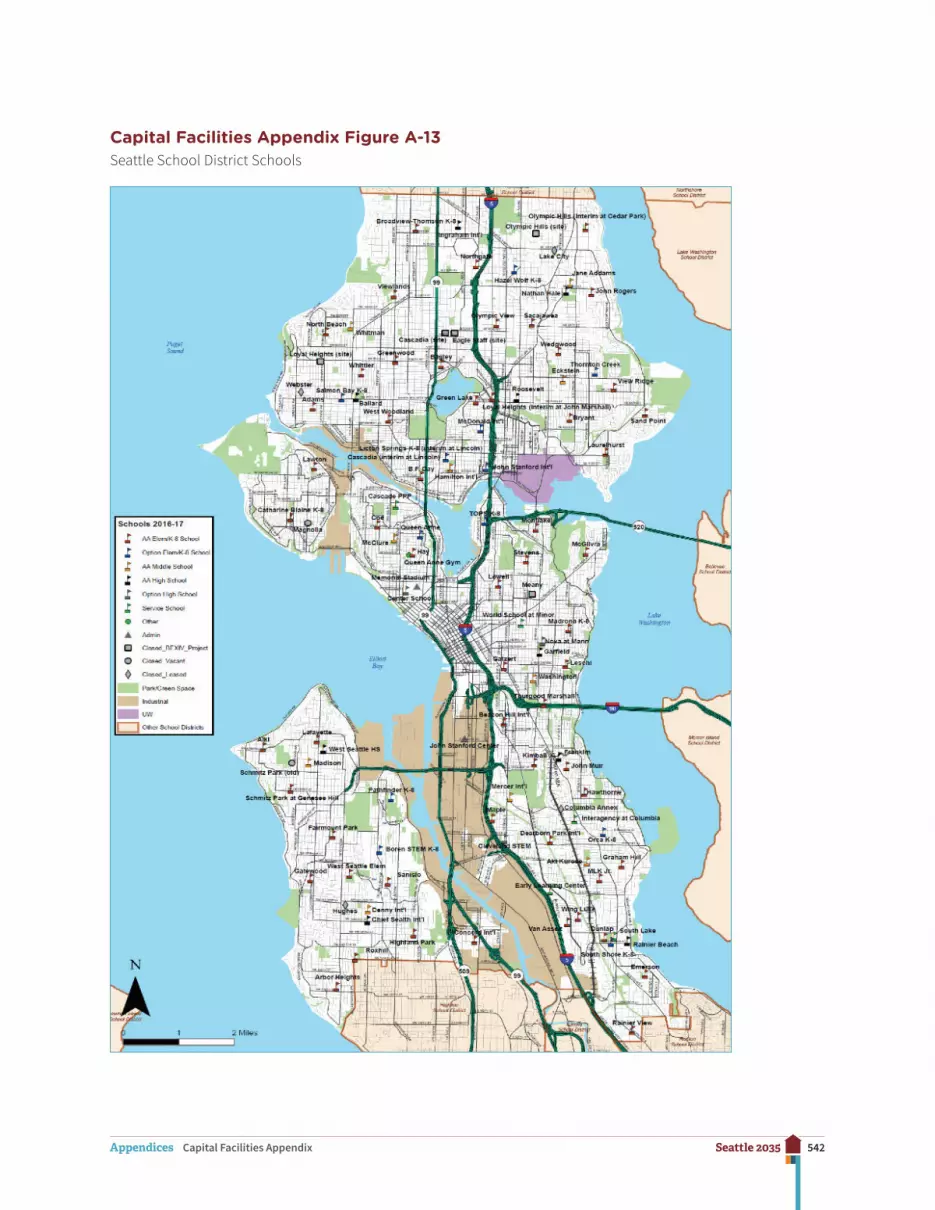
542Seattle 2035Appendices Capital Facilities Appendix
Capital Facilities Appendix Figure A-13Seattle School District Schools

543Seattle 2035Appendices Capital Facilities Appendix
Public Health
Public Health—Seattle & King County (Public Health) is a joint enterprise of the City of Seattle and King County and is responsible for the supervision and control of all public health and sanitation affairs in Seattle and King County. Public Health maintains a system of personal health, environmental health, health promotion, and disease prevention services through health centers/clinics and other service sites located in Seattle. The capacity and ownership of individual facilities are listed below.
Capital Facilities Appendix Figure A-14Table of Public Health Facilities
Health Facility Size in Sq. Ft. Tenancy
Chinook Building (Administration) 114,839 Owned
Columbia Health Center 28,094 Owned
Downtown Clinic 25,497 Leased
Harborview: STD Clinic 13,197 Owned
Harborview: Medical Examiner 34,147 Owned
Harborview: Public Health Laboratory 5,003 Owned
Harborview: TB Clinic 4,205 Owned
Lake City Dental Clinic 3,370 Leased
North District Health Center* 16,067 Owned
Rainier Beach Teen Clinic 800 Leased
*Scheduled for demolition in 2016
Facilities Serving Urban Centers
Following is an inventory of facilities that serve urban centers. Facilities do not have to be located within the boundaries or potential boundaries of the centers or villages in order to serve those areas.

544Seattle 2035Appendices Capital Facilities Appendix
Downtown Urban Center
Facility Type Name Location
Fire Station Headquarters 301 2nd Avenue S
Fire Station Fire Station 5 925 Alaskan Way
Fire Station Fire Station 2 2334 4th Avenue
Fire Station Fire Station 25 1300 E Pine Street
Police Station East Precinct 1519 12th Avenue
Library Central Library 1000 4th Avenue
Park Alaskan Way Boulevard Alaskan Way Blvd.
Park Bell Street Boulevard Bell Street Blvd. from 1st Avenue to 5th Avenue
Park Belltown Cottages 2520 Elliott Avenue
Park Boren-Pike-Pine Park Boren Avenue & Pike Street
Park City Hall Park 450 3rd Avenue
Park Denny Park 100 Dexter Avenue
Park Denny Playfield Westlake Avenue & Denny Way
Park Dr. Jose Rizal Park 1008 12th Avenue S
Park East Duwamish Greenbelt 2799 12th Avenue S
Park Freeway Park 700 Seneca Street
Park Harborview Park 778 Alder Street
Park Hing Hay Park 423 Maynard Avenue S
Park Int’l Children’s Park 700 S Lane Street
Park Kobe Terrace 221 6th Avenue S
Park McGraw Square Stewart Street & Westlake Avenue N
Park Myrtle Edwards Park 3130 Alaskan Way W
Park Occidental Square Occidental Avenue S & S Main Street
Park Plymouth Pillars Park Boren Avenue & Pike Street
Park Piers 62 and 63 1951 Alaska Way
Park Pioneer Square 100 Yesler Way

545Seattle 2035Appendices Capital Facilities Appendix
Facility Type Name Location
Park Prefontaine Place 3rd Avenue & Yesler Way
Park Regrade Park 2251 3rd Avenue
Park Seattle Aquarium Pier 59
Park Seattle CenterDenny Way & Republican Street (1st Avenue N to 5th Avenue N)
Park Sturgus Park 904 Sturgus Avenue S
Park Tillicum Place 5th Avenue & Denny Way
Park Union Station Square Jackson & 3rd Avenue S
Park Victor Steinbrueck Park 2001 Western Avenue
Park Waterfront Park 1301 Alaskan Way
Park Westlake Park 401 Pine Street
Park Westlake Square 1900 Westlake Avenue N
ParkYesler Terrace Community Center grounds
Yesler Way & Broadway Avenue
Schools
Gatzert and Lowell Elementary Schools
McClure and Washington Middle Schools
Garfield High School
Overall, City facilities are sufficient to accommodate expected twenty-year growth.
A replacement of the Fire Department’s headquarters building is expected for reasons other than as a result of development (the SFD headquarters is located in the urban center).
The City may seek to increase park space in the urban center to meet desired goals. While additions to the park facilities would enhance the City’s quality of life, such additions are not necessary to accommodate new households in urban centers or citywide.
Some of the schools serving this urban center are projected to exceed their capacity, given existing attendance area boundaries and other factors. Given that Seattle Public Schools has planned investments to meet citywide capacity needs, capacity issues could potentially be solved by modifying attendance area boundaries, allowing more students to transfer to other schools, or other strategies. Seattle Public Schools is also evaluating the creation of a Downtown elementary school. This could help create a local school option as well as assist with capacity issues.

546Seattle 2035Appendices Capital Facilities Appendix
First Hill/Capitol Hill Urban Center
Facility Type Name Location
Fire Station Fire Station 25 1300 E Pine Street
Fire Station Fire Station 10 301 2nd Avenue S
Fire Station Fire Station 22 901 E Roanoke Street
Fire Station Fire Station 6 101 23rd Avenue S
Library Capitol Hill Branch 425 Harvard Avenue E
Library Central Library 1000 4th Avenue
Library Douglass Truth Branch 2300 E Yesler Way
Community Center Yesler Playfield & Community Center 903 Yesler Way
Park 12th & E James Street Park 12th Avenue & E James Street
Park Bellevue Place Bellevue Pl. E & Bellevue Avenue E
Park Belmont Place Belmont Pl. E & Belmont Avenue E
Park Boren Place Broadway & Boren Avenue S
Park Boren-Pike-Pine Park Boren Avenue & Pike Street
Park Boylston Place Broadway Avenue & Boylston Avenue E
Park Cal Anderson Park 1635 11th Avenue
Park Federal & Republican Federal Avenue & Republican Street
Park First Hill Park University Street & Minor Avenue E
Park Freeway Park 700 Seneca Street
Park Harborview Park 778 Alder Street
Park Horiuchi Park 156 Boren Avenue
Park Kobe Terrace 221 6th Avenue S
Park McGilvra Place E Madison Street & Pike Street
Park Miller Playfield 400 19th Avenue E
Park Plymouth Pillars Boren Avenue & Pike Street
Park Seven Hills 1514 E Howell Street
Park Spring Street Mini Park E Spring Street & 15th Avenue

547Seattle 2035Appendices Capital Facilities Appendix
Facility Type Name Location
Park Spruce & Squire Park 156 Boren Avenue
Park Summit Place Belmont Avenue E & Bellevue Pl. E
Park Tashkent Park 511 Boylston Avenue
Park Thomas Street Mini Park 306 Bellevue Avenue E
Park Volunteer Park 1247 15th Avenue E
Park Volunteer Parkway 14th Avenue E (E Prospect Street to E Roy Street)
Park Williams Place 15th Avenue E & E John Street
Police Station East Precinct 1519 12th Avenue
Schools
Gatzert, Lowell, Madrona, and Stevens Elementary Schools
Meany and Washington Middle Schools
Garfield High School
Overall, City facilities are sufficient to accommodate expected twenty-year growth. The City may seek to increase park space in the urban center to meet desired goals. While additions to the park facilities would enhance the City’s quality of life, such additions are not neces-sary to accommodate new households in urban centers or citywide.
Some of the schools serving this urban center are projected to exceed their capacity, given existing attendance area boundaries and other factors. Meany Middle School is proposed to be reconfigured to accommodate more students. Given that Seattle Public Schools has planned investments to meet citywide capacity needs, capacity issues could potentially be solved by the Meany reconfiguration and modifying attendance area boundaries, by allow-ing more students to transfer to other schools, or by other strategies. Seattle Public Schools is also evaluating the creation of a Downtown elementary school. This could help create a local school option as well as assisting with capacity issues.
University Community Urban Center
Facility Type Name Location
Fire Station SFD 17 1050 NE 50th Street
Fire Station SFD 38 5503 33rd Avenue NE
Library Northeast Branch 6801 35th Avenue NE
Library University Branch 5009 Roosevelt Way NE
Park 17th Ave NE Centerstrip 17th Avenue NE (NE 45th Street to NE Ravenna Blvd.)
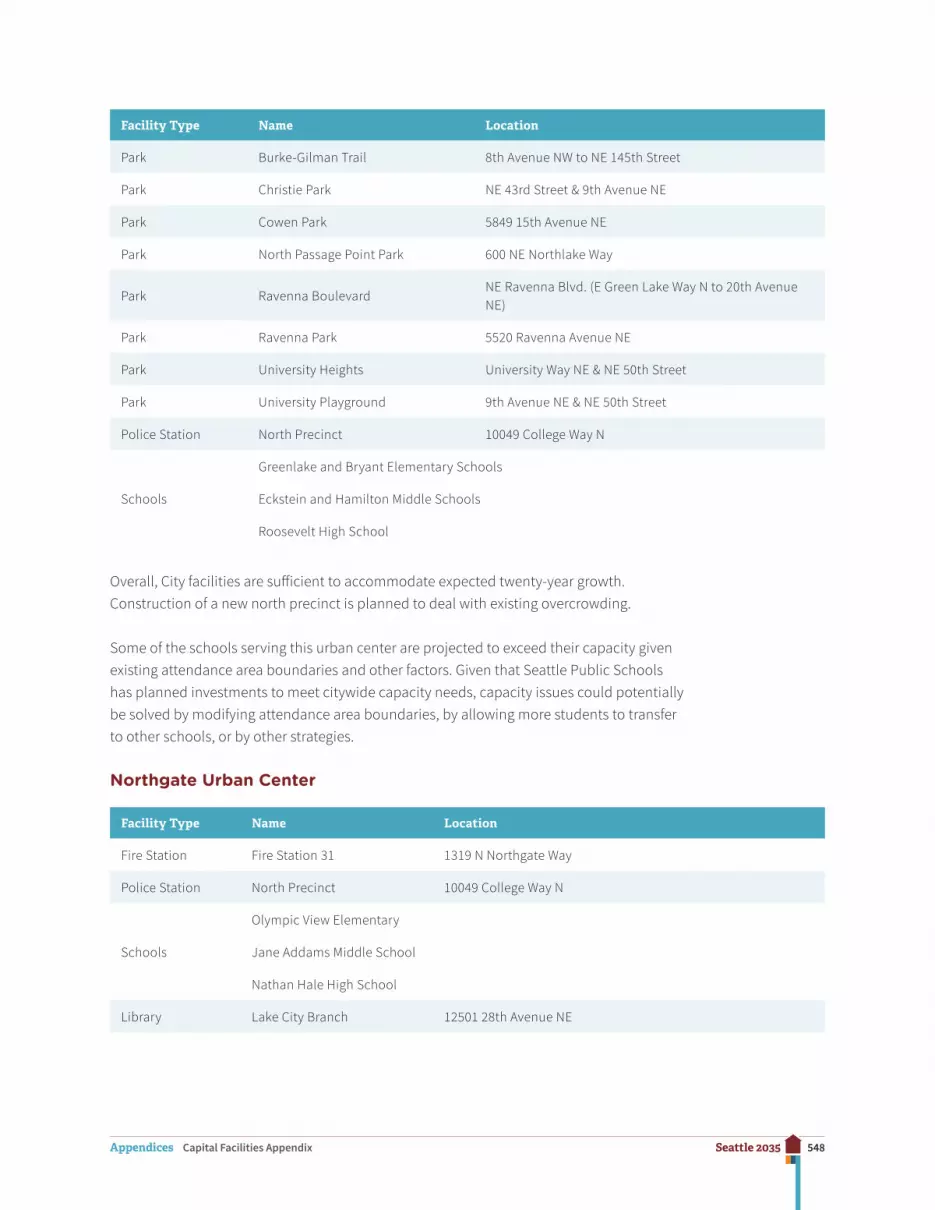
548Seattle 2035Appendices Capital Facilities Appendix
Facility Type Name Location
Park Burke-Gilman Trail 8th Avenue NW to NE 145th Street
Park Christie Park NE 43rd Street & 9th Avenue NE
Park Cowen Park 5849 15th Avenue NE
Park North Passage Point Park 600 NE Northlake Way
Park Ravenna BoulevardNE Ravenna Blvd. (E Green Lake Way N to 20th Avenue NE)
Park Ravenna Park 5520 Ravenna Avenue NE
Park University Heights University Way NE & NE 50th Street
Park University Playground 9th Avenue NE & NE 50th Street
Police Station North Precinct 10049 College Way N
Schools
Greenlake and Bryant Elementary Schools
Eckstein and Hamilton Middle Schools
Roosevelt High School
Overall, City facilities are sufficient to accommodate expected twenty-year growth. Construction of a new north precinct is planned to deal with existing overcrowding.
Some of the schools serving this urban center are projected to exceed their capacity given existing attendance area boundaries and other factors. Given that Seattle Public Schools has planned investments to meet citywide capacity needs, capacity issues could potentially be solved by modifying attendance area boundaries, by allowing more students to transfer to other schools, or by other strategies.
Northgate Urban Center
Facility Type Name Location
Fire Station Fire Station 31 1319 N Northgate Way
Police Station North Precinct 10049 College Way N
Schools
Olympic View Elementary
Jane Addams Middle School
Nathan Hale High School
Library Lake City Branch 12501 28th Avenue NE
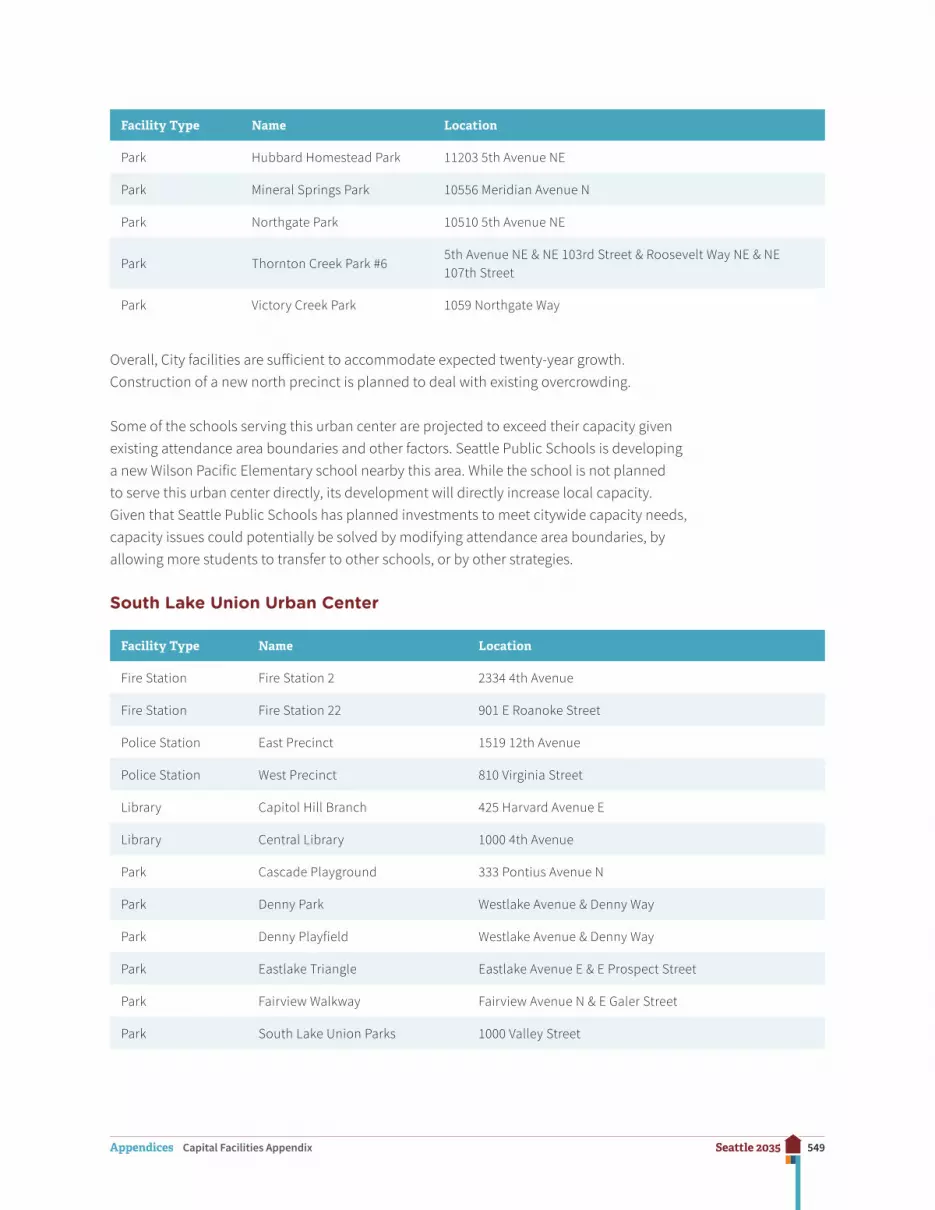
549Seattle 2035Appendices Capital Facilities Appendix
Facility Type Name Location
Park Hubbard Homestead Park 11203 5th Avenue NE
Park Mineral Springs Park 10556 Meridian Avenue N
Park Northgate Park 10510 5th Avenue NE
Park Thornton Creek Park #65th Avenue NE & NE 103rd Street & Roosevelt Way NE & NE 107th Street
Park Victory Creek Park 1059 Northgate Way
Overall, City facilities are sufficient to accommodate expected twenty-year growth. Construction of a new north precinct is planned to deal with existing overcrowding.
Some of the schools serving this urban center are projected to exceed their capacity given existing attendance area boundaries and other factors. Seattle Public Schools is developing a new Wilson Pacific Elementary school nearby this area. While the school is not planned to serve this urban center directly, its development will directly increase local capacity. Given that Seattle Public Schools has planned investments to meet citywide capacity needs, capacity issues could potentially be solved by modifying attendance area boundaries, by allowing more students to transfer to other schools, or by other strategies.
South Lake Union Urban Center
Facility Type Name Location
Fire Station Fire Station 2 2334 4th Avenue
Fire Station Fire Station 22 901 E Roanoke Street
Police Station East Precinct 1519 12th Avenue
Police Station West Precinct 810 Virginia Street
Library Capitol Hill Branch 425 Harvard Avenue E
Library Central Library 1000 4th Avenue
Park Cascade Playground 333 Pontius Avenue N
Park Denny Park Westlake Avenue & Denny Way
Park Denny Playfield Westlake Avenue & Denny Way
Park Eastlake Triangle Eastlake Avenue E & E Prospect Street
Park Fairview Walkway Fairview Avenue N & E Galer Street
Park South Lake Union Parks 1000 Valley Street

550Seattle 2035Appendices Capital Facilities Appendix
Facility Type Name Location
Park Bellevue Place Bellevue Pl. E & Bellevue Avenue E
Park NE Queen Anne Greenbelt 1920 Taylor Avenue N
Schools
Lowell Elementary School
McClure Middle School
Garfield and Ballard High Schools
Overall, City facilities are sufficient to accommodate expected twenty-year growth. To support the SFD’s desired goal of timely emergency response in all areas of the city, a new South Lake Union fire station is needed under existing conditions.
Some of the schools serving this urban center are projected to exceed their capacity given existing attendance area boundaries and other factors. Given that Seattle Public Schools has planned investments to meet citywide capacity needs, capacity issues could potentially be solved by modifying attendance area boundaries, by allowing more students to transfer to other schools, or by other strategies. Seattle Public Schools is also evaluating the creation of a Downtown elementary school. This could help create a local school option as well as assisting with capacity issues.
Uptown Urban Center
Facility Type Name Location
Fire Station Fire Station 8 110 Lee Street
Fire Station Fire Station 2 2334 4th Avenue
Police Station West Precinct 810 Virginia Street
Library Queen Anne Branch 400 W Garfield
Library Central Library 1000 4th Avenue
Community Center Queen Anne Community Center 1901 1st Avenue W
Park Alaskan Way Boulevard Alaskan Way Blvd.
Park Counterbalance Park Queen Anne Avenue N & Roy Street
Park Elliott Bay Park Pier 86
Park Kinnear Park 899 W Olympic Pl.
Park Bhy Kracke 1215 5th Avenue N
Park Kerry Park 211 W Highland Dr.

551Seattle 2035Appendices Capital Facilities Appendix
Facility Type Name Location
Park Myrtle Edwards Park 3130 Alaskan Way W
Park Northeast Queen Anne Greenbelt 1920 Taylor Avenue N
Park Seattle CenterDenny Way & Republican Street (1st Avenue N to 5th Avenue N)
Park SW Queen Anne Greenbelt W Howe Street & 12th Avenue W
Park Ward Springs Park Ward Street & 4th Avenue N
Schools
Hay Elementary School
McClure Middle School
Ballard High School
Overall, City facilities are sufficient to accommodate expected twenty-year growth.
Some of the schools serving this urban center are projected to exceed their capacity given existing attendance area boundaries and other factors. Given that Seattle Public Schools has planned investments to meet citywide capacity needs, capacity issues could potentially be solved by modifying attendance area boundaries, by allowing more students to transfer to other schools, or by other strategies. Seattle Public Schools is also evaluating the creation of a Downtown elementary school. This school could help create a local school option as well as assisting with capacity issues.
Potential Future Discretionary Projects
Besides the facilities in the City’s CIP, there are a number of prospective capital projects that the City might undertake or fund in the future. They are listed below to provide a broad view of the City’s potential future capital spending. Projects are not listed in any priority order. Funding for these projects may not yet be identified and decisions may not yet have been made to go forward with funding these projects.
Fire
• South Lake Union Fire Station development• Freshwater Marine Station relocation• Fire Administration Building relocation• Fire Marshal’s Office relocation• Warehouse Space replacement• Training Facilities expansion
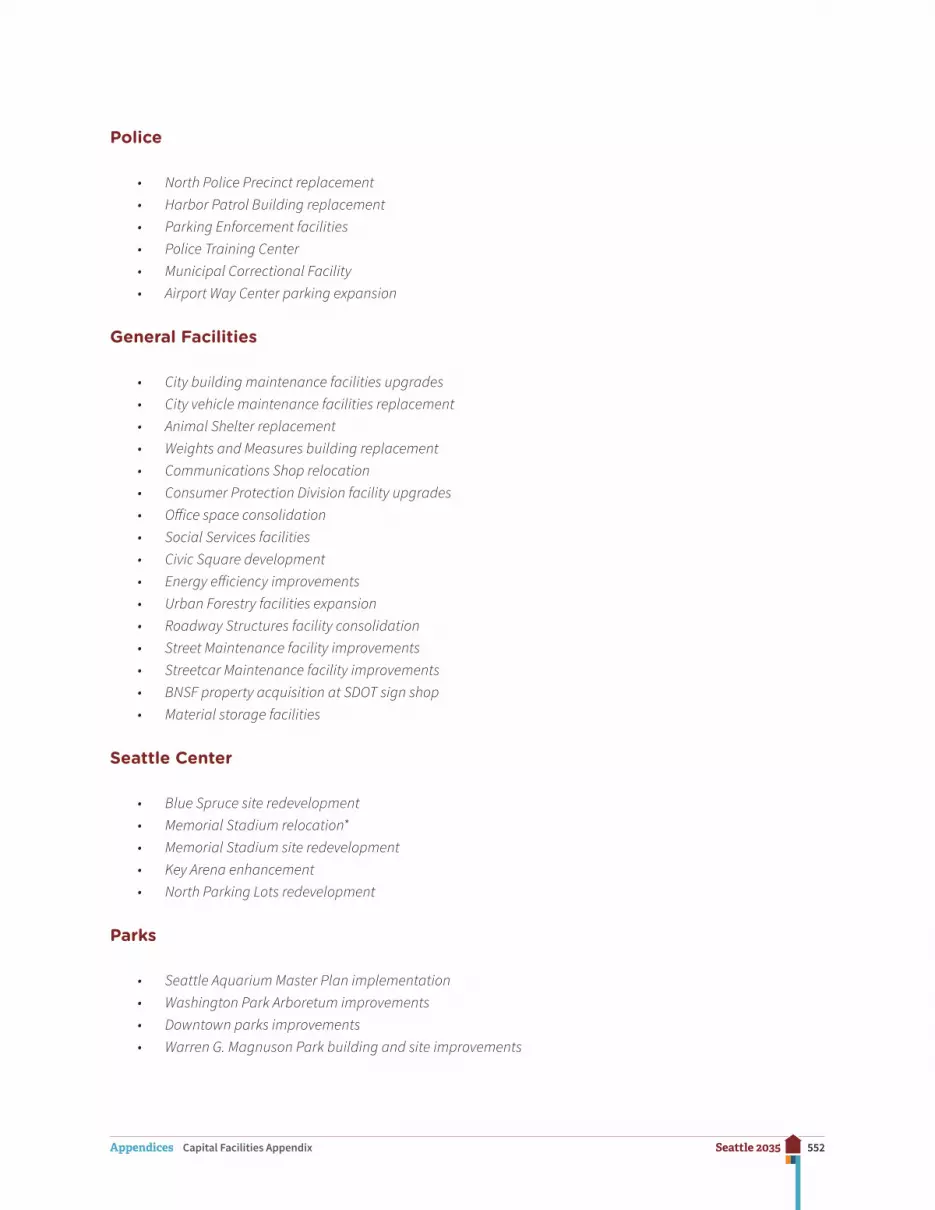
552Seattle 2035Appendices Capital Facilities Appendix
Police
• North Police Precinct replacement• Harbor Patrol Building replacement• Parking Enforcement facilities• Police Training Center• Municipal Correctional Facility• Airport Way Center parking expansion
General Facilities
• City building maintenance facilities upgrades• City vehicle maintenance facilities replacement • Animal Shelter replacement• Weights and Measures building replacement• Communications Shop relocation• Consumer Protection Division facility upgrades• Office space consolidation • Social Services facilities• Civic Square development• Energy efficiency improvements• Urban Forestry facilities expansion• Roadway Structures facility consolidation• Street Maintenance facility improvements• Streetcar Maintenance facility improvements• BNSF property acquisition at SDOT sign shop• Material storage facilities
Seattle Center
• Blue Spruce site redevelopment • Memorial Stadium relocation*• Memorial Stadium site redevelopment • Key Arena enhancement• North Parking Lots redevelopment
Parks
• Seattle Aquarium Master Plan implementation• Washington Park Arboretum improvements• Downtown parks improvements• Warren G. Magnuson Park building and site improvements

553Seattle 2035Appendices Capital Facilities Appendix
• Seattle Park District implementation• Regional and neighborhood park improvements • Waterfront improvements
Library
• Facility shops relocation
(At the time of publication, project with an * is owned or sponsored by another government agency or private organization. The City might participate in funding this project.)
554Seattle 2035Appendices Utilities Appendix
Utilities Appendix
City Utilities: Inventory, Capacity, and
Future Needs Assessment
Seattle City Light: Electricity
Seattle City Light (SCL) is the City-owned electric utility serving all of Seattle and some por-tions of other cities and unincorporated King County north and south of the city limits.
Seattle City Light: Inventory & Capacity
SCL supplies power from a portfolio of sources that includes self-generated assets and pur-chased power. SCL typically purchases 50 percent of all power delivered to its customers. Utilities Appendix Figure A-1 below shows the sources of power.
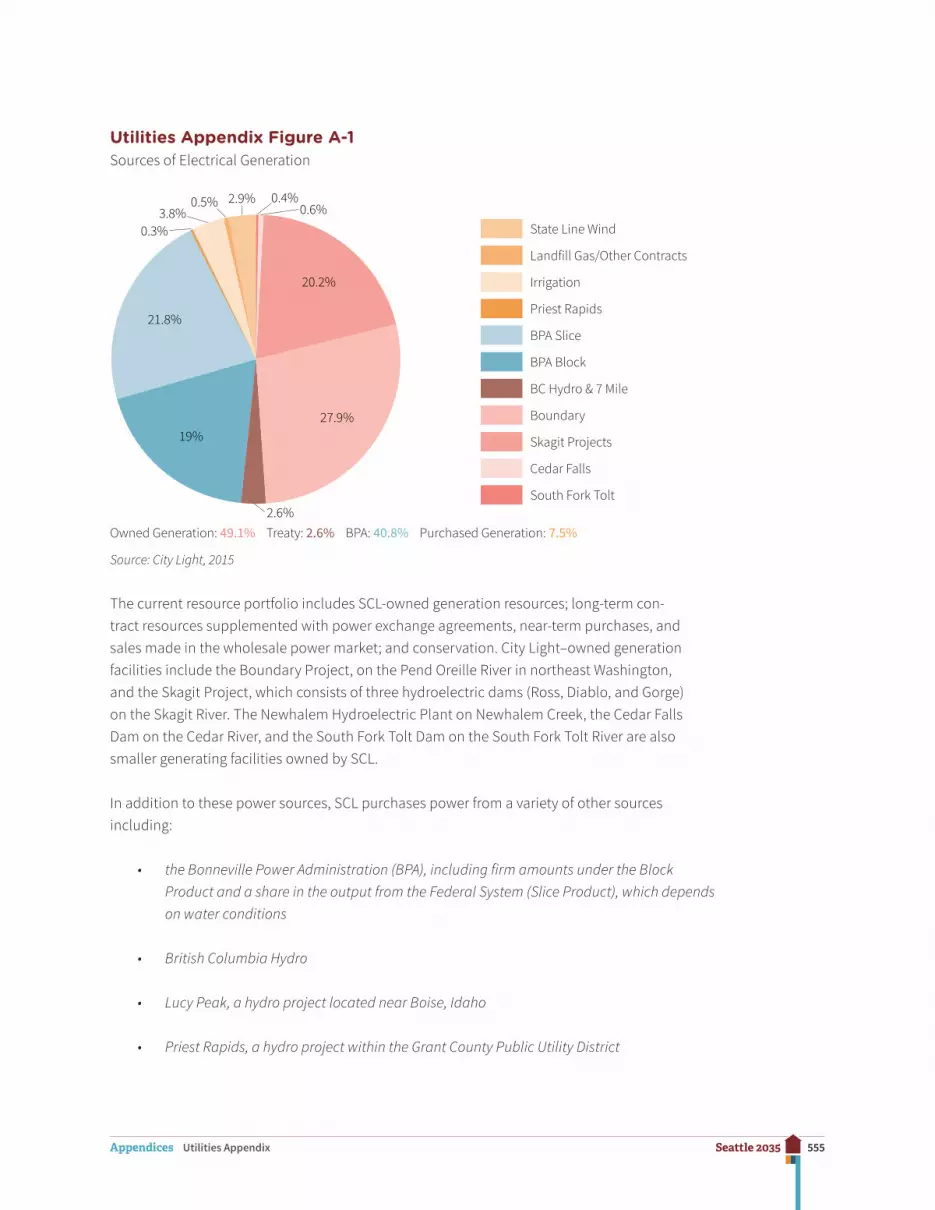
555Seattle 2035Appendices Utilities Appendix
Utilities Appendix Figure A-1Sources of Electrical Generation
State Line Wind
Landfill Gas/Other Contracts
Irrigation
Priest Rapids
BPA Slice
BPA Block
BC Hydro & 7 Mile
Boundary
Skagit Projects
Cedar Falls
South Fork Tolt
Owned Generation: 49.1% Treaty: 2.6% BPA: 40.8% Purchased Generation: 7.5%
2.9%0.5%3.8%
0.3%
21.8%
19%
2.6%
27.9%
20.2%
0.6%0.4%
Source: City Light, 2015
The current resource portfolio includes SCL-owned generation resources; long-term con-tract resources supplemented with power exchange agreements, near-term purchases, and sales made in the wholesale power market; and conservation. City Light–owned generation facilities include the Boundary Project, on the Pend Oreille River in northeast Washington, and the Skagit Project, which consists of three hydroelectric dams (Ross, Diablo, and Gorge) on the Skagit River. The Newhalem Hydroelectric Plant on Newhalem Creek, the Cedar Falls Dam on the Cedar River, and the South Fork Tolt Dam on the South Fork Tolt River are also smaller generating facilities owned by SCL.
In addition to these power sources, SCL purchases power from a variety of other sources including:
• the Bonneville Power Administration (BPA), including firm amounts under the Block Product and a share in the output from the Federal System (Slice Product), which depends on water conditions
• British Columbia Hydro
• Lucy Peak, a hydro project located near Boise, Idaho
• Priest Rapids, a hydro project within the Grant County Public Utility District
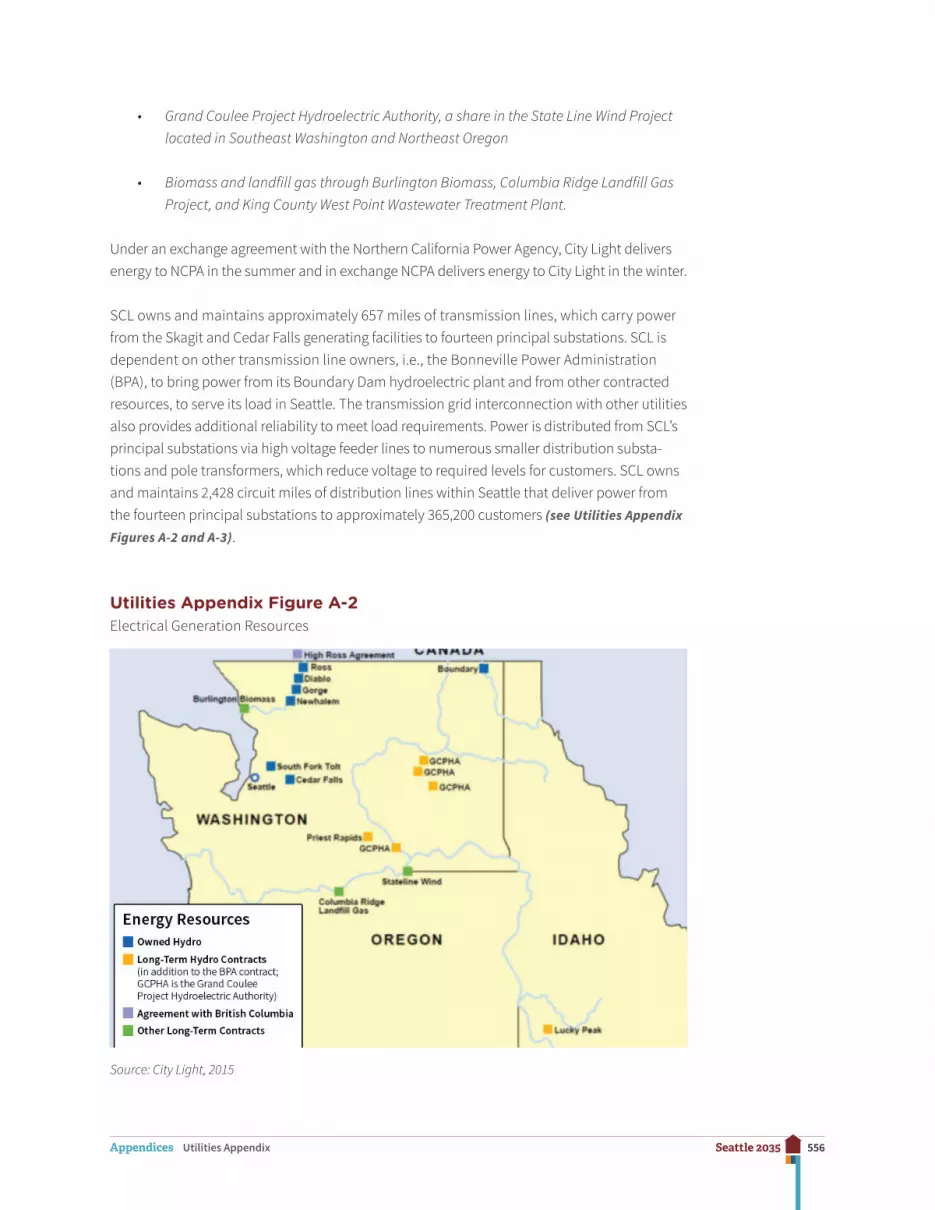
556Seattle 2035Appendices Utilities Appendix
• Grand Coulee Project Hydroelectric Authority, a share in the State Line Wind Project located in Southeast Washington and Northeast Oregon
• Biomass and landfill gas through Burlington Biomass, Columbia Ridge Landfill Gas Project, and King County West Point Wastewater Treatment Plant.
Under an exchange agreement with the Northern California Power Agency, City Light delivers energy to NCPA in the summer and in exchange NCPA delivers energy to City Light in the winter.
SCL owns and maintains approximately 657 miles of transmission lines, which carry power from the Skagit and Cedar Falls generating facilities to fourteen principal substations. SCL is dependent on other transmission line owners, i.e., the Bonneville Power Administration (BPA), to bring power from its Boundary Dam hydroelectric plant and from other contracted resources, to serve its load in Seattle. The transmission grid interconnection with other utilities also provides additional reliability to meet load requirements. Power is distributed from SCL’s principal substations via high voltage feeder lines to numerous smaller distribution substa-tions and pole transformers, which reduce voltage to required levels for customers. SCL owns and maintains 2,428 circuit miles of distribution lines within Seattle that deliver power from the fourteen principal substations to approximately 365,200 customers (see Utilities Appendix Figures A-2 and A-3).
Utilities Appendix Figure A-2Electrical Generation Resources
Source: City Light, 2015
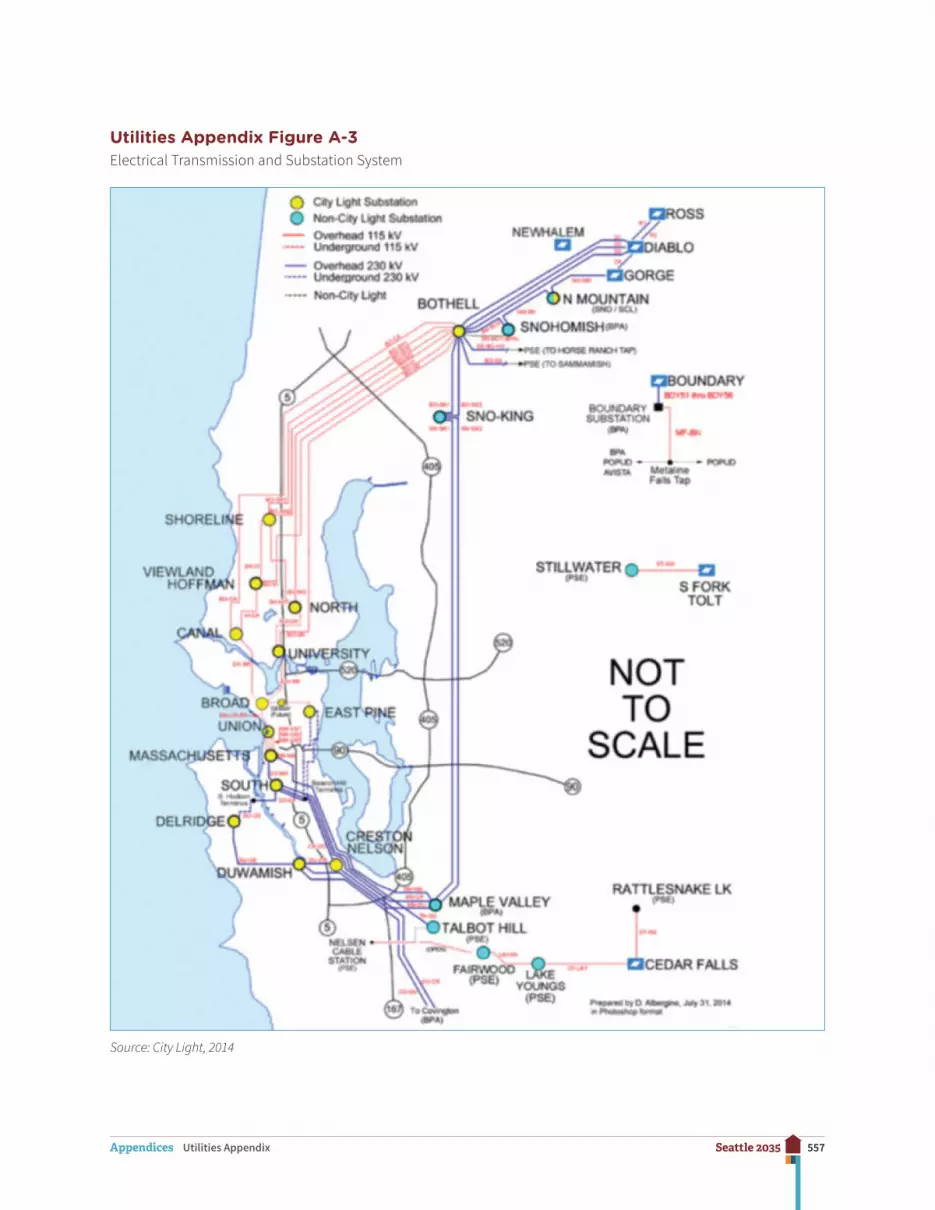
557Seattle 2035Appendices Utilities Appendix
Utilities Appendix Figure A-3Electrical Transmission and Substation System
Source: City Light, 2014
558Seattle 2035Appendices Utilities Appendix
SCL’s current generation capability (owned and contracted) is adequate to serve existing customers. Because of the nature of City Light’s hydroelectric system, the utility is not presently constrained by its ability to meet peak loads (typically referred to as capacity). At times, the system may be constrained in its ability to carry load over periods of heavy load hours (6 a.m. to 10 p.m.) during the winter. On an average monthly basis, City Light currently has sufficient resources to meet expected customer load in the next few years, even under serious drought conditions.
SCL sells on the wholesale energy markets the energy it does not need to meet customer load. The utility also buys energy in the wholesale markets to enhance the value of its re-source portfolio and to meet occasional short-term energy deficits.
Seattle City Light: Future Needs Assessment
New resources will be needed to meet load growth and to comply with I-937 over the next twenty years. The timing of resource acquisition depends on the rate of load growth, hydro volatility, together with the I-937 schedule for acquiring renewable resources and/or renew-able energy credits.
For the transmission and distribution components of SCL’s system, projected growth will be accommodated by planned transmission and distribution capacity additions. The pending addition of a Downtown substation will meet the load growth in Denny Triangle and South Lake Union.
Capacity would also be expanded at the North, Duwamish, Shoreline, University, and Creston substations. New substations also may be built in the next five to twenty years in Interbay, SODO, and the Highline area, depending on load growth projections and emerging real construction. Substations in the northeast and northwest parts of the City may also be built in the twenty-year period. City Light owns properties for the Interbay, Northeast, and Northwest substations.
Seattle Public Utilities: Drinking Water
Seattle Public Utilities (SPU) provides drinking water to a service area population of 1.3 mil-lion within the greater Seattle metropolitan region of King County and portions of southern Snohomish County. SPU provides retail water service to customers in the City of Seattle, and portions of the cities of Shoreline, Lake Forest Park, and Burien, as well as portions of unin-corporated King County south of the City of Seattle. SPU also provides retail water service to Shorewood Apartments on Mercer Island and Seattle Tacoma International Airport. In ad-dition, SPU sells wholesale water to nineteen municipalities and special-purpose districts, plus Cascade Water Alliance, who in turn provide the water to their own retail customers (see Utilities Appendix Figure A-4). SPU operates under an annual operating permit issued by
559Seattle 2035Appendices Utilities Appendix
the Washington State Department of Health. More information about the water system can be found in Seattle’s latest Water System Plan.
Seattle Public Utilities: Inventory & Capacity
SPU supplies drinking water from two major water supply sources, the Cedar River Watershed and the South Fork of the Tolt River Watershed, both on the western slopes of the Cascade Mountains. In addition, a small amount of water from Seattle Well Fields, which are located north of Seattle Tacoma International Airport, is available to provide drought and emergency supply. In total, these sources can supply up to 172 million gallons of water per day on an average annual basis. Water from these sources is treated to meet drinking water quality regulations. The treated water is then delivered to Seattle retail and wholesale customers through a network of approximately 1,880 miles of transmission and distribution system pipelines, 400 million gallons of treated water storage facilities (reservoirs, tanks, and standpipes), and thirty-one pump stations. System-wide treatment and transmission capacity is 310 million gallons per day (see Utilities Appendix Figure A-4).

560Seattle 2035Appendices Utilities Appendix
Utilities Appendix Figure A-4Drinking Water Service Area
Source: Seattle Public Utilities
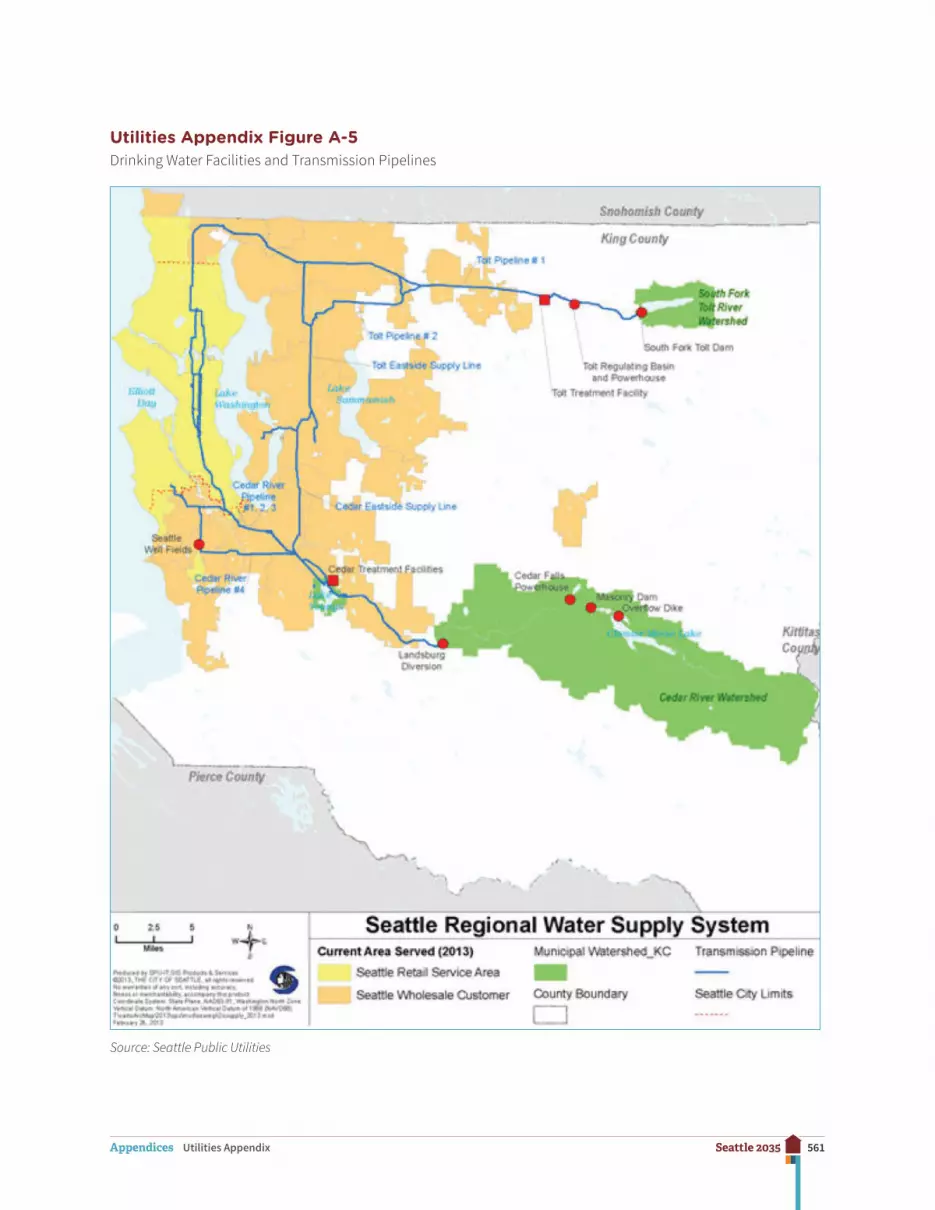
561Seattle 2035Appendices Utilities Appendix
Utilities Appendix Figure A-5Drinking Water Facilities and Transmission Pipelines
Source: Seattle Public Utilities
562Seattle 2035Appendices Utilities Appendix
Seattle Public Utilities: Future Needs Assessment
SPU expects water supply to be adequate to serve the City’s existing and forecast popu-lation for at least the next twenty years. This assessment considered an analysis of future climate change impacts on both supply and demand. That analysis indicated that, although available supply could be reduced by as much as 4 percent in 2025 and 6 percent in 2050 under the warmest climate change scenario analyzed, this reduced supply would still ex-ceed climate-impacted demands in those time periods.
One reason for this outlook is the anticipated continued reduction in per capita water use in SPU’s service area. Total water use in SPU’s regional water system declined by 15 per-cent from 2000 to 2013 while the population served has grown by 30 percent. The regional water conservation program administered by SPU for the Saving Water Partnership—a collaborative program run by Seattle and eighteen of SPU’s wholesale customers—has been a contributor to this reduction in water use. For the 2013–2018 period, the Saving Water Partnership has set a goal to reduce per capita water use from current levels so that total average annual retail water use of members of the Saving Water Partnership is less than 105 million gallons per day despite forecasted population growth.
Distribution and storage facilities that serve Seattle residents and businesses have adequate capacity to serve the city. There are, however, a few areas where SPU’s water system has hydrants that cannot provide fire flows to existing buildings as required under current codes for new buildings. This can be caused by a combination of factors including pipes with small diameters or areas with low water pressure due to older design standards, or pipes whose interiors have been reduced by deposits. There are also areas that were originally built to now-obsolete fire codes. Depending on the location and type of development, parts of SPU’s water distribution system may need to be upgraded to meet current fire flow stan-dards for the planned development. Additionally, there are also parts of the retail service area in which water mains need to be extended to serve a particular parcel. SPU will work with developers to have needed water infrastructure in place for the development.
In addition to the distribution system improvements needed to support new development, investments are needed to replace aging infrastructure that has reached the end of its eco-nomic life. SPU is currently applying an asset management assessment to determine which facilities would be replaced using the funds available in the six-year CIP instead of being repaired.
Seattle Public Utilities: Drainage & Sewer
Seattle Public Utilities is charged with managing drainage and sewer systems to meet public safety, water quality, and resource protection goals. SPU’s drainage and sewer service area covers the City of Seattle. King County is responsible for operating the sewage treatment

563Seattle 2035Appendices Utilities Appendix
plants that treat all City of Seattle sewage as well as the interceptor lines that deliver sewage to these facilities.
Seattle Public Utilities: Inventory & Capacity
Although a few small areas are still served by septic systems, almost all areas of the city are served by sewer. Three types of drainage and sewer systems are used in Seattle:
• combined drainage and sewer (a single set of pipes carries water from drainage water and sewage)
• separate drainage sewer systems (the pipes carrying drainage are completely separate from the pipes carrying sewage), and
• partially separated drainage and sewer (one set of pipes carries sewage and some drainage water—generally from street runoff—while the other set carries only drainage water).
The SPU system collects residential, commercial, and industrial sewage and delivers it to in-terceptor lines operated by the regional sewage treatment agency (King County). While King County operates a regional system including various treatment plants, sewage from Seattle is primarily treated at the West Point Sewage Treatment Plant before being discharged into Puget Sound (see Utilities Appendix Figure A-5). The West Point Treatment Plant is a second-ary treatment facility, with a monthly average capacity of 133 million gallons per day (MGD) and daily peak flow capacity of 440 MGD. Of the daily peak flow capacity, 300 MGD would receive secondary treatment and the remainder would receive primary treatment. The West Point Treatment Plant serves 1.3 million people including residents of Seattle, King County north of Seattle, and South Snohomish County.
The capacity of the drainage and sewer system in some areas is limited during peak storm events. During or following intense or prolonged periods of rainfall, some of the systems cannot accommodate the combined drainage and sewage flows, resulting in combined sewer overflows (CSOs) being discharged into area waters. CSOs occur in both the regional and the City systems. There are two “wet weather” treatment facilities, Alki and Carkeek, that partially treat a portion of this overflow, but in many areas the overflows discharge completely untreated water.
The City of Seattle has prepared a comprehensive strategy, called The Plan to Protect Seattle’s Waterways, to reduce overflows and discharge of pollutants from combined sewers and the storm drain system. This plan identifies areas of Seattle where projects are needed to reduce CSOs, evaluates alternatives for reducing CSOs in these areas, and recommends a schedule for designing and constructing projects.
564Seattle 2035Appendices Utilities Appendix
Seattle Public Utilities: Future Needs Assessment
Generally, the City-operated drainage and sewer facilities in Seattle have been planned and sized to serve the maximum or build-out conditions under zoning at the time and will be adequate to serve the level of increased growth proposed in the plan. The capacity of the sewer system is limited in confined areas of the city, where there have been historic hydrau-lic and system backup problems. In addition, there are areas of drainage deficiencies and water quality issues in the city. These problems are being addressed through developer- funded facility upgrades and by Seattle Public Utilities’ Capital Improvement Program (CIP).
Seattle Public Utilities: Solid Waste
Various state and local regulations and guidelines influence Seattle’s solid waste planning. Chief among the regulations is the State of Washington’s 1969 legislation Revised Code of Washington (RCW) 70.95 requiring local solid waste plans. Seattle Public Utilities manag-es this responsibility by regularly reviewing and updating Seattle’s Solid Waste Plan. The Plan has a twenty-year horizon and provides strategies for future solid waste management needs.
Seattle Public Utilities: Inventory & Capacity
A network of public and private service providers and facilities collect, transfer, process, and landfill Seattle’s discards. All Seattle’s municipal solid waste that is not recycled or compost-ed is, by law, under city control.
SPU contracts with private firms to collect residential garbage, recyclables, and yard and food waste (organics). The same contractors collect commercial garbage. Open-market providers collect commercial recycling and organics. Businesses may choose to “self-haul” their solid waste materials.
Transfer and recycling processing facilities consolidate collected solid waste materials and route them to their next destination. Garbage and organics collected by the city’s contrac-tors go to the transfer stations owned and operated by the city. Recycling picked up by the city’s contractors goes to the city’s contracted recycling processing facility. Recycling picked up from businesses may go to a recycling processor or one of the many local businesses specializing in recycled materials. Other collected materials go to the city’s transfer stations, or private transfer stations or processors. Occasionally, residential garbage is taken to pri-vate transfer facilities, such as when a city station temporarily needs to close.
At the transfer stations, garbage is loaded into rail containers and trucked to Seattle’s con-tracted rail yard. Assembled trains of containers are hauled to the city’s contracted landfill.
565Seattle 2035Appendices Utilities Appendix
Processed recyclables go to various materials markets. Organics go to the City’s contracted organics contractor to be processed into compost.
SPU also runs two moderate-risk waste (MRW) collection facilities. Seattle provides this service as a partner in the Local Hazardous Waste Management Program (LHWMP) in King County.
Except for the two City-owned transfer stations, the equipment and facilities necessary to operate Seattle’s solid waste system are provided by contracted services.
Seattle Public Utilities: Collection
Two collection companies collect all residential solid waste materials and commercial garbage. Current contracts started in March 2009 and run until at least 2017. The companies provide all aspects of collection, including trucks, truck yards, and labor. Service areas and routes are planned to ensure efficient use of collection vehicles and to collect consistent amounts of material each day so that the daily capacity of each transfer station is not ex-ceeded. Transfer and processing facilities need an even, predictable inflow to avoid having to stockpile incoming materials.
Seattle Public Utilities: Transfer Stations
The city owns and operates two transfer stations: North Transfer Station in the Wallingford neighborhood, and South Transfer Station in the South Park neighborhood. Two private transfer stations supplement city facilities.
The city’s transfer facilities now serve a variety of vehicles and customers and receive a range of discarded materials that include garbage, recyclables, and compostables. In ad-dition to transferring materials delivered by collectors, the stations play an important role in accepting materials unsuitable for curbside collection. Residents with large, bulky items or excess quantities can bring these materials to the stations for recycling or disposal. The stations also serve businesses that choose to self-haul their waste and recyclable materials.
In 2007, the Seattle City Council decided to proceed with improvements to the two city-owned stations, which were originally built in the 1960s. SPU completed construction of the new South Transfer Station in 2013. The new North Transfer Station will be complete in 2016. Demolition of the old South Recycling and Disposal Station and redevelopment of that site is scheduled to be complete in 2018.
The two private transfer facilities are located in the industrial area south of Downtown Seattle.

566Seattle 2035Appendices Utilities Appendix
Seattle Public Utilities: Recycling and Composting
SPU contracts with Rabanco Recycling Center for traditional recycling (newspaper, glass bottles, tin cans, etc.). It is located in the Duwamish Manufacturing/Industrial Center.
Most commercial recycling is provided by private arrangements. Vendors collect both mixed and source-separated materials, and take them to a variety of processors in the Seattle area. Which processor they use depends on the material and any agreements haulers and processors may have.
For organics composting, SPU implemented new contracts in 2014 with two vendors: Lenz Enterprises, Inc., and PacifiClean Environmental of Washington, LLC. Lenz Enterprises is mainly responsible for taking organics from SPU’s Seattle’s North Transfer Station to its processing facility in Stanwood, Washington. PacifiClean takes mainly organics from SPU’s South Transfer station to their processing facility that will be located in central Washington. Both companies have guaranteed access to backup facilities.
Seattle Public Utilities: Disposal
The City of Seattle contracts with Waste Management of Washington for rail haul and dis-posal of all nonrecyclable waste at Columbia Ridge Landfill in Gilliam County, Oregon. After it has been compacted into shipping containers at transfer facilities, garbage is hauled to the Argo rail yard and loaded onto the train. The Argo Yard is owned and operated by the Union Pacific Railroad, and is located in the Duwamish Manufacturing/Industrial Center. Trains leave Seattle six times a week, stacked two-high. Waste Management of Washington owns the containers. The Columbia Ridge Landfill and Recycling Center is owned and oper-ated by Oregon Waste Systems, a division of Waste Management.
Seattle Public Utilities: Future Needs Assessment
As the City of Seattle contracts with private service providers for recycling processing, or-ganics composting, and landfill long-haul and disposal, any programmatic changes would be made through those contracts. Since Public Health—Seattle & King County regulates all solid waste handling facilities in their jurisdiction, their approval is required for any new public or private facilities for the transfer, recycling, composting, and landfilling of solid waste materials.
Although the overall amount of waste generated in the city will increase with projected resi-dential and employment growth over the twenty-year plan horizon, the percentage of waste that will be directed to disposal is expected to decrease. Seattle’s overall municipal solid waste generation (MSW) has generally followed the ups and downs of economic trends, even as population has steadily increased. Total generation saw a prolonged downward
567Seattle 2035Appendices Utilities Appendix
trend after 2007 through the Great Recession and through 2012. SPU expects overall waste generation to increase gradually over the next two decades, not rising to pre-recession lev-els of about 850,000 tons of material per year until about 2027 or after.
Seattle’s diversion goal is to recycle or compost 70 percent of the city’s MSW by 2022. In 2012 Seattle recycled or composted 56 percent of its MSW. Seattle recently set an additional goal to recycle 70 percent of the city’s construction and demolition (C&D) waste by 2020. The majority of C&D waste is managed in the private sector, from generation through processing and disposal.
Shifts in consumer patterns change over time. Likewise, new materials and combinations of materials continue to enter the consumption cycle. SPU will conduct waste composition analyses frequently enough to be able to respond to these changes. For example, SPU will continue to work with processors to designate additional recyclable materials, and modify collection programs as needed.
Future Needs Assessment
Collection
Seattle will continue with its strategy to competitively contract for collection services. The contractors will adjust to changing service needs, such as more recycling, over time.
Transfer
The capacity provided by the rebuild of Seattle’s two transfer facilities, in conjunction with private transfer capacity, is projected to satisfy Seattle’s solid waste transfer needs for at least as long as the fifty-year expected life of the rebuilt facilities. Seattle’s new facilities are purposely designed for flexibility in response to a changing mix of solid waste materials over time.
Recycling & Composting
Recycling capacity at private facilities is considered adequate for at least two decades, and Seattle will continue to contract for these services. Seattle’s current contract is guaranteed through 2019. In 2014, Recology Cleanscapes opened a new high-capacity mixed-mate-rial recycling facility in the Duwamish Manufacturing/Industrial Center. Furthermore, the Washington State Department of Ecology currently lists more than 280 recycling facilities in King, Pierce, and Snohomish Counties. In addition to the new Recology Cleanscapes facility, at least three of these are large facilities that process mixed recycling and are within twenty
568Seattle 2035Appendices Utilities Appendix
miles of Seattle. SPU expects that many other private recyclers that handle limited ranges of materials will continue their presence in the local market.
Current composting capacity is adequate for the twenty-year planning horizon. However, statewide there is concern about future capacity as more cities and counties divert more or-ganics. Seattle’s two organics contracts are guaranteed, and may be extended through 2024. As regional demand for composting increases, composting service providers are researching and developing new technologies, for example anaerobic digestion.
Disposal
Columbia Ridge landfill, Seattle’s current contracted landfill, projects that it will be able to receive material beyond the current contract’s guaranteed 2028 end date. Seattle plans to continue with contracting for this service. Although Seattle’s disposal alternatives are re-stricted through the life of the contract, the City will continue monitoring emerging alternate technologies. Rail-haul capacity has not been an issue. The contract provides for alternate transportation if rail lines become unavailable.
City Communications Facilities
The City Department of Information Technology, in collaboration with City Light and other departments, jurisdictions, and institutions, installs, owns, and/or operates an extensive radio and broadband information and communications technology (ICT) infrastructure, including radio for emergency services and fieldwork, and fiber optic for transmission of voice, video, and data for delivery of city services. The City leases some services from private providers, but has steadily increased the network of public infrastructure to city buildings. The City has a fiber-sharing agreement with other public agencies that enables joint installation and maintenance of an extensive network of conduit and which minimizes cost, digging, and installation of broadband infrastructure. The City also leases excess fiber capacity to private providers.
Investor-Owned Utilities
Natural Gas
Puget Sound Energy (PSE) provides natural gas service to more than 780,000 customers in six Western Washington counties: Snohomish, King, Kittitas, Pierce, Thurston, and Lewis. As of 2014, it is estimated that PSE serves over 140,000 customers within the City of Seattle.

569Seattle 2035Appendices Utilities Appendix
Natural gas comes from gas wells in the Rocky Mountains and in Canada and is transported through interstate pipelines by Williams Northwest Pipeline to Puget Sound Energy’s gate stations.
Supply mains then transport the gas from the gate stations to district regulators where the pressure is reduced to less than 60psig. Distribution mains are fed from the district regula-tors, and individual residential service lines are fed by the distribution mains.
PSE does not have any major projects planned in Seattle, but new projects may be devel-oped in the future at any time due to:
• New or replacement of existing facilities to increase capacity requirements due to new building construction and conversion from other fuels.
• Main replacement to facilitate improved maintenance of facilities.
• Replacement or relocation of facilities due to municipal and state projects.
Cable
The FCC provides limited regulatory authority to local jurisdictions to enable franchise agreements with providers of cable television. As of 2014, the City of Seattle had cable fran-chise agreements with two companies: Comcast and Wave Broadband. Comcast is the city’s largest provider, serving approximately two-thirds of the city. These companies also provide telephone and broadband Internet services. As of 2014, Wave also owns CondoInternet, which offers gigabit Internet service in a limited, but growing area of Seattle.
The franchise agreements provide for consumer protection and public benefits, such as delivery of cable television and public Internet access to City community centers, public housing, and nonprofits providing Internet access and skills training to technology- disadvantaged residents. The companies are allowed to compete, though overlapping ser-vice areas have been minimal as of 2014. The franchise agreements have generally been for ten-year periods with some adjustment when companies are sold. See seattle.gov/cable/franchises.htm for more detail.
Landline Telephone
CenturyLink, which purchased QWEST Communications, is the largest telephone compa-ny providing local landline telephone and related retail and wholesale communications services throughout the entire city. They maintain a number of poles, transmission lines, and network architecture. Additionally, there are a number of small companies that provide limited telephone service, often by paying for the use of another company’s infrastructure.
570Seattle 2035Appendices Utilities Appendix
Wireless and Cellular
Seattle is served by numerous companies providing wireless and cellular services. These communications utility companies tend to own wireless and cellular transmission facilities as well as fiber backbone to relay the data received in the transmission facilities. Common wireless technologies include point-to-point microwave as well as Wi-Fi internet services. Microwave antennas require location for line-of-sight transmission. Cellular and Wi-Fi transmitters have limited transmission radius and are also dependent on the strength of the antenna in users’ mobile devices. As the number of users and the demand for higher data transfer (e.g., for watching or sending video) grows, the infrastructure will also require expansion. Greater distribution of fiber optics through the city enables higher bandwidth connections to these antennas. The industry is continuing to evolve, so the city is likely to see continued demand for placement of antennas, though technology developments may also result in some reduction of the number required.
Radio and Broadcast Television
Seattle is also served by a number of radio and television broadcast facilities who main-tain antennas and transmission equipment in the city, which, like cellular equipment, may be located and operated on company sites, or placed on other public or private buildings through leasing arrangements. Some of these companies also operate other communi-cations hosting or networking services. The FCC issued a limited number of low-power FM construction licenses to nonprofit entities, starting in 2014, that require siting of small antennas and will enable local information distribution.
District Energy
Enwave Seattle is a district energy utility franchised by the City. Enwave produces heat at a centralized plant and distributes steam to commercial, residential, and institutional cus-tomers for space and water heating, along with other uses, by underground lines. Its service area encompasses roughly a square-mile area of the Central Business District, extending from Blanchard Street to King Street and from the waterfront to 14th Avenue, crossing over First Hill.
Enwave Seattle is a privately owned utility that provides heat to approximately 200 buildings in Seattle’s Central Business District and First Hill neighborhoods. Enwave Seattle’s mission is to deliver a reliable, cost-effective, and efficient source of heat that benefits its customers, the environment, and the Seattle community.
Two steam-generating plants supply the piping network. The primary plant is located on Western Avenue at University Street. The secondary plant is located on Western Avenue near Yesler Way—the site of the original plant built in 1893. Total steam generation capacity
571Seattle 2035Appendices Utilities Appendix
is 670,000 pounds per hour, with boilers designed to burn renewable biomass, natural gas, or diesel oil if natural gas is not available. The network of insulated steel pipe encompasses a total length of over eighteen miles beneath city streets and currently serves approximately 200 buildings.
The City is also working to establish district energy utility systems in South Lake Union, Denny Triangle, and First Hill. Systems for these neighborhoods are in varying planning stages, but each, if established, would likely be a closed-loop water-based utility system providing heating, hot water, and potentially cooling services to building owners. Energy sources for the utility system would largely comprise waste heat already in the neighbor-hood, including waste heat from data centers, sewer lines, and condensate from the nearby Enwave system.
572Seattle 2035Appendices Legislative History of the Comprehensive Plan
Legislative History of the Comprehensive Plan
The Comprehensive Plan was first adopted on July 25, 1994, by Ordinance 117221.
Comprehensive Plan Amendments
Adoption Date
Ordinance Number Nature of Amendments
12/12/94 117436 1994 Capital Improvement Program
7/31/95 117735 1995 Comprehensive Plan amendments
11/27/95 117906 Adoption of a new Human Development element
11/27/95 117915 1995 Six-Year CIP amendments
7/01/96 118197Response to 4/2/96 Growth Management Hearings Board remand. Repealed policy L-127 of Ord. 117735
9/23/96 118408 Addition of Shoreline Master Program to Plan
11/18/96 118388 1996 CIP amendments
11/18/96 118389 1996 annual amendments
6/16/97 118622 Policies for the reuse of Sand Point Naval Station
9/8/97 118722 Response to 3/97 GMHB remand
11/13/97 118820 1997 Six-Year CIP amendments
11/13/97 118821 1997 annual amendments; addition of Cultural Resources element
6/22/98 119047Adoption of the Ballard/Interbay Northend Manufacturing/Industrial Center neighborhood plan
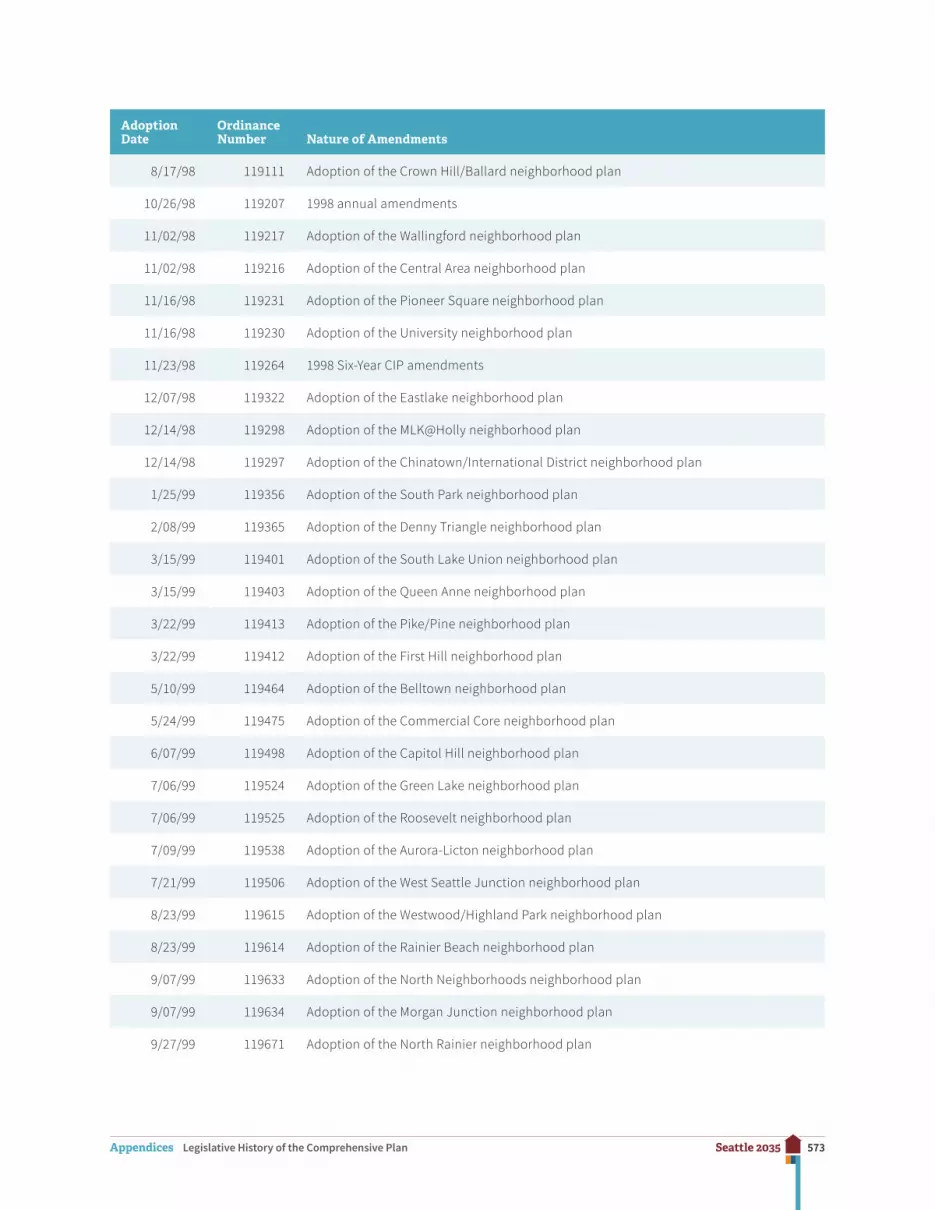
573Seattle 2035Appendices Legislative History of the Comprehensive Plan
Adoption Date
Ordinance Number Nature of Amendments
8/17/98 119111 Adoption of the Crown Hill/Ballard neighborhood plan
10/26/98 119207 1998 annual amendments
11/02/98 119217 Adoption of the Wallingford neighborhood plan
11/02/98 119216 Adoption of the Central Area neighborhood plan
11/16/98 119231 Adoption of the Pioneer Square neighborhood plan
11/16/98 119230 Adoption of the University neighborhood plan
11/23/98 119264 1998 Six-Year CIP amendments
12/07/98 119322 Adoption of the Eastlake neighborhood plan
12/14/98 119298 Adoption of the MLK@Holly neighborhood plan
12/14/98 119297 Adoption of the Chinatown/International District neighborhood plan
1/25/99 119356 Adoption of the South Park neighborhood plan
2/08/99 119365 Adoption of the Denny Triangle neighborhood plan
3/15/99 119401 Adoption of the South Lake Union neighborhood plan
3/15/99 119403 Adoption of the Queen Anne neighborhood plan
3/22/99 119413 Adoption of the Pike/Pine neighborhood plan
3/22/99 119412 Adoption of the First Hill neighborhood plan
5/10/99 119464 Adoption of the Belltown neighborhood plan
5/24/99 119475 Adoption of the Commercial Core neighborhood plan
6/07/99 119498 Adoption of the Capitol Hill neighborhood plan
7/06/99 119524 Adoption of the Green Lake neighborhood plan
7/06/99 119525 Adoption of the Roosevelt neighborhood plan
7/09/99 119538 Adoption of the Aurora-Licton neighborhood plan
7/21/99 119506 Adoption of the West Seattle Junction neighborhood plan
8/23/99 119615 Adoption of the Westwood/Highland Park neighborhood plan
8/23/99 119614 Adoption of the Rainier Beach neighborhood plan
9/07/99 119633 Adoption of the North Neighborhoods neighborhood plan
9/07/99 119634 Adoption of the Morgan Junction neighborhood plan
9/27/99 119671 Adoption of the North Rainier neighborhood plan

574Seattle 2035Appendices Legislative History of the Comprehensive Plan
Adoption Date
Ordinance Number Nature of Amendments
10/04/99 119685 Adoption of the Broadview/Bitter Lake/Haller Lake neighborhood plan
10/04/99 119687 Adoption of the Fremont neighborhood plan
10/11/99 119694 Adoption of the Columbia City neighborhood plan
10/25/99 119713 Adoption of the North Beacon Hill neighborhood plan
10/25/99 119714 Adoption of the Admiral neighborhood plan
11/15/99 119743 Adoption of the Greenwood/Phinney Ridge neighborhood plan
11/15/99 119744 1999 annual amendments
11/22/99 119760 1999 Six-Year CIP amendments
12/06/99 119789 Adoption of the Delridge neighborhood plan
2/07/00 119852 Adoption of the Georgetown neighborhood plan
6/12/00 119973Adoption of the Greater Duwamish Manufacturing/Industrial Center neighborhood plan
11/13/00 120158Response to Growth Management Hearings Board remand; Greenwood/Phinney Ridge neighborhood plan
12/11/00 120201 2000 five-year Comprehensive Plan review amendments
10/15/01 120563 2001 annual amendments
12/09/02 121020 2002 annual amendments
12/13/04 121701 2004 ten-year Update to Comprehensive Plan
10/10/05 121955 2005 annual amendments
12/11/06 122313 2006 annual amendments
12/17/07 122610 2007 annual amendments
10/27/08 122832 2008 annual amendments
3/29/10 123267 2010 annual amendments
4/11/11 123575 2011 annual amendments
4/10/12 123854 2012 annual amendments
5/20/13 124177 2013 annual amendments
5/2/14 124458 2014 annual amendments
10/16/15124888, 124887
2015 annual amendments

575Seattle 2035Appendices Legislative History of the Comprehensive Plan
Resolutions Related to Vision for City of Seattle Comprehensive Plan
Passage Date Resolution Nature of Legislation
7/25/94 28962 1994 Vision for the Comprehensive Plan
11/27/95 29215Updated 1994 Vision to reflect addition of Human Development element in Comprehensive Plan (Ord. 117906)
12/11/00 30252Updated Vision to reflect Cultural Resources and Environment elements and adoption of neighborhood plans
12/13/04 30727Updated Vision in conjunction with the 2004 ten-year Update to the Comprehensive Plan
5/15/15 31577 Confirmed race and social equity as a core value of the Comprehensive Plan
Related Documents