Mayor’s Management Report Fiscal 2021 Indicator Definitions The City of New York Mayor Bill de Blasio Dean Fuleihan, First Deputy Mayor Jeff Thamkittikasem, Director Mayor’s Office of Operations September 2021

Welcome message from author
This document is posted to help you gain knowledge. Please leave a comment to let me know what you think about it! Share it to your friends and learn new things together.
Transcript

Mayor’s Management ReportFiscal 2021Indicator Definitions
The City of New York Mayor Bill de Blasio
Dean Fuleihan, First Deputy Mayor
Jeff Thamkittikasem, Director Mayor’s Office of Operations
September 2021

Page ii
Table of Contents
5 Public Safety and Access to Justice 7 New York City Police Department 13 Fire Department 21 New York City Emergency Management 25 Department of Correction 29 Department of Probation 33 Civilian Complaint Review Board 37 Law Department 41 Department of Investigation 45 City Commission on Human Rights 49 Office of Administrative Trials and Hearings 53 Business Integrity Commission
57 Basic Services for All New Yorkers 59 Department of Sanitation 65 Department of Parks and Recreation 73 Department of Cultural Affairs 75 Department of Consumer and
Worker Protection 81 311 Customer Service Center 83 Taxi and Limousine Commission
89 Health and Human Services 91 Department of Health and Mental Hygiene 97 Office of Chief Medical Examiner 101 NYC Health + Hospitals 105 Human Resources Administration 117 Administration for Children’s Services 125 Department of Homeless Services 131 Department for the Aging
133 Building Human Potential 135 Department of Education 147 School Construction Authority 149 Department of Youth and
Community Development 155 Public Libraries 157 City University of New York 163 Department of Small Business Services 167 Department of Veterans’ Services
169 Infrastructure and Sustainability 171 Department of Environmental Protection 177 Department of Transportation 185 Department of Buildings 193 Department of Design and Construction
197 Promoting Viable Communities and Neighborhoods
199 Department of City Planning 203 New York City Economic
Development Corporation 207 Department of Housing Preservation and Development 215 New York City Housing Authority 221 Landmarks Preservation Commission
223 Administrative Services 225 Department of Citywide
Administrative Services 235 Department of Records and
Information Services 239 Department of Finance 247 Department of Information Technology and Telecommunications 251 Board of Elections 253 Agency Resources


Public Safety and Access to Justice

Public Safety and Access to Justice
Fire Department
New York City Emergency Management
Department of Correction
Law Department
Department of Investigation
City Commission on Human Rights
New York City Police Department p 7
p 13
p 21
p 25
p 37
p 41
p 45
Department of Probation
Civilian Complaint Review Board
p 29
p 33
Office of Administrative Trials and Hearings
Business Integrity Commission
p 49
p 53
Indicator Definitions | Page 7
New York City Police Department
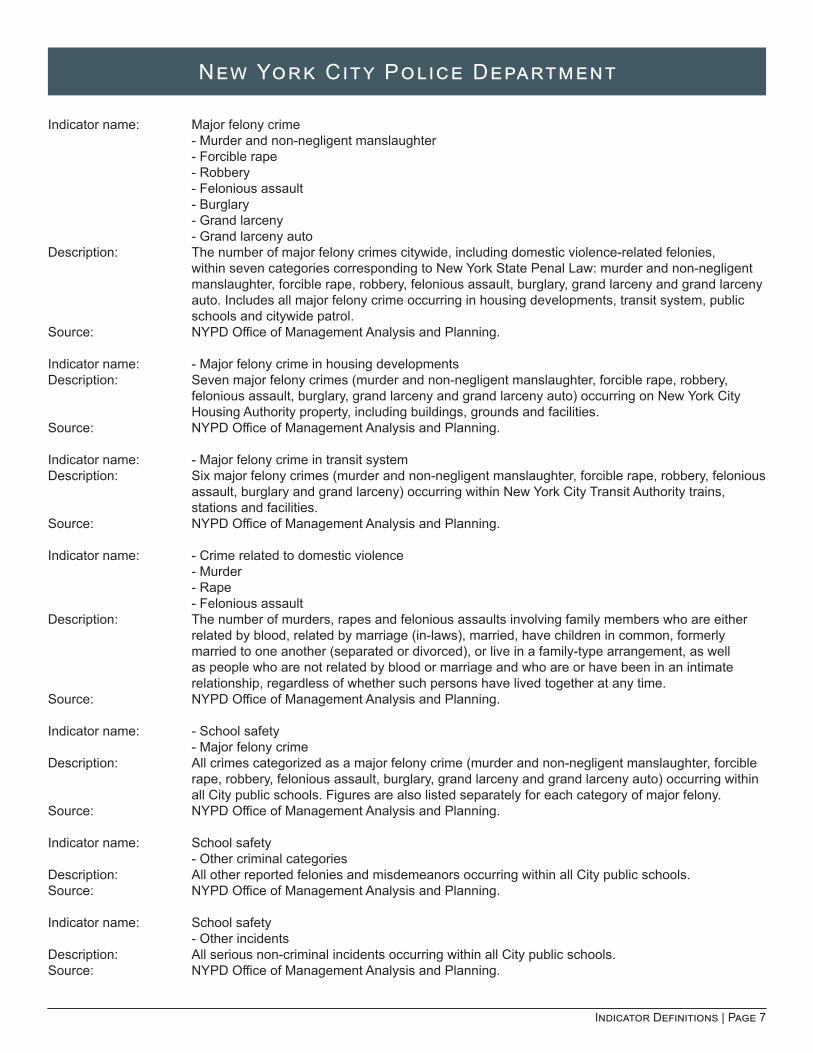
Indicator name: Major felony crime - Murder and non-negligent manslaughter
- Forcible rape - Robbery - Felonious assault - Burglary - Grand larceny - Grand larceny auto
Description: The number of major felony crimes citywide, including domestic violence-related felonies, within seven categories corresponding to New York State Penal Law: murder and non-negligent manslaughter, forcible rape, robbery, felonious assault, burglary, grand larceny and grand larceny auto. Includes all major felony crime occurring in housing developments, transit system, public schools and citywide patrol.
Source: NYPD Office of Management Analysis and Planning. Indicator name: - Major felony crime in housing developmentsDescription: Seven major felony crimes (murder and non-negligent manslaughter, forcible rape, robbery,
felonious assault, burglary, grand larceny and grand larceny auto) occurring on New York City Housing Authority property, including buildings, grounds and facilities.
Source: NYPD Office of Management Analysis and Planning. Indicator name: - Major felony crime in transit systemDescription: Six major felony crimes (murder and non-negligent manslaughter, forcible rape, robbery, felonious
assault, burglary and grand larceny) occurring within New York City Transit Authority trains, stations and facilities.
Source: NYPD Office of Management Analysis and Planning. Indicator name: - Crime related to domestic violence
- Murder - Rape - Felonious assault
Description: The number of murders, rapes and felonious assaults involving family members who are either related by blood, related by marriage (in-laws), married, have children in common, formerly married to one another (separated or divorced), or live in a family-type arrangement, as well as people who are not related by blood or marriage and who are or have been in an intimate relationship, regardless of whether such persons have lived together at any time.
Source: NYPD Office of Management Analysis and Planning. Indicator name: - School safety
- Major felony crimeDescription: All crimes categorized as a major felony crime (murder and non-negligent manslaughter, forcible
rape, robbery, felonious assault, burglary, grand larceny and grand larceny auto) occurring within all City public schools. Figures are also listed separately for each category of major felony.
Source: NYPD Office of Management Analysis and Planning. Indicator name: School safety
- Other criminal categoriesDescription: All other reported felonies and misdemeanors occurring within all City public schools.Source: NYPD Office of Management Analysis and Planning. Indicator name: School safety
- Other incidentsDescription: All serious non-criminal incidents occurring within all City public schools.Source: NYPD Office of Management Analysis and Planning.
Page 8 | Mayor’s Management Report
New York City Police Department
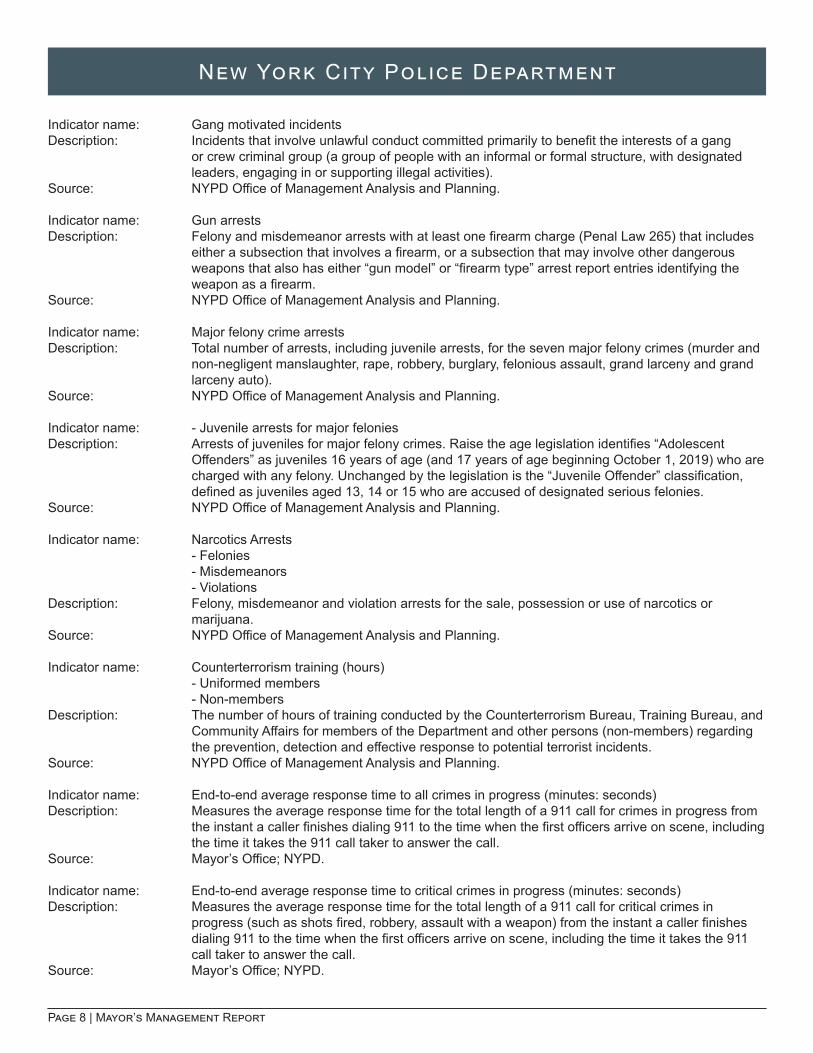
Indicator name: Gang motivated incidentsDescription: Incidents that involve unlawful conduct committed primarily to benefit the interests of a gang
or crew criminal group (a group of people with an informal or formal structure, with designated leaders, engaging in or supporting illegal activities).
Source: NYPD Office of Management Analysis and Planning.
Indicator name: Gun arrestsDescription: Felony and misdemeanor arrests with at least one firearm charge (Penal Law 265) that includes
either a subsection that involves a firearm, or a subsection that may involve other dangerous weapons that also has either “gun model” or “firearm type” arrest report entries identifying the weapon as a firearm.
Source: NYPD Office of Management Analysis and Planning.
Indicator name: Major felony crime arrestsDescription: Total number of arrests, including juvenile arrests, for the seven major felony crimes (murder and
non-negligent manslaughter, rape, robbery, burglary, felonious assault, grand larceny and grand larceny auto).
Source: NYPD Office of Management Analysis and Planning.
Indicator name: - Juvenile arrests for major feloniesDescription: Arrests of juveniles for major felony crimes. Raise the age legislation identifies “Adolescent
Offenders” as juveniles 16 years of age (and 17 years of age beginning October 1, 2019) who are charged with any felony. Unchanged by the legislation is the “Juvenile Offender” classification, defined as juveniles aged 13, 14 or 15 who are accused of designated serious felonies.
Source: NYPD Office of Management Analysis and Planning.
Indicator name: Narcotics Arrests - Felonies
- Misdemeanors - Violations
Description: Felony, misdemeanor and violation arrests for the sale, possession or use of narcotics or marijuana.
Source: NYPD Office of Management Analysis and Planning. Indicator name: Counterterrorism training (hours)
- Uniformed members - Non-members
Description: The number of hours of training conducted by the Counterterrorism Bureau, Training Bureau, and Community Affairs for members of the Department and other persons (non-members) regarding the prevention, detection and effective response to potential terrorist incidents.
Source: NYPD Office of Management Analysis and Planning.
Indicator name: End-to-end average response time to all crimes in progress (minutes: seconds)Description: Measures the average response time for the total length of a 911 call for crimes in progress from
the instant a caller finishes dialing 911 to the time when the first officers arrive on scene, including the time it takes the 911 call taker to answer the call.
Source: Mayor’s Office; NYPD.
Indicator name: End-to-end average response time to critical crimes in progress (minutes: seconds)Description: Measures the average response time for the total length of a 911 call for critical crimes in
progress (such as shots fired, robbery, assault with a weapon) from the instant a caller finishes dialing 911 to the time when the first officers arrive on scene, including the time it takes the 911 call taker to answer the call.
Source: Mayor’s Office; NYPD.
Indicator Definitions | Page 9
New York City Police Department
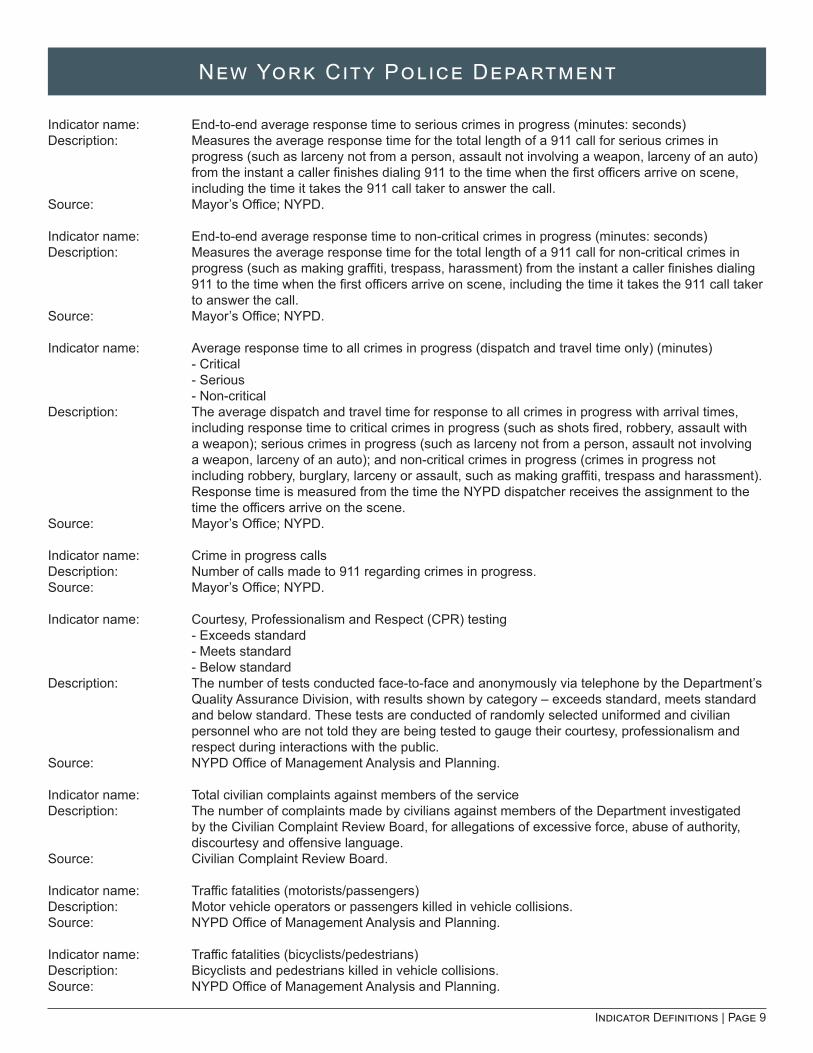
Indicator name: End-to-end average response time to serious crimes in progress (minutes: seconds)Description: Measures the average response time for the total length of a 911 call for serious crimes in
progress (such as larceny not from a person, assault not involving a weapon, larceny of an auto) from the instant a caller finishes dialing 911 to the time when the first officers arrive on scene, including the time it takes the 911 call taker to answer the call.
Source: Mayor’s Office; NYPD.
Indicator name: End-to-end average response time to non-critical crimes in progress (minutes: seconds)Description: Measures the average response time for the total length of a 911 call for non-critical crimes in
progress (such as making graffiti, trespass, harassment) from the instant a caller finishes dialing 911 to the time when the first officers arrive on scene, including the time it takes the 911 call taker to answer the call.
Source: Mayor’s Office; NYPD.
Indicator name: Average response time to all crimes in progress (dispatch and travel time only) (minutes) - Critical
- Serious - Non-critical
Description: The average dispatch and travel time for response to all crimes in progress with arrival times, including response time to critical crimes in progress (such as shots fired, robbery, assault with a weapon); serious crimes in progress (such as larceny not from a person, assault not involving a weapon, larceny of an auto); and non-critical crimes in progress (crimes in progress not including robbery, burglary, larceny or assault, such as making graffiti, trespass and harassment). Response time is measured from the time the NYPD dispatcher receives the assignment to the time the officers arrive on the scene.
Source: Mayor’s Office; NYPD.
Indicator name: Crime in progress callsDescription: Number of calls made to 911 regarding crimes in progress.Source: Mayor’s Office; NYPD.
Indicator name: Courtesy, Professionalism and Respect (CPR) testing - Exceeds standard
- Meets standard - Below standard
Description: The number of tests conducted face-to-face and anonymously via telephone by the Department’s Quality Assurance Division, with results shown by category – exceeds standard, meets standard and below standard. These tests are conducted of randomly selected uniformed and civilian personnel who are not told they are being tested to gauge their courtesy, professionalism and respect during interactions with the public.
Source: NYPD Office of Management Analysis and Planning. Indicator name: Total civilian complaints against members of the serviceDescription: The number of complaints made by civilians against members of the Department investigated
by the Civilian Complaint Review Board, for allegations of excessive force, abuse of authority, discourtesy and offensive language.
Source: Civilian Complaint Review Board.
Indicator name: Traffic fatalities (motorists/passengers)Description: Motor vehicle operators or passengers killed in vehicle collisions.Source: NYPD Office of Management Analysis and Planning. Indicator name: Traffic fatalities (bicyclists/pedestrians)Description: Bicyclists and pedestrians killed in vehicle collisions.Source: NYPD Office of Management Analysis and Planning.

Page 10 | Mayor’s Management Report
New York City Police Department
Indicator name: DWI-related fatalitiesDescription: The number of fatalities resulting from motor vehicle collisions that involve intoxicated motorists
(Driving While Intoxicated).Source: NYPD Office of Management Analysis and Planning.
Indicator name: DWI arrestsDescription: Total number of arrests made for driving while intoxicated (DWI).Source: NYPD Office of Management Analysis and Planning.
Indicator name: Total moving violation summonses Description: All moving violation summonses issued by NYPD personnel.Source: NYPD Office of Management Analysis and Planning. Indicator name: - Summonses for hazardous violationsDescription: A category of moving violation summonses issued for traffic infractions that have been identified
by the Department as being the major causes of most collisions, deaths and injuries on the roadways, including the prohibited use of a cellular phone while operating a motor vehicle, disobeying traffic signals, and improper passing and speeding.
Source: NYPD Office of Management Analysis and Planning. Indicator name: - Summonses for prohibited use of cellular phonesDescription: A subcategory of hazardous violation summonses issued for operating a motor vehicle on a
public highway while using a mobile telephone to engage in a call while the vehicle is in motion, as defined by State Vehicle and Traffic Law.
Source: NYPD Office of Management Analysis and Planning.
Indicator name: Quality-of-life summonsesDescription: Summonses returnable to the New York Criminal Court, the Office of Administrative Trials and
Hearings/Environmental Control Board, or the Transit Adjudication Bureau for offenses that have a negative impact on City residents, including unreasonable noise, aggressive panhandling, window washing, and urinating in public.
Source: NYPD Office of Management Analysis and Planning. Indicator name: - Unreasonable noise summonsesDescription: A category of quality-of-life summonses, issued by police officers, returnable to the New York
Criminal Court or the Office of Administrative Trials and Hearings/Environmental Control Board for violations of the New York City Administrative Code related to excessive noise.
Source: NYPD Office of Management Analysis and Planning. Indicator name: - Graffiti summonsesDescription: A category of quality-of-life summonses, issued by police officers for graffiti answerable in criminal
court.Source: NYPD Office of Management Analysis and Planning.
Indicator name: Graffiti arrestsDescription: Total number of arrests made for graffiti.Source: NYPD Office of Management Analysis and Planning.
Indicator name: Individuals who, after reporting a crime, received support to deal with the emotional, physical and financial aftermath of crime through the Crime Victim Assistance Program
Description: The number of inidividuals who have had at least one face-to-face or over the phone encounter with CRT and have received services. Service types include clinical assessment, supportive counseling, health promotion and awareness, service referral, connection to care or other stabilizing support, or transport to a hospital.
Source: MOCJ
Indicator Definitions | Page 11
New York City Police Department
Indicator name: Cases commenced against the City in state and federal courtDescription: The number of state court and federal court matters assigned a litigation start date. In cases with
payout, it will be paid from the judgment and claims account in the City’s General Fund. Source: Law Department LawManager system. Indicator name: Payout ($000)Description: The judgment and claims amount, in thousands of dollars, paid by the City from the judgment and
claims account in the City’s General Fund to resolve cases through settlement or verdict. Source: Law Department LawManager system.
Indicator name: Collisions involving City vehicles (per 100,000 miles)Description: Number of City-vehicle involved collision reports involving injury or property damage per 100,000
miles traveled. New York State MV-104 reports are required whenever a collision occurs involving death, or other personal injury, or property damage over $1,000.
Source: NYPD Office of Management Analysis and Planning.
Indicator name: Workplace injuries reported (uniform and civilian)Description: The number of incidents (uniform and civilian) resulting in a workers’ compensation or line of duty
injury claim regardless of whether or not time is lost.Source: NYPD Office of Management Analysis and Planning.
Indicator Name: Violations admitted to or upheld at the Office of Administrative Trials and Hearings (%)Description: For all violations returnable to OATH, the number of violations where the respondent admitted to
the violation and paid the penalty without a hearing or where the violation was upheld following a hearing as a percent of all violations resolved.
Source: Office of Administrative Trials and Hearings (OATH).
Indicator name: Completed requests for interpretationDescription The sum of all requests for interpretation using a language other than English fulfilled by the
agency via telephone (including Language Line, call centers, offices/reception desks and 311 transfer calls) and via face-to-face interaction with bilingual employees or contracted interpreters.
Source NYPD.
Indicator name: CORE (Customers Observing and Reporting Experiences) facility rating (0-100)Description: An average score based on the rating of 15 conditions, including physical conditions (e.g.,
cleanliness, litter, seating) and customer service conditions (e.g. wait time, professionalism), for all agency walk-in facilities inspected, divided by the number of walk-in facilities inspected. Facilities are rated by trained City inspectors.
Source: Mayor’s Office of Operations.
Indicator name: Calls answered in 30 seconds (%)Description: The percentage of calls answered in 30 seconds or less. Source: NYPD.
Indicator name: Percent meeting time to close - (Response to Service Requests)Description: The percentage of service requests received through the 311 Customer Service Center for which
the agency met its planned time of action to provide the service. Source: Mayor’s Office of Operations/Citywide Performance Reporting.

Page 12 | Mayor’s Management Report
New York City Police Department
Indicator Definitions | Page 13
Fire Department
Indicator name: Structural fires Description: The number of fires occurring in buildings.Source: FDNY Computer Aided Dispatch (CAD) System. Indicator name: Structural fires per 100,000 peopleDescription: The number of structural fires per 100,000 people living in New York City.Source: FDNY Computer Aided Dispatch (CAD) System.
Indicator name: Non-structural fires Description: The number of fires occurring outside of buildings, such as car, rubbish and brush fires.Source: FDNY Computer Aided Dispatch (CAD) System.
Indicator name: Completed inspections performed by civilian fire prevention staffDescription: The number of completed checks of a premise or location by civilian personnel of the Department
against established standards, such as the Fire Code, Administrative Code, the Rules of the City of New York and other FDNY rules and regulations.
Source: FDNY Bureau of Fire Prevention.
Indicator name: Violation orders issuedDescription: The number of violation orders (VO) issued by FDNY inspectors used to give notification of a
violation and a directive to correct the violation condition. VOs are issued for imminent hazards and require reinspections.
Source: FDNY Bureau of Fire Prevention.
Indicator name: Violation orders correctedDescription: The number of violation orders issued by FDNY inspectors that are corrected by the person or
entity responsible for the property.Source: FDNY Bureau of Fire Prevention.
Indicator name: Violation orders corrected (%)Description: The percentage of violation orders issued by FDNY inspectors that are corrected by the person or
entity responsible for the property.Source: FDNY Bureau of Fire Prevention. Indicator name: Summonses issuedDescription: The number of summonses answerable in criminal court issued by FDNY inspectors and
field units. Summonses are generally reserved for a situation of imminent hazard or for non-compliance with a previously cited violation.
Source: FDNY Bureau of Fire Prevention.
Indicator name: Hazard complaints resolved within 1 day (%)Description: The percentage of hazard complaints that are found by FDNY inspectors to be resolved or non-
existent within 24 hours of complaint.Source: FDNY Risk Based Inspection System (RBIS).
Indicator name: Completed risk-based inspections performed by uniformed personnelDescription: The number of completed inspections of commercial and residential buildings performed by
firefighters and fire officers based on a building’s fire risk. A building’s fire risk is determined through an analysis of previous fire and emergency activity, building characteristics, violations, complains and other risk factors that have been found to impact the incidence and severity of fires.
Source: FDNY Risk Based Inspection System (RBIS).
Page 14 | Mayor’s Management Report
Fire Department
Indicator name: Completed mandatory inspections performed by uniformed personnelDescription: The number of completed mandatory inspections of commercial and residential buildings
performed by firefighters and fire officers. Mandatory inspections are based on fire code and fire operations policy requirements that are carried out by uniformed personnel.
Source: FDNY Risk Based Inspection System (RBIS).
Indicator name: InvestigationsDescription: The number of investigations by fire marshals into the causes and origins of fires, fire-related
offenses and certain non-fire offenses, such as malicious false alarms.Source: FDNY Bureau of Fire Investigation. Indicator name: Arson firesDescription: The number of fires determined to be intentionally set following investigation by fire marshals.Source: FDNY Bureau of Fire Investigation.
Indicator name: Fire safety education presentationsDescription: Presentations and outreach by the Community Engagement Unit at fire safety education events
for the public, public forums, the Fire Museum and firehouses. Source: FDNY Bureau of Training, Education, & Curriculum.
Indicator name: End-to-end average response time to structural fires (minutes:seconds)Description: Measures the average response time for the total length of a 911 call for structural fires from the
instant a caller finishes dialing 911 to the time when the first emergency responders arrive on scene, including the time it takes for the NYPD call taker to conference in the FDNY dispatcher. Response time to incidents that do not go through 911, such as private fire alarms, are not included in this measurement.
Source: Mayor’s Office, NYPD and FDNY.
Indicator name: Average response time to structural fires (FDNY dispatch and travel time only) (minutes:seconds)Description: The average dispatch and travel time until the first fire company arrives on the scene of a
structural fire counting from the time FDNY’s dispatcher receives the call or notification of request for assistance.
Source: FDNY Computer Aided Dispatch(CAD) System/STARFIRE.
Indicator name: Average response time to all emergencies by fire companies (FDNY dispatch and travel time only) (minutes:seconds)
Description: The average dispatch and travel time until the first fire company arrives on the scene of all incidents (structural fires, non-structural fires, life-threatening medical emergencies and non-fire emergencies) counting from the time FDNY’s dispatcher receives the call or notification of request for assistance.
Source: FDNY Computer Aided Dispatch (CAD) System/STARFIRE.
Indicator name: Total fire company runs Description: The total number of responses made by fire engine and ladder companies.Source: FDNY Computer Aided Dispatch (CAD) System.
Indicator name: Serious fires per 1,000 structural firesDescription: The number of fires with the highest alarms, from “All Hands” to a “5th Alarm” and above, in every
1,000 structural fires.Source: FDNY Computer Aided Dispatch (CAD) System/STARFIRE.
Indicator Definitions | Page 15
Fire Department
Indicator name: Serious fires reaching second alarm or higher (%)Description: The percentage of serious fires (fires with the highest alarms, from “All Hands” to a “5th Alarm”
and above) that received a second alarm or higher response. Serious fires require and receive additional resources after initial response.
Source: FDNY Computer Aided Dispatch (CAD) System. Indicator name: Civilian fire fatalitiesDescription: The number of people, excluding firefighters, who died as a result of injuries sustained in a fire,
including accidental and intentional fire deaths. All fire deaths are counted in the month and year in which the death occurs, which may be after the date of the fire, following a determination on the cause of death by the Office of the Chief Medical Examiner.
Source: FDNY Bureau of Fire Investigation. Indicator name: Civilian fire fatalities per 100,000 peopleDescription: The number of deaths attributed to injuries sustained in fires per 100,000 people living in New
York City.Source: FDNY Bureau of Fire Investigation.
Indicator name: End-to-end combined average response time to life-threatening medical emergencies by ambulances & fire companies (minutes:seconds)
Measures the average response time for the total length of a 911 call for life-threatening medical emergencies (incidents of cardiac arrest, choking, unconsciousness, difficulty breathing, and major burns and trauma) from the instant a caller finishes dialing 911 to the time when the first responder (Emergency Medical Service or fire company resource) arrives on scene, including the time it takes for the NYPD call taker to conference in the FDNY emergency medical dispatcher.
Source: Mayor’s Office, NYPD and FDNY.
Indicator name: End-to-end average response time to life-threatening medical emergencies by ambulances (minutes:seconds)
Description: Measures the average response time for the total length of a 911 call for life-threatening medical emergencies (incidents of cardiac arrest, choking, unconsciousness, difficulty breathing, and major burns and trauma) from the instant a caller finishes dialing 911 to the time when the first Emergency Medical Service resource, including ambulances and non-transport Advanced Life Support (ALS) “fly cars,” arrives on scene, including the time it takes for the NYPD call taker to conference in the FDNY emergency medical dispatcher.
Source: Mayor’s Office, NYPD and FDNY.
Indicator name: End-to-end average response time to life-threatening medical emergencies by fire companies (minutes:seconds)
Description: Measures the average response time for the total length of a 911 call for life-threatening medical emergencies (incidents of cardiac arrest, choking, unconsciousness, difficulty breathing, and major burns and trauma) from the instant a caller finishes dialing 911 to the time when the first fire company resource arrives on scene, including the time it takes for the NYPD call taker to conference in the FDNY emergency medical dispatcher.
Source: Mayor’s Office, NYPD and FDNY.
Indicator name: Combined average response time to life-threatening medical emergencies by ambulances and fire companies (FDNY dispatch and travel time only) (minutes:seconds)
Description: The average dispatch and travel time until either an ambulance or fire company arrives on the scene of a life-threatening medical emergency, based on the first to arrive, counting from the time FDNY’s dispatcher receives the call or notification of request for assistance.
Source: FDNY Computer Aided Dispatch (CAD)System/STARFIRE/Emergency Medical Service.
Page 16 | Mayor’s Management Report
Fire Department
Indicator name: Average response time to life-threatening medical emergencies by ambulances (FDNY dispatch and travel time only) (minutes:seconds)
Description: The average dispatch and travel time until the first Emergency Medical Service resource, including ambulances and Advanced Life Support “fly cars,” arrives on the scene of a life-threatening medical emergency (incidents of cardiac arrest, choking, unconsciousness, difficulty breathing, and major burns and trauma) counting from the time FDNY’s dispatcher receives the call or notification of request for assistance.
Source: FDNY Computer Aided Dispatch (CAD) System/Emergency Medical Service.
Indicator name: Average response time to life-threatening medical emergencies by fire companies (FDNY dispatch and travel time only) (minutes:seconds)
Description: The average dispatch and travel time until the first fire company arrives on the scene of a life-threatening medical emergency (incidents of cardiac arrest, choking, unconsciousness, difficulty breathing, and major burns and trauma) counting from the time FDNY’s dispatcher receives the call or notification of request for assistance.
Source: FDNY Computer Aided Dispatch (CAD) System/STARFIRE.
Indicator name: Life-threatening medical emergency incidentsDescription: Total number of life-threatening medical emergencies, including reports of patients in cardiac
arrest and severe trauma, receiving an ambulance and non-transport fly car response.Source: FDNY Computer Aided Dispatch (CAD) System/Emergency Medical Service.
Indicator name: Segment one incidents (cardiac arrest and choking)Description: The number of reports of patients in cardiac arrest (sudden cessation of heartbeat and cardiac
function) receiving a 911 response.Source: FDNY/EMS Electronic Patient Call Reports (ePCR).
Indicator name: Cardiac arrest patients revived (%)Description: The percentage of confirmed, non-traumatic cardiac arrest patients receiving life-saving
measures, such as cardiopulmonary resuscitation (CPR)/Defibrillation, from 911 emergency response units with a return of spontaneous circulation during resuscitation efforts.
Source: FDNY/EMS Electronic Patient Call Reports (ePCR). Indicator name: - Witnessed cardiac arrest patients revived (%)Description: The percentage of bystander witnessed, non-traumatic, arrests of cardiac etiology patients who
receive lifesaving measures (such as CPR/Defibrillation) from 911 emergency response units with a return of spontaneous circulation during resuscitation efforts. A bystander is someone who is not a 911 emergency responder that is working in an official capacity as part of an organized medical response. Bystander witnessed arrests of cardiac etiology occur when a bystander is with the patient who can call for help, and possibly perform cardiopulmonary resuscitation (CPR) for a patient believed to be in arrest due to a cardiac condition.
Source: FDNY/EMS Electronic Patient Call Reports (ePCR). Indicator name: Peak number of ambulances in service per day Description: The average daily number of medical response units available for assignment or on assignment
in the 911 system (municipal and voluntary hospital Advanced Life Support (ALS) and Basic Life Support (BLS) ambulances and non-transport ALS “fly cars”) at the time of day that has the highest unit count. The fiscal year average is each day’s peak number of units divided by 365.
Source: FDNY Computer Aided Dispatch (CAD) System/Emergency Medical Service. Indicator name: FDNY workers who sustained service-connected injuries (total agency-wide)Description: The total number of workers in the Fire Service, Emergency Medical Service and civilian
workforce who sustained injuries while on duty (with or without medical leave).Source: FDNY Health Services - Computerized Injury Reporting System (CIRS)
Indicator Definitions | Page 17
Fire Department
Indicator name: Firefighters / fire officers who sustained service-connected injuriesDescription: The number of firefighters and fire officers who sustained injuries while on duty (with or without
medical leave).Source: FDNY Health Services - Computerized Injury Reporting System (CIRS).
Indicator name: Firefighters / fire officers who sustained service-connected injuries resulting in medical leaveDescription: The number of firefighters and fire officers who sustained injuries while on duty that resulted in
medical leave.Source: FDNY Health Services - Computerized Injury Reporting System (CIRS).
Indicator name: Firefighters / fire officers who sustained service-connected burn injuriesDescription: The number of firefighters and fire officers who sustained burn injuries while on duty (with or
without medical leave), including burns sustained inside and outside quarters.Source: FDNY Health Services - Computerized Injury Reporting System (CIRS).
Indicator name: Firefighters / fire officers who sustained service-connected burn injuries resulting in medical leaveDescription: The number of firefighters and fire officers who sustained burn injuries while on duty that resulted
in medical leave.Source: FDNY Health Services - Computerized Injury Reporting System (CIRS).
Indicator name: EMS workers / officers who sustained service-connected injuriesDescription: The number of workers in the Emergency Medical Service who sustained injuries while on duty
(with or without medical leave).Source: FDNY Health Services - Computerized Injury Reporting System (CIRS).
Indicator name: Civilian workers who sustained service-connected injuriesDescription: The number of civilian workers who sustained injuries while on duty (with or without medical
leave).Source: FDNY Health Services - Computerized Injury Reporting System (CIRS).
Indicator name: Firefighter/ fire officer service-connected injury rate (per 10,000 runs)Description: The total number of firefighters and fire officers who sustained injuries while on duty per 10,000
runs.Source: FDNY Health Services.
Indicator name: Apparatus collision rate (per 10,000 runs)Description: The total number of collisions involving fire engines and ladders per 10,000 runs.Source: Accident Reporting System, FDNY Computer Aided Dispatch (CAD) System/Starfire.
Indicator name: Ambulance collision rate (per 10,000 runs)Description: The total number of collisions involving ambulances per 10,000 runs.Source: Accident Reporting System, FDNY Computer Aided Dispatch (CAD) System/ Emergency Medical
Service.
Indicator name: Average annual cost of an engine company ($000,000)Description: The average cost in millions of dollars to operate an engine company for a year, calculated based
on the total costs including direct and indirect personnel costs, other than personal service costs, leasing, City overhead and fringe costs, divided by the total number of engine companies.
Source: FDNY Bureau of Budget Services. Indicator name: Average annual cost of a ladder company ($000,000)Description: The average cost in millions of dollars to operate a ladder company for a year, calculated based
on the total costs including direct and indirect personnel costs, other than personal service costs, leasing, City overhead and fringe costs, divided by the total number of ladder companies.
Source: FDNY Bureau of Budget Services.
Page 18 | Mayor’s Management Report
Fire Department
Indicator name: Average annual cost of an ambulance ($000,000)Description: The average cost in millions of dollars to operate a three-tour per day ambulance for a year,
calculated based on the total costs including direct and indirect personnel costs, other than personal service costs, leasing, City overhead and fringe costs, divided by the total number of ambulances.
Source: FDNY Bureau of Budget Services.
Indicator name: Average time from inspection request until inspection (days) - Fire alarm inspections - Rangehood inspectionsDescription: The time in days between a customer request for an inspection of a newly installed fire alarm,
rangehood or fire suppression system until an FDNY inspector witnesses a test of the new system.
Source: Bureau of Fire Prevention.
Indicator Name: Violations admitted to or upheld at the Office of Administrative Trials and Hearings (%)Description: For all violations returnable to OATH, the number of violations where the respondent admitted to
the violation and paid the penalty without a hearing or where the violation was upheld following a hearing as a percent of all violations resolved.
Source: Office of Administrative Trials and Hearings (OATH).
Indicator name: Completed requests for interpretationDescription The sum of all requests for interpretation using a language other than English fulfilled by the
agency via telephone (including Language Line, call centers, offices/reception desks and 311 transfer calls) and via face-to-face interaction with bilingual employees or contracted interpreters.
Source: FDNY.
Indicator name: Letters responded to in 14 days (%)Description: The percentage of letters answered in 14 calendar days or less. Responses are substantive and
adequately address the question/issue raised by the customer. However, for complex inquiries that require research and additional action on the part of the agency, an acknowledgement which includes a description of the next step, as well as an estimated time frame for completion, is considered acceptable and is also reported as part of the 14 day response. Agencies track the additional time until a customer has a complete and full response.
Source: FDNY.
Indicator name: E-mails responded to in 14 days (%)Description: The percentage of emails answered in 14 calendar days or less. Responses are substantive and
adequately address the question/issue raised by the customer. However, for complex inquiries that require research and additional action on the part of the agency, an acknowledgement which includes a description of the next step, as well as an estimated time frame for completion, is considered acceptable and is also reported as part of the 14 day response. Agencies track the additional time until a customer has a complete and full response.
Source: FDNY.
Indicator name: Average in-person wait time (minutes)Description: The average time in minutes from the time a customer meets with a greeter or information desk
representative until he or she is met by a customer service representative. Security/building entry wait times are not included unless a security guard plays a formal intake role.
Source: FDNY.

Indicator Definitions | Page 19
Fire Department
Indicator name: CORE (Customers Observing and Reporting Experiences) facility rating (0-100)Description: An average score based on the rating of 15 conditions, including physical conditions (e.g.,
cleanliness, litter, seating) and customer service conditions (e.g. wait time, professionalism), for all agency walk-in facilities inspected, divided by the number of walk-in facilities inspected. Facilities are rated by trained City inspectors.
Source: Mayor’s Office of Operations.

Page 20 | Mayor’s Management Report
Fire Department
Indicator Definitions | Page 21
New York City Emergency Management
Indicator name: IncidentsDescription: The total number of individual emergency incidents requiring field response or monitoring from
NYCEM.Source: NYCEM Operations Indicator name: Field responsesDescription: The number of individual emergency incidents responded to by NYCEM for the purposes of
coordinating the City’s actions on-scene, providing first hand information to City officials and coordinating the provision of resources. Measures response to each incident as a singular event regardless of complexity or duration of the incident.
Source: NYCEM Operations
Indicator name: Incidents monitored from NYCEM Watch CommandDescription: The number of individual emergency incidents monitored and coordinated from the 24/7/365
NYCEM Watch Command. Actions include impact assessment, internal and external notifications and logistical support.
Source: NYCEM Operations
Indicator name: Interagency meetings held during field responsesDescription: The number of on-site conferences held by NYCEM with other responding agencies. May
represent multiple conferences per field response.Source: NYCEM Operations Indicator name: Days Emergency Operations Center activatedDescription: The number of days that the City’s Emergency Operations Center (EOC) was activated.Source: NYCEM EOC Management
Indicator name: Full-scale and functional exercises/drillsDescription: The number of field exercises (full-scale and functional drills that evaluate the mobilization of
response to various incident types) held by the agency.Source: NYCEM Training and Exercises Indicator name: Tabletop exercisesDescription: The number of tabletop discussions and/or simulations of various emergency situations designed
to familiarize personnel with their roles and responsibilities conducted by the agency.Source: NYCEM Training and Exercises
Indicator name: Participation in drills coordinated by other agencies or organizationsDescription: The number of drills and exercises that NYCEM staff participate in with other agencies (federal,
State and local), jurisdictions and entities (private and nonprofit).Source: NYCEM Training and Exercises Indicator name: Participants at instructor-led emergency management training sessions.Description: The total number of City, State and federal government employees and non-profit or private-
sector individuals working in an emergency management related field taking part in NYCEM-sponsored training programs related to emergency response, including Incident Command System training sessions.
Source: NYCEM Training and Exercises
Indicator name: Online emergency management courses completed through Learning Management SystemDescription: All online courses taken through the NYC Academy Learning Management System. Courses are
taken by internal staff and agency partners.Source: NYCEM Training and Exercises
Page 22 | Mayor’s Management Report
New York City Emergency Management
Indicator name: Total participants at emergency preparedness education sessionsDescription: The total number of people who attended NYCEM-sponsored emergency preparedness events,
including Community Emergency Response Team (CERT) seminars, public preparedness presentations for residents and community groups, preparedness activities conducted at outreach fairs and preparedness in the workplace presentations.
Source: NYCEM External Affairs
Indicator name: Ready New York webpage viewsDescription: The number of times the Ready New York emergency preparedness website is viewed online at
NYC.gov.Source: NYCEM External Affairs—Ready New York Indicator name: Community Emergency Response Team (CERT) volunteer hoursDescription: Number of hours CERT members volunteer. CERTs are community-based nonprofit organizations
that have completed disaster preparedness and basic response skills training required for certification.
Source: NYCEM External Affairs—CERT Indicator name: CERT members recruitedDescription: The number of members of community-based, non-profit organizations that have been recruited
for disaster preparedness and basic response skills as part of a Community Emergency Response Team (CERT).
Source: NYCEM External Affairs - CERT
Indicator name: Community Emergency Response Team (CERT) deploymentsDescription: Number of deployments for Community Emergency Response Team (CERT) volunteer members.
CERTs are community-based nonprofit organizations whose members have completed disaster preparedness and basic response skills training required for certification.
Source: NYCEM External Affairs—CERT
Indicator name: Notify NYC messages issuedDescription: The total number of messages issued about extreme weather, travel disruptions, cancellations,
closings or other emergency incidents monitored from the 24/7/365 NYCEM Watch Command. Notify NYC messages include emergency alerts and notifications about high impact events, public health advisories, public school closings and unscheduled suspension of parking rules.
Source: NYCEM Operations
Indicator name: Average time from incident to issuing of Notify NYC message (minutes: seconds)Description: The amount of time from the beginning of an emergency incident to NYCEM Watch Command
issuing a notification message via Notify NYC.Source: NYCEM Operations
Indicator name: Subscribers to Notify NYC, CorpNet, Advance Warning System, and Community Preparedness newsletter.
Description: The total number of subscribers to all of NYCEM’s messaging and alert services.Source: NYCEM External Affairs
Indicator Definitions | Page 23
New York City Emergency Management
Indicator name: Letters responded to in 14 days (%)Description: The percentage of letters answered in 14 calendar days or less. Responses are substantive and
adequately address the question/issue raised by the customer. However, for complex inquiries that require research and additional action on the part of the agency, an acknowledgement which includes a description of the next step, as well as an estimated time frame for completion, is considered acceptable and is also reported as part of the 14 day response. Agencies track the additional time until a customer has a complete and full response.
Source: NYCEM.
Indicator name: E-mails responded to in 14 days (%)Description: The percentage of emails answered in 14 calendar days or less. Responses are substantive and
adequately address the question/issue raised by the customer. However, for complex inquiries that require research and additional action on the part of the agency, an acknowledgement which includes a description of the next step, as well as an estimated time frame for completion, is considered acceptable and is also reported as part of the 14 day response. Agencies track the additional time until a customer has a complete and full response.
Source: NYCEM.

Page 24 | Mayor’s Management Report
New York City Emergency Management
Indicator Definitions | Page 25
Department of Correction
Indicator name: AdmissionsDescription: Number of inmates admitted to DOC custody from courts during fiscal year.Source: DOC Population Research Indicator name: Average daily populationDescription: Annual average of the daily number of inmates in DOC custody during fiscal year.Source: DOC Population Research
Indicator name: Inmates in security risk group (% ADP)Description: The percent of the average daily population of inmates identified as Security Risk Group inmates.Source: DOC SRG Database Indicator name: Fight/assault infractionsDescription: The number of fight and assault infractions processed by the DOC Adjudication Unit.Source: DOC Security database
Indicator name: Jail-based arrests of inmatesDescription: The number of inmates who were arrested for committing criminal offenses while in DOC custody.Source: DOC Security database Indicator name: SearchesDescription: The number of searches conducted by uniformed staff.Source: DOC Security database
Indicator name: Weapons recoveredDescription: The number of weapons recovered during searches.Source: DOC Security database
Indicator name: Violent inmate-on-inmate incidents (monthly rate per 1,000 ADP)Description: The monthly rate, per 1,000 inmates, of incidents of reported violence by an inmate(s) against
another inmate(s). These incidents include inmate physical fights and assaults, including slashings and stabbings.
Source: DOC Security database
Indicator name: Serious injury to inmate(s) as a result of violent inmate-on-inmate incidents (monthly rate per 1,000 ADP)
Description: The monthly rate, per 1,000 inmates, of incidents of reported violence by an inmate(s) against another inmate(s), (such as physical fights/assaults, slashings, and stabbings), that result in an injury to an inmate requiring medical treatment beyond the prescription of over-the-counter analgesics.
Source: DOC Security database
Indicator name: Inmate assault on staff (monthly rate per 1,000 ADP)Description: The monthly rate, per 1,000 inmates, of incidents involving an inmate assault on a civilian staff
member or a uniformed staff member. Assaults against uniformed staff members captured by this indicator include only those resulting in a staff use of force. Although rare, some assaults on uniformed staff do not precipitate a use of force and are not represented in the data as it is currently captured.
Source: DOC Security database
Page 26 | Mayor’s Management Report
Department of Correction
Indicator name: Serious injury to staff as a result of inmate assault on staff (monthly rate per 1,000 ADP)Description: The monthly rate, per 1,000 inmates, of incidents where an inmate(s) assault on a uniformed or
civilian staff member(s) results in an injury to a staff member requiring medical treatment beyond the prescription of over-the-counter analgesics or the administration of minor first aid.
Source: DOC Security database
Indicator name: Escapes (rate per 1,000 ADP)Description: The monthly rate, per 1,000 inmates, of escapes from DOC custody.Source: DOC Security database Indicator name: Non-natural inmate deaths in custody (monthly rate per 1,000 ADP)Description: The monthly rate, per 1,000 inmates, of inmate deaths resulting from non-natural causes
including suicides, homicides, overdoses, and accidents.Source: DOC Security database
Indicator name: Incidents of use of force - totalDescription: Total number of incidents where custodial staff used force against one or more inmates to enforce
Department policy. Physical contact employed by staff in a non-confrontational manner to apply mechanical restraints or to guide the inmate is not a reportable use of force.
Source: DOC Security database
Indicator name: Department use of force incidents with serious injury (rate per 1,000 ADP)Description: The monthly rate, per 1,000 inmates, of incidents where uniformed staff used force against one or
more inmates and at least one person involved suffered an injury requiring treatment beyond the prescription of over-the-counter analgesics or minor first aid.
Source: DOC Security database Indicator name: Department use of force incidents with minor injury (rate per 1,000 ADP)Description: The monthly rate, per 1,000 inmates, of incidents where uniformed staff used force against one
or more inmates and at least one person involved suffered a minor injury requiring no treatment beyond the prescription of over-the-counter analgesics or minor first aid.
Source: DOC Security database Indicator name: Department use of force incidents with no injury (rate per 1,000 ADP)Description: The monthly rate, per 1,000 inmates, of incidents where uniformed staff used force against one or
more inmates and no person involved was injured.Source: DOC Security database Indicator name: Incidents and allegations of use of forceDescription: Total number of incidents where custodial staff used or allegedly used force against one or more
inmates to enforce Department policy. Physical contact employed by staff in a non-confrontational manner to apply mechanical restraints or to guide the inmate is not a reportable use of force.
Source: DOC Security database Indicator name: Inmates with a mental health diagnosis (% ADP)Description: The percent of the average daily population in DOC custody during the reporting period
comprised of inmates with a mental health diagnosis.Source: DOC Strategic Planning and Programs database
Indicator name: Inmates with a serious mental illness (SMI) diagnosis (% ADP)Description: The percent of the average daily population in DOC custody during the reporting period
comprised of inmates with a serious mental illness diagnosis.Source: NYC H+H
Indicator Definitions | Page 27
Department of Correction
Indicator name: Inmate health clinic visitsDescription: The number of inmate visits to medical staff.Source: DOC Strategic Planning and Programs database
Indicator name: Average clinic waiting time (minutes)Description: The average number of minutes an inmate waited to see medical staff at a facility clinic.Source: DOC Strategic Planning and Programs database
Indicator name: Jail cells unavailable (short-term repair) (%)Description: The percent of jail cells in need of short-term repair.Source: DOC Custody Management database Indicator name: Population as percent of capacity (%)Description: The percent of open and ready beds that inmates occupied.Source: DOC Population Research database
Indicator name: On-trial inmates delivered to court on time (%)Description: The percent of inmates on trial whom the DOC delivered to court on time.Source: DOC Criminal Justice Bureau database Indicator name: I-CAN EnrollmentsDescription: Any instance when an inmate meets with a contracted provider for intake and signs up for the
program. The vast majority of inmates who enroll in the program participate in at least one service.
Source: DOC contracted providers.
Indicator name: I-CAN workshopsDescription: The number of jail-based group activities where inmates receive services such as job readiness
training, cognitive behavioral therapy or parenting. Source: DOC contracted providers.
Indicator name: Average daily number of inmates in vocational skills training programsDescription: The average daily number of inmates attending vocational development programs.Source: DOC Strategic Planning and Programs database
Indicator name: Average daily attendance in school programs Description: The average daily attendance of inmates in Department of Education (DOE) school programs.
Data for this performance measure include both the attendance of inmates mandated to attend school (16 and 17 year olds), and those for whom DOC and DOE are required to provide educational services upon their request (18 to 21 year olds).
Source: DOC Strategic Planning and Programs database
Indicator name: Inmates participating in skills-building activities/discharge planning (%)Description: The percent of inmates in custody for more than ten days during the reporting period who
participated in skills-building activities including vocational, educational and life-skill programs, and discharge planning services.
Source: DOC Strategic Planning and Programs database
Indicator name: Victim Identification Notification Everyday (VINE) system registrationsDescription: The number of new registrations created to receive notification from the VINE system for
information concerning the transfer or release date of an inmate.Source: DOC Strategic Planning and Programs database
Page 28 | Mayor’s Management Report
Department of Correction
Indicator name: VINE confirmed notificationsDescription: The number of VINE notifications successfully delivered to registrants regarding the release or
transfer of an inmate.Source: DOC Strategic Planning and Programs database
Indicator name: Collisions involving city vehiclesDescription: The total number of City-vehicle involved collision reports involving injury or property damage for
the citywide fleet reported in the citywide collision reporting system (CRASH). New York State MV-104 reports are required whenever a collision occurs involving death, or other personal injury, or property damage over $1,000. Collisions are tracked and reported regardless of whether or not the driver was at fault and whether or not the vehicle was in motion. Collisions involving City vehicles occur whenever a City vehicle strikes (or is struck by) a second vehicle, pedestrian, bicyclist or fixed object.
Source: DOC Fleet Administration
Indicator name: Workplace injuries reportedDescription: All incidents resulting in a workers’ compensation or line of duty injury claim regardless of whether
or not time is lost.Source: DOC Security database
Indicator name: Accidents involving inmatesDescription: All accidents resulting in an injury to inmate requiring more than over-the-counter treatment.Source: DOC Security database
Indicator Definitions | Page 29
Department of Probation
Indicator name: Adult investigation reports completed – total/felony/misdemeanorDescription: The overall number adult presentence investigation reports submitted to local courts during the
reporting period. The combined total consists of reports completed for felony & misdemeanor convictions in criminal or supreme court.
Source: Adult Operations
Indicator name: Adult investigation reports – on time completion (%)Description: The percentage of adult investigation reports submitted to court prior to the mandated delivery
deadline. These reports assist local judges in making informed adjudication (sentencing) decisions.
Source: Adult Operations
Indicator name: Juvenile investigation reports completedDescription: The total number of preadjudication Investigation Reports completed for juveniles during the
reporting period.Source: Juvenile Operations
Indicator name: Juvenile investigation reports – on time completion (%)Description: The percentage of juvenile investigation reports submitted to court prior to the mandated
delivery deadline. These reports assist local judges in making informed adjudication (sentencing) decisions.
Source: Juvenile Operations
Indicator name: Juvenile supervision - Intake cases receivedDescription: The number of intake determinations produced after being sent to the Probation Department
following a juvenile arrest. A juvenile intake determines whether a youth will be referred for prosecution, sent for adjustment (court diversion) services, or released based on their case being dismissed.
Source: Juvenile Operations
Indicator name: Juvenile Delinquency cases eligible for adjustment (%)Description: The percent of eligible Juvenile Delinquency cases opened for adjustment services divided by all
new intake case recommendations, to measure potential adjustment eligibility.Source: Borough Offices/Juvenile Operations
Indicator name: Juvenile Delinquency cases eligible for adjustment – high risk(%)Description: The percent of eligible high risk Juvenile Delinquency cases opened for adjustment services
divided by all new intake case recommendations, to measure potential adjustment eligibility.Source: Borough Offices/Juvenile Operations
Indicator name: Juvenile Delinquency cases eligible for adjustment – medium risk (%)Description: The percent of eligible medium risk Juvenile Delinquency cases opened for adjustment services
divided by all new intake case recommendations, to measure potential adjustment eligibility.Source: Borough Offices/Juvenile Operations
Indicator name: Juvenile Delinquency cases eligible for adjustment – low risk (%)Description: The percent of eligible low risk Juvenile Delinquency cases opened for adjustment services
divided by all new intake case recommendations, to measure potential adjustment eligibility.Source: Borough Offices/Juvenile Operations
Indicator name: Adult supervision cases - end of periodDescription: The total adult supervision case count Citywide at the end of the reporting period.Source: Adult Operations

Page 30 | Mayor’s Management Report
Department of Probation
Indicator name: Juvenile supervision cases - end of periodDescription: The total juvenile supervision case count Citywide at the end of the reporting period.Source: Juvenile Operations
Indicator name: Adult initial risk assessments completedDescription: The number of risk / need assessments completed for adult probationers at the onset of a
probation supervision term.Source: Adult Operations
Indicator name: Juvenile initial risk assessments completedDescription: The number of risk / need assessments completed for juvenile probationers at the onset of a
probation supervision term.Source: Adult Operations
Indicator name: Adult probationer rearrest rate (monthly average) (%)Description: The monthly number of adult probationers arrested divided by the total number of individuals
supervised, aggregated based on the reporting period. Source: Statistical Tracking, Analysis & Reporting System.
Source: Adult Operations
Indicator name: Adult probationers arrested citywide as a percentage of the NYPD arrest report (monthly average)
Description: The proportion of NYPD arrests that are adult probationers. Source: Statistical Tracking, Analysis & Reporting System, NYPD Weekly Arrest Report
Source: Adult Operations
Indicator name: Juvenile probationer rearrest rate (monthly average) (%)Description: The monthly number of juvenile probationers arrested divided by the total number of individuals
supervised, aggregated based on the reporting period.Source: Statistical Tracking, Analysis & Reporting System. Indicator name: Juvenile Probationers Arrested Citywide as a Percentage of the NYPD Arrest Report (monthly
average)Description: The proportion of NYPD arrests that are Juvenile probationers.Source: Statistical Tracking, Analysis & Reporting System, NYPD Weekly Arrest Report
Indicator name: Average monthly violation rate for adult probationers (%)Description: The proportion of adult probationers whose cases are referred to court for a violation proceeding
for serious misconduct.Source: Statistical Tracking, Analysis & Reporting System. Indicator name: Average monthly violation rate for juvenile probationers (%)Description: The proportion of juvenile probationers (individual youths) referred to court for a violation
proceeding for serious misconduct.Source: Statistical Tracking, Analysis & Reporting System.
Indicator name: Probation violation proceedings ending in revocation for adult probationers (%)Description: The percentage of violation hearing dispositions that result in the client’s removal from probation
supervision, relative to all dispositions. Source: Caseload Explorer automated case management system
Indicator name: Probation violation proceedings ending in revocation for juvenile probationers (%)Description: The percentage of violation hearing dispositions that result in the client’s removal from probation
supervision, relative to all dispositions. Source: New York State DP-30 reporting forms
Indicator Definitions | Page 31
Department of Probation
Indicator name: Revocation of juveniles not resulting in placement (%)Description: The percentage of juvenile “violation of probation” (VOP) proceedings resulting in a new
supervision level being assigned, or a modification of an existing disposition.Source: Caseload Explorer automated case management system
Indicator name: Revocation of juveniles resulting in placement (%)Description: The percentage of juvenile “violation of probation” (VOP) proceedings resulting in the youth’s
probation case being closed for non-compliance, and the youth being transferred to the custody of the State Office of Children and Family Services for placement in a secure detention facility.
Source: Caseload Explorer automated case management system
Indicator name: Adult supervision- new individual action plans (IAPs) created for eligible clients (%)Description: The percentage of new adult probation cases opened during the reporting period that have
received an individual action plan (IAP) for the client. The IAP serves as a structured blueprint designed to assist a client in achieving self-sufficiency and disengagement with the criminal or juvenile justice system.
Source: Caseload Explorer automated case management system
Indicator name: Juvenile supervision - new Individual Action Plans (IAPs) created for eligible clients (%)Description: The percentage of new juvenile probation cases opened during the reporting period that have
received an individual action plan (IAP) for the client. The IAP serves as a structured blueprint designed to assist a client in achieving self-sufficiency and disengagement with the criminal or juvenile justice system.
Source: Caseload Explorer automated case management system
Indicator name: New Enrollments in Alternative-to-Placement (ATP) ProgramsDescription: The average number of eligible youth who were active participants in ATP programs, including
Esperanza, which has been an ATP program since 2003, and three additional ATP programs: Advocate, Intervene, Mentor (AIM); Every Child Has a Chance to Excel and Succeed (Echoes); and Pathways to Excellence, Achievement, & Knowledge (PEAK) during the reporting period. These programs offer youth a community-based, intensive family-centered supervision model which serves as an alternative to state placement.
Source: Borough Offices/Juvenile Operations
Indicator name: New enrollments in DOP-managed programs. Description: The number of adult & juvenile participants enrolled during the reporting period in a criminal /
juvenile justice program directly managed by the Department.Source: Caseload Explorer automated case management system
Indicator name: Adult probationer early completion rate (%)Description: The percentage of all case closings that are closed for early discharge.Source: Statistical Tracking, Analysis & Reporting System. Indicator name: Adult probationer early completion approval rate (%)Description: The percent of all early discharge applications approved by local courts Citywide for early
discharge requests filed by DOP on behalf of adult probationers in good standing.Source: Statistical Tracking, Analysis & Reporting System. Indicator name: Successful completion rate for adult probationers (%)Description: The percentage of probation supervision cases that are closed due to maximum expiration
(sentence served in full) or early completion, relative to all supervision case closings.Source: Caseload Explorer automated case management system
Page 32 | Mayor’s Management Report
Department of Probation
Indicator name: Successful completion rate for juvenile probationers (%)Description: The percentage of probation supervision cases that are closed due to maximum expiration
(sentence served in full) or early completion, relative to all supervision case closings.Source: New York State DP-30 reporting forms
Indicator name: Intel enforcement eventsDescription: The number of community-based enforcement activities performed by the Department’s
Intelligence Unit (Intel) during the reporting period. Intel enforcement actions include NYPD domestic incident report notice follow-up, gang-related investigations, bench warrant enforcement, failure-to-report home visits, and transporting offenders to and from other jurisdictions.
Source: Intelligence Unit
Indicator Definitions | Page 33
Civil ian Complaint Review Board
Indicator name: Total civilian complaints against uniformed members of the New York City Police DepartmentDescription: The number of misconduct complaints made by civilians against members of the New York
City Police Department investigated by the CCRB, for allegations of excessive force, abuse of authority, discourtesy and offensive language.
Source: CCRB Complaint Tracking System.
Indicator name: Average age of open docket (days)Description: The average age in days, as measured from date the complaint was received by CCRB, for all
open cases on the docket.Source: CCRB Complaint Tracking System.
Indicator name: Average time to complete a full investigation (days)Description: The average number of days to complete a full investigation, measured from the date CCRB
received the complaint to the date when the Board renders a final decision. The indicator measures the elapsed time from the start of the investigation to the closing date for all full investigations closed within the reporting period.
Source: CCRB Complaint Tracking System. Indicator name: Full investigations as a percentage of total cases completed (%)Description: The percentage of all cases on the Board’s docket that were closed during the reporting period
after being fully investigated; the remainder were truncated due to a complaint being withdrawn, complainant, victim or witness being unable to cooperate or unavailable to aid in the investigation.
Source: CCRB Complaint Tracking System.
Indicator name: Cases closedDescription: Number of cases in which the Board renders a final decision.Source: CCRB Complaint Tracking System. Indicator name: Closed allegations with findings on the merits (%)Description: The percentage of allegations fully investigated and closed as substantiated, exonerated or
unfounded. The Board renders findings on the merits when sufficient evidence has been gathered to allow a factual conclusion to be made. No findings on the merits are made when allegations are unsubstantiated, the subject officer is no longer a member of NYPD, or the subject officer could not be identified.
Source: CCRB Complaint Tracking System.
Indicator name: Average time to complete a substantiated investigation (days)Description: The average number of days to complete a substantiated case, as measured from date CCRB
received the complaint to the date when the Board renders a final decision. The indicator measures the elapsed time from the start of the investigation to the closing date for all full substantiated investigations closed within the reporting period.
Source: CCRB Complaint Tracking System.
Indicator name: Substantiated cases in which the statute of limitations expired (%)Description: The percentage of substantiated cases that were completed after the 18 month statute of
limitations expired. The statute of limitations is measured from the date of incident.Source: CCRB Complaint Tracking System.
Indicator name: Officers disciplined (excluding pending and filed cases) (%)Description: The percentage of substantiated complaints reviewed by NYPD where the police officer received
some type of discipline. Excludes pending (awaiting review) and filed cases (those with officers no longer employed by NYPD when case is reviewed).
Source: New York City Police Department (NYPD) & CCRB Complaint Tracking System.
Page 34 | Mayor’s Management Report
Civil ian Complaint Review Board
Indicator name: Cases with mutual agreement to mediateDescription: The number of cases referred and accepted for mediation.Source: CCRB Complaint Tracking System.
Indicator name: Officers who accepted mediation (%) Description: The percentage of identified subject officers who accepted mediation after the civilian(s) agreed
to mediate the complaint as an alternative to a full investigation.Source: CCRB Complaint Tracking System.
Indicator name: Civilians who accepted mediation (%)Description: The percentage of civilians who agreed to mediate their complaints when mediation was offered
by a CCRB investigator.Source: CCRB Complaint Tracking System.
Indicator name: Cases successfully mediatedDescription: The number of cases where both the civilian(s) and the subject officer(s) participated in a
successful mediation session at CCRB. Source: CCRB Complaint Tracking System.
Indicator name: Average mediation case completion time (days)Description: The average number of days required for completion of cases referred to mediation, as measured
from the date a complaint is received by CCRB to the date a complaint is successfully mediated.Source: CCRB Complaint Tracking System.
Indicator name: Mediation satisfaction rate (%)Description: The percentage of civilians who participated in a successful mediation who asserted their
satisfaction with the process.Source: CCRB Complaint Tracking System.
Indicator name: Administrative prosecution cases closedDescription: Pursuant to the April 2, 2012 Memorandum of Understanding (MOU) between NYPD and CCRB,
the total number of substantiated cases with charges and specifications recommended by the Board that are closed by CCRB’s Administrative Prosecution Unit (APU). Total APU case closures include all closures, such as cases closed by plea agreement, trial, dismissal, expired statute of limitations, reconsidered cases and cases retained (those in which NYPD keeps jurisdiction pursuant to Section 2 of the MOU).
Source: CCRB Complaint Tracking System/APU.
Indicator name: - Cases closed by pleaDescription: The number of substantiated cases with charges and specifications recommended by the Board
that are closed by plea agreement.Source: CCRB Complaint Tracking System/APU.
Indicator name: - Cases closed by trialDescription: The number of substantiated cases with charges and specifications recommended by the Board
that were tried by CCRB’s Administrative Prosecution Unit (APU). APU prosecutes these cases in front of an NYPD administrative law judge.
Source: CCRB Complaint Tracking System/APU.
Indicator name: Completed requests for interpretationDescription The sum of all requests for interpretation using a language other than English fulfilled by the
agency via telephone (including Language Line, call centers, offices/reception desks and 311 transfer calls) and via face-to-face interaction with bilingual employees or contracted interpreters.
Source: CCRB.
Indicator Definitions | Page 35
Civil ian Complaint Review Board
Indicator name: Letters responded to in 14 days (%)Description: The percentage of letters answered in 14 calendar days or less. Responses are substantive and
adequately address the question/issue raised by the customer. However, for complex inquiries that require research and additional action on the part of the agency, an acknowledgement which includes a description of the next step, as well as an estimated time frame for completion, is considered acceptable and is also reported as part of the 14 day response. Agencies track the additional time until a customer has a complete and full response.
Source: CCRB.
Indicator name: E-mails responded to in 14 days (%)Description: The percentage of emails answered in 14 calendar days or less. Responses are substantive and
adequately address the question/issue raised by the customer. However, for complex inquiries that require research and additional action on the part of the agency, an acknowledgement which includes a description of the next step, as well as an estimated time frame for completion, is considered acceptable and is also reported as part of the 14 day response. Agencies track the additional time until a customer has a complete and full response.
Source: CCRB.
Indicator name: CORE (Customers Observing and Reporting Experiences) facility rating (0-100)Description: An average score based on the rating of 15 conditions, including physical conditions (e.g.,
cleanliness, litter, seating) and customer service conditions (e.g. wait time, professionalism), for all agency walk-in facilities inspected, divided by the number of walk-in facilities inspected. Facilities are rated by trained City inspectors.
Source: Mayor’s Office of Operations.

Page 36 | Mayor’s Management Report
Civil ian Complaint Review Board
Indicator Definitions | Page 37
Law Department
Indicator name: Total citywide payout for judgments and claims ($000)Description: The judgment and claims amount, in thousands of dollars, paid by the City from the judgment
and claims account in the City’s General Fund to resolve cases through settlement or verdict, including pre-litigation claims dispositions.
Source: Office of Management and Budget
Indicator name: Total cases commenced against the CityDescription: The number of state court and federal court matters assigned a litigation start date, where if there
is a money disposition, it will be paid from the judgment and claims account in the City’s General Fund.
Source: LawManager system
Indicator name: - Cases commenced against the City in state court.Description: Subset of the total cases commenced. Includes state court matters from the Department’s
General Litigation, Labor & Employment Law, Special Federal Litigation and Tort Divisions, where if there is a money disposition, it will be paid from the judgment and claims account in the City’s General Fund.
Source: LawManager system
Indicator name: - Cases commenced against the City in federal courtDescription: Subset of the total cases commenced. Includes federal court matters from the Department’s
General Litigation, Labor & Employment Law, Special Federal Litigation and Tort Divisions, where if there is a money disposition, it will be paid from the judgment and claims account in the City’s General Fund.
Source: LawManager system
Indicator name: Cases pending in state courtDescription: The number of state court tort cases, such as personal injury and property damage cases, that
have not yet been disposed (resolved). Includes only tort cases from the Department’s Tort Division.
Source: LawManager system
Indicator name: - Cases pending on trial calendarDescription: The subset of pending state court tort cases that have a filed note of issue and certificate of
readiness for trial on the state court calendar. Source: New York State Office of Court Administration.
Indicator name: Affirmative motions to dismiss or for summary judgmentDescription: Dispositive motions (motions to dismiss/for summary judgment) made by the Department’s Tort
Division on tort cases in state court where the original return date of the motion before the court is within the reporting period.
Source: LawManager system
Indicator name: Win rate on affirmative motions (%)Description: The percentage of decisions granted in favor of the City based on the number of motions decided,
within the reporting period, as the result of dispositive motions made by the Department’s Tort Division on tort cases in state court.
Source: LawManager system
Indicator name: Cases pending in federal court.Description: The number of federal court tort cases handled by the Department’s Special Federal
Litigation Division that have not yet been disposed (resolved). Source: LawManager system

Page 38 | Mayor’s Management Report
Law Department
Indicator name: Dismissals or discontinuances Description: The number of federal court tort cases handled by the Department’s Special Federal Litigation
Division where the action has been dismissed or discontinued.Source: LawManager systemIndicator name: Juveniles successfully referred to a diversion program with no new delinquency referral within 1
year (%)Description: The percentage of youth who, within a year of successfully completing a diversion program,
obtained no new delinquency referrals, measuring the effectiveness of programs used as part of a Department initiative to divert certain low-level juvenile delinquency cases from prosecution.
Source: LawManager system Indicator name: Referred cases filed for prosecution (%) Description: The percentage of all juvenile delinquency matters referred to the Department that are filed for
prosecution by the Department’s Family Court Division following completion of the investigation phase (including interviewing victims and witnesses, collecting and reviewing evidence and determining whether the charges are legally sufficient and appropriate to file). Cases that are not filed may be diverted to a community-based program, referred to the Department of Probation, covered pursuant to a plea bargain or declined for legal reasons.
Source: LawManager system
Indicator name: Crime victims referred for community-based services (%)Description: The percentage of crime victims assessed by Department attorneys who were referred to
community-based services available to victims.Source: Family Court Division Indicator name: Juvenile conviction rate (%)Description: The percentage of all outcomes for filed juvenile delinquency cases that result in a delinquency
finding or plea. Other types of case outcomes include pre-finding adjournments in contemplation of dismissal, post-filing referrals to the Department of Probation for adjustment and other dismissals.
Source: LawManager system Indicator name: Filing of enforcement referrals within 60 days of referral (%)Description: The percentage of requests received by the Department where a petition is filed in the Family
Court within 60 calendar days after the receipt of the referral from the Human Resources Administration’s Office of Child Support Enforcement (OCSE). OCSE refers cases to the Department for assistance seeking judicial remedies in Family Court against non-custodial parents who are not meeting their child support obligation. Data for Fiscal 2013 was partial, covering only October 2012 through June 2013.
Source: LawManager system
Indicator name: Families entitled to a support order that get a support order (%)Description: The percentage of child support orders entered in Family Court on behalf of custodial parents
who are living in other jurisdictions. The Department receives petitions seeking the establishment of child support and medical support that are filed in Family Court on behalf of custodial parents who are living in other jurisdictions.
Source: LawManager system
Indicator name: Completed requests for interpretationDescription The sum of all requests for interpretation using a language other than English fulfilled by the
agency via telephone (including Language Line, call centers, offices/reception desks and 311 transfer calls) and via face-to-face interaction with bilingual employees or interpreters.
Source Law
Indicator Definitions | Page 39
Law Department
Indicator name: Letters responded to in 14 days (%)Description: The percentage of letters answered in 14 calendar days or less. Responses are substantive and
adequately address the question/issue raised by the customer. However, for complex inquiries that require research and additional action on the part of the agency, an acknowledgement which includes a description of the next step, as well as an estimated time frame for completion, is considered acceptable and is also reported as part of the 14 day response. Agencies track the additional time until a customer has a complete and full response.
Source: LawIndicator name: E-mails responded to in 14 days (%)Description: The percentage of emails answered in 14 calendar days or less. Responses are substantive and
adequately address the question/issue raised by the customer. However, for complex inquiries that require research and additional action on the part of the agency, an acknowledgement which includes a description of the next step, as well as an estimated time frame for completion, is considered acceptable and is also reported as part of the 14 day response. Agencies track the additional time until a customer has a complete and full response.
Source: Law

Page 40 | Mayor’s Management Report
Law Department
Indicator Definitions | Page 41
Department of Investigation
Indicator name: ComplaintsDescription: The number of complaints containing allegations of criminal activity, corruption or conflicts
of interest, as well as service complaints, received via the internet, telephone, walk-ins and conventional mail. Not all complaints received fall under DOI’s jurisdiction.
Source: Case Management System (CMS).
Indicator name: Written policy and procedure recommendations issued to City agenciesDescription: The number of formal written recommendations by the Department for citywide or City agency
specific changes in policies and procedures to correct operational vulnerabilities identified through DOI investigations.
Source: Case Management System (CMS).
Indicator name: Written policy and procedure recommendations issued during previous fiscal years that have been accepted by City agencies (%)
Description: The percentage of DOI’s formal written recommendations issued during the previous fiscal year that have been accepted by City agencies. Full fiscal year data from City agencies on their acceptance of DOI’s recommendations will be reported in the PMMR to account for the time agencies require to respond to the recommendations. Acceptance of the fiscal years recommendations will be updated for each reporting cycle. Accepted PPRs include those where the agency already had the practice in place at the time the PPR was issued.
Source: PPR Information System (PPRIS).
Indicator name: Written policy and procedure recommendations issued during previous fiscal years that have been implemented of those accepted by City agencies (%)
Description: The percentage of DOI’s formal written recommendations issued during the previous fiscal year that have been implemented by City agencies out of the total of those accepted. Full fiscal year data from City agencies on their acceptance and implementation of DOI’s recommendations will be reported in the PMMR to account for the time agencies require to respond to the recommendations. Acceptance of the fiscal years recommendations will be updated for each reporting cycle. Accepted and implemented PPRs include those where the agency already had the practice in place at the time the PPR was issued.
Source: PPR Information System (PPRIS).
Indicator name: Written PPRs issued during previous fiscal years that are still pending an outcome from City agencies (%)
Description: The percentage of DOI’s formal written recommendations issued during the previous fiscal year that are still pending an outcome from City agencies. Full fiscal year data from City agencies on their current status of DOI’s recommendations will be reported in the PMMR to account for the time agencies require to respond to the recommendations. The status of the fiscal years recommendations will be updated for each reporting cycle. Pending PPRs are still in evaluation with agencies and DOI and may be outstanding for a variety of reasons.
Source: PPR Information System (PPRIS).
Indicator name: Written PPRs issued during previous fiscal years that have been rejected by City agencies (%)Description: The percentage of DOI’s formal written recommendations issued during the previous fiscal
year that have been rejected by City agencies. Full fiscal year data from City agencies on their rejection of DOI’s recommendations will be reported in the PMMR to account for the time agencies require to respond to the recommendations. Rejection of the fiscal years recommendations will be updated for each reporting cycle. Rejected PPRs include those where the agency rejected the PPR partially or in full.
Source: PPR Information System (PPRIS).
Page 42 | Mayor’s Management Report
Department of Investigation
Indicator name: Corruption prevention and whistleblower lectures conductedDescription: The number of lectures conducted by DOI to new City employees, agencies undergoing major
investigations and vendors conducting business with, or receiving benefits from, the City.Source: Offices of the Inspectors General computerized database.
Indicator name: Corruption prevention lecture e-learning attendeesDescription: The number City employees, including employees at agencies under major investigations, and
consultants that complete the City’s online anti-corruption lectures. Source: Department of Citywide Administrative Services/DOI.
Indicator name: Integrity monitoring agreementsDescription: The number of active monitoring agreements currently in place entered into by City vendors
who have been required to retain an Integrity Monitor at the company’s expense in order to be found responsible to do business with the City. Integrity Monitors are generally retained to monitor a vendor’s ongoing operations, with an emphasis placed on the areas that have raised integrity issues in the past. DOI also engages in proactive monitoring for vendors working on City projects to prevent or reduce fraud, waste or abuse –particularly on large-scale construction projects. Integrity Monitors are selected by DOI and report directly to DOI.
Source: Integrity Monitor Program.
Indicator name: Vendor name checks completed within 30 days (%)Description: The percent of all name and background checks of companies, as well as principals, AKAs and
affiliates, doing business with the City completed within 30 calendar days as per the Procurement Policy Board Rules.
Source: PASSPort system. Indicator name: Average time to complete an investigation (days) Description: The average length of time to complete all investigations of alleged corruption, fraud, waste,
abuse or unethical conduct (excluding background investigations which are captured separately) as a function of the investigation’s complexity from intake to when the investigation is completed. The sum of the time to complete each investigation that is closed within the reporting period is divided by the total number closed in that period.
Source: Case Management System (CMS).
Indicator name: Referrals for civil and administrative actionDescription: The number of referrals made to federal, state or City agencies. Civil actions may include
financial recoveries, restitution or recommendations for the initiation of lawsuits to collect damages. Administrative actions may include disciplinary, civil and Conflicts of Interest Board referrals.
Source: Case Management System (CMS). Indicator name: Referrals for criminal prosecutionDescription: The number of referrals made to federal, state and local prosecutors’ offices as a result of
information obtained from a DOI investigation.Source: Case Management System (CMS). Indicator name: Arrests resulting from DOI investigationsDescription: The number of arrests by the Department or federal, state or local law enforcement agencies as a
result of information obtained from a DOI investigation. Source: Case Management System (CMS).
Indicator Definitions | Page 43
Department of Investigation
Indicator name: Financial recoveries to the City ordered/agreed ($)Description: The total dollar value of financial recoveries ordered or agreed to be paid to, or otherwise
recovered by, the City as a result of DOI investigations in civil, criminal and administrative cases, including Special Commissioner of Investigation for the City School District and Department of Buildings Inspector General Office/Buildings Special Investigations Unit cases. These funds include restitution (money paid to the City as compensation for monetary loss); fines (monetary penalties levied by a court, administrative tribunal, or agency action upon an individual or company for criminal or civil offenses); forfeiture (the seizure of assets that were used in the commission of a crime or the proceeds of a crime); or other money recovered by the City, such as the satisfaction of debt owed to the City, including the reinstatement of fines or taxes collected, contract adjustments or credits, reimbursements or the recovery of City equipment or property.
Source: Offices of Inspector General and General Counsel. Indicator name: Financial recoveries to the City collected ($) Description: The total dollar value of financial recoveries actually received by the City as a result of DOI
investigations, including the payment of restitution, fines, forfeiture, satisfaction of debt, or the recovery of City equipment/property.
Source: Offices of Inspector General and General Counsel. Indicator name: Average time to complete a background investigation (from date of receipt) (days)Description: The average number of days to close background investigations of candidates for decision-
making or sensitive City jobs from date of receipt of background packet to completion of investigation for those background packets received on or after July 1, 2019. This data will be reported for the first time beginning in the Fiscal 2020 Mayor’s Management Report to account for the six-month closure period that commenced on July 1, 2019. Requests received before July 1, 2019 are included in the ‘backlogged background investigations’ indicators.
Source: Background Unit database. Indicator name: Background investigations received and closed within six months (%)Description: Of requests for investigations of candidates for decision making or sensitive City jobs received
on or after July 1, 2019 and closed during the reporting period, the percentage that were closed within six months or less from date of receipt of background packet to completion of investigation. This data will be reported for the first time beginning in the Fiscal 2020 Mayor’s Management Report to account for the six-month closure period that commenced on July 1, 2019. Requests received before July 1, 2019 are included in the ‘backlogged background investigations’ indicators.
Source: Background Unit database.
Indicator name: Backlogged background investigations closed during the reporting periodDescription: The number of pending requests for background investigations received prior to July 1, 2019 that
were competed or otherwise closed during the current reporting period.Source: Background Unit database.
Indicator name: Backlogged background investigations remaining openDescription: The number of pending requests for background investigations received prior to July 1, 2019 that
remain open. Source: Background Unit database.
Page 44 | Mayor’s Management Report
Department of Investigation
Indicator name: Time to notify agencies of prospective childcare, home care and family care workers with criminal records after receipt from State Division of Criminal Justice Services and FBI (days)
Description: The average number of days from DOI’s receipt of criminal record results for prospective childcare, home care and family care workers from the State Division of Criminal Justice Services and Federal Bureau of Investigation (FBI) to the notification letter from DOI to affected agencies.
Source: Fingerprint Unit database. Indicator name: Time to notify agencies of arrest notifications for current childcare, home care and family care
workers after receipt from the State Division of Criminal Justice Services (days)Description: The average number of days from DOI’s receipt of an arrest notification for current childcare,
home care and family care workers previously fingerprinted by DOI to the notification letter from DOI to affected agency.
Source: Fingerprint Unit database.
Indicator name: Completed requests for interpretationDescription The sum of all requests for interpretation using a language other than English fulfilled by the
agency via telephone (including Language Line, call centers, offices/reception desks and 311 transfer calls) and via face-to-face interaction with bilingual employees or contracted interpreters.
Source: DOI.
Indicator name: Letters responded to in 14 days (%)Description: The percentage of letters answered in 14 calendar days or less. Responses are substantive and
adequately address the question/issue raised by the customer. However, for complex inquiries that require research and additional action on the part of the agency, an acknowledgement which includes a description of the next step, as well as an estimated time frame for completion, is considered acceptable and is also reported as part of the 14 day response. Agencies track the additional time until a customer has a complete and full response.
Source: DOI.
Indicator name: E-mails responded to in 14 days (%)Description: The percentage of emails answered in 14 calendar days or less. Responses are substantive and
adequately address the question/issue raised by the customer. However, for complex inquiries that require research and additional action on the part of the agency, an acknowledgement which includes a description of the next step, as well as an estimated time frame for completion, is considered acceptable and is also reported as part of the 14 day response. Agencies track the additional time until a customer has a complete and full response.
Source: DOI.
Indicator name: Average wait time to speak with a customer service agent (minutes)Description: The average time in minutes from the time a customer meets with a greeter or information desk
representative until he or she is met by a customer service representative. Security/building entry wait times are not included unless a security guard plays a formal intake role.
Source: DOI. Indicator name: CORE facility rating (0–100)Description: An average CORE (Customers Observing and Reporting Experiences) score based on the rating
of 15 conditions, including physical conditions (e.g., cleanliness, litter, seating) and customer service conditions (e.g. wait time, professionalism), for all agency walk-in facilities inspected, divided by the number of walk-in facilities inspected. Facilities are rated by trained City inspectors.
Source: Mayor’s Office of Operations.
Indicator Definitions | Page 45
City Commission on Human Rights
Indicator name: Inquiries receivedDescription: The number of inquiries fielded by Commission staff.Source: Law Enforcement Bureau.
Indicator name: Matters initiatedDescription: The number of inquiries that result in a matter being initiated that requires follow-up from
Commission staff. Possible outcomes include resolution before filing a complaint or the filing of a complaint.
Source: Law Enforcement Bureau.
Indicator name: Pre-complaint resolutionsDescription: The number of matters resolved on consent of all involved parties prior to the filing of a complaint.Source: Law Enforcement Bureau.
Indicator name: Modifications for accessibility for people with disabilitiesDescription: The number of modifications made to housing accommodations, public accommodations, or
workplaces in order to allow for accessibility for individuals with disabilities.Source: Law Enforcement Bureau
Indicator name: Complaints filed Description: The number of complaints filed during the reporting period.Source: Law Enforcement Bureau.
Indicator name: Complaints closedDescription: The number of complaints closed during the reporting period. Source: Law Enforcement Bureau.
Indicator name: Complaints closed (%)—no probable cause determinationDescription: The percentage of complaints closed during the reporting period where the Law Enforcement
Bureau finds that probable cause does not exist to believe that the respondent(s) engaged in unlawful discrimination under the City Human Rights Law.
Source: Law Enforcement Bureau. Indicator name: Complaints closed (%)—probable cause determinationDescription: The percentage of complaints closed during the reporting period where the Law Enforcement
Bureau finds that probable cause exists to believe that the respondent(s) engaged in unlawful discrimination under the City Human Rights Law.
Source: Law Enforcement Bureau. Indicator name: Complaints closed (%)—administrative causeDescription: The percentage of complaints closed during the reporting period where the Law Enforcement
Bureau finds dismissal appropriate due to, but not limited to: the inability to locate complainant after diligent efforts to do so; complainant’s repeated failure to appear at mutually agreed-upon appointments with CCHR staff or unwillingness to meet with CCHR staff, provide requested information, or attend a hearing; complainant’s unwillingness to accept a reasonable proposed conciliation agreement; complainant’s repeated conduct disruptive to the orderly function of CCHR; complainant’s request for dismissal; or where the Law Enforcement Bureau finds the prosecution of the complaint will not serve the public interest.
Source: Law Enforcement Bureau. Indicator name: Complaints closed (%)—settlementDescription: The percentage of complaints closed during the reporting period involving the parties’ agreement
to terms that will resolve and close the complaint.Source: Law Enforcement Bureau
Page 46 | Mayor’s Management Report
City Commission on Human Rights
Indicator name: Complaints successfully mediatedDescription: The number of complaints resolved through the Commission’s free and voluntary mediation
office. Source: Law Enforcement Bureau.
Indicator name: Complaints referred to the Office of Administrative Trials and HearingsDescription: The number of complaints that Law Enforcement Bureau refers to the Office of Administrative
Trials and Hearings for trial.Source: Law Enforcement Bureau Indicator name: Value of damages for complainants ($)Description: The value in dollars of all monetary relief, including damages and attorney’s fees, ordered to be
paid to complainants.Source: Law Enforcement Bureau.
Indicator name: Value of civil penalties imposed ($)Description: The value in dollars of civil penalties ordered to be paid to the City.Source: Law Enforcement Bureau.
Indicator name: Open mattersDescription: The number of open matters at the close of the reporting period. Source: Law Enforcement Bureau.
Indicator name: Open complaintsDescription: The number of open complaints with the Law Enforcement Bureau at the close of the reporting
period.Source: Law Enforcement Bureau. Indicator name: Average age of complaint caseload (days)Description: The average time open complaints at the close of the reporting period have been in progress
measured from the date the complaint was filed through the close of the reporting period.Source Law Enforcement Bureau Indicator name: Complaints pending by age—less than one yearDescription: The number of open complaints still in progress that have been open with Law Enforcement
Bureau for less than one year measured from the date the complaint was filed through the close of the reporting period.
Source: Law Enforcement Bureau. Indicator name: Conferences, workshops and training sessionsDescription: The number of conferences, workshops, training sessions, and youth-based training sessions on
issues including but not limited to the Human Rights Law, cultural diversity, and conflict resolution.Source: Community Relations Bureau. Indicator name: Youth-based training sessions conductedDescription: The number of workshops and training sessions that cater to youth on issues including but not
limited to the Human Rights Law, cultural diversity, conflict resolution and peer mediation provided by CCHR to students, teachers, parents or administrators.
Source: Community Relations Bureau.

Indicator Definitions | Page 47
City Commission on Human Rights
Indicator name: People servedDescription: The number of individuals reached by Commission staff through its outreach activities. This
includes attendance at conferences, workshops, trainings, and events at which staff are invited to speak about the Commission’s work.
Source: Community Relations Bureau.
Indicator name: Responses to bias-based incidentsDescription: The number of incidents responded to by the Bias Response Team.Source: Community Relations Bureau.
Indicator name: Letters responded to in 14 days (%)Description: The percentage of letters answered in 14 calendar days or less out of the total number of letters
responded to during the reporting period. Responses are substantive and adequately address the question/issue raised by the customer. However, for complex inquiries that require research and additional action on the part of the agency, an acknowledgement which includes a description of the next step, as well as an estimated time frame for completion, is considered acceptable and is also reported as part of the 14 day response. Agencies track the additional time until a customer has a complete and full response.
Source: City Commission on Human Rights.
Indicator name: E-mails responded to in 14 days (%)Description: The percentage of emails answered in 14 calendar days or less out of the total number of emails
responded to during the reporting period. Responses are substantive and adequately address the question/issue raised by the customer. However, for complex inquiries that require research and additional action on the part of the agency, an acknowledgement which includes a description of the next step, as well as an estimated time frame for completion, is considered acceptable and is also reported as part of the 14 day response. Agencies track the additional time until a customer has a complete and full response.
Source: City Commission on Human Rights.
Indicator name: Completed requests for interpretationDescription The sum of all requests for interpretation using a language other than English fulfilled by the
agency via telephone (including Language Line, call centers, offices/reception desks and 311 transfer calls) and via face-to-face interaction with bilingual employees or contracted interpreters.
Source: City Commission on Human Rights.
Indicator name: Average wait time to speak with a customer service agent (minutes)Description: The average time in minutes from the time a customer meets with a greeter or information desk
representative until he or she is met by a customer service representative. Security/building entry wait times are not included unless a security guard plays a formal intake role.
Source: City Commission on Human Rights.
Indicator name: CORE customer experience rating (0–100)Description: An average score based on the rating of 15 conditions, including physical conditions (e.g.,
cleanliness, litter, seating) and customer service conditions (e.g., wait time, professionalism), for all agency walk-in facilities inspected, divided by the number of walk-in facilities inspected. Each of the 15 conditions can be rated excellent, good, fair or poor. Ratings of excellent are worth 100 points each, good ratings are worth 67 points, fair ratings are worth 33 points and poor ratings receive no points. Facilities are rated by trained City inspectors. Fiscal 2017 data for Customers Observing and Reporting Experiences (CORE) ratings are based on the inspection results of all the agency’s service centers. In Fiscal 2016, as an exception, the rating was based on inspections of targeted facilities.
Source: Mayor’s Office of Operations.

Page 48 | Mayor’s Management Report
City Commission on Human Rights
Indicator Definitions | Page 49
Office of Administrative Trials and Hearings
Indicator name: Average time for OATH Trials Division to issue decisions after records closed (business days)Description: The average number of business days it took the OATH Trials Division to issue a decision after
the record is closed.Source: OATH Trials Division. Indicator name: OATH Trials Division cases with decisions issued within 45 business days (%)Description: The percentage of OATH Trials Division cases for which decisions were issued within the targeted
number of business days after the record was closed.Source: OATH Trials Division. Indicator name: OATH Trials Division facts and conclusions adopted by agencies (%)Description: The percent of facts and conclusions issued by the OATH Trials Division that were accepted and
adopted by agency heads.Source: OATH Trials Division. Indicator name: OATH Trials Division settlement rate (%)Description: The percentage of cases that are disposed of by settlement, either at the referring agency or at
the OATH Trials Division.Source: OATH Trials Division. Indicator name: Cases filed at the OATH Trials Division (total)Description: The total number of cases filed at the OATH Trials Division.Source: OATH Trials Division. Indicator name: Cases closed at the OATH Trials Division (total)Description: The total number of cases closed at the OATH Trials Division.Source: OATH Trials Division. Indicator name: Cases processed per ALJ (total)Description: The average number of cases closed by each Administrative Law Judge (ALJ) at the OATH Trials
Division.Source: OATH Trials Division. Indicator name: Total summonses received from the issuing agencies at the OATH Hearings DivisionDescription: Total number of summonses received by the OATH Hearings Division from the agencies that
issue the summonses, or notices of violation, for which it conducts hearings. This volume includes all such documents received by the OATH Hearings Division, having undertaken the activity previously administered by the Division’s three legacy sections, Environmental Control Board (ECB), Health, and Vehicles for Hire, and at the Department of Consumer Affairs.
Source: OATH Hearings Division.
Indicator name: Total hearings at the OATH Hearings DivisionDescription: Total volume of hearings held by the OATH Hearings Division as it undertakes its responsibility
to resolve administrative law violations issued by the more than two dozen agencies that issue them. The volume includes all hearings held by the OATH Hearings Division, having undertaken the hearings activity previously administered by the Division’s three legacy sections, Environmental Control Board (ECB), Health, and Vehicles for Hire, and at the Department of Consumer Affairs.
Source: OATH Hearings Division.
Page 50 | Mayor’s Management Report
Office of Administrative Trials and Hearings
Indicator name: Total number of pre-hearings activities at the OATH Hearings DivisionDescription: Total number of all summonses that resulted in either an Admission Prior to Hearing, a
Stipulation, a Cure, a Settlement or a Withdrawal before a hearing was held at the OATH Hearings Division.
Source: OATH Hearings Division.
Indicator name: Total number of help sessions conducted by OATH Help CentersDescription: Summonses for which respondent has had an active session with a Procedural Justice
Coordinator (PJC).Source: Help Center/Ombudsman.
Indicator name: Total summonses processed at the OATH Hearings DivisionDescription: Total of all defaults, live hearings, remote hearings, motions to vacate and appeals processed at
the OATH Hearings Division during the reporting period.Source: OATH Hearings Division. Indicator name: Summonses with decisions rendered at the OATH Hearings DivisionDescription: Total number of summonses heard and reaching a final decision at the OATH Hearings Division
during the reporting period.Source: OATH Hearings Division.
Indicator name: Average time from OATH Hearings Division hearing assignment to decision rendered (days) Description: The average time decisions were pending at the OATH Hearings Division calculated by dividing
the total number of days decisions were pending at the Hearings Division by the total number of summonses heard and having a decision rendered at the OATH Hearings Division during the reporting period.
Source: OATH Hearings Division.
Indicator name: Defenses submitted by mail.Description: The total number of all remote Hearings/submissions that were mail defense submissions, in
which a respondent can contest charges by submitting their defense and supporting documents by mail at their convenience without having to appear in person.
Source: OATH Hearings Division.
Indicator name: Hearings by phone.Description: The total number of all Remote Hearings conducted by OATH that were selected by respondents
as a Hearing by Phone, in which they can contest eligible charges by submitting their defense by telephone at their convenience without having to appear in person.
Source: OATH Hearings Division.
Indicator name: One-click online submissions. Description: The total number of all Remote Hearings/submissions that were One-Click online submissions, in
which a respondent can contest charges by submitting their defense and supporting documents by computer at their convenience without having to appear in person.
Source: OATH Hearings Division.
Indicator name: Defenses submitted by mail (% of total remote hearings/submissions)Description: The percentage distribution of Remote Hearings/submissions conducted by OATH that were
selected by respondents as a mail defense submission, in which they can contest charges by submitting their defense and supporting documents by mail at their convenience without having to appear in person.
Source: OATH Hearings Division.
Indicator Definitions | Page 51
Office of Administrative Trials and Hearings
Indicator name: OATH Hearings by Phone (% of total remote hearings/submissions) Description: The percentage distribution of activity in response to OATH Hearings by Phone that the agency
offers. The indicator is the percentage of total remote hearings that the use of this type of remote, or alternative, hearing represented during the period being reported. Hearings by remote means are part of OATH’s and the City’s effort to enable those who receive violations to respond at their convenience and without having to appear for a hearing.
Source: OATH Hearings Division.
Indicator name: OATH one-click online submissions (% of total remote hearings/submissions)Description: The indicator is the percentage of total number of all Remote Hearings/Submissions that were
One-Click online submissions, in which a respondent can contest charges by submitting their defense and supporting documents by computer at their convenience without having to appear in person.
Source: OATH Hearings Division.
Indicator name: Mediations administered for City employees.Description: The total number of voluntary mediation sessions conducted by CCCR that were referred or
requested by various city agencies to help manage and resolve an interpersonal workplace conflict.
Source: Center for Creative Conflict Resolution
Indicator name: Conflict resolution trainings administered for City employees.Description: The total number of conflict resolution trainings conducted by CCCR that were requested by
various city agencies in building internal conflict capacity and professional development for staff and management.
Source: Center for Creative Conflict Resolution
Indicator name: Coaching sessions for City personnel.Description: The total number of voluntary individual conflict and leadership coaching sessions conducted by
CCR that were referred or requested by city personnel seeking support with a workplace conflict. Source: Center for Creative Conflict Resolution
Indicator name: Consultations for City personnel.Description: The total number of individual consultations conducted by CCCR that were requested by city
personnel seeking guidance for the development of an internal conflict resolution office, seeking mediation services or a restorative justice initiative, or, for strategic support with managing workplace conflict.
Source: Center for Creative Conflict Resolution
Indicator name: Restorative circles/group facilitations sessions administered. Description: The total number of restorative circles or group facilitation sessions conducted by CCCR that
were provided as a community service option under the CJRA or for the Citywide roundtables, or were provided as requested or referred by city agencies seeking conflict resolution and other support for work groups.
Source: Center for Creative Conflict Resolution
Indicator name: Mediations administered for members of the public.Description: The total number of voluntary mediation sessions conducted by CCCR that involve or were
requested by members of the public, including through the MEND program that provides mediation for quality of life disputes between community members and bar/restaurants or small business commercial lease disputes.
Source: Center for Creative Conflict Resolution

Page 52 | Mayor’s Management Report
Office of Administrative Trials and Hearings
Indicator name: Letters responded to in 14 days (%)Description: The percentage of letters answered in 14 calendar days or less out of the total number of letters
responded to during the reporting period. Responses are substantive and adequately address the question/issue raised by the customer. However, for complex inquiries that require research and additional action on the part of the agency, an acknowledgement which includes a description of the next step, as well as an estimated time frame for completion, is considered acceptable and is also reported as part of the 14 day response. Agencies track the additional time until a customer has a complete and full response.
Source: Office of Administrative Trials and Hearings.
Indicator name: E-mails responded to in 14 days (%)Description: The percentage of emails answered in 14 calendar days or less out of the total number of emails
responded to during the reporting period. Responses are substantive and adequately address the question/issue raised by the customer. However, for complex inquiries that require research and additional action on the part of the agency, an acknowledgement which includes a description of the next step, as well as an estimated time frame for completion, is considered acceptable and is also reported as part of the 14 day response. Agencies track the additional time until a customer has a complete and full response.
Source: Office of Administrative Trials and Hearings.
Indicator name: Completed requests for interpretationDescription The sum of all requests for interpretation using a language other than English fulfilled by the
agency via telephone (including Language Line, call centers, offices/reception desks and 311 transfer calls) and via face-to-face interaction with bilingual employees or contracted interpreters.
Source: Office of Administrative Trials and Hearings.
Indicator name: CORE customer experience rating (0–100)Description: An average score based on the rating of 15 conditions, including physical conditions (e.g.,
cleanliness, litter, seating) and customer service conditions (e.g., wait time, professionalism), for all agency walk-in facilities inspected, divided by the number of walk-in facilities inspected. Each of the 15 conditions can be rated excellent, good, fair or poor. Ratings of excellent are worth 100 points each, good ratings are worth 67 points, fair ratings are worth 33 points and poor ratings receive no points. Facilities are rated by trained City inspectors. Fiscal 2017 data for Customers Observing and Reporting Experiences (CORE) ratings are based on the inspection results of all the agency’s service centers. In Fiscal 2016, as an exception, the rating was based on inspections of targeted facilities.
Source: Mayor’s Office of Operations.
Indicator Definitions | Page 53
Business Integrity Commission
Indicator name: Violations issued to private waste haulersDescription: The number of violations issued to private waste haulers for violating the City’s laws and rules,
ranging from dirty trucks to unlicensed or unregistered trade waste removal activity.Source: Trade Waste Enforcement Unit. Indicator name: Violations issued to legally operating private waste haulersDescription: The number of violations issued to parties who are licensed or registered by BIC, for violating the
City’s laws and rules covering private waste hauling.Source: Trade Waste Enforcement Unit. Indicator name: Violations issued to illegally operating private waste haulersDescription: The number of violations issued to parties who are not licensed or registered by BIC, for violating
the City’s laws and rules covering private waste hauling.Source: Trade Waste Enforcement Unit. Indicator name: Waste hauling applications deniedDescription: The number of new and renewal trade waste hauling license and registration applications denied
or revoked after background and other investigations of the applicant companies and principals, pursuant to the applicable laws and regulations.
Source: Licensing Unit/Legal Unit/Management Information System. Indicator name: Waste hauling complaints receivedDescription: The number of waste hauling complaints received by BIC.Source: Trade Waste Enforcement Unit.
Indicator name: Private Waste Hauler Violations admitted to or upheld at the Office of Administrative Trials and Hearings (%)
Description: The number of notices of violation paid without a hearing and the number upheld upon a hearing at OATH as a percentage of all notices of violation issued by BIC to private waste haulers.
Source: Office of Administrative Trials and Hearing and BIC.
Indicator name: Average time to approve waste hauling applications (days)—New and RenewalDescription: The average number of days to process and approve new and renewal waste hauling license
and registration applications from the date of filing of the application to the date of approval by the Legal Unit. This does not include applications that undergo long-term investigations and are subsequently approved.
Source: Management Information System (MIS) and Operations. Indicator name: Average time to approve waste hauling applications registrations (days)—NewDescription: The average number of days to process and approve new waste hauling license and registration
applications from the date an application is filed until it is approved by the Legal Unit. This does not include applications that undergo long-term investigations and are subsequently approved.
Source: Management Information System (MIS) and Operations.
Indicator name: Average time to approve waste hauling applications registrations (days)—RenewalDescription: The average number of days to process and approve waste hauling license and registration
applications for renewal from the date an application is filed until it is approved by the Legal Unit. This does not include applications that undergo long-term investigations and are subsequently approved.
Source: Management Information System (MIS) and Operations.
Page 54 | Mayor’s Management Report
Business Integrity Commission
Indicator name: Average age of pending waste hauling applications (days)Description: The average age of pending new and renewal waste hauling license and registration applications
from the date of the filing of the application to the end of the current indicator period. This does not include applications slated for denial or under long-term investigation.
Source: Management Information System (MIS).
Indicator name: Waste hauling applications pendingDescription: The number of new and renewal waste hauling license and registration applications pending at
the end of the current indicator period. This does not include applications slated for denial or under long-term investigation.
Source: Management Information System (MIS). Indicator name: Waste hauling applications approved—New and RenewalDescription: The number of new and renewal waste hauling license and registration applications approved
after completion of background investigations on the applicant company, principals and key employees.
Source: Licensing Unit and Management Information System (MIS). Indicator name: Waste hauling applications approved—NewDescription: The number of new waste hauling license and registration applications approved after completion
of background investigations.Source: Licensing Unit and Management Information System (MIS). Indicator name: Waste hauling applications approved—RenewalDescription: The number of waste hauling license and registration renewal applications approved after
completion of background investigations.Source: Licensing Unit and Management Information System (MIS). Indicator name: Violations issued at public wholesale marketsDescription: The number of violations issued to wholesalers and businesses operating in the public wholesale
markets for violating the Agency’s laws and rules, ranging from littering to vehicle engine idling over 3 minutes.
Source: Security and Enforcement Section; NYC Environmental Control Board. Indicator Name: Public Wholesale Markets Violations admitted to or upheld at the Office of Administrative Trials
and Hearings (%)Description: The number of notices of violation paid without a hearing and the number upheld upon a hearing
at OATH as a percentage of all notices of violation issued by BIC at public markets.Source: Security and Enforcement Section; Office of Administrative Trials and Hearings (OATH). Indicator name: Public wholesale market applications deniedDescription: The number of new and renewal public wholesale market license and registration applications
denied or revoked after background and other investigations of the applicant companies and principals, pursuant to the applicable laws and regulations.
Source: Licensing Unit/Legal Unit/Management Information System. Indicator name: Public wholesale market applications pendingDescription: The number of new and renewal public wholesale market license and registration applications
pending at the end of the current indicator period. This does not include applications slated for denial or under long-term investigation.
Source: Management Information System (MIS).
Indicator Definitions | Page 55
Business Integrity Commission
Indicator name: Average time to approve public wholesale market applications (days)Description: The average number of days to process and approve new and renewal public wholesale
market license or registration applications from the date of the filing of the application to the date of approval by the Legal Unit. This does not include applications that undergo long-term investigation and are subsequently approved.
Source: Management Information System/Operations. Indicator name: Average age of pending wholesale market applications (days)Description: The average age of pending new and renewal wholesale market registration or license
applications from the date of filing of the application to the end of the current reporting period.Source: Licensing Unit/Management Information System/Operations.
Indicator name: Public wholesale market applications approvedDescription: The number of new and renewal public wholesale market license and registration applications
approved after completion of background and other investigations of the companies and principals, pursuant to the relevant chapters of the New York City Administrative Code.
Source: Licensing Unit/Management Information System/Operations.
Indicator name: Letters responded to in 14 days (%)Description: The percentage of letters answered in 14 calendar days or less out of the total number of letters
responded to during the reporting period. Responses are substantive and adequately address the question/issue raised by the customer. However, for complex inquiries that require research and additional action on the part of the agency, an acknowledgement which includes a description of the next step, as well as an estimated time frame for completion, is considered acceptable and is also reported as part of the 14-day response. Agencies track the additional time until a customer has a complete and full response.
Source: Business Integrity Commission.
Indicator name: E-mails responded to in 14 days (%)Description: The percentage of emails answered in 14 calendar days or less out of the total number of letters
responded to during the reporting period. Responses are substantive and adequately address the question/issue raised by the customer. However, for complex inquiries that require research and additional action on the part of the agency, an acknowledgement which includes a description of the next step, as well as an estimated time frame for completion, is considered acceptable and is also reported as part of the 14-day response. Agencies track the additional time until a customer has a complete and full response.
Source: Business Integrity Commission.
Indicator name: Completed customer requests for interpretationDescription The sum of all requests for interpretation using a language other than English fulfilled by the
agency via telephone (including Language Line, call centers, offices/reception desks and 311 transfer calls) and via face-to-face interaction with bilingual employees or contracted interpreters.
Source: Business Integrity Commission.
Indicator name: Average wait time to speak with a customer service agent (minutes)Description: The average time in minutes from the time a customer meets with a greeter or information desk
representative until he or she is met by a customer service representative. Security/building entry wait times are not included unless a security guard plays a formal intake role.
Source: Business Integrity Commission.
Page 56 | Mayor’s Management Report
Business Integrity Commission
Indicator name: CORE customer experience rating of facilities (0–100)Description: An average score based on the rating of 15 conditions, including physical conditions (e.g.,
cleanliness, litter, seating) and customer service conditions (e.g., wait time, professionalism), for all agency walk-in facilities inspected, divided by the number of walk-in facilities inspected. Each of the 15 conditions can be rated excellent, good, fair or poor. Ratings of excellent are worth 100 points each, good ratings are worth 67 points, fair ratings are worth 33 points and poor ratings receive no points. Facilities are rated by trained City inspectors. The data for an agency’s Customers Observing and Reporting Experiences (CORE) rating is based on the inspection results of each agency service center.
Source: Mayor’s Office of Operations.

Basic Services for All New Yorkers
Basic Services for All New Yorkers
Department of Parks & Recreation
Department of Cultural Affairs
Department of Consumer and Worker Protection
311 Customer Service Center
NYC
Taxi and Limousine Commission
Department of Sanitation p 59
p 65
p 73
p 75
p 81
p 83

Indicator Definitions | Page 59
Department of Sanitation
Indicator name: Streets rated acceptably clean (%)Description: Percentage of over 6,000 sample blocks rated acceptably clean by Mayor’s Office field
inspectors, based on a seven-point picture-based rating scale. Figures show averages based on twice-monthly ratings of the citywide street sample.
Source: Mayor’s Office of Operations. Indicator name: Streets rated filthy (%) Description: On a scale of 1.0 (a clean street with no litter) to 3.0 (a street where litter is highly concentrated
along the curbs and overflowing onto the sidewalk), the percentage of streets with a rating of 1.75 or higher (filthy).
Source: Mayor’s Office of Operations.
Indicator name: Sidewalks rated acceptably clean (%) Description: Percentage of over 6,000 sample blocks rated acceptably clean by Mayor’s Office field
inspectors, based on a seven-point picture-based rating scale. Figures show averages based on twice-monthly ratings of the citywide sidewalk sample.
Source: Mayor’s Office of Operations.
Indicator name: Sidewalks rated filthy (%)Description: On a scale of 1.0 (a clean sidewalk with no litter) to 3.0 (a street where litter is highly
concentrated along the curbs and overflowing onto the sidewalk), the percentage of sidewalks with a rating of 1.75 or higher (filthy).
Source: Mayor’s Office of Operations.
Indicator name: Violations issued for dirty sidewalksDescription: The number of violations issued to property owners for dirty sidewalks.Source: Bureau of Waste Prevention Reuse and Recycling.
Indicator name: Violations issued for illegal postingDescription: The number of violations issued for illegally posting, painting, attaching or affixing by any means
any printed material upon any curb, gutter, tree, lamppost, telephone pole, or public garbage receptacle.
Source: Bureau of Waste Prevention Reuse and Recycling.
Indicator name: Vacant lot cleaning requestsDescription: The number of service requests for vacant lot cleaning received through the 311 Customer
Service Center.Source: 311 Customer Service Center; DSNY Bureau of Cleaning & Collection. Indicator name: Lots cleaned citywideDescription: Total City-owned and private lots cleaned by DSNY. Source: Bureau of Cleaning & Collection; Bureau of Planning and Budget. Indicator name: Other non-lot locations cleanedDescription: Locations that are cleaned that do not have a tax block or lot assigned, such as center medians,
dead-end or uncut/unimproved streets, areas adjacent to railways.Source: Bureau of Cleaning & Collection.
Indicator name: Tons of refuse disposed (000)Description: Total refuse tonnage, in thousands, disposed by the Department.Source: Bureau of Waste Disposal; Bureau of Planning and Budget.
Indicator name: Refuse tons per truck-shiftDescription: Average curbside household refuse tons collected by each truck working an eight-hour shift.Source: Operations Management Division; Bureau of Planning & Budget.
Page 60 | Mayor’s Management Report
Department of Sanitation
Indicator name: Trucks dumped on shift (%)Description: Percentage of total number of trucks that collect and dispose of their materials at their designated
transfer stations within their eight-hour shifts.Source: Operations Management Division.
Indicator name: Tons per day disposedDescription: Average tons of refuse disposed per operational day.Source: Bureau of Waste Disposal; Bureau of Planning and Budget.
Indicator name: Average outage rate for all collection trucks (%)Description: The number of collection trucks that are inoperable due to mechanical failure divided by the total
number of collection trucks in the fleet. Combined average for rear loader, dual bin and front loading collection trucks.
Source: Bureau of Motor Equipment.
Indicator name: Missed refuse collections (%)Description: Percentage of curbside refuse tonnage scheduled for collection but not removed by midnight.
Excludes holiday weeks and missed collections due to snow events.Source: Operations Management Division; Bureau of Planning & Budget.
Indicator name: Curbside and containerized recycling diversion rate (%)Description: Percentage of the Department’s residential waste stream (curbside and containerized metal,
glass, plastic, organics and mixed paper) that is recycled. Source: Operations Management Division; Bureau of Planning and Budget.
Indicator name: Curbside and containerized recycled tons (000)Description: The tonnage, in thousands, of the residential waste stream (curbside and containerized metal,
glass, plastic, mixed paper and organics) that is recycled. Source: Operations Management Division; Bureau of Planning and Budget. Indicator name: Recycled tons per day (annual total)Description: Average number of tons of recycled materials per day calculated per annum; includes residential
curbside and containerized, institutional, bulk and private sector recyclables. Reported on an annual basis only. Full fiscal year data is available four to six months after the close of the year.
Source: Operations Management Division; Bureau of Planning and Budget.
Indicator name: Total annual recycling diversion rate (%)Description: Percentage of the City’s total waste stream that is recycled curbside plus all other recycling
including institutional, bulk and other private sector recycling programs. Reported on an annual basis only. Full fiscal year data is available four to six months after the close of the year.
Source: Operations Management Division; Bureau of Waste Prevention Reuse and Recycling; and Bureau of Planning and Budget.
Indicator name: Annual tons recycled (000)Description: Tons, in thousands, of recycled materials per year, including residential curbside and
containerized, institutional, City office paper, indirect, bulk and private sector recyclables. Reported on an annual basis only. Full fiscal year data is available four to six months after the close of the year.
Source: Operations Management Division; Bureau of Planning and Budget.
Indicator name: Recycling tons per truck-shiftDescription: Average curbside recycling tons collected by each truck working an eight-hour shift.Source: Operations Management Division; Bureau of Planning and Budget.

Indicator Definitions | Page 61
Department of Sanitation
Indicator name: Missed recycling collections (%)Description: Percentage of curbside and containerized recycling tonnage scheduled for collection but not
removed by midnight. Excludes holiday weeks.Source: Operations Management Division; Bureau of Planning and Budget. Indicator name: Recycling trucks dumped on shift (%)Description: Percentage of recycling trucks that collect and dispose of their materials at their designated
transfer stations within their eight-hour shifts.Source: Operations Management Division.Indicator name: Recycling summonses issuedDescription: Summonses issued to residents and commercial establishments for violating recycling
regulations.Source: Bureau of Planning and Budget. Indicator name: Snowfall (inches)Description: Total amount of snow, in inches, that has fallen during the reporting period.Source: Bureau of Cleaning & Collection; Bureau of Planning & Budget.
Indicator name: Salt used (tons)Description: Amount, in tons, of salt used due to winter weather conditions (snow and ice).Source: Bureau of Cleaning & Collection; Bureau of Planning & Budget.
Indicator name: Cases commenced against the City in state and federal courtDescription: The number of state court and federal court matters assigned a litigation start date. In cases with
payout, it will be paid from the judgment and claims account in the City’s General Fund. Source: Law Department LawManager system.
Indicator name: Payout ($000)Description: The judgment and claims amount, in thousands of dollars, paid by the City from the judgment and
claims account in the City’s General Fund to resolve cases through settlement or verdict. Source: Law Department LawManager system.
Indicator name: Private transfer station permitsDescription: The number of private transfer station permits issued by the Department.Source: Legal Affairs Division.
Indicator name: Private transfer station inspections performedDescription: The number of inspections of legally permitted private transfer stations performed by the
Department’s permit unit.Source: Permit inspection unit report.
Indicator name: Total Office of Administrative Trials and Hearings violations issued Description: The total number of notices of violation issued by DSNY that fall under the jurisdiction of the
Office of Administrative Trials and Hearings.Source: Bureau of Planning & Budget; Office of Administrative Trials and Hearings (OATH).
Indicator Name: Violations admitted to or upheld at the Office of Administrative Trials and Hearings (%)Description: For all violations returnable to OATH, the number of violations where the respondent admitted to
the violation and paid the penalty without a hearing or where the violation was upheld following a hearing as a percent of all violations resolved.
Source: Office of Administrative Trials and Hearings (OATH).
Page 62 | Mayor’s Management Report
Department of Sanitation
Indicator name: Refuse collection cost per ton ($)Description: Annual cost of collecting curbside and containerized refuse on a per ton basis. This is a “fully
loaded” cost including a complete range of direct, indirect and overhead expenses. Reported on an annual basis only. Full fiscal year data is available seven to nine months after the close of the year.
Source: Internal reports and budget documents.
Indicator name: Refuse cost per ton (fully loaded) ($)Description: Annual cost of curbside and containerized collection and disposal on a per ton basis. This is
a “fully loaded” cost including a complete range of direct, indirect and overhead expenses. Reported on an annual basis only. Full fiscal year data is available seven to nine months after the close of the year.
Source: Internal reports and budget documents.
Indicator name: Disposal cost per ton ($)Description: Annual cost of curbside and containerized refuse disposal on a per ton basis. This is a “fully
loaded” cost including a complete range of direct, indirect and overhead expenses. Reported on an annual basis only. Full fiscal year data is available seven to nine months after the close of the year.
Source: Internal reports and budget documents.
Indicator name: Recycling cost per ton (fully loaded) ($)Description: Annual cost of curbside and containerized recycling and processing on a per ton basis. This
is a “fully loaded” cost including a complete range of direct, indirect and overhead expenses. Reported on an annual basis only. Full fiscal year data is available seven to nine months after the close of the year.
Source: Internal reports and budget documents.
Indicator name: Recycling collection cost per ton ($)Description: Annual cost of collecting curbside and containerized recyclables on a per ton basis. This is a “fully
loaded” cost including a complete range of direct, indirect and overhead expenses. Reported on an annual basis only. Full fiscal year data is available seven to nine months after the close of the year.
Source: Internal reports and budget documents. Indicator name: Paper recycling revenue per ton ($)Description: The amount of revenue per ton agreed to in the Department’s contracts with paper recyclers.Source: Bureau of Waste Prevention, Reuse and Recycling records.
Indicator name: Removal cost per inch of snow ($)Description: Annual cost of snow removal operations divided by the total number of inches of snow for the
year. Reported on an annual basis only.Source: Bureau of Planning and Budget.
Indicator name: Collisions involving City vehiclesDescription: Number of City-vehicle involved collision reports involving injury or property damage. New York
State MV-104 reports are required whenever a collision occurs involving death, or other personal injury, or property damage over $1,000. Collisions are tracked and reported regardless of whether or not the driver was at fault and whether or not the vehicle was in motion. Collisions involving City vehicles occur whenever a City vehicle strikes (or is struck by) a second vehicle, pedestrian, bicyclist or fixed object.
Source: Citywide Fleet Management at DCAS.
Indicator Definitions | Page 63
Department of Sanitation
Indicator name: Workplace injuries reported (uniform and civilian)Description: All incidents resulting in a workers’ compensation or line of duty injury claim regardless of whether
or not time is lost.Source: Medical Division.
Indicator name: Completed requests for interpretationDescription The sum of all requests for interpretation using a language other than English fulfilled by the
agency via telephone (including Language Line, call centers, offices/reception desks and 311 transfer calls) and via face-to-face interaction with bilingual employees or contracted interpreters.
Source DSNY.
Indicator name: Letters responded to in 14 days (%)Description: The percentage of letters answered in 14 calendar days or less. Responses are substantive and
adequately address the question/issue raised by the customer. However, for complex inquiries that require research and additional action on the part of the agency, an acknowledgement which includes a description of the next step, as well as an estimated time frame for completion, is considered acceptable and is also reported as part of the 14 day response. Agencies track the additional time until a customer has a complete and full response.
Source: DSNY.Indicator name: E-mails responded to in 14 days (%)Description: The percentage of emails answered in 14 calendar days or less. Responses are substantive and
adequately address the question/issue raised by the customer. However, for complex inquiries that require research and additional action on the part of the agency, an acknowledgement which includes a description of the next step, as well as an estimated time frame for completion, is considered acceptable and is also reported as part of the 14 day response. Agencies track the additional time until a customer has a complete and full response.
Source: DSNY.
Indicator name: Percent meeting time to close—(Response to Service Requests) Description: The percentage of service requests received through the 311 Customer Service Center for which
the agency met its planned time of action to provide the related service. Source: Mayor’s Office of Operations/Citywide Performance Reporting.

Page 64 | Mayor’s Management Report
Department of Sanitation
Indicator Definitions | Page 65
Department of Parks & Recreation
Indicator name: Parks rated acceptable for overall condition (%)Description: The percent of park sites that pass an inspection based on 16 individual features. If three or
more features are rated unacceptable based on the Parks Inspection Program’s criteria, or if one condition is judged a serious safety hazard, the entire site is rated unacceptable. Additionally, a failed cleanliness rating will automatically result in a site’s being rated unacceptable for overall condition. Park sites included in this rating are playgrounds, small parks, large parks, and greenstreets (street triangles and medians landscaped with horticultural installations).
Source: Operations & Management Planning Division. Indicator name: – Overall condition of small parks and playgrounds (%)Description: The percent of small parks (six acres or less) and playgrounds that pass an inspection based on
16 conditions.Source: Operations & Management Planning Division.
Indicator name: – Overall condition of large parks (%)Description: The percent of large parks (more than six acres) that pass individual features. If three or more
features are rated unacceptable based on the Parks Inspection Program’s criteria, or if one condition is judged a serious safety hazard, the entire site is rated unacceptable. Additionally, a failed cleanliness rating will automatically result in a site’s being rated unacceptable for overall an inspection based on 16 individual features. If three or more features are rated unacceptable based on the Parks Inspection Program’s criteria, or if one condition is judged a serious safety hazard, the entire site is rated unacceptable. Additionally, a failed cleanliness rating will automatically result in a site’s being rated unacceptable for overall condition.
Source: Operations & Management Planning Division.
Indicator name: – Overall condition of greenstreets (%)Description: The percent of greenstreets that pass an inspection based on 16 individual features. If three or
more features are rated unacceptable based on the Parks Inspection Program’s criteria, or if one condition is judged a serious safety hazard, the entire site is rated unacceptable. Additionally, a failed cleanliness rating will automatically result in a site’s being rated unacceptable for overall condition.
Source: Operations & Management Planning Division.
Indicator name: Parks rated “acceptable” for cleanliness (%)Description: Cleanliness is a subset of overall condition. The percent of park sites with acceptable cleanliness
is the percent rated acceptable for litter, broken glass, graffiti and weeds or ice, depending on the season. A park will fail for cleanliness if two of the four cleanliness features are unacceptable or if conditions for one feature are egregious. Park sites included in this rating are playgrounds, small parks, large parks, and greenstreets (street triangles and medians landscaped with horticultural installations).
Source: Operations & Management Planning Division. Indicator name: – Cleanliness of small parks and playgrounds (%)Description: Cleanliness is a subset of overall condition. The percent of small parks (six acres or less) and
playgrounds with acceptable cleanliness is the percent rated acceptable for litter, broken glass, graffiti and weeds or ice, depending on the season.
Source: Operations & Management Planning Division. Indicator name: – Cleanliness of large parks (%)Description: Cleanliness is a subset of overall condition. The percent of large parks (more than six acres) with
acceptable cleanliness is the percent rated acceptable for litter, broken glass, graffiti and weeds or ice, depending on the season.
Source: Operations & Management Planning Division.

Page 66 | Mayor’s Management Report
Department of Parks & Recreation
Indicator name: – Cleanliness of greenstreets (%)Description: Cleanliness is a subset of overall condition. The percent of greenstreets with acceptable
cleanliness is the percent rated acceptable for litter, broken glass, graffiti and weeds or ice, depending on the season.
Source: Operations & Management Planning Division.
Indicator name: Play equipment rated acceptable (%)Description: The percent of play equipment in all parks, playgrounds and greenstreets that passes an
inspection during the reporting period. This includes slides and jungle gyms, handball court walls, and chess and checkers tables.
Source: Operations & Management Planning Division.
Indicator name: Safety surfaces rated acceptable (%)Description: The percent of safety surfaces (impact-absorbing material placed on the ground) in all parks,
playgrounds and greenstreets that pass an inspection during the reporting period. This includes safety matting under playground equipment and wood chipping under adult exercise equipment.
Source: Operations & Management Planning Division.
Indicator name: Comfort stations in service (in season only) (%)Description: From April 1st to October 31st, the percent of comfort stations that are open and in service at the
time of park inspections. Source: Operations & Management Planning Division. Indicator name: Spray showers in service (in season only) (%)Description: From Memorial Day to Labor Day, the percent of spray showers operating at the time of park
inspections. Spray showers are required to be on when the temperature exceeds 80 degrees and children are present.
Source: Operations & Management Planning Division. Indicator name: Drinking fountains in service (in season only) (%)Description: From Memorial Day to Columbus Day, the percent of drinking fountains operating at the time of
park inspections. Source: Operations & Management Planning Division.
Indicator name: Recreation centers rated “acceptable” for cleanliness (%)Description: The percent of recreation centers that pass an inspection based on acceptability ratings for litter,
graffiti, dirt and the availability of restroom amenities/supplies. A recreation center will receive a rating of unacceptable for cleanliness if, based on the inspection program’s criteria, two features are unacceptable or if there is any hazard that poses a serious health/safety risk. Recreation centers included in this rating are facilities requiring membership that are owned and operated by Parks. Every recreation center will be inspected at least twice a year.
Source: Operations & Management Planning Division. Indicator name: Recreation centers rated “acceptable” for overall condition (%)Description: The percent of recreation centers that pass an inspection based on acceptability ratings for
twelve features in three categories – safety, cleanliness and structural. A recreation center’s overall condition will receive a rating of unacceptable if, based on the inspection program’s criteria, safety is found to be unacceptable, both the cleanliness and structural categories are rated unacceptable, or if any one condition is judged a serious health/safety hazard. Recreation centers included in this rating are facilities requiring membership that are owned and operated by Parks. Every recreation center will be inspected at least twice a year.
Source: Operations & Management Planning Division.
Indicator Definitions | Page 67
Department of Parks & Recreation
Indicator name: Monuments receiving annual maintenance (%)Description: The percent of Parks’ monuments and public art in the City’s collection that receive maintenance
on a yearly basis.Source: Art and Antiquities.
Indicator name: Major felonies reported on Parks’ properties (excludes Central Park) – Crimes against persons – Crimes against properties Description: The total number of major felony crimes reported within seven categories as these correspond
to New York State Penal Law. Crimes against persons include murder and non-negligent manslaughter, rape, robbery, and felonious assault; crimes against property include burglary, grand larceny and grand larceny auto. Data are provided on a quarterly basis by NYPD for 1,154 park properties (includes parks, playgrounds, pools and recreation centers). Crime data for Central Park, which has its own precinct, are not included in these numbers.
(Note: Data reported in the Preliminary Mayor’s Management Report are for the quarter ending in September.)
Source: New York City Police Department.
Indicator name: Summonses issuedDescription: The number of summonses issued during the reporting period for parking and health code
violations including summonses returnable to the Parking Violations Bureau, the Environmental Control Board, Criminal Court, and Traffic Court.
Source: Parks Enforcement Patrol.
Indicator Name: Violations admitted to or upheld at the Office of Administrative Trials and Hearings (%)Description: For all violations returnable to OATH, the number of violations where the respondent admitted to
the violation and paid the penalty without a hearing or where the violation was upheld following a hearing as a percent of all violations resolved.
Source: Office of Administrative Trials and Hearings (OATH).
Indicator name: Street trees pruned—Block programDescription: The number of street trees pruned in the block program during the reporting period. Through the
block program DPR prunes City street trees on an established cycle to ensure tree health and to minimize safety hazards, such as low-hanging limbs over sidewalks and trees blocking traffic signs. Note: Due to changes in funding, the established pruning cycle can be subject to change.
Source: Forestry Division. Indicator name: – Annual pruning goal completed (%)Description: The percent of the funding-based annual pruning goal that was completed during the reporting
period. Source: Forestry Division.
Indicator name: – Trees pruned as a percent of pruning eligible trees Description: The number of pruning eligible street trees (trees 5 inches and larger in diameter) that were
pruned using block pruning contracts divided by the total number of pruning eligible trees as determined by the 2005-2006 street tree census.
Source: Forestry Division.
Indicator name: Trees removed Description: The total number of street and park trees removed annually, including downed trees.Source: Forestry Division.

Page 68 | Mayor’s Management Report
Department of Parks & Recreation
Indicator name: Tree inspectionsDescription: The number of tree inspections performed by forestry staff on street and non-forest park trees.
This includes all inspections that yield any risk priority category.
Indicator name: Immediate priority tree work resolved within 7 days (%)Description: The percentage of immediate priority work orders completed in a seven day period following a
field inspection. Immediate priority is the most urgent priority category. These work orders meet the following risk criteria: the likelihood of tree failure over a period of seven days is imminent, the chance of impacting a target is high and the consequences if failure and impact occur are severe.
Source: Forestry Division
Indicator name: High-priority tree work resolved within 28 days (%)Description: The percentage of high-priority work orders completed within a 28 day period following a field
inspection. High-priority is the second highest priority category after immediate priority. These work orders meet the following risk criteria: the likelihood of tree failure over the period of one year is probable, the chance of impacting a target is medium and the consequences if failure and impact occur are significant.
Source: Forestry Division
Indicator name: Trees plantedDescription: The total number of street trees and forestry trees planted by DPR and the number of street trees
planted by non-DPR entities. This includes trees planted by NYC Parks’ Capital Projects and Operations Divisions; street trees planted by Central Forestry and Horticulture; forest restoration trees planted by the Natural Resources Group; and street trees planted by other City agencies and individuals, community groups, and non-government organizations.
Source: Forestry Division.
Indicator name: Capital projects completedDescription: The number of capital construction projects completed by DPR’s Capital Projects Division during
the reporting period. Construction projects include all individual site projects or any individual sites within a multi-site project contract that are greater than $400,000.
Source: Capital Projects Division.
Indicator name: Capital projects completed on time or early (%)Description: The percent of capital construction projects completed on time or early, exclusive of programmatic
scope changes. Projects completed before the scheduled completion dates are considered early; those completed more than 30 days after the scheduled completion date are considered late. All others are considered on time.
Source: Capital Projects Division.
Indicator name: Capital projects completed within budget (%)Description: The percent of capital construction projects completed during the reporting period that remained
within budget, exclusive of programmatic scope changes.Source: Capital Projects Division.
Indicator name: New Yorkers living within walking distance of a park (%)Description: The percent of people living within a quarter of a mile of a small, publicly accessible park or a half
of a mile of a larger park.Source: OneNYC.

Indicator Definitions | Page 69
Department of Parks & Recreation
Indicator name: Total recreation center membershipsDescription: The total number of active memberships as of the end of the reporting month. This includes all full
year senior, adult, child and youth memberships and all 6-month adult memberships. In July 2013 the Department began to offer reduced rate memberships to young adults between the ages of 18–24. These memberships are a subset of the total adult membership category.
Source: Operations & Management Planning Division.
Indicator name: Total recreation center attendance Description: The total recreation center attendance, includes both members and visitors, during the reporting
period. Source: Operations & Management Planning Division.
Indicator name: Attendance at outdoor Olympic and intermediate pools (pool season)Description: The number of people in attendance at DPR’s outdoor Olympic and intermediate swimming pools
during the summer season, which generally runs from late June, the end of the school year, through Labor Day. Data reported in fiscal year (FY) is for period which begins in June of that FY and runs through September of the following FY. For example, data reported for Fiscal 2016 covers the relevant period of June 2016 through September 2016.
Source: Office of the First Deputy Commissioner.
Indicator name: Attendance at historic house museums Description: The number of people who visited DPR’s historic house museums throughout the reporting
period.Source: Historic House Trust.
Indicator name: Attendance at skating rinks Description: The number of people in attendance at skating rinks, not including off-season programming, as
reported by individual concessionaires.Source: Revenue Division.
Indicator name: Total attendance at non-recreation center programsDescription: Total attendance at structured youth, adult fitness and Urban Park Ranger programming, as
well as attendance at nature centers. Youth programming includes the number of attendees at mobile units, including movie vans, and Kids in Motion (KIM) programming. Adult fitness reports the number of attendees at Shape up classes not held in recreation centers. Urban Park Ranger programming includes the number of attendees at the Natural Classroom/Custom Adventures, Explorers/Weekend Adventures, Alley Pond Park adventure course and nature centers.
Source: Public Programs Division.
ndicator name: Volunteer turnout Description: The number of volunteer attendees at DPR administered programs and events. The following
programs/events are captured in this number: “It’s My Park” projects, planting and tree care events, natural area care projects and trainings, and the number of classes taught by volunteer Shape Up instructors.
Source: Partnerships for Parks, MillionTreesNYC, Natural Resources Group and Recreation Division.
Indicator name: Community Partner groups engaged by Partnerships for ParksDescription: The number of groups or organizations supporting DPR and green spaces that have actively
engaged with Partnerships for Parks (PfP) resources. Engagements can include hosting an “It’s My Park” project, utilizing any of the PfP’s resources (grants and training programs, which include public workshops, community visioning, coaching, etc.), and/or receiving support from PfP’s field staff.
Source: Partnerships for Parks.
Page 70 | Mayor’s Management Report
Department of Parks & Recreation
Indicator name: Cases commenced against the City in state and federal courtDescription: The number of state court and federal court matters assigned a litigation start date. In cases with
payout, it will be paid from the judgment and claims account in the City’s General Fund. Source: Law Department Law Manager system.
Indicator name: Payout ($000)Description: The judgment and claims amount, in thousands of dollars, paid by the City from the judgment and
claims account in the City’s General Fund to resolve cases through settlement or verdict. Source: Law Department Law Manager system.
Indicator name: Collisions involving City vehiclesDescription: The total number of City-vehicle involved collision reports involving injury or property damage
for the DPR fleet reported in the citywide collision reporting system (CRASH). New York State MV-104 reports are required whenever a collision occurs involving death, or other personal injury, or property damage over $1,000. Collisions are tracked and reported regardless of whether or not the driver was at fault and whether or not the vehicle was in motion. Collisions involving City vehicles occur whenever a City vehicle strikes (or is struck by) a second vehicle, pedestrian, bicyclist or fixed object.
Source: Citywide Fleet Management at DCAS.
Indicator name: Workplace injuries reportedDescription: All incidents resulting in a workers’ compensation or line of duty injury claim regardless of whether
or not time is lost.Source: Benefits Division.
Indicator name: E-mails routed and responded to in 14 days (%)Description: Of the e-mails that were routed, the percentage that were answered in 14 calendar days or
less. Responses should be substantive and adequately address the question/issue raised by the customer. A simple acknowledgement is not considered an adequate response. However, for more complex inquiries that require research and action on the part of the agency, an acknowledgement which includes a description of the next step (either on the agency’s behalf, or the customer’s), as well as an estimated time frame for completion, is considered acceptable and can be reported as part of the 14 day response. Agencies must internally track the additional time until a customer has a complete and full response.
Source: Office of the Commissioner.
Indicator name: Letters routed and responded to in 14 days (%)Description: Of the letters that were routed, the percentage that were answered in 14 calendar days or less.
Responses should be substantive and adequately address the question/issue raised by the customer. A simple acknowledgement is not considered an adequate response. However, for more complex inquiries that require research and action on the part of the agency, an acknowledgement which includes a description of the next step (either on the agency’s behalf, or the customer’s), as well as an estimated time frame for completion, is considered acceptable and can be reported as part of the 14 day response. Agencies must internally track the additional time until a customer has a complete and full response.
Source: Office of the Commissioner.
Indicator name: Completed customer requests for interpretationDescription: The sum of all requests for interpretation using a language other than English fulfilled by the
agency via telephone (including Language Line, call centers, offices/reception desks and 311 transfer calls) and via face-to-face interaction with bilingual employees or contracted interpreters.
Source: Community Outreach.
Indicator Definitions | Page 71
Department of Parks & Recreation
Indicator name: CORE customer experience rating (0–100)Description: An average score based on the rating of 15 conditions, including physical conditions (e.g.,
cleanliness, litter, seating) and customer service conditions (e.g., wait time, professionalism), for all agency walk-in facilities inspected, divided by the number of walk-in facilities inspected. Each of the 15 conditions can be rated excellent, good, fair or poor. Ratings of excellent are worth 100 points each, good ratings are worth 67 points, fair ratings are worth 33 points and poor ratings receive no points. Facilities are rated by trained City inspectors. Fiscal 2016 data for the overall rating represents a change in methodology. For agencies with multiple service centers, inspectors focused on sites that had historically lower scores, specifically sites that received an average overall site score of 85 or lower over the last three years and sites that received a score of 85 or lower in Fiscal 2015. If all agency service centers scored above 85 last year, the service center with the lowest overall score was inspected.
Source: Mayor’s Office of Operations—SCOUT
Indicator name: Total public service requests received—ForestryDescription: The total number of public service requests received from 311 and the Department’s internet
request form for forestry work during the reporting period. Examples include requests for tree pruning, the removal of dead trees, tree stumps, downed trees and limbs, and hanging limbs.
Source: Forestry Division.
Indicator name: Downed trees, downed limbs, and hanging limbsDescription: Service requests received from 311 and the Department’s internet request form for downed
trees, downed limbs, and hanging limbs. This indicator has been historically used as a proxy to document severe weather activity.
Source: Forestry Division.
Indicator name: Percent of service requests meeting time to first action Description: The percentage of closed service requests for which the agency met its planned time of action to
provide the service. Source: Mayor’s Office of Operations/Citywide Performance Reporting.

Page 72 | Mayor’s Management Report
Department of Parks & Recreation

Indicator Definitions | Page 73
Department of Cultural Affairs
Indicator name: Operating support payments made to Cultural Institutions Group by the 5th day of each month (%)
Description: The percent of operating support payments made by the fifth business day of each month after receiving a correct payment requisition. The Cultural Institutions Group is comprised of 33 City-owned institutions.
Source: Cultural Institutions Unit.
Indicator name: Average days to issue initial Cultural Development Fund (CDF) payments after complying with all City requirements
Description: The average number of business days to issue a grantee organization its initial Cultural Development Fund (CDF) payment following the organization’s satisfactory compliance with the City’s grant procedures and requirements, including compliance with Local Law 34 of 2007, which requires disclosures from principal officers, owners and senior managers of groups receiving DCLA funds; current registration with New York State’s Charities Bureau; and other requisites.
Source: Grants Management Tracking System.
Indicator name: Average days to issue final CDF paymentsDescription: Average number of business days to issue final payments to grantee organizations following
receipt of a complete and satisfactory payment request form. Source: Grants Management Tracking System.
Indicator name: Program organizations awarded CDF paymentsDescription: The number of eligible organizations awarded Cultural Development Fund grants. Grantee
organizations must satisfactorily comply with the City’s grant procedures and requirements, including compliance with Local Law 34 of 2007, which requires disclosures from principal officers, owners and senior managers of groups receiving DCLA funds; current registration with New York State’s Charities Bureau; and other requisites.
Source: Grants Management Tracking System.
Indicator name: Total financial support provided to qualifying organizations ($000,000)Description: The total amount of financial support provided to qualifying organizations. This includes monies
awarded to the Cultural Institutions Group for operating and energy costs, awards to program organizations, and monies awarded to cultural organizations in support of the Cultural After School adventures program (CASA).
Source: Finance Unit.
Indicator name: Capital projects authorized to proceedDescription: The number of all capital projects sent to the managing agency for which a full scope of work has
been approved to proceed to be funded.Source: Database files maintained by Capital Projects Unit. Indicator name: Capital projects initiated (%)Description: The percent of all capital projects sent to the managing agency for which a full scope of work has
been received and capital eligibility verified.Source: Database files maintained by Capital Projects Unit.
Indicator name: Schools, non-profits and City/State agencies served by Materials for the Arts (MFTA)Description: The total number of public schools, non-profits and City/State agencies provided free materials
and equipment through the MFTA Program, and the number served in each of the two reporting categories.
Source: Database files maintained by MFTA.
Page 74 | Mayor’s Management Report
Department of Cultural Affairs
Indicator name: MFTA transactionsDescription: The number of times MFTA recipients—not-for-profit organizations, public schools and City/State
agencies—have accessed donations of free materials, either through a visit to the warehouse or by directly picking up an item(s) from a donor.
Source: Database files maintained by MFTA.
Indicator name: Total visitors to Cultural Institutions Group (000)Description: The total number of visitors (onsite attendance) at the 33 organizations that comprise the Cultural
Institutions Group. Attendance is reported to DCLA by each funded organization. Source: Cultural Institutions Unit.
Indicator name: – Visitors using free admission and/or tickets (%)Description: Of the total number of visitors to the 33 City-owned cultural institutions (CIG), the percentage
utilizing free admission hours/tickets. Source: Cultural Institutions Unit.
Indicator name: E-mails responded to in 14 days (%)Description: The percentage of e-mails answered in 14 calendar days or less. Responses should be
substantive and adequately address the question/issue raised by the customer. A simple acknowledgement is not considered an adequate response. However, for more complex inquiries that require research and action on the part of the agency, an acknowledgement which includes a description of the next step (either on the agency’s behalf, or the customer’s), as well as an estimated time frame for completion, is considered acceptable and can be reported as part of the 14 day response. Agencies must internally track the additional time until a customer has a complete and full response.
Source: Database files maintained by Commissioner’s Unit.
Indicator name: Letters responded to in 14 days (%)Description: The percentage of letters answered in 14 calendar days or less. Responses should be
substantive and adequately address the question/issue raised by the customer. A simple acknowledgement is not considered an adequate response. However, for more complex inquiries that require research and action on the part of the agency, an acknowledgement which includes a description of the next step (either on the agency’s behalf, or the customer’s), as well as an estimated time frame for completion, is considered acceptable and can be reported as part of the 14 day response. Agencies must internally track the additional time until a customer has a complete and full response.
Source: Database files maintained by Commissioner’s Unit.
Indicator Definitions | Page 75
Department of Consumer and Worker Protection
Indicator name: Total docketed complaints Description: The total number of docketed complaints received and entered into DCA’s database. A docketed
complaint is entered into the database when the agency has received documentation supporting a complaint, the agency has determined that it has oversight authority of the complaint, and the complainant has requested the complaint be mediated.
Source: Office of the General Counsel (OGC) Consumer Services Unit.
Indicator name: Resolved consumer complaintsDescription: The number of consumer complaints that have been closed. A complaint can be resolved or
closed in several ways—agreement by consumer and vendor, referral to DCA’s Office of the General Counsel (OGC), referral outside the agency, etc.
Source: Office of the General Counsel Consumer Services Unit.
Indicator name: Complaints processed —Within 0-50 days (%) —Within 0-90 days (%)Description: The percent of valid complaints that were resolved within the specified time periods as measured
in calendar days. Source: Office of the General Counsel Consumer Services Unit.
Indicator name: Median complaint processing time (days)Description: The median number of calendar days required to resolve complaints. A complaint can be
resolved/closed in several ways—agreement by consumer and vendor, referral to DCA’s Office of the General Counsel (OGC) Licensing Litigation Unit, referral outside the agency, etc.
Source: OGC Consumer Services Unit. Indicator name: Consumer restitution awarded ($000)Description: The dollar value of restitution awarded but not necessarily paid to consumers by businesses in
complaint cases. Restitution comes from two main sources: Amounts negotiated by the Office of the General Counsel (OGC) after mediation and amounts awarded by the Office of Administrative Trials and Hearings (OATH) after a hearing.
Source: OGC Consumer Services Unit and Office of Administrative Trials and Hearings (OATH).
Indicator name: Mediated complaints resolved to the satisfaction of the business and consumer (%)Description: The percent of complaints resolved in mediation where the business and consumer mutually
agree upon the outcome. Complaints that are initially docketed for mediation but are later found to be ineligible for mediation are excluded—i.e., business is closed or cannot be located, DCA action was pre-empted by a legally binding document, agency has no jurisdiction.
Source: Office of the General Counsel Consumer Services Unit.
Indicator name: Total inspectionsDescription: The total number of inspections performed by DCA inspectors, including the borough units, the
petroleum unit, and the tobacco units, as well as all weights and measures, qualifying vehicle, and qualifying site inspections. The number does not include courtesy “Business Education” inspections conducted by the Special Enforcement unit.
Source: Enforcement Division.
Indicator name: Proactive inspectionsDescription: Total number of proactive inspections performed by DCWP inspectors including all weights and
measures, qualifying vehicle, qualifying site, periodic compliance, and patrol inspections.Source: Enforcement Division.
Page 76 | Mayor’s Management Report
Department of Consumer and Worker Protection
Indicator name: Tobacco program inspectionsDescription: Total number of tobacco retail dealer and electronic cigarette retail dealer inspections performed
by the tobacco unit.Source: Enforcement Division.
Indicator name: Referred inspectionsDescription: Total number of inspections performed after a referral or request from consumers, another DCWP
division, or external agency.Source: Enforcement Division.
Indicator name: Total summonses issuedDescription: The total number of summonses issued by the Enforcement Division, the Office of the General
Counsel (OGC) and the Office of Labor Policy and Standards (OLPS). Summonses that are withdrawn or voided before the adjudicatory process are not included in this total.
Source: Enforcement Division, DCA’s Office of the General Counsel (OGC) and Office of Labor Policy and Standards (OLPS)
Indicator name: Proactive summonses issuedDescription: Proactive inspections resulting in a violation.Source: Enforcement Division.
Indicator name: Tobacco program summonses issuedDescription: The number of Tobacco Program inspections resulting in a violation.Source: Enforcement Division.
Indicator name: Referred inspections summonses issuedDescription: The number of inspections resulting from a referral or request from consumers, another DCWP
division, or external agency that resulted in a violation.Source: Enforcement Division.
Indicator name: Licensing Law compliance rate (%)Description: The percent of all inspected businesses that are required to have a license and were found to be
licensed at the time of routine patrol inspections, calculated by dividing the number of inspections where no violations were issued by the number of inspections of licensed business categories.
Source: Enforcement Division.
Indicator name: Consumer Protection Law—refund and receipt compliance rate (%)Description: The percent of all businesses found to be in compliance with refund and receipt regulations (i.e.,
refund policy is adequately posted, name and address of business appear on receipt) at the time of a routine patrol inspection, calculated by dividing the number of inspections where no violations were issued by the number of inspections of businesses with applicable refund and receipt regulations.
Source: Enforcement Division.
Indicator name: Weights and Measures Law compliance rate—gasoline pumps (%)Description: The percent of gasoline pumps that accurately dispensed indicated amounts during inspections of
meters, calculated by dividing the number of passed inspections by the number of gasoline pump inspections.
Source: Enforcement Division.
Indicator Definitions | Page 77
Department of Consumer and Worker Protection
Indicator name: Weights and Measures Law compliance rate—fuel trucks (%)Description: The percent of fuel trucks that accurately dispensed indicated amounts during routine inspections
of meters, calculated by dividing the number of passed inspections by the total number of inspections.
Source: Enforcement Division.
Indicator name: Inspected stores complying with NY State regulations regarding the sale of tobacco to minors (%)Description: The percent of undercover inspections of tobacco vendors with a minor under the age of 18
where the vendor did not sell tobacco products to the minor. This metric is calculated by dividing the number of inspections where no violations were issued by the total number of inspections.
Source: Enforcement Division.
Indicator name: Total settlements ($000)Description: Fines collected as a result of actions by lawyers and settlement officers prior to final adjudication.Source: Collections Division.
Indicator name: Cases settled prior to original hearing date (%)Description: The percentage of scheduled hearings during the reporting period where the respondent entered
into a settlement or pleading agreement prior to their original hearing date.Source: General Counsel (Settlements)
Indicator name: Basic license application—Average processing time (days)Description: The average number of calendar days required to process new and renewal license applications
for categories containing most DCA licensees, including some categories requiring fingerprint checks. Licenses requiring approval by outside agencies, special inspections, mandatory waiting periods, or extensive legal review are excluded from this calculation.
Source: Licensing Division.
Indicator name: License applications received online (%)Description: The total number of new and renewal DCA license applications received online as a percent of all
licensing applications received by DCA.Source: Licensing Division.
Indicator name: Licensing Centers wait time (minutes)Description: The average number of minutes a customer waits to speak with a license center representative at
all DCA Licensing Centers, measured from the time the customer receives a Q-matic ticket to the time the customer reaches a service window.
Source: Q-matic system maintained by DCA’s Licensing Division.
Indicator name: Businesses educated through direct outreachDescription: The number of businesses visited on business education days, businesses attending DCA
outreach events and businesses participating in live chats.Source: External Affairs.
Indicator name: Clients served by Office of Financial Empowerment financial counseling programs Description: The number of unique clients receiving financial counseling through Office of Financial
Empowerment financial counseling programs. Source: Office of Financial Empowerment.
Page 78 | Mayor’s Management Report
Department of Consumer and Worker Protection
Indicator name: Financial counseling program clients—Percent achieving measurable success (%)Description: The percent of Office of Financial Empowerment financial counseling program clients with at
least two financial counseling sessions that have achieved at least one short or long-term change in financial behavior during the most recent fiscal year. Client behavioral changes include: (1) opening a safe and affordable bank account; (2) transitioning to a safe and affordable bank account; (3) maintaining a bank account for at least six months; (4) increasing credit score by at least 35 points (over a baseline credit score that cannot have occurred more than 15 months in the past); (5) establishing a credit score; (6) decreasing debt by 10% (compared to a baseline debt amount that cannot have occurred more than 15 months in the past); or (7) increasing savings by at least 2% of net income (over a baseline savings value that cannot have occurred more than 15 months in the past).
Source: Office of Financial Empowerment.
Indicator name: Total debt reduced by clients ($000) (cumulative)Description: The cumulative debt reduction, since inception of the respective program, by Office of Financial
Empowerment financial counseling program clients over the entire course of their counseling, measured from the point the client began participating in the program. Fiscal year first quarter data is used as a proxy for the October YTD number reported in the Preliminary Mayor’s Management Report.
Source: Office of Financial Empowerment.
Indicator name: Total savings accumulated ($) (cumulative)Description: The amount of cumulative savings increased, since inception of the respective program, by
Office of Financial Empowerment financial counseling program clients over the entire course of their counseling, measured from the point the client began participating in the program. Fiscal year first quarter data is used as a proxy for the October YTD number reported in the Preliminary Mayor’s Management Report.
Source: Office of Financial Empowerment.
Indicator name: Tax returns filed through citywide Tax Credit Campaign Description: The total number of tax returns prepared through the Tax Credit Campaign, a citywide
promotional effort focused on informing New Yorkers about the Earned Income Tax Credit and free and low-cost tax preparation services. DCA-supported tax partners include Volunteer Income Tax Assistance (VITA) providers, who manage free tax sites across the City, and free online providers.
Source: Office of Financial Empowerment.
Indicator name: Paid Safe and Sick Leave (PSSL) complaints receivedDescription: The total number of Paid Safe and Sick Leave (PSSL) complaints filed with the Office of Labor
Policy and Standards that are within DCA’s jurisdiction.Source: Office of Labor Policy and Standards.
Indicator name: PSSL complaints investigatedDescription: The total number of PSSL complaints investigated. Complaints may be investigated individually
or based upon a class of complainants.Source: Office of Labor Policy and Standards.
Indicator name: Average time to resolve PSSL complaint investigations (days)Description: The average age, in calendar days, of all resolved PSSL complaint investigations.Source: Office of Labor Policy and Standards.
Indicator Definitions | Page 79
Department of Consumer and Worker Protection
Indicator name: Number of employees entitled to restitutionDescription: The total number of employees who were entitled to restitution as a result of a settlement
agreement or a trial at OATH resulting from an Office of Labor Policy and Standards (OLPS) investigation. Employees may be entitled to restitution as a result of a complaint investigation or a proactive investigation by OLPS.
Source: Office of Labor Policy and Standards.
Indicator name: Total amount of employee restitution assessed ($)Description: The total dollar value of restitution assessed through a settlement agreement or as a result of a
trial at OATH. Employee restitution may be assessed as a result of a complaint investigation or a proactive investigation by OLPS.
Source: Office of Labor Policy and Standards.
Indicator name: Total amount of PSSL fines assessed ($)Description: The total dollar value of civil penalties imposed through a settlement agreement or as a result
of a trial. Civil penalties may be imposed as a result of a complaint investigation or a proactive investigation by OLPS.
Source: Office of Labor Policy and Standards.
Indicator name: Freelance Isn’t Free inquiries receivedDescription: The number of inquiries concerning the Freelance Isn’t Free Law that were addressed by the
Office of Labor Policy and Standards (OLPS). Inquiries can be placed by freelancers, hiring parties, or other members of the public. OLPS addresses inquiries by providing information and making referrals. Allegations of hiring party misconduct that would constitute violation of the Freelance Isn’t Free Law are handled as complaints, not inquiries.
Source: Office of Labor Policy and Standards.
Indicator name: Freelance Isn’t Free complaints received and addressedDescription: The number of complaints of Freelance Isn’t Free violations that were addressed by the Office of
Labor Policy and Standards (OLPS). Complaints are filed by freelancers against hiring parties. OLPS handles complaints by counseling Freelancers on their rights and options, notifying hiring parties of the allegations against them and requesting information, communicating the hiring party’s response to the complainant, making legal and other referrals, and providing ongoing support. Allegations of hiring party misconduct not covered under the Freelancer Isn’t Free Law are addressed as inquiries, not complaints.
Source: Office of Labor Policy and Standards.
Indicator name: Amount recovered for Freelance Isn’t Free complainants ($)Description: The amount of money recovered by freelancers after their complaints of Freelance Isn’t Free
violations were handled by the Office of Labor Policy and Standards (OLPS). Amounts recovered are self-reported by complainants either following payment from the hiring party or following an agreement with the hiring party to pay.
Source: Office of Labor Policy and Standards.
Indicator name: Average customer in-person wait time (minutes)Description: The average wait time for customers visiting the Licensing Centers, the Consumer Services Unit
and the collections office and, prior to Fiscal 2017, those visiting the agency’s administrative tribunal. For Licensing Center customers, the time is calculated from the time the customer receives a Q-matic ticket to the time the customer reaches a service window to speak with a Licensing Center representative. For other customers, wait time is tracked manually.
Source: Licensing Division, OGC Consumer Services Unit and Collections Division.
Page 80 | Mayor’s Management Report
Department of Consumer and Worker Protection
Indicator name: Completed customer requests for interpretationDescription: The sum of all requests for interpretation using a language other than English fulfilled by the
agency via telephone (including Language Line, call centers, offices/reception desks and 311 transfer calls) and via face-to-face interaction with bilingual employees or contracted interpreters.
Source: External Affairs.
Indicator name: CORE customer experience rating (0-100)Description: An average score based on the rating of 15 conditions, including physical conditions (e.g.,
cleanliness, litter, seating) and customer service conditions (e.g., wait time, professionalism), for all agency walk-in facilities inspected, divided by the number of walk-in facilities inspected. Each of the 15 conditions can be rated excellent, good, fair or poor. Ratings of excellent are worth 100 points each, good ratings are worth 67 points, fair ratings are worth 33 points and poor ratings receive no points. Facilities are rated by trained City inspectors. Fiscal 2016 data for the overall rating represents a change in methodology. For agencies with multiple service centers, inspectors focused on sites that had historically lower scores, specifically sites that received an average overall site score of 85 or lower over the last three years and sites that received a score of 85 or lower in Fiscal 2015. If all agency service centers scored above 85 last year, the service center with the lowest overall score was inspected.
Source: Mayor’s Office of Operations—SCOUT.
Indicator name: Percent of service requests meeting time to first action Description: The percentage of closed service requests for which the agency met its planned time of action to
provide the service. Source: Mayor’s Office of Operations/Citywide Performance Reporting.
Indicator Definitions | Page 81
311 Customer Service Center
Indicator name: 311 calls (000)Description: The number of calls, in thousands, received by the Customer Service Center by dialing 3-1-1
directly; by dialing 212-NEWYORK, the number available to callers outside the five boroughs of the City; or by dialing agency call centers or hotlines that were consolidated into 311 operations.
Source: 311 Customer Service Center. Indicator name: 311 Spanish language calls (000)Description: The number of calls received by the Customer Service Center that selected the Spanish
language prompt in the Interactive Voice Response menu.Source: 311 Customer Service Center.
Indicator name: 311 calls in languages other than English or Spanish (000)Description: The number of calls received by the Customer Service Center that were handled by
representatives using a translation service. Typically, these are calls in languages other than English or Spanish.
Source: 311 Customer Service Center.
Indicator Name: 311 mobile app contacts (000)Description: Number of contacts, in thousands, for information or service made to 311 through the mobile
application. Source: 311 Customer Service Center.
Indicator Name: 311-NYC (text) contacts (000)Description: Number of text contacts, in thousands, for information or service made to 311 via 311-NYC
(311-692). Each conversation with a text caller only counts as one contact, even if multiple messages are exchanged.
Source: 311 Customer Service Center. Indicator name: 311 Online site visits (000)Description: The number of visits, including requests for information or services, in thousands, made to 311
Online via the City’s website (www.nyc.gov/311).Source: 311 Customer Service Center.
Indicator name: Completed service requests (000)Description: Number of service requests to 311 that were completed in that fiscal year.Source: 311 Customer Service Center.
Indicator name: Knowledge articles accessed (000)Description: Number of knowledge articles accessed by call takers and members of the public directly
accessing 311 Online. Source: 311 Customer Service Center.
Indicator name: Average wait time (tier 1 calls) Peak hours (11am–3pm, M–F) (minutes:seconds)Description: The average wait time, in minutes and seconds, until a call in the tier 1 queue is answered by
a live call center representative during Peak hours. Tier 1 is the general 311 call queue, which excludes callers that select one of the menu options. The average is calculated for the Peak hours of 11am-3pm Monday to Friday. Wait time begins after initial prerecorded messages.
Source: 311 Customer Service Center.
Page 82 | Mayor’s Management Report
311 Customer Service Center
Indicator name: Average wait time (tier 1 calls) Off-peak hours (minutes:seconds)Description: The average wait time, in minutes and seconds, until a call in the tier 1 queue is answered by a
live call center representative during Off-peak hours. Tier 1 is the general 311 call queue, which excludes callers that select one of the menu options. The average is calculated for Off-peak hours (i.e., outside of 11am–3pm Monday to Friday). Wait time begins after initial prerecorded messages.
Source: 311 Customer Service Center. Indicator name: E-mails responded to in 14 days (%)Description: The percentage of emails answered in 14 calendar days or less. Responses are substantive and
adequately address the question/issue raised by the customer. However, for complex inquiries that require research and additional action on the part of the agency, an acknowledgement which includes a description of the next step, as well as an estimated time frame for completion, is considered acceptable and is also reported as part of the 14-day response. Agencies track the additional time until a customer has a complete and full response.
Source: 311 Customer Service Center.
Indicator name: Customer satisfaction indexDescription: An index of the customers surveyed who were satisfied with the service they received from
311. The survey is conducted and the index is calculated by CFI Group, Inc. for 311 using their patented American Customer Satisfaction Index (ACSI) methodology. The overall result reported is a comparison and weighted metric that triangulates the customer’s view on ideal customer experience, desired customer experience and actual customer experience.
Source: CFI Group, Inc./311 Customer Service Center.
Indicator Definitions | Page 83
Taxi and Limousine Commission
Indicator name: Active medallion taxis that are accessibleDescription: The number of active medallion taxicabs that are wheelchair accessible and did any trips in
a month. All accessible taxicabs must be compliant with the applicable requirements of the Americans with Disabilities Act.
Source: TLC Programs.
Indicator name: Active Boro Taxis that are accessibleDescription: The number of Boro Taxis (also known as Street Hail Liveries or green cabs) that are wheelchair
accessible and did any trips in a month. All accessible Boro Taxis must be compliant with the applicable requirements of the Americans with Disabilities Act.
Source: TLC Programs.
Indicator name: Active FHVs that are accessibleDescription: The number of FHVs that are wheelchair accessible and did any trips in a month. Source: TLC Programs.
Indicator name: Accessible dispatch median wait time citywide (minutes:seconds)Description: The median wait time for passengers who requested a wheelchair accessible vehicle through
the Accessible Dispatch program. The median wait time includes the time associated with traffic and travel to the passenger’s pick-up location and is calculated from the time the request for an accessible taxi is submitted to the time the driver arrives at the passenger’s pick-up location.
Source: TLC Programs.
Indicator name: Accessible dispatch trips fulfilled as a percent of requested trips (%)Description: The percentage of passenger trips fulfilled through the Accessible Dispatch program as a percent
of all requested trips. Source: TLC Programs.
Indicator name: Active medallion vehicles with hearing induction loopsDescription: The number of medallion taxicab vehicles with hearing induction loops. A hearing induction loop
is an installed system that transmits sound to assist passengers with hearing aids or cochlear implants.
Source: TLC Safety and Emissions.
Indicator name: Medallion safety and emissions inspections conductedDescription: The total number of completed initial and re-test inspections for medallion taxicabs. As per a TLC
rule, all medallion cabs must be inspected three times per year at TLC’s Woodside inspections facility. Inspections consist of New York State Department of Motor Vehicles (DMV) required safety and emissions testing and TLC required safety and visual testing.
Source: TLC Safety and Emissions Division.
Indicator name: Medallion safety and emissions failure rate - Initial inspection (%) - Re-inspection (%)Description: The percent of medallion taxicabs that failed initial inspection and the percent of medallion
taxicabs that failed re-inspection. Vehicles that fail initial inspections must return to TLC’s Woodside facility for re-inspection until they are able to pass.
Source: TLC Safety and Emissions Division.
Indicator name: Medallion safety and emissions inspections completed on schedule (%)Description: The percent of medallion vehicles that completed a safety and emissions inspection on the
scheduled appointment date.Source: TLC Safety and Emissions Division.
Page 84 | Mayor’s Management Report
Taxi and Limousine Commission
Indicator name: For-hire vehicle (FHV) safety and emissions inspections conducted at TLC facilityDescription: The total number of completed initial and re-test inspections performed on for-hire vehicles. As
per a TLC rule, FHVs must be inspected once every two years at TLC’s Woodside inspections facility. Inspections consist of New York State (NYS) Department of Motor Vehicles (DMV) required safety and emissions testing and TLC required safety and visual testing. Other required safety and emissions inspections (an additional five during the two year license period) can be completed at any NYS DMV registered facility.
Source: TLC Safety and Emissions Division.
Indicator name: FHV safety and emissions failure rate - Initial inspection (%) - Re-inspection (%)Description: The percent of FHV vehicles that failed initial inspections and the percent that failed re-
inspections. Vehicles that fail initial inspections must return to TLC’s Woodside facility for re-inspection until they are able to pass.
Source: TLC Safety and Emissions Division.
Indicator name: FHV safety and emissions inspections completed on schedule (%)Description: The percent of for-hire vehicles that completed a safety and emissions inspection on the
scheduled appointment date.Source: TLC Safety and Emissions Division.
Indicator name: Boro Taxi safety and emissions inspections conducted Description: The total number of completed initial and re-test inspections for Boro Taxis. As per a TLC rule,
all Boro Taxis must be inspected two times per year at TLC’s Woodside inspections facility. Inspections consist of New York State Department of Motor Vehicles (DMV) required safety and emissions testing and TLC required safety and visual testing.
Source: TLC Safety and Emissions Division.
Indicator name: Boro Taxis safety and emissions failure rate - Initial inspection (%) - Re-inspection (%)Description: The percent of Boro Taxis that failed initial inspection and the percent that failed re-inspection.
Vehicles that fail initial inspections must return to TLC’s Woodside facility for re-inspection until they are able to pass.
Source: TLC Safety and Emissions Division.
Indicator name: Patrol summonses issued to driversDescription: The total number of patrol summonses issued to drivers of TLC licensed vehicles for not
complying with TLC’s rules and regulations and the number issued to unlicensed operators that offer street hail service to passengers. A patrol summons is a field summons issued while an inspector is on patrol.
Source: TLC Enforcement Division.
Indicator name: Patrol summonses issued to owners/agents/basesDescription: The total number of patrol summonses issued to vehicle owners, agents and bases of TLC
licensed vehicles when drivers do no not comply with TLC’s rules and regulations. A patrol summons is a field summons issued while an inspector is on patrol.
Source: TLC Enforcement Division
Indicator Definitions | Page 85
Taxi and Limousine Commission
Indicator name: Patrol summonses issued for illegal street hails (drivers and vehicle owners)Description: The number of summonses issued to licensed vehicle drivers and vehicle owners who are not
authorized to pick up street hails yet do so—i.e., 1) drivers of commuter and paratransit vans; 2) drivers of street hail liveries (Boro taxis) that pick up street hails in the Exclusionary Zone; and 3) any other driver who does not have a medallion and picks up a street hail. (Note: Through June 2013 only medallion drivers were legally allowed to pick up street hails.)
Source: TLC Enforcement Division.
Indicator name: Patrol summonses issued for unlicensed activity (drivers and vehicle owners)Description: The total number of patrol summonses issued to unlicensed drivers, as well as to the owners of
those vehicles, that offer street hail service to passengers. Source: TLC Enforcement Division.
Indicator name: Administrative summonses issued to driversDescription: The total number of administrative summonses issued to TLC-licensed drivers for not complying
with TLC’s rules and regulations. Whereas patrol summonses are issued by inspectors in the field, administrative summonses are generated based on violations observable in secure TLC databases, such as licensing records.
Source: TLC Enforcement Division.
Indicator name: Administrative summonses issued to owners/agents/basesDescription: The total number of administrative summonses issued to vehicle owners, agents and bases for
not complying with TLC’s rules and regulations. Administrative summonses are generated based on violations observable in secure TLC databases, such as licensing records.
Source: TLC Enforcement Division.
Indicator name: Violations admitted to or upheld at the Taxi and Limousine Tribunal at the Office of Administrative Trials and Hearings (%)
Description: The number of violations where the respondent admitted to the rule violation and/or paid the penalty without a hearing (referred to as a stipulation) or where the rule violation was upheld following a hearing as a percent of all violations resolved (stipulations, plus violations upheld and dismissed).
Source: TLC Prosecution.
Indicator name: Average wait time at Long Island City licensing facility (hours: minutes)Description: The average number of hours/minutes a licensee/applicant waited at the licensing facility from
the time the licensee/applicant receives a Q-Matic ticket to the start of service by a TLC customer representative.
Source: TLC Licensing Division.
Indicator name: TLC driver licenses issuedDescription: The total number of TLC driver licenses, both initial (new) and renewal licenses, that TLC issued
to applicants who met TLC standards and completed all requirements.Source: TLC Licensing Division.
Indicator name: - New TLC driver licenses issuedDescription: The total number of new TLC driver licenses issued to applicants who met TLC standards and
completed all requirements.Source: TLC Licensing Division.
Page 86 | Mayor’s Management Report
Taxi and Limousine Commission
Indicator name: Average time to issue a new driver license from initial application (calendar days) Description: The average time, measured in calendar days, to issue a new TLC driver license from the date
the applicant initiated the application process to the time the license is issued. This includes the time needed by an applicant to complete all requirements as well as the time by TLC to process the application.
Source: TLC Licensing Division.
Indicator name: - Average agency processing time to issue a new driver license Description: The average time, measured in calendar days, to issue a new TLC driver’s license from the date
the applicant submitted all completed requirements. This counts only the time TLC requires to process the application and excludes time needed by applicants to complete all requirements. The clock is stopped and started as necessary.
Source: TLC Licensing Division
Indicator name: Average time to conduct a safety and emissions inspection of a medallion taxi (hours: minutes)Description: The average time it takes to conduct a safety and emissions inspection of a medallion taxi;
includes the time spent waiting for the inspection and the time spent on the inspection. Source: TLC Safety and Emissions Division. Indicator name: Average time to conduct a safety and emissions inspection of a FHV (hours: minutes)Description: The average time it takes to conduct a safety and emissions inspection of a FHV, includes both
the time spent waiting for the inspection and the time spent on the inspection.Source: TLC Safety and Emissions Division. Indicator name: Average time to conduct a safety and emissions inspection of a Boro Taxi (hours: minutes)Description: The average time it takes to conduct a safety and emissions inspection of a Boro Taxi; includes
the time spent waiting for the inspection and the time spent on the inspection.Source: TLC Safety and Emissions Division.
Indicator TLC driver complaints received.Description: The total number of complaints customers made to TLC’s Call Center and other channels
regarding a TLC driver. These complaints can lead to charges being filed against the driver and may lead to a consumer hearing.
Source: Prosecution.
Indicator - TLC driver complaints that were eligible for prosecution. Description: The total number of complaints received against TLC drivers where the customer agreed
to participate in TLC’s investigation, TLC was able to verify the information provided by the customer, and the information gave TLC reasonable cause to believe the TLC driver violated a TLC rule/s.
Source: Prosecution.
Indicator name: Average time to close a consumer complaint (calendar days): TLC driverDescription: The average number of calendar days to close a consumer complaint against a TLC driver,
measured from receipt of the complaint to the date the hearing is scheduled or complaint is otherwise resolved.
Source: Prosecution.
Indicator name: Medallion vehiclesDescription: The total number of current medallion taxicab vehicles. Source: TLC Licensing Division.
Indicator Definitions | Page 87
Taxi and Limousine Commission
Indicator name: For-hire vehicles (includes Boro Taxis) - Boro TaxisDescription: The total number of for-hire vehicles, including Boro Taxis, and the number of Boro Taxis as a
subset of the total. Source: TLC Licensing Division.
Indicator name: E-mails responded to in 14 days (%)Description: The percentage of e-mails answered in 14 calendar days or less. Responses should be
substantive and adequately address the question/issue raised by the customer. A simple acknowledgement is not considered an adequate response. However, for more complex inquiries that require research and action on the part of the agency, an acknowledgement which includes a description of the next step (either on the agency’s behalf, or the customer’s), as well as an estimated time frame for completion, is considered acceptable and can be reported as part of the 14 day response. Agencies must internally track the additional time until a customer has a complete and full response.
Source: TLC Call Center.
Indicator name: Letters responded to in 14 days (%)Description: The percentage of letters answered in 14 calendar days or less. Responses should be
substantive and adequately address the question/issue raised by the customer. A simple acknowledgement is not considered an adequate response. However, for more complex inquiries that require research and action on the part of the agency, an acknowledgement which includes a description of the next step (either on the agency’s behalf, or the customer’s), as well as an estimated time frame for completion, is considered acceptable and can be reported as part of the 14 day response. Agencies must internally track the additional time until a customer has a complete and full response.
Source: Operations.
Indicator name: Average call wait time (minutes: seconds) Description: The average time, measured in minutes and seconds, from the time a call enters the Interactive
Voice Response (IVR) system to the time that a Call Center Agent answers the call. This includes the time during which the recorded greetings are played as well as the time taken by the caller to navigate through the IVR options attempting self-service.
Source: TLC Licensing Division
Indicator name: Completed customer requests for interpretationDescription: The sum of all requests for interpretation using a language other than English fulfilled by the
agency via telephone (including Language Line, call centers, offices/reception desks and 311 transfer calls) and via face-to-face interaction with bilingual employees or contracted interpreters.
Source: TLC Licensing Division.
Indicator name: CORE customer experience rating (1-100)Description: An average score based on the rating of 24 conditions, including physical conditions (e.g.,
cleanliness, litter, seating) and customer service conditions (e.g. wait time, professionalism), for all agency walk-in facilities inspected, divided by the number of walk-in facilities inspected. Facilities are rated by trained City inspectors.
Source: Mayor’s Office of Operations—SCOUT.
Indicator name: Percent of service requests meeting time to first action Description: The percentage of closed service requests for which the agency met its planned time of action to
provide the service. Source: Mayor’s Office of Operations/Citywide Performance Reporting.

Page 88 | Mayor’s Management Report
Taxi and Limousine Commission

Health and Human Services
Health and Human Services
Office of Chief Medical Examiner
NYCHealth + Hospitals
Human Resources Administration
Administration for Children’s Services
Department of Homeless Services
Department for the Aging
Department of Health and Mental Hygiene p 91
p 97
p 101
p 105
p 117
p 125
p 131
Indicator Definitions | Page 91
Department of Health and Mental Hygiene
Indicator name: New HIV diagnoses (CY Preliminary)Description: The number of new HIV diagnoses cases reported and confirmed by DOHMH. Data is by
calendar year quarter. Source: DOHMH Bureau of HIV/AIDS Prevention and Control
Indicator name: Patients enrolled in Ryan White Part A with current antiretroviral (ARV) prescription at last assessment (%)
Description: Patients in enrolled in Ryan White Part A with current antiretroviral (ARV) prescription at last assessment as reported to DOHMH. Data is by fiscal year quarter.
Source: DOHMH Bureau of HIV/AIDS Prevention and Control
Indicator name: Syphilis casesDescription: The number of primary and secondary stage syphilis cases reported to DOHMH.Source: DOHMH Bureau of Sexually Transmitted Disease Prevention and Control
Indicator name: Male Condoms Distributed (000)Description: The total number of male condoms distributed by DOHMH. Data is by fiscal year quarter.Source: DOHMH Bureau of HIV/AIDS Prevention and Control
Indicator name: New tuberculosis cases (CY)Description: The number of new tuberculosis cases reported and confirmed by DOHMH. Data is by calendar
year. Four-month data reflect the months January-April. Source: DOHMH Bureau of Tuberculosis Control
Indicator name: Seniors, aged 65+, who reported receiving a flu shot in the last 12 months (%) (CY)Description: Seniors, aged 65+, who reported being immunized against influenza in the last 12 months as
noted in the NYC Community Health Survey. Data is by calendar yearSource: DOHMH Bureau of Epidemiology Services
Indicator name: Children aged 19-35 months with up-to-date immunizations (%)Description: Children 19-35 months reported as receiving 4 or more doses of DTaP, 3 or more doses of
poliovirus vaccine, 1 or more doses of any MMR, 3 or more doses of Hib, 3 or more doses of HepB, and 1 or more doses of varicella vaccine, divided by the total number of children ages 19-35 months according to the US Census Bureau. Data is by fiscal year quarter.
Source: DOHMH Bureau of Immunization
Indicator name: Children in the public schools who are in compliance with required immunizations (%)Description: The number of children in public schools who are in compliance with all immunizations required
by State and Local public health laws, divided by the number of children enrolled in NYC public schools.
Source: NYC Department of Education, DOHMH Bureau of Immunization
Indicator name: HPV vaccine series completion (%) Description: Proportion of 13-17 year-olds who received a complete series (2 or 3 doses depending on series
initiation at <15 years of age and interval between dose 1 and dose 2 is > 5 months) of HPV vaccine, by gender
Numerator = Number of females and males ages 13-17 years who have completed the HPV vaccine series with 2 or 3 valid doses of HPV vaccine reported to the CIR
Denominator= Total number of females and males ages 13-17 years, based on 2010 US Census estimates
Source: Disease Control; Bureau of Immunization
Page 92 | Mayor’s Management Report
Department of Health and Mental Hygiene
Indicator name: Adults who smoke (%)(CY)Description: The percent of adult New Yorkers who define themselves as current smokers in the NYC
Community Health Survey. Data is by calendar year.Source: DOHMH Bureau of Epidemiology Services Indicator name: Adults with obesity (%)(CY)Description: Adult New Yorkers who have a Body Mass Index (BMI) of 30 or greater and is calculated based
on respondents’ self-reported weight and height, as noted in the NYC Community Health Survey. Data is by calendar year.
Source: DOHMH Bureau of Epidemiology Services.
Indicator name: Adults who consume an average of one or more sugar-sweetened beverage per day (%)(CY)Description: Adults who consume an average of one or more sugar-sweetened beverage per day, as noted
in the NYC Community Health Survey. “Sugar-sweetened beverages” are defined as sugar-sweetened sodas and other sugar-sweetened drinks, like iced tea. Data is by calendar year.
Source: DOHMH Bureau of Epidemiology Services
Indicator name: Adult New Yorkers without health insurance (%)(CY) Description: Age-adjusted percent of adults that reported not having health insurance.Source: DOHMH Community Health Survey
Indicator name: Adult patients with controlled blood pressure (%) (CY)Description: The percentage of patients seen at a Primary Care Information Project (PCIP)-participating
primary care practice who have a diagnoses of hypertension and a recent blood pressure less than 140/90 mm Hg.
Source: DOHMH Primary Care Information Project (PCIP) Hub
Indicator name: Adults, aged 50+, who received a colonoscopy in the past ten years (%)(CY)Description: Adults, aged 50+, who received a colonoscopy screening test in the past ten years as noted in
the NYC Community Health Survey. Data is by calendar year.Source: DOHMH Bureau of Epidemiology Services Indicator name: Asthma-related emergency department visits among children ages 5-17 (per 10,000 children)
(CY)Description: Children aged 5-17 who enter the hospital due to asthma, per 1,000 children aged 0-14 residing
in NYC. Data is by calendar year.Source: New York State Department of Health Indicator name: Infant mortality rate (per 1,000 live births)(CY)Description: Deaths of infants under one year of age per 1,000 live births in NYC. Data is by calendar year.Source: DOHMH Bureau of Vital Statistics
Indicator name: Childhood Blood Lead Levels- number of children under the age of 18 with blood lead levels of 5 micrograms per deciliter or greater (CY)
Description: The number of children under the age of 18 with a blood lead test level at or above 5 micrograms per deciliter. Each child is counted only once per year, but the same child may be counted multiple times over time if he or she has been tested in multiple calendar years with a blood lead test at or above the reference level. Data is by calendar year quarter.
Source: DOHMH Lead Poisoning Prevention Program
Indicator Definitions | Page 93
Department of Health and Mental Hygiene
Indicator name: Childhood Blood Lead Levels- number of children under the age of 6 with blood lead levels of 5 micrograms per deciliter or greater (CY)
Description: The number of children under the age of 6 with a blood lead test level at or above 5 micrograms per deciliter. Each child is counted only once per year, but the same child may be counted multiple times over time if he or she has been tested in multiple calendar years with a blood lead test at or above the reference level. Data is by calendar year quarter.
Source: DOHMH Lead Poisoning Prevention Program
Indicator name: Active group child care center full inspectionsDescription: The number of full inspections, including initial, monitoring and compliance inspections,
conducted at active group child care centers. Active group child care centers only include NYC permitted sites.
Source: DOHMH Bureau of Child Care
Indicator name: Active group child care center initial inspections that do not require a compliance inspection (%)Description: The percent of initial inspections at group day care centers that do not result in critical, serious or
five or more non-serious violations. Active group child care centers only include NYC permitted sites.
Source: DOHMH Bureau of Child Care Indicator name: Restaurants inspected (%)Description: The number of restaurants with at least one inspection performed, divided by the number of
permitted restaurants in New York City, not including mobile vending units. Source: DOHMH Division of Environmental Health Indicator name: Restaurants scoring an ‘A’ grade (%)Description: The percent of restaurants with a final adjudicated grade that have an ‘A’ (snapshot taken on
the last day of each month). Only restaurants that have finished the grading process (had their hearing) are included.
Source: DOHMH Division of Environmental Health Indicator name: Initial Pest Control Inspections (000)Description: The total number of initial pest control inspections of private properties by DOHMH citywide.Source: DOHMH Division of Environmental Health
Indicator name: Initial inspections with Active Rat Signs (ARS)(%)Description: The percent of properties receiving rodent inspections that failed their initial inspection as a result
of ‘signs of active rats (ARS)’ – the most serious rodent violation, divided by the total number of initial property inspections.
Source: DOHMH Division of Environmental Health Indicator name: Compliance inspections found to be rat free (%)Description: The number of properties receiving rodent inspections that passed their compliance inspection
divided by the number of those properties that failed their initial inspection as a result of ‘signs of active rats (ARS)’ – the most serious rodent violation.
Source: DOHMH Division of Environmental Health Indicator name: Dogs licensed (000)Description: The number of dogs with an active license.Source: DOHMH Division of Environmental Health
Page 94 | Mayor’s Management Report
Department of Health and Mental Hygiene
Indicator name: Buprenorphine patients (CY)Description: Total number of individuals who had a buprenorphine prescription, a medication used to treat
opiate addiction, filled for the first time at some point during the year. Data is by calendar year quarter.
Source: NYS DOH Bureau of Narcotics Enforcement Indicator name: Deaths from unintentional drug overdose (CY)Description: Deaths due to use of, or accidental poisoning by, psychoactive substances. Excludes alcohol and
tobacco. Data is by calendar year quarter.Source: NYC Department of Health and Mental Hygiene Indicator name: Individuals in the assisted outpatient mental health treatment programDescription: The number of individuals in the Assisted Outpatient Treatment Program, a State-mandated
program that provides appropriate support to individuals with mental illnesses who are a threat to themselves and others. Data reflects the count on the first day of the month after the reporting period, i.e. fiscal data reflects data from July 1st.
Source: NYC Department of Health and Mental Hygiene Indicator name: Units of supportive housing available to persons at risk for developing serious mental health and
substance use disorders (000)Description: The number of supportive housing beds, in thousands, in contracts overseen by the Bureau of
Mental Health at NYC DOHMH. Supportive housing units provide services that help people with mental illness or substance use or at risk of mental illness or substance use live in community-based settings as independently as possible.
Source: New York State Office of Mental Health. Indicator name: New children receiving services from the Early Intervention Program (000)Description: The number of children, in thousands, who receive services from the Early Intervention Program.
Fiscal year data reflects counts performed on December 1 to align with State reporting on Early Intervention services. Four-month data reflects counts performed on April 1.
Source: NYS DOH New York Early Intervention System.
Indicator name: Supportive connections provided by NYC Well, a behavioral health helplineDescription: Number of calls, texts and chats that were answered by NYC Well in the current FY.Source: NYC Department of Health and Mental Hygiene
Indicator name: Individuals who received services from long-term mobile community-based treatment providersDescription: Number of individuals who were served by Assertive Community Treatment (ACT) teams,
Forensic Assertive Community Treatment (FACT) teams, or Intensive Mobile Treatment (IMT) teams.
Source: NYC Department of Health and Mental Hygiene Indicator name: New individuals engaged by a Co-Response Team (with DOHMH and NYPD)Description: The number of individuals who have had at least one face-to-face or over the phone encounter
with CRT and have received services. Service types include clinical assessment, supportive counseling, health promotion and awareness, service referral, connection to care or other stabilizing support, or transportation to a hospital.
Source: NYC Department of Health and Mental Hygiene Indicator name: Average response time for birth certificates by mail/online (days)Description: Average response time for birth certificates by mail/online (days) from receipt of necessary
documentation to response/issuance.Source: DOHMH Office of Vital Records
Indicator Definitions | Page 95
Department of Health and Mental Hygiene
Indicator name: Average response time for death certificates by mail/online (days)Description: Average response time for death certificates by mail/online (days) from receipt of necessary
documentation to response/issuance, including funeral director orders.Source: DOHMH Office of Vital Records
Indicator name: Workplace injuries reportedDescription: All incidents resulting in a workers’ compensation or line of duty injury claim regardless of whether
or not time is lost.Source: New York City Law Department
Indicator name: Collisions involving city vehiclesDescription: The total number of City-vehicle involved collision reports involving injury or property damage for
the citywide fleet reported in the citywide collision reporting system (CRASH). New York State MV-104 reports are required whenever a collision occurs involving death, or other personal injury, or property damage over $1,000. Collisions are tracked and reported regardless of whether or not the driver was at fault and whether or not the vehicle was in motion. Collisions involving City vehicles occur whenever a City vehicle strikes (or is struck by) a second vehicle, pedestrian, bicyclist or fixed object.
Source: DOHMH Fleet Administration
Indicator name: ECB violations received at the Office of Administrative Trials and HearingsDescription: Total number of DOHMH ECB violations received at OATH.Source: Office of Administrative Trials and Hearings (OATH) Hearings Division Green Book reports
Indicator Name: ECB violations admitted to or upheld at the Office of Administrative Trials and Hearings (%)Description: For all ECB violations returnable to OATH, the number of violations where the respondent
admitted to the violation and paid the penalty without a hearing or where the violation was upheld following a hearing as a percent of all violations resolved.
Source: Office of Administrative Trials and Hearings (OATH) Hearings Division Green Book reports

Page 96 | Mayor’s Management Report
Department of Health and Mental Hygiene
Indicator Definitions | Page 97
Office of Chief Medical Examiner
Indicator name: Median time for scene arrivals by medicolegal investigators (MLIs) (hours)Description: The time taken for medicolegal investigators (MLIs) to arrive to investigate and make the
preliminary review of OCME cases in the field. MLIs visit about one-third of all cases accepted by OCME.
Source: IT MEANS System.
Indicator name: Deaths reportedDescription: The total number of deaths reported to OCME. OCME is responsible for investigating all deaths
of persons in New York City occurring from criminal violence, by accidents, by suicide, suddenly when in apparent health, or in any unusual or suspicious manner. Deaths that fall into this category are reported to OCME by law enforcement, health care professionals and others.
Source: OCME IT Case Management System.
Indicator name: Cases where Chief Medical Examiner takes jurisdictionDescription: When deaths are reported to OCME, its investigators conduct an initial investigation. If following
that investigation, there’s a possibility the death may have resulted from criminal violence, accident, suicide, suddenly when in apparent health, or in any unusual or suspicious manner, OCME will take jurisdiction over the case for further forensic investigation. This investigation may include post-mortem examination/autopsy, laboratory testing and other forensic analyses, as required, to determine the cause and manner of death.
Source: Records Unit.
Indicator name: Median time to complete autopsy reports (days)Description: Median time to complete autopsy reports, which detail the cause and manner of death, as well as
other findings, after autopsy completion.Source: Records Unit. Indicator name: Total cremation requests received and investigated as requirement of processing Description: The total number of applications for cremation requests received by OCME, as OCME reviews all
applications for a permit to cremate the body of any person who dies in New York City. Source: OCME IT Case Management System. Indicator name: Cremation requests rejected after investigation and turned over to Medical Examiner jurisdictionDescription: The number of cremation requests that, after initial required investigation by OCME investigators,
were not approved for cremation because there was evidence that the death may have occurred in an unusual, suspicious or other manner, bringing it under the jurisdiction of the Medical Examiner for further investigation.
Source: OCME IT Case Management System.
Indicator name: Median time to certify death certificates after initial receipt of decedents’ remains (hours)Description: The median time OCME takes to certify NYC death certificates after the decedents’ remains are
initially received as Medical Examiner’s cases within one of its mortuaries. State law mandates that all remains be issued an initial death certificate within 72 hours, and therefore DOHMH requires of OCME that certification of death certificates be provided within that time.
Source: OCME IT Case Management System.
Indicator name: Decedents’ remains transported and stored by OCME Description: The total number of remains transported and stored by OCME Mortuary Services that do not fall
under Medical Examiner jurisdiction. OCME has a legal mandate to take custody of all unclaimed remains in the five boroughs. OCME transports these remains from healthcare facilities and other locations and stores them in the mortuary. While remains are being stored, OCME performs due diligence searches to locate the decedent’s family and notify them of the death.
Source: OCME IT Case Management System.
Page 98 | Mayor’s Management Report
Office of Chief Medical Examiner
Indicator name: Median time from OCME receipt of decedents’ remains to “Ready to Release” status (hours) Description: The median amount of time that elapses from OCME receipt of decedents’ remains in the
mortuary to when all necessary forensic examinations, including autopsies, are completed, quality assurance reviews conducted and those remains are ready to be released to funeral directors.
Source: OCME IT Case Management System.
Indicator name: Median time to clear and release to third party for final disposition, per case (minutes)Description: The median amount of turnaround time, from the moment when funeral directors arrive at an
OCME facility and have their paperwork verified by OCME security personnel to when all proper quality assurance procedures are complete and they depart the facility with the correct remains.
Source: OCME IT Case Management System.
Indicator name: Remains recovered following the September 11, 2001 attacks (cumulative)Description: The cumulative number of human remains recovered following the mass fatality incident of
9/11/2001.Source: Investigations/Special Operations Unit.
Indicator name: Number of fatalities handled by OCME following a mass fatality eventDescription: The total number of decedents handled by OCME following a mass fatality incident in the
reporting fiscal year. The definition of a mass fatality event, as defined in the NYC All hazards Mass Fatality Response Plan, includes: any event having the potential to yield 10 or more fatalities; any situation in which there are remains contaminated by chemical, biological, radiological, nuclear or explosive agents or materials; any incident or other special circumstance requiring a multi-agency response to support mass fatality response operations; any incident involving a protracted or complex remains recovery operation.
Source: Investigations/Special Operations Unit.
Indicator name: Remains identified following the September 11, 2001 attacks (cumulative)Description: The cumulative number of human remains recovered from 9/11/2001 disaster site that have been
identified.Source: Forensic Biology DNA Laboratory/WTC Records Unit.
Indicator name: Median time to complete analysis of a DNA case (days)Description: The median number of days for the Forensic Biology DNA Laboratory to perform chemical,
immunological, biochemical, and molecular biological analysis on submitted evidence to identify the source of the collected specimens in cases such as homicides, sexual assaults and property crimes, measured in age from the time OCME receives the case.
Source: Forensic Biology DNA Laboratory.
Indicator name: Median time to complete DNA homicide cases, from evidence submission to report (days)Description: Median time to complete fatality cases that undergo genetic marker analysis to help identify the
origin of biological specimens using DNA testing, from the time OCME receives the case.Source: Forensic Biology DNA Laboratory.
Indicator name: Median time to complete DNA sexual assault cases, from evidence submission to report (days)Description: Median time to complete sexual assault cases analyzed using DNA, from the time OCME
receives the case. Source: Forensic Biology DNA Laboratory.
Indicator name: Median time to complete DNA property crime cases, from evidence submission to report (days)Description: Median time to complete property crime cases analyzed using DNA, from the time OCME
receives the case.Source: Forensic Biology DNA Laboratory.

Indicator Definitions | Page 99
Office of Chief Medical Examiner
Indicator name: DNA matches with profiles in databaseDescription: The number of DNA samples from biological evidence found at crime scenes that match the DNA
profiles stored in the Combined DNA Index System (CODIS) national database.Source: Forensic Biology DNA Laboratory.
Indicator name: Median time to complete toxicology cases (days)Description: The median number of days for the Forensic Toxicology Laboratory to perform analysis on fatality
victims to determine the presence of drugs and other toxic substances in human fluids and tissues, in order to evaluate their role in the cause or manner of death, measured in age from the time OCME receives the case.
Source: Forensic Toxicology Laboratory. Indicator name: Median time to complete toxicology DUI cases (days)Description: Median time to complete Driving Under the Influence (DUI) cases analyzed to determine the
presence of ethanol and other drugs, from the time OCME receives the case. Source: Forensic Toxicology Laboratory.
Indicator name: Median time to complete toxicology sexual assault cases (days)Description: Median time for sexual assault cases to be screened by the Forensic Toxicology Laboratory for
the presence of volatiles, opiates, benzoylecgonine, barbiturates, salicylates, acetaminophen and basic drugs, from the time OCME receives the case.
Source: Forensic Toxicology Laboratory. Indicator name: Completed customer requests for interpretationDescription The sum of all requests for interpretation using a language other than English fulfilled by the
agency via telephone (including Language Line, call centers, offices/reception desks and 311 transfer calls) and via face-to-face interaction with bilingual employees or contracted interpreters.
Source: Office of Chief Medical Examiner.
Indicator name: Letters responded to in 14 days (%)Description: The percentage of letters answered in 14 calendar days or less out of the total number of letters
responded to during the reporting period. Responses are substantive and adequately address the question/issue raised by the customer. However, for complex inquiries that require research and additional action on the part of the agency, an acknowledgement that includes a description of the next step, as well as an estimated time frame for completion, is considered acceptable and is also reported as part of the 14 day response. Agencies track the additional time until a customer has a complete and full response.
Source: Office of Chief Medical Examiner.
Indicator name: E-mails responded to in 14 days (%)Description: The percentage of emails answered in 14 calendar days or less out of the total number of e-mails
responded to during the reporting period. Responses are substantive and adequately address the question/issue raised by the customer. However, for complex inquiries that require research and additional action on the part of the agency, an acknowledgement that includes a description of the next step, as well as an estimated time frame for completion, is considered acceptable and is also reported as part of the 14 day response. Agencies track the additional time until a customer has a complete and full response.
Source: Office of Chief Medical Examiner.

Page 100 | Mayor’s Management Report
Office of Chief Medical Examiner
Indicator Definitions | Page 101
NYC Health + Hospitals
Indicator name: Unique patientsDescription: The number of unique NYC Health+Hospitals patients represents all in-and outpatients during the
reporting period based on the unique patient identifier. Four-month actual figures reported reflect the 3-month period ending in September.
Source: Epic Clarity, QCPR, Dentrix, and PCC
Indicator name: Unique primary care patients (seen in the last 12 months)Description: The number of unique NYC Health+Hospitals patients seen at a primary care clinic based on
unique patient identifier number. It is a cumulative list of unique primary care patients seen in the last 12 months.
Source: Cerner billing database
Indicator name: Uninsured patients servedDescription: Count of every patient who has at least 1 encounter that reports primary care group as guar or
self-pay.Source: Cerner billing database, Epic Clarity, Dentrix, and PCC
Indicator name: eConsults completed Description: The number of outpatient referrals reviewed and managed via eConsult work flow. Source: Epic Clarity
Indicator: Telehealth visitsDescription: Use of digital information and communication technologies, such as computers and mobile
devises, via audio or video. To access health care services remotely and manage your healthcare.
Source: Epic, Amwell-Amwell’s looker tool
Indicator name: Eligible women receiving a mammogram screening (%)Description: The percentage of female patients age 50-75 with a Medicine or GYN visit during the reporting
year and a Mammogram in the past two years. Source: Cerner billing database, Epic Clarity
Indicator: HIV patients retained in care (%)Description: The proportion of HIV diagnosed patients who had at least one Virology visit in the first 6 months
of the review period and in the second 6 months of the review period. This indicator is collected annually following the fiscal year calendar.
Source: Cerner billing database, Epic Clarity
Indicator: Calendar days to third next available new appointment – adult medicineDescription: The number of calendar days to third next available appointment for new adult medicine patients. Source: Epic Clarity
Indicator: Calendar days to third next available new appointment – pediatric medicineDescription: The number of calendar days to third next available appointment for new pediatric medicine
patients. Source: Epic Clarity
Indicator: Patients enrolled in care during their first trimester of pregnancy (%) Description: Numerator: number of women who entered prenatal care in the first trimester Denominator: Total
number of women that entered prenatal care anytime during the measurement periodSource: Cerner billing database, Epic Clarity
Page 102 | Mayor’s Management Report
NYC Health + Hospitals
Indicator name: Correctional health patients with a substance use diagnosis who received jail-based contactDescription: Number of patients with a substance use disorder diagnosis who received any appropriate
substance use contact with our clinical services.Source: NYC Health+Hospitals Correctional Health Services
Indicator name: Total correctional health clinical encounters per 100 average daily populationDescription: Total number of CHS clinical encounters completed during the quarter, per 100 average daily
populationSource: NYC Health+Hospitals Correctional Health Services
Indicator name: Individuals who received clinical services from Mental Health Service Corps behavioral health clinicians
Description: The number of individuals who received clinical services from Mental Health Service Corps members including in-person therapy, group therapy, home visits, field visits, crisis interventions, etc.
Source: NYC Health + Hospitals Office of Behavioral Health
Indicator name: Follow-up appointment kept within 30 days after behavioral health dischargeDescription: The percentage of eligible patients that attended an outpatient encounter with a licensed mental
health professional within 30 days of behavioral health discharge. Numerator: A follow-up visit with a mental health practitioner within 30 days after discharge. Denominator: number of patients ages 6 and older discharged from an acute inpatient setting.
Source: Epic Clarity, PDMS
Indicator name: MetroPlus membership (000)Description: The number of recipients enrolled in any of NYC Health+Hospitals’ MetroPlus health plans.Source: MetroPlus
Indicator: MyChart Activations (%)Description: Numerator: Patients that have an active MyChart account. Denominator: All patients that had face
to face or telehealth visit during the reporting period.Source: Epic Clarity
Indicator name: Patients who left Emergency Department without being seen (%)Description: A patient who registers to be evaluated in the Emergency Department who leaves the Emergency
Department prior to being evaluated by a provider. Source: Cerner billing database, Epic Clarity
Indicator name: Net days of revenue for accounts receivableDescription: Total accounts receivable days, excluding days where patient remains admittedSource: Cerner billing database, Epic Clarity
Indicator name: Patient care revenue/expensesDescription: Patient care revenue growth and expense reduction adjusting for changes in city/state/federal
policy or other issues outside NYC Health + Hospitals’ management’s controlSource: Health+Hospitals Systems Financial Statements
Indicator name: MetroPlus Health Plan medical spend at Health+Hospitals (%)Description: The percentage of total MetroPlus medical spending at NYC Health + Hospitals facilities. This
measure does not account for pharmacy and non-medical spend.Source: MetroPlus
Indicator Definitions | Page 103
NYC Health + Hospitals
Indicator name: Insurance applications submitted by Health + Hospitals staff (monthly average)Description: The monthly average of insurance applications submitted by Health + Hospitals staff, with a last
status change date in the reporting month.Source: Epic Financial Assistance Trackers
Indicator name: Inpatient satisfaction rate (%)Description: The percent of inpatients who rate the hospital either a 9 or 10 based on a scale of 0 to 10. Data
is run at a System level via discharge date for the reporting periodSource: Press Ganey
Indicator name: Outpatient satisfaction rate (%)Description: The percent of outpatients who rate the hospital either a 9 or 10 based on a scale of 0 to 10. Data
is run at a system level via Discharge date for the reporting period.Source: Press Ganey
Indicator name: Patients receiving a defined set of medical services to treat sepsis within three hours of presentation (%)
Description: The percent of discharges in the calendar year for which all components of the 3-hour bundle were satisfied. This measure aggregates hospital-level data to reflect a system-wide score.
Source: New York State Department of Health/IPRO Quarterly Facility Sepsis Report
Indicator name: Patients diagnosed with diabetes who have appropriately controlled blood sugar (%)Description: The percent of patients aged 18-75 with diabetes, engaged in primary care and with a primary
care visit in the last 12 months, whose most recent HbA1c level during the last 12 months is adequately controlled (<8.0% and <1 year old).
Source: NYC Health+Hospitals Office of Population Health, Diabetes Registry
Indicator name: Post-acute satisfaction rate (%)Description: The percent of post-acute patients surveyed who are likely to recommend the facility to others.
This measure reflects the mean score. Post-acute care includes long-term care, sub-acute rehabilitation or long-term acute care services that patients receive after, or in some cases instead of, a stay in an acute care hospital.
Source: Press Ganey
Indicator name: Overall safety grade – acute care (%)Description: The percent of providers and staff surveyed who rated their facility as excellent or very good on
patient safety. This survey is conducted every two years on even-numbered years. Data for odd-numbered years is not available.
Source: Agency for Healthcare Research and Quality (AHRQ) Patient Safety Culture Survey
Indicator name: Overall safety grade – post-acute care (%)Description: The percent of providers and staff surveyed who rated their facility as excellent or very good on
patient safety. This survey is conducted every two years on even-numbered years. Data for odd-numbered years is not available.
Source: Agency for Healthcare Research and Quality (AHRQ) Patient Safety Culture Survey
Indicator name: Overall safety grade – ambulatory care (D & TC)(%)Description: The percent of providers and staff surveyed who rated their facility as excellent or very good on
patient safety. This survey is conducted every two years on even-numbered years. Data for odd-numbered years is not available.
Source: Agency for Healthcare Research and Quality (AHRQ) Patient Safety Culture Survey

Page 104 | Mayor’s Management Report
NYC Health + Hospitals
Indicator Definitions | Page 105
Human Resources Administration
Cash Assistance
Indicator name: Cash assistance unduplicated number of persons (12-month) (000)Description: This indicator measures the number of distinct people who received only one-time emergency
assistance or an ongoing recurring Cash Assistance benefit on the time-limited Family Assistance Program, the Safety Net Assistance (SNA) Program, or the 60-month Converted to Safety Net program within last 12 months. Everyone receiving any of these types of cash assistance is counted only once during the 12-month period.
Source: HRA Office of Planning and Performance Management (OPPM) and WMS report CRM01OR1
Indicator name: Cash assistance unduplicated number of persons receiving recurring assistance (12-month) (000)Description: This indicator measures the number of distinct people who received an ongoing, monthly Cash
Assistance benefit on either the time-limited Family Assistance Program or the Safety Net Assistance (SNA) Program or the 60-month Converted to Safety Net program within last 12 months. Everyone receiving any of these types of recurring cash assistance is counted only once during the 12-month period.
Source: HRA Office of Planning and Performance Management (OPPM) and WMS report CRM01OR1
Indicator name: Cash assistance unduplicated number of persons receiving emergency assistance (12-month) (000)
Description: This indicator measures the number of distinct people who received a one-time only emergency Cash Assistance benefit on either the time-limited Family Assistance Program or the Safety Net Assistance (SNA) Program or the 60-month Converted to Safety Net program within last 12 months. Everyone receiving any of these types of cash assistance is counted only once during the 12-month period.
Source: HRA Office of Planning and Performance Management (OPPM) and WMS report CRM01OR1
Indicator name: Persons receiving cash assistance (000)Description: As of the end of the reporting month, this indicator measures the number of persons who
received recurring and or emergency cash assistance from the Family Assistance Program, the Safety Net Assistance (SNA) Program or the 60-month Converted to Safety Net.
Source: HRA OPPM and WMS report CRM01OR1
Indicator name: Persons receiving recurring assistance (000)Description: As of the end of the reporting month, this indicator measures only the number of persons who
received ongoing, monthly cash assistance from the Family Assistance Program, the Safety Net Assistance (SNA) Program or the 60-month Converted to Safety Net.
Source: HRA OPPM and WMS report CRM01OR1
Indicator name: Persons receiving recurring emergency assistance (000)Description: As of the end of the reporting month, this indicator measures only the number of persons who
received one-time only emergency cash assistance from the Family Assistance Program, the Safety Net Assistance (SNA) Program or the 60-month Converted to Safety Net.
Source: HRA OPPM and WMS report CRM01OR1
Indicator name: Cash assistance caseload (point in time) (000) Description: At the end of the reporting period, the total number of cases receiving Cash Assistance.Source: HRA OPPM and WMS report
Indicator name: Cash assistance applications (000)Description: The cumulative number of cases applying for Cash Assistance (Recurring or Single-Issue
benefits).Source: HRA Office of Planning and Performance Management (OPPM)
Page 106 | Mayor’s Management Report
Human Resources Administration
Indicator name: Cash assistance application acceptance rate (%)Description: The percentage of Cash Assistance Applications with the application outcome of single issue
or active or closed out of the total number of cases applying for Cash Assistance (Recurring or Single-Issue benefits) in the respective month.
Source: HRA Office of Planning and Performance Management (OPPM)
Indicator name: Cash assistance cases in sanction process (%)Description: The percentage of Cash Assistance cases that were in conference/conciliation/awaiting
conciliation/fair hearing process out of the total number of Cash Assistance cases (on the engagement report) at the end of the reporting month.
Source: HRA Office of Planning and Performance Management (OPPM)
Indicator name: Cash assistance cases in sanction status (%)Description: The percentage of Cash Assistance cases that were in sanction due to non-compliance out of the
total number of Cash Assistance cases (on the engagement report) at the end of the reporting month.
Source: HRA Office of Planning and Performance Management (OPPM)
Indicator name: Cash Assistance application timeliness rate (%)Description: This indicator measures the percent of Cash Assistance application processing completed by the
Agency in the required 45-day time frame.Source: HRA Family Independence Administration (FIA)
Supplemental Nutrition Assistance Program (SNAP)
Indicator name: Persons receiving Supplemental Nutrition Assistance Program (SNAP) benefits (000)Description: As of the end of the reporting period, the number of eligible persons receiving federally supported
Supplemental Nutrition Assistance Program benefits, including both cash assistance recipients and non-PA recipients. The calculation includes persons who receive SNAP benefits at residential treatment centers and recipients of Supplemental Security Income (SSI) who receive SNAP benefits.
Source: HRA Office of Planning and Performance Management (OPPM)
Indicator name: Cash assistance persons receiving SNAP benefits (000)Description: As of the end of the reporting period, the total number of persons who receive both Supplemental
Nutrition Assistance Program benefits and Cash AssistanceSource: HRA Office of Planning and Performance Management (OPPM)
Indicator name: Non-cash assistance persons receiving SNAP benefits (000)Description: As of the end of the reporting period, the total number of persons who receive Supplemental
Nutrition Assistance Program benefits who are not cash assistance or SSI recipients.Source: HRA Office of Planning and Performance Management (OPPM)
Indicator name: SSI persons receiving SNAP benefits (000)Description: As of the end of the reporting period, the total number of eligible recipients of SSI receiving
federally supported Supplemental Nutrition Assistance Program benefits.Source: HRA Office of Planning and Performance Management (OPPM)

Indicator Definitions | Page 107
Human Resources Administration
Indicator name: Total SNAP households (000) Description: As of the end of the reporting period, the total number of eligible households receiving
Supplemental Nutrition Assistance Program benefits.Source: HRA Office of Planning and Performance Management (OPPM)
Indicator name: Cash assistance households receiving SNAP benefits (000) Description: As of the end of the reporting period, the total number of Cash Assistance eligible households
receiving Supplemental Nutrition Assistance Program benefits.Source: HRA Office of Planning and Performance Management (OPPM)
Indicator name: Non-cash assistance households receiving SNAP benefits (000) Description: As of the end of the reporting period, the total number of households who receive Supplemental
Nutrition Assistance Program benefits who are not cash assistance or SSI recipients.Source: HRA Office of Planning and Performance Management (OPPM)
Indicator name: SSI households receiving SNAP benefits (000) Description: As of the end of the reporting period, the total number of eligible SSI households SSI receiving
federally supported Supplemental Nutrition Assistance Program benefits.Source: HRA Office of Planning and Performance Management (OPPM)
Indicator name: Supplemental Nutrition Assistance Program (SNAP) Payment Error Rate (federal fiscal year) (%)Description: This indicator is a New York State reported percent of Supplemental Nutrition Assistance Program
(SNAP) benefit Payment Errors for CA and non-CA SNAP recipients. It shows the percent of incorrect SNAP benefit amounts paid if they are either over or under the correct amount, due to a calculation or documentation error on the part of either the worker or the client. In addition, a payment error can also occur for cases subsequently found to be ineligible for SNAP after having already received SNAP benefits. This indicator is reported for the Federal Fiscal Year: October through September.
Source: HRA Family Independence Administration (FIA)
Indicator name: SNAP application timeliness rate (%) Description: The percent of Supplemental Nutrition Assistance Program Cash Assistance and Non-Cash
Assistance application processing completed by the Agency in the federally required 30-day timeframe.
Source: HRA Family Independence Administration (FIA)
Indicator name: SNAP applications filed electronically (%):Description: The percentage of cases that applied for SNAP benefits through Access HRA out of the total
number of cases that applied for SNAP benefits in the respective month.Source: HRA Office of Planning and Performance Management (OPPM)
Medical Assistance
Indicator name: Total Medicaid enrollees administered by HRA (000)Description: As of the end of the reporting period, the total number of persons enrolled in Medicaid
administered by HRA who also receive cash assistance or SSI, and Medicaid without cash assistance (Medicaid-only). A person can apply for Medicaid administered by HRA if he or she is over 65 years of age or over, need Medicaid because of a disability or blindness, get Medicare and are not a parent or caretaker of minor children or are a former foster care young adult under 26.
Source: WMS report WINR0521 and HealthStat Report
Page 108 | Mayor’s Management Report
Human Resources Administration
Indicator name: Medicaid-only enrollees administered by HRA (000)Description: As of the end of the reporting period, the number of persons who are not recipients of cash
assistance or SSI who receive Medicaid services administered by HRA. As of January 2014, most Medicaid-only eligible clients (Medicaid clients without cash assistance) began to be enrolled in the New York State administered Medicaid program through the State Health Care Exchange. People can apply for Medicaid administered by HRA if he or she is over 65 years of age or older, need Medicaid because of a disability or blindness, get Medicare and are not a parent or caretaker of minor children or are a former foster care young adult under 26.
Source: HealthStat Report
Indicator name: Application timeliness rate for Medicaid administered by HRA (%)Description: Percent of Community and Hospital new applications processed by the Agency within required
timeframes. Source: HRA Medical Insurance and Community Services Administration [Medical Assistance Program
(MAP)]
Employment Services
Indicator name: Clients whom HRA helped obtain employment (000)Description: An unduplicated cumulative count of only those placements for Cash Assistance clients and
non-custodial parents obtained through HRA’s contracted vendors, including Career Services and WeCARE. HRA also counts placements achieved through non-contracted services, such as placements following a client’s engagement in an educational program. Job placements that are self-attained by clients while engaged in HRA programs and services are also counted.
Source: Source of Cash Assistance (CA): HRA New York City WAY (NYCWAY), Welfare Management System (WMS), CA and Non-CA cases matched against State New Hire Placements file, and OPPM.
Source of STEP: HRA’s Payment and Claiming System (PaCS)]
Indicator name: HRA clients who obtained employment, and maintained employment or did not return to CA for 180 days (city fiscal year-to-date average) (%)
Description: The City Fiscal Year to date percent of both those cash assistance cases for which HRA helped a client obtain employment six months (180 days) prior to the reporting period, earned enough income to close their cash assistance cases, and did not return to cash assistance within the last six months (180 days) of the reporting period, and those cash assistance cases for which HRA helped the client obtain employment six months prior to the reporting period, that remained open and were not re-budgeted for CA within 180 days due to the loss of employment income.
Source: HRA NYCWAY, WMS and OPPM
Indicator name: HRA clients who obtained employment, and maintained employment or did not return to CA for 12 months (city fiscal year-to-date average) (%)
Description: The City Fiscal Year-to-date percent of both those cash assistance cases for which HRA helped a client obtain employment 12 months prior to the reporting period where the client earned enough income to close their cash assistance cases and did not return to cash assistance within the last 12 months of the reporting period, and those cash assistance cases for which HRA helped the client obtain employment 12 months prior to the reporting period where the clients cash assistance cases remained open and were not re-budgeted for CA within 12 months due to the loss of employment income.
Source: HRA Office of Planning and Performance Management (OPPM)
Indicator Definitions | Page 109
Human Resources Administration
Indicator Name: Safety Net Assistance (SNA) cases engaged in training or education in accordance with New York City guidelines (%)
Description: The City Fiscal Year-to-date percent of partially or fully engageable (able to work) SNA cases who increase their self-sufficiency by participating in training or education activities that prepare clients to obtain and retain employment. These training/education activities are defined by New York City and may be stand-alone or concurrent job search, substance abuse or other work activities. Education includes high school students over 15 and college students. Under the new Career Services employment contracts, clients are counted for this indicator if they participate in contextualized literacy and/or language programs designed specifically for different types of jobs or if they participate in full or part-time GED programs.
Source: HRA NYCWAY and OPPM
Indicator name: Family cases engaged in training or education in accordance with New York City guidelines (%)Description: The City Fiscal Year-to-date percent of partially or fully engageable (able to work) family cases
who increase their self-sufficiency by participating in training or education activities that prepare clients to obtain and retain employment. (Family cases include the total of those clients who receive TANF and those who receive 60-month Converted to Safety Net.) These training/education activities are defined by New York City and may be stand-alone or concurrent with job search, substance abuse or other work activities. Education includes high school students over 15 and college students. Under the new Career Services employment contracts, clients are counted for this indicator if they participate in contextualized literacy and/or language programs designed specifically for different types of jobs or if they participate in full or part-time GED programs.
Source: HRA NYCWAY and OPPM
Indicator name: Cash Assistance family cases participating in work or work-related activities per federal guidelines (official federal fiscal year-to-date average) (%)
Description: The official Federal Fiscal Year-to-date average percent of Family Assistance Program and 60-month converted to Safety Net Assistance cases who participate in work or work-related activities in compliance with federal guidelines. This indicator reports the most recent available federal data. The official family participation rate is calculated based on the Federal Fiscal Year: October through September.
Source: HRA NYCWAY, WMS and OPPM
Wellness, Comprehensive Assessment, Rehabilitation and Employment (WeCARE)
Indicator name: Total WeCARE recipients Description: As of the end of the reporting period, the unduplicated total of Wellness, Comprehensive
Assessment, Rehabilitation and Employment (WeCARE) recipients. WeCARE provides a continuum of services to help cash assistance clients with medical and/or mental health conditions that affect their employability to attain their maximum levels of self-sufficiency. Individuals referred to WeCARE receive a comprehensive biopsychosocial assessment to identify possible clinical conditions and social barriers that may affect their ability to participate in work-related activities. Based on the results of this assessment, WeCARE contractors determine an individual’s functional capacity, develop a customized service plan, and provide a range of services tailored to meet a client’s needs.
Source: WeCARE Engagement Report
Indicator name: Number of WeCARE federal disability awards (000)Description: The cumulative number, for the reporting period, of HRA clients assisted by the Agency who
obtain federal SSI benefits for the aged, blind, or disabled. As of January 2009, only one award per person is counted: either the award granted for the initial application or the award granted in a subsequent appeal if the initial application was denied.
Source: HRA Payment and Claiming System (PACS)
Page 110 | Mayor’s Management Report
Human Resources Administration
Child Support Services
Indicator name: Total new child support orders obtainedDescription: The cumulative number of new child support orders obtained.Source: New York State Department of Child Support Enforcement, Office of Child Support Enforcement:
157 Report
Indicator name: Total Child Support Cases with active orders (end of period)Description: As of the end of the reporting period, the total number of child support cases with active child
support orders as of the end of the reporting period.Source: New York State Department of Child Support Enforcement, Office of Child Support Enforcement:
157 Report
Indicator name: Child support cases with orders of support (%)Description: The monthly average of cash assistance and non-cash assistance child support cases for which
a support order has been established by a court, as a percent of the total number of open child support cases.
Source: New York State Department of Child Support Enforcement, Office of ChildSupport Enforcement: 157 Report - Performance Measures—SEP
Indicator name: Child support collected ($000,000)Description: The cumulative total amount of child support collected on behalf of both cash assistance and
non-cash assistance clients, including cases where the child resides outside the City and the non-custodial parent resides in the City.
Source: New York State Department of Child Support Enforcement, Office of Child Support Enforcement: Monthly Calendar Year Comparisons of Collections—Total Collections
Indicator name: Support cases with active orders receiving current payments (%)Description: This indicator measures the City Fiscal Year to date percent of child support cases with active
orders (cases with an ongoing obligation) receiving current payments in the month.Source: NYC Office of Child Support Services
Homlessness Prevention Services
Indicator Name: Clients successfully diverted at PATH from entering a homeless shelter (%) Description: Due to interventions at Department of Homeless Services’ Prevention Assistance and Temporary
Housing (PATH) family intake unit, the percent of all clients (families with children) who are diverted from entering a homeless shelter. Efforts are made at PATH to provide prevention assistance that allows families with children to either remain in place or find alternative housing.
Source: Department of Homeless Services’ “Client Assistance and Rehousing Enterprise System” (CARES) database
Indicator name: Adults receiving preventive services who did not enter the shelter system (%) Description: Those adults who adults who received diversion/prevention services and did not enter shelter for
12 continuous months after their initial contact, excluding clients in Safe Havens and Veterans short-term housing.
Source: Department of Homeless Services’ “Client Assistance and Rehousing Enterprise System” (CARES) database
Indicator name: Adult Families receiving preventive services who did not enter the shelter system (%) Description: Those adult families who received diversion/prevention services who were not found eligible for
shelter for 12 continuous months after their initial contact. Source: Department of Homeless Services’ “Client Assistance and Rehousing Enterprise System”
(CARES) database

Indicator Definitions | Page 111
Human Resources Administration
Indicator name: Families with children receiving preventive services who did not enter the shelter system (%) Description: Those families with children who received diversion/prevention services who were not found
eligible for shelter for 12 continuous months after their initial contact. Source: Department of Homeless Services’ “Client Assistance and Rehousing Enterprise System”
(CARES) database
Indicator Name: Rental Assistance Unit Emergency Assistance requests approved (%)Description: Percent of emergency assistance requests at the Rental Assistance Unit that are approved.Source: HRA Housing and Homeless Assistance Services/Initiatives, Rental Assistance Unit
Indicator Name: Requests for Emergency Assistance Rental Assistance Unit Description: The City Fiscal Year cumulative number of request Emergency Rental Assistance. Emergency
benefits provide rental arrears, rent in advance to secure an apartment, security deposits, broker’s/finder’s fee, and back mortgage and taxes.
Source: HRA Housing and Homeless Assistance Services/Initiatives, Rental Assistance Unit
Indicator Name: Low-income cases facing eviction and homelessness who were assisted with legal services in Housing Court.
Description: The cumulative number of low-income households who are facing eviction in Housing Court to whom HRA legal services providers gave either full legal representation or legal assistance.
Source: HRA Office of Civil Justice
Domestic Violence Services
Indicator name: Eligible Families seeking shelter at Prevention Assistance and Temporary Housing (PATH) who entered HRA’s domestic violence shelters (%)
Description: The percentage of families found eligible for domestic violence shelter through the No Violence Again (NoVA) program, housed at the Department of Homeless Services’ Prevention Assistance and Temporary Housing (PATH) center who are placed in an HRA domestic violence shelter.
Source: HRA ODVEIS NoVA Program Reports
Indicator name: Average number of families served per day in the domestic violence shelter program Description: The monthly average of the number of families served per day in emergency domestic violence
shelters that provide temporary and emergency housing and supportive services for victims of domestic violence and their children. All programs provide a safe environment as well as counseling, advocacy and referral services
Source: HRA ODVEIS Shelter Occupancy Referral Tracking System
Indicator name: Number of domestic violence emergency beds (capacity)Description: At the end of the reporting period, the number of domestic violence emergency beds that HRA
administers.Source: HRA Office of Domestic Violence & Emergency Intervention Services (ODVEIS) recorded state
certifications of facilities.
Indicator name: Domestic violence non-residential services programs average monthly caseloadDescription: The number of unique clients who have received non-residential domestic violence services each
month, averaged to determine the City Fiscal Year to date value.Source: Contracted non-residential shelter provider reports
Page 112 | Mayor’s Management Report
Human Resources Administration
Adult Protective Services
Indicator name: Adult Protective Services (APS) assessment casesDescription: The unduplicated number of individuals in the assessment phase for APS services during the
month. The fiscal year to date number is calculated as an average of monthly cases.Source: HRA Adult Protective Services Monthly Compliance Report
Indicator name: Individuals referred to an APS field office visited within three working days (%)Description: The City Fiscal Year-to-date average percent of cases referred to Adult Protective Services (APS)
that are visited within the State-mandated three working days.Source: HRA Adult Protective Services Monthly Compliance Report
Indicator name: APS assessment cases accepted or denied for undercare within State-mandated 60 days (%)Description: Percent of referrals to the borough offices or contracted vendors with a decision made to accept
or deny a case within the State-mandated 60 days.Source: HRA Adult Protective Services Monthly Compliance Report
Indicator name: APS cases eligible for servicesDescription: The unduplicated number of the total cases in APS undercare or Preventive Services Program
during the month. The fiscal year to date number is calculated as an average of monthly cases.Source: HRA Adult Protective Services Monthly Compliance Report
Indicator name: Total referrals received for APS Description: The cumulative number of referrals screened at Central Intake Unit for presumptive eligibility or
referral to other agencies. Source: HRA Adult Protective Services Monthly Compliance Report
Home Care Services
Indicator name: Personal care services - average weekly billable hoursDescription: At the end of the reporting period, the average number of weekly billable hours of service for all
clients receiving personal care services (home attendant and housekeeping). The billable hours indicator measures the number of hours during which service is provided.
Source: HRA Home Care Services Program
Indicator name: Serious personal care complaints resolved in 24 hours (%)Description: Percent of client serious complaints resolved within required timeframe of 24 hours. Vendors
must remove the risk to the client within 24 hours for the complaint to be resolved.Source: HRA MICSA
Indicator name: Average days to initiate home attendant and housekeeper services for all casesDescription: At the end of the reporting period, the average number of days from the date of application to
the commencement of service for all new Home Attendant and Housekeeping cases during the reporting month. All cases with a service start date during the reporting month are included in this measure and include applicants who are currently enrolled in Medicaid and those who have applied for but not begun to receive Medicaid.
Source: HRA Home Care Services Program
Indicator Definitions | Page 113
Human Resources Administration
Indicator name: Cases receiving home care services Description: As of the end of the reporting period, the number of cases receiving Medicaid-funded Home
Attendant and Housekeeping; Long Term Home Health Care; and AIDS Project/AIDS Lombardi Home Care services at the end of the month.
Source: HRA Home Care Services Program
HIV/AIDS Services
Indicator name: New applicants for HIV/AIDS Services Administration (HASA) servicesDescription: The cumulative number of new applicants to HASA services.Source: HRA HIV/AIDS Services Administration (HASA)
Indicator name: Individuals receiving HASA services Description: As of the end of the reporting period, the number of individual clients (individuals who are either
HIV Symptomatic or with AIDS) served during the reporting month.Source: HRA HIV/AIDS Services Administration (HASA)
Indicator name: HASA cases receiving housing assistance (%)Description: The percent of HASA cases who receive on-going monthly supplemental rents in addition to the
basic HASA shelter grant.Source: IPA 705 report generated by HRA/MIS
Indicator name: Average number of days from submission of a completed application to approval or denial of enhanced housing benefits for HASA cases to keep HASA clients in stable housing
Description: At the end of the period, the average number of days to grant or deny HASA housing-related enhanced financial benefits to HASA cases after the completed application is submitted. Benefits are required for clients in HASA cases to secure or maintain housing, including but not limited to rent increases, home furnishings requests, moving and storage expenses.
Source: HRA HIV/AIDS Services Administration Case by Case Financial Assessment database
Indicator name: Average number of days from submission of a completed application to issuance of enhanced housing benefits to HASA cases
Description: The average number of calendar days from submission of a completed application it takes to issue housing-related enhanced financial benefits to HASA cases to enable clients in these cases to secure or maintain housing, including but not limited to rent increases, home furnishings requests, moving and storage expenses.
Source: HRA HIV/AIDS Services Administration Case by Case Financial Assessment database
Agency Management: Recoveries and Cost Avoidance
Indicator name: Medicaid recoveries and cost avoidance for fraud waste & abuse ($000,000)Description: This indicator shows the cumulative amount recovered from concealment of income and
resources by clients, provider audits for waste and abuse, collections from windfalls, personal injury lawsuit settlements and liens on properties and estates, and cost savings from various efforts such as Medicaid prescription drug fraud investigations and clients receiving Medicaid in more than one state. The Medicaid Integrity Investigation Program concluded in January 2014 since most new Medicaid applications began in January 2014 taking place through New York State of Health, the Official Health Plan Marketplace for New York State. As the number of HRA-administered Medicaid recipients has declined, HRA has seen diminished volume through the quarterly Medicaid PARIS match. Therefore, HRA anticipates that going forward the Medicaid cost avoidance values will gradually decline.
Source: HRA Investigations, Revenue & Enforcement Administration

Page 114 | Mayor’s Management Report
Human Resources Administration
Indicator name: Cash Assistance recoveries and cost avoidance for fraud, waste and abuse ($000,000)Description: This indicator shows, pursuant to Cash Assistance eligibility rules, the cumulative amount
recovered from concealment of income and resources by clients, collections from windfalls, lawsuit settlements and liens on properties, repayment of emergency assistance, and federal reimbursement for assistance given while Social Security Disability benefit applications were pending. It also includes, cost savings from various efforts such as fraud investigations, case re-budgeting for income changes, and clients receiving Cash Assistance in more than one state. As of Fiscal Year 2013, HRA changed its method for calculating the Cash Assistance cost avoidance and recoveries indicator by no longer placing a value on reduced budget recommendations from HRA’s Bureau of Eligibility Verification (BEV). HRA’s updated calculation of cost avoidance more accurately reflects the type of recommendations likely to result in savings.
Source: HRA Investigations, Revenue & Enforcement Administration
Indicator name: Supplemental Nutritional Assistance Program (SNAP) cost avoidance for fraud and abuse ($000,000)
Description: This indicator shows the cumulative amount of cost avoidance from client fraud through concealment of income and resources and from clients receiving SNAP benefits in more than one state.
Source: HRA Investigations, Revenue & Enforcement Administration
Agency Management: Fair Hearings
Indicator name: Fair Hearings requestedDescription: The cumulative number of client requests for hearings to contest decisions made by HRA
regarding any benefit programs administered by HRA. For Fiscal Years 2019, 2020 and 2021 HRA adjusted its count of fair hearings requested to be consistent with how these requests are determined by New York State. This adjustment resulted in a slight decrease in the reported monthly number of fair hearings requested compared to previously reported data.
Source: HRA Office of Planning and Performance Management (OPPM)
Indicator name: Fair hearings upheld (%)Description: Starting in Fiscal 2014, HRA changed its method for calculating Fair Hearings outcomes. The
agency win rate includes issues that are affirmed and that are found to be correct at the time they were made and excludes client defaults. Defaults were included as Agency wins in prior periods but are currently excluded because they do not reflect contested issues that are actually heard at hearings. The numerator of this indicator includes all fair hearing issues heard with an outcome of affirmation of the Agency’s decision or correct decision when originally made by the Agency and other outcomes. Other outcomes include, for example, the appellant’s lack of standing. The denominator includes all fair hearing issues heard with all outcomes including affirmation, correct when made, agency withdrawal, settled, reversal and other outcomes. The rate is calculated based on all outcomes on hearings heard, and it does not include defaults in which the client fails to appear, and the hearing is therefore not actually heard.
Source: HRA Office of Planning and Performance Management (OPPM)
Indicator Definitions | Page 115
Human Resources Administration
Agency Management: IDNYC
Indicator name: IDNYC—number of applications processedDescription: The City Fiscal Year to date cumulative number of IDNYC applications processed for eligibility
clients as of the end of the period. The number of cards mailed in each period will not match the number of applications processed due to time required to print and mail cards. IDNYC is a free identification card available to New York City residents. The card helps New Yorkers gain access to City services and buildings. In addition, it offers free membership in the City’s leading museums, zoos, concert halls and botanical gardens.
Source: HRA Office IDNYC
Indicator name: IDNYC—number of cards issuedDescription: This indicator measures the City Fiscal Year to date cumulative number of IDNYC cards mailed.
IDNYC is a free identification card available to New York City residents. The card helps New Yorkers gain access to City services and buildings. In addition, it offers free membership in the City’s leading museums, zoos, concert halls and botanical gardens.
Source: HRA Office IDNYC
Indicator name: IDNYC—application timeliness rate%Description: This indicator measures the City Fiscal Year to date percentage of IDNYC cards that have been
mailed within 14 business days of receiving an application. Source: HRA Office IDNYC
Agency Management: Fair Fares
Indicator name: Fair Fares NYC—total enrollmentDescription: This indicator measures the number of people enrolled in Fair Fares NYC as of June 30th, the
end of the City Fiscal Year reporting period. Launched in January 2019, Fair Fares NYC is a City program to help people who live in New York City with low incomes manage their transportation costs. With the Fair Fares NYC discount, eligible New York City residents receive a 50% discount on subway and eligible bus fares or Access-A-Ride fares.
Source: HRA Office of Planning and Performance Management (OPPM)
Agency Management: Finance Services
Indicator name: Billed revenue as a percentage of budgeted revenue (%)Description: Billed revenue as a percentage of budgeted revenue indicates where HRA is meeting its
projected targeted revenue.Source: HRA DSS Finance Office
Indicator name: Claims filed within 60 days of close of expenditure month (%)Description: The percent of claims filed on a timely basis, since the State and Federal funding of major HRA
programs and the timing of future advances relies on such filing.Source: HRA DSS Finance Office
Indicator name: Calls resolved within 48 hours to the Finance customer service call line for employment vendors (%)
Description: Percent of calls made by employment vendors to the HRA DSS Finance Office Customer Service Call Line that are resolved.
Source: HRA DSS Finance Office
Page 116 | Mayor’s Management Report
Human Resources Administration
Agency Management: Employee Safety
Indicator name: Collisions involving city vehiclesDescription: The cumulative number of state reports, MV-104, filed. These reports are required whenever an
accident occurs that involves death, personal injury or property damage, including damage done to city vehicles while they were parked with no HRA employee in the car.
Source: HRA Fleet Administration
Indicator name: Workplace injuries reportedDescription: The cumulative number of all incidents resulting in a workers’ compensation or line of duty injury
claim regardless of whether time is lost.Source: DSS Office of Human Resources Solutions
Agency Management: Immigration Services
Indicator Name: Applications filed with the United States Citizenship and Immigration Services Description: The cumulative number of applications for permanent residence, citizenship, asylum, or other
special immigration status that HRA funded community-based organizations helped file with the United States Citizenship and Immigration Services (USCIS). Other special immigration status applications can include U or T visas, Special Immigrant Juvenile Status (SIJS), DACA and immigration relief under VAWA or the VTVPA.
Source: HRA Office of Civil Justice
Indicator Definitions | Page 117
Administration for Children’s Services
Indicator name: Number of State Central Register Consolidated InvestigationsDescription: Excludes those reports that have been consolidated according to the new Office of Children and
Family Services procedure, which went into effect in January 2004, that requires local districts to consolidate certain reports based on a set of identified criteria
Source: Division of Policy & Planning Indicator name: Abuse and/or neglect reports responded to within 24 hours of receipt from State Central Registry
(%)Description: The percent of child abuse/neglect investigations initiated within 24 hours of oral report to the
State Central Registry, as monitored internally by ACS. Source: ACS Office of Management Development and Research. Indicator name: Investigations that found credible evidence of abuse or neglect (%)Description: The percent of child abuse/neglect reports that have credible evidence of abuse or neglect,
determined upon investigation.Source: CONNECTIONS database maintained by ACS Management Information Systems Unit. Indicator name: Children in complete investigations with repeat investigations within a year (%)Description: The percent of children who were named as alleged victims in an investigation, who were
then named as alleged victims in another investigation within a year of the closing of the first investigation. Figures are provided for the fiscal year of the repeat investigation.
Source: CONNECTIONS database maintained by ACS Management Information Systems Unit. Indicator name: Children in investigations that found credible evidence of abuse or neglect with repeat
investigations that also found credible evidence within a year (%)(preliminary)Description: The percent of children who were named as alleged victims in an investigation that found
credible evidence of abuse or neglect, who were then named as alleged victims in another investigation that found credible evidence of abuse or neglect within a year of the closing of the first investigation. Figures are provided for the fiscal year of the repeat investigation.
Source: CONNECTIONS database maintained by ACS Management Information Systems Unit. Indicator name: Average child protective specialist caseloadDescription: Total number of cases carried on the last day of the month divided by the total number of
Diagnostic Child Protective Specialists and Supervisors (Sup I) on the last day of the month.Source: Division of Policy & Planning
Indicator name: Families entering child welfare preventive services Description: Total number of Families entering child welfare preventive services during the month. Source: ACS Office of Management, Development and Research.
Indicator name: Families entering child welfare specialized teen preventive servicesDescription: The number of new child welfare specialized teen preventive service cases.Source: PROMIS data extracts maintained by ACS Office of Information Technology
Indicator name: Children receiving child welfare preventive services (daily average)Description: The daily average number of children in active child welfare preventive cases at the end of the
month. Source: ACS Office of Management, Development and Research. Indicator name: Children who received contract preventive services during the year (annual total)Description: The cumulative number of unique children in families that received contract preventive services
during the fiscal year.Source: PROMIS data extracts maintained by ACS Office of Information Technology
Page 118 | Mayor’s Management Report
Administration for Children’s Services
Indicator name: All children entering foster careDescription: The number of children entering foster care. Includes children with repeat admissions into foster
care.Source: Child Care Review Service (CCRS) data extracts maintained by ACS Management Information
Systems UnitIndicator name: Children placed in foster care in their communityDescription: The percent of children placed in regular foster boarding homes in their home community district
or in a community district adjacent to their home community district.Source: Child Care Review Service (CCRS) and CONNECTIONS maintained by ACS Management
Information Systems Unit. Indicator name: Children in foster care (average)Description: The average number of children in foster care during the reporting period, excluding suspended
payment and trial discharge, in all facilities and homes operated by contract foster care agencies or by ACS Direct Care Services. Excludes young people in juvenile delinquency placements.
Source: ACS Office of Management, Development and Research.
Indicator name: Children in foster kinship homes (average)Description: The average number of children in foster kinship homes during the reporting period, excluding
suspended payment and trial discharge, in all homes operated by contract foster care agencies or by ACS Direct Care Services. Excludes young people in juvenile delinquency placements.
Source: ACS Office of Research and Evaluation. Indicator name: Children in nonrelative foster homes (average)Description: The average number of children in nonrelative foster homes during the reporting period, excluding
suspended payment and trial discharge, in all homes operated by contract foster care agencies or by ACS Direct Care Services. Excludes young people in juvenile delinquency placements.
Source: ACS Office of Research and Evaluation. Indicator name: Children in residential care (average)Description: The average number of children in congregate care during the reporting period, excluding
suspended payment and trial discharge, in all facilities operated by contract foster care agencies or by ACS Direct Care Services. Excludes young people in juvenile delinquency placements.
Source: ACS Office of Research and Evaluation. Indicator name: Children who re-enter foster care within a year of discharge to family (%)Description: The percent of foster care children who are discharged to their family, either through reunification
or the Kinship Guardianship Assistance Program, who re-enter foster care within a year of their discharge date. Percentages are provided for discharges in the prior Fiscal Year.
Source: ACS Management Information Systems Unit. Indicator name: School Attendance Rate - Children in Foster Care (%)Description: For children in foster care during the entire month who are enrolled in New York City public
schools, the percent of school days children attended school.Source: ACS Management Information Systems Unit.
Indicator name: Total days all children spent in foster careDescription: The days children spent in foster care.Source: Connections data extracts maintained by ACS Office of Information Technology
Indicator Definitions | Page 119
Administration for Children’s Services
Indicator name: Number of moves in foster care per 1,000 care daysDescription: The number of moves from one foster care placement to another per 1,000 care days.
Calculation: (the total number of moves from one foster care placement to another/total days in period)*1,000
Source: Connections data extracts maintained by ACS Office of Information Technology
Indicator name: Children maltreated during family foster care placement per 100,000 care daysDescription: The number of children with substantiated abuse or neglect by a foster parent while in family
foster care per 100,000 care days. Calculation: =(children with substantiated allegations of abuse or neglect by foster parent while in foster care during period / total number of care days in period) *100,000
Source: Connections data extracts maintained by ACS Office of Information TechnologyIndicator name: Siblings placed simultaneously in the same foster home (%)Description: The percent of siblings in foster care who are placed simultaneously, when no other siblings are
in care, in the same foster home.Source: ACS Management Information Systems Unit. Indicator name: Children entering foster care who are placed with relatives (%)Description: The percent of children entering foster care who are placed in foster boarding homes with
relatives.Source: ACS Management Information Systems Unit. Indicator name: Children discharged to permanency within a year of placement (%)Description: The percent of children who entered care in the fiscal year who were discharged to permanency
(parent(s), Kinship Guardian Assistance, adoption) within one year of placement.Source: Connections data extracts maintained by ACS Office of Information Technology
Indicator name: Children in care 12–23 months discharged to permanency (%)Description: The percent of children in care 12–23 months at the beginning of the fiscal year who were
discharged to permanency (parent(s), Kinship Guardian Assistance, adoption) during the fiscal year.
Source: Connections data extracts maintained by ACS Office of Information Technology
Indicator name: Children in care 24 or more months discharged to permanency (%)Description: The percent of children in care 24 or more months at the beginning of the fiscal year who were
discharged to permanency (parent(s), Kinship Guardian Assistance, adoption) during the fiscal year.
Source: Connections data extracts maintained by ACS Office of Information Technology
Indicator name: Children adoptedDescription: The number of children with a finalized adoption through either Contract Agency Service
Adoptions or ACS Direct Care Adoptions. Finalization requires a court form to verify the child’s identity and date of adoption.
Source: ACS Office of Adoption Services.Indicator name: Children eligible for adoption (average)Description: The average number of children freed for adoption at the end of the Fiscal Year, as monitored
internally by ACS. The number includes those in adoptive placement and those also freed and not in adoptive homes.
Source: ACS Office of Family Permanency

Page 120 | Mayor’s Management Report
Administration for Children’s Services
Indicator name: Kinship Guardianship Assistance dischargesDescription: The number of children discharged from foster care to Kinship Guardianship . The Kinship
Guardianship Assistance Program (KinGAP) is designed for a foster child to achieve a permanent placement with a relative who had been the child’s foster parent. This program provides financial support and in most cases medical coverage for the child.
Source: ACS Division of Policy Planning and Measurement
Indicator name: Children returned to parent(s) (reunifications)Description: The number of children discharged from foster care to their parent(s).Source: Connections data extracts maintained by ACS Office of Information Technology
Indicator name: Average child care voucher enrollmentDescription: Average number of children accessing early care and education services through use of a
voucher, both cash assistance and low-income.Source: ACS Division of Early Care & Education
Indicator name: Average mandated children voucher enrollmentDescription: Average number of children accessing early care and education services through use of a
voucher as part of their cash assistance benefits.Source: ACS Division of Early Care & Education
Indicator name: Average other eligible children voucher enrollmentDescription: Average number of children accessing early care and education services through use of a low-
income voucher.Source: ACS Division of Early Care & Education
Indicator name: Average center-based child care voucher enrollmentDescription: Average number of children accessing child care services through a mandated (cash assistance)
or low-income voucher at a center-based program.Source: ACS Division of Early Care & Education
Indicator name: Average family child care voucher enrollmentDescription: Average number of children accessing child care services through a mandated (cash assistance)
or low-income voucher at a home-based registered/licensed program.Source: ACS Division of Early Care & Education
Indicator name: Average informal (home-based) voucher enrollmentDescription: Average number of children accessing child care services through a mandated (cash assistance)
or low-income voucher with a home-based program.Source: ACS Division of Early Care & Education
Indicator name: Fiscal year spending per child—Center-based child care vouchersDescription: Fiscal year spending per child—Center-based child care vouchers.Source: ACS Division of Early Care & Education
Indicator name: Fiscal year spending per child—Family child care vouchersDescription: Fiscal year spending per child—Family child care vouchersSource: ACS Division of Early Care & Education
Indicator name: Fiscal year spending per child—Legally exempt (informal child care) vouchersDescription: Fiscal year spending per child—Legally exempt (informal child care) vouchersSource: ACS Division of Early Care & Education
Indicator Definitions | Page 121
Administration for Children’s Services
Indicator name: Abuse and/or neglect reports for children in child careDescription: The number of abuse or neglect reports for children in ACS funded child care which are
investigated by the Office of Confidential Investigations (OCI), a division of ACS/Division of Child Protection.
Source: CONNECTIONS database maintained by ACS Management Information Systems Unit and OCI. Indicator name: Investigations for children in care that found credible evidence of abuse or neglect (%)Description: The percent of abuse and/or neglect reports for children in ACS funded child care that are
determined upon investigation by the Office of Special Investigations (OSI) to have credible evidence of abuse or neglect.
Source: CONNECTIONS database maintained by ACS Management Information Systems Unit and OSI. Indicator name: Total Admissions to detentionDescription: The total number of admissions to detention.Source: Comprehensive Justice Information System (CJIS). Indicator name: Average Daily Population (ADP), detentionDescription: The number of youth in custody on an average day during the reporting period.Source: Comprehensive Justice Information System (CJIS).
Indicator name: Secure detention - ADPDescription: The number of youth in secure detention custody on an average day during the reporting period.Source: Comprehensive Justice Information System (CJIS).
Indicator name: Non-secure detention - ADPDescription: The number of youth in non-secure custody on an average day during the reporting period.Source: Comprehensive Justice Information System (CJIS).
Indicator name: Average Length of Stay, detention (days)Description: The average number of days between the admission date and release date of all youth released
from either secure detention or non-secure detention. Source: Comprehensive Justice Information System (CJIS).
Indicator name: Escapes in secure detentionDescription: The number of youth who escape from a secure detention facility, court-related services, or
medical/mental health service while in the custody of secure detention staff.Source: Incident Database.
Indicator name: Abscond rate in non-secure detention (Average per 100 Total ADP in non-secure)Description: The number of youth who abscond from a non-secure group home, field site, court-related
service, or medical/mental health service while in the custody of non-secure detention staff. Calculated as the average number of instances per days in the reporting period, per 100 Average Daily Population in non-secure system during the reporting period.
Source: Incident Database.
Indicator name: Youth-on-youth assaults/altercations with injury (per 100 total ADP), detentionDescription: The number of reported instances of assaults and altercations between youth resulting in physical
injury requiring medical attention. Calculated as the average number of instances per days in the reporting period, per 100 average Daily Population during the reporting period
Source: Incident Database.
Page 122 | Mayor’s Management Report
Administration for Children’s Services
Indicator name: Youth on Staff Assault w/injury Rate (Average per 100 Total ADP), detentionDescription: The number of reported instances of assaults and altercations on staff resulting in a physical
injury. Calculated as the average number of instances per days in the reporting period, per 100 Average Daily Population during the reporting period.
Source: Incident Database. Indicator name: Weapon Recovery Rate (Average per 100 Total ADP), detentionDescription: The number of instances in which weapons were found. Calculated as the average number of
instances per days in the reporting period, per 100 Average Daily Population during the reporting period.
Source: Incident Database.
Indicator name: Illegal substance/prescription or OTC medication recovery rate (average per 100 total ADP), detention
Description: The number of instances in which Illegal substance/prescription or OTC medication were found. Calculated as the average number of instances per days in the reporting period, per 100 Average Daily Population during the reporting period.
Source: Incident Database. Indicator name: Child abuse and/or neglect allegation cases with credible evidence of abuse and/or neglect, rate
(average per 100 total ADP), detentionDescription: The rate per 100 average daily population of child abuse/neglect allegations against ACS and
contracted-staff regarding youth in detention where credible evidence of abuse and/or neglect was found as reported to ACS by the NYS Justice Center during the reporting period.
Source: NYS Justice Center Indicator name: Average daily cost per juvenile in detention ($)Description: The average daily dollar value of all secure and non-secure detention costs (including staff
salaries and fringe benefits, contracts and indirect costs) divided by the average daily population.Source: Financial Management System. Indicator name: Admissions to Close to Home placementDescription: Number of admissions to Close to Home placement.Source: ACS Division of Youth and Family Justice Indicator name: Number in Close to Home placementDescription: Number of young people in Close to Home placement.Source: ACS Division of Youth and Family Justice Indicator name: AWOL rate, Close to Home placementDescription: Number AWOLs from close to Home placement per 100 care days.Source: Incident Database Indicator name: Discharges from Close to Home placement (dispositional order complete)Description: Number of young people discharged from Close to Home placement with complete dispositional
orders.Source: ACS Division of Youth and Family Justice
Indicator name: Youth on staff assault with injury rate, Close to home placementDescription: Number of youth on staff assaults with injury in Close to Home placement per 100 care days.Source: Incident Database
Indicator Definitions | Page 123
Administration for Children’s Services
Indicator name: Youth on youth assault with injury rate, Close to home placementDescription: Number of youth on youth assaults and altercations with injury in Close to Home placement per
100 care days.Source: Incident Database Indicator name: Youth who received mental health screening or services while in detention (%)Description: The percent of youth in detention for at least three days during a month who received mental
health services during that month. Services include: screening, intake interview, treatment planning, crisis intervention, and supportive counseling including cognitive behavioral treatment in individual, group and family modalities. Youth in non-secure detention can receive all services on-site at Passages Academy.
Source: Mental Health service provider tracking; CJIS database before May 2019 and JDAS database beginning May 2019.
Indicator name: Residents seen within 24 hours of Sick Call Report (%)Description: The percent of residents who were seen by medical staff within 24 hours of submitting a sick call
request.Source: Medical Service Contractor. Indicator name: General healthcare cost per youth per day ($), detentionDescription: The average daily dollar value of all medical and mental health care contracts, related counseling
staff (including salaries and fringe benefits), and indirect costs, divided by the average daily population.
Source: Financial Management System.
Indicator name: Youth with previous admission(s) to detention (%)Description: The percent of youth admitted to DJJ custody during the reporting period with at least one prior
admission to DJJ, ever. This is not a recidivism or “within the same reporting period” readmission rate.
Source: Comprehensive Justice Information System (CJIS).
Indicator name: Number of releases to Close to Home aftercareDescription: Number of young people released from non-secure placement to Close to Home aftercare.Source: ACS Division of Youth and Family Justice Indicator name: Number in Close to Home aftercareDescription: Number of young people in Close to Home aftercare upon release from non-secure placement.Source: ACS Division of Youth and Family Justice
Indicator name: Collisions involving city vehiclesDescription: Number of ACS-vehicle involved collision reports involving injury or property damage for the ACS
fleet. New York State MV-104 reports are required whenever a collision occurs involving death, or other personal injury, or property damage.
Source: Fleet Administration
Indicator name: Workplace injuries reportedDescription: All incidents resulting in a workers’ compensation or line of duty injury claim regardless of whether
or not time is lost.Source: New York City Law Department

Page 124 | Mayor’s Management Report
Administration for Children’s Services
Indicator Definitions | Page 125
Department of Homeless Services
Indicator name: Single adults entering the DHS shelter services systemDescription: Single adults entering the DHS shelter services system for the first time or returning after a period
of at least one year, excluding clients in Safe Havens and Veterans short-term housing.Source: DHS Client Assistance and Rehousing Enterprise System (CARES) Database.
Indicator name: Adult families entering the DHS shelter services system Description: Adult families determined to be eligible for shelter.Source: DHS CARES Database.
Indicator name: Families with children entering the DHS shelter services system Description: Families with children determined to be eligible for shelter.Source: DHS CARES Database.
Indicator name: Average number of adult families in shelters per dayDescription: The average daily census of adult families in shelter at noon for the month. Does not include
families that may not yet be assigned or are in transition to shelter at noon and those placed in overnight facilities.
Source: DHS CARES Database.
Indicator name: Average number of single adults in shelters per dayDescription: The average number of single adults residing in shelter each morning at 3:00 A.M. Source: DHS CARES Database.
Indicator name: Average number of families with children in shelters per dayDescription: The average daily census of families with children in shelter at noon for the month. Does not
include families that may not yet be assigned or are in transition to shelter at noon and those placed in overnight facilities.
Source: DHS CARES Database.
Indicator Name: Families with children receiving public assistance (average) (%).Description: The percentage of families with children who have been determined eligible for shelter and are
currently receiving public assistance.Source: DHS CARES Database and Welfare Management System (WMS) Database.
Indicator name: Average school attendance rate for children in the DHS shelter services system (%)Description: The rate of actual attendance per number of school days per month, based on total number of
school-aged children who have attendance/registration records.Source: DHS CARES Database and DOE ATS.
Indicator name: Families placed in the shelter services system according to their youngest school-aged child’s school address (%)
Description: The percent of families provided with shelter that have identified their youngest school-aged child’s school and were placed in the facility closest to that school.
Source: DHS CARES Database.
Indicator name: Families living in shelter who received biopsychosocial screenings from mental health clinicians (%)Description: Total number of families, with over 30 days in shelter on the 1st of the month, screened for
behavioral health (mental health and/or substance use) needs in the current Fiscal YearSource: DHS
Page 126 | Mayor’s Management Report
Department of Homeless Services
Indicator name: Families in shelter living in the borough of their youngest child’s school (%)Description: The average percentage of non-DV families in shelter during the school year with school-aged
children residing in the same borough as their youngest child’s school. Borough residence is based on the shelter address the families are residing in on the last day of each month. Borough of school enrollment is based on DOE data for all children enrolled in NYC public school.
Source: DHS CARES Database and DOE ATS.
Indicator name: Adult shelter inspections with safety, maintenance or cleanliness deficiencies per 1,000 bedsDescription: Total number of inspections with safety, maintenance or cleanliness deficiencies, per 1000 beds,
noted in inspections carried out by a court appointed inspection team to ensure shelters meet court-mandated standards. Inspections take place in adult shelters semi-annually.
Source: DHS Facilities Maintenance and Development.
Indicator name: Serious incidents in the Adult Shelter system, per 1,000 residentsDescription: The number of serious incidents during the reporting year, per 1,000 residents in the adult shelter
system. Serious incidents are those that affect the well-being of shelter residents or staff. They include both onsite incidents at the shelter as well as notification of offsite incidents involving shelter residents. All serious incidents are reported to the New York State Office of Temporary and Disability Assistance (OTDA).
Source: DHS CARES Database.
Indicator name: Serious violent incidents in the adult shelter system, per 1,000 ResidentsDescription: The number of violent serious incidents during the reporting year, per 1,000 residents in the adult
shelter system. Violent serious incidents are a subset of serious incidents that affect the safety of shelter residents or staff and are reported to the New York State Office of Temporary and
Disability Assistance (OTDA).Source: DHS CARES Database.
Indicator name: Serious incidents in the adult family shelter system, per 1,000 ResidentsDescription: The number of serious incidents during the reporting year, per 1,000 residents in the adult family
shelter system. Serious incidents are those that affect the well-being of shelter residents or staff. They include both onsite incidents at the shelter as well as notification of offsite incidents
involving shelter residents. All serious incidents are reported to the New York State Office of Temporary and Disability Assistance (OTDA).
Source: DHS CARES Database.
Indicator name: Serious violent incidents in the adult family shelter system, per 1,000 ResidentsDescription: The number of violent serious incidents during the reporting year, per 1,000 residents in the adult
family shelter system. Violent serious incidents are a subset of serious incidents that affect the safety of shelter residents or staff and are reported to the New York State Office of Temporary and Disability Assistance (OTDA).
Source: DHS CARES Database.
Indicator name: Serious incidents in the Families with Children Shelter system, per 1,000 Residents Description: The number of serious incidents during the reporting year, per 1,000 residents in the family with children shelter system. Serious incidents are those that affect the well-being of shelter residents
or staff. They include both onsite incidents at the shelter as well as notification of offsite incidents involving shelter residents. All serious incidents are reported to the New York State Office of Temporary and Disability Assistance (OTDA).
Source: DHS CARES Database.
Indicator Definitions | Page 127
Department of Homeless Services
Indicator name: Serious violent incidents in the families with children shelter system, per 1,000 ResidentsDescription: The number of violent serious incidents during the reporting year, per 1,000 residents in the
family w/children shelter system. Violent serious incidents are a subset of serious incidents that affect the safety of shelter residents or staff and are reported to the New York State Office of Temporary and Disability Assistance (OTDA).
Source: DHS CARES Database.
Indicator name: Cost per day for shelter facilities Single adult facilities ($) (annual) Family facilities ($) (annual) Adult families Families with childrenDescription: The daily cost (per diem) per person or family for privately run facilities, including Tier IIs, hotels,
and cluster facilities, providing overnight shelter to homeless single adults or families. It is the average cost for all units occupied at a given point in time.
Source: DHS Budget Office.
Indicator name: Single adults exiting to permanent housing placementDescription: The number of single adults relocated to permanent housing from shelters, including both
subsidized and unsubsidized permanent housing placements, excluding clients in Safe Havens and Veterans short-term housing. A placement is considered if a client remains out of shelter for 30 days.
Source: DHS CARES Database.
Indicator name: Single adults exiting to permanent housing placement—subsidizedDescription: The number of single adults relocated to subsidized permanent housing from shelters, excluding
clients in Safe Havens and Veterans short-term housing. A placement is considered if a client remains out of shelter for 30 days.
Source: DHS CARES Database.
Indicator name: Single adults exiting to permanent housing placement—unsubsidizedDescription: The number of single adults relocated to unsubsidized permanent housing from shelters,
excluding clients in Safe Havens and Veterans short-term housing. A placement is considered if a client remains out of shelter for 30 days.
Source: DHS CARES Database.
Indicator name: Adult families exiting to permanent housing placementDescription: The number of adult families relocated to permanent housing from shelters, including both
subsidized and unsubsidized permanent housing placements. A placement is considered if a family remains out of shelter for 30 days.
Source: DHS CARES Database.
Indicator name: Adult families exiting to permanent housing—subsidizedDescription: The number of adult families relocated to subsidized permanent housing from shelters. A
placement is considered if a family remains out of shelter for 30 days.Source: DHS CARES Database.
Indicator name: Adult families exiting to permanent housing placement—unsubsidizedDescription: The number of adult families relocated to unsubsidized permanent housing from shelters. A
placement is considered if a family remains out of shelter for 30 days.Source: DHS CARES Database.
Page 128 | Mayor’s Management Report
Department of Homeless Services
Indicator name: Families with children exiting to permanent housing placementDescription: The number of Families with children relocated to permanent housing from shelters, including
both subsidized and unsubsidized permanent housing placements. A placement is considered if a family remains out of shelter for 30 days.
Source: DHS CARES Database. Indicator name: Families with children exiting to permanent housing—subsidizedDescription: The number of families with children relocated to subsidized permanent housing from shelters. A
placement is considered if a family remains out of shelter for 30 days.Source: DHS CARES Database.
Indicator name: Families with children exiting to permanent housing placement—unsubsidizedDescription: The number of families with children relocated to unsubsidized permanent housing from shelters.
A placement is considered if a family remains out of shelter for 30 days.Source: DHS CARES Database
Indicator name: Average length of stay for single adults in shelter (days)Description: The average number of days an adult has spent in the DHS shelter services system during the
reporting period. Includes non-consecutive days spent in shelters, excluding clients in Safe Havens and Veterans short-term housing.
Source: DHS CARES Database.
Indicator name: Average length of stay for adult families in shelter (days)Description: The average number of days adult families spend in shelter, excluding overnight facilities, from
their first date of application. Families who leave the DHS shelter system for more than 30 days are considered new applicants.
Source: DHS CARES Database.
Indicator name: Average length of stay for families with children in shelter (days)Description: The average number of days families with children spend in shelter, excluding overnight facilities,
from their first date of application. Families who leave the DHS shelter system for more than 30 days are considered new applicants.
Source: DHS CARES Database.
Indicator name: Single adults who exited to permanent housing and returned to the DHS shelter services system within one year (%)
Description: The percent of those single adults, excluding clients in Safe Havens and Veterans short-term housing, placed into permanent housing in the prior fiscal year who returned to the DHS shelter services system within one year. To be considered, the client must remain out of shelter following placement for 30 days.
Source: DHS CARES Database.
Indicator name: Single adults who exited to permanent housing and returned to the DHS shelter services system within one year (%)—subsidized
Description: The percent of those single adults, excluding clients in Safe Havens and Veterans short-term housing, placed into subsidized permanent housing in the prior fiscal year who returned to the DHS shelter services system within one year. To be considered, the client must remain out of shelter following placement for 30 days.
Source: DHS CARES Database.

Indicator Definitions | Page 129
Department of Homeless Services
Indicator name: Single adults who exited to permanent housing and returned to the DHS shelter services system within one year (%)—unsubsidized
Description: The percent of those single adults, excluding clients in Safe Havens and Veterans short-term housing, placed into unsubsidized permanent housing in the prior fiscal year who returned to the DHS shelter services system within one year. To be considered, the client must remain out of shelter following placement for 30 days.
Source: DHS CARES Database.
Indicator name: Adult families who exited to permanent housing and returned to the DHS shelter services system within one year (%)
Description: The percent of those adult families placed into permanent housing in the prior fiscal year who returned to the DHS shelter services system within one year. To be considered, the family must remain out of shelter following placement for 30 days.
Source: DHS CARES Database.
Indicator name: Adult families who exited to permanent housing and returned to the DHS shelter services system within one year (%)—subsidized
Description: The percent of those adult families placed into subsidized permanent housing in the prior fiscal year who returned to the DHS shelter services system within one year. To be considered, the family must remain out of shelter following placement for 30 days.
Source: DHS CARES Database.
Indicator name: Adult families who exited to permanent housing and returned to the DHS shelter services system within one year (%)—unsubsidized
Description: The percent of those adult families placed into unsubsidized permanent housing in the prior fiscal year who returned to the DHS shelter services system within one year. To be considered, the family must remain out of shelter following placement for 30 days.
Source: DHS CARES Database.
Indicator name: Families with children who exited to permanent housing and returned to the DHS shelter services system within one year (%)
Description: The percent of those families with children placed into permanent housing in the prior fiscal year who returned to the DHS shelter services system within one year. .To be considered, the family must remain out of shelter following placement for 30 days.
Source: DHS CARES Database.
Indicator name: Families with children who exited to permanent housing and returned to the DHS shelter services system within one year (%)—subsidized
Description: The percent of those families with children placed into subsidized permanent housing in the prior fiscal year who returned to the DHS shelter services system within one year. To be considered, the family must remain out of shelter following placement for 30 days.
Source: DHS CARES Database. Indicator name: Families with children who exited to permanent housing and returned to the DHS shelter services
system within one year (%)—unsubsidizedDescription: The percent of those families with children placed into unsubsidized permanent housing in
the prior fiscal year who returned to the DHS shelter services system within one year. To be considered, the family must remain out of shelter following placement for 30 days.
Source: DHS CARES Database.
Page 130 | Mayor’s Management Report
Department of Homeless Services
Indicator name: Unsheltered individuals that are estimated to be living on the streets, in parks, under highways, on subways, and in the public transportation stations in New York City (HOPE)
Description: This indicator reports the results of the agency’s annual Homeless Outreach Population Estimate, held from midnight—4AM on the last Monday in January. Teams of volunteers are assigned to small study areas where they administer a survey to all passersby to determine their housing situation.
Source: Homeless Outreach Population Estimate Findings.
Indicator name: HOME-STAT clients referred to placement into permanent housing, transitional housing and other settings
Description: This indicator reflects the number of unduplicated HOME-STAT clients who were placed at any time during the year into the following settings: Permanent housing includes supportive housing, public housing, independent living, adult home/nursing home, mental health community residence, family reunification, Veterans Affairs Supportive Housing, and other permanent housing settings. Transitional housing includes safe havens, stabilization beds, shelters, and other transitional housing settings. Settings other than transitional or permanent housing include drop-in centers, detox centers, hospitals, or intake facilities.
Source: StreetSmart.
Indicator name: Collisions involving city vehiclesDescription: Number of DHS-vehicle involved collision reports involving injury or property damage for the DHS
fleet. New York State MV-104 reports are required whenever a collision occurs involving death, or other personal injury, or property damage.
Source: DHS Fleet Administration.
Indicator name: Workplace injuries reportedDescription: All incidents resulting in a workers’ compensation or line of duty injury claim regardless of whether
or not time is lost.Source: DSS Office of Human Resources Solutions.
Indicator Definitions | Page 131
Department for the Aging
Indicator name: Congregate meals servedDescription: Total number of meals (Includes breakfast and lunch) served at DFTA-funded senior centers.Source: DFTA Planning Division
Indicator name: Average daily attendance at senior centersDescription: The average daily attendance at senior centersSource: DFTA Planning Division
Indicator name: Senior Center Services Utilization Rate (%)Description: The Senior Center Service Utilization indicator is a measure which divides the total units of ser-
vice that a center has provided in each of these three categories by the planned number of units in each of three categories of service. The service categories are case assistance to clients need-ing help with issues ranging from mental health issues to benefits applications; health promo-tions, which are evidence-based and other activities that promote health and well-being, ranging from falls prevention classes to chronic disease self-management; and recreation and education classes that extend from computer classes to nutrition education.
Source: DFTA Financials Indicator name: Persons who participated in senior center mealsDescription: The unduplicated number of older New Yorkers who ate breakfast, lunch, dinner, and/or a week-
end meal at a senior center.Source: Senior Tracking, Analysis and Reporting System (STARS)
Indicator name: Individuals at DFTA senior centers receiving mental health servicesDescription: The unduplicated number of older New Yorkers who received mental health services at a senior
center.Source: Senior Tracking, Analysis and Reporting System (STARS) Indicator name: Persons who received information and/or supportive services through DFTA’s in-house and con-
tracted Caregiver programsDescription: The number of caregivers who receive counseling, information, respite and/or assistance with
entitlements, benefits, or other aging services from DFTA’s Alzheimer’s and Caregivers Resource Center, Grandparent Resource Center, and/or contracted providers.
Source: DFTA Planning Division
Indicator name: Home delivered meals servedDescription: Total number of home delivered meals provided by DFTA-funded programs. Source: DFTA Planning Division
Indicator name: Recipients of home delivered meals (PMMR and MMR)Description: The number of persons who receive a home delivered meal from a DFTA-funded home delivery
vendor during the reporting period. Eligibility: Older New Yorkers age 60+; unable to attend a congregate meals site unattended; unable to prepare meals due to at least one of the following: incapacity due to accident, illness or physical or mental frailty; Lack of cooking facility, such as refrigerator or stove; Inability to shop or cook for self; Inability to safely prepare meals; Lack of knowledge or skills on how to prepare meals; Lacks formal or informal supports who can regularly provide meals; Is able to live safely at home if services are provided. Note: When it is in the best interest of the older person receiving a DFTA-funded home delivered meals, meals may also be provided to: (1) the client’s spouse or domestic partner, regardless of age or physical condition, and (2) a disabled individual(s) under 60 years of age living in the same household as the client..
Source: DFTA BFS and/or PRET
Page 132 | Mayor’s Management Report
Department for the Aging
Indicator name: Hours of home care services provided (PMMR and MMR)Description: The number of hours of contracted in-home care services, including homemaker/personal care
and housekeeping/chore services, provided to frail seniors by DFTA contractors. Source: DFTA Planning Division Indicator name: Total recipients of home care services Description: Total number of senior citizens receiving DFTA-funded personal care and housekeeping services
during the fiscal year.Source: DFTA Planning Division
Indicator name: Hours of case management services provided Description: Total number of hours of DFTA-funded case management services delivered.Source: DFTA Planning Division
Indicator name: Total recipients of case management services Description: Total number of senior citizens receiving DFTA-funded case management services during the fis-
cal year.Source: DFTA Planning Division

Building Human Potential

Building Human Potential
Department of Education p 135
School Construction Authority p 147
Department of Youth and Community Development p 149
Public Libraries p 155
Department of Small Business Services p 163
City University of New York p 157
Department of Veterans’ Services p 167

Indicator Definitions | Page 135
Department of Education
Indicator name: Student enrollment as of October 31 in grades pre-kindergarten to 12 (000)Description: The number of students on the October 31st audited register, not including charter school
students, for a given school year. By February DOE completes an audit of schools to verify October 31st enrollment data.
Source: Automate the School system. Indicator name: Student Enrollment as of October 31 in full-day pre-kindergartenDescription: The number of pre-kindergarten students on the October 31st audited register, not including
charter school students, for a given school year. By February DOE completes an audit of schools to verify October 31st enrollment data.
Source: Automate the School system.
Indicator name: Average daily attendance (%) - Elementary/middle (%) - High school (%)Description: The percentage of students present as calculated by the number of students present divided by
the number of students present and absent, not including charter school students, for each school day. Includes District 75. Elementary/middle and high school breakouts are calculated by grade level.
Source: Automate the School system.
Indicator name: Students with 90% or better attendance rate (%)Description: The percentage of students whose attendance rate for the year is 90% or better, as calculated
by the number of students with an attendance rate of 90% or more divided by the number of students on register, not including charter school students. . Includes District 75.
Source: Automate the School system. Indicator name: Students in grades 3 to 8 meeting or exceeding standards - English Language Arts (%)Description: The percent of general and special education students who meet the learning standard in English
Language Arts (ELA) for their grade by performing at Level 3 (Proficient) or higher. Scores are on a scale ranging from Level 1, below basic proficiency level, through Level 4, the advanced level. Fiscal 2002 year’s grade 7 scores were excluded as results of the test appeared inconsistent with other available information and were not released. Other years include all grades, 3–8.
Source: Division of Assessment and Accountability. Indicator name: Students in grades 3 to 8 meeting or exceeding standards - Math (%)Description: The percent of general and special education students who meet the learning standard in math
for their grade by performing at Level 3 (Proficient) or higher. Scores are on a scale ranging from Level 1, below basic proficiency level, through Level 4, the advanced level.
Source: Division of Assessment and Accountability. Indicator name: Students in grades 3 to 8 scoring below standards progressing into a higher level - English Language Arts (%)Description: The percent of students who scored at Level 1 or 2 on the English Language Arts (ELA) test in
a given year and showed progress the following year by moving into a higher proficiency level. Scores are on a scale ranging from Level 1, below basic proficiency level, through Level 4, the advanced level. Fiscal 2002 year’s grade 7 scores were excluded as results of the test appeared inconsistent with other available information and were not released. Other years include all grades, 3–8.
Source: Division of Assessment and Accountability
Page 136 | Mayor’s Management Report
Department of Education
Indicator name: Students in grades 3 to 8 scoring below standards progressing into a higher level - Math (%)Description: The percent of students who scored at Level 1 or 2 on the math test in a given year and showed
progress the following year by moving into a higher proficiency level. Scores are on a scale ranging from Level 1, below basic proficiency level, through Level 4, the advanced level.
Source: Division of Assessment and Accountability.Indicator name: Students in grades 3 to 8 progressing from below standards to meeting standards - English Language Arts (%)Description: The percent of students who scored at Level 1 or 2 on the English Language Arts (ELA) test in
a given year and showed progress the following year by moving into Level 3 or 4. Scores are on a scale ranging from Level 1, below basic proficiency level, through Level 4, the advanced level. Fiscal 2002 year’s grade 7 scores were excluded as results of the test appeared inconsistent with other available information and were not released. Other years include all grades, 3-8.
Source: Division of Assessment and Accountability. Indicator name: Students in grades 3 to 8 progressing from below standards to meeting standards - Math (%)Description: The percent of students who scored at Level 1 or 2 on the math test in a given year and showed
progress the following year by moving into Level 3 or 4. Scores are on a scale ranging from Level 1, below basic proficiency level, through Level 4, the advanced level.
Source: Division of Assessment and Accountability.
Indicator name: Students in grades 1 to 9 promoted (%)Description: The percent of all students in grades 1 to 9 who were promoted into the next grade level after
meeting promotion criteria, which includes passing standardized tests, attendance and classwork except for grade 3 and 5. Grade 3 and 5 promotion rates include all third grade general education students held to the new promotion policy adopted in 2003-2004 for grade 3 and in 2004-2005 for grade 5 as well as English language learners and special education students who were promoted based on multiple promotion criteria. Grade 9 includes middle schools only.
Source: Division of Assessment and Accountability. Indicator name: Students in the graduating class taking required Regents examinations (%)Description: The percentage of students in the graduating class taking the required Regents exams for
graduation and Regents diploma. Data is reported annually in the PMMR.Source: Division of Assessment and Accountability. Indicator name: Students passing required Regents examinations (%)Description: The percent of students in the graduating class who take the Regents examinations and
who meet graduation and Regents diploma requirements by passing the required Regents examinations. Data is reported annually in the PMMR.
Source: Division of Assessment and Accountability. Indicator name: Students in graduating class with a 65 to 100 passing score on the Regents Examination - English (%)Description: The percent of students in the graduating class who take the Regents examinations and who
meet New York State Education Department (NYSED) graduation requirements in English. Students passing all required Regents exams with a score of 65 or higher graduate with a Regents diploma. Data is reported annually in the PMMR.
Source: Division of Assessment and Accountability.

Indicator Definitions | Page 137
Department of Education
Indicator name: Students in graduating class with a 65 to 100 passing score on the Regents Examination - Math (%)Description: The percent of students in the graduating class who take the Regents examinations and who
meet New York State Education Department graduation requirements in math. Students passing all required Regents exams with a score of 65 or higher graduate with a Regents diploma. Data is reported annually in the PMMR.
Source: Division of Assessment and Accountability.
Indicator name: Students in graduating class with a 65 to 100 passing score on the Regents Examination - United States history and government (%)Description: The percent of students in the graduating class who take the Regents examinations and who
meet New York State Education Department graduation requirements in United States history and government. Students passing all required Regents exams with a score of 65 or higher graduate with a Regents diploma. Data is reported annually in the PMMR.
Source: Division of Assessment and Accountability. Indicator name: Students in graduating class with a 65 to 100 passing score on the Regents Examination - Global history (%)Description: The percent of students in the graduating class who take the Regents examinations and who
meet New York State Education Department graduation requirements in global history. Students passing all required Regents exams with a score of 65 or higher graduate with a Regents diploma. Data is reported annually in the PMMR.
Source: Division of Assessment and Accountability. Indicator name: Students in graduating class with a 65 to 100 passing score on the Regents Examination - Science (%)Description: The percent of students in the graduating class who take the Regents examinations and who
meet New York State Education Department graduation requirements in science. Students passing all required Regents exams with a score of 65 or higher graduate with a Regents diploma. Data is reported annually in the PMMR.
Source: Division of Assessment and Accountability. Indicator name: Percent of all students in cohort graduating from high school in 4 years (NYSED)Description: The percent of a graduating class of students, who entered the public school system in
September of a given year and graduated within four years. The New York State calculation, instituted in 2005, includes Local and Regents Diplomas and all disabled students. It does not include students receiving GEDs or special education diplomas. For the cohort of 2004, students who graduate in August are also reported separately. This rate does not include GEDs and Special Education diplomas. Data is reported annually in the PMMR.
Source: Division of Assessment and Accountability.
Indicator name: Percent of all students in cohort graduating from high school in 6 years (NYSED)Description: The percent of a graduating class of students, who entered the public school system in
September of a given year and graduated within six years. The New York State calculation, instituted in 2005, includes Local and Regents Diplomas and all disabled students. It does not include students receiving GEDs or special education diplomas. For the cohort of 2004, students who graduate in August are also reported separately. This rate does not include GEDs and Special Education diplomas. Data is reported annually in the PMMR.
Source: Division of Assessment and Accountability. Indicator name: Percent of all students in cohort dropping out from high school in 4 years (NYSED)Description: The percent of students, who entered ninth grade public school in September of a given year and
dropped out by June 30th of their fourth year. Data is reported annually in the PMMR.Source: Division of Assessment and Accountability.

Page 138 | Mayor’s Management Report
Department of Education
Indicator name: Percent of all students in cohort dropping out from high school in 6 years (NYSED)Description: The percent of students, who entered ninth grade public school in September of a given year and
dropped out by June 30th of their sixth year. Data is reported annually in the PMMR.Source: Division of Assessment and Accountability.
Indicator name: Average Class Size (January, audited) - Kindergarten - Grade 1 - Grade 2 - Grade 3 - Grade 4 - Grade 5 - Grade 6 - Grade 7 - Grade 8 - Grade 9 (not high schools) Description: The average class size as of October 31 in grades kindergarten to nine, not including high
schools. Source: Automate the School system. Indicator name: Phone calls responded to by parent coordinator or parent engagement designee (000)Description: The citywide total number of phone calls responded to by parent coordinators is a measure of
how many parents have their issues and concerns addressed by parent coordinators. Source: Office of Parent Engagement. Indicator name: In-person consultations with parents by PC or parent engagement designee (000)Description: The citywide total number of parents who were seen by parent coordinators as walk-ins to the
school is a measure of how many parents have their issues and concerns addressed by parent coordinators.
Source: Office of Parent Engagement.
Indicator name: School-based workshops offered to parents (000)Description: Key functions of parent coordinators are to increase parents’ involvement with their children’s
education and to help parents support their children’s learning. The number of workshops held by parent coordinators is a measure of the opportunities parents are provided at the school level to accomplish these goals.
Source: Office of Parent Engagement. Indicator name: Parents attending school-based workshops (000)Description: Key functions of Parent Coordinators are to increase parents’ involvement with their children’s
education and to help parents support their children’s learning. The number of parents who attended workshops organized by Parent Coordinators is a measure of how many parents participated and benefited from parent coordinators’ efforts to accomplish the above goals.
Source: Office of Parent Engagement. Indicator name: Parents attending Fall and Spring Parent-Teacher Conferences (000)Description: The citywide total number of parents who attended parent-teacher conferences.Source: Office of Parent Engagement.
Indicator name: Students enrolled as English Language Learners (000)Description: The number of students identified who require a bilingual or English as a Second Language
(ESL) program.Source: Bilingual Education Student Information Survey.

Indicator Definitions | Page 139
Department of Education
Indicator name: English Language Learners testing out of ELL programs (%)Description: The percent of students who score at the proficient level on the New York State English as a
Second Language Achievement Test (NYSESLAT). This test was redesigned by the New York State Education Department in Fiscal 2005.
Source: Division of Assessment and Accountability.
Indicator name: English Language Learners testing out of ELL programs within 3 years (%)Description: The percent of students who score at the proficient level on the New York State English as a
Second Language Achievement Test (NYSESLAT) within 3 years. This test was redesigned by the New York State Education Department in Fiscal 2005.
Source: Division of Assessment and Accountability.
Indicator name: Percent of students with disabilities in cohort graduating from high school in 4 years (NYSED)Description: The percent of a graduating class of students with disabilities, who entered the public school
system in September of a given year and graduated within four years. The New York State calculation, instituted in 2005, includes Local and Regents Diplomas and all disabled students. It does not include students receiving GEDs or special education diplomas. For the cohort of 2004, students who graduate in August are also reported separately. This rate does not include GEDs and Special Education diplomas. Data is reported annually in the PMMR.
Source: Division of Assessment and Accountability. Indicator name: Percent of students with disabilities in cohort graduating from high school in 6 years (NYSED)Description: The percent of a graduating class of students with disabilities, who entered the public school
system in September of a given year and graduated within six years. The New York State calculation, instituted in 2005, includes Local and Regents Diplomas and all disabled students. It does not include students receiving GEDs or special education diplomas. For the cohort of 2004, students who graduate in August are also reported separately. This rate does not include GEDs and Special Education diplomas. Data is reported annually in the PMMR.
Source: Division of Assessment and Accountability. Indicator name: Percent of students with disabilities in cohort dropping out from high school in 4 years (NYSED)Description: The percent of students with disabilities, who entered ninth grade public school in September of
a given year and dropped out by June 30th of their fourth year. Data is reported annually in the PMMR.
Source: Division of Assessment and Accountability. Indicator name: Percent of students with disabilities in cohort dropping out from high school in 6 years (NYSED)Description: The percent of students with disabilities, who entered ninth grade public school in September of
a given year and dropped out by June 30th of their sixth year. Data is reported annually in the PMMR.
Source: Division of Assessment and Accountability. Indicator name: Students receiving special education services (000)Description: The number of students who have been classified as disabled by the Committee on Special
Education and have an Individualized Education Program, which outlines special education services for each child.
Source: Office of Special Education Initiatives/Children Assistance Program.
Indicator name: Students receiving special education services - School age - Public Schools - Non-Public Schools - Pre-school - Public Schools - Non-Public Schools

Page 140 | Mayor’s Management Report
Department of Education
Description: The number of students who have been classified as disabled by the Committee on Special Education and have an Individualized Education Program, which outlines special education services for each child. Subtotals are included to show the different settings in which students receive special services through the Department of Education, including settings outside the public school system.
Source: Office of Special Education Initiatives/Children Assistance Program.
Indicator name: Students recommended for special education servicesDescription: The number of new students who have been found to have a disability and require special
education services.Source: Office of Special Education Initiatives/Children Assistance Program. Indicator name: Students no longer in need of special education servicesDescription: The number of students who have been determined by the Committee on Special Education to no
longer require special education services and are returned to full-time general education services.Source: Office of Special Education Initiatives/Children Assistance Program Indicator name: Students in special education scoring below standards progressing into a higher level - English Language Arts (%)Description: The percent of special education students who scored in Level 1 on the English Language Arts
test in a given year and showed progress the following year by moving into a higher level. Scores are on a scale ranging from Level 1, below basic proficiency level, through Level 4, the advanced level.
Source: Division of Assessment and Accountability. Indicator name: Students in special education scoring below standards progressing into a higher level - Math (%)Description: The percent of special education students who scored in Level 1 on the math test in a given year
and showed progress the following year by moving into a higher level. Scores are on a scale ranging from Level 1, below basic proficiency level, through Level 4, the advanced level.
Source: Division of Assessment and Accountability.
Indicator name: Percent of high school cohort taking the SAT at least once in 4 years of high schoolDescription: Percent of 9th grade cohort taking the SAT exam at least once in 4 years of high school. Data is
reported annually in the PMMR.Source: Division of Teaching and Learning
Indicator name: Percent of high school cohort who graduate ready for college and careersDescription: The College Readiness Index (CRI) calculated by NYC is a rich measure of a student’s college
readiness that aligns to the standards for passing out of remedial coursework set by the City University of New York (CUNY).The CRI includes students who:
• Graduated by August with a diploma, and • Earned a 75+ on the English Regents or scored 480+ on the Critical Reading SAT or scored a
20+ on the ACT English or scored a 70+ on the CUNY Reading Assessment and a 56+ on the CUNY Writing Assessment, and
• Scored an 80+ on a math Regents or 70+ on a Common Core Algebra Regents and completed coursework in Algebra II/Trigonometry or higher, or scored 480+ on the math SAT, or scored a 20+ on the ACT Math, or scored a 40+ on the CUNY Math Assessment, or scored an 80+ on the PBAT and completed required coursework. Data is reported annually in the PMMR.
Source: Division of Teaching and Learning

Indicator Definitions | Page 141
Department of Education
Indicator name: Percent of high school cohort who graduated from high school and enrolled in a college or other postsecondary program within 6 months
Description: The percentage who graduated from high school and enrolled in a college or other postsecondary program within 6 months includes students who graduated from high school and enrolled in college, a vocational program, or public service within 6 months of their scheduled graduation date, out of all the school’s students who entered 9th grade 4 years earlier. Data is reported annually in the PMMR.
Source: Division of Teaching and Learning
Indicator name: Percent of high school cohort taking at least 1 AP exam in 4 years of high school.Description: Percent of 9th grade cohort taking at least 1 Advanced Placement exam in 4 years of high school.
Data is reported annually in the PMMR.Source: Division of Teaching and Learning
Indicator name: Percent of high school cohort passing at least 1 AP exam in 4 years of high schoolDescription: Percent of 9th grade cohort passing at least 1 Advanced Placement exam with a score of 3 or
higher in 4 years of high school. Data is reported annually in the PMMR.Source: Division of Teaching and Learning
Indicator name: Percentage of students who successfully completed approved rigorous courses or assessmentsDescription: The percentage of students who successfully completed approved college preparatory courses
and assessments shows the percentage of students who accomplished any of the following achievements within four years after entering 9th grade:
• scored 65 or above on the Regents exams in Algebra II, Math B, Chemistry, or Physics • scored 3 or above on an Advanced Placement exam • scored 4 or above on an International Baccalaureate exam • earned a grade of C or higher in a college course • passed a course certified by the NYC DOE as college-and career-ready • earned a diploma with a Career and Technical Education endorsement • earned a diploma with an Arts endorsement • passed an industry-recognized technical assessment Data is reported annually in the PMMR.Source: Division of Teaching and Learning
Indicator name: Average EarlyLearn contract enrollmentDescription: Average number of children being served by EarlyLearn contractors in center-based (group) and
home-based (family child care) settings.Source: Division of Early Care & Education
Indicator name: EarlyLearn—Average center-based enrollmentDescription: Average number of children being served by EarlyLearn contractors in center-based (group)
settings.Source: Division of Early Care & Education
Indicator name: EarlyLearn—Average family child care enrollmentDescription: Average number of children being served by EarlyLearn contractors in home-based (family child
care) settings.Source: Division of Early Care & Education
Indicator name: Average EarlyLearn Utilization (%)Description: The percent of contracted center-based and home-based care seats available for which children
are enrolled.Source: Division of Early Care & Education
Page 142 | Mayor’s Management Report
Department of Education
Indicator name: Average EarlyLearn Utilization—Center-based (%)Description: The percent of contracted center-based seats available for which children are enrolled.Source: Division of Early Care & Education
Indicator name: Average EarlyLearn Utilization—Family child care (%) Description: The percent of contracted home-based care seats available for which children are enrolled.Source: Division of Early Care & Education
Indicator name: EarlyLearn—Fiscal year spending per child based on average enrollment in Contract Family Child Care
Description: Fiscal year spending per child based on average enrollment in Contract Family Child Care.Source: Division of Early Care & Education
Indicator name: EarlyLearn—Budget per slot in contract family child careDescription: Budget per slot in contract family child care.Source: Division of Early Care & Education
Indicator name: EarlyLearn—Fiscal year spending per child based on average enrollment in Contract Family Child Care
Description: Fiscal year spending per child based on average enrollment in Contract Family Child Care.Source: Division of Early Care & Education
Indicator name: Schools that exceed capacity - Elementary schools (%) - Middle schools (%) - High schools (%)Description: The percent of schools, not including charter schools located in private buildings, where student
enrollment is at 100 percent or more of a school’s functional capacity. Capacity is determined using a formula that reflects instructional needs, student population and building size. The formula is devised by the School Construction Authority in consultation with instructional and operational staff. Data is reported annually in the PMMR.
Source: Division of School Facilities through Fiscal 2002, School Construction Authority beginning Fiscal 2003.
Indicator name: Students in schools that exceed capacity - Elementary/middle schools (%) - High schools (%)Description: The percent of the enrolled student population that attend schools, not including charter schools
located in private buildings, where enrollment is 100 percent or more of functional capacity. Capacity is determined using a formula that reflects instructional needs, student population and building size. The formula is devised by the School Construction Authority in consultation with instructional and operational staff.
Source: Division of School Facilities through Fiscal 2002, School Construction Authority beginning Fiscal 2003. Data is reported annually in the PMMR.
Indicator name: Total new seats createdDescription: The number of new student seats created through the efforts of the Department of Education and
the School Construction Authority, including construction of new buildings, construction of school additions, room portioning, room conversions, and leasing.
Source: Division of School Facilities and School Construction Authority.

Indicator Definitions | Page 143
Department of Education
Indicator name: Hazardous building violations total backlogDescription: The number of hazardous Department of Buildings (DOB) violations pending against Department
of Education facilities. These include violations that need corrective work, and violations for which work has been completed but which are awaiting official dismissal by DOB.
Source: Division of School Facilities.
Indicator name: School building rating - Good condition (%) - Fair to good condition (%) - Fair condition (%) - Fair to poor condition (%) - Poor condition (%)Description: School building conditions are rated annually, with each major infrastructure component of each
building rated on a scale of 1 to 5, 1 being Good and 5 being Poor. A Good rating means that infrastructure is sound and is performing its function. A Fair rating means that infrastructure is still performing adequately at this time, but may require preventive maintenance to prevent further deterioration and restore it to good condition. A Poor rating means that infrastructure cannot continue to perform its original function without repairs, or is in such condition that its failure is imminent. Data is reported annually in the PMMR.
Source: Department of Education Division of School Facilities through Fiscal 2002; School Construction Authority beginning Fiscal 2003.
Indicator name: School safety - Seven Major CrimesDescription: All crimes categorized as a major index crime (murder and non-negligent manslaughter, forcible
rape, robbery, felonious assault, burglary, grand larceny and grand larceny auto) occurring within City public schools.
Source: NYPD School Safety Division.
Indicator name: School safety - Other criminal categoriesDescription: Summary of all other reported felonies and misdemeanors occurring within City public schools.Source: NYPD School Safety Division. Indicator name: School safety - Other incidentsDescription: All serious non-criminal incidents occurring within City public schools.Source: NYPD School Safety Division.
Indicator name: Average lunches served dailyDescription: Lunches served by School Food in which claims are submitted for State Education
reimbursement divided by service days. The denominator is a composite of the site (both public and non-public schools) service days citywide due to all sites not having the same number of service days.
Source: School Food Report of Meals Served (Management Information Evaluation) form.
Indicator name: Average breakfasts served dailyDescription: Breakfasts served by School Food in which claims are submitted for State Education
reimbursement divided by service days. The denominator is a composite of the site (both public and non-public schools) service days citywide due to all sites not having the same number of service days.
Source: School Food Report of Meals Served (Management Information Evaluation) form.

Page 144 | Mayor’s Management Report
Department of Education
Indicator name: Average expenditure per student ($) - Elementary school ($) - Middle school ($) - High school ($) - Full-time special education (District 75) ($)Description: Total school expenditures, including direct services to schools, regional costs, and systemwide
costs and obligations, divided by school enrollment (official audited registers). Data is reported annually in the PMMR.
Source: School Based Expenditures Reports.
Indicator name: Average direct services to schools expenditure per student ($)Description: Dollars spent directly on services provided to public school students and staff, taking place
primarily in the school building during the school day, during the school year, divided by school enrollment (official audited registers). Cost categories feature classroom instruction; student support; leadership and supervision; building services; and food, transportation, computers and school safety. Also includes funds for after school and summer school programs. Data is reported annually in the PMMR.
Source: School Based Expenditure Reports. Indicator name: TeachersDescription: The number of active teachers system-wide, which does not include teachers on approved
unpaid leaves of absence and teachers in charter schools.Source: Human Resources System. Indicator name: Teachers with 5 or more years teaching experience (%)Description: The percent of teachers, not including charter school teachers, with five or more years of
classroom experience.Source: Human Resources System.
Indicator name: Teachers hired to fill projected vacancies (%)Description: The percent of teacher vacancies that were filled by teachers hired for the new school year.Source: Enterprise Data Warehouse Human Resources System. Indicator name: Principals with 4 or more years experience as principal (%)Description: The percent of principals that have been in the NYC public school system as principal for three or
more years.Source: Enterprise Data Warehouse Human Resources System. Indicator name: Teachers absent 11 or more days (%)Description: The percent of active teachers (excludes teachers on approved leave) who have been absent (as
defined under the teachers’ contract) beyond the 10 days allowed under the teachers’ contract.Source: Enterprise Data Warehouse Human Resources System.
Indicator name: Collision involving City vehiclesDescription: The total number of DOE-vehicle involved collision reports involving injury or property damage
for the citywide fleet reported in the citywide collision reporting system (CRASH). New York State MV-104 reports are required whenever a collision occurs involving death, or other personal injury, or property damage over $1,000. Collisions are tracked and reported regardless of whether or not the driver was at fault and whether or not the vehicle was in motion. Collisions involving City vehicles occur whenever a City vehicle strikes (or is struck by) a second vehicle, pedestrian, bicyclist or fixed object.
Source: Department of Citywide Administrative Services (DCAS)

Indicator Definitions | Page 145
Department of Education
Indicator name: Workplace injuries reported”Description: All incidents resulting in a workers’ compensation or line of duty injury claim regardless of whether
or not time is lost.Source: New York City Law Department
Indicator name: Accidents in schools - Students (#); - The public (#)Description: All accidents that involve students or the public logged into the department’s Online Occurrence
Reporting System (OORS).Source: DOE Online Occurrence Reporting System (OORS)

Page 146 | Mayor’s Management Report
Department of Education

Indicator Definitions | Page 147
School Construction Authority
Indicator name: Total new seats createdDescription: The number of new student seats created through the efforts of the Department of Education and
the School Construction Authority, including construction of new buildings, construction of school additions, room partitioning, room conversions, leasing and transportable classroom units.
Source: Division of School Facilities and School Construction Authority. Indicator name: New schools and additions constructedDescription: The number of new schools and additions constructed as part of the City’s elementary,
intermediate and high schools. SCA measures new schools and additions from October to September to capture projects completed for the start of the school year.
Source: SCA Finance Department. Indicator name: New schools and additions—construction funds committed as a percent of initial authorized
budget (%)Description: The sum of the total construction costs of all the completed new schools and additions which
includes the original contract and all additional construction costs related to the original contract, divided by the sum of all of the contract amounts and contingency for the completed new schools and additions. SCA’s goal is not to exceed 100 percent of its authorized budget.
Source: SCA Finance Department Indicator name: Scheduled new seats constructed on time (%)Description: The percent of planned new seats ready for occupancy by September, as approved and funded
by the Department of Education.Source: SCA Finance Department. Indicator name: Construction bid price for school capacity projects per square foot ($)Description: The construction contract cost at award divided by the school’s total gross floor area (measured
to the outside of exterior walls on each floor). For new schools and additions, the reported construction contract cost per square foot reflects costs attributable to the new building.
Source: SCA Finance Department. Indicator name: Average new school construction cost per square foot
- Early childhood ($)Description: The total construction cost of completed early childhood centers (prekindergarten–grade 2)
divided by the centers’ total gross floor area (measured to the outside of exterior walls on each floor). Cost includes original contract and all additional construction costs related to the original contract. NA reflects no construction done in this category.
Source: SCA Finance Department.
Indicator name: Average new school construction cost per square foot - Elementary ($)
Description: The total construction cost of completed elementary schools (prekindergarten-grade 5) divided by the schools’ total gross floor area (measured to the outside of exterior walls on each floor). Cost includes original contract and all additional construction costs related to the original contract. NA reflects no construction done in this category.
Source: SCA Finance Department. Indicator name: Average new school construction cost per square foot
- Intermediate ($)Description: The total construction cost of completed intermediate schools (grade 6–grade 8) divided by the
schools’ total gross floor area (measured to the outside of exterior walls on each floor). Cost includes original contract and all additional construction costs related to the original contract. NA reflects no construction done in this category.
Source: SCA Finance Department.

Page 148 | Mayor’s Management Report
School Construction Authority
Indicator name: Average new school construction cost per square foot - High School ($)
Description: The total construction cost of completed high schools (grade 9–grade 12) divided by the schools’ total gross floor area (measured to the outside of exterior walls on each floor). Cost includes original contract and all additional construction costs related to the original contract. NA reflects no construction done in this category.
Source: SCA Finance Department. Indicator name: Capital improvement projects constructed on time or early (%)Description: The percent of capital repair projects (such as roof repair and window replacement) with
substantial completion within 15 days of the scheduled date.Source: SCA Finance Department. Indicator name: Capital improvement projects constructed within budget (%)Description: The percent of capital repair projects (such as roof repair and window replacement) completed
within contract dollar amount and budgeted contingency as of June 30.Source: SCA Finance Department. Indicator name: Ultimate cost of insurance losses as % of construction valueDescription: The ratio of the cost of insurance losses to value of construction projects for the period.Source: SCA Finance Department.
Indicator Definitions | Page 149
Department of Youth and Community Development
Indicator name: Number of young people involved in DYCD-funded programsDescription: The annually reported number of youth participants in programs funded through the Department
of Youth and Community Development (DYCD).Source: DYCD Program Units.
Indicator name: Comprehensive After-School System of NYC (COMPASS NYC) enrollmentDescription: The number of youth enrolled in Comprehensive After-School System of NYC (COMPASS NYC)
programs during the reporting period.Source: DYCD COMPASS Unit. Indicator name: COMPASS NYC programs meeting target enrollment (school year) (%)Description: The percentage of all Comprehensive After-School System of NYC (COMPASS NYC) programs
meeting the minimum annual enrollment target (school-year programs)Source: DYCD COMPASS Unit.
Indicator name: COMPASS NYC programs meeting target enrollment – SONYC/middle school (school year) (%)Description: The percentage of Comprehensive After-School System of NYC (COMPASS NYC) SONYC/
middle school programs meeting the minimum annual enrollment target (school-year programs)Source: DYCD COMPASS Unit. Indicator name: COMPASS NYC programs meeting target enrollment - elementary (school year) (%)Description: The percentage of Comprehensive After-School System of NYC (COMPASS NYC) elementary
school programs meeting the minimum annual enrollment target (school-year programs)Source: DYCD COMPASS Unit.
Indicator name: COMPASS NYC programs meeting target enrollment (summer) (%)Description: The percentage of all Comprehensive After-School System of NYC (COMPASS NYC) programs
meeting the minimum annual enrollment target (summer programs)Source: DYCD COMPASS Unit. Indicator name: Beacon programs enrollment as a percentage of the annual target (%)Description: The percentage of the annual enrollment target met by Beacon programs.Source: DYCD After-School Programs.
Indicator name: Beacon programs activeDescription: The number of DYCD operated Beacon programs. Source: DYCD After-School Programs.
Indicator name: Youth served in Beacon programsDescription: The number youth served at DYCD operated Beacon programs. Source: DYCD After-School Programs.
Indicator name: Adults served in Beacon programsDescription: The number adults served at DYCD operated Beacon programs. Source: DYCD After-School Programs.
Indicator name: Cornerstone programs enrollment as a percentage of the annual target (%)Description: The percentage of the annual enrollment target met by Cornerstone programs.Source: DYCD After-School Programs.
Indicator name: Cornerstone programs activeDescription: The number of DYCD operated Cornerstone programs. Source: DYCD After-School Programs.
Page 150 | Mayor’s Management Report
Department of Youth and Community Development
Indicator name: Youth served in Cornerstone programsDescription: The number youth served at DYCD operated Cornerstone programs. Source: DYCD After-School Programs.
Indicator name: Adults served in Cornerstone programsDescription: The number adults served at DYCD operated Cornerstone programs. Source: DYCD After-School Programs. Indicator name: Calls to Youth ConnectDescription: The number of calls received, excluding hang-up and prank calls. Name updated from ‘Calls to
Youthline’ in accordance with program name change; no changes to previously reported data.Source: DYCD Special Youth Initiatives Unit. Indicator name: Youth and young adults reunited with family or placed in a suitable environment from Crisis
Services Programs (%)Description: The percentage of youth and homeless young adults, served through the Department’s Runaway
and Homeless Youth Crisis Services Programs, who are discharged to known locations, including returning to families, other known living arrangements (such as apartment or living with friends), supportive housing, and placements at other shelters, foster homes, hospitalization and in residential care.
Source: DYCD Runaway and Homeless Youth Services. Indicator name: Youth and young adults reunited with family or placed in a suitable environment from Transitional
Independent Living (TIL) Support Programs (%)Description: The percentage of youth and homeless young adults, served through the Department’s
Runaway and Homeless Youth Transitional Independent Living (TIL) Support Programs, who are discharged to known locations, including returning to families, other known living arrangements (such as apartment or living with friends), supportive housing, and placements at other shelters, foster homes, hospitalization, and in residential care.
Source: DYCD Runaway and Homeless Youth Services. Indicator name: Residential beds for runaway and homeless youth and homeless young adultsDescription: The number of residential beds at DYCD-funded Runaway & Homeless Youth Services programs. Source: DYCD Runaway and Homeless Youth Services.
Indicator name: Runaway and homeless youth and homeless young adults served – Crisis Services ProgramsDescription: The unduplicated number of youth and homeless young adults who resided at DYCD-funded
sites contracted to provide Crises Services Programs. Source: DYCD Runaway and Homeless Youth Services.
Indicator name: Runaway and homeless youth and homeless young adults served – Transitional Independent Living (TIL) Support Programs
Description: The unduplicated number of youth and homeless young adults who resided at DYCD-funded sites contracted to provide Transitional Independent Living (TIL) Support Programs.
Source: DYCD Runaway and Homeless Youth Services. Indicator name: Utilization rate for Crisis Services Programs (%)Description: The percentage of Crisis Services Programs beds that are occupied on average over the course
of the reporting period.Source: DYCD Runaway and Homeless Youth Services.
Indicator Definitions | Page 151
Department of Youth and Community Development
Indicator name: Utilization rate for Transitional Independent Living (TIL) Support Programs (%)Description: The percentage of Transitional Independent Living (TIL) Support Programs beds that are
occupied on average over the course of the reporting period.Source: DYCD Runaway and Homeless Youth Services. Indicator name: Young people who received mental health support in a city-funded residential program or drop-in
center serving runaway and homeless youthDescription: Number of youth who have participated in a mental health service at Transitional Independent
Living facilities, drop-in centers, and crisis centers.Source: DYCD Runaway and Homeless Youth Services.
Indicator name: Summer Youth Employment Program (SYEP) participantsDescription: Number of participants enrolled in summer youth employment programs during the current or
latest summer’s SYEP..Source: Summer Youth Employment Program. Indicator name: Number of Summer Youth Employment Program contractsDescription: Number of contracts in place under the current or latest summer’s Summer Youth Employment
Program.Source: Summer Youth Employment Program. Indicator name: Value of Number of Summer Youth Employment Program contracts ($000).Description: The dollar value of the contracts in place under the current or latest summer’s Summer Youth
Employment Program.Source: Summer Youth Employment Program. Indicator name: Participants in WIOA-funded Train & Earn (Out-of-School Youth) programDescription: Out-of-school youth participating in Workforce Innovation and Opportunity Act (WIOA) funded
Train & Earn program during the reporting period.Source: DYCD WIOA Unit. Indicator name: Participants in WIOA-funded Learn & Earn (In-School Youth) programDescription: In-school youth participating in WIOA-funded Learn & Earn program during the reporting period.Source: DYCD WIOA Unit.
Indicator name: Youth who are out-of-school, attend a DYCD-funded training or employment program, and are placed in post-secondary education, employment, or advanced training in the 2nd quarter after exiting the program (%).
Description: The percentage of out-of-school youth placed in post-secondary education, employment, or advanced training in the 2nd quarter after exiting the program.
Source: DYCD WIOA Unit Indicator name: Youth who attend a training program while in school and are placed in post-secondary education,
employment, or advanced training during the 2nd quarter after exiting the program (%).Description: The percentage of in-school youth placed in post-secondary education, employment, or advanced
occupational training during the 2nd quarter after exiting the program.Source: DYCD WIOA Unit.
Indicator name: Youth who are out-of-school, attend a DYCD-funded training or employment program, and attain a recognized post-secondary credential or a secondary school diploma, or its recognized equivalent, during participation in or within one year after exiting from the program (%).
Description: The percentage of out-of-school youth attaining a credential within one year after exiting the program.
Source: DYCD WIOA Unit.
Page 152 | Mayor’s Management Report
Department of Youth and Community Development
Indicator name: Youth who attend a DYCD-funded training program while in school, and attain a recognized postsecondary credential or a secondary school diploma, or its recognized equivalent, during participation in or within one year after exiting from the program (%).
Description: The percentage of in-school youth attaining a credential within one year after exiting the program. Source: DYCD WIOA Unit. Indicator name: Community anti-poverty participants achieving target outcomes designated for clients in each
program area (%).Description: The percent of all DYCD-funded anti-poverty program participants achieving defined milestones
and outcomes, which are negotiated with each provider based on the goals of the program. Source: DYCD Community Development Unit. Indicator name: Participants in community anti-poverty programs.Description: The number of unduplicated participants in DYCD-funded anti-poverty programs during the
reporting period. Source: DYCD Community Development Unit. Indicator name: Participants in DYCD-funded English literacy programs.Description: The number of students enrolled in Adult Basic Education, English for Speakers of Other
Languages (ESOL), and other DYCD literacy programs, and who have attended for at least 12 hours.
Source: New York State Adult Literacy Information and Evaluation System. Indicator name: Participants in DYCD-funded English literacy programs meeting standards of improvement in
their ability to read, write and speak English (%)Description: The percentage of participants in Adult Basic Education, ESOL and other DYCD literacy program
meeting federal standards of improvement in their ability to read, write and speak English, as determined by initial and final tests.
Source: New York State Adult Literacy Information and Evaluation System. Indicator name: Participants achieving positive outcomes in immigrant assistance programs (%)Description: The percentage of participants enrolled in an immigrant assistance program achieving at least
one positive outcome as defined by the program area.Source: DYCD Office of Immigrant Initiatives. Indicator name: Participants in immigrant assistance programsDescription: The number of participants in DYCD funded immigrant assistance programs during the reporting
period.Source: DYCD Office of Immigrant Initiatives. Indicator name: Contracts terminatedDescription: The number of contracts terminated by DYCD, or withdrawn at request of CBO prior to original
contract end date.Source: DYCD Agency Chief Contracting Officer.
Indicator name: Agency assessments completed as a percent of total agency contracts (%)Description: The number of evaluations completed for assessments divided by the number of agency
contracts with contract values in excess of $100,000.Source: DYCD Agency Chief Contracting Officer/PASSPort. Indicator name: Fiscal audits conductedDescription: Fiscal audits conducted of contracts in effect during the prior fiscal year.Source: DYCD Agency Chief Contracting Officer.
Indicator Definitions | Page 153
Department of Youth and Community Development
Indicator name: Expenditure report reviewsDescription: The number of contractors’ expenditure reports that agency contracting analysts processed
during the period.Source: DYCD Agency Chief Contracting Officer. Indicator name: Programmatic reviews/contract monitoringDescription: The number of telephone and site visits for monitoring contracted program operations by both CD
and Youth Operations.Source: DYCD Agency Chief Contracting Officer. Indicator name: Agency assessments completedDescription: The number of evaluations completed for assessments.Source: DYCD Agency Chief Contracting Officer/PASSPort.
Indicator name: Contracts fundedDescription: The number of contracts funded by DYCD.Source: DYCD Agency Chief Contracting Officer.
Indicator name: Value of agency contractsDescription: The dollar value awarded for all contracts in effect with DYCD.Source: DYCD Agency Chief Contracting Officer.
Indicator name: Value of intracity agreements ($)Description: The value all monies that DYCD gives to other City agencies to operate programs and
services. It does not reflect the amount that DYCD receives from other agencies. That figure is incorporated in the ‘Value of agency contracts’ indicator, as DYCD expends monies it receives from other agencies through its contracted services.
Source: DYCD Agency Chief Contracting Officer. Indicator name: Completed customer requests for interpretationDescription: The sum of all requests for interpretation using a language other than English fulfilled by the
agency via telephone and via face-to-face interaction with bilingual employees or contracted interpreters.
Source: DYCD.
Indicator name: Letters responded to in 14 days (%)Description: The percentage of letters answered in 14 calendar days or less. Responses are substantive and
adequately address the question/issue raised by the customer. However, for complex inquiries that require research and additional action on the part of the agency, an acknowledgement which includes a description of the next step, as well as an estimated time frame for completion, is considered acceptable and is also reported as part of the 14-day response. Agencies track the additional time until a customer has a complete and full response.
Source: DYCD.
Indicator name: E-mails responded to in 14 days (%)Description: The percentage of emails answered in 14 calendar days or less. Responses are substantive and
adequately address the question/issue raised by the customer. However, for complex inquiries that require research and additional action on the part of the agency, an acknowledgement which includes a description of the next step, as well as an estimated time frame for completion, is considered acceptable and is also reported as part of the 14-day response. Agencies track the additional time until a customer has a complete and full response.
Source: DYCD.

Page 154 | Mayor’s Management Report
Department of Youth and Community Development

Indicator Definitions | Page 155
Public Libraries
Indicator name: Average weekly scheduled hoursDescription: The total amount of scheduled public service hours at all libraries/branches divided by the
number of open locations.Source: Brooklyn Public Library (BPL) - Government Affairs; New York Public Library (NYPL) - Office
of the Branch Libraries and Research Libraries Administration; Queens Public Library (QPL) - Information Technology Services.
Indicator name: Libraries open seven days per week (%)Description: Libraries/branches open seven days per week during non-summer months (fall, winter and
spring) as a percent of the total locations.Source: BPL - Government Affairs; NYPL - Office of the Branch Libraries and Research Libraries
Administration; QPL - Community Library Services. Indicator name: Libraries open six days per week (%)Description: Libraries/branches open six days per week as a percent of the total locations.Source: BPL - Government Affairs; NYPL - Office of the Branch Libraries and Research Libraries
Administration; Queens Public Library - Community Library Services. Indicator name: Circulation (000)Description: The total number of library materials, e.g., books, periodicals, and other materials, checked out or
renewed at all library locations.Source: BPL - Information Technology Department; NYPL - Office of the Branch Libraries; QPL -
Community Library Services. Indicator name: Reference queries (000)Description: The total number of reference questions asked of library staff by patrons in person, telephone,
e-mail, and chat room.Source: BPL: annual reference survey; NYPL: quarterly reader service statistics report; and QPL:
quarterly reference sample report. Indicator name: Electronic visits to website (000)Description: The total number of visits to the library website. The numbers reported for NYPL branch libraries
include activity for both branch and research facilities.Source: BPL - Information Technology Dept; NYPL - Information Technology Group; QPL - Information
Technology Services. Indicator name: Computers for public useDescription: Computers used by the public in public areas. The numbers reported for NYPL branch libraries
include activity for both branch and research facilities.Source: Information technology departments of each library system.
Indicator name: Computer sessions (000)Description: The number of sessions used on library system computers available to the public. The numbers
reported for NYPL branch libraries include activity for both branch and research facilities.Source: Information technology departments of each library system.
Indicator name: Wireless sessions (000)Description: The number of wireless sessions on the libraries’ websites during the reporting period. Figures
reported for NYPL branch libraries include activity for both branch and research facilities.Source: Information technology departments of each library system.
Indicator name: Program sessionsDescription: The total number of programs conducted by library staff for the public, including virtual programs.Source: BPL – Government Affairs; NYPL - Office of the Branch Libraries and Research Libraries
Administration; QPL - Community Library Services.

Page 156 | Mayor’s Management Report
Public Libraries
Indicator name: Program attendanceDescription: The number of people attending programs conducted by library staff for the public, including live
online attendance of virtual programs and views of recorded programs.Source: BPL – Government Affairs; NYPL - Office of the Branch Libraries and Research Libraries
Administration; QPL - Community Library Services. Indicator name: Library card holders (000)Description: The total number of people registered as New York Public Libraries branch library card holders.Source: Library staff reports from each library system. Indicator name: Active library cards (000)Description: The number of library cards or library card accounts demonstrating activity in the library system
during the reporting period.Source: Library staff reports from each library system. Indicator name: New library card registrationsDescription: The number of new library cards or library card accounts created during the reporting period.Source: Library staff reports from each library system. Indicator name: Total library attendance (000)Description: The total number of people visiting all library/branch locations.Source: Turnstile figures for patrons entering the library/branch, gathered from all library systems’
locations. BPL – staff reports; NYPL - Office of the Branch Libraries and Research Libraries Administration; QPL - Community Library Services.

Indicator Definitions | Page 157
City University of New York
Indicator name: CUNY courses offered partly or totally online (%) Description: Values are computed as the number of student full-time equivalents (FTEs) in CUNY course
sections designated as either partially or fully online divided by the total number of CUNY student FTEs. Both undergraduate and graduate courses are included. Note: FTE for each student is based on the number of credits of the courses the student is enrolled in that term (both equated and regular) divided by the number of credits defined as full-time status (15 for undergraduates and 12 for master’s students).
Source: CUNY Office of Institutional Research and Assessment.
Indicator name: Instructional full-time equivalents (FTEs) taught by full-time faculty (%) – Senior CollegesDescription: This indicator is calculated by dividing the total number of CUNY student (instructional) FTEs in
courses taught by full-time faculty by the total number of student (instructional) FTEs in all CUNY courses for both the fall and spring semesters of a given academic year at CUNY senior colleges. Note: A full-time employee is counted as one FTE, a part-time non-faculty employee is counted as one-half of an FTE, and each part-time faculty member is counted as one-third of an FTE.
Source: CUNY Office of Institutional Research and Assessment.
Indicator name: Instructional full-time equivalents (FTEs) taught by full-time faculty (%) – Community CollegesDescription: This indicator is the total number of student (instructional) FTEs in courses taught by full‐time
faculty divided by the total number of student (instructional) FTEs in all courses for both the fall and spring semesters of a given academic year at CUNY community colleges.
Source: CUNY Office of Institutional Research and Assessment.
Indicator name: Student/faculty ratio – OverallDescription: The overall ratio of full-time equivalent (FTE) undergraduate students to full-time faculty at all
CUNY educational facilities. FTE students include full-time students counted as one FTE and part-time students counted as specified fraction of a full-time student. Full-time faculty includes the number of faculty employed full-time at a CUNY educational facility. It is a fall-only metric.
Source: CUNY Office of Institutional Research and Assessment.
Indicator name: Student/faculty ratio – Community CollegesDescription: The ratio of full-time equivalent (FTE) undergraduate students to full-time faculty at CUNY
Community Colleges. FTE students include full-time students counted as one FTE and part-time students counted as specified fraction of a full-time student. Full-time faculty includes the number of faculty employed full-time at a CUNY Community College. It is a fall-only metric.
Source: CUNY Office of Institutional Research and Assessment.
Indicator name: Student/faculty ratio – Senior CollegesDescription: The ratio of full-time equivalent (FTE) undergraduate students to full-time faculty at CUNY Senior
Colleges. FTE students include full-time students counted as one FTE and part-time students counted as specified fraction of a full-time student. Full-time faculty includes the number of faculty employed full-time at a CUNY Senior College. It is a fall-only metric.
Source: CUNY Office of Institutional Research and Assessment. Indicator name: Number of full-time faculty employed by CUNY community colleges Description: The number of faculty whose primary activities are teaching, research and scholarship and who
are employed full-time at a CUNY community college.Source: CUNY Office of Institutional Research and Assessment.
Indicator name: Number of associate degrees awarded at community colleges Description: The total number of associate degrees awarded at CUNY community colleges during the school
year.Source: CUNY Office of Institutional Research and Assessment.
Page 158 | Mayor’s Management Report
City University of New York
Indicator name: Students earning Grade C or better in Freshman Composition Courses (%) Description: Based on CUNY students completing freshman composition in the fall of a given term. Students
earning a C- (or lower) are not included in the numerator of this percentage calculation. Students are counted once for each course in a given semester. Incompletes and withdrawals are excluded.
Source: CUNY Office of Institutional Research and Assessment.
Indicator name: Students earning Grade C or better in Math Gateway Courses (%)Description: Based on CUNY students completing a credit-bearing math course through pre-calculus in
the fall of a given term. Students earning a C- (or lower) are not included in the numerator of this percentage calculation. Students are counted once for each course in a given semester. Incompletes and withdrawals are excluded.
Source: CUNY Office of Institutional Research and Assessment.
Indicator name: One-year (fall-to-fall) retention rate of full-time first-time freshmen enrolled in CUNY associate degree programs
Description: The percent of regularly admitted full-time, first-time freshmen who are still enrolled the fall term following the fall of entry into an associate program at a CUNY community college. For example, students entering CUNY as full-time, first-time freshmen in Fall 2017 must be enrolled at CUNY in Fall 2018 to be counted as retained.
Source: CUNY Office of Institutional Research and Assessment.
Indicator name: One-year (fall-to-fall) retention rate of full-time first-time freshmen enrolled in CUNY baccalaureate degree programs
Description: The percent of regularly admitted full-time, first-time freshmen who are still enrolled the fall term following the fall of entry into a CUNY baccalaureate program. For example, students entering CUNY as full-time, first-time freshmen in Fall 2017 must be enrolled at CUNY in Fall 2018 to be counted as retained.
Source: CUNY Office of Institutional Research and Assessment.
Indicator name: Three-year systemwide graduation rate (%) - CUNY Accelerated Study in Associate Programs (ASAP) students
Description: Percentage of regularly admitted, full-time freshmen enrolled in CUNY Accelerated Study in Associate Programs (ASAP) who earn a CUNY degree within three years of entry. For example, full-time, first-time, associate degree-seeking students entering a CUNY community college in Fall 2016 must earn a degree by August 2019 to be counted as having graduated within three years. Graduation rates are reported for the fiscal year corresponding with the end of the three-year period.
Source: CUNY Office of Institutional Research and Assessment.
Indicator name: Six-year systemwide graduation rate (%) - community college students in STEM disciplines Description: Percentage of regularly admitted, full-time freshmen enrolled in a Science, Technology,
Engineering & Mathematics (STEM) discipline who earn a CUNY degree within six years of entry. For example, full-time, first-time, associate degree-seeking students entering a CUNY community college in Fall 2013 must earn a degree by August 2019 to be counted as having graduated within six years. Graduation rates are reported for the fiscal year corresponding with the end of the six-year period.
Source: CUNY Office of Institutional Research and Assessment.

Indicator Definitions | Page 159
City University of New York
Indicator name: Six-year systemwide graduation rate (%) - CUNY associate degree students Description: Percentage of regularly admitted, full-time freshmen who earn a CUNY degree within six years
of entry. For example, full-time, first-time, associate degree-seeking students entering a CUNY community college in Fall 2013 must earn a degree by August 2019 to be counted as having graduated. Graduation rates are reported for the fiscal year corresponding with the end of the six-year period.
Source: CUNY Office of Institutional Research and Assessment.
Indicator name: Six-year systemwide graduation rate (%) - CUNY baccalaureate studentsDescription: The percent of regularly admitted, full-time freshmen who earn a CUNY degree within six years of
entry. For example, full-time, first-time, bachelor’s degree-seeking students entering CUNY in Fall 2013 must earn a degree by August 2019 to be counted as having graduated. Graduation rates are reported for the fiscal year corresponding with the end of the six-year period.
Source: CUNY Office of Institutional Research and Assessment.
Indicator name: Percentage of test-takers passing the National Council Licensure Examination for Registered Nurses (NCLEX)
Description: The percent of CUNY nursing students who pass the National Council Licensure Examination for Registered Nurses (NCLEX-RN) in a given academic year, based on the number of test-takers.
Source: New York State Education Department.. Indicator name: CUNY associate degree recipients who transfer to a CUNY baccalaureate program within one
year (%) Description: Calculated as the percentage of associate-seeking first-time freshmen that transferred to a CUNY
baccalaureate program within one year of completing their CUNY associate degree.Source: CUNY Office of Institutional Research and Assessment.
Indicator name: CUNY community college certificate and associate graduates from career and technical education programs who are employed within six months of graduation (%)
Description: Based on responses to a survey of certificate and associate graduates. Graduates from CUNY community college career and technical education programs are asked to report on their employment status six months after graduation. Figures reflect the percentage of respondents who reported being employed, working in an apprenticeship or being in the military six months after graduation.
Source: CUNY Office of Institutional Research and Assessment.
Indicator name: CUNY community college certificate and associate graduates from career and technical education programs who are employed or continuing their education six months after graduation (%)
Description: Based on responses to a survey of CUNY certificate and associate graduates, who are asked to report on their employment and education status six months after graduation. Figures reflect the percentage of respondents who reported being employed, working in an apprenticeship, being in the military, or pursuing additional education or training six months after graduation.
Source: CUNY Office of Institutional Research and Assessment.
Indicator name: High school students participating in college preparation program (College Now)Description: The number of high school students participating in College Now during an academic year.
College Now programs, offered at each college, help prepare students for college-level work. College Now offers college-level courses as well as remediation in reading, writing and math.
Source: CUNY Office of Academic Affairs.
Indicator name: Total headcount enrollmentDescription: The total headcount enrollment of full-time degree seeking students as of CUNY fall census date.Source: CUNY Office of Institutional Research and Assessment.

Page 160 | Mayor’s Management Report
City University of New York
Indicator name: Enrollment in STEM disciplines at community collegesDescription: The total headcount enrollment in Science, Technology, Engineering & Mathematics (STEM)
disciplines at CUNY community colleges as of CUNY fall census date.Source: CUNY Office of Institutional Research and Assessment.
Indicator name: Total students served in CUNY Accelerated Study in Associate Programs (ASAP)Description: Total headcount served in CUNY Accelerated Study in Associated Programs (ASAP) at CUNY
community colleges as of CUNY fall census date.Source: CUNY Office of Institutional Research and Assessment.
Indicator name: Total full-time equivalent enrollment (FTEs)Description: The total number of full-time equivalent (FTE) student enrollment in CUNY. Fifteen credits plus
hours is considered full-time at the undergraduate level; 12 credits is full-time at the graduate level. Full-time doctoral study is defined differently for students at different stages of the doctoral program.
Source: CUNY Office of Institutional Research and Assessment.
Indicator name: Total headcount enrollment at CUNY community collegesDescription: The total headcount enrollment at CUNY community colleges as of CUNY fall census data.Source: CUNY Office of Institutional Research and Assessment.
Indicator name: Enrollment of first-time freshmen in CUNY community college Description: The total number of full-time freshmen enrolled in a CUNY community college in the fall term.Source: CUNY Office of Institutional Research and Assessment.
Indicator name: Enrollment of first-time freshmen in CUNY senior colleges Description: The total number of first-time freshmen enrolled in a CUNY senior college in the fall term.Source: CUNY Office of Institutional Research and Assessment.
Indicator name: Enrollment of first-time freshmen in CUNY community colleges who are recent graduates of NYC public high schools
Description: The number of students enrolled in a CUNY community college who graduated within the past 15 months from a NYC public or private high school.
Source: CUNY Office of Institutional Research and Assessment.
Indicator name: Annual tuition at CUNY community colleges (full-time NYS resident)Description: The annual tuition for a New York State resident enrolling full time at a CUNY community college.Source: CUNY Office of Institutional Research and Assessment.
Indicator name: Annual tuition at CUNY senior colleges (full-time NYS resident)Description: The annual undergraduate tuition for a New York State resident enrolling full time at a CUNY
senior college.Source: CUNY Office of Institutional Research and Assessment.
Indicator name: Expenditures per student (full-time equivalent) at CUNY community collegesDescription: The total expenditures of CUNY community colleges divided by the full-time equivalent (FTE)
enrollment at the community colleges. Note: FTE for each enrolled student is based on the number of credits of the courses the student is enrolled in that term (both equated and regular) divided by the number of credits defined as full-time status (15 for undergraduates).
Source: CUNY Office of Institutional Research and Assessment.

Indicator Definitions | Page 161
City University of New York
Indicator name: Percentage of CUNY community college students receiving federal financial aid (Pell) (%)Description: The percentage of students at CUNY community colleges who receive Pell grants or other forms
of federal aid.Source: CUNY Office of Institutional Research and Assessment.
Indicator name: Percentage of CUNY community college students receiving Tuition Assistance Program (TAP) grants (%)
Description: The percentage of students at CUNY community colleges who receive Tuition Assistance Program (TAP) grants.
Source: CUNY Office of Institutional Research and Assessment.

Page 162 | Mayor’s Management Report
City University of New York
Indicator Definitions | Page 163
Department of Small Business Services
Indicator name: Unique customers and businesses servedDescription: This indicator refers to the number of unique customers and businesses served by DBS. Counts
all customers and entities served once.Source: Division of Business Services (DBS). Indicator name: Unique businesses receiving financial awards (facilitated or disbursed)Description: This indicator will count the number of unique businesses served by DBS programs disbursing or
facilitating financial awards. Awards include grants and debt capital (through third party lenders).Source: Division of Business Services (DBS).
Indicator name: Financial awards to businesses (facilitated or disbursed)Description: This indicator refers to the number of financial awards to businesses that has been disbursed
and/or facilitated by DBS programs. Awards include grants and debt capital (through third party lenders).
Source: Division of Business Services (DBS).
Indicator name: Value of financial awards to businesses (facilitated or disbursed) ($000)Description: This indicator refers to the dollar value of the financial awards to businesses that have been
disbursed and/or facilitated by DBS programs. Financial awards include grants and debt capital.Source: Division of Business Services (DBS). Indicator name: Businesses opened with assistance from SBSDescription: This indicator will count the number of unique businesses opened with the assistance of SBS
programs.Source: Division of Business Services (DBS). Indicator name: Projected number of hires by businesses opened with assistance from SBSDescription: This indicator will count the number of projected hires for businesses opened with assistance
from DBS programs.Source: Division of Business Services (DBS).
Indicator name: Unique customers served by programs that help navigate governmentDescription: This indicator will count the number of unique customers served by DBS Navigating Government
services.Source: Division of Business Services (DBS).
Indicator name: Value of Energy Cost Savings Program savings for businesses ($000) Description: Total estimated annual dollar value of utility discounts for businesses approved for ECSP benefits
during the fiscal year.Source: Division of Business and District Development. Indicator name: Jobs created or retained by Energy Cost Savings ProgramDescription: Total number of full-time employees at the time company was approved for ECSP benefits.Source: Division of Business and District Development.
Indicator name: Value of Lower Manhattan Energy Program savings for active commercial tenants (cumulative) ($000)
Description: Additive annual dollar value of savings on electrical utility costs of all buildings receiving LMEP benefits.
Source: Division of Business and District Development.
Indicator name: Commercial tenants active in Lower Manhattan Energy ProgramDescription: Number of commercial tenants active within buildings approved for LMEP benefits.Source: Division of Business and District Development.
Page 164 | Mayor’s Management Report
Department of Small Business Services
Indicator name: Workforce1 systemwide job placements and promotionsDescription: Number of jobseekers registered through the Workforce1 system who found employment or
obtained promotions during the time period.Source: Division of Workforce Development. Indicator name: New jobseekers registered through the Workforce1 Career Center systemDescription: The number of new jobseekers registered in the Workforce1 Career Center system. Source: Division of Workforce Development. Indicator name: Walk-in traffic at Workforce1 CentersDescription: The number of new jobseekers visiting Workforce1 Career Centers, Sector Centers, Expansion
Center or Employment Works during the reporting period.Source: Division of Workforce Development.
Indicator name: Customers enrolled in training Description: The number of customers registered with the Workforce1 system who enrolled in an associated
training program, including training funds, on-the-job training, individual training grants and occupational training cohorts.
Source: Division of Workforce Development.
Indicator name: Unique customers served Description: The number of unduplicated customers who received value-added services through the
Workforce1 system – not including activities such as registration or brief orientations – that contribute to clients attaining positive employment or educational outcomes.
Source: Division of Workforce Development.
Indicator name: Businesses awarded funding for employer-based training Description: The number of businesses awarded dollars for employer-based training programs, such as NYC
Business Solutions training funds and On-The-Job Training funds. Source: Business Development Division.
Indicator name: City block faces receiving supplemental sanitation services through BIDsDescription: The number of block faces in zones obtaining supplemental sanitation services financed through
Business Improvement Districts (BIDs) in the City during the reporting period.Source: Business Improvement District Oversight.
Indicator name: Average acceptably clean BID sidewalk ratings (%)Description: Percent of sample block faces in selected Business Improvement Districts (BIDs) rated
acceptably clean by Mayor’s Office field inspectors, based on a seven-point picture-based rating scale. Ratings are averaged across BIDs that perform sanitation services and for which data is available for the reporting periods currently presented. Figures show averages based on monthly ratings of each BID.
Source: Mayor’s Office of Operations.
Indicator name: Value of AvenueNYC local development corporations funding ($000,000)Description: The total dollar value of grants distributed to local development corporations through AvenueNYC
programs. These funds are a combination of federal Community Development Block Grant dollars and City tax-levy dollars. AvenueNYC is a competitive grant program that funds locally based organizations to carry out commercial revitalization activities.
Source: Business Development Division.
Indicator name: Total Minority and Women-owned Business Enterprises certifiedDescription: Total number of businesses certified with the Minority/Women-owned Business Enterprise
Program at the end of the given period.Source: Division of Economic & Financial Opportunity.
Indicator Definitions | Page 165
Department of Small Business Services
Indicator name: Minority and Women-owned Business Enterprises awarded City contractsDescription: A count of unique certified M/WBEs that have been awarded City contracts.Source: Division of Economic & Financial Opportunity. Indicator name: M/WBEs awarded contracts after receiving procurement and capacity building assistance Description: A count of unique certified M/WBEs that have been awarded City contracts after receiving
procurement and capacity building services from the Division of Economic and Financial Opportunity (DEFO). These services include assistance with purchasing, bonding, financing, and other forms of technical assistance.
Source: Division of Economic & Financial Opportunity.
Indicator name: Annual M/WBE recertification rateDescription: Ratio of the total number of M/WBEs recertifying to the total number of certified Minority and
Women-owned Business Enterprise (M/WBE) firms due to expire in a given year.Source: Division of Economic & Financial Opportunity.
Indicator name: Newly certified and recertified businesses in M/WBE ProgramDescription: Number of businesses in the New York City 13-county metropolitan area, ownership of which is at
least 51 percent by women and/or minorities that have been newly certified or recertified by SBS to be published in the SBS Minority and Women-owned Business Enterprise (M/WBE) Program directory.
Source: Division of Economic & Financial Opportunity.
Indicator name: CORE customer experience rating (0-100)Description: An average score based on the rating of 15 conditions, including physical conditions (e.g.,
cleanliness, litter, seating) and customer service conditions (e.g., wait time, professionalism), for all agency walk-in facilities inspected, divided by the number of walk-in facilities inspected. Each of the 15 conditions can be rated excellent, good, fair or poor. Ratings of excellent are worth 100 points each, good ratings are worth 67 points, fair ratings are worth 33 points and poor ratings receive no points. Facilities are rated by trained City inspectors. Fiscal 2016 data for the overall rating represents a change in methodology. For agencies with multiple service centers, inspectors focused on sites that had historically lower scores, specifically sites that received an average overall site score of 85 or lower over the last three years and sites that received a score of 85 or lower in Fiscal 2015. If all agency service centers scored above 85 last year, the service center with the lowest overall score was inspected.
Source: Mayor’s Office of Operations – SCOUT.
Indicator name: Letters responded to in 14 days (%)Description: The percentage of letters answered in 14 calendar days or less. Responses should be
substantive and adequately address the question/issue raised by the customer. A simple acknowledgement is not considered an adequate response. However, for more complex inquiries that require research and action on the part of the agency, an acknowledgement which includes a description of the next step (either on the agency’s behalf, or the customer’s), as well as an estimated time frame for completion, is considered acceptable and can be reported as part of the 14 day response. Agencies must internally track the additional time until a customer has a complete and full response.
Source: Department of Small Business Services

Page 166 | Mayor’s Management Report
Department of Small Business Services
Indicator name: E-mails responded to in 14 days (%)Description: The percentage of e-mails answered in 14 calendar days or less. Responses should be
substantive and adequately address the question/issue raised by the customer. A simple acknowledgement is not considered an adequate response. However, for more complex inquiries that require research and action on the part of the agency, an acknowledgement which includes a description of the next step (either on the agency’s behalf, or the customer’s), as well as an estimated time frame for completion, is considered acceptable and can be reported as part of the 14 day response. Agencies must internally track the additional time until a customer has a complete and full response.
Source: Department of Small Business ServicesIndicator name: Completed customer requests for interpretationDescription: The sum of all requests for interpretation using a language other than English fulfilled by the
agency via telephone (including Language Line, call centers, offices/reception desks and 311 transfer calls) and via face-to-face interaction with bilingual employees or contracted interpreters.
Source: Department of Small Business Services

Indicator Definitions | Page 167
Department of Veterans’ Services
Indicator name: Homeless veterans and their families who received housing through DVS Vet Peer Coordinator program
Description: The number of veterans and veteran families that find housing with the assistance of the DVS Veteran Peer Coordinator program. The program provides peer-to-peer housing assistance to veterans and their families, helping them navigate the process of finding, applying for and moving into an affordable apartment that meets their needs.
Source: DVS data. Indicator name: Veterans and their families receiving homelessness prevention assistance from DVS Description: The number of veterans and their families that received homelessness prevention assistance by
DVS. Prevention assistance includes landlord mediation, assistance with paying rent arrears and connecting veterans and their families to the social services and other supports needed to remain stably housed.
Source: DVS data. Indicator name: Veterans and their families engaged by DVSDescription: The number of times DVS engaged with veterans or their families by providing any type of
information or support.Source: DVS data.
Indicator name: Veterans and their families given assistance to access resourcesDescription: The number of unique assistance requests received from veterans and their families supported
via phone, in-person, postal mail, electronic mail or VetConnectNYC. Support involves connecting veterans and their families to a coordinated network of public, private and non-profit organizations.
Source: DVS data.

Page 168 | Mayor’s Management Report
Department of Veterans’ Services

Infrastructure and Sustainability

Infrastructure and Sustainability
Department of Transportation
Department of Environmental Protection
p 171
p 177
Department of Buildings
Department of Design and Construction
p 185
p 193
Indicator Definitions | Page 171
Department of Environmental Protection
Indicator name: Samples testing positive for coliform bacteria (%)Description: The percent of samples of City drinking water testing positive for coliform bacteria during the
period. This is a standard evaluation of the microbiological purity of drinking water. Source: Bureau of Water Supply, Water Quality Directorate
Indicator name: In-City samples meeting water quality standards for coliform bacteria (%)Description: The percent of time the City drinking water meets the State quality standard for coliform bacteria.
This is a standard measure of microbiological purity for drinking water.Source: Bureau of Water Supply, Water Quality Directorate.
Indicator name: Water supply—Critical equipment out of service (%)Description: The number of pieces of equipment throughout the City’s watershed areas and other upstate
conveyance structures that have been identified as critical to the operation and that are out of service as a percent of the overall number of pieces of equipment that have been identified as critical.
Source: Bureau of Water Supply, Operations Directorate.
Indicator name: Facility security checksDescription: The number of security checks conducted at DEP facilities by the DEP Police. Examples of
facilities that are checked include shaft sites, lab buildings, offices and aqueducts. Source: Bureau of Police and Security.
Indicator name: Overall enforcement activityDescription: The number of summonses, arrests, Notices of Violation and Notices of Warning issued by the
DEP Police in the areas containing the City’s watershed and water conveyance infrastructure. This includes both penal law and Environmental Conservation Law citations.
Source: Bureau of Police and Security.
Indicator name: Sewer backup complaints receivedDescription: The total number of sewer backup complaints received during the reporting period.Source: Bureau of Water and Sewer Operations.
Indicator name: Sewer backup complaints resolved—Confirmed (on City infrastructure)Description: A sewer backup complaint is considered confirmed when, upon field investigation, it is determined
to be associated with a part of DEP’s sewer system. Indications of such failure include surcharging, temporary overtaxing, blockages, and collapses.
Source: Bureau of Water and Sewer Operations.
Indicator name: Sewer backup complaints resolved—Unconfirmed (not on City infrastructure or unfounded) Description: A sewer backup complaint is considered unconfirmed when, upon field investigation, it exhibits
none of the factors that would indicate that there is or was a problem with a part of DEP’s sewer system. In such situations, the condition can be associated with an internal condition, a problem with the private sewer connection, or may be otherwise unfounded.
Source: Bureau of Water and Sewer Operations.
Indicator name: Sewer backup resolution time (hours)Description: The average amount of time that DEP takes to resolve a sewer backup from the time the
complaint is received. Resolution of a complaint can occur by a clearing of a blockage or an inspection that reveals no backup or that the problem is on private infrastructure.
Source: Bureau of Water and Sewer Operations.
Page 172 | Mayor’s Management Report
Department of Environmental Protection
Indicator name: Street segments with confirmed sewer backup in the last 12 months (% of total segments)Description: The number of street segments in the City that had at least one confirmed sewer backup
complaint during the last 12 months as a percent of the overall number of street segments in the City. A segment is the distance from one intersecting street to the next.
Source: Bureau of Water and Sewer Operations. Indicator name: Street segments with recurring confirmed sewer backups in the last 12 months (% of total
segments)Description: The number of street segments in the City that had more than one confirmed sewer backup
complaint during the last 12 months as a percent of the overall number of street segments in the City. A segment is the distance from one intersecting street to the next.
Source: Bureau of Water and Sewer Operations. Indicator name: Street cave-in complaints receivedDescription: The total number of complaints received by the Department concerning street cave-ins or street
depressions during the reporting period. A cave-in is described as the collapse of roadway surface in which the pavement has cracked and fallen into a deep empty space without a solid bottom beneath the street surface.
Source: Bureau of Water and Sewer Operations.
Indicator name: Average time to respond to street cave-in complaints and make safe (days) Description: The average number of calendar days it took DEP to respond to street cave-in/depression
complaints and resolve related danger during the period.Source: Bureau of Water and Sewer Operations.
Indicator name: Water main breaksDescription: The number of water main breaks responded to by DEP.Source: Bureau of Water and Sewer Operations.
Indicator name: Water main breaks per 100 miles of main in the last 12 monthsDescription: The number of water main breaks per 100 miles of main during the last 12 months.Source: Bureau of Water and Sewer Operations.
Indicator name: Average time to restore water to customers after confirming breaks (hours)Description: The average number of hours that it takes DEP to restore water service to affected customers
from the time the water to the main with the break is shut off until it is restored.Source: Bureau of Water and Sewer Operations. Indicator name: Broken and inoperative hydrants (%)Description: The percent of all hydrants in the City which are broken and inoperative. There are approximately
110,180 fire hydrants in the City. Source: Bureau of Water and Sewer Operations.
Indicator name: Average time to repair or replace high-priority broken or inoperative hydrants (days)Description: The average number of calendar days it takes DEP to fix a high-priority broken or inoperative
hydrant. High-priority repairs and replacements are designated by the NYC Fire Department. Source: Bureau of Water and Sewer Operations.
Indicator name: Catch basin complaints receivedDescription: The total number of clogged catch basin complaints received during the reporting period.Source: Bureau of Water and Sewer Operations.

Indicator Definitions | Page 173
Department of Environmental Protection
Indicator name: Catch basin backup resolution time (days)Description: The average number of calendar days between receipt and resolution for complaints of clogged
catch basins. One complaint can involve multiple catch basins. Source: Bureau of Water and Sewer Operations.
Indicator name: Catch basins surveyed/inspected (%) (cumulative)Description: The percent of the total catch basins inspected by DEP to identify those in need of cleaning,
hooding and/or repair.Source: Bureau of Water and Sewer Operations.
Indicator name: Catch basins cleanedDescription: The total number of catch basins cleaned; includes both programmed and complaint cleaning.Source: Bureau of Water and Sewer Operations.
Indicator name: Backlog of catch basin repairs (% of system)Description: The number of catch basins with open repair work orders as a percent of the overall number of
catch basins citywide.Source: Bureau of Water and Sewer Operations.
Indicator name: Leak complaints receivedDescription: The total number of leak complaints received during the reporting period; includes complaints on
both City and private infrastructure.Source: Bureau of Water and Sewer Operations.
Indicator name: Leak resolution time (days) (City infrastructure only)Description: The average time in calendar days it took for City infrastructure related complaints to be resolved.Source: Bureau of Water and Sewer Operations. Indicator name: Water resource recovery facility (WRRF) effluent meeting federal standards (%)Description: The percent of treated wastewater leaving in-City treatment plants that meets federal standards
for suspended solids and biochemical oxygen demand.Source: Bureau of Wastewater Treatment, Division of Facility Operations.
Indicator name: WRRFs—Critical equipment out-of-service (% below minimum)Description: There are certain types of equipment at wastewater treatment plants, such as main sewage
pumps, that are critical to the treatment of sewage. For each of these equipment types, each of the City’s 14 wastewater treatment plants establishes the minimum number which must be in service in order to treat the industry standard of two times dry weather flow. This indicator reports the total number of unit types that were below the required number at any time during the month as a percent of total critical equipment units (the aggregate of number and type).
Source: Bureau of Wastewater Treatment, Division of Facility Operations.
Indicator name: Estimated bills (%)Description: The proportion of water and sewer bills mailed that are not based on actual meter readings.Source: Bureau of Customer Services. Indicator name: Total revenue collected ($000,000)Description: Total amount of money collected by DEP for water and sewer charges.Source: New York City Water Board.
Page 174 | Mayor’s Management Report
Department of Environmental Protection
Indicator name: Total revenue as percent of target (%) Description: Total monies actually collected by DEP for water and sewer charges as a percentage of planned
collections for the period.Source: Bureau of Customer Services.
Indicator name: Accounts receivable—Total balance ($000,000) Description: The net value, in millions of dollars, of all charges due for water and sewer use. For a small
percentage of customers who are billed on an annual basis, versus quarterly, bills are issued near the end of the fiscal year, resulting in a temporary spike in the accounts receivable. Most of these customers pay their annual bills during the first quarter of the new fiscal year, bringing the accounts receivable balance back down by the end of the July to October reporting period (Preliminary Mayor’s Management Report).
Source: Bureau of Customer Services.
Indicator name: Billed amount collected in 30 days (%)Description: The percent of the billed amount that is collected by DEP with 30 days of distribution.Source: Bureau of Customer Services.
Indicator name: Air complaints receivedDescription: The total number of air quality complaints received during the reporting period.Source: Bureau of Environmental Compliance.
Indicator name: Average days to close air quality complaintsDescription: The average number of calendar days between receipt of an air quality complaint and closure of
the complaint for complaints closed during the reporting period. A complaint is closed when no further action will be taken on it by DEP. This includes instances where, upon investigation, no infractions of applicable rules/regulations were found, or infractions were present and a Notice of Violation was issued.
Source: Bureau of Environmental Compliance.
Indicator name: Air complaints responded to within seven days (%)Description: The percent of complaints concerning air quality responded to within seven calendar days of
receipt.Source: Bureau of Environmental Compliance.
Indicator name: Noise complaints received Description: The total number of noise complaints received during the reporting period.Source: Bureau of Environmental Compliance.
Indicator name: Average days to close noise complaintsDescription: The average number of calendar days between receipt of a noise complaint and closure of the
complaint for complaints closed during the reporting period. A complaint is closed when no further action will be taken on it by DEP. This includes instances where, upon investigation, no infractions of applicable rules/regulations were found, or infractions were present and a Notice of Violation was issued.
Source: Bureau of Environmental Compliance.
Indicator name: Noise complaints not requiring access to premises responded to within seven days (%)Description: Percent of complaints concerning noise, not requiring scheduling with the complainant,
responded to within seven calendar days.Source: Bureau of Environmental Compliance.
Indicator name: Asbestos complaints receivedDescription: The total number of asbestos complaints received during the reporting period.Source: Bureau of Environmental Compliance.
Indicator Definitions | Page 175
Department of Environmental Protection
Indicator name: Average days to close asbestos complaintsDescription: The average number of calendar days between receipt of an asbestos complaint and closure
of the complaint for complaints closed during the reporting period. A complaint is closed when the asbestos issue described in the complaint has either been resolved or determined to be unfounded based on the Department’s inspection; when the complaint location is an abandoned building and access is not possible; or when more information is required and contact information for the complainant is not available. If the Department issues a Notice of Violation for infractions of applicable rules/regulations and corrective action is required, then a follow-up inspection is done to ensure compliance.
Source: Bureau of Environmental Compliance. Indicator name: Asbestos complaints responded to within three hours (%)Description: The percent of complaints concerning asbestos responded to within three hours of receipt.Source: Bureau of Environmental Compliance.
Indicator name: Total violations issued Description: The total number of violations issued for all DEP service areas.Source: NYC Office of Administrative Trials and Hearings, Environmental Control Board.
Indicator name: Violations admitted to or upheld at the Environmental Control Board (%)Description: For all violations returnable to the Environmental Control Board (ECB), the number of violations
where the respondent admitted to the violation without a hearing and paid the penalty, if applicable, or where the violation was upheld following an ECB hearing as a percent of all violations resolved.
Source: NYC Office of Administrative Trials and Hearings, Environmental Control Board.
Indicator name: Collisions involving City vehiclesDescription: The total number of City-vehicle involved collision reports involving injury or property damage
for the DEP fleet reported in the citywide collision reporting system (CRASH). New York State MV-104 reports are required whenever a collision occurs involving death, or other personal injury, or property damage over $1,000. Collisions are tracked and reported regardless of whether or not the driver was at fault and whether or not the vehicle was in motion. Collisions involving City vehicles occur whenever a City vehicle strikes (or is struck by) a second vehicle, pedestrian, bicyclist or fixed object.
Source: Citywide Fleet Management at DCAS.
Indicator name: Workplace injuries reportedDescription: All incidents resulting in a workers’ compensation or line of duty injury claim regardless of whether
or not time is lost.Source: Organizational Development and Human Resources.
Indicator name: E-mails responded to in 14 days (%)Description: The percentage of e-mails answered in 14 calendar days or less. Responses should be
substantive and adequately address the question/issue raised by the customer. A simple acknowledgement is not considered an adequate response. However, for more complex inquiries that require research and action on the part of the agency, an acknowledgement which includes a description of the next step (either on the agency’s behalf, or the customer’s), as well as an estimated time frame for completion, is considered acceptable and can be reported as part of the 14 day response. Agencies must internally track the additional time until a customer has a complete and full response.
Source: Bureau of Customer Services.

Page 176 | Mayor’s Management Report
Department of Environmental Protection
Indicator name: Letters responded to in 14 days (%)Description: The percentage of letters answered in 14 calendar days or less. Responses should be
substantive and adequately address the question/issue raised by the customer. A simple acknowledgement is not considered an adequate response. However, for more complex inquiries that require research and action on the part of the agency, an acknowledgement which includes a description of the next step (either on the agency’s behalf, or the customer’s), as well as an estimated time frame for completion, is considered acceptable and can be reported as part of the 14 day response. Agencies must internally track the additional time until a customer has a complete and full response.
Source: Bureau of Customer Services and Commissioner’s Office.
Indicator name: Calls answered in 30 seconds (%)Description: The percentage of calls answered by a call center representative in 30 seconds or less. Time
begins after initial prerecorded message. Source: Bureau of Customer Services.
Indicator name: Average customer in-person wait time (minutes)Description: The average time in minutes from the time a customer meets with a greeter or information desk
representative until he or she is met by a customer service representative. Security/building entry wait times are not included unless a security guard plays a formal intake role.
Source: Bureau of Customer Services.
Indicator name: Completed customer requests for interpretationDescription: The sum of all requests for interpretation using a language other than English fulfilled by the
agency via telephone (including Language Line, call centers, offices/reception desks and 311 transfer calls) and via face-to-face interaction with bilingual employees or contracted interpreters.
Source: Bureau of Customer Services.
Indicator name: Visitors rating customer service at borough centers as good or better (%)Description: The number of customers surveyed at DEP’s five borough offices who rated their overall
customer service experience as good or excellent as a percent of all customers who completed surveys.
Source: Bureau of Customer Services.
Indicator name: CORE customer experience rating (0–100)Description: An average score based on the rating of 15 conditions, including physical conditions (e.g.,
cleanliness, litter, seating) and customer service conditions (e.g., wait time, professionalism), for all agency walk-in facilities inspected, divided by the number of walk-in facilities inspected. Each of the 15 conditions can be rated excellent, good, fair or poor. Ratings of excellent are worth 100 points each, good ratings are worth 67 points, fair ratings are worth 33 points and poor ratings receive no points. Facilities are rated by trained City inspectors. Fiscal 2016 data for the overall rating represents a change in methodology. For agencies with multiple service centers, inspectors focused on sites that had historically lower scores, specifically sites that received an average overall site score of 85 or lower over the last three years and sites that received a score of 85 or lower in Fiscal 2015. If all agency service centers scored above 85 last year, the service center with the lowest overall score was inspected.
Source: Mayor’s Office of Operations—SCOUT.
Indicator name: Percent of service requests meeting time to first action Description: The percentage of service requests for which the agency met its planned time of action to provide
the service. Source: Mayor’s Office of Operations/Citywide Performance Reporting.
Indicator Definitions | Page 177
Department of Transportation
Indicator name: Bridges rated (calendar year) —Good or very good (%) —Fair (%) —Poor (%)Description: Federal and State laws mandate that bridge structures be inspected at least once every two
years. Engineering consultants from the New York State Department of Transportation perform biennial inspections for all New York City bridge structures except pedestrian bridges and structures under 20 feet in length. Bridge structures not inspected by the State are inspected by DOT’s Division of Bridges. Ratings are based on a scale from 1 to 7, and results are grouped in the following categories for each calendar year: —Very good—ratings of 6.1 to 7 —Good—ratings of 5 to 6 —Fair—ratings of 3.1 to 4.9 —Poor—ratings of 1 to 3
Source: Division of Bridges—Management and Support Services Bureau.
Indicator name: Streets maintained with a pavement rating of —Good (%) —Fair (%) —Poor (%)Description: The number of surveyed lane miles of local roadways assigned a condition rating of good, fair
or poor divided by the total number of surveyed lane miles. DOT surveys at least 50 percent of City streets each year. Ratings are based on a scale from 1 to 10, and results are grouped in the following categories for each fiscal year:
—Good (%)—ratings of 8 to 10 —Fair (%)—ratings of 4 to 7 —Poor (%)—ratings of 1 to 3Source: Division of Roadway Repair & Maintenance—Resource Management Unit.
Indicator name: Average time to close a pothole work order where repair was done (calendar days)Description: The average number of calendar days it takes to close a pothole work order where at least one
repair was completed. This includes potholes reported through 311 and online, as well as field pickups noted by DOT personnel.
Source: Division of Roadway Repair & Maintenance—Resource Management Unit.
Indicator name: Pothole work ordersDescription: The number of new work orders opened for potholes on streets (excludes work orders for bridges
and arterial highways). Potholes are reported through calls to the 311 Customer Service Center, e-mails and written correspondence by the public, elected officials, or agency personnel during the course of inspections. A work order may include multiple potholes.
Source: Division of Roadway Repair & Maintenance—Resource Management Unit.
Indicator name: Potholes repaired—Arterial highway systemDescription: The number of potholes and other small street defects corrected on arterial streets. Note: these
arterials are highways that DOT is responsible for.Source: Division of Roadway Repair & Maintenance—Resource Management Unit.
Indicator name: Potholes repaired—Local streetsDescription: The number of potholes and other small street defects corrected on local streets.Source: Division of Roadway Repair & Maintenance—Resource Management Unit.
Page 178 | Mayor’s Management Report
Department of Transportation
Indicator name: Lane miles resurfaced citywide (in-house)Description: The total length of roadway that was milled and resurfaced with new asphalt topping in each
of the five boroughs and on arterial highways, measured in units 12 feet wide and one mile in length. Only includes work done by in-house staff.
Source: Division of Roadway Repair & Maintenance—Resource Management Unit.
Indicator name: Average cost per lane mile resurfaced citywide ($)Description: Expenditures for milling and paving divided by the number of lane miles resurfaced. Expenditures
reflect the cost of in-house resurfacing operations, including labor, materials, capital, and overhead, as well as payments to contractors, but does not include contract milling costs.
Source: Division of Roadway Repair & Maintenance—Resource Management Unit.
Indicator name: Average in-house cost of asphalt per ton ($)Description: Hamilton Avenue Asphalt Plant and Harper Street Asphalt Plant expenditures totaled and divided
by the total number of tons of asphalt produced. Expenditures include only in-house cost of asphalt production, including labor, materials, capital, and overhead.
Source: Division of Roadway Repair & Maintenance—Resource Management Unit. Indicator name: Average vendor cost of asphalt per ton ($)Description: Payments to vendors divided by the total number of tons received from vendors. Costs include
only payments to vendors.Source: Division of Roadway Repair & Maintenance—Resource Management Unit.
Indicator name: Construction permits issued Description: The number of permits issued for street openings, building operations, sidewalk construction,
canopies and miscellaneous purposes.Source: Division of Sidewalks and Inspection Management—Highway Inspection and Quality Assurance
Unit. Indicator name: Inspections of permitted street work Description: The number of inspections of permit-based street construction work conducted by the Highway
Inspection and Quality Assurance Unit.Source: Division of Sidewalks and Inspection Management—Highway Inspection and Quality Assurance
Unit. Indicator name: Permitted jobs passing inspection (%)Description: The number of permitted jobs passing inspection divided by the total number of permitted jobs
inspected.Source: Division of Sidewalks and Inspection Management—Highway Inspection and Quality Assurance
Unit.
Indicator name: Post-audit inspections for completed street workDescription: The total number of inspections of street work performed after the expiration of the construction
permit to determine if the street has been properly restored after construction was finished. Source: Division of Sidewalks and Inspection Management—Highway Inspection and Quality Assurance
Unit. Indicator name: Post-audit inspections for completed street work that passed inspection (%)Description: The total number of passed post-audit inspections divided by the total number of post-audit
inspections.Source: Division of Sidewalks and Inspection Management—Highway Inspection and Quality Assurance
Unit.
Indicator Definitions | Page 179
Department of Transportation
Indicator name: Adopt-A-Highway adoption rate (%)Description: The number of miles of the City’s highway system for which maintenance is sponsored through
the Adopt-A-Highway Program divided by 362, the total number of adoptable highway miles. Source: Division of Roadway Repair & Maintenance—Arterial Maintenance Unit.
Indicator name: Adopted highway miles that receive a service rating of good (%)Description: The number of adopted highway miles that were inspected by DOT and assigned a service rating
of good divided by the total number of inspected miles. Service tasks include litter removal, mechanical sweeping and beautification and can vary by segment. DOT sets both the service (task) for the adopted segment and the level of service (i.e., frequency) to be provided by the contractor.
Source: Division of Roadway Repair & Maintenance—Arterial Maintenance Unit.
Indicator name: Parking meters that are operable (%)Description: The number of muni-meters that are functioning divided by the total number of muni-meters. A
meter’s operability is determined electronically or by inspection.Source: Division of Traffic Operations—Parking Operations.
Indicator name: Total violations issued Description: Total number of violations issued for all DOT service areas.Source: Division of Sidewalks and Inspection Management—Highway Inspection and Quality Assurance
Unit.
Indicator Name: Violations admitted to or upheld at the Office of Administrative Trials and Hearings (%)Description: For all violations returnable to OATH, the number of violations where the respondent admitted to
the violation and paid the penalty without a hearing or where the violation was upheld following a hearing as a percent of all violations resolved.
Source: Office of Administrative Trials and Hearings (OATH).
Indicator name: Average time to respond to high priority traffic signal defect and make safe (hours: minutes)Description: The average number of hours it takes DOT contractors to repair and restore signal operation for
defects requiring a two-hour response time. A repair can be temporary or permanent provided that the signal problem at the intersection is corrected and made safe.
Source: Division of Traffic Operations—Signal Engineering and Street Lighting
Indicator name: Average time to repair priority regulatory signs after notification (business days) Description: The average number of business days it takes to repair priority regulatory signs (e.g., Stop, Yield,
Do Not Enter, and One-Way) after notification to DOT.Source: Division of Transportation Planning & Management—Traffic Control and Engineering Indicator name: Average time to repair street lights—by DOT (calendar days) Description: The average number of calendar days it takes DOT to repair streetlights.Source: Division of Traffic Operations—Street Lighting Unit.
Indicator name: Average time to repair street lights—by ConEd (calendar days) Description: The average number of calendar days it takes Con Edison to repair streetlights, for cases where
repairs to Con Edison equipment is required to restore electricity.Source: Division of Traffic Operations—Street Lighting Unit.
Indicator name: Overall traffic crashesDescription: The total number of traffic crashes as initially reported in the Accident Information System (AIS),
including those on highways and bridges. Data is entered by NYPD staff into AIS and forwarded to NYCDOT’s data warehouse.
Source: Division of Transportation Planning & Management—Research, Implementation & Safety
Page 180 | Mayor’s Management Report
Department of Transportation
Indicator name: Citywide traffic fatalitiesDescription: The total number of pedestrian, motorist, bicyclist, and passenger deaths resulting from traffic
crashes. Data reflects crash-related fatalities during the reporting period. Data is typically collected 30 days after the close of the reporting period.
Source: Division of Transportation Planning & Management—Research, Implementation & Safety / Chief of Transportation—New York City Police Department.
Indicator name: Traffic fatalities—Bicyclists/pedestrians Description: The number of bicyclist and pedestrian deaths resulting from traffic crashes. Data reflects crash-
related fatalities during the reporting period. Data is typically collected 30 days after the close of the reporting period.
Source: Division of Transportation Planning & Management—Research, Implementation & Safety / Chief of Transportation—New York City Police Department.
Indicator name: Traffic fatalities—Motorists/passengersDescription: The number of motorist and passenger deaths resulting from traffic crashes. Data reflects crash-
related fatalities during the reporting period. Data is typically collected 30 days after the close of the reporting period.
Source: Division of Transportation Planning & Management—Research, Implementation & Safety / Chief of Transportation—New York City Police Department.
Indicator name: Collisions involving DOT vehiclesDescription: The total number of City-vehicle involved collision reports involving injury or property damage for
the DOT fleet reported in the citywide collision reporting system (CRASH). New York State MV-104 reports are required whenever a collision occurs involving death, or other personal injury, or property damage over $1,000. Collisions are tracked and reported regardless of whether or not the driver was at fault and whether or not the vehicle was in motion. Collisions involving City vehicles occur whenever a City vehicle strikes (or is struck by) a second vehicle, pedestrian, bicyclist or fixed object.
Source: Citywide Fleet Management at DCAS.
Indicator name: Speed humps installedDescription: The number of new speed humps installed. Speed humps (also known as speed reducers) are
traffic calming devices designed to slow vehicle speeds to either 15 or 20 mph. Speed humps are located mostly on residential streets.
Source: Division of Transportation Planning & Management—Research, Implementation & Safety .
Indicator name: Pavement safety markings installed (000,000) (linear feet)Description: The number of new and replacement pavement safety markings installed (4” width) measured in
million linear feet (MLF). Safety markings are durable and reflective material applied to pavement to guide and inform all street/highway users—including people walking, bicycling, and operating motor vehicles. Markings designate lane positioning, convey regulation, reinforce signing, and delineate conflict points.
Source: Division of Transportation Planning & Management—Highway Design and Construction.
Indicator name: Intersections with accessible pedestrian signals installedDescription: The number of intersections with accessible pedestrian signals (APS) installed. APS are
devices affixed to pedestrian signal poles to assist blind or low vision pedestrians in crossing the street. APS are wired to a pedestrian signal and send audible and vibrotactile indications when pedestrians push a button installed at the crosswalk.
Source: Division of Traffic Operations—Signal Engineering.

Indicator Definitions | Page 181
Department of Transportation
Indicator name: Injury crashesDescription: The total number of traffic crashes that resulted in injury, including those on highways and
bridges. Data is entered by NYPD staff into AIS (Accident Information System) and forwarded to NYCDOT’s Data Warehouse.
Source: Division of Transportation Planning & Management—Office of Research, Implementation, and Safety.
Indicator name: Leading pedestrian intervals (LPIs) installedDescription: The number of Leading Pedestrian Intervals (LPIs) installed. LPIs allow pedestrians a “head start”
of several seconds on the walk signal before parallel vehicular traffic receives a green light, which enhances pedestrian visibility to turning drivers.
Source: Division of Traffic Operations—Signal Engineering.
Indicator name: Staten Island Ferry—Customer accident injury rate (per million passengers)Description: The number of ferry passengers, per one million passengers, that reported an injury and
requested professional medical treatment. Source: Division of the Staten Island Ferry.
Indicator name: Staten Island Ferry—Trips that are on time (%)Description: The overall percent of Staten Island Ferry trips completed on schedule.Source: Division of the Staten Island Ferry.
Indicator name: Staten Island Ferry—Ridership (000)Description: The number of passengers traveling on the Staten Island Ferry. Source: Division of the Staten Island Ferry. Indicator name: Staten Island Ferry—Average cost per passenger per trip ($)Description: Total Staten Island Ferry operating expenses, including labor, materials, and equipment, divided
by the total number of passengers carried. Source: Division of the Staten Island Ferry.
Indicator name: Private ferry service—Total ridership (000)Description: The total ridership of commuters traveling on private ferries as reported to DOT by the individual
companies: Hornblower (operator of NYC Ferry), Billybey, New York Waterway, New York Water Taxi, Seastreak and Liberty Landing.
Source: Division of Passenger Transport—Private Ferries Program.
Indicator name: Private ferry service—Number of permanent routes Description: The average number of permanent private ferry routes operating from Monday through Friday.
The private ferry operators are Hornblower (operator of NYC Ferry), Billybey, New York Waterway, New York Water Taxi, Seastreak and Liberty Landing.
Source: Division of Passenger Transport—Private Ferries Program.
Indicator name: Citi Bike annual membershipDescription: Total count of Citi Bike annual memberships activated, including renewals.Source: Department of Transportation Planning & Management—Bike Share Program.
Indicator name: Citi Bike—Trips (000)Description: Total count of Citi Bike trips by all users (annual and short-term members).Source: Department of Transportation Planning & Management—Bike Share Program.
Indicator name: Bicycle lane miles—total Description: The number of bicycle lane miles (Class I protected paths, II on-street lanes, and III shared lanes)
installed during the fiscal year.Source: Division of Transportation Planning & Management—Bicycle Program.
Page 182 | Mayor’s Management Report
Department of Transportation
Indicator name: Bicycle lane miles—protected Description: Subset of ‘Bicycle lane miles—total’. The number of Class I protected bicycle paths in lane miles
installed during the fiscal year. A Class I bicycle path is a facility intended for the use of bicycles that is physically separated from motorized vehicle traffic by an open space, vertical delineation, or barrier and either within the roadway or within an independent right-of-way.
Source: Division of Transportation Planning & Management—Bicycle Program. Indicator name: Bicycle racks installed Description: The total number of bicycle racks installed by DOT or its contractors citywide. (http://www.nyc.
gov/html/dot/html/bicyclists/bicycleparking.shtml) Source: Division of Transportation Planning & Management—Bicycle Program.
Indicator name: NYC adults who bike regularly (annual) (calendar year)Description: The number of NYC adult residents who bike at least several times a month as reported in the
NYC Community Health Survey.Source: Division of Transportation Planning & Management—Bicycle Program
Indicator name: Select Bus Service ridership (000) (annual)Description: The number of passengers traveling on Select Bus Service routes during weekday and weekends
hours.Source: Metropolitan Transportation Authority—Long Range Bus Planning. Indicator name: Select Bus Service—Route miles (cumulative)Description: The total length of Select Bus Service routes, traveling one way.Source: Department of Transportation Planning & Management—Transit Development.
Indicator name: Average travel speed (miles per hour)—Manhattan Central Business DistrictDescription: The average speed of yellow taxis traveling with passengers between the hours of 8AM-6PM,
Monday-Friday, in Manhattan’s Central Business District (CBD), excluding all major US holidays. The CBD covers the entire area south of 60th Street.
Source: Division of Planning and Sustainability—Congestion Mitigation.
Indicator name: Crossing points with pedestrian ramps installed (%) Description: The number of crossing points where pedestrian ramps have been installed, facilitating access
by the disabled, divided by the number of crossing points identified as requiring a ramp. Crossing points are generally at corners but can also be at mid-block.
Source: Division of Roadway Repair & Maintenance—Resource Management Unit.
Indicator name: Pedestrian volume indexDescription: An index of pedestrian volumes—the number of pedestrians traveling on the sidewalk at 50
sample locations around the City. Sampling is conducted during one week of May and one week of September at consistent times of day and days of the week. The figure shown is a ratio using the May 2007 count as a baseline. The May 2007 count is assigned a starting value of 100, and the ratio of each new pedestrian count to the baseline count is multiplied by 100 to give the new value. A value of 102 for Spring 2008 means that pedestrian volumes at sample locations increased by approximately two percent over the May 2007 baseline.
Source: Division of Transportation Planning & Management—Pedestrian Projects Group.
Indicator name: Pedestrian space installed (square feet)Description: The number of total square feet of pedestrian space installed. Pedestrian space includes plazas,
neckdowns (curb extensions), sidewalks, safety islands, ramps, and crosswalks.Source: Division of Transportation Planning & Management—Public Space Unit.
Indicator Definitions | Page 183
Department of Transportation
Indicator name: Existing newsstands converted to new model (%)Description: The total number of new Cemusa-designed newsstands installed as part of the coordinated street
furniture program divided by the total number of newsstands. Source: Legal Affairs—Coordinated Street Furniture Franchise.
Indicator name: Bridge projects (structural work) substantially completed on schedule (%)Description: The percent of bridge (re)construction/rehabilitation projects completed on or before the
scheduled completion date, not including non-structural or minor work. Source: Division of Bridges—Management and Support Services Bureau.
Indicator name: Cases commenced against the City in state and federal courtDescription: The number of State court and federal court matters assigned a litigation start date. In cases with
payout, it will be paid from the judgment and claims account in the City’s General Fund. Source: Law Department Law Manager system. Indicator name: Payout ($000)Description: The judgment and claims amount, in thousands of dollars, paid by the City from the judgment and
claims account in the City’s General Fund to resolve cases through settlement or verdict. Source: Law Department Law Manager system.
Indicator name: Workplace injuries reportedDescription: All incidents resulting in a workers’ compensation or line of duty injury claim regardless of whether
or not time is lost.Source: Occupational Safety and Health Office (HR & Facilities).
Indicator name: E-mails responded to in 14 days (%)Description: The percentage of e-mails answered in 14 calendar days or less. Responses should be
substantive and adequately address the question/issue raised by the customer. A simple acknowledgement is not considered an adequate response. However, for more complex inquiries that require research and action on the part of the agency, an acknowledgement which includes a description of the next step (either on the agency’s behalf, or the customer’s), as well as an estimated time frame for completion, is considered acceptable and can be reported as part of the 14 day response. Agencies must internally track the additional time until a customer has a complete and full response.
Source: Customer Service Unit.
Indicator name: Letters responded to in 14 days (%)Description: The percentage of letters answered in 14 calendar days or less. Responses should be
substantive and adequately address the question/issue raised by the customer. A simple acknowledgement is not considered an adequate response. However, for more complex inquiries that require research and action on the part of the agency, an acknowledgement which includes a description of the next step (either on the agency’s behalf, or the customer’s), as well as an estimated time frame for completion, is considered acceptable and can be reported as part of the 14 day response. Agencies must internally track the additional time until a customer has a complete and full response.
Source: Customer Service Unit.
Indicator name: Calls answered in 30 seconds (%)Description: The percentage of calls answered by a call center representative in 30 seconds or less. Time
begins after initial prerecorded message. Source: Authorized Parking and Permits.
Page 184 | Mayor’s Management Report
Department of Transportation
Indicator name: Average customer in-person wait time (minutes:seconds)Description: The weighted average wait time (in minutes) for walk-in customers at the Central Manhattan
Permits Office. Security/building entry wait times are excluded unless a security plays a vital role in the process.
Source: OCMC Permits.
Indicator name: Requests for language interpretations and translations receivedDescription: The sum of all requests for interpretation using a language other than English fulfilled by the
agency via telephone (including Language Line, call centers, offices/reception desks and 311 transfer calls) and via face-to-face interaction with bilingual employees or contracted interpreters.
Source: Department of Transportation—Commissioner’s Office, Language Services.
Indicator name: CORE customer experience rating (0-100)Description: An average score based on the rating of 15 conditions, including physical conditions (e.g.,
cleanliness, litter, seating) and customer service conditions (e.g., wait time, professionalism), for all agency walk-in facilities inspected, divided by the number of walk-in facilities inspected. Each of the 15 conditions can be rated excellent, good, fair or poor. Ratings of excellent are worth 100 points each, good ratings are worth 67 points, fair ratings are worth 33 points and poor ratings receive no points. Facilities are rated by trained City inspectors. Fiscal 2016 data for the overall rating represents a change in methodology. For agencies with multiple service centers, inspectors focused on sites that had historically lower scores, specifically sites that received an average overall site score of 85 or lower over the last three years and sites that received a score of 85 or lower in Fiscal 2015. If all agency service centers scored above 85 last year, the service center with the lowest overall score was inspected.
Source: Mayor’s Office of Operations—SCOUT.
Indicator name: Percent of service requests meeting time to first action or to close Description: The percentage of service requests for which the agency met its planned time of action to provide
the service. Source: Mayor’s Office of Operations/Citywide Performance Reporting; DOT Street Lights.
Indicator Definitions | Page 185
Department of Buildings
Indicator name: Filings (DOB NOW)Description: The total number of applications filed online in DOB NOW, categorized by work type rather than
job type. Work types (such as antenna, curb cut, plumbing, and sidewalk shed) were previously included as part of the new building, major renovation (Alteration I), and minor renovation (Alterations II and III) job types currently filed in BIS.
Source: DOB NOW: Build.
Indicator name: Jobs filed (BIS)Description: The total number of applications filed in BIS, categorized by job type. Job types include new
buildings, major renovations (Alteration I) and minor renovations (Alterations II and III).Source: BIS mainframe database maintained by DOB.
Indicator name: Average customer in-person transaction time (minutes)Description: The average time to complete a transaction at the agency’s borough offices and those specialized
units that have Qmatic measured from the time a ticket is called to the time the customer has completed the transaction(s). Typical transactions include filing a job, pulling a permit and obtaining a certificate of occupancy.
Source: BIS mainframe database maintained by DOB.
Indicator name: Average customer in-person wait time (minutes)Description: The average wait time for a customer to be served at the agency’s borough offices and those
specialized units that have Qmatic measured from the time a ticket is issued to the time the customer is first helped by a Department representative.
Source: Qmatic.
Indicator name: Work permits issued—Initial (DOB NOW)Description: The total number of initial permits issued through DOB NOW, categorized by work type rather
than job type. Work types (such as antenna, curb cut, plumbing, and sidewalk shed) were previously included as part of the new building, major renovation (Alteration I), and minor renovation (Alterations II and III) job types currently filed in BIS.
Source: DOB NOW: Build.
Indicator name: Work permits issued—Renewals (DOB NOW)Description: The total number of permits previously issued through DOB NOW that were renewed during the
reporting period, categorized by work type rather than job type. Work types (such as antenna, curb cut, plumbing, and sidewalk shed) were previously included as part of the new building, major renovation (Alteration I), and minor renovation (Alterations II and III) job types currently filed in BIS.
Source: DOB NOW: Build.
Indicator name: First plan reviews completed (BIS)Description: The total number of building applications that moved to either J status (disapproved) or P status
(approved) during the reporting period. Excluded are those jobs that were administratively closed before they reached review.
Source: BIS mainframe database maintained by DOB and DOB NOW: Build.
Indicator name: First plan reviews completed (DOB NOW)Description: The total number of DOB NOW: Build building applications that moved to either objection status
or approval status during the reporting period. Excluded are those jobs that were administratively closed before they reached review.
Source: BIS mainframe database maintained by DOB and DOB NOW: Build.
Page 186 | Mayor’s Management Report
Department of Buildings
Indicator name: – Building permits issued—Initial (BIS) – New buildings – Major renovation (Alteration I) – Minor renovation (Alterations II and III) Description: The total number of initial building permits issued through BIS, categorized by job type, as well
as the respective number in each category. Job types include new buildings, major renovations (Alteration I) and minor renovations (Alterations II and III).
Source: BIS mainframe database maintained by DOB.
Indicator name: – Building permits issued—Renewals (BIS) – New buildings – Major renovation (Alteration I) – Minor renovation (Alterations II and III) Description: The total number of building permits previously issued through BIS that were renewed during the
reporting period, categorized by job type, as well as the respective number in each category. Job types include new buildings, major renovations (Alteration I) and minor renovations (Alterations II and III).
Source: BIS mainframe database maintained by DOB.
Indicator name: Certificates of Occupancy issuedDescription: The total number of initial temporary Certificates of Occupancy issued plus the number of final
Certificates of Occupancy issued during the reporting period.Source: Certificate of Occupancy Document Database (CODD) maintained by DOB.
Indicator name: – Average days to complete first plan review (Borough offices) – New buildings – Major renovation (Alteration I) – Minor renovation (Alterations II and III) Description: For plan reviews completed in the borough offices, the average number of business days for
building applications to go from D status (application processed - completed) to either J status (disapproved) or P status (approved) for each job category.
Source: BIS mainframe database maintained by DOB.
Indicator name: – Average days to complete first plan review (Hub projects) – New buildings – Major renovation (Alteration I) – Minor renovation (Alterations II and III) Description: For Hub projects, the average number of business days for building applications to go from
assigned to either J status (disapproved) or P status (approved) for each job category. Source: BIS mainframe database and SharePoint platform maintained by DOB.
Indicator name: Average days to complete first plan review (DOB NOW)Description: For plan reviews of minor renovation (Alteration type II) applications completed in DOB NOW, the
average number of business days for jobs to go from D status (application processed-completed) to either J status (disapproved) or P status (approved) for all jobs.
Source: DOB NOW database.
Indicator name: Permitted jobs professionally certified (%)Description: The percent of jobs (building applications) filed by registered architects and professional
engineers who have certified that their submissions are in compliance with the NYC Building Code and applicable zoning regulations. These jobs do not undergo a regular plan examination but are subject to random audit as well as other DOB reviews.
Source: BIS mainframe database maintained by DOB.
Indicator Definitions | Page 187
Department of Buildings
Indicator name: Permitted jobs professionally certified that were audited (%)Description: The percent of professionally certified permitted jobs (building applications) filed that were audited
by DOB staff. This includes 1) random (program) and targeted audits of jobs that are accepted and might have already received permits, and 2) zoning audits of new building, major renovations (Alteration type I) and other enlargement applications which are reviewed for compliance with the Zoning Resolution.
Source: BIS mainframe database maintained by DOB. Indicator name: - Of eligible audited jobs, the percent of audits that resulted in revocation notices (%)Description: Excluding zoning reviews, which occur before approval, the percent of professionally certified
jobs (building applications) that were audited by DOB staff after approval and/or permit issuance and for which objections pertaining to substantive issues of zoning, life safety and/or accessibility resulted in the issuance of a revocation notice. Note: An applicant must propose corrective measures within 15 calendar days of a revocation notice.
Source: BIS mainframe database maintained by DOB.
Indicator name: Average days between construction inspection request and inspectionDescription: The average number of business days between the receipt of a request for a construction
inspection and the first available date that an inspector can visit a job site.Source: DOB NOW: Inspections.
Indicator name: Average days between electrical inspection request and inspectionDescription: Appointment wait time is the average number of business days between the receipt of a request
for an electrical inspection and the first available date that an inspector can visit a job site.Source: DOB NOW: Inspections.
Indicator name: Average days between plumbing inspection request and inspection Description: Appointment wait time is the average number of business days between the receipt of a request
for a plumbing inspection and the first available date that an inspector can visit a job site.Source: DOB NOW: Inspections.
Indicator name: Average days to complete first review (DOB NOW)Description: Averaged count of business days (or fraction thereof) from filing date to first review date.Source: DOB NOW
Indicator name: Average days from filing to approval (DOB NOW) Description: Averaged count of business days (or fraction thereof) from filing date to first approval date (total
time with the agency and the applicant).Source: DOB NOW
Indicator name: Priority A (emergency) complaints receivedDescription: The number of complaints describing Priority A (emergency) conditions received by DOB. Priority
A complaints include all accidents (construction and non-construction related), fumes/smoke from a boiler, unsafe or illegal demolition and vibrating or shaking building, among others.
Source: BIS mainframe maintained by DOB. Indicator name: Priority B (nonemergency) complaints receivedDescription: The number of complaints describing nonemergency (Priority B) conditions received by DOB.
Priority B complaints include the illegal conversion of residential/building space, excessive debris, failure to erect a sidewalk shed, inadequate sidewalk shed, and construction contrary to approved plans/permits, among others.
Source: BIS mainframe maintained by DOB.
Page 188 | Mayor’s Management Report
Department of Buildings
Indicator name: Priority A complaints responded to Description: The number of complaints describing emergency (Priority A) conditions for which DOB conducted
an initial field visit. If the DOB inspector is able to gain access to the complaint site, the field visit results in an inspection. Priority A complaints include all accidents (construction and non-construction related), fumes/smoke from a boiler, unsafe or illegal demolition and vibrating or shaking building, among others. Excluded are those complaints that were administratively closed.
Source: BIS mainframe maintained by DOB. Indicator name: Priority B complaints responded to Description: The number of complaints describing nonemergency (Priority B) conditions for which DOB
conducted an initial field visit. If the DOB inspector is able to gain access to the complaint site, the field visit results in an inspection. Priority B complaints include the illegal conversion of residential/building space, excessive debris, failure to erect a sidewalk shed, inadequate sidewalk shed, and construction contrary to approved plans/permits, among others. Excluded are those complaints that were administratively closed.
Source: BIS mainframe maintained by DOB.
Indicator name: Average time to respond to Priority A complaints (days)Description: The average number of work days it took DOB to conduct a field visit for complaints describing
emergency (Priority A) conditions. If the DOB inspector is able to gain access to the complaint site, the field visit results in an inspection. Priority A complaints include all accidents (construction and non-construction related), fumes/smoke from a boiler, unsafe or illegal demolition and vibrating or shaking building, among others.
Source: BIS mainframe maintained by DOB. Indicator name: Average time to respond to Priority B complaints (days)Description: The average number of work days it took DOB to conduct a field visit for complaints describing
nonemergency (Priority B) conditions. If the DOB inspector is able to gain access to the complaint site, the field visit results in an inspection. Priority B complaints include the illegal conversion of space, excessive debris, failure to erect a sidewalk shed or an inadequate sidewalk shed, and construction contrary to approved plans/permits, among others.
Source: BIS mainframe maintained by DOB.
Indicator name: Residential illegal conversion complaints where access was obtained (%)Description: The percent of residential illegal conversion complaints where access was gained and an
inspection was completed during the reporting period.Source: BIS mainframe maintained by DOB.
Indicator name: – Access obtained and violations were written (%)Description: The number of residential illegal conversion complaints that resulted in a violation being written
as a percent of those complaints where the Department was able to gain access to the complaint location.
Source: BIS mainframe maintained by DOB.
Indicator name: Work without a permit complaints where access was obtained and violations were written (%)Description: The number of Priority B work without a permit complaints that resulted in a violation being written
as a percent of those complaints where the Department was able to gain access to the complaint location.
Source: BIS mainframe maintained by DOB.
Indicator Definitions | Page 189
Department of Buildings
Indicator name: Construction inspections completedDescription: The number of construction inspections completed citywide. Source: BIS mainframe database maintained by DOB, DOB NOW: Inspections and electronic records
maintained by DOB inspection units.
Indicator name: Construction inspections resulting in violations (%)Description: The total number of construction inspections performed that resulted in the issuance of at least
one violation divided by the total number of construction inspections performed. This includes both complaint-driven and development inspections.
Source: BIS mainframe database maintained by DOB and electronic records maintained by DOB inspection units.
Indicator name: DOB violations issuedDescription: Violations issued by DOB that are a notice that a property is not in compliance with a provision
of applicable law and includes an order from the Commissioner to correct the violating condition. This includes administrative violations issued for the non-submittal of required documentation, such as a property owner failing to submit evidence that required inspections were completed.
Source: BIS mainframe maintained by DOB.
Indicator name: Office of Administrative Trials and Hearings violations issuedDescription: The total number of violations issued by DOB that fall under the jurisdiction of the Office
of Administrative Trials and Hearings. Initially reported data for the Preliminary Mayor’s Management Report (PMMR) and annual Mayor’s Management Report (MMR) is typically incomplete due to data entry backlog and routinely updated in subsequent releases of the MMR.
Source: AIMS database maintained by the Office of Administrative Trials and Hearings. Indicator Name: Violations admitted to or upheld at the Office of Administrative Trials and Hearings (%)Description: For all violations returnable to OATH, the number of violations where the respondent admitted to
the violation and paid the penalty without a hearing or where the violation was upheld following a hearing as a percent of all violations resolved.
Source: Office of Administrative Trials and Hearings (OATH).
Indicator name: Construction-related incidentsDescription: The total number of events on a construction site (with or without a permit) that DOB responded
to within the reporting period. An event or incident includes accidents and anything other than a scheduled inspection.
Source: Incident database maintained by the FDC of Development & Tech Affairs Unit. Indicator name: – Construction-related accidents Description: An accident is an incident caused by construction activity on a construction site, or on an
adjoining site, which results in a fatality or injury requiring medical attention. Source: Incident database maintained by the FDC of Development & Tech Affairs Unit.
Indicator name: Construction-related injuriesDescription: The total number of persons injured (includes fatalities and non-fatalities) as a result of
construction activity. This includes injuries occurring at a construction site, or related to an incident at a construction site.
Source: Incident database maintained by the FDC of Development & Tech Affairs Unit. Indicator name: Construction-related fatalitiesDescription: The total number of fatalities that occurred on a construction site, or was related to an incident at
a construction site, that was a result of construction activity. Source Incident database maintained by the FDC of Development & Tech Affairs Unit.
Page 190 | Mayor’s Management Report
Department of Buildings
Indicator name: Incident inspections resulting in violations (%)Description: The percent of incident inspections that resulted in a written violation within the reporting period.Source: Incident database maintained by the FDC of Development & Tech Affairs Unit.
Indicator name: Collisions involving City vehiclesDescription: The total number of City-vehicle involved collision reports involving injury or property damage
for the DOB fleet reported in the citywide collision reporting system (CRASH). New York State MV-104 reports are required whenever a collision occurs involving death, or other personal injury, or property damage over $1,000. Collisions are tracked and reported regardless of whether or not the driver was at fault and whether or not the vehicle was in motion. Collisions involving City vehicles occur whenever a City vehicle strikes (or is struck by) a second vehicle, pedestrian, bicyclist or fixed object.
Source: Office of Fleet Administration.
Indicator name: Workplace injuries reportedDescription: All incidents resulting in a workers’ compensation or line of duty injury claim regardless of whether
or not work time was lost.Source: Human Capital.
Indicator name: E-mails responded to in 14 days (%)Description: The percentage of e-mails answered in 14 calendar days or less. Responses should be
substantive and adequately address the question/issue raised by the customer. A simple acknowledgement is not considered an adequate response. However, for more complex inquiries that require research and action on the part of the agency, an acknowledgement which includes a description of the next step (either on the agency’s behalf, or the customer’s), as well as an estimated time frame for completion, is considered acceptable and can be reported as part of the 14 day response. Agencies must internally track the additional time until a customer has a complete and full response.
Source: Intranet Quorum.
Indicator name: Letters responded to in 14 days (%)Description: The percentage of letters answered in 14 calendar days or less. Responses should be
substantive and adequately address the question/issue raised by the customer. A simple acknowledgement is not considered an adequate response. However, for more complex inquiries that require research and action on the part of the agency, an acknowledgement which includes a description of the next step (either on the agency’s behalf, or the customer’s), as well as an estimated time frame for completion, is considered acceptable and can be reported as part of the 14 day response. Agencies must internally track the additional time until a customer has a complete and full response.
Source: Intranet Quorum.
Indicator name: Calls answered in 30 seconds (%)Description: The percentage of calls answered by a call center representative in 30 seconds or less. Time
begins after initial prerecorded message. Source: Automatic Call Distribution (ACD) system.
Indicator Definitions | Page 191
Department of Buildings
Indicator name: Completed customer requests for interpretationDescription: The sum of all requests for interpretation using a language other than English fulfilled by the
agency via telephone (including Language Line, call centers, offices/reception desks and 311 transfer calls) and via face-to-face interaction with bilingual employees or contracted interpreters.
Source: Borough and Unit Liaisons.
Indicator name: CORE customer experience rating (0-100)Description: An average score based on the rating of 15 conditions, including physical conditions (e.g.,
cleanliness, litter, seating) and customer service conditions (e.g., wait time, professionalism), for all agency walk-in facilities inspected, divided by the number of walk-in facilities inspected. Each of the 15 conditions can be rated excellent, good, fair or poor. Ratings of excellent are worth 100 points each, good ratings are worth 67 points, fair ratings are worth 33 points and poor ratings receive no points. Facilities are rated by trained City inspectors. Fiscal 2016 data for the overall rating represents a change in methodology. For agencies with multiple service centers, inspectors focused on sites that had historically lower scores, specifically sites that received an average overall site score of 85 or lower over the last three years and sites that received a score of 85 or lower in Fiscal 2015. If all agency service centers scored above 85 last year, the service center with the lowest overall score was inspected.
Source: Mayor’s Office of Operations—SCOUT.
Indicator name: Percent of service requests meeting time to first action Description: The percentage of service requests for which the agency met its planned time of action to provide
the service. Source: BIS mainframe database maintained by DOB.

Page 192 | Mayor’s Management Report
Department of Buildings

Indicator Definitions | Page 193
Department of Design and Construction
Indicator name: Design projects completedDescription: The total number of infrastructure and public building design projects for which design was
completed during the reporting period and the number in each reporting category. Source: DDC’s Project Management Information System.
Indicator name: Total design projects completed early/on time (%)Description: Of the projects for which design was completed during the reporting period, the percentage
that were completed ahead of schedule or no more than 30 days behind the baseline schedule, exclusive of programmatic scope changes and delays outside of DDC control.
Source: Infrastructure and Public Buildings Divisions
Indicator name: - Completed early/on time: Infrastructure (%)Description: Of the infrastructure projects for which design was completed during the reporting period, the percentage that were completed ahead of schedule or no more than 30 days behind the baseline schedule, exclusive of programmatic scope changes and delays outside of DDC control. Source: Infrastructure Division.
Indicator name: - Completed early/on-time: Public buildings (%)Description: Of the public building projects for which design was completed during the reporting period, the percentage that were completed ahead of schedule or no more than 30 days behind the baseline schedule, exclusive of programmatic scope changes and delays outside of DDC control.Source: Public Buildings Division.
Indicator name: Construction projects completedDescription: The total number of infrastructure and public building construction projects that were substantially
completed during the reporting period. A project is considered substantially complete when contract work has been finished. For public buildings a Certificate of Occupancy (temporary or final) is required. For infrastructure projects permanent street restoration must be in place.
Source: DDC’s Project Management Information System.
Indicator name: Total construction projects completed early/on-time (%)Description: The percentage of all construction projects completed ahead of schedule or no more than 30
days behind the baseline schedule, exclusive of programmatic scope changes and delays outside of DDC control. Additions/adjustments to the design that was agreed on prior to construction start and funding issues caused by such adjustments constitute a programmatic scope change. On larger infrastructure projects (roadway/sewer/water main), delays caused by significant utility interference that are completely out of the agency’s control constitute a programmatic scope change.
Source: Infrastructure and Public Buildings Divisions.
Indicator name: - Completed early/on-time: Infrastructure (%)Description: “The percentage of all infrastructure projects for which construction was completed ahead of schedule or no more than 30 days behind the baseline schedule, exclusive of programmatic scope changes and delays outside of DDC control. Additions/adjustments to the design that was
agreed on prior to construction start and funding issues caused by such adjustments constitute a programmatic scope change. On larger infrastructure projects (roadway/sewer/water main), delays caused by significant utility interference that are completely out of the agency’s control constitute a programmatic scope change.”
Source: Infrastructure Division.
Page 194 | Mayor’s Management Report
Department of Design and Construction
Indicator name: - Completed early/on-time: Public buildings (%)Description: “The percentage of public buildings for which construction was completed ahead of schedule or no more than 30 days behind the baseline schedule, exclusive of programmatic scope changes and delays outside of DDC control. Additions/adjustments to the design that was agreed on prior
to construction start and funding issues caused by such adjustments constitute a programmatic scope change.”
Source: Public Buildings Division.
Indicator name: Construction contracts completed within budget (%)Description: The percentage of projects that completed construction where the resulting cost increase from
change orders that were caused by DDC due to design error, design omission or field conditions does not exceed 10 percent of the adjusted total construction costs. (Note: for purposes of calculating this data, construction costs do not include costs associated with the change orders caused by DDC. Only stand-alone construction contracts are included.)
Source: DDC’s Project Management Information System.
Indicator name: - Construction completed on schedule (%)Description: The percentage of street reconstruction projects that were completed within 30 days of the
baseline schedule, exclusive of programmatic scope changes and any holds placed on the project by the sponsor agency.
Source: DDC’s Project Management Information System.
Indicator name: - Construction completed on schedule (%)Description: The percent of sewer construction projects that were completed within 30 days of the baseline
schedule, exclusive of programmatic scope changes and any holds placed on the project by the sponsor agency.
Source: DDC’s Project Management Information System.
Indicator name: - Construction completed on schedule (%)Description: The percent of sewer reconstruction projects that were completed within 30 days of the baseline
schedule, exclusive of programmatic scope changes and any holds placed on the project by the sponsor agency.
Source: DDC’s Project Info database
Indicator name: - Construction completed on schedule (%)Description: The percent of water main projects that were completed within 30 days of the baseline schedule,
exclusive of programmatic scope changes and any holds placed on the project by the sponsor agency.
Source: DDC’s Project Management Information System.
Indicator name: Active design projects: Early/on-time (%)Description: The percentage of active design projects for which the expected date of completion is earlier than or within 30 days of the baseline schedule, exclusive of programmatic scope changes and delays outside of DDC control. Active projects are those where work has begun but is not yet
completed, as well as those projects that were completed in the reporting month.Source: Infrastructure and Public Buildings Divisions.
Indicator name: Active construction projects: Early/on-time (%)Description: The percentage of active construction projects for which the expected date of completion is earlier than or within 30 days of the baseline schedule, exclusive of programmatic scope changes and delays outside of DDC control. Active projects are those where work has begun but is not yet
completed, as well as those projects that were completed in the reporting month.Source: Infrastructure and Public Buildings Divisions.
Indicator Definitions | Page 195
Department of Design and Construction
Indicator name: Projects completed front-end-planning phase Description: The total number of projects, agency wide, that completed the Front End Planning (FEP) phase in
the current reporting period.Source: Infrastructure and Public Buildings Divisions.
Indicator name: Projects audited (%)Description: The percentage of active projects in construction during the reporting period for which at least
one quality assurance/site safety audit was performed. Projects that are under $100,000 and those completed within the first six weeks of the reporting period or started within the last six weeks of the period are excluded.
Source: Quality assurance database.
Indicator name: Construction-related accidents on DDC-managed construction sitesDescription: On DDC-managed construction sites, the total number of work-related events which resulted in
a fatality or injury requiring medical attention beyond first aid. This includes events occurring at a construction site or related to an event at a construction site.
Source: Accident/Incident database maintained by DDC Safety and Site Support.
Indicator name: Construction-related injuries on DDC-managed construction sitesDescription: On DDC-managed construction sites, the total number of persons injured (required medical
attention beyond first aid or suffered a fatality) as a result of a work-related event. This includes events occurring at a construction site or related to an event at a construction site.
Source: Accident/Incident database maintained by DDC Safety and Site Support.
Indicator name: Construction-related fatalities on DDC-managed construction sitesDescription: On DDC-managed construction sites, the total number of fatalities resulting from a work-related
event. This includes events occurring at a construction site or related to an event at a construction site.
Source: Accident/Incident database maintained by DDC Safety and Site Support.
Indicator name: Eligible projects with completed post-construction surveys (%)Description: The number of eligible capital construction projects for which at least one completed customer
survey was returned as a percent of the number of construction projects substantially completed during the last quarter of the prior fiscal year through the third quarter of the current fiscal year. Note: Infrastructure projects involving minimal work at multiple sites throughout the City are typically excluded from surveys.
Source: DDC’s Client Survey database.
Indicator name: Post-construction satisfaction - Surveys returnedDescription: The total number of completed post-construction satisfaction surveys returned to DDC. Source: DDC’s Client Survey database.
Indicator name: Respondents rating a completed project as adequate or better (%) Description: The percentage of completed surveys returned with an overall satisfactory rating.Source: DDC’s Client Survey database.
Page 196 | Mayor’s Management Report
Department of Design and Construction
Indicator name: E-mails responded to in 14 days (%)Description: The percentage of e-mails answered in 14 calendar days or less. Responses should be
substantive and adequately address the question/issue raised by the customer. A simple acknowledgement is not considered an adequate response. However, for more complex inquiries that require research and action on the part of the agency, an acknowledgement which includes a description of the next step (either on the agency’s behalf, or the customer’s), as well as an estimated time frame for completion, is considered acceptable and can be reported as part of the 14 day response. Agencies must internally track the additional time until a customer has a complete and full response.
Source: DDC’s correspondence tracking database.
Indicator name: Letters responded to in 14 days (%)Description: The percentage of letters answered in 14 calendar days or less. Responses should be
substantive and adequately address the question/issue raised by the customer. A simple acknowledgement is not considered an adequate response. However, for more complex inquiries that require research and action on the part of the agency, an acknowledgement which includes a description of the next step (either on the agency’s behalf, or the customer’s), as well as an estimated time frame for completion, is considered acceptable and can be reported as part of the 14 day response. Agencies must internally track the additional time until a customer has a complete and full response.
Source: DDC’s correspondence tracking database.

Promoting Viable Communities & Neighborhoods
Promoting Viable Communities & Neighborhoods
New York City Economic Development Corporation
Department of Housing Preservation and Development
New York City Housing Authority
Landmarks Preservation Commission
Department of City Planning p 199
p 203
p 207
p 215
p 221
Indicator Definitions | Page 199
Department of City Planning
Indicator name: Economic development and housing proposals completed and presented to the publicDescription: The number of proposals to promote sustainable mixed-use, mixed-income communities
anchored by affordable housing in existing and emerging neighborhoods or that foster growth and development of the City’s central and regional business districts, in the form of written reports, certified applications for zoning map or text amendments, website postings, and/or public presentations of recommended actions.
Source: Records maintained by DCP’s Planning Coordination Division.
Indicator name: Neighborhood enhancement proposals completed and presented to the publicDescription: The number of proposals to preserve the character of existing neighborhoods, promote
sustainability, resiliency and long-term affordability, or improve physical and social infrastructure, in the form of written reports, certified applications for zoning map or text amendments, website postings, and/or public presentations of recommended actions.
Source: Records maintained by DCP’s Planning Coordination Division.
Indicator name: Planning information and policy analysis initiatives presented to the publicDescription: The number of projects informing the public of significant trends in land use, housing, zoning,
demographics, and procedures and/or policies, in the form of written reports, individual datasets, website postings, and/or public presentations.
Source: Records maintained by DCP’s Planning Coordination Division
Indicator Name: Simple zoning actions certified/referredDefinition: The number of simple zoning actions initiated by private and public applicants, including the
Department of City Planning, that were certified as complete and, for those actions subject to ULURP (Uniform Land Use Review Procedure), referred for public review. Simple projects, which can include one or more land use applications and their associated environmental review, include zoning map changes, amendments to the zoning resolution, zoning special permits, authorizations, and certifications and, in general, have no or limited environmental review (all Type II designations).
Source: Database maintained by DCP’s Planning Coordination Division.
Indicator name: Simple zoning actions certified/referred within 12 months (%) Description: The percent of simple public and private zoning actions certified as complete or referred for public
review within 12 months of project start, normally marked by submission of a Pre-Application Statement (PAS) to the Department.
Source: Database maintained by DCP’s Planning Coordination Division.
Indicator Name: Zoning actions with CEQR (EAS) certified/referredDefinition: The number of zoning actions with CEQR (City Environmental Quality Review) requiring an EAS
(Environmental Assessment Statement)initiated by private and public applicants, including DCP, that were certified as complete and, for those actions subject to ULURP (Uniform Land Use Review Procedure), referred for public review. Complex projects, which can include one or more land use applications and their associated environmental review, include zoning map changes, amendments to the zoning resolution, zoning special permits, authorizations, and certifications and require more involved environmental review and interagency coordination (Type I or unlisted actions).
Source: Database maintained by DCP’s Planning Coordination Division.
Indicator name: Zoning Actions with CEQR (EAS) certified/referred within 15 months (%) Description: The percent of public and private zoning actions with CEQR (City Environmental Quality Review)
requiring an EAS (Environmental Assessment Statement) certified as complete and/or referred for public review within 15 months of project start, normally marked by submission of a Pre-Application Statement (PAS) to the Department.
Source: Database maintained by DCP’s Planning Coordination Division.
Page 200 | Mayor’s Management Report
Department of City Planning
Indicator name: Zoning actions with CEQR (EIS) certified/referredDescription: The number of zoning actions with CEQR (City Environmental Quality Review) requiring an
EIS (Environmental Impact Statement)initiated by private and public applicants, including DCP, that were certified as complete and, for those actions subject to ULURP (Uniform Land Use Review Procedure), referred for public review. Complex projects, which can include one or more land use applications and their associated environmental review, include zoning map changes, amendments to the zoning resolution, zoning special permits, authorizations, and certifications and require more involved environmental review and interagency coordination (Type I or unlisted actions).
Source: Database maintained by DCP’s Planning Coordination Division.
Indicator name: Zoning actions with CEQR (EIS) certified/referred within 22 months (%)Description: The percent of public and private zoning actions with CEQR (City Environmental Quality Review)
requiring an EIS (Environmental Impact Statement) certified as complete and/or referred for public review within 22 months of project start, normally marked by submission of a Pre-Application Statement (PAS) to the Department.
Source: Database maintained by DCP’s Planning Coordination Division.
Indicator Name: City projects (non-zoning) certified/referred Definition: The number of projects submitted by public agencies or the NYC Economic Development
Corporation, including their associated environmental review, which were certified as complete and, for those actions subject to ULURP (Uniform Land Use Review Procedure), referred for public review. Projects include individual sitings of City facilities, acquisition of property or office space by the City, housing approvals, business improvement districts, franchises, landmarks and concessions.
Source: Database maintained by DCP’s Planning Coordination Division.
Indicator Name: City projects (non-zoning actions) certified/referred within 6 months (%) Description: The percent of projects submitted by public agencies or the NYC Economic Development
Corporation, including their associated environmental review, certified as complete and/or referred for public review within six months of project start, normally marked by submission of a Pre-Application Statement (PAS) to the Department.
Source: Database maintained by DCP’s Planning Coordination Division.
Indicator name: Renewals/South Richmond Actions certified/referredDescription: The number of project renewals citywide and South Richmond School Seat/Subdivision
certification project approvals located in the South Richmond Development Special District that are completed, referred and, for those actions subject to ULURP (Uniform Land Use Review Procedure), certified as complete and referred for public review. Typical applicants are individual home and business owners and private developers. Project renewals include special permits for use or bulk subject to terms of expiration.
Source: Database maintained by DCP’s Planning Coordination Division.
Indicator Name: Renewals/South Richmond Action projects certified/referred within 6 months (%)Description: The percent of project renewals citywide and South Richmond School Seat/Subdivision
certification project approvals, including their associated environmental review, certified as complete or referred for public review within six months of project start, normally marked by submission of a Pre-Application Statement (PAS) for renewals or a filed land use application for South Richmond School Seat/Subdivision certifications to the Department.
Source: Database maintained by DCP’s Planning Coordination Division.
Indicator Definitions | Page 201
Department of City Planning
Indicator name: E-mails responded to in 14 days (%)Description: The percentage of e-mails answered in 14 calendar days or less. Responses should be
substantive and adequately address the question/issue raised by the customer. A simple acknowledgement is not considered an adequate response. However, for more complex inquiries that require research and action on the part of the agency, an acknowledgement which includes a description of the next step (either on the agency’s behalf, or the customer’s), as well as an estimated time frame for completion, is considered acceptable and can be reported as part of the 14 day response. Agencies must internally track the additional time until a customer has a complete and full response.
Source: Records maintained by the Executive Office.
Indicator name: Letters responded to in 14 days (%)Description: The percentage of letters answered in 14 calendar days or less. Responses should be
substantive and adequately address the question/issue raised by the customer. A simple acknowledgement is not considered an adequate response. However, for more complex inquiries that require research and action on the part of the agency, an acknowledgement which includes a description of the next step (either on the agency’s behalf, or the customer’s), as well as an estimated time frame for completion, is considered acceptable and can be reported as part of the 14 day response. Agencies must internally track the additional time until a customer has a complete and full response.
Source: Records maintained by the Executive Office.
Indicator name: Completed customer requests for interpretationDescription: The sum of all requests for interpretation using a language other than English fulfilled by the
agency via telephone (including Language Line, call centers, offices/reception desks and 311 transfer calls) and via face-to-face interaction with bilingual employees or contracted interpreters.
Source: Records maintained by DCP’s Planning Coordination Division.
Indicator name: CORE customer experience rating (0-100)Description: An average score based on the rating of 15 conditions, including physical conditions (e.g.,
cleanliness, litter, seating) and customer service conditions (e.g. wait time, professionalism), for all agency walk-in facilities inspected, divided by the number of walk-in facilities inspected. Each of the 15 conditions can be rated excellent, good, fair or poor. Ratings of excellent are worth 100 points each, good ratings are worth 67 points, fair ratings are worth 33 points and poor ratings receive no points. Facilities are rated by trained City inspectors. Fiscal 2016 data for the overall rating represents a change in methodology. For agencies with multiple service centers, inspectors focused on sites that had historically lower scores, specifically sites that received an average overall site score of 85 or lower over the last three years and sites that received a score of 85 or lower in Fiscal 2015. If all agency service centers scored above 85 last year, the service center with the lowest overall score was inspected.
Source: Mayor’s Office of Operations – SCOUT.

Page 202 | Mayor’s Management Report
Department of City Planning
Indicator Definitions | Page 203
New York City Economic Development Corporation
Indicator name: Private investment leveraged on the sale/long-term lease of City-owned property ($000,000)Description: The net present value of the total investment of private entities in connection with the sale or
long-term lease of City-owned property. Private investment includes land sale or lease, and hard (site work and building construction) and soft (architecture and engineering) development costs. The data is extrapolated in the year that the transaction closes (land sale closing or lease execution), and reflects the anticipated total private investment associated with these projects.
Source: Real Estate. Indicator name: Capital expenditures ($000,000) (excludes asset management and funding agreements)Description: Based on an accrual basis, the amounts paid to firms (architecture, landscape architecture,
engineering, resident engineering, etc.), construction managers, construction contractors, etc. for capital project related services. The data reported in the fiscal year Mayor’s Management Report (MMR) is a preliminary number and is updated in the following year’s Preliminary MMR to reflect the audited financial statements (e.g., Fiscal 2015 data is updated in the Fiscal 2016 PMMR).
Source: Finance.
Indicator name: Graffiti sites cleaned Description: The number of properties cleaned through Graffiti-Free NYC, the City’s graffiti removal program.Source: NYC’s graffiti database.
Indicator name: Square feet of graffiti removed (000)Description: The square feet of graffiti removed by power-washing and painting through Graffiti-Free NYC, the
City’s graffiti removal program.Source: NYC’s graffiti database.
Indicator name: NYC Ferry—Average monthly ridershipDescription: The average monthly ridership of passengers traveling on the NYC Ferry as reported to NYCEDC
by Hornblower, Inc.Source: NYCEDC/NYC Ferry
Indicator name: Capital expenditures on asset management ($000,000) Description: Based on an accrual basis, the amounts paid to firms (architecture, landscape architecture,
engineering, resident engineering, etc.), construction managers, construction contractors, etc. for capital project related services on NYCEDC-managed property. The data reported in the fiscal year Mayor’s Management Report (MMR) is a preliminary number and is updated in the following year’s Preliminary MMR to reflect the audited financial statements (e.g., Fiscal 2015 data is updated in the Fiscal 2016 PMMR).
Source: Finance.
Indicator name: Occupancy rate of NYCEDC-managed property (%)Description: For NYCEDC-managed properties, the number of square feet leased as a percent of the total
available space.Source: Asset Management.
Indicator name: Portfolio revenue generated ($000,000)Description: Revenue generated from NYCEDC’s portfolio of assets.Source: Asset Management.
Page 204 | Mayor’s Management Report
New York City Economic Development Corporation
Indicator name: Square footage of assets actively managed by NYCEDC (000)Description: The square footage of assets in which NYCEDC, on behalf of the City, is responsible for the day
to day management and leasing of the property.Source: Asset Management.
Indicator name: Businesses served by industry-focused programmatic initiativesDescription: The number of businesses actively engaged in NYCEDC’s programmatic initiatives, including
NYCEDC’s incubator network and centers for excellence, technology competitions, partnership funds and programmatic ventures throughout the five boroughs.
Source: Initiatives.
Indicator name: Private sector jobs in innovation industries (%) (calendar year)Description: The share of jobs within sectors designated as “advanced,” “innovative” and “creative” by the
Brookings Institution, HR&A Advisors and NYCEDC as a percent of all private sector jobs. Source: U.S. Bureau of Labor Statistics Quarterly Census of Employment and Wages.
Indicator name: New York City unemployment rate (%)Description: Average unemployment rate of New York City residents.Source: U.S. Bureau of Labor Statistics.
Indicator name: New York City Industrial Development Agency projects - Contracts closedDescription: The number of projects closed by the New York City Industrial Development Agency (NYCIDA),
a state public benefit corporation created under New York State law with the capacity to provide financial assistance to commercial, industrial and, until January 31, 2008, not-for-profit organizations. NYCIDA project contracts are signed at closing, at which point project companies can begin to access benefits. NYCIDA programs can provide access to triple tax exempt financing, mortgage recording tax deferral, sales tax exemptions, land tax abatements and/or building tax stabilization.
Source: Compliance & Strategic Investments Group. Indicator name: New York City Industrial Development Agency projects - Projected three-year job growth associated with closed contracts Description: The number of jobs that companies retain and create in connection with closed New York City
Industrial Development Agency (NYCIDA) projects. The data is compiled in the year that the transaction closes and includes the estimated number of new jobs that projects are expected to create during the first three years of the contract. NYCIDA is a state public benefit corporation created under New York State law with the capacity to provide financial assistance to commercial, industrial and, until January 31, 2008, not-for-profit organizations.
Source: Compliance & Strategic Investments Group. Indicator name: New York City Industrial Development Agency projects - Projected net City tax revenues generated in connection with closed contracts ($000,000)Description: The net present value of the estimated City tax revenues generated by closed New York City
Industrial Development Agency (NYCIDA) projects, net of New York City and New York State benefits provided. The measure uses an input-output model developed by the U.S. Department of Commerce. The data is extrapolated in the year that the transaction closes and reflects the total City tax revenue impact of these projects during the term of the contract. NYCIDA is a state public benefit corporation created under New York State law with the capacity to provide financial assistance to commercial, industrial and, until January 31, 2008, not-for-profit organizations.
Source: Compliance & Strategic Investments Group.
Indicator Definitions | Page 205
New York City Economic Development Corporation
Indicator name: New York City Industrial Development Agency projects - Private investment leveraged on closed projects ($000,000)Description: The estimated value of third-party investment leveraged (federal, State and/or private) as a result
of NYCIDA’s assistance. Source: Compliance & Strategic Investments Group. Indicator name: Build NYC Resource Corporation - Contracts closedDescription: The number of projects closed by Build NYC Resource Corporation (Build NYC), a local
development corporation incorporated under the New York Not-for-Profit Corporation Law. Build NYC is administered by NYCEDC and assists qualified not-for-profit institutions and other entities in obtaining tax-exempt and taxable bond financing. As a conduit bond issuer, Build NYC’s primary goal is to facilitate access to private activity tax-exempt bond financing for not-for-profit institutions to acquire, construct, renovate and/or equip their facilities.
Source: Compliance & Strategic Investments Group. Indicator name: Build NYC Resource Corporation - Projected three-year job growth associated with closed contractsDescription: The number of jobs that companies retain and create in connection with closed Build NYC
Resource Corporation (Build NYC) projects. The data is compiled in the year that the transaction closes and includes the estimated number of new jobs projects are expected to create during the first three years of the contract. Build NYC, a local development corporation incorporated under the New York Not-for-Profit Corporation Law, is administered by NYCEDC and assists qualified not-for-profit institutions and other entities in obtaining tax-exempt and taxable bond financing. As a conduit bond issuer, Build NYC’s primary goal is to facilitate access to private activity tax-exempt bond financing for not-for-profit institutions to acquire, construct, renovate and/or equip their facilities.
Source: Compliance & Strategic Investments Group. Indicator name: Build NYC Resource Corporation - Projected net City tax revenues generated in connection with closed contracts ($000,000)Description: The net present value of the estimated City tax revenues generated by closed Build NYC
projects, net of New York City and New York State benefits provided. The measure uses an input-output model developed by the U.S. Department of Commerce. The data is extrapolated in the year that the transaction closes and reflects the City tax revenue impact of these projects during the term of the contract. Build NYC, a local development corporation incorporated under the New York Not-for-Profit Corporation Law, is administered by NYCEDC and assists qualified not-for-profit institutions and other entities in obtaining tax-exempt and taxable bond financing. As a conduit bond issuer, Build NYC’s primary goal is to facilitate access to private activity tax-exempt bond financing for not-for-profit institutions to acquire, construct, renovate and/or equip their facilities.
Source: Compliance & Strategic Investments Group. Indicator name: Build NYC Resource Corporation - Private investment leveraged on closed projects ($000,000)Description: The estimated value of third-party investment leveraged (federal, State and/or private) as a result
of Build NYC Resource’s assistance.Source: Compliance & Strategic Investments Group. Indicator name: Value of funding disbursed pursuant to City funding agreements ($000,000) Description: The total value of funding disbursed in connection with active funding agreement contracts
between NYCEDC and non-City entities. Funds are provided to non-City entities to implement projects that result in public betterment. Funding agreements are used to finance capital projects; typical projects include renovations, new construction, and acquisition of property.
Source: Budget; Funding Agreements Team.

Page 206 | Mayor’s Management Report
New York City Economic Development Corporation
Indicator name: Project employees reported to be earning a living wage or more (%)Description: The number of employees on projects receiving financial assistance from NYC’s Industrial
Development Agency, BuildNYC Resource Corporation or NYCEDC programs that earned a living wage, or more than a living wage, as defined by the Fair Wages for New Yorkers Act, as a percent of the total number of project employees.
Source: Compliance Department.
Indicator Definitions | Page 207
Department of Housing Preservation and Development
Indicator name: Total complaints reportedDescription: The number of housing maintenance problems reported in privately-owned buildings recorded
by the 311 Customer Service Center and other 311 channels and Code Enforcement Borough Offices. Duplicate problems reported on some building-wide conditions are excluded.
Source: Office of Enforcement and Neighborhood Services. Indicator name: - Emergency complaints reportedDescription: The number of heat and hot water, lead-based paint and other emergency problems reported in
privately-owned buildings requiring an inspection or other action by HPD. Duplicate problems in the heat and hot water and other emergency categories are excluded.
Source: Office of Enforcement and Neighborhood Services. Indicator name: Inspections completed Description: The number of problem inspections and reinspections completed.Source: Office of Enforcement and Neighborhood Services.
Indicator name: Inspection visits per team per dayDescription: The average number of visits per inspection route. A visit is an attempted physical observation of
a problem or group of problems filed at the same time, or an attempted re-inspection of a violation or group of violations. A route is comprised of stops (inspections) by an inspection team on any given day.
Source: Office of Enforcement and Neighborhood Services.
Indicator name: Ratio of completed inspections to attempted inspections (%)Description: The number of completed inspections divided by the number of attempted inspections.Source: Office of Enforcement and Neighborhood Services.
Indicator name: Total complaints closedDescription: The total number of problems closed due to an inspection, callback to tenant, or repeated
attempts for access. Source: Office of Enforcement and Neighborhood Services.
Indicator name: - Emergency complaints closed - Heat and hot water - Lead - Other emergencyDescription: The total number of emergency problems closed due to an inspection, callback to tenant, or
repeated attempts for access and the number closed in each category.Source: Office of Enforcement and Neighborhood Services.
Indicator name: Average time to close emergency complaints (days) Description: The average number of calendar days to close an emergency problem in a privately-owned
building during the reporting period. An emergency problem can be closed due to an inspection, callback to tenant, or repeated attempts for access.
Source: Office of Enforcement and Neighborhood Services.
Indicator name: Average time to close nonemergency complaints (days) Description: The average number of calendar days to close a nonemergency problem in a privately-owned
building during the reporting period. Problems can be closed due to an inspection, callback to tenant, or repeated attempts for access.
Source: Office of Enforcement and Neighborhood Services.
Page 208 | Mayor’s Management Report
Department of Housing Preservation and Development
Indicator name: Emergency complaints closed within 12 days of receipt (%)Description: The number of emergency problems that were closed within 12 days of receipt divided by the
number of emergency problems that were closed in the reporting period.Source: Office of Enforcement and Neighborhood Services.
Indicator name: Nonemergency complaints closed within 20 days of receipt (%)Description: The number of nonemergency problems that were closed within 20 days of receipt divided by the
number of nonemergency problems that were closed in the reporting period.Source: Office of Enforcement and Neighborhood Services.
Indicator name: Total violations issued Description: The total number of violations issued. Source: Office of Enforcement and Neighborhood Services.
Indicator name: - Emergency violations issued - Heat and hot water - Lead - Other emergencyDescription: The total number of emergency repair-generating “C” violations issued, including heat and hot
water, lead-based paint hazards and other emergencies, and the number in each reporting category. Emergency repair-generating violations are those for emergency conditions that HPD will attempt to address if the landlord fails to do so.
Source: Office of Enforcement and Neighborhood Services.
Indicator name: - Nonemergency violations issuedDescription: The total number of “A” violations (non-hazardous), “B” violations (hazardous), and “C” violations
issued that do not call for emergency repairs by HPD. Source: Office of Enforcement and Neighborhood Services.
Indicator name: Violations issued and removed in the same fiscal year (%)Description: The number of violations removed during the fiscal year that were issued in that fiscal year
divided by the total number of violations issued in the same fiscal year.Source: Office of Enforcement and Neighborhood Services.
Indicator name: Emergency violations corrected by owner (%)Description: Emergency repair-generating violations issued in the fiscal year that were deemed complied,
closed as corrected on inspection, or closed as landlord complied, divided by the total number of emergency repair-generating violations issued in the same fiscal year.
Source: Office of Enforcement and Neighborhood Services.
Indicator name: Emergency violations corrected by HPD (%)Description: Emergency repair-generating violations that were corrected by HPD divided by the total number
of emergency repair-generating violations.Source: Office of Enforcement and Neighborhood Services.
Indicator name: Violations closedDescription: The total number of violations closed during the reporting period regardless of the date the
violation was issued. A violation is closed once the violating condition is reinspected by HPD and found to be corrected, if deemed corrected by HPD based on landlord certification, or if administratively removed by HPD.
Source: Office of Enforcement and Neighborhood Services.
Indicator Definitions | Page 209
Department of Housing Preservation and Development
Indicator name: Violations certified as corrected by ownerDescription: The number of violations for which a property owner/managing agent submits a certification
of correction. Certified violations may be reinspected and closed by HPD or may be deemed corrected and closed 70 days after certification (except for lead-based paint violations, heat violations and hot water violations) if HPD does not reinspect. Lead-based paint violations, heat violations and hot water violations can only be closed upon reinspection by HPD or if the conditions are corrected by HPD.
Source: Office of Enforcement and Neighborhood Services.
Indicator name: Housing Court cases initiated by HPDDescription: The number of Housing Court cases initiated by HPD’s Housing Litigation Division (HLD) against
private property owners to enforce compliance with the housing quality standards. HLD may seek correction of conditions, civil penalties, appointment of a 7A Administrator, or access warrants.
Source: Office of Enforcement and Neighborhood Services.
Indicator name: Housing Court cases initiated by HPD that were disposedDescription: For cases initiated by HPD, the number of cases with an outcome determined by the Court within
the reporting period. Outcomes are point in time counts and the outcome for any given case may change/be updated when cases are returned to Court for further action.
Source: Office of Enforcement and Neighborhood Services.
Indicator name: - Housing Court cases initiated by HPD that were settledDescription: For cases initiated by HPD, the number of stipulations or orders negotiated by the parties
involved (i.e., HPD, tenants, respondents, tenant and/or respondent attorneys) and ordered by a judge during the reporting period. Generally, settlements include orders to correct conditions and civil penalties. Note: Outcomes are point in time counts and the outcome for any given case may change/be updated when cases are returned to court for further action.
Source: Office of Enforcement and Neighborhood Services.
Indicator name: - Housing Court cases initiated by HPD resulting in judgmentsDescription: Formal decisions made by the Courts for cases initiated by HPD. This includes: Default
judgments: Judgments entered for an order to correct and/or civil penalties upon default where there was no appearance in Court by the required respondent(s). Judgments after trial: Judgments awarded by the Court after a trial and presentation of the evidence. Judgments after payment default: Judgments that are imposed after a payment schedule from settlements or consent orders were violated. Note: Outcomes are point in time counts and the outcome for any given case may change/be updated when cases are returned to court for further action.
Source: Office of Enforcement and Neighborhood Services.
Indicator name: Total dollars spent on emergency repairs (excluding demolition and AEP) ($)Description: Total cost of emergency repair work completed by HPD’s Emergency Repair Program to correct
emergency repair-generating Class C violations where the landlord has failed to do so. Costs include both payments to contractors and the direct costs of in-house repairs.
Source: Office of Enforcement and Neighborhood Services. Indicator name: Alternative Enforcement Program - Buildings currently activeDescription: The number of buildings currently active in the Alternative Enforcement Program (AEP). AEP
is an enhanced enforcement program, initiated in Fiscal 2008, which provides for the issuance of orders to property owners to correct violations and replace building systems. Failure to meet substantial compliance within the first four months of the building selection will result in the issuance of the order, regular inspections and significant fees, and may result in emergency repair charges and liens.
Source: Office of Enforcement and Neighborhood Services.
Page 210 | Mayor’s Management Report
Department of Housing Preservation and Development
Indicator name: - Buildings discharged (cumulative)Description: The number of buildings discharged from the Alternative Enforcement Program from the
program’s inception in Fiscal 2008 to date. Buildings are discharged from the program if they meet defined criteria for discharge.
Source: Office of Enforcement and Neighborhood Services.
Indicator name: - Buildings discharged from program (%) (cumulative)Description: The number of buildings discharged from the Alternative Enforcement Program as a percent of
the total buildings participating in the program from the program’s inception in Fiscal 2008 to date. Buildings are discharged from the program if they meet defined criteria for discharge.
Source: Office of Enforcement and Neighborhood Services.
Indicator name: Total dollars spent on emergency repairs in the Alternative Enforcement Program ($)Description: Total cost of all emergency repair work completed by HPD’s Alternative Enforcement Program
(AEP). Costs include both payments to contractors and the direct costs of in-house repairs.Source: Office of Enforcement and Neighborhood Services.
Indicator name: Total housing starts under Housing New York (units)Description: The total number of housing units (starts) created or preserved and counted towards Housing
New York (HNY). Units are created or preserved through financed new construction or rehabilitation, regulatory agreements creating or extending affordability, and homebuyer and homeownership assistance. HNY counts units produced by Housing Preservation and Development, Housing Development Corporation, NYC Economic Development Corporation, New York City Housing Authority, Department of Homeless Services, City Planning and New York State Homes and Community Renewal.
Source: HPD Office of Development.
Indicator name: - New construction starts (HNY)Description: The total number of new construction housing units (starts) created and counted towards Housing
New York (HNY). Units are created through financed new construction, regulatory agreements creating affordability requirements, homebuyer and homeownership assistance. HNY counts units produced by Housing Preservation and Development, Housing Development Corporation, NYC Economic Development Corporation, New York City Housing Authority, Department of Homeless Services, City Planning and New York State Homes and Community Renewal.
Source: HPD Office of Development. Indicator name: - Preservation starts (HNY)Description: The total number of housing units preserved and counted towards Housing New York (HNY).
Preservation is defined as financed rehabilitation or a regulatory agreement extending affordability requirements. HNY counts units produced by Housing Preservation and Development, Housing Development Corporation, NYC Economic Development Corporation, New York City Housing Authority, Department of Homeless Services, City Planning and New York State Homes and Community Renewal.
Source: HPD Office of Development.
Indicator name: HNY units started for homeless individuals and familiesDescription: New construction and preservation units started and counted towards Housing New York that that
are restricted for homeless individuals and families.Source: HPD Office of Development.
Indicator name: HNY units started for senior individuals and familiesDescription: New construction and preservation units started and counted towards Housing New York that are
restricted for senior individuals and families.Source: HPD Office of Development.

Indicator Definitions | Page 211
Department of Housing Preservation and Development
Indicator name: Total housing completions (New Housing Marketplace Plan and Housing New York) (units)Description: The total number of housing units started under the New Housing Marketplace Plan (NHMP) and
Housing New York (HNY) where construction was completed. In the case of programs with no construction or permanent financing only, start and completion are reported simultaneously. Only projects that started under HNY, a 12 year plan that started in January 2014, will be counted as HNY completions. Projects started under the NHMP (July 1, 2003 to December 31, 2013) will be counted as NHMP completions.
Source: HPD Office of Development.
Indicator name: - New construction completions (NHMP and HNY)Description: The total number of new construction units started under the New Housing Marketplace Plan
(NHMP) and Housing New York (HNY) where construction was completed. In the case of programs with no construction or permanent financing only, start and completion are reported simultaneously. Only projects that started under HNY, a 12 year plan that started in January 2014, will be counted as HNY completions. Projects started under the NHMP (July 1, 2003 to December 31, 2013) will be counted as NHMP completions.
Source: HPD Office of Development. Indicator name: - Preservation completions (NHMP and HNY)Description: The total number of preservation units started under the New Housing Marketplace Plan (NHMP)
and Housing New York (HNY) where construction was completed. In the case of programs with no construction or permanent financing only, start and completion are reported simultaneously. Only projects that started under HNY, a 12 year plan that started in January 2014, will be counted as HNY completions. Projects started under the NHMP (July 1, 2003 to December 31, 2013) will be counted as NHMP completions.
Source: HPD Office of Development.
Indicator name: Asset management - Rental buildings in portfolio Description: The number of rental buildings that are monitored by HPD to ensure compliance with regulatory
and financial requirements. Buildings included in the asset management program are those where the City has made an investment in the form of land or money or both, or that were formerly owned by the City.
Source: Division of Asset Management. Indicator name: Asset management - Medium/high risk rental buildings in portfolio (%)Description: The percentage of total rental buildings in the asset management portfolio at risk or already
showing indications of physical deterioration, financial distress, or noncompliance with federal funding requirements. A project and its buildings are deemed medium or high risk if it meets certain criteria in at least one of three areas: physical health, financial health, or federal HOME and LIHTC compliance. Project physical health is measured by Housing Maintenance Code Class B (hazardous) and C (immediately hazardous) violations as well as Emergency Repair Balance. Financial health is measured by Emergency Repair Utility Balance, municipal arrears, and tax lien sale history. Fiscal year first quarter data is used as a proxy for the October year-to-date number reported in the Preliminary Mayor’s Management Report.
Source: Division of Asset Management. Indicator name: Asset management - Co-op buildings in portfolioDescription: The number of co-op buildings that are monitored by HPD to ensure compliance with regulatory
and financial requirements. Buildings included in the asset management program are those where the City has made an investment in the form of land or money or both, or that were formerly owned by the City.
Source: Division of Asset Management.
Page 212 | Mayor’s Management Report
Department of Housing Preservation and Development
Indicator name: Asset management - Medium/high risk co-op buildings in portfolio (%)Description: The percentage of total co-op buildings in the asset management portfolio at risk or already
showing indications of physical deterioration or financial distress. A project and its buildings are deemed medium or high risk if it meets certain criteria in at least one of two areas: physical health or financial health. Project physical health is measured by Housing Maintenance Code Class B (hazardous) and C (immediately hazardous) violations as well as Emergency Repair Balance. Financial health is measured by Emergency Repair Utility Balance, municipal arrears, and tax lien sale history. Fiscal year first quarter data is used as a proxy for the October year-to-date number reported in the Preliminary Mayor’s Management Report.
Source: Division of Asset Management.
Indicator name: Section 8 - Voucher utilization rateDescription: The percent of Section 8 vouchers allotted to HPD by the Department of Housing and Urban
Development that are used by families to rent housing in the private market. Source: Division of Tenant Resources. Indicator name: Section 8 - Vouchers issued Description: The number of new households receiving assisted rental vouchers for use in the private housing
market.Source: Division of Tenant Resources. Indicator name: Section 8 - Households assisted Description: The total number of households receiving a rent subsidy for a residential unit in the private
housing market. This includes the number assisted through the housing choice voucher program, enhanced vouchers, project-based vouchers, Mod Rehab and Shelter Plus Care.
Source: Division of Tenant Resources.
Indicator name: Section 8 subsidized units in abatement (%)Description: The percent of subsidized units that failed the Housing Quality Standard (HQS) inspection
conducted by HPD resulting in a unit being placed in abatement - i.e., the rent subsidy is temporarily suspended until all conditions resulting in failure are corrected by the owner. The percent total is derived from the number of units in abatement at the end of the month (June) divided by the total number of units receiving assistance. HQS standards are established by the Department of Housing and Urban Development’s Section 8 program regulations.
Source: Division of Tenant Resources.
Indicator name: Housing New York units started - Extremely low income (0-30% AMI)Description: The number of housing units created or preserved for households earning 0-30% of the area
median income as defined by the U.S. Department of Housing and Urban Development for the New York Metropolitan Area.
Source: HPD Office of Development.
Indicator name: Housing New York units started - Very low income (31%- 50% AMI)Description: The number of housing units created or preserved for households earning 31-50% of the area
median income as defined by the U.S. Department of Housing and Urban Development for the New York Metropolitan Area.
Source: HPD Office of Development.
Indicator Definitions | Page 213
Department of Housing Preservation and Development
Indicator name: E-mails responded to in 14 days (%)Description: The percentage of e-mails answered in 14 calendar days or less. Responses should be
substantive and adequately address the question/issue raised by the customer. A simple acknowledgement is not considered an adequate response. However, for more complex inquiries that require research and action on the part of the agency, an acknowledgement which includes a description of the next step (either on the agency’s behalf, or the customer’s), as well as an estimated time frame for completion, is considered acceptable and can be reported as part of the 14 day response. Agencies must internally track the additional time until a customer has a complete and full response.
Source: HPDInfo computer system.
Indicator name: Letters responded to in 14 days (%)Description: The percentage of letters answered in 14 calendar days or less. Responses should be
substantive and adequately address the question/issue raised by the customer. A simple acknowledgement is not considered an adequate response. However, for more complex inquiries that require research and action on the part of the agency, an acknowledgement which includes a description of the next step (either on the agency’s behalf, or the customer’s), as well as an estimated time frame for completion, is considered acceptable and can be reported as part of the 14 day response. Agencies must internally track the additional time until a customer has a complete and full response.
Source: HPDInfo computer system.
Indicator name: Average customer in-person wait time (minutes) Description: The average time in minutes from the time a customer meets with a greeter or information desk
representative until he or she is met by a customer service representative. Security/building entry wait times are not included unless a security guard plays a formal intake role.
Source: Division of Tenant Resources.
Indicator name: Visitors to the Division of Tenant Resources, Client and Owner Services rating customer service as good or better (%)
Description: The number of visitors to the Division of Tenant Resources, Client and Owner Services facility (HPD’s Section 8 walk-in center) who rated their overall customer service experience as good or excellent as a percent of the total number of visitors who completed surveys.
Source: Division of Tenant Resources.
Indicator name: Completed customer requests for interpretationDescription: The sum of all requests for interpretation using a language other than English fulfilled by the
agency via telephone (including Language Line, call centers, offices/reception desks and 311 transfer calls) and via face-to-face interaction with bilingual employees or contracted interpreters.
Source: Division of Tenant Resources.
Indicator name: CORE customer experience rating (0 -100)Description: An average score based on the rating of 15 conditions, including physical conditions (e.g.,
cleanliness, litter, seating) and customer service conditions (e.g., wait time, professionalism), for all agency walk-in facilities inspected, divided by the number of walk-in facilities inspected. Each of the 15 conditions can be rated excellent, good, fair or poor. Ratings of excellent are worth 100 points each, good ratings are worth 67 points, fair ratings are worth 33 points and poor ratings receive no points. Facilities are rated by trained City inspectors. Fiscal 2016 data for the overall rating represents a change in methodology. For agencies with multiple service centers, inspectors focused on sites that had historically lower scores, specifically sites that received an average overall site score of 85 or lower over the last three years and sites that received a score of 85 or lower in Fiscal 2015. If all agency service centers scored above 85 last year, the service center with the lowest overall score was inspected.
Source: Mayor’s Office of Operations – SCOUT.

Page 214 | Mayor’s Management Report
Department of Housing Preservation and Development
Indicator name: Percent of service requests meeting time to close Description: The percentage of service requests received that were closed for which the agency met its
planned time of action to provide the service. Source: Citywide Performance Reporting.
Indicator Definitions | Page 215
New York City Housing Authority
Indicator name: Rent collection (%)Description: The percentage of total rent amount collected from total rent amount Due for the year.Source: Rent Collection System
Indicator name: Rent Delinquency Rate (%)Description: The percentage of occupied units (households) that owe a balance greater than zero.Source: Rent Collection System
Indicator name: Average time to resolve emergency service requests (hours)Description: The average number of hours to resolve heat, hot water and electrical emergency service
requests.Source: Information Technology Indicator name: Average time to resolve nonemergency service requests (days)Description: The average number of days to resolve service requests that are not emergency or elevator
service requests. Source: Information Technology Indicator name: Average time to resolve heat service requests (hours)Description: The average number of hours to complete emergency and non-emergency non-heat service
requests. Source: Research and Management Analysis Indicator name: Average time to resolve elevator outages (hours)Description: The average number of hours to resolve reported emergency and non-emergency elevator
outages.Source: Research & Management Analysis
Indicator name: Average outage per elevator per monthDescription: The average number of outages per elevator car per month. Data excludes outages due to
preventive maintenance, shut downs due to inspections and rehab work, and “running with a problem” (in service) outages.
Source: RISE (Repair and Information System for Elevators) Indicator name: Elevator service uptime (%)Description: The percentage of time that elevators are in service.Source: Elevator Division
Indicator name: Alleged elevator injuries reported to the Department of BuildingsDescription: The number of alleged elevator incidents that are reported to the Department of Buildings where
a person(s) is injured and seeks medical attention. Source: Elevator Division
Indicator name: Elevator-related fatalitiesDescription: The number of elevator accidents that is reported to the Department of Buildings which results in
a fatality that may or may not have been caused by an elevator malfunction. Source: Elevator Division
Indicator name: Management cost per dwelling unit per month ($)Description: The average dollar amount NYCHA spends to manage an apartment each month. Calculated
as a “fully loaded” cost including salaries, utilities, equipment, contracts, debt service and miscellaneous expenses.
Source: Finance
Page 216 | Mayor’s Management Report
New York City Housing Authority
Indicator name: Average time to prepare vacant apartments (days)Description: The average time it takes NYCHA staff to complete repairs and routine maintenance in order for
an apartment to be ready for occupancy. Source: Research & Management Analysis Indicator name: Average turnaround time for vacant apartments (days)Description: The average time a NYCHA public housing apartment is vacant.Source: Research and Management Analysis Indicator name: Major felony crime rate per 1,000 residentsDescription: Rate per 1,000 residents of seven major felony crimes reported at NYCHA developments
during the reporting period. The seven major felony categories are: murder & non-negligent manslaughter, forcible rape, robbery, felonious assault, burglary, grand larceny, and grand larceny auto.
Source: NYPD; NYCHA Research and Management Analysis
Indicator name: Major felony crimes in public housing developmentsDescription: Total of seven major felony crimes (murder and non-negligent manslaughter, forcible rape,
robbery, felonious assault, burglary, larceny, and grand larceny auto) occurring on New York City Housing Authority property, including buildings, grounds and facilities.
Source: NYPD; NYCHA Research and Management Analysis
Indicator name: Active capital projects on schedule (%)Description: The percentage of all active capital projects that are on schedule. Active capital projects describe
all projects where a design has started, and the project has not yet been closed. “On schedule” means that the actual duration of the project is within the duration of the baseline set for that project.
Source: Research & Management Analysis
Indicator name: Active capital projects in construction phase on schedule (%)Description: The percentage of all active capital projects in the construction phase that are on schedule. Active
capital projects in construction describe the projects in the construction phase of the work. “On schedule” means that the actual duration of the project during the construction phase is within the duration of the baseline set for this phase of the project.
Source: Research & Management Analysis Indicator name: Apartment Attrition Rate(%)Description: The percentage of public housing apartments vacated during the reporting period.Source: Research & Management Analysis Indicator name: Occupancy rate (%)Description: The percentage of all available New York City Housing Authority public housing units that are
occupied. Source: Research and Management Analysis Indicator name: Applicants placed in public housingDescription: The number of applicants placed in an apartment in a public housing development (“conventional
public housing”).Source: Research and Management Analysis
Indicator Definitions | Page 217
New York City Housing Authority
Indicator name: Homeless applicants placed housing - TotalDescription: The number of homeless applicants placed in conventional public housing and via Section 8
vouchers.Source: Research and Management Analysis
Indicator name: Homeless applicants placed housing – NYCHA housingDescription: The number of homeless applicants placed in conventional public housing.Source: Research and Management Analysis
Indicator name: Homeless applicants placed housing – Section 8Description: The number of homeless applicants placed in housing using Section 8 vouchers.Source: Research and Management Analysis
Indicator name: Working families residing in public housing (cumulative) (%)Description: The percentage of working families residing in public housing. Source: Research and Management Analysis
Indicator name: Families on Section 8 waiting list (000)Description: The number, in thousands, of families on the waiting list to receive a Section 8 voucher (federal
rent assistance), including applicants in the eligibility and certification stages of the process and those who are in the preliminary stage of the application process.
Source: Research and Management Analysis
Indicator name: Maximum allowable Section 8 vouchersDescription: The number of US HUD approved and available units for NYCHA since inception. Source: Research and Management Analysis
Indicator name: Funded Section 8 vouchersDescription: The number of vouchers that US HUD provided funding for based on previous year expenses. Source: Research and Management Analysis
Indicator name: Utilization rate for funded Section 8 vouchers (%)Description: The percentage of funded Section 8 vouchers allotted to NYCHA from US HUD that are used by
families to rent housing in the private market. Source: Research and Management Analysis
Indicator name: Funding utilization for Section 8 vouchers (%)Description: The percentage of monthly housing payments over monthly approved housing budget. Source: Research and Management Analysis
Indicator name: Section 8 occupied units (vouchers)Description: The number of households in the Section 8 program.Source: Leased Housing
Indicator name: Biennial Section 8 inspectionsDescription: The percentage of annual inspections completed of those due.Source: Leased Housing
Indicator name: Annual Section 8 recertificationsDescription: The percentage of annual inspections conducted to assess the conditions of the units occupied
by Section 8 voucher holders.Source: NYCHA’s Siebel system
Page 218 | Mayor’s Management Report
New York City Housing Authority
Indicator name: Applicants placed through Section 8 vouchersDescription: The number of applicants who received Section 8 vouchers during the reporting period.Source: Research and Management Analysis
Indicator name: Unit InventoryDescription: The total number, in thousands, of apartments in public housing developments.Source: Research & Management Analysis Indicator name: Number of developmentsDescription: The number of NYCHA public housing developments.Source: NYCHA’s Property Database
Indicator name: Number of buildingsDescription: The number of buildings in NYCHA public housing developments.Source: NYCHA’s Property Database
Indicator name: Residents approved for the emergency transfersDescription: The number of Emergency Transfer Program cases approved for transfer.Source: Social Services Indicator name: Emergency transfer disposition time (days)Description: The average number of days to disposition Emergency Transfer Program cases.Source: Research & Management Analysis
Indicator name: Initial social service tenant contacts conducted within five days of referral (%)Description: The percentage of initial social service tenant contacts conducted within five days of social
services referral.Source: Social Services Indicator name: Referrals to supportive services rendered to senior residentsDescription: The number of referrals to supportive social services for senior residents during the reporting
period.Source: Social Services
Indicator name: NYCHA-operated senior centersDescription: The number of NYCHA-operated senior centers.Source: Community Operations
Indicator name: Utilization of senior centers (%) ages 60+Description: The number of seniors ages 60 and over who utilize NYCHA’s senior centers, divided by the
number of participants that the center can accommodate (based on staff to participant ratio of 1:15).
Source: Community Operations
Indicator name: Job training graduates placed in jobs (%)Description: The ratio of NYCHA residents who completed NYCHA sponsored job training programs to the
number of trainees who found jobs. Source: Resident Employment Services Indicator name: Residents job placements - TotalDescription: The number of NYCHA residents placed in jobs who receive assistance from Jobs Plus, NYCHA
Resident Training Academy (NRTA) and Partner Placements.Source: Resident Employment Services & Human Resources

Indicator Definitions | Page 219
New York City Housing Authority
Indicator name: Residents job placements – Direct placementsDescription: The number of NYCHA residents placed in jobs who were hired by NYCHA, including NYCHA
Resident Training Academy (NRTA) and REES placement types: Section 3, REP, Outside Employer.
Source: Resident Employment Services & Human Resources Indicator name: Residents job placements – Program and partner placementsDescription: The number of NYCHA residents placed in jobs who receive assistance from Jobs Plus or
partner-facilitated placement.Source: Resident Employment Services & Human Resources Indicator name: Youth placed in jobs through youth employment programsDescription: The number of youth placed in summer jobs in NYCHA developments through the summer
seasonal employment program and the Summer Youth Employment Program.Source: Human Resources

Page 220 | Mayor’s Management Report
New York City Housing Authority

Indicator Definitions | Page 221
Landmarks Preservation Commission
Indicator name: Individual, interior and scenic landmarks, and historic districts designatedDescription: The number of interior, exterior and scenic landmarks and the number of historic districts
designated by the Commission. The sites regulated by the Landmarks Preservation Commission includes all structures designated as individual or interior landmarks, such as buildings (including secondary buildings on landmarked sites, such as garages), bridges, viaducts, aqueducts, water towers, lighthouses, subway stations or amusement rides. This count also includes non-structural properties such as historic lampposts, sidewalk clocks, fences, plazas, monuments, or street plans.
Source: LPC Research Department. Indicator name: Total number of buildings designatedDescription: The number of individually landmarked buildings and the total number of designated buildings
within historic districts. Also included are all buildings designated as part of historic districts (including secondary buildings such as garages) and unimproved or vacant properties located within the boundaries of historic districts, as well as properties designated as scenic landmarks and buildings located within the boundaries of scenic landmarks.
Source: LPC Research Department. Indicator name: Work permit applications receivedDescription: The number of work permit applications received for review by LPC’s Preservation Department.Source: LPC Preservation Department. Indicator name: Actions taken on work permit applications receivedDescription: The number of actions taken on the work permit applications received. More than one action
can be taken on a single application. Examples of “actions” include the issuance of Expedited Certificates of No Effect, Certificates of No Effect, Permits for Minor Work and Certificates of Appropriateness, among others.
Source: LPC Preservation Department. Indicator name: Certificates of No Effect issued within 10 business days (%)Description: The percentage of Certificates of No Effect issued within 10 business days of the application
being completed. This type of permit is issued when proposed work on a designated structure requires a permit from the Department of Buildings but the proposed work will not affect a protected architectural feature of the structure.
Source: LPC Preservation Department. Indicator name: Expedited Certificates of No Effect issued within two business days (%)Description: The percentage of Expedited Certificates of No Effect issued within two business days of the
application being completed. This type of permit is issued when the proposed interior work above the second floor of a building requires a Department of Buildings permit and will not affect a protected architectural feature.
Source: LPC Preservation Department.
Indicator name: Permits for Minor Work issued within 10 business days (%)Description: The percentage of Permits for Minor Work issued within 10 business days of the application
being completed. This type of permit is issued for work that requires a Landmarks Commission permit but does not require a Department of Buildings permit. Examples include exterior painting, window and door replacements, and brick repointing.
Source: LPC Preservation Department. Indicator name: Investigations completedDescription: The number of completed investigations of reported incidences of illegal work on designated
structures. This can include initial and follow-up investigations. There also may be multiple complaints for one property.
Source: LPC Enforcement Department.
Page 222 | Mayor’s Management Report
Landmarks Preservation Commission
Indicator name: Enforcement actions taken: Total warning letter, notices of violations (NOVs), and stop work orders issued
Description: The number of warning letters, Notices of Violation (NOVs) and stop work orders issued by LPC during the reporting period. The number of enforcement actions taken is determined by the amount of illegal work found upon investigation.
Source: LPC Enforcement Department. Indicator name: Violations admitted to or upheld at the Office of Administrative Trials and Hearings (%) Description: The percentage of Notices of Violation upheld at OATH hearings. This includes violations that
were cured by the respondent without appearing at a hearing but does not include cases that are on hold while legal papers are being served or pending cases.
Source: LPC Enforcement Department; Office of Administrative Trials and Hearings. Indicator name: Archaeology applications receivedDescription: The number of archaeology applications received. Archaeology applications are submitted by
other City, State and federal agencies whenever projects within New York City that are subject to the environmental review process have the potential to impact archaeological resources.
Source: LPC Archaeology Department. Indicator name: Archaeology applications reviewed within 10 business days (%)Description: The percentage of archaeology applications reviewed within 10 business days of receipt of a
completed application.Source: LPC Archaeology Department.
Indicator name: Letters responded to in 14 days (%)Description: The percentage of letters answered in 14 calendar days or less. Responses are substantive and
adequately address the question/issue raised by the customer. However, for complex inquiries that require research and additional action on the part of the agency, an acknowledgement which includes a description of the next step, as well as an estimated time frame for completion, is considered acceptable and is also reported as part of the 14-day response. Agencies track the additional time until a customer has a complete and full response.
Source: Landmarks Preservation Commission.
Indicator name: E-mails responded to in 14 days (%)Description: The percentage of emails answered in 14 calendar days or less. Responses are substantive and
adequately address the question/issue raised by the customer. However, for complex inquiries that require research and additional action on the part of the agency, an acknowledgement which includes a description of the next step, as well as an estimated time frame for completion, is considered acceptable and is also reported as part of the 14-day response. Agencies track the additional time until a customer has a complete and full response.
Source: Landmarks Preservation Commission.

Administrative Services
Administrative Services
Department of Records & Information Services
Department of Finance
Department of Citywide Administrative Services
Board of Elections
Department of Information Technology & Telecommunications p 247
p 251
p 239
p 225
p 235
Indicator Definitions | Page 225
Department of Citywide Administrative Services
Indicator name: Applications received for all DCAS civil service examsDescription: The number of completed applications received by DCAS for Open Competitive, Promotion, and
Qualified Incumbent civil service examinations excluding NYC Transit Authority exams.Source: Mainframe computer system (APPS), maintained by the Bureau of Examination, within the
Human Capital Line of Service at the Department of Citywide Administrative Services (DCAS).
Indicator name: Employment applications received via NYC JobsDescription: The number of completed applications received from internal and external applicants via NYC
Jobs (www.nyc.gov/jobs) within the fiscal year.Source: New York City Automated Personnel System (NYCAPS).
Indicator name: New hires – White (%) – Black (%) – Hispanic (%) – Asian (%) – Some other race (%) – Male (%) – Female (%)Description: The number of newly hired people who identified themselves by race/ethnicity and gender divided
by the sum of all new hires in the Mayoral agencies during the reporting period represented as a percentage. Mayoral agencies included are the Offices of the Mayor, ACS, BIC, BSA, CCHR, DFTA, DOB, SBS, DCP, DCAS, DCA, DOC, DCLA, DDC, DEP, DOF, DOHMH, DHS, DoITT, DOI, DPR, DOP, DSNY, DOT, DVS, DYCD, DORIS, FISA, FDNY, HPD, HRA, LPC, LAW, MOCS, NYPD, OATH, OATA, OEM, OLR, OMB, OPA and TLC. Does not include DOE or public authorities and corporations.
Source: Citywide Equal Employment Database System (CEEDS).
Indicator name: Civil service exams open for filing by DCASDescription: The total number of examinations open for filing by DCAS within the fiscal year excluding NYC
Transit Authority exams.Source: Human Capital.
Indicator name: Median time from exam administration to exam results completion for DCAS-administered exams (days)
Description: The median number of days elapsed from the date a civil service exam was given to the date exam results are completed (list published or directly established at the request of a hiring agency) for all single-part (i.e., education & experience or multiple choice exams) and multi-part (i.e., qualifying education & experience or qualifying practical exams with competitive multiple choice exams) exams, excluding NYC Transit Authority (NYCTA) exams. NYCTA exams are excluded from this indicator because NYCTA has jurisdiction over the development, administration and scoring of its civil service exams; DCAS is only responsible for processing NYCTA’s eligible lists. List publication refers to the point at which results are sent to candidates and published lists are sent to hiring agencies. Appointments cannot be made until a list has been established and certified to hiring agencies. The fiscal year figure is the median number of days for the entire fiscal year.
Source: Human Capital. Indicator name: Average rating for professional development sessions (%)Description: The average rating for professional development training sessions sponsored by DCAS Citywide
Leaning and Development based on post-session surveys filled out by training participants and City employees that receive services. The highest possible rating given by each participant is 100%.
Source: Human Capital.
Page 226 | Mayor’s Management Report
Department of Citywide Administrative Services
Indicator name: City employees/participants trained in Managerial and Professional Development programsDescription: The total number of City employees/participants attending Managerial and Professional
Development (CMPD) programs sponsored/supported by DCAS Citywide Learning and Development.
Source: Human Capital.
Indicator name: City employees/participants trained in Equity and InclusionDescription: The number of City employees/participants attending Equity and Inclusion training programs
sponsored by DCAS Citywide Learning and Development.Source: Human Capital.
Indicator name: Average building cleanliness and condition rating for DCAS-managed space (non-court) (%)Description: The average cleanliness and condition rating of DCAS-managed office buildings. The ratings are
based on surveys received from tenants of DCAS in more than 20 office buildings. Each score is weighted by the square footage of the building the tenant is rating. The overall score tenants gave to their building is worth 20 percent of the total score and all other questions are worth 80 percent.
Source: Facilities Management. Indicator name: CORE customer experience rating of facilities (0-100)Description: An average Customers Observing and Reporting Experiences (CORE) score based on the rating
of 15 conditions, including physical conditions (e.g., cleanliness, litter, seating) and customer service conditions (e.g., wait time, professionalism), for all agency walk-in facilities inspected, divided by the number of walk-in facilities inspected. Each of the 15 conditions can be rated excellent, good, fair or poor. Ratings of excellent are worth 100 points each, good ratings are worth 67 points, fair ratings are worth 33 points and poor ratings receive no points. Facilities are rated by trained City inspectors. In Fiscal 2016 inspectors focused on sites that had historically lower scores, specifically sites that received an average overall site score of 85 or lower over the prior three years and sites that received a score of 85 or lower in Fiscal 2015. If all agency service centers scored above 85 in 2015, the service center with the lowest overall score was inspected in 2016. All of the agency service centers were inspected and included in the average score for all other years. Fiscal 2019 data will be reported in Fiscal 2020.
Source: Mayor’s Office of Operations.
Indicator name: Average time to complete in-house trade shop work orders for minor repairs (days)Description: The average time, in days, for DCAS staff to complete in-house trade shop work orders for
minor repairs starting from the time the work is assigned. DCAS calculates the average time to completion by including all work orders submitted, started and finished within a 30 day window. Calculations used for minor repairs do not include work orders finished beyond 30 days, including long-term projects as they may skew and misrepresent data presented. Work orders included in the calculations of this indicator reflect the average duration of work orders related to building operations and maintenance rather than renovations, small projects, long-term projects, etc. Trade shop includes carpenters, plumbers, electricians, etc., and is independent of maintenance and mechanical work.
Source: Facilities Management.
Indicator name: In-house trade shop work orders completed within 30 days (%)Description: The percentage of in-house work orders received by the DCAS trade shops finished within 30
days of the work being assigned. Trade shop includes carpenters, plumbers, electricians, etc., and is independent of maintenance and mechanical work.
Source: Facilities Management.
Indicator Definitions | Page 227
Department of Citywide Administrative Services
Indicator name: Lease-in agreements executedDescription: The number of lease-in real estate agreements executed by DCAS for City agency use in private
space. Real estate agreements executed include renewals, amendments and new executions of leases or licenses.
Source: Division of Real Estate Services.
Indicator name: Square footage associated with executed lease-in agreements (000)Description: The total square footage, in thousands, as specified in the lease-in or license agreement,
associated with the real estate agreements executed by DCAS for City agency use in private space. Real estate agreements executed include renewals, amendments and new executions of leases or licenses.
Source: Division of Real Estate Services.
Indicator name: Lease revenue generated ($000)Description: Total revenue, in thousands of dollars, generated from the lease of City-owned properties. Source: IPIS, a mainframe computer system maintained by the Division of Real Estate Services.
Indicator name: Revenue generated from the sale of surplus goods ($000)Description: Total revenue, in thousands of dollars, generated from the sale of the City’s surplus goods. Source: Budget.
Indicator name: – Revenue generated from auto auctions ($000)Description: Total revenue, in thousands of dollars, generated from the vehicle surplus (auto auction) sales.
Auto auction revenue is a component of ‘Revenue generated from the sale of surplus goods’ above.
Source: Citywide Fleet Management.
Indicator name: Real estate auction bids received ($000)Description: The amount, in thousands of dollars, of bids received from the sale of City-owned property to the
private sector at property auctions.Source: IPIS, a mainframe computer system maintained by the Division of Real Estate Services.
Indicator name: Average number of bidders per bidDescription: The total bids tabulated divided by the total number of bid openings, excluding bids for surplus
goods sold by the Department.Source: Commodity Line Item Purchasing System, a mainframe computer system maintained by the
Office of Citywide Procurement.
Indicator name: Mayoral agency spending on goods against DCAS master contracts (%)Description: The percentage of mayoral agency spending on goods (e.g., office supplies) through consolidated
master contracts put in place by the DCAS Office of Citywide Procurement (OCP). For procurements under $100,000 (“small purchases”), agencies can process their own purchases/contracts if OCP does not have a master contract in place to meet that need. This indicator does not include spending outside of DCAS OCP’s portfolio (e.g. excludes technology, construction and professional services).
Source: Financial Management System.
Indicator name: Mayoral agency spending on services against DCAS master contracts (%)Description: The percentage of mayoral agency spending on standard services (e.g., elevator maintenance)
through consolidated master contracts put in place by the DCAS Office of Citywide Procurement. Source: Financial Management System.
Page 228 | Mayor’s Management Report
Department of Citywide Administrative Services
Indicator name: Value of goods and services purchased ($000,000)Description: The value, in millions of dollars, of purchase orders processed by the DCAS on behalf of City
agencies. Purchase orders are requests from City agencies to purchase goods through DCAS contracts.
Source: Office of Citywide Procurement.
Indicator name: Value of Central Storehouse requisitions ($000)Description: The value, in thousands of dollars, of all items purchased and stored by City agencies at the
City’s Central Storehouse.Source: Office of Citywide Procurement.
Indicator name: Average time to fulfill an agency requisition (days)Description: Average number of days from submission of an agency request for goods stored at the DCAS
Central Storehouse until signed delivery at the requesting location. Source: Office of Citywide Procurement.
Indicator name: Inspections deemed non-compliantDescription: The number of quality assurance inspections resulting in a deduction or credit applied
(deductions), a product deemed non-compliant or rejected (rejections), or a product or portion of the products being withheld (withholds), as a result of not meeting contract specifications.
Source: Office of Citywide Procurement.
Indicator name: Value of cost avoidance ($)Description: The dollar value of cost avoidance for products deemed non-compliant with contract requirements
and specifications by quality assurance inspectors. The value of cost avoidance includes deductions, rejections and withholds (defined above). If an item is delivered to the City that does not conform to the bid specification but may still be used or if it deviates slightly from the requirements within the specification, DCAS Office of Citywide Procurement may negotiate an appropriate price deduction with the supplier. Judgments regarding the magnitude of an agreed upon price deduction will draw upon contract specifications, laboratory reports, determinations of technical experts, and other generally recognized trade and government sources.
Source: Office of Citywide Procurement.
Indicator name: Electricity purchased (kilowatt hours) (billions)Description: Total electricity purchased in billions of kilowatt hours (kWh). Source: Bills paid by DCAS. Indicator name: Total energy purchased (British thermal units) (trillions)Description: Total energy purchased in trillions of British thermal units (BTUs), including electricity, gas and
steam.Source: Bills paid by DCAS.
Indicator name: – Electricity (%)Description: Electricity purchased as a percent of the total energy purchased by the City (in British thermal
units (BTUs)).Source: DCAS Energy Management.
Indicator name: – Natural gas (%)Description: Natural gas purchased as a percent of total energy purchased (in British thermal units (BTUs)). Source: DCAS Energy Management.
Indicator name: – Steam (%)Description: Steam purchased as a percent of total energy purchased (in British thermal units (BTUs)). Source: DCAS Energy Management.
Indicator Definitions | Page 229
Department of Citywide Administrative Services
Indicator name: Annual estimated reduction in greenhouse gas emissions from all energy projects (metric tons)Description: The annual reduction in greenhouse gas (GHG) emissions, by metric ton, (carbon dioxide
equivalent or CO2e) estimated to be reduced as a result of energy efficiency and retro-commissioning projects that have been funded, in whole or in part, by DCAS on behalf of the City and are completed within the fiscal year reported. This measurement only reports on the estimated GHG reductions in building-related emissions for buildings with energy projects completed within a fiscal year and does not account for adjustments in other variables (e.g., changes in weather, occupancy, operation, etc.) that may impact the actual change in energy usage as reported in MMR energy usage data. Funded refers to funds invested by DCAS, or awarded by DCAS, to other City agencies for that agency’s implementation of a project.
Source: DCAS Energy Management.
Indicator name: Cumulative estimated reduction in greenhouse gas emissions from all energy projects (metric tons)
Description: Using Fiscal 2012 as a baseline, or starting point, the cumulative reduction in GHG emissions, by metric ton, (carbon dioxide equivalent or CO2e) estimated to be reduced as a result of energy efficiency and retro-commissioning projects that have been funded, in whole or in part, by DCAS on behalf of the City and are completed within a fiscal year period. This measurement reports the GHG reductions in building-related emissions for buildings with energy projects were completed within a fiscal year period and does not account for adjustments in other variables (e.g. changes in weather, occupancy, operation, etc.) that may impact the actual change in energy usage as reported in MMR energy usage data. Funded refers to funds invested by DCAS, or awarded by DCAS, to other City agencies for that agency’s implementation of a project.
Source: DCAS Energy Management.
Indicator name: Annual estimated avoided energy cost from all energy projects ($000,000)Description: The annual estimated energy cost avoided, in millions of dollars, derived from municipal energy
and retro-commissioning projects completed within a fiscal year based on project scopes, that have been funded, in whole or in part, by DCAS on behalf of the City, without adjusting for other variables (e.g., changes in weather) that may impact the actual change in energy usage as reported in MMR energy usage data.
Source: DCAS Energy Management. Indicator name: Cumulative estimated avoided energy cost from all energy projects ($000,000)Description: Using Fiscal 2012 as a baseline, or starting point, the cumulative estimated energy cost avoided,
in millions of dollars, derived from municipal energy and retro-commissioning projects completed within a fiscal year based on project scopes, that have been funded, in whole or in part, by DCAS on behalf of the City, without adjusting for other variables (e.g., changes in weather) that may impact the actual change in energy usage as reported in MMR energy usage data.
Source: DCAS Energy Management.
Indicator name: Annual energy retrofit/conservation projects completedDescription: The annual number of energy retrofit, retro-commissioning, solar thermal and co-generation
projects installed and operational within or on municipal buildings/structures in a given fiscal year.Source: DCAS Energy Management.
Indicator name: Cumulative energy retrofit/conservation projects completedDescription: Using Fiscal 2012 as a baseline, or starting point, the cumulative number of energy retrofit,
retro-commissioning, solar thermal and co-generation projects installed and operational in or on municipal buildings/structures.
Source: DCAS Energy Management.
Page 230 | Mayor’s Management Report
Department of Citywide Administrative Services
Indicator name: Annual Energy Efficiency Reports (EER) completedDescription: The annual number of Energy Efficiency Reports (EERs), comprised of energy audits and
retro-commissioning reports as per Local Law 87 of 2009. Energy audits are compliant energy efficiency assessments completed in municipal buildings.
Source: DCAS Energy Management.
Indicator name: Cumulative Energy Efficiency Reports (EER) completedDescription: Using Fiscal 2012 as a baseline, or starting point, the cumulative number of Energy Efficiency
Reports (EERs), comprised of energy audits and retro-commissioning reports as per Local Law 87 of 2009. Energy audits are compliant energy efficiency assessments completed in municipal buildings.
Source: DCAS Energy Management.
Indicator name: Cumulative installed solar capacity (megawatts)Description: Using Fiscal 2012 as a baseline, or starting point, the cumulative energy generating capacity, in
megawatts, of exclusively solar systems that are installed and operational within or on City-owned buildings/structures, including those operated by City-affiliated public benefit corporations or not-for-profit corporations.
Source: DCAS Energy Management.
Indicator name: Hybrid or alternative fuel vehicles in the citywide fleet (%)Description: The percentage of the City’s total fleet that is hybrid and/or runs on fuels other than the traditional
petroleum gasoline/diesel. Alternative fuels include compressed natural gas, biodiesel blends, electricity and solar.
Source: Citywide Fleet Management.
Indicator name: – Hybrid or alternative fuel vehicles in the DCAS-managed fleet (%)Description: The percentage of the DCAS-managed fleet, a subset of the City’s total fleet that is managed
directly by DCAS, which is hybrid and/or runs on fuels other than the traditional petroleum gasoline/diesel. Alternative fuels include compressed natural gas, biodiesel blends, electricity and solar.
Source: Citywide Fleet Management.
Indicator name: Vehicles with highest emission ratings purchased pursuant to Local Law 38 in the citywide fleet (%)
Description: The percentage of light-duty and medium-duty vehicles purchased for the City through DCAS that are certified with the three highest ratings defined by California Low-Emission Vehicle (LEV) II standards. The three highest ratings are zero emission vehicles (ZEV), advanced technology partial zero emission vehicles (ATPZEV), and partial zero emission vehicles (PZEV). Pursuant to Local Law 38 of 2005, each light- and medium-duty vehicle that the City purchases should have the best certified emission rating within its vehicle category while meeting the requirements for the City’s intended use. According to the law, some exceptions apply based on cost and other limited exemptions, including exceptions for certain emergency vehicles.
Source: Vehicle Tracking System.
Indicator Definitions | Page 231
Department of Citywide Administrative Services
Indicator name: – Vehicles with highest emission ratings purchased pursuant to Local Law 38 in the DCAS- managed fleet (%)
Description: The percentage of light-duty and medium-duty vehicles purchased for the DCAS-managed fleet, a subset of the City’s total fleet, which is managed directly by DCAS, that are certified with the three highest ratings defined by California Low-Emission Vehicle (LEV) II standards. The three highest ratings are zero emission vehicles (ZEV), advanced technology partial zero emission vehicles (ATPZEV), and partial zero emission vehicles (PZEV). Pursuant to Local Law 38 of 2005, each light- and medium -duty vehicle that the City purchases should have the best certified emission rating within its vehicle category while meeting the requirements for the City’s intended use. According to the law, some exceptions apply based on cost and other limited exemptions, including exceptions for certain emergency vehicles.
Source: Vehicle Tracking System.
Indicator name: Electric vehicles in the citywide fleetDescription: The number of electric and plug-in vehicles in the citywide fleet. The fiscal year figure is the
number of electric vehicles on the last day of the reporting period.Source: Citywide Fleet Management.
Indicator name: – Electric vehicles in the DCAS-managed fleetDescription: The number of electric and plug-in vehicles in the DCAS- managed fleet, a subset of the citywide
fleet. The fiscal year figure is the number of electric vehicles on the last day of the reporting period.
Source: Citywide Fleet Management.
Indicator name: Fleet in-service rate citywide (%)Description: The percentage of the total citywide fleet that is available for use each month.Source: Citywide Fleet Management.
Indicator name: – Fleet in-service rate for DCAS-managed fleet (%)Description: The percentage of the DCAS-managed fleet, a subset of the City’s total fleet managed directly by
DCAS, that is available for use each month.Source: Citywide Fleet Management.
Indicator name: City employees trained in defensive driving citywideDescription: The number of City employees trained in defensive driving, a six-hour course focused on
preventive and safe driving and the rules of the road. A class completion certificate lasts for three years.
Source: Citywide Fleet Management.
Indicator name: – Employees of DCAS-managed fleet agencies trained in defensive drivingDescription: The number of employees of DCAS-managed fleet agencies trained in defensive driving, a
subset of all City employees trained in defensive driving.Source: Citywide Fleet Management.
Indicator name: Collisions per 100,000 miles involving City vehicles citywideDescription: The number of City-vehicle involved collision reports per 100,000 miles traveled in the citywide
fleet reported in the citywide collision reporting system (CRASH). New York State MV-104 reports are required whenever a collision occurs involving death, or other personal injury, or property damage over $1,000. Collisions are tracked and reported regardless of whether or not the collision was preventable and whether or not the vehicle was in motion. Collisions involving City vehicles occur whenever a City vehicle strikes (or is struck by) a second vehicle, pedestrian, bicyclist or fixed object.
Source: Citywide Fleet Management.
Page 232 | Mayor’s Management Report
Department of Citywide Administrative Services
Indicator name: – Collisions per 100,000 miles involving City vehicles in the DCAS managed fleetDescription: The number of City-vehicle involved collision reports per 100,000 miles traveled for the DCAS-
managed fleet, a subset of the City’s total fleet, that is managed directly by DCAS in CRASH. New York State MV-104 reports are required whenever a collision occurs involving death, or other personal injury, or property damage over $1,000. Collisions are tracked and reported regardless of whether or not the collision was preventable and whether or not the vehicle was in motion. Collisions involving City vehicles occur whenever a City vehicle strikes (or is struck by) a second vehicle, pedestrian, bicyclist or fixed object.
Source: Citywide Fleet Management.
Indicator name: Preventable collisions per 100,000 miles involving City vehicles citywideDescription: The number of preventable collisions reports per 100,000 miles traveled in the citywide fleet. A
preventable collision is in which the driver, by his/her own admission or in the judgment of an Agency Accident Review Committee, did not take all reasonable avoidance actions, including attention to road conditions and improper actions of other drivers. Preventability is not limited to the violation of traffic laws and is distinguished from chargeability as determined by the law.
Source: Citywide Fleet Management.
Indicator name: – Preventable collisions per 100,000 miles involving City vehicles in the DCAS- managed fleetDescription: The number of preventable collisions reports per 100,000 miles traveled for the DCAS-managed
fleet, a subset of the City’s total fleet. A preventable collision is in which the driver, by his/her own admission or in the judgment of an Agency Accident Review Committee, did not take all reasonable avoidance actions, including attention to road conditions and improper actions of other drivers. Preventability is not limited to the violation of traffic laws and is distinguished from chargeability as determined by the law.
Source: Citywide Fleet Management.
Indicator name: Injuries involving collisions in City vehicles citywide per 100,000 milesDescription: The number of injuries associated with collisions per 100,000 miles traveled that included at least
one City vehicle.Source: Citywide Fleet Management.
Indicator name: – Injuries involving collisions in City vehicles in the DCAS-managed fleet per 100,000 milesDescription: The number of injuries associated with collisions per 100,000 miles traveled that included at least
one vehicle in the DCAS-managed fleet, a subset of citywide injuries. Source: Citywide Fleet Management.
Indicator name: Fatalities resulting from collisions involving non-emergency City vehicles citywideDescription: The number of fatalities associated with collisions that included at least one non-emergency City
vehicle.Source: Citywide Fleet Management.
Indicator name: – Fatalities resulting from collisions involving non-emergency City vehicles in the DCAS-managed fleet
Description: The number of fatalities associated with collisions that included at least one non-emergency vehicle in the DCAS-managed fleet, a subset of citywide fatalities.
Source: Citywide Fleet Management.
Indicator name: Workplace injuries reportedDescription: All incidents resulting in a workers’ compensation or line of duty injury claim regardless of whether
or not time is lost. The number of incidents reported by DCAS, on a monthly basis, reflects the number of incidents that occurred. Employees may not report an injury at the time the incident occurred and may report it on a later date, resulting in a delay on the date an incident is reported.
Source: Administration and the Office of the General Counsel, Citywide Occupational Safety and Health.
Indicator Definitions | Page 233
Department of Citywide Administrative Services
Indicator name: Accidents involving the public in DCAS-managed properties Description: All accidents recorded by the DCAS security vendor.
Source: Administration, DCAS Security.
Indicator name: Average cost of training per employee ($)Description: The average cost of training per City employee trained during the reporting period. Calculated as
a “fully loaded” cost including vendor payments, staff costs and facility overhead.Source: Vendor training costs are taken from an internal database maintained by Human Capital and
the Agency Chief Contracting Officer. DCAS personnel costs are taken from the City’s Payroll Management System. Overhead costs are calculated based on information in the City’s Financial Management System.
Indicator name: Average cost of cleaning per square foot ($)Description: The average cost of supplies, equipment and personnel expenses per square foot of space
cleaned, including both court and non-court public buildings.Source: Budget.
Indicator name: Letters responded to in 14 days (%)Description: The percentage of letters answered in 14 calendar days or less out of the total number of letters
responded to during the reporting period. Responses are substantive and adequately address the question/issue raised by the customer. However, for complex inquiries that require research and additional action on the part of the agency, an acknowledgement that includes a description of the next step, as well as an estimated time frame for completion, is considered acceptable and is also reported as part of the 14 day response. Agencies track the additional time until a customer receives a complete and full response.
Source: DCAS Correspondence Management System.
Indicator name: E-mails responded to in 14 days (%)Description: The percentage of e-mails answered in 14 calendar days or less out of the total number of
e-mails responded to during the reporting period. Responses are substantive and adequately address the question/issue raised by the customer. However, for complex inquiries that require research and additional action on the part of the agency, an acknowledgement that includes a description of the next step, as well as an estimated time frame for completion, is considered acceptable and is also reported as part of the 14 day response. Agencies track the additional time until a customer receives a complete and full response.
Source: DCAS Correspondence Management System.
Indicator name: Average wait time to speak with a customer service agent (minutes)Description: The average time in minutes from the time a customer meets with a greeter or information desk
representative until he or she is met by a customer service representative. Security/building entry wait times are not included unless a security guard plays a formal intake role.
Source: Department of Citywide Administrative Services.

Page 234 | Mayor’s Management Report
Department of Citywide Administrative Services

Indicator Definitions | Page 235
Department of Records and Information Services
Indicator name: Records digitizedDescription: The total number of digital images produced by the Municipal Archives digital laboratory or by
vendor contract. Source: Municipal Archives Division. Indicator name: Number of library items available Description: The number of New York City government reports, books and other publications housed in the
Department’s City Hall Library. Source: City Hall Library. Indicator name: Unique visitors to agency website and related online platforms (000)Description: The number of unique visitors to archives.nyc, luna gallery, youtube, and the agency website.Source: Municipal Archives Division.
Indicator name: Publications and reports acquiredDescription: The number of government reports, studies, professional journals, published books and
collections of legal statutes and codes the Department has officially accessioned either in print or electronically.
Source: City Hall Library. Indicator name: Percent of required agency reports submitted to the Municipal Library publications portal Description: The percentage of agency compliance with Section 1133 of the City Charter, which requires
City agencies to post their qualifying publications to the Department’s electronic portal for public access. It is the ratio of publications posted by agencies to the number of applicable publications released.
Source: Municipal Library.
Indicator name: Records accessioned in Municipal Archives (cubic ft.)Description: The volume of archival records, measured in cubic feet, that were accessioned. Source: Municipal Archives Division. Indicator name: Walk-in and program attendees at the Visitor Center.Description: The number of people visiting the Department’s Visitor Center and Media Room at 31 Chambers
Street in Manhattan, on a planned and unplanned basis.Source: Municipal Records Management Division. Indicator name: Vital record requests responded to within 12 business days (%)Description: The percent of vital record requests for which the Department conducted a record search
and sent the search results (either a certified copy of the record or a “not found” statement) to the customer within 12 business days. Data is calculated based on the number of requests completed during four or five randomly selected days each month.
Source: Municipal Archives Division.
Indicator name: Average response time to vital record requests (days)Description: The average time it took the Department to conduct a record search and send the search
results (either a certified copy of the record or a “not found” statement) to the customer. Data is calculated based on the number of requests completed during four or five randomly selected days each month.
Source: Municipal Archives Division. Indicator name: Average response time to historical photo requests (days)Description: The average time it took the Department to produce and send the requested historical image.
Data is calculated based on the number of requests completed during two or three randomly selected days each month.
Source: Municipal Archives Division.
Page 236 | Mayor’s Management Report
Department of Records and Information Services
Indicator name: Preservation actions performedDescription: The number of records or holdings that require preservation work that have had any preservation
action completed by the Conservation Unit including the necessary rehousing, conservation treatments and other specialized measures.
Source: Municipal Archives Division.
Indicator name: Average response time to agency requests for inactive records (days)Description: The average time it takes the Department to retrieve inactive records from the warehouses,
calculated from the day the request is made by the City agency, court or district attorney’s office to the day the records are available for pick-up.
Source: Municipal Records Management Division. Indicator name: Requests for stored records processed within 48 hours (%)Description: The percentage of requests for stored records that the Department processed within 48 hours,
calculated from the business hour that the request is received from the City agency, court or district attorney’s office to the business hour the records are available for pick-up.
Source: Municipal Records Management Division. Indicator name: Warehouse capacity available for new accessions (%)Description: The percent of warehouse (off-site storage facilities) capacity available to store client agency
records. Source: Municipal Records Management Division.
Indicator name: Records transferred into Municipal Records Center (cubic ft.)Description: The quantity of records transferred into the Municipal Records Center during the reporting period. Source: Municipal Records Management Division.
Indicator name: Average time between records disposal eligibility and application sent to Law Department (months)
Description: The average time it takes the Department of Records and Information Services (DOR) to send a records disposal application to the Law Department for review and approval, calculated from the time a client agency has been notified by DOR that a record series is eligible for disposal; agencies must return an authorized disposal application to DOR after notification. Note: Data reported as Four-month Actual for this indicator reflects first-quarter information for this quarterly-reported measure.
Source: Municipal Records Management Division. Indicator name: Average time for Law Department to approve records disposal application (months)Description: The average time it takes the Law Department to approve a records disposal application,
calculated from the time the Department of Records and Information Services sends the application to the Law Department. Note: Data reported as Four-month Actual for this indicator reflects first-quarter information for this quarterly-reported measure.
Source: Municipal Records Management Division.
Indicator name: Total records disposed by City government entities (cubic ft.)Description: The overall total amount of records disposed directly by all City government entities from their
offices or off-site storage facilities. This measurement is the sum of the indicator tracking the quantity of records disposed by DOR from its off-site Municipal Records Center storage facilities, which has moved from the “book” section of the MMR to the online MMR site, and the quantity of records disposed by all City government entities other than this Department, which now monitors such disposals.
Source: Municipal Records Management Division.
Indicator Definitions | Page 237
Department of Records and Information Services
Indicator name: Letters responded to in 14 days (%)Description: The percentage of letters answered in 14 calendar days or less. Responses are substantive and
adequately address the question/issue raised by the customer. However, for complex inquiries that require research and additional action on the part of the agency, an acknowledgement which includes a description of the next step, as well as an estimated timeframe for completion, is considered acceptable and is also reported as part of the 14-day response. Agencies track the additional time until a customer has a complete and full response.
Source: DOR.
Indicator name: E-mails responded to in 14 days (%)Description: The percentage of e-mails answered in 14 calendar days or less. Responses are substantive and
adequately address the question/issue raised by the customer. However, for complex inquiries that require research and additional action on the part of the agency, an acknowledgement which includes a description of the next step, as well as an estimated timeframe for completion, is considered acceptable and is also reported as part of the 14-day response. Agencies track the additional time until a customer has a complete and full response.
Source: DOR.
Indicator name: CORE customer experience rating (0-100) Description: An average score based on the rating of 15 conditions, including physical conditions (e.g.,
cleanliness, litter, seating) and customer service conditions (e.g. wait time, professionalism), for all agency walk-in facilities inspected, divided by the number of walk-in facilities inspected. Each of the 15 conditions can be rated excellent, good, fair or poor. Ratings of excellent are worth 100 points each, good ratings are worth 67 points, fair ratings are worth 33 points and poor ratings receive no points. Facilities are rated by trained City inspectors. Fiscal 2017-18 data for Customers Observing and Reporting Experiences (CORE) ratings are based on the inspection results of all the agency’s service centers. In Fiscal 2016, as an exception, the rating was based on inspections of targeted facilities.
Source: Mayor’s Office of Operations.

Page 238 | Mayor’s Management Report
Department of Records and Information Services
Indicator Definitions | Page 239
Department of Finance
Indicator name: Property taxes billed that are paid (%)Description: The percent of property taxes that Finance bills New York City property owners that was resolved
by the end of the tax period. This is the inverse of the property tax delinquency rate.Source: Tax Policy Division.
Indicator name: Property taxes – Paid on time (%)Description: The percent of property taxes that Finance bills New York City property owners, net of exemptions
and reductions, resolved within one month of the due date. Source: Tax Policy Division.
Indicator name: Average turnaround time for field audits (days) Description: The average number of calendar days its takes Finance to complete an audit of bank, corporate,
commercial rent, general corporation, hotel, unincorporated business, utility, sales and personal income tax returns, measured from the date the case is initiated to the closing date.
Source: Audit Division.
Indicator name: Average turnaround time for non-field audits (days) Description: The average number of calendar days its takes Finance to complete an audit of bank, corporate,
commercial rent, general corporation, hotel, unincorporated business, utility, sales and personal income tax returns, measured from the date the case is initiated to the closing date.
Source: Audit Division.
Indicator name: Increase in tax liability as a result of audits (%)Description: For audits completed during the fiscal year, the additional tax revenue identified in audits of tax
returns divided by the original tax liability filed by taxpayers in the same returns. Source: Audit Division.
Indicator name: Originally noticed properties sold in lien sale (%) Description: The number of liens sold in a lien sale after receiving a 90 day notice as a percent of the total
number of liens issued. The 90-day period is related to the length of time allowed to make arrangements to pay off the lien.
Source: Collections Division. Indicator name: Properties in final lien sale Description: The number of properties that were included in the annual lien sale of properties on which unpaid
debt (property taxes, water bill, or other property charges) remains after four lien sale notices have been sent to the property owner.
Source: Collections Division.
Indicator name: Average time to issue a property tax refund (days) Description: The average number of calendar days it takes Finance to issue a property tax refund, measured
from when the application is received to the date the check is mailed.Source: Refunds & Adjustments Unit.
Indicator name: Average time to issue a business tax refund (days) Description: The average number of calendar days it takes Finance to issue a refund for business taxes,
measured from the postmark date of the tax return or refund claim to the date the check is mailed to the customer. This includes non-requested business tax refunds as well.
Source: Payment Operations.
Indicator name: Average time to issue a requested business tax refund (days) Description: The average number of calendar days it takes Finance to issue a refund for business taxes,
measured from the postmark date of the tax return or refund claim to the date the check is mailed to the customer.
Source: Payment Operations.
Page 240 | Mayor’s Management Report
Department of Finance
Indicator name: Average time to issue a non-requested business tax refund (days) Description: The average number of calendar days it takes Finance to issue a refund for business taxes
without a prior request from the taxpayer, measured from the postmark date of the tax return to the date the check is mailed to the customer.
Source: Payment Operations.
Indicator name: Parking tickets resolved within 90 days (000)Description: The number of parking tickets that were either paid or dismissed within 90 days of issuance. The
90-day period is related to the length of time allowed to contest a parking ticket and appeal a hearing decision.
Source: STARS system/Information Technology Division.
Indicator name: Parking tickets issued that are paid within 90 days (%) Description: The number of parking tickets that are paid within 90 calendar days as a percent of the total
number of parking tickets issued in a particular month. The 90-day period is related to the length of time allowed to contest a parking ticket and appeal a hearing decision.
Source: STARS system/Information Technology Division.
Indicator name: Parking tickets issued that are dismissed within 90 days (%)Description: The number of parking tickets that are dismissed at a hearing within 90 calendar days of issuance
as a percent of the total number of parking tickets issued in a particular month. The 90-day period is related to the length of time allowed to contest a parking ticket and appeal a hearing decision.
Source: STARS system/Information Technology Division.
Indicator name: Summonses adjudicated (000)Description: The total number of parking summonses challenged by motorists.Source: Adjudication Division.
Indicator name: Parking ticket hearings – Total – In-person hearings – Hearings-by-mail – Online hearingsDescription: The total number of parking ticket hearings conducted by Administrative Law Judges and the
number conducted in each category. There are three ways motorists can request a hearing to dispute a parking ticket - online, in person and by mail.
Source: Adjudication Division.
Indicator name: Parking ticket “pay or dispute” app transactionsDescription: The number of transactions made using NYC’s mobile “pay or dispute” app to securely pay or
dispute parking and camera violations.Source: Adjudication Division.
Indicator name: Average turnaround time for in-person parking ticket hearings (minutes)Description: The average number of minutes from the time a motorist (non-commercial vehicle driver)
receives a Q-matic ticket to the completion of the hearing by an Administrative Law Judge, or the completion of a settlement conference by a clerk for those eligible motorists who opt to participate in the Parking Violations Settlement Program. (Note: The Program ended on January 31, 2012.)
Source: Q-matics system and manual records maintained by Administrative Law Judges in the Business Centers.
Indicator Definitions | Page 241
Department of Finance
Indicator name: Average turnaround time to issue decision for a parking ticket hearing-by-web (days) Description: The average number of calendar days from the receipt of a request for an online hearing until
a decision is issued by an Administrative Law Judge. The time to process settlement offers for those eligible non-commercial motorists who opted to participate in the Parking Violations Settlement Program is included in the calculation through January 31, 2012, at which time the Program ended.
Source: Adjudication Division.
Indicator name: Average turnaround time to issue decision for a parking ticket hearing- by-mail (days)Description: The average number of calendar days from the receipt of a written request for a hearing until
a decision is issued by an Administrative Law Judge. The time to process settlement offers for those eligible non-commercial motorists who opted to participate in the Parking Violations Settlement Program is included in the calculation through January 31, 2012, at which time the Program ended.
Source: Adjudication Division.
Indicator name: Parking ticket appeals reviewedDescription: The number of parking ticket hearing decisions that were appealed and reviewed by the
Appeals Board. The Appeals Board consists of three or more Administrative Law Judges, Senior Administrative Law Judges, or Supervising Administrative Law Judges. The Appeals Board reviews the facts and the law but does not consider any evidence that was not presented at the original hearing. A concurring vote by two members of the Appeals Board panel is required to make a determination on an appeal; the determination is considered final.
Source: Adjudication Division.
Indicator name: Parking ticket appeals granted a reversal (%) Description: The number of appeals filed that resulted in the hearing decision being reversed divided by the
total number of appeals reviewed.Source: Adjudication Division.
Indicator name: Senior Citizen Rent Increase Exemption (SCRIE) – Initial applications receivedDescription: The number of initial SCRIE applications received by DOF. Applications are received at the DOF
mail room and then immediately sent to the SCRIE unit, where they are date stamped. This is the count of that date stamp.
Source: SCRIE Unit.
Indicator name: Average time to process initial SCRIE applications (days)Description: The time, measured in calendar days, between the date an initial SCRIE application is received at
the SCRIE unit and the date the review process is completed; that is, the application is approved, denied or deemed incomplete.
Source: SCRIE Unit.
Indicator name: SCRIE – Renewal applications receivedDescription: The number of renewal applications for SCRIE benefits received by DOF. Applications are
received by the DOF mail room and then immediately sent to the SCRIE unit, where they are date stamped. This is the count of that date stamp.
Source: SCRIE Unit.
Indicator name: Average time to process SCRIE renewal applications (days)Description: The time, measured in calendar days, between the date a renewal application for SCRIE
benefits is received at the SCRIE unit and the date the review process is completed, that is, the application is approved, denied or deemed incomplete.
Source: SCRIE Unit.
Page 242 | Mayor’s Management Report
Department of Finance
Indicator name: Disability Rent Increase Exemption (DRIE) – Initial applications receivedDescription: The number of initial DRIE applications received by DOF. Applications are received at the DOF
mail room and then immediately sent to the DRIE unit, where they are date stamped. This is the count of that date stamp.
Source: DRIE Unit.
Indicator name: Average time to process initial DRIE applications (days)Description: The time, measured in calendar days, between the date an initial DRIE application is received at
the DRIE unit and the date the review process is completed; that is, the application is approved, denied or deemed incomplete.
Source: DRIE Unit.
Indicator name: DRIE – Renewal applications receivedDescription: The number of renewal applications for DRIE benefits received by DOF. Applications are
received by the DOF mail room and then immediately sent to the DRIE unit, where they are date stamped. This is the count of that date stamp.
Source: DRIE Unit.
Indicator name: Average time to process renewal DRIE applications (days)Description: The time, measured in calendar days, between the date a renewal application for DRIE benefits
is received at the DRIE unit and the date the review process is completed, that is, the application is approved, denied or deemed incomplete.
Source: DRIE Unit.
Indicator name: Senior Citizen Homeowner Exemption (SCHE) – Initial applications receivedDescription: The number of initial SCHE applications received by DOF. Applications are received at the DOF
mail room and then immediately sent to the SCHE unit, where they are date stamped. This is the count of that date stamp.
Source: SCHE Unit.
Indicator name: Average time to process initial SCHE applications (days)Description: The time, measured in calendar days, between the date an initial SCHE application is received at
the SCHE unit and the date the review process is completed; that is, the application is approved, denied or deemed incomplete.
Source: SCHE Unit.
Indicator name: SCHE – Renewal applications receivedDescription: The number of renewal applications for SCHE benefits received by DOF. Applications are
received by the DOF mail room and then immediately sent to the SCHE unit, where they are date stamped. This is the count of that date stamp.
Source: SCHE Unit.
Indicator name: Average time to process SCHE renewal applications (days)Description: The time, measured in calendar days, between the date a renewal application for SCHE benefits
is received at the SCHE unit and the date the review process is completed, that is, the application is approved, denied or deemed incomplete.
Source: SCHE Unit.
Indicator name: Disability Homeowner Exemption (DHE) – Initial applications receivedDescription: The number of initial DHE applications received by DOF. Applications are received at the DOF
mail room and then immediately sent to the DHE unit, where they are date stamped. This is the count of that date stamp.
Source: DHE Unit.
Indicator Definitions | Page 243
Department of Finance
Indicator name: Average time to process initial DHE applications (days)Description: The time, measured in calendar days, between the date an initial DRIE application is received at
the DHE unit and the date the review process is completed; that is, the application is approved, denied or deemed incomplete.
Source: DHE Unit.
Indicator name: DHE – Renewal applications receivedDescription: The number of renewal applications for DHE benefits received by DOF. Applications are received
by the DOF mail room and then immediately sent to the DHE unit, where they are date stamped. This is the count of that date stamp.
Source: DHE Unit.
Indicator name: Average time to process renewal DHE applications (days)Description: The time, measured in calendar days, between the date a renewal application for DRIE benefits
is received at the DHE unit and the date the review process is completed, that is, the application is approved, denied or deemed incomplete.
Source: DHE Unit.
Indicator name: Inquiries received by the Office of the Taxpayer Advocate (OTA)Description: The total number of new requests received by OTA from taxpayers, property owners or others for
specific information needed for assistance with a business, excise or property tax matter. Inquiries include calls, e-mails, referrals from 311, walk-ins, referrals from other parts of the Department of Finance or elected officials for instructions on how to comply with a tax law or requirement, who to contact to discuss or resolve a tax problem through normal channels or information about how taxes were imposed or computed.
Source: Office of the Taxpayer Advocate.
Indicator name: Average time to address inquiries (days)Description: The average number of calendar days it takes the Office of the Taxpayer Advocate to provide a
response to an inquiry.Source: Office of the Taxpayer Advocate.
Indicator name: Cases opened by the Office of the Taxpayer AdvocateDescription: The total number of new formal requests by taxpayers, property owners or representatives to the
Office of the Taxpayer Advocate asking for assistance in resolving a matter because they meet one of the following criteria: 1) The person has made a reasonable attempt to solve the inquiry or complaint with the Department of Finance but the inquiry or complaint has not been resolved or the person has not received a timely response. 2) The person believes he or she can show that the Department of Finance is applying the tax laws, regulations or policies unfairly or incorrectly, or that the person’s Taxpayer Rights have been or will be injured. 3) The person will face a threat of immediate harmful action (e.g., seizure of funds or property) by the Department of Finance for a debt the person believes he or she can show is not owed or is incorrect, unfair or illegal. 4) The person believes he or she can show that he or she will suffer damage that is beyond repair or a long-term harmful impact if relief is not granted. 5) The person believes he or she can show that the problem also affects other similar taxpayers and is a problem with the Department of Finance’s systems or processes. 6) The person believes he or she can show that the rare facts in the case justify help from the Office of the Taxpayer Advocate. 7) The person believes he or she can show that there is a compelling public policy reason why he or she should get help from the Office of the Taxpayer Advocate.
Source: Office of the Taxpayer Advocate.
Page 244 | Mayor’s Management Report
Department of Finance
Indicator name: Cases closed by the Office of the Taxpayer AdvocateDescription: The total number of formal requests (cases) from taxpayers, property owners or their
representatives meeting eligibility criteria that were resolved and formally closed by the Office of the Taxpayer Advocate.
Source: Office of the Taxpayer Advocate.
Indicator name: Average time to close a case (days)Description: The average number of calendar days it takes the Office of the Taxpayer Advocate to close a
case.Source: Office of the Taxpayer Advocate.
Indicator name: Online property recording transactions (%) Description: The number of property recording transactions submitted online as a percentage of total property
recording transactions submitted.Source: Land Records.
Indicator name: Average time to record and index property documents (days) – CitywideDescription: The average number of calendar days from receipt of property records to completion of the entry
process, measured from the date the document is submitted to Finance. Data excludes Staten Island property documents, which are recorded at the Richmond County Clerk’s office.
Source: Automated City Register Information System (ACRIS)/Information Technology Division.
Indicator name: Arrest warrants successfully executed (%)Description: The number of arrest warrants that were successfully executed (person was arrested) by the
Sheriff’s Office as a percentage of total arrest attempts.Source: Sheriff’s Office.
Indicator name: Orders of Protection successfully served (%)Description: The number of Orders of Protection successfully served by the Sheriff’s Office as a percent of
total service attempts. Source: Sheriff’s Office.
Indicator name: Property seizure orders successfully executed (%)Description: The number of property seizure orders successfully executed by the Sheriff’s Office as a percent
of total attempts – i.e., property was seized. A seizure order is an instrument used by the Sheriff’s Office to seize the property assets of a debtor.
Source: Sheriff’s Office.
Indicator name: Child support orders successfully executed (%) Description: The number of child support orders successfully served by the Sheriff’s Office as a percent of
total service attempts.Source: Sheriff’s Office.
Indicator Definitions | Page 245
Department of Finance
Indicator name: Total revenue collected ($000,000) – Property taxes collected ($000,000) – Business taxes collected ($000,000) – Property transfer taxes collected ($000,000) – Parking summonses revenue ($000,000) – Audit and enforcement revenue collected ($000,000) – Other revenue ($000,000) Description: Total tax and non-tax revenues collected and the amount collected in each reporting category.
The total includes revenue from property taxes; business income and excise taxes; real property transfer and mortgage recording taxes; parking fines; audit, enforcement and collection divisions; and all other revenue sources. The revenue data reported in the fiscal year Mayor’s Management Report (MMR) is based on preliminary September numbers from the City’s Financial Management System (FMS) and is updated in the following year’s Preliminary MMR to reflect final revenue as per FMS (e.g., Fiscal 2016 data is updated in the Fiscal 2017 PMMR).
Source: Tax Policy Division.
Indicator name: E-mails responded to in 14 days (%)Description: The percentage of e-mails answered in 14 calendar days or less. Responses should be
substantive and adequately address the question/issue raised by the customer. A simple acknowledgement is not considered an adequate response. However, for more complex inquiries that require research and action on the part of the agency, an acknowledgement which includes a description of the next step (either on the agency’s behalf, or the customer’s), as well as an estimated time frame for completion, is considered acceptable and can be reported as part of the 14 day response. Agencies must internally track the additional time until a customer has a complete and full response.
Source: Division of External Affairs.
Indicator name: Letters responded to in 14 days (%)Description: The percentage of letters answered in 14 calendar days or less. Responses should be
substantive and adequately address the question/issue raised by the customer. A simple acknowledgement is not considered an adequate response. However, for more complex inquiries that require research and action on the part of the agency, an acknowledgement which includes a description of the next step (either on the agency’s behalf, or the customer’s), as well as an estimated time frame for completion, is considered acceptable and can be reported as part of the 14 day response. Agencies must internally track the additional time until a customer has a complete and full response.
Source: Division of External Affairs.
Indicator name: Completed customer requests for interpretationDescription: The sum of all requests for interpretation using a language other than English fulfilled by the
agency via telephone (including Language Line, call centers, offices/reception desks and 311 transfer calls) and via face-to-face interaction with bilingual employees or contracted interpreters.
Source: Division of External Affairs.
Indicator name: Average customer in-person wait time (minutes)Description: The average time a customer waits to see a customer service representative measured from
the time a customer takes a Q-matic ticket until the customer is seen by a customer service representative.
Source: Payment Operations Division.
Indicator name: Calls answered by customer service representative (%)Description: The number of calls made to the agency’s call center regarding judgment notices that were
answered by an agent as a percent of all incoming calls.Source: Collections Division.
Page 246 | Mayor’s Management Report
Department of Finance
Indicator name: CORE customer experience rating (0-100)Description: An average score based on the rating of 15 conditions, including physical conditions (e.g.,
cleanliness, litter, seating) and customer service conditions (e.g., wait time, professionalism), for all agency walk-in facilities inspected, divided by the number of walk-in facilities inspected. Each of the 15 conditions can be rated excellent, good, fair or poor. Ratings of excellent are worth 100 points each, good ratings are worth 67 points, fair ratings are worth 33 points and poor ratings receive no points. Facilities are rated by trained City inspectors. Fiscal 2016 data for the overall rating represents a change in methodology. For agencies with multiple service centers, inspectors focused on sites that had historically lower scores, specifically sites that received an average overall site score of 85 or lower over the last three years and sites that received a score of 85 or lower in Fiscal 2015. If all agency service centers scored above 85 last year, the service center with the lowest overall score was inspected.
Source: Mayor’s Office of Operations – SCOUT.
Indicator Definitions | Page 247
Department of Information Technology and Telecommunications
Indicator Name: Systems DoITT managesDescription: Number of associated sets of appliances, applications, servers and networks (telephony,circuits,
wired) directly managed by DoITT.Source: Applications,Information Security, Infrastructure, Public Safety
Indicator Name: Newly completed projects that provide new services to the publicDescription: Number of projects where a member of the public directly interfaces with the deliverable (e.g., an
appliance, application, server or network).Source: Applications,Information Security, Infrastructure, Public Safety Indicator Name: Incidents that directly impact services provided to the publicDescription: Number of incident tickets where the outage impacted an application, appliance, server or
network that is directly interfaced by public.Source: Customer Service, Public Safety Indicator Name: Critical public safety outagesDescription: Number of outages that impacted the operations of a life safety system.Source: Public Safety Indicator Name: Total outage time for critical public safety infrastructure (minutes)Description: Total time the operations of life safety systems were impacted by outages.Source: Public Safety
Indicator Name: Incidents by severity level - Critical - High - Medium - LowDescription: Number of reported incidents by severity level.Source: Customer Service, Public Safety
Indicator Name Average incident resolution time by SLA level (hours) - Critical - High - Medium - LowDescription: Average time from the initial reporting of an incident to the incident resolution time broken out by
SLA.Source: Customer Service, Public Safety
Indicator Name: Active projects for new services to the publicDescription: Number of projects that create or modify a service offered by DoITT with which the public directly
interacts.Source: Applications, Information Security, Infrastructure, Public Safety Indicator Name: Active projects to support outside agenciesDescription: Number of projects that create or modify a service provided by DoITT to an outside City agency.Source: Applications, Information Security, Infrastructure, Public Safety
Indicator Name: NYC.gov page views (000) Description: Cumulative number of requests to load a single HTML file (‘page’) on the City’s website at www.
nyc.gov. Source: Web and New Media Operations
Page 248 | Mayor’s Management Report
Department of Information Technology and Telecommunications
Indicator: NYC.gov unique visitors (average monthly) (000)Description: Average of the number of unique visitors per month, as determined by IP addresses, to one or
more pages within the www.nyc.gov portal.Source: Web and New Media Operations
Indicator Name: Data sets available for download on NYC.gov/OpenData Description: Reflects raw and mapped data sets from City agencies available to the public on the City’s
website at www.nyc.gov/opendata. Source: Web and New Media Operations Indicator Name: Datasets with data dictionaries on NYC.gov/OpenData (%)Description: Percentage of datasets available through OpenData that have a data dictionary available to the
public on the City’s website at www.nyc.gov/opendata.Source: OpenData
Indicator Name: Video cable complaints CitywideDescription: Number of cable complaints received by DoITT from Altice, Charter and Verizon.Source: Franchises
Indicator Name: Video complaints resolved Citywide (%)Description: Percentage of cable complaints received by DoITT from Altice, Charter and Verizon that were
determined to be actually resolved.Source: Franchises
Indicator Name: Cumulative number of LinkNYC subscribersDescription: Cumulative number of LinkNYC subscribers..Source: Franchises
Indicator Name: Summonses issued for LinkNYC’s with inoperable phone service or unacceptable appearanceDescription: The number of summons issued in a fiscal year for LinkNYC’s for inoperability (phone service is
not functioning) or appearance, (e.g. cleanliness, graffiti, stickers, etc.).Source: Telecommunications Planning
Indicator Name: Telecommunications advertisement-generated revenue ($000)Description: The total dollar amount, in thousands, of revenue generated by selling advertisements that the
City receives from all fully functional telecommunications and public pay telephone kiosks across the five boroughs. The City receives 50 percent of all advertising revenue from ads on kiosks, including those on payphones and LinkNYC kiosks.
Source: Telecommunications Planning
Indicator Name: Citywide IT professional services contracts in use by agencies (%)Description: The percentage of the value of task orders and task order amendments registered by agencies
against the overall value of citywide IT professional services contracts administered by DoITT.Source: Vendor Management
Indicator name: Letters responded to in 14 days (%)Description: The percentage of letters answered in 14 calendar days or less. Responses are substantive and
adequately address the question/issue raised by the customer. However, for complex inquiries that require research and additional action on the part of the agency, an acknowledgement which includes a description of the next step, as well as an estimated time frame for completion, is considered acceptable and is also reported as part of the 14 day response. Agencies track the additional time until a customer has a complete and full response.
Source: DoITT.

Indicator Definitions | Page 249
Department of Information Technology and Telecommunications
Indicator name: E-mails responded to in 14 days (%)Description: The percentage of emails answered in 14 calendar days or less. Responses are substantive and
adequately address the question/issue raised by the customer. However, for complex inquiries that require research and additional action on the part of the agency, an acknowledgement which includes a description of the next step, as well as an estimated time frame for completion, is considered acceptable and is also reported as part of the 14 day response. Agencies track the additional time until a customer has a complete and full response.
Source: DoITT.
Indicator name: Percent meeting time to close - (Response to Service Requests)Description: The percentage of service requests received through the 311 Customer Service Center for which
the agency met its planned time of action to provide the service. Source: Mayor’s Office of Operations/Citywide Performance Reporting.

Page 250 | Mayor’s Management Report
Department of Information Technology and Telecommunications

Indicator Definitions | Page 251
Board of Elections
Indicator Name: Voter turnout - general election (000)Description: The number of eligible active voters who voted on Election Day.Source: Board of Elections Annual Report Indicator Name: Voter Registration forms processed Description: The number of registration application forms processed from all sources: BOE, NYS DMV, City
Agencies and CUNYSource: Board of Elections Annual Report Indicator Name: Total registered voters (000)Description: The number of registered voters at the end of the reporting period.Source: Board of Elections Annual Report Indicator Name: Poll worker attendance on Election Day (%)Description: The percent of poll workers assigned to work on Election Day who worked on Election Day.Source: Board of Elections Annual Report Indicator Name: Voter complaints regarding poll workers Description: The total number of complaints lodged with the Board regarding poll workers.Source: Board of Elections Annual Report Indicator Name: Voter complaints regarding poll workers - serviceDescription: The total number of complaints lodged with the Board regarding poll workers “Were Rude/
Behavior Issues”.Source: Board of Elections Annual Report Indicator Name: Voter complaints regarding poll workers - procedureDescription: The total number of complaints lodged with the Board regarding poll workers “Were Not Following
Proper Procedures.”Source: Board of Elections Annual Report Indicator Name: Voting equipment replacement rate - ballot scanners (%)Description: The rate of received and documented calls for ballot scanners, which resulted in replaced
equipment.Source: Board of Elections Annual Report Indicator Name: Voting equipment replacement rate - ballot marking devices (%)Description: The rate of received and documented calls for ballot marking devices, which resulted in replaced
equipment.Source: Board of Elections Annual Report Indicator Name: Precision of unofficial election results (%) Description: The difference between election night results and re-canvass results. Source: Board of Elections Annual Report Indicator Name: Interpreters deployed on Election Day Description: The number of interpreters assigned to poll sites citywide on Election Day.Source: Board of Elections Annual Report Indicator Name: Interpreters deployed on Election Day - BronxDescription: The number of interpreters assigned to poll sites in the Bronx on Election Day.Source: Board of Elections Annual Report

Page 252 | Mayor’s Management Report
Board of Elections
Indicator Name: Interpreters deployed on Election Day - BrooklynDescription: The number of interpreters assigned to poll sites in Brooklyn on Election Day.Source: Board of Elections Annual Report Indicator Name: Interpreters deployed on Election Day - QueensDescription: The number of interpreters assigned to poll sites in Queens on Election Day.Source: Board of Elections Annual Report Indicator Name: Interpreters deployed on Election Day - ManhattanDescription: The number of interpreters assigned to poll sites in Manhattan on Election Day.Source: Board of Elections Annual Report Indicator Name: Interpreters deployed on Election Day - Staten Island Description: The number of interpreters assigned to poll sites in Staten Island on Election Day.Source: Board of Elections Annual Report
Indicator Definitions | Page 253
Agency Resources
Indicator name: ExpendituresDescription: Actual and planned expenditures across all units of appropriation in an agency’s expense budget.
This does not include capital resources (see Capital commitments, below).Source: The Office of Management and Budget. Data prior to Fiscal 2020 is consistent with previous
Mayor’s Management Reports. Fiscal 2021 expenditures reflect the forecast of Fiscal 2021 final expenditures submitted to the Financial Control Board as of June 2021. Fiscal 2021 and Fiscal 2022 plans reflect the City’s Modified and Adopted Budgets for Fiscal 2021 and Fiscal 2022, respectively. NYC Health + Hospitals and the New York City Housing Authority self-report expenditure information.
Indicator name: RevenuesDescription: Funds collected by agency revenue-generating operations. Does not include State and federal
monies and routine City tax collections.Source: The Office of Management and Budget. Data prior to Fiscal 2020 is consistent with previous
Mayor’s Management Reports. Fiscal 2021 revenues are derived from the City’s Financial Management System and include anticipated closing adjustments. Fiscal 2021 and Fiscal 2022 plans reflect the City’s Modified and Adopted Budgets for Fiscal 2021 and Fiscal 2022, respectively. NYC Health + Hospitals and the New York City Housing Authority self-report revenue information.
Indicator name: PersonnelDescription: The total employees, from all funding sources, active on the final day of the reporting period.
Among the civilian workforce, non-full-time employees and seasonal employees are counted as full-time equivalents (FTEs), adjusting for the proportion of a full-time salary that they earn. FTEs were not included in this data prior to December 2001. The Fiscal 2022 planned hiring and attrition management headcount reduction will be reflected in a future plan for select agencies.
Source: The Office of Management and Budget. Fiscal 2021 personnel reflect the number of employees active on June 30, 2021. Fiscal 2021 plans and Fiscal 2022 plans are consistent with the City’s Modified and Adopted Budgets for Fiscal 2021 and Fiscal 2022, respectively. The School Construction Authority self-reports personnel plan information.
Indicator name: Overtime paidDescription: The additional monetary compensation received by those employees who worked in excess of
the 35 or 40 hour work week. Actuals: In the MMR, actual overtime amounts for the most current fiscal year are not yet final,
and are estimated from the planned amounts in the City’s Financial Management System at the time of budget adoption for the subsequent fiscal year. Final fiscal year actual values for annual overtime paid are reported in the subsequent PMMR (e.g., the Fiscal 2022 PMMR will contain final overtime values for Fiscal 2021) and are provided by OMB. Those final actual values reflect the Comptroller’s “Comprehensive Annual Financial Report”, the closing audit of the City’s fiscal year budget, which is released after the publication of the MMR.
Plans: In the MMR, overtime plan information for the most current fiscal year (e.g. Fiscal 2021) reflects the City’s prior preliminary financial plan, and the subsequent fiscal year plan reflects the City’s adopted budget for the year. In the PMMR, the value of the September MMR plan for the current fiscal year (e.g. Fiscal 2022) is consistent with the adopted budget, and the values for the updated current year plan and subsequent year plan are consistent with the City’s most recent preliminary financial plan.
Source: The Office of Management and Budget (OMB). NYC Health + Hospitals and the New York City Housing Authority self-report overtime information. Annual overtime data from Fiscal 2003 onward is consistent in the MMR since Fiscal 2007, when
the City changed to reporting budget-based overtime costs rather than the payroll-based overtime earnings reported in previous MMRs. Overtime plan information was not included in the MMR prior to September 2012.
Four-month overtime figures in the PMMR are as of October 31 of each fiscal year, based on the October Financial Information Services Agency report for each year.
Page 254 | Mayor’s Management Report
Agency Resources
Indicator name: Capital commitmentsDescription: The value of contracts for capital projects that the agency is authorized to register and actually
registers. Capital projects include construction work and some other categories of procurements, including computer hardware and software, heavy equipment and vehicles. Some construction projects counted within a given agency’s commitment total may be managed by other agencies.
Source: The Office of Management and Budget. Data prior to Fiscal 2020 is consistent with previous Mayor’s Management Reports. Fiscal 2022 commitment plan figures are consistent with the Fiscal 2022 Executive Capital Commitment Plan. Fiscal 2021 actual data is as of July 31 and may change upon closure and audit. To view the Fiscal 2022 Adopted Capital Commitment Plan upon its release, please visit www.nyc.gov\omb. The School Construction Authority self-reports capital commitment data in conjunction with OMB.
Indicator name: Human services contract budgetDescription: Total amount budgeted or actually obligated for human services contracts. This data is shown for
eight agencies that together account for over 95 percent of the City total in this category. These agencies are: Department of Health and Mental Hygiene, Department of Education, Human Resources Administration, Administration for Children’s Services, Department of Homeless Services, Department for the Aging, Department of Youth and Community Development and Department of Small Business Services.
Source: The Office of Management and Budget provides actual figures, derived from the Financial Management System. Fiscal 2021 actuals are subject to additional finalization and closing adjustments. Fiscal 2021 and Fiscal 2022 plans are consistent with the Contracts section of the City’s Fiscal 2021 and Fiscal 2022 Adopted Budgets, respectively.
Related Documents


