Mayor’s Green Ribbon Task Mayor’s Green Ribbon Task Force Force on Climate Protection on Climate Protection Final Report Final Report Palo Alto City Council Study Palo Alto City Council Study Session Session 12/18/2006 12/18/2006

Mayor’s Green Ribbon Task Force on Climate Protection Final Report Palo Alto City Council Study Session 12/18/2006.
Dec 29, 2015
Welcome message from author
This document is posted to help you gain knowledge. Please leave a comment to let me know what you think about it! Share it to your friends and learn new things together.
Transcript

Mayor’s Green Ribbon Task ForceMayor’s Green Ribbon Task Forceon Climate Protectionon Climate Protection
Final ReportFinal Report
Palo Alto City Council Study SessionPalo Alto City Council Study Session
12/18/200612/18/2006

December 18, 2006December 18, 2006 22
MissionMission
MissionMission: : To recommend an achievable and measurable set of To recommend an achievable and measurable set of policies and actions to meet or beat the Governor’s policies and actions to meet or beat the Governor’s greenhouse gas emission-cutting goalsgreenhouse gas emission-cutting goals
2000 levels by 20102000 levels by 20101990 levels by 2020, and 1990 levels by 2020, and 80 percent below 1990 levels by 205080 percent below 1990 levels by 2050
GoalGoal: : To achieve significant, measurable reductions of To achieve significant, measurable reductions of greenhouse gas (GHG) emissions in the Palo greenhouse gas (GHG) emissions in the Palo Alto/Stanford area through positive actions in all Alto/Stanford area through positive actions in all sectors of the populationsectors of the population

December 18, 2006December 18, 2006 33
ContentsContents
Baseline COBaseline CO22 Emissions Emissions EnergyEnergy TransportationTransportation Built EnvironmentBuilt Environment Education & MotivationEducation & Motivation Summary – Next StepsSummary – Next Steps
December 18, 2006December 18, 2006 44
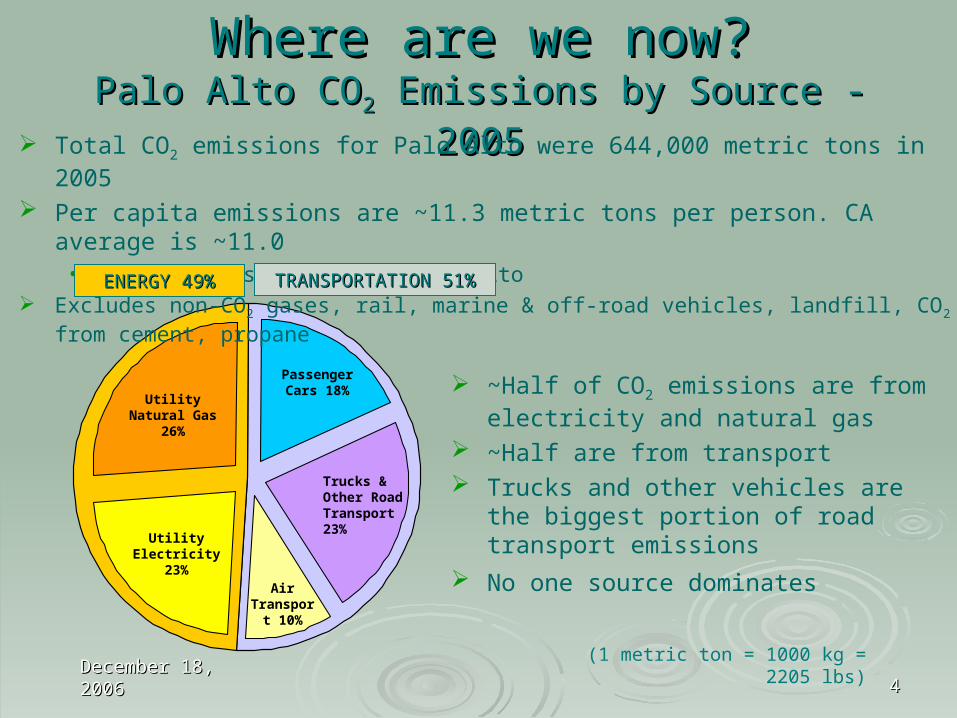
Where are we now?Where are we now?Palo Alto COPalo Alto CO22 Emissions by Source - 2005 Emissions by Source - 2005
(1 metric ton = 1000 kg = 2205 lbs)
Total CO2 emissions for Palo Alto were 644,000 metric tons in 2005
Per capita emissions are ~11.3 metric tons per person. CA average is ~11.0• High non-residential in Palo Alto
Excludes non-CO2 gases, rail, marine & off-road vehicles, landfill, CO2 from cement, propane
~Half of CO2 emissions are from electricity and natural gas
~Half are from transport Trucks and other vehicles are the biggest
portion of road transport emissions
No one source dominatesAir
Transport 10%
Utility Natural Gas 26%
Passenger Cars 18%
Utility Electricity 23%
Trucks & Other Road Transport 23%
ENERGY 49%ENERGY 49% TRANSPORTATION 51%TRANSPORTATION 51%

December 18, 2006December 18, 2006 55
Baseline CommitteeBaseline CommitteeKey Observations and RecommendationsKey Observations and Recommendations
Inventory emissionsInventory emissions Knowing the starting point helps identify and prioritize opportunities
No uniform accepted baseline methodology for citiesNo uniform accepted baseline methodology for cities Community-wide CO2 emissions from transportation are very difficult to
estimate Would be improved with more frequently updated Palo Alto-specific data
In developing targets, devise how to measure and track In developing targets, devise how to measure and track progressprogress
Applies to government, corporations, or even individuals Measure progress against time, not against others Measuring changes instead of totals often easier with greater accuracy
December 18, 2006December 18, 2006 66
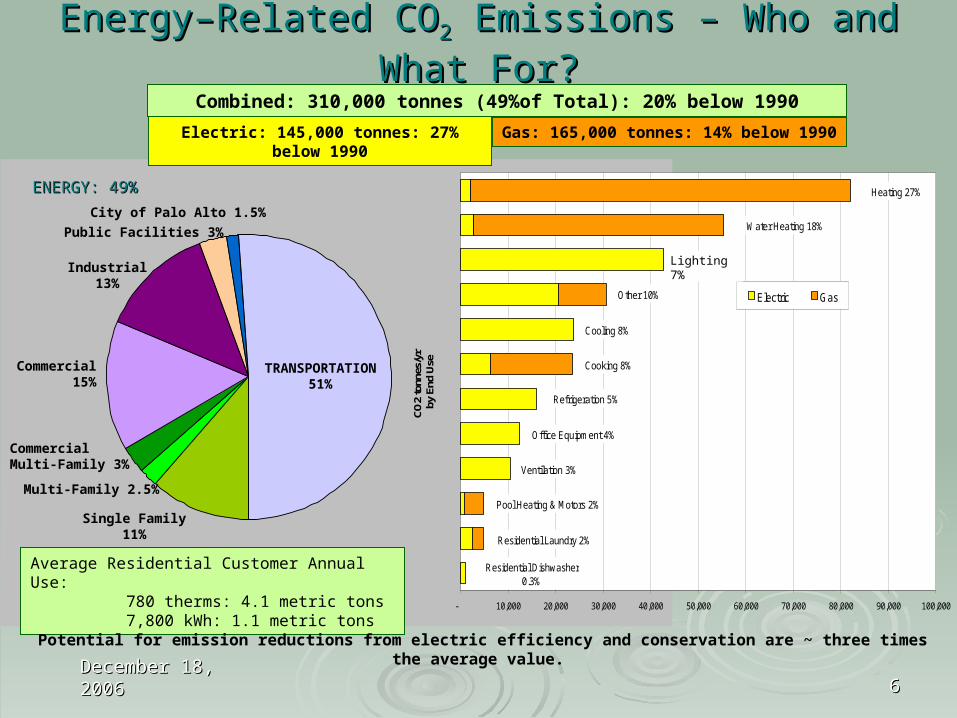
Energy–Related COEnergy–Related CO22 Emissions – Who and What For? Emissions – Who and What For?
Gas: 165,000 tonnes: 14% below 1990Electric: 145,000 tonnes: 27% below 1990
Combined: 310,000 tonnes (49%of Total): 20% below 1990
Average Residential Customer Annual Use: 780 therms: 4.1 metric tons7,800 kWh: 1.1 metric tons
TRANSPORTATION51%
Industrial13%
Commercial15%
Single Family 11%
CommercialMulti-Family 3%
Multi-Family 2.5%
City of Palo Alto 1.5%
Public Facilities 3%
ENERGY: 49%ENERGY: 49% Heating 13%
Water Heating 9%
Other 5%
Cooling 4%
Cooking 4%
Refrigeration 2.5%
Office Equipment 2%
Ventilation 1.5%
Pool Heating & Motors 1%
Residential Laundry 1%
Residential Dishwasher 0.15%
Potential for emission reductions from electric efficiency and conservation are ~ three times the average value.
Ventilation 3%
Office Equipment 4%
Refrigeration 5%
Cooling 8%
Lighting 14%
Residential Dishwasher 0.3%
Residential Laundry 2%
Pool Heating & Motors 2%
Heating 27%
Water Heating 18%
Other 10%
Cooking 8%
- 10,000 20,000 30,000 40,000 50,000 60,000 70,000 80,000 90,000 100,000
CO
2 to
nnes
/yr
by
End
Use
Electric Gas
Lighting 7%

December 18, 2006December 18, 2006 77
Electric Efficiency and New RenewablesElectric Efficiency and New RenewablesHave an Amplified EffectHave an Amplified Effect
Potential for emission reductions from electric efficiency and conservation are~ three times the average value.
0
200
400
600
800
1000
1200
2005 2015
Efficiency
Generic
PaloAltoGreen
Renewables
Large Hydro
0.32 lb CO2/kWh0.15-0.20 lb CO2/kWh
In a normal hydro year
Ele
ctri
city
Su
pp
ly (
mil
lio
n k
Wh
/ye
ar)
CO2 reductions from electric efficiency and new renewable supplies reduce generic market purchases that are the main source of emissions

December 18, 2006December 18, 2006 88
Energy RecommendationsEnergy RecommendationsReduce greenhouse gas emissions from electricity and natural Reduce greenhouse gas emissions from electricity and natural
gas usage to achieve climate neutrality by 2020:gas usage to achieve climate neutrality by 2020: Conservation and energy efficiencyConservation and energy efficiency Coordinate with urban planningCoordinate with urban planning
Reduce carbon intensity of energy supplyReduce carbon intensity of energy supply Customer use of renewable energyCustomer use of renewable energy
Projects or offsets Projects or offsets Urban forest managementUrban forest management
Emissions inventory tracking and reportingEmissions inventory tracking and reporting Promote and educatePromote and educate Research and developmentResearch and development
“Climate Neutral” does not necessarily mean zero emissions, but as close to zero as is feasible and practical, similar to the goals of the Zero Waste Strategic Plan.
Specific tactical recommendations and ideas are contained in the written report.

December 18, 2006December 18, 2006 99
TransportationTransportationWhich activities emit the most COWhich activities emit the most CO22? Where can we help?? Where can we help?
*Commute emissions included 50% of commute into or out of Palo Alto and 100% of commute within Palo Alto.
90% of commute emissions are generated by single occupants in vehicles
ENERGY49%
Commercial Road Transport 18%
Commute Personal Road Trip 15%
Air Transport 10%
Non-commute Personal Road Trip 7%
For travelers, flights are the major source of emissions
95% of non-commute personal transport emissions due to cars

December 18, 2006December 18, 2006 1010
What-If Model for Passenger TransportWhat-If Model for Passenger TransportTo help study groups test the impact of different initiatives on COTo help study groups test the impact of different initiatives on CO22
Commute into Palo AltoModel inputs Model outputs
What if model for commute modeMiles travelled by transport type Baseline What-if scenarioTravel alone 80% 70 70%2 in car 12% 12 12%3 in car 3% 13 13%Railroad 3% 3 3%Bus 2% 2 2%Bicycle 0% 0 0%Walk only 0% 0 0%Work at home (mile reduction) 0% 0 0%Total 100% 100%
What if model for car emissionsSplit of journeys MPG
Car efficiency baseline 100% 20.7Model Group 1 80.00 80% 20.7
Group 2 10 10% 30.0Group 3 10 10% 60.0 Total CO2 Palo Alto CO2
100% metric tons metric tonsMean MPG 25.6 Baseline 156551 78275Baseline/what if 0.8 What if 114990 57495
Total CO2 change (metric tons) -41561 -20780
What if model for fuel type for cars Btu/gallon % change -27% -13%Car fuel baseline 100% 125000Model Auto. gasoline 80.00 80% 125000
Ethanol 10 10% 84600Diesel 0 0% 138700Bio diesel 10 10% 126206Other 0% 0
100%Mean Btu/gallon 121081Baseline/what if 1.03
ParametersYearly commute growth 2%Part of commute attributed to Palo Alto 50%Number of trips per year 200Conversion lbs to metric tons 2205
What if comparison
Baseline
What if
0
20000
40000
60000
80000
100000
Palo Alto CO2
CO
2 (
Me
tric
to
ns
)
Trend of CO2 emissions
0
20000
40000
60000
80000
100000
Yea
r 1
Yea
r 2
Yea
r 3
Yea
r 4
Yea
r 5
Yea
r 6
Yea
r 7
Yea
r 8
Yea
r 9
Yea
r 10
CO
2 (m
etri
c to
ns)
Baseline
What if
6% reduction in commute emissions (5,500 metric tons)
Screen shot: Screen shot:
…we increase the number of people who carpool to work by 10%?
What if …
… 20% of people moved to more efficient cars?
… 10% of the population worked from home 1 day per week?
18% reduction in commute emissions
2% reduction (at low cost!)

December 18, 2006December 18, 2006 1111
Transportation RecommendationsTransportation Recommendations
Promote alternative fuelsCity can lead the way in fuel-efficient vehicles
Facilitate increased biking and walkingMore and better routes, bike parking and carriage on transit
Use parking incentives to encourage less driving and greener vehicles
Green vehicle benefits, pedestrian/bike zones, Transportation Demand Management

December 18, 2006December 18, 2006 1212
Transportation Recommendations (2)Transportation Recommendations (2)
Increase mass transit availabilityLocal shuttles, interconnectivity, multi-modal passes
Encourage electronic alternatives to travelHigh-speed data access, video conference facilities, telecommute incentives
Reduce emissions from school commutingSafe Routes to School, busing, PAUSD goals and measures
Education/Outreach (carbon offsets) Lobbying – Region, State, National
Carbon tax

December 18, 2006December 18, 2006 1313
Built Environment RecommendationsBuilt Environment RecommendationsNew Buildings and Renovations – Green BuildingsNew Buildings and Renovations – Green Buildings
Expertise Information Incentives
Energy EfficiencyEnergy Efficiency Consulting assistance services Solar Power & low-carbon water heating Residential energy consumption ordinance (RECO)
LandscapeLandscape Trees to reduce heat island and provide shade Reduce water use
Pedestrian and Transit PlanningPedestrian and Transit Planning Transit-oriented development Bicycle circulation and parking Outdoor seating and pedestrian access
Carrot: Recognition, Expedited review, Exemptions, Subsidies
Stick: Building Code, Process – e.g. green points on applications

December 18, 2006December 18, 2006 1414
Palo Alto Green Ribbon Task Force
Education/ Motivation Committee
Recommendations: to create a community awareness/action
program that willInstill a sense of moral imperative about global warming.
Teach and motivate all segmentsor “nodes” of our community to take quantitative environmental action to reduce CO2 emissions.
Provide a “portal” to existing green programs for people through their usual channels of communication:
City GovernmentHome/NeighborhoodBusinessSchoolsFaith CommunityNon-profits & Service Clubs

December 18, 2006December 18, 2006 1515
Green P.R. Umbrella
EFFICIENCY PROGRAMSEFFICIENCY PROGRAMSCPAU works hard to offer many options CPAU works hard to offer many options to both residential and commercial to both residential and commercial customers. Below are links to customers. Below are links to information about the many programs information about the many programs we offer. we offer.
Residential Residential Appliance Rebates PA Green Photovoltaic (PV) Partners Photovoltaic (PV) Partners Refrigerator Recycling and Rebate Refrigerator Recycling and Rebate SMART Energy Program SMART Energy Program Water Conservation Rebates Water Conservation Rebates
CommercialCommercial Commercial Advantage Program Commercial Advantage Program PA Green PA Green Landscape Water Efficiency Standards Landscape Water Efficiency Standards Photovoltaic (PV) Partners Photovoltaic (PV) Partners Water Conservation Water Conservation
Create an overall
Green PR Umbrella
for Palo Alto Green Action:
Navigating between a myriad of available environmental programs is confusing and daunting.
Provide a well-designed City Green Web Page Portal with“one-stop-shopping” linked to all environmental programs, incentives, and rebates.
Create a logo & graphic identity.
“Brand” Palo Alto as an innovative, green city

December 18, 2006December 18, 2006 1616
To save time and money, create a
Public/Private Partnership
to administer the awareness/action program.
Create synergy, not duplication, between new and existing
environmental activities. Provide an easy-to-access portal to
information for the public.
As in many other cities, form a partnership between city government and environmental resources that already exist. The Palo Alto green action partnership would take a proactive, advocacy role in the community.
A City staff person would act as a “Portal” and “Connector” for the array of green services, partnering with an environ-mental non-profit (one possibility is Acterra).
SustainableSchools
Committee
POST Peninsula Open Space Trust
Palo AltoBusiness
Goes Green

December 18, 2006December 18, 2006 1717
Learn by doing: encourage
Green Certification
to change natural resource consumption behavior on a macro
and a micro level. Examples:
City, Business & Non-profitSanta Clara County’s Bay Area
Green Business Program
Larger businesses partner to reduce CO2 emissions from a baseline
Sustainable Silicon Valley
New Commercial & Multi-Family Construction
LEED Standards
New Residential ConstructionBuild-It Green (BIG)
Faith CommunityGreen Sanctuary
Household ProgramActerra’s “Green@Home”
Track Palo Alto’s progress against other cities SustainLane
“Becoming a Green Sanctuary”1. Establish a Green Sanctuary
Committee2. Conduct an Environmental Audit3. Create an Action Plan4. Apply for Green Sanctuary
Candidacy & Complete All Activities
5. Apply for Green Sanctuary Accreditation
Palo Alto: the first EPA-certified Green Power Community in California!
LEED Certification
December 18, 2006December 18, 2006 1818
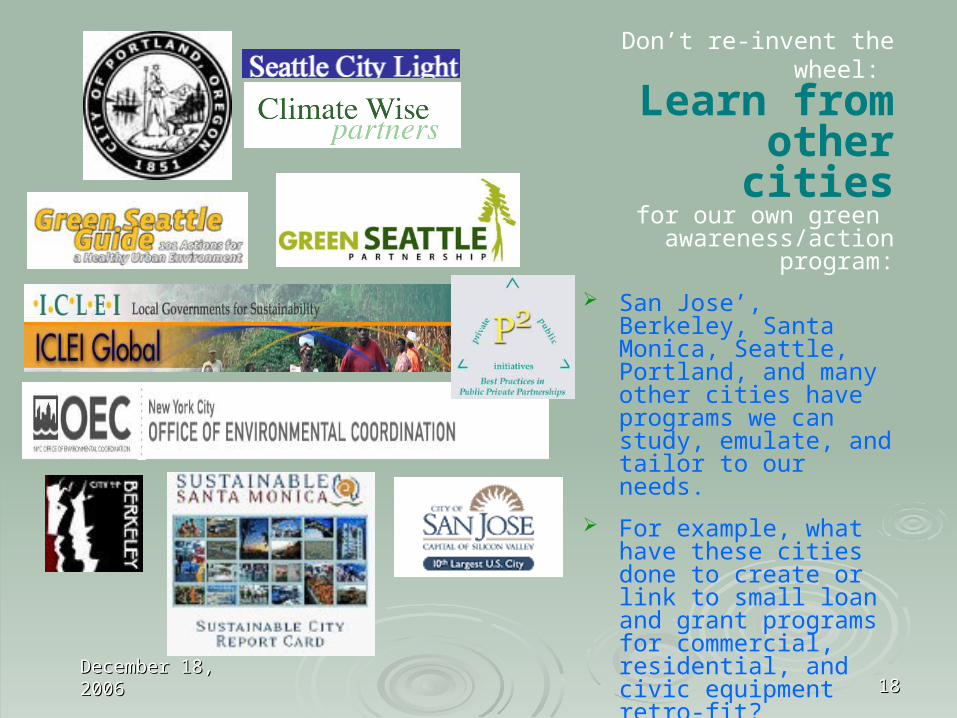
Don’t re-invent the wheel:
Learn from other cities
for our own green awareness/action
program:
San Jose’, Berkeley, Santa Monica, Seattle, Portland, and many other cities have programs we can study, emulate, and tailor to our needs.
For example, what have these cities done to create or link to small loan and grant programs for commercial, residential, and civic equipment retro-fit?
What are other obstacles to green action that they have found ways to mitigate?

December 18, 2006December 18, 2006 1919
As the birthplace of Silicon Valley,
Encourage green tech innovation, synergy &
cross-pollinationbetween the City of Palo Alto, Stanford University, Stanford
Research Park, and local Green Tech entrepreneurs, designers and
venture capitalists.
Opportunities and partnerships can arise from the research and development occurring all around us.
R&D Case studies demonstrate how lowering CO2 emissions actually saves money over time.
Palo Alto businesses and residents might “beta test” new technologies for efficacy.

December 18, 2006December 18, 2006 2020
Palo Alto GRTF:
Let’s get on with it!
We can be a regional, State, and national leader in municipal green action
if we fully harness the drive, passion,
entrepreneurial skills, and intellectual property
that are all around us.
“You must be the change you wish to see in the world”— Gandhi
December 18, 2006December 18, 2006 2121
Summary: Next StepsSummary: Next StepsCOMMUNITYCOMMUNITY Community businesses, institutions and residents take individual
and collective action to reduce their environmental footprint.
COUNCIL and CITY GOVERNMENTCOUNCIL and CITY GOVERNMENT Direct staff to develop a formal Climate Action Plan.
City staff, commissions, boards, committees and Council consider the ideas in this report and adopt new codes, standards and procedures to reduce greenhouse gas emissions.
As part of the Action Plan, devise a Public/Private Partnership along the lines recommended by the Education/Motivation Committee.
Duties of the Partnership should include convening periodic meetings
Task Force members and the public invited to suggest new actions to be taken by the City and its stakeholders.
DISCUSSIONDISCUSSION

Mayor’s Green Ribbon Task ForceMayor’s Green Ribbon Task ForceBret Andersen, Penny Barrett ,Allan Berkowitz, Steven Bishop, Jim Burch, Bret Andersen, Penny Barrett ,Allan Berkowitz, Steven Bishop, Jim Burch, Melissa Caswell, Jeremy Carl, Michael Closson, David Coale, Cedric de La Melissa Caswell, Jeremy Carl, Michael Closson, David Coale, Cedric de La Beaujardiére, Peter Drekmeier, Kirsten A. Flynn, Amy French, Walt Hays, Beaujardiére, Peter Drekmeier, Kirsten A. Flynn, Amy French, Walt Hays, Carroll Harrington, Bruce Hodge, Jeffrey Hook, Jim Inglis, Leigh Johnson, Carroll Harrington, Bruce Hodge, Jeffrey Hook, Jim Inglis, Leigh Johnson,
Thomas Jordan, Jr., James Kao, Arthur Keller, Judy Kleinberg, Karl Knapp, Thomas Jordan, Jr., James Kao, Arthur Keller, Judy Kleinberg, Karl Knapp, Christine Kohl-Zaugg Jeffrey Koseff, Sandra Lonnquist, Elke MacGregor, Christine Kohl-Zaugg Jeffrey Koseff, Sandra Lonnquist, Elke MacGregor, Drew Maran, Catherine Martineau, Jerry Matranga, Jean McCown, Jane Drew Maran, Catherine Martineau, Jerry Matranga, Jean McCown, Jane Melia, Debbie Mytels, Pete Pearne, Michael Miller, Armand Neukermans Melia, Debbie Mytels, Pete Pearne, Michael Miller, Armand Neukermans Robert Parkhurst, Steve Raney, Susan Rosenberg, Mark Sabin, Linda Robert Parkhurst, Steve Raney, Susan Rosenberg, Mark Sabin, Linda
Schuck, Jonathan Stoumen, Marshall S. Smith, John Tarlton, Melinda Teves, Schuck, Jonathan Stoumen, Marshall S. Smith, John Tarlton, Melinda Teves, Sally Tomlinson, Heather Trossman, Karl Van OrsdolSally Tomlinson, Heather Trossman, Karl Van Orsdol
Acknowledgments: Timothy Burroughs, Chris Christofferson, Sue Dremann, Acknowledgments: Timothy Burroughs, Chris Christofferson, Sue Dremann, Ted Driscoll, Jason Green, Susan Kulakowski, Kathleen Livelli, Ted MendozaTed Driscoll, Jason Green, Susan Kulakowski, Kathleen Livelli, Ted Mendoza
Related Documents