CREB® Calgary Regional Housing Market Statistics page 1 d CALGARY REGIONAL HOUSING MARKET STATISTICS 5.14 CITY OF CALGARY MAY SALES ACTIVITY 0 500 1000 1500 2000 2500 3000 3500 SF Sales Apartment Sales TH Sales 10 Year Average Source: CREB® Sales improve as consumers have more choice City-wide price gains and better weather support year-over-y ear gains in new listings Calgary June 2 2014 Residential sales in the city of Calgary totaled 2,948 units in May, a 16 per cent increase over the previous year. Sales last month were well above long-term trends and are the highest May activity on record. “Strong sales activity is a reflection of improving fundamental conditions such as a growing population, favourable lending rates and rising wages,” says CREB® chief economist Ann-Marie Lurie. “Leading up to May, resale market sales were somewhat restricted by lack of choice. However, recent price gains have encouraged growth in new listings, helping meet some of the housing demand.” In May, new listings totaled 4,327, a 16.5 per cent rise over figures reported during the same time last year with gains in new listings nearly matching sales growth. While inventories remain nearly five per cent below levels recorded last year, this is the first time in over two years that year-over-year declines were not in the double digits. While market conditions continue to favour the seller, improving supply has helped ease some of the tightness in the market. “Market conditions vary depending on the product type,” says CREB® president Bill Kirk. “Both condominium apartment and townhouse style products have recorded inventory growth relative to last year. This is good news for consumers looking for more choice in condominiums priced between $200,000 and $400,000.” Year-to-date condominium apartment sales have totaled 2,020 units, a 21 per cent increase over the first five months of 2013. Meanwhile, the rec ent boost in new listings caused inventory levels to rise to 1,051 units, a 13.1 per cent increase compared to last year, representing 23.3 per cent of all city- wide inventories. “The single family market varies depending on the price and location,” explains Kirk. “While the majority of sales are occurring in the $300,000 to $500,000 range, the number of new listings in this segment has lessened relative to last year, which indicates most new listing growth is occurring in the higher end of the market.” Year-to-date, single family sales and new listings totaled 7,662 and 11,093 units respectively. While May saw new listings improve by 11 per cent compared to the same month last year, sales growth continued to exceed new listings growth, keeping inventories levels nearly 12 per cent below May 2013 levels. The unadjusted single family benchmark price totaled $504,300 in May 2014, a 10 per cent increase over the previous year. Meanwhile, typical condominium apartment and townhouse prices reached a respective $295,400 and $321,400 in May 2014. Despite year-over-year gains that surpassed double digit per cent in both segments, condominium prices in both segments continue to remain just below peak. “Persistently tight market conditions continue to support stronger than expected price gains,” says Lurie. “While supply levels are improving, demand remains strong preventing any significant run up in inventories. However, we may see more divergent behaviour in the single family and condominium markets, impacting the relative price growth in each of these sectors.”

Welcome message from author
This document is posted to help you gain knowledge. Please leave a comment to let me know what you think about it! Share it to your friends and learn new things together.
Transcript

8/12/2019 May 2014 Calgary Real Estate Market Stats
http://slidepdf.com/reader/full/may-2014-calgary-real-estate-market-stats 1/20
CREB® Calgary Regional Housing Market Statistics pa
CALGARY REGIONAL HOUSING MARKET STATISTICS 5.1
CITY OF CALGARY MAY SALES ACTIVITY
0
500
1000
1500
2000
2500
3000
3500
SF Sales Apartment Sales TH Sales 10 Year Average Source: CREB®
Sales improve as consumers have more choice
City-wide price gains and better weather support year-over-year gains in new listings
June 2 2014 Residential sales in the city of
Calgary totaled 2,948 units in May, a 16 per cent increase
over the previous year. Sales last month were well above
ong-term trends and are the highest May activity on record.
“Strong sales activity is a reflection of improving
fundamental conditions such as a growing population,
favourable lending rates and rising wages,” says CREB® chief
economist Ann-Marie Lurie. “Leading up to May, resale
market sales were somewhat restricted by lack of choice.
However, recent price gains have encouraged growth in new
istings, helping meet some of the housing demand.”
n May, new listings totaled 4,327, a 16.5 per cent rise over
figures reported during the same time last year with gains in
new listings nearly matching sales growth. While inventories
remain nearly five per cent below levels recorded last year,
this is the first time in over two years that year-over-year
declines were not in the double digits.
While market conditions continue to favour the seller,
mproving supply has helped ease some of the tightness in
the market.
“Market conditions vary depending on the product type,”
says CREB® president Bill Kirk. “Both condominium
apartment and townhouse style products have recorded
nventory growth relative to last year. This is good news for
consumers looking for more choice in condominiums priced
between $200,000 and $400,000.”
Year-to-date condominium apartment sales have totaled
2,020 units, a 21 per cent increase over the first five months
of 2013. Meanwhile, the recent boost in new listings caused
nventory levels to rise to 1,051 units, a 13.1 per cent increase
compared to last year, representing 23.3 per cent of all cit
wide inventories.
“The single family market varies depending on the price an
location,” explains Kirk. “While the majority of sales a
occurring in the $300,000 to $500,000 range, the numb
of new listings in this segment has lessened relative to la
year, which indicates most new listing growth is occurring
the higher end of the market.”
Year-to-date, single family sales and new listings totale
7,662 and 11,093 units respectively. While May saw ne
listings improve by 11 per cent compared to the same mon
last year, sales growth continued to exceed new listin
growth, keeping inventories levels nearly 12 per cent belo
May 2013 levels.
The unadjusted single family benchmark price totale
$504,300 in May 2014, a 10 per cent increase over th
previous year.
Meanwhile, typical condominium apartment and townhou
prices reached a respective $295,400 and $321,400 in Ma
2014. Despite year-over-year gains that surpassed doub
digit per cent in both segments, condominium prices in bo
segments continue to remain just below peak.
“Persistently tight market conditions continue to suppo
stronger than expected price gains,” says Lurie. “Wh
supply levels are improving, demand remains stron
preventing any significant run up in inventories. Howeve
we may see more divergent behaviour in the single fam
and condominium markets, impacting the relative pri
growth in each of these sectors.”

8/12/2019 May 2014 Calgary Real Estate Market Stats
http://slidepdf.com/reader/full/may-2014-calgary-real-estate-market-stats 2/20
CREB® Calgary Regional Housing Market Statistics pa
May-13 May-14May-13 May-14 Y/Y % 2013 YTD 2014 YTD Y/Y %
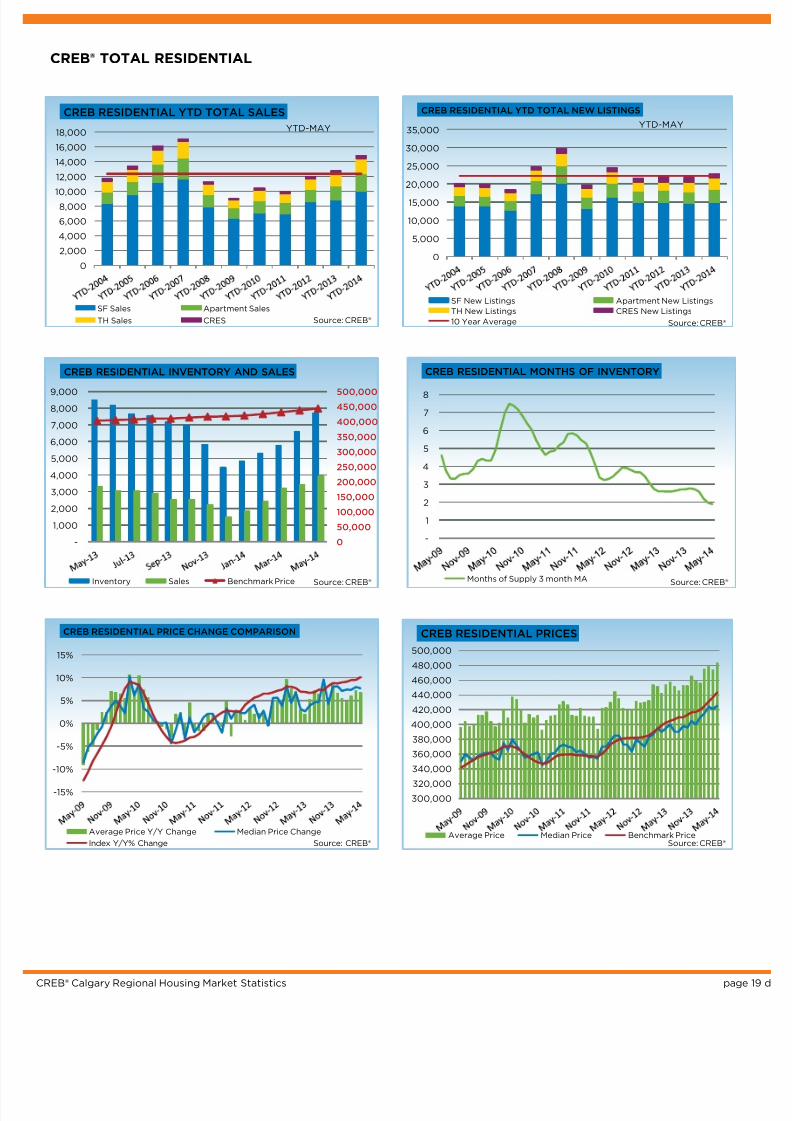
CREB® TOTAL RESIDENTIAL
Total Sales 3,303 3,921 18.71% 12,743 14,798 16.13%
Total Sales Volume $1,496,875,215 $1,895,944,090 26.66% $5,703,609,432 $7,029,181,572 23.24%
New Listings 5,186 6,037 16.41% 21,593 22,716 5.20%
Active Listings 8,485 7,711 -9.12% N/A N/A
Sales to New Listings Ratio 0.64 0.65 1.98% 0.59 0.65 10.39%
Sales $ / List $ 97.75% 98.43% 0.68% 97.60% 98.35% 0.76%
Average DOM 40 34 -16.08% 43 33 -23.26%
Average Price $453,187 $483,536 6.70% $447,588 $475,009 6.13%
Benchmark Price $402,700 $443,500 10.13%
Index 190 209 10.12%
CREB® CITY OF CALGARY
Total Sales 2,535 2,948 16.29% 9,951 11,264 13.19%
Total Sales Volume $1,169,703,995 $1,434,292,632 22.62% $4,520,515,534 $5,415,866,421 19.81%
New Listings 3,714 4,327 16.51% 15,544 16,502 6.16%
Active Listings 4,743 4,504 -5.04% N/A N/A
Sales to New Listings Ratio 0.68 0.68 -0.18% 0.64 0.68 6.62%
Sales $ / List $ 97.95% 98.73% 0.78% 97.78% 98.63% 0.85%
Average DOM 32 27 -13.66% 36 29 -19.44%
Average Price $461,422 $486,531 5.44% $454,278 $480,812 5.84%
Benchmark Price $409,600 $452,900 10.57%
Index 191 211 10.58%
CREB® TOWNS
Total Sales 486 627 29.01% 1,782 2,312 29.74%
Total Sales Volume $178,701,469 $257,217,473 43.94% $641,376,523 $915,515,347 42.74%
New Listings 773 929 20.18% 3,298 3,542 7.40%
Active Listings 1,767 1,492 -15.56% N/A N/A
Sales to New Listings Ratio 0.63 0.67 7.35% 0.54 0.65 20.80%
Sales $ / List $ 97.80% 98.27% 0.47% 97.59% 98.26% 0.67%
Average DOM 64 44 -32.22% 71 53 -25.35%
Average Price $367,698 $410,235 11.57% $359,919 $395,984 10.02%
Benchmark Price $343,900 $368,800 7.24%
Index 181 194 7.24%
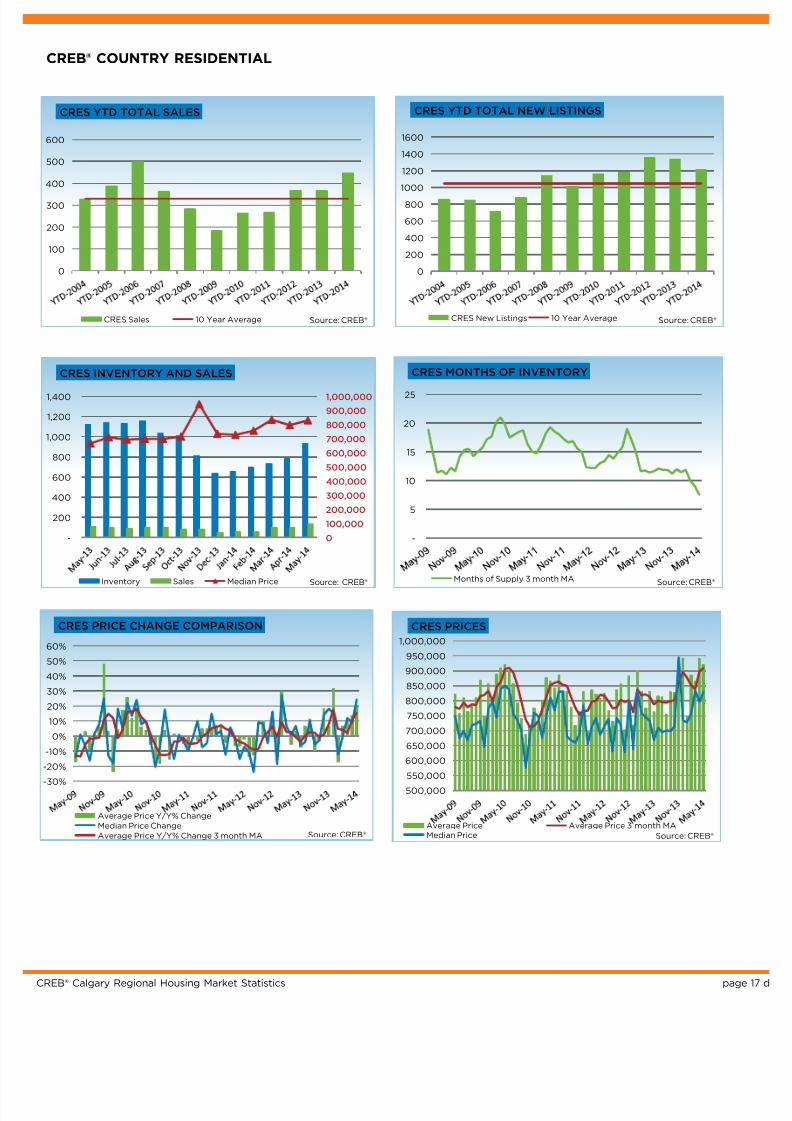
CREB® CRES
Total Sales 104 131 25.96% 366 445 21.58%
Total Sales Volume $79,261,900 $120,494,050 52.02% $295,280,441 $393,581,968 33.29%
New Listings 334 364 8.98% 1,330 1,206 -9.32%
Active Listings 1,123 932 -17.01% N/A N/A
Sales to New Listings Ratio 0.31 0.36 15.58% 0.28 0.37 34.09%
Sales $ / List $ 94.90% 95.53% 0.63% 95.00% 95.42% 0.43%
Average DOM 91 86 -5.30% 106 97 -8.49%
Average Price $762,134 $919,802 20.69% $806,777 $884,454 9.63%
Median Price $667,500 $830,000 24.34%
For a list of definitions, see page 20.
CREB® - SUMMARY STATS
8/12/2019 May 2014 Calgary Real Estate Market Stats
http://slidepdf.com/reader/full/may-2014-calgary-real-estate-market-stats 3/20
CREB® Calgary Regional Housing Market Statistics pa
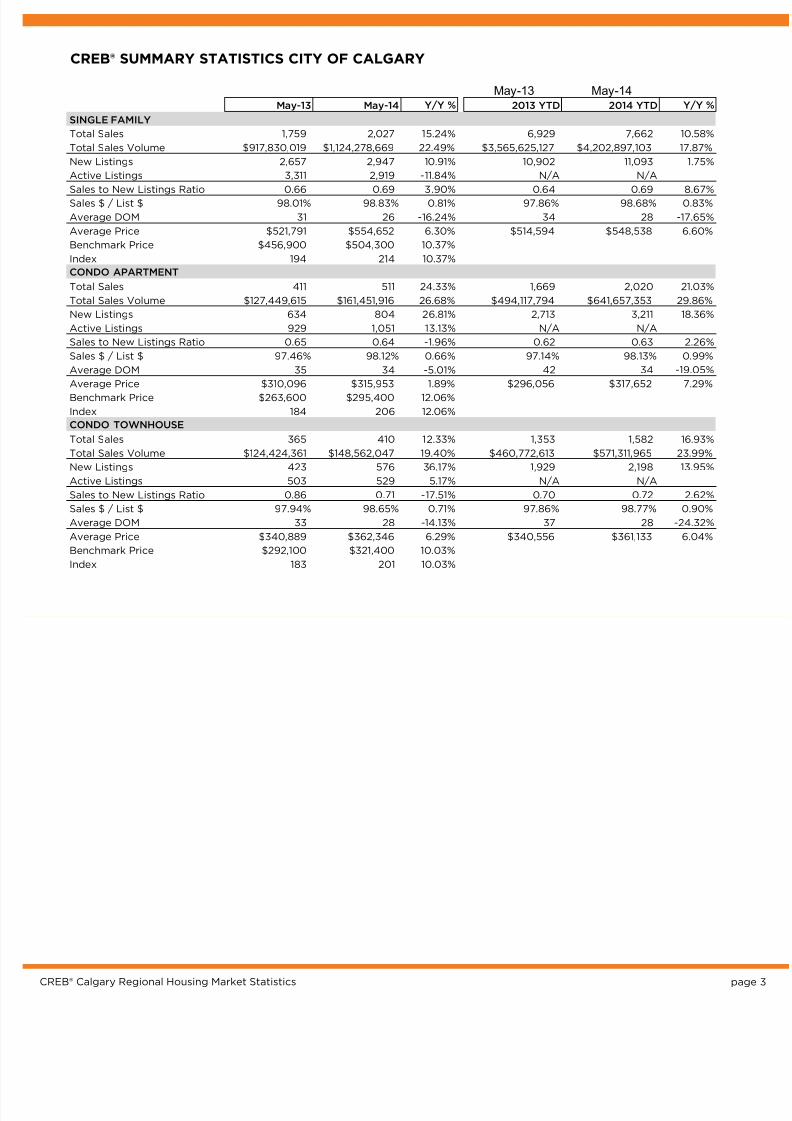
CREB® SUMMARY STATISTICS CITY OF CALGARY
May-13 May-14May-13 May-14 Y/Y % 2013 YTD 2014 YTD Y/Y %
SINGLE FAMILY
Total Sales 1,759 2,027 15.24% 6,929 7,662 10.58%
Total Sales Volume $917,830,019 $1,124,278,669 22.49% $3,565,625,127 $4,202,897,103 17.87%
New Listings 2,657 2,947 10.91% 10,902 11,093 1.75%
Active Listings 3,311 2,919 -11.84% N/A N/A
Sales to New Listings Ratio 0.66 0.69 3.90% 0.64 0.69 8.67%
Sales $ / List $ 98.01% 98.83% 0.81% 97.86% 98.68% 0.83%
Average DOM 31 26 -16.24% 34 28 -17.65%
Average Price $521,791 $554,652 6.30% $514,594 $548,538 6.60%
Benchmark Price $456,900 $504,300 10.37%
Index 194 214 10.37%
CONDO APARTMENT
Total Sales 411 511 24.33% 1,669 2,020 21.03%
Total Sales Volume $127,449,615 $161,451,916 26.68% $494,117,794 $641,657,353 29.86%
New Listings 634 804 26.81% 2,713 3,211 18.36%
Active Listings 929 1,051 13.13% N/A N/A
Sales to New Listings Ratio 0.65 0.64 -1.96% 0.62 0.63 2.26%
Sales $ / List $ 97.46% 98.12% 0.66% 97.14% 98.13% 0.99%
Average DOM 35 34 -5.01% 42 34 -19.05%
Average Price $310,096 $315,953 1.89% $296,056 $317,652 7.29%
Benchmark Price $263,600 $295,400 12.06%
Index 184 206 12.06%
CONDO TOWNHOUSE
Total Sales 365 410 12.33% 1,353 1,582 16.93%
Total Sales Volume $124,424,361 $148,562,047 19.40% $460,772,613 $571,311,965 23.99%
New Listings 423 576 36.17% 1,929 2,198 13.95%
Active Listings 503 529 5.17% N/A N/A
Sales to New Listings Ratio 0.86 0.71 -17.51% 0.70 0.72 2.62%
Sales $ / List $ 97.94% 98.65% 0.71% 97.86% 98.77% 0.90%
Average DOM 33 28 -14.13% 37 28 -24.32%
Average Price $340,889 $362,346 6.29% $340,556 $361,133 6.04%
Benchmark Price $292,100 $321,400 10.03%
Index 183 201 10.03%

8/12/2019 May 2014 Calgary Real Estate Market Stats
http://slidepdf.com/reader/full/may-2014-calgary-real-estate-market-stats 4/20
CREB® Calgary Regional Housing Market Statistics pa
MLS® HPI SUMMARY
Benchmark Price Index (HPI) Apr-14 Nov-13 May-13 May-11 May-09
CREB® TOTAL RESIDENTIAL
Single Family 486,500 211 1.6% 7.0% 9.8% 24.4% 31.6%
Townhouse 320,500 202 1.4% 5.2% 10.3% 19.7% 22.0%
Apartment 293,900 206 1.3% 5.5% 11.9% 21.1% 26.4%
COMPOSITE 443,500 209 1.5% 6.5% 10.1% 23.4% 29.7%
CREB® TOWNS
Single Family 374,800 194 1.8% 6.0% 6.8% 17.0% 20.4%
Townhouse 267,600 216 1.2% 6.8% 16.3% 24.1% 23.9%
Apartment 205,100 176 0.6% 3.6% 6.4% 9.2% 10.1%
COMPOSITE 368,800 194 1.8% 6.0% 7.2% 17.1% 20.3%
CREB® CITY OF CALGARY
Single Family 504,300 214 1.5% 7.2% 10.4% 25.8% 33.7%
Townhouse 321,400 201 1.5% 5.1% 10.0% 19.5% 22.0%
Apartment 295,400 206 1.3% 5.6% 12.1% 21.4% 26.6%
COMPOSITE 452,900 211 1.5% 6.7% 10.6% 24.4% 31.1%
% ChangesMay 2014

8/12/2019 May 2014 Calgary Real Estate Market Stats
http://slidepdf.com/reader/full/may-2014-calgary-real-estate-market-stats 5/20
CREB® Calgary Regional Housing Market Statistics pag
COMPARISONS
-
100,000
200,000
300,000
400,000
500,000
600,000
1 storey 2 Storey Total SF Townhouse Apartment Total Composite
Benchmark Price - May
CREB® Total Residential CREB® City of Calgary CREB® Towns Source: CREB®
-
1.0
2.0
3.0
4.0
5.0
6.0
7.0
8.0
Months of Supply SF Months of SupplyTownhouse
Months of SupplyApartment
Months of Supply - May
CREB® Total Residential CREB® City of CalgaryCREB® Towns Source: CREB®
68.86% 68.76%82.62%
13.54% 13.91%
11.80%14.64% 17.33%5.58%
3.34%
0%
20%
40%
60%
80%
100%
120%
CREB® TotalResidential
CREB® City ofCalgary
CREB® Towns
Sales Distribution - May
Single Family Townhouse Apartment CRES Source: CREB®
150
160
170
180
190
200
210
220
CALGARY INDEX VALUE
Index Value Single Family Index Value Tonwhouse
Index Value Apartment Source: CREB®
-20%
-15%
-10%
-5%
0%
5%
10%
15%
CALGARY INDEX YEAR OVER YEAR COMPARISON
SF Y/Y Index Price Change
Apartment Y/Y Index Price Change
Townhouse Y/Y Price Change Source: CREB®

8/12/2019 May 2014 Calgary Real Estate Market Stats
http://slidepdf.com/reader/full/may-2014-calgary-real-estate-market-stats 6/20
CREB® Calgary Regional Housing Market Statistics
Jan. Feb. Mar. Apr. May Jun. Jul. Aug. Sept. Oct. Nov. Dec. YTD
2013 01/01/2013 01/02/2013 01/03/2013 ######## 01/05/2013 01/06/2013 01/07/2013 01/08/2013 01/09/2013 01/10/2013 01/11/2013 01/12/2013 01/12/2013
Sales 1,229 1,706 2,107 2,374 2,535 2,306 2,264 2,192 1,919 1,948 1,724 1,171 23,475
New Listings 2,493 2,670 3,192 3,475 3,714 2,998 2,725 2,773 2,794 2,521 1,824 972 32,151
Active Listings 3,084 3,539 4,007 4,366 4,743 4,584 4,092 3,898 3,922 3,841 3,156 2,236
AverageDOM 50 38 35 33 32 35 39 38 36 40 40 46 37
Average Price 439,763 457,349 461,038 445,955 461,422 466,384 460,181 453,859 454,151 458,655 458,157 454,387 456,640
Benchmark Price 392,000 396,100 400,600 406,000 409,600 412,000 414,100 417,300 417,600 421,400 424,600 425,700
Index 183 185 187 189 191 192 193 195 195 197 198 199
2014 01/01/2014 01/02/2014 ######## ######## ######## ######## 01/07/2014 ######## ######## 01/10/2014 01/11/2014 01/12/2014 ########
Sales 1,438 1,851 2,483 2,544 2,948 1,290 - - - - - - 11,264
New Listings 2,394 2,709 3,318 3,754 4,327 2,010 - - - - - - 16,502 Active Listings 2,524 2,892 3,233 3,794 4,504 3,854 NA NA NA NA NA NA
AverageDOM 40 30 28 27 27 28 NA NA NA NA NA NA 29
Average Price 462,234 482,782 484,890 479,273 486,531 507,357 NA NA NA NA NA NA 480,812
Benchmark Price 429,100 434,100 440,500 446,300 452,900 NA NA NA NA NA NA NA
Index 200 202 205 208 211 NA NA NA NA NA NA NA
T41395 T41760 T2013 T2014
May-13 May-14 YTD2013 YTD2014
Calgary Total 01/05/2013 ######## 01/05/2013 ########
>$100,000 1 1 11 5
$100,000 - $199,999 108 52 441 212
$200,000 - $299,999 440 422 1,853 1,702
$300,000 -$ 349,999 327 346 1,302 1,368
$350,000 - $399,999 354 402 1,370 1,530
$400,000 - $449,999 298 353 1,215 1,412
$450,000 - $499,999 271 335 949 1,195
$500,000 - $549,999 175 264 678 971
$550,000 - $599,999 128 151 468 627 $600,000 - $649,999 85 144 359 495
$650,000 - $699,999 74 98 268 389
$700,000 - $799,999 99 154 388 521
$800,000 - $899,999 62 90 221 317
$900,000 - $999,999 30 42 110 161
$1,000,000 - $1,249,999 40 40 154 162
$1,250,000 - $1,499,999 13 28 65 95
$1,500,000 - $1,749,999 9 10 36 42
$1,750,000 - $1,999,999 6 8 23 27
$2,000,000 - $2,499,99 11 7 24 23
$2,500,000 - $2,999,99 4 - 12 4
$3,000,000 - $3,499,99 - - 1 2
$3,500,000 - $3,999,99 - - 2 2
$4,000,000 + - 1 1 2
2,535 2,948 9,951 11,264
CREB® CITY OF CALGARY
0%
5%
10%
15%
20%
25%
30%
35%YTD MAY
CALGARY YTD SALES BY PRICE RANGE
YTD-2011 YTD-2012 YTD-2013 YTD-2014Source: CREB®

8/12/2019 May 2014 Calgary Real Estate Market Stats
http://slidepdf.com/reader/full/may-2014-calgary-real-estate-market-stats 7/20
CREB® Calgary Regional Housing Market Statistics pag
CITY OF CALGARY
0
2,000
4,000
6,000
8,000
10,000
12,000
14,000
16,000 YTD-MAY
CALGARY YTD TOTAL SALES
SF Sales Apartment SalesTH Sales 10 Year Average Source: CREB®
0
5,000
10,000
15,000
20,000
25,000YTD-MAY
CALGARY YTD TOTAL NEW LISTINGS
SF New Listings Apartment New ListingsTH New Listings 10 Year Average Source: CREB®
-
50,000
100,000
150,000
200,000
250,000
300,000
350,000
400,000
450,000
500,000
-
500
1,000
1,500
2,000
2,500
3,000
3,500
4,000
4,500
5,000
CALGARY INVENTORY AND SALES
Inventory Sales Benchmark Price Source: CREB®
-
1
2
3
4
5
6
7
CALGARY MONTHS OF INVENTORY
Months of Supply 3 month MA Source: CREB®
BALANCED
-15%
-10%
-5%
0%
5%
10%
15%
CALGARY PRICE CHANGE COMPARISON
Average Price Y/Y% Change Y/Y Median Price Change
Index Y/Y% Change Source: CREB®
320,000
340,000
360,000
380,000
400,000
420,000
440,000
460,000
480,000
500,000
CALGARY PRICES
Average Price Median PriceBenchmark Price Source: CREB®

8/12/2019 May 2014 Calgary Real Estate Market Stats
http://slidepdf.com/reader/full/may-2014-calgary-real-estate-market-stats 8/20
CREB® Calgary Regional Housing Market Statistics
Jan. Feb. Mar. Apr. May Jun. Jul. Aug. Sept. Oct. Nov. Dec. YTD
2013 01/01/2013 01/02/2013 01/03/2013 ######## 01/05/2013 01/06/2013 01/07/2013 01/08/2013 01/09/2013 01/10/2013 01/11/2013 01/12/2013 01/12/2013
Sales 878 1,207 1,479 1,606 1,759 1,630 1,573 1,513 1,351 1,333 1,193 772 16,294
New Listings 1,732 1,874 2,233 2,406 2,657 2,146 1,956 1,963 1,973 1,736 1,233 649 22,558
Active Listings 2,075 2,408 2,727 2,977 3,311 3,199 2,917 2,791 2,789 2,705 2,171 1,515
AverageDOM 47 37 33 31 31 33 37 37 37 38 39 45 36
Average Price 496,821 518,480 518,468 509,942 521,791 526,021 524,976 517,206 512,296 516,375 515,491 527,634 517,621
Benchmark Price 436,900 442,500 446,500 452,900 456,900 459,700 461,600 464,700 463,700 468,000 470,600 472,200
Index 185 188 190 192 194 195 196 197 197 199 200 200
2014 01/01/2014 01/02/2014 ######## ######## ######## ######## 01/07/2014 ######## ######## 01/10/2014 01/11/2014 01/12/2014 ########
Sales 973 1,229 1,697 1,736 2,027 1,020 - - - - - - 7,662
New Listings 1,583 1,782 2,198 2,583 2,947 1,530 - - - - - - 11,093 Active Listings 1,671 1,894 2,052 2,445 2,919 2,525 NA NA NA NA NA NA
AverageDOM 40 29 27 25 26 27 NA NA NA NA NA NA 28
Average Price 520,678 550,531 556,448 547,871 554,652 560,292 NA NA NA NA NA NA 548,538
Benchmark Price 476,700 482,800 490,600 496,700 504,300 NA NA NA NA NA NA NA
Index 202 205 208 211 214 NA NA NA NA NA NA NA
SF41395 SF41760 SF2013 SF2014
May-13 May-14 YTD2013 YTD2014
Calgary SF 01/05/2013 ######## 01/05/2013 ########
>$100,000 1 1 2 1
$100,000 - $199,999 8 1 24 11
$200,000 - $299,999 115 58 525 249
$300,000 -$ 349,999 201 152 832 638
$350,000 - $399,999 279 277 1,087 1,056
$400,000 - $449,999 258 287 1,043 1,142
$450,000 - $499,999 226 287 832 1,028
$500,000 - $549,999 157 236 616 857
$550,000 - $599,999 115 143 431 579
$600,000 - $649,999 74 140 323 469 $650,000 - $699,999 66 88 248 361
$700,000 - $799,999 94 141 369 487
$800,000 - $899,999 60 85 212 296
$900,000 - $999,999 29 41 103 150
$1,000,000 - $1,249,999 35 39 132 152
$1,250,000 - $1,499,999 13 27 59 90
$1,500,000 - $1,749,999 9 8 33 38
$1,750,000 - $1,999,999 6 8 22 26
$2,000,000 - $2,499,99 11 7 23 23
$2,500,000 - $2,999,99 2 - 9 4
$3,000,000 - $3,499,99 - - 1 1
$3,500,000 - $3,999,99 - - 2 2
$4,000,000 + - 1 1 2
1,759 2,027 6,929 7,662
CREB® CITY OF CALGARY SINGLE FAMILY
0%
5%
10%
15%
20%
25%
30%
35%
40%YTD MAY
CALGARY YTD SINGLE FAMILY SALES BY PRICE RANGE
YTD-2011 YTD-2012 YTD-2013 YTD-2014 Source: CREB®

8/12/2019 May 2014 Calgary Real Estate Market Stats
http://slidepdf.com/reader/full/may-2014-calgary-real-estate-market-stats 9/20
CREB® Calgary Regional Housing Market Statistics pag
CITY OF CALGARY SINGLE FAMILY
0
2,000
4,000
6,000
8,000
10,000
12,000 YTD-MAY
CALGARY YTD SINGLE FAMILY SALES
SF Sales 10 Year Average Source: CREB®
0
2,000
4,000
6,000
8,00010,000
12,000
14,000
16,000
18,000YTD-MAY
CALGARY YTD SINGLE FAMILY NEW LISTINGS
SF New Listings 10 Year Average Source: CREB®
-
100,000
200,000
300,000
400,000
500,000
600,000
-
500
1,000
1,500
2,000
2,500
3,000
3,500
CALGARY SINGLE FAMILY INVENTORY AND SALES
SF Inventory SF Sales SF Benchmark Price Source: CREB®
-
1
2
3
4
5
6
7
CALGARY SINGLE FAMILY MONTHS OF INVENTORY
SF Months of Supply 3 month MA Source: CREB®
BALANCED
-15%
-10%
-5%
0%
5%
10%
15%
CALGARY SINGLE FAMILY PRICE CHANGE COMPARISON
SF Average Price Y/Y% Change SF Median Price Change
Index Y/Y% Change Source: CREB®
350,000
400,000
450,000
500,000
550,000
600,000
CALGARY SINGLE FAMILY PRICES
SF Average Price SF Median PriceSF Benchmark Price Source: CREB®

8/12/2019 May 2014 Calgary Real Estate Market Stats
http://slidepdf.com/reader/full/may-2014-calgary-real-estate-market-stats 10/20
CREB® Calgary Regional Housing Market Statistics p
Jan. Feb. Mar. Apr. May Jun. Jul. Aug. Sept. Oct. Nov. Dec. YTD
2013 01/01/2013 01/02/2013 01/03/2013 ######## 01/05/2013 01/06/2013 01/07/2013 01/08/2013 01/09/2013 01/10/2013 01/11/2013 01/12/2013 01/12/2013
Sales 147 220 282 339 365 318 294 282 244 278 228 179 3,176
New Listings 310 343 399 454 423 362 303 359 361 335 238 112 3,999
Active Listings 369 427 484 518 503 489 407 417 450 444 380 242
AverageDOM 52 38 39 36 33 40 38 34 31 43 39 48 38
Average Price 320,590 337,071 355,757 338,474 340,889 346,293 326,728 333,673 338,569 362,807 358,625 332,893 341,900
Benchmark Price 283,400 283,000 286,800 288,900 292,100 295,000 294,500 298,500 299,100 302,200 305,700 307,100
Index 177 177 179 181 183 184 184 187 187 189 191 192
2014 01/01/2014 01/02/2014 ######## ######## ######## ######## 01/07/2014 ######## ######## 01/10/2014 01/11/2014 01/12/2014 ########
Sales 206 265 341 360 410 150 - - - - - - 1,582
New Listings 326 354 457 485 576 180 - - - - - - 2,198 Active Listings 277 324 389 445 529 443 NA NA NA NA NA NA
AverageDOM 38 28 26 25 28 36 NA NA NA NA NA NA 28
Average Price 371,347 377,382 355,617 347,169 362,346 303,500 NA NA NA NA NA NA 361,133
Benchmark Price 308,100 309,700 313,100 316,700 321,400 NA NA NA NA NA NA NA
Index 193 194 196 198 201 NA NA NA NA NA NA NA
TH41395 TH41760 TH2013 TH2014
May-13 May-14 YTD2013 YTD2014
Calgary Townhouse 01/05/2013 ######## 01/05/2013 ########
>$100,000 - - 2 -
$100,000 - $199,999 33 15 118 48
$200,000 - $299,999 136 117 551 474
$300,000 -$ 349,999 66 114 234 435
$350,000 - $399,999 50 67 155 234
$400,000 - $449,999 19 28 97 133
$450,000 - $499,999 21 29 60 97
$500,000 - $549,999 10 11 34 54
$550,000 - $599,999 8 3 24 20
$600,000 - $649,999 9 4 27 17 $650,000 - $699,999 4 8 10 21
$700,000 - $799,999 5 8 10 20
$800,000 - $899,999 2 3 8 11
$900,000 - $999,999 - - 3 3
$1,000,000 - $1,249,999 2 - 14 6
$1,250,000 - $1,499,999 - 1 3 5
$1,500,000 - $1,749,999 - 2 2 4
$1,750,000 - $1,999,999 - - 1 -
$2,000,000 - $2,499,99 - - - -
$2,500,000 - $2,999,99 - - - -
$3,000,000 - $3,499,99 - - - -
$3,500,000 - $3,999,99 - - - -
$4,000,000 + - - - -
365 410 1353 1582
CITY OF CALGARY CONDOMINIUM TOWNHOUSE
0%
5%
10%
15%
20%
25%
30%
35%
40%
45%
50%YTD MAY
CALGARY YTD TOWNHOUSE SALES BY PRICE RANGE
YTD-2011 YTD-2012 YTD-2013 YTD-2014 Source: CREB®

8/12/2019 May 2014 Calgary Real Estate Market Stats
http://slidepdf.com/reader/full/may-2014-calgary-real-estate-market-stats 11/20
CREB® Calgary Regional Housing Market Statistics pag
CITY OF CALGARY CONDOMINIUM TOWNHOUSE
0
200
400
600
800
1,000
1,200
1,400
1,600
1,800
2,000YTD-MAY
CALGARY YTD TOWNHOUSE SALES
Townhouse Sales 10 Year Average Source: CREB®
0
500
1000
1500
2000
2500
3000 YTD-MAY
CALGARY YTD TOWNHOUSE NEW LISTINGS
Townhouse New Listings 10 Year Average Source: CREB®
-
50,000
100,000
150,000
200,000
250,000
300,000
350,000
-
100
200
300
400
500
600
CALGARY TOWNHOUSE INVENTORY AND SALES
TH Inventory TH Sales TH Benchmark Price Source: CREB®
-
1
2
3
4
5
6
7
CALGARY TOWNHOUSE MONTHS OF INVENTORY
TH Months of Supply 3 month MA
Source: CREB®
BALANCED
-20%
-15%
-10%
-5%
0%
5%
10%
15%
20%
25%
CALGARY TOWNHOUSE PRICE CHANGE COMPARISON
TH Average Price Y/Y % Change TH Median Price Change
Index Y/Y% Change Source: CREB®
220,000
240,000
260,000
280,000
300,000
320,000
340,000
360,000
380,000
400,000
CALGARY TOWNHOUSE PRICES
TH Average Price Median PriceTH Benchmark Price Source: CREB®

8/12/2019 May 2014 Calgary Real Estate Market Stats
http://slidepdf.com/reader/full/may-2014-calgary-real-estate-market-stats 12/20
CREB® Calgary Regional Housing Market Statistics
Jan. Feb. Mar. Apr. May Jun. Jul. Aug. Sept. Oct. Nov. Dec. YTD
2013 01/01/2013 01/02/2013 01/03/2013 ######## 01/05/2013 01/06/2013 01/07/2013 01/08/2013 01/09/2013 01/10/2013 01/11/2013 01/12/2013 01/12/2013
Sales 204 279 346 429 411 358 397 397 324 337 303 220 4,005
New Listings 451 453 560 615 634 490 466 451 460 450 353 211 5,594
Active Listings 640 704 796 871 929 896 768 690 683 692 605 479
AverageDOM 62 45 41 41 35 38 50 43 39 43 43 50 43
Average Price 280,067 287,733 301,358 291,345 310,096 301,523 302,278 297,807 298,743 309,415 307,308 296,207 299,536
Benchmark Price 251,300 252,900 257,700 261,300 263,600 264,000 267,600 270,600 272,900 276,100 279,600 278,600
Index 176 177 180 183 184 184 187 189 191 193 195 195
2014 01/01/2014 01/02/2014 ######## ######## ######## ######## 01/07/2014 ######## ######## 01/10/2014 01/11/2014 01/12/2014 ########
Sales 259 357 445 448 511 120 - - - - - - 2,020
New Listings 485 573 663 686 804 300 - - - - - - 3,211 Active Listings 577 677 791 898 1,051 886 NA NA NA NA NA NA
AverageDOM 42 33 31 34 34 21 NA NA NA NA NA NA 34
Average Price 314,966 327,788 311,064 319,610 315,953 312,226 NA NA NA NA NA NA 317,652
Benchmark Price 280,600 283,400 287,200 291,700 295,400 NA NA NA NA NA NA NA
Index 196 198 201 204 206 NA NA NA NA NA NA NA
A41395 A41760 A2013 A2014
May-13 May-14 YTD2013 YTD2014
Calgary Apartment 01/05/2013 ######## 01/05/2013 ########
>$100,000 - - 7 4
$100,000 - $199,999 67 36 299 153
$200,000 - $299,999 189 247 777 979
$300,000 -$ 349,999 60 80 236 295
$350,000 - $399,999 25 58 128 240
$400,000 - $449,999 21 38 75 137
$450,000 - $499,999 24 19 57 70
$500,000 - $549,999 8 17 28 60
$550,000 - $599,999 5 5 13 28
$600,000 - $649,999 2 - 9 9 $650,000 - $699,999 4 2 10 7
$700,000 - $799,999 - 5 9 14
$800,000 - $899,999 - 2 1 10
$900,000 - $999,999 1 1 4 8
$1,000,000 - $1,249,999 3 1 8 4
$1,250,000 - $1,499,999 - - 3 -
$1,500,000 - $1,749,999 - - 1 -
$1,750,000 - $1,999,999 - - - 1
$2,000,000 - $2,499,99 - - 1 -
$2,500,000 - $2,999,99 2 - 3 -
$3,000,000 - $3,499,99 - - - 1
$3,500,000 - $3,999,99 - - - -
$4,000,000 + - - - -
411 511 1,669 2,020
CITY OF CALGARY CONDOMINIUM APARTMENTS
0%
10%
20%
30%
40%
50%
60%YTD MAY
CALGARY YTD APARTMENT SALES BY PRICE RANGE
YTD-2011 YTD-2012 YTD-2013 YTD-2014 Source: CREB®

8/12/2019 May 2014 Calgary Real Estate Market Stats
http://slidepdf.com/reader/full/may-2014-calgary-real-estate-market-stats 13/20
CREB® Calgary Regional Housing Market Statistics pag
CITY OF CALGARY CONDOMINIUM APARTMENTS
0
500
1,000
1,500
2,000
2,500
3,000YTD-MAY
CALGARY YTD APARTMENT SALES
Apartment Sales 10 Year Average Source: CREB®
0
500
1,000
1,500
2,000
2,5003,000
3,500
4,000
4,500
5,000YTD-MAY
CALGARY YTD APARTMENT NEW LISTINGS
Apartment New Listings 10 Year Average Source: CREB®
-
50,000
100,000
150,000
200,000
250,000
300,000
350,000
-
200
400
600
800
1,000
1,200
CALGARY APARTMENT INVENTORY AND SALES
Apartment Inventory Apartment SalesApartment Benchmark Price Source: CREB®
-
1
2
3
4
5
6
7
8
CALGARY APARTMENT MONTHS OF INVENTORY
Apartment Months of Supply 3 month MA Source: CREB®
BALANCED
-20%
-15%
-10%
-5%
0%
5%
10%
15%
20%
25%
CALGARY APARTMENT PRICE CHANGE COMPARISON
Apartment Average Price Y/Y% ChangeMedian Price ChangeIndex Y/Y% Change Source: CREB®
200000
220000
240000
260000
280000
300000
320000
340000
CALGARY APARTMENT PRICES
Apartment Average Price Median Price
Benchmark Price Source: CREB®

8/12/2019 May 2014 Calgary Real Estate Market Stats
http://slidepdf.com/reader/full/may-2014-calgary-real-estate-market-stats 14/20
CREB® Calgary Regional Housing Market Statistics p
Jan. Feb. Mar. Apr. May Jun. July. Aug. Sept. Oct. Nov. Dec. YTD
2013 01/01/2013 01/02/2013 01/03/2013 ######## 01/05/2013 01/06/2013 01/07/2013 01/08/2013 01/09/2013 01/10/2013 01/11/2013 01/12/2013 01/12/2013
Sales 245 256 364 431 486 470 480 431 377 382 317 201 4,440
New Listings 542 559 659 765 773 587 671 590 549 513 379 218 6,805
Active Listings 1,218 1,381 1,533 1,705 1,767 1,606 1,570 1,517 1,443 1,390 1,241 1,008
AverageDOM 82 69 55 66 64 62 60 57 58 59 64 65 68
Average Price 349,213 338,531 364,728 365,877 367,698 370,550 374,672 364,998 378,736 380,376 392,647 376,726 369,588
Benchmark Price 329,200 332,500 336,100 339,900 343,900 346,200 346,400 348,100 345,800 345,400 347,900 346,500
Index 173 175 177 179 181 182 182 183 182 182 183 182
2014 01/01/2014 01/02/2014 ######## ######## ######## ######## 01/07/2014 ######## ######## 01/10/2014 01/11/2014 01/12/2014 ########
Sales 251 358 494 582 627 180 - - - - - - 2,312
New Listings 551 544 705 813 929 330 - - - - - - 3,542 Active Listings 1,141 1,202 1,243 1,344 1,492 1,786 NA NA NA NA NA NA
AverageDOM 68 56 49 46 44 18 NA NA NA NA NA NA 53
Average Price 379,053 387,568 392,572 396,006 410,235 463,850 NA NA NA NA NA NA 395,984
Benchmark Price 346,500 351,300 356,800 362,100 368,800 NA NA NA NA NA NA NA
Index 182 185 188 191 194 NA NA NA NA NA NA NA
TO41395 TO41760 TO2013 TO2014
May-13 May-14 YTD2013 YTD2014
CREB Towns 01/05/2013 ######## 01/05/2013 ########
>$100,000 3 3 29 10
$100,000 - $199,999 57 31 186 146
$200,000 - $299,999 95 116 402 455
$300,000 -$ 349,999 69 88 295 312
$350,000 - $399,999 97 104 309 381
$400,000 - $449,999 58 77 206 316
$450,000 - $499,999 36 62 148 243
$500,000 - $549,999 27 55 71 170
$550,000 - $599,999 12 38 39 111
$600,000 - $649,999 13 21 32 62 $650,000 - $699,999 6 5 15 34
$700,000 - $799,999 5 17 18 35
$800,000 - $899,999 3 2 10 9
$900,000 - $999,999 1 - 7 8
$1,000,000 - $1,249,999 3 4 7 12
$1,250,000 - $1,499,999 1 1 4 3
$1,500,000 - $1,749,999 - 3 2 4
$1,750,000 - $1,999,999 - - 2 1
$2,000,000 - $2,499,99 - - - -
$2,500,000 - $2,999,99 - - - -
$3,000,000 - $3,499,99 - - - -
$3,500,000 - $3,999,99 - - - -
$4,000,000 + - - - -
486 627 1,782 2,312
CREB® TOWNS
0%
5%
10%
15%
20%
25%
30%
35%
40%YTD MAY
CREB TOWNS YTD SALES BY PRICE RANGE
YTD-2012 YTD-2012 YTD-2013 YTD-2014 Source: CREB®

8/12/2019 May 2014 Calgary Real Estate Market Stats
http://slidepdf.com/reader/full/may-2014-calgary-real-estate-market-stats 15/20
CREB® Calgary Regional Housing Market Statistics pag
CREB® TOWNS
0
500
1,000
1,500
2,000
2,500
CREB TOWNS YTD TOTAL SALES
SF Sales Apartment SalesTH Sales 10 Year Average Source: CREB®
0
500
1,000
1,500
2,000
2,500
3,000
3,500
4,000
4,500
5,000
CREB TOWNS YTD TOTAL NEW LISTINGS
SF New Listings Apartment New ListingsTH New Listings 10 Year Average Source: CREB®
-
50,000
100,000
150,000
200,000
250,000
300,000
350,000
400,000
-
200
400
600
800
1,000
1,200
1,400
1,600
1,800
2,000
CREB TOWNS INVENTORY AND SALES
Inventory Sales Benchmark Price Source: CREB®
-
2
4
6
8
10
12
CREB TOWNS MONTHS OF INVENTORY
Months of Supply 3 month MA Source: CREB®
BALANCED
-15%
-10%
-5%
0%
5%
10%
15%
20%
CREB TOWNS PRICE CHANGE COMPARISON
Average Price Y/Y% Change Median Price Change
Index Y/Y% Change Source: CREB®
250,000
270,000
290,000
310,000
330,000
350,000
370,000
390,000
410,000
430,000
CREB TOWNS PRICES
Average Price Median Price Benchmark PriceSource: CREB®
8/12/2019 May 2014 Calgary Real Estate Market Stats
http://slidepdf.com/reader/full/may-2014-calgary-real-estate-market-stats 16/20
CREB® Calgary Regional Housing Market Statistics
Jan. Feb. Mar. Apr. May Jun. Jul. Aug. Sept. Oct. Nov. Dec. YTD
2013 01/01/2013 01/02/2013 01/03/2013 ######## 01/05/2013 01/06/2013 01/07/2013 01/08/2013 01/09/2013 01/10/2013 01/11/2013 01/12/2013 01/12/2013
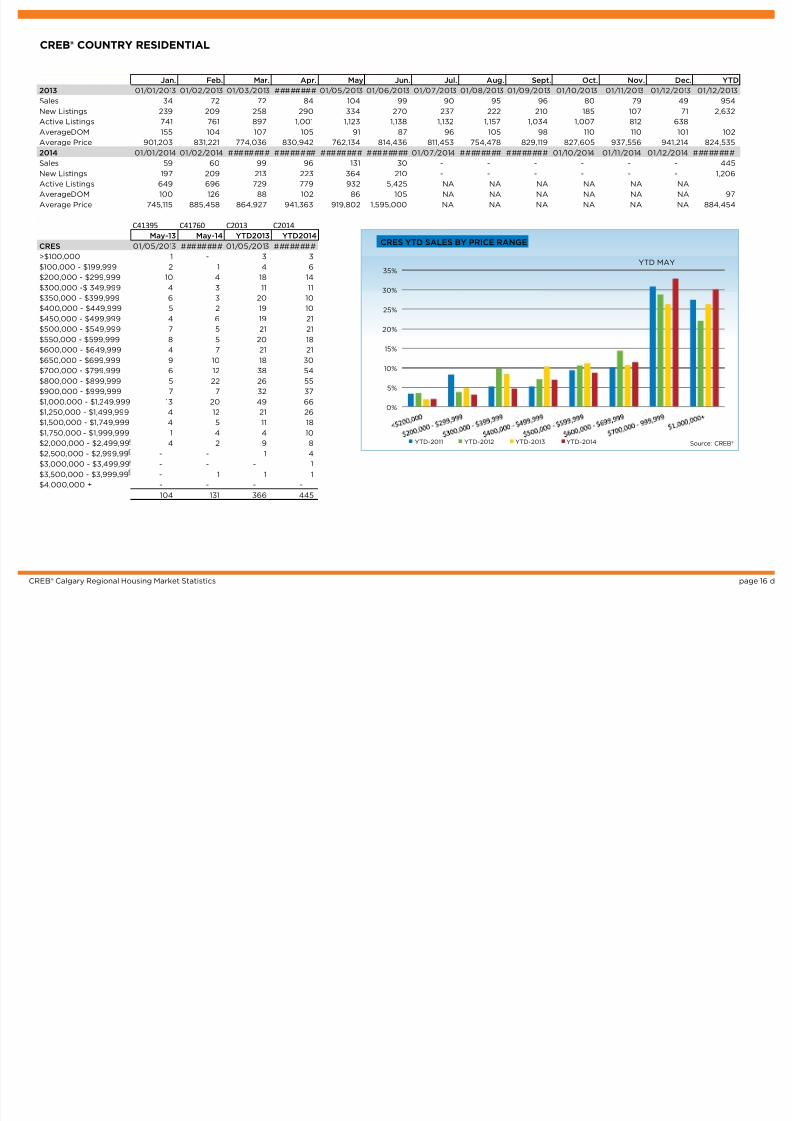
Sales 34 72 72 84 104 99 90 95 96 80 79 49 954
New Listings 239 209 258 290 334 270 237 222 210 185 107 71 2,632
Active Listings 741 761 897 1,001 1,123 1,138 1,132 1,157 1,034 1,007 812 638
AverageDOM 155 104 107 105 91 87 96 105 98 110 110 101 102
Average Price 901,203 831,221 774,036 830,942 762,134 814,436 811,453 754,478 829,119 827,605 937,556 941,214 824,535
2014 01/01/2014 01/02/2014 ######## ######## ######## ######## 01/07/2014 ######## ######## 01/10/2014 01/11/2014 01/12/2014 ########
Sales 59 60 99 96 131 30 - - - - - - 445
New Listings 197 209 213 223 364 210 - - - - - - 1,206
Active Listings 649 696 729 779 932 5,425 NA NA NA NA NA NA
AverageDOM 100 126 88 102 86 105 NA NA NA NA NA NA 97 Average Price 745,115 885,458 864,927 941,363 919,802 1,595,000 NA NA NA NA NA NA 884,454
C41395 C41760 C2013 C2014
May-13 May-14 YTD2013 YTD2014
CRES 01/05/2013 ######## 01/05/2013 ########
>$100,000 1 - 3 3
$100,000 - $199,999 2 1 4 6
$200,000 - $299,999 10 4 18 14
$300,000 -$ 349,999 4 3 11 11
$350,000 - $399,999 6 3 20 10
$400,000 - $449,999 5 2 19 10
$450,000 - $499,999 4 6 19 21
$500,000 - $549,999 7 5 21 21
$550,000 - $599,999 8 5 20 18
$600,000 - $649,999 4 7 21 21
$650,000 - $699,999 9 10 18 30
$700,000 - $799,999 6 12 38 54
$800,000 - $899,999 5 22 26 55
$900,000 - $999,999 7 7 32 37 $1,000,000 - $1,249,999 13 20 49 66
$1,250,000 - $1,499,999 4 12 21 26
$1,500,000 - $1,749,999 4 5 11 18
$1,750,000 - $1,999,999 1 4 4 10
$2,000,000 - $2,499,99 4 2 9 8
$2,500,000 - $2,999,99 - - 1 4
$3,000,000 - $3,499,99 - - - 1
$3,500,000 - $3,999,99 - 1 1 1
$4,000,000 + - - - -
104 131 366 445
CREB® COUNTRY RESIDENTIAL
0%
5%
10%
15%
20%
25%
30%
35%YTD MAY
CRES YTD SALES BY PRICE RANGE
YTD-2011 YTD-2012 YTD-2013 YTD-2014 Source: CREB®
8/12/2019 May 2014 Calgary Real Estate Market Stats
http://slidepdf.com/reader/full/may-2014-calgary-real-estate-market-stats 17/20
CREB® Calgary Regional Housing Market Statistics pag
CREB® COUNTRY RESIDENTIAL
0
100
200
300
400
500
600
CRES YTD TOTAL SALES
CRES Sales 10 Year Average Source: CREB®
0
200
400
600
800
1000
1200
1400
1600
CRES YTD TOTAL NEW LISTINGS
CRES New Listings 10 Year Average Source: CREB®
0
100,000
200,000
300,000
400,000
500,000
600,000
700,000
800,000
900,000
1,000,000
-
200
400
600
800
1,000
1,200
1,400
CRES INVENTORY AND SALES
Inventory Sales Median Price Source: CREB®
-
5
10
15
20
25
CRES MONTHS OF INVENTORY
Months of Supply 3 month MA Source: CREB®
-30%
-20%
-10%
0%
10%
20%
30%
40%
50%
60%
CRES PRICE CHANGE COMPARISON
Average Price Y/Y% Change
Median Price Change
Average Price Y/Y% Change 3 month MA Source: CREB®
500,000
550,000
600,000
650,000
700,000
750,000
800,000
850,000
900,000
950,000
1,000,000
CRES PRICES
Average Price Average Price 3 month MAMedian Price Source: CREB®

8/12/2019 May 2014 Calgary Real Estate Market Stats
http://slidepdf.com/reader/full/may-2014-calgary-real-estate-market-stats 18/20
CREB® Calgary Regional Housing Market Statistics p
Jan. Feb. Mar. Apr. May Jun. Jul. Aug. Sept. Oct. Nov. Dec. YTD
2013 01/01/2013 01/02/2013 01/03/2013 ######## 01/05/2013 01/06/2013 01/07/2013 01/08/2013 01/09/2013 01/10/2013 01/11/2013 01/12/2013 01/12/2013
Sales 1,588 2,128 2,676 3,048 3,303 3,057 3,023 2,894 2,545 2,541 2,228 1,497 30,528
New Listings 3,462 3,635 4,425 4,885 5,186 4,186 3,958 3,850 3,777 3,451 2,454 1,348 44,617
Active Listings 5,713 6,366 7,169 7,854 8,485 8,189 7,646 7,550 7,152 6,944 5,830 4,437
AverageDOM 59 47 42 42 40 42 47 45 45 46 48 53 43
Average Price 431,889 453,384 451,662 442,076 453,187 457,543 451,412 445,737 452,837 452,283 465,171 458,374 451,429
Benchmark Price 385,300 389,300 393,800 398,900 402,700 404,800 407,000 409,900 409,700 413,100 416,300 416,900
Index 182 184 186 188 190 191 192 193 193 195 196 197
2014 01/01/2014 01/02/2014 ######## ######## ######## ######## 01/07/2014 ######## ######## 01/10/2014 01/11/2014 01/12/2014 ########
Sales 1,842 2,393 3,231 3,411 3,921 1,170 - - - - - - 14,798
New Listings 3,306 3,660 4,561 5,152 6,037 1,860 - - - - - - 22,716 Active Listings 4,830 5,291 5,783 6,593 7,711 5,425 NA NA NA NA NA NA
AverageDOM 49 39 34 34 34 27 NA NA NA NA NA NA 33
Average Price 455,402 474,128 478,193 473,397 483,536 540,783 NA NA NA NA NA NA 475,009
Benchmark Price 419,900 424,800 431,100 436,900 443,500 NA NA NA NA NA NA NA
Index 198 200 203 206 209 NA NA NA NA NA NA NA
CT41395 CT41760 CT2013 CT2014
May-13 May-14 YTD2013 YTD2014
CREB Total 01/05/2013 ######## 01/05/2013 ########
>$100,000 13 5 79 28
$100,000 - $199,999 181 109 687 435
$200,000 - $299,999 578 581 2,379 2,329
$300,000 -$ 349,999 421 474 1,714 1,807
$350,000 - $399,999 494 542 1,805 2,037
$400,000 - $449,999 379 458 1,517 1,840
$450,000 - $499,999 321 421 1,147 1,519
$500,000 - $549,999 220 338 800 1,204
$550,000 - $599,999 153 197 544 783
$600,000 - $649,999 110 176 435 592 $650,000 - $699,999 91 115 311 465
$700,000 - $799,999 115 187 463 629
$800,000 - $899,999 71 119 269 394
$900,000 - $999,999 40 51 154 215
$1,000,000 - $1,249,999 57 64 216 244
$1,250,000 - $1,499,999 20 41 93 125
$1,500,000 - $1,749,999 13 18 50 64
$1,750,000 - $1,999,999 7 13 29 40
$2,000,000 - $2,499,99 15 10 33 32
$2,500,000 - $2,999,99 4 - 13 8
$3,000,000 - $3,499,99 - - 1 3
$3,500,000 - $3,999,99 - 1 3 3
$4,000,000 + - 1 1 2
3,303 3,921 12,743 14,798
CREB® TOTAL RESIDENTIAL
0%
5%
10%
15%
20%
25%
30%
35%
YTD MAY
CREB RESIDENTIAL YTD SALES BY PRICE RANGE
YTD-2011 YTD-2012 YTD-2013 YTD-2014 Source: CREB®
8/12/2019 May 2014 Calgary Real Estate Market Stats
http://slidepdf.com/reader/full/may-2014-calgary-real-estate-market-stats 19/20
CREB® Calgary Regional Housing Market Statistics pag
CREB® TOTAL RESIDENTIAL
0
2,000
4,000
6,000
8,00010,000
12,000
14,000
16,000
18,000YTD-MAY
CREB RESIDENTIAL YTD TOTAL SALES
SF Sales Apartment Sales
TH Sales CRES Source: CREB®
0
5,000
10,000
15,000
20,000
25,000
30,000
35,000YTD-MAY
CREB RESIDENTIAL YTD TOTAL NEW LISTINGS
SF New Listings Apartment New Listings
TH New Listings CRES New Listings
10 Year Average Source: CREB®
0
50,000
100,000
150,000
200,000
250,000
300,000
350,000
400,000
450,000500,000
-
1,000
2,000
3,000
4,000
5,000
6,000
7,000
8,000
9,000
CREB RESIDENTIAL INVENTORY AND SALES
Inventory Sales Benchmark Price Source: CREB®
-15%
-10%
-5%
0%
5%
10%
15%
CREB RESIDENTIAL PRICE CHANGE COMPARISON
Average Price Y/Y Change Median Price Change
Index Y/Y% Change Source: CREB®
300,000320,000
340,000
360,000
380,000
400,000
420,000
440,000
460,000
480,000
500,000
CREB RESIDENTIAL PRICES
Average Price Median Price Benchmark PriceSource: CREB®
-
1
2
3
4
5
6
7
8
CREB RESIDENTIAL MONTHS OF INVENTORY
Months of Supply 3 month MA Source: CREB®

8/12/2019 May 2014 Calgary Real Estate Market Stats
http://slidepdf.com/reader/full/may-2014-calgary-real-estate-market-stats 20/20
DEFINITIONS
SF - Single Family LP - List Price
TH - Condominium Townhouse Sales $ / List $ - sales price to list price ratio
Months of Supply - Active Listings (Inventory) / sales CRES - Country residential properties
Composite - includes single family, apartment and townhouse activity YTD - Year to Date
Average DOM - Average Days on Market for Sold properties 3 month MA - 3 month Moving Average
SP – Sales Price
Benchmark Price – Price of the typical home, based on the value consumers assign to various attributes
MLS® Home Price Index – changes in home prices by comparing price levels at a point in time with price levels in a base (reference) period.
HOW THESE STATISTICS ARE CALCULATED
CREB® Towns
• Includes only areas outside of Calgary in which CREB® represents the majority of membership
• Areas included: Airdrie, Foothills, Kneehill, Mountain View, Rocky View, Wheatland and Willow Creek.
• All historical data has been revised
ABOUT CREB®
In order to align our data with the MLS® Home Price Index (HPI), we made several changes to the data that we report, as well as themonthly statistics.
The new package provides more information and data exclusions to provide a better residential picture. All the data providedthrough the monthly statistics package as of March 2012, reflect these adjustments. Please note, historical PDF packages do notinclude the changes.
MONTHLY STATISTICS PACKAGE
• We now provide monthly statistics for: CREB® Total Residential, CREB® Towns, CREB® Country Residential (CRES),
City of Calgary, City of Calgary Single Family, City of Calgary Apartment, City of Calgary Townhouse.• Median prices have been removed and replaced with the benchmark price and the index. • MLS® HPI Summary was added.
• Several trending graphs and summary stats were added for each category
All categories exclude: vacant lots, time shares, parking stalls and mobile homes on leased land.
CITY OF CALGARY
• Includes sales in Zones A, B, C, D only.
• Condominium Apartment – includes all ‘Condominium’ title properties that are classified by type as either a low-rise orhigh-rise apartment.
• Condominium Townhouse – includes all ‘Condominium’ titled properties that are not classified as an ‘Apartment.’• Historical inventories have been adjusted to reflect the adjustments made to the data.
TOTAL MLS®
• Changed to CREB® Total Residential • Excludes: Rural Land, Country Recreational (CREC),
• The exclusions applied to the data results in roughly 400 – 500 less sales per year.
• Historical inventories have been revised to best reflect the adjustments made to the data, while Mobile Homes, Rural Land and CREC were removed for inventories, we could not exclude vacant lots, time shares and parking stalls from historicalinventories.
CREB® is a professional body of more than 5,100 licensed brokers and registered associates, representing 245 member offices. CREB®is dedicated to enhancing the value, integrity and expertise of its REALTOR® members. Our REALTORS® are committed to a highstandard of professional conduct, ongoing education, and a strict Code of Ethics and standards of business practice.
For Calgary Metro, CREB® statistics include only Zone A, B, C and D for properties located in Calgary. Furthermore, all historical data
has been adjusted to the most current information.
Any use or reference to CREB® data and statistics must acknowledge CREB® as the source. The board does not generate statistics oranalysis of any individual member or company’s market share. All MLS® active listings for Calgary and area may be found on theboard’s website at www.creb.com.
CREB® is a registered trademark of the Calgary Real Estate Board Cooperative. The trademarks MLS® and Multiple Listing Service® areowned by the Canadian Real Estate Association (CREA) and identify the quality of services provided by real estate professionals whoare members of CREA. The trademarks REALTOR® and REALTORS® are controlled by CREA and identify real estate professionals whoare members of CREA, and subsequently the Alberta Real Estate Association and CREB®, used under licence.
Related Documents