May 2009 Wilson Sons Mkt cap = US$ 493mn ou R$ 1,059bn Net Debt = US$ 15.8mn Revenues 09E = US$ 551.9mn EBITDA 09E = US$ 119mn Fernanda Torós

May 2009
Jan 12, 2016
Wilson Sons Mkt cap = US$ 493mn ou R$ 1,059bn Net Debt = US$ 15.8mn Revenues 09E = US$ 551.9mn EBITDA 09E = US$ 119mn Fernanda Torós. May 2009. The Port Industry. Growth Drivers for the Brazilian Port Sector. - PowerPoint PPT Presentation
Welcome message from author
This document is posted to help you gain knowledge. Please leave a comment to let me know what you think about it! Share it to your friends and learn new things together.
Transcript

May 2009
Wilson Sons
Mkt cap = US$ 493mn ou R$ 1,059bnNet Debt = US$ 15.8mnRevenues 09E = US$ 551.9mnEBITDA 09E = US$ 119mn
Fernanda Torós
The Port Industry

Growth Drivers for the Brazilian Port Sector
• Change in the transportation matrix to a more efficient mix: away from road and towards cabotage and rails.
• Increased globalization and openness to world trade.
• Growth in container use, which is expected to facilitate trade.
• Evolution in the size of container ships: the larger the ship, the larger the efficiency over long distances, and the larger the volume of cargo handled at the port for a given anchored ship.
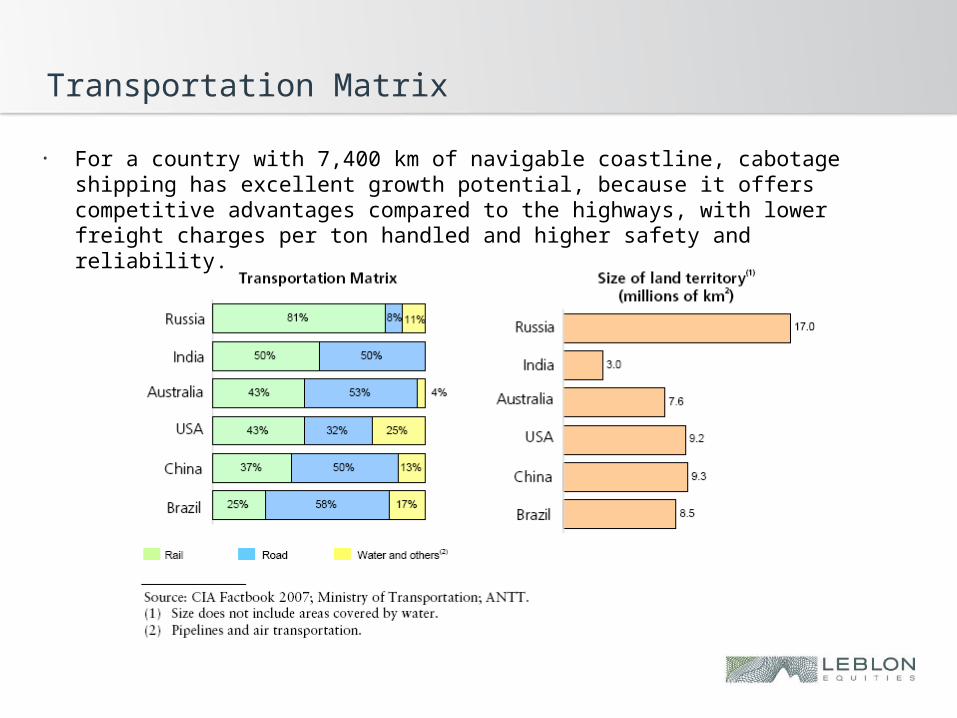
Transportation Matrix
• For a country with 7,400 km of navigable coastline, cabotage shipping has excellent growth potential, because it offers competitive advantages compared to the highways, with lower freight charges per ton handled and higher safety and reliability.
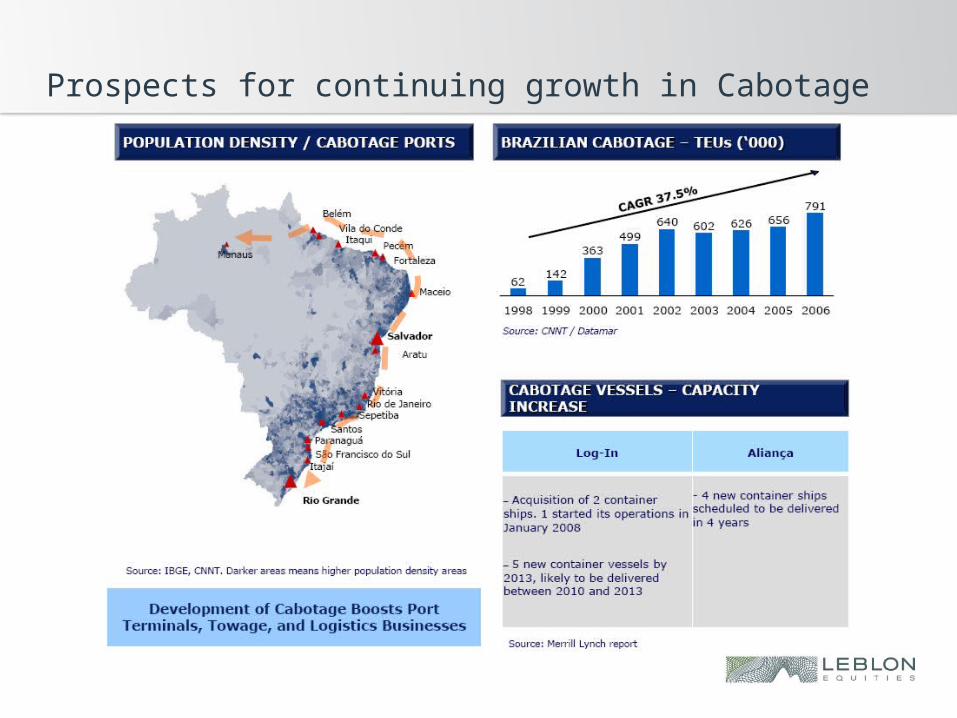
Prospects for continuing growth in Cabotage
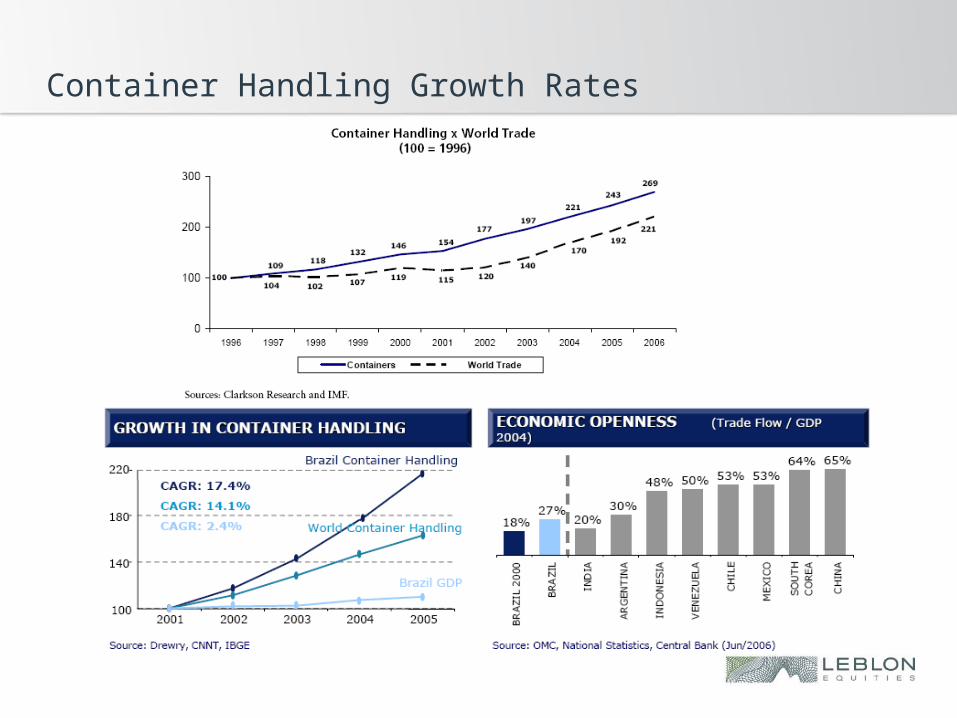
Container Handling Growth Rates

Advantage of Containers
Advantages of containers over the transportation of goods as general cargo:
• reduction in cargo losses, damage and theft;• faster transport and storage;• reduction in cargo-handling manpower;• facilitation of intermodal transport;• possibility of storing goods in uncovered areas;• globally standardized packaging;• and better logistical capillarity in terms of ground distribution.

Evolution in the Size of Container Ships
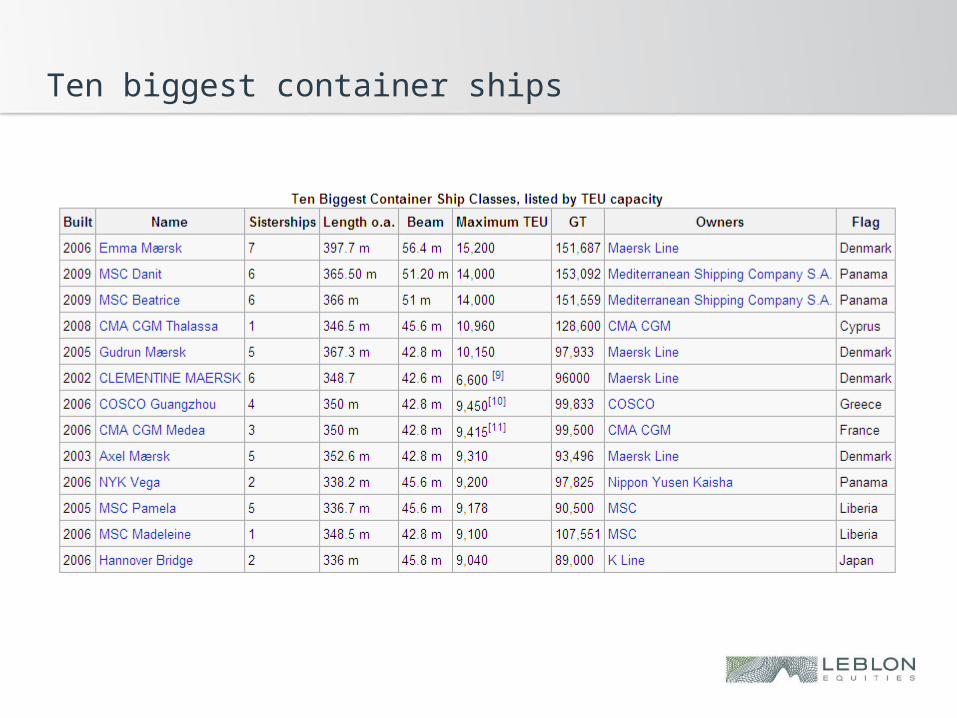
Ten biggest container ships
The Oil & Gas Industry
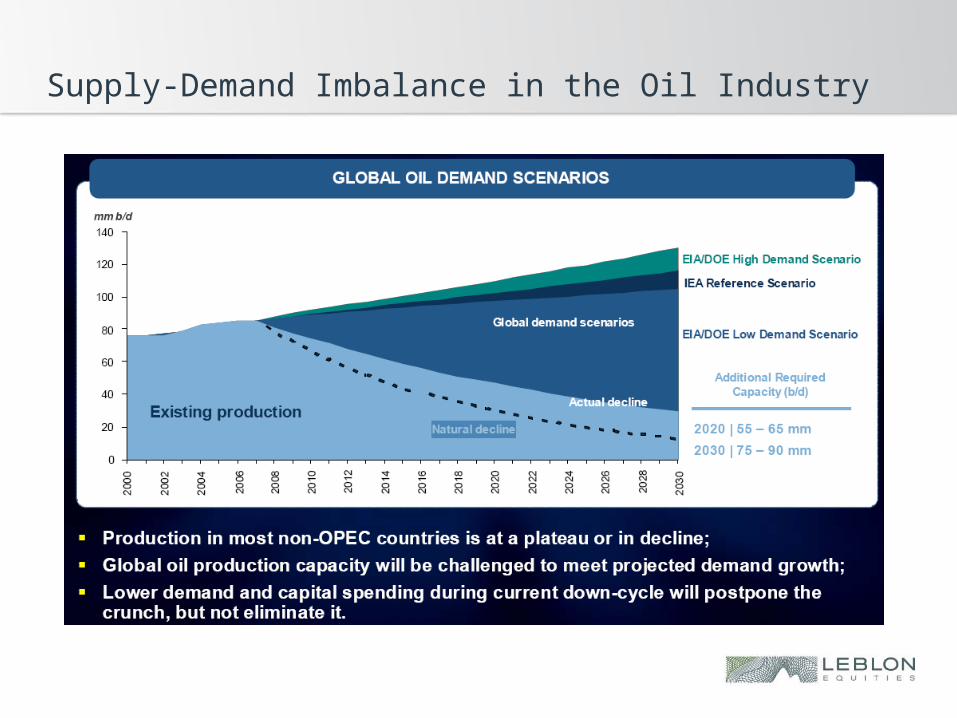
Supply-Demand Imbalance in the Oil Industry

High-Potential Portfolio in a Politically Stable Country

Petrobras Production Plans are expected to benefit the whole supply chain in the oil industry...
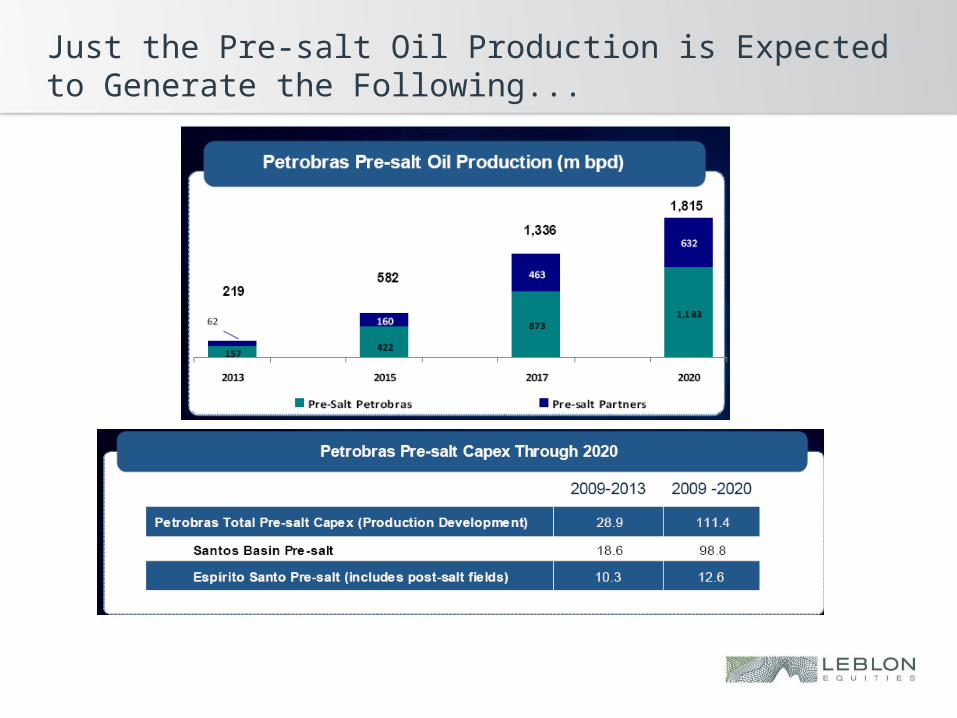
Just the Pre-salt Oil Production is Expected to Generate the Following...

Petrobras is a Leading Operator in Floating Production Systems – and this may grow...
Note: FPSO stands for Floating Production, Storage and Offloading vessel.
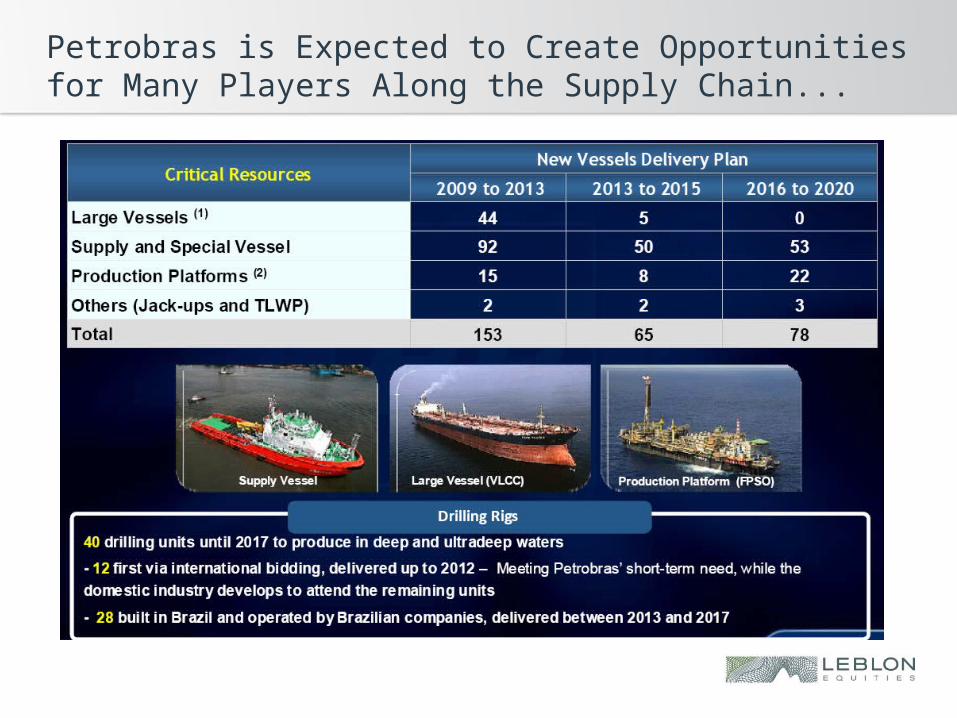
Petrobras is Expected to Create Opportunities for Many Players Along the Supply Chain...
The Company

Wilson Sons- Overview
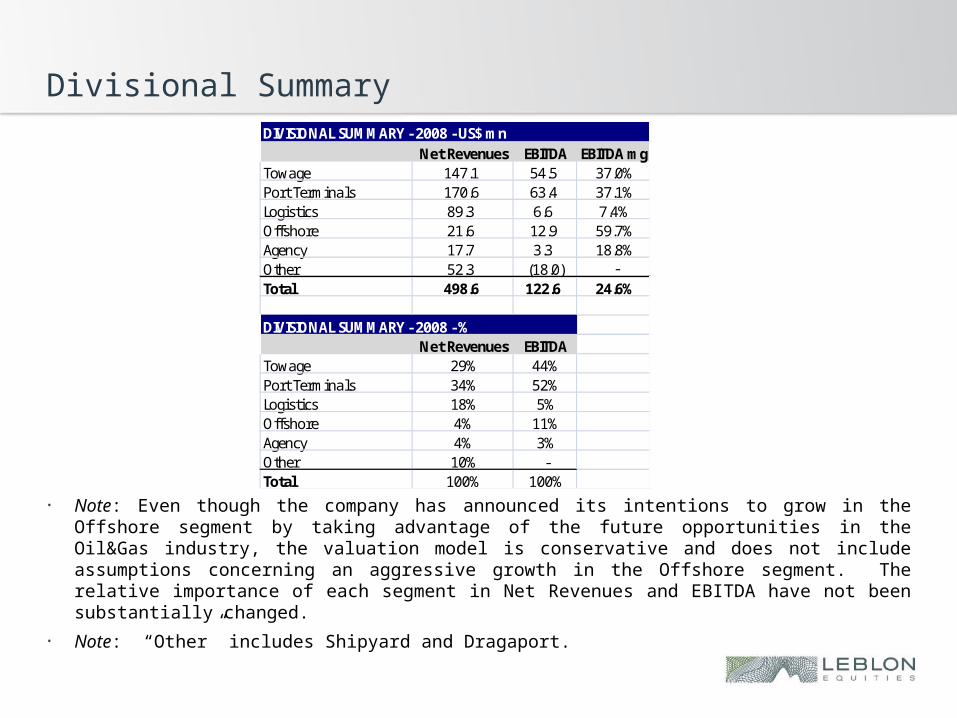
Divisional SummaryDIVISIONAL SUMMARY - 2008 - US$ mn
Net Revenues EBITDA EBITDA mgTowage 147.1 54.5 37.0%Port Terminals 170.6 63.4 37.1%Logistics 89.3 6.6 7.4%Offshore 21.6 12.9 59.7%Agency 17.7 3.3 18.8%Other 52.3 (18.0) -Total 498.6 122.6 24.6%
DIVISIONAL SUMMARY - 2008 - %Net Revenues EBITDA
Towage 29% 44%Port Terminals 34% 52%Logistics 18% 5%Offshore 4% 11%Agency 4% 3%Other 10% -Total 100% 100%
• Note: Even though the company has announced its intentions to grow in the Offshore segment by taking advantage of the future opportunities in the Oil&Gas industry, the valuation model is conservative and does not include assumptions concerning an aggressive growth in the Offshore segment. The relative importance of each segment in Net Revenues and EBITDA have not been substantially changed.
• Note: “Other” includes Shipyard and Dragaport.

Client Base and Synergy Among Segments
• The client base is diversified. Note, however, that the main clients are the shipowners (“armadores”).
• Currently, there are more than 7,000 active clients in their portfolio, many of whom make use of services from more than one business segment, thus confirming the synergy and complementary nature of the Company’s operations.
• The top 100 largest clients, for ex, are served by at least two business segments. Of these, 66 are served by 3 segments, and 28 of them by 4 service areas.
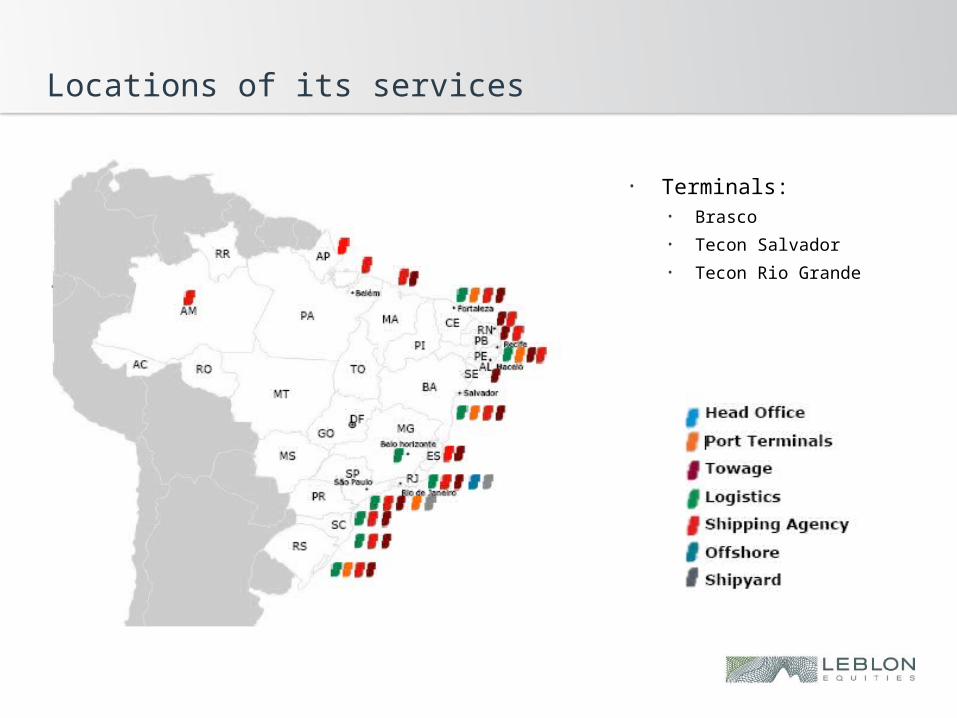
Locations of its services
• Terminals:• Brasco
• Tecon Salvador
• Tecon Rio Grande

Port Terminals Segment
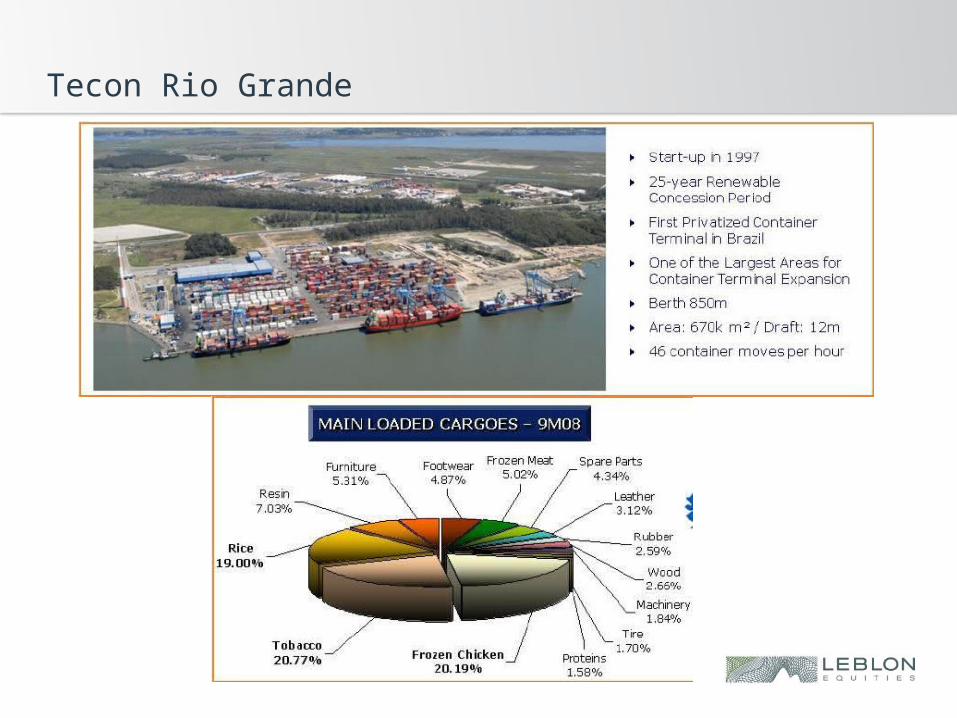
Tecon Rio Grande

Tecon Salvador
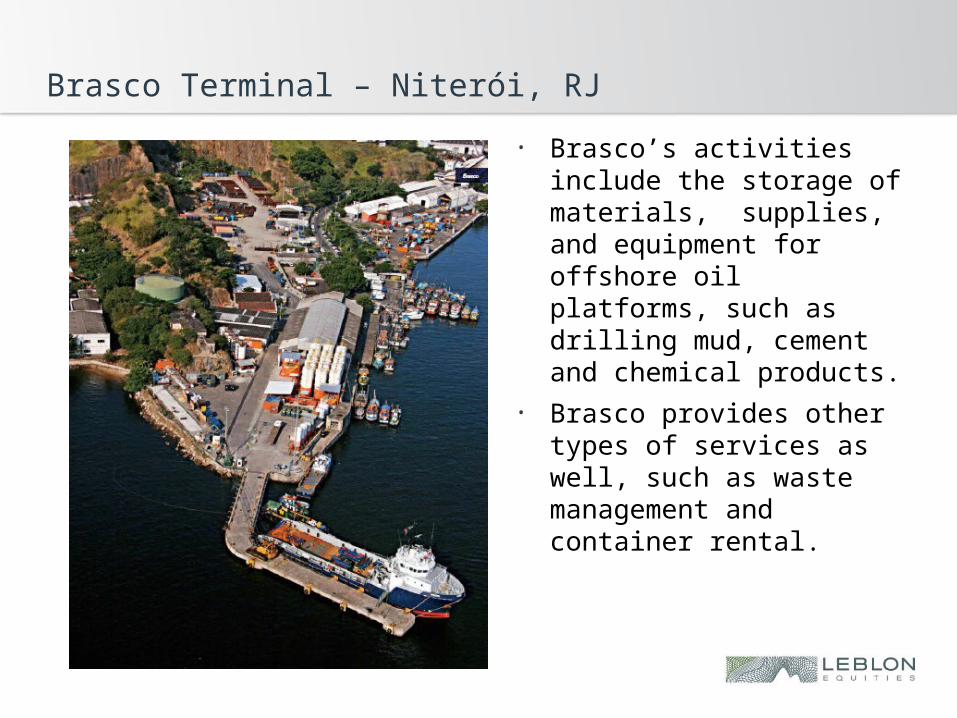
Brasco Terminal – Niterói, RJ
• Brasco’s activities include the storage of materials, supplies, and equipment for offshore oil platforms, such as drilling mud, cement and chemical products.
• Brasco provides other types of services as well, such as waste management and container rental.

Towage Segment
Services:
• Harbor Towage: Ship Maneuvering, Berthing, and Un-berthing
• Special Operations: Oceanic Towage, Support to Salvage, and Offloading
Main asset: Tugboats (31 w/ Azimuth propulsion)
Highlights:
• Largest Tugboat Fleet in South America, with 67 Vessels; 54% Market Share in Brazil
• Regulatory Protection Ensures Exclusivity to Brazilian Flag Vessels
• Friendly funding available from FMM (Fundo da Marinha Mercante)
Scale as a Barrier to Entry:
• Demand for tugboats is spread alongside the Brazilian coast, benefiting towage companies with nationwide coverage
• Ability to attend unscheduled demand (spot rates)

Offshore Segment
Main Service:• Support to Offshore Oil & Natural Gas Exploration and Production Platforms
Main Asset: Fleet of 5 PSVs
Highlights:• Friendly funding available from FMM• 2 PSVs to be delivered until 2010• 4 PSVs to be delivered to 3rd parties until 2011• US$ 100 million in annual investments over the next 5 years
Competitive Advantage from having its own Shipyard:• Control of construction costs, maintenance costs, and delivery schedule• Lack of Space Capacity in Brazilian Shipyards
“Bonus” not included in the valuation:• Petrobras Capex (2008E –2012E): US$ 112.4 bn. This would benefit Port
Terminals and Offshore segments.

Logistics and Shipping Agency
Logistics• Main Services: Transport, Handling, Storage, and Distribution• Asset light Business, providing Integrated Logistics Solutions
Shipping Agency• Main Services: Agent and Attorney-In-Fact to Ship-owners, Documentation
Services, Control of Containers, Equipment and Demurrage Control, Services to Vessels while in the Ports (Vessel Calls), and Sales Offices
• Asset Light Business, Intelligence center
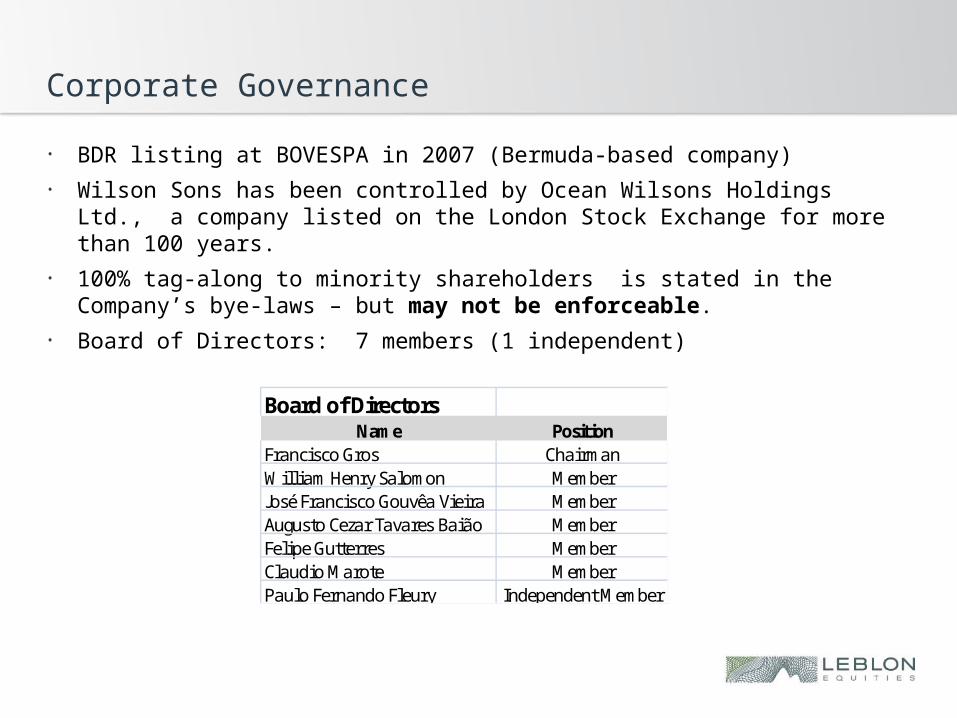
Corporate Governance
• BDR listing at BOVESPA in 2007 (Bermuda-based company)• Wilson Sons has been controlled by Ocean Wilsons Holdings Ltd., a
company listed on the London Stock Exchange for more than 100 years.
• 100% tag-along to minority shareholders is stated in the Company’s bye-laws – but may not be enforceable.
• Board of Directors: 7 members (1 independent)
Board of DirectorsName Position
Francisco Gros ChairmanWilliam Henry Salomon MemberJosé Francisco Gouvêa Vieira MemberAugusto Cezar Tavares Baião MemberFelipe Gutterres MemberClaudio Marote MemberPaulo Fernando Fleury Independent Member

WSON 11 – Stock Price

Debt

Valuation – Main Assumptions
(1) Towage
• Tug Mkt growing by 20% above GDP. WS's mkt share decreases over time by 0.5 p.p.
• 6 new tugs from 2008-2011; Slow migration to more efficient Azimuth (retire less efficient, conventional).
• Manuevers: guidance is for volume to fall by 5-10% in 2009, then growing close to GDP.
• Prices: guidance is for price increases over time by 5-10%; choice was more conservative 4%.
• WS's guidance is for Special Operations to reach 14% share in revenue in the future, but 7.5% is a better (and more conservative) assumption (following recent trend).
• EBITDA margin decreases by 1 p.p./year and stabilizes at 34%.
Valuation – Main Assumptions
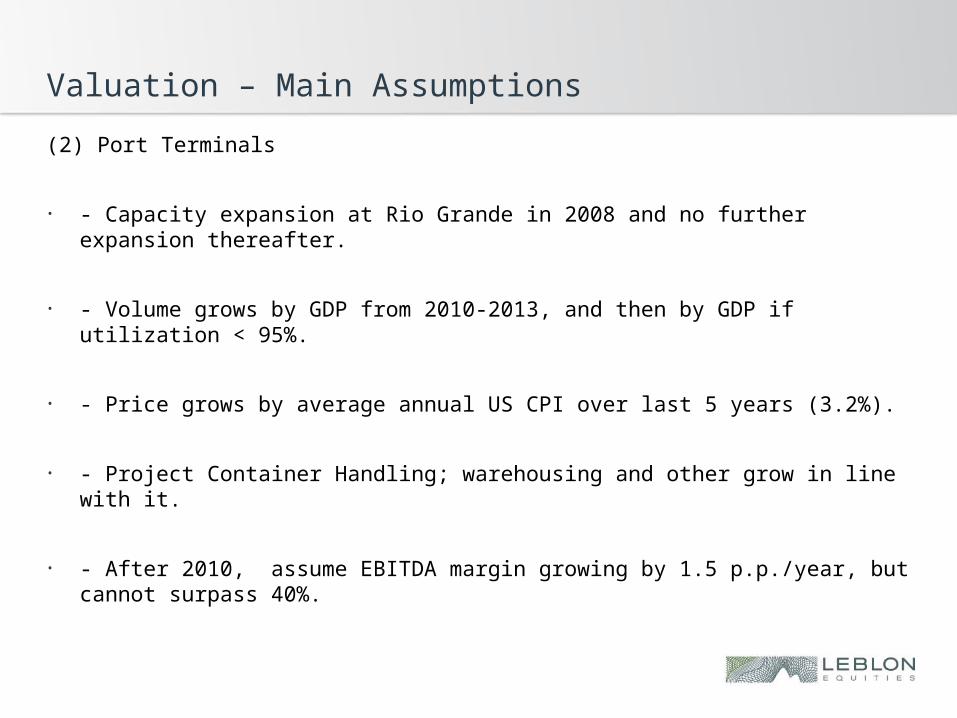
(2) Port Terminals
• - Capacity expansion at Rio Grande in 2008 and no further expansion thereafter.
• - Volume grows by GDP from 2010-2013, and then by GDP if utilization < 95%.
• - Price grows by average annual US CPI over last 5 years (3.2%).
• - Project Container Handling; warehousing and other grow in line with it.
• - After 2010, assume EBITDA margin growing by 1.5 p.p./year, but cannot surpass 40%.

Valuation – Main Assumptions
(3) Logistics
• Growth rates of 2xGDP for 2010/13, and GDP for 2014/18.
• EBITDA margin growing at 1 p.p./year, with cap of 12%
(4) Offshore
• # of PSVs as given by WS (6 in 2009, 8 in 2010, retire 1 in 2011, stabilize then).
• Price growing by average US CPI for last 5 years (3.2%).
• EBITDA margin at 44%.

Valuation – Main Assumptions
(5) Agency
• - Volume given by # of vessel calls (assuming 0% growth)
• - Tariff per vessel call growing at 2% p.a.
• - EBITDA margin at 16.5%
Notes: • Net Debt is US$ 15.8mn only. Net Debt/EBITDA = 0.13x. Mkt Cap: US$
493mn • FEX: R$2.15/US$ (Locked in range 2.15 - 2.40)• Tax Rate: 34% (following assumption by UBS) • Capex: Maintenance of US$30 mn/year; replacement of 37 conventional tugs
for azimuth tugs at a cost of US$ 8mn/each (period of 4 years). So, from 2010 to 2013 capex of US$ 104mn/year, then capex stabilizing at US$30 mn/year.
Valuation
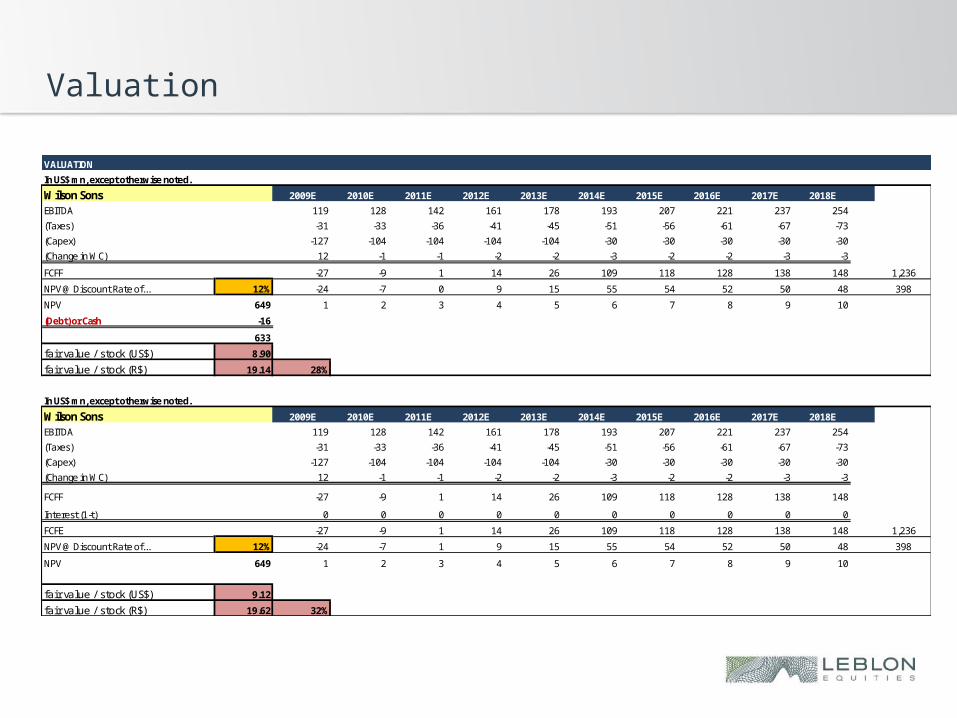
VALUATION
In US$ mn, except otherwise noted.
Wilson Sons 2009E 2010E 2011E 2012E 2013E 2014E 2015E 2016E 2017E 2018E
EBITDA 119 128 142 161 178 193 207 221 237 254
(Taxes) -31 -33 -36 -41 -45 -51 -56 -61 -67 -73
(Capex) -127 -104 -104 -104 -104 -30 -30 -30 -30 -30
(Change in WC) 12 -1 -1 -2 -2 -3 -2 -2 -3 -3
FCFF -27 -9 1 14 26 109 118 128 138 148 1,236
NPV @ Discount Rate of... 12% -24 -7 0 9 15 55 54 52 50 48 398
NPV 649 1 2 3 4 5 6 7 8 9 10
(Debt) or Cash -16
633
fa i r va lue / s tock (US$) 8.90
fa i r va lue / s tock (R$) 19.14 28%
In US$ mn, except otherwise noted.
Wilson Sons 2009E 2010E 2011E 2012E 2013E 2014E 2015E 2016E 2017E 2018E
EBITDA 119 128 142 161 178 193 207 221 237 254
(Taxes) -31 -33 -36 -41 -45 -51 -56 -61 -67 -73
(Capex) -127 -104 -104 -104 -104 -30 -30 -30 -30 -30
(Change in WC) 12 -1 -1 -2 -2 -3 -2 -2 -3 -3
FCFF -27 -9 1 14 26 109 118 128 138 148
Interest (1-t) 0 0 0 0 0 0 0 0 0 0
FCFE -27 -9 1 14 26 109 118 128 138 148 1,236
NPV @ Discount Rate of... 12% -24 -7 1 9 15 55 54 52 50 48 398
NPV 649 1 2 3 4 5 6 7 8 9 10
fa i r va lue / s tock (US$) 9.12
fa i r va lue / s tock (R$) 19.62 32%

Tugs at Work...
Tugboats Race!!!
Related Documents