Hydromax Training 45 Tutorials

Welcome message from author
This document is posted to help you gain knowledge. Please leave a comment to let me know what you think about it! Share it to your friends and learn new things together.
Transcript
Hydromax Training
45
Tutorials

Hydromax Training
46
Tutorial 1: Upright Hydrostatics Analysis In this first example, we will look at computing basic upright hydrostatics of a design imported from Maxsurf. 1. First close any design you may have open, then choose File | Open design from the file menu. Select “Hydromax Sample.msd” from the Sample Designs folder.
When prompted, select Read Sections from File and set precision to medium. Click OK to close the dialog box. If you change to the Design window (select from the menu either Window | Profile, Window | Plan, Window | Perspective or Window | Body Plan depending on which is the currently active view), you will be able to do a visual check of the design to ensure that the design has been loaded correctly. 2. The Upright Hydrostatics analysis option maybe chosen either from the menu (Analysis | Set Analysis Type | Upright Hydrostatics) or from the Analysis toolbar drop down menu:
3. To determine the Upright Hydrostatics of the vessel the program requires a (number of) draft value(s), a VCG in m above the baseline, as well as a trim angle. These values are set from the Analysis menu item. Choose Analysis | Trim and the Trim dialog box should appear:
Set the Fixed Trim value to 0m (it should actually be set at this by default). Click OK to close the Dialog box. Now lets set the draft readings. Select Analysis | Draft from the menu. In the Draft Range dialog box enter and Initial draft at amidships value of 1m and a Final draft at amidships value of 1.3m, also set the Number of drafts to 4 (ensuring that the draft readings are incremented by 0.1m) and leave the VCG above baseline value at the default value of 1.215m:
4. The final set up required before running the Upright Hydrostatics Analysis option is to tell the program which hydrostatic parameters you want displayed in the results window. To do this first ensure the results window is the current window (Window | Results) and select Display | Data Format from the menu. A dialog box will then appear with all the output options for the Upright Hydrostatic results.
Hydromax Training
47
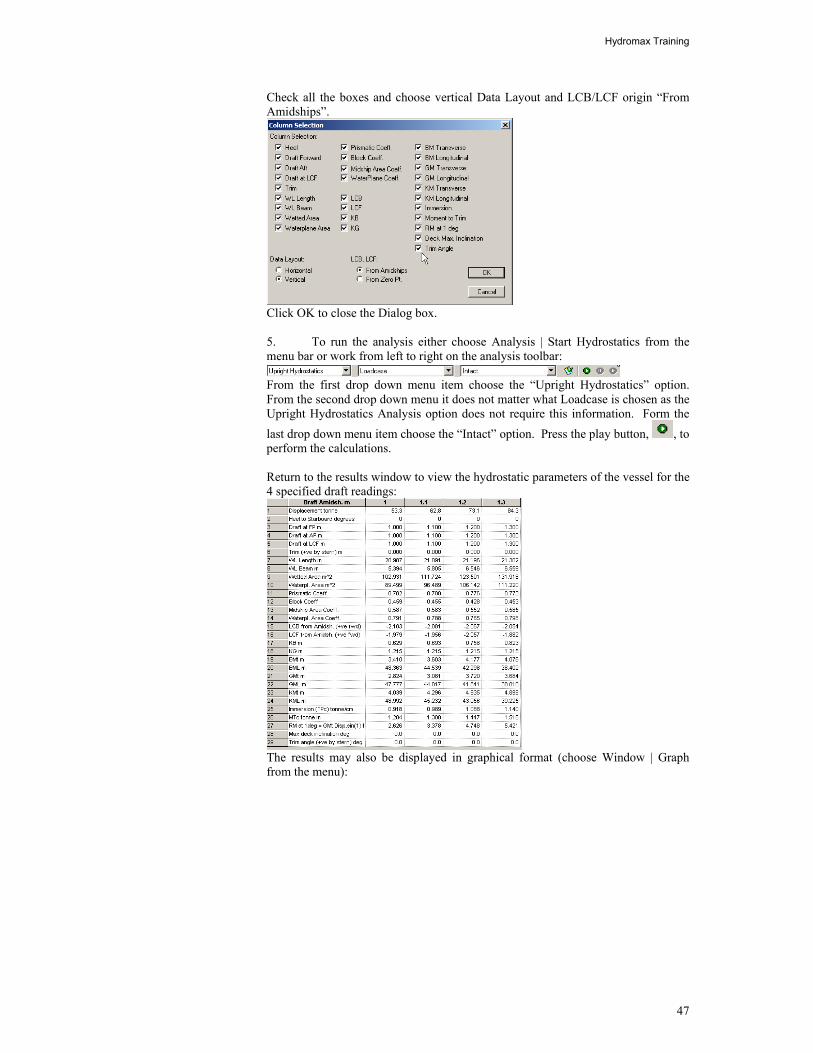
Check all the boxes and choose vertical Data Layout and LCB/LCF origin “From Amidships”.
Click OK to close the Dialog box. 5. To run the analysis either choose Analysis | Start Hydrostatics from the menu bar or work from left to right on the analysis toolbar:
From the first drop down menu item choose the “Upright Hydrostatics” option. From the second drop down menu it does not matter what Loadcase is chosen as the Upright Hydrostatics Analysis option does not require this information. Form the last drop down menu item choose the “Intact” option. Press the play button, , to perform the calculations. Return to the results window to view the hydrostatic parameters of the vessel for the 4 specified draft readings:
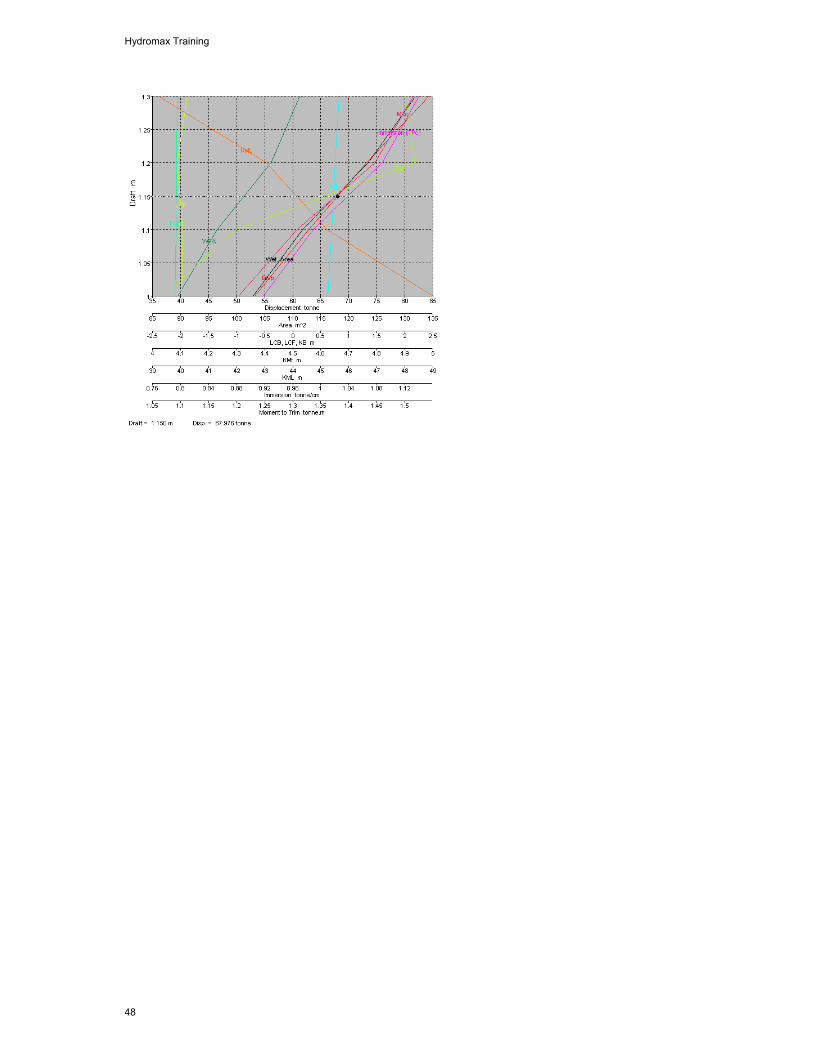
The results may also be displayed in graphical format (choose Window | Graph from the menu):
Hydromax Training
48
Hydromax Training
49
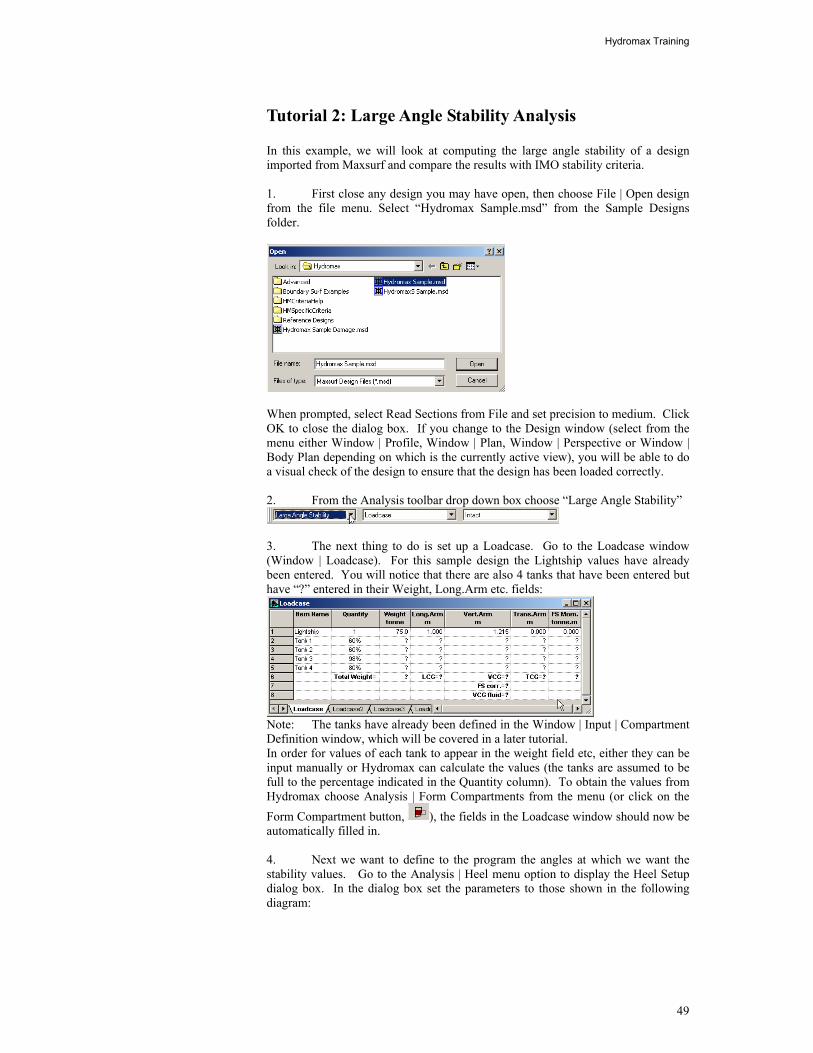
Tutorial 2: Large Angle Stability Analysis In this example, we will look at computing the large angle stability of a design imported from Maxsurf and compare the results with IMO stability criteria. 1. First close any design you may have open, then choose File | Open design from the file menu. Select “Hydromax Sample.msd” from the Sample Designs folder.
When prompted, select Read Sections from File and set precision to medium. Click OK to close the dialog box. If you change to the Design window (select from the menu either Window | Profile, Window | Plan, Window | Perspective or Window | Body Plan depending on which is the currently active view), you will be able to do a visual check of the design to ensure that the design has been loaded correctly. 2. From the Analysis toolbar drop down box choose “Large Angle Stability”
3. The next thing to do is set up a Loadcase. Go to the Loadcase window (Window | Loadcase). For this sample design the Lightship values have already been entered. You will notice that there are also 4 tanks that have been entered but have “?” entered in their Weight, Long.Arm etc. fields:
Note: The tanks have already been defined in the Window | Input | Compartment Definition window, which will be covered in a later tutorial. In order for values of each tank to appear in the weight field etc, either they can be input manually or Hydromax can calculate the values (the tanks are assumed to be full to the percentage indicated in the Quantity column). To obtain the values from Hydromax choose Analysis | Form Compartments from the menu (or click on the Form Compartment button, ), the fields in the Loadcase window should now be automatically filled in. 4. Next we want to define to the program the angles at which we want the stability values. Go to the Analysis | Heel menu option to display the Heel Setup dialog box. In the dialog box set the parameters to those shown in the following diagram:
Hydromax Training
50
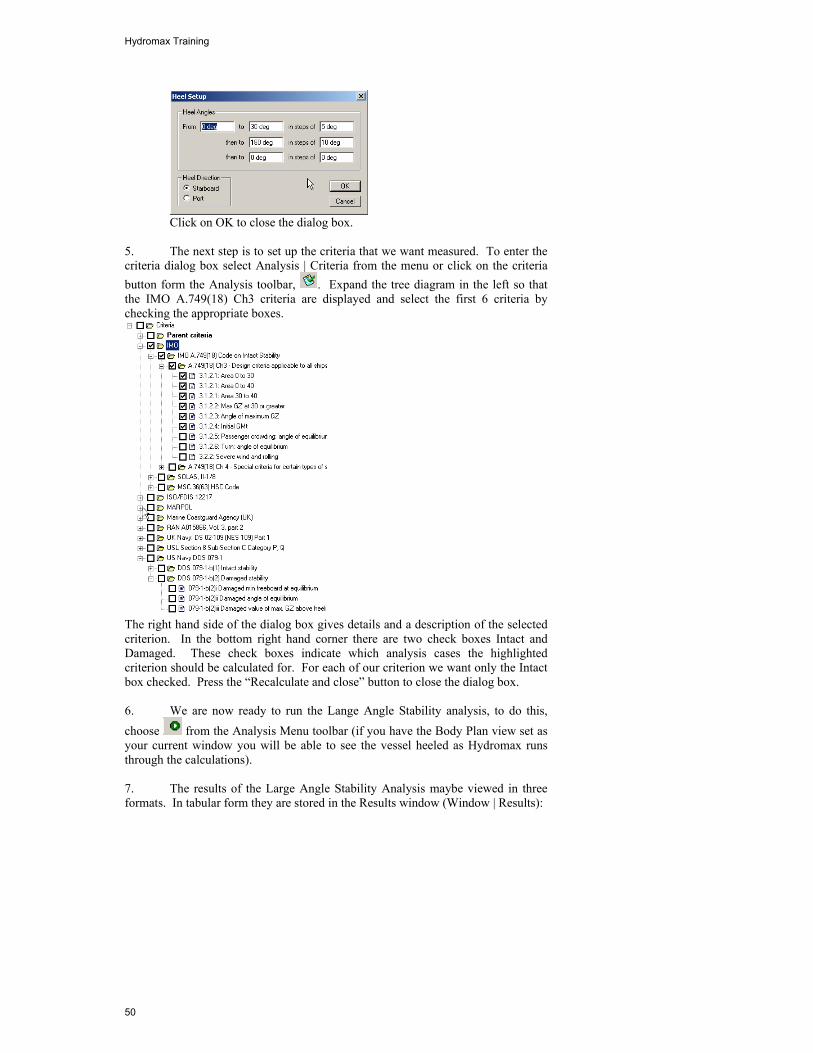
Click on OK to close the dialog box. 5. The next step is to set up the criteria that we want measured. To enter the criteria dialog box select Analysis | Criteria from the menu or click on the criteria button form the Analysis toolbar, . Expand the tree diagram in the left so that the IMO A.749(18) Ch3 criteria are displayed and select the first 6 criteria by checking the appropriate boxes.
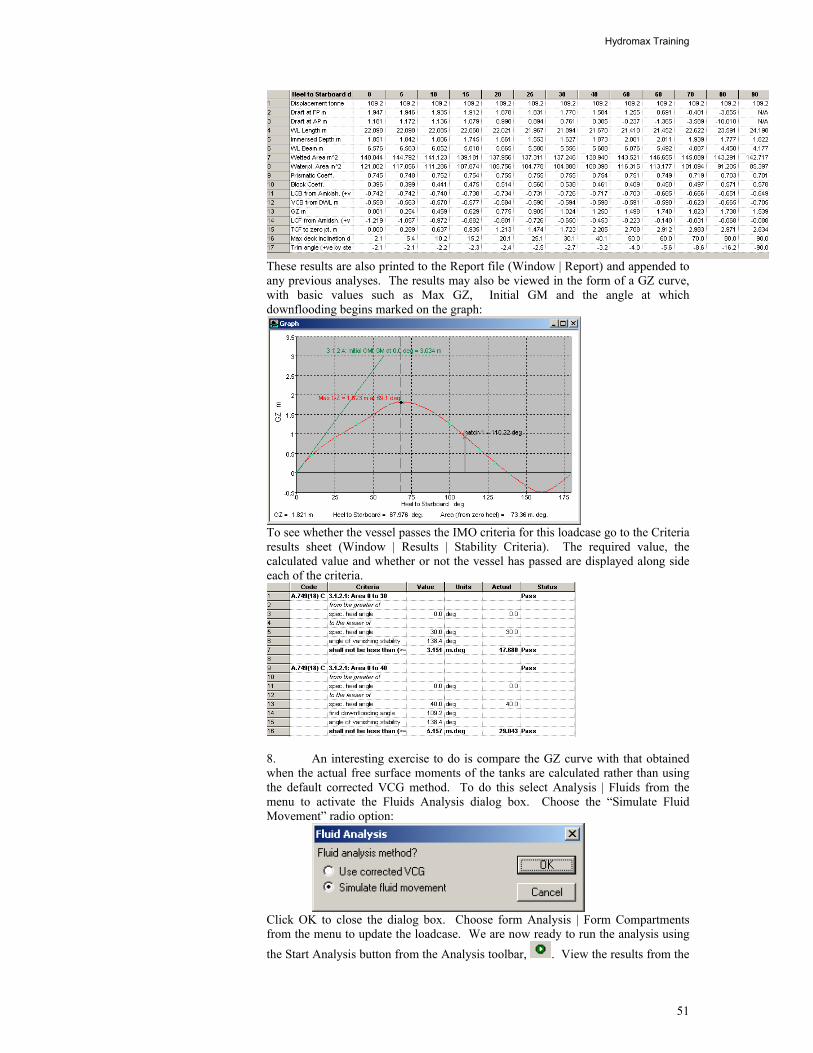
The right hand side of the dialog box gives details and a description of the selected criterion. In the bottom right hand corner there are two check boxes Intact and Damaged. These check boxes indicate which analysis cases the highlighted criterion should be calculated for. For each of our criterion we want only the Intact box checked. Press the “Recalculate and close” button to close the dialog box. 6. We are now ready to run the Lange Angle Stability analysis, to do this, choose from the Analysis Menu toolbar (if you have the Body Plan view set as your current window you will be able to see the vessel heeled as Hydromax runs through the calculations). 7. The results of the Large Angle Stability Analysis maybe viewed in three formats. In tabular form they are stored in the Results window (Window | Results):
Hydromax Training
51
These results are also printed to the Report file (Window | Report) and appended to any previous analyses. The results may also be viewed in the form of a GZ curve, with basic values such as Max GZ, Initial GM and the angle at which downflooding begins marked on the graph:
To see whether the vessel passes the IMO criteria for this loadcase go to the Criteria results sheet (Window | Results | Stability Criteria). The required value, the calculated value and whether or not the vessel has passed are displayed along side each of the criteria.
8. An interesting exercise to do is compare the GZ curve with that obtained when the actual free surface moments of the tanks are calculated rather than using the default corrected VCG method. To do this select Analysis | Fluids from the menu to activate the Fluids Analysis dialog box. Choose the “Simulate Fluid Movement” radio option:
Click OK to close the dialog box. Choose form Analysis | Form Compartments from the menu to update the loadcase. We are now ready to run the analysis using the Start Analysis button from the Analysis toolbar, . View the results from the

Hydromax Training
52
graph window. Below is a comparison of the GZ curves obtained using the two different methods.
-1
-0.5
0
0.5
1
1.5
2
2.5
0 50 100 150
Heel angle (deg)
GZ
(m)
Simulated FluidMovementMethodCorrected VCGmethod
It is interesting that the corrected VCG method adopted by most classification societies well under predicts the actual stability of the vessel with free surfaces. When using the corrected VCG method the tank capacities and free surface moments are calculated for the upright hull (zero trim and zero heel). The effective rise in VCG due to the tanks' free surface is calculated by summing the maximum free surface moment of all the tanks filled less than 98% capacity and dividing by the total vessel displacement. This method should be used when compiling a stability booklet for a design, as it corresponds with the traditional approach used by naval architects and classification societies worldwide. It is reasonably accurate at low angles of heel and trim. Use “Simulate Fluid Movement” when a faithful simulation of the movement of the centre of gravity of the fluid in each tank is required. Every tank is rotated to the heel and trim angle being analysed. Hydromax iterates to find the fluid level for the rotated tank at the specified capacity. The new centre of gravity is calculated for each tank and used in the analysis. The new LCG, VCG and TCG are calculated for the whole design and used in the calculation of GZ, KG, and GM. This approach is used when the stability of a vessel is being investigated and the closest possible simulation of the hull's behaviour is required. It is particularly useful at high angles of heel or trim, or with tanks whose heeled water plane area may be significantly different from the upright case (i.e. tall narrow tanks, or wide shallow tanks). The penalty of using this approach is that the calculation time is longer, however the results are significantly more accurate.
Hydromax Training
53
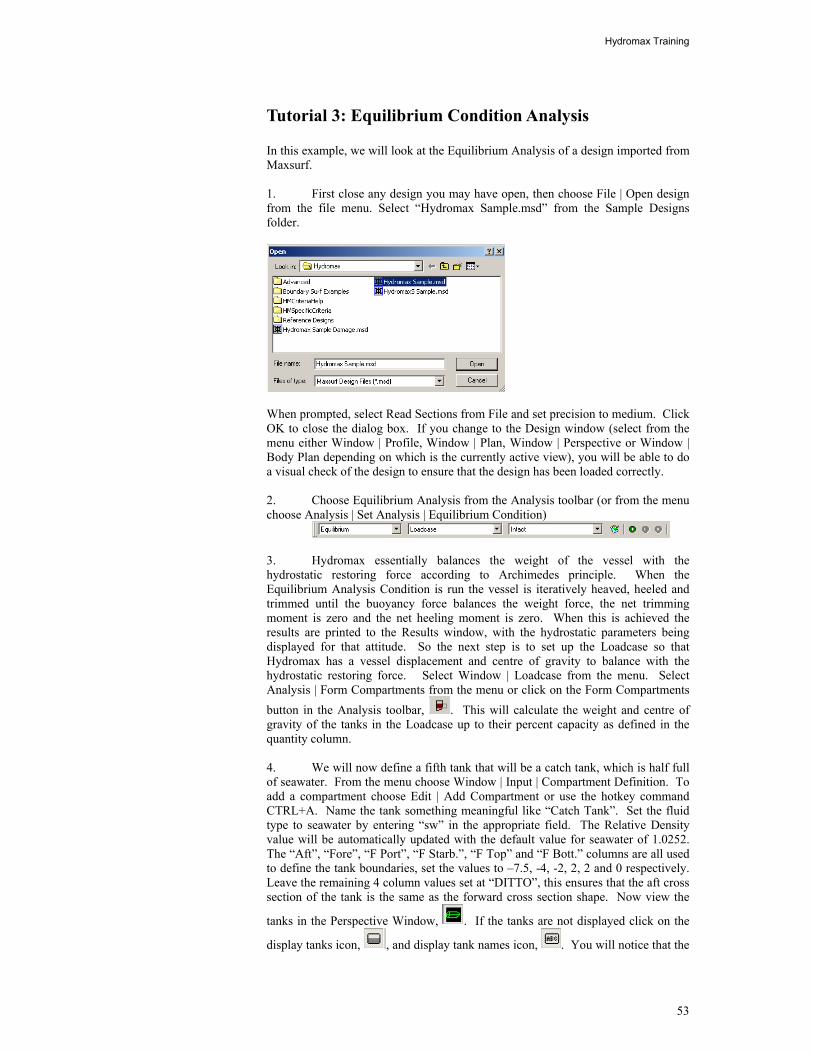
Tutorial 3: Equilibrium Condition Analysis In this example, we will look at the Equilibrium Analysis of a design imported from Maxsurf. 1. First close any design you may have open, then choose File | Open design from the file menu. Select “Hydromax Sample.msd” from the Sample Designs folder.
When prompted, select Read Sections from File and set precision to medium. Click OK to close the dialog box. If you change to the Design window (select from the menu either Window | Profile, Window | Plan, Window | Perspective or Window | Body Plan depending on which is the currently active view), you will be able to do a visual check of the design to ensure that the design has been loaded correctly. 2. Choose Equilibrium Analysis from the Analysis toolbar (or from the menu choose Analysis | Set Analysis | Equilibrium Condition) 3. Hydromax essentially balances the weight of the vessel with the hydrostatic restoring force according to Archimedes principle. When the Equilibrium Analysis Condition is run the vessel is iteratively heaved, heeled and trimmed until the buoyancy force balances the weight force, the net trimming moment is zero and the net heeling moment is zero. When this is achieved the results are printed to the Results window, with the hydrostatic parameters being displayed for that attitude. So the next step is to set up the Loadcase so that Hydromax has a vessel displacement and centre of gravity to balance with the hydrostatic restoring force. Select Window | Loadcase from the menu. Select Analysis | Form Compartments from the menu or click on the Form Compartments button in the Analysis toolbar, . This will calculate the weight and centre of gravity of the tanks in the Loadcase up to their percent capacity as defined in the quantity column. 4. We will now define a fifth tank that will be a catch tank, which is half full of seawater. From the menu choose Window | Input | Compartment Definition. To add a compartment choose Edit | Add Compartment or use the hotkey command CTRL+A. Name the tank something meaningful like “Catch Tank”. Set the fluid type to seawater by entering “sw” in the appropriate field. The Relative Density value will be automatically updated with the default value for seawater of 1.0252. The “Aft”, “Fore”, “F Port”, “F Starb.”, “F Top” and “F Bott.” columns are all used to define the tank boundaries, set the values to –7.5, -4, -2, 2, 2 and 0 respectively. Leave the remaining 4 column values set at “DITTO”, this ensures that the aft cross section of the tank is the same as the forward cross section shape. Now view the
tanks in the Perspective Window, . If the tanks are not displayed click on the
display tanks icon, , and display tank names icon, . You will notice that the
Hydromax Training
54
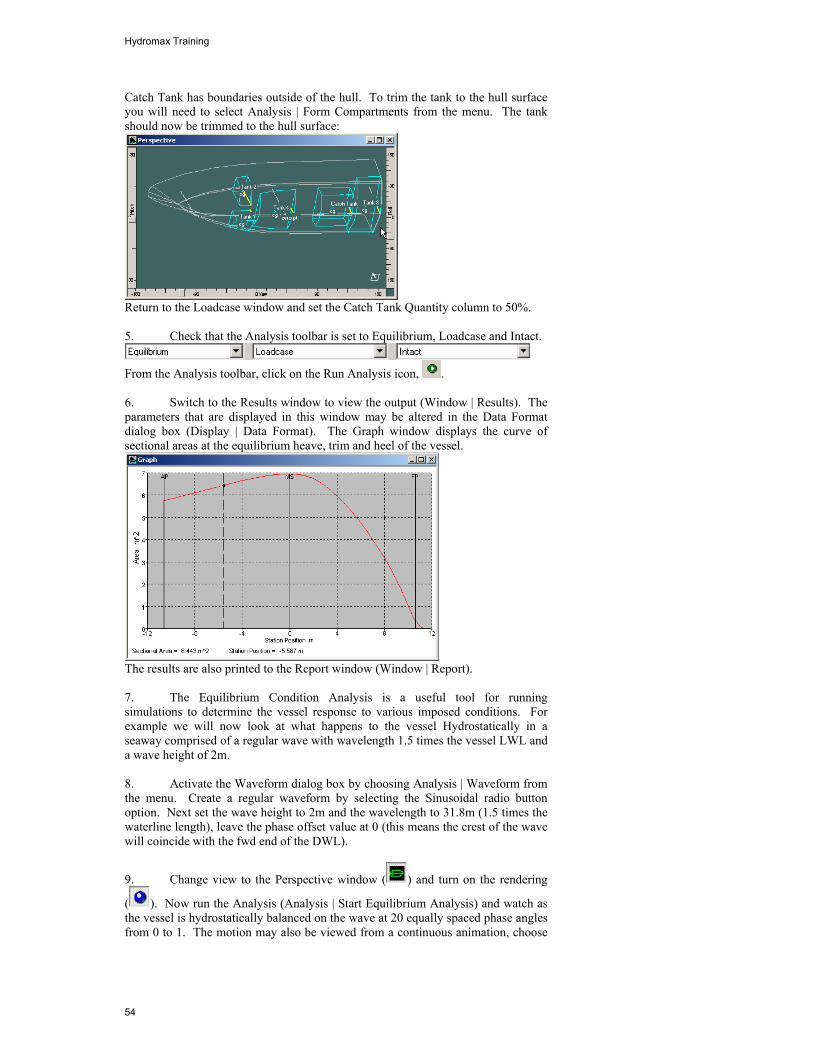
Catch Tank has boundaries outside of the hull. To trim the tank to the hull surface you will need to select Analysis | Form Compartments from the menu. The tank should now be trimmed to the hull surface:
Return to the Loadcase window and set the Catch Tank Quantity column to 50%. 5. Check that the Analysis toolbar is set to Equilibrium, Loadcase and Intact.
From the Analysis toolbar, click on the Run Analysis icon, . 6. Switch to the Results window to view the output (Window | Results). The parameters that are displayed in this window may be altered in the Data Format dialog box (Display | Data Format). The Graph window displays the curve of sectional areas at the equilibrium heave, trim and heel of the vessel.
The results are also printed to the Report window (Window | Report). 7. The Equilibrium Condition Analysis is a useful tool for running simulations to determine the vessel response to various imposed conditions. For example we will now look at what happens to the vessel Hydrostatically in a seaway comprised of a regular wave with wavelength 1.5 times the vessel LWL and a wave height of 2m. 8. Activate the Waveform dialog box by choosing Analysis | Waveform from the menu. Create a regular waveform by selecting the Sinusoidal radio button option. Next set the wave height to 2m and the wavelength to 31.8m (1.5 times the waterline length), leave the phase offset value at 0 (this means the crest of the wave will coincide with the fwd end of the DWL).
9. Change view to the Perspective window ( ) and turn on the rendering
( ). Now run the Analysis (Analysis | Start Equilibrium Analysis) and watch as the vessel is hydrostatically balanced on the wave at 20 equally spaced phase angles from 0 to 1. The motion may also be viewed from a continuous animation, choose

Hydromax Training
55
Display | Animate from the menu. If the animation is running too fast it may be slowed down by pressing the – (negative) key on your keyboard.

Hydromax Training
56
Tutorial 4: Specified Condition Analysis In this example, we will look at Specified Condition analysis of a design imported from Maxsurf. The Specified Condition Analysis calculates the vessel hydrostatics for a given displacement and centre of gravity, or fore and aft drafts, or heave and trim. We will also run this analysis for a vessel operating in fresh water. 1. First close any design you may have open, then choose File | Open design from the file menu. Select “Hydromax Sample.msd” from the Sample Designs folder.
When prompted, select Read Sections from File and set precision to medium. Click OK to close the dialog box. If you change to the Design window (select from the menu either Window | Profile, Window | Plan, Window | Perspective or Window | Body Plan depending on which is the currently active view), you will be able to do a visual check of the design to ensure that the design has been loaded correctly. 2. Choose Specified Condition Analysis from the Analysis toolbar (or from the menu choose Analysis | Specified Condition). To run the analysis in Fresh Water (i.e. water with a relative density value of 1.0), we need to enter the Densities dialog (Analysis | Density).
When an Analysis is run Hydromax always performs the calculations using the density in the Sea Water row (row number 1). Therefore to run the calculations in fresh water of density 1000 kg/m3 we need to change the relative density in row number 1 to 1.0. Click OK to close the dialog box. 3. In the Specified Conditions Dialog box three sets of variables are provided: Heel, Trim and Immersion. When defining a condition, one choice must be made from each of these groups. There are 10 combinations of parameters to define a condition (which are outlined below):
• Fixed Heel, Fixed Trim and Displacement
Hydromax Training
57
• Fixed Heel, Fixed Trim and Draft Amidships • Fixed Heel, Fixed Trim and Draft Fwd and Aft • Fixed Heel, Free to Trim and Displacement • Fixed Heel, Free to Trim and Draft Amidships • Free to Heel, Fixed Trim and Displacement • Free to Heel, Fixed Trim and Draft Amidships • Free to Heel, Fixed Trim and Draft Fwd and Aft • Free to Heel, Free to Trim and Displacement • Free to Heel, Free to Trim and Draft Amidships
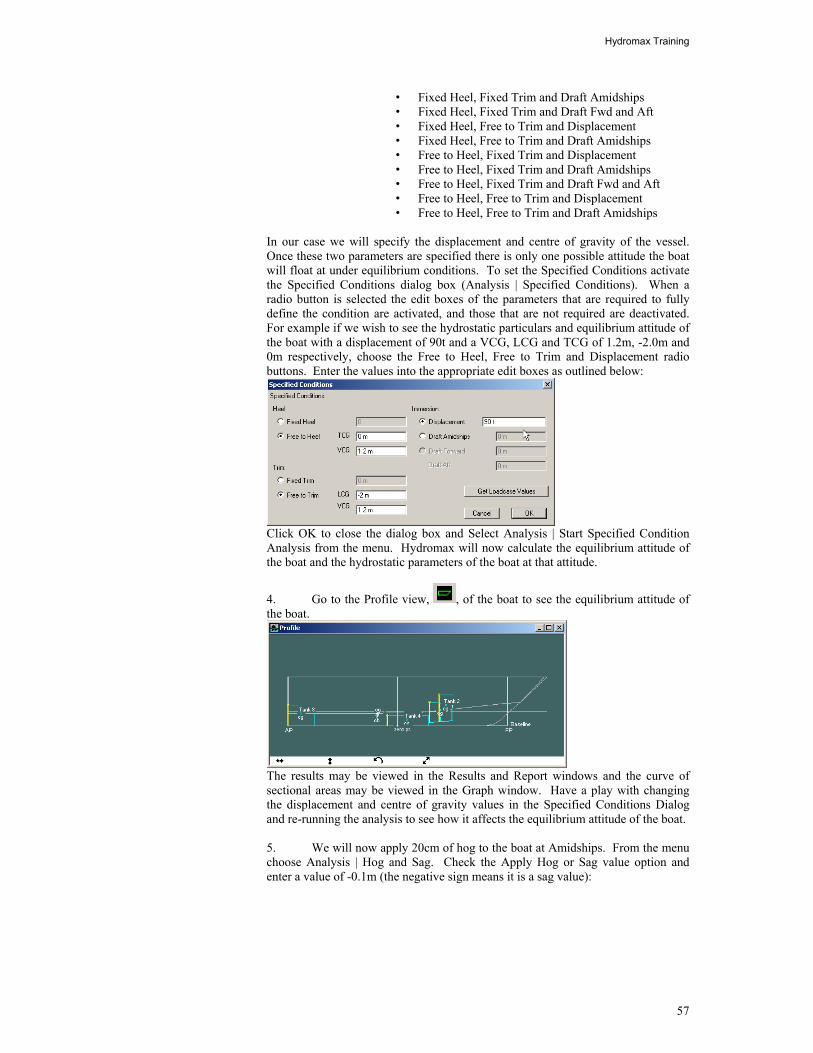
In our case we will specify the displacement and centre of gravity of the vessel. Once these two parameters are specified there is only one possible attitude the boat will float at under equilibrium conditions. To set the Specified Conditions activate the Specified Conditions dialog box (Analysis | Specified Conditions). When a radio button is selected the edit boxes of the parameters that are required to fully define the condition are activated, and those that are not required are deactivated. For example if we wish to see the hydrostatic particulars and equilibrium attitude of the boat with a displacement of 90t and a VCG, LCG and TCG of 1.2m, -2.0m and 0m respectively, choose the Free to Heel, Free to Trim and Displacement radio buttons. Enter the values into the appropriate edit boxes as outlined below:
Click OK to close the dialog box and Select Analysis | Start Specified Condition Analysis from the menu. Hydromax will now calculate the equilibrium attitude of the boat and the hydrostatic parameters of the boat at that attitude.
4. Go to the Profile view, , of the boat to see the equilibrium attitude of the boat.
The results may be viewed in the Results and Report windows and the curve of sectional areas may be viewed in the Graph window. Have a play with changing the displacement and centre of gravity values in the Specified Conditions Dialog and re-running the analysis to see how it affects the equilibrium attitude of the boat. 5. We will now apply 20cm of hog to the boat at Amidships. From the menu choose Analysis | Hog and Sag. Check the Apply Hog or Sag value option and enter a value of -0.1m (the negative sign means it is a sag value):

Hydromax Training
58
Click OK to close the dialog box. 6. Now returning to the Report Window (Window | Report) we can compare the results with and without the 10cm of sag at amidships. Note: every time that an Analysis is run the results are automatically printed to the output window.

Hydromax Training
59
Tutorial 5: KN Calculations Analysis In this example, we will look at the KN Calculations analysis. The KN Calculations Analysis calculates the KN values for a range of displacements and Heel Angles. KN data is useful for assessing the stability of a vessel in the early stages on design when the VCG of the vessel is not known. It is also a useful measure of stability for vessels such as cargo ships where the VCG can vary significantly depending on the loading for a particular voyage. 1. First close any design you may have open, then choose File | Open design from the file menu. Select “Hydromax Sample.msd” from the Sample Designs folder.
When prompted, select Read Sections from File and set precision to medium. Click OK to close the dialog box. If you change to the Design window (select from the menu either Window | Profile, Window | Plan, Window | Perspective or Window | Body Plan depending on which is the currently active view), you will be able to do a visual check of the design to ensure that the design has been loaded correctly. 2. Choose KN Values Analysis from the Analysis toolbar.
3. We now need to set up the conditions for which we require the KN values. Firstly go to the Heel Setup dialog box. We want to go from 0o
to 120o in steps of 10o, heeling in a starboard direction.
Click on OK to close the dialog box. 4. Next open the Trim Setup Dialog box (Analysis | Trim). Make sure the Fixed Trim option is chosen and set to a value of 0m.
Click on OK to close the dialog box. 5. Finally we want to set the range of displacements for which we want to calculate the KN values. Choose Analysis | Displacement to activate the
Hydromax Training
60
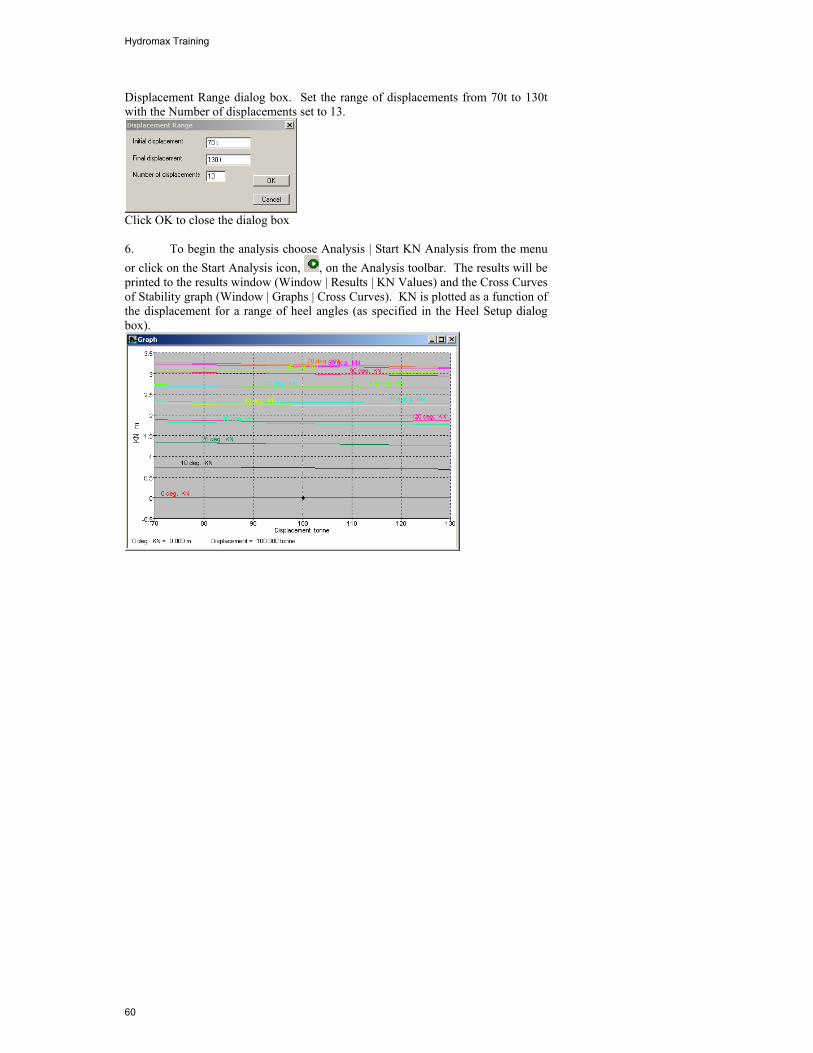
Displacement Range dialog box. Set the range of displacements from 70t to 130t with the Number of displacements set to 13.
Click OK to close the dialog box 6. To begin the analysis choose Analysis | Start KN Analysis from the menu or click on the Start Analysis icon, , on the Analysis toolbar. The results will be printed to the results window (Window | Results | KN Values) and the Cross Curves of Stability graph (Window | Graphs | Cross Curves). KN is plotted as a function of the displacement for a range of heel angles (as specified in the Heel Setup dialog box).
Hydromax Training
61
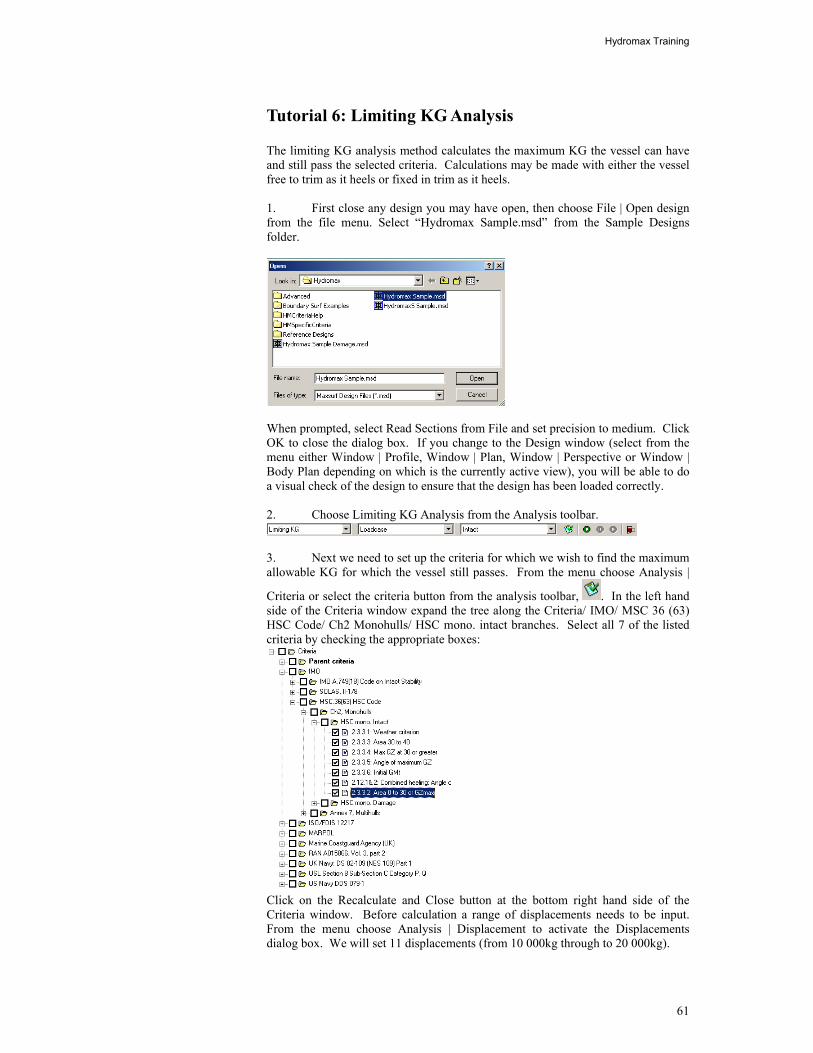
Tutorial 6: Limiting KG Analysis The limiting KG analysis method calculates the maximum KG the vessel can have and still pass the selected criteria. Calculations may be made with either the vessel free to trim as it heels or fixed in trim as it heels. 1. First close any design you may have open, then choose File | Open design from the file menu. Select “Hydromax Sample.msd” from the Sample Designs folder.
When prompted, select Read Sections from File and set precision to medium. Click OK to close the dialog box. If you change to the Design window (select from the menu either Window | Profile, Window | Plan, Window | Perspective or Window | Body Plan depending on which is the currently active view), you will be able to do a visual check of the design to ensure that the design has been loaded correctly. 2. Choose Limiting KG Analysis from the Analysis toolbar.
3. Next we need to set up the criteria for which we wish to find the maximum allowable KG for which the vessel still passes. From the menu choose Analysis |
Criteria or select the criteria button from the analysis toolbar, . In the left hand side of the Criteria window expand the tree along the Criteria/ IMO/ MSC 36 (63) HSC Code/ Ch2 Monohulls/ HSC mono. intact branches. Select all 7 of the listed criteria by checking the appropriate boxes:
Click on the Recalculate and Close button at the bottom right hand side of the Criteria window. Before calculation a range of displacements needs to be input. From the menu choose Analysis | Displacement to activate the Displacements dialog box. We will set 11 displacements (from 10 000kg through to 20 000kg).
Hydromax Training
62
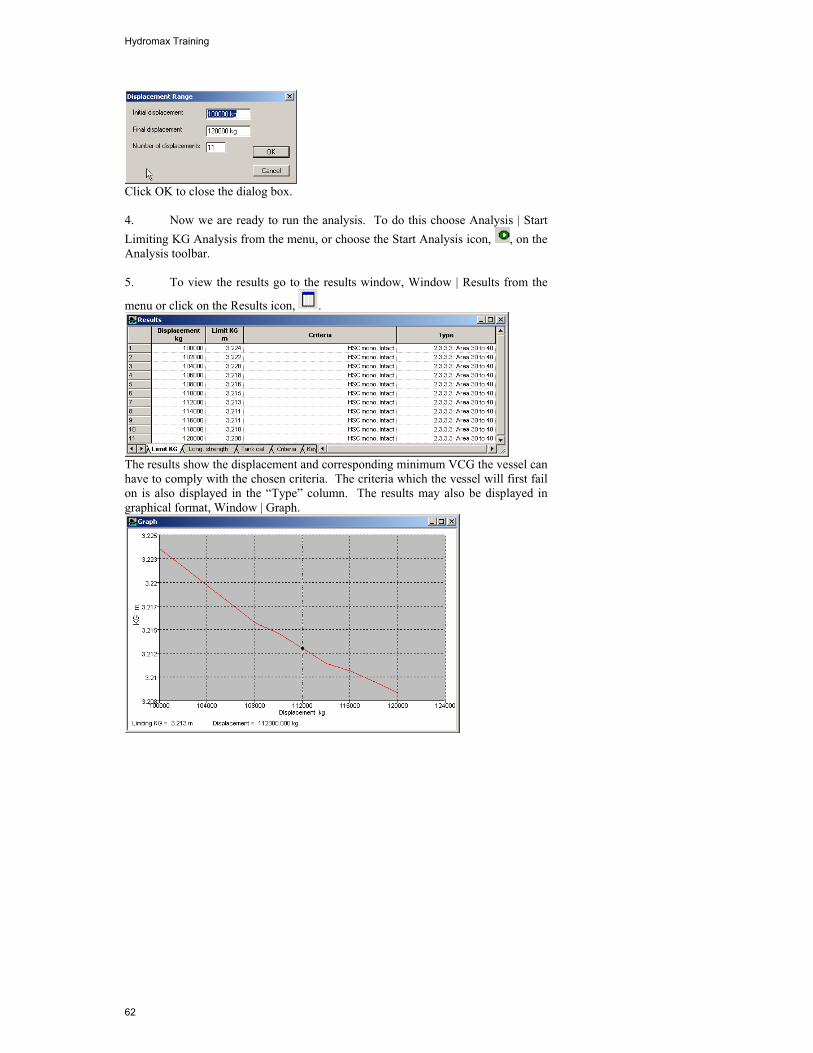
Click OK to close the dialog box. 4. Now we are ready to run the analysis. To do this choose Analysis | Start Limiting KG Analysis from the menu, or choose the Start Analysis icon, , on the Analysis toolbar. 5. To view the results go to the results window, Window | Results from the
menu or click on the Results icon, .
The results show the displacement and corresponding minimum VCG the vessel can have to comply with the chosen criteria. The criteria which the vessel will first fail on is also displayed in the “Type” column. The results may also be displayed in graphical format, Window | Graph.
Hydromax Training
63
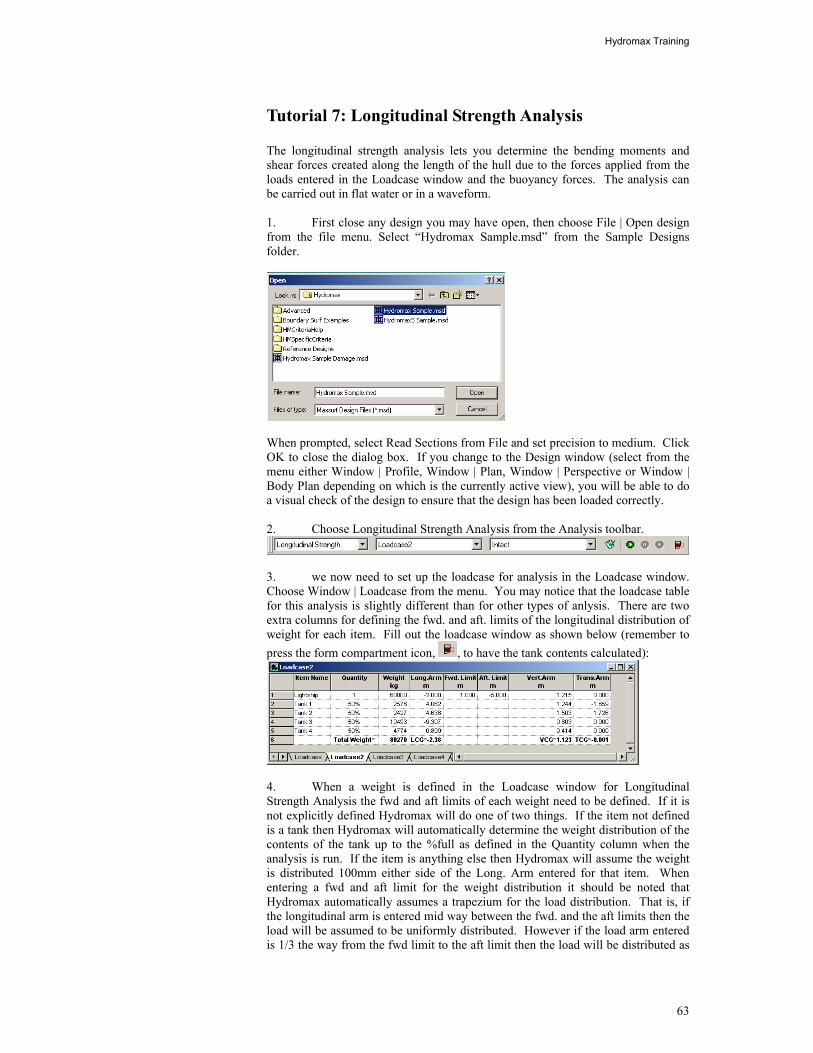
Tutorial 7: Longitudinal Strength Analysis The longitudinal strength analysis lets you determine the bending moments and shear forces created along the length of the hull due to the forces applied from the loads entered in the Loadcase window and the buoyancy forces. The analysis can be carried out in flat water or in a waveform. 1. First close any design you may have open, then choose File | Open design from the file menu. Select “Hydromax Sample.msd” from the Sample Designs folder.
When prompted, select Read Sections from File and set precision to medium. Click OK to close the dialog box. If you change to the Design window (select from the menu either Window | Profile, Window | Plan, Window | Perspective or Window | Body Plan depending on which is the currently active view), you will be able to do a visual check of the design to ensure that the design has been loaded correctly. 2. Choose Longitudinal Strength Analysis from the Analysis toolbar.
3. we now need to set up the loadcase for analysis in the Loadcase window. Choose Window | Loadcase from the menu. You may notice that the loadcase table for this analysis is slightly different than for other types of anlysis. There are two extra columns for defining the fwd. and aft. limits of the longitudinal distribution of weight for each item. Fill out the loadcase window as shown below (remember to press the form compartment icon, , to have the tank contents calculated):
4. When a weight is defined in the Loadcase window for Longitudinal Strength Analysis the fwd and aft limits of each weight need to be defined. If it is not explicitly defined Hydromax will do one of two things. If the item not defined is a tank then Hydromax will automatically determine the weight distribution of the contents of the tank up to the %full as defined in the Quantity column when the analysis is run. If the item is anything else then Hydromax will assume the weight is distributed 100mm either side of the Long. Arm entered for that item. When entering a fwd and aft limit for the weight distribution it should be noted that Hydromax automatically assumes a trapezium for the load distribution. That is, if the longitudinal arm is entered mid way between the fwd. and the aft limits then the load will be assumed to be uniformly distributed. However if the load arm entered is 1/3 the way from the fwd limit to the aft limit then the load will be distributed as
Hydromax Training
64
a triangle from maximum at the fwd. limit to 0 at the aft limit. This means that the longitudinal arm should always lie within the middle third of the limits if negative loads are to be avoided.
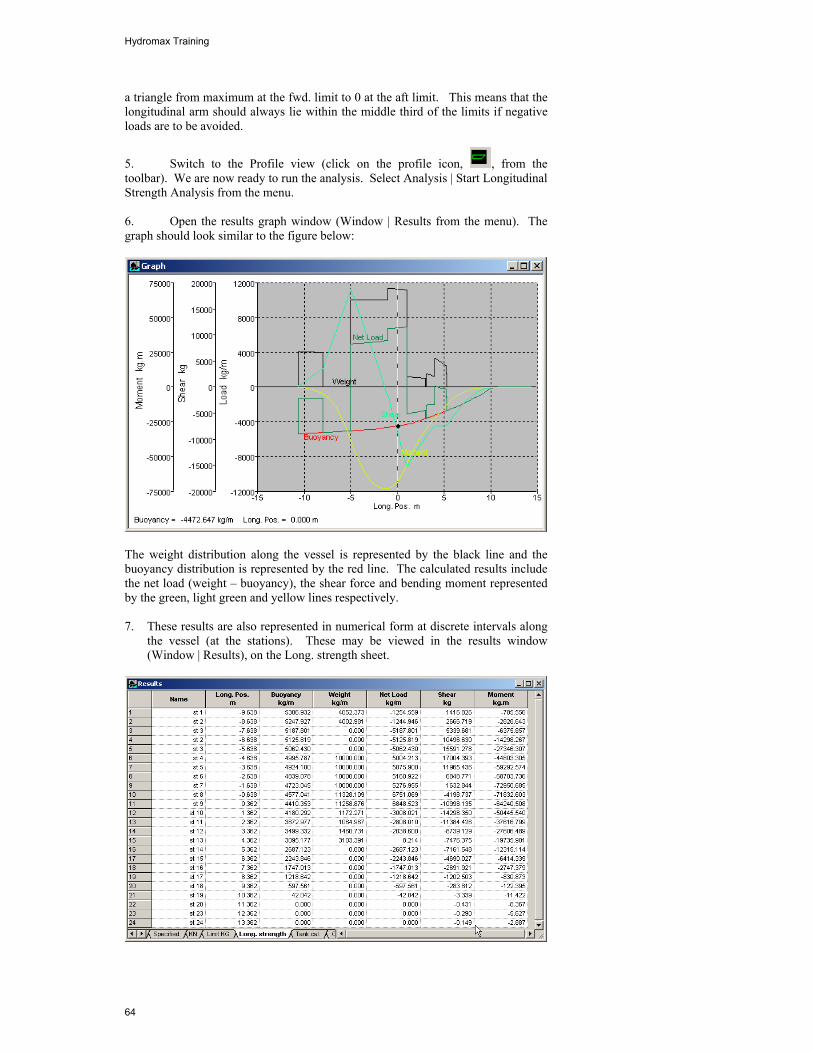
5. Switch to the Profile view (click on the profile icon, , from the toolbar). We are now ready to run the analysis. Select Analysis | Start Longitudinal Strength Analysis from the menu. 6. Open the results graph window (Window | Results from the menu). The graph should look similar to the figure below:
The weight distribution along the vessel is represented by the black line and the buoyancy distribution is represented by the red line. The calculated results include the net load (weight – buoyancy), the shear force and bending moment represented by the green, light green and yellow lines respectively. 7. These results are also represented in numerical form at discrete intervals along
the vessel (at the stations). These may be viewed in the results window (Window | Results), on the Long. strength sheet.
Hydromax Training
65
Tutorial 8: Tank Calibrations In this tutorial we will calibrate the tanks for capacity, centre of gravity and free surface moment. The fluid densities and tank permeability’s may be varied arbitrarily. Each tank that has been calibrated has a table of tank capacities available through the Results window, and a separate graph of its volumetric properties available through the Graph window. 1. First close any design you may have open, then choose File | Open design from the file menu. Select “Hydromax Sample.msd” from the Sample Designs folder.
When prompted, select Read Sections from File and set precision to medium. Click OK to close the dialog box. If you change to the Design window (select from the menu either Window | Profile, Window | Plan, Window | Perspective or Window | Body Plan depending on which is the currently active view), you will be able to do a visual check of the design to ensure that the design has been loaded correctly. 2. Choose Tank Calibrations from the Analysis toolbar.
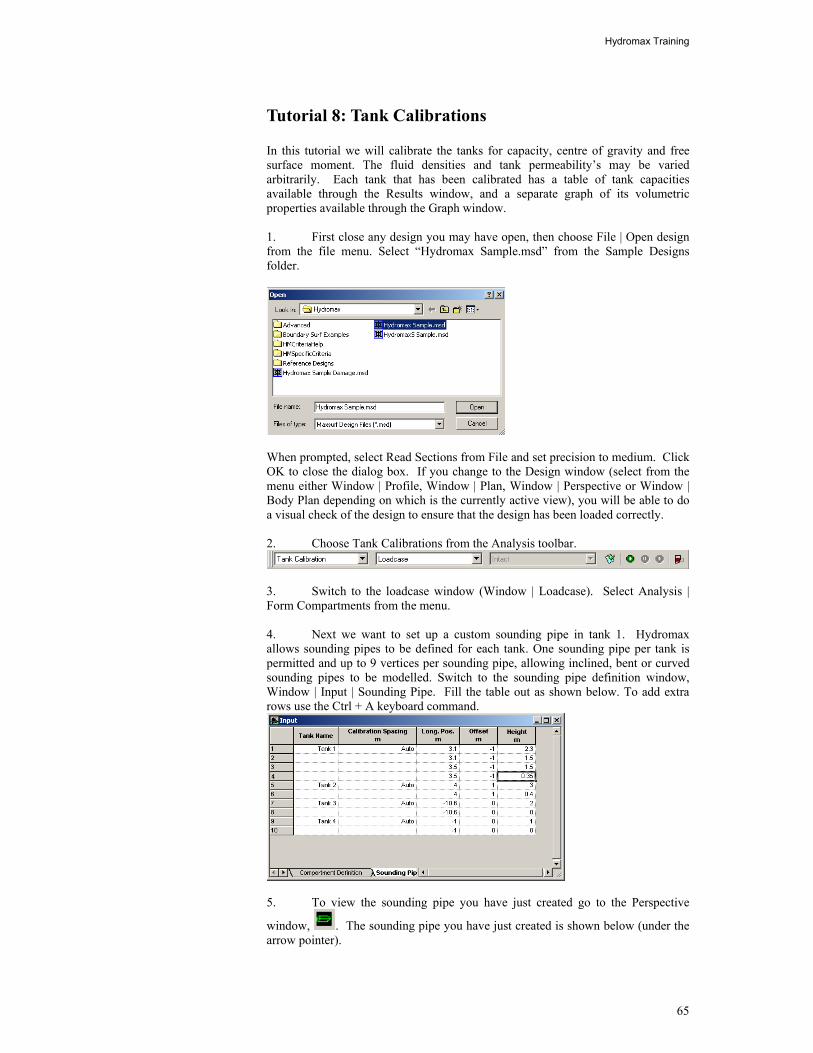
3. Switch to the loadcase window (Window | Loadcase). Select Analysis | Form Compartments from the menu. 4. Next we want to set up a custom sounding pipe in tank 1. Hydromax allows sounding pipes to be defined for each tank. One sounding pipe per tank is permitted and up to 9 vertices per sounding pipe, allowing inclined, bent or curved sounding pipes to be modelled. Switch to the sounding pipe definition window, Window | Input | Sounding Pipe. Fill the table out as shown below. To add extra rows use the Ctrl + A keyboard command.
5. To view the sounding pipe you have just created go to the Perspective
window, . The sounding pipe you have just created is shown below (under the arrow pointer).
Hydromax Training
66
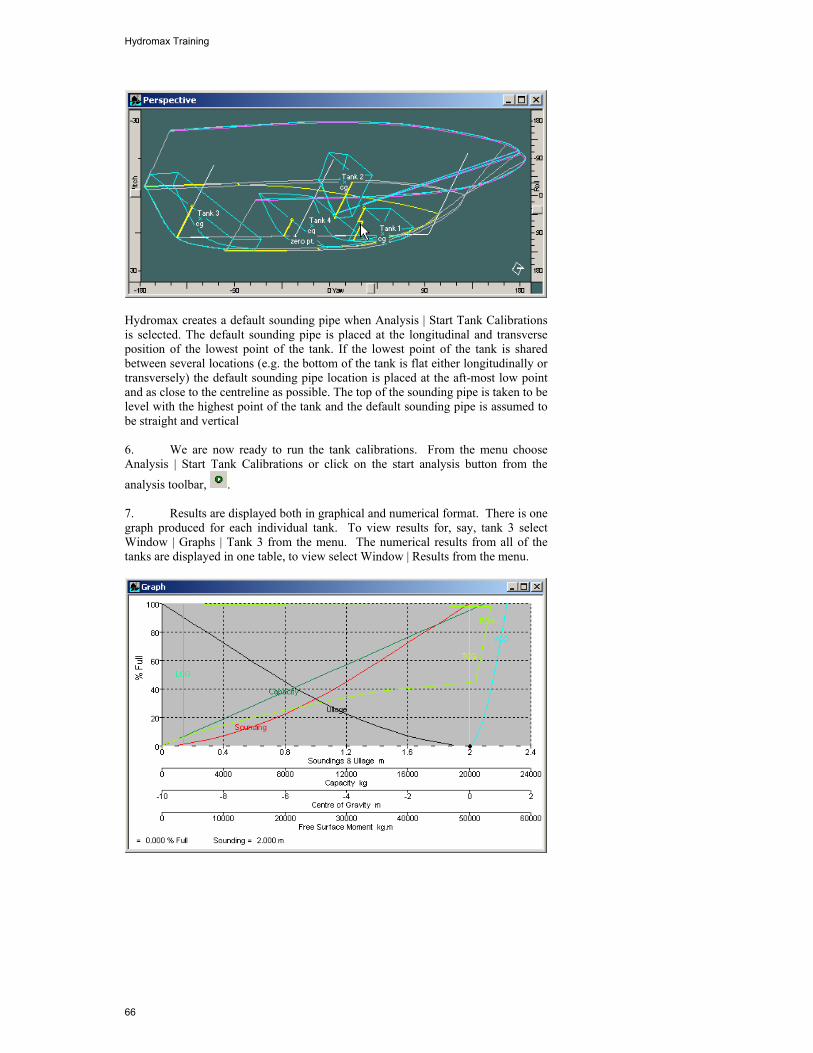
Hydromax creates a default sounding pipe when Analysis | Start Tank Calibrations is selected. The default sounding pipe is placed at the longitudinal and transverse position of the lowest point of the tank. If the lowest point of the tank is shared between several locations (e.g. the bottom of the tank is flat either longitudinally or transversely) the default sounding pipe location is placed at the aft-most low point and as close to the centreline as possible. The top of the sounding pipe is taken to be level with the highest point of the tank and the default sounding pipe is assumed to be straight and vertical 6. We are now ready to run the tank calibrations. From the menu choose Analysis | Start Tank Calibrations or click on the start analysis button from the
analysis toolbar, . 7. Results are displayed both in graphical and numerical format. There is one graph produced for each individual tank. To view results for, say, tank 3 select Window | Graphs | Tank 3 from the menu. The numerical results from all of the tanks are displayed in one table, to view select Window | Results from the menu.
Related Documents