MAXED OUT MASSACHUSETTS TRANSPORTATION AT A FINANCING CROSSROAD A Primer from Transportation for Massachusetts (T4MA) OCTOBER 2011 The people and economy of Massachusetts depend upon the state’s network of rails and roads, but the transportation system is living largely on borrowed time and borrowed money. Faced with a crushing burden of debt, the system lacks the revenue to maintain its current condition, let alone meet future needs.

Welcome message from author
This document is posted to help you gain knowledge. Please leave a comment to let me know what you think about it! Share it to your friends and learn new things together.
Transcript
MAXED OUT MASSACHUSETTS TRANSPORTATION AT A FINANCING CROSSROADA Primer from Transportation for Massachusetts (T4MA)
OCTOBER 2011
The people and economy of Massachusetts depend upon the state’s network of rails and roads, but the transportation system is living largely on borrowed time and borrowed money. Faced with a crushing burden of debt, the system lacks the revenue to maintain its current condition, let alone meet future needs.

Transportation for Massachusetts (T4MA), a diverse coalition
of Bay State organizations, seeks to promote an environmentally
sustainable, reliable, and affordable transportation system for
people across the Commonwealth. T4MA believes that a strong
and competitive Massachusetts economy requires a transpor-
tation system that supports and connects communities while
reducing greenhouse gases and other pollution and providing
greater choices to users of the state’s rails and roads. Through
research, advocacy, and organizing, T4MA works to spur invest-
ment in transportation improvements and to obtain the best
return on those investments to travelers and taxpayers. T4MA
members promote better transportation, regional planning,
affordable housing development, public health, environmental
protection, environmental justice, and smart growth.
Transportation for Massachusetts (T4MA)2181 Washington Street, Suite 310
Roxbury, MA 02119
857.205.9932
www.t4ma.org
AcknowledgementsResearch and publication of this report was made possible
thanks to support from the Barr Foundation.
This report was made possible by the efforts of many people.
Astrid Glynn, Rob DiAdamo, and Richard Doyle of TPRG LLC con-
ducted original research and analysis. Melissa Hoffer and Aviva
Rothman-Shore of Conservation Law Foundation provided fur-
ther research and project oversight, as did Stephanie Pollack of
Northeastern University’s Dukakis Center for Urban and Regional
Policy. We are grateful to T4MA members whose helpful com-
ments strengthened this document, which was mainly dra"ed by
independent writer and editor Phil Primack.
Report Design: one[visual]mind
Figures 1 and 12: Design by Brian Cragin

Maxed Out: Massachusetts Transportation at a Financing Crossroad 1
The Massachusetts transportation system is aging, unable to
maintain itself in good condition and even more unable to expand
to meet the requirements of the Commonwealth’s people, envi-
ronment, and economy. The situation—on the balance sheet and
on the state’s roads and rails—keeps getting worse. But as a
Transportation Finance Commission created by the Legislature
in 2004 succinctly put it, “We take our transportation system for
granted.”1 Massachusetts can no longer afford such compla-
cency. Nor can policy makers assume that passage of trans-
portation reform two years ago solved the system’s underlying
problems. The need to understand the depth and significance
of the transportation system’s financial problems has become
especially urgent.
The stakes are enormous: Life in the Commonwealth is built
upon a transportation infrastructure that connects more than 6
million residents to jobs, schools, health care, libraries, ball fields,
churches, and each other.2 The system has approximately 72,000
miles of roads and more than 5,000 bridges.3 The state has the
nation’s fi"h largest transit system in terms of ridership4 and, with
South Station, the sixth busiest intercity rail station. While the
transportation system features major players such as the Mas-
sachusetts Bay Transportation Authority (MBTA), and the Massa-
chusetts Port Authority, it also consists of regional transit authori-
ties, transport for senior citizens, and small roads and bridges
used by residents, businesses, and tourists throughout the state.
As a new transportation leadership team seeks to define the
system’s future in Massachusetts, the state faces a potential 30
percent federal transportation budget cut under proposals before
Congress. For the highway division alone, this could mean the
loss of $180 million, reducing the federal contribution from $600
million5 to $420 million.
Despite additional sales tax revenues for the MBTA and the
metropolitan highway system provided by the Legislature, other
revenue streams, such as federal stimulus funds, are tapping out
or are vulnerable to budget cuts. As funding declines, service will
suffer in a range of ways, from bus routes that are eliminated and
road and bridge repairs that are deferred to public transit expan-
sions that are canceled, despite their important role in reducing
vehicular emissions that contribute to climate change. Because
of its financial problems, the MBTA plans to raise fares in July
2012 and service cuts are likely even with that increase.
The most direct measure of transportation’s financing woes is
not found in data or even reports such as this one. Rather, the
impact is being felt in direct ways by people and businesses
across Massachusetts. Just this past summer, a maxed-out sys-
tem showed up as Red Line commuters stuck on trains for hours
as equipment operating far past its expected lifetime suffered
breakdowns. A maxed-out system means traffic bottlenecks that
negatively affect deliveries to or by small businesses, and some
regional transit authorities being forced to eliminate bus service
on weekends, o"en leaving people who live outside of major
urban areas with few if any public transportation options, forc-
ing them back into a costly and environmentally harmful depen-
dency on automobiles.
All Massachusetts transportation systems are jeopardized by a long pattern of underinvestment.
Warnings about the consequences of a financially strapped sys-
tem are not new. “While the financial picture is grim, it is impor-
tant to note that the MBTA is too valuable an economic asset
to permit its further deterioration or even collapse, said a 2009
report on MBTA finance requested by Governor Deval Patrick and
authored by David D’Alessandro. “A robust public transportation
system provides vital economic and quality-of-life benefits to
Fixing transportation is about more than rails, roads, sidewalks, bike paths, and bridges. Transportation is at the core of the Massachusetts economy, strengthening links to jobs, and delivering goods and services as well as opportunities. The system is also central to a more environmentally responsible future.
I. The Transportation Financing Crisis Matters

2
residents from all walks of life and to businesses in the commu-
nities it serves.”6 That applies to the entire transportation system
in Massachusetts, all of which is jeopardized by a long pattern of
underinvestment.
It’s true that the same can be said for other areas of government
in this era of fiscal stress. From schools to health care, tough
times are leading to curtailed services and hard choices across
the board. But it is difficult to find a single area of state govern-
ment with a more direct and indirect impact on the Common-
wealth than transportation.
It is difficult to find a single area of state govern-ment with a more direct and indirect impact on the Commonwealth than transportation.
ECONOMIC COMPETITIVENESSThe Commonwealth’s transportation system supports a strong
state economy by connecting workers to jobs and businesses to
customers while helping spur private sector investment in com-
mercial and residential development. But as the non-profit group
Our Transportation Future warned in a July 2010 white paper,
“[T]he condition of our transportation infrastructure is dete-
riorating to the point of threatening Massachusetts’s economic
competitiveness.”7 Achieving the great potential of Gateway Cit-
ies requires local transportation connections, including easy and
affordable access to Boston’s economic engine. While problems
such as traffic congestion add costs to business and thus hurt job
creation, highway, transit, and other construction projects create
not only better infrastructure, but good jobs.
ENVIRONMENTAL CONSEQUENCESTransportation decisions directly impact the environment. In
Massachusetts, the transportation sector is the largest and fast-
est growing source of greenhouse gas emissions that cause cli-
mate change. Reducing such emissions will require more than
fuel-efficient cars. Massachusetts also needs expanded transit,
bicycle, and other alternatives to automobiles, especially ones
with single occupants. Resulting improvements in air quality will
contribute to healthier people and communities.
QUALITY OF LIFEA comprehensive transportation system can link people to
a range of services. But today, such access is limited in many
communities. For example, senior citizens—an already signifi-
cant population segment that is growing as boomers age into
it—require better mobility options. According to the U.S. Depart-
ment of Transportation and the American Association of Retired
Persons, more than 70 percent “of older households want to live
within walking distance of transit.”8
Progress On Reforms, But Reform Is Not EnoughMassachusetts has acted to improve how it operates and finances
transportation. The first effort focused on the MBTA, which serves
175 communities over an area of 3,200 square miles with a daily
ridership of approximately 1.24 million passengers.9 In 2000, leg-
islation referred to as forward funding provided the MBTA with its
first-ever dedicated funding source, giving it one-fi"h of the then-
five percent state sales tax. However, with revenue from this sales
tax source falling far short of projections, the MBTA’s financial
condition has actually gotten worse since forward funding.
SOURCE: Transit Cooperative Research Program, Synthesis 84 Current Practices in Greenhouse Gas Emissions Savings from Transit, page 8 figure 4.* All transit includes bus, heavy, light, and commuter rail.
All Transit*
Private Auto 0.96 pounds of CO2 per passenger mile
0.41 pounds of CO2 per passenger mile
FIGURE 1Comparing Greenhouse Gas Emissions
Maxed Out: Massachusetts Transportation at a Financing Crossroad 3
In 2009, the Legislature passed transportation reform, which
restructured how Massachusetts operates and funds its highway
system. The legislation merged the Executive Office of Trans-
portation and several other transportation agencies into a mul-
timodal department of transportation, MassDOT. While trans-
portation reform has led to greater efficiencies and cost savings,
it has not been enough to significantly ease fiscal stresses and
better align the transportation system with the Commonwealth’s
broader social, economic, and environmental priorities.
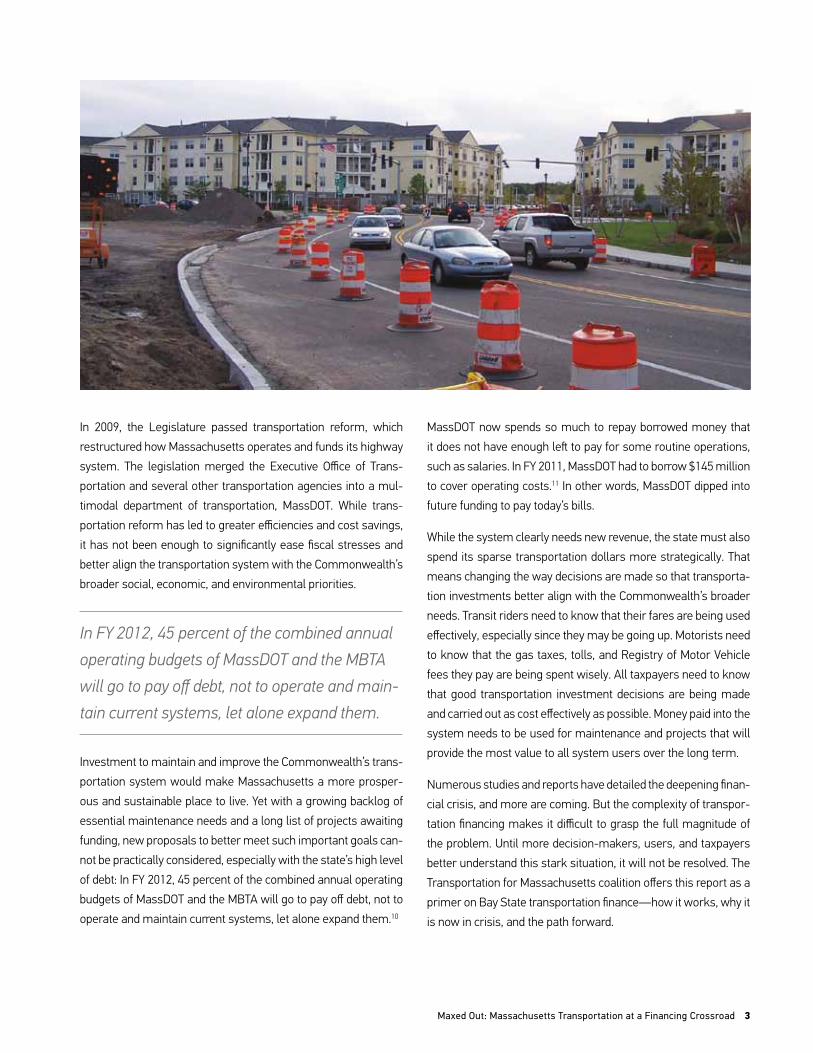
In FY 2012, 45 percent of the combined annual operating budgets of MassDOT and the MBTA will go to pay off debt, not to operate and main-tain current systems, let alone expand them.
Investment to maintain and improve the Commonwealth’s trans-
portation system would make Massachusetts a more prosper-
ous and sustainable place to live. Yet with a growing backlog of
essential maintenance needs and a long list of projects awaiting
funding, new proposals to better meet such important goals can-
not be practically considered, especially with the state’s high level
of debt: In FY 2012, 45 percent of the combined annual operating
budgets of MassDOT and the MBTA will go to pay off debt, not to
operate and maintain current systems, let alone expand them.10
MassDOT now spends so much to repay borrowed money that
it does not have enough le" to pay for some routine operations,
such as salaries. In FY 2011, MassDOT had to borrow $145 million
to cover operating costs.11 In other words, MassDOT dipped into
future funding to pay today’s bills.
While the system clearly needs new revenue, the state must also
spend its sparse transportation dollars more strategically. That
means changing the way decisions are made so that transporta-
tion investments better align with the Commonwealth’s broader
needs. Transit riders need to know that their fares are being used
effectively, especially since they may be going up. Motorists need
to know that the gas taxes, tolls, and Registry of Motor Vehicle
fees they pay are being spent wisely. All taxpayers need to know
that good transportation investment decisions are being made
and carried out as cost effectively as possible. Money paid into the
system needs to be used for maintenance and projects that will
provide the most value to all system users over the long term.
Numerous studies and reports have detailed the deepening finan-
cial crisis, and more are coming. But the complexity of transpor-
tation financing makes it difficult to grasp the full magnitude of
the problem. Until more decision-makers, users, and taxpayers
better understand this stark situation, it will not be resolved. The
Transportation for Massachusetts coalition offers this report as a
primer on Bay State transportation finance—how it works, why it
is now in crisis, and the path forward.
4
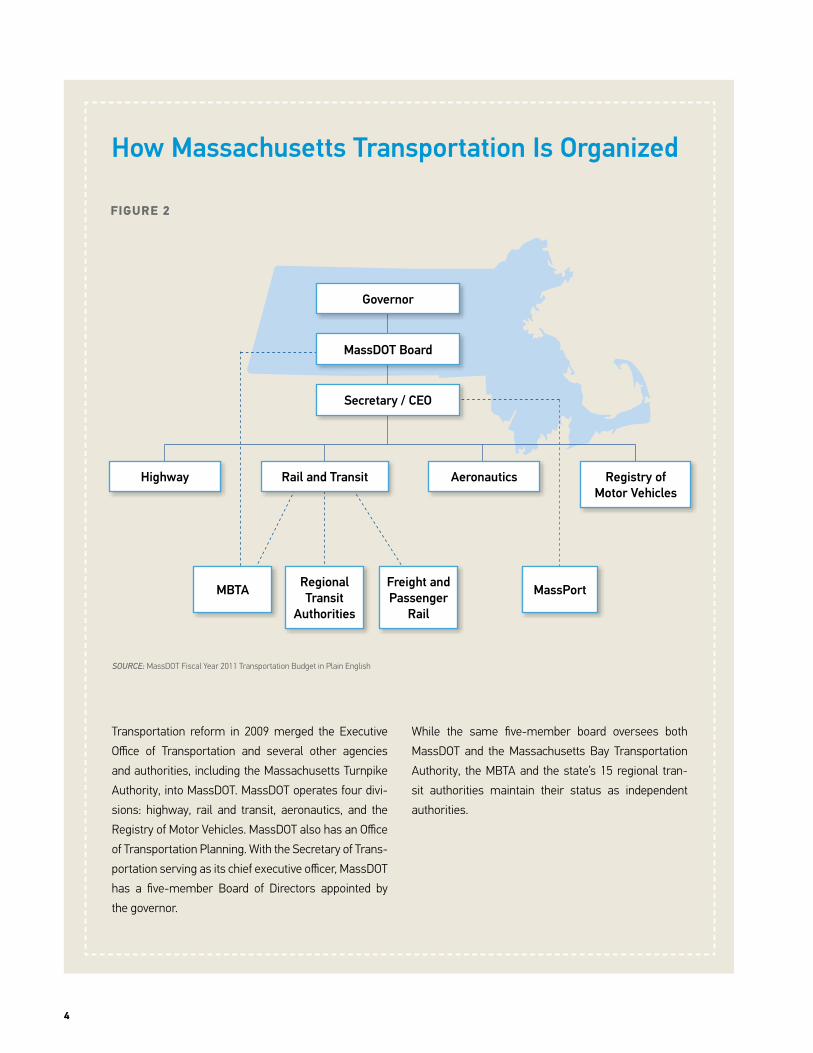
How Massachusetts Transportation Is Organized
Transportation reform in 2009 merged the Executive
Office of Transportation and several other agencies
and authorities, including the Massachusetts Turnpike
Authority, into MassDOT. MassDOT operates four divi-
sions: highway, rail and transit, aeronautics, and the
Registry of Motor Vehicles. MassDOT also has an Office
of Transportation Planning. With the Secretary of Trans-
portation serving as its chief executive officer, MassDOT
has a five-member Board of Directors appointed by
the governor.
While the same five-member board oversees both
MassDOT and the Massachusetts Bay Transportation
Authority, the MBTA and the state’s 15 regional tran-
sit authorities maintain their status as independent
authorities.
Registry of Motor Vehicles
Governor
MassDOT Board
Secretary / CEO
Rail and Transit
MBTA Regional Transit
Authorities
Freight and Passenger
Rail
AeronauticsHighway
MassPort
FIGURE 2
SOURCE: MassDOT Fiscal Year 2011 Transportation Budget in Plain English

Maxed Out: Massachusetts Transportation at a Financing Crossroad 5
The Transportation Finance Commission minced few words in its
2007 report. Transportation, it concluded, “has been neglected for
years… [T]he system we take for granted will fail if we do not take
prompt and decisive action.”12 Taking “a very conservative view,”
the Commission estimated that “over the next 20 years, the cost
just to maintain our transportation system exceeds the antici-
pated resources available by $15 billion to $19 billion. This does
nothing to address necessary expansions or enhancements.”13
Nearly five years later, the picture has gotten worse as an aging
infrastructure has further deteriorated, even as demands on it
increase due to population changes and other factors. The Com-
mission’s numbers were based on a snapshot of five years ago;
it defined the gap as the difference between available revenue
and the ability to continue spending at then-current levels. The
Commission did not have the information to actually assess how
much needed to be invested in the system to keep it running well
and up to current transportation standards. In the real world of
transportation users, failing to achieve a state of good repair
means train breakdowns, crowded roads, and an overall decline
of service and systems.
Since the Commission’s report, the MBTA and MassDOT have
been developing more current assessments of the system’s
actual condition. The good news is that much better information
about system conditions is now available; the bad news is that
the gap between system needs and resources is much greater, in
scope and dollars, than described by the Commission. The MBTA
has a $4.5 billion backlog of state of good repair and other proj-
ects. On the road and bridge side, MassDOT also faces a chasm
between needs and revenues. According to MassDOT, the five-
year cost to bring the system up to standards and meet high pri-
ority needs is $6.17 billion, while the amount of funding projected
to be available over the same time frame is $2.5 billion.14
Frustrated commuters and drivers might wonder how state
transportation agencies with multi-billion dollar budgets have
become so maxed out, like credit card users who have hit their
limits. While this report tries to respond to that legitimate ques-
tion, doing so is neither simple nor easy. Finding the answer to
a seemingly basic question—how much money flows into the
state’s transportation system and where does it go—requires
detours through a stream of agencies, acronyms, funding
sources, and other fiscal complexities that can confuse even
policy wonks. But the bottom line is pretty clear: Massachusetts
has been forced to use major chunks of its transportation dol-
lars to pay the principal and interest on borrowed money (the
official term is “debt service”), which itself is the result of the way
revenue-starved Massachusetts funded yesterday’s transit, road,
bridge, and other transportation projects. Unless the Common-
wealth changes how it funds projects, transportation debt will
continue to mount and revenues that could otherwise be used for
system maintenance and improvements will instead be used to
pay off the debt on borrowed money.
The Growing GapMassachusetts has a variety of revenue sources for its trans-
portation systems and uses them for a range of purposes. (See
Figure 3.) These sources and uses are tracked separately for
MassDOT and for the MBTA, which is a separate state agency.
Further complicating the money picture, each agency has two
kinds of budgets: the annual operating budget, which covers reg-
ular costs such as wages and routine repairs, and the five-year
capital spending plan, which covers the costs for longer-term
investments, such as bridge construction or train locomotives.
Federal funds are available mainly for capital spending. Local
funding is targeted largely at local roads, though cities and towns
also pay assessments to help cover regional transit system costs.
Significant funding for transportation comes from state sources,
including user fees such as tolls and transit fares, and state gen-
eral revenue. For transit, the main funding source is the sales
tax. The two largest state revenue sources for roads, bridges, and
Previous studies have documented that revenue shortfalls jeopardize the current transportation network and severely limit future choices. But as deep federal cuts loom, an already dismal outlook is about to get even worse.
II. Scope Of The Problem
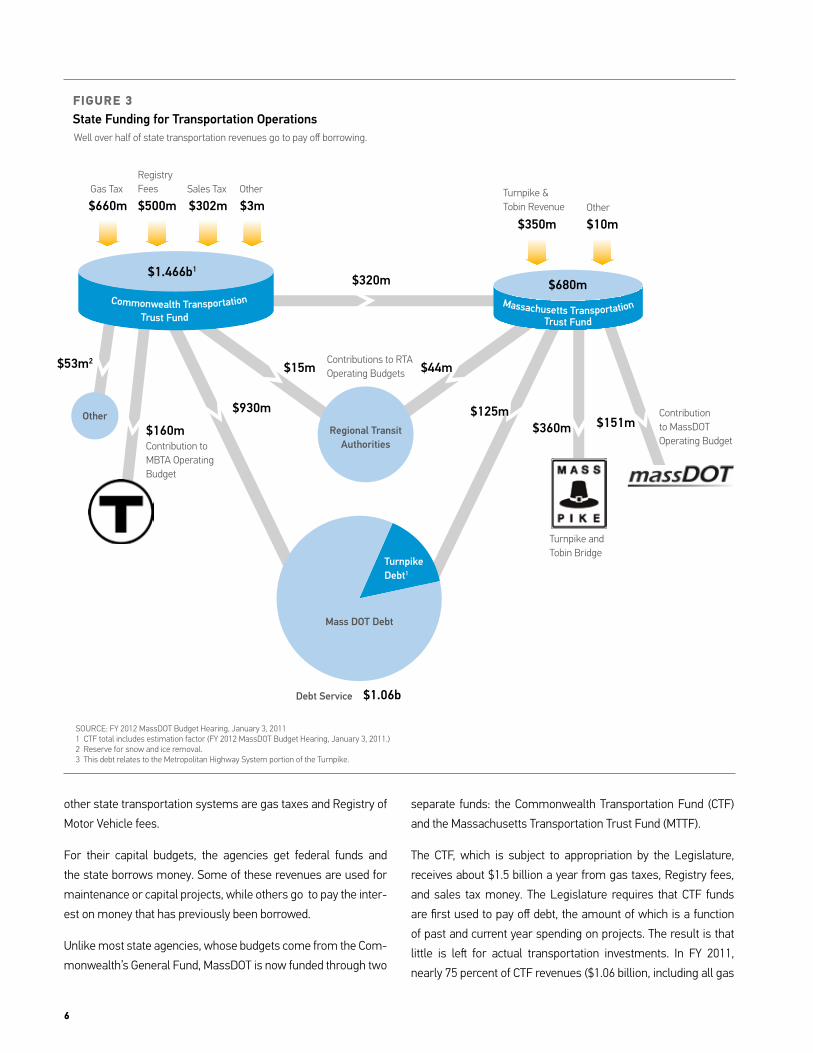
6
other state transportation systems are gas taxes and Registry of
Motor Vehicle fees.
For their capital budgets, the agencies get federal funds and
the state borrows money. Some of these revenues are used for
maintenance or capital projects, while others go to pay the inter-
est on money that has previously been borrowed.
Unlike most state agencies, whose budgets come from the Com-
monwealth’s General Fund, MassDOT is now funded through two
separate funds: the Commonwealth Transportation Fund (CTF)
and the Massachusetts Transportation Trust Fund (MTTF).
The CTF, which is subject to appropriation by the Legislature,
receives about $1.5 billion a year from gas taxes, Registry fees,
and sales tax money. The Legislature requires that CTF funds
are first used to pay off debt, the amount of which is a function
of past and current year spending on projects. The result is that
little is le" for actual transportation investments. In FY 2011,
nearly 75 percent of CTF revenues ($1.06 billion, including all gas
FIGURE 3State Funding for Transportation OperationsWell over half of state transportation revenues go to pay off borrowing.
SOURCE: FY 2012 MassDOT Budget Hearing, January 3, 20111 CTF total includes estimation factor (FY 2012 MassDOT Budget Hearing, January 3, 2011.)2 Reserve for snow and ice removal.3 This debt relates to the Metropolitan Highway System portion of the Turnpike.
Gas Tax
Contribution to MBTA Operating Budget
Contribution to MassDOT Operating Budget
Turnpike and Tobin Bridge
Regional Transit Authorities
Mass DOT Debt
Debt Service
Turnpike Debt1
$660m
$160m
$1.06b
Registry Fees
$500m Sales Tax
$302m Turnpike & Tobin Revenue
$350m
$320m
$15m
$930m $125m $360m
$44m
Other
$3m Other
$10m
$1.466b1
$680m
Trust Fund
Massachusetts Transportation
$151m
$53m2
Other
Contributions to RTA Operating Budgets
Trust Fund
Commonwealth Transportation

Maxed Out: Massachusetts Transportation at a Financing Crossroad 7
tax revenues and Registry fees) were spent on debt service.15
(See Figure 3.)
Because transportation agencies don’t have enough revenue
to maintain their systems, the backlog of unmet needs grows
larger and larger and the condition of transportation and transit
systems deteriorates further. Without enough resources, mod-
ernization and expansion are now hoped-for luxuries for high-
way and transit agencies alike, despite their potential benefits.
Unless the Commonwealth changes how it funds projects, that transportation debt will continue to mount and revenues that could oth-erwise be used for maintenance and improve-ments in transit, roads, bridges and more will instead have to pay back borrowed money.
Debt: Necessary Funding Tool, But With Long-term ConsequencesFinding the money for overdue repairs and other maintenance
is a challenge under good conditions, and today’s funding con-
ditions are anything but good. The increasing costs of principal
and interest payments on all the transportation debt the state
has racked up cut deeply into its capacity to fund projects. The
outlook is made even bleaker by the political and fiscal climate in
Washington D.C.: federal funding for transportation is declining,
potentially in significant ways. Any money that comes to Massa-
chusetts in upcoming years will be largely used to pay off trans-
portation bills the state has already run up trying unsuccessfully
to keep the system in a state of good repair.
To understand the magnitude of the problem on the transit side,
it’s important to recognize that the MBTA carries the highest debt
burden of any transit authority in the nation.16 In FY 2011, 25 per-
cent of its annual operating budget went to debt service, which
is the MBTA’s second largest cost a"er wages and benefits;17 the
system’s annual debt payments are now nearly as large as its
total revenue from fares.18 The percentage going to debt ser-
vice will continue to rise; the MBTA estimates that it will reach
30 percent by 2016. The shortfall between needed upgrades and
available funds is actually worse than official numbers suggest.
For example, the MBTA’s Capital Investment Program does not
include other identified and necessary projects, including about
$1.3 billion to replace aging cars on the Red and Orange Lines.
(See Figure 5.) Similarly, MassDOT has identified major highway
projects, currently estimated to cost $550 million, for which no
funding exists.19
A look beyond the operating budgets of MassDOT and the MBTA
and into the $1.5 billion CTF offers a more complete picture of
how debt dominates everything else. Every year, the state col-
A sample of the challenge facing the MBTA:
Orange Line120 cars built in 1979-1981 need to be replaced
Red Line 74 cars built in 1969 need to be replaced
Mattapan High Speed LineNew vehicles are needed to replace the cars built in the 1940s
Commuter RailMore than half of the MBTA’s 82 commuter rail locomotives date to the 1970s and nearly all are at or past the manufacturer’s recommended lifespan of 25 years
SOURCE: Boston MPO, Long Range Transportation Plan, Pathways to a Sustainable Future.
FIGURE 5Not a State of Good Repair
SOURCE: MassDOT Budget FY 2011
FIGURE 4Total Local and State Revenue For MBTA Operations FY 2011
$767mSales Tax (dedicated)
$150m
Local Assessments$160m
Sales Tax (appropriated)
$451mFares
8
lects about $500 million in Registry fees and more than $660 mil-
lion in gas taxes.20 That money, plus roughly $300 million in sales
tax revenue appropriated by the Legislature, flows into the CTF.
But while that money is intended to fund transportation, nearly
three of every four dollars in that fund are going to repay debt for
money already borrowed by the Commonwealth for transporta-
tion projects. Despite recent efforts to reissue some debt at lower
interest rates, the debt service burden will continue to grow as
long as Massachusetts keeps using borrowed money as its pri-
mary way to pay for transportation.
FEDERAL BUDGET CUTS LOOM; STATE REVENUES FALL SHORTThe Bay State’s in-state revenue sources cannot come close to
filling the current shortfall and certainly not the one due to loom-
ing federal cuts. The 21-cents-per-gallon state tax on gas has
not been increased since 1991 and factoring for inflation, that 21
cents buys only as much as 13 cents would have in 1991.
On the transit side, revenues from the primary source of state
funding, a penny of the sales tax, have fallen significantly short
of projections. When forward funding was established in 2000,
the MBTA assumed an average sales tax growth rate of 3 per-
cent a year. Due to various factors, including the recession and
tax-free Internet sales, that assumption proved far too optimis-
tic.21 Though a 2009 sales tax increase did provide the MBTA
with $160 million in new revenue, the overall underperformance
of the sales tax, which accounts for 57 percent of all MBTA rev-
enues, has worsened the transit system’s already bleak finan-
cial outlook.
Alarmingly, the MBTA’s annual operating deficit is expected to
double over the next four years as its state of good repair backlog
continues to grow. While the MBTA’s Capital Investment Program
states that the agency must spend $470 million a year simply to
prevent further system deterioration, the actual number may be
closer to $750 million, according to the long-range transporta-
tion plan recently adopted by the Boston Metropolitan Planning
Organization. Funding cuts to the transportation system are like
dominoes. The first piece to fall is the direct impact on projects,
whether maintenance or expansion. The lack of timely invest-
ment and aggressive preservation strategies then leads to higher
costs to fix the same problems later. Inadequate funding has fur-
ther consequences down the line. Because of tight budgets, for
example, some day-to-day operations of transportation agencies
are now being paid from capital budgets, taking away money
that could otherwise be used for road or bridge repairs. Another
domino that could fall: budget pressures could leave MassDOT
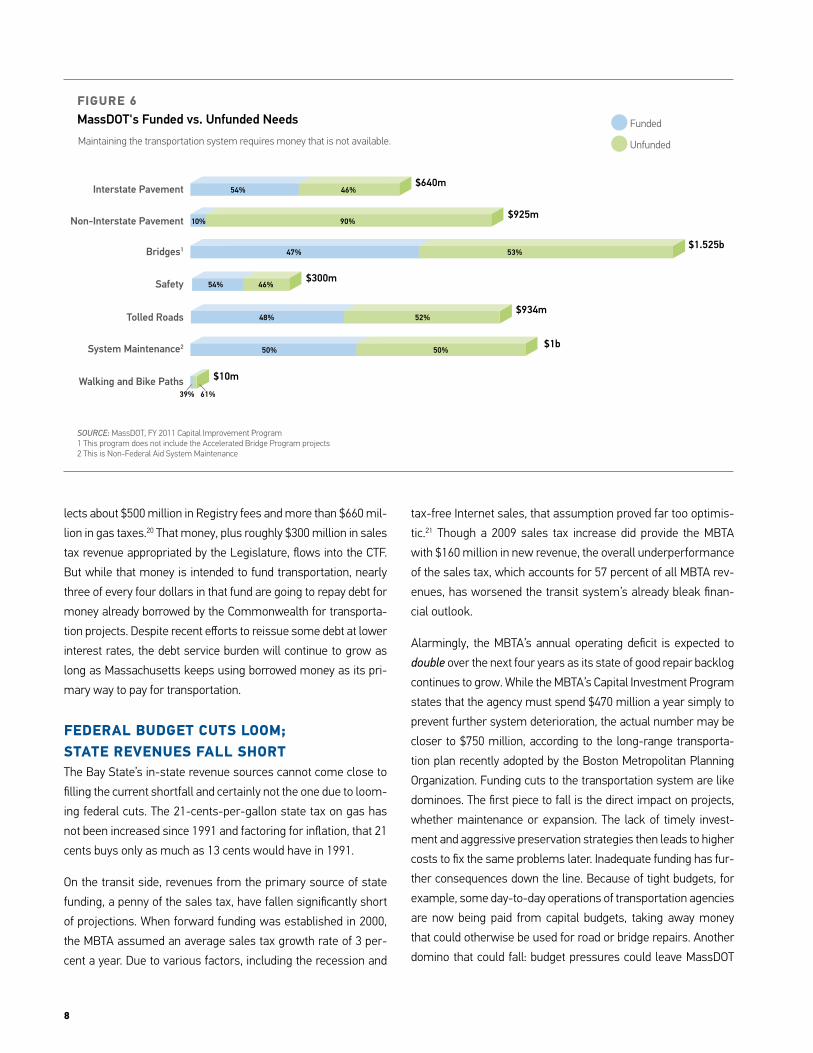
Funded
Unfunded
Interstate Pavement $640m
Non-Interstate Pavement $925m
Bridges1 $1.525b
Safety $300m
Tolled Roads$934m
System Maintenance2 $1b
Walking and Bike Paths $10m
10% 90%
47% 53%
54% 46%
48% 52%
50% 50%
39% 61%
Maintaining the transportation system requires money that is not available.
FIGURE 6MassDOT's Funded vs. Unfunded Needs
46%54%
SOURCE: MassDOT, FY 2011 Capital Improvement Program1 This program does not include the Accelerated Bridge Program projects2 This is Non-Federal Aid System Maintenance

Maxed Out: Massachusetts Transportation at a Financing Crossroad 9
with an insufficient staff of adequately trained personnel to over-
see and maintain road and bridge projects to keep quality up and
costs down. Such a lack of careful supervision could translate
into greater costs in the future.
Another consequence of transportation’s bleak balance sheet
is that it undermines the possibility of future federal funding for
transit. For a project such as the Green Line extension, for exam-
ple, the state is required to demonstrate that the MBTA can pay
associated operating costs, as well as maintain both the exist-
ing system and any extension. Despite the state’s high level of
investment in transit, the MBTA’s debt service load and its main-
tenance backlog make it increasingly difficult for Massachusetts
to make that case.
In short, a critical situation facing the Massachusetts transporta-
tion system is about to get even worse.
FIGURE 7MBTA Capital Investment Program (Total: $3.8 billion FY12 - FY16)
Source of Funds Use of Funds
31%State Bond Funding* $1.2b
Expansion
Homeland Security Funding
Homeland Security Programs
3%
Federal Stimulus Projects $225m
20%MBTA Revenue Bonds* $757m
46% Federal Transit Funds $1.86b
State of Good Repair (SGR) $2.3b
State Commitments $1.2b
SOURCE: MBTA Presentation to the Board September 9, 2011 * Borrowing is the source of funding.
6%
1%
3%
31%
60%
FIGURE 8MassDOT Capital Investment Program (Total: $10.4 billion FY11 - FY15)
Source of Funds Use of Funds
2%
60%
Transportation Infrastructure Fund
34%
Debt (General and Special)* $6.3b
Rail & Transit Division $1.2b
Aeronautics
Central Artery Tunnel
Office of Transportation Planning $365m
Highway $8.6b
Federal Highway Funds $3.5b
SOURCE: MassDOT Fiscal Year 2011 Transportation Budget in Plain English* Borrowing is the source of funding.
11%
4%
2%1%
82%
4%Federal Transit Funds

10
FIGURE 9Federal Funding for Massachusetts Transit$292m in federal appropriations are currently dedicated to city-specific, statewide and interstate transportation programs. The MBTA receives most federal transit funds.
Note: The actual amounts available to regions in Massachusetts is approximated in this chart. Some federal funds are shared with transit systems across state lines.
SOURCE: Federal Register, Vol. 76, No. 98.1. These figures do not include the federal stimulus funds Massachusetts received.2. Statewide programs include Rural, Elderly and Disabled, Metropolitan Transportation Planning, Statewide Transportation Planning and Rural Technical Assistance.3. The MBTA receives all the Rail Modernization and most of the Urbanized Area Formula funds for the Boston metropolitan area. The MBTA and Regional Transit Authorities agree upon a split of these funds.
Programs Targeted To Transit Dependent Populations
$5.1mRail Modernization (commuter rail)
$95.5m Urbanized Area Formula (for all types of transit)
$181.5m Statewide Programs2
$9.9m
Federal Funding1
$292m
Pittsfield Leominster-Fitchburg
New Bedford
Barnstable
$1.3m
$2.6m
$3.3m
Springfield
Worcester
$5.8m
$13m
$10.3m
Boston3
$244m
Maxed Out: Massachusetts Transportation at a Financing Crossroad 11
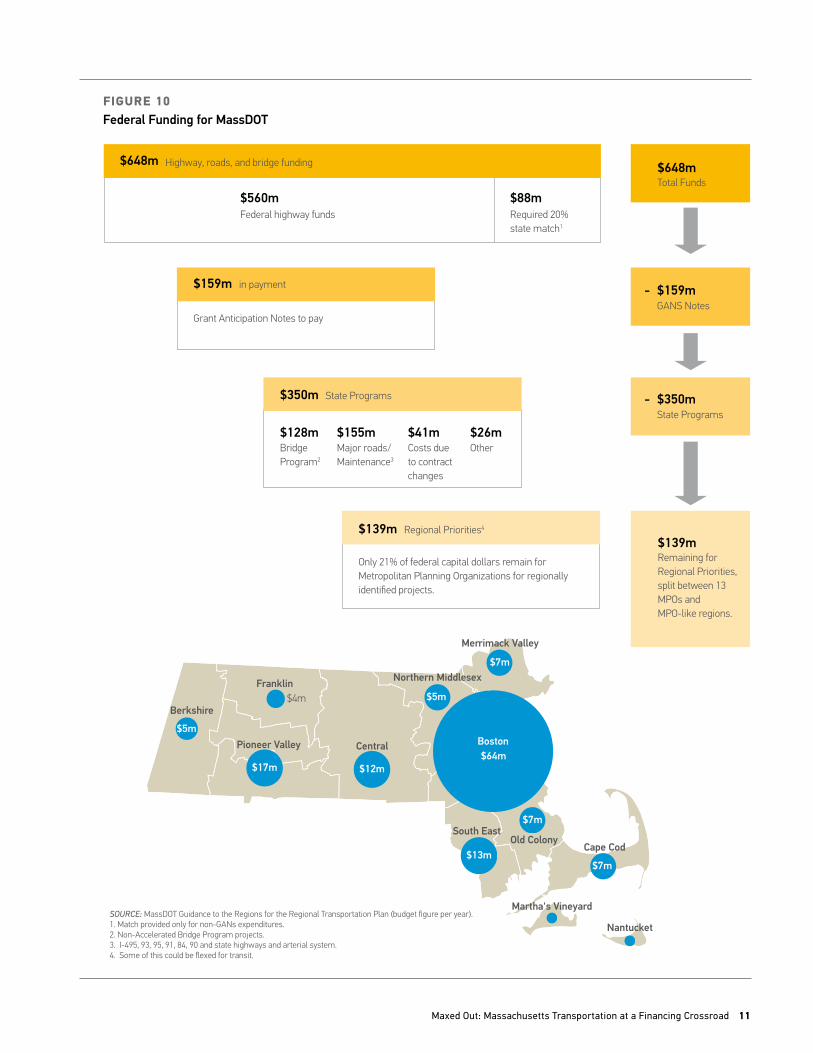
FIGURE 10Federal Funding for MassDOT
SOURCE: MassDOT Guidance to the Regions for the Regional Transportation Plan (budget figure per year).1. Match provided only for non-GANs expenditures.2. Non-Accelerated Bridge Program projects.3. I-495, 93, 95, 91, 84, 90 and state highways and arterial system.4. Some of this could be flexed for transit.
Berkshire
Cape Cod
Merrimack Valley
Northern MiddlesexFranklin
Pioneer Valley Central
South East
Martha's Vineyard
Nantucket
$5m
$7m
$7m
$5m$4m
$17m$64m
$12m
$13m
Boston
Old Colony
$7m
$648m Total Funds
$139m Remaining for Regional Priorities, split between 13 MPOs and MPO-like regions.
$159mGANS Notes
-
$350m State Programs
-
Grant Anticipation Notes to pay
$128m Bridge Program2
$155m Major roads/ Maintenance3
$26m Other
$41m Costs due to contract changes
Only 21% of federal capital dollars remain for Metropolitan Planning Organizations for regionally identified projects.
Federal highway funds$560m
Required 20% state match1
$88m
Highway, roads, and bridge funding$648m
State Programs$350m
Regional Priorities4$139m
in payment$159m
12
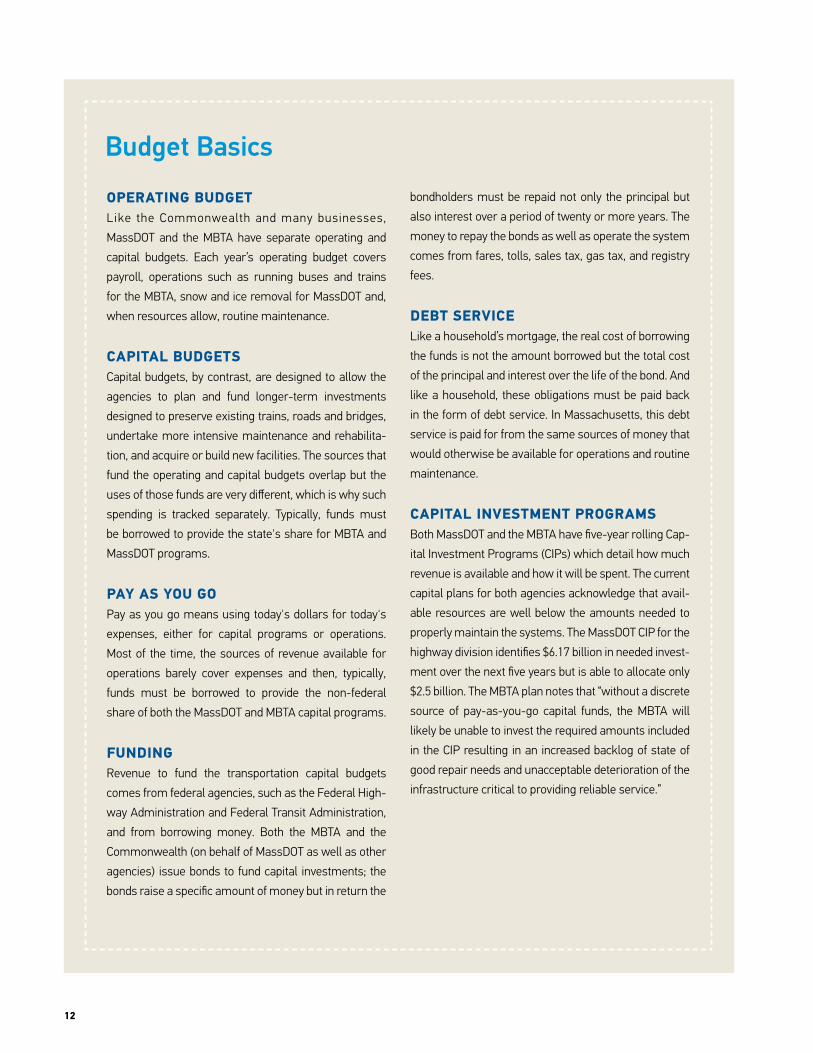
OPERATING BUDGETLike the Commonwealth and many businesses,
MassDOT and the MBTA have separate operating and
capital budgets. Each year’s operating budget covers
payroll, operations such as running buses and trains
for the MBTA, snow and ice removal for MassDOT and,
when resources allow, routine maintenance.
CAPITAL BUDGETSCapital budgets, by contrast, are designed to allow the
agencies to plan and fund longer-term investments
designed to preserve existing trains, roads and bridges,
undertake more intensive maintenance and rehabilita-
tion, and acquire or build new facilities. The sources that
fund the operating and capital budgets overlap but the
uses of those funds are very different, which is why such
spending is tracked separately. Typically, funds must
be borrowed to provide the state's share for MBTA and
MassDOT programs.
PAY AS YOU GOPay as you go means using today's dollars for today's
expenses, either for capital programs or operations.
Most of the time, the sources of revenue available for
operations barely cover expenses and then, typically,
funds must be borrowed to provide the non-federal
share of both the MassDOT and MBTA capital programs.
FUNDINGRevenue to fund the transportation capital budgets
comes from federal agencies, such as the Federal High-
way Administration and Federal Transit Administration,
and from borrowing money. Both the MBTA and the
Commonwealth (on behalf of MassDOT as well as other
agencies) issue bonds to fund capital investments; the
bonds raise a specific amount of money but in return the
bondholders must be repaid not only the principal but
also interest over a period of twenty or more years. The
money to repay the bonds as well as operate the system
comes from fares, tolls, sales tax, gas tax, and registry
fees.
DEBT SERVICELike a household’s mortgage, the real cost of borrowing
the funds is not the amount borrowed but the total cost
of the principal and interest over the life of the bond. And
like a household, these obligations must be paid back
in the form of debt service. In Massachusetts, this debt
service is paid for from the same sources of money that
would otherwise be available for operations and routine
maintenance.
CAPITAL INVESTMENT PROGRAMSBoth MassDOT and the MBTA have five-year rolling Cap-
ital Investment Programs (CIPs) which detail how much
revenue is available and how it will be spent. The current
capital plans for both agencies acknowledge that avail-
able resources are well below the amounts needed to
properly maintain the systems. The MassDOT CIP for the
highway division identifies $6.17 billion in needed invest-
ment over the next five years but is able to allocate only
$2.5 billion. The MBTA plan notes that “without a discrete
source of pay-as-you-go capital funds, the MBTA will
likely be unable to invest the required amounts included
in the CIP resulting in an increased backlog of state of
good repair needs and unacceptable deterioration of the
infrastructure critical to providing reliable service.”
Budget Basics

Maxed Out: Massachusetts Transportation at a Financing Crossroad 13
This and other reports have documented the financial strangle-
hold on transit and other transportation systems in Massachu-
setts. But how it happened—how debt has sharply reduced
transportation options—is much less understood. Because the
story behind how the system got maxed out is complex, even
people who care about transportation are drawn to relatively
simple explanations. Some reflexively blame overspending and
mismanagement by transportation agencies. Others cite Central
Artery/Tunnel Project costs and problems, equating that project
with overspending and mismanagement. While some manage-
ment decisions and the Big Dig certainly contributed to the cur-
rent problem, the more accurate and complete explanation of
how Massachusetts transportation has gotten so maxed out lies
in how the state has funded transportation in recent decades—
and, perhaps more importantly, how it has not.
It may seem counterintuitive, but Massachusetts transportation
is maxed out today not because the state has spent too much on
transportation, but because it has spent too little.
It may seem counterintuitive, but Massachu-setts transportation is maxed out today not because the state has spent too much on trans-portation, but because it has spent too little.
Leveraging Federal DollarsIn some ways, Massachusetts has been a victim of its own suc-
cess. Instead of using and, where necessary, raising its own
revenues to maintain or expand systems, Massachusetts has
taken advantage of federal funds to finance transportation. That
approach made sense in some key ways. The federal govern-
ment requires a state match of just 20 percent of transportation
capital dollars, meaning that as long as Massachusetts could
show an ability to pay $1 towards a project’s costs, it could secure
an additional $4 in federal funds, even if that $1 was itself pro-
duced by borrowing.
For state officials, leveraging federal dollars was much easier
(politically, at least) than relying on annual appropriations or
seeking increases in user fees such as tolls or gas taxes. Other
states, of course, also utilize federal funds to finance projects, but
unlike Massachusetts, many of those states pay their 20 percent
share out of actual state revenues, in essence using their own
cash for a down payment. Massachusetts, by contrast, o"en bor-
Rather than using dedicated state revenues to pay-as-you-go for at least some transporta-tion projects, debt has become the state’s primary way to finance transportation. The tab for ever-growing debt service is coming due at an especially bad time.
III. How We Got Here

14
rows money to meet that federal match requirement. It is also
worth noting that Massachusetts, unlike states such as New York
and Pennsylvania, does not require voter approval for the state
to borrow money. This means that the public generally does not
recognize that the rails and roads upon which they depend are
financed in large part with borrowed money, not just with taxes or
other revenues. If the state is to change how it funds transporta-
tion, the public must understand the system’s true costs and the
need to find a better way than debt to pay for them.
Grant Anticipation Notes— The State’s Credit CardThe current system, by which Massachusetts issues debt and
promises to use future revenues to pay it off, is somewhat akin to
using a credit card: the state gets what it wants now (in this case,
money to fix roads or bridges) and pays the bill off over time and
with interest. A financing tool known as Grant Anticipation Notes
(GANs) has become a very significant part of the state’s highway
funding since the state used them to pay Big Dig construction
bills before federal funds became available. GANs are essentially
a pledge of future revenues. But does the resulting debt burden
mean that decision-makers acted in poor faith or without proper
due diligence? It can be argued that they actually had little alter-
native but to pursue federal dollars for the basic reason that a
lack of sufficient state resources tied their fiscal hands. Despite
the warnings of the Transportation Finance Commission and oth-
ers, debt remains an important and necessary tool for financing
transportation. But the struggle to keep up with payments on its
debt leaves Massachusetts with even fewer funds for mainte-
nance or expansion, even as those needs increase.
Transportation Reform and MBTA Forward Funding: Important but InadequateFor years, some people calling for changes in how Massachu-
setts funds and operates its transportation systems called for
reform before revenue. And reform came, most notably through
forward funding for the MBTA in 2000 and transportation reform
in 2009. Though both initiatives have led to financial savings and
improved organizational accountability, these and other reforms
have been only partially successful.
FORWARD FUNDINGFor years, the MBTA’s budgeting practice was to spend money
and then send the state an annual bill a"er the fact. Forward
funding in 2000 abolished that system and, as noted before, pro-
vided the MBTA with a fixed revenue stream, most of it from a
dedicated penny of the sales tax.
As a result of forward funding, the MBTA develops an annual
balanced budget based on its projected revenues, including
fares, local assessments, and sales tax revenue. Because of this
new revenue system, the MBTA has been able to save money
by restructuring some its debt. However, as noted by the MBTA
itself, “Much of the current debt has been refinanced at a lower
cost over the past ten years, but those savings opportunities
no longer exist.”22 Despite refinancing and other strategies, the
MBTA continues to struggle to find the money it needs each year
just to keep the system’s condition from further deterioration.
Forward funding was, in short, a positive but insufficient reform.
TRANSPORTATION REFORMIf forward funding restructured MBTA funding, transportation
reform in 2009 restructured the way Massachusetts funds and
operates all of its transportation system. Following transporta-
tion reform, MassDOT’s Commonwealth Transportation Fund
allows for revenues to be used across different transportation
modes. This positive development sets the stage for a progres-
sive, multimodal approach to future transportation investment
decision-making.
With funds sparse, another important aspect of transportation
reform was that it helped create a system to better prioritize
projects according to condition and degree of use. Such asset
management systems can lead to more coordinated and cost-
effective investments by moving money to where it is most
needed within transportation’s different modes.
Transportation reform also sought to address another of the
transportation system’s major cost drivers: labor costs, includ-
ing expenses from health care and other employee benefits,
especially at the MBTA. Despite some results, such as moving
MBTA workers into the insurance plan covering state employ-
ees, wages and benefits remain the transit system’s biggest
cost. However, collective bargaining rules and a process by
which arbitration o"en reverses MBTA efforts to reduce costs
limit the agency’s ability to further control health care and pen-
sion costs.
The cost savings promised by reform will come over a 20-year
period. But the system is starved for funds now. Reform before
revenue made sense as a first step, but reform is not a substitute
for revenue.

Maxed Out: Massachusetts Transportation at a Financing Crossroad 15
Case Study: Accelerated Bridge ProgramA program recently in the news illustrates the upside and down-
side of borrowing money to pay for transportation projects. With
a bridge collapse in Minnesota driving home the danger of struc-
turally deficient bridges, Massachusetts sought a way to repair
bridges on an expedited basis. By this summer, the Accelerated
Bridge Program (ABP) had reduced the number of structurally
deficient state highway bridges from 543 (as counted in 2008) to
423. More importantly, the number of such bridges is no longer
escalating as it would have without the program, saving the state
more expensive repairs in the future. But how did debt-ridden
MassDOT find the money to do this project? Massachusetts
turned to a familiar friend: Grant Anticipation Notes.
While GANs enable necessary projects to get done now before
they cost more later, it is at the cost of future revenues. Indeed,
in FY 2011, more federal money was set aside to pay off GANs
than went to the state’s Metropolitan Planning Organizations for
regional priorities. (See Figure 10.) Over the next three years,
about $785 million in federal funds (including the state match)
will be committed to statewide road and bridge needs and
another $397 million will be dedicated to regional priorities. But
$527 million in federal funds will be held aside to pay off GANs. In
other words, nearly 30 percent of all expected federal funds will
go to pay off old commitments rather toward new needs.
Even with such borrowing against the future, ABP is not enough
to keep the state’s bridges in a state of good repair. MassDOT
estimates an annual gap of $161 million between identified
needs for other bridge repairs and available funds for completing
those repairs.23 The inability to fix those structures now will cost
Massachusetts more in terms of both public safety and dollars.
Transportation Under The State Bond Cap Since 1991, Massachusetts agencies, including transportation,
have operated under an annual cap to limit their borrowing to
levels closer to what the state can afford to support. But unlike
other parts of state government, such as housing agencies or
the courts, transportation agencies are expected to cover the
principal and interest on bonds issued under the cap. “Transpor-
tation has historically represented the largest share of the Com-
monwealth’s capital spending, accounting for between one-half
and two-thirds of the total capital budget over the last five years,”
according to MassDOT.24
But do the MBTA, MassDOT, and other transportation agencies
really have a more viable alternative to the debt tool today than in
the past? Borrowing money remains the Bay State way of doing
transportation business. That’s in large part because a revenue
stream that would enable a pay-as-you-go approach continues
to lag far behind identified needs. The last gas tax increase was

16
more than two decades ago; a 2009 attempt to raise it by 19
cents, of which 6 cents would go to public transit, was abandoned
in the face of strong opposition. The MBTA fare increases that
may soon be proposed would be the first since January 1, 2007.
Most of the new revenue to the system has been from a non-user
source, the statewide sales tax. But rather than going to trans-
portation system maintenance and capital improvements, much
of that revenue is being used to pay for basic operating expenses
and the interest on debt.
This perpetuates a Catch-22. Necessary maintenance of capital
facilities is deferred or outright ignored, which kicks the cost can
down the road into the future, further widening the growing gap
between needed improvements and available funds. Meanwhile,
the combination of heavy debt service and a tangle of federal and
state restrictions on the allowable use of revenues leaves little
or no unrestricted funding available to plan and build other local,
regional, and state transportation projects that serve important
economic and environmental goals.
Reform before revenue made sense as a first step, but reform is not a substitute for revenue.
Delayed transportation projects end up being more expensive.
And the risks to public safety, the environment, and the Massa-
chusetts economy increase.
Maxed Out: Massachusetts Transportation at a Financing Crossroad 17
Changes in how Massachusetts finances and operates its trans-
portation systems, especially forward funding and transportation
reform, have created greater transparency about the system’s
needs compared to its funding capacity. Greater transparency
means that policy makers and others have the information they
need to respond.
That response must be comprehensive. It must consider not only
the pressing need for revenue, but how to best use that revenue.
With dollars increasingly tight, further changes may be needed to
make the Commonwealth smarter in deciding how it invests in
transportation. Despite federal requirements to coordinate trans-
portation with other planning processes, transportation planning
in Massachusetts, as in many states, remains compartmental-
ized, with transportation decisions not fully integrated with land-
use planning, other infrastructure needs, and environmental
considerations.
How Decisions Are Currently MadeThough driven by federal requirements, transportation planning
is implemented through state and regional choices. Investments
intended to meet statewide needs are basically decided by Mass-
DOT, while local and regional transportation spending choices
are generally selected by 13 Metropolitan Planning Organizations
(MPOs) scattered across the state. Under federal law, MPOs are
charged with planning and programming federal highway and
transit funds. Typically, MPOs employ regional planning staff.
Various factors shape their decisions, but MPOs are bound by
certain limits, such as the state bond cap or changes in federal
funding, as they make long-term plans and pursue short-term
programs. While these constraints are intended to force trans-
portation planners to prioritize and identify a fundable universe of
projects, they limit the number of projects that can be advanced
at any one time. The pipeline of transportation projects is long.
Even routine projects can take several years and a major project
can require a decade from concept to completion.
In Massachusetts, MPOs tend to have more involvement in how
federal highway funds are spent than in how the MBTA and
regional transit authorities use federal transit funds. MPOs tend
to accept the transit agency’s allocations and incorporate them
into regional plans with few changes. While priorities may shi"
from year to year, those plans o"en consist of maintaining the
existing systems rather than enhancing or expanding them. For
example, of the $3.8 billion in capital projects included in the
MBTA's Capital Investment Program for the five years beginning
in FY 2012, more than 90 percent goes to existing projects and
system maintenance and less than 10 percent to enhancements
and expansion projects.25
The decision-making process for highway spending is more
complicated. While MassDOT usually takes the lead role in deter-
mining how federal funds will be applied to statewide highway
needs, MPOs program federal highway funds to regional priori-
ties. MassDOT determines maintenance priorities for the state
system, while other MPO members, especially municipalities
and regional planning agencies, generally take the lead in select-
ing regional priorities.
Problems With The ProcessAs a result of financial and other constraints, MPOs have tended
to give priority and commit funds to projects that are under way
or at least well into design and preliminary engineering. This
limits opportunities to advance new projects that could serve
important environmental, economic, or other goals, or improve
local or regional mobility choices, such as better sidewalks and
bike paths, expanded transit service, or local shuttles to jobs and
downtown areas.
The current planning process also creates a constant battle to find
the right balance between spending to maintain a state of good
repair in both transit and highways and investing in broader pro-
grams. On the one hand, maintenance is critical and early spend-
ing can avoid more expensive fixes later. On the other, funds used
to get the current system into good condition cannot be used to
Transportation in Massachusetts needs more revenue and better planning.
IV. Spending Smarter
18
create a transportation system that will meet both current and
future demands.
A more outcome-focused and data-based process would help
MassDOT and the MPOs develop and advance projects that bet-
ter meet the needs of the people of Massachusetts and are bet-
ter aligned with state policy goals, including efforts to reduce
greenhouse gases, allow seniors to remain in their communi-
ties, enhance social equity, offer workers an affordable way to
commute in off hours, and give Massachusetts communities
more efficient connections to the global market. Integrating more
diverse perspectives into the evaluation process could also result
in tapping into a broader range of funding sources to deliver the
projects.
Some projects—including some long promised and planned—
might have to be reassessed or re-shaped as their relative ben-
efits are compared to their likely costs. Such right-sizing of the
project pipeline will not be easy, but communities may prefer
it to waiting for projects that will never come or that will be so
expensive when they are finally programmed that they displace
all other needs.
The Route AheadThis paper seeks to help the public understand how the Massa-
chusetts transportation system got so maxed out. Such under-
standing is a prerequisite if the public is to be willing to support
programs and policies, some of them costly and contentious,
involving both revenues and the decision-making process for
transportation.
To their credit, state transportation agencies have been trying to
make their fiscal situations more transparent and comprehen-
sible. More detailed information about the depths and roots of
financing and other issues affecting transportation, including
possible revenue and other solutions, is also available from a
number of non-government sources. A year ago, for example,
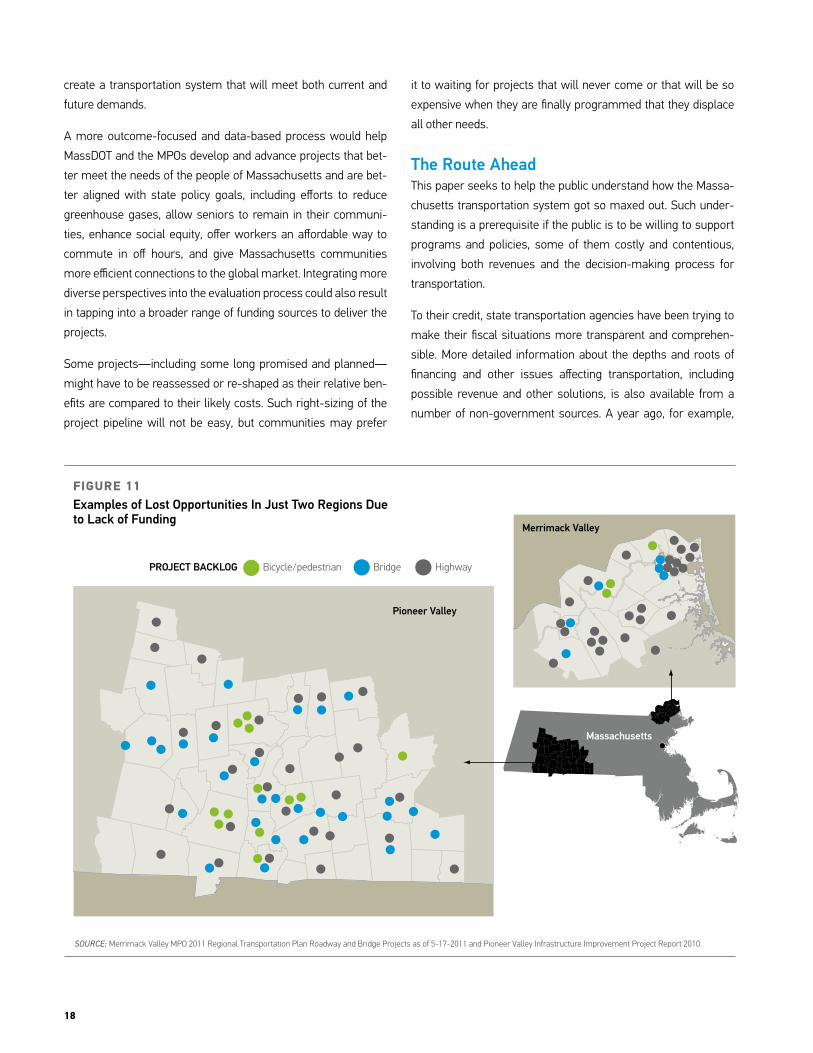
Merrimack Valley
SOURCE: Merrimack Valley MPO 2011 Regional Transportation Plan Roadway and Bridge Projects as of 5-17-2011 and Pioneer Valley Infrastructure Improvement Project Report 2010
PROJECT BACKLOG Bicycle/pedestrian Bridge Highway
FIGURE 11Examples of Lost Opportunities In Just Two Regions Due to Lack of Funding
Pioneer Valley
Massachusetts

Maxed Out: Massachusetts Transportation at a Financing Crossroad 19
Northeastern University’s Dukakis Center for Urban and Regional
Policy in collaboration with Conservation Law Foundation, held a
Blue Ribbon Summit on Financing the Massachusetts Bay Trans-
portation Authority and Regional Transit Authorities.
Organizations and events aren’t the only prompts for consider-
ation of transportation problems and solutions. Legislative pro-
posals, such as the Transportation Economic Development and
Ridership Act (TEDRA) now before the Legislature, also offer
opportunities for important analysis and discussion of multiple
financing strategies for transportation.
As MassDOT itself has recognized publicly over the past few
months, the time for a serious discussion of new revenue has
come. The following foundational criteria can help guide the
important public conversation that will hopefully now proceed:
1. The transportation system must be funded with resources sufficient to enable it to function effectively and safely today while increasing transportation choices for the future
2. To succeed in generating necessary public support, transpor-tation leaders must develop customer-based performance metrics that make clear the links between transporta-tion investments and real outcomes, such as reductions in greenhouse gas and other pollution, affordable access to jobs, less time stuck in traffic, and greater mobility options.
3. Future efforts must build on the accomplishments of forward funding and transportation reform to further improve how transportation in Massachusetts is managed and financed
4. To ensure broad-based support, leaders should conduct an open public discussion about transportation needs and options for achieving them.
That last point is especially critical. Without public understanding
and support, policies to fix the system’s fiscal and other problems
will simply not succeed. The stakes involve the future of trans-
portation in Massachusetts. And that involves the future of the
Commonwealth itself.

20
GLOSSARY OF TERMS
A&F (Executive Office of Administration and Finance) Execu-tive department in the Administration responsible for developing the Governor’s budget and overseeing other financial responsibilities for the Commonwealth.
ABP (Accelerated Bridge Program) $3 billion dollar investment over 8 years by the Administration to repair Massachusetts’s bridges using a combination of federal highway and state funds.
AC (Advance Construction) Allows states to begin a project even in the absence of sufficient federal-aid obligation authority to cover the federal share of project costs. Advance construction eliminates the need to set aside full obligational authority before starting projects. As a result, a state can undertake a greater number of concurrent projects than would otherwise be possible.26
Capital Funds Funding dedicated to new projects or projects to expand the capacity of the transportation system, including freeway widenings, rail extensions, transit station improvements, new bicycle and pedestrian lanes, and so forth. (Also see “operating funds”.)27
CIP (Capital Investment Program) The MBTA´s or MassDOT's five-year capital expenditures plan.
CTF (Commonwealth Transportation Fund) CTF is the successor to the state’s Highway Fund. It receives $1.466b annually from state sources —registry charges, fuel taxes, and sales taxes (excluding the dedicated one cent that goes directly to the MBTA). This fund is subject to appropriation by the legislature and the amount of debt service attribut-able to the fund is a function of past and current year spending.
Debt Service The amount of money owed as a result of past borrowing.
Farebox The revenues collected by transit operators from passenger fares.29
FHWA (Federal Highway Administration) See U.S. DOT.27
Forward Funding MBTA funding reform instituted in 2000 that abol-ished funding in arrears and provided MBTA with a fixed revenue stream.
FTA (Federal Transit Administration) See U.S. DOT.27
FY (Fiscal Year) Annual schedule for keeping financial records and for budgeting transportation funds. Massachusetts’s fiscal year runs from July 1 through June 30, while the federal fiscal year runs from Oct. 1 through Sept. 30.27
GANS (Grant Anticipation Notes) Used to borrow against future fed-eral-aid funds (Federal Transit Administration Title 49 grants) that are allocated by formula (Section 5307) or by project (Section 5309).27
MassDOT (Massachusetts Department of Transportation) Created in 2009 by Transportation Reform to oversee an integrated department that includes four divisions Highway, Mass Transit, Aeronautics and the Regis-try of Motor Vehicles (RMV), and an Office of Planning and Programming.
MBTA (Massachusetts Bay Transportation Authority) The agency that provides public-transportation service in eastern Massachusetts.28
MHS (Metropolitan Highway System) The portion of the Turnpike that includes the 12 mile Boston Extension along with the Sumner-Callahan and Ted Williams Tunnels which connect to Logan Airport.
MPO (Metropolitan Planning Organization) A federally required planning body responsible for the transportation planning and project selection in its region; the governor designates an MPO in every urban-ized area with a population of over 50,000 people. MPOs produce three federally mandated documents: the Transportation Plan, Transportation Improvement Program, and Unified Planning Work Program.27
MTTF (Massachusetts Transportation Trust Fund) Created by Trans-portation Reform it is one of the two structures through which state funds are funneled (the other is the CTF). The MTTF is the primary fund for MassDOT. Revenue collected in the MTTF includes Toll Revenue, non Toll Revenue, Departmental Revenue, Operating Transfer of funds from the CTF, and Contract Assistance dedicated to debt service. The MTTF funds the operating costs of the four divisions of MassDOT as well as the Office of Transportation Planning. All revenue except departmental rev-enue and the operating transfer from the CTF is restricted for Turnpike purposes.29
RTA (Regional Transit Authority) The entity responsible for providing public transportation in a region; there are 15 RTAs in Massachusetts.
SD (Structurally Deficient Bridges) A bridge is structurally deficient when the deck (driving surface), the superstructure (supports immedi-ately beneath the driving surface), or the substructure (foundation and supporting posts and piers) are rated in condition 4 or less on a scale of 1-10.
SGR (State of Good Repair) The MBTA defines SGR as the “condition where all assets perform their assigned functions without limitation”.
Transportation Reform 2009 Transportation Reform legislation restructured the way Massachusetts funds the highway system by turn-ing the Executive Office of Transportation and several other existing transportation agencies into a multimodal department of transportation, MassDOT. The Massachusetts Turnpike Authority (Turnpike) was incor-porated into the new MassDOT Highway Division, although the reorgani-zation did not eliminate the bond covenants or change the law that iso-lates Turnpike revenues for Turnpike needs.
Turnpike (Massachusetts Turnpike Authority) Sometimes called MassPike, this agency is responsible for the operation of the Massa-chusetts Turnpike and the three harbor tunnels (Sumner, Callahan, and Ted Williams).
U.S. DOT (United States Department of Transportation) The federal agency responsible for highways, mass transit, aviation and ports and headed by the secretary of transportation. USDOT includes the FHWA and the FTA, among others.27
Maxed Out: Massachusetts Transportation at a Financing Crossroad 21
END NOTES
1 Massachusetts Transportation Finance Commission (TFC), Transportation Finance in Massachusetts: An Unsustainable System, March 28, 2007. http://www.eot.state.ma.us/downloads/tfc/TFC_Findings.pdf
2 The transportation system also includes other important players, from MassPort to Regional Transit Authorities. To focus the discussion about financing issues, this paper focuses on the system’s two biggest players, MassDOT and the MBTA.
3 MassDOT, FY 2011 Capital Investment Program (MassDOT CIP). http://www.massdot.state.ma.us/Portals/17/documents/CIP/CIP_2011_2015.pdf
4 MBTA, FY 2011 Capital Investment Program (MBTA CIP). http://www.mbta.com/uploadedfiles/About_the_T/Financials/MBTA%20CIP%20FY11-FY15.pdf
5 MassDOT Guidance to the Regions for the Regional Transportation Plan.
6 MBTA Review, Independent review of MBTA finances prepared by commission headed by David D’Allesandro. November 1, 2009. http://mbtareview.com/MBTA_Review_2009.pdf
7 Our Transportation Future, Our Transportation Future White Paper, July 2010. http://www.edrgroup.com/attachments/-01_OTF%20White%20Paper%20Final%207-20-10%20v%2023.pdf
8 USDOT, Dra! USDOT Strategic Plan, 2010-2015. http://www.dot.gov/stratplan/dot_strategic_plan_10-15.pdf
9 MassDOT CIP, Id.
10 Transportation Advisory Committee Presentation (TAC), September 21, 2011.
11 TAC, Id.
12 TFC, Id.
13 TFC, Id.
14 MassDOT CIP, Id.
15 TAC, Id.
16 Massachusetts Taxpayers Foundation (MTF) presentation, Fixing Transit Finance, A Better City Forum, April 25, 2011. http://www.abettercity.org/docs/Transit%20Finance%20Slides.pdf
17 The biggest expense remains wages and benefits. At its heart, transit remains a predominantly human capital-intensive endeavor, i.e., a human being must actually drive the bus, collect fares from the vending machines and conduct safety inspections. In FY12, these expenses represent over 37 percent of all expenses. That figure does not include wages and benefits paid for commuter rail, ferries, and paratransit employees; contractors operate those services and the costs are part of the separately listed “contracted services” that account for another twenty-five percent of the FY12 budget. MBTA FY12 Operating Budget Oversight Report, MBTA Advisory Board, March 30, 2011, p. 4.
18 MBTA, Statement of Revenue and Expenses, FY 2001 to FY 2011.
19 MassDOT CIP, Id.
20 MassDOT, Fiscal Year 2011 Transportation Budget in Plain English, December 13, 2010. http://www.massdot.state.ma.us/InformationCenter/DocumentsPresentations.aspx
21 MTF Presentation, Id.
22 MBTA, 2011 Operating Budget Proposal to the Board of Directors. http://www.mbta.com/uploadedfiles/About_the_T/Financials/FY2011%20Operating%20Budget%20Board%20Action.pdf
23 MassDOT CIP, Id.
24 Id.
25 MassDOT, 2012 Capital Investment Program.http://www.mbta.com/uploadedfiles/About_the_T/Financials/MBTA%20CIP%20FY12-FY16.pdf
26 http://www.fhwa.dot.gov/ipd/finance/tools_programs/federal_aid/ac_pcac/index.htm
27 http://www.fhwa.dot.gov/ipd/finance/tools_programs/federal_debt_financing/garvees/index.htm
28 http://www.ctps.org/bostonmpo/2_planning_activities/5_transportation_terms/terms.html
29 http://www.massdot.state.ma.us/main/documents/FY12_BudgetHearing.pdf

Transportation for Massachusetts (T4MA)2181 Washington Street, Suite 310, Boston, MA 02119 • 857-205-9932 • www.T4MA.org
Related Documents