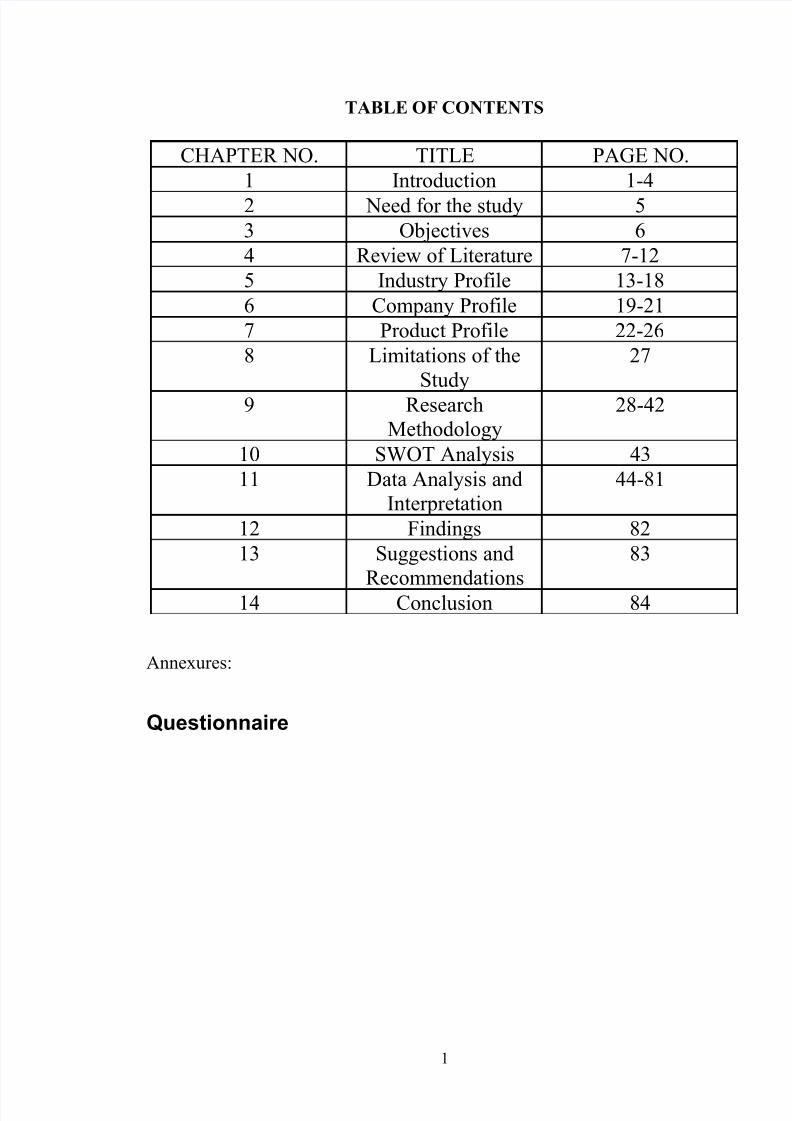
TABLE OF CONTENTS CHAPTER NO. TITLE PAGE NO. 1 Introduction 1-4 2 Need for the study 5 3 Objectives 6 4 Review of Literature 7-12 5 Industry Profile 13-18 6 Company Profile 19-21 7 Product Profile 22-26 8 Limitations of the Study 27 9 Research Methodology 28-42 10 SWOT Analysis 43 11 Data Analysis and Interpretation 44-81 12 Findings 82 13 Suggestions and Recommendations 83 14 Conclusion 84 Annexures: Questionnaire 1

Welcome message from author
This document is posted to help you gain knowledge. Please leave a comment to let me know what you think about it! Share it to your friends and learn new things together.
Transcript
8/3/2019 Max Newyork Marketing
http://slidepdf.com/reader/full/max-newyork-marketing 1/105
TABLE OF CONTENTS
CHAPTER NO. TITLE PAGE NO.
1 Introduction 1-4
2 Need for the study 5
3 Objectives 6
4 Review of Literature 7-12
5 Industry Profile 13-18
6 Company Profile 19-21
7 Product Profile 22-26
8 Limitations of the
Study
27
9 Research
Methodology
28-42
10 SWOT Analysis 43
11 Data Analysis and
Interpretation
44-81
12 Findings 82
13 Suggestions and
Recommendations
83
14 Conclusion 84
Annexures:
Questionnaire
1

8/3/2019 Max Newyork Marketing
http://slidepdf.com/reader/full/max-newyork-marketing 2/105
LIST OF TABLES
TABLE NO.TITLE
PAGE NO.
1 Gender wiseclassification of therespondent
44
2 Age wise classificationof the respondent
46
3 Occupation wiseclassification of therespondent
48
4 Income wiseclassification of therespondent
50
5 Investmentpreference of therespondent
52
6 Awareness about themutual fund
54
7 Awareness about thePyramid AdvisoryServices Ltd.
56
8 Sources of Awareness 58
9 Willingness of
respondent to invest
60
10 Response towards thetype of investment
62
11 Response towards thetype of investmentschemes
64
12 Response towards themutual fundpreference
66
13 Response towards the
size of investment
68
14 Response towards thetenure of investment
70
15 Response towards thetype of investors
72
16 Cross classificationbetween theoccupation of respondent and theirwillingness to invest inmutual fund
74
17 76
2

8/3/2019 Max Newyork Marketing
http://slidepdf.com/reader/full/max-newyork-marketing 3/105
Cross classificationbetween the income of respondent and their
willingness to invest inmutual fund.
18 Cross classificationbetween the genderof respondent andtheir willingness toinvest in mutual fund.
78
19 Cross
classification
between the age
of respondent
and their
willingness to
invest in mutual
fund.
80
3
8/3/2019 Max Newyork Marketing
http://slidepdf.com/reader/full/max-newyork-marketing 4/105
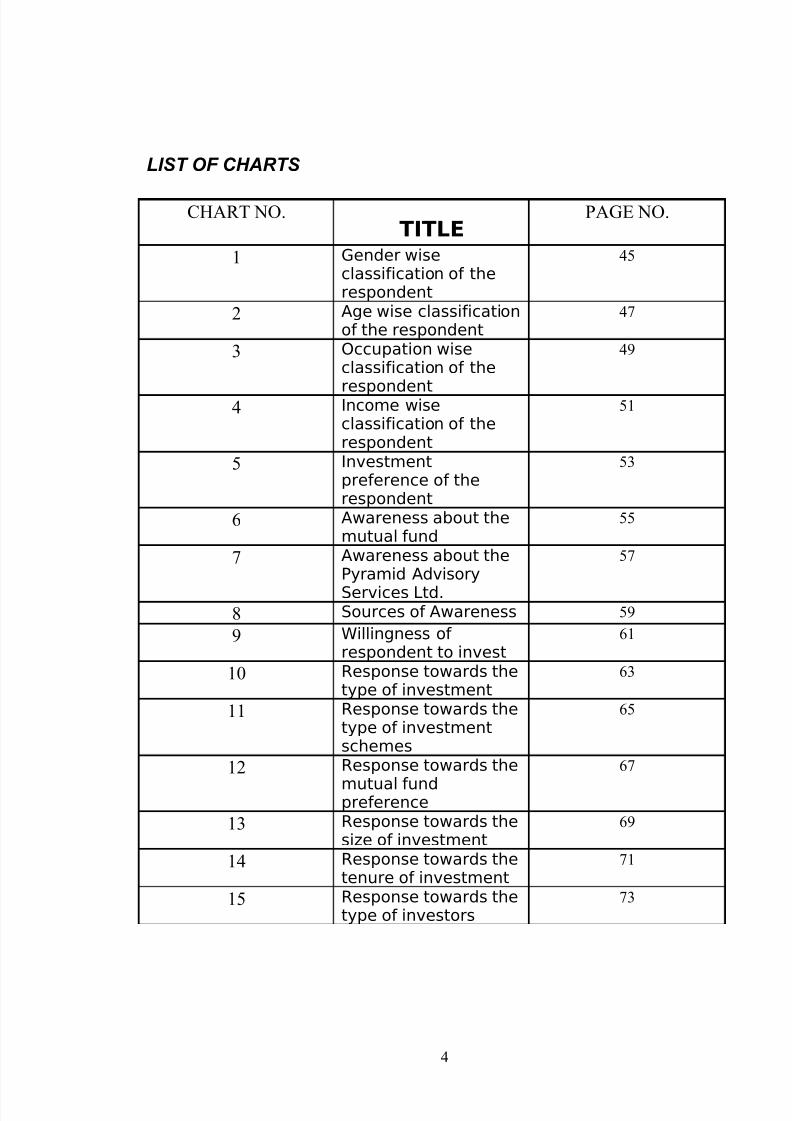
LIST OF CHARTS
CHART NO.TITLE
PAGE NO.
1 Gender wiseclassification of therespondent
45
2 Age wise classificationof the respondent
47
3 Occupation wiseclassification of the
respondent
49
4 Income wiseclassification of therespondent
51
5 Investmentpreference of therespondent
53
6 Awareness about themutual fund
55
7 Awareness about thePyramid Advisory
Services Ltd.
57
8 Sources of Awareness 59
9 Willingness of respondent to invest
61
10 Response towards thetype of investment
63
11 Response towards thetype of investmentschemes
65
12 Response towards the
mutual fundpreference
67
13 Response towards thesize of investment
69
14 Response towards thetenure of investment
71
15 Response towards thetype of investors
73
4

8/3/2019 Max Newyork Marketing
http://slidepdf.com/reader/full/max-newyork-marketing 5/105
5

8/3/2019 Max Newyork Marketing
http://slidepdf.com/reader/full/max-newyork-marketing 6/105
6

8/3/2019 Max Newyork Marketing
http://slidepdf.com/reader/full/max-newyork-marketing 7/105
7

8/3/2019 Max Newyork Marketing
http://slidepdf.com/reader/full/max-newyork-marketing 8/105
8

8/3/2019 Max Newyork Marketing
http://slidepdf.com/reader/full/max-newyork-marketing 9/105
9

8/3/2019 Max Newyork Marketing
http://slidepdf.com/reader/full/max-newyork-marketing 10/105
10

8/3/2019 Max Newyork Marketing
http://slidepdf.com/reader/full/max-newyork-marketing 11/105
11

8/3/2019 Max Newyork Marketing
http://slidepdf.com/reader/full/max-newyork-marketing 12/105
12

8/3/2019 Max Newyork Marketing
http://slidepdf.com/reader/full/max-newyork-marketing 13/105
13

8/3/2019 Max Newyork Marketing
http://slidepdf.com/reader/full/max-newyork-marketing 14/105
14

8/3/2019 Max Newyork Marketing
http://slidepdf.com/reader/full/max-newyork-marketing 15/105
15

8/3/2019 Max Newyork Marketing
http://slidepdf.com/reader/full/max-newyork-marketing 16/105
16

8/3/2019 Max Newyork Marketing
http://slidepdf.com/reader/full/max-newyork-marketing 17/105
17

8/3/2019 Max Newyork Marketing
http://slidepdf.com/reader/full/max-newyork-marketing 18/105
18
8/3/2019 Max Newyork Marketing
http://slidepdf.com/reader/full/max-newyork-marketing 19/105
1.Introduction
A mutual fund is types of investment vehicle where investors pool
their money in order to allow each investor participate in a portfolio of
securities. The individual investor doesn't actually own each security but
instead, he owns shares of the mutual fund. The main benefit of a mutual
fund is that it provides a way for the investor to achieve diversification in
his investments without having to invest a lot of money
This research conducted for pyramid advisory services (p)ltd in
Chennai. This study helps to identify and acquiring mutual funds clients by
the way of the providing awareness.
19

8/3/2019 Max Newyork Marketing
http://slidepdf.com/reader/full/max-newyork-marketing 20/105
ORIGIN OF MUTUAL FUND IN INDIA
Mutual Fund Industry Comes to India
In India, the Mutual Fund industry started with the setting up of Unit
Trust of India in 1964, as a single State Monopoly. Twenty-three years
later Public Sector banks and financial institutions were permitted to
establish Mutual Funds in 1987. The Industry was brought under the
control of SEBI and opened for private sector participation in 1993.
The private sector and foreign Institutions began setting up Mutual
Funds thereafter. The fast growing industry is regulated by the Securities
and Exchange Board of India (SEBI). A Mutual fund in India is registered /
incorporated as a public trust. As per Clause 14 of SEBI guidelines- A
mutual fund shall be constituted in the form of a trust and the instrument
of trust shall be in the form of a deed, duly registered under the provisions
of the Indian Registration Act, 1908 (16 of 1908) executed by the sponsor
in favour of the trustees named in such an instrument. If the Trust Deed
so provides the trustees can appoint an Asset Management Company for
the day to day administration of the MF and investment of its funds
Organisation Structure of Mutual Fund
"The mutual funds can be organised in two ways. One, the Trust
structure and the other, the Company structure. In both these structures,
there is an entity which undertakes the designing and marketing of
schemes, raises money from the public under the schemes and manages
the money on behalf of its owners. This entity is the fund manager or an
20

8/3/2019 Max Newyork Marketing
http://slidepdf.com/reader/full/max-newyork-marketing 21/105
Asset Management Company (AMC) . To segregate the collected funds
from this entity's own funds, the corpus is placed in a legal vehicle. It is
the character of this legal vehicle that determines the character of the
Fund itself. If this vehicle is a corporate entity then the fund acquires the
name of an investment company as in the US and UK and if the entity is a
Trust, the fund acquires the name of mutual fund as in UK and India, for
example. Irrespective of the nature of the structure, what is more
fundamental is that in view of the fiduciary role of the AMC or the fund
manager towards the public, there is a need for supervision of the
activities of the AMC or fund manager by a separate body. This
supervisory role is fulfilled by the Board of Trustees and in a corporate
structure by the Board of directors of the Investment company."
Organisation Structure of Indian Mutual Funds
There are four constituents of a mutual fund in India,
1. the sponsor,
2. the board of Trustees or Trustee company,
3. the asset management company and
4. the custodian.
The sponsor is the Settlor of the Trust which holds Trust property on
behalf of investors who are the beneficiaries of the Trust. The sponsor is
also required to contribute at least 40% of the capital of the asset
management company which is formed for managing the assets of the
Trust. The assets of the Trust comprise of properties of the schemes which
21

8/3/2019 Max Newyork Marketing
http://slidepdf.com/reader/full/max-newyork-marketing 22/105
are floated by the asset management company with the approval of the
Trustees. Schemes may have different characteristics - they may be open
or closed ended or may have a particular investment focus or portfolio
composition. Finally, the safe custody of assets of the Trust is entrusted to
one or more custodians
22

8/3/2019 Max Newyork Marketing
http://slidepdf.com/reader/full/max-newyork-marketing 23/105
2. NEED FOR THE STUDY
The study about identification and acquisition of mutual find client is
primarily involves two phases identification and acquisition.
The identification process focused on income level of particular
person whose are self employed, salaried and professionals.
The acquiring phase needs to give awareness about mutual fund
and the different types of mutual find companies; because the awareness
about the product is vital for any marketing firm to achieve its marketing
objective.
The present study “Identifying and acquiring mutual fund
clients in Chennai” attempts to analyze the suitable customers for
mutual funds and satisfying the consumers by the way of better service
23
8/3/2019 Max Newyork Marketing
http://slidepdf.com/reader/full/max-newyork-marketing 24/105
3. OBJECTIVE OF THE STUDY
Primary Objective
To know the number of clients interested to invest in mutual finds
Secondary objectives
1. To know customer awareness about the mutual find scheme
2. To know the source of awareness.
3. To know customers willing ness to join mutual fund scheme
4. To know customers preference for joining a specific mutual fund
scheme.
5. To know customers reason for willing or not willing to joins a scheme
6. To know the size of investment
7. To know whether relation exist between occupation and willingness
8. To know whether relation exists between income and willingness
9. To know whether relation exists between gender and willingness
10. To know whether relation exist between age and willingness.
11. To know respondents timing of investments.
12. To know whether investors are risk takers or risk averse
investors.
13. To know about respondents tenure of investment.
24

8/3/2019 Max Newyork Marketing
http://slidepdf.com/reader/full/max-newyork-marketing 25/105
4. REVIEW OF LITERATURE
What is mutual fund?
A mutual fund is types of investment vehicle where investors pool
their money in order to allow each investor participate in a portfolio of
securities. The individual investor doesn't actually own each security but
instead, he owns shares of the mutual fund. The main benefit of a mutual
fund is that it provides a way for the investor to achieve diversification in
his investments without having to invest a lot of money.
The first mutual fund was the Massachusetts Investors Trust
introduced in 1924. At the end of its first year, the fund had 200 investors
with $63,600 in assets. At the end of 1995, the fund grew to 73,500
investors with assets totaling $1.8 billion! Now there are over 7000
different mutual funds available for you to choose from. You may be
wondering why you should choose a mutual fund. Simple - a mutual fund
offers 2 large benefits over owning the stocks individually. Those benefits
are diversification with professional management without having to invest
a lot of money.
Diversification is important because it helps to reduce the risk. By
owning shares of multiple companies, the fund's share value is not
devastated if an individual company has a poor performance. Selecting
which securities to buy, the allocation of cash and securities, and when to
purchase is all done by the fund manager or the management team. The
fund manager has the training, time and the resources to make the best
25
8/3/2019 Max Newyork Marketing
http://slidepdf.com/reader/full/max-newyork-marketing 26/105
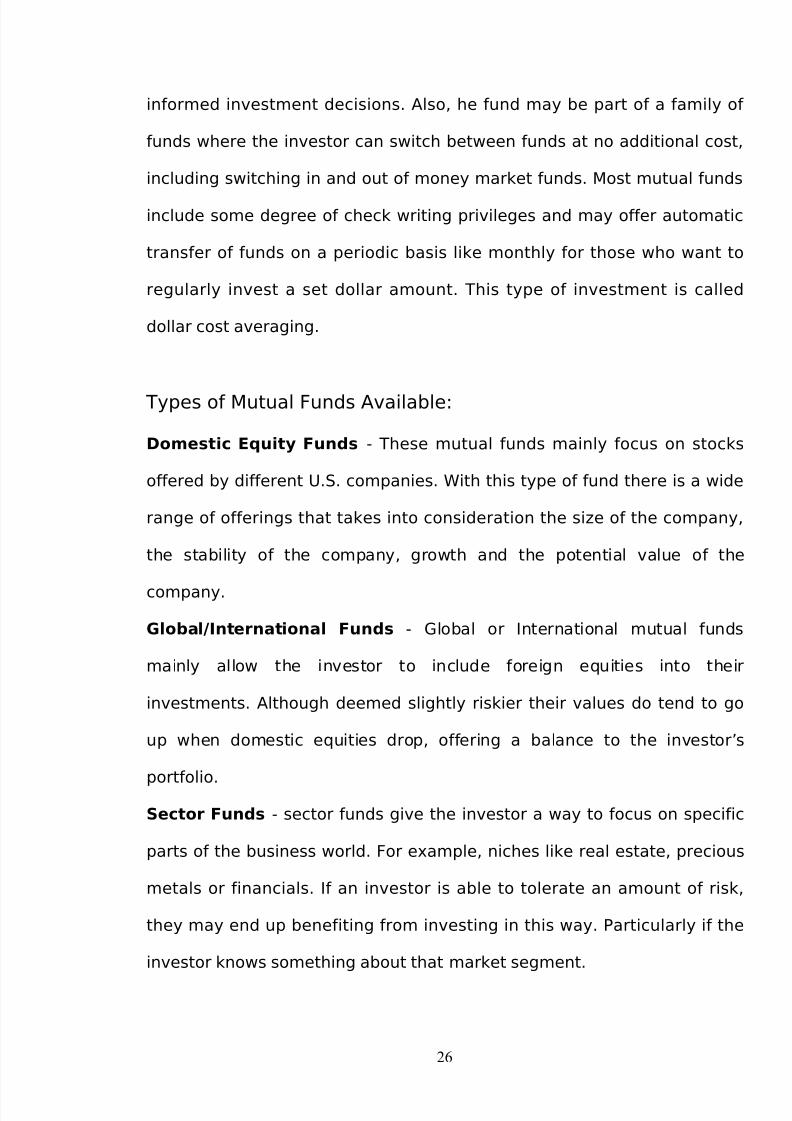
informed investment decisions. Also, he fund may be part of a family of
funds where the investor can switch between funds at no additional cost,
including switching in and out of money market funds. Most mutual funds
include some degree of check writing privileges and may offer automatic
transfer of funds on a periodic basis like monthly for those who want to
regularly invest a set dollar amount. This type of investment is called
dollar cost averaging.
Types of Mutual Funds Available:
Domestic Equity Funds - These mutual funds mainly focus on stocks
offered by different U.S. companies. With this type of fund there is a wide
range of offerings that takes into consideration the size of the company,
the stability of the company, growth and the potential value of the
company.
Global/International Funds - Global or International mutual funds
mainly allow the investor to include foreign equities into their
investments. Although deemed slightly riskier their values do tend to go
up when domestic equities drop, offering a balance to the investor’s
portfolio.
Sector Funds - sector funds give the investor a way to focus on specific
parts of the business world. For example, niches like real estate, precious
metals or financials. If an investor is able to tolerate an amount of risk,
they may end up benefiting from investing in this way. Particularly if the
investor knows something about that market segment.
26

8/3/2019 Max Newyork Marketing
http://slidepdf.com/reader/full/max-newyork-marketing 27/105
Fixed Income Funds - Fixed income mutual funds tend to be less
volatile. This is the right fund for an investor who is looking for income.
Fixed mutual funds for the most part are made up of bonds, CD's and
money market funds. Yes, they do fluctuate with interest rates, still are a
sound investment for someone looking for an income generating portfolio.
Hybrid Funds - Hybrid mutual funds are generally made up of different
investment sectors in one mutual fund. For example, a usual mix may be
the pairing of equities with bonds or blue chip stocks with riskier ones.
Index Funds - Index mutual funds imitate the selections and amounts of
specified market indexes like the S&P 500. They are generally unmanaged
keeping costs down.
Enhanced Index Funds - Enhanced index funds are actively managed
funds applying a portion of their resources to outperform their benchmark
induces.
Asset Allocation Funds - Asset allocation funds target investors who
want a single product solution. They are designed to invest across the
primary asset classes including equities, fixed income securities and
money market. Each fund is allocated among different asset classes
according to their risk tolerances.
Conservative Allocation Funds - Conservative allocation mutual funds
are usually for
investors with a minimum five-year investment timeframe.
How to Select a Mutual Fund
27
8/3/2019 Max Newyork Marketing
http://slidepdf.com/reader/full/max-newyork-marketing 28/105
Unfortunately, there's no one size fits all strategy when it comes to
any type of investing. You need to take into consideration what your
needs are and what your future financial goals are. Everyone's situation is
unique. We encourage you to talk with your financial advisor to find out
which mutual funds would best complement your portfolio. When choosing
a mutual fund you should first get a prospectus then, call the fund
company.
In many cases, the prospectus is available right on the company's
website. Also, Morningstar rates mutual funds. Each year end, many
financial publications list the year's best performing mutual funds.
Naturally, very eager investors will rush out to purchase shares of last
year's top performers. That's a big mistake. Remember, changing market
conditions make it rare that last year's top performer repeats that ranking
for the current year. Mutual fund investors would be well advised to
consider the fund prospectus, the fund manager, and the current market
conditions. Never rely on last year's top performers.
Risks the Investor may confront by Investing in a Mutual Fund
1. The companies in which the fund has invested will perform poorly,
suffer mismanagement or otherwise meet with misfortune.
2. some economic, political or other development will cause the overall
market to fall, dragging down with it the holdings of your particular
fund.
28
8/3/2019 Max Newyork Marketing
http://slidepdf.com/reader/full/max-newyork-marketing 29/105
3. Wrong Investment Decision, or speculative Decisions by MFs. The
fund management, for instance, may be doing things you don't
know about or wouldn't like if you did. What you think is a plain
vanilla domestic equity-income fund might, in order to boost
returns, invest in derivatives, invest overseas, or invest in growth
companies that pay little or no dividend. In a downturn, you could
be in for an unpleasant surprise. There is also the risk that the fund
will under-perform a benchmark index, which means that
management fees aren't buying any added value.1
The Prospectus
A prospectus for a mutual fund is a publication that has all the
information that is required by the Securities Exchange Commission (SEC).
The funds prospectus includes objectives and policies, roles, services,
fees, and major features of the fund.
The prospectus also defines the boundaries within which the fund
manager can operate. Using a hypothetical example, we will assume that
the prospectus of the Chicken Farms Mutual Fund says "the fund will only
invest in chicken farms in the USA that have shown a profit for at least the
last two years." The fund manager would have the freedom to buy stock
in any chicken farm meeting those criteria. However, the fund could not
buy any chicken farm shares anywhere else other than the U.S.The
prospectus also tells you the costs of the fund.
Advantages of mutual funds
The advantages of investing in a Mutual Fund are:
29

8/3/2019 Max Newyork Marketing
http://slidepdf.com/reader/full/max-newyork-marketing 30/105
• Diversification: The best mutual funds design their portfolios so
individual investments will react differently to the same economic
conditions. For example, economic conditions like a rise in interest
rates may cause certain securities in a diversified portfolio to
decrease in value. Other securities in the portfolio will respond to
the same economic conditions by increasing in value. When a
portfolio is balanced in this way, the value of the overall portfolio
should gradually increase over time, even if some securities lose
value.
• Professional Management: Most mutual funds pay topflight
professionals to manage their investments. These managers decide
what securities the fund will buy and sell.
•
Regulatory oversight: Mutual funds are subject to many
government regulations that protect investors from fraud.
• Liquidity: It's easy to get your money out of a mutual fund. Write a
check, make a call, and you've got the cash.
• Convenience: You can usually buy mutual fund shares by mail,
phone, or over the Internet.
• Low cost: Mutual fund expenses are often no more than 1.5
percent of your investment. Expenses for Index Funds are less than
that, because index funds are not actively managed. Instead, they
automatically buy stock in companies that are listed on a specific
index
30

8/3/2019 Max Newyork Marketing
http://slidepdf.com/reader/full/max-newyork-marketing 31/105
• Transparency
• Flexibility
• Choice of schemes
• Tax benefits
• Well regulated
5. INDUSTRY PROFILE
About the industry
A Mutual Fund is a trust that pools the savings of a number of
investors who share a common financial goal. The money which is
collected is then invested in capital market instruments such as shares,
debentures and other securities. The income earned through these
investments and the capital appreciation realised are shared by its unit
holders in proportion to the number of units owned by them. As on 2004,
mutual funds contribute about 6% of the GDP
Mutual funds were introduced in India in the year 1963. Between
1963 and 1987 there was existence of only one mutual fund company in
India with Rs. 67bn assets under management (AUM). It was Unit Trust of
India (UTI). By the end of the 80s decade, few other mutual fund
companies in India took their position in mutual fund market. Kothari
Pioneer was the first private sector mutual fund company in India which
has now merged with Franklin Templeton. Just after ten years with private
31

8/3/2019 Max Newyork Marketing
http://slidepdf.com/reader/full/max-newyork-marketing 32/105
sector players’ penetration, the total assets rose up to Rs. 1218.05 bn.
Today there are 33 mutual fund companies in India.
The growth remained slow in the initial years, but it accelerated
from the year 1987 when private players entered the industry. In the past
decade, Indian mutual fund industry had seen dramatic improvements,
both quality wise as well as quantity wise. The private sector entry to the
fund family rose the AUM to Rs. 470 bn in March 1993 and till April 2004,
it reached the height of 1,540 bn. Putting the AUM of the Indian Mutual
Funds Industry into comparison, the total of it is less than the deposits of
SBI alone, constitute less than 11% of the total deposits held by the Indian
banking industry. The mutual fund industry can be broadly put into four
phases according to the development of the sector. Each phase is briefly
described as under.
First Phase 1964 - 87
Unit Trust of India (UTI) was established on 1963 by an Act of
Parliament. It was set up by the Reserve Bank of India and functioned
under the Regulatory and administrative control of the Reserve Bank of
India. In 1978 UTI was de-linked from the RBI and the Industrial
Development Bank of India (IDBI) took over the regulatory and
administrative control in place of RBI. The first scheme launched by UTI
was Unit Scheme 1964. At the end of 1988 UTI had Rs.6, 700 crores of
assets under management.
Second Phase 1987-1993 (Entry of Public Sector Funds)
32
8/3/2019 Max Newyork Marketing
http://slidepdf.com/reader/full/max-newyork-marketing 33/105
SBI Mutual Fund was the first to start up. It was followed by Canbank
Mutual Fund (Dec 87), Punjab National Bank Mutual Fund (Aug 89), Indian
Bank Mutual Fund (Nov 89), Bank of India (Jun 90), Bank of Baroda Mutual
Fund (Oct 92). LIC in 1989 and GIC in 1990. The end of 1993 marked
Rs.47,004 as Assets under Management.
Third Phase 1993-2003 (Entry of Private Sector Funds)
With the entry of private sector funds in 1993, a new era started in
the Indian mutual fund industry, giving the Indian investors a wider choice
of fund families. Also, 1993 was the year in which the first Mutual Fund
Regulations came into being, under which all mutual funds, except UTI
were to be registered and governed. The erstwhile Kothari Pioneer (now
merged with Franklin Templeton) was the first private sector mutual fund
registered in July 1993. The 1993 SEBI (Mutual Fund) Regulations were
substituted by a more comprehensive and revised Mutual Fund
Regulations in 1996. The industry now functions under the SEBI (Mutual
Fund) Regulations 1996.
The number of mutual fund houses went on increasing, with many
foreign mutual funds setting up funds in India and also the industry has
witnessed several mergers and acquisitions. As at the end of January
2003, there were 33 mutual funds with total assets of Rs. 1,21,805 crores.
33
8/3/2019 Max Newyork Marketing
http://slidepdf.com/reader/full/max-newyork-marketing 34/105
The Unit Trust of India with Rs.44, 541 crores of assets under
management was way ahead of other mutual funds.
Fourth Phase since February 2003
This phase had bitter experience for UTI. It was bifurcated into two
separate entities. One is the Specified Undertaking of the Unit Trust of
India with AUM of Rs.29, 835 crores (as on January 2003). The Specified
Undertaking of Unit Trust of India, functioning under an administrator and
under the rules framed by Government of India and does not come under
the purview of the mutual fund regulations.
The second is the UTI Mutual Fund Ltd, sponsored by SBI, PNB, BOB
and LIC. It is registered with SEBI and functions under the Mutual Fund
Regulations. With the bifurcation of the erstwhile UTI which had in March
2000 more than Rs.76,000 crores of AUM and with the setting up of a UTI
Mutual Fund, conforming to the SEBI Mutual Fund Regulations, and with
recent mergers taking place among different private sector funds, the
mutual fund industry has entered its current phase of consolidation and
growth. As at the end of September, 2004, there were 29 funds, which
manage assets of Rs.153108 crores under 421 schemes.
The major competitors of the company
There are many advisory agencies in Chennai. They are given
below,
1. Geogit financial services limited.
34
8/3/2019 Max Newyork Marketing
http://slidepdf.com/reader/full/max-newyork-marketing 35/105
2. V.K.C financial services
3. E.C.S investment and financial consultants’ services.
4. UTI investor service limited.
5. Shah investment advisory services.
6. Appollo Sindhoori
7. Jayesh Agency.
8. Mahara jyothi Services.
9. Cholamandalam District services limited
10. ITI financial services.
Some Major Mutual Fund Companies in India are
1. Birla Sun Life Mutual Fund
2. HDFC Mutual Fund
3. HSBC Mutual Fund
4. Prudential ICICI Mutual Fund
5. State Bank of India Mutual Fund
6. Tata Mutual Fund
7. Sundaram Mutual fund
8. Kotak Mahindra Mutual Fund
9. Unit Trust of India Mutual Fund
10. Canbank Mutual Fund
35
8/3/2019 Max Newyork Marketing
http://slidepdf.com/reader/full/max-newyork-marketing 36/105
11. Principal Capital Mutual Fund
12. Standard Chartered Mutual Fund
13. Franklin Templeton India Mutual Fund
14. Morgan Stanley Mutual Fund India
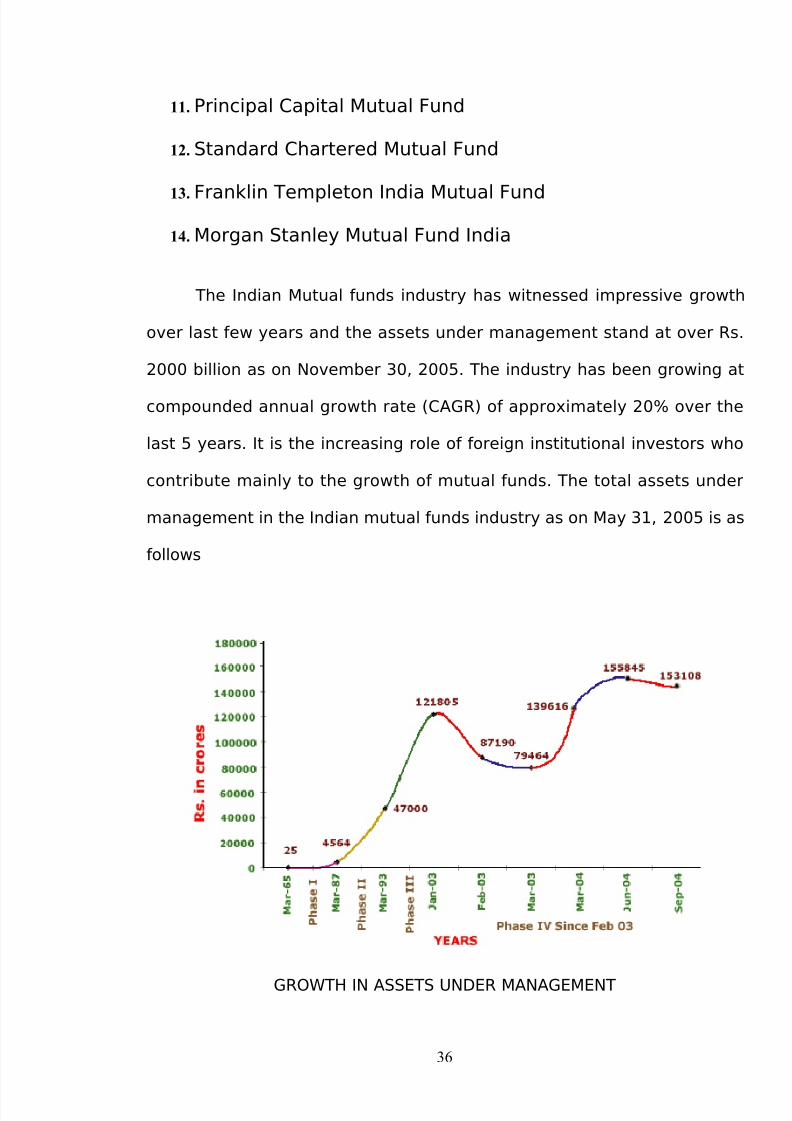
The Indian Mutual funds industry has witnessed impressive growth
over last few years and the assets under management stand at over Rs.
2000 billion as on November 30, 2005. The industry has been growing at
compounded annual growth rate (CAGR) of approximately 20% over the
last 5 years. It is the increasing role of foreign institutional investors who
contribute mainly to the growth of mutual funds. The total assets under
management in the Indian mutual funds industry as on May 31, 2005 is as
follows
GROWTH IN ASSETS UNDER MANAGEMENT
36
8/3/2019 Max Newyork Marketing
http://slidepdf.com/reader/full/max-newyork-marketing 37/105
6. COMPANY PROFILE
PYRAMID ADVISORY SERVICES(P) LIMITED was established in the
year2003. It was founded by Mr. Venkatesh.
Wealth Creation and Wealth Protection is the prime objective
of the company. It has three major units. The following are the three
major units of the company.
Mutual Funds
Share broking
Insurance
Share broking:
PYRAMID ADVISORY SERVICES(P) LTD. acts as a broker in buying and
selling of shares in stock market. It functions as a sub-broker to ITI financial services
private limited.
The company as a broker offers investor the following broking services:
Advisory:
The broker offers advice on the purchase and or sale of shares in the
investor’s portfolio –the investors are holding of shares.
Discretionary:
This is a management service of buying and selling of shares on behalf
of the client, completely at the discretion of the broker.
37

8/3/2019 Max Newyork Marketing
http://slidepdf.com/reader/full/max-newyork-marketing 38/105
Mutual Funds:
The Company acts as an agency for acquiring mutual fund clients. In this unit
the company tries to acquire the clients for mutual funds by convincing the
customers. It is mainly done by making cold calls by using telemarketers.
The following are the various mutual funds for which the company acts as an
agency and acquires clients for them.
UTI Mutual Funds
SBI Mutual Funds
HDFC Mutual Funds
Reliance Mutual Funds
HSBC Mutual Funds
TATA Mutual Fund
Other Mutual Fund
Thus the company helps in acquiring clients for all the above mentioned Mutual
Funds. Mainly this company concentrates on mutual fund and share broking.
Insurance:
The company in this unit acts as an agency for acquiring clients for various
insurance policies. In this unit the company covers the insurance
• life insurance
• general insurance.
• Vehicle Insurance.
Thus these are the three major units dealt in by the company and in this
research the share broking unit has been concentrated.
38

8/3/2019 Max Newyork Marketing
http://slidepdf.com/reader/full/max-newyork-marketing 39/105
Vision:
The vision of the company is to become a market leader among the various
financial servicing companies. So the company works hard to achieve its vision in a
quick span of time.
39
8/3/2019 Max Newyork Marketing
http://slidepdf.com/reader/full/max-newyork-marketing 40/105
7. PRODUCT PROFILE
Types of funds
Equity funds
Funds, which have long-term capital appreciation, are referred to as
equity funds. The risk and return involvement is very high.
Debt funds
Funds, which have fixed returns and comparatively low risk are
called as debt funds. This fund features more capital stability.
Liquid funds
Funds, which have very stable returns and very low capital risk, are
called as liquid funds.
Balanced funds
Funds which strike a balance between growth and steady returns is
referred to as balanced funds. The returns are better in the long term.
Growth funds
Funds that have an extreme volatility in their performance are
called as growth funds.
40
8/3/2019 Max Newyork Marketing
http://slidepdf.com/reader/full/max-newyork-marketing 41/105
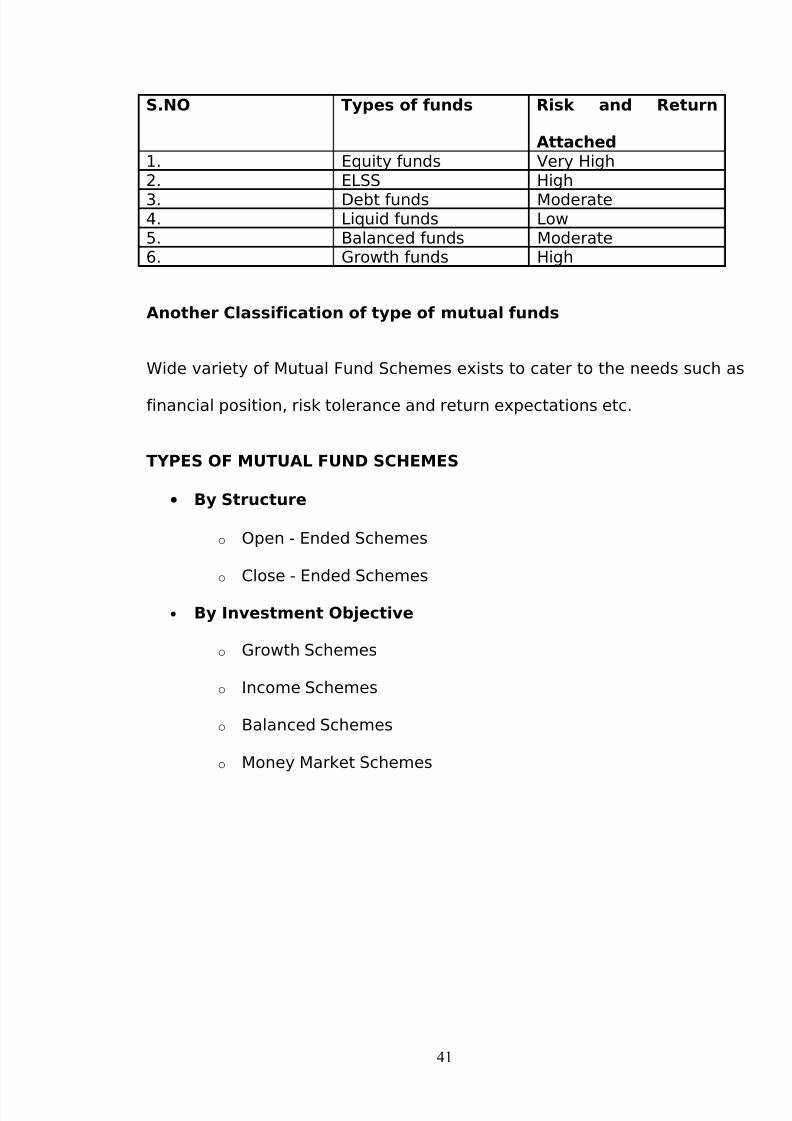
S.NO Types of funds Risk and Return
Attached1. Equity funds Very High2. ELSS High
3. Debt funds Moderate4. Liquid funds Low5. Balanced funds Moderate6. Growth funds High
Another Classification of type of mutual funds
Wide variety of Mutual Fund Schemes exists to cater to the needs such as
financial position, risk tolerance and return expectations etc.
TYPES OF MUTUAL FUND SCHEMES
• By Structure
o Open - Ended Schemes
o Close - Ended Schemes
• By Investment Objective
o Growth Schemes
o Income Schemes
o Balanced Schemes
o Money Market Schemes
41

8/3/2019 Max Newyork Marketing
http://slidepdf.com/reader/full/max-newyork-marketing 42/105
Other Schemes
o Tax Saving Schemes ( ELSS)
o Special Schemes
Index Schemes
Sector Specfic Schemes
About concepts and definitions
Net Asset Value
Net Asset Value is determined by dividing the total value of the
fund's assets by the number of outstanding shares. This value is
calculated daily by the fund.
Unit Value = Market Value of the investments + Current Assets-
Current Liabilities and Provisions+/- Transaction Charges
Number of outstanding units in the fund
Back End Load
A fee an investor pays when selling a mutual fund within a certain number
of years, usually seven.
Sale price
It is the price one pays when an investor invests in a scheme. It is also
called as Offer Price. It may include a sales load.
42

8/3/2019 Max Newyork Marketing
http://slidepdf.com/reader/full/max-newyork-marketing 43/105
Repurchase price
It is the price at which a close-ended scheme repurchases its units and it
may include a back-end load. This is also called Bid Price.
Sales load
It is a charge collected by a scheme when it sells the units. It is also
called, ‘Front-end’ load. Schemes that do not charge a load are called ‘No
Load’ schemes.
Repurchase or ‘Back end’ Load
It is a charge collected by a scheme when it buys back the units from the
unit holders.
Bench Mark Index
The benchmarks are the yard sticks with which the performance of an
individual item can be compared. As the funds’ portfolio consists of
diversified equity shares, the benchmark will be usually the stock market
indices. The benchmark index used for comparing the funds is BSE 200.
The benchmark index is referred to as the market index.
Costs of Mutual Funds
Usually, mutual funds are offered with several classes of shares, or
they are no-load funds. Mutual fund companies exist to make money. That
money can come from many different sources:
43

8/3/2019 Max Newyork Marketing
http://slidepdf.com/reader/full/max-newyork-marketing 44/105
A sales charge: incurred upon purchase of shares
A deferred sales charge: incurred upon the sale of shares
Management fees: an on going operating cost
Distribution fees: on-going costs usually associated with advertising
Trading costs: costs charged by the broker for executing trades within
the fund. These can be high in funds that have high turnover rates.
Other expenses: another category for on going expenses No load funds
will typically have no sales charge and no deferred sales charge, but will
have the fees listed
Load funds will offer different classes of shares such as A, B, or C
shares. These will be defined by varied cost structures. An example of the
impact of an investment which is held for different time periods will also
be included in the prospectus. The best deal for you primarily depends on
how long you hold the shares. No-load funds that are held for many years
can be more expensive than load funds.
In conclusion, mutual funds are a way for investors to diversify their risk
and still benefit from professional money management. The prospectus
identifies key information about the mutual fund including its operating
boundaries and its costs. The fund manager operates within those
boundaries and is important in order to achieve good results within those
boundaries. Do your research, and then talk to a professional investment
advisor about mutual fund investing. Global Direct Investment Guide
provides access to free Mutual Funds information.
44
8/3/2019 Max Newyork Marketing
http://slidepdf.com/reader/full/max-newyork-marketing 45/105
8. LIMITATION OF THE STUDY
Any research study will be restricted in scope by certain inherent
limitations that are participated by the choice of the research design,
sampling procedure and respondent selection. This study has the
following limitations.
1. The area of survey covered in and around Chennai city only.
2. The time available to provide awareness is very less.
3. Due to limited time of survey we can’t acquire more customers
45

8/3/2019 Max Newyork Marketing
http://slidepdf.com/reader/full/max-newyork-marketing 46/105
9. RESEARCH METHODOLOGY
Research:
Research for facts, answer to questions and solutions to problems. It
is an organized inquiry. It seeks to find explanation to an explained
phenomenon to clarity the doubtful facts and to correct to misconceived
fact.
Method of Research
1. Arbitrary method: Seeking answer to questions consists of
imagination, opinion, blind belief or impression. E.g.; Earth was flat, solar
eclipse due to as big snake swallows sub .it is subjective , vague and
inaccurate.
2. Scientific method: A systematic rational approach to seeking facts. It
is objective, precise, and arrives at conclusion on the basis of verifiable
evidences.
46
8/3/2019 Max Newyork Marketing
http://slidepdf.com/reader/full/max-newyork-marketing 47/105
Research & Theory
Theory is a set of systematically interrelated concept, definitions,
and propositions that are advanced to explain and predict phenomenon
or facts .
Research is closely related to theory. Theory is a conceptual model
for research. Research, in turn, contributes to theory.
Fact
An empirically verifiable observation.
Hypothesis
A preliminary assumption adopted for the explanation of a phenomenon.
Classification of Research
1. Pure research: It is undertaken for the sake of knowledge without
any intention to apply it in practice.
2. Applied research: It is carried on to find solutions to a real life
problem requiring an action or policy decision .Thus, it is problem
oriented and action oriented.
3. Exploratory research: preliminary study of an unfamiliar problem
about which the researcher has no knowledge. It is unstructured and
47

8/3/2019 Max Newyork Marketing
http://slidepdf.com/reader/full/max-newyork-marketing 48/105
much less focused on pre-determined objectives. Usually it takes
the form of a pilot study.
4. Descriptive research : Fact finding investigation with adequate
interpretation-more specific than exploratory study , as it focus on
particular aspects as dimensions of the problem studied – designed
to gather descriptive information and provides the information for
formulating more sophisticated studies.
5. Diagnostic research : It is similar to descriptive research, but
focus on
a. What is happening
b. Why is happening, and
c. What can be done about?
6. Evaluation research: A type of applicable research – made for
assessing the effectiveness of social or economic programs on the
development of Programme area.
7. Action research: A type of evaluating research – it is a concurrent
evaluation research of an action program launched for ordering a
problem for improving an existing situation.
8. Experimental research: Designed to users. Human effects of
particular variables or a phenomenon by keeping the other variable
constant or controlled.
9. Analytical research: A system of procedures and techniques of
analysis applied to quantitative data – consists of a system of
48

8/3/2019 Max Newyork Marketing
http://slidepdf.com/reader/full/max-newyork-marketing 49/105
mathematical methods or statistical techniques applicable to
numeric data.
10. Historical research : A study of past records and other information
source with a view to reconstructing the origin and development of
an institution or a movement or a system and discovering the trends
in part .
49

8/3/2019 Max Newyork Marketing
http://slidepdf.com/reader/full/max-newyork-marketing 50/105
SAMPLING TECHNIQUES
A sample is a definite plan determined before any data are actually
collected for obtaining a sample from a given population . Samples can be
either probability sample or non- probability samples.
a. Probability Samples:
They are distinguished by the fact that each population
element has a Known non-zero chance of being included in the sample.
A sample is a definite plan determined before any data are actually
collected for obtaining a sample. The objective Selection of elements in
turn allows the objective assessment of the reliability of the sample
results. Thus it will be more representative of the population.
( i) Sample Random Sample: They are popular known as probability
samples as they are distinguished by the fact that each element of the
population has not only a known but an equal chance of being selected,
and further ‘m’ that every combination of population elements is a sample
probability and is just as likely ‘n’ occur as any other combination of an ‘n’
units.
( ii) Complex Random Sample : They may also be called ‘mixed
sampling designs’ as many of such designs may represent a combination
50
8/3/2019 Max Newyork Marketing
http://slidepdf.com/reader/full/max-newyork-marketing 51/105
of probability and non-probability sampling procedures in selecting a
sample . It includes:
1)Systematic Sampling:
It is the method in which every first item in the list may be
selected . An element of randomness is usually introduced into this kind of
sampling by using random numbers to pick up the unit with which to start.
2)Stratified Sampling:
If the population from which a sample is to be drawn does not
constitute a homogeneous group , then stratified sampling technique is
applied so as to obtain a representative sample .
3)Cluster Sampling:
It involves grouping the population and then selecting the groups or
the clusters rather than individual elements for inclusion in the sample .
4)Area Sampling:
It is quite closer to cluster sampling and is often talked about when
the total geographical area of interest happens to be big one. It is
especially helpful where we do not have the list of the population
concerned. It also makes the field interviewing more efficient since
interviewer can do many interviews at each location.
51
8/3/2019 Max Newyork Marketing
http://slidepdf.com/reader/full/max-newyork-marketing 52/105
5)Multi – Stage sampling:
It is a further development of the principle of cluster sampling. If the
technique of random sampling is applied to all the stages; the sampling
procedure is described as multi-stage random sampling.
6) Sequential sampling:
This is a complex random sampling. Where the ultimate size of the
sample is not fixed in advance, is determined according to mathematical
decisions on the basis of information yielded as survey progresses.
B.Non-Probability Samples:
It is a sampling procedure, which does not afford any basics for
estimating the probability that each item in the population has of being
include in the sample . It involves personal judgment, somewhere in the
selection process .
( i) Convenience Sampling : population elements are selected for
inclusion in the sample based on the ease of the access. They are not
generally recommended for descriptive or causal research.
( ii) Judgment Sampling: The researcher’s judgment is used for
selecting items , which he consider as representative of the population . It
is quite frequently in qualitative research where the desire happens to be
developing hypothesis rather than to generalize to larger population.
( iii)Quota Sampling : In stratified sampling, the cost of taking random
samples from individual strata, is often so expensive that interviewer’s are
52
8/3/2019 Max Newyork Marketing
http://slidepdf.com/reader/full/max-newyork-marketing 53/105
simply given quota to be filled from different strata, the actual selection of
items for sample being left to the interviewer’s judgment .
COLECTION OF DATA
The information needed for the study is of 2 types – primary data
and secondary data.
Primary data:
It was collected a fresh and for the first time, and this is original in
character.
The primary data was collected mainly-
1) Observation:
Commonly used method of primary data collection especially for
studies relating to behavior sciences. Observation becomes a scientific
tool and the method of data collection for the researcher, when it serves a
formulated research purpose, it systematically planned and recorded and
is subjected to checks and controls on validity and reliability. Here, the
respondent is not asked any questions. This method is practically suitable
in studies, which deals with studies (respondents) that are not capable of
giving verbal reports of their feelings.
53
8/3/2019 Max Newyork Marketing
http://slidepdf.com/reader/full/max-newyork-marketing 54/105
2) Interview:
Method of collecting data involves presentation of oral, verbal
stimuli and reply in terms of oral verbal responses. It can be done through
personal interviews or telephone interviews.
Personal interviews take forms – individual and group interviewing.
Individual interviewing involves talking with people in their homes or
officers, on the Street, or in shopping malls, etc. Such interviewing is
flexible. Group interviewing consists of inviting 6-10 people to gather for a
few hours with a trained moderator to talk about a product service or
organization. The participants are normally paid for attending.
The moderator encourages free and easy discussion, hoping that
group interactions will bring out actual feeling and thoughts. In personal
interview method, a person known as interviewer will ask questions
generally in a face-to-face contact to other persons. In this method, the
interviewer has to meet all sources personally from where the data has to
be collected.
Telephone Interviews includes the method of collecting information
consist of contacting respondents on telephone itself.
It is not very widely used but in case of industrial surveys especially
in developed regions.
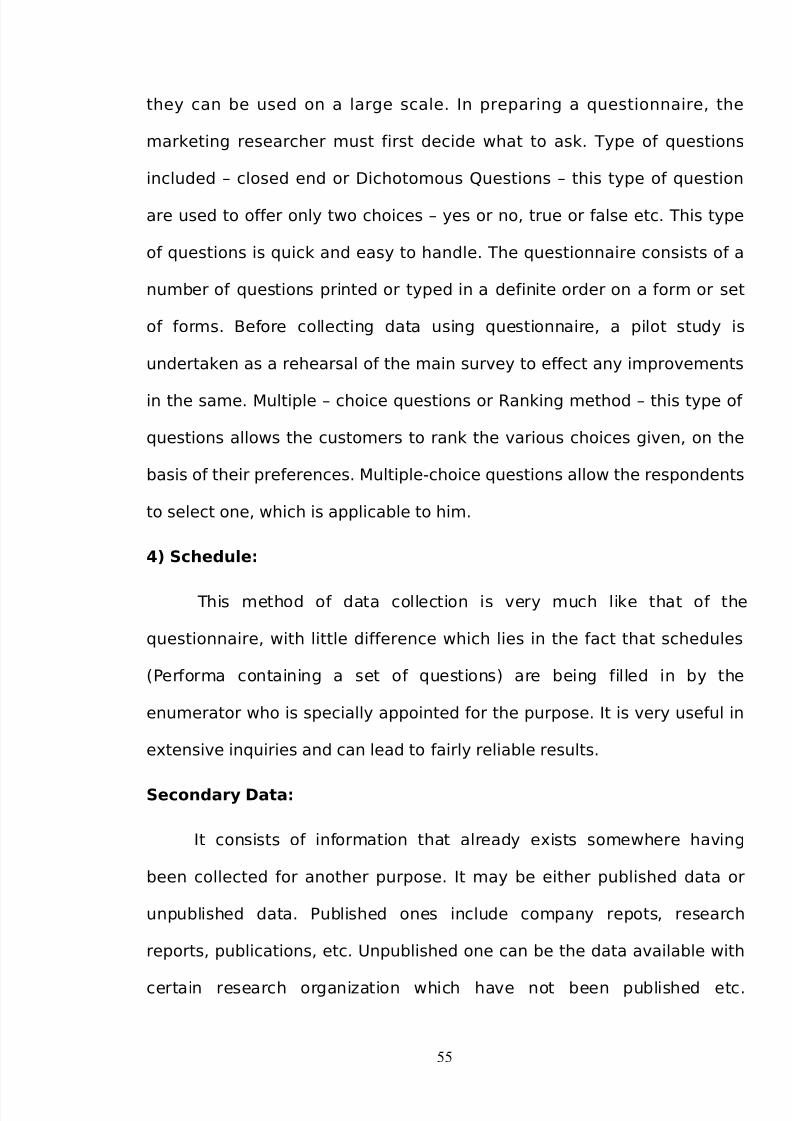
3) Questionnaires
Questionnaires are very flexible – there are many ways to ask
questions. However, they must be developed carefully and tested before
54
8/3/2019 Max Newyork Marketing
http://slidepdf.com/reader/full/max-newyork-marketing 55/105
they can be used on a large scale. In preparing a questionnaire, the
marketing researcher must first decide what to ask. Type of questions
included – closed end or Dichotomous Questions – this type of question
are used to offer only two choices – yes or no, true or false etc. This type
of questions is quick and easy to handle. The questionnaire consists of a
number of questions printed or typed in a definite order on a form or set
of forms. Before collecting data using questionnaire, a pilot study is
undertaken as a rehearsal of the main survey to effect any improvements
in the same. Multiple – choice questions or Ranking method – this type of
questions allows the customers to rank the various choices given, on the
basis of their preferences. Multiple-choice questions allow the respondents
to select one, which is applicable to him.
4) Schedule:
This method of data collection is very much like that of the
questionnaire, with little difference which lies in the fact that schedules
(Performa containing a set of questions) are being filled in by the
enumerator who is specially appointed for the purpose. It is very useful in
extensive inquiries and can lead to fairly reliable results.
Secondary Data:
It consists of information that already exists somewhere having
been collected for another purpose. It may be either published data or
unpublished data. Published ones include company repots, research
reports, publications, etc. Unpublished one can be the data available with
certain research organization which have not been published etc.
55

8/3/2019 Max Newyork Marketing
http://slidepdf.com/reader/full/max-newyork-marketing 56/105
Secondary data can include internal data, which are those found within
the organization for which the research is being done, and external data,
which are those obtained from outside sources. Secondary data also
posses significant cost and time advantages.
PROCEDURE FOR DATA ANALYSIS
The data, after collection has to be processed and analyzed in
accordance with the outline laid down for the purpose at the time of
developing the research plan. This is essential for a scientific study and
for ensuring that we have all relevant data for making contemplated
comparisons and analysis. Technically speaking processing implies
editing, coding, classification and tabulation.
1) Editing:
Editing of data is a process of examining the collected raw data to
delete errors and omissions and to correct these. Thus editing involves a
careful scrutiny of the completed questionnaires and or schedules. Editing
is done to assure that the data are accurate consistent with other facts
gathered, uniformly entered, as complete as possible and have been all
arranged to facilitate coding and tabulation. It can be of two types:
a) Field editing: It consists of the review of the reporting forms
by the investigator for completing (translating or rewriting)
56
8/3/2019 Max Newyork Marketing
http://slidepdf.com/reader/full/max-newyork-marketing 57/105
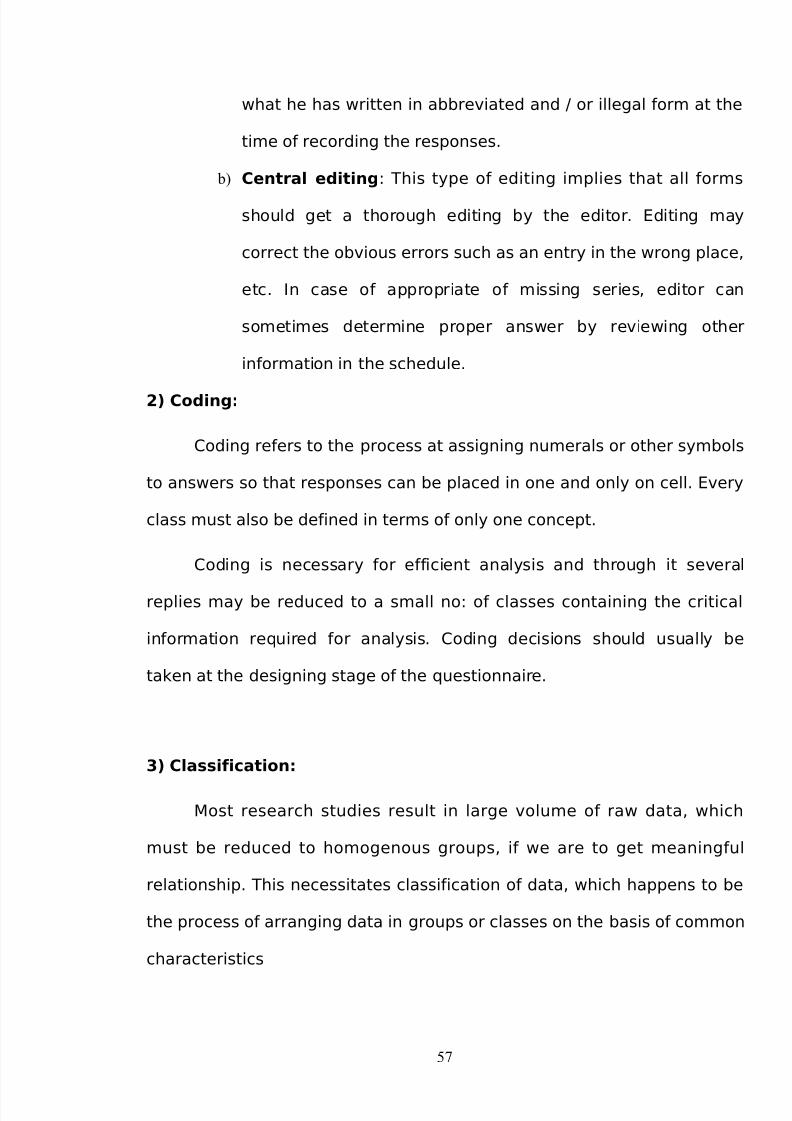
what he has written in abbreviated and / or illegal form at the
time of recording the responses.
b) Central editing: This type of editing implies that all forms
should get a thorough editing by the editor. Editing may
correct the obvious errors such as an entry in the wrong place,
etc. In case of appropriate of missing series, editor can
sometimes determine proper answer by reviewing other
information in the schedule.
2) Coding:
Coding refers to the process at assigning numerals or other symbols
to answers so that responses can be placed in one and only on cell. Every
class must also be defined in terms of only one concept.
Coding is necessary for efficient analysis and through it several
replies may be reduced to a small no: of classes containing the critical
information required for analysis. Coding decisions should usually be
taken at the designing stage of the questionnaire.
3) Classification:
Most research studies result in large volume of raw data, which
must be reduced to homogenous groups, if we are to get meaningful
relationship. This necessitates classification of data, which happens to be
the process of arranging data in groups or classes on the basis of common
characteristics
57
8/3/2019 Max Newyork Marketing
http://slidepdf.com/reader/full/max-newyork-marketing 58/105
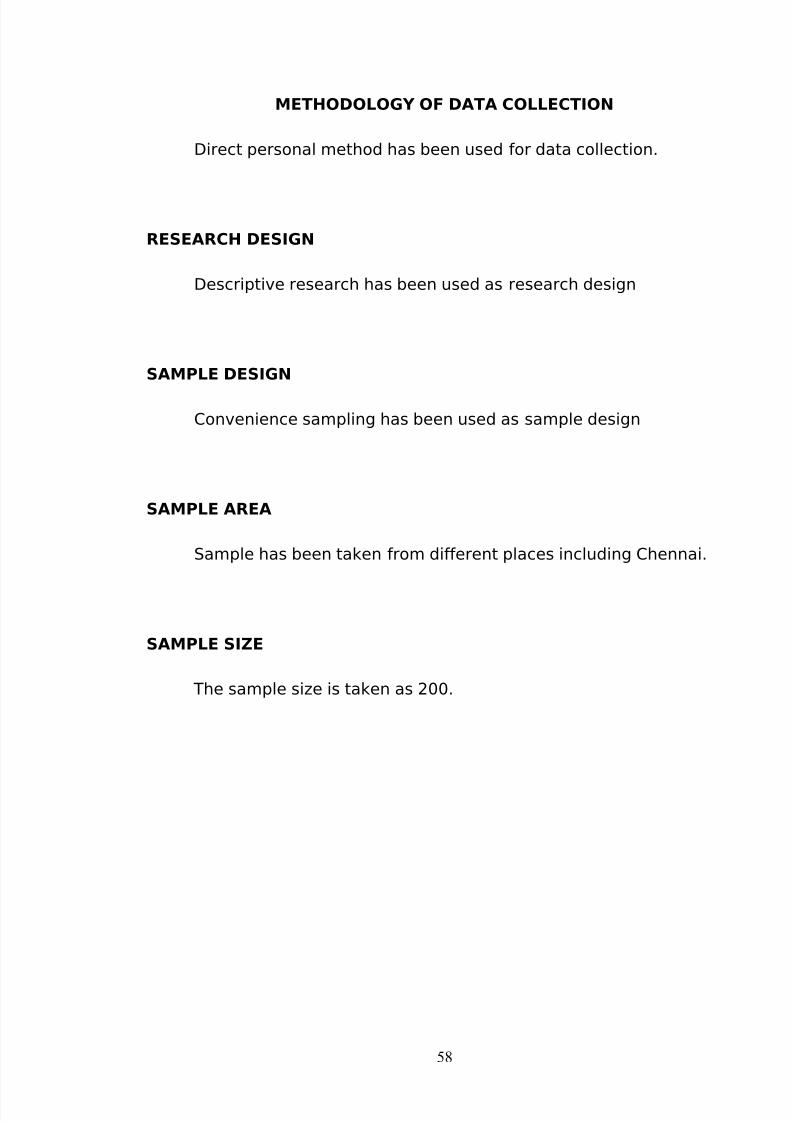
METHODOLOGY OF DATA COLLECTION
Direct personal method has been used for data collection.
RESEARCH DESIGN
Descriptive research has been used as research design
SAMPLE DESIGN
Convenience sampling has been used as sample design
SAMPLE AREA
Sample has been taken from different places including Chennai.
SAMPLE SIZE
The sample size is taken as 200.
58
8/3/2019 Max Newyork Marketing
http://slidepdf.com/reader/full/max-newyork-marketing 59/105
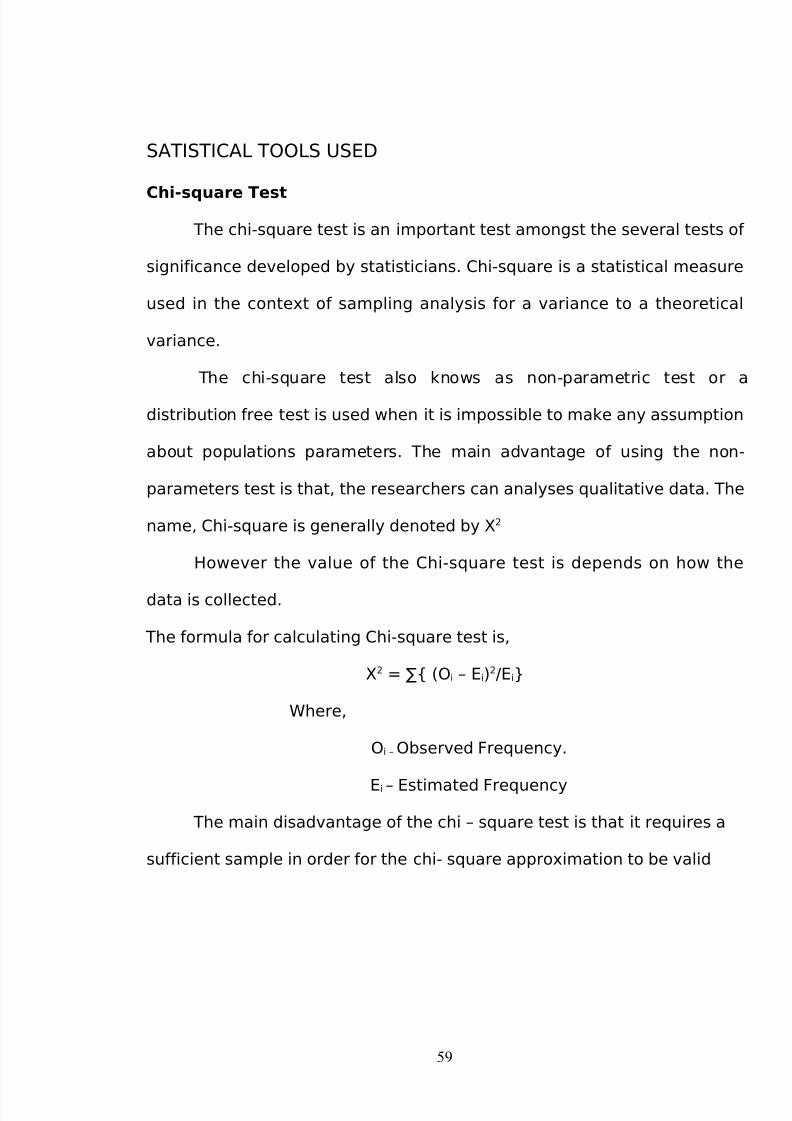
SATISTICAL TOOLS USED
Chi-square Test
The chi-square test is an important test amongst the several tests of
significance developed by statisticians. Chi-square is a statistical measure
used in the context of sampling analysis for a variance to a theoretical
variance.
The chi-square test also knows as non-parametric test or a
distribution free test is used when it is impossible to make any assumption
about populations parameters. The main advantage of using the non-
parameters test is that, the researchers can analyses qualitative data. The
name, Chi-square is generally denoted by Х2
However the value of the Chi-square test is depends on how the
data is collected.
The formula for calculating Chi-square test is,
Х2 = ∑{ (Oi – Ei)2/Ei}
Where,
Oi – Observed Frequency.
Ei – Estimated Frequency
The main disadvantage of the chi – square test is that it requires a
sufficient sample in order for the chi- square approximation to be valid
59

8/3/2019 Max Newyork Marketing
http://slidepdf.com/reader/full/max-newyork-marketing 60/105
PERCENTAGE METHOD
Percentage Method refers to a special kind of ratio. Percentages are
used in comparison between two or more series and also to describe the
relationship. Percentage reduces everything to a common base and
thereby allowing meaningful comparison to be made.
60
8/3/2019 Max Newyork Marketing
http://slidepdf.com/reader/full/max-newyork-marketing 61/105
10. SWOT Analysis of Pyramid advisory agency.
Strength
Main strength of company is it concentrates on the following
business
• Mutual find
• Share broking
• Insurance
Secondly it is situated in more populated (Anna nager) area in
Chennai city
Weakness
• New company
• Less data base
• Less executives
Opportunities
• Large scope for growth on mutual funds
Threats
• Market risk
• Competitors.
61
8/3/2019 Max Newyork Marketing
http://slidepdf.com/reader/full/max-newyork-marketing 62/105
11. DATA ANALYSIS AND INTERPRETATION
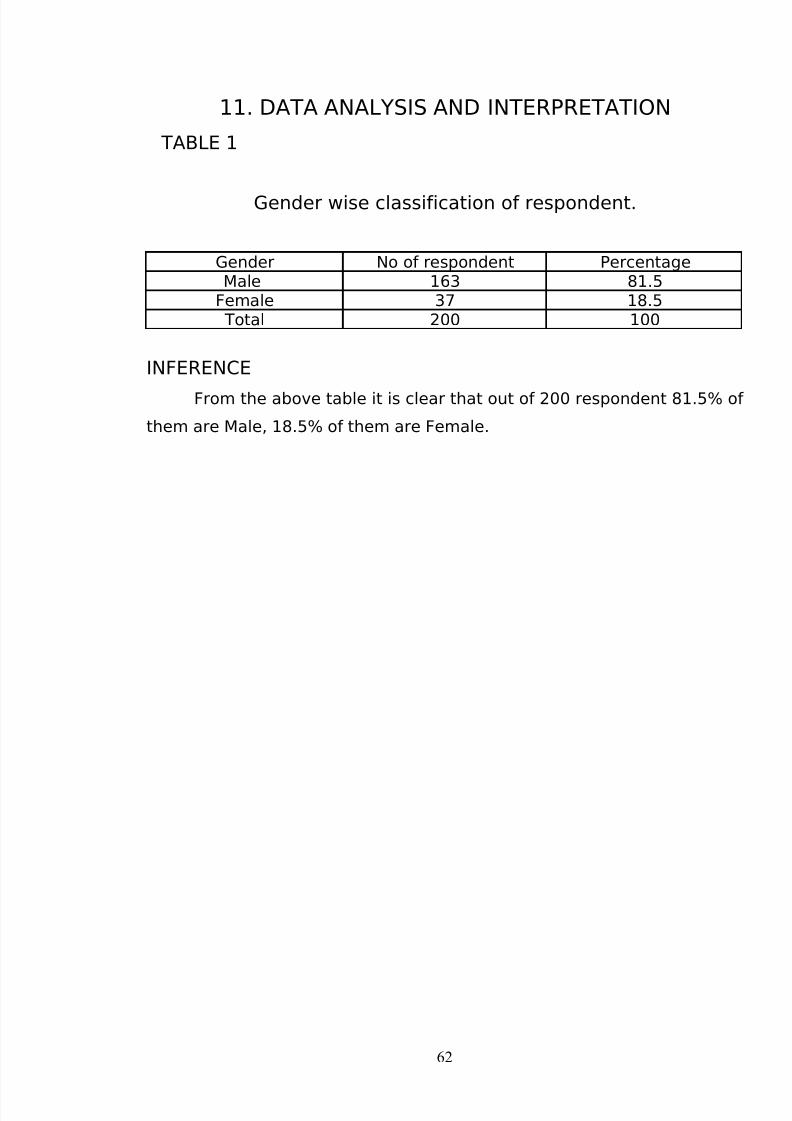
TABLE 1
Gender wise classification of respondent.
Gender No of respondent PercentageMale 163 81.5
Female 37 18.5 Total 200 100
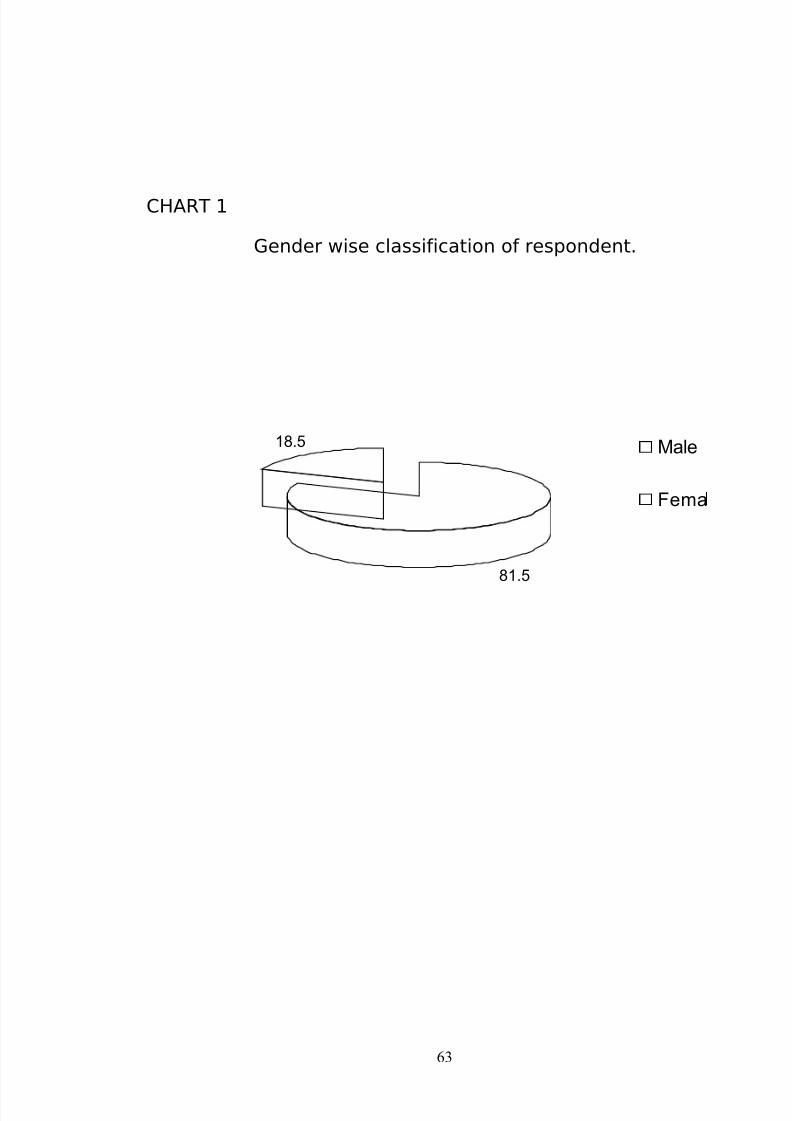
INFERENCE
From the above table it is clear that out of 200 respondent 81.5% of
them are Male, 18.5% of them are Female.
62
8/3/2019 Max Newyork Marketing
http://slidepdf.com/reader/full/max-newyork-marketing 63/105
CHART 1
Gender wise classification of respondent.
63
81.5
18.5 Male
Fema

8/3/2019 Max Newyork Marketing
http://slidepdf.com/reader/full/max-newyork-marketing 64/105
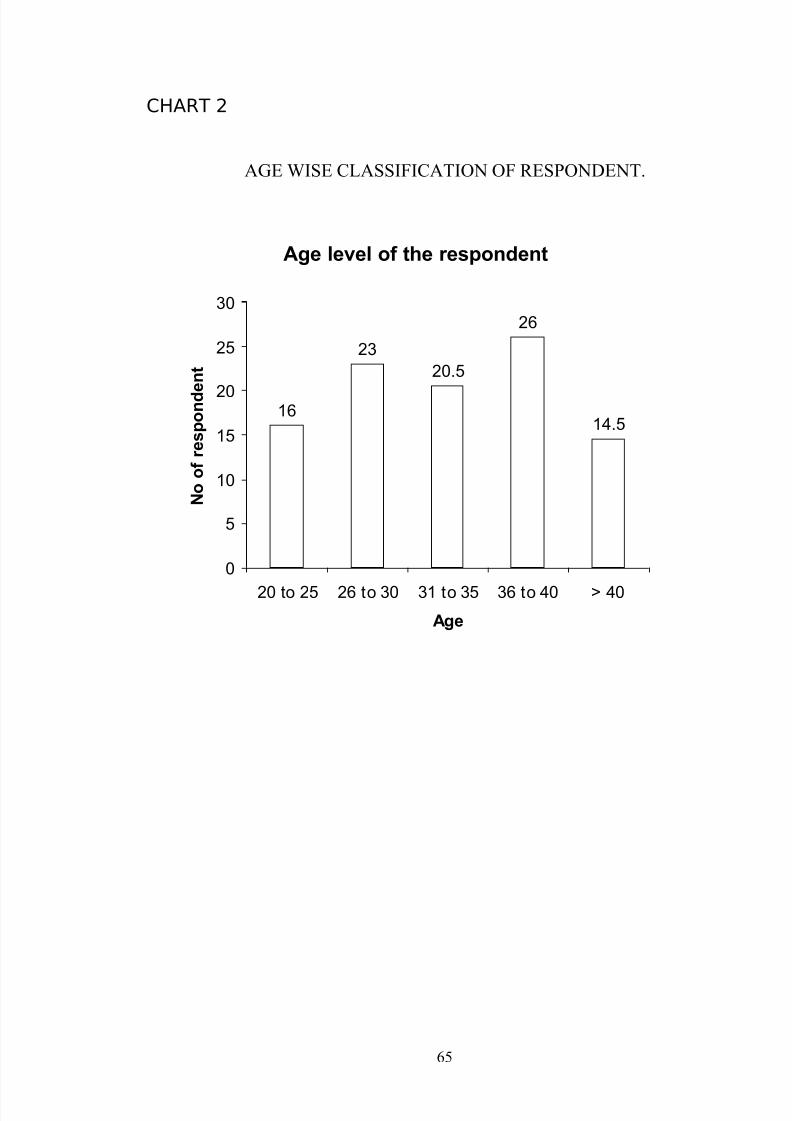
TABLE 2
AGE WISE CLASSIFICATION OF RESPONDENT.
Age No of respondent Percentage20 to 25 32 1626 to 30 46 2331 to 35 41 20.536 to 40 52 26
> 40 29 14.5 Total 200 100
INFERENCE
From the above table it is clear that out of 200 respondent 16% of
them are in the age group 20 to 25, 23% of them are in the age group 26
to 30, 20.5% of them are in the age group 31 to 35, 26% of them are in
the age group 36 to 40, 14.5% of them are above 40.
64
8/3/2019 Max Newyork Marketing
http://slidepdf.com/reader/full/max-newyork-marketing 65/105
CHART 2
AGE WISE CLASSIFICATION OF RESPONDENT.
65
Age level of the respondent
16
23
20.5
26
14.5
0
5
10
15
20
25
30
20 to 25 26 to 30 31 to 35 36 to 40 > 40
Age
N o
o f r e s p o n d e n t

8/3/2019 Max Newyork Marketing
http://slidepdf.com/reader/full/max-newyork-marketing 66/105
TABLE 3
OCCUPATION WISE CLASSIFICATION OF RESPONDENT.
Occupation No of respondent PercentageSalesman 74 37
Self employed 104 52Professional 22 11
Total 200 100
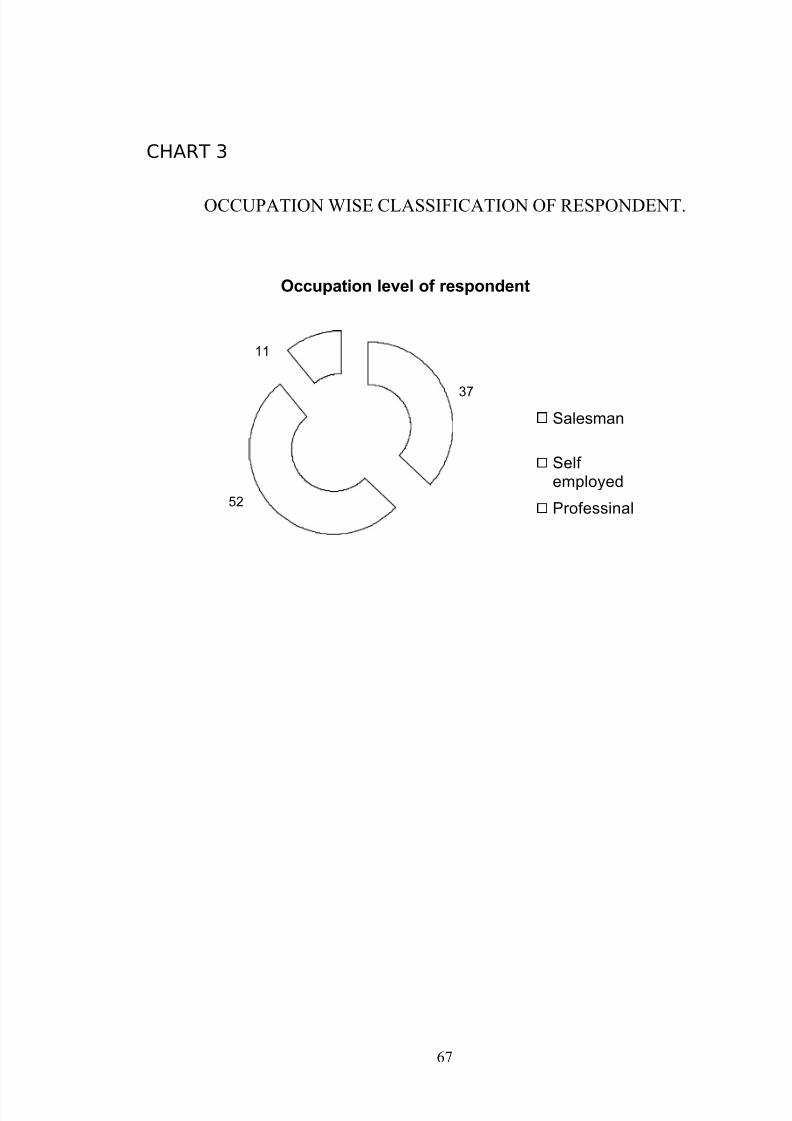
INFERENCE
From the above table it is clear that out of 200 respondent 16% of
them are Salesman, 52% them are Self employed, 11% of them are
Professionals.
66
8/3/2019 Max Newyork Marketing
http://slidepdf.com/reader/full/max-newyork-marketing 67/105
CHART 3
OCCUPATION WISE CLASSIFICATION OF RESPONDENT.
67
Occupation level of respondent
37
11
52
Salesman
Self employed
Professinal
8/3/2019 Max Newyork Marketing
http://slidepdf.com/reader/full/max-newyork-marketing 68/105
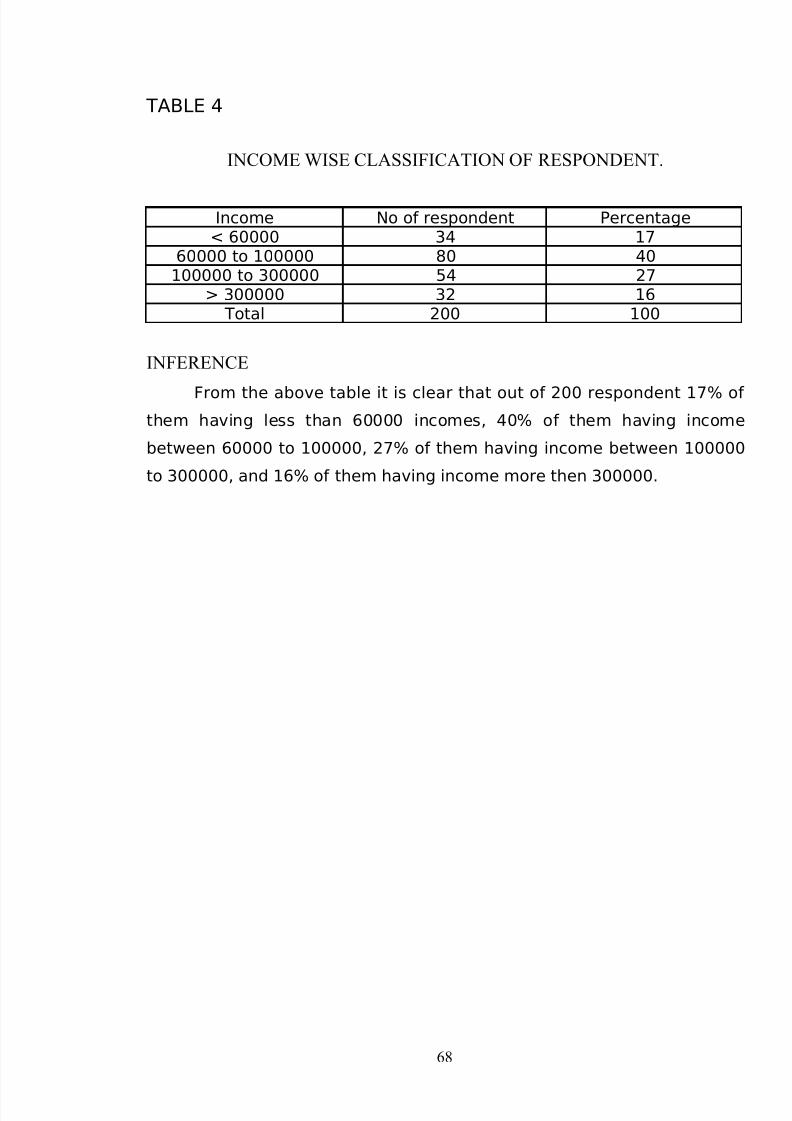
TABLE 4
INCOME WISE CLASSIFICATION OF RESPONDENT.
Income No of respondent Percentage< 60000 34 17
60000 to 100000 80 40100000 to 300000 54 27
> 300000 32 16 Total 200 100
INFERENCE
From the above table it is clear that out of 200 respondent 17% of
them having less than 60000 incomes, 40% of them having income
between 60000 to 100000, 27% of them having income between 100000
to 300000, and 16% of them having income more then 300000.
68

8/3/2019 Max Newyork Marketing
http://slidepdf.com/reader/full/max-newyork-marketing 69/105
CHART 4
INCOME WISE CLASSIFICATION OF RESPONDENT.
69
17
40
27
16
0
5
10
15
20
25
30
35
40
No of
respondent
< 60000 60000 to100000
100000 to300000
> 300000
Income
8/3/2019 Max Newyork Marketing
http://slidepdf.com/reader/full/max-newyork-marketing 70/105
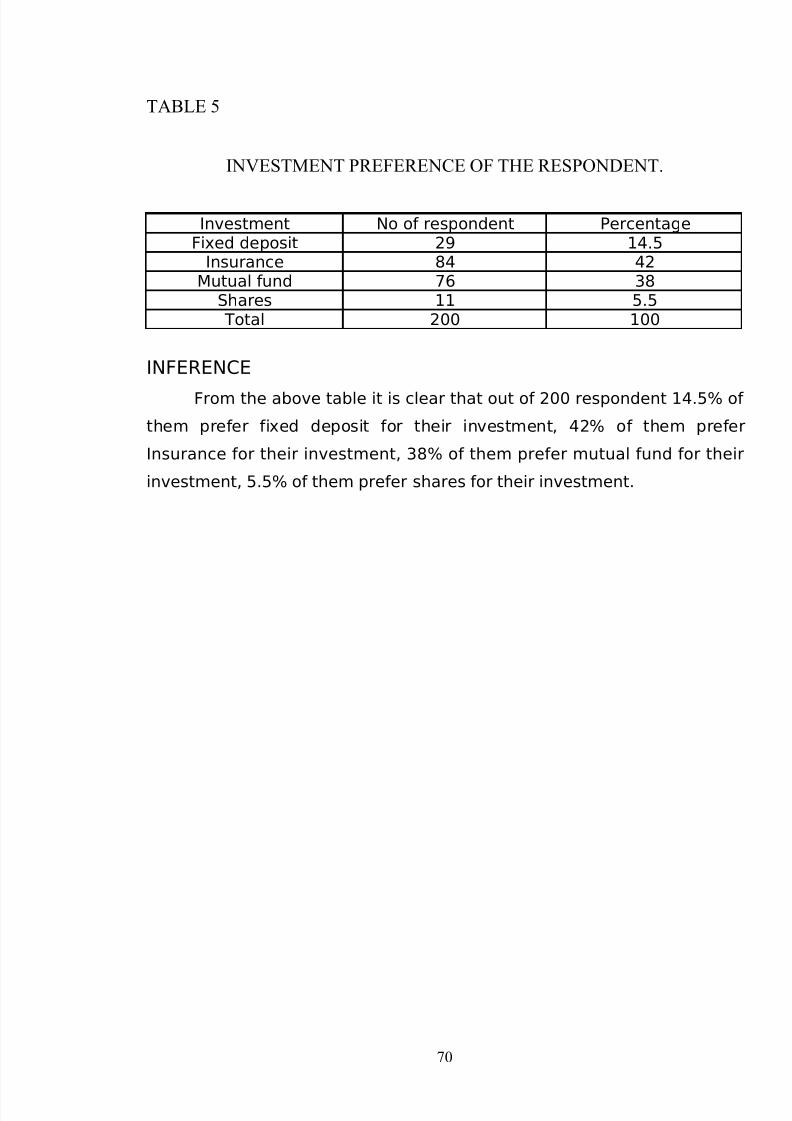
TABLE 5
INVESTMENT PREFERENCE OF THE RESPONDENT.
Investment No of respondent PercentageFixed deposit 29 14.5
Insurance 84 42Mutual fund 76 38
Shares 11 5.5 Total 200 100
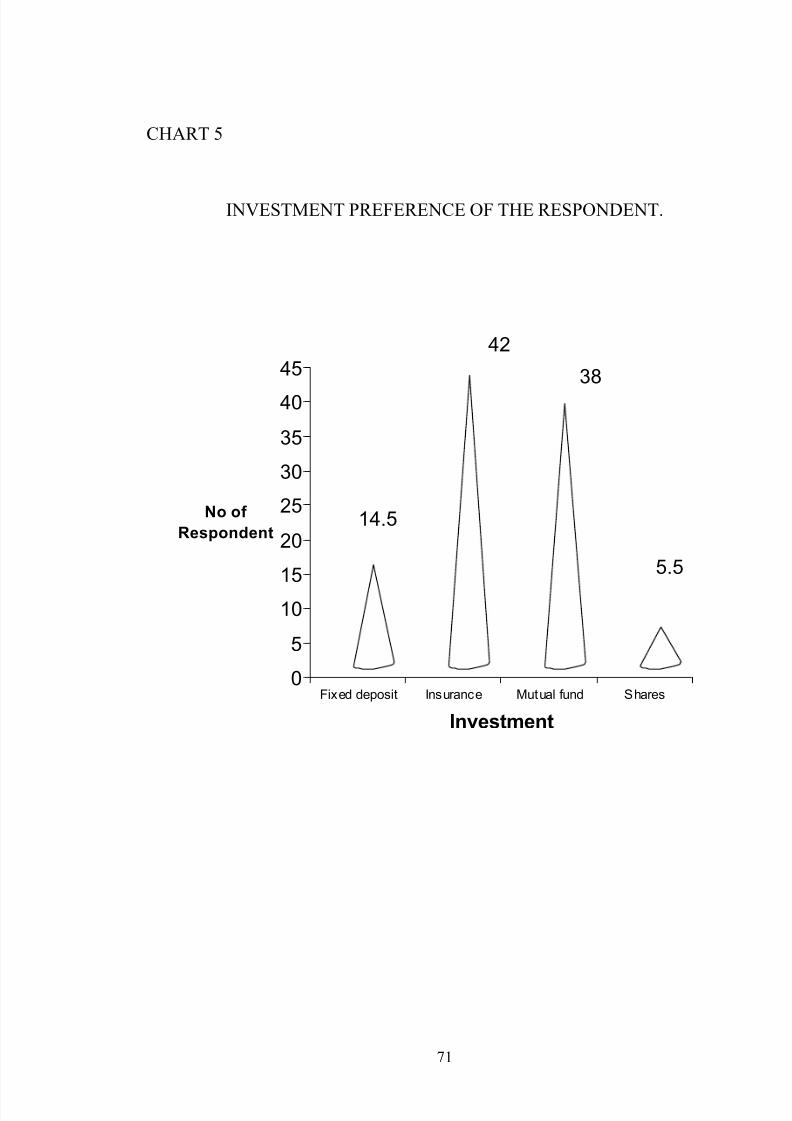
INFERENCE
From the above table it is clear that out of 200 respondent 14.5% of
them prefer fixed deposit for their investment, 42% of them prefer
Insurance for their investment, 38% of them prefer mutual fund for their
investment, 5.5% of them prefer shares for their investment.
70
8/3/2019 Max Newyork Marketing
http://slidepdf.com/reader/full/max-newyork-marketing 71/105
CHART 5
INVESTMENT PREFERENCE OF THE RESPONDENT.
71
14.5
42
38
5.5
0
5
10
15
20
25
30
35
40
45
No of
Respondent
Fixed deposit Insurance Mutual fund Shares
Investment

8/3/2019 Max Newyork Marketing
http://slidepdf.com/reader/full/max-newyork-marketing 72/105
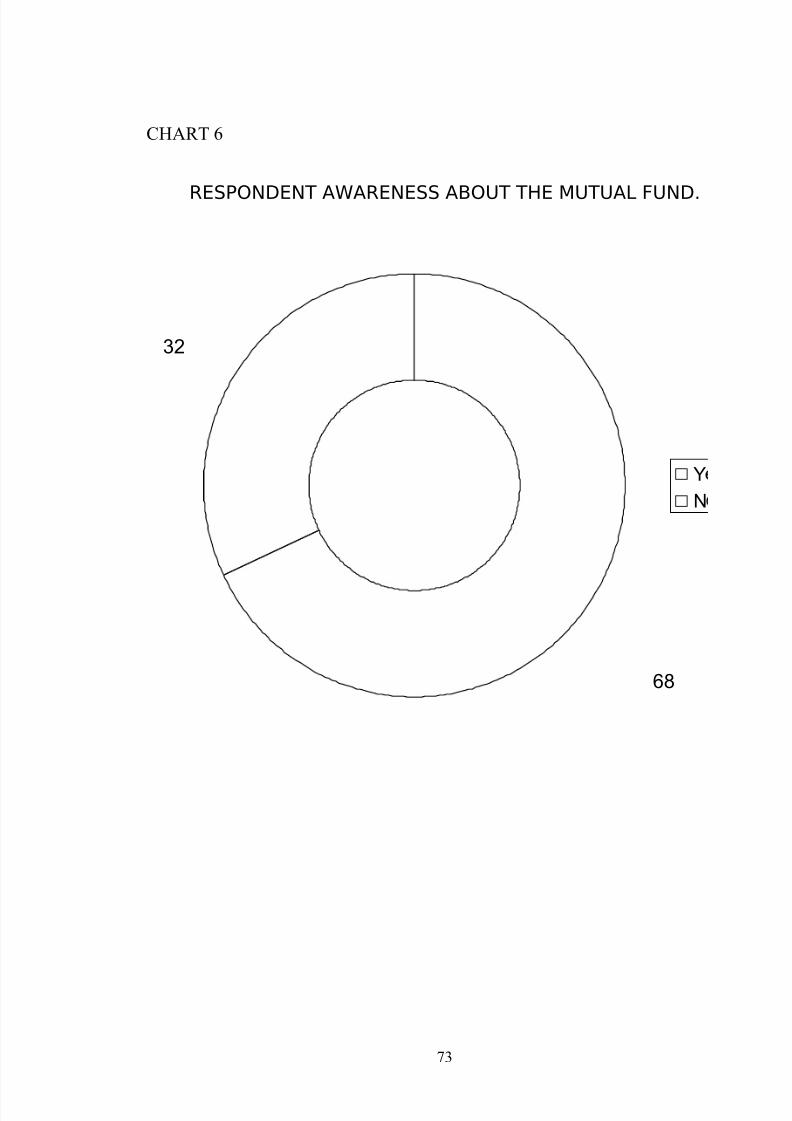
TABLE 6
RESPONDENT AWARENESS ABOUT THE MUTUAL FUND.
Awareness No of respondent Percentage Yes 136 68No 64 32
Total 200 100
INFERENCE
From the above table it is clear that out of 200 respondent 68% of
them are having awareness about the mutual fund, 32% of them are nothaving awareness about the mutual fund.
72
8/3/2019 Max Newyork Marketing
http://slidepdf.com/reader/full/max-newyork-marketing 73/105
CHART 6
RESPONDENT AWARENESS ABOUT THE MUTUAL FUND.
73
68
32
Y
N
8/3/2019 Max Newyork Marketing
http://slidepdf.com/reader/full/max-newyork-marketing 74/105
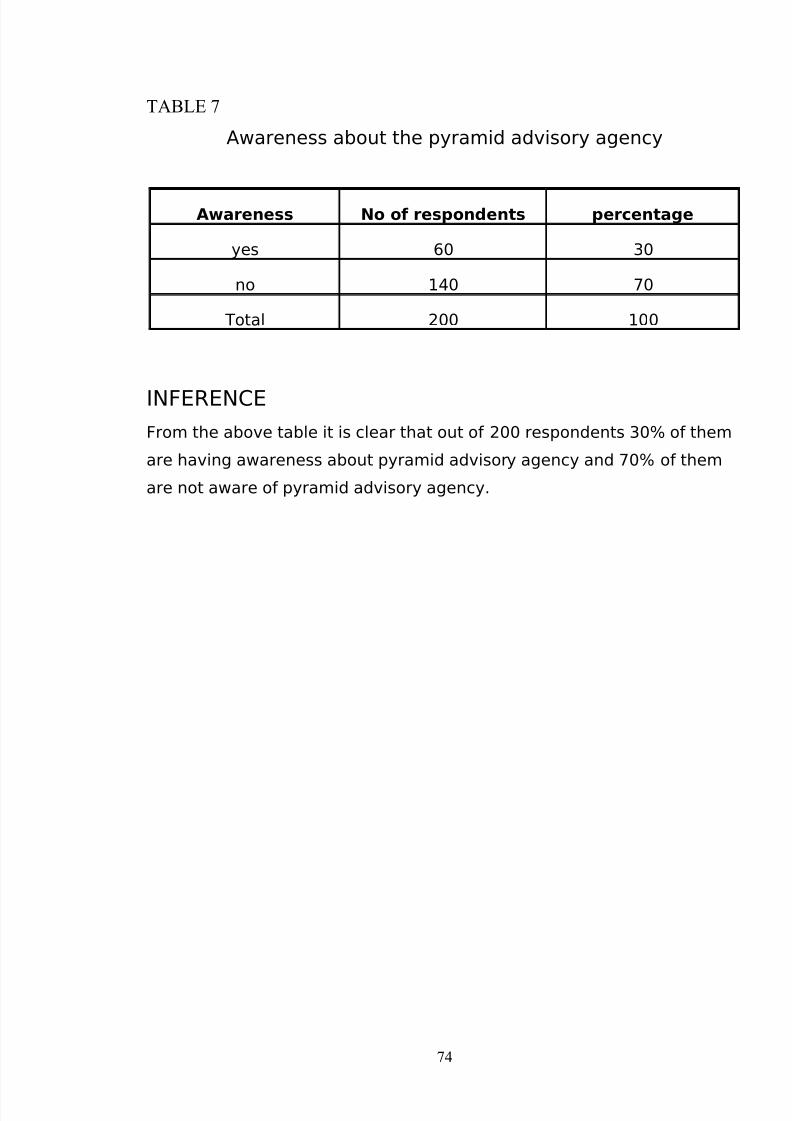
TABLE 7
Awareness about the pyramid advisory agency
Awareness No of respondents percentage
yes 60 30
no 140 70
Total 200 100
INFERENCE
From the above table it is clear that out of 200 respondents 30% of them
are having awareness about pyramid advisory agency and 70% of them
are not aware of pyramid advisory agency.
74
8/3/2019 Max Newyork Marketing
http://slidepdf.com/reader/full/max-newyork-marketing 75/105
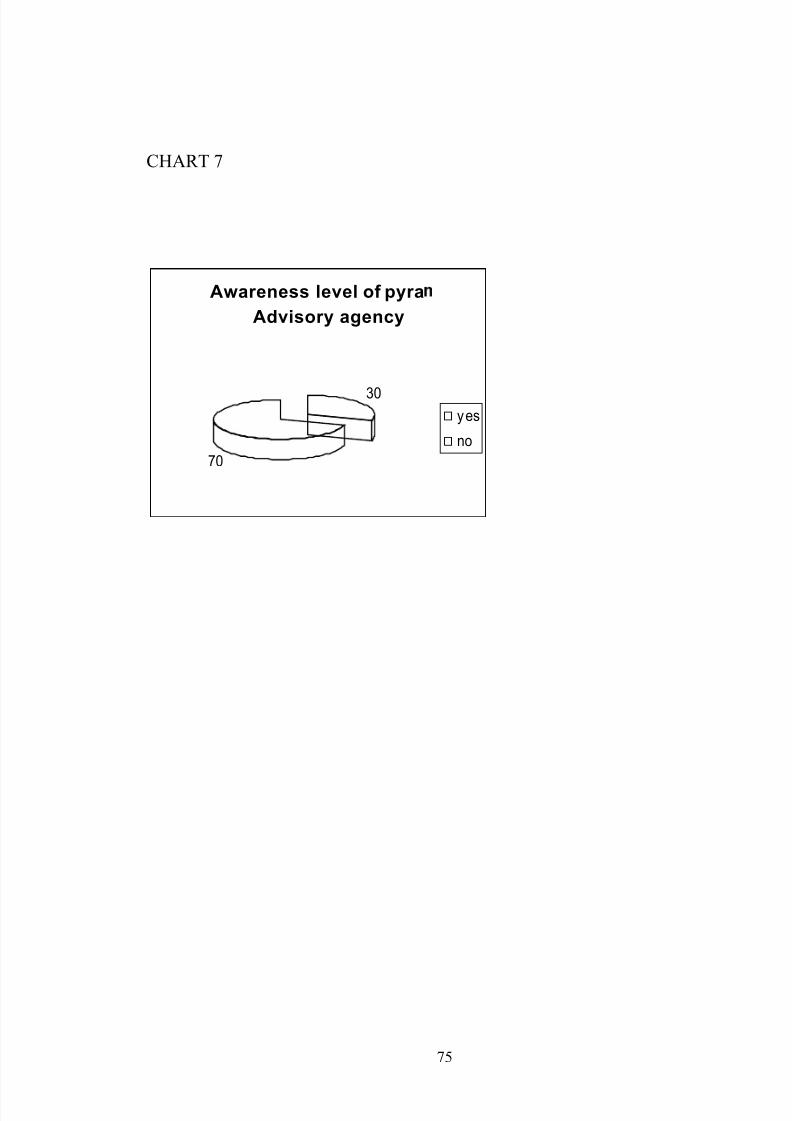
CHART 7
Awareness level of pyra
Advisory agency
30
70
yes
no
75

8/3/2019 Max Newyork Marketing
http://slidepdf.com/reader/full/max-newyork-marketing 76/105
TABLE 8
SOURCES OF AWARENESS.
Sources No of respondent PercentagePrint media 54 31.71 Television 56 41.17
Banners 18 20.5Others 52 26 Total 29 14.5
INFERENCE
From the above table it is clear that out of 200 respondent 16% of
them are getting awareness from printed media, 41.17% of them are
getting awareness from Television, 20.5% of them are getting awareness
from Banners, 26% of them are getting awareness from others sources.
76

8/3/2019 Max Newyork Marketing
http://slidepdf.com/reader/full/max-newyork-marketing 77/105
CHART 8
SOURCES OF AWARENESS
77
31.71
41.17
13.24
5.22
0 10 20 30 40 5
Print media
Television
Banners
Others
S o u r c e s
No of res ondent

8/3/2019 Max Newyork Marketing
http://slidepdf.com/reader/full/max-newyork-marketing 78/105
TABLE 9
Willingness of respondent to invest.
Willing to invest No of respondent Percentage Yes 66 33No 134 67
Total 200 100
INFERENCE
From the above table it is clear that out of 200 respondent 33% of
them are having willingness to join, 67% of them are not having
willingness to join in mutual fund.
78

8/3/2019 Max Newyork Marketing
http://slidepdf.com/reader/full/max-newyork-marketing 79/105
CHART 9
79
Willingness to join
Yes
33%
No
67%
8/3/2019 Max Newyork Marketing
http://slidepdf.com/reader/full/max-newyork-marketing 80/105
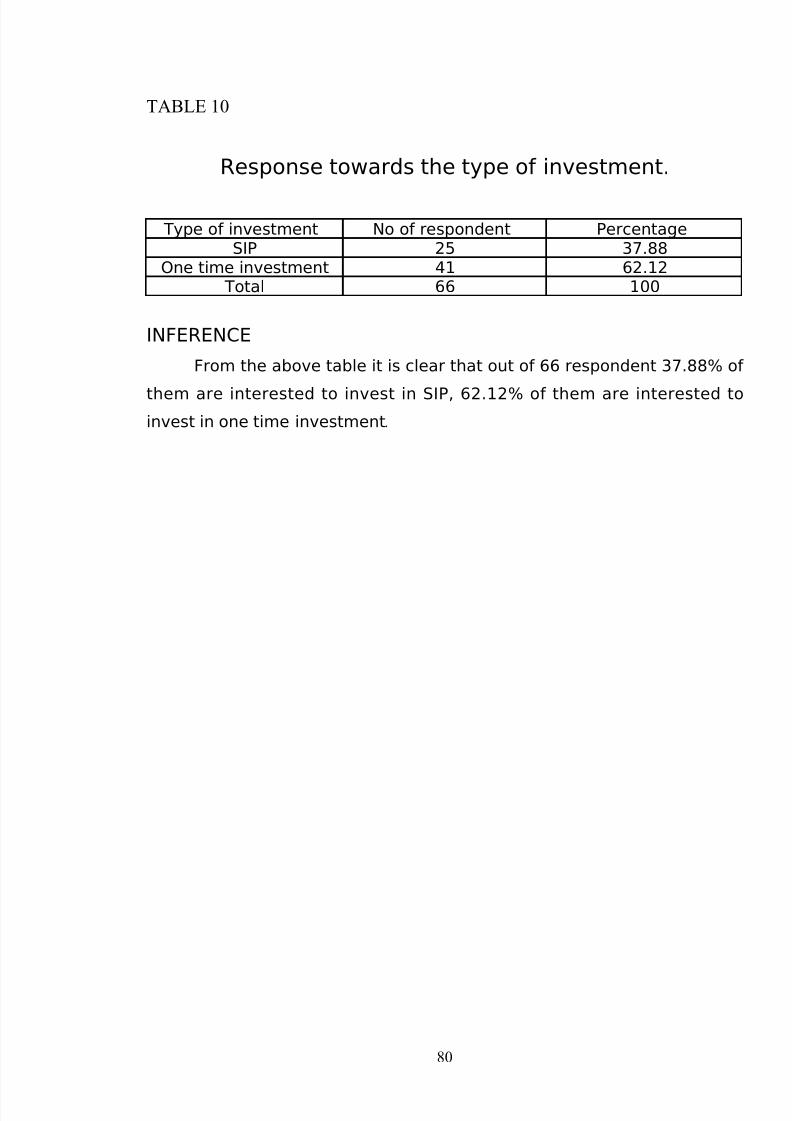
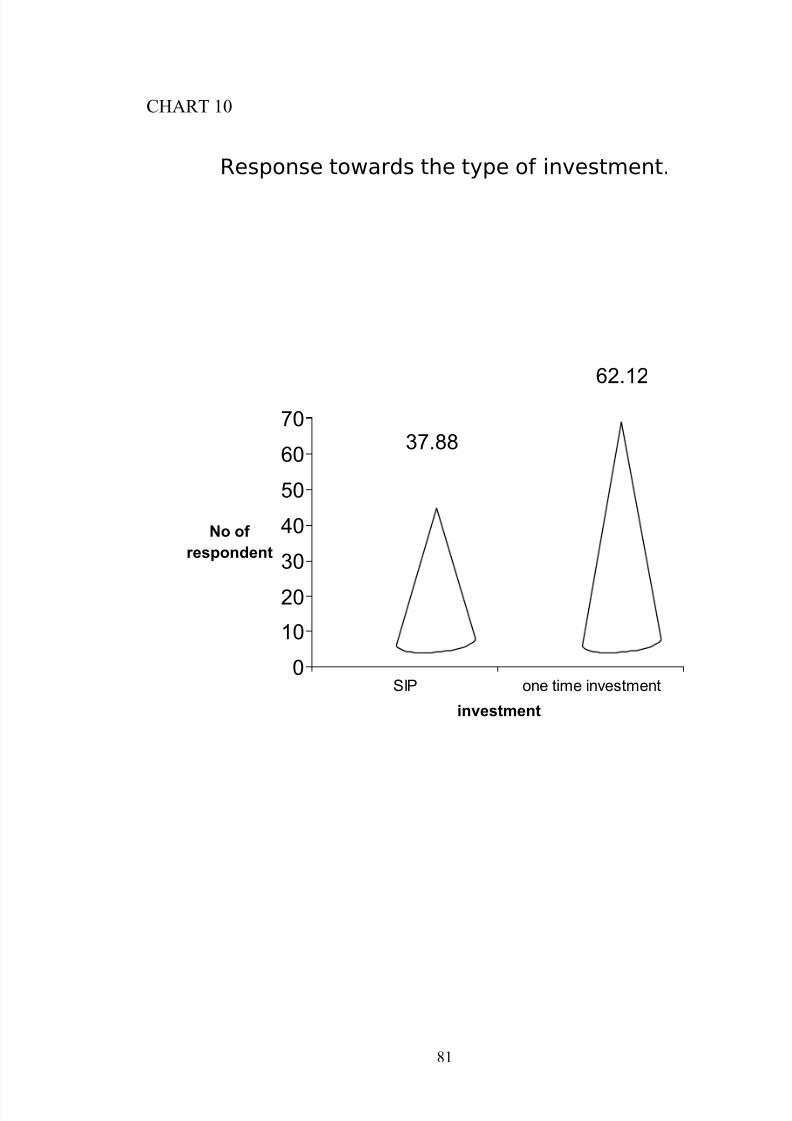
TABLE 10
Response towards the type of investment.
Type of investment No of respondent PercentageSIP 25 37.88
One time investment 41 62.12 Total 66 100
INFERENCE
From the above table it is clear that out of 66 respondent 37.88% of
them are interested to invest in SIP, 62.12% of them are interested to
invest in one time investment.
80
8/3/2019 Max Newyork Marketing
http://slidepdf.com/reader/full/max-newyork-marketing 81/105
CHART 10
Response towards the type of investment.
81
37.88
62.12
0
10
20
30
40
50
60
70
No of
respondent
SIP one time investment
investment

8/3/2019 Max Newyork Marketing
http://slidepdf.com/reader/full/max-newyork-marketing 82/105
TABLE 11
RESPONSE TOWARDS THE TYPE OF INVESTMENT SCHEMES.
Type of Schemes No of respondent PercentageExisting Schemes 28 42.42
NFOs 38 57.58 Total 66 100
INFERENCE
From the above table it is clear that out of 66 respondent 42.42% of
them are interested to invest in existing scheme, 57.58% of them areinterested to invest in NFOs.
82

8/3/2019 Max Newyork Marketing
http://slidepdf.com/reader/full/max-newyork-marketing 83/105
CHART 11
RESPONSE TOWARDS THE TYPE OF INVESTMENT SCHEMES.
42.42
57.58
0 20 40 60
No of respondent
Existing Scheme
NFOs
S c h e m
Investment Scheme
83
8/3/2019 Max Newyork Marketing
http://slidepdf.com/reader/full/max-newyork-marketing 84/105
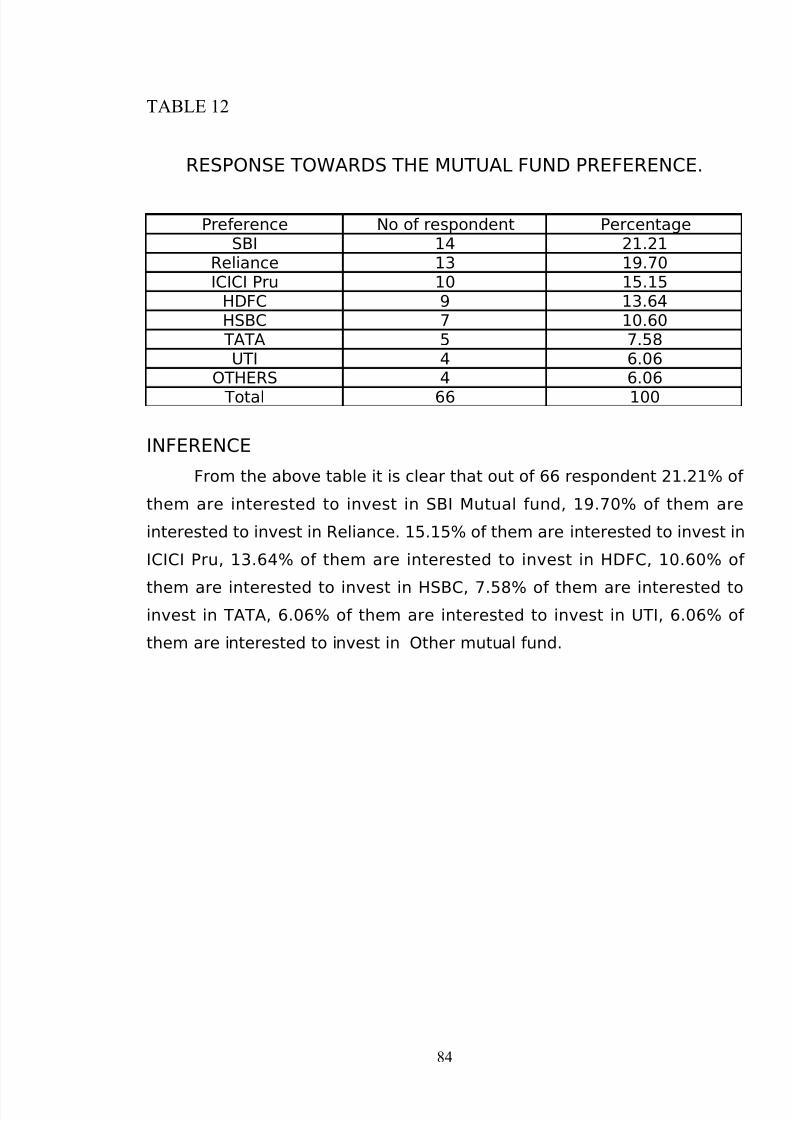
TABLE 12
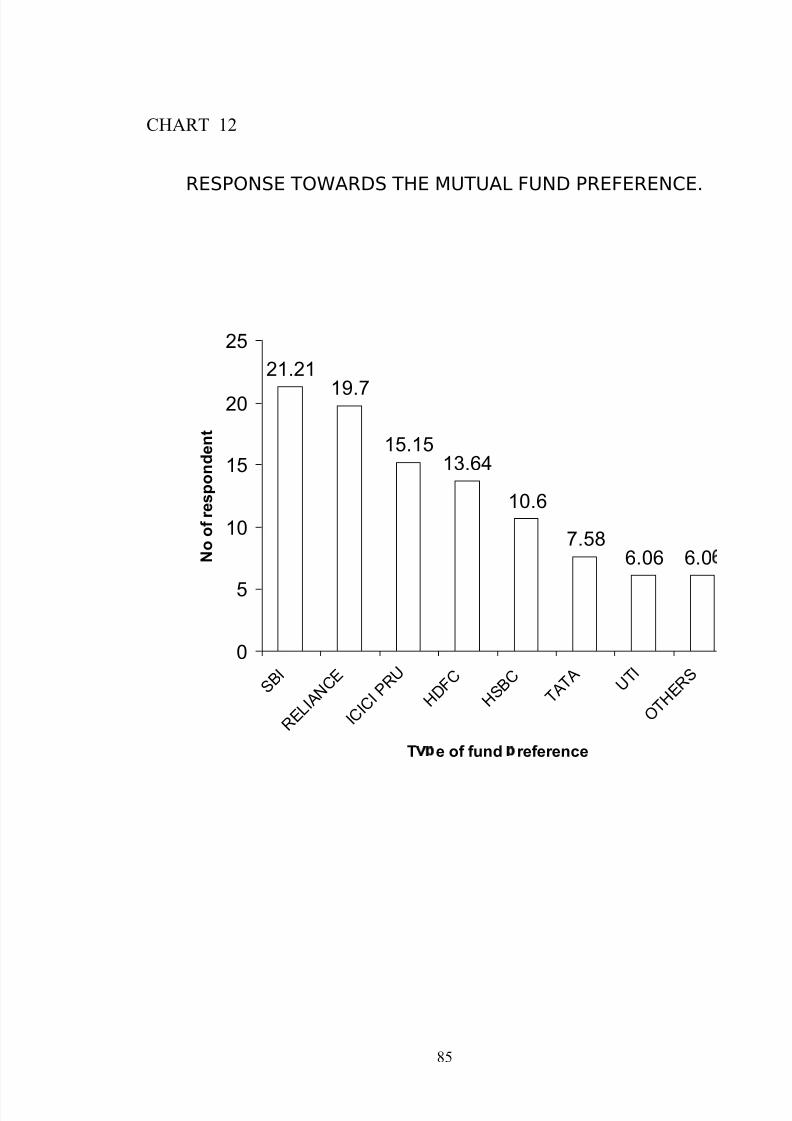
RESPONSE TOWARDS THE MUTUAL FUND PREFERENCE.
Preference No of respondent PercentageSBI 14 21.21
Reliance 13 19.70ICICI Pru 10 15.15
HDFC 9 13.64HSBC 7 10.60 TATA 5 7.58
UTI 4 6.06OTHERS 4 6.06
Total 66 100
INFERENCE
From the above table it is clear that out of 66 respondent 21.21% of
them are interested to invest in SBI Mutual fund, 19.70% of them are
interested to invest in Reliance. 15.15% of them are interested to invest in
ICICI Pru, 13.64% of them are interested to invest in HDFC, 10.60% of
them are interested to invest in HSBC, 7.58% of them are interested toinvest in TATA, 6.06% of them are interested to invest in UTI, 6.06% of
them are interested to invest in Other mutual fund.
84
8/3/2019 Max Newyork Marketing
http://slidepdf.com/reader/full/max-newyork-marketing 85/105
CHART 12
RESPONSE TOWARDS THE MUTUAL FUND PREFERENCE.
85
21.21
19.7
15.1513.64
10.6
7.586.06 6.0
0
5
10
15
20
25
S B I
R E L I A N C E
I C I C I P R U
H D F C
H S B
C T A T A
U T I
O T H
E R S
T e of fund reference
N o
o f r e s p o n d e n t
8/3/2019 Max Newyork Marketing
http://slidepdf.com/reader/full/max-newyork-marketing 86/105
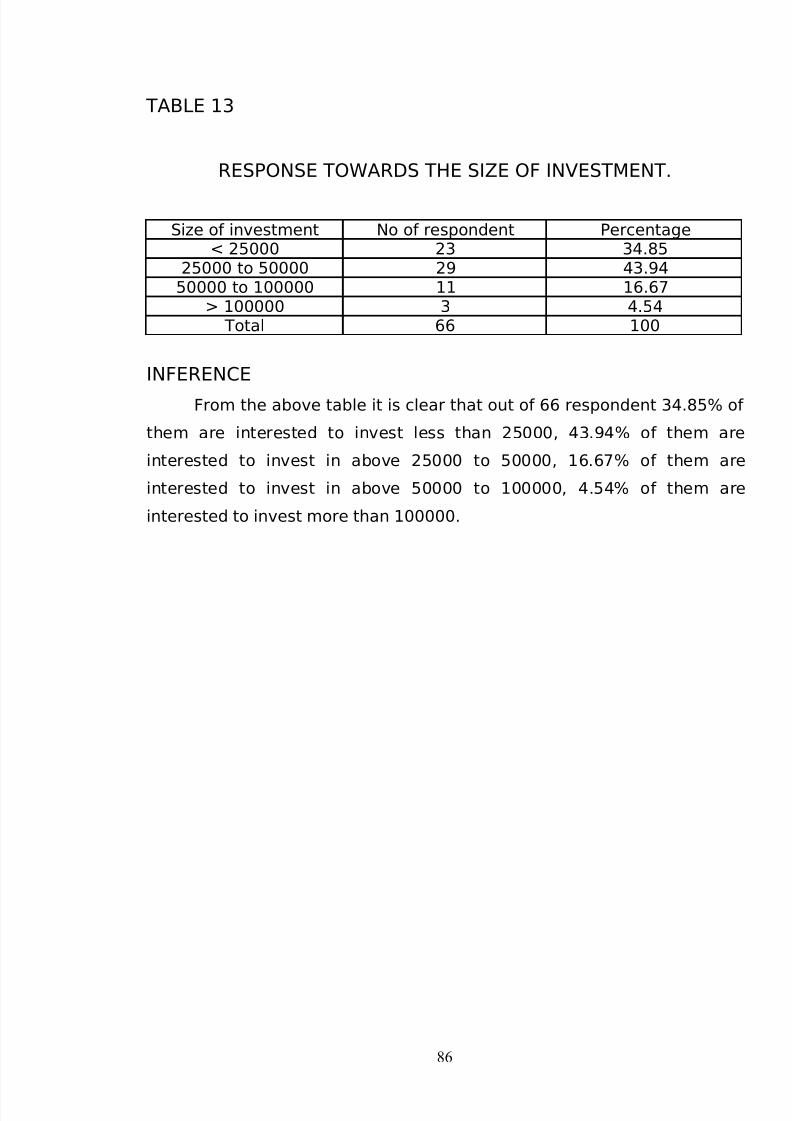
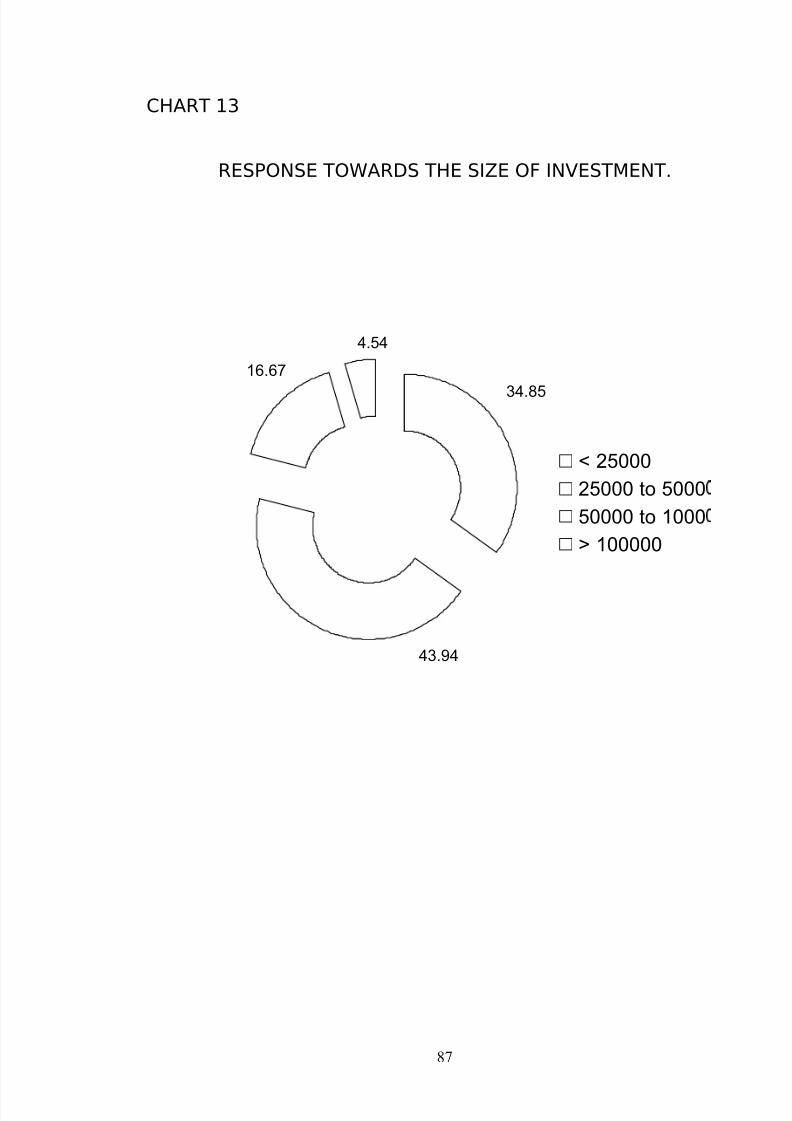
TABLE 13
RESPONSE TOWARDS THE SIZE OF INVESTMENT.
Size of investment No of respondent Percentage< 25000 23 34.85
25000 to 50000 29 43.9450000 to 100000 11 16.67
> 100000 3 4.54 Total 66 100
INFERENCE
From the above table it is clear that out of 66 respondent 34.85% of
them are interested to invest less than 25000, 43.94% of them are
interested to invest in above 25000 to 50000, 16.67% of them are
interested to invest in above 50000 to 100000, 4.54% of them are
interested to invest more than 100000.
86
8/3/2019 Max Newyork Marketing
http://slidepdf.com/reader/full/max-newyork-marketing 87/105
CHART 13
RESPONSE TOWARDS THE SIZE OF INVESTMENT.
87
34.85
43.94
16.67
4.54
< 25000
25000 to 5000
50000 to 1000
> 100000

8/3/2019 Max Newyork Marketing
http://slidepdf.com/reader/full/max-newyork-marketing 88/105
TABLE 14
RESPONSE TOWARDS THE TENURE OF INVESTMENT.
Tenure of investment No of respondent PercentageShort term 11 16.67
Medium Term 26 39.39Long Term 29 43.94
Total 66 100
INFERENCE
From the above table it is clear that out of 66 respondent 16.67% of
them are interested to short term investment, 39.39% of them are
interested to medium term investment, 43.94% of them are interested to
Long term investment.
88

8/3/2019 Max Newyork Marketing
http://slidepdf.com/reader/full/max-newyork-marketing 89/105
CHART 14
RESPONSE TOWARDS THE TENURE OF INVESTMENT
89
16.67
39.39
43.94 Short Term
Medium Te
Long Term
8/3/2019 Max Newyork Marketing
http://slidepdf.com/reader/full/max-newyork-marketing 90/105
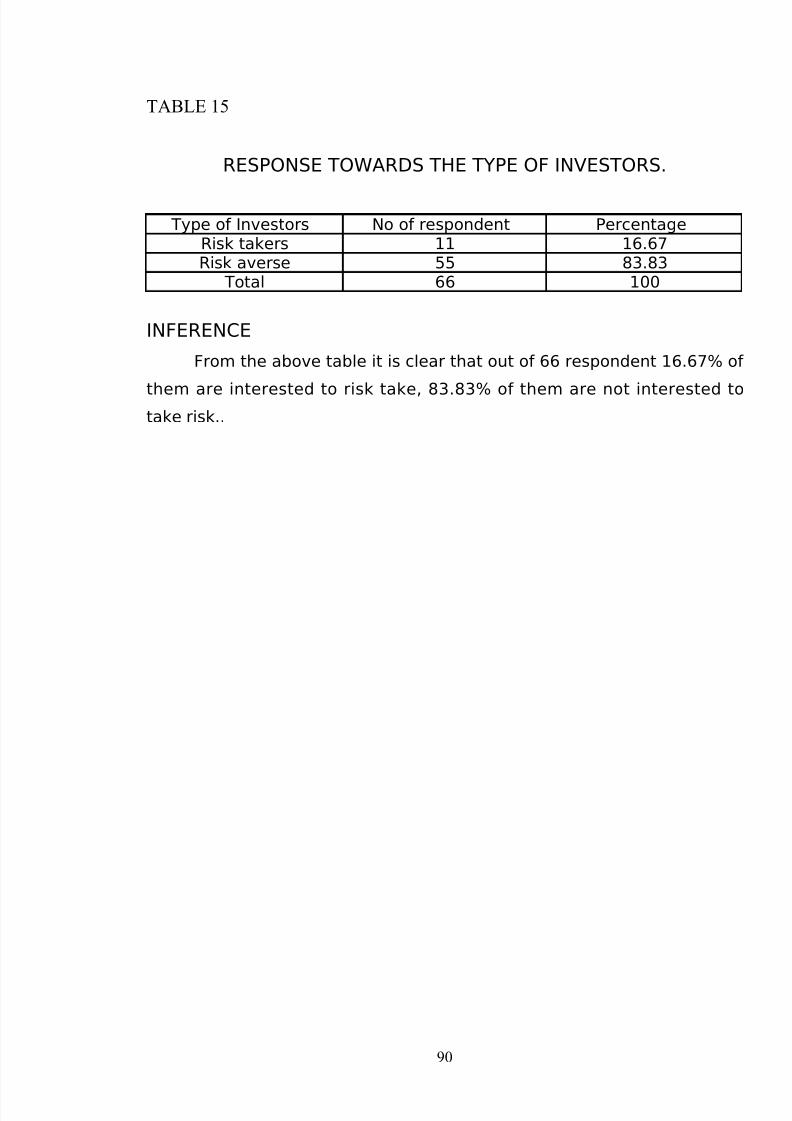
TABLE 15
RESPONSE TOWARDS THE TYPE OF INVESTORS.
Type of Investors No of respondent PercentageRisk takers 11 16.67Risk averse 55 83.83
Total 66 100
INFERENCE
From the above table it is clear that out of 66 respondent 16.67% of
them are interested to risk take, 83.83% of them are not interested totake risk..
90

8/3/2019 Max Newyork Marketing
http://slidepdf.com/reader/full/max-newyork-marketing 91/105
CHART 15
RESPONSE TOWARDS THE TYPE OF INVESTORS.
91
16.67
83.83
0
10
20
30
40
50
60
70
80
90
No of
respondent
Risk Taker Risk averse
Investors
8/3/2019 Max Newyork Marketing
http://slidepdf.com/reader/full/max-newyork-marketing 92/105
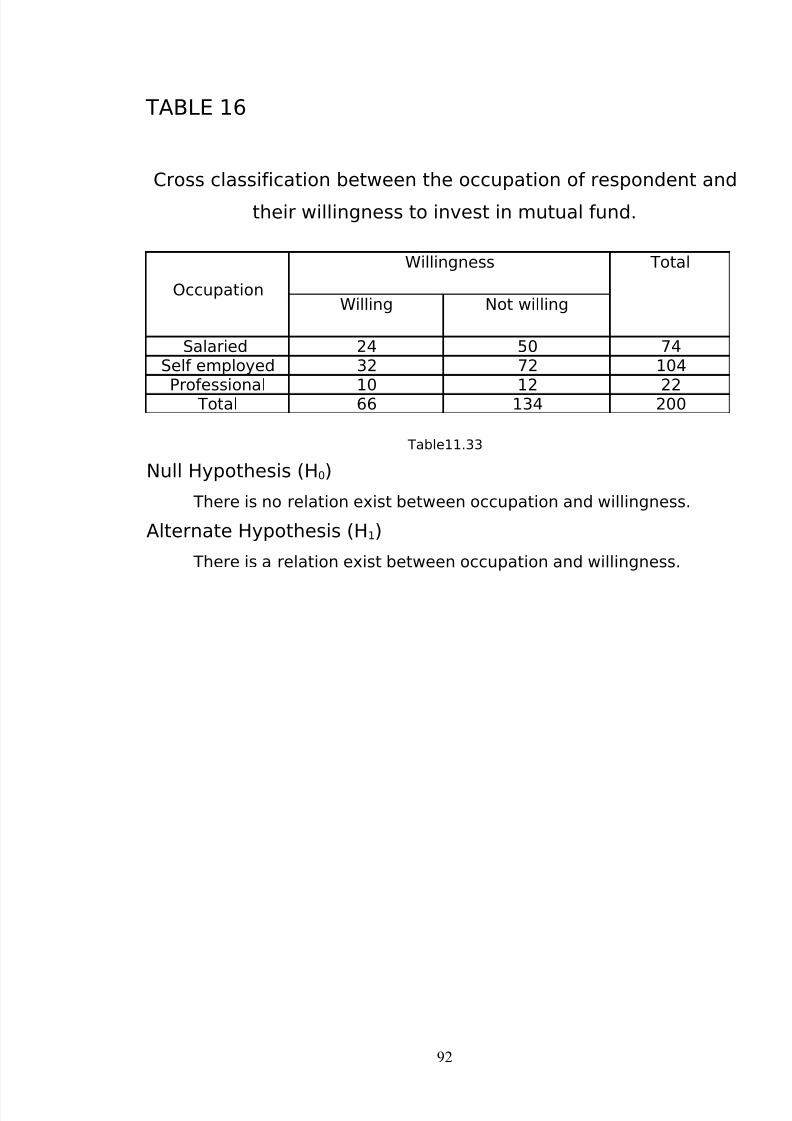
TABLE 16
Cross classification between the occupation of respondent and
their willingness to invest in mutual fund.
Occupation
Willingness Total
Willing Not willing
Salaried 24 50 74Self employed 32 72 104
Professional 10 12 22 Total 66 134 200
Table11.33
Null Hypothesis (H0)
There is no relation exist between occupation and willingness.
Alternate Hypothesis (H1)
There is a relation exist between occupation and willingness.
92
8/3/2019 Max Newyork Marketing
http://slidepdf.com/reader/full/max-newyork-marketing 93/105
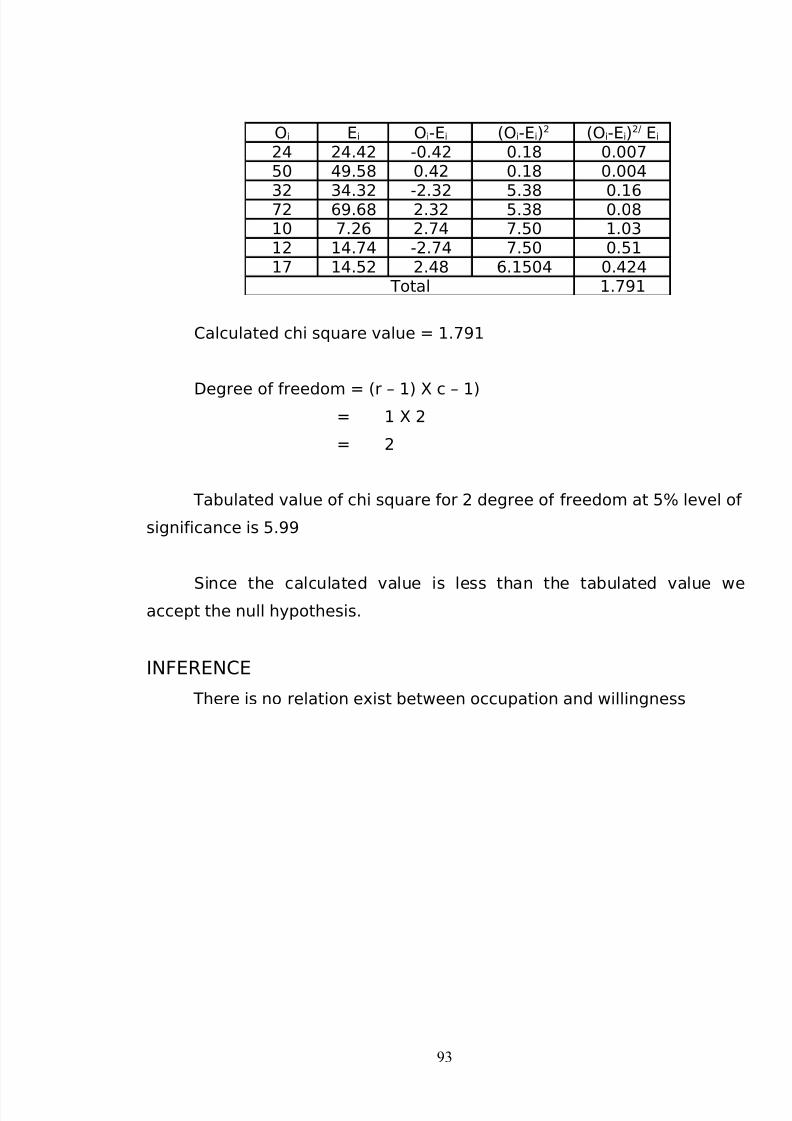
Oi Ei Oi-Ei (Oi-Ei)2 (Oi-Ei)2/ Ei
24 24.42 -0.42 0.18 0.00750 49.58 0.42 0.18 0.004
32 34.32 -2.32 5.38 0.1672 69.68 2.32 5.38 0.0810 7.26 2.74 7.50 1.0312 14.74 -2.74 7.50 0.5117 14.52 2.48 6.1504 0.424
Total 1.791
Calculated chi square value = 1.791
Degree of freedom = (r – 1) X c – 1)= 1 X 2
= 2
Tabulated value of chi square for 2 degree of freedom at 5% level of
significance is 5.99
Since the calculated value is less than the tabulated value weaccept the null hypothesis.
INFERENCE
There is no relation exist between occupation and willingness
93

8/3/2019 Max Newyork Marketing
http://slidepdf.com/reader/full/max-newyork-marketing 94/105
TABLE 17.
Cross classification between the income of respondent and
their willingness to invest in mutual fund.
Income
Willingness Total
Willing Not willing
< 70000 6 28 3470000 to 100000 16 64 80100000 to 300000 29 25 54
> 300000 15 17 32 Total 66 134 200
Table11.33
Null Hypothesis (H0)
There is no relation exist between income and willingness.
Alternate Hypothesis (H1)
There is a relation exist between income and willingness.
94
8/3/2019 Max Newyork Marketing
http://slidepdf.com/reader/full/max-newyork-marketing 95/105
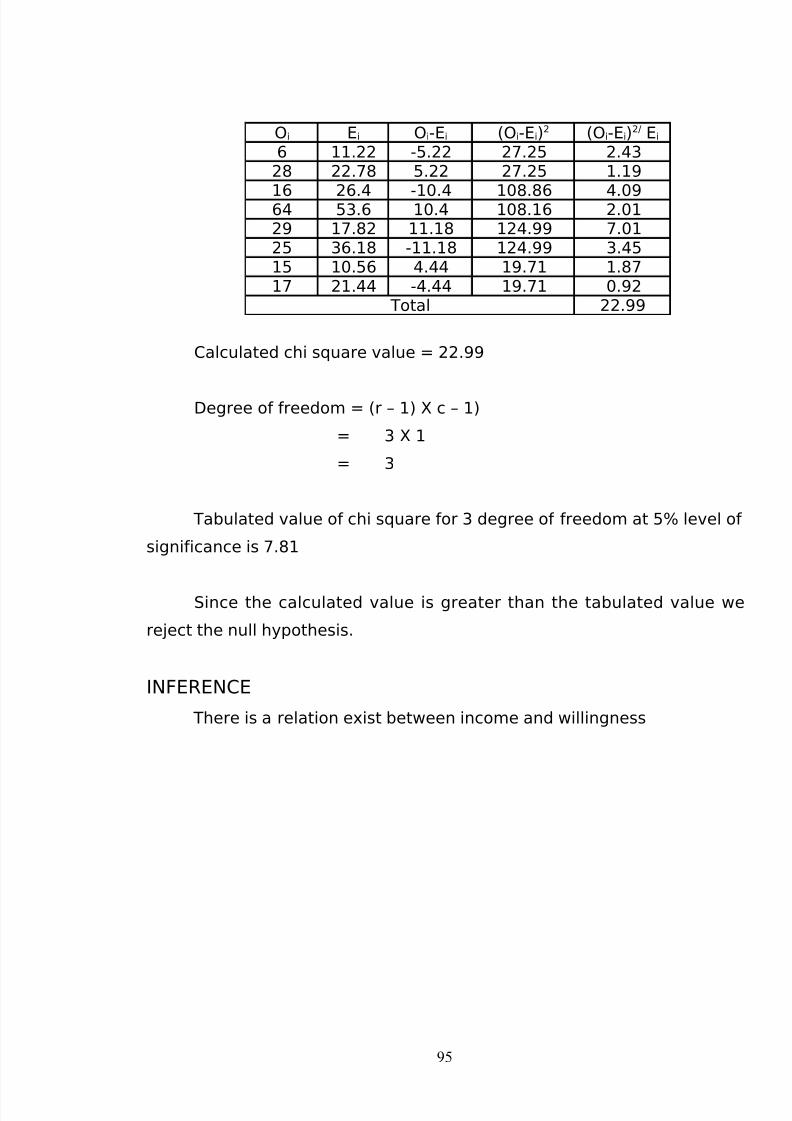
Oi Ei Oi-Ei (Oi-Ei)2 (Oi-Ei)2/ Ei
6 11.22 -5.22 27.25 2.4328 22.78 5.22 27.25 1.19
16 26.4 -10.4 108.86 4.0964 53.6 10.4 108.16 2.0129 17.82 11.18 124.99 7.0125 36.18 -11.18 124.99 3.4515 10.56 4.44 19.71 1.8717 21.44 -4.44 19.71 0.92
Total 22.99
Calculated chi square value = 22.99
Degree of freedom = (r – 1) X c – 1)
= 3 X 1
= 3
Tabulated value of chi square for 3 degree of freedom at 5% level of
significance is 7.81
Since the calculated value is greater than the tabulated value we
reject the null hypothesis.
INFERENCE
There is a relation exist between income and willingness
95

8/3/2019 Max Newyork Marketing
http://slidepdf.com/reader/full/max-newyork-marketing 96/105
TABLE 18
Cross classification between the gender of respondent and their
willingness to invest in mutual fund.
Gender
Willingness Total
Willing Not willing
Male 54 109 163Female 12 25 37 Total 66 154 200
Table11.33
Null Hypothesis (H0)
There is no relation exist between gender and willingness.
Alternate Hypothesis (H1)
There is a relation exist between gender and willingness.
96
8/3/2019 Max Newyork Marketing
http://slidepdf.com/reader/full/max-newyork-marketing 97/105
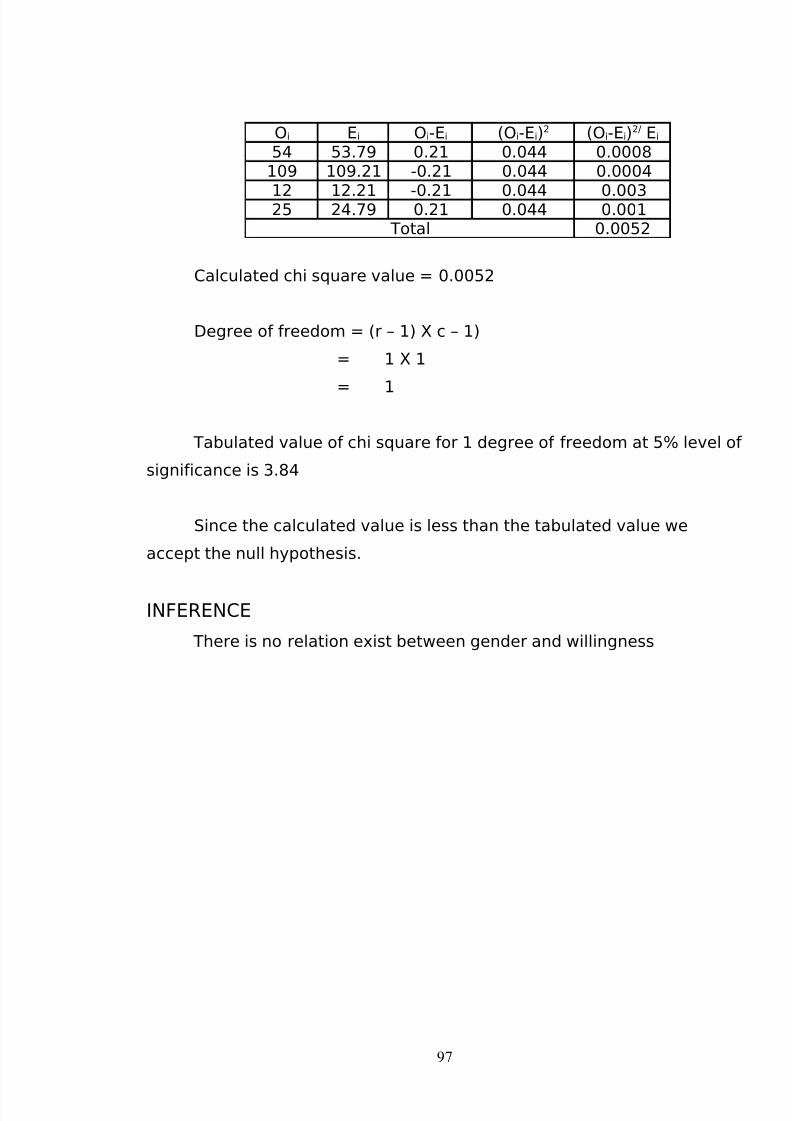
Oi Ei Oi-Ei (Oi-Ei)2 (Oi-Ei)2/ Ei
54 53.79 0.21 0.044 0.0008109 109.21 -0.21 0.044 0.0004
12 12.21 -0.21 0.044 0.00325 24.79 0.21 0.044 0.001 Total 0.0052
Calculated chi square value = 0.0052
Degree of freedom = (r – 1) X c – 1)
= 1 X 1
= 1
Tabulated value of chi square for 1 degree of freedom at 5% level of
significance is 3.84
Since the calculated value is less than the tabulated value we
accept the null hypothesis.
INFERENCE
There is no relation exist between gender and willingness
97
8/3/2019 Max Newyork Marketing
http://slidepdf.com/reader/full/max-newyork-marketing 98/105
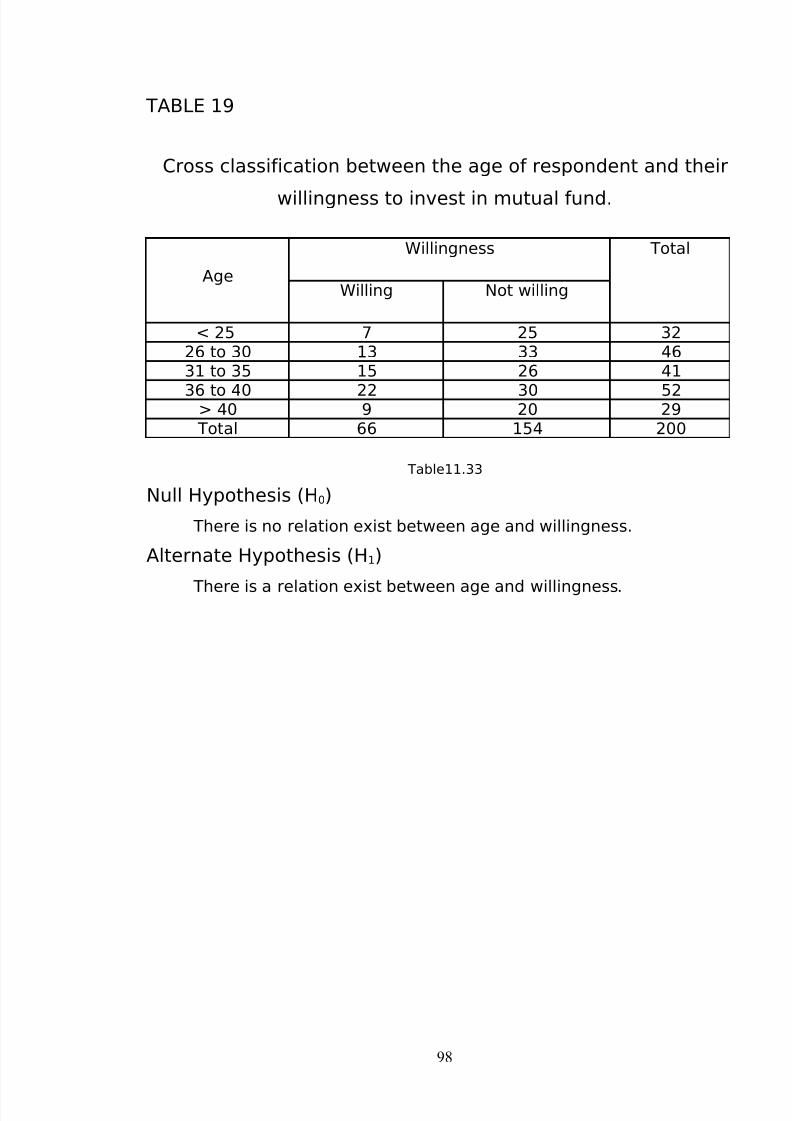
TABLE 19
Cross classification between the age of respondent and their
willingness to invest in mutual fund.
Age
Willingness Total
Willing Not willing
< 25 7 25 3226 to 30 13 33 4631 to 35 15 26 41
36 to 40 22 30 52> 40 9 20 29
Total 66 154 200
Table11.33
Null Hypothesis (H0)
There is no relation exist between age and willingness.
Alternate Hypothesis (H1)
There is a relation exist between age and willingness.
98

8/3/2019 Max Newyork Marketing
http://slidepdf.com/reader/full/max-newyork-marketing 99/105
Oi Ei Oi-Ei (Oi-Ei)2 (Oi-Ei)2/ Ei
7 10.56 -3.56 12.67 1.1925 21.44 3.56 12.67 0.59
13 15.18 -2.18 4.75 0.3133 30.82 2.18 4.75 0.1515 13.53 1.47 2.16 0.1626 27.47 -1.47 2.16 0.0822 7.16 4.84 23.42 1.3630 34.84 -4.84 23.42 0.679 9.57 -0.57 0.32 0.0320 19.43 0.57 0.32 0.02
Total 4.56
Calculated chi square value = 4.56
Degree of freedom = (r – 1) X c – 1)
= 4 X 1
= 4
Tabulated value of chi square for 4 degree of freedom at 5% level of
significance is 9.48
Since the calculated value is less than the tabulated value we
accept the null hypothesis.
INFERENCE
There is no relation exist between age and willingness
99

8/3/2019 Max Newyork Marketing
http://slidepdf.com/reader/full/max-newyork-marketing 100/105
12. FINDINGS
1. Majority of the respondents are Male.
2. Majority of the respondents are in the age group 36 to 40.
3. Majority of the respondents are Self employed.
4. Majority of the respondents having the annual income > Rs.70000
but less than Rs.100000.
5. Majority of the respondents are preferring insurance as their
investment.
6. Majority of the respondents having awareness about mutual fund.
7. Majority of the respondents are getting their awareness from
television advertisement
8. Only 33% of the respondents are willing to invest in mutual fund
9. Majority of the respondents choosing one time investment
10. Majority of the respondents preferring NFO schemes
11. Majority of the respondents are willing to invest in SBI mutual
fund
12. Majority of the respondents are willing to invest in Rs.25000 to
Rs. 50000
13. Majority of the respondents’ tenure of investment is long
term.
14. Majority of the respondents are like risk averse investment.
15. There is no relation exist between occupation and willingness
16. There is a relation exist between income and willingness
17. There is no relation exist between gender and willingness
100

8/3/2019 Max Newyork Marketing
http://slidepdf.com/reader/full/max-newyork-marketing 101/105
18. There is no relation exist between age and willingness.
13.SUGGESTION & RECOMMENDATIONS:
1. To create the awareness among the people by attractive
banners, electronic media and non-electronic media.
2. Advertising should reach the customer in an understandable
manner.
3. The asset management companies(AMC) should conduct more
seminar programmes regarding Mutual Fund investments.
4. Highlights of Mutual Funds should be displayed in every nuke and
corner of crowded areas.
5. Whenever there is NFO it should reach the people.
6. Awareness should be created among the tax payees regarding
the added advantages of tax benefit schemes.
7. In the Direct marketing, Company should promote the number of
sales guys.
8. Numerous sales promotion activities should be handled by
Pyramid Advisory to increase their sales.
9. Awareness about pyramid advisory services is not satisfactory.
10. The company can start additional branches in important areas
in Chennai city to serve the customers better
101

8/3/2019 Max Newyork Marketing
http://slidepdf.com/reader/full/max-newyork-marketing 102/105
14.CONCLUSION
The results and findings of this research study clearly exemplifies the fact
that an in depth research study has been conducted and all the objectives set for this
research work has been fully accomplished.
In order to improve the investors in Mutual Fund various suggestions and
recommendations have also been put forth in this research study.
Thus all the major objectives of this research study had been well
analysed and accomplished in detail in this research report
102
8/3/2019 Max Newyork Marketing
http://slidepdf.com/reader/full/max-newyork-marketing 103/105
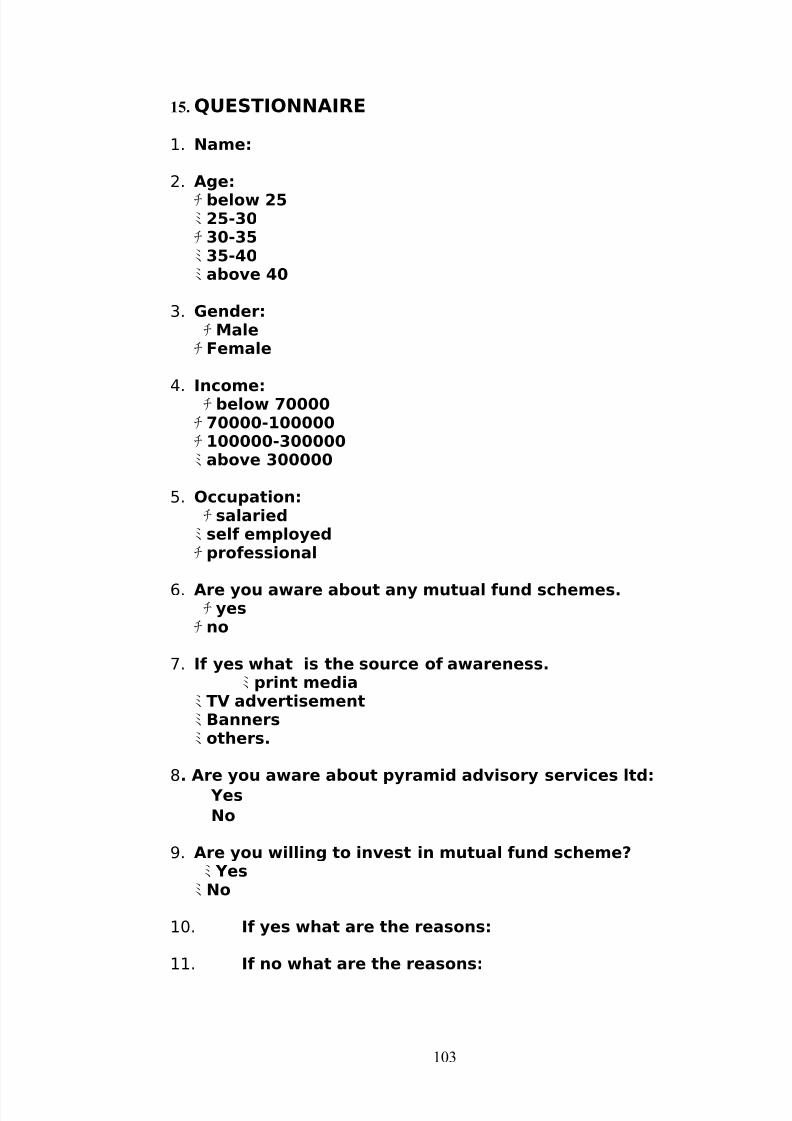
15. QUESTIONNAIRE
1. Name:
2. Age:
チ below 25ミ 25-30チ 30-35ミ 35-40ミ above 40
3. Gender:チ Male
チ Female
4. Income:チ below 70000チ 70000-100000チ 100000-300000ミ above 300000
5. Occupation:チ salaried
ミ self employedチ professional
6. Are you aware about any mutual fund schemes.チ yes
チ no
7. If yes what is the source of awareness.ミ print media
ミ TV advertisementミ Bannersミ others.
8. Are you aware about pyramid advisory services ltd:
Yes
No
9. Are you willing to invest in mutual fund scheme? ミ Yes
ミ No
10. If yes what are the reasons:
11. If no what are the reasons:
103
8/3/2019 Max Newyork Marketing
http://slidepdf.com/reader/full/max-newyork-marketing 104/105
12. Please give the size of investments you going to make.チ<25000
チ 25000-50000
チ 50000-100000ミ above 100000.
13. Which of the following mutual funds you prefer to join
チ SBIチ Relianceチ ICICI Pruチ HDFCチ HSBCチ TATAチ UTIチ Others
14. Which scheme you prefer to join? チ Existing scheme
チ NFOs
15. How soon will you join the mutual fund scheme?チ immediately
チ with in 3 months
ン 3-6 months.
16. What type of investor you are:チ Risk taker
チ Risk averse
17. What will be your tenure of investment? チ short term
チ medium termチ long term.
104

8/3/2019 Max Newyork Marketing
http://slidepdf.com/reader/full/max-newyork-marketing 105/105
BIBILIOGRAPHY
1. Philip kotler , Market Research, New York , Wellington Press, 1999.
2. Philip kotler, Marketing management, New Delhi, Prentice Hall of India(p) Ltd,
2001
3. Kothari, C.R., Research Methodology, New Delhi, New Age International
Publishers, 2005
4. Gupta, S.P., Satistical Methods, New Delhi, Educational Publishers, 1982.
5. Business Line, January 2007.
6. www.amfi.com
Related Documents