~ Pergamon 0146-6380(94)00117-0 Org. Geochem. Vol. 23, No. 2, pp. 139-158, 1995 Copyright © 1995Elsevier ScienceLtd Printed in Great Britain.All rights reserved 0146-6380/95$9.50+ 0.00 Maturity trends in asphaltenes from pyrolysed source rocks and natural coals--multivariate modelling of diffuse reflectance Fourier-transform infrared spectra TANJA BARTW, MARIT SEIM, 2 ALFRED A. CHRISTY I and OLAV M. KVALHEIM 2 ~Department of Chemistry, University of Bergen, Allrgt 41 , N-5007 Bergen, Norway and 2Statoil, Bamble, N-3960 Stathelle, Norway (Received 14 February 1994; returned for revision 4 July 1994; accepted 20 October 1994) Summary--DRIFTspectra of asphaltenes have been modelledby multivariate methods to show the patterns of maturity dependent changes in chemical composition. The asphaltenes are from source rocks that have been artificiallymatured by hydrous pyrolysis,and cover a wide range of kerogen types and maturity levels. Asphaltenes from a set of naturally matured coal samplesare modelledfor comparison.The modellingresults in defining a limited number of systematic trends in maturity dependent chemical changes in the spectra. The trends are comparable for similar source rocks and are interpreted as representing defunctionalisation, aromatisation and cracking reactions. However, the timing and maturity dependence of the reactions are specific for each source rock, and a general maturation model that includes all source rock types could not he established. Key words--asphaltenes, DRIFT spectroscopy, multivariate analysis, hydrous pyrolysis, maturity measurements INTRODUCTION The combination of Fourier-transform infrared spectroscopy (FT-IR) with chemometric techniques is a powerful tool for extracting and modelling systematic chemical changes in complex reaction systems (Christy et al., 1993). Thermal degradation of kerogen resulting in petroleum generation is an example of a very complex process where the approach has been used with good results (Barth et al., 1992, Christy et al., 1989a). In this work maturity dependent chemical changes in asphaltene compositions are investigated. An asphaltene unit can be viewed as a large fragment or association of fragments of the irregular kerogen polymer (Pelet et al., 1986) with a molecular weight in the range of 1000-50,000 g/mol (Acevedo et al., 1985) and is defined by its solubility in organic solvents. The chemical compositions of asphaltenes are complex and variable, and can only be represented by average measurements. Spectroscopic methods are suitable for this purpose, and a diffuse reflectance Fourier- transform infrared spectrum (DRIFT) contains much information on chemical composition that is related to both the source and the maturity level of the organic matter in the source rock. However, this information is not easily available for direct interpretation, especially if the aim is a quantitative evaluation. The traditional approach has been to choose certain wavelengths from the spectra and then correlate the derived absorbance ratios to other maturity measures (Christy et al., 1989b; Ganz and Kalkreuth, 1987). This approach ignores much of the information contained in the spectra. An alternative is the use of multivariate methods for establishing models of chemical change as a function of a maturity parameter. Information contained in the whole spectrum can simultaneously be exploited, and the reliability and information value is considerably increased (Barth et al., 1992, Christy et aL, 1989a). The resulting maturity factors can be visualised as i.r. spectrum equivalents, which makes it possible to interpret "maturation" in terms of underlying chemical processes. Establishing reliable maturity models, both for the investigation of chemical changes with maturity and for determining the maturity of unknown samples, requires a sufficiently large set of source rock samples with well-defined compositions and maturity levels. Such sample sets are not easily found, based on normal sampling of naturally matured source rocks. Alterna- tively, well defined sample sets can be made using laboratory methods for simulating the natural maturation process. Hydrous pyrolysis (HP--heating to 250-365°C in a closed autoclave with excess water) is accepted as a method of simulated maturation that gives a chemical composition of the products which closely resembles the natural situation (Winters et al., 1983; Monthioux et al., 1985; Andresen et al., 1993). The method enables production of sample sets from identical starting material, matured to different levels 139

Welcome message from author
This document is posted to help you gain knowledge. Please leave a comment to let me know what you think about it! Share it to your friends and learn new things together.
Transcript
~ Pergamon 0146-6380(94)00117-0
Org. Geochem. Vol. 23, No. 2, pp. 139-158, 1995 Copyright © 1995 Elsevier Science Ltd
Printed in Great Britain. All rights reserved 0146-6380/95 $9.50 + 0.00
Maturity trends in asphaltenes from pyrolysed source rocks and natural coals--multivariate modelling of diffuse reflectance
Fourier-transform infrared spectra
TANJA BARTW, MARIT SEIM, 2 ALFRED A. CHRISTY I and OLAV M. KVALHEIM 2
~Department of Chemistry, University of Bergen, Allrgt 41 , N-5007 Bergen, Norway and 2Statoil, Bamble, N-3960 Stathelle, Norway
(Received 14 February 1994; returned for revision 4 July 1994; accepted 20 October 1994)
Summary--DRIFT spectra of asphaltenes have been modelled by multivariate methods to show the patterns of maturity dependent changes in chemical composition. The asphaltenes are from source rocks that have been artificially matured by hydrous pyrolysis, and cover a wide range of kerogen types and maturity levels. Asphaltenes from a set of naturally matured coal samples are modelled for comparison.The modelling results in defining a limited number of systematic trends in maturity dependent chemical changes in the spectra. The trends are comparable for similar source rocks and are interpreted as representing defunctionalisation, aromatisation and cracking reactions. However, the timing and maturity dependence of the reactions are specific for each source rock, and a general maturation model that includes all source rock types could not he established.
Key words--asphaltenes, DRIFT spectroscopy, multivariate analysis, hydrous pyrolysis, maturity measurements
INTRODUCTION
The combination of Fourier-transform infrared spectroscopy (FT-IR) with chemometric techniques is a powerful tool for extracting and modelling systematic chemical changes in complex reaction systems (Christy et al., 1993). Thermal degradation of kerogen resulting in petroleum generation is an example of a very complex process where the approach has been used with good results (Barth et al., 1992, Christy et al., 1989a).
In this work maturity dependent chemical changes in asphaltene compositions are investigated. An asphaltene unit can be viewed as a large fragment or association of fragments of the irregular kerogen polymer (Pelet et al., 1986) with a molecular weight in the range of 1000-50,000 g/mol (Acevedo et al., 1985) and is defined by its solubility in organic solvents. The chemical compositions of asphaltenes are complex and variable, and can only be represented by average measurements. Spectroscopic methods are suitable for this purpose, and a diffuse reflectance Fourier- transform infrared spectrum (DRIFT) contains much information on chemical composition that is related to both the source and the maturity level of the organic matter in the source rock. However, this information is not easily available for direct interpretation, especially if the aim is a quantitative evaluation. The traditional approach has been to choose certain wavelengths from the spectra and then correlate the derived absorbance ratios to other maturity measures
(Christy et al., 1989b; Ganz and Kalkreuth, 1987). This approach ignores much of the information contained in the spectra. An alternative is the use of multivariate methods for establishing models of chemical change as a function of a maturity parameter. Information contained in the whole spectrum can simultaneously be exploited, and the reliability and information value is considerably increased (Barth et al., 1992, Christy et aL, 1989a). The resulting maturity factors can be visualised as i.r. spectrum equivalents, which makes it possible to interpret "maturation" in terms of underlying chemical processes.
Establishing reliable maturity models, both for the investigation of chemical changes with maturity and for determining the maturity of unknown samples, requires a sufficiently large set of source rock samples with well-defined compositions and maturity levels. Such sample sets are not easily found, based on normal sampling of naturally matured source rocks. Alterna- tively, well defined sample sets can be made using laboratory methods for simulating the natural maturation process. Hydrous pyrolysis (HP--heating to 250-365°C in a closed autoclave with excess water) is accepted as a method of simulated maturation that gives a chemical composition of the products which closely resembles the natural situation (Winters et al., 1983; Monthioux et al., 1985; Andresen et al., 1993). The method enables production of sample sets from identical starting material, matured to different levels
139
140 Tanja Barth et al.
Table I. Source rocks used in hydrous pyrolysis series Series Source rock Initial T~a~ (~C) HI Temperature range ( C ) No.of experiments T~, range ('C)
I Lacustr. sh. Dan.c.s' 440 542 240-360 10 441~,52 2 Marine sh. Dan.c.s ~ 428 476 240-360 7 433-546 3 Heather s.r., N.c.s 2. 424 439 280-365 7 435-534 4 Brown coal, Rhine 411 83 250-365 10 428-545 5 Brent coal, Nor.c.s 2. 428 84 280-365 8 437-525
hSample from the Danish continental shelf, courtesy of the Danish Geological survey and B. J. Schmidt. -'Sample from the Norwegian continental shelf, courtesy of Statoil.
with quantitative analysis of the products. In this way, the evolution patterns of specific "typical" source rocks can be evaluated. However, the precision of the simulation of the natural chemical evolution is not easy to establish. Comparative studies of maturity trends in asphaltenes from HP of different source rocks and suites of natural samples by DRIFT spectroscopy/ multivariate calibration can help establish both the range of variation between source rocks, and the degree of correspondence with the natural processes.
The aim of this paper is to establish multivariate models for maturity changes in DRIFT-spectra of both naturally and artificially matured samples with reference to commonly used maturity scales. The systematic variation in the asphaltene spectra that corresponds to thermal maturity is extracted in the multivariate models and interpreted as chemical reaction processes, and the trends observed in natural and artificially matured samples are compared. As measures of maturity, Rock-Eval Tma~ and vitrinite reflectance (%Ro) are used because of their general utility. For the HP simulations, pyrolysis temperature is used as the primary maturity axis.
EXPERIMENTAL
Source rock and coal samples. Five immature source rocks were artificially matured by hydrous pyrolysis to give series of samples that range from incipient oil
generation into the oil cracking stage. The source rocks are specified in Table 1, together with the range of maturity covered by the pyrolysed sample set.
Coal samples covering a wide range of maturity were collected from various sources, with the majority donated by Norsk Hydro's Research Centre, Bergen. After removal of samples with atypical spectra and samples that are classified as statistical outliers, 41 samples were retained and used in the modelling. The samples are listed by increasing vitrinite reflectance values in Table 2.
Hydrous pyrolysis. Hydrous pyrolysis was per- formed using the procedure described in Barth et al. (1989). 2-5 g of the pre-extracted crushed or powdered source rock was put into a 50 or 80 ml stainless steel (ss 316) autoclave together with an amount of water that would result in a 5 ml liquid water phase at the chosen pyrolysis temperature. The autoclave was purged with nitrogen, closed and rapidly heated to the pyrolysis temperature in a high-temperature oven. The pyrolysis was continued for 72 h before cooling. The generated gas was measured volumetrically on collection through a gas vent. The autoclave was opened, the contents transferred to a filter unit and the water filtered off through a glass fibre filter. The solid residue was transferred to a Soxhlet extraction thimble. The autoclave and filter were washed with dichloromethane (DCM) to collect any generated oil remaining in the equipment, and the solution was
Table 2. Naturally matured coal samples used in calibration of asphaltene DRIFT spectra to maturity
No. Name %Ro T~,x Asphalt t No. Name %Ro Tm,~ AsphaW
1 Lignite 0.38 423 5.8 22 Horseley 0.91 445 1.1 2 IN 21 0.49 449 4.9 23 Heddon 0.95 451 2.1 3 KNORP10 0.50 438 6.2 24 Wearmouth 0.95 447 1.8 4 L.Gelly ca. 0.56 434 5. I 25 Brit.coal 1.02 452 1.4 5 832056 0.58 440 1.8 26 Washington 1.03 451 1.7 6 79910 0.59 445 7.1 27 Usworth 1.04 454 - - 7 843001-3 0.60 442 7.2 28 Svalb.Anser 1.11 441 2.1 8 Kingsw.Cu 0.62 438 2.2 29 Harperley 1.13 461 0.5 9 H.Hazels G. 0.65 431 4.6 30 Sacriston 1.15 462 0.6 10 Brenkley B. 0.67 439 3.5 31 Svalb.Leml 3 1.30 472 2.1 11 Cannel West 0.67 442 3.6 322 VM32, S.Wa, 1.34 471 0.7 12 Bedlington 0.68 439 6.2 322 VM32, S.Wa, 1.34 473 0.7 13 832058 0.68 447 1.1 33 USA, Vol 21 1.34 482 1.4 14 Pleassy A. 0.69 435 1.2 34 Brit.C.23.5 1.42 471 1.0 15 867005-7 0.69 444 2.2 35 Bettes Han. 1.47 495 10.4 16 857047-50 0.71 442 1.3 36 S.Wa. Vm29 1.55 496 0.2 17 Walbottle 0.76 439 2.0 37 Bettes H. L 1.70 496 0.6 18 Wyland can. 0.80 446 3.4 38 Cyn Heidre 1.86 524 9.8 19 842025 0.83 450 1.3 39 Gavon 2.03 529 0.8 20 862037 0.87 443 1.3 40 S.Wa. Loc. 2.04 526 0.2 21 S.A.Wankie 0.90 457 1.3 41 S.Wa. Vm33 2.17 538 0.3
'mg asphalt per gram coal in extract. "Experimental parallels.
Maturity trends in asphaltenes 141
added to the Soxhlet extraction unit for inclusion in the total extract.
Extraction and asphalt separation. Both the coal samples and the pyrolysed source rocks were Soxhlet extracted with D C M for a minimum of 48 h. The resulting bitumen extract was reduced to 10-20 ml on a Rotavapor and quantified by weighing the residue of 10 pl solution on a Cahn Electrobalance. The solution was transferred to a 10 ml round-bot tomed flask, or a 20 ml screw-topped tube (for the coal samples), and the remaining D C M was removed under nitrogen. 40 volumes of hexane were added, and the solution refluxed for 8 h before filtering through a glass fibre filter. The dissolved deasphalted bitumen fraction was collected for further analysis, while the precipitated asphalt was redissolved in D C M and used for recording the i.r. spectra.
The overall results f rom the maturat ion series are presented in Schmidt and Barth (1993) and Barth and Nielsen (1993).
Drift spectroscopy. IR spectra of the asphaltenes from Series 1 and 2 (Table 1) were registered on a Nicolet 800 spectrophotometer with a spectral resolution of 8 c m - 1 (844 data points per spectrum). A Perkin Elmer 1702 x F T I R Spectrophotometer with a spectral resolution of 4 cm - J giving a spectrum of 3401 data points was used for Series 3--6 (Tables 1 and 2). The spectra were directly transferred to a VAX 2000 computer for processing.
The asphaltenes were dissolved in D C M at a concentration of 5 mg/ml and deposited on a levelled surface of powdered anhydrous potassium bromide (KBr) contained in a sample cup. 10 pl sample solution was used, and the diffuse reflectance spectra of the resulting films of asphaltene were registered after the solvent had evaporated.
The structural interpretation of the spectra was done according to the assignments given in Kemp (1991) and Yen et al. (1984).
Multivariate analysis o f spectral profiles. The spectral profiles in transmittance form were trans-
formed to Kube lka -Munk units (Christy et al., 1987). A matrix consisting of wavelengths as columns and sample spectra as rows was used as input to the S IRIUS program on a VAX 2000 computer. S IRIUS is a general-purpose multivariate analysis software program (Kvalheim and Karstang, 1987).
To reduce the matrix dimension, Series 3-6 were subjected to variable reduction by a maximum entropy method (Karstang and Eastgate, 1987) which removes points in areas with little variation. This gave spectra containing 800 variables in the final analysis. A drawback with this procedure is that it results in a non-linear axis of wavenumbers, so that plots cannot be directly compared.
Partial least squares analysis (PLS, or projection to latent structures, Wold et al., 1984) o f the data sets was performed to extract the maturity dependent variation from each source rock series and to establish models for predicting maturity levels from the D R I F T spectra. The statistical significance of the resulting model is evaluated by a cross-validation procedure where the samples are successively left out and predicted by the model. Models with principal components that were not classified as statistically significant were rejected.
RESULTS
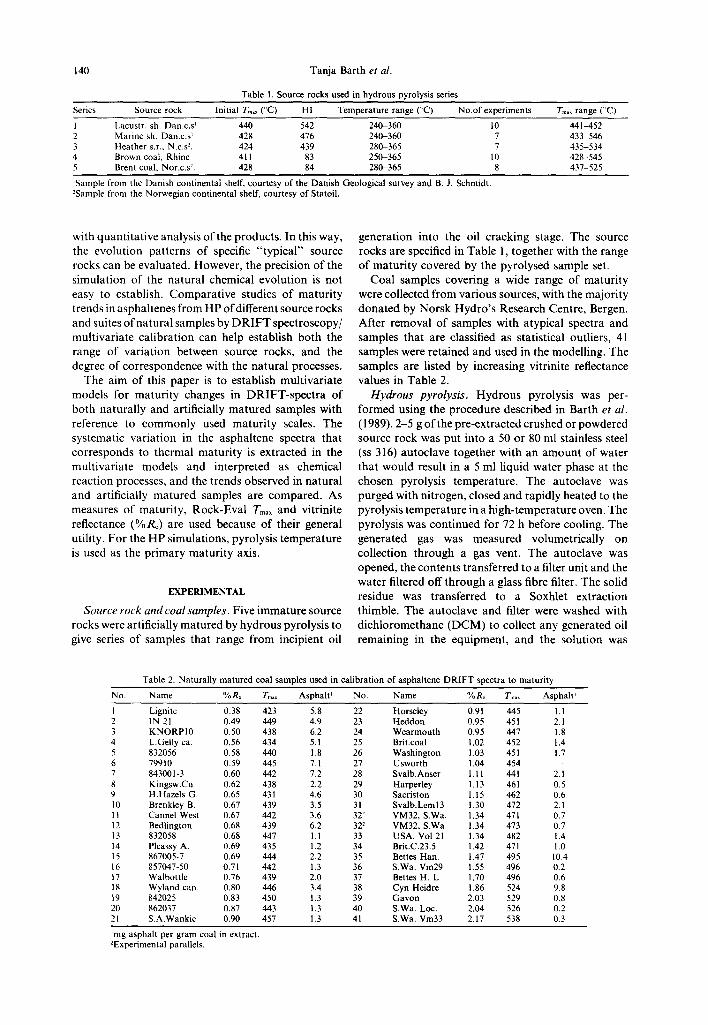
Series 1--lacustrine shale. As shown in Table l, this is a very good potential source rock from the Danish continental shelf which contains 8.1% TOC (total organic carbon) and has a HI (hydrogen index) of 542. It is classified as a Type I - I I source rock, and is expected to generate aliphatic-rich petroleum within a narrow temperature range. An overview of the yields of extractable organic matter (EOM) and asphaltenes from each of the batch experiments in the HP series, and the Tma~ values in the extracted residues at each maturity level, is given in Fig. 1. The yields of E O M and asphaltenes increased slowly to 320°C, and the main generation stage occurred in the 320-350°C
Yields series 1 300
- 540
ra E O M ~ . . . , - a.~ -- 520 250
/ ,5 Aspha l t ene /
"~ 200 - - 500
- 480 ,~ 150 - ~ .
~ -- 460 B 100 --
- - 4 4 0
50 - - - - 4 2 0
0 ] -- _ I 400 200 220 240 260 280 300 320 340 360 380 400
Pyrolysis temperature (°C)
Fig. 1. Yields of total extractable organic matter (EOM) and asphaltenes as mg/g source rock pyrolysed, and Tm~ in the residual source rock after extraction for Series 1.
043 23/2--D
142 Tanja Barth et al.
interval, with the subsequent cracking reactions dominating at 360c~C. The increase in Tm,x was limited, and nearly linear over the temperature range. Thirteen asphaltene spectra were registered, including exper- imental duplicates at 300°C and replicate spectra at 280, 320 and 350°C.
In the final PLS model, the 360°C spectrum was excluded because it represented a separate direction of variation compared to the remaining spectra. This reflects the transition from the temperature range of petroleum generation to the range dominated by petroleum cracking processes, as observed in the yield curve. The single high temperature sample does not provide sufficient data for reliable modelling, and the high temperature trends are instead treated separately below on the basis of models including several experimental series.
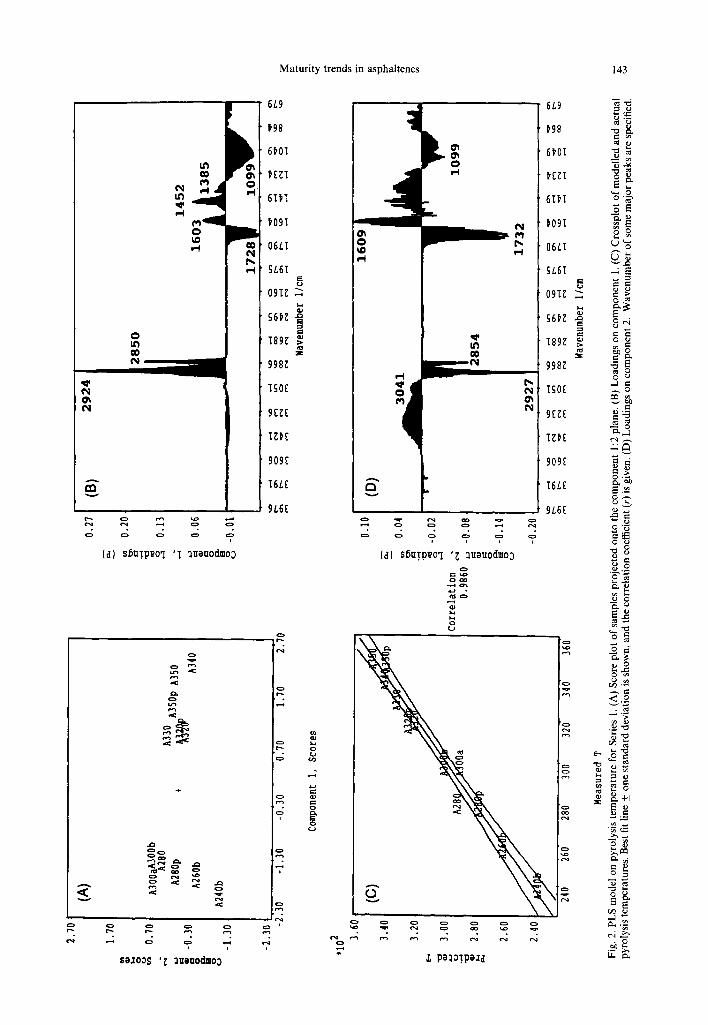
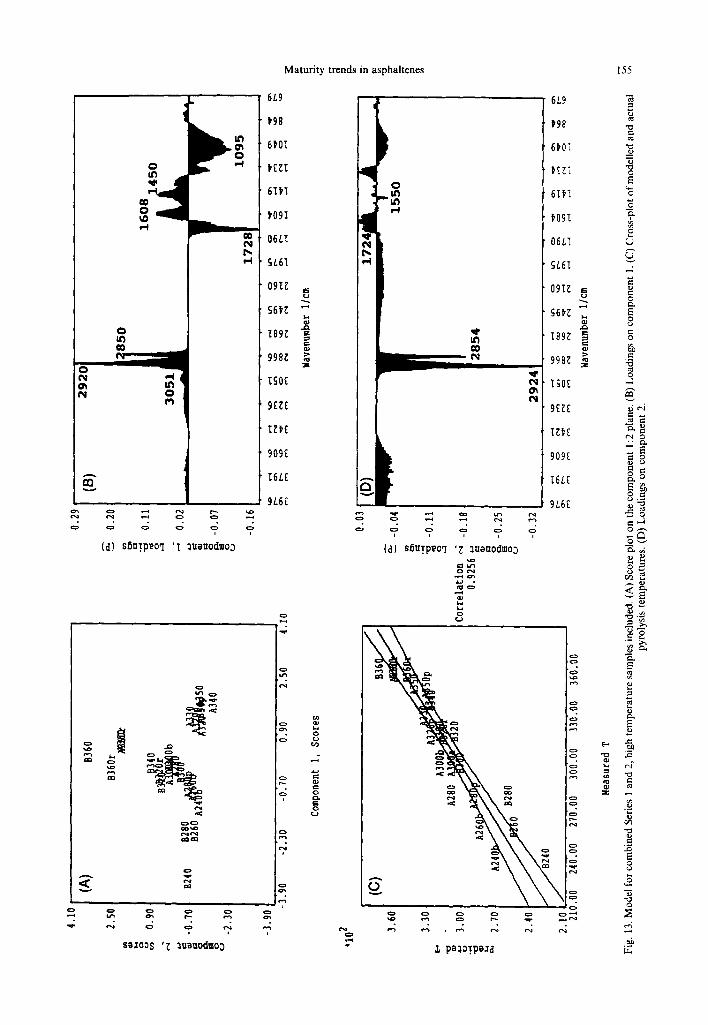
The two major components of the PLS model explain a total of 96.6% of the variance in the pyrolysis temperature and 94.9% of the variance in the spectra. There are three additional components that are statistically significant, but they explain little of the total variance and are not interpretable, and so are not included in the final modelling. The model is presented graphically in Fig. 2, where Fig. 2(A) shows the score plot of the spectra on component 1:2, Fig. 2(B) and (D) show the loadings on the two fist components and Fig. 2(C) shows the correlation between the predicted values from the model and the pyrolysis temperatures used. The correlation between predicted and measured values is 0.986. The loadings on the main components are summarised in Table 3.
The aliphatic region dominates the loadings, as expected from the kerogen type. The first component, Fig. 2(B), reflects the major trend in compositional change during oil generation and covers nearly 80% of the total variation. It shows an increase in the relative amount of aliphatic chains and a decrease in carbonyl-, ether- and hydroxyl- functionalities, illustrating the primary importance of the defunction- alisation reactions. Since the PLS analysis was performed on normalised data (i.e. adjusted to equal area), it is not possible to determine whether there was a real increase in the number of aliphatic chains, or whether the loss of oxygen functionalities caused a relative increase in the aliphatic signals.
On the second component, Fig. 2(D), the aliphatic regions were mainly negatively loaded together with the carbonyls, while the aromatic regions and hydroxyl were positively loaded. This reflects an aromatisation process, combined with removal of carbonyl functions. The maximum of the negative carbonyl peak is at 1732 cm-~ and corresponds to loss of open chain esters and ketones (Kemp, 1991, p. 75). This can be interpreted as a loss of aliphatic chains by hydrolysis of ester linkages, leaving a hydroxyl functionality on the asphaltene fragment. The score plot [Fig. 2(A)] indicates that this process is most important in the temperature range up to 300°C.
Thus, the two statistical axes of variation describe two independent chemical processes that are import- ant in different maturity ranges, though with some overlap. In addition, a separate, high-maturity process is indicated by the initial classification of the 360~C sample as an outlier. In a case like this, the use of target projections which summarise the covariation in the whole set of components (Christy et al., 1993) is not useful, as there is little overlap of information in the components. The two-component multivariate model gives a good description of the experimental data [Fig. 2(D)], and quantitative and statistically signifi- cant descriptions of the changes in the chemical composition of the asphaltenes in this pyrolysis series.
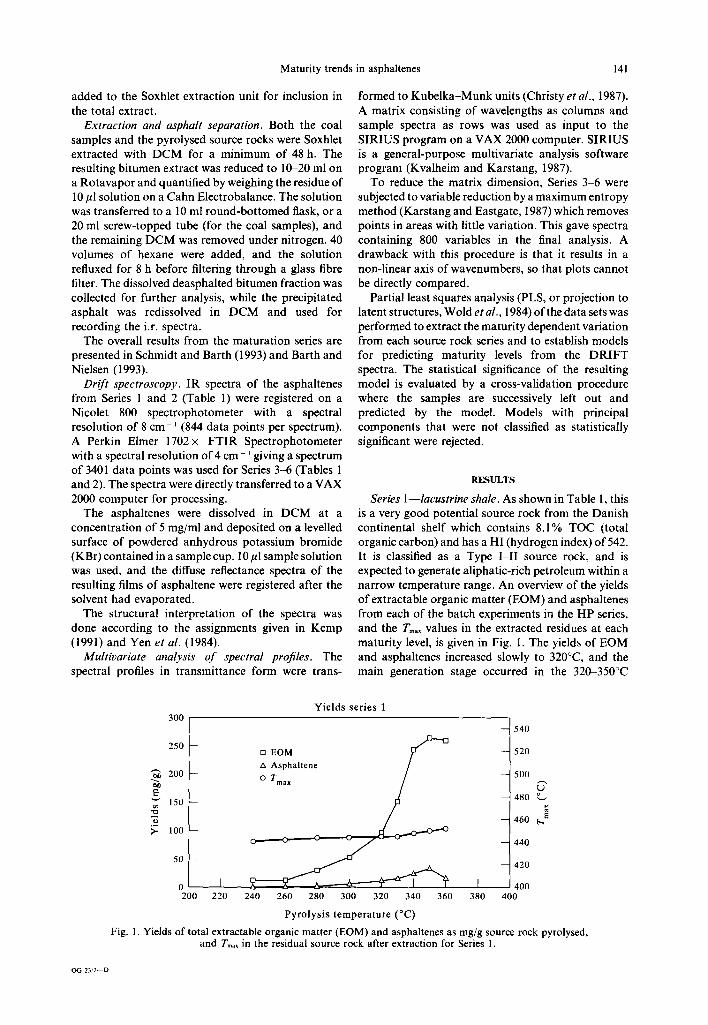
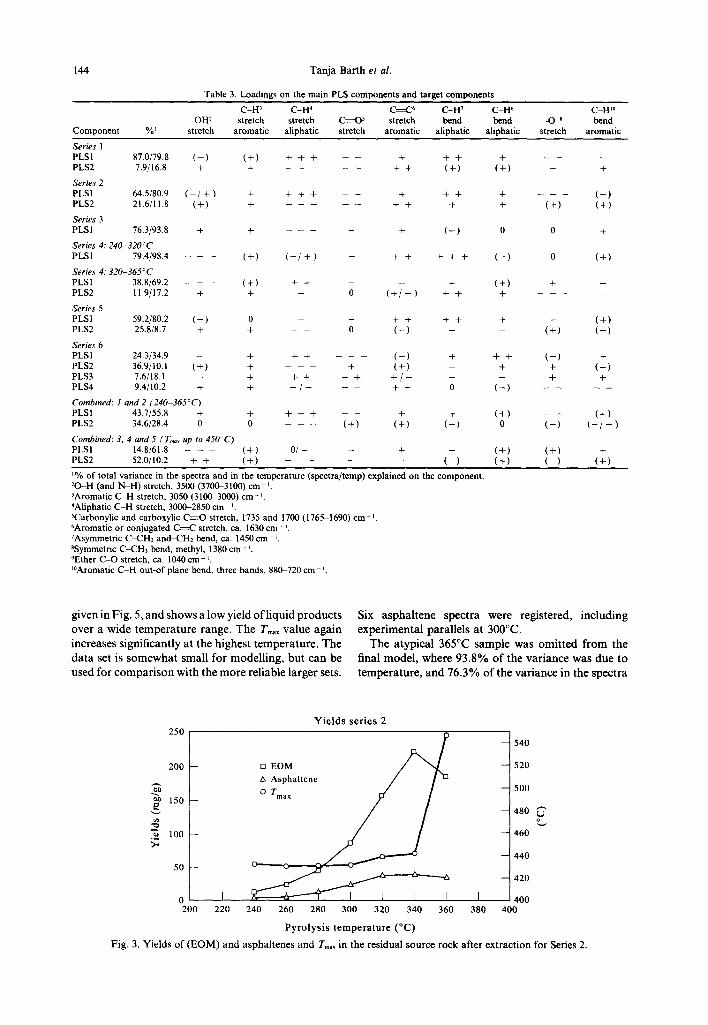
Series 2 - -mar ine shale. The sample is an immature marine shale with a good source rock potential, TOC = 4.0% and HI -- 428. It is classified as a Type II source rock with a potential for oil generation. An overview of the yields and T~,x evolution is given in Fig. 3. The generation phase covered a wider temperature range than Series l, with a maximum EOM yield at 340°C, and a sharp decrease at 36WC, The maximum yield of asphaltenes came at 320°C, and the decrease with temperature was slower than in the previous series. The Tm~ value increased slightly through the generation phase, but for the highest temperature, where cracking processes dominated, the value increased dramatically from 440 to 546"C. Eight asphaltene spectra were registered, including replicate spectra at 320°C.
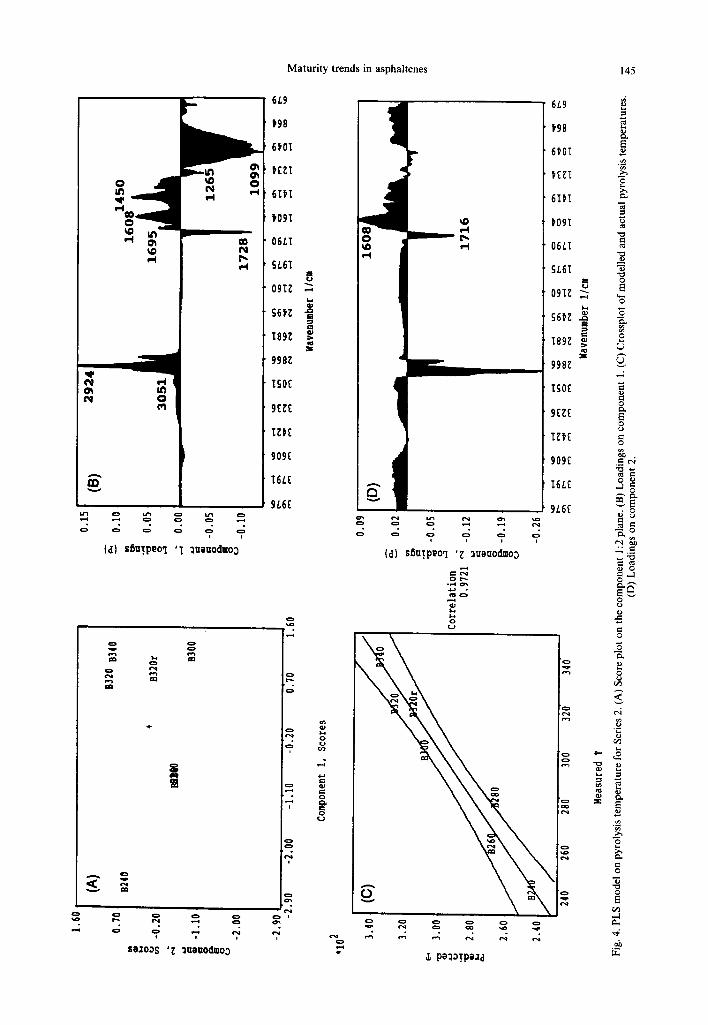
The spectrum of the sample from the highest pyrolysis temperature was again omitted from the model to get a more uniform data set. The two major components explain 91.8% of the variance in the pyrolysis temperatures and 86.1% of the variance in the spectra. The PLS model is shown in Fig. 4(A-D), and the loadings on the main components are summarised in Table 3. The correlation between the modelled and measured pyrolysis temperatures was 0.972.
The loading patterns resemble Series 1, though the aliphatic regions are not as dominating. This is reasonable as the precursor is a less aliphatic Type II kerogen. On the first component, the loadings in the hydroxyl region change sign from negative to positive at 3400 cm - ~, indicating either differences in evolution of free and H-bound hydroxyl groups, or possibly a contribution from amino N-H stretch in the lower region (Kemp, 1991, p. 67). Component 1 mainly reflects the changes up to 300°C, while component 2, with the emphasis on the aromatic regions, is more important in the higher temperature range. The overall patterns are very similar to the loadings for Series 1, and the model explains the data set well.
Series 3 - - H e a t h e r source rock. This is an Upper Jurassic source rock from the Norwegian continental shelf, with 5.0% TOC and a HI of 439. It is classified as a Type II/III source rock with more potential for gas than oil generation. Only 5 pyrolysis temperatures were run in this series. The yield and Tm~ curves are
Maturity trends in asphaltenes 143
O~ f 4
A
CO v
A < v
0
CO
e.4 r,.i ~1 Cb WE ,-I
w~
0
cO IN ¢,,
(d) sSuTP~O'I ' I 3ueuodmoo
c,
.< ~ -~
¢:m ¢=,
s~;z0~S ' ~ ~u~aodmoD
6L9
P98
6~01
~[KI
61~I
~091
06LI
~L61
091~
998Z
I~O[
IZ)[
909[
9L6[
g
i
,4
8
0
O%
o o ,?, o o
(d) SSUTP~0q 'Z ~uau0d,.0D
O O m
~ o
o v
6L9
~98
6~01
6TPI
~091
06tI
~t61
091~
§6~ ~
189~
998Z
I~0E
909[
16i[
9L6[
%- O
8~ O
~E
O ~
O
E_ ~ O ~
O ~
88
<o
> ~
N
C~
• O
144 T a n j a B a r t h et al.
Table 3. Loadings on the main PLS components and target components
C - H 3 C - H 4 C - - C 6 C_H 7 C - H e C-H~0 - O H 2 stretch stretch C-----'<) 5 stretch bend bend -<)-~ bend
Component ° 1 stretch aromat ic aliphatic stretch aromat ic aliphatic aliphatic stretch aromat ic
Series 1 PLSI 87.0/79.8 ( - ) ( + ) + + + + + + + - PLS2 7.9/16.8 + + + + ( + ) ( + ) - +
Series 2 PLSI 64.5/80.9 ( - / + ) + + + + + + + + ( - ) PLS2 21.6/11.8 ( + ) + + + + + ( + ) ( + )
Series 3 PLSI 76.3/93.8 + + - + ( - ) 0 0 +
Series 4: 240-320°C PLSI 79.4/98.4 ( + ) ( - / + ) - + + + + + ( - ) 0 ( + )
Series 4: 320-365°C PLSI 38.8/69.2 ( + ) + + - - + ( + ) + + PLS2 11.9/17.2 + + + 0 ( + / - ) + + +
Series 5 PLSI 59.2/80.2 ( - ) 0 - - + + + + + - ( + ) PLS2 25.8/8.7 + + 0 ( - ) - - ( + ) ( + )
Series 6 PLSI 24.3/34.9 - + + + ( - ) + + + ( - ) + PLS2 36.9/10.1 ( + ) + + ( + ) -- + + ( + ) PLS3 7.6/18.1 - + + + + + + / - - - + + PLS4 9.4/10.2 + + + / - + + 0 ( - )
Combined: 1 and 2 (240-365°C) PLSI 43.7/55.8 + + + + + + + ( + ) ( + ) PLS2 34.6/28.4 0 0 ( + ) ( + ) ( - ) 0 ( - ) ( - / + )
Combined: 3, 4 and5 (Tm,~ up to 450°C) PLSI 14.8/61.8 ( + ) O / - - + + ( + ) ( + ) + PLS2 52.0/10.2 + + ( + ) - - ( - ) ( + ) ( - ) ( + )
% of total var iance in the spectra and in the temperature (spectra/ temp) explained on the component , 2 0 - H (and N - H ) stretch, 3500 (3700-3100) c m - t . 3Aromatic C - H stretch, 3050 (3100-3000) cm-~. 4Aliphatic C - H stretch, 3000-2850 cm ~. SCarbonylic and carboxylic C-----O stretch, 1735 and 1700 (1765-1690) c m - k . 6Aromatic or conjugated C----C stretch, ca. 1630 cm - ~. 7Asymmetric C-CH3 and-CH2 bend, ca. 1450 cm - t. 8Symmetric C-CH3 bend, methyl, 1380 cm-~. 9Ether C~O stretch, ca. 1040 cm - ~. ~°Aromatic C - H out-of plane bend, three bands, 880-720 cm - ~.
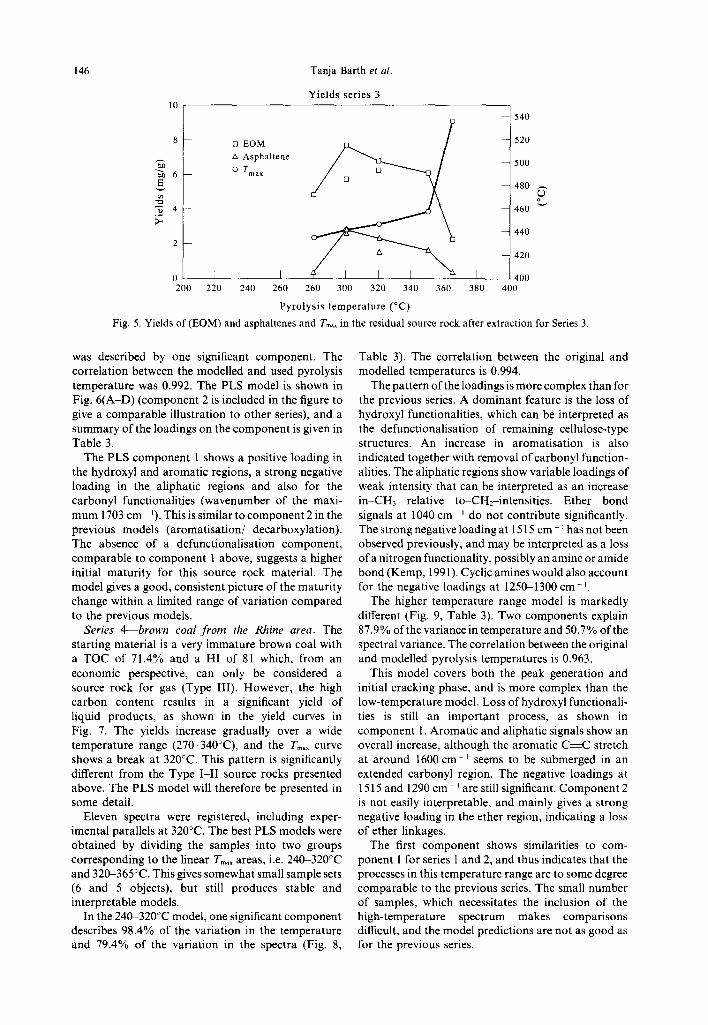
given in Fig. 5, and shows a low yield of liquid products over a wide temperature range. The Tm~x value again increases significantly at the highest temperature. The data set is somewhat small for modelling, but can be used for comparison with the more reliable larger sets.
Six asphaltene spectra were registered, including experimental parallels at 300°C.
The atypical 365°C sample was omitted from the final model, where 93.8% of the variance was due to temperature, and 76.3% of the variance in the spectra
Y i e l d s s e r i e s 2 250
/ ~ - 540
200 - ra E O M -- 520
A Aspha l t ene j [ u m 0 0
"~ 150 -- / ~ -- 480
.~ 100 -- - - 460
-- 440
o L I 400 200 220 240 260 280 300 320 340 360 380 400
P y r o l y s i s t e m p e r a t u r e ( ° C )
F i g . 3. Y i e l d s o f ( E O M ) a n d a s p h a l t e n e s a n d Tmax in t h e r e s i d u a l s o u r c e r o c k a f t e r e x t r a c t i o n f o r Se r i e s 2.
Maturity trends in asphaltenes 145
e~
m
¢~
o ~.)
e-l¢l ¢
~p
0
o o o o, o,
((I) S~uTP~O'I '~ ~,zzau0du0;~
o oo
s~
• ~ o ° o
sozo~s '~ 3u0u0dmo~
6L9
}98
6POI
PEZI
6I~I
~09!
06LI
SL61
09IZ
S6t~
I89~
998~
ISO£
I~P£
909£
I6L£
9L6£
• °
t
,4
3
~ u
"2. o o o, o
(~]) s6uTp~o'I ' ~ ~uauodlo3
0 v
• °
6L9
~98
6POI
P£~I
6IPI
~09I
06LI
SL6I
09IC
te9~
998~
ISO£
909E
$6L£
9L6£
o,
pa~Tpa~a
3
.o
"t:p 0
.o c~
0 c,,
8 C~
O
~ 8
0
8
e-, o
o
o
o
--1
LE
10
~ 6
'-~ 4
0 2 0 0
I 2 6 0 2 6 0 3 0 0 3 2 0 3 4 0 3 6 0
P y r o l y s i s t e m p e r a t u r e ( ° C )
Y i e l d s s e r i e s 3
[] E O M
A A s p h a l t e n e
0 Tma x
t I 2 2 0 2 4 0
1 4 6 T a n j a B a r t h et al.
- - 5 4 0
- - 5 2 0
- - 5 0 0
- - 4 8 0 , - ,
L., - - 4 6 0
- - 4 4 0
- - 4 2 0
I 400 3 8 0 4 0 0
Fig. 5. Yields of (EOM) and asphaltenes and Tm~ in the residual source rock after extraction for Series 3.
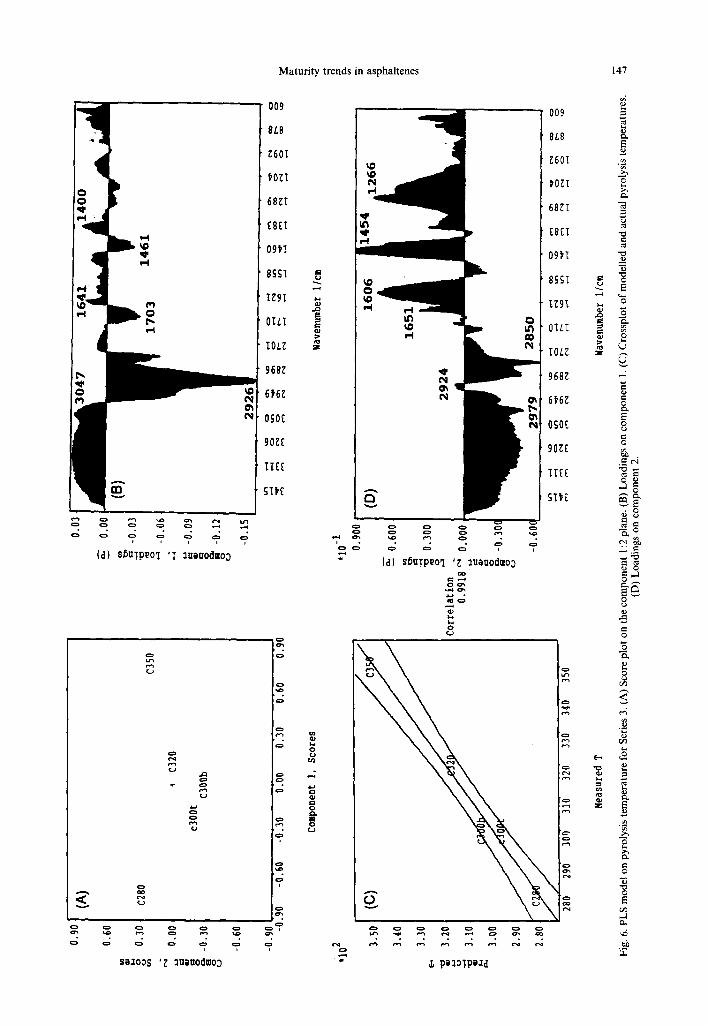
was described by one significant component. The correlation between the modelled and used pyrolysis temperature was 0.992. The PLS model is shown in Fig. 6(A-D) (component 2 is included in the figure to give a comparable illustration to other series), and a summary of the loadings on the component is given in Table 3.
The PLS component 1 shows a positive loading in the hydroxyl and aromatic regions, a strong negative loading in the aliphatic regions and also for the carbonyl functionalities (wavenumber of the maxi- mum 1703 cm - ~). This is similar to component 2 in the previous models (aromatisation/ decarboxylation). The absence of a defunctionalisation component, comparable to component 1 above, suggests a higher initial maturity for this source rock material. The model gives a good, consistent picture of the maturity change within a limited range of variation compared to the previous models.
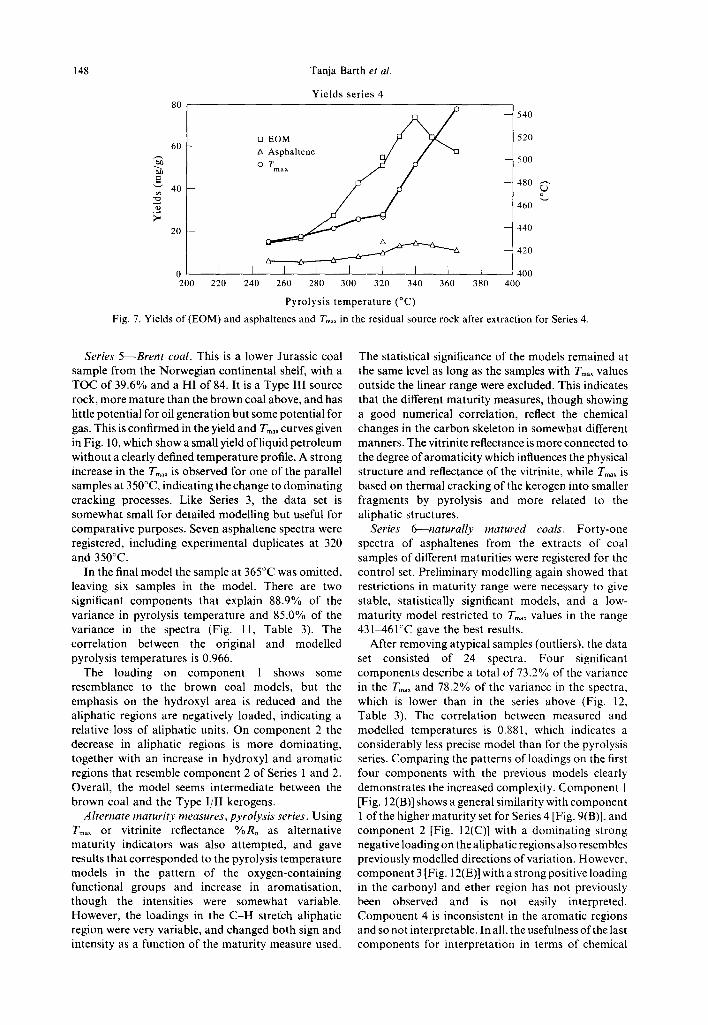
Series 4--brown coal from the Rhine area. The starting material is a very immature brown coal with a TOC of 71.4% and a HI of 81 which, from an economic perspective, can only be considered a source rock for gas (Type III). However, the high carbon content results in a significant yield of liquid products, as shown in the yield curves in Fig. 7. The yields increase gradually over a wide temperature range (270-340°C), and the Tmax curve shows a break at 320°C. This pattern is significantly different from the Type I-II source rocks presented above. The PLS model will therefore be presented in some detail.
Eleven spectra were registered, including exper- imental parallels at 320°C. The best PLS models were obtained by dividing the samples into two groups corresponding to the linear Tm~x areas, i.e. 240-320°C and 320-365°C. This gives somewhat small sample sets (6 and 5 objects), but still produces stable and interpretable models.
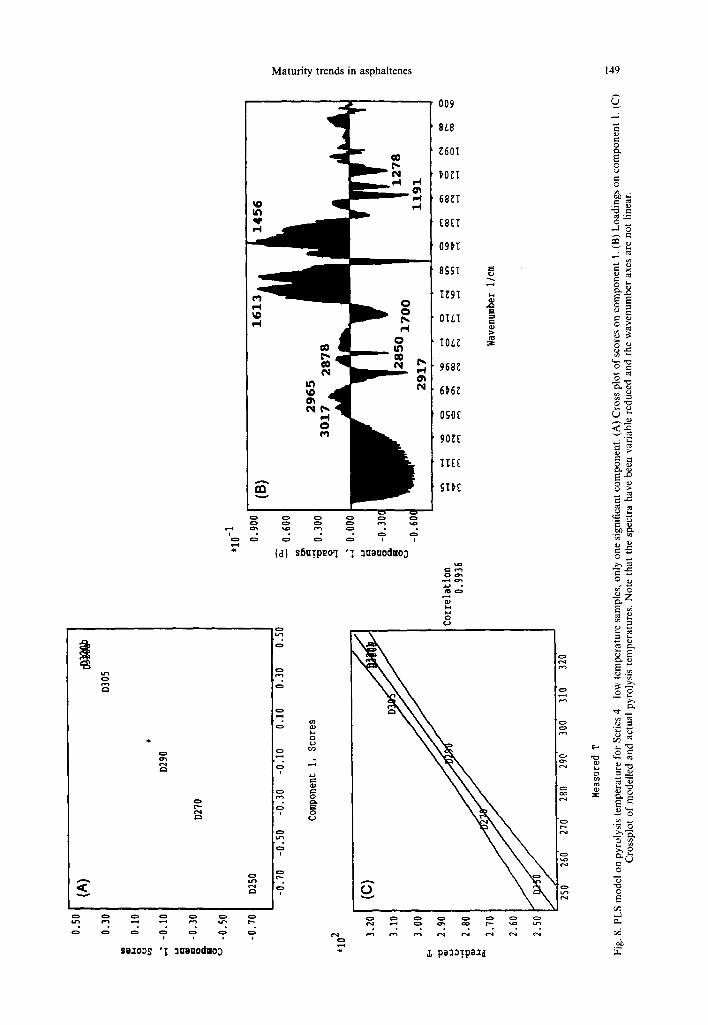
In the 240-320°C model, one significant component describes 98.4% of the variation in the temperature and 79.4% of the variation in the spectra (Fig. 8,
Table 3). The correlation between the original and modelled temperatures is 0.994.
The pattern of the loadings is more complex than for the previous series. A dominant feature is the loss of hydroxyl functionalities, which can be interpreted as the defunctionalisation of remaining cellulose-type structures. An increase in aromatisation is also indicated together with removal of carbonyl function- alities. The aliphatic regions show variable loadings of weak intensity that can be interpreted as an increase in-CH3 relative to-CH2-intensities. Ether bond signals at 1040 cm- ~ do not contribute significantly. The strong negative loading at 1515 cm - ~ has not been observed previously, and may be interpreted as a loss of a nitrogen functionality, possibly an amine or amide bond (Kemp, 1991). Cyclic amines would also account for the negative loadings at 1250--1300 cm-
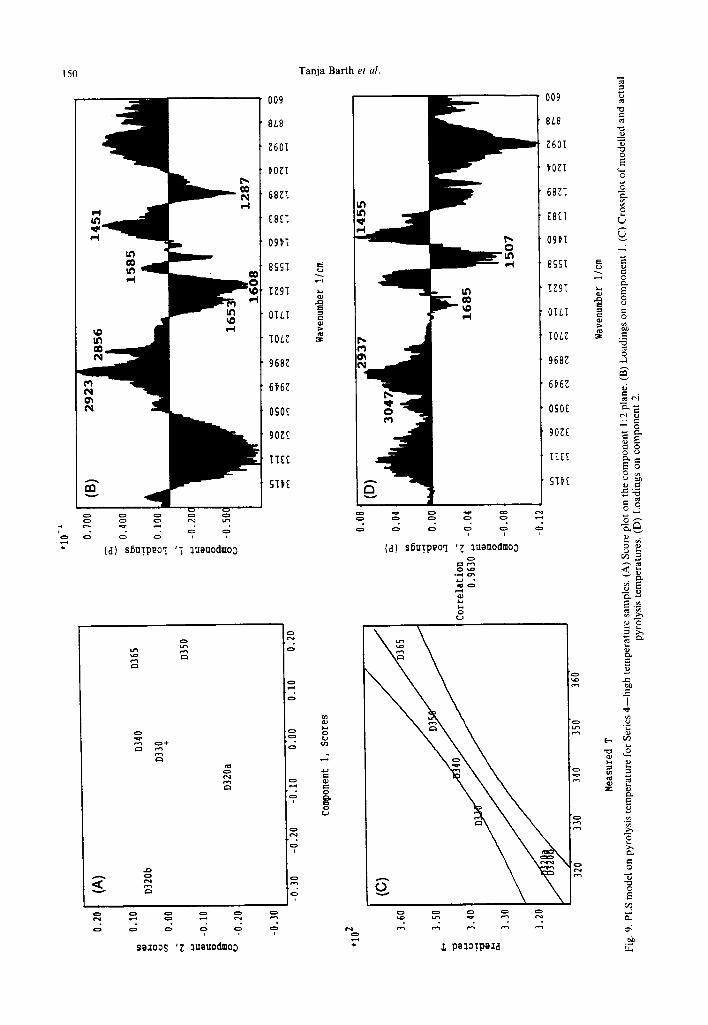
The higher temperature range model is markedly different (Fig. 9, Table 3). Two components explain 87.9 % of the variance in temperature and 50.7 % of the spectral variance. The correlation between the original and modelled pyrolysis temperatures is 0.963.
This model covers both the peak generation and initial cracking phase, and is more complex than the low-temperature model. Loss of hydroxyl functionali- ties is still an important process, as shown in component 1. Aromatic and aliphatic signals show an overall increase, although the aromatic C------C stretch at around 1600 cm-~ seems to be submerged in an extended carbonyl region. The negative loadings at 1515 and 1290 cm - ~ are still significant. Component 2 is not easily interpretable, and mainly gives a strong negative loading in the ether region, indicating a loss of ether linkages.
The first component shows similarities to com- ponent 1 for series 1 and 2, and thus indicates that the processes in this temperature range are to some degree comparable to the previous series. The small number of samples, which necessitates the inclusion of the high-temperature spectrum makes comparisons difficult, and the model predictions are not as good as for the previous series.
Maturity trends in asphaltcnes 147
I
I 0 0
e,,l
t,,,, ,-,4
A
rn
• o o o
i n p
(el) s~uTpeoz 'I nuauoclmoo
O09
8L8
~601
P0ZI
68~I
£BZI
09Pl
ess~
I~gl i 01LI
968~
6~6Z
OSO£
90~£
II££
v
~ J
o
o
, °
solons '~ :~uouodmo3
I - {
C) v
N
009
8L8
~601
~0~I
68~I
C8£I
09)I
85SI
I~91
O 01LI
10L~
968Z
6~6Z
OSO£
90~C
II££
Sl~£
, , = ,
* (d) st~uTP~O,i '~ ~uauoclmoo
~ d
E
E
2 ,~ rJ
O
8 C~
~ 8
C~
O
"E .u O
.r'
O
.-.a
,6 L~
148 Tanja Barth et al.
Yields series 4 80
_ 1540
[] EOM 520 60 -- A Asphahene ~ / /
"~ o r ~ c~ -- 500
E -- 480 40 --
.'~ 460
20 -- -- 440
~ ~ ~ ~ ' ~ : ~ -- 420
0 I I I I I l I i i 400 200 220 240 260 280 300 320 340 360 380 400
P y r o l y s i s t e m p e r a t u r e ( ° C )
Fig. 7. Yields of (EOM) and asphaltenes and Tma~ in the residual source rock after extraction for Series 4.
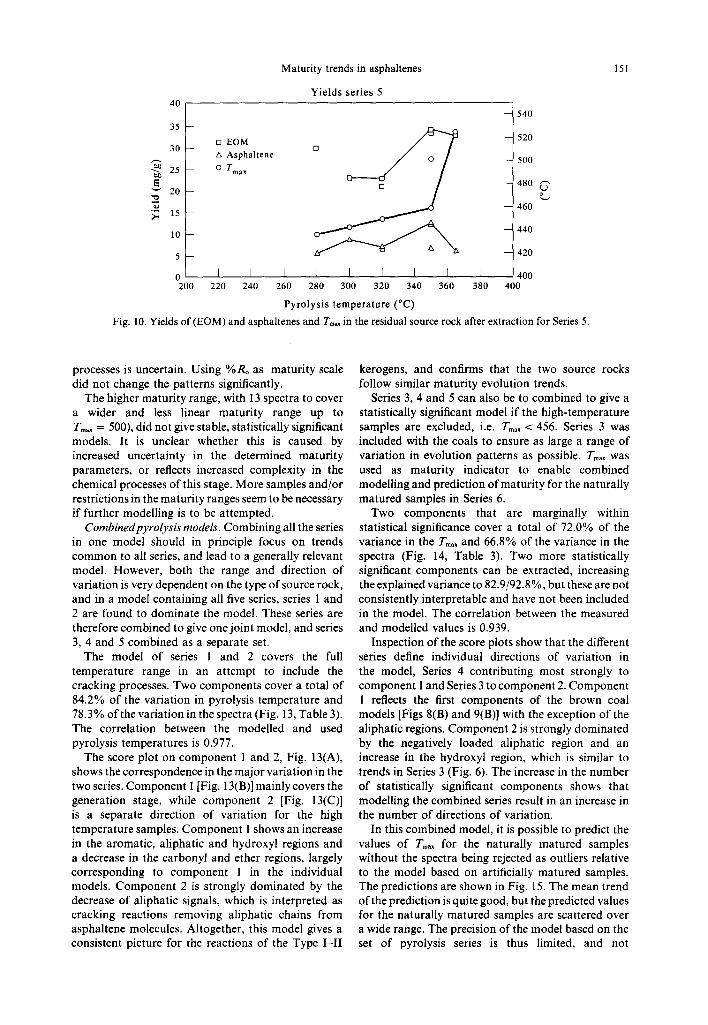
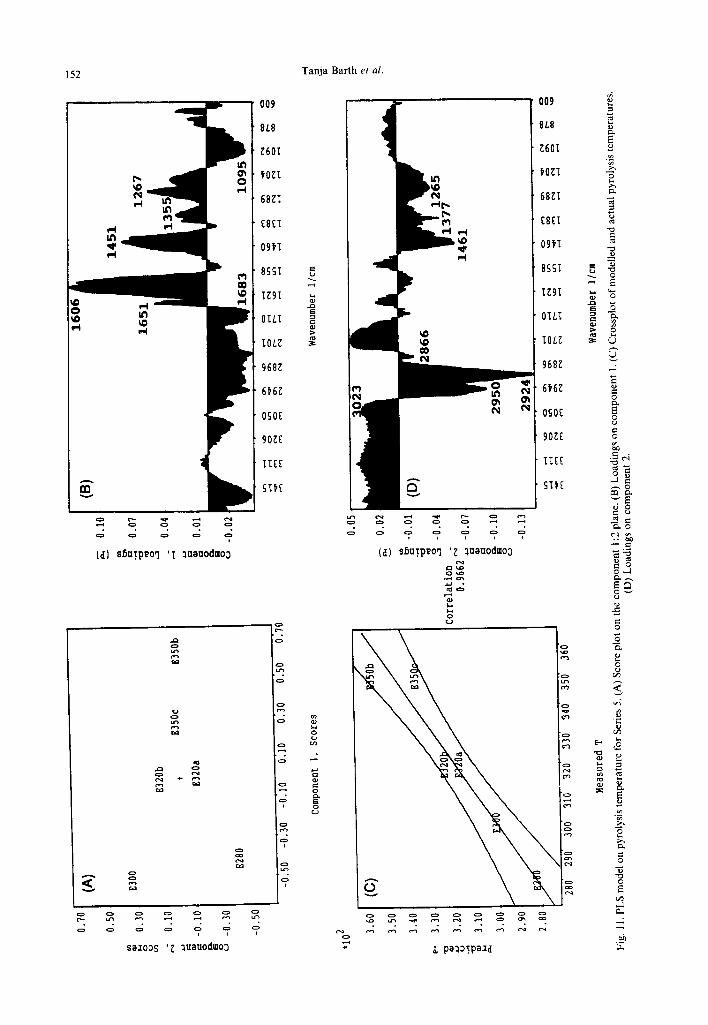
Series 5--Brent coal. This is a lower Jurassic coal sample from the Norwegian continental shelf, with a TOC of 39.6% and a HI of 84. It is a Type III source rock, more mature than the brown coal above, and has little potential for oil generation but some potential for gas. This is confirmed in the yield and T~ax curves given in Fig. 10, which show a small yield of liquid petroleum without a clearly defined temperature profile. A strong increase in the Tmax is observed for one of the parallel samples at 350°C, indicating the change to dominating cracking processes. Like Series 3, the data set is somewhat small for detailed modelling but useful for comparative purposes. Seven asphaltene spectra were registered, including experimental duplicates at 320 and 350°C.
In the final model the sample at 365°C was omitted, leaving six samples in the model. There are two significant components that explain 88.9% of the variance in pyrolysis temperature and 85.0% of the variance in the spectra (Fig. 11, Table 3). The correlation between the original and modelled pyrolysis temperatures is 0.966.
The loading on component 1 shows some resemblance to the brown coal models, but the emphasis on the hydroxyl area is reduced and the aliphatic regions are negatively loaded, indicating a relative loss of aliphatic units. On component 2 the decrease in aliphatic regions is more dominating, together with an increase in hydroxyl and aromatic regions that resemble component 2 of Series 1 and 2. Overall, the model seems intermediate between the brown coal and the Type I/II kerogens.
Alternate maturity measures, pyrolysis series. Using Tmax o r vitrinite reflectance %Ro as alternative maturity indicators was also attempted, and gave results that corresponded to the pyrolysis temperature models in the pattern of the oxygen-containing functional groups and increase in aromatisation, though the intensities were somewhat variable. However, the loadings in the C-H stretch aliphatic region were very variable, and changed both sign and intensity as a function of the maturity measure used.
The statistical significance of the models remained at the same level as long as the samples with Tmax values outside the linear range were excluded. This indicates that the different maturity measures, though showing a good numerical correlation, reflect the chemical changes in the carbon skeleton in somewhat different manners. The vitrinite reflectance is more connected to the degree of aromaticity which influences the physical structure and reflectance of the vitrinite, while Tmax is based on thermal cracking of the kerogen into smaller fragments by pyrolysis and more related to the aliphatic structures,
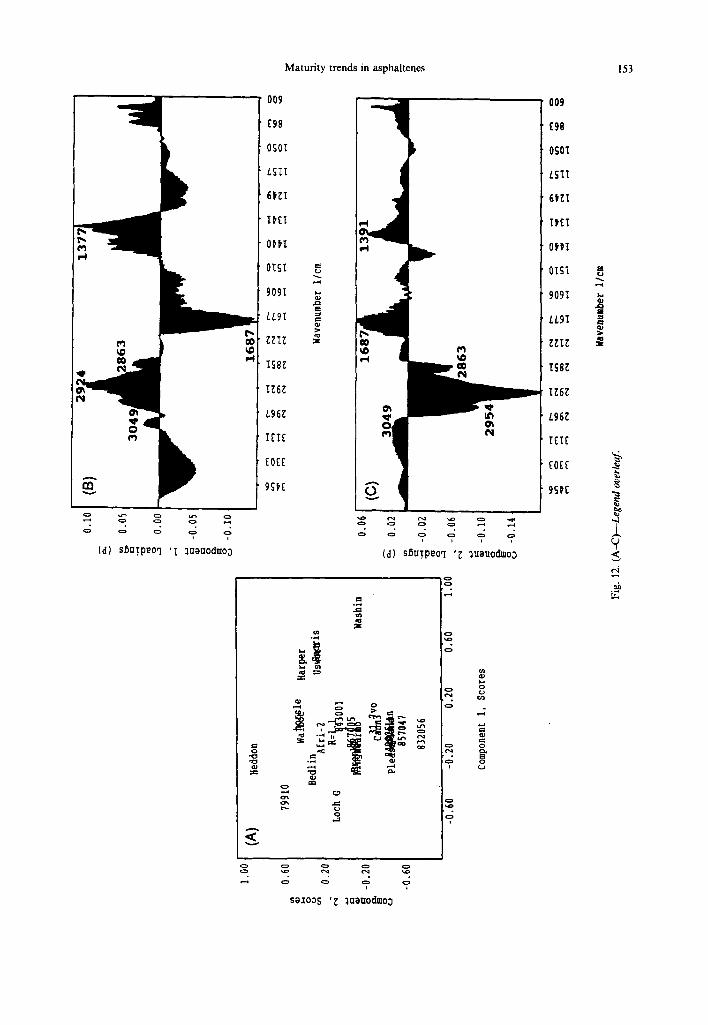
Series 6~naturally matured coals. Forty-one spectra of asphaltenes from the extracts of coal samples of different maturities were registered for the control set. Preliminary modelling again showed that restrictions in maturity range were necessary to give stable, statistically significant models, and a low- maturity model restricted to Tm,~ values in the range 431~,61°C gave the best results.
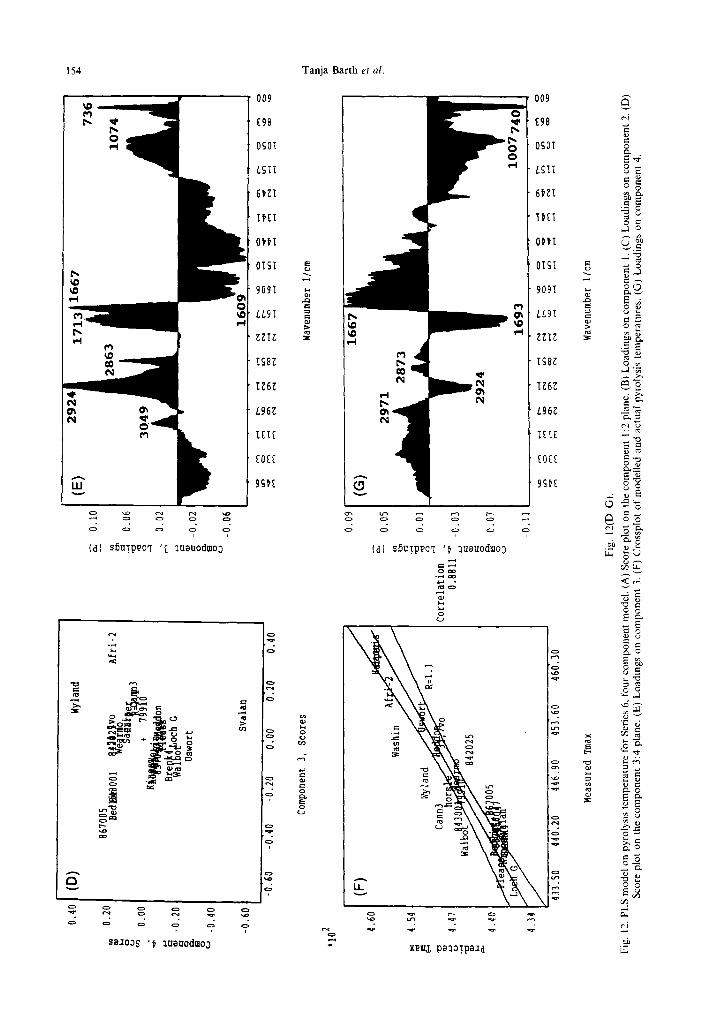
After removing atypical samples (outliers), the data set consisted of 24 spectra. Four significant components describe a total of 73.2% of the variance in the T, nax and 78.2% of the variance in the spectra, which is lower than in the series above (Fig. 12, Table 3). The correlation between measured and modelled temperatures is 0.881, which indicates a considerably less precise model than for the pyrolysis series. Comparing the patterns of loadings on the first four components with the previous models clearly demonstrates the increased complexity. Component 1 [Fig. 12(B)] shows a general similarity with component 1 of the higher maturity set for Series 4 [Fig. 9(B)], and component 2 [Fig. 12(C)] with a dominating strong negative loading on the aliphatic regions also resembles previously modelled directions of variation. However, component 3 [Fig. 12(E)] with a strong positive loading in the carbonyl and ether region has not previously been observed and is not easily interpreted. Component 4 is inconsistent in the aromatic regions and so not interpretable. In all, the usefulness of the last components for interpretation in terms of chemical
Maturity trends in asphaltenes 149
A <
o
¢1
A {n
o o
' o o
o ~
÷
o
Sa.IOOS ' ~ :au~u0dla0~
o~
009
8L8
Z60I
~OZT
68ZI
CS£I
09~I
8SSI
e~
0 IOL~ m
cO . ~ P':. 968~ ~i I
OS0[ 0
SI~
, °
6
i
o ~ o
o
0
E 8 o ~. .
• , ~ e -
o ~
~ g
8 ~
0
N ~ =
2 ~
0
0
r ~ ...1
._~
- ~ Pa~aTpa~d
150
" (d) s6u~.p~oq ' I ~uBuoclm03
009
8L8
Z601
~O~I
68~I
EB[~
09~I
8 ~ I
I~9T
OILI
IOL~
968~
6~6~
OSO[
90~E
fiZZ
SlfE
v
o ~
¢m
¢m
o
=
o ¢m
o • . o
soioo$ 'Z 3uOuodmo3
Tanja Barth et al.
009
8L8
~601
~O~I
68~I
[8[I
09~I
8SSI
IZ91
OILI
IOL~
968Z
6~6~
OSOZ
90ZE
llZ£
SI~Z
o
c >
(d) s6uTpeoq '~ auauodmo3
0
a.,,a • m o
\ \ \
z
0
E
P
0
8 0
.E
0
d
m 0
0
8~
o . 1
0
E . ~ . ~E .~.o
p
E
~n
c- O
0
4 0
3 5 - -
1 0 - -
5 - -
0 2 0 O
3O
25
~ 2 0
o E O M
A A s p h a l t e n e
0 Tma x
I I 2 2 0 2 4 0
Maturity trends in asphaltenes
Yields series 5
[] []
t I I i I I 2 6 0 2 8 0 3 0 0 3 2 0 3 4 0 3 6 0
Pyrolysis temperature (°C)
- - 5 4 0
- 5 2 0
- - 5 0 0
- - ! 4 8 0 ~ "
- - [ 4 6 0 ~
- - 4 4 0
- - 4 2 0
I 400 3 8 0 4 0 0
Fig. 10. Yields of (EOM) and asphaltenes and Tm,~ in the residual source rock after extraction for Series 5.
151
processes is uncertain. Using %Ro as maturity scale did not change the patterns significantly.
The higher maturity range, with 13 spectra to cover a wider and less linear maturity range up to Tmax = 500), did not give stable, statistically significant models. It is unclear whether this is caused by increased uncertainty in the determined maturity parameters, or reflects increased complexity in the chemical processes of this stage. More samples and/or restrictions in the maturity ranges seem to be necessary if further modelling is to be attempted.
Combined pyrolysis models. Combining all the series in one model should in principle focus on trends common to all series, and lead to a generally relevant model. However, both the range and direction of variation is very dependent on the type of source rock, and in a model containing all five series, series 1 and 2 are found to dominate the model. These series are therefore combined to give one joint model, and series 3, 4 and 5 combined as a separate set.
The model of series l and 2 covers the full temperature range in an attempt to include the cracking processes. Two components cover a total of 84.2% of the variation in pyrolysis temperature and 78.3% of the variation in the spectra (Fig. 13, Table 3). The correlation between the modelled and used pyrolysis temperatures is 0.977.
The score plot on component l and 2, Fig. 13(A), shows the correspondence in the major variation in the two series. Component 1 [Fig. 13(B)] mainly covers the generation stage, while component 2 [Fig. 13(C)] is a separate direction of variation for the high temperature samples. Component 1 shows an increase in the aromatic, aliphatic and hydroxyl regions and a decrease in the carbonyl and ether regions, largely corresponding to component 1 in the individual models. Component 2 is strongly dominated by the decrease of aliphatic signals, which is interpreted as cracking reactions removing aliphatic chains from asphaltene molecules. Altogether, this model gives a consistent picture for the reactions of the Type I - I I
kerogens, and confirms that the two source rocks follow similar maturity evolution trends.
Series 3, 4 and 5 can also be to combined to give a statistically significant model if the high-temperature samples are excluded, i.e. Tma~ < 456. Series 3 was included with the coals to ensure as large a range of variation in evolution patterns as possible. Tmax was used as maturity indicator to enable combined modelling and prediction of maturity for the naturally matured samples in Series 6.
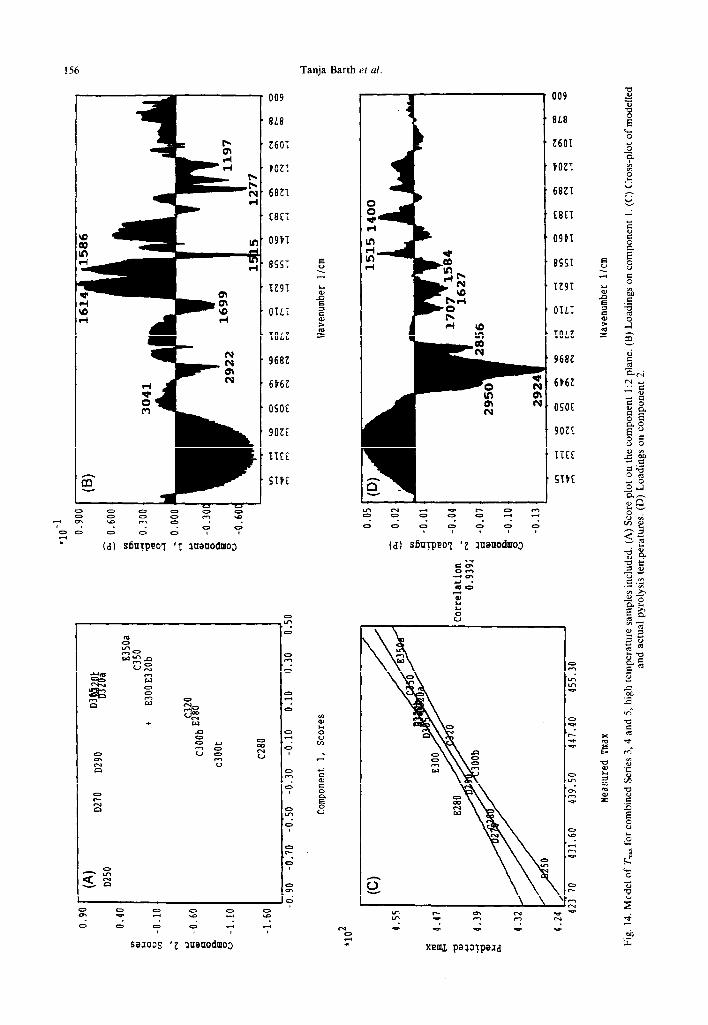
Two components that are marginally within statistical significance cover a total of 72.0% of the variance in the Tmax and 66.8% of the variance in the spectra (Fig. 14, Table 3). Two more statistically significant components can be extracted, increasing the explained variance to 82.9/92.8 %, but these are not consistently interpretable and have not been included in the model. The correlation between the measured and modelled values is 0.939.
Inspection of the score plots show that the different series define individual directions of variation in the model, Series 4 contributing most strongly to component 1 and Series 3 to component 2. Component 1 reflects the first components of the brown coal models [Figs 8(B) and 9(B)] with the exception of the aliphatic regions. Component 2 is strongly dominated by the negatively loaded aliphatic region and an increase in the hydroxyl region, which is similar to trends in Series 3 (Fig. 6). The increase in the number of statistically significant components shows that modelling the combined series result in an increase in the number of directions of variation.
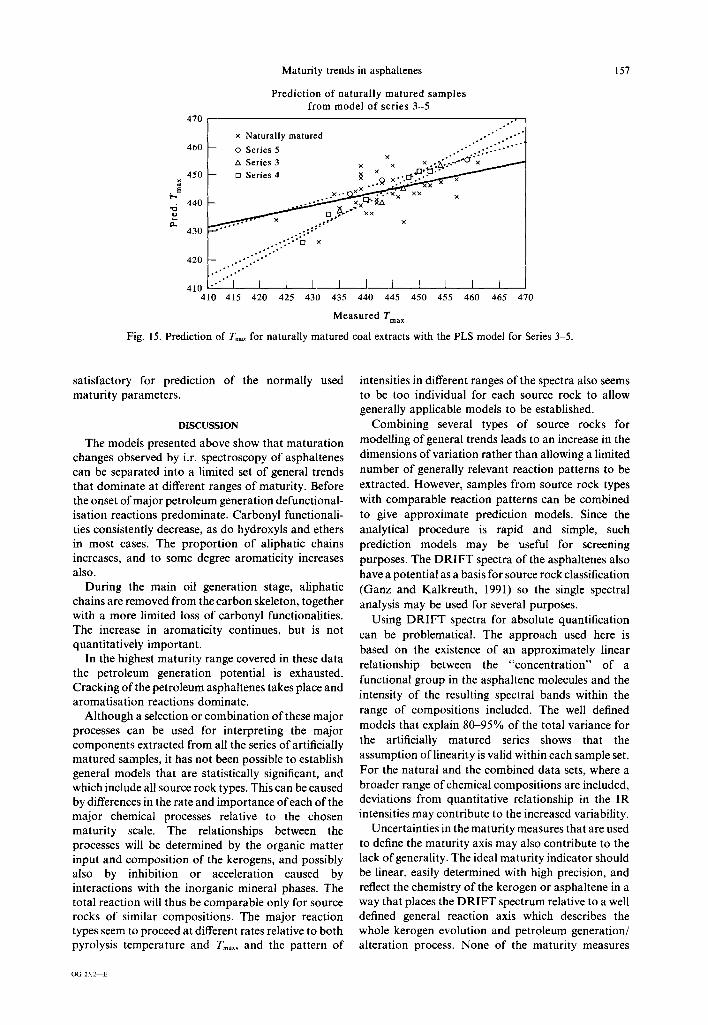
In this combined model, it is possible to predict the values of T~ax for the naturally matured samples without the spectra being rejected as outliers relative to the model based on artificially matured samples. The predictions are shown in Fig. 15. The mean trend of the prediction is quite good, but the predicted values for the naturally matured samples are scattered over a wide range. The precision of the model based on the set of pyrolysis series is thus limited, and not
152 Tanja Barth et al.
A
O0 v
O~ 0
I=
OOg
8L8
~601
fO~I
68~I
£8£I
09~I
OILI
~OLZ
968~
6P6E
0~0~
90~Z
II£Z
~IfZ
009
8L8
~601
DO~I
68ZI
£8ZI
OgDI
(~I) SOUTp~O'I ' I :luauod=o3
<
I
. . . . o ~ o
s~oo~ '~ ~,u~uod=o3
o
(d) sOu!p~oq '~ ~u~uod=o3
o ~ • .
~91
OILI
IOL~
968~
6~6~
OSOZ
90~Z
ITZZ
SI~Z
E
0
o
CO v E
~ o
~ g
3 ~
0
9 a
r ~
~q
g~
m
a
¢-
o % 0
r ~ .a e~
._~
Maturity 153
009
C98
OS01
LSII
6bZI
TKI
ObDT
ISBZ
I262
1962
[ITf
iOEE
3SPC
/1 pp1, * LSII
’ 6121
rl 4 ’
VET
r: . OUT
OIST
* 909T
’ LL91
2
, ZZTZ
-00 TSilZ
I 1262
E
L96Z
TETE
EOEC
9SDE
0.4c
fiI 0.20
::
r3 0.00
3 u B op -0
.20
P z -0.40
-0.60
*lo2
4.60
I
(D)
Wyl
and
Afr
i-2
Sval
an
-0.6
0 -0
.40
-0.2
0 0.
00
0.20
0.
40
Com
pone
nt 3
, Sc
ores
F)
433.
50
440.
20
446.
90
453.
60
460.
30
Mea
sure
d T
max
7
I
z z!
-0.0
2
2 ’ -0
.06
0.09
- 0.
05
5 -j 0.
01
..a
Zor
rela
tion
0.88
11-,
-0
.03
9 z Q
-0.0
7 u
-0.1
1
* r-
L
736
Wav
enum
ber
l/cm
1693
1007
74
0)
Fig.
12
(D~-
G).
Fig.
12
. PL
S m
odel
on
py
roly
sis
tem
pera
ture
fo
r Se
ries
6,
fou
r co
mpo
nent
m
odel
. (A
) Sc
ore
plot
on
th
e co
mpo
nent
I :
2 pl
ane.
(B
) L
oadi
ngs
on
com
pone
nt
I. (
C)
Loa
ding
s on
com
pone
nt
2. (
D)
Scor
e pl
ot
on
the
com
pone
nt
3:4
plan
e.
(E)
Loa
ding
s on
co
mpo
nent
3.
(F
) C
ross
plot
of
m
odel
led
and
actu
al
pyro
lysi
s te
mpe
ratu
res.
(G
) L
oadi
ngs
on
com
pone
nt
4.
Maturity trends in asphaltenes 155
6L9
b98
6Kll
bEZ1
6ltl
PO91
06L1
SL61
0912
SLPZ
189Z
9982
TSOE
9EZE
IZH
909E
16LC
9L6E f
6L9
V98
6bOi
PfZi
6Ibl
DO91
06LT
5161
1SOE
9fZf
TZVE
909E
16Lf
9L6f
156 Tanja Barth et al.
(d) SbU!pPO? ‘1 -Jnanodmo~
009
aLa
2601
to21
6821
E8fT
091
ES5
IZ9
011
lOLZ
9682
6P6Z
OSOE
90ZE
IlEE
Sl$E
(d) SbR~peO~ ’ z anauodao~
L
I
I )
109
318
!601
COZT
6821
EEET
D9bI
ES51
IZ9T
OIL1
1OLZ
9682
6)6Z
osot
9OZf
IICE
Slit
saxox ‘Z auanodmog
Maturity trends in asphaltenes
Prediction of naturally matured samples from model of series 3-5
470
x Naturally matured . ' " ' " - " "" . " . -
460 -- o S e r i e s 5 . , " " . - : : : ' ' ' " " • x ." ~ " . ' '
,x Series 3 x x _ . ~ _ ~ ~ x . 2~- " . " "O' "x /
450 -- [] Series 4 ~ .xx x ' . ~ ~ . , . u , . , , . ~ . ~ ^
E ~ xx~'" x x,. xX . °*x x xx x .~ 4 4 0 -
o ~ . . , ~ . ~ .... ~ x x
a., 430 . : : : : " .-':"D x ..:'."
420 7 ,.j;;;;.':. -.°
" ' " 1 t I I I I I I I I I 410 410 415 420 425 430 435 440 445 450 455 460 465 470
Measured Tma x
Fig. 15. Prediction of Tma, for naturally matured coal extracts with the PLS model for Series 3-5•
157
satisfactory for prediction of the normally used maturity parameters.
D I S C U S S I O N
The models presented above show that maturation changes observed by i.r. spectroscopy of asphaltenes can be separated into a limited set of general trends that dominate at different ranges of maturity. Before the onset of major petroleum generation defunctional- isation reactions predominate. Carbonyl functionali- ties consistently decrease, as do hydroxyls and ethers in most cases. The proportion of aliphatic chains increases, and to some degree aromaticity increases also.
During the main oil generation stage, aliphatic chains are removed from the carbon skeleton, together with a more limited loss of carbonyl functionalities. The increase in aromaticity continues, but is not quantitatively important.
In the highest maturity range covered in these data the petroleum generation potential is exhausted. Cracking of the petroleum asphaltenes takes place and aromatisation reactions dominate.
Although a selection or combination of these major processes can be used for interpreting the major components extracted from all the series of artificially matured samples, it has not been possible to establish general models that are statistically significant, and which include all source rock types. This can be caused by differences in the rate and importance of each of the major chemical processes relative to the chosen maturity scale. The relationships between the processes will be determined by the organic matter input and composition of the kerogens, and possibly also by inhibition or acceleration caused by interactions with the inorganic mineral phases. The total reaction will thus be comparable only for source rocks of similar compositions. The major reaction types seem to proceed at different rates relative to both pyrolysis temperature and Tm~x, and the pattern of
intensities in different ranges of the spectra also seems to be too individual for each source rock to allow generally applicable models to be established.
Combining several types of source rocks for modelling of general trends leads to an increase in the dimensions of variation rather than allowing a limited number of generally relevant reaction patterns to be extracted. However, samples from source rock types with comparable reaction patterns can be combined to give approximate prediction models. Since the analytical procedure is rapid and simple, such prediction models may be useful for screening purposes. The D R I F T spectra of the asphaltenes also have a potential as a basis for source rock classification (Ganz and Kalkreuth, 1991) so the single spectral analysis may be used for several purposes•
Using DRIFT spectra for absolute quantification can be problematical. The approach used here is based on the existence of an approximately linear relationship between the "concentration" of a functional group in the asphaltene molecules and the intensity of the resulting spectral bands within the range of compositions included. The well defined models that explain 80-95% of the total variance for the artificially matured series shows that the assumption of linearity is valid within each sample set. For the natural and the combined data sets, where a broader range of chemical compositions are included, deviations from quantitative relationship in the IR intensities may contribute to the increased variability.
Uncertainties in the maturity measures that are used to define the maturity axis may also contribute to the lack of generality. The ideal maturity indicator should be linear, easily determined with high precision, and reflect the chemistry of the kerogen or asphaltene in a way that places the DRIFT spectrum relative to a well defined general reaction axis which describes the whole kerogen evolution and petroleum generation/ alteration process. None of the maturity measures
OG 232 E
158 Tanja Barth et al.
used (T,~,x, %Ro, pyrolysis temperature) calibrate the observed variations in the spectra to maturity in such a way that source rock type becomes unimportant , which means that either the general reaction axis does not exist, or the maturity measures used do not precisely reflect a placement on the axis. Obviously, the "perfect single maturity indicator" has not yet been established, possibly because there is no single maturat ion process.
Comparing the asphaltenes from the larger set of naturally matured coals with the pyrolysis series shows a good qualitative correspondence and comparable reaction trends. However, the number of directions of variability increase and the data set is much less uniform than the pyrolysis series of single source rocks. Both the wide variation in source type, even for a sample set restricted to coals, and the possibly different temperature dependencies of the processes at natural and HP temperature regimes, can contribute to this. Precise models for general prediction of maturity of natural samples based on pyrolysis series thus cannot be established. Average descriptors of the processes, i.e. target coefficients (Christy et al., 1993) are too much influenced by the lack of co-variation in the different components, and do not provide useful visualisations of the trends in these model types.
The usefulness of the H P - F T I R approach lies in its descriptive strengths, where the major changes in composit ion due to reactions of both functional groups and carbon skeletons can be defined and modelled. If a representative immature source rock is available it is also possible to establish quantitative maturity models with good predictive abilities based on HP samples. Such models could be very useful on a local basis as well as leading to an increased understanding of the chemical process involved. However, the high sensitivity of the method, which enables it to follow individual reaction patterns in detail in a quantitative model, seems to make it less suitable for use in the search for a "universal maturat ion model".
Associate Ed i tor - -M. G. Fowler
Acknowledgements--Anne Gulbrandsen (Department of Chemistry, University of Bergen) is thanked for running the Series 1 and 2 DRIFT spectra. Birthe J. Schmidt (Statoil, Norway) is thanked for permitting samples from her pyrolysis experiments to be included in the data set.
REFERENCES
Acevedo S., Mend~z B., Rojas R., Layrisse I. and Rivas H. (1985) Asphaltenes and resins from the Orinoco basin. Fuel 68, 1741-1747.
Andresen B., Barth T. and Irwin H. (1993) Yields and carbon isotopic composition of pyrolysis products from artificial maturation processes. Chem. Geol. 106, 103-114.
Barth T. and Nielsen S. B. (1993) Estimating kinetic parameters for generation of petroleum and single components from hydrous pyrolysis of source rocks. En. Fuels 7, 100-110.
Barth T., Seim M. and Skadsem K. (1992) A comparison of maturity dependent chemical trends in samples from hydrous pyrolysis and naturally matured samples. Am. Chem. Soc. Fall Meeting, Aug. 1992, preprint 7.pp.
Barth T., Borgund A. E. and Hopland A. L. (1989) Generation of organic compounds by hydrous pyrolysis of a Kimmeridge Oil shale--bulk results and activation energy calculations. Org. Geochem. 14, 69-76.
Christy A. A., Kvalheim O. M., Libnau F. O., Aksnes G. and Toft J. (1993) Interpretation of chemical structural changes by target-projection analysis of infrared profiles. Vib. Spectrosc. 6, 1-14.
Christy A. A., Dahl B. and Kvalheim O. M. (1989a) Structural features of resins, asphaltenes and kerogen studied by diffuse reflectance infrared spectroscopy. Fuel 68, 430-434.
Christy A. A., Hopland A. A., Barth T. and Kvalheim O. M. (1989b) Quantitative determination of thermal maturity in sedimentary organic matter by diffuse reflectance infrared spectroscopy of asphaltenes. Org. Geochem. 14, 77 81.
Christy A. A., Velapoldi R. A., Karstang T. V., Kvalheim O. M., Sletten E. and Teln~es N, (1987) Multivariate calibration of DRIFT spectra of coals as an alternative to rank determination by vitrinite reflectance. Chemolab. 2, 199-207.
Ganz H. and Kalkreuth W. (1991) IR-classification of kerogen type, thermal maturation, hydrocarbon potential and lithological characteristics. J. S.E. Asian Earth Sci. 5, 19-29.
Ganz H. and Kalkreuth W. (1987) Application of infrared spectroscopy to the classification of of kerogen types and the evaluation of source rock and oil shale potential. Fuel 66, 708-711.
Karstang T. V. and Eastgate R.J. (1987) Multivariate calibration of an X-ray diffractometer by partial least squares regression. Chemolab. 2, 209-219.
Kemp W. (1991) Organic Spectroscopy, 3rd edn, pp. 66-68. MacMillan, London
Kvalheim O. M. and Karstang T. V. (1987) A general purpose program for multivariate analysis. Chemolab. 2, 235-239.
Monthioux M., Landais P. and Monin J. C. (1985) Comparison between natural and artificial maturation series of humic coals from the Makaham delta, Indonesia. Org. Geochem. 8, 275-292.
Pelet R., Behar F. and Monin J. C. (1986) Resins and asphaltenes in the generation and migraton of petroleum. Org. Geochem. 10, 481-498.
Schmidt B. J. and Barth T. (1993) Discussion of "kerogen typing" based on data from artificial maturation (hydrous pyrolysis), kinetics calculation and optical analyses. Proc. 16th Int. Meeting on Organic Geochemistry, Stavanger, September 1993 (edited by K. Oygard), pp. 810-813.
Winters J. C., Williams J. A. and Lewan M. D. (1983) A laboratory study of petroleum generation by hydrous pyrolysis. In Advances in Organic Geochemistry 1981 (edited by M. Bjoroy et al.), pp. 524-533. Wiley, Chichester.
Wold S., Albano W., Dunn W., Edlund U., Esbensen K., Geladi P., Heleberg S., Johansson E., Lindberg W. and Sjostrom M. (1984) Multivariate data analysis in chemistry. In Chemometrics: Mathematics and Statistics in Chemistry (edited by B.R. Kowalski), pp. 17 95. Riedel.
Yen T. F., Wu W. H. and Chilingar G. V. (1984) A study of the structure of petroleum asphaltenes and related substances by I R spectroscopy. Energy Sources 7,203-235.
Related Documents


![Pyrolysed carbon microelectrode for Environmental and Life ... · presented. The pyrolysed carbon is characterized by Raman, 4-point measurement, CV and EIS[1]. Electrode design was](https://static.cupdf.com/doc/110x72/5f821cf9cba7301f6e5b542e/pyrolysed-carbon-microelectrode-for-environmental-and-life-presented-the-pyrolysed.jpg)