1 MATS AND LASPEC: HIGH-PRECISION EXPERIMENTS USING ION TRAPS AND LASERS AT FAIR D. Rodríguez 1 , K. Blaum 2* , W. Nörtershäuser 3# , M. Ahammed 4 , A. Algora 5 , G. Audi 6 , J. Äystö 7 , D. Beck 8 , M. Bender 9 , J. Billowes 10 , M. Block 8 , G. Bollen 11 , M. Bordeur 12 , T. Brunner 12 , B. A. Bushaw 13 , R. B. Cakirli 2 , P. Campbell 10 , D. Cano-Ott 14 , G. Cortés 15 , J. R. Crespo López –Urrutia 2 , P. Das 4 , A. Dax 16 , A. De 17 , P. Delheij 12 , T. Dickel 18 , J. Dilling 12 , K. Eberhardt 3 , S. Eliseev 2 , S. Ettenauer 12 , K. Flanagan 19 , R. Ferrer 11 , J.-E. García-Ramos 20 , E. Gartzke 21 , H. Geissel 8 , S. George 11 , C. Geppert 3 , M. B. Gómez-Hornillos 15 , Y. Gusev 22 , D. Habs 21 , P.-H. Heenen 23 , S. Heinz 8 , F. Herfurth 8 , A. Herlert 24 , M. Hobein 25 , G. Huber 26 , M. Huyse 27 , C. Jesch 18 , A. Jokinen 7 , O. Kester 11 , J. Ketelaer 2 , V. Kolhinen 7 , I. Koudriavtsev 27 , M. Kowalska 2 , J. Krämer 3 , S. Kreim 2 , A. Krieger 3 , T. Kühl 8 , A. M. Lallena 1 , A. Lapierre 12 , F. Le Blanc 19 , Y. A. Litvinov 2 , D. Lunney 6 , T. Martínez 14 , G. Marx 24 , M. Matos 28 , E. Minaya- Ramirez 6 , I. Moore 7 , S. Nagy 2 , S. Naimi 6 , D. Neidherr 2 , D. Nesterenko 22 , G. Neyens 27 , Y. N. Novikov 22 , M. Petrick 18 , W. R. Plaß 18 , A. Popov 22 , W. Quint 8 , A. Ray 4 , P.-G. Reinhard 29 , J. Repp 2 , C. Roux 2 , B. Rubio 5 , R. Sánchez 3 , B. Schabinger 2 , C. Scheidenberger 8 , D. Schneider 30 , R. Schuch 25 , S. Schwarz 10 , L. Schweikhard 24 , M. Seliverstov 22 , A. Solders 25 , M. Suhonen 25 , J. Szerypo 21 , J. L. Taín 5 , P. G. Thirolf 21 , J. Ullrich 2 , P. Van Duppen 27 , A. Vasiliev 22 , G. Vorobjev 22 , C. Weber 21 , K. Wendt 26 , M. Winkler 8 , D. Yordanov 16 , F. Ziegler 24 , 1 Departamento de Física Atómica Molecular y Nuclear, University of Granada, 18071 Granada, Spain 2 Max-Planck-Institute for Nuclear Physics, 69029 Heidelberg, Germany 3 Institute of Nuclear Chemistry, Johannes Gutenberg University, 55099 Mainz, Germany 4 Variable Energy Cyclotron Centre, 1/AF, Kolkata, Bidhanagar, India 5 IFIC-CSIC University of Valencia, 46071 Valencia, Spain 6 CSNSM-IN2P3, CNRS, 91405 Orsay/Paris, France, 7 Department of Physics, P.O. Box 35, 40014 University of Jyväskylä, Jyväskylä, Finland 8 GSI, 64291 Darmstadt, Germany 9 CENBG/IN2P3, Bordeaux-Gradignan, France 10 Department of Physics and Astronomy, University of Manchester, Manchester M13 9PL, Great- Britain 11 Michigan State University, NSCL, US-MI 48824-1321 East Lansing, USA 12 TRIUMF, CA-BC V6T 2A3 Vancouver, Canada 13 Pacific Northwest National Lab, PNNL, Richland WA 99352, USA 14 CIEMAT, E-28040, Madrid, Spain 15 UPC, 08034, Barcelona, Spain 16 CERN, CH-1211 Geneva 23, Switzerland 17 Raniganj Girls' College, Raniganj, West Bengal, India 18 II. Institute of Physics, Justus-Liebig University, 35390 Gießen, Germany 19 IN2P3-CNRS, 91405 Orsay/Paris, France 20 Departamento de Física Aplicada, University of Huelva, 21071 Huelva, Spain 21 Department of Physics, Ludwig-Maximilians University München, 85748 Garching, Germany 22 St. Petersburg Nuclear Physics Institute, 188359 Gatchina and St. Petersburg State University, 198904 St. Petersburg, Russia 23 PNTPM, CP229, Universite Libre de Bruxelles, 1050 Bruxelles, Belgium 24 Institute of Physics, Ernst-Moritz-Arndt University, 17487 Greifswald, Germany 25 SCFAB, Stockholm University, 10691 Stockholm, Sweden 26 Institute of Physics, Johannes Gutenberg-University, 55099 Mainz, Germany 27 Afd. Kern- en stralingsfysica, Katholieke Universiteit Leuven, 3001 Leuven, Belgium 28 Louisiana State University, US-LA 70803 Baton Rouge, USA 29 Institute of Theoretical Physics II, Friedrich-Alexander University, 91054 Erlangen, Germany 30 Lawrence Livermore National Laboratory, US-CA 94550-9234 Livermore, USA * Spokesperson MATS collaboration # Spokesperson LaSpec collaboration

Welcome message from author
This document is posted to help you gain knowledge. Please leave a comment to let me know what you think about it! Share it to your friends and learn new things together.
Transcript
1
MATS AND LASPEC: HIGH-PRECISION EXPERIMENTS USING ION TRAPS AND LASERS AT FAIR
D. Rodríguez1, K. Blaum2*, W. Nörtershäuser3#, M. Ahammed4, A. Algora5, G. Audi6, J.
Äystö7, D. Beck8, M. Bender9, J. Billowes10, M. Block8, G. Bollen11, M. Bordeur12, T. Brunner12, B. A. Bushaw13, R. B. Cakirli2, P. Campbell10, D. Cano-Ott14, G. Cortés15, J. R.
Crespo López –Urrutia2, P. Das4, A. Dax16, A. De17, P. Delheij12, T. Dickel18, J. Dilling12, K. Eberhardt3, S. Eliseev2, S. Ettenauer12, K. Flanagan19, R. Ferrer11, J.-E. García-Ramos20, E. Gartzke21, H. Geissel8, S. George11, C. Geppert3, M. B. Gómez-Hornillos15, Y. Gusev22, D. Habs21, P.-H. Heenen23, S. Heinz8, F. Herfurth8, A. Herlert24, M. Hobein25, G. Huber26, M.
Huyse27, C. Jesch18, A. Jokinen7, O. Kester11, J. Ketelaer2, V. Kolhinen7, I. Koudriavtsev27, M. Kowalska2, J. Krämer3, S. Kreim2, A. Krieger3, T. Kühl8, A. M. Lallena1, A. Lapierre12, F. Le
Blanc19, Y. A. Litvinov2, D. Lunney6, T. Martínez14, G. Marx24, M. Matos28, E. Minaya-Ramirez6, I. Moore7, S. Nagy2, S. Naimi6, D. Neidherr2, D. Nesterenko22, G. Neyens27, Y. N. Novikov22, M. Petrick18, W. R. Plaß18, A. Popov22, W. Quint8, A. Ray4, P.-G. Reinhard29, J.
Repp2, C. Roux2, B. Rubio5, R. Sánchez3, B. Schabinger2, C. Scheidenberger8, D. Schneider30, R. Schuch25, S. Schwarz10, L. Schweikhard24, M. Seliverstov22, A. Solders25, M. Suhonen25, J.
Szerypo21, J. L. Taín5, P. G. Thirolf21, J. Ullrich2, P. Van Duppen27, A. Vasiliev22, G. Vorobjev22, C. Weber21, K. Wendt26, M. Winkler8, D. Yordanov16, F. Ziegler24,
1Departamento de Física Atómica Molecular y Nuclear, University of Granada, 18071 Granada, Spain
2Max-Planck-Institute for Nuclear Physics, 69029 Heidelberg, Germany 3Institute of Nuclear Chemistry, Johannes Gutenberg University, 55099 Mainz, Germany
4Variable Energy Cyclotron Centre, 1/AF, Kolkata, Bidhanagar, India 5IFIC-CSIC University of Valencia, 46071 Valencia, Spain
6CSNSM-IN2P3, CNRS, 91405 Orsay/Paris, France, 7Department of Physics, P.O. Box 35, 40014 University of Jyväskylä, Jyväskylä, Finland
8GSI, 64291 Darmstadt, Germany 9CENBG/IN2P3, Bordeaux-Gradignan, France
10Department of Physics and Astronomy, University of Manchester, Manchester M13 9PL, Great-Britain
11Michigan State University, NSCL, US-MI 48824-1321 East Lansing, USA 12TRIUMF, CA-BC V6T 2A3 Vancouver, Canada
13Pacific Northwest National Lab, PNNL, Richland WA 99352, USA 14 CIEMAT, E-28040, Madrid, Spain
15 UPC, 08034, Barcelona, Spain 16CERN, CH-1211 Geneva 23, Switzerland
17Raniganj Girls' College, Raniganj, West Bengal, India 18II. Institute of Physics, Justus-Liebig University, 35390 Gießen, Germany
19IN2P3-CNRS, 91405 Orsay/Paris, France 20Departamento de Física Aplicada, University of Huelva, 21071 Huelva, Spain
21Department of Physics, Ludwig-Maximilians University München, 85748 Garching, Germany 22St. Petersburg Nuclear Physics Institute, 188359 Gatchina and St. Petersburg State University,
198904 St. Petersburg, Russia 23PNTPM, CP229, Universite Libre de Bruxelles, 1050 Bruxelles, Belgium
24Institute of Physics, Ernst-Moritz-Arndt University, 17487 Greifswald, Germany 25SCFAB, Stockholm University, 10691 Stockholm, Sweden
26 Institute of Physics, Johannes Gutenberg-University, 55099 Mainz, Germany 27Afd. Kern- en stralingsfysica, Katholieke Universiteit Leuven, 3001 Leuven, Belgium
28Louisiana State University, US-LA 70803 Baton Rouge, USA 29Institute of Theoretical Physics II, Friedrich-Alexander University, 91054 Erlangen, Germany
30Lawrence Livermore National Laboratory, US-CA 94550-9234 Livermore, USA *Spokesperson MATS collaboration #Spokesperson LaSpec collaboration

2
TABLE OF CONTENTS I. INSTITUTIONS AND COLLABORATIONS.................................................................. 8 II. ABSTRACT ...................................................................................................................... 13 III GLOSSARY, ACRONYMS, AND ABBREVIATIONS............................................... 15 1. PHYSICS CASE AND OVERVIEW .............................................................................. 19 1.1 PRECISE MEASUREMENTS POSSIBLE WITH MATS .............................................. 19 1.2 PERFORMANCE AND APPLICABILITY OF MATS................................................... 33 1.3 PRECISE MEASUREMENTS WITH LASPEC.............................................................. 36 1.4 PERFORMANCE AND APPLICABILITY OF LASPEC............................................... 49 2. THE COMMON BEAMLINE ................................................................................................. 51 2.1. REQUIREMENTS TO THE BEAM FROM THE GAS CELL ..........................................54 2.2 SPECIFICATIONS OF THE SEPARATOR MAGNET.......................................................54 2.3 ION DETECTION IN THE COMMON BEAM LINE .........................................................54 2.3.1 TAPE STATION ...............................................................................................................54 2.3.2 MCP AND FARADAY CUP DETECTORS ....................................................................55 2.4. ION BEAM COOLER AND BUNCHER........................................................ ……..…..57 2.4.1 VACUUM SYSTEM ................................................................................ ……..…..58 2.4.2. PERFORMANCE...................................................................................... ……..…59 2.4.3. FLEXIBILITY .......................................................................................... ……..…60 2.4.4. OPTICAL SYSTEM (INJECTION AND EXTRACTION) .......................... ……..…62 2.4.5 DIMENSIONS ........................................................................................... ……..…62
2.4.6 OPTICAL MANIPULATION WITHIN THE ION BEAM COOLER AND BUNCHER.......................................................................................................................... ……..…63
2.5. MULTIPLE-REFLECTION TOF-MS............................................................................. 64 2.5.1 OBJECTIVES OF THE MR-TOF-MS AT THE LOW-ENERGY-BRANCH................ 64 2.5.2 LAYOUT OF THE MR-TOF-MS.............................................................................. 66 2.5.3 VACUUM SYSTEM ................................................................................................ 68 2.5.4 ION-OPTICAL ELEMENTS .................................................................................... 69 2.5.5 DETECTORS AND DATA ACQUISITION.................................................................... 73 2.5.6 ELECTRONICS ....................................................................................................... 73 3. COMPONENTS OF THE MATS EXPERIMENT........................................................ 75 3.1 LOW ENERGY BEAM TRANSPORT AND DIAGNOSTICS ............................................... 77 3.2 CHARGE STATE BREEDER.......................................................................... ……..…..78 3.2.1 AN ADVANCED ELECTRON BEAM ION TRAP FOR MATS (MATS-EBIT) ..... …79 3.2.2 PARTS AND EQUIPMENT ..................................................................................... 82 3.2.3 DIAGNOSTICS ....................................................................................................... 82 3.3 Q/A SEPARATION .......................................................................................................... 83 3.4. PREPARATION PENNING TRAP................................................................................. 88 3.4.1 VACUUM REQUIREMENTS .................................................................................. 90 3.4.2 COOLING MECHANISM ........................................................................................ 92 3.4.3 TRAP CONFIGURATION ....................................................................................... 95 3.4.4 DETECTION SYSTEM............................................................................................ 96 3.4.5 GENERAL INFRASTRUCTURE ............................................................................. 98 3.5. MEASUREMENT PENNING TRAP.............................................................................. 98
3
3.5.1 DETECTION AND FREQUENCY MEASUREMENT............................................... 99 3.5.2 MAGNET FIELD AND MAGNET SPECIFICATIONS ........................................... 100 3.5.3 MECHANICAL TRAP DESIGN............................................................................. 101 3.5.4 CRYOSTAT AND VACUUM REQUIREMENTS ................................................... 103 3.5.5 ADVANCED FEATURES...................................................................................... 103 3.5.6 GENERAL INFRASTRUCTURE ........................................................................... 104 3.6 INSTRUMENTATION................................................................................................... 106 3.6.1 INSTRUMENTATION FOR MASS SPECTROMETRY ..........................................…106 3.6.2 IN-TRAP DECAY AND TRAP ASSISTED SPECTROSCOPY...............................…112 3.6.3 PENNING TRAP TOTAL ABSORPTION SPECTROSCOPY .........…………………121 3.6.4 NEUTRON SPECTROSCOPY AT MATS ........................................…………………124 3.7 SPECIFICATIONS OF THE MATS EXPERIMENT.................................................... 129 4. COMPONENTS OF THE LASPEC SETUP................................................................ 131 4.1 COLLINEAR LASER SPECTROSCOPY OF IONS..................................................... 133 4.1.1 THE TWIN STEERERS AND QUADRUPOLE TRIPLET ....................................... 133 4.1.2 THE BEAM DIAGNOSTIC REGIONS ................................................................... 134 4.1.3 THE LIGHT COLLECTION REGION .................................................................... 134 4.1.4 LASER LIGHT ENTRANCE SECTIONS ............................................................... 136 4.2 OPTICAL PUMPING AND FAST ATOMIC BEAM LASER LINE............................ 136
4.2.1 ATOMIC BEAMLINE DEFLECTION CHAMBER & ION OPTICS ........................ 136 4.2.2 CHARGE EXCHANGE CELL................................................................................ 136
4.3 BETA-ASYMMETRY-DETECTED NUCLEAR MAGNETIC RESONANCE........... 139 4.4 DIAGNOSTICS FOR THE LASPEC EXPERIMENT................................................... 142 4.5 SPECIFICATIONS OF THE LASPEC EXPERIMENT ................................................ 142 5. TIMING, ION IDENTIFICATION AND CONTROLS.............................................. 145 REFERENCES AND ACKNOWLEDGEMENTS .......................................................... 148

4
LIST OF FIGURES Figure 1: End of the Low Energy Beam line of the Super FRS at the future FAIR facility. . 19 Figure 2: Experimental ft-values ............................................................................................. 22 Figure 3: Two-neutron separation energies in the vicinity of Z = 82...................................... 23 Figure 4: Empirical δVpn values for the 208Pb region .............................................................. 25 Figure 5: Section of the nuclear chart with the upper region of the rp-and νp- process pathways......................................................................................................................... 28 Figure 6: Contribution of the r-process to the isotopic abundances of the chemical elements in the Solar System............................................................................................................. 29 Figure 7: Mass comparison between model predictions and experimental data of iodine isotopes........................................................................................................................... 30 Figure 8: Nuclear chart with the relative mass uncertainties of all known nuclides............... 34 Figure 9: Storage rings and Penning trap facilities for high-accuracy mass measurements ... 35 Figure 10: Chart of nuclei showing the isotopes for which optical spectroscopy has been performed ....................................................................................................................... 41 Figure 11: Overview of laser spectroscopy and laser ion source facilities worldwide ........... 50 Figure 12: Overview of the MATS and LaSpec experimental halls ....................................... 53 Figure 13: Schematic overview of a tape station for beam diagnosis ..................................... 55
Figure 14: Location of detectors for buncher section.............................................................. 56 Figure 15: Technical drawing of an ion source used for off-line measurements .................... 57 Figure 16: Cut view of ISOLDE RFQ structure...................................................................... 58 Figure 17: Schematic drawing of the pumping barrier for the RFQ system ........................... 59 Figure 18: Dependence of the bunch width on the number of ions in the bunch.................... 61 Figure 19: Electrodes of the RFQ structure............................................................................. 62 Figure 20: Schematic view of the complete vacuum system including the RFQ structure..... 63 Figure 21: Optical pumping scheme for niobium and the signal obtained by collinear laser spectroscopy ................................................................................................................... 64 Figure 22: Schematic figure of the MR-TOF-MS system....................................................... 67 Figure 23: Illustration of the four operation modes of the MR-TOF-MS............................... 67 Figure 24: Technical drawing of the MR-TOF-MS system.................................................... 68 Figure 25: Mass spectrum of an isobaric doublet.................................................................... 71 Figure 26: Photo of the prototype of the Bradbury-Nielsen-Gate........................................... 72 Figure 27: Schematic figure illustrating the technique of the dynamic energy buncher......... 72 Figure 28: Overview of the MATS beamline.......................................................................... 75 Figure 29: Layout of the MATS Penning traps ....................................................................... 76 Figure 30: CF-160 cross housing an electrostatic quadrupople deflector and a surface ion source.............................................................................................................................. 77 Figure 31: Mounting of an MCP detector in a CF-160 vacuum cross together with optical lenses .............................................................................................................................. 78 Figure 32: Overall scheme of the MATS-EBIT...................................................................... 79 Figure 33: Section through the different elements of FLASH EBIT ...................................... 80 Figure 34: Section of the central tube of the Heidelberg EBIT............................................... 80 Figure 35: The new high current electron beam design .......................................................... 81 Figure 36: Evolution of the charge state of Fe ions after into an EBIT .................................. 81 Figure 37: Section of the MATS beamline ............................................................................. 84 Figure 38: Simulations of ion trajectories through a quadrupole bender ................................ 85 Figure 39: Picture of the quadrupole bender used to inject SCI into an EBIT........................ 85 Figure 40: Assembly of the quadrupole bender in a square box ............................................. 86 Figure 41: Q-bender operated in symmetric configuration ..................................................... 86 Figure 42: Mass resolution (M/∆M) versus bending radius for a dipole magnet. .................. 87
5
Figure 43: Top view of the TRIGA-TRAP system. ............................................................... 89 Figure 44: Schematic view of the preparation and detection trap for MATS. ....................... 90 Figure 45: Two stage cryocooler and assembly with a Penning trap system. ........................ 91 Figure 46: Trapping configurations for electron and proton/ion cooling. .............................. 93 Figure 47: Energy evolution of a HCI in a Mg+ Coulomb crystal. ........................................ 94 Figure 48: SIMION simulation of extraction of the ions from the trap. ................................ 94 Figure 49: Technical drawing for electrodes configuration. .................................................. 96 Figure 50: Picture of the amplifiers used for broad-band FT-ICR. ........................................ 97 Figure 51: Reduced cyclotron-frequency resonances for He+. ............................................... 97 Figure 52: Technical drawing and cutaway zoomed view of the precision trap. ................... 99 Figure 53: Picture of a segmented Faraday cup plus electron gun for alignment. ............... 100 Figure 54: Technical drawing of the different parts of the hyperbolical measurement trap. 102 Figure 55: Magnetic field plot in the trap region. ................................................................ 102 Figure 56: Proposed high-accuracy measurement Penning trap for mass spectrometry. ..... 103 Figure 57: Simulation of ion injection in the Measurement trap with Lorentz steerer. ....... 105 Figure 58: Time-of-Flight (TOF) resonance for Cs+ ions ................................................... 107 Figure 59: ISOLTRAP design of a dector chamber with a CEM and an MCP .................... 108 Figure 60: Position sensitive detector with delay-lines anode manufactured by RoentDek . 109 Figure 61: Relative detection efficiency for MCP and CEM................................................ 109 Figure 62: Narrow-band FT-ICR detection circuit................................................................ 110 Figure 63: Photograph of the NbTi helical resonator and coil transformer .......................... 111 Figure 64: Superconducting helical-coil transformer for narrow-band FT-ICR detection. . 111 Figure 65: Resonance spectrum of an unloaded narrow-band FT-ICR circuit ..................... 112 Figure 66: Schematics illustration of the proposed setup for a detector trap ........................ 114 Figure 67: Pictures from SIMION of the detector trap and associate elements.................... 115 Figure 68: Results from SIMION simulations of the electron transport in a magnetic field 115 Figure 69: Comparision of impact position in an MCP of conversion and shake-off electrons after travelling along a magnetic field gradient............................................................ 116 Figure 70: Picture of silicon strip detector with ceramic PCB currently available in the market provided by the company CANBERRA ..................................................................... 117 Figure 71: Simulations of α particles in a magnetic field surrounding the detector trap...... 117 Figure 72: Longitudinal and transversal view of the trajectories of α particles from decays in the cubic trap ................................................................................................................ 118 Figure 73: Schematics of the experimental setup envisaged for studies on α decays from high spin isomeric states....................................................................................................... 120 Figure 74: The BaF2 Total Absorption Spectrometer (TAS) ............................................... 123 Figure 75: The DESPEC TAS............................................................................................... 123 Figure 76: Skecth showing the front and side view of a 4π neutron detector ....................... 125 Figure 77: Picture of the 4π neutron detector........................................................................ 126 Figure 78: General view of the n-TOF spectrometer proposed for DESPEC ....................... 127 Figure 79: CIEMAT n-TOF spectrometer setup for use at IGISOL ..................................... 128 Figure 80: Achievable mass uncertainty with MATS........................................................... 131 Figure 81: Schematic drawing showing the LaSpec beamlines ............................................ 132 Figure 82: Technical drawing of the LaSpec ion-line configuration .................................... 133 Figure 83: Results from Nb burst spectroscopy .................................................................... 135 Figure 84: Technical drawing of the optical pumping and the fast atomic beamline ........... 136 Figure 85: Technical drawing showing components of the LaSpec atomic beamline.......... 137 Figure 86: Ion optics module for the atomic beamline ......................................................... 138 Figure 87: Charge exchange cell on the LaSpec beamline ................................................... 139 Figure 88: Typical β-NMR magnet and specifications ......................................................... 140 Figure 89: Ion beam monitor................................................................................................. 142

6
Figure 90: Long-term stabilization to the a1-line in the hyperfine structure of the P(132)(9-3)- transition in molecular iodine....................................................................................... 143 Figure 91: High voltage at the ISOLDE frontend ................................................................. 144 Figure 92: Schematics of the MATS and LaSpec online systems ....................................... 145
7
LIST OF TABLES Table 1: Fields of application and the generally required relative uncertainty on the measured mass δm/m to probe the associated physics.................................................................... 20 Table 2: Resolution and accuracy which is typically required for the extraction of charge radii in the different parts of the nuclear chart ....................................................................... 40 Table 3: Comparison of collinear spectroscopy with resonance ionization mass spectrometry ................................................................................................................................................. 45 Table 4: Mass range and corresponding RF frequency and amplitude used at ISCOOL ....... 60 Table 5: Performance and important parameters for ISCOOL ............................................... 61 Table 6: Charge breeding performance ................................................................................... 81 Table 7: Comparison between different cooling mechanisms proposed for HCI ................... 95 Table 8: Sensitivity of the FT-ICR detection system in a Penning trap.................................. 97 Table 9: Peak charge-state after 20 ms breeding time........................................................... 130
8
I. INSTITUTIONS AND COLLABORATIONS
The MATS Collaboration
BELGIUM
Paul-Henri Heenen B-1050 Bruxelles, Belgium, PNTPM, CP229, Universite Libre de Bruxelles
CANADA
Jens Dilling, Paul Delheij, Alain Lapierre, Maxime Bordeur, Stephan Ettenauer, Thomas Brunner CA-BC V6T 2A3 Vancouver, Canada, TRIUMF
FRANCE
Georges Audi, David Lunney, Sarah Naimi, Enrique Minaya-Ramirez F-91405 Orsay/Paris, France, CSNSM-IN2P3, CNRS
Michael Bender CENBG/IN2P3, Bordeaux-Gradignan, France
FINLAND
Juha Äystö, Ari Jokinen, Iain Moore, Veli Kolhinen F-Jyväskylä, Finland, Department of Physics, P.O. Box 35, FIN-40014 University of Jyväskylä
GERMANY
Klaus Blaum, R. Burco Cakirli, Sergey Eliseev, Sebastian George, Alban Kellerbauer, Yuri A. Litvinov, Szilard Nagy, Julia Repp, Christian Roux, Joachim Ullrich, José R. Crespo López -Urrutia D-69029 Heidelberg, Germany, Max-Planck-Institute for Nuclear Physics
Alexander Herlert, Gerrit Marx, Lutz Schweikhard, Falk Ziegler D-17487 Greifswald, Germany, Institute of Physics, Ernst-Moritz-Arndt University
Dietrich Beck, Michael Block, Hans Geissel, Sophie Heinz, Frank Herfurth, Wolfgang Quint, Christoph Scheidenberger, Martin Winkler D-64291 Darmstadt, Germany, GSI
Klaus Eberhardt, Christopher Geppert, Jens Ketelaer, Susanne Kreim, Dennis Neidherr, Wilfried Nörtershäuser, Birgit Schabinger D-55099 Mainz, Germany, Institute of Physics, Johannes Gutenberg University
Timo Dickel, Christian Jesch, Martin Petrick, Wolfgang R. Plaß D-35390 Gießen, Germany, II. Institute of Physics, Justus-Liebig University
Eva Gartzke, Jerzy Szerypo, Peter G. Thirolf, Christine Weber D-85748 Garching, Germany, Department of Physics, Ludwig-Maximilians University
München
Paul-Gerhard Reinhard D-91054 Erlangen, Germany, Institute of Theoretical Physics II, Friedrich-Alexander
University
9
INDIA
Manir Ahammed, Parnika Das, Anirban De, Amlan Ray Kolkata, Bidhanagar, India, Variable Energy Cyclotron Centre, 1/AF
Alokkumar De Raniganj Girls' College, Raniganj, West Bengal, India
RUSSIA Yuri Gusev, Dmitri Nesterenko, Yuri N. Novikov, A. Popov, Maxim Seliverstov, Alexander Vasiliev, Gleb Vorobjev
St. Petersburg Nuclear Physics Institute, 188359 Gatchina
St. Petersburg State University, 198904 St. Petersburg
SPAIN
Antonio M. Lallena, Daniel Rodríguez E-18071 Granada, Spain, Departamento de Física Atómica Molecular y Nuclear, University
of Granada
José Enrique García Ramos E-21071 Huelva, Spain, Departamento de Física Aplicada, University of Huelva
Berta Rubio, José Luis Taín, Alejandro Algora E-46071 Valencia, Spain, IFIC-CSIC University of Valencia
Daniel Cano Ott, Trinitario Martínez E-28040, Madrid, Spain, CIEMAT
M. Belén Gómez-Hornillos, Guillén Cortés E-08034, Barcelona, Spain, UPC
SWEDEN
Reinhold Schuch, Markus Suhonen, Andreas Solders, Matthias Hobein S-10691 Stockholm, Sweden, SCFAB, Stockholm University
USA
Dieter Schneider US-CA 94550-9234 Livermore, USA, Lawrence Livermore National Laboratory
Georg Bollen, Oliver Kester, Rafael Ferrer, Stefan Schwarz US-MI 48824-1321 East Lansing, USA, Michigan State University, NSCL
Milan Matos US-LA 70803 Baton Rouge, Louisiana State University
In total: 10 Countries; 24 Institutes; 87 Members

10
Spokesperson: Klaus Blaum [email protected] +49-6221-516-850 Co-Spokesperson: Ari Jokinen [email protected] +358-14-260-2386 José R. Crespo [email protected] +49-6221-516-521 Contact at GSI: Frank Herfurth [email protected] +49-6159-711360
TDR-coordinator: Daniel Rodríguez [email protected] +34-958-240029
11
The LASPEC Collaboration
BELGIUM
Mark Huyse, Iouri Koudriavtsev, Gerda Neyens, Piet Van Duppen B-3001 Leuven, Belgium, Afd. Kern- en stralingsfysica, Katholieke Universiteit Leuven
FRANCE
Francois Le Blanc, David Lunney, Kieran Flanagan F-91405 Orsay/Paris, France, IN2P3,CNRS
FINLAND
Juha Äystö, Ari Jokinen, Iain Moore FIN-40014 Jyväskylä, Finland, Department of Physics, P.O. Box 35, University of Jyväskylä
GERMANY
Christopher Geppert, Thomas Kühl, Christoph Scheidenberger D-64291 Darmstadt, Germany, GSI
Gerhard Huber, Maxim Seliverstov, Klaus Wendt D-55099 Mainz, Germany, Institute of Physics, Johannes Gutenberg University
Wilfried Nörtershäuser, Jörg Krämer, Andreas Krieger, Rodolfo Sanchez D-55099 Mainz, Germany, Institute of Nuclear Chemistry, Johannes Gutenberg University
Dietrich Habs, Jerzy Szerypo, Peter G. Thirolf D-85748 Garching, Germany, Institute of Physics, Ludwig-Maximilians University Munich
Klaus Blaum, Joachim Ullrich, José R. Crespo López-Urrutia, Deyan Yordanov, Magdalena Kowalska D-69117 Heidelberg, Germany, MPI Kernphysik
GREAT BRITAIN Paul Campbell, Jonathan Billowes Manchester M13 9PL, Great-Britain, Department of Physics and Astronomy, University of
Manchester
SPAIN Daniel Rodríguez E-18071 Granada, Departamento de Física Atómica Molecular y Nuclear, University of
Granada
SWITZERLAND Andreas Dax CH-1211 Genf 23, CERN
12
USA Dieter Schneider US-CA 94550-9234 Livermore, USA, Lawrence Livermore National Laboratory
Bruce A. Bushaw Richland WA 99352, USA, Pacific Northwest National Lab, PNNL
In total: 8 Countries; 13 Institutes; 34 Members
Spokesperson: Wilfried Nörtershäuser [email protected] +49-6131-39-25881 Deputy: Iain Moore [email protected] +358-14-260-2430
Contact @ GSI: Christopher Geppert [email protected] +49-6159-71-2140 TDR-coordinator: Daniel Rodríguez [email protected] +34-958-240029
13
II. ABSTRACT
Nuclear ground state properties including mass, charge radii, spins and moments can be
determined by applying atomic physics techniques such as Penning-trap based mass spectrometry and laser spectroscopy. The MATS and LaSpec setups at the low-energy beamline at FAIR will allow us to extend the knowledge of these properties further into the region far from stability.
The mass and its inherent connection with the nuclear binding energy is a fundamental
property of a nuclide, a unique “fingerprint”. Thus, precise mass values are important for a variety of applications, ranging from nuclear-structure studies like the investigation of shell closures and the onset of deformation, tests of nuclear mass models and mass formulas, to tests of the weak interaction and of the Standard Model. The required relative accuracy ranges from 10-5 to below 10-8 for radionuclides, which most often have half-lives well below 1 s. Substantial progress in Penning trap mass spectrometry has made this method a prime choice for precision measurements on rare isotopes. The technique has the potential to provide high accuracy and sensitivity even for very short-lived nuclides. Furthermore, ion traps can be used for precision decay studies and offer advantages over existing methods.
With MATS (Precision Measurements of very short-lived nuclei using an Advanced
Trapping System for highly-charged ions) at FAIR we aim to apply several techniques to very short-lived radionuclides: High-accuracy mass measurements, in-trap conversion electron and alpha spectroscopy, and trap-assisted spectroscopy. The experimental setup of MATS is a unique combination of an electron beam ion trap for charge breeding, ion traps for beam preparation, and a high precision Penning trap system for mass measurements and decay studies.
For the mass measurements, MATS offers both a high accuracy and a high sensitivity. A
relative mass uncertainty of 10-9 can be reached by employing highly-charged ions and a non-destructive Fourier-Transform Ion-Cyclotron-Resonance (FT-ICR) detection technique on single stored ions. This accuracy limit is important for fundamental interaction tests, but also allows for the study of the fine structure of the nuclear mass surface with unprecedented accuracy, whenever required. The use of the FT-ICR technique provides true single ion sensitivity. This is essential to access isotopes that are produced with minimum rates which are very often are the most interesting ones. Instead of pushing for highest accuracy, the high charge state of the ions can also be used to reduce the storage time of the ions, hence making measurements on even shorter-lived isotopes possible.
Decay studies in ion traps will become possible with MATS. Novel spectroscopic tools for
in-trap high-resolution conversion-electron and charged-particle spectroscopy from carrier-free sources will be developed, aiming e.g. at the measurements of quadrupole moments and E0 strengths. With the possibility of both high-accuracy mass measurements of the shortest-lived isotopes and decay studies, the high sensitivity and accuracy potential of MATS is ideally suited for the study of very exotic nuclides that will only be produced at the FAIR facility.
Laser spectroscopy of radioactive isotopes and isomers is an efficient and model-
independent approach for the determination of nuclear ground and isomeric state properties. Hyperfine structures and isotope shifts in electronic transitions exhibit readily accessible information on the nuclear spin, magnetic dipole and electric quadrupole moments as well as root-mean-square charge radii. The dependencies of the hyperfine splitting and isotope shift

14
on the nuclear moments and mean square nuclear charge radii are well known and the theoretical framework for the extraction of nuclear parameters is well established. These extracted parameters provide fundamental information on the structure of nuclei at the limits of stability. Vital information on both bulk and valence nuclear properties are derived and an exceptional sensitivity to changes in nuclear deformation is achieved. Laser spectroscopy provides the only mechanism for such studies in exotic systems and uniquely facilitates these studies in a model-independent manner.
The accuracy of laser-spectroscopic-determined nuclear properties is very high.
Requirements concerning production rates are moderate; collinear spectroscopy has been performed with production rates as few as 100 ions per second and laser-desorption resonance ionization mass spectroscopy (combined with β-delayed neutron detection) has been achieved with rates of only a few atoms per second.
This Technical Design Report describes a number of complementary experimental devices
for laser spectroscopy, which will provide a complete system with respect to the physics and isotopes that can be studied. Since MATS and LaSpec require high-quality low-energy beams, the two collaborations have a common beamline to stop the radioactive beam of in-flight produced isotopes and prepare them in a suitable way for transfer to the MATS and LaSpec setups, respectively.
15
III GLOSSARY, ACRONYMS, AND ABBREVIATIONS∗∗∗∗
ADC Analog-to-Digital Converter AIDA Advanced Implantation Detector Array ALTO Accélérateur Linéaire auprés du Tandem d´Orsay (France) AME Atomic Mass Evaluation ANL Argonne National Laboratory in Chicago (USA) ASACUSA Atomic Spectroscopy And Collisions Using Slow Antiprotons, one of the
three low-energy antiproton collaboration at CERN ATHENA AnTiHydrogEN Apparatus, one of the three low-energy antiproton
collaboration at CERN BESSY-II Helmholtz-Zentrum Berlin für Materialien und Energie - Speicherring
BESSY II, Berlin (Germany) CARIBU CAlifornium Rare Isotope Breeder Upgrade, a project at ANL (USA) CCD Charged Coupled Device CEM Channel Electron Multiplier CERN Centre Européenne pour la Recherche Nucléaire, European Organization for
Nuclear Research in Geneva (Switzerland). CF ConFlat CIEMAT Centro de Investigaciones Energéticas Medioambientales y Tecnológicas,
Centre for Environmental, Energy and Technological Research (Spain) CKM Cabibbo–Kobayashi–Maskawa (quark mixing) matrix CPT Canadian Penning Trap, a trap system at ANL (USA) CW Continuous Wave DAC Digital-toAnalog Converter DACQ Data ACQuisition DESPEC DEcay SPECtroscopy, another experiment at FAIR’s low energy branch DN Diametre Nominal. Standard type for flanges/fittings/valves etc… DSSD Double Sided Silicon Detector EBIT Electron Beam Ion Trap EC Electron Capture EU European Union EHT Extra High Tension ESR Experimental Storage Ring ETFSI-Q Extended Thomas Fermi plus Strutinsky Integral with Bogolyubov-enhanced
shell-Quenching FADC Flash Analog-to-Digital Converter FAIR Facility for Antiprotons and Ion Research, to be built in Darmstadt
(Germany) FC Faraday Cup FEL Free Electron Laser FET Field Effect Transistor FFT Fast Fourier Transform FLASH Free electron Laser in Hamburg (Germany) FM Frequency Modulation FRIB Facility for Rare Isotopes Beams FRM-II Forschungsneutronenquelle Heinz Maier-Leibnitz in Garching FT-ICR Fourier-Transform Ion-Cyclotron-Resonance
∗ The acronysms related to the control system are given in Sec.
16
FWHM Full width at Half Maximum GANIL Grand Accélérateur National d’Ions Lourds, Large Accelerator for Heavy
Ions in Caen (France) GEANT4 Toolkit for the simulation of the passage of particles through matter GSI Helmholtzzentrum für Schwerionenforschung GmbH, Darmstadt (Germany) GT Gamow Teller GUI General User Interface HCI Highly Charged Ions HISPEC High resolution In-flight SPECtroscopy, another experiment at FAIR’s low
energy branch HITRAP Facility at GSI for Highly Charged Ions HV High Voltage IFIC Instituto de Física Corpuscular, research institute from the Spanish Research
Council in Valencia (Spain) IGISOL Isotope Separator Facility at JYFL in Jyväskylä Finland ILIMA Study of Isomeric beams LIfetimes and Masses, another experiment in the
NUSTAR collaboration at FAIR devoted to mass measurements in a storage ring
ISCOOL An RFQ cooler and buncher at ISOLDE ISOL Isotope Separator On-Line ISOLDE ISOL facility at CERN, Geneva Switzerland ISOLTRAP Penning trap mass spectrometer at ISOLDE JYFL University of Jyväskylä (Finland) JYFLTRAP Penning trap mass spectrometer at JYFL KATRIN KArlsruhe TRItium Neutrino experiment, experiment under construction in
Karlsruhe (Germany) to determine the mass of the electron antineutrino LaSpec Laser Spectroscopy of short-lived nuclei at FAIR’s low energy branch LDRIS Laser Desorption Resonance Ionization Source LEB Low Energy Branch of the Super Fragment Separator at FAIR LEBIT Low Energy Beam Ion Trap, trap system at Michigan State University (USA) LHe Liquid Helium LIF Laser-Induced Fluorescence, detection techique LIST Laser Ion Source Trap LLNL Lawrence Livermore National Laboratory in USA LMU Ludwig Maximilian Universität, Munich (Germany) LN2 Liquid Nitrogen LRC Light Collector Region KVI Kernfysisch Versneller Instituut, Nuclear Physics Accelerator Institute in
Groningen (Holand) MAFF Munich Accelerator for Fission Fragments (Germany) MARABOU System for data acquisition and evaluation developed in Munich MATS Precision Measurements on very short-lived nuclei using an Advanced
Trapping System at FAIR’s low energy branch MBS Multi Branch System MCP Micro Channel Plate MINIBALL γ-ray detector set-up at ISOLDE MLL-TRAP Penning trap system at the Maier Leibniz Laboratory in Munich (Germany) MOSFET Metal Oxide Semiconductor Field Effect Transistor MPIK Max-Planck Institut für Kernphysik, Max-Planck Institute for Nuclear
Physics in Heidelberg (Germany) MPS Multi Passage Spectrometer

17
MPT Measurement Penning Trap MR-TOF-MS Multi-Reflection Time-Of-Flight Mass-Spectrometer MSU Michigan State University (USA) Nd:YAG Neodymium-Doped Yttrium Aluminium Garnet, solid state laser NEA Nuclear Enery Agency, specialised agency within the Organisation for
Economic Co-operation and Development (OECD) NEG Non-Evaporable Getter NERO Neutron detector at MSU (USA) NIM Nuclear Instrumentation Module NMR Nuclear Magnetic Resonance NSCL National Superconducting Cyclotron Laboratory at MSU (USA) NUSTAR NUSTAR: Nuclear STructure, Astrophysics and Reactions. Collaboration at
FAIR/GSI OFE Oxygen Free Electrode PCB Printed Circuit Board PMT Photo Multiplier Tube PNPI St. Petersburg Nuclear Physics Institute (Rusia) PPT Preparation Penning Trap PTB Physikalisch Technischen Bundesanstalt, National Metrology Institute in
Germany PTFE PolyTetraFluoroEthylene PVC From PVC conduit (PolyVinyl Chloride) QED Quantum ElectroDinamics RADRIS RAdiation Detected Resonance Ionization Spectroscopy RF Radio Frequency RFQ Radio Frequency Quadrupole RIB Radioactive Ion Beam RIKEN Research Laboratory in Japan RILIS Resonance Ionization Laser Ion Source ROOT Data Analysis Framework SCI Singly Charged Ion Super-FRS Superconducting FRagment Separator SHG Second Harmonic Generation SHIP Separator for Heavy Ion reaction Products SHIPTRAP Penning trap System behind SHIP SIMION Computer code to simulate ion trajectories SIS Heavy Ion Syncrhotron at GSI SPIG SextuPole Ion Guide SPIRAL2 Système de Production d’Ions Radioactifs Accélérés en Ligne 2, laboratory
to be constructed in GANIL SU Stockholm University (Sweden) SuMa Superconducting Magnet TAS Total Absorption Spectrometer TDC Time-to-Digital Converter TDR Technical Design Report TITAN Triumf´s Ion Trap for Atomic and Nuclear Science, trap system at TRIUMF
(Canada) TOF Time-Of-Flight TOF-ICR Time-Of-Flight Ion Cyclotron Resonance TONNERE TONneau pour NEutRons REtardes, detector system for neutrons at the LPC
Caen (France)
18
TRIUMF Canada's National Laboratory for Particle and Nuclear Physics TRIGA Training, Research, Isotopes, General Atomics nuclear reactor TRIGA-LASER Laser system for precision spectroscopy at the TRIGA reactor in Mainz
(Germany) TRIGA-TRAP Ion trap system for precision mass measurements at the TRIGA reactor in
Mainz (Germany) TTL Transistor-Transistor Logic UG University of Giessen (Germany) UGR University of Granada (Spain) UGW University of Greisfwald (Germany) UHV Ultra High Vacuum UJ University of Jyväskylä (Finland) UNILAC UNIversal Linear Accelerator at GSI (Germany) UPC Technical University in Barcelona (Spain) UPS University of Paris Sud (France) UV Ultra Violet VDE Verband Deutscher Elektrotechniker (Association of German Electrical
Engineers) VECC Variable Energy Cyclotron Centre in Kolkata (India), VME Virtual Machine Environment XHV Extremely High Vacuum
19
1. PHYSICS CASE AND OVERVIEW
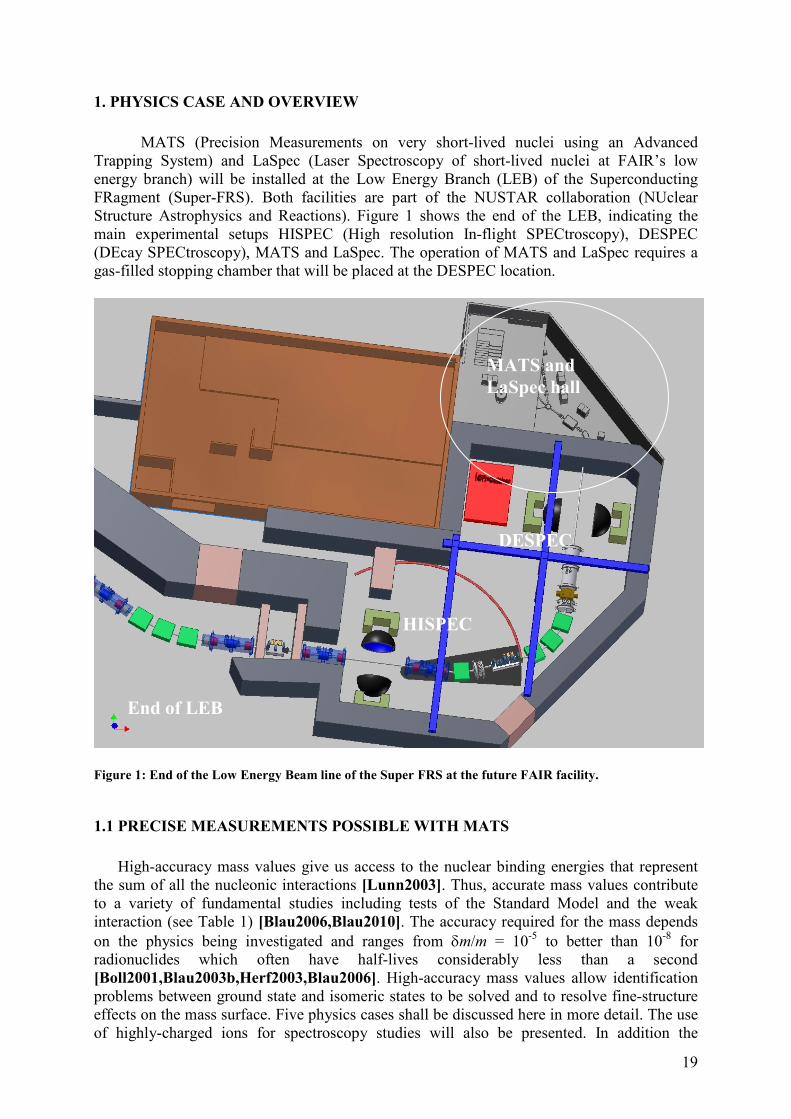
MATS (Precision Measurements on very short-lived nuclei using an Advanced Trapping System) and LaSpec (Laser Spectroscopy of short-lived nuclei at FAIR’s low energy branch) will be installed at the Low Energy Branch (LEB) of the Superconducting FRagment (Super-FRS). Both facilities are part of the NUSTAR collaboration (NUclear Structure Astrophysics and Reactions). Figure 1 shows the end of the LEB, indicating the main experimental setups HISPEC (High resolution In-flight SPECtroscopy), DESPEC (DEcay SPECtroscopy), MATS and LaSpec. The operation of MATS and LaSpec requires a gas-filled stopping chamber that will be placed at the DESPEC location.
Figure 1: End of the Low Energy Beam line of the Super FRS at the future FAIR facility.
1.1 PRECISE MEASUREMENTS POSSIBLE WITH MATS
High-accuracy mass values give us access to the nuclear binding energies that represent
the sum of all the nucleonic interactions [Lunn2003]. Thus, accurate mass values contribute to a variety of fundamental studies including tests of the Standard Model and the weak interaction (see Table 1) [Blau2006,Blau2010]. The accuracy required for the mass depends on the physics being investigated and ranges from δm/m = 10-5 to better than 10-8 for radionuclides which often have half-lives considerably less than a second [Boll2001,Blau2003b,Herf2003,Blau2006]. High-accuracy mass values allow identification problems between ground state and isomeric states to be solved and to resolve fine-structure effects on the mass surface. Five physics cases shall be discussed here in more detail. The use of highly-charged ions for spectroscopy studies will also be presented. In addition the
HISPEC
DESPEC
End of LEB
MATS and LaSpec hall
20
application and advantage of in-trap conversion electron and alpha spectroscopy as well as trap-assisted spectroscopy will be discussed.
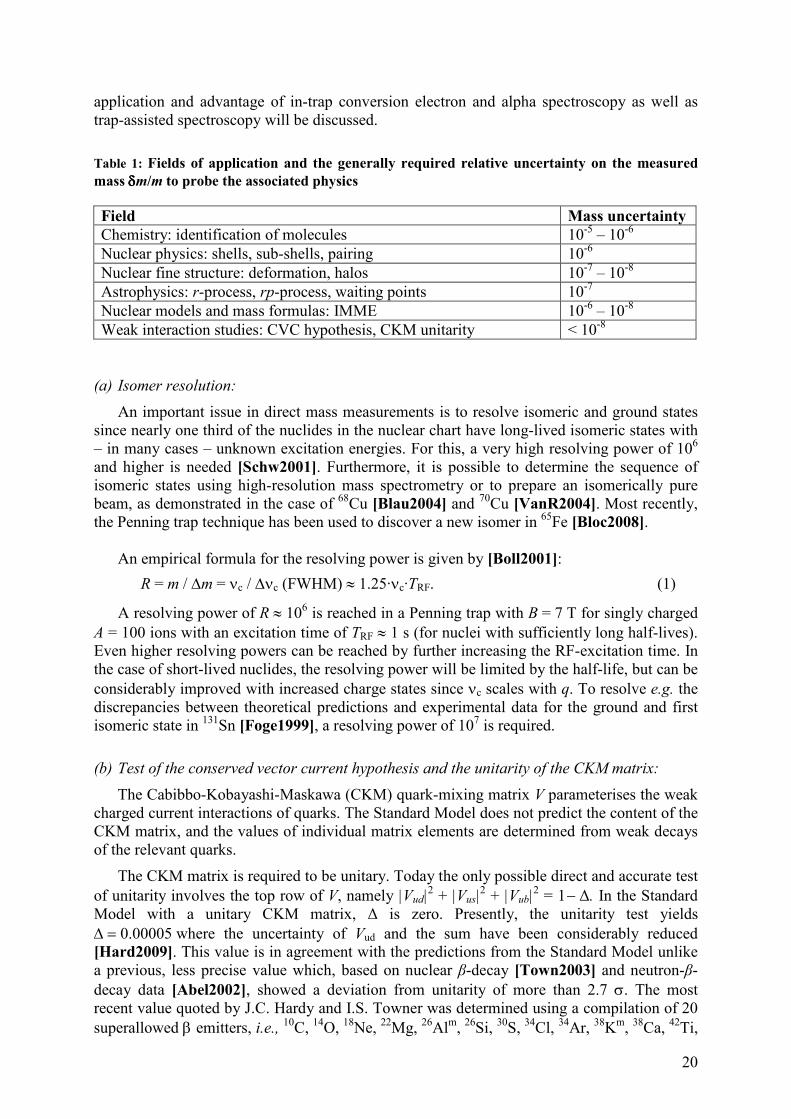
Table 1: Fields of application and the generally required relative uncertainty on the measured mass δδδδm/m to probe the associated physics Field Mass uncertainty Chemistry: identification of molecules 10-5 – 10-6 Nuclear physics: shells, sub-shells, pairing 10-6 Nuclear fine structure: deformation, halos 10-7 – 10-8 Astrophysics: r-process, rp-process, waiting points 10-7 Nuclear models and mass formulas: IMME 10-6 – 10-8 Weak interaction studies: CVC hypothesis, CKM unitarity < 10-8
(a) Isomer resolution:
An important issue in direct mass measurements is to resolve isomeric and ground states since nearly one third of the nuclides in the nuclear chart have long-lived isomeric states with – in many cases – unknown excitation energies. For this, a very high resolving power of 106 and higher is needed [Schw2001]. Furthermore, it is possible to determine the sequence of isomeric states using high-resolution mass spectrometry or to prepare an isomerically pure beam, as demonstrated in the case of 68Cu [Blau2004] and 70Cu [VanR2004]. Most recently, the Penning trap technique has been used to discover a new isomer in 65Fe [Bloc2008].
An empirical formula for the resolving power is given by [Boll2001]:
R = m / ∆m = νc / ∆νc (FWHM) ≈ 1.25·νc·TRF. (1)
A resolving power of R ≈ 106 is reached in a Penning trap with B = 7 T for singly charged A = 100 ions with an excitation time of TRF ≈ 1 s (for nuclei with sufficiently long half-lives). Even higher resolving powers can be reached by further increasing the RF-excitation time. In the case of short-lived nuclides, the resolving power will be limited by the half-life, but can be considerably improved with increased charge states since νc scales with q. To resolve e.g. the discrepancies between theoretical predictions and experimental data for the ground and first isomeric state in 131Sn [Foge1999], a resolving power of 107 is required.
(b) Test of the conserved vector current hypothesis and the unitarity of the CKM matrix:
The Cabibbo-Kobayashi-Maskawa (CKM) quark-mixing matrix V parameterises the weak charged current interactions of quarks. The Standard Model does not predict the content of the CKM matrix, and the values of individual matrix elements are determined from weak decays of the relevant quarks.
The CKM matrix is required to be unitary. Today the only possible direct and accurate test of unitarity involves the top row of V, namely |Vud|
2 + |Vus|2 + |Vub|
2 = 1− ∆. In the Standard Model with a unitary CKM matrix, ∆ is zero. Presently, the unitarity test yields ∆ = 0.00005 where the uncertainty of Vud and the sum have been considerably reduced [Hard2009]. This value is in agreement with the predictions from the Standard Model unlike a previous, less precise value which, based on nuclear β-decay [Town2003] and neutron-β-decay data [Abel2002], showed a deviation from unitarity of more than 2.7 σ. The most recent value quoted by J.C. Hardy and I.S. Towner was determined using a compilation of 20 superallowed β emitters, i.e., 10C, 14O, 18Ne, 22Mg, 26Alm, 26Si, 30S, 34Cl, 34Ar, 38Km, 38Ca, 42Ti,
21
42Sc, 46V, 50Mn, 54Co, 62Ga, 66As, 70Br, and 74Rb. Due to its large size, a determination of Vud
is most important. In addition to the measurements in nuclear β decay, there has been considerable activity in the determination of Vus, the other matrix element which plays a role in the unitarity of the CKM matrix. Precise measurements of the kaon branching ratio and improved theoretical corrections have yielded a new value with improved precision [Scia2008]. The third element Vub is very small and contributes a negligible 0.001 % to the unitarity. In nuclear β decay, in addition to the experiments, radiative corrections [Marc2006] and isospin symmetry-breaking corrections [Town2008] have been subject to major re-evaluations in the past four years.
The study of unitarity in the first row of the CKM matrix is a challenge to the three generation Standard Model. CKM matrix entries deduced from unitarity might be altered when the CKM matrix is expanded to accommodate more generations [Marc1986, Hagi2002]. A deviation ∆ has been related to concepts beyond the Standard Model, such as couplings to exotic fermions [Lang1988,Maal1990], to the existence of an additional Z boson [Lang1992,Marc1987], to supersymmetry or to the existence of right-handed currents in the weak interaction [Deut1988]. A non-unitarity of the CKM matrix in models with an extended quark sector gives rise to an induced neutron electric dipole moment that can be within reach of the next generation of experiments [Liao2001].
The most precise value for the Vud element is extracted from the vector coupling constant GV derived from the mean Ft value of superallowed nuclear β-decay emitters, in conjunction with the Fermi coupling constant from µ-decay Gµ: Vud
2 = GV2 / Gµ
2 (the most recent review includes 20 superallowed transitions [Hard2009]). Together with particle physics data from K and B meson decay, this can be used to test CKM unitarity. The experimental Ft value is expressed as:
Ft ≡ ft (1 + δR)(1 – δC) = K / (2|Vud|2 Gµ
2 (1 + ∆R)), (2)
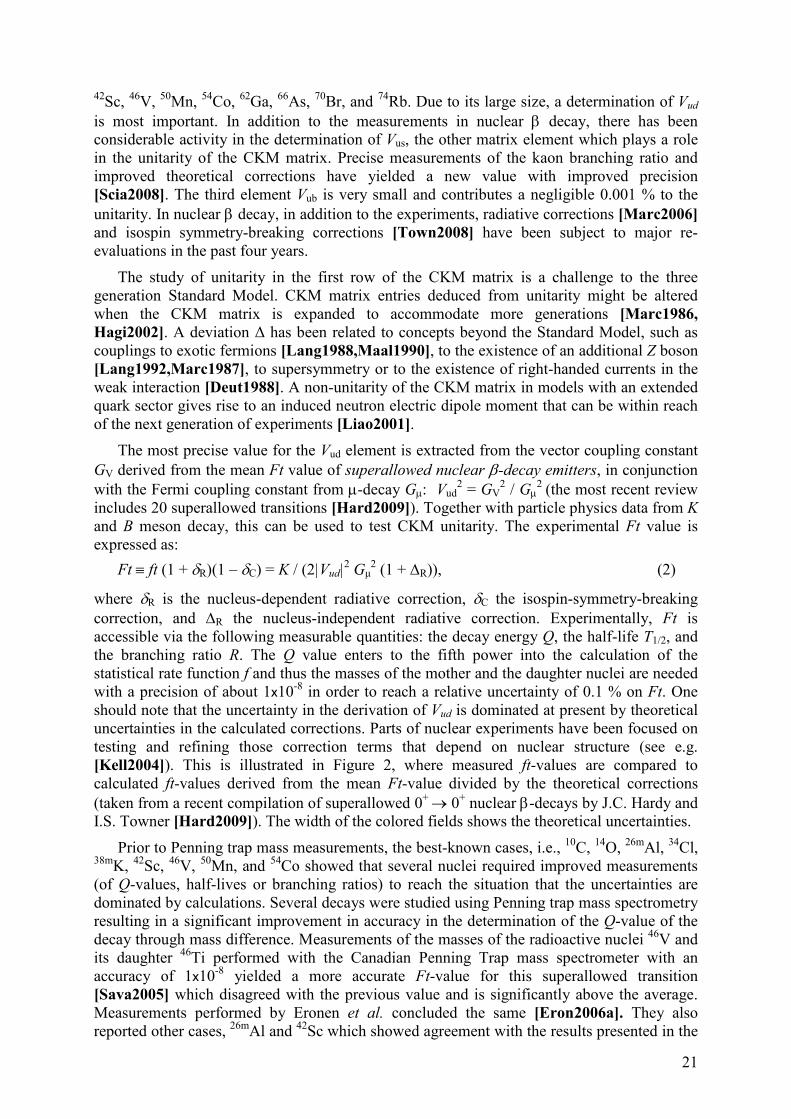
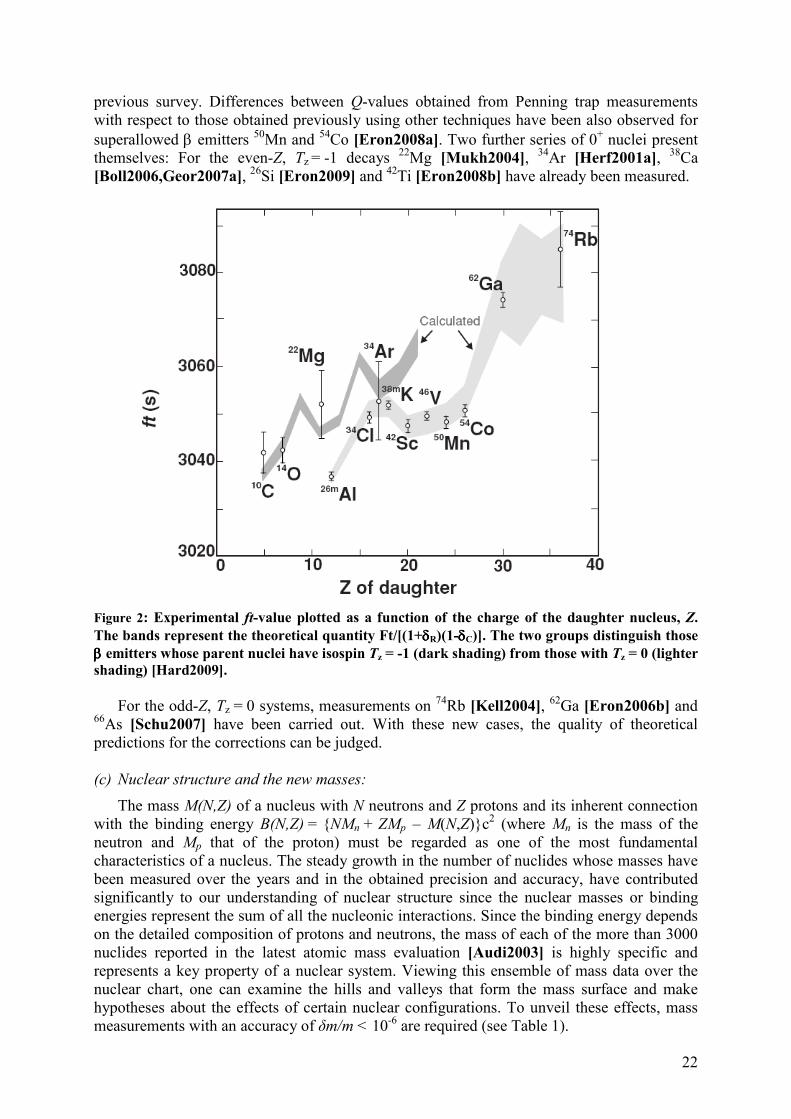
where δR is the nucleus-dependent radiative correction, δC the isospin-symmetry-breaking correction, and ∆R the nucleus-independent radiative correction. Experimentally, Ft is accessible via the following measurable quantities: the decay energy Q, the half-life T1/2, and the branching ratio R. The Q value enters to the fifth power into the calculation of the statistical rate function f and thus the masses of the mother and the daughter nuclei are needed with a precision of about 1x10⁻⁸ in order to reach a relative uncertainty of 0.1 % on Ft. One should note that the uncertainty in the derivation of Vud is dominated at present by theoretical uncertainties in the calculated corrections. Parts of nuclear experiments have been focused on testing and refining those correction terms that depend on nuclear structure (see e.g. [Kell2004]). This is illustrated in Figure 2, where measured ft-values are compared to calculated ft-values derived from the mean Ft-value divided by the theoretical corrections (taken from a recent compilation of superallowed 0+ → 0+ nuclear β-decays by J.C. Hardy and I.S. Towner [Hard2009]). The width of the colored fields shows the theoretical uncertainties.
Prior to Penning trap mass measurements, the best-known cases, i.e., 10C, 14O, 26mAl, 34Cl, 38mK, 42Sc, 46V, 50Mn, and 54Co showed that several nuclei required improved measurements (of Q-values, half-lives or branching ratios) to reach the situation that the uncertainties are dominated by calculations. Several decays were studied using Penning trap mass spectrometry resulting in a significant improvement in accuracy in the determination of the Q-value of the decay through mass difference. Measurements of the masses of the radioactive nuclei 46V and its daughter 46Ti performed with the Canadian Penning Trap mass spectrometer with an accuracy of 1x10⁻⁸ yielded a more accurate Ft-value for this superallowed transition [Sava2005] which disagreed with the previous value and is significantly above the average. Measurements performed by Eronen et al. concluded the same [Eron2006a]. They also reported other cases, 26mAl and 42Sc which showed agreement with the results presented in the
22
previous survey. Differences between Q-values obtained from Penning trap measurements with respect to those obtained previously using other techniques have been also observed for superallowed β emitters 50Mn and 54Co [Eron2008a]. Two further series of 0+ nuclei present themselves: For the even-Z, Tz = -1 decays 22Mg [Mukh2004], 34Ar [Herf2001a], 38Ca [Boll2006,Geor2007a], 26Si [Eron2009] and 42Ti [Eron2008b] have already been measured.
Figure 2: Experimental ft-value plotted as a function of the charge of the daughter nucleus, Z. The bands represent the theoretical quantity Ft/[(1+δδδδR)(1-δδδδC)]. The two groups distinguish those ββββ emitters whose parent nuclei have isospin Tz = -1 (dark shading) from those with Tz = 0 (lighter shading) [Hard2009].
For the odd-Z, Tz = 0 systems, measurements on 74Rb [Kell2004], 62Ga [Eron2006b] and 66As [Schu2007] have been carried out. With these new cases, the quality of theoretical predictions for the corrections can be judged.
(c) Nuclear structure and the new masses:
The mass M(N,Z) of a nucleus with N neutrons and Z protons and its inherent connection with the binding energy B(N,Z) = NMn + ZMp – M(N,Z)c2
(where Mn is the mass of the neutron and Mp that of the proton) must be regarded as one of the most fundamental characteristics of a nucleus. The steady growth in the number of nuclides whose masses have been measured over the years and in the obtained precision and accuracy, have contributed significantly to our understanding of nuclear structure since the nuclear masses or binding energies represent the sum of all the nucleonic interactions. Since the binding energy depends on the detailed composition of protons and neutrons, the mass of each of the more than 3000 nuclides reported in the latest atomic mass evaluation [Audi2003] is highly specific and represents a key property of a nuclear system. Viewing this ensemble of mass data over the nuclear chart, one can examine the hills and valleys that form the mass surface and make hypotheses about the effects of certain nuclear configurations. To unveil these effects, mass measurements with an accuracy of δm/m < 10-6 are required (see Table 1).
23
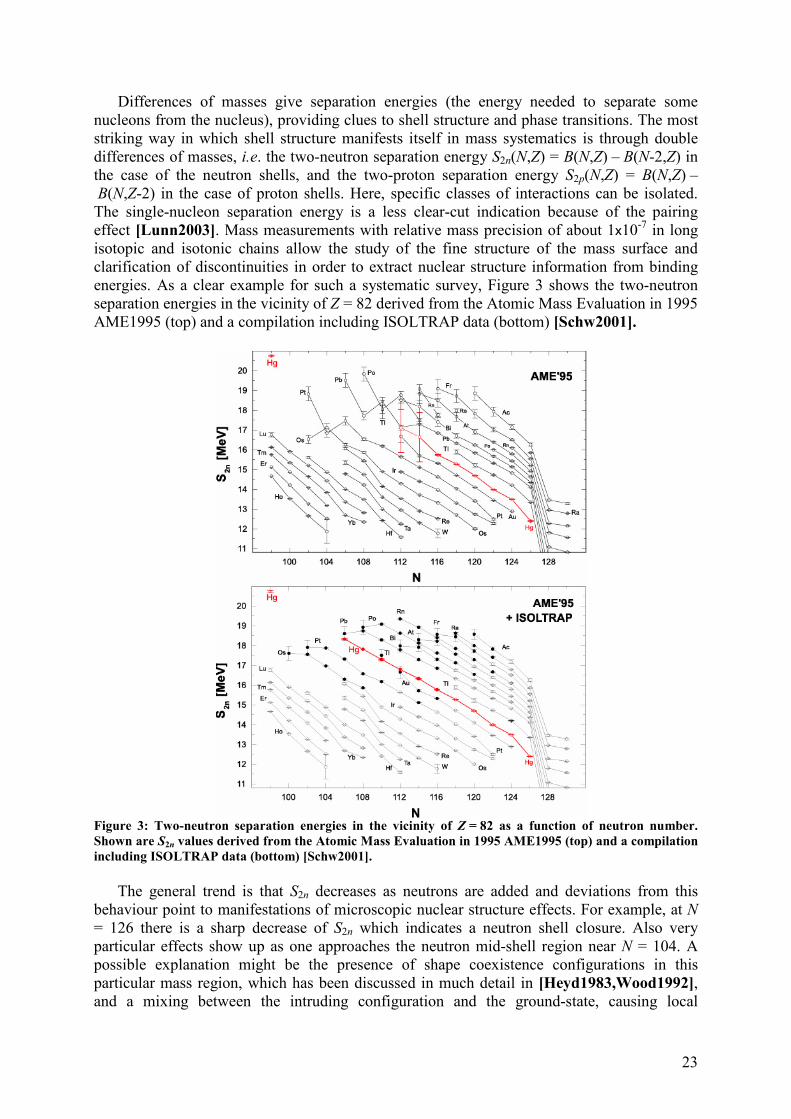
Differences of masses give separation energies (the energy needed to separate some nucleons from the nucleus), providing clues to shell structure and phase transitions. The most striking way in which shell structure manifests itself in mass systematics is through double differences of masses, i.e. the two-neutron separation energy S2n(N,Z) = B(N,Z) – B(N-2,Z) in the case of the neutron shells, and the two-proton separation energy S2p(N,Z) = B(N,Z) – B(N,Z-2) in the case of proton shells. Here, specific classes of interactions can be isolated. The single-nucleon separation energy is a less clear-cut indication because of the pairing effect [Lunn2003]. Mass measurements with relative mass precision of about 1x10⁻⁷ in long isotopic and isotonic chains allow the study of the fine structure of the mass surface and clarification of discontinuities in order to extract nuclear structure information from binding energies. As a clear example for such a systematic survey, Figure 3 shows the two-neutron separation energies in the vicinity of Z = 82 derived from the Atomic Mass Evaluation in 1995 AME1995 (top) and a compilation including ISOLTRAP data (bottom) [Schw2001].
Figure 3: Two-neutron separation energies in the vicinity of Z = 82 as a function of neutron number. Shown are S2n values derived from the Atomic Mass Evaluation in 1995 AME1995 (top) and a compilation including ISOLTRAP data (bottom) [Schw2001].
The general trend is that S2n decreases as neutrons are added and deviations from this behaviour point to manifestations of microscopic nuclear structure effects. For example, at N
= 126 there is a sharp decrease of S2n which indicates a neutron shell closure. Also very particular effects show up as one approaches the neutron mid-shell region near N = 104. A possible explanation might be the presence of shape coexistence configurations in this particular mass region, which has been discussed in much detail in [Heyd1983,Wood1992], and a mixing between the intruding configuration and the ground-state, causing local
24
deviations from a smooth linear trend. This is particularly striking in the Hg and Pt nuclei and illustrates most impressively how masses give a first glimpse of nuclear structure.
Another highly interesting class of interaction is that of the last proton(s) with the last neutron(s) called δVpn [Zhan1989,VanI1995,Caki2005]. For example, δVpn values show striking singularities for nuclei with N = Z, reflecting the T = 0 interaction. For even-even nuclei, δVpn is defined [Zhan1989, Bren1990] by
δVpn(Z,N) = ¼ [B(Z,N) – B(Z,N-2) – B(Z-2,N) – B(Z-2,N-2)]. (3)
A given δVpn(Z,N) value for even-even nuclei refers to the interaction of the (Z-1) and Zth
protons with the (N-1) and Nth neutrons.
In a study by R.B. Cakirli et al. [Caki2005], known masses from the new Atomic-Mass Evaluation AME2003 [Audi2003] were used to extract δVpn values to highlight the variations of the p-n interaction and to interpret the very characteristic behavior. δVpn values can help to explain and describe shell structure and orbit occupations near the Fermi surface, for example in the 208Pb region. Since the magnitude of variations in δVpn are in the order of 150-250 keV in a given region, the uncertainties in the δVpn values must be less than 30-50 keV to draw a clear conclusion. Since four masses enter in the δVpn(Z,N) equation, it becomes immediately obvious that meaningful trends can only be distinguished if the errors on each individual mass value are in the order of 10-20 keV corresponding to δm ≈ 5x10⁻⁸ for masses above A = 200. Presently only Penning trap mass spectrometers can reach this accuracy and only a very small number of mass values with this accuracy exist in the heavy mass region. The analysis by R.B. Cakirli et al. [Caki2005] shows the clear need for new high-accuracy mass measurements far from stability for nuclear structure studies.
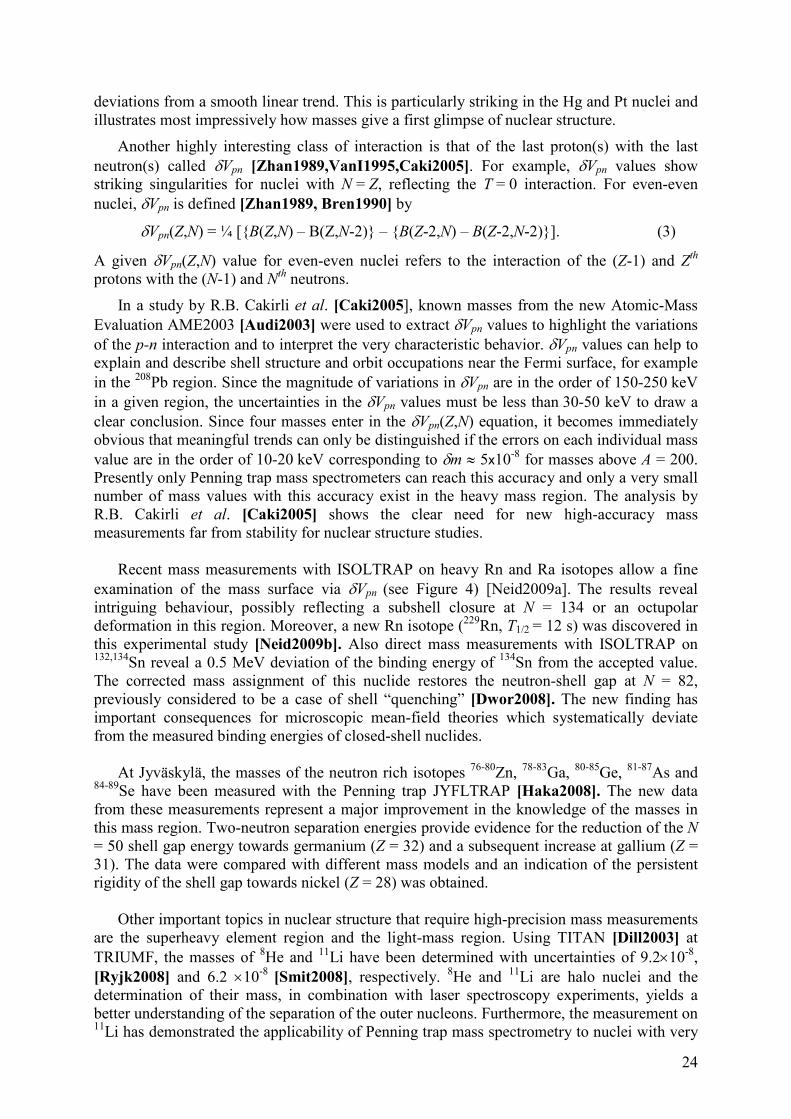
Recent mass measurements with ISOLTRAP on heavy Rn and Ra isotopes allow a fine
examination of the mass surface via δVpn (see Figure 4) [Neid2009a]. The results reveal intriguing behaviour, possibly reflecting a subshell closure at N = 134 or an octupolar deformation in this region. Moreover, a new Rn isotope (229Rn, T1/2 = 12 s) was discovered in this experimental study [Neid2009b]. Also direct mass measurements with ISOLTRAP on 132,134Sn reveal a 0.5 MeV deviation of the binding energy of 134Sn from the accepted value. The corrected mass assignment of this nuclide restores the neutron-shell gap at N = 82, previously considered to be a case of shell “quenching” [Dwor2008]. The new finding has important consequences for microscopic mean-field theories which systematically deviate from the measured binding energies of closed-shell nuclides.
At Jyväskylä, the masses of the neutron rich isotopes 76-80Zn, 78-83Ga, 80-85Ge, 81-87As and
84-89Se have been measured with the Penning trap JYFLTRAP [Haka2008]. The new data from these measurements represent a major improvement in the knowledge of the masses in this mass region. Two-neutron separation energies provide evidence for the reduction of the N = 50 shell gap energy towards germanium (Z = 32) and a subsequent increase at gallium (Z = 31). The data were compared with different mass models and an indication of the persistent rigidity of the shell gap towards nickel (Z = 28) was obtained.
Other important topics in nuclear structure that require high-precision mass measurements
are the superheavy element region and the light-mass region. Using TITAN [Dill2003] at TRIUMF, the masses of 8He and 11Li have been determined with uncertainties of 9.2×10⁻⁸, [Ryjk2008] and 6.2 ×10⁻⁸ [Smit2008], respectively. 8He and 11Li are halo nuclei and the determination of their mass, in combination with laser spectroscopy experiments, yields a better understanding of the separation of the outer nucleons. Furthermore, the measurement on 11Li has demonstrated the applicability of Penning trap mass spectrometry to nuclei with very
25
short half-lives. 11Li has a half life of 8.8 ms and is the shortest-lived nuclei ever investigated in a Penning trap. This nuclide represents the range of half-lives foreseen to be accessible with MATS. At ISOLTRAP, measurements on the two proton halo nucleus 17Ne were also performed [Geit2008].
Figure 4: Picture from Ref. [Neid2009]. Top: Empirical δδδδVpn (even-odd) values for the 208Pb region (from Ref. [Bren2006]), with the addition of the ISOLTRAP Ra δδδδVpn values (solid circles). The δδδδVpn values involving 230Rn, whose mass is confirmed in the present study, are encircled. Bottom: As top but for even-even nuclei.
In the superheavy element region the interest lies in the search of the so-called island of
stability. In the region above uranium the mass is normally determined from the Q-values in alpha decay chains which link the nuclei of interest with a stable nucleus whose mass is very well known. The first direct mass measurements on this region have been recently performed on 252-254No isotopes and opens up a new field for the mass measurement program [Bloc2010]. In the most recent experiment, 255Lr isotopes produced with a rate of 0.06 ions/s, were investigated at SHIPTRAP, GSI.
(d) Nuclear masses far from stability to test new mass models:
The nucleus is a self-organized, many-body quantum system that interacts through the strong, weak and electromagnetic forces. The calculation of nuclear masses with current ab-initio methods is possible for very light p shell nuclei only. Recent progress in many-body methods and the construction of the nuclear Hamiltonian from first principles allows the first steps to be taken towards the calculation of masses of heavier systems, but are ultimately limited by the tremendous complexity of the nucleonic many-body system. Instead, one has to rely on mass predictions by mass models (aiming at the quantitative microscopic description of nuclear observables, most prominently but not exclusively its mass, through suitable effective degrees of freedom and effective interactions) and mass formulas (aiming at the calculation of masses through empirically motivated expressions) [Lunn2003]. The latter are based on a set of free parameters (up to several hundreds), which have to be constrained by local [Jäne1988] or empirical [Tach1988] comparison to experimental data. In particular, data far from the valley of β-stability represent well-suited test cases for the predictive power of models.
In the last few years there has been significant progress in the construction of purely
microscopic mass models on the basis of self-consistent mean-field models. Large-scale fits of Skyrme-type interactions to all available masses became feasible [Gori2003]. When including phenomenological correction terms for correlation effects, these Skyrme mass fits compete with the best available microscopic-macroscopic models [Gori2009a]. More recent
26
theoretical developments now allow the large-scale microscopic calculation of correlation energies, either in the framework of a symmetry-restored Generator Coordinate Method [Bend2004], or a microscopic Bohr-Hamiltonian [Flei2004]. A first mass fit based on the Gogny force including such correlations is very promising [Gori2009b], but does not yet reach the rms deviation of the best available Skyrme mass fits [Gori2009a]. Further development of the models is necessary to include all important correlation effects simultaneously, but the present results are most encouraging as they improve the masses around shell closures [Bend2008]. For a more reliable extrapolation of masses, not only the models, but also the effective interactions used and the protocols for the adjustment of their coupling constants have to be improved [Toiv2008]. To that aim, it is highly desirable to have more data on neutron-rich nuclei beyond the neutron shell closures that separate the stable nuclei from the drip line. Their structure is mainly determined by the single-particle states above the shell closures, which are not completely constrained by the data on more stable nuclei.
(e) Astrophysics
Together with β-decay half-lives, precise atomic mass data are among the most critical nuclear parameters in reaction network calculations for nucleosynthesis. The detailed reaction flow is determined by individual mass differences, the single-proton separation energies, and moreover mass values are used to calculate reaction energies to model capture processes. To this end, mass uncertainties δm on the order of less than 10 keV, i.e. δm/m ≤ 10-7, are required [Scha2006], which are routinely achieved in precision Penning trap mass spectrometry.
Whereas neutron-deficient nuclides close to the N = Z line and in the vicinity of the rapid proton capture (rp)-process are routinely produced and Penning trap mass measurements even beyond the proton drip line have been successfully conducted farther up around A = 145 [Raut2008], neutron-rich nuclides studied are located close to the N = 50 magic shell closure [Haka2008,Baru2008] or around mass numbers A = 112 - 120 for isotopes from technetium to palladium [Hage2007]. However, the presumed paths of the r-process is merely reached in the region around N = 50 and close to N = 82 within the tin isotopes [Dwor2008].
Along the rp-process path Penning trap mass spectrometry has been successfully applied to the so-called waiting point nuclei, 64Ge, 68Se, 72Kr, and 76Sr which are of particular importance, since they cause a delay in the process. The effective lifetime of a waiting point can be as long as its β decay half life. Studies of these nuclei and their vicinity are needed to constrain the limits on the effective lifetimes which depend exponentially on the Q value for proton capture. The masses around 64Ge and 68Se have been both determined with CPT [Clar2007,Clar2004] and LEBIT [Schu2007], respectively, reducing the uncertainties in the effective lifetimes. Measurements on 72-74Kr were obtained with ISOLTRAP [Rodr2004,Rodr2006]. The latter study indicates that the β-decay lifetime is modified by less than 20%. In addition, several nuclides such as neutron-deficient strontium isotopes up to the waiting point 76Sr [Sikl2005], or neutron-deficient isotopes of selenium and bromine were studied at ISOLTRAP.
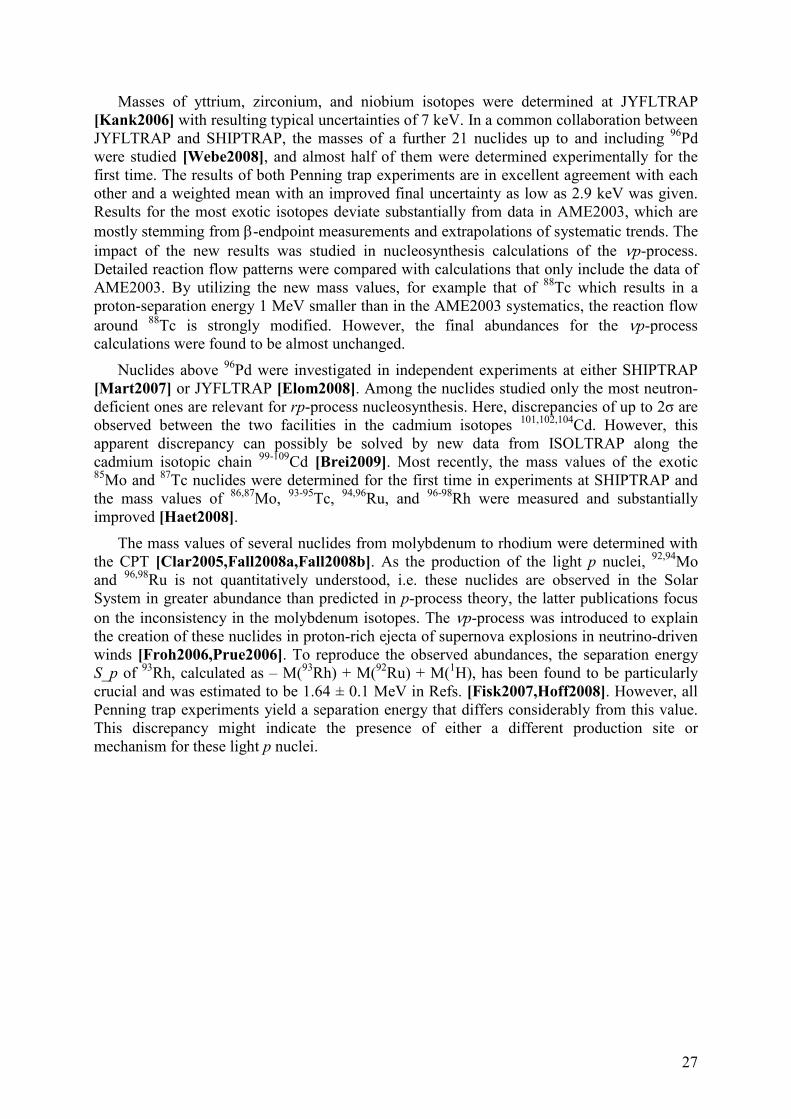
Across the higher-mass region of the rp-process path above A = 80 broad mass determinations have been performed with JYFLTRAP, SHIPTRAP and CPT. Figure 5 gives an overview on all nuclides studied in either of the first two experiments. A possible pathway of the rp-process for steady-state burning (from Schatz [Scha2001], solid lines) is shown together with a possible path of the ν p-process (dashed lines). The data amount to about 75 newly determined mass values which are not included in the published issue of the Atomic Mass Evaluation 2003 [Audi2003]. Their mass uncertainties δm are well below the required limit of 10 keV needed for nucleosynthesis calculations [Scha2006].
27
Masses of yttrium, zirconium, and niobium isotopes were determined at JYFLTRAP [Kank2006] with resulting typical uncertainties of 7 keV. In a common collaboration between JYFLTRAP and SHIPTRAP, the masses of a further 21 nuclides up to and including 96Pd were studied [Webe2008], and almost half of them were determined experimentally for the first time. The results of both Penning trap experiments are in excellent agreement with each other and a weighted mean with an improved final uncertainty as low as 2.9 keV was given. Results for the most exotic isotopes deviate substantially from data in AME2003, which are mostly stemming from β-endpoint measurements and extrapolations of systematic trends. The impact of the new results was studied in nucleosynthesis calculations of the νp-process. Detailed reaction flow patterns were compared with calculations that only include the data of AME2003. By utilizing the new mass values, for example that of 88Tc which results in a proton-separation energy 1 MeV smaller than in the AME2003 systematics, the reaction flow around 88Tc is strongly modified. However, the final abundances for the νp-process calculations were found to be almost unchanged.
Nuclides above 96Pd were investigated in independent experiments at either SHIPTRAP [Mart2007] or JYFLTRAP [Elom2008]. Among the nuclides studied only the most neutron-deficient ones are relevant for rp-process nucleosynthesis. Here, discrepancies of up to 2σ are observed between the two facilities in the cadmium isotopes 101,102,104Cd. However, this apparent discrepancy can possibly be solved by new data from ISOLTRAP along the cadmium isotopic chain 99-109Cd [Brei2009]. Most recently, the mass values of the exotic 85Mo and 87Tc nuclides were determined for the first time in experiments at SHIPTRAP and the mass values of 86,87Mo, 93-95Tc, 94,96Ru, and 96-98Rh were measured and substantially improved [Haet2008].
The mass values of several nuclides from molybdenum to rhodium were determined with the CPT [Clar2005,Fall2008a,Fall2008b]. As the production of the light p nuclei, 92,94Mo and 96,98Ru is not quantitatively understood, i.e. these nuclides are observed in the Solar System in greater abundance than predicted in p-process theory, the latter publications focus on the inconsistency in the molybdenum isotopes. The νp-process was introduced to explain the creation of these nuclides in proton-rich ejecta of supernova explosions in neutrino-driven winds [Froh2006,Prue2006]. To reproduce the observed abundances, the separation energy S_p of 93Rh, calculated as – M(93Rh) + M(92Ru) + M(1H), has been found to be particularly crucial and was estimated to be 1.64 ± 0.1 MeV in Refs. [Fisk2007,Hoff2008]. However, all Penning trap experiments yield a separation energy that differs considerably from this value. This discrepancy might indicate the presence of either a different production site or mechanism for these light p nuclei.
28
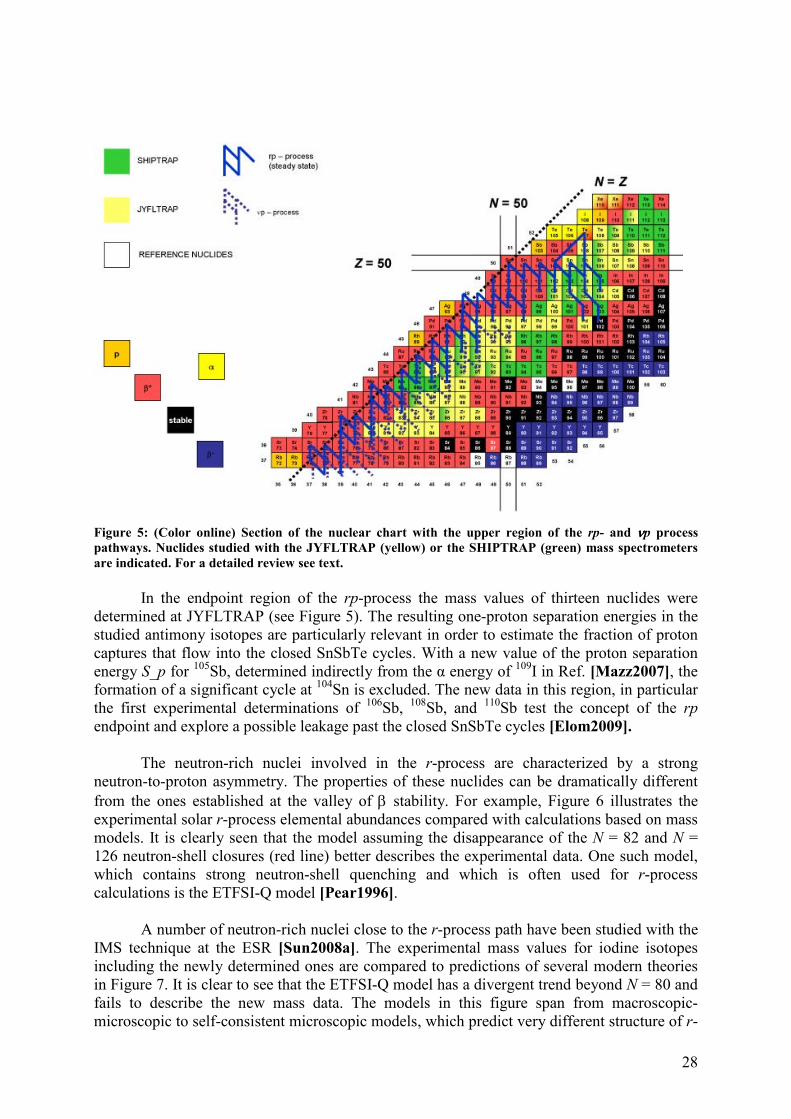
Figure 5: (Color online) Section of the nuclear chart with the upper region of the rp- and ννννp process pathways. Nuclides studied with the JYFLTRAP (yellow) or the SHIPTRAP (green) mass spectrometers are indicated. For a detailed review see text. In the endpoint region of the rp-process the mass values of thirteen nuclides were determined at JYFLTRAP (see Figure 5). The resulting one-proton separation energies in the studied antimony isotopes are particularly relevant in order to estimate the fraction of proton captures that flow into the closed SnSbTe cycles. With a new value of the proton separation energy S_p for 105Sb, determined indirectly from the α energy of 109I in Ref. [Mazz2007], the formation of a significant cycle at 104Sn is excluded. The new data in this region, in particular the first experimental determinations of 106Sb, 108Sb, and 110Sb test the concept of the rp endpoint and explore a possible leakage past the closed SnSbTe cycles [Elom2009]. The neutron-rich nuclei involved in the r-process are characterized by a strong neutron-to-proton asymmetry. The properties of these nuclides can be dramatically different from the ones established at the valley of β stability. For example, Figure 6 illustrates the experimental solar r-process elemental abundances compared with calculations based on mass models. It is clearly seen that the model assuming the disappearance of the N = 82 and N = 126 neutron-shell closures (red line) better describes the experimental data. One such model, which contains strong neutron-shell quenching and which is often used for r-process calculations is the ETFSI-Q model [Pear1996].
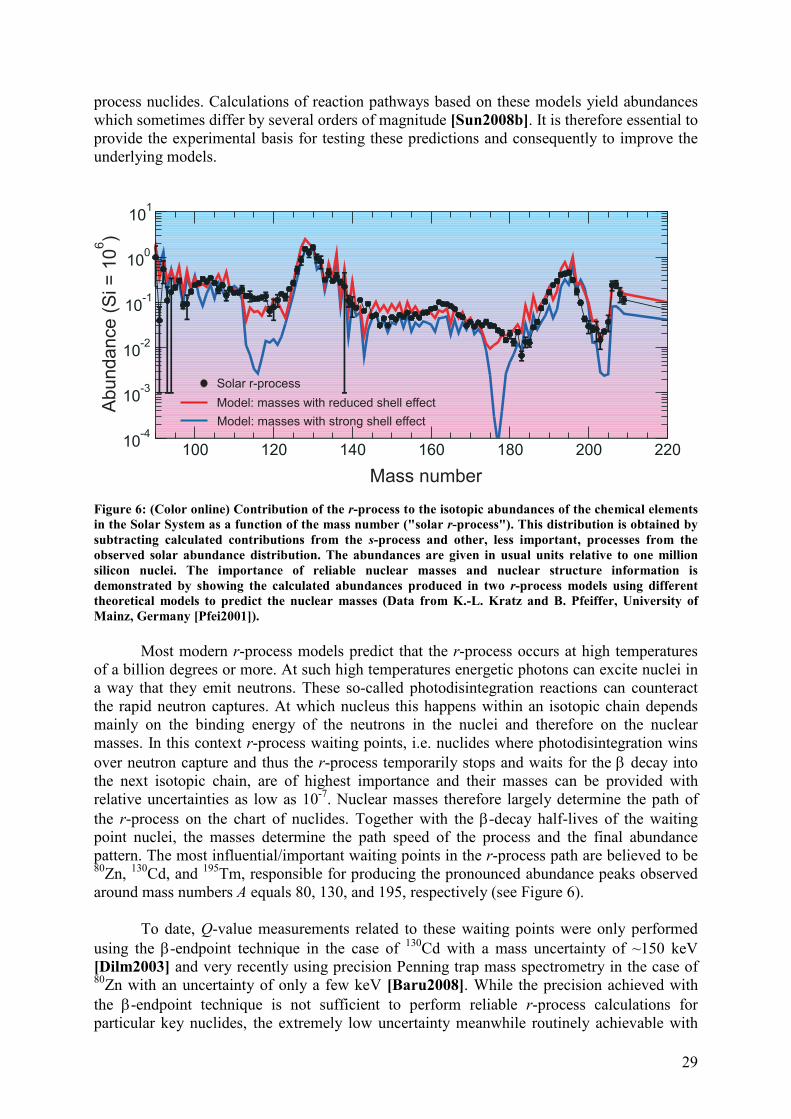
A number of neutron-rich nuclei close to the r-process path have been studied with the IMS technique at the ESR [Sun2008a]. The experimental mass values for iodine isotopes including the newly determined ones are compared to predictions of several modern theories in Figure 7. It is clear to see that the ETFSI-Q model has a divergent trend beyond N = 80 and fails to describe the new mass data. The models in this figure span from macroscopic-microscopic to self-consistent microscopic models, which predict very different structure of r-
29
process nuclides. Calculations of reaction pathways based on these models yield abundances which sometimes differ by several orders of magnitude [Sun2008b]. It is therefore essential to provide the experimental basis for testing these predictions and consequently to improve the underlying models.
100 120 140 160 180 200 22010
-4
10-3
10-2
10-1
100
101
Ab
un
da
nce
(S
i =
10
)6
Mass number
Solar r-process
Model: masses with reduced shell effect
Model: masses with strong shell effect
Figure 6: (Color online) Contribution of the r-process to the isotopic abundances of the chemical elements in the Solar System as a function of the mass number ("solar r-process"). This distribution is obtained by subtracting calculated contributions from the s-process and other, less important, processes from the observed solar abundance distribution. The abundances are given in usual units relative to one million silicon nuclei. The importance of reliable nuclear masses and nuclear structure information is demonstrated by showing the calculated abundances produced in two r-process models using different theoretical models to predict the nuclear masses (Data from K.-L. Kratz and B. Pfeiffer, University of Mainz, Germany [Pfei2001]). Most modern r-process models predict that the r-process occurs at high temperatures of a billion degrees or more. At such high temperatures energetic photons can excite nuclei in a way that they emit neutrons. These so-called photodisintegration reactions can counteract the rapid neutron captures. At which nucleus this happens within an isotopic chain depends mainly on the binding energy of the neutrons in the nuclei and therefore on the nuclear masses. In this context r-process waiting points, i.e. nuclides where photodisintegration wins over neutron capture and thus the r-process temporarily stops and waits for the β decay into the next isotopic chain, are of highest importance and their masses can be provided with relative uncertainties as low as 10-7. Nuclear masses therefore largely determine the path of the r-process on the chart of nuclides. Together with the β-decay half-lives of the waiting point nuclei, the masses determine the path speed of the process and the final abundance pattern. The most influential/important waiting points in the r-process path are believed to be 80Zn, 130Cd, and 195Tm, responsible for producing the pronounced abundance peaks observed around mass numbers A equals 80, 130, and 195, respectively (see Figure 6).
To date, Q-value measurements related to these waiting points were only performed using the β-endpoint technique in the case of 130Cd with a mass uncertainty of ~150 keV [Dilm2003] and very recently using precision Penning trap mass spectrometry in the case of 80Zn with an uncertainty of only a few keV [Baru2008]. While the precision achieved with the β-endpoint technique is not sufficient to perform reliable r-process calculations for particular key nuclides, the extremely low uncertainty meanwhile routinely achievable with
30
Penning trap mass measurements allowed, in the case of 80Zn, to extract a well-defined map of conditions for a major r-process waiting point to be on the reaction path. Figure 7: Mass comparison between model predictions and experimental data of iodine isotopes (from Ref. [Sun2008a]) (f) Spectroscopy on highly-charged ions Trapped highly charged ions (HCI) produced in situ by an electron beam ion trap (EBIT) have enabled novel investigations in a broad range of atomic and nuclear physics fields. The major player in this field has been undoubtedly the Lawrence Livermore National Laboratory (LLNL) EBIT group. The list of EBIT papers with immediate relevance for fusion plasma research is overwhelming, with numerous high quality contributions from the LLNL group of Beiersdorfer (see e.g. the very first and most recent results [Levi1988,Beie2003b]). The MPI-K EBIT group in Heidelberg has continued and expanded work in many of those fields (see e.g. [Beie2005,WEpp2007,ElSa2007b]). Experiments related to electron-ion interactions at energies relevant for high temperature plasmas, including radiative and dielectronic recombination, have achieved excellent resolution and provided data on the electronic structure in a regime of extraordinarily enhanced relativistic, nuclear size, and QED contributions [Cres2001,YZou2003,Gonz2005,Gonz2006,Harm2006,Mokl2008]. High resolution spectroscopy in all spectral ranges, from the hard x-rays to the visible, have yielded unique information stringently benchmarking advanced atomic structure calculations [Bruh2007,Drag2003,Tupi2003,Sori2006,Sori2007]. Such studies did not only deal with issues such as the Breit interaction or the Lamb shift in the nonperturbative regime, but also on a much wider variety of physical effects, from nuclear sizes, isotopic shifts, hyperfine splitting and anomalies, the Bohr-Weisskopf effect to the relativistic nuclear recoil or QED contributions to the transition probabilities [Cres2008,Lapi2005]. Furthermore, the application of EBITs to the investigation of HCIs with neutral species (charge exchange) has been essential to our understanding of the interaction of the solar wind with comets [Beie2003b], and experiments using EBIT-produced HCIs interacting with surfaces have resulted in a much better knowledge of the formation and evolution of hollow atoms [WEpp2007,Meis2006,Meis2007,ElSa2007a,ElSa2007b]. Very recently, the MPIK group has demonstrated new EBIT-related techniques. EBITs can be used successfully as a target for advanced light sources, as pioneering results achieved at the Free Electron Laser (FEL) in Hamburg, FLASH, on the resonant excitation of Fe23+ ions by 49 eV photons have recently demonstrated [Bren2007]. Another new avenue for investigating the interaction of x-ray radiation with HCI has been pioneered by the MPIK
31
group with the application of one of the Heidelberg EBITs as an HCI target in recent experiments at BESSY-II [Simo2009]. The novel apparatus, achieving HCI target area densities up to 1011 ions/cm2, and thus raising the HCI target area density by more than three orders of magnitude in comparison with the merged beam techniques, enables experiments in photoionization and photoexcitation of HCI which had not been possible before. They can address pressing issues in astrophysics, e.g., the absorption spectra of matter surrounding active galactic nuclei that cannot be modeled with existing atomic models because of wavelength uncertainties and lack of experimental data [Kall2007]. (g) In-trap conversion electron and alpha spectroscopy:
Presently high-resolution electron spectroscopy is limited by the thickness of radioactive sources due to scattering in the source material. Since ions localized in a Penning trap represent an ideal carrier-free source, where energy loss or scattering do not influence the line shape, we also plan to equip MATS with novel, highly efficient experimental techniques for in-trap conversion electron and α spectroscopy [Weis2002a]. Moreover, by use of the preparation trap isobarically pure sources can be obtained. In addition in-trap α spectroscopy will be studied. Typically the α decay of a heavy even-even nucleus branches within 10-20% to the first excited 2+ state of the daughter nucleus [Sobi2001]. The populating α decay causes the emission of low-energy 'shake-off' electrons which allow the determination of the decay position [Gras1975]. After a lifetime (typically a few hundred picoseconds) the 2+ state itself decays via L conversion, again producing several shake-off electrons. During the lifetime of the 2+ state the recoil nucleus typically moves by about 50-100 µm. Thus the origin of the shake-off electrons at the position of the conversion decay will be displaced by this distance with respect to the position of the initial α decay. In order to adapt this distance to the position resolution achievable in the electron detector, the magnetic field of the Penning trap on the axis behind the magnet can be adiabatically expanded, e.g. from 7 T at the trap center to 7×10-
3 T in about 1 m distance. Thus the position of the two electron components can be detected in distance of about 1.5-3 mm, sufficient for the position resolution of a segmented electron detector.
Measuring the position of both electron components results in a lifetime measurement of
the 2+ state with the recoil-distance method, allowing for a determination of the quadrupole deformation. In addition 0+ states can be populated in the α decay, whose lifetimes can be determined with the same experimental technique via shake-off and conversion electrons (in situations where the 0+ state is the first excited state). This would yield access to a measurement of the E(0) strength ρ2(E0). This method is suitable for all α-decaying isotopes e.g. produced at the Super-FRS via fragmentation of a 238U beam.
Position-sensitive α-recoil coincidence spectroscopy as well as position-sensitive electron
spectroscopy allow for diagnostics of the size and shape of the ion cloud in the trap, while the conversion electron lines provide an unambiguous Z identification. Due to the rotational character of the converted transitions, from the measured energy of the K and L lines the rotational energy and thus the spin can be extracted. Therefore this experimental technique can provide an improved assignment of level schemes especially in odd nuclei compared to the so far used methods of α-spectroscopy. Trap-assisted and neutron spectroscopy
32
Beta decay is by far the most common form of radioactivity for nuclei away from the stability valley. Therefore the knowledge of the beta decay properties contributes decisively to our understanding of nuclear phenomena. In particular the accurate measurement of the distribution of decay probabilities over the entire accessible energy window reveals fundamental aspects of the structure of atomic nuclei and provides essential data for the fields of astrophysics, nuclear technology and neutrino physics. The vast majority of the information that we have about the beta intensity distribution is coming from the level schemes obtained in high resolution experiments with germanium detectors. It is known [Hard1977] that this technique suffers from a systematic error (the Pandemonium effect) that tends to displace the beta intensity towards low excitation energies. This error can be dramatic for nuclei far from stability with large Q-values and/or level densities, and it is related to the low detection probability of high-lying high-energy gamma-ray transitions. The total absorption spectroscopy technique in beta-decay studies was introduced to overcome this limitation since it is based on the detection of the full cascade branch with high efficiency using close-to-4π scintillation detectors [Tain2007]. The major limitation of the technique is the purity of the samples under investigation. We propose to use at MATS a total absorption spectrometer in order to perform accurate measurements of the beta strength distribution on relevant isotopes. Due to the simplicity of the allowed decay operator, where the transformed nucleon remains in its orbit changing at most the spin orientation, the beta strength reflects sensitively the structure of the available orbitals for the transition. This explains why the bulk of the allowed strength in β- -decay lies outside the beta decay window, since the empty proton orbitals are pushed up by the Coulomb interaction, and only the tail of the distribution is observed [Klap1983]. However, and contrary to the common assumption, there is ample evidence for a rich structure in the accessible strength distribution which provides a sensitive test of nuclear model calculations. This will be particularly important for calculations which aim to predict the beta-decay half lives for nuclei lying on the r-process path not accessible to experimental determination. The study of neutron rich medium and medium-heavy nuclei approaching the waiting-point nuclei will help to improve the r-process nucleosynthesis abundance calculations [Graw2007]. Additionally the study of nuclei in the vicinity of 78Ni and 132Sn and of the existence of high lying weak decay branches will provide a clearer picture of the nuclear structure around closed shells far from stability. In the case of EC/β+ decays it is possible to find regions of the nuclear chart where a significant fraction of the strength is located within the decay window as is the case for the heavier nuclei with N~Z, or the nuclei around 100Sn and 146Gd where the bulk of the GT strength is accessible. The study of nuclei in these regions will shed light on isospin effects, the shell structure of magic nuclei, the interplay of single particle and collective motions, and the effect of the nuclear shape [Hama1994]. It offers also the possibility to contribute decisively to the unitarity test of the Cabibbo-Kobayashi-Maskawa matrix via the accurate measurement of superallowed decay probabilities in odd-odd N=Z nuclei. As has been pointed out [Hard02], the extension of the test to the heavier isotopes (A≥62) requires the determination of the contribution to the decay of high-lying very weak decay branches for which the total absorption spectrometer is ideally suited. The accurate determination of the beta decay intensity distributions of the fission products which are generated in nuclear reactors has important consequences for the calculation of the reactor heat after shutdown, with implications for the spent fuel discharge
33
and handling procedures, and at the same time for the calculation of the reactor neutrino spectra, with implications in the analysis of neutrino oscillation experiments. Some key isotopes are suspected to suffer from large systematic errors and their measurement will represent an important contribution to these fields [Fall2007].
The decay of very neutron-rich nuclei is, owing to the high Qβ and relatively low binding energies of the daughter nuclei, often associated with delayed neutron emission from the population of unbound levels. In order to map the full decay strength, a system for detecting neutrons with energies up to some 10 MeV with good efficiency and energy resolution is required. As the most neutron-rich systems can decay through the emission of two or more neutrons, a multi-neutron detection capability is also highly desirable. In such cases, information may be derived concerning neutron-neutron correlations and the sequential or direct character of the decay. The study of delayed neutron emission after beta decay is essential for the design of safer nuclear reactors and the transport, management and storage of nuclear waste. The Nuclear Energy Agency (NEA) highlights the importance of experimental measurements and data evaluation of delayed neutron emission in its working group 6 “Delayed neutron data” [WPEC-SG6]. In nuclear physics, beta delayed neutron emission provides especially valuable information for the nuclei involved in the rapid neutron-capture process (r-process) in nuclear astrophysics. In one of the regions of interest for the r-process, the A=110 region prior to the A=130 peak, the astrophysical models underestimate the abundances by more than one order of magnitude. The delayed neutron emission probability (Pn) of r-process isobaric nuclei define the decay path towards stability during freeze-out, and provide a source of late time neutrons. The experimental data from delayed neutron emission represents an important input to r-process model calculations. Additionally, the half-lives (T1/2) and β-delayed neutron-emission probabilities (Pn) measured can be used as first probes of the structure of the β-decay daughter nuclei in this mass region, where more detailed spectroscopy is not technically possible nowadays due to the low production rates in the current experimental facilities. [Pere2009].
1.2 PERFORMANCE AND APPLICABILITY OF MATS
MATS is a novel and unique setup using an advanced trapping system and highly-charged
ions for high-accuracy mass measurements and trap assisted spectroscopy. The proposed project aims for a relative mass precision of better than 10-8 even for nuclides with half-lives of only 10 ms. Assuming an overall efficiency of about 1-5% (depending on the speed of extraction for the low-energy branch gas catcher, the charge-breeding and trapping time) nuclides with yields of only a few 10/s are accessible. With the FT-ICR technique, nuclides with yields below 1/s can be addressed. With the advantage of using highly-charged ions resolving powers of above 107 will be easily obtained, enough to resolve low lying isomers with excitation energies of a few 10 keV. Since the measurement technique can be applied to any nuclide of interest with suitable yield and half-life, irrespective of the chemical behavior of the ion under investigation, all the above discussed physics cases and mass candidates can be addressed with the novel high-accuracy Penning trap mass spectrometer MATS at the future facility FAIR.
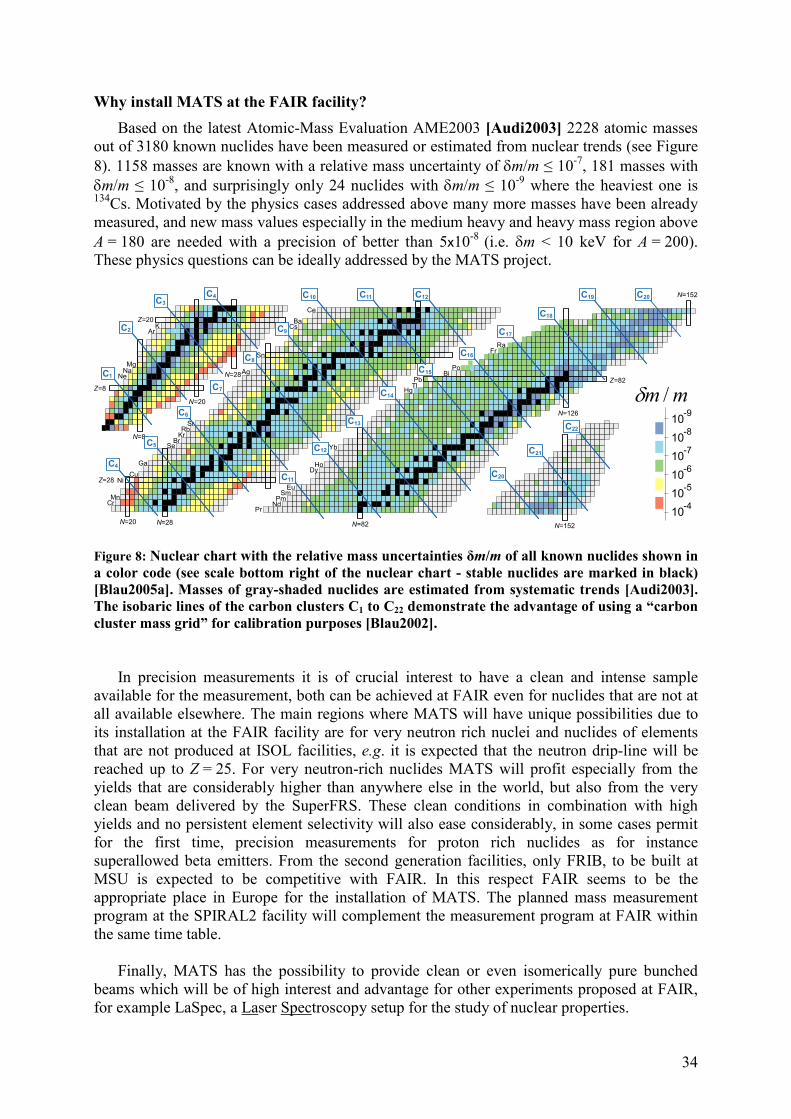
34
Why install MATS at the FAIR facility?
Based on the latest Atomic-Mass Evaluation AME2003 [Audi2003] 2228 atomic masses out of 3180 known nuclides have been measured or estimated from nuclear trends (see Figure 8). 1158 masses are known with a relative mass uncertainty of δm/m ≤ 10-7, 181 masses with δm/m ≤ 10-8, and surprisingly only 24 nuclides with δm/m ≤ 10-9 where the heaviest one is 134Cs. Motivated by the physics cases addressed above many more masses have been already measured, and new mass values especially in the medium heavy and heavy mass region above A = 180 are needed with a precision of better than 5x10⁻⁸ (i.e. δm < 10 keV for A = 200). These physics questions can be ideally addressed by the MATS project.
Figure 8: Nuclear chart with the relative mass uncertainties δm/m of all known nuclides shown in a color code (see scale bottom right of the nuclear chart - stable nuclides are marked in black) [Blau2005a]. Masses of gray-shaded nuclides are estimated from systematic trends [Audi2003]. The isobaric lines of the carbon clusters C1 to C22 demonstrate the advantage of using a “carbon cluster mass grid” for calibration purposes [Blau2002].
In precision measurements it is of crucial interest to have a clean and intense sample
available for the measurement, both can be achieved at FAIR even for nuclides that are not at all available elsewhere. The main regions where MATS will have unique possibilities due to its installation at the FAIR facility are for very neutron rich nuclei and nuclides of elements that are not produced at ISOL facilities, e.g. it is expected that the neutron drip-line will be reached up to Z = 25. For very neutron-rich nuclides MATS will profit especially from the yields that are considerably higher than anywhere else in the world, but also from the very clean beam delivered by the SuperFRS. These clean conditions in combination with high yields and no persistent element selectivity will also ease considerably, in some cases permit for the first time, precision measurements for proton rich nuclides as for instance superallowed beta emitters. From the second generation facilities, only FRIB, to be built at MSU is expected to be competitive with FAIR. In this respect FAIR seems to be the appropriate place in Europe for the installation of MATS. The planned mass measurement program at the SPIRAL2 facility will complement the measurement program at FAIR within the same time table.
Finally, MATS has the possibility to provide clean or even isomerically pure bunched
beams which will be of high interest and advantage for other experiments proposed at FAIR, for example LaSpec, a Laser Spectroscopy setup for the study of nuclear properties.
10-9
10-8
10-7
10-6
10-5
10-4
mm
Ar
Ne
Se
Sn
NdPm
SmEu
DyHo
Yb
HgTlPb
BiPo
FrRa
CsBa
Ce
Sr
BrKrRb
N=8
Z=8
N=20
Z=20
N=28
N=28
Z=28
N=82
Z=82
N=126
N=152
N=152
CrMn
NiCu
Ga
N=20
NaMg
K
Pr
AgC1
C2
C3
C4
C5
C6
C7
C8
C9
C10 C11 C12
C12
C13
C14
C15
C16
C17
C18
C19 C20
C21
C20
C22
C11
C4
mm /δ
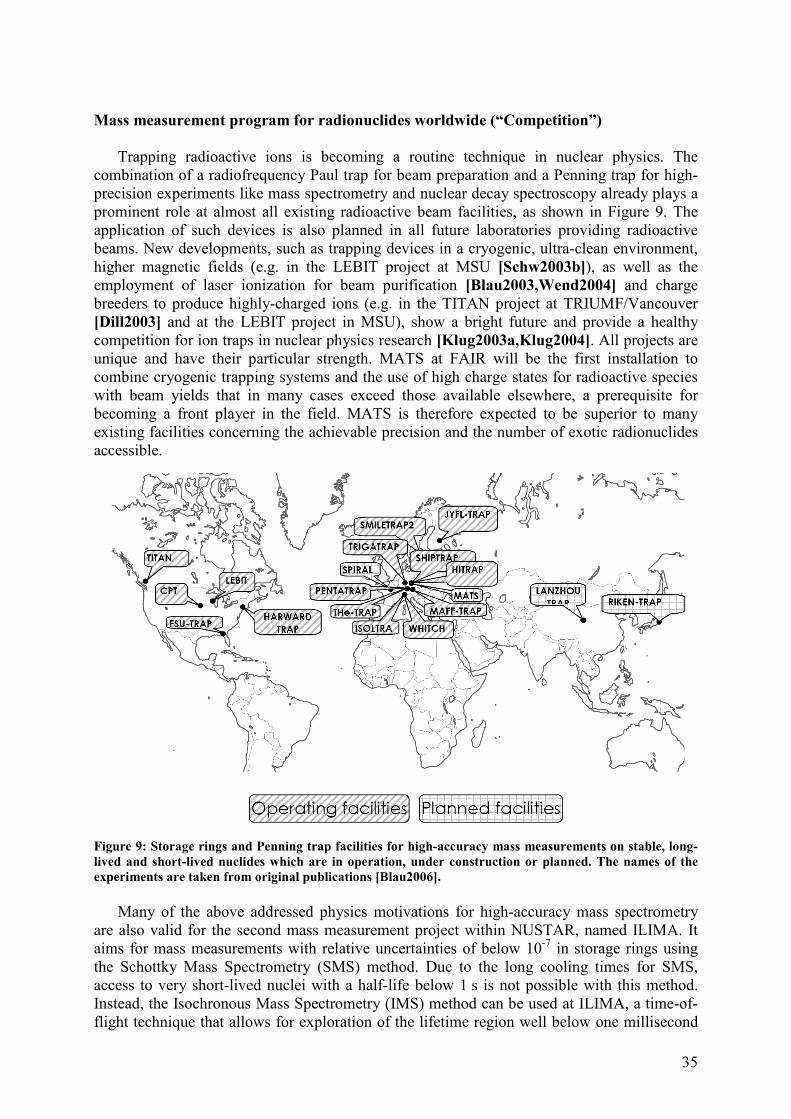
35
Mass measurement program for radionuclides worldwide (“Competition”)
Trapping radioactive ions is becoming a routine technique in nuclear physics. The combination of a radiofrequency Paul trap for beam preparation and a Penning trap for high-precision experiments like mass spectrometry and nuclear decay spectroscopy already plays a prominent role at almost all existing radioactive beam facilities, as shown in Figure 9. The application of such devices is also planned in all future laboratories providing radioactive beams. New developments, such as trapping devices in a cryogenic, ultra-clean environment, higher magnetic fields (e.g. in the LEBIT project at MSU [Schw2003b]), as well as the employment of laser ionization for beam purification [Blau2003,Wend2004] and charge breeders to produce highly-charged ions (e.g. in the TITAN project at TRIUMF/Vancouver [Dill2003] and at the LEBIT project in MSU), show a bright future and provide a healthy competition for ion traps in nuclear physics research [Klug2003a,Klug2004]. All projects are unique and have their particular strength. MATS at FAIR will be the first installation to combine cryogenic trapping systems and the use of high charge states for radioactive species with beam yields that in many cases exceed those available elsewhere, a prerequisite for becoming a front player in the field. MATS is therefore expected to be superior to many existing facilities concerning the achievable precision and the number of exotic radionuclides accessible.
Figure 9: Storage rings and Penning trap facilities for high-accuracy mass measurements on stable, long-lived and short-lived nuclides which are in operation, under construction or planned. The names of the experiments are taken from original publications [Blau2006].
Many of the above addressed physics motivations for high-accuracy mass spectrometry are also valid for the second mass measurement project within NUSTAR, named ILIMA. It aims for mass measurements with relative uncertainties of below 10-7 in storage rings using the Schottky Mass Spectrometry (SMS) method. Due to the long cooling times for SMS, access to very short-lived nuclei with a half-life below 1 s is not possible with this method. Instead, the Isochronous Mass Spectrometry (IMS) method can be used at ILIMA, a time-of-flight technique that allows for exploration of the lifetime region well below one millisecond
36
though the accuracy is not yet hight. For mass measurements at ILIMA absolute calibrants from other sources, such as MATS, are important. While ILIMA can map a mass surface over a large area, MATS is interested in specific nuclides where a high-precision is required. There are interesting candidates (a list of special cases and unresolved mass problems for the AME2003 can be found in [Waps2003], pp 169) where it is important to attack them from two different sides: by the storage ring and by the trap community. The experiments will be performed in a both cooperative and at the same time competitive spirit between ILIMA and MATS.
1.3 PRECISE MEASUREMENTS WITH LASPEC
Besides mass, lifetime, decay and excitation schemes, the nuclear ground-state spin and
moments are basic properties of the nucleus that allow us to derive directly or indirectly information on the nuclear structure, as well as on the strong nuclear force. Comparison of experimental results of exotic nuclei to calculations performed with different nuclear models allows us to test the predictive power of these models when going to the extremes.
For more than 40 years, peaking in the seventies and eighties and again in the last few
years, nuclear moments of radioactive nuclei have been measured, both in the ground state and in some isomeric states. Experiments were mainly performed for nuclei close to the valley of stability and on its neutron-deficient side, because the nuclei were produced mostly in fusion-evaporation or spallation reactions. Comprehensive review papers have been published by Otten [Otte1989] on the use of atomic spectroscopy methods for nuclear moment research and were followed by more recent reports [Bill1995,Neug2002,Klug2003b]. Still today, laser spectroscopy continues to deliver key information on properties of nuclear ground states and isomers and there is so far no alternative technique to obtain charge radii of short-lived species with comparable accuracy by other means. These experimental data are highly accurate and the nuclear parameters can be extracted without need of a nuclear model. Since the nuclear ground-state properties are very sensitive to both single-particle and collective structures, they provide a stringent test for nuclear theories and models.
New production facilities for radioactive beams like FAIR provide great opportunities to
extend our knowledge into new, interesting and previously inaccessible regions of the nuclear chart and further away from the valley of stability. DETERMINATION OF CHARGE RADII AND NUCLEAR MOMENTS FROM OPTICAL SPECTRA
Static nuclear moments provide crucial information about the single-particle structure or the collective nature of nuclear states. Nuclear charge radii are sensitive to details of the nuclear structure such as shell effects and deformations, the magnetic moment is sensitive to the single-particle nature of the valence nucleon, while the nuclear quadrupole moment is sensitive to bulk deformations.
Static moments of nuclei are measured via the interaction of the nuclear charge distribution and magnetism with electromagnetic fields in the immediate vicinity. These fields can be induced by atomic electrons, by the bulk electrons and first neighbouring nuclei for nuclei implanted in a crystal, or by an external magnetic field. The interaction of the three lowest multipole-order nuclear moments with the surrounding fields is fully understood and exhausted by scaler products of the three lowest-order multipoles:
37
• The radial nuclear charge distribution influences the interaction with the charge of the shell electrons, inducing an overall shift of the electronic fine structure levels. This energy shift is different for each isotope (as well as for each isomer) and is called the “isotope (isomer) shift”.
• The magnetic dipole vector µ interacts with the dipole magnetic field B. The energy of this
interaction is defined by the scalar product of the two vectors. • The electric quadrupole moment Qn
2, a tensor of rank 2, with the spectroscopic moment Qs being the zero order component of the tensor, interacts with the second order derivative of the electric field, being the tensor of the electric field gradient.
For unstable isotopes high-resolution optical spectroscopy is a unique approach to obtain precise information on the nuclear charge radii, because it is sensitive enough to be performed on the minute quantities of (short-lived) radioactive atoms produced at accelerator facilities. Other techniques are suitable only for stable isotopes of which massive targets are available. Elastic electron scattering gives details of the charge distribution, whereas X-ray spectroscopy on muonic atoms deals with systems for which the absolute shifts with respect to a point nucleus can be calculated. Thus, both methods give absolute values of ⟨r2⟩, whereas from optical spectra – with the exception of hydrogen - only differences in the mean-square charge radii can be extracted so far. Eventually, the combination of absolute radii for stable isotopes and differences of radii for radioactive isotopes provides absolute radii for nuclei all over the range that is accessible to optical spectroscopy. The combination of optical isotope shift and muonic atom data has been used extensively in order to disentangle mass and field shift components (see below) and to provide absolute values of ⟨r2⟩ [Heil1974,Heil1985, Fric2004]. However, great care must be taken in such a procedure, particularly if the stable isotopes are in a region where the field shift component is relatively small.
Nuclear charge radii and isotope shift
In atomic physics the nucleus is usually considered to be a positive point charge Ze forming the center of gravity of a system of electrons. The nuclear mass and size affect very little the atomic energy levels, and this is reflected in the isotope shifts which are accessible only to very high resolution atomic spectroscopy methods. The finite nuclear mass gives rise to a small nuclear recoil energy which is observed as a “mass shift” between the atomic transition frequencies of different isotopes. This effect could in principle be used to deduce information on nuclear masses, but is not at all competitive with direct precision mass measurements as described previously in this chapter.
A second part of the isotope shift is due to the nucleus not being a point charge, but having
an extended charge distribution which changes from one isotope to another. Traditionally this is called “nuclear volume shift” or “field shift”. The extension of the nuclear charge can be expressed by a charge radius Rp and reduces the binding energy of a real atom compared to a hypothetical atom containing a point-like nucleus. Even though this effect cannot be measured directly, it is visible in the shift between the transition frequencies of different isotopes for which Rp is different. Vice versa, information about differences of radii can be obtained from the measurement of isotope shifts. As nuclear radii are sensitive to details of the nuclear structure such as shell effects and deformation, this has become an important tool for exploring the behaviour of nuclear systems.
The isotope shift in an atomic transition, i.e. the difference between the optical transition
frequencies of two isotopes with masses MA and MA', is given by
38
2
'2
'
'''
)0(3
2Ψ∆=
+−
=−=
ZF
rFMM
MMK
AA
AA
AAAAAA
π
δννδν (4)
Both, the mass shift (first term) and the field shift (second term) factorize into an electronic
and a nuclear part. Knowledge of the electronic factors F (field shift constant) and K (mass shift constant) allows one to extract the quantity δ⟨r2⟩, i.e. the change in the mean-square nuclear charge radius between the isotopes A and A'. These atomic parameters have to be calculated theoretically or semi-empirically. The electronic factor F is determined by the change of the electron probability at the nuclear site during the transition. Three approaches can be used to calculate this probability density. Accurate and reliable ab-initio calculations are available only for selected elements. Two different methods are based on empirical approaches – either the known hyperfine structure and the magnetic dipole moment is used to extract the desired probability density, or the ns level energies are related to the probability densities by the Goudsmith-Fermi-Segré formula. The field shift term as given above is a good approximation for light elements where contributions from higher order radial moments of the nuclear charge distribution can be neglected. In particular s-electrons have high probability amplitudes inside the nucleus. p-states have small probability amplitudes, thus s → p transitions are most suitable for the spectroscopic study of differences in nuclear mean-square charge radii δ⟨r2⟩.
The theory of the mass shift can be found in the book of King [King1984]. Summarizing,
the normal mass shift constant KNMS can be calculated by the relation KNMS = νA × me. The specific mass shift is very sensitive to electron correlations which are notoriously difficult to calculate. So far, ab-initio calculations with sufficient precision for light isotopes are only available for systems with up to three electrons [Yan2000,Yan2008,Puch2008].
For heavier elements, an ad-hoc approach related to the mass dependence of the mass shift
(MA’-MA)/ (MA’MA) can be used to extract field effects. This function can be fitted to the experimental isotope-shift data, and deviations can be ascribed to the field shift. Of course, this approach neglects all field-shift contributions which have the same mass dependence as the mass shift. In a more elaborate way, using the so-called "King-Plot", KMS is determined by combining absolute nuclear charge-radii measured by X-ray spectroscopy on muonic atoms with data from optical spectroscopy, provided that a few stable isotopes exist and have been investigated. This approach has been used also for neon isotopes [Geit2002,Geit2008].
Hyperfine Structure
Not only the radial distribution of the nuclear charge (monopole moment), but also the higher multipole electromagnetic moments of nuclei with a spin I ≠ 0 influence the atomic energy levels. By interacting with the multipole fields of the shell electrons they cause an additional splitting called hyperfine structure. For all practical purposes it is sufficient to consider only the magnetic dipole and the electric quadrupole interaction of the nucleus with the shell electrons. We have seen that nuclei with I ≥ 1/2 possess a magnetic moment. On the other hand, the shell electrons in states with a total angular momentum J ≠ 0 produce a magnetic field at the site of the nucleus. This gives a dipole interaction energy Em = −µ · B. The spectroscopic quadrupole moment of a nucleus with I ≥ 1 interacts with an electric field gradient produced by the shell electrons in a state with J ≥ 1 according to EQ = eQs (∂
2V/∂z2).
39
For a particular atomic level characterized by the angular momentum quantum number J,
the coupling with the nuclear spin I gives a new total angular momentum F. The hyperfine interaction removes the degeneracy of the different F levels and produces a splitting into 2J +
1 or 2I + 1 hyperfine structure levels for J < I and J > I, respectively. This is the basis for the determination of the nuclear spin from the hyperfine structure. Using quantum mechanical vector coupling rules one obtains an expression for the hyperfine structure energies of all F levels of a hyperfine structure multiplet with respect to the atomic fine structure level J
)12()12(2
)1()1()1(43
2
1
−−+−+−+
+=JJII
JJIICCBACEF . (5)
Within the multiplet, these energies depend on only two parameters, the magnetic dipole interaction constant A
JI
BA I )0(N
hfs
µµ= (6)
and the electric quadrupole interaction constant B
0
hfs
∂∂
=z
EQeB s . (7)
B(0) is the magnetic field of the electrons and (∂E/∂z)0 =Vzz(0) the electric field gradient of the shell electron at the site of the nucleus. Both these parameters Ahfs and Bhfs contain as a nuclear part the magnetic nuclear moment µI, and spectroscopic quadrupole moment Qs, respectively, and as an electronic part a quantity which is independent of the isotope, constant for a given chemical element in a particular atomic state.
The determination of nuclear moments from hyperfine structure is particularly appropriate for radioactive isotopes, if the electronic parts, namely B(0) and Vzz(0), are usually known from independent measurements of moments and hyperfine structure on the stable isotopes of the same element.
REQUIRED RESOLUTION AND ACCURACY
Isotope Shifts
The dependencies of the mass shift (MS) and the field shift (FS) size on the mass and atomic numbers, namely
,
1
3
2'
2'
''
A
Z
AMM
MM
AA
FS
AA
AAAA
MS
∝
∝−
∝
δν
δν (8)
leads to very different demands on the accuracy for charge radii determination in the nuclear chart (see Table 2). Typical orders of magnitude for the mass shift are between a few 10 GHz for very light elements (Z ≈ 2) and 10 MHz for the heavy ones (Z ≈ 80), whereas the size of
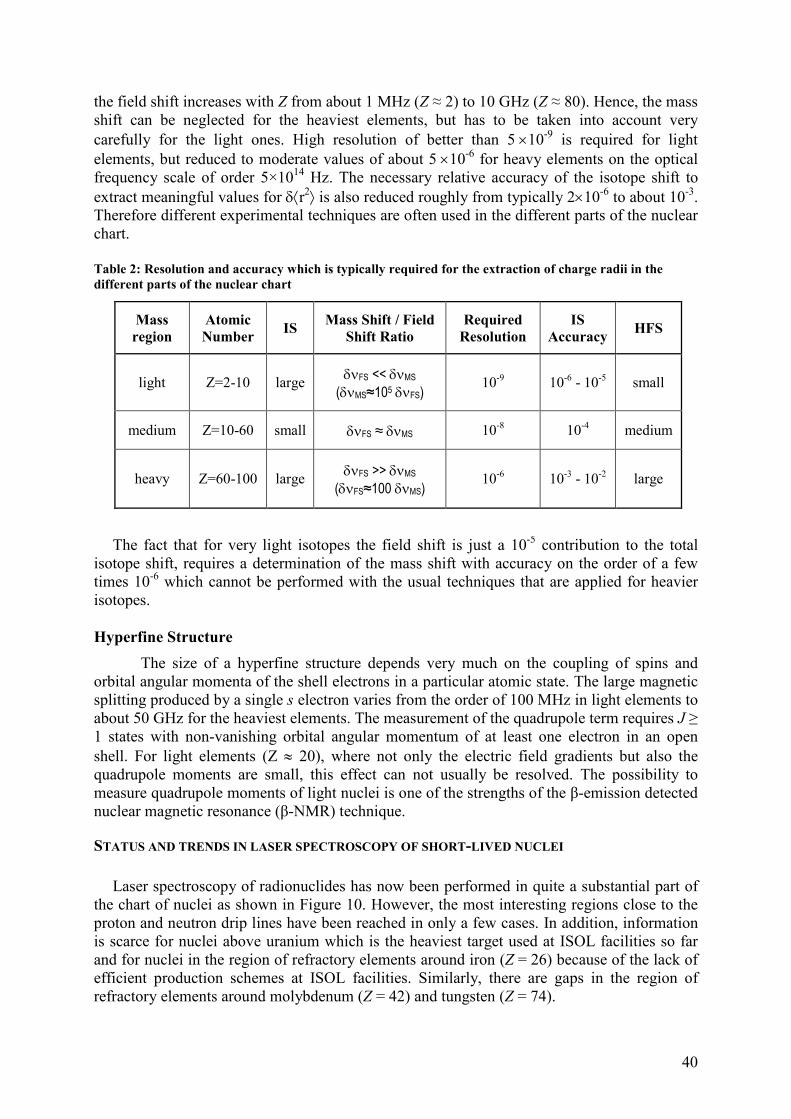
40
the field shift increases with Z from about 1 MHz (Z ≈ 2) to 10 GHz (Z ≈ 80). Hence, the mass shift can be neglected for the heaviest elements, but has to be taken into account very carefully for the light ones. High resolution of better than 5 ×10⁻⁹ is required for light elements, but reduced to moderate values of about 5 ×10⁻⁶ for heavy elements on the optical frequency scale of order 5×10¹⁴ Hz. The necessary relative accuracy of the isotope shift to extract meaningful values for δ⟨r2⟩ is also reduced roughly from typically 2×10⁻⁶ to about 10-3. Therefore different experimental techniques are often used in the different parts of the nuclear chart. Table 2: Resolution and accuracy which is typically required for the extraction of charge radii in the different parts of the nuclear chart
The fact that for very light isotopes the field shift is just a 10-5 contribution to the total isotope shift, requires a determination of the mass shift with accuracy on the order of a few times 10-6 which cannot be performed with the usual techniques that are applied for heavier isotopes. Hyperfine Structure
The size of a hyperfine structure depends very much on the coupling of spins and orbital angular momenta of the shell electrons in a particular atomic state. The large magnetic splitting produced by a single s electron varies from the order of 100 MHz in light elements to about 50 GHz for the heaviest elements. The measurement of the quadrupole term requires J ≥ 1 states with non-vanishing orbital angular momentum of at least one electron in an open shell. For light elements (Z ≈ 20), where not only the electric field gradients but also the quadrupole moments are small, this effect can not usually be resolved. The possibility to measure quadrupole moments of light nuclei is one of the strengths of the β-emission detected nuclear magnetic resonance (β-NMR) technique.
STATUS AND TRENDS IN LASER SPECTROSCOPY OF SHORT-LIVED NUCLEI
Laser spectroscopy of radionuclides has now been performed in quite a substantial part of
the chart of nuclei as shown in Figure 10. However, the most interesting regions close to the proton and neutron drip lines have been reached in only a few cases. In addition, information is scarce for nuclei above uranium which is the heaviest target used at ISOL facilities so far and for nuclei in the region of refractory elements around iron (Z = 26) because of the lack of efficient production schemes at ISOL facilities. Similarly, there are gaps in the region of refractory elements around molybdenum (Z = 42) and tungsten (Z = 74).
Mass region
Atomic Number
IS Mass Shift / Field
Shift Ratio Required
Resolution IS
Accuracy HFS
light Z=2-10 large δνFS << δνMS
(δνMS≈105 δνFS) 10-9 10-6 - 10-5 small
medium Z=10-60 small δνFS ≈ δνMS 10-8 10-4 medium
heavy Z=60-100 large δνFS >> δνMS
(δνFS≈100 δνMS) 10-6 10-3 - 10-2 large
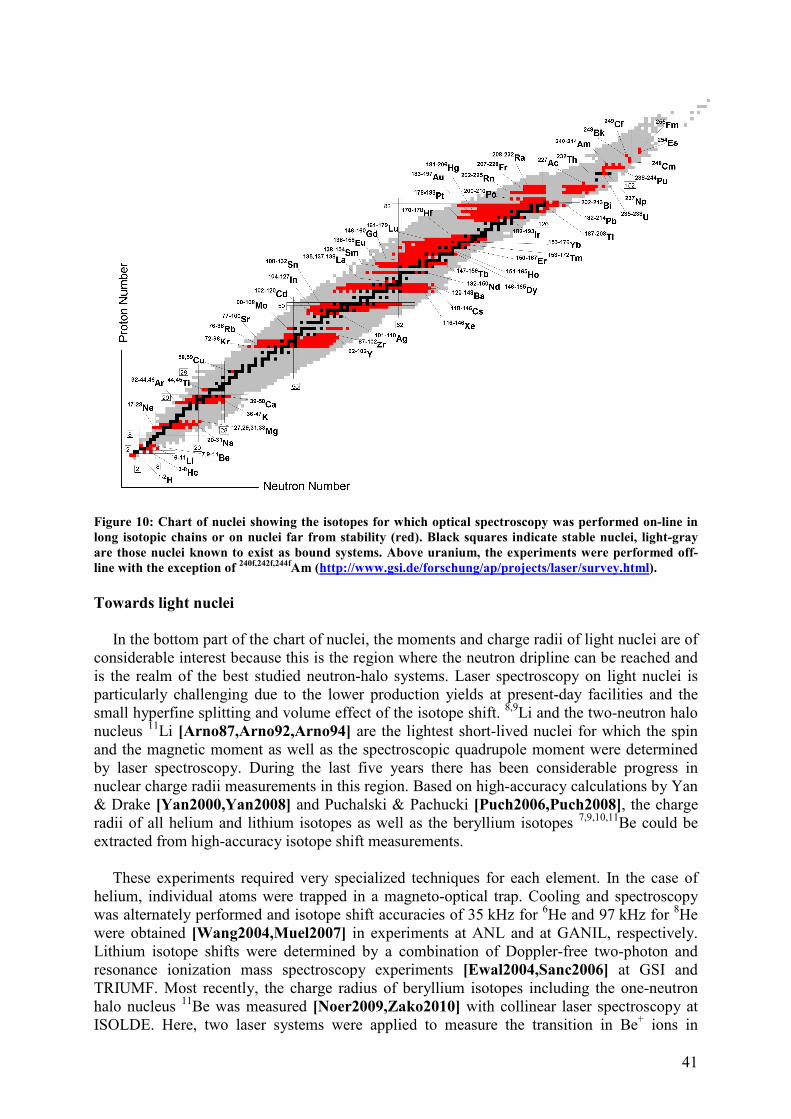
41
Figure 10: Chart of nuclei showing the isotopes for which optical spectroscopy was performed on-line in long isotopic chains or on nuclei far from stability (red). Black squares indicate stable nuclei, light-gray are those nuclei known to exist as bound systems. Above uranium, the experiments were performed off-line with the exception of 240f,242f,244fAm (http://www.gsi.de/forschung/ap/projects/laser/survey.html).
Towards light nuclei
In the bottom part of the chart of nuclei, the moments and charge radii of light nuclei are of considerable interest because this is the region where the neutron dripline can be reached and is the realm of the best studied neutron-halo systems. Laser spectroscopy on light nuclei is particularly challenging due to the lower production yields at present-day facilities and the small hyperfine splitting and volume effect of the isotope shift. 8,9Li and the two-neutron halo nucleus 11Li [Arno87,Arno92,Arno94] are the lightest short-lived nuclei for which the spin and the magnetic moment as well as the spectroscopic quadrupole moment were determined by laser spectroscopy. During the last five years there has been considerable progress in nuclear charge radii measurements in this region. Based on high-accuracy calculations by Yan & Drake [Yan2000,Yan2008] and Puchalski & Pachucki [Puch2006,Puch2008], the charge radii of all helium and lithium isotopes as well as the beryllium isotopes 7,9,10,11Be could be extracted from high-accuracy isotope shift measurements.
These experiments required very specialized techniques for each element. In the case of
helium, individual atoms were trapped in a magneto-optical trap. Cooling and spectroscopy was alternately performed and isotope shift accuracies of 35 kHz for 6He and 97 kHz for 8He were obtained [Wang2004,Muel2007] in experiments at ANL and at GANIL, respectively. Lithium isotope shifts were determined by a combination of Doppler-free two-photon and resonance ionization mass spectroscopy experiments [Ewal2004,Sanc2006] at GSI and TRIUMF. Most recently, the charge radius of beryllium isotopes including the one-neutron halo nucleus 11Be was measured [Noer2009,Zako2010] with collinear laser spectroscopy at ISOLDE. Here, two laser systems were applied to measure the transition in Be+ ions in
42
parallel and anti-parallel geometry simultaneously in order that the result was independent of the uncertainty in the acceleration voltage.
Another halo nucleus of which the charge radius was recently measured is 17Ne
[Geit2008]. A sophisticated technique had to be used. It included charge exchange of the ion beam into an atomic metastable state, depopulation of the metastable state by collinear spectroscopy when the laser is tuned to resonance, probing of the population by collisional ionization in a gas cell, and finally detection of the atomic and ionic components of the fast beam by observation of the nuclear decay. In this way, the shell closure at A = 18 and strong deformation for A > 20 was clearly observed in the slope of the δ<r
2> data. The fermionic molecular dynamics model explains the pronounced changes in the ground-state structure observed in the experiments very accurately. It attributes the large charge radius of 17Ne to an extended proton configuration with an s2 component of about 40%. The smaller radius of 18Ne is attributed to a significantly smaller s2 component.
Indeed, the region of light radionuclides is attractive for further laser spectroscopic
measurements as the drip lines can be reached, halo nuclei are accessible and nuclear theory is well developed. For example, there are plans to measure the nuclear charge radius of 12Be and, on a longer perspective, 14Be, provided that the current production yields at ISOL facilities of a few atoms/s can be significantly increased or 14Be ions produced in-flight can be efficiently stopped in and extracted from a gas cell. The one-proton halo nucleus 8B would also be a very interesting candidate for a charge radius determination but it is not available at any ISOL facility. The measurement of the quadrupole moments of the sodium isotopes could be extended over the presently known series up to 29Na [Keim2000] to the neutron shell closure at N = 20 and beyond, provided the beam intensities of these nuclei can be increased. Thus, prerequisites for such experiments on light nuclei are the development of new target and ion source systems at ISOL facilities or ion catchers coupled to fragmentation facilities which efficiently slow down, capture, accumulate, and cool radioactive beams [Sava2001]. The low energy beamline at the Super-FRS of FAIR will provide such a unique opportunity. Towards superheavy nuclei
Above uranium (Z = 92) the information on nuclear ground-state properties from laser spectroscopy is scarce since these elements are not available at ISOL facilities. Isotopes of such elements can only be produced by fusion reactions in heavy ion collisions or by transfer reactions using radioactive targets. Gas-filled recoil mass separators or velocity filters are used in the case of fusion reactions.
The only on-line laser experiment performed until now has been conducted by Backe et al. on the fission isomers of 240f,242f,244fAm [Back1998, Back2000]. In this case, the challenges of an extremely short half-life (0.9 ms) and production rates as low as 1 ion/s were overcome. A deformation parameter of about β = 0.7 was deduced which corresponds to an axis ratio of a rotational ellipsoid of about 2:1. The Am fission isomer is the shortest-lived species that has been investigated by laser spectroscopy thus far.
Laser spectroscopic experiments on even heavier elements up to fermium (Z = 100) were performed off-line. For example, the ionization limits of the actinides up to einsteinium (Z = 99) were determined by resonance ionization spectroscopy [Köhl1997].
In general, atomic level schemes of heavy actinide elements have not been studied and
theoretical predictions are difficult because of the many-body nature of these elements with
43
several open shells and strong relativistic effects. A recent search for excited atomic levels of fermium (Z = 100) was successfully performed by the use of resonance ionization spectroscopy [Sewt2003]. In order to search for optical transitions and to determine the nuclear ground-state properties of trans-uranium elements, a new facility – called SHIPTRAP – has been built up and tested at GSI [Dill2000,Raut2008]. Here, a gas cell for stopping the fusion products and linear Paul and Penning traps are installed behind the velocity filter SHIP. Extremely low production cross sections are typical for such type of experiments however the ion manipulation techniques applied make full use of all rare ions delivered to the gas cell. A mass-spectrometric identification of a single ion by non-destructive Fourier Transform Ion Cyclotron Resonance (FT-ICR) is presently being developed for TRIGA-TRAP in Mainz in order to make the most efficient use of these rare events [Kete2008].
To perform laser spectroscopy on fusion reaction products at SHIP, a novel experimental procedure was developed. It is based on the technique of Radiation Detected Resonance Ionization Spectroscopy (RADRIS) and can be applied to elements such as nobelium produced with rates of a few ions per second. The heavy elements are separated from the primary beam by the velocity filter SHIP, stopped in a buffer gas cell, collected on a tantalum filament and then re-evaporated as atoms. The ions produced by resonance ionization with tunable laser beams are detected via their characteristic α decay. First on-line experiments on α-active 155Yb, which has an atomic level structure similar to nobelium, were successfully performed [Back2007]. Towards the drip lines
There is a particular interest to study nuclei near the drip lines by laser spectroscopy. Both proton and neutron drip lines can be reached only for very light nuclei. The proton drip line is accessible up to medium-heavy nuclei whereas the neutron drip line above Z = 8 is presently still far off reach. Due to the small binding energies of nuclei close to the drip lines, one expects a lowering of the nuclear density, novel types of shell structures, or presently unknown unusual collective modes.
To make drip line nuclei accessible to laser spectroscopy, higher production yields and/or
higher efficiency of the laser spectroscopic techniques are required. With LaSpec we will employ both: the Super-FRS as a next-generation radioactive ion beam facility will provide beams with unprecedented intensity while the groups participating in LaSpec are continuously developing on-line techniques towards higher sensitivity and precision. For example, a breakthrough was achieved at Jyväskylä for the case of collinear spectroscopy with laser-induced fluorescence detection: by accumulating, cooling and bunching ions in a linear, segmented gas-filled radiofrequency quadrupole trap, the signal-to-background ratio was increased by more than four orders of magnitude [Niem2002]. In this way, the hyperfine structure and isotope shift of short-lived isotopes of the refractory element hafnium were determined much more efficiently than possible before [Levi1999]. Since this scheme is working successfully for the rather low yields at the ion guide separator online (IGISOL), it holds great promise concerning an extension of laser spectroscopy towards the drip lines. A similar cooler and buncher - ISCOOL - has recently been successfully commissioned in a collaborative effort by a large part of the LaSpec collaboration at ISOLDE. For MATS and LaSpec, such an RFQ is part of the common beamline and will facilitate the detection of rarely produced isotopes.
Moreover, the technique of cooling and bunching has recently been expanded by a new
widely applicable technique of optical pumping inside the RFQ using tunable, high repetition
44
rate pulsed laser beams [Camp2006]. In this approach, the central axis of the ion beam cooler is illuminated with laser light. Due to the ion confinement time, an extended laser-ion interaction time permits the optical manipulation of ions from the ground state into an excited state. This state will subsequently decay to populate metastable states, from which, high resolution collinear spectroscopy is performed [Chea2008]. Manipulation of state population in such a way extends the number of transitions available for study by collinear techniques. Transitions may be chosen on the basis of strength, preferred spins or suitability of hyperfine structure. Recently, this technique has permitted efficient collinear laser spectroscopy in refractory systems where atomic ground state resonance lines are ill-suited to the fast beam technique due to a combination of unfavorable transition wavelengths for cw laser excitation and a total angular momentum of J ≤ 1/2 that does not allow for the determination of quadrupole moments from the optical spectra [Chea2009].
LaSpec will - from the beginning - benefit from all present and future technological
developments.
LASER SPECTROSCOPIC TECHNIQUES APPLIED AT LASPEC
Since the end of the 1980's, when E.W. Otten published the review ”Nuclear Radii and Moments of Unstable Isotopes” by optical spectroscopy [Otte1989], the known laser techniques have been significantly developed, especially with respect to detection efficiency. In addition, new techniques have been introduced such as neutral atom traps, the laser ion source and optical spectroscopy in the laser ion source itself, laser spectroscopy in a storage ring [Seel1998], or accumulation, cooling and bunching of radioactive beams in ion traps [Herf2001b,Niem2001]. Still, collinear spectroscopy and resonance ionization (mass) spectrometry are the spectroscopic techniques that are most often applied. Both techniques are rather complimentary to each other. This is shown in Table 3 which gives a comparison of both methods with respect to sensitivity, applicability, generally applied lasers, resolution, and background. LaSpec is strongly based on the application of these two techniques in different realizations. In particular, collinear laser spectroscopy can be combined with a large variety of detection methods, many of them specialized to a group of elements. This is the basis of the continuing success of the collinear laser spectroscopy setups at ISOLDE and Jyväskylä over three decades.
Detection Scheme
The following detection schemes, among others, have been used successfully in the past and can - in principle - be also used at the LaSpec beamlines. Not all schemes will be addressed in this design report since they can be added using relatively small and simple extensions to the beamline.
Laser-Induced Fluorescence (LIF) Detection
The observation of fluorescence photons from the spontaneous emission after laser excitation is a standard technique. For the weak beams of radioactive isotopes one has to rely on single-photon counting using photomultipliers. As the laser frequency is very selective for a particular element, this “optical” detection is insensitive to contaminations of the beam by isobars. The main loss in efficiency of this detection technique arises from the limited solid angle of emission of photons from the pencil-shaped interaction region.
Background photons of laser light can pass through the interaction region and scatter in the direction of observation from small apertures and other components of the
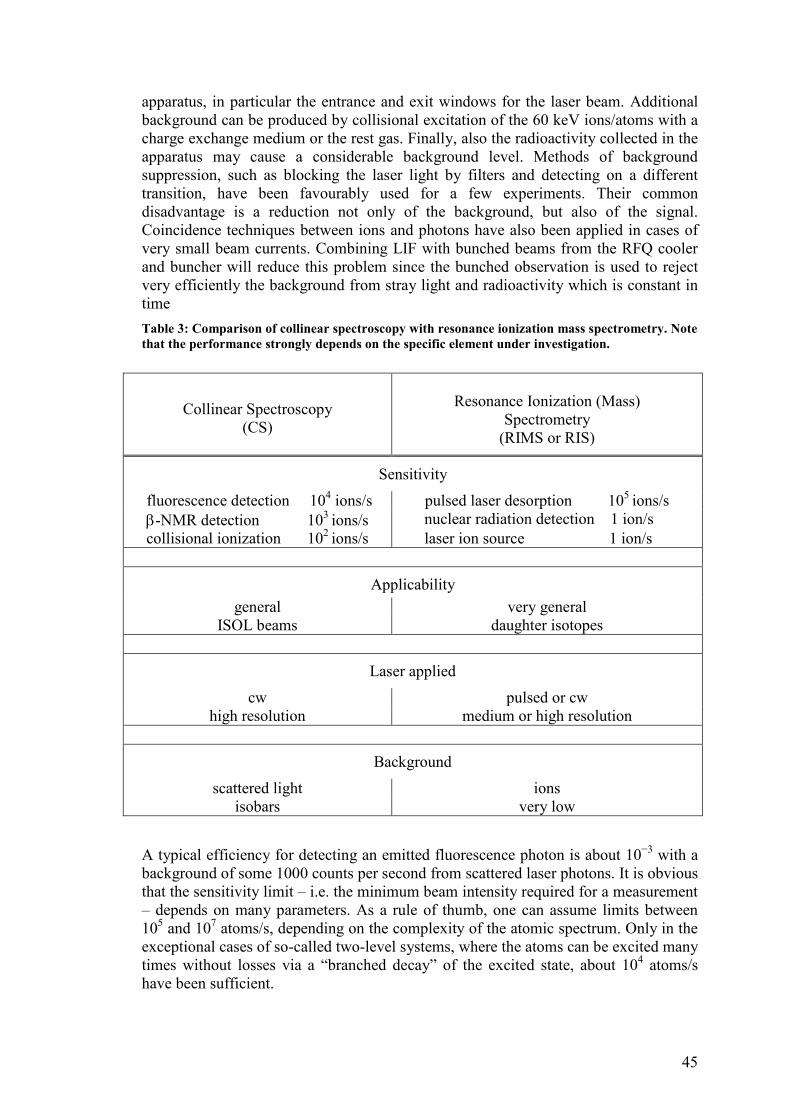
45
apparatus, in particular the entrance and exit windows for the laser beam. Additional background can be produced by collisional excitation of the 60 keV ions/atoms with a charge exchange medium or the rest gas. Finally, also the radioactivity collected in the apparatus may cause a considerable background level. Methods of background suppression, such as blocking the laser light by filters and detecting on a different transition, have been favourably used for a few experiments. Their common disadvantage is a reduction not only of the background, but also of the signal. Coincidence techniques between ions and photons have also been applied in cases of very small beam currents. Combining LIF with bunched beams from the RFQ cooler and buncher will reduce this problem since the bunched observation is used to reject very efficiently the background from stray light and radioactivity which is constant in time
Table 3: Comparison of collinear spectroscopy with resonance ionization mass spectrometry. Note that the performance strongly depends on the specific element under investigation.
A typical efficiency for detecting an emitted fluorescence photon is about 10−3 with a background of some 1000 counts per second from scattered laser photons. It is obvious that the sensitivity limit – i.e. the minimum beam intensity required for a measurement – depends on many parameters. As a rule of thumb, one can assume limits between 105 and 107 atoms/s, depending on the complexity of the atomic spectrum. Only in the exceptional cases of so-called two-level systems, where the atoms can be excited many times without losses via a “branched decay” of the excited state, about 104 atoms/s have been sufficient.
Collinear Spectroscopy (CS)
Resonance Ionization (Mass)
Spectrometry (RIMS or RIS)
Sensitivity
fluorescence detection 104 ions/s pulsed laser desorption 105 ions/s β-NMR detection 103 ions/s nuclear radiation detection 1 ion/s collisional ionization 102 ions/s laser ion source 1 ion/s
Applicability
general very general ISOL beams daughter isotopes
Laser applied
cw pulsed or cw high resolution medium or high resolution
Background
scattered light ions isobars very low
46
Non-optical Detection and High Sensitivity
Alternatives for an improved sensitivity to optical detection have been sought in unconventional detection schemes. The idea is to introduce processes that can distinguish between atoms that have or have not interacted with the laser light, and then to count either ions or atoms, or to detect their radioactive decay. The great advantage of the detection of massive particles is having the efficiency close to 100% without the problem of background from the laser light. 60 keV ions or neutral atoms impinging on a surface can be counted by secondary electron multiplication. For β-radioactivity one uses plastic scintillators with photomultipliers, and for α-particles silicon detectors which can even discriminate sharply between different decay energies. The key to a non-optical detection scheme is efficient optical pumping, i.e. the transfer of population from the initial to a final atomic state via repeated excitation and decay. For the detection one needs a process discriminating between these states. Several such schemes have been used very successfully in experiments. They are based on the state dependence of cross-sections of charge-changing collisions [Liev1992] or on the particular properties of the radioactive β-decay. The possible schemes depend very much on the properties of the atomic spectra and hence are rather specific for different classes of elements:
State-selective charge exchange [Silv1987]: singly-charged ions of alkaline earth and related elements that have 2S1/2 ground states and metastable 2D3/2,5/2 states below the excited 2P1/2,3/2 states which are reachable from the ground state. The transfer of population from the ground state to these metastable states can be detected by the use of a charge-exchange reaction that fulfils the resonance condition for the metastable state. Then the neutralized fraction of the beam is detected as a function of the laser frequency.
State-selective collisional ionization [Silv1987]: strongly bound neutral atoms, such as noble gases, for which the first excited states above the ground state can hardly be reached by cw lasers. Metastable states, about 4–5 eV below the ionization limit, are populated in the charge exchange process. They have cross-sections for ionization in collisions that are much larger than those of the low-lying ground state. Hence, optical pumping from the metastable state to the ground state gives rise to a decrease of the ionization rate when the (neutral) beam passes through a thin gas atmosphere (“gas target”).
β-Asymmetry detection: the excitation by circularly polarized light transfers angular momentum from the light field to the atomic system. This can be exploited for polarizable atoms by optical pumping between the Zeeman components of a particular level. If a nuclear spin I = 0 is involved, the nuclear spin is also polarized. Due to parity violation, the β-emission occurs preferentially along or against the spin direction. With the atoms implanted into a suitable host crystal, the β-decay asymmetry can serve as a detector for optical excitation.
Experimental Sections of LaSpec
The LaSpec collaboration intends to construct a number of complementary experimental devices which will provide a complete system with respect to the physics and isotopes that can be studied. The main components will be described in this Technical Design Report. Here, we will give only a short overview on the different techniques.
(a) Collinear laser spectroscopy on ions
Collinear laser spectroscopy of atoms and ions has been the workhorse for high-precision laser spectroscopy on short-lived isotopes for many years. Although the
47
absorption lines of ions are typically in the deep blue and ultraviolet regions of the spectrum, suitable laser light can often be produced and a highly robust and universal spectroscopy provided. Collinear ion spectroscopy on cooled and bunched beams has recently been demonstrated [Camp2002] and this variant of the technique will be immediately and powerfully applicable at the new facility. A new development applicable for the LaSpec collaboration involves optical pumping of cooled ions. This has been recently demonstrated within a radiofrequency quadrupole cooler-buncher device. With the use of a pulsed, high-repetition rate tunable laser system, this technique enables the manipulation of the population of ionic states to preferentially select a state from which an efficient transition may be chosen for collinear laser spectroscopy.
(b) Optical pumping and collinear laser spectroscopy on atoms
Ion beams can be efficiently neutralized by charge exchange processes (experimentally achieved using a beamline cell containing a low pressure alkali-metal vapour). This offers the possibility of laser spectroscopy on a fast beam of atoms, which have absorption wavelengths that are more readily accessible than those of ions. Different types of optical and particle detection will be employed. Polarized beams of atoms and ions can be produced by optical pumping. This opens the possibility of β-asymmetry detection and β-NMR.
(c) β-NMR
β-NMR is a well-established method for the determination of nuclear magnetic dipole and electric quadrupole moments. The technique has been especially favoured for light elements [Neug2000] but has also been applied to a range of cases where high precision has been required to explore the nuclear structure (such as measuring small admixtures of intruder components in a wavefunction). It combines optical pumping with nuclear magnetic resonance and β-decay asymmetry spectroscopy. Recently the method has been used to determine the quadrupole moment of 11Li to high accuracy using yields of only a few thousand ions/s [Neug2008]. The method can be used for all β-decaying (non-zero spin) isotopes with half-lives between approximately 5 ms and 20 s. Generally, β-NMR is able to deliver quadrupole moments with higher accuracy then those obtained from standard laser spectroscopy. However, laser spectroscopy and hyperfine structure investigations are necessarily the first step prior to attempting optical pumping.
(d) Resonance Ionization Laser Ion Source (RILIS)
Resonance ionization of atoms combined with the detection of the produced ions is a very efficient method in the study of rare isotopes [Payn1994]. During the last decade, it has been used for a broad range of applications, e.g., laser ion sources to produce ion species which were not accessible by other methods [Kost2003,Blau2003], in-source laser spectroscopy [Weiss2002b], and ultra-trace detection of cosmogenic and radio-toxic isotopes [Lu2003]. Its most prominent features are the efficient ionization process with resonant intermediate and autoionizing states, the elemental, isotopical, and sometimes even isomeric selectivity [Fedo2000] and the large detection efficiency for the produced, charged particles.
At the FAIR facility's Low Energy Branch (LEB), a resonance ionization laser ion
source (RILIS) will add to the selectivity inherent in the production method of the Super-FRS and ion catcher device. The RILIS will be used to enhance the production of isotopic (or even isomeric) enriched or pure ion beams. There are several possibilities to implement RILIS and they are closely related to the ion catcher device developments. A natural development to a laser ion source is the installation of a laser ion source trap
48
(LIST) [Blau2003]. This device may be coupled to the exit nozzle of the ion catcher. One possible design of a LIST is based on a typical segmented and gas-filled radio-frequency ion trap. Any neutral species that exit the ion catcher may be selectively ionized with counter propagating high-repetition rate pulsed lasers. All options are being actively pursued by members of the LaSpec collaboration and this development is closely related to that of the beam distribution working group of the LEB.
(e) Laser-Desorption Resonance Ionization Spectroscopy (LDRIS)
Radioactive ions or atoms can be deposited on an appropriate catcher, laser desorbed, and studied during a secondary (and resonant) laser ionization [Sauv2000]. When used in conjunction with Time-Of-Flight (TOF) mass-separation [Maul2004] and decay-tagged photo-ion detection an extremely sensitive spectroscopy can be achieved. For cases with very low production yields, the technique is superior to fluorescence detection. Such spectroscopy has previously, and notably, been used to study isotopes where the radioactive species was deposited in chemical or cluster form. It was also used for cases where the species of interest was not directly available but precursor nuclei could be deposited [LeBl1997]. At FAIR the technique will be applied to the study of heavy neutron-rich elements (Pb, Bi, Pt, Au…) and will provide an opportunity to extend the investigation of these elements beyond the neutron-deficient cases previously studied at ISOLDE [LeBl1997,LeBl1999,Fedo2003,Andr2002,DeWi2004].
(f) Spectroscopy in an Electron Beam Ion Trap (EBIT)
Spectroscopy of highly-charged ions inside an EBIT is an interesting option for the LaSpec collaboration. It can be performed in collaboration with the MATS group as an EBIT is an integral part of their experimental set-up. The spectroscopy will study ground state properties of nuclei via, for example, precision measurements of the hyperfine splitting of the atomic ground state, and will provide stringent tests of QED in strong electric and magnetic fields.
As the varying experimental approaches place different demands on the experimental station we propose to build two beamlines. A short beamline for collinear laser spectroscopy of ions will be optimized for the best vacuum conditions and minimal laser scattering. A second, longer beamline will be used for optical pumping of ions and atoms. This line will house the charge exchange cell and the β-NMR station.
The LaSpec collaboration has sought to, and has succeeded in, gathering a collection of
members expert in each of the spectroscopic fields. The opportunities offered by a universal laser facility at LEB will be met by this strong and varied collaboration. Resonance ionization in the gas cell (d) is not included in this TDR since its applicability and implementation depends strongly on the final design of the gas catcher which is currently under development. Laser desorption and resonance ionization is also not discussed in detail, since a commercial time of flight machine will be used that exists at the University of Mainz and will be simply attached to the collinear beamline for ions with small modifications. Hence, here it is mainly required to keep the option to install this apparatus as well as other experiments (e.g. ion traps for special dedicated experiments) at this place. Finally, the option (f) of laser spectroscopy in the EBIT is not part of this TDR since it has not been included in the costbook. Hence, only the main sections of LaSpec, i.e. the two beamlines and the setup for β-asymmetry detection and β-NMR, which will be permanently installed at the low-energy branch, will be described in detail in the following chapters.
49
1.4 PERFORMANCE AND APPLICABILITY OF LASPEC
Why install LaSpec at the FAIR facility?
Laser spectroscopy has been performed in many regions of the nuclear chart (see Figure 10) but still there are areas in which important nuclear ground-state data is missing. So far, on-line laser spectroscopy was mainly performed at ISOL facilities because the radioactive ion beams delivered by those have moderate energy (some 10 keV) and low emittance. This is a prerequisite for highly accurate and efficient laser spectroscopy. The application of stopping gas cells at in-flight facilities [Sava2001,Schw2003a] opened the rich world of fragmented beams for low-energy nuclear ground-state measurements. The Super-FRS at FAIR with its intense primary beams of high-energy will allow for the production of short-lived isotopes far from stability which are not accessible elsewhere [Auma2007]. In a similar motivation for MATS, the main regions where LaSpec will have unique possibilities due to its installation at the FAIR facility are those of very neutron rich nuclei and nuclides of elements that are not produced at ISOL facilities, e.g. refractory elements. Laser spectroscopy measurement program for radionuclides worldwide (“competition”): Extremely successful programmes of laser spectroscopy have continued throughout the past decade at the collinear laser beamlines of ISOLDE and Jyväskylä. New results from these facilities has spurred a renewed interest in such experiments and new laser spectroscopy setups are being built or planned at several institutes worldwide. Figure 11 gives an (probably incomplete) overview on the different facilities worldwide. Some setups are very specialized in their experiments and we will mention here only those who will be able to address a large fraction of the nuclear chart and which might be in competition with the LaSpec set-up. First of all, there are the collinear laser spectroscopy stations at ISOLDE and Jyväskylä, where the successful work will be continued. The collinear setup at TRIUMF (Vancouver) has so far mainly being used for solid-state investigations using polarized beams of 8Li and - most recently - 11Be, but a program towards more work on nuclear ground-state properties exists. There are plans to improve the accuracy of the nuclear moments of the halo nucleus 11Li. However, currently the production at TRIUMF is mainly focused in the region of very light nuclei. Collinear laser beamlines are planned at MSU (East Lansing), ANL (Argonne), ALTO, GANIL, and at Mainz. Different production techniques will be applied at these facilities, thus, they are often complementary. While MSU will use fragmentation reactions, the CARIBU project at ANL will employ a strong spontaneous fission source of 252Cf. At ALTO photofission of 238U is used and at the research reactor TRIGA-MAINZ, neutron-induced fission of 235U or 249Cf will be exploited. The TRIGA-LASER setup in Mainz is actually the forerunner and prototype of the LaSpec beamlines and will be transported or copied to FAIR as soon as beam from the Super-FRS is available.
At GANIL with the SPIRAL2 project, three different techniques to produce the radioactive ion beams are under investigation: (1) neutron-induced fission of uranium carbide, (2) direct interaction of deuterons in a uranium carbide target, and (3) interaction of a heavy ion beam with a target. Furthermore, at RIKEN [Naka2002], the first impressive results on laser spectroscopy of radioactive beryllium ions produced from in-flight fragmentation that are slowed down and trapped in a linear Paul trap were reported [Naka2006,Okad2008]. Last but not least, measurements on specialized areas of the nuclear chart are planned at SHIPTRAP [Dill2000] and HITRAP [Quin2000] at GSI, KVI Groningen, and the MAFF facility at the FRMII reactor at Munich [Kest2002].
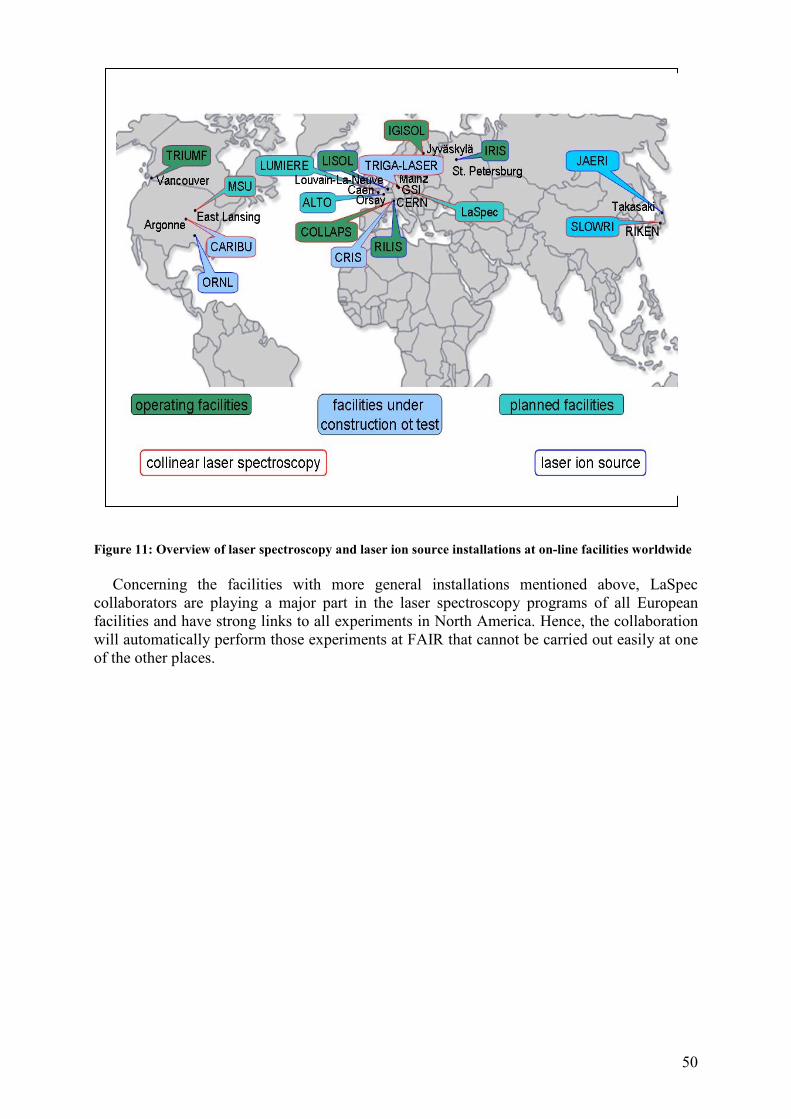
50
Figure 11: Overview of laser spectroscopy and laser ion source installations at on-line facilities worldwide
Concerning the facilities with more general installations mentioned above, LaSpec collaborators are playing a major part in the laser spectroscopy programs of all European facilities and have strong links to all experiments in North America. Hence, the collaboration will automatically perform those experiments at FAIR that cannot be carried out easily at one of the other places.

51
2. THE COMMON BEAMLINE
The beamline includes the common low energy beam transport (A in Figure 12) of ions from the gas catcher to the MATS and LaSpec setups, starting with the injection into the RFQ cooler and buncher and followed by a switchyard where the beam line splits up into the dedicated experimental beam lines of MATS and LaSpec represented by (B) and (C) respectively in Figure 12. While the common beam line has to accommodate the requirements of both setups, the experimental beam lines after the switchyard are tailored to the application of Penning trap mass spectrometry and laser spectroscopy. The different components and the ion optical elements associated are outlined in the following and described in detail in this manuscript.
(A) Common beam line A.1 the buncher section
- including an MCP/FC for the incoming beam, - ion optics (Einzel lens and deflector) to feed the buncher, - ion optics (Einzel lens and deflector) after the extraction from the buncher, - an MCP/FC detector to monitor the extracted bunch, - and the ion optics to transfer into the switchyard
A.2 A multi-reflection time-of-flight mass spectrometer - here, additional mass separation, including isobar separation, and ion
identification and mass measurements can be performed. A.3 The switchyard section
- here the ion beam is deflected to the appropriate branch (B) MATS beam line B.1 The EBIT junction
- including an MCP/FC for the incoming beam from the switchyard, - ion optics (Einzel lens and deflector) to feed the quadrupole bender, - the interface to the EBIT and the m/q selection - ion optics (Einzel lens and deflector) after the extraction from the bender, - an MCP/FC detector to monitor the extracted beam, - and the ion optics to transfer into the elevator section
B.2 The carbon cluster off-line ion source - ion optics (Einzel lens and deflector) to feed the quadrupole bender, - ion optics (Einzel lens and deflector) after the bender, - an MCP/FC detector to monitor the extracted beam, - and the ion optics to transfer into the lift tube
B.3 The PPT section (Preparation Penning Trap) - ion optics (Einzel lens and deflector) for the transfer into the magnet - the Precision Penning Trap - the final detector section with a delay line detector.
B.4 The MPT section (Measurement Penning Trap) - including an MCP/FC for the incoming beam, - ion optics (Einzel lens and deflector) to transfer into the magnet - ion optics to transfer into the upper detector section - lift tube including an MCP/FC detector to monitor the beam and ion optics (Einzel lens and deflector).
(C) LaSpec beam line
C.1 Common supply beamline - including an MCP/FC for the incoming beam from the switchyard.

52
- an optional pulsed drift tube for deceleration of the ions into an optional second rf section.
- an optional low pressure buncher for precise voltage determination of the ion potentials.
- a switchyard for injection into the ion or atom beam line. C.2 Ion beam line - including an MCP/FC for the incoming beam from the LaSpec switchyard
- a pair of horizontal and vertical steerers - a quadrupole triplet for laser - ion beam matching - diagnostics module containing fork scanner and retractable MCP/FC - dedicated light collection modules - diagnostics module containing fork scanner and retractable MCP/FC - laser entrance optics
C.3 Atom beam line - including an MCP/FC for the incoming beam from the LaSpec switchyard - quadrupole doublet for beam shaping and focusing
- laser entrance optics - deflector chamber for horizontal 10° deflection to overlap ion beam with laser beam - retractable FC and fork scanner for alignment and ion beam shape monitoring after deflection - quadrupole doublet and steerer plates for beam shaping and focusing into charge exchange cell and detection region
- deceleration stage for fine Doppler-tuning of the ion velocity - deflector unit for suppression of non-neutralized primary ions - dedicated light collection modules - fork scanner for beam profile monitoring - retractable MCP/FC detector to monitor the neutralized beam
- laser entrance optics C.4 Beta-NMR setup - including the beta-NMR magnet - the magnet power supply - vacuum chamber
- cold finger
D Setup for nuclear spectroscopy -Total absorption spectroscopy -Neutron decay probabilities -Neutron time-of-flight spectrometry
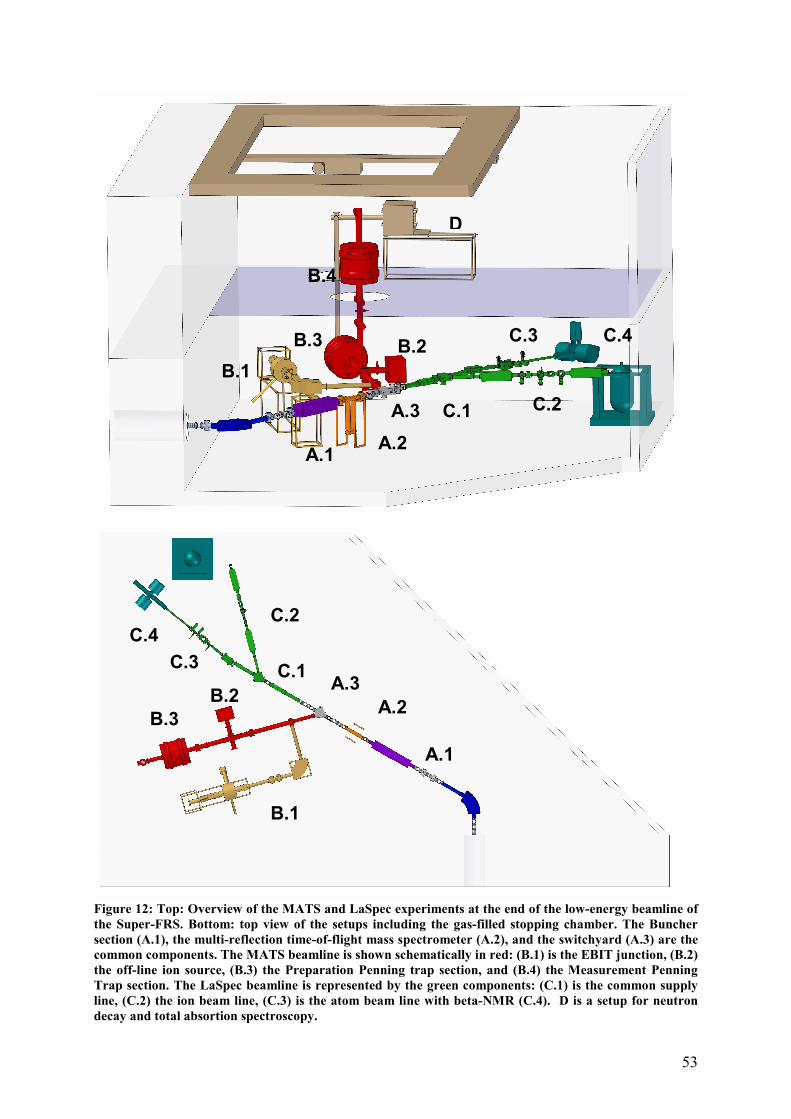
53
Figure 12: Top: Overview of the MATS and LaSpec experiments at the end of the low-energy beamline of the Super-FRS. Bottom: top view of the setups including the gas-filled stopping chamber. The Buncher section (A.1), the multi-reflection time-of-flight mass spectrometer (A.2), and the switchyard (A.3) are the common components. The MATS beamline is shown schematically in red: (B.1) is the EBIT junction, (B.2) the off-line ion source, (B.3) the Preparation Penning trap section, and (B.4) the Measurement Penning Trap section. The LaSpec beamline is represented by the green components: (C.1) is the common supply line, (C.2) the ion beam line, (C.3) is the atom beam line with beta-NMR (C.4). D is a setup for neutron decay and total absortion spectroscopy.
B.1
B.2
B.3
A.1
A.2
A.3 C.1
C.2
C.3
C.4
A.1 A.2
A.3
B.1
B.2 B.3
B.4
C.1 C.2
C.3 C.4
D

54
2.1. REQUIREMENTS TO THE BEAM FROM THE GAS CELL
The gas catcher of the Super-FRS will provide a continuous ion beam which will be
injected into and transported through a radiofrequency (rf) multipole device, before being extracted and accelerated to several 10s of keV in a region of high vacuum. The choice of multipole element is likely to be that of a sextupole (SPIG) structure, motivated by the capability to transport higher beam currents compared to that of a more commonly used rf quadrupole [Karv2008]. Following the rf sextupole, the ions are accelerated to the full potential set by the extractor electrode which is positioned close (a few cm) to the end electrode of the SPIG. The energy spread of the ion beam is expected to be ~1 eV and the emittance a few π mm mrads.
2.2 SPECIFICATIONS OF THE SEPARATOR MAGNET
In order to separate the ion beam into individual mass numbers, a modest mass resolving power is needed, of the order M/∆M = 500. This will be provided by a double-focussing 60° dipole magnet. A similar mass separator system exists at the IGISOL facility, Jyväskylä, and can be used as a template for the proposed system. Two Einzel lenses are used to form a parallel beam at the entrance of the separator magnet. The double-focussing magnet separates the ion beam according to mass and refocuses the beams both in the horizontal and vertical direction to practically coinciding focal planes ~2 m downstream which are inclined by 24° to the central plane. The maximum magnetic field of the JYFL magnet is 0.45 Tesla and it has a bending radius of R = 1500 mm. Depending on the conditions of the ion source the MRP may far exceed the 500 suggested above. Beam diagnostics will be provided in the focal plane region of the magnet, including a moveable Faraday cup, Si detector and possible slit system. Following the focal plane, a standard beam line transports the CW ion beam towards the RFQ cooler and buncher, discussed in Section 2.4. ION BEAM COOLER AND BUNCHER
2.3 ION DETECTION IN THE COMMON BEAM LINE
For the detection of the radioactive ion beam behind the bending magnet, two detector arrangements will be considered: a tape station and a Faraday cup mounted together with a Micro-Channel Plate detector. Both are described in the following:
2.3.1 TAPE STATION
In addition to beam scanners and Faraday cups which will be used to monitor the position and intensity of the ion beam delivered by the Super-FRS and thermalized in a gas-filled stopping chamber, a tape-station system as shown in Figure 13 is foreseen as a diagnostics tool to measure the beam composition before entering the RFQ cooler and buncher. This will give information for the operation of both experimental setups MATS and LaSpec.
The tape station has to operate in an "in-beam" mode, i.e. the ion beam is normally
passing the collection point and only for the operation of the tape station the ion beam is deflected on the tape by use of an electrostatic bender element. The ion beam must have more than 10 keV kinetic energy in order to implant the short-lived ions in the tape surface. After collecting the required amount of activity on the tape (depending on the half-life of the ions and the intensity), it is moved to the measurement point where either beta or gamma decays
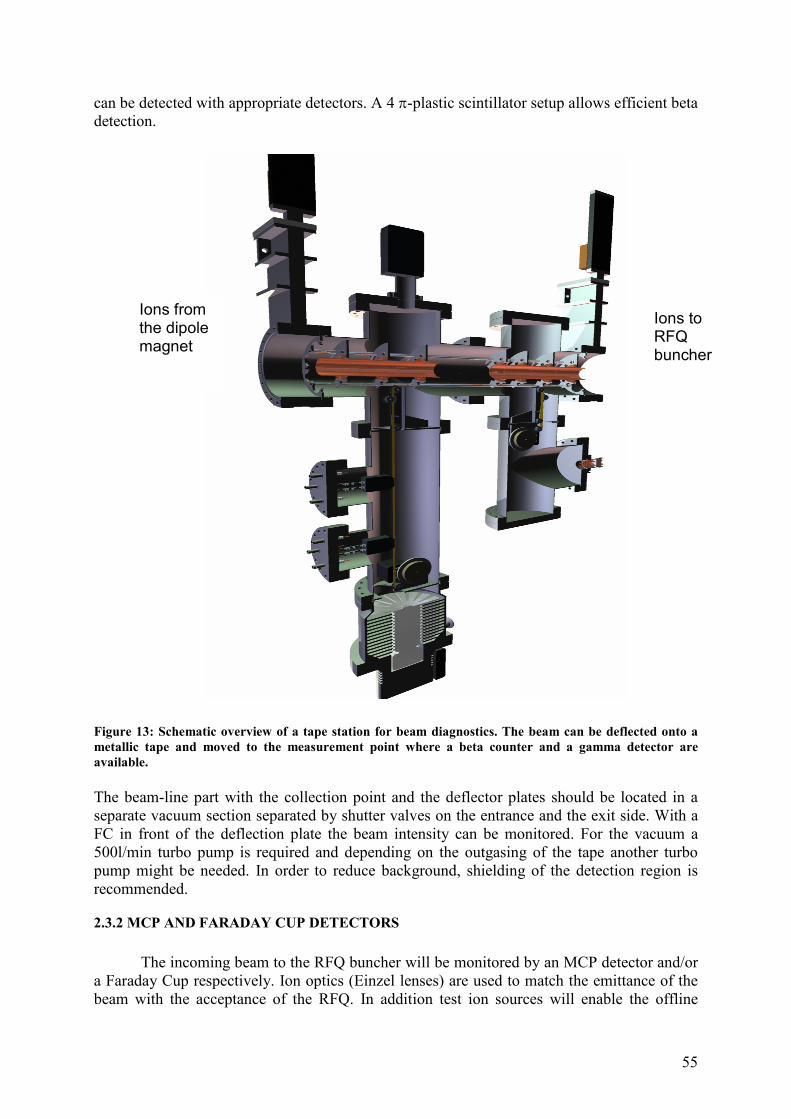
55
can be detected with appropriate detectors. A 4 π-plastic scintillator setup allows efficient beta detection. Figure 13: Schematic overview of a tape station for beam diagnostics. The beam can be deflected onto a metallic tape and moved to the measurement point where a beta counter and a gamma detector are available. The beam-line part with the collection point and the deflector plates should be located in a separate vacuum section separated by shutter valves on the entrance and the exit side. With a FC in front of the deflection plate the beam intensity can be monitored. For the vacuum a 500l/min turbo pump is required and depending on the outgasing of the tape another turbo pump might be needed. In order to reduce background, shielding of the detection region is recommended.
2.3.2 MCP AND FARADAY CUP DETECTORS
The incoming beam to the RFQ buncher will be monitored by an MCP detector and/or a Faraday Cup respectively. Ion optics (Einzel lenses) are used to match the emittance of the beam with the acceptance of the RFQ. In addition test ion sources will enable the offline
Ions from the dipole magnet
Ions to RFQ buncher
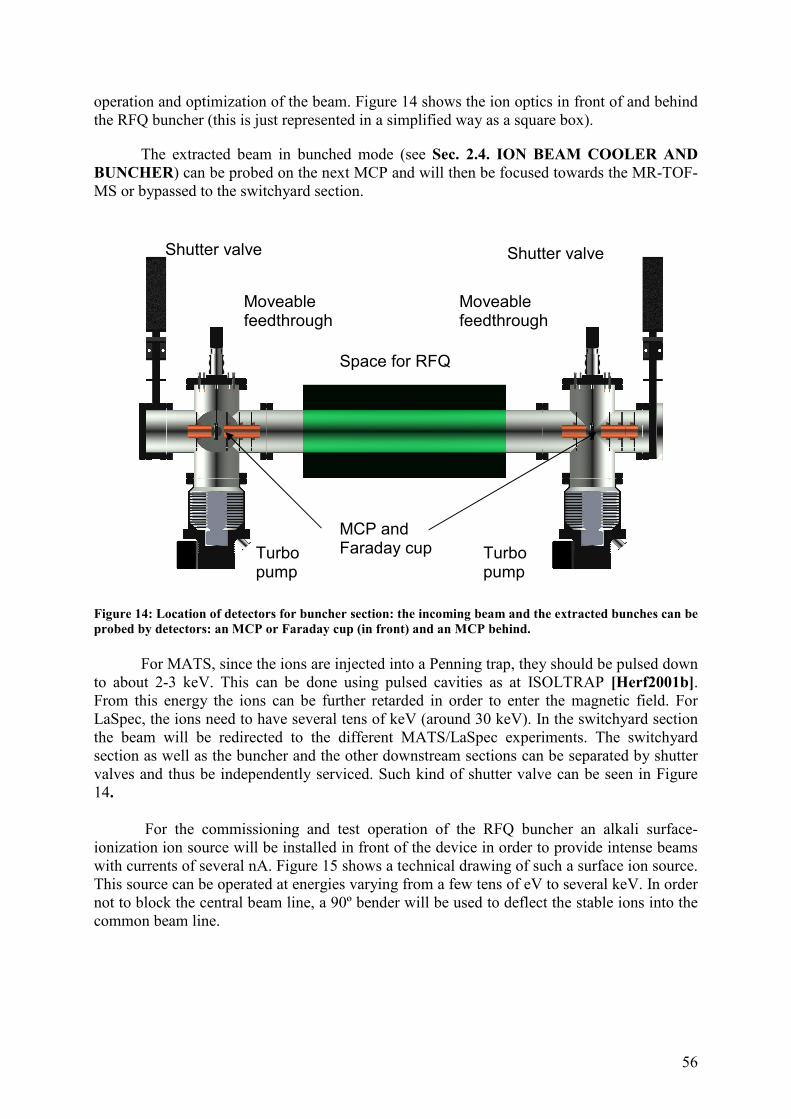
56
operation and optimization of the beam. Figure 14 shows the ion optics in front of and behind the RFQ buncher (this is just represented in a simplified way as a square box).
The extracted beam in bunched mode (see Sec. 2.4. ION BEAM COOLER AND BUNCHER) can be probed on the next MCP and will then be focused towards the MR-TOF-MS or bypassed to the switchyard section.
Figure 14: Location of detectors for buncher section: the incoming beam and the extracted bunches can be probed by detectors: an MCP or Faraday cup (in front) and an MCP behind.
For MATS, since the ions are injected into a Penning trap, they should be pulsed down to about 2-3 keV. This can be done using pulsed cavities as at ISOLTRAP [Herf2001b]. From this energy the ions can be further retarded in order to enter the magnetic field. For LaSpec, the ions need to have several tens of keV (around 30 keV). In the switchyard section the beam will be redirected to the different MATS/LaSpec experiments. The switchyard section as well as the buncher and the other downstream sections can be separated by shutter valves and thus be independently serviced. Such kind of shutter valve can be seen in Figure 14.
For the commissioning and test operation of the RFQ buncher an alkali surface-
ionization ion source will be installed in front of the device in order to provide intense beams with currents of several nA. Figure 15 shows a technical drawing of such a surface ion source. This source can be operated at energies varying from a few tens of eV to several keV. In order not to block the central beam line, a 90º bender will be used to deflect the stable ions into the common beam line.
Turbo pump
Turbo pump
Shutter valve Shutter valve
Moveable feedthrough
Moveable feedthrough
Space for RFQ
MCP and Faraday cup
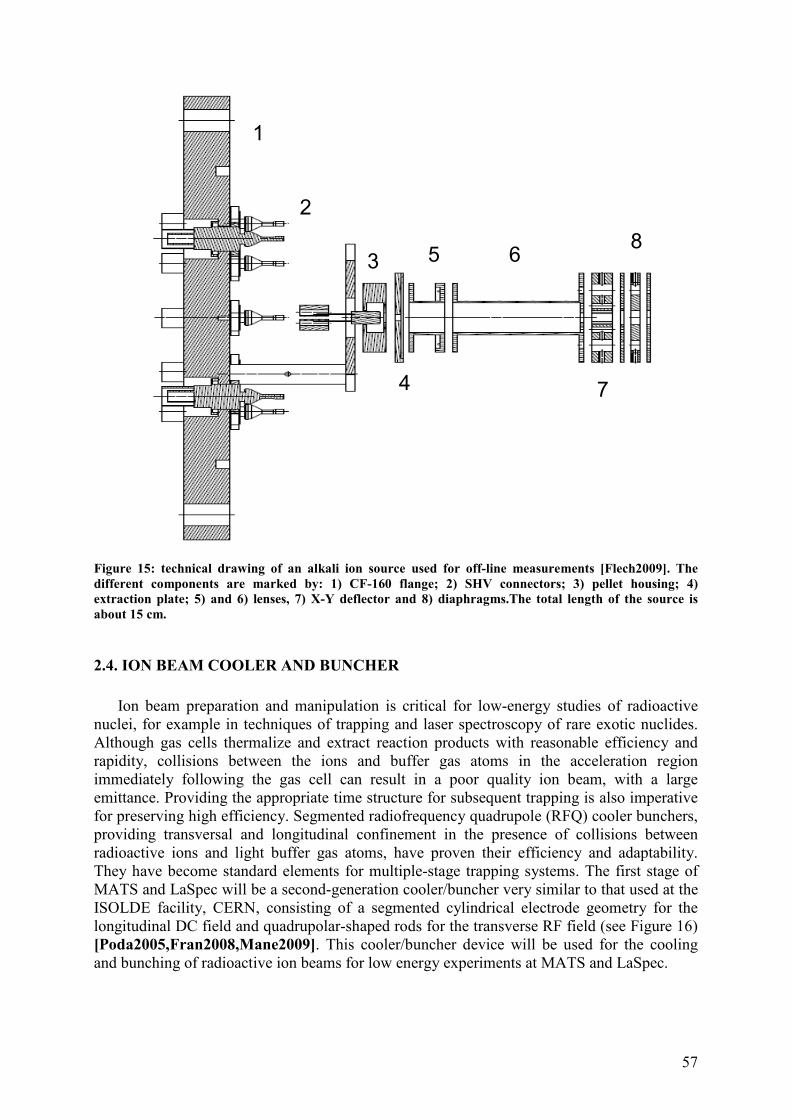
57
Figure 15: technical drawing of an alkali ion source used for off-line measurements [Flech2009]. The different components are marked by: 1) CF-160 flange; 2) SHV connectors; 3) pellet housing; 4) extraction plate; 5) and 6) lenses, 7) X-Y deflector and 8) diaphragms.The total length of the source is about 15 cm.
2.4. ION BEAM COOLER AND BUNCHER
Ion beam preparation and manipulation is critical for low-energy studies of radioactive
nuclei, for example in techniques of trapping and laser spectroscopy of rare exotic nuclides. Although gas cells thermalize and extract reaction products with reasonable efficiency and rapidity, collisions between the ions and buffer gas atoms in the acceleration region immediately following the gas cell can result in a poor quality ion beam, with a large emittance. Providing the appropriate time structure for subsequent trapping is also imperative for preserving high efficiency. Segmented radiofrequency quadrupole (RFQ) cooler bunchers, providing transversal and longitudinal confinement in the presence of collisions between radioactive ions and light buffer gas atoms, have proven their efficiency and adaptability. They have become standard elements for multiple-stage trapping systems. The first stage of MATS and LaSpec will be a second-generation cooler/buncher very similar to that used at the ISOLDE facility, CERN, consisting of a segmented cylindrical electrode geometry for the longitudinal DC field and quadrupolar-shaped rods for the transverse RF field (see Figure 16) [Poda2005,Fran2008,Mane2009]. This cooler/buncher device will be used for the cooling and bunching of radioactive ion beams for low energy experiments at MATS and LaSpec.
1
2
3
4
5 6
7
8
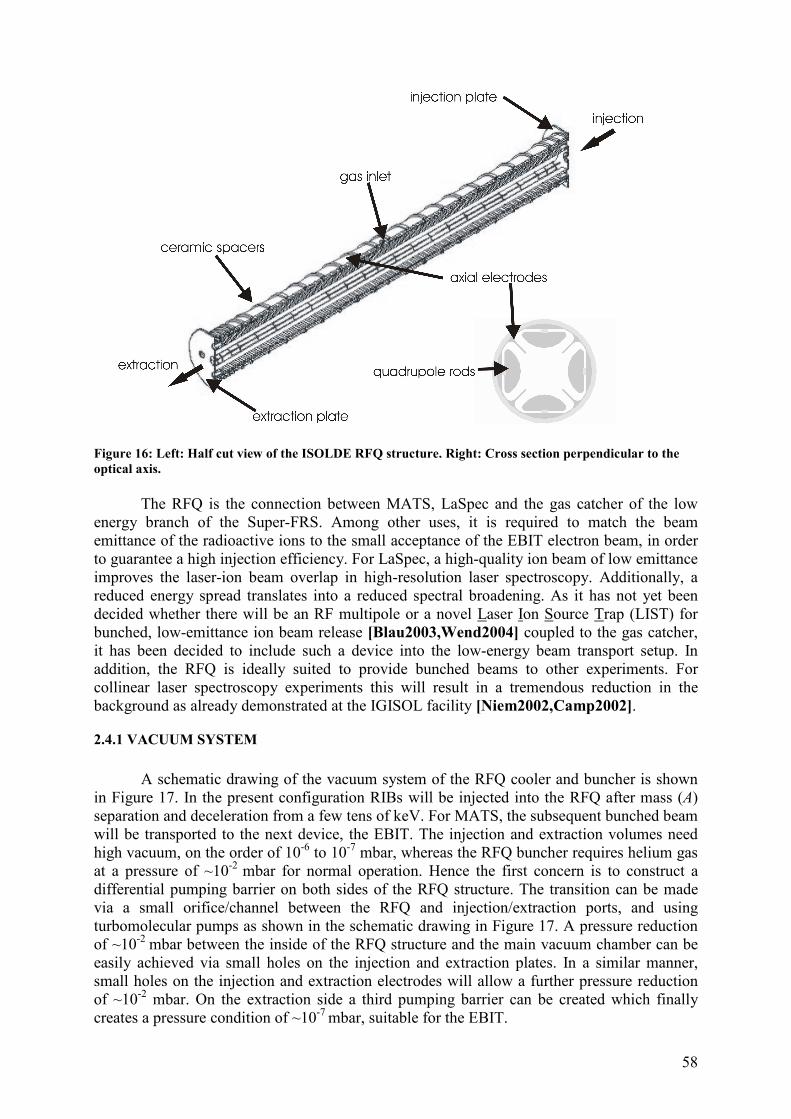
58
Figure 16: Left: Half cut view of the ISOLDE RFQ structure. Right: Cross section perpendicular to the optical axis.
The RFQ is the connection between MATS, LaSpec and the gas catcher of the low energy branch of the Super-FRS. Among other uses, it is required to match the beam emittance of the radioactive ions to the small acceptance of the EBIT electron beam, in order to guarantee a high injection efficiency. For LaSpec, a high-quality ion beam of low emittance improves the laser-ion beam overlap in high-resolution laser spectroscopy. Additionally, a reduced energy spread translates into a reduced spectral broadening. As it has not yet been decided whether there will be an RF multipole or a novel Laser Ion Source Trap (LIST) for bunched, low-emittance ion beam release [Blau2003,Wend2004] coupled to the gas catcher, it has been decided to include such a device into the low-energy beam transport setup. In addition, the RFQ is ideally suited to provide bunched beams to other experiments. For collinear laser spectroscopy experiments this will result in a tremendous reduction in the background as already demonstrated at the IGISOL facility [Niem2002,Camp2002].
2.4.1 VACUUM SYSTEM
A schematic drawing of the vacuum system of the RFQ cooler and buncher is shown
in Figure 17. In the present configuration RIBs will be injected into the RFQ after mass (A) separation and deceleration from a few tens of keV. For MATS, the subsequent bunched beam will be transported to the next device, the EBIT. The injection and extraction volumes need high vacuum, on the order of 10-6 to 10-7 mbar, whereas the RFQ buncher requires helium gas at a pressure of ~10-2 mbar for normal operation. Hence the first concern is to construct a differential pumping barrier on both sides of the RFQ structure. The transition can be made via a small orifice/channel between the RFQ and injection/extraction ports, and using turbomolecular pumps as shown in the schematic drawing in Figure 17. A pressure reduction of ~10-2 mbar between the inside of the RFQ structure and the main vacuum chamber can be easily achieved via small holes on the injection and extraction plates. In a similar manner, small holes on the injection and extraction electrodes will allow a further pressure reduction of ~10-2 mbar. On the extraction side a third pumping barrier can be created which finally creates a pressure condition of ~10-7 mbar, suitable for the EBIT.
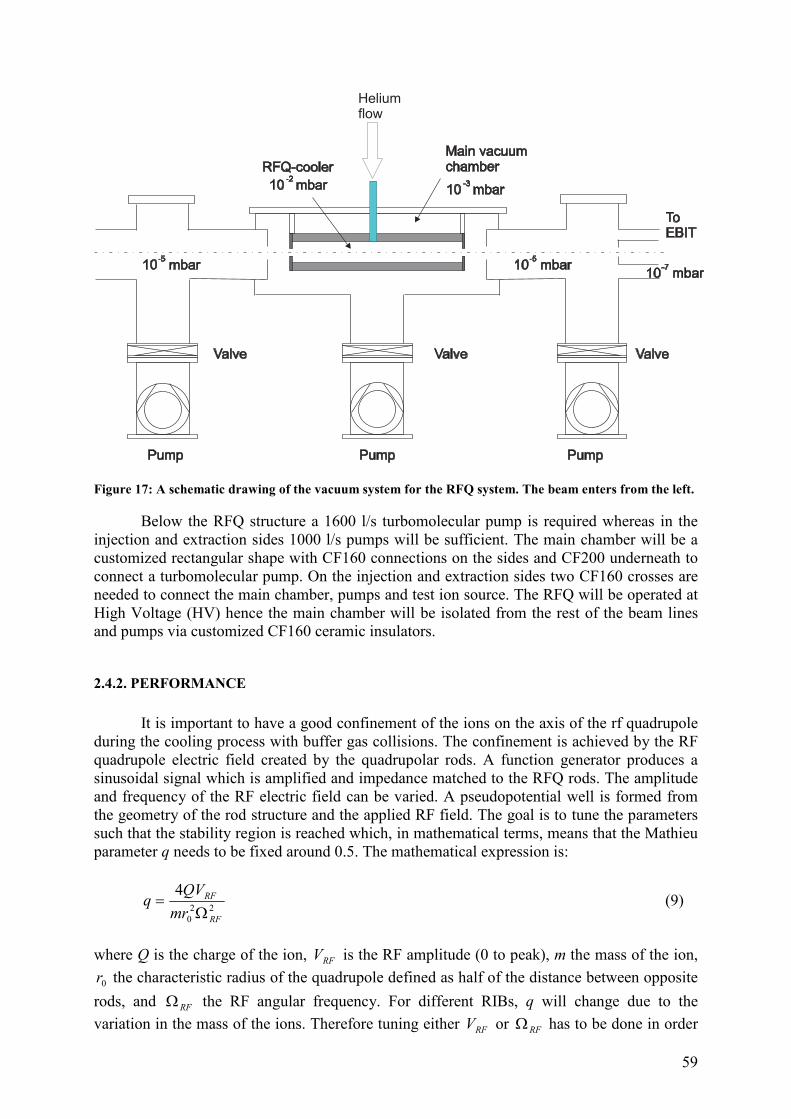
59
Pump Pump Pump
Valve Valve Valve
RFQ-coolerMain vacuumchamber
ToEBIT
10 mbar-710 mbar
-5
10 mbar-310 mbar
-2
Heliumflow
10 mbar-5
Figure 17: A schematic drawing of the vacuum system for the RFQ system. The beam enters from the left.
Below the RFQ structure a 1600 l/s turbomolecular pump is required whereas in the injection and extraction sides 1000 l/s pumps will be sufficient. The main chamber will be a customized rectangular shape with CF160 connections on the sides and CF200 underneath to connect a turbomolecular pump. On the injection and extraction sides two CF160 crosses are needed to connect the main chamber, pumps and test ion source. The RFQ will be operated at High Voltage (HV) hence the main chamber will be isolated from the rest of the beam lines and pumps via customized CF160 ceramic insulators.
2.4.2. PERFORMANCE
It is important to have a good confinement of the ions on the axis of the rf quadrupole
during the cooling process with buffer gas collisions. The confinement is achieved by the RF quadrupole electric field created by the quadrupolar rods. A function generator produces a sinusoidal signal which is amplified and impedance matched to the RFQ rods. The amplitude and frequency of the RF electric field can be varied. A pseudopotential well is formed from the geometry of the rod structure and the applied RF field. The goal is to tune the parameters such that the stability region is reached which, in mathematical terms, means that the Mathieu parameter q needs to be fixed around 0.5. The mathematical expression is:
220
4
RF
RF
mr
QVq
Ω= (9)
where Q is the charge of the ion, RFV is the RF amplitude (0 to peak), m the mass of the ion,
0r the characteristic radius of the quadrupole defined as half of the distance between opposite
rods, and RFΩ the RF angular frequency. For different RIBs, q will change due to the
variation in the mass of the ions. Therefore tuning either RFV or RFΩ has to be done in order
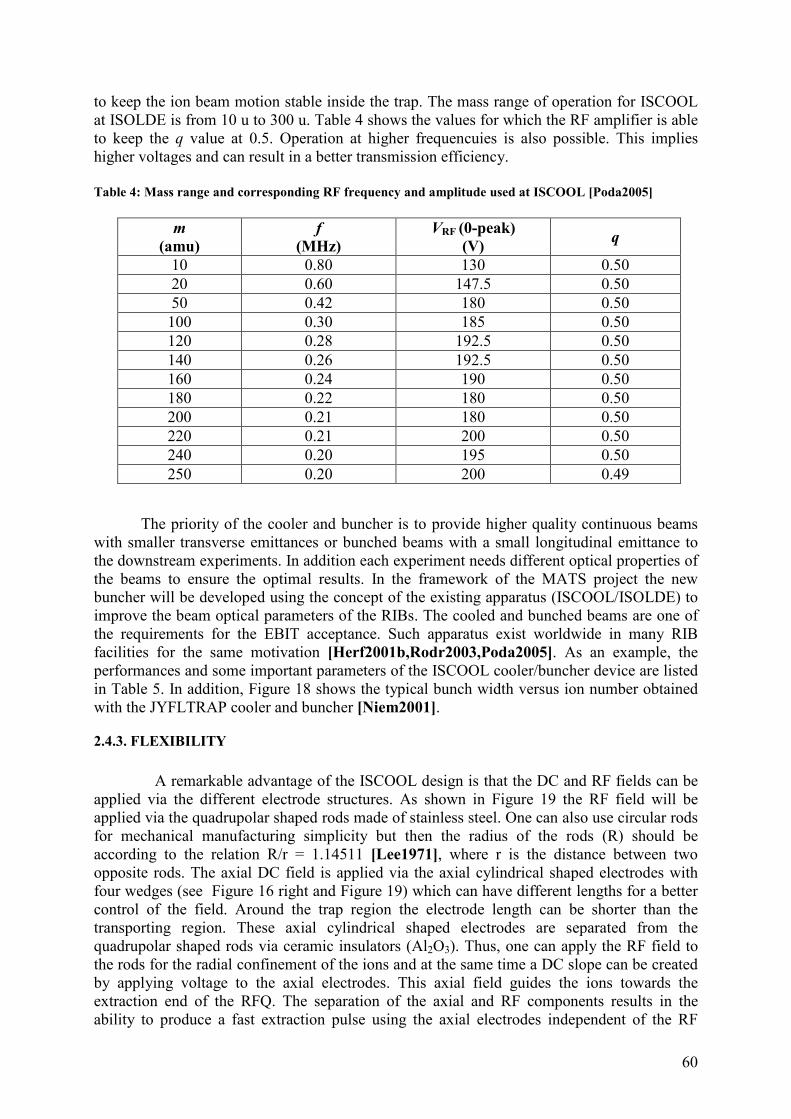
60
to keep the ion beam motion stable inside the trap. The mass range of operation for ISCOOL at ISOLDE is from 10 u to 300 u. Table 4 shows the values for which the RF amplifier is able to keep the q value at 0.5. Operation at higher frequencuies is also possible. This implies higher voltages and can result in a better transmission efficiency. Table 4: Mass range and corresponding RF frequency and amplitude used at ISCOOL [Poda2005]
m
(amu) f
(MHz) VRF (0-peak)
(V) q
10 0.80 130 0.50 20 0.60 147.5 0.50 50 0.42 180 0.50 100 0.30 185 0.50 120 0.28 192.5 0.50 140 0.26 192.5 0.50 160 0.24 190 0.50 180 0.22 180 0.50 200 0.21 180 0.50 220 0.21 200 0.50 240 0.20 195 0.50 250 0.20 200 0.49
The priority of the cooler and buncher is to provide higher quality continuous beams with smaller transverse emittances or bunched beams with a small longitudinal emittance to the downstream experiments. In addition each experiment needs different optical properties of the beams to ensure the optimal results. In the framework of the MATS project the new buncher will be developed using the concept of the existing apparatus (ISCOOL/ISOLDE) to improve the beam optical parameters of the RIBs. The cooled and bunched beams are one of the requirements for the EBIT acceptance. Such apparatus exist worldwide in many RIB facilities for the same motivation [Herf2001b,Rodr2003,Poda2005]. As an example, the performances and some important parameters of the ISCOOL cooler/buncher device are listed in Table 5. In addition, Figure 18 shows the typical bunch width versus ion number obtained with the JYFLTRAP cooler and buncher [Niem2001].
2.4.3. FLEXIBILITY
A remarkable advantage of the ISCOOL design is that the DC and RF fields can be applied via the different electrode structures. As shown in Figure 19 the RF field will be applied via the quadrupolar shaped rods made of stainless steel. One can also use circular rods for mechanical manufacturing simplicity but then the radius of the rods (R) should be according to the relation R/r = 1.14511 [Lee1971], where r is the distance between two opposite rods. The axial DC field is applied via the axial cylindrical shaped electrodes with four wedges (see Figure 16 right and Figure 19) which can have different lengths for a better control of the field. Around the trap region the electrode length can be shorter than the transporting region. These axial cylindrical shaped electrodes are separated from the quadrupolar shaped rods via ceramic insulators (Al2O3). Thus, one can apply the RF field to the rods for the radial confinement of the ions and at the same time a DC slope can be created by applying voltage to the axial electrodes. This axial field guides the ions towards the extraction end of the RFQ. The separation of the axial and RF components results in the ability to produce a fast extraction pulse using the axial electrodes independent of the RF
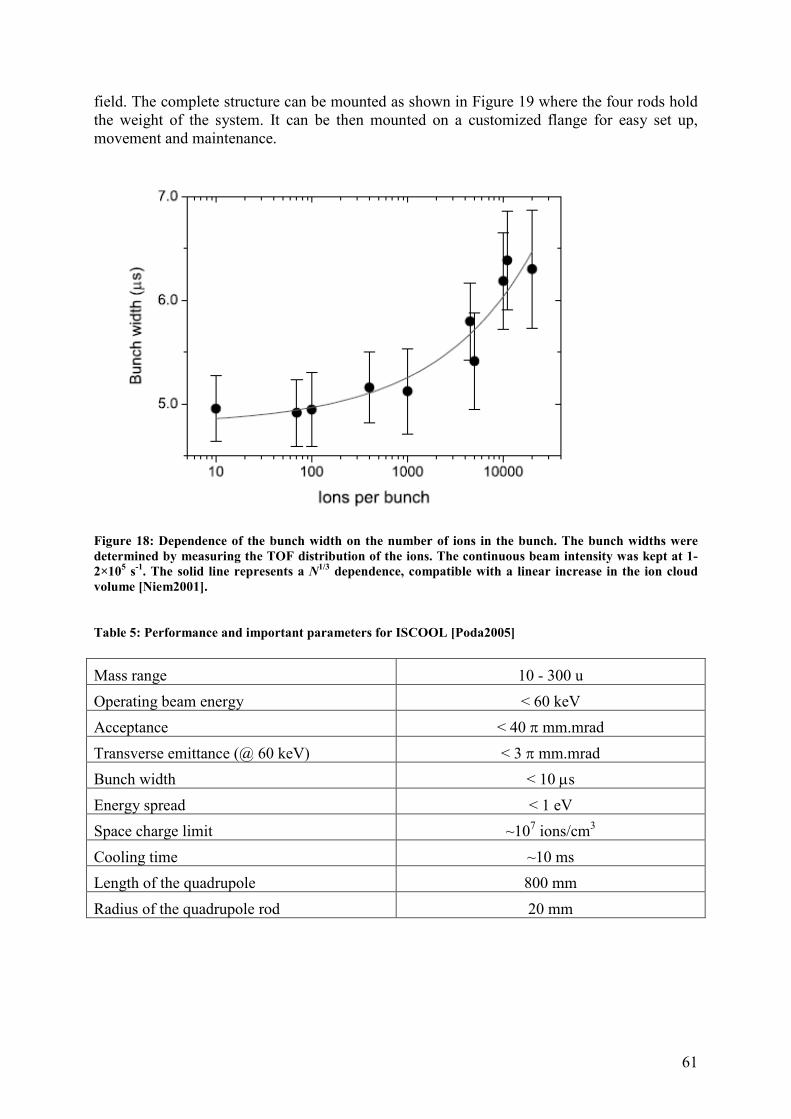
61
field. The complete structure can be mounted as shown in Figure 19 where the four rods hold the weight of the system. It can be then mounted on a customized flange for easy set up, movement and maintenance.
Figure 18: Dependence of the bunch width on the number of ions in the bunch. The bunch widths were determined by measuring the TOF distribution of the ions. The continuous beam intensity was kept at 1-2×10⁵ s-1. The solid line represents a N1/3 dependence, compatible with a linear increase in the ion cloud volume [Niem2001]. Table 5: Performance and important parameters for ISCOOL [Poda2005]
Mass range 10 - 300 u
Operating beam energy < 60 keV
Acceptance < 40 π mm.mrad
Transverse emittance (@ 60 keV) < 3 π mm.mrad
Bunch width < 10 µs
Energy spread < 1 eV
Space charge limit ~107 ions/cm3
Cooling time ~10 ms
Length of the quadrupole 800 mm
Radius of the quadrupole rod 20 mm
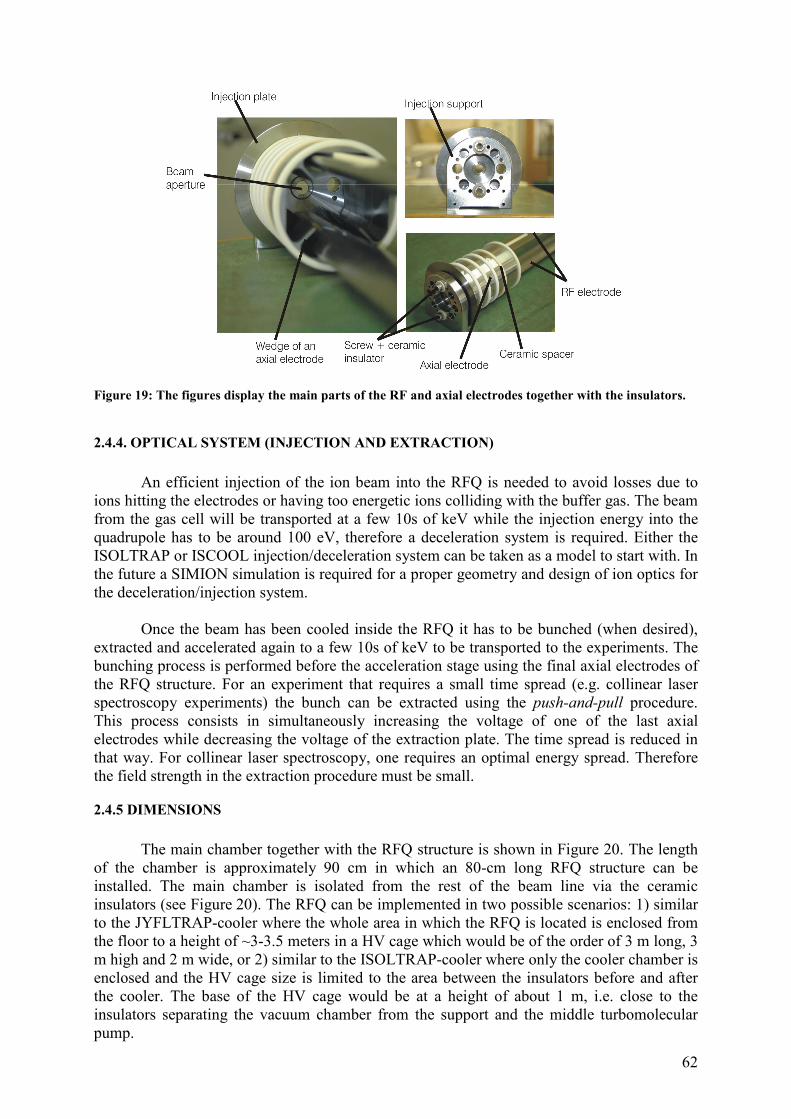
62
Figure 19: The figures display the main parts of the RF and axial electrodes together with the insulators.
2.4.4. OPTICAL SYSTEM (INJECTION AND EXTRACTION)
An efficient injection of the ion beam into the RFQ is needed to avoid losses due to
ions hitting the electrodes or having too energetic ions colliding with the buffer gas. The beam from the gas cell will be transported at a few 10s of keV while the injection energy into the quadrupole has to be around 100 eV, therefore a deceleration system is required. Either the ISOLTRAP or ISCOOL injection/deceleration system can be taken as a model to start with. In the future a SIMION simulation is required for a proper geometry and design of ion optics for the deceleration/injection system.
Once the beam has been cooled inside the RFQ it has to be bunched (when desired), extracted and accelerated again to a few 10s of keV to be transported to the experiments. The bunching process is performed before the acceleration stage using the final axial electrodes of the RFQ structure. For an experiment that requires a small time spread (e.g. collinear laser spectroscopy experiments) the bunch can be extracted using the push-and-pull procedure. This process consists in simultaneously increasing the voltage of one of the last axial electrodes while decreasing the voltage of the extraction plate. The time spread is reduced in that way. For collinear laser spectroscopy, one requires an optimal energy spread. Therefore the field strength in the extraction procedure must be small.
2.4.5 DIMENSIONS
The main chamber together with the RFQ structure is shown in Figure 20. The length
of the chamber is approximately 90 cm in which an 80-cm long RFQ structure can be installed. The main chamber is isolated from the rest of the beam line via the ceramic insulators (see Figure 20). The RFQ can be implemented in two possible scenarios: 1) similar to the JYFLTRAP-cooler where the whole area in which the RFQ is located is enclosed from the floor to a height of ~3-3.5 meters in a HV cage which would be of the order of 3 m long, 3 m high and 2 m wide, or 2) similar to the ISOLTRAP-cooler where only the cooler chamber is enclosed and the HV cage size is limited to the area between the insulators before and after the cooler. The base of the HV cage would be at a height of about 1 m, i.e. close to the insulators separating the vacuum chamber from the support and the middle turbomolecular pump.
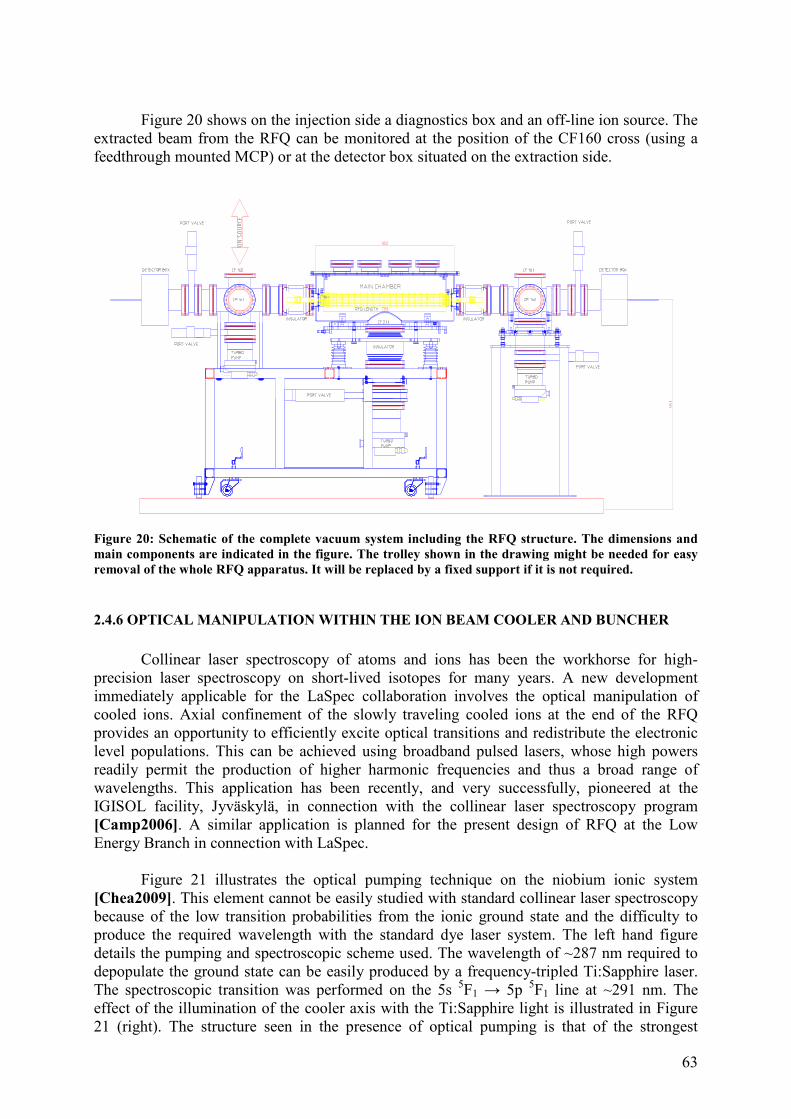
63
Figure 20 shows on the injection side a diagnostics box and an off-line ion source. The
extracted beam from the RFQ can be monitored at the position of the CF160 cross (using a feedthrough mounted MCP) or at the detector box situated on the extraction side.
Figure 20: Schematic of the complete vacuum system including the RFQ structure. The dimensions and main components are indicated in the figure. The trolley shown in the drawing might be needed for easy removal of the whole RFQ apparatus. It will be replaced by a fixed support if it is not required.
2.4.6 OPTICAL MANIPULATION WITHIN THE ION BEAM COOLER AND BUNCHER
Collinear laser spectroscopy of atoms and ions has been the workhorse for high-
precision laser spectroscopy on short-lived isotopes for many years. A new development immediately applicable for the LaSpec collaboration involves the optical manipulation of cooled ions. Axial confinement of the slowly traveling cooled ions at the end of the RFQ provides an opportunity to efficiently excite optical transitions and redistribute the electronic level populations. This can be achieved using broadband pulsed lasers, whose high powers readily permit the production of higher harmonic frequencies and thus a broad range of wavelengths. This application has been recently, and very successfully, pioneered at the IGISOL facility, Jyväskylä, in connection with the collinear laser spectroscopy program [Camp2006]. A similar application is planned for the present design of RFQ at the Low Energy Branch in connection with LaSpec.
Figure 21 illustrates the optical pumping technique on the niobium ionic system [Chea2009]. This element cannot be easily studied with standard collinear laser spectroscopy because of the low transition probabilities from the ionic ground state and the difficulty to produce the required wavelength with the standard dye laser system. The left hand figure details the pumping and spectroscopic scheme used. The wavelength of ~287 nm required to depopulate the ground state can be easily produced by a frequency-tripled Ti:Sapphire laser. The spectroscopic transition was performed on the 5s 5F1 → 5p 5F1 line at ~291 nm. The effect of the illumination of the cooler axis with the Ti:Sapphire light is illustrated in Figure 21 (right). The structure seen in the presence of optical pumping is that of the strongest
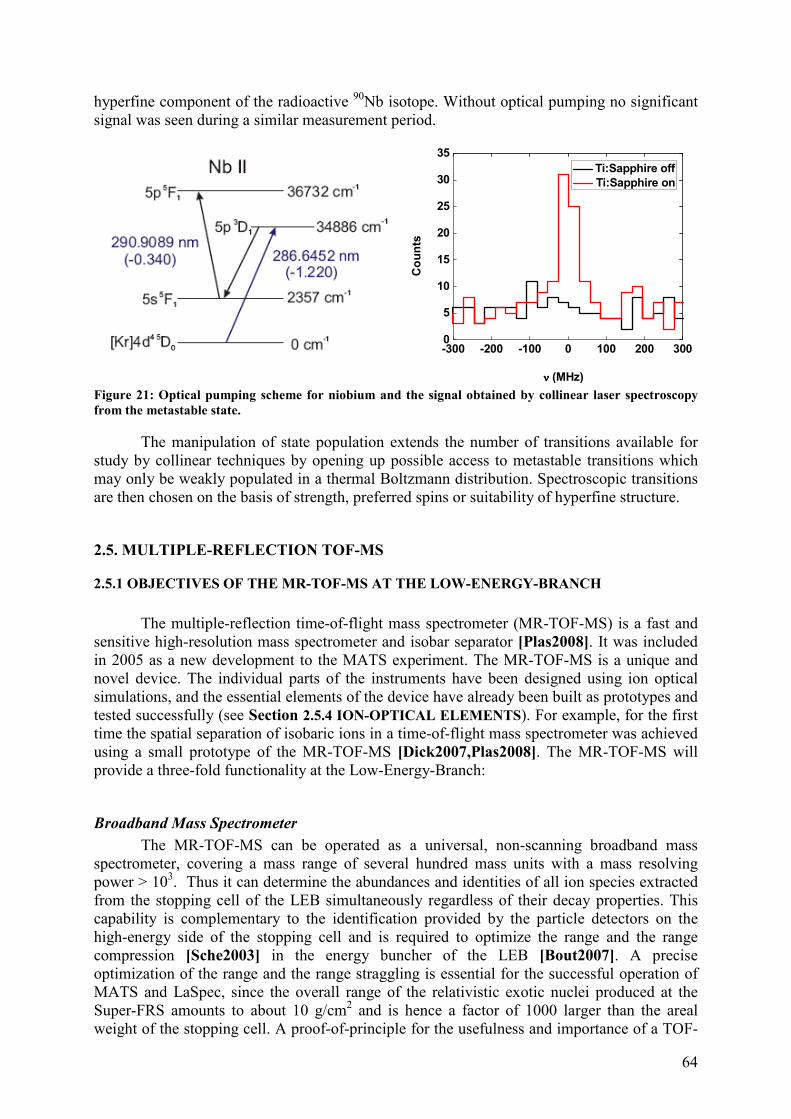
64
hyperfine component of the radioactive 90Nb isotope. Without optical pumping no significant signal was seen during a similar measurement period.
Figure 21: Optical pumping scheme for niobium and the signal obtained by collinear laser spectroscopy from the metastable state.
The manipulation of state population extends the number of transitions available for study by collinear techniques by opening up possible access to metastable transitions which may only be weakly populated in a thermal Boltzmann distribution. Spectroscopic transitions are then chosen on the basis of strength, preferred spins or suitability of hyperfine structure.
2.5. MULTIPLE-REFLECTION TOF-MS
2.5.1 OBJECTIVES OF THE MR-TOF-MS AT THE LOW-ENERGY-BRANCH
The multiple-reflection time-of-flight mass spectrometer (MR-TOF-MS) is a fast and
sensitive high-resolution mass spectrometer and isobar separator [Plas2008]. It was included in 2005 as a new development to the MATS experiment. The MR-TOF-MS is a unique and novel device. The individual parts of the instruments have been designed using ion optical simulations, and the essential elements of the device have already been built as prototypes and tested successfully (see Section 2.5.4 ION-OPTICAL ELEMENTS). For example, for the first time the spatial separation of isobaric ions in a time-of-flight mass spectrometer was achieved using a small prototype of the MR-TOF-MS [Dick2007,Plas2008]. The MR-TOF-MS will provide a three-fold functionality at the Low-Energy-Branch:
Broadband Mass Spectrometer
The MR-TOF-MS can be operated as a universal, non-scanning broadband mass spectrometer, covering a mass range of several hundred mass units with a mass resolving power > 103. Thus it can determine the abundances and identities of all ion species extracted from the stopping cell of the LEB simultaneously regardless of their decay properties. This capability is complementary to the identification provided by the particle detectors on the high-energy side of the stopping cell and is required to optimize the range and the range compression [Sche2003] in the energy buncher of the LEB [Bout2007]. A precise optimization of the range and the range straggling is essential for the successful operation of MATS and LaSpec, since the overall range of the relativistic exotic nuclei produced at the Super-FRS amounts to about 10 g/cm2 and is hence a factor of 1000 larger than the areal weight of the stopping cell. A proof-of-principle for the usefulness and importance of a TOF-
-300 -200 -100 0 100 200 3000
5
10
15
20
25
30
35
Counts
νννν (MHz)
Ti:Sapphire off
Ti:Sapphire on
65
MS for the fast tuning of the range and range compression of (initially relativistic) beams was provided for the first time at the FRS Ion-Catcher, a prototype for the LEB stopping cell [Petr2008a]. Since stable ions including molecules as well as radioactive nuclei can be identified by the MR-TOF-MS, the cleanliness of the LEB stopping cell and its proper operation can be investigated and verified. In addition, the MR-TOF-MS will be used already in the development phase of the LEB stopping cell as a high-resolution diagnostics device for the measurement and optimization of the efficiency, extraction times and cleanliness of the stopping cell.
Isobar Separator
The MR-TOF-MS can be used as a separator with a mass resolving power of 105 (FWHM). It can thus provide an isobarically pure beam for MATS. Isobaric reaction products originating from the production target or secondary reactions in the degraders of the Super-FRS, which cannot be fully suppressed in the Super-FRS can thus be separated from the nuclides of choice. This is of importance in particular for fission fragments. Because of the large emittance of fission fragments, contaminants can be transmitted through the Super-FRS with intensities that are larger by up to two orders of magnitude than the nuclides of choice even under optimum conditions. In addition, contaminants created in the stopping cell of the LEB, e.g. by charge exchange or by chemical reactions, can be removed [Elis2007,Petr2008b]. While the stopping cell will be operated at cryogenic temperatures to avoid the production of contaminants, full suppression cannot be guaranteed, in particular for intensive beams. In addition, the stopping cell will have to be moved in and out of its position behind the energy buncher of the LEB if experiments at MATS and LaSpec alternate with HISPEC/DESPEC experiments and thus should also be able to work under unfavorable vacuum conditions. The separation time in the MR-TOF-MS is about 2 ms, and up to 106...107 ions per second can be separated. The isobar separation in the MR-TOF-MS is hence much faster than the conventional mass-selective cooling in Penning traps, in particular for heavy and medium-heavy nuclei, and it is effective for much larger ion intensities. The MR-TOF-MS itself profits from the separation according to mass number provided by the magnet in the low-energy beamline.
High-precision Mass Spectrometer
Complementary to the MATS Penning trap system, the MR-TOF-MS can be used for high-resolution direct mass measurements of exotic nuclei with an expected accuracy of 10-6 to 10-7. So far, systematic studies have shown that a mass accuracy of better than 10–6 can be achieved in a time-of-flight mass spectrometer with one reflection only [Wang2006], and an increase in this accuracy can be expected for the MR-TOF-MS. The MR-TOF-MS is a non-scanning mass spectrometer, thus all isobars of several mass numbers can be detected and measured simultaneously. In addition, the device is sensitive to single ions. The measurement cycle duration amounts to about 2 ms only hence the half-life of the ions to be measured is limited by the extraction time of the LEB stopping cell. Mass calibration and mass accuracy studies with the MR-TOF-MS will be performed using carbon cluster ions produced by laser ablation of fullerenes with an admixture of 13C [Wang2006]. In combination with experiments at MATS or LaSpec, the MR-TOF-MS can perform survey measurements in a short time, which determine the number, species, mass (accurate to about 100 keV) and charge state of the nuclides delivered from the stopping cell. The most interesting nuclides of those can then be transferred to MATS or LaSpec. The MR-TOF-MS will thus significantly reduce the setup time of experiments at the LEB and enhance their performance.
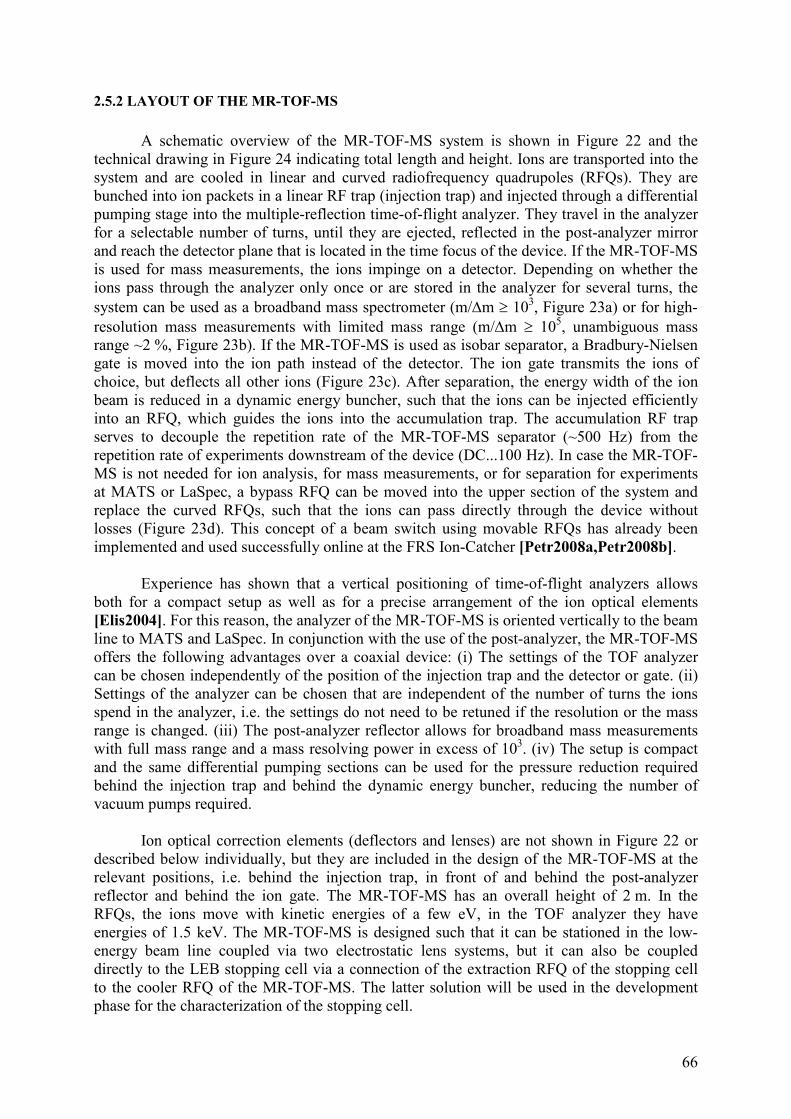
66
2.5.2 LAYOUT OF THE MR-TOF-MS
A schematic overview of the MR-TOF-MS system is shown in Figure 22 and the
technical drawing in Figure 24 indicating total length and height. Ions are transported into the system and are cooled in linear and curved radiofrequency quadrupoles (RFQs). They are bunched into ion packets in a linear RF trap (injection trap) and injected through a differential pumping stage into the multiple-reflection time-of-flight analyzer. They travel in the analyzer for a selectable number of turns, until they are ejected, reflected in the post-analyzer mirror and reach the detector plane that is located in the time focus of the device. If the MR-TOF-MS is used for mass measurements, the ions impinge on a detector. Depending on whether the ions pass through the analyzer only once or are stored in the analyzer for several turns, the system can be used as a broadband mass spectrometer (m/∆m ≥ 103, Figure 23a) or for high-resolution mass measurements with limited mass range (m/∆m ≥ 105, unambiguous mass range ~2 %, Figure 23b). If the MR-TOF-MS is used as isobar separator, a Bradbury-Nielsen gate is moved into the ion path instead of the detector. The ion gate transmits the ions of choice, but deflects all other ions (Figure 23c). After separation, the energy width of the ion beam is reduced in a dynamic energy buncher, such that the ions can be injected efficiently into an RFQ, which guides the ions into the accumulation trap. The accumulation RF trap serves to decouple the repetition rate of the MR-TOF-MS separator (~500 Hz) from the repetition rate of experiments downstream of the device (DC...100 Hz). In case the MR-TOF-MS is not needed for ion analysis, for mass measurements, or for separation for experiments at MATS or LaSpec, a bypass RFQ can be moved into the upper section of the system and replace the curved RFQs, such that the ions can pass directly through the device without losses (Figure 23d). This concept of a beam switch using movable RFQs has already been implemented and used successfully online at the FRS Ion-Catcher [Petr2008a,Petr2008b].
Experience has shown that a vertical positioning of time-of-flight analyzers allows both for a compact setup as well as for a precise arrangement of the ion optical elements [Elis2004]. For this reason, the analyzer of the MR-TOF-MS is oriented vertically to the beam line to MATS and LaSpec. In conjunction with the use of the post-analyzer, the MR-TOF-MS offers the following advantages over a coaxial device: (i) The settings of the TOF analyzer can be chosen independently of the position of the injection trap and the detector or gate. (ii) Settings of the analyzer can be chosen that are independent of the number of turns the ions spend in the analyzer, i.e. the settings do not need to be retuned if the resolution or the mass range is changed. (iii) The post-analyzer reflector allows for broadband mass measurements with full mass range and a mass resolving power in excess of 103. (iv) The setup is compact and the same differential pumping sections can be used for the pressure reduction required behind the injection trap and behind the dynamic energy buncher, reducing the number of vacuum pumps required.
Ion optical correction elements (deflectors and lenses) are not shown in Figure 22 or
described below individually, but they are included in the design of the MR-TOF-MS at the relevant positions, i.e. behind the injection trap, in front of and behind the post-analyzer reflector and behind the ion gate. The MR-TOF-MS has an overall height of 2 m. In the RFQs, the ions move with kinetic energies of a few eV, in the TOF analyzer they have energies of 1.5 keV. The MR-TOF-MS is designed such that it can be stationed in the low- energy beam line coupled via two electrostatic lens systems, but it can also be coupled directly to the LEB stopping cell via a connection of the extraction RFQ of the stopping cell to the cooler RFQ of the MR-TOF-MS. The latter solution will be used in the development phase for the characterization of the stopping cell.
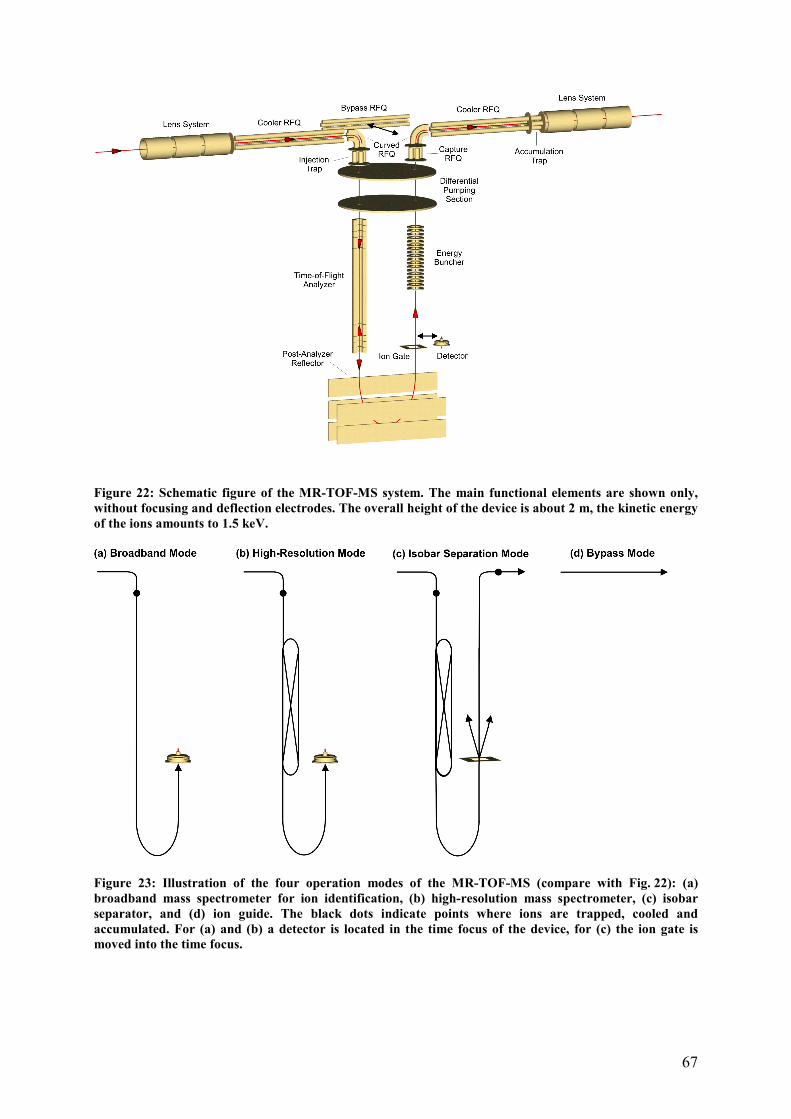
67
Figure 22: Schematic figure of the MR-TOF-MS system. The main functional elements are shown only, without focusing and deflection electrodes. The overall height of the device is about 2 m, the kinetic energy of the ions amounts to 1.5 keV.
Figure 23: Illustration of the four operation modes of the MR-TOF-MS (compare with Fig. 22): (a) broadband mass spectrometer for ion identification, (b) high-resolution mass spectrometer, (c) isobar separator, and (d) ion guide. The black dots indicate points where ions are trapped, cooled and accumulated. For (a) and (b) a detector is located in the time focus of the device, for (c) the ion gate is moved into the time focus.
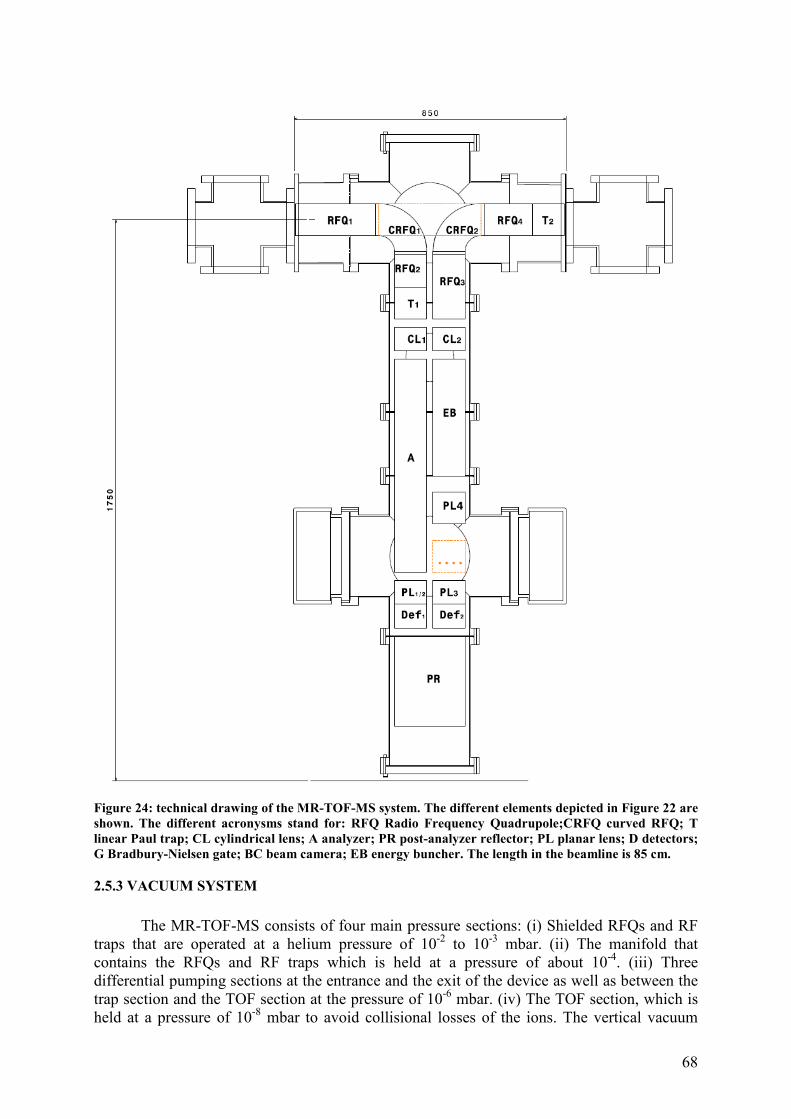
68
Figure 24: technical drawing of the MR-TOF-MS system. The different elements depicted in Figure 22 are shown. The different acronysms stand for: RFQ Radio Frequency Quadrupole;CRFQ curved RFQ; T linear Paul trap; CL cylindrical lens; A analyzer; PR post-analyzer reflector; PL planar lens; D detectors; G Bradbury-Nielsen gate; BC beam camera; EB energy buncher. The length in the beamline is 85 cm.
2.5.3 VACUUM SYSTEM
The MR-TOF-MS consists of four main pressure sections: (i) Shielded RFQs and RF
traps that are operated at a helium pressure of 10-2 to 10-3 mbar. (ii) The manifold that contains the RFQs and RF traps which is held at a pressure of about 10-4. (iii) Three differential pumping sections at the entrance and the exit of the device as well as between the trap section and the TOF section at the pressure of 10-6 mbar. (iv) The TOF section, which is held at a pressure of 10-8 mbar to avoid collisional losses of the ions. The vertical vacuum
69
chamber of the device is built from DN250CF vacuum crosses; for the coupling to the beam line DN160CF vacuum crosses and bellows are used. Five turbo-molecular pumps (500 l/s) are required to provide the differential pumping. They are backed by two oil-free scroll pumps. The pressure in the individual sections is measured using Pirani, Penning and Bayard-Alpert ion gauges. Helium is introduced as buffer gas for ion cooling into the injection trap and the accumulation trap of the MR-TOF-MS using two regulated precision gas inlets.
2.5.4 ION-OPTICAL ELEMENTS
Ion Transport
In the buffer-gas-filled environment of the upper section of the MR-TOF-MS the ion transport occurs using RFQs. These have been shown to be ion guides with almost unity transmission efficiency even in the presence of a buffer gas up to 0.1 mbar. In addition the RFQs serve for pre-cooling of the ions before they enter the injection trap or the accumulation trap. The change from the horizontal to the vertical direction of motion and back required at the entrance and exit of the device, respectively, can be realized using curved RFQs. Curved RFQs have already been shown to have similarly ideal transmission characteristics as straight RFQs [Plas2007,Petr2008b]. Since ions dissipate their kinetic energy in gas-filled RFQs due to collisions with the buffer gas, in addition to the radial confining RF field, a static axial field is needed to draw the ions through the RFQ. This axial field can be created using four additional, inclined rods, which are placed between the RF rods and supplied with a DC potential [Lobo2000,Weid2003]. An alternative solution is RF electrodes that are machined from UHV-compatible resistive plastic. If different DC offset potentials are applied at both ends of the RF rods, an axial field is created inside the RFQ. This latter solution has been tested in a prototype RFQ [Simo2008] and will be applied in the MR-TOF-MS.
Injection Trap System
Preparation of the ions before mass analysis plays a crucial role in time-of-flight mass spectrometry, because the initial spatial and velocity distributions determine the emittance of the beam, in particular the energy spread of the accelerated ions. In addition, the initial velocity distribution is responsible for the turn-around time [Wile1955]. The turn-around time is often the dominant contribution to the overall time-of-flight spread and thus limits the resolution of the TOF-MS. For the MR-TOF-MS system a linear RF ion trap was chosen for ion preparation, since in addition to universally applicable buffer gas cooling it facilitates highly efficient coupling of the system to the low-energy beam line. In the injection trap system the incoming ions are accumulated, cooled and accelerated in bunches. In order to allow both for a short cooling time as well as an ejection without collisional energy broadening, a three-stage trap system with differential pumping is employed. A rectangular RF pulse with a frequency of 2 MHz is used, since it allows flexible operation of the trap system with sections of the trap at different pulsed potentials as well as for switching off of the RF during ejection of the ions from the trap.
A prototype of this injection trap system has been designed, built and tested [Jesc2008]. For characterization of this trap system, it was coupled to a cesium ion source via a gas-filled RFQ that serves for pre-cooling of the Cs+ ions. After a selectable storage time, the ions were ejected from the trap by a dipolar voltage pulse on the entrance and exit diaphragms of the trap and post-accelerated in a second stage onto an MCP detector, located at the time focus of the set-up. Time-of-flight peaks for the Cs+ ions with a width of about 5 ns were achieved. This peak width is mostly caused by the unavoidable turn-around-time.
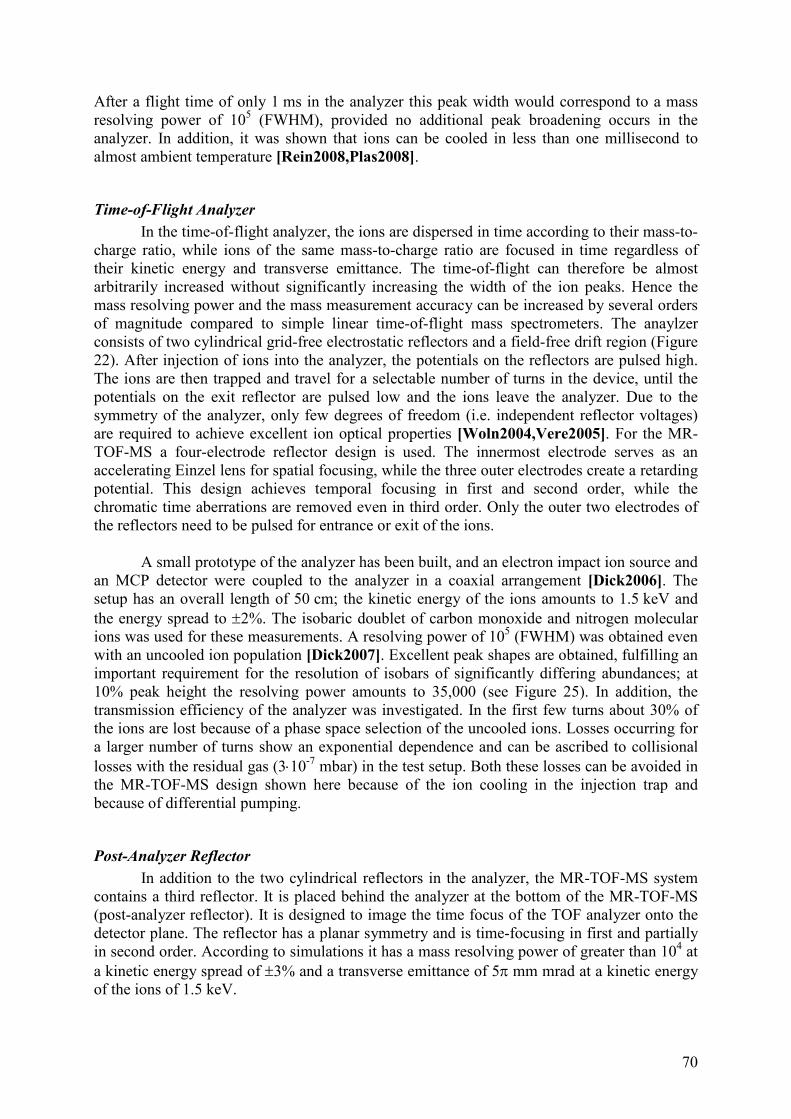
70
After a flight time of only 1 ms in the analyzer this peak width would correspond to a mass resolving power of 105 (FWHM), provided no additional peak broadening occurs in the analyzer. In addition, it was shown that ions can be cooled in less than one millisecond to almost ambient temperature [Rein2008,Plas2008].
Time-of-Flight Analyzer
In the time-of-flight analyzer, the ions are dispersed in time according to their mass-to-charge ratio, while ions of the same mass-to-charge ratio are focused in time regardless of their kinetic energy and transverse emittance. The time-of-flight can therefore be almost arbitrarily increased without significantly increasing the width of the ion peaks. Hence the mass resolving power and the mass measurement accuracy can be increased by several orders of magnitude compared to simple linear time-of-flight mass spectrometers. The anaylzer consists of two cylindrical grid-free electrostatic reflectors and a field-free drift region (Figure 22). After injection of ions into the analyzer, the potentials on the reflectors are pulsed high. The ions are then trapped and travel for a selectable number of turns in the device, until the potentials on the exit reflector are pulsed low and the ions leave the analyzer. Due to the symmetry of the analyzer, only few degrees of freedom (i.e. independent reflector voltages) are required to achieve excellent ion optical properties [Woln2004,Vere2005]. For the MR-TOF-MS a four-electrode reflector design is used. The innermost electrode serves as an accelerating Einzel lens for spatial focusing, while the three outer electrodes create a retarding potential. This design achieves temporal focusing in first and second order, while the chromatic time aberrations are removed even in third order. Only the outer two electrodes of the reflectors need to be pulsed for entrance or exit of the ions.
A small prototype of the analyzer has been built, and an electron impact ion source and an MCP detector were coupled to the analyzer in a coaxial arrangement [Dick2006]. The setup has an overall length of 50 cm; the kinetic energy of the ions amounts to 1.5 keV and the energy spread to ±2%. The isobaric doublet of carbon monoxide and nitrogen molecular ions was used for these measurements. A resolving power of 105 (FWHM) was obtained even with an uncooled ion population [Dick2007]. Excellent peak shapes are obtained, fulfilling an important requirement for the resolution of isobars of significantly differing abundances; at 10% peak height the resolving power amounts to 35,000 (see Figure 25). In addition, the transmission efficiency of the analyzer was investigated. In the first few turns about 30% of the ions are lost because of a phase space selection of the uncooled ions. Losses occurring for a larger number of turns show an exponential dependence and can be ascribed to collisional losses with the residual gas (3⋅10-7 mbar) in the test setup. Both these losses can be avoided in the MR-TOF-MS design shown here because of the ion cooling in the injection trap and because of differential pumping.
Post-Analyzer Reflector In addition to the two cylindrical reflectors in the analyzer, the MR-TOF-MS system
contains a third reflector. It is placed behind the analyzer at the bottom of the MR-TOF-MS (post-analyzer reflector). It is designed to image the time focus of the TOF analyzer onto the detector plane. The reflector has a planar symmetry and is time-focusing in first and partially in second order. According to simulations it has a mass resolving power of greater than 104 at a kinetic energy spread of ±3% and a transverse emittance of 5π mm mrad at a kinetic energy of the ions of 1.5 keV.
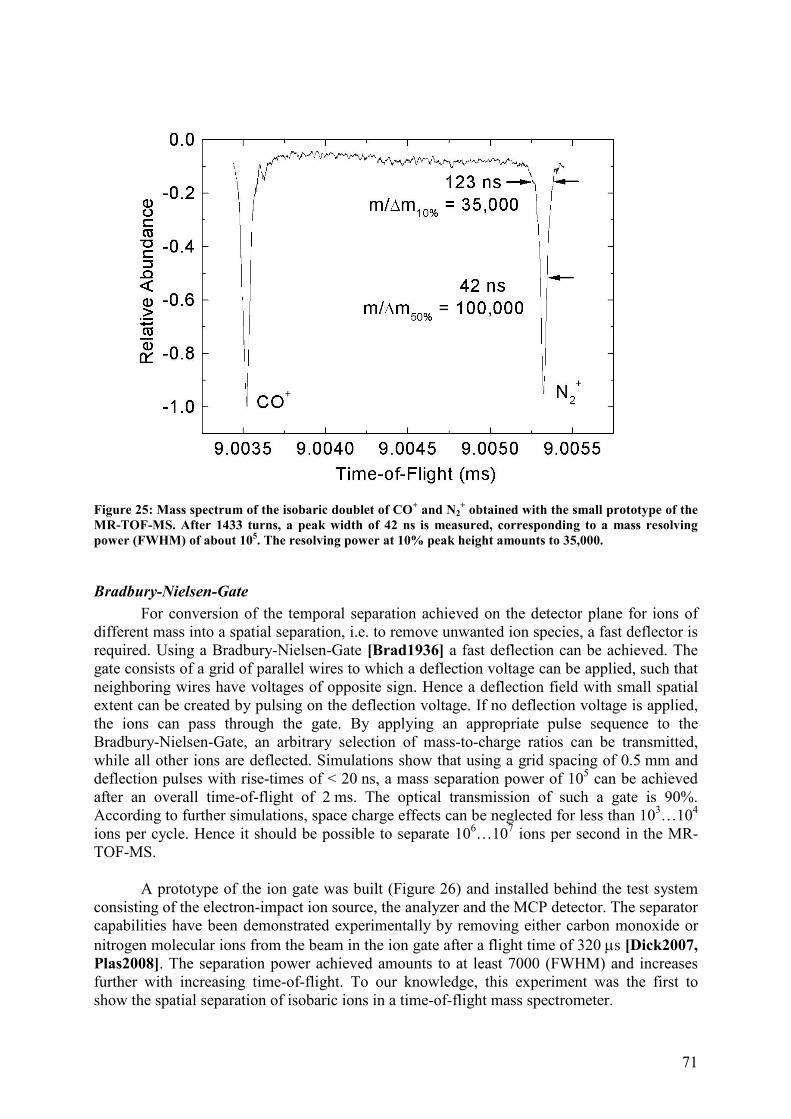
71
Figure 25: Mass spectrum of the isobaric doublet of CO+ and N2
+ obtained with the small prototype of the MR-TOF-MS. After 1433 turns, a peak width of 42 ns is measured, corresponding to a mass resolving power (FWHM) of about 105. The resolving power at 10% peak height amounts to 35,000.
Bradbury-Nielsen-Gate For conversion of the temporal separation achieved on the detector plane for ions of
different mass into a spatial separation, i.e. to remove unwanted ion species, a fast deflector is required. Using a Bradbury-Nielsen-Gate [Brad1936] a fast deflection can be achieved. The gate consists of a grid of parallel wires to which a deflection voltage can be applied, such that neighboring wires have voltages of opposite sign. Hence a deflection field with small spatial extent can be created by pulsing on the deflection voltage. If no deflection voltage is applied, the ions can pass through the gate. By applying an appropriate pulse sequence to the Bradbury-Nielsen-Gate, an arbitrary selection of mass-to-charge ratios can be transmitted, while all other ions are deflected. Simulations show that using a grid spacing of 0.5 mm and deflection pulses with rise-times of < 20 ns, a mass separation power of 105 can be achieved after an overall time-of-flight of 2 ms. The optical transmission of such a gate is 90%. According to further simulations, space charge effects can be neglected for less than 103…104 ions per cycle. Hence it should be possible to separate 106…107 ions per second in the MR-TOF-MS.
A prototype of the ion gate was built (Figure 26) and installed behind the test system consisting of the electron-impact ion source, the analyzer and the MCP detector. The separator capabilities have been demonstrated experimentally by removing either carbon monoxide or nitrogen molecular ions from the beam in the ion gate after a flight time of 320 µs [Dick2007, Plas2008]. The separation power achieved amounts to at least 7000 (FWHM) and increases further with increasing time-of-flight. To our knowledge, this experiment was the first to show the spatial separation of isobaric ions in a time-of-flight mass spectrometer.
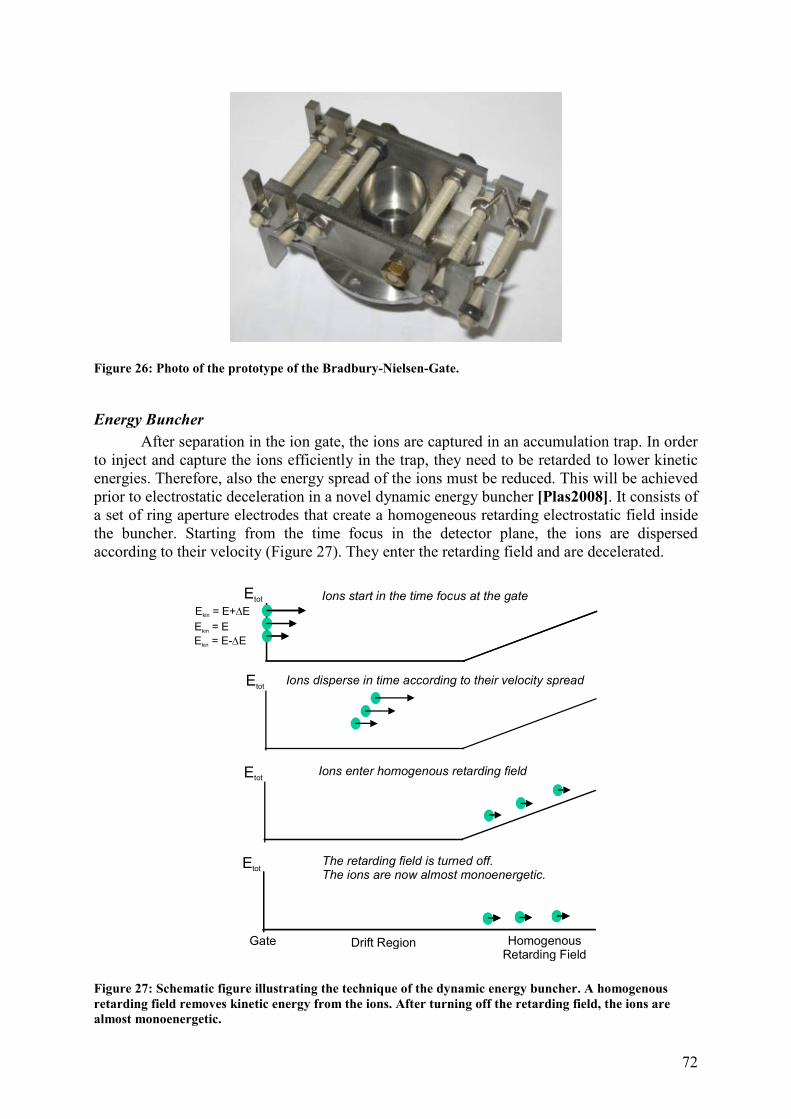
72
Figure 26: Photo of the prototype of the Bradbury-Nielsen-Gate.
Energy Buncher
After separation in the ion gate, the ions are captured in an accumulation trap. In order to inject and capture the ions efficiently in the trap, they need to be retarded to lower kinetic energies. Therefore, also the energy spread of the ions must be reduced. This will be achieved prior to electrostatic deceleration in a novel dynamic energy buncher [Plas2008]. It consists of a set of ring aperture electrodes that create a homogeneous retarding electrostatic field inside the buncher. Starting from the time focus in the detector plane, the ions are dispersed according to their velocity (Figure 27). They enter the retarding field and are decelerated.
Drift Region HomogenousRetarding Field
Etot
E = E+ Ekin ∆E = Ekin
E = E- Ekin ∆
Gate
Etot
Etot
Etot
Ions start in the time focus at the gate
Ions disperse in time according to their velocity spread
Ions enter homogenous retarding field
The retarding field is turned off. The ions are now almost monoenergetic.
Figure 27: Schematic figure illustrating the technique of the dynamic energy buncher. A homogenous retarding field removes kinetic energy from the ions. After turning off the retarding field, the ions are almost monoenergetic.
73
The retarding field is switched off when the ions are in the middle of the buncher. If
the retarding field is pulsed off at the right time, more kinetic energy is removed from the faster ions than from the slower ions, such that behind the energy buncher the ions are almost monoenergetic. Simulations show that the energy spread of the ions in the MR-TOF-MS can be reduced by a factor of 20 using this technique.
2.5.5 DETECTORS AND DATA ACQUISITION
Several detectors are needed for the tuning and operation of the MR-TOF-MS. An
isochronous secondary electron multiplier (ETP MagneTOF) will be used as the main detector for broadband and high-resolution mass measurements. It delivers signals with peak widths of less than 1 ns and is believed to have a detection efficiency of 80%. Alternatively, a microchannel plate (MCP) detector can be used, which can also produce signals with widths of less than 1 ns, but is limited by the open area ratio of the channels to a detection efficiency of about 55%. A silicon detector can replace the main detector for optimization of the MR-TOF-MS. Two MCP detectors (gate detectors) are mounted offset from the optical axis behind the Bradbury-Nielsen-Gate. During the operation of the MR-TOF-MS as an isobar separator, they can be used to detect the deflected ions. Thus the intensity of the incoming beam and the performance of the MR-TOF-MS operation can be monitored continuously by observing deflected contaminant ions, even if the ions of interest are delivered from the Super-FRS at extremely low rates. In this way, problems with the complex process of ion stopping and extraction in the LEB stopping cell can be detected.
The main detector, the Bradbury-Nielsen-Gate and the gate MCP detectors will be mounted at the time-focus of the post-analyzer reflector on a movable platform driven by an UHV-compatible motor. Depending on the horizontal position of the platform, either the primary detector or the ion gate and the gate detectors will be placed in the ion beam coming from the reflector. An additional MCP detector (diagnostics detector) will be mounted behind the backplane of the post-analyzer reflector. If the voltages on the post-analyzer reflector are turned off, the beam coming from the TOF analyzer will impinge directly on the diagnostics detector. Thus the diagnostics detector can be used to tune the ion transmission in the first part of the MR-TOF-MS.
A fast-sampling transient recorder with large bandwidth (500 MHz, 2 GSamples, Signal Recovery) will be used for data acquisition of the high-resolution mass spectra obtained with the isochronous secondary electron multiplier and MCP detectors. A spectroscopy amplifier and a multiscaler are used to acquire data with the silicon detector.
2.5.6 ELECTRONICS
The MR-TOF-MS requires 90 static and pulsed high (HV) and low voltages (LV) for
the TOF analyzer, post analyzer, lenses, deflectors, energy buncher, the detectors and as DC voltage offsets for the RF quadrupoles and traps. The stability of the analyzer voltages needed to achieve full resolving power and accuracy amounts to about 1 ppm. The rise times of the pulsed voltages should not exceed about 50 ns. In addition, several adjustable high-power sinusodial and rectangular RF sources are required for operation of the RF quadrupoles and traps of the device. Commercial solutions for these requirements are either not available, such as for the HV of the TOF analyzer, or would considerably increase the overall cost of the MR-TOF-MS. Therefore, custom solutions have been developed, which fulfill the requirements listed above. HV and LV are supplied by commercial computer-controlled voltage modules

74
(ISEG, Wiener) but are stabilized against medium-term (0.01…10 Hz) drifts and pulse distortions by custom-built circuitry. Long-term (< 0.01 Hz) drifts are avoided by an active temperature stabilization of the power supplies. Fast HV pulsers for amplitudes of up to 1.7 kV have been developed based on a push-pull MOSFET design. A source for rectangular RF voltages has been designed and built [Jesc2008]. Computer-controlled digital function generators (Tektronix) and inexpensive, modified power RF amplifiers (RM Italy) are used to supply the sinusodial RF; they are coupled to the RFQ electrodes via custom-built high-quality resonance circuits. Timing signals (TTL) are produced by two computer-controlled timer-counter cards (National Instruments).
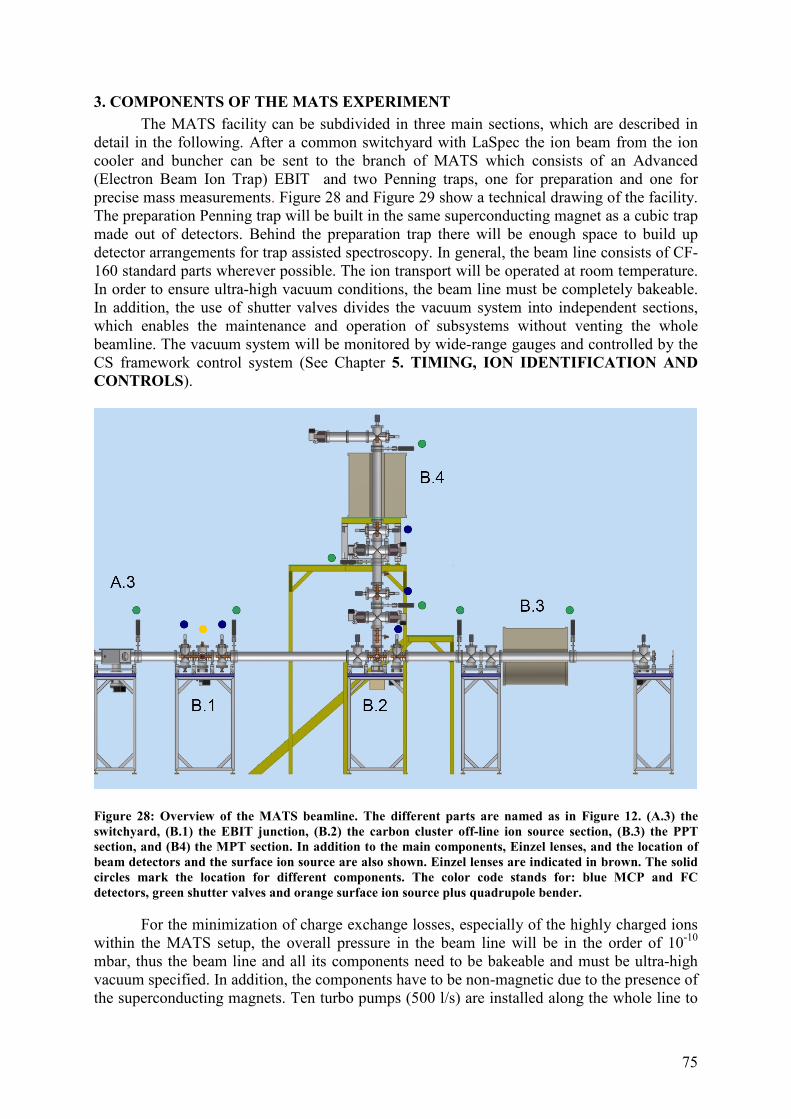
75
3. COMPONENTS OF THE MATS EXPERIMENT
The MATS facility can be subdivided in three main sections, which are described in detail in the following. After a common switchyard with LaSpec the ion beam from the ion cooler and buncher can be sent to the branch of MATS which consists of an Advanced (Electron Beam Ion Trap) EBIT and two Penning traps, one for preparation and one for precise mass measurements. Figure 28 and Figure 29 show a technical drawing of the facility. The preparation Penning trap will be built in the same superconducting magnet as a cubic trap made out of detectors. Behind the preparation trap there will be enough space to build up detector arrangements for trap assisted spectroscopy. In general, the beam line consists of CF-160 standard parts wherever possible. The ion transport will be operated at room temperature. In order to ensure ultra-high vacuum conditions, the beam line must be completely bakeable. In addition, the use of shutter valves divides the vacuum system into independent sections, which enables the maintenance and operation of subsystems without venting the whole beamline. The vacuum system will be monitored by wide-range gauges and controlled by the CS framework control system (See Chapter 5. TIMING, ION IDENTIFICATION AND CONTROLS).
Figure 28: Overview of the MATS beamline. The different parts are named as in Figure 12. (A.3) the switchyard, (B.1) the EBIT junction, (B.2) the carbon cluster off-line ion source section, (B.3) the PPT section, and (B4) the MPT section. In addition to the main components, Einzel lenses, and the location of beam detectors and the surface ion source are also shown. Einzel lenses are indicated in brown. The solid circles mark the location for different components. The color code stands for: blue MCP and FC detectors, green shutter valves and orange surface ion source plus quadrupole bender.
For the minimization of charge exchange losses, especially of the highly charged ions within the MATS setup, the overall pressure in the beam line will be in the order of 10-10 mbar, thus the beam line and all its components need to be bakeable and must be ultra-high vacuum specified. In addition, the components have to be non-magnetic due to the presence of the superconducting magnets. Ten turbo pumps (500 l/s) are installed along the whole line to
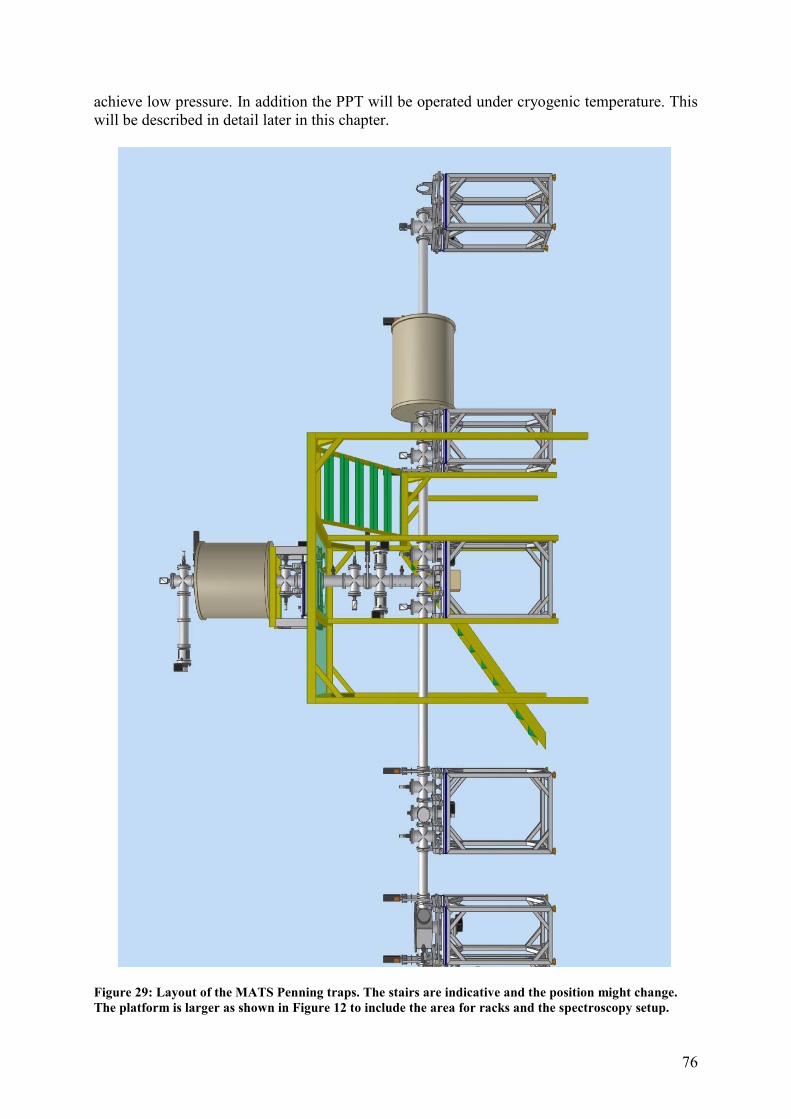
76
achieve low pressure. In addition the PPT will be operated under cryogenic temperature. This will be described in detail later in this chapter.
Figure 29: Layout of the MATS Penning traps. The stairs are indicative and the position might change. The platform is larger as shown in Figure 12 to include the area for racks and the spectroscopy setup.
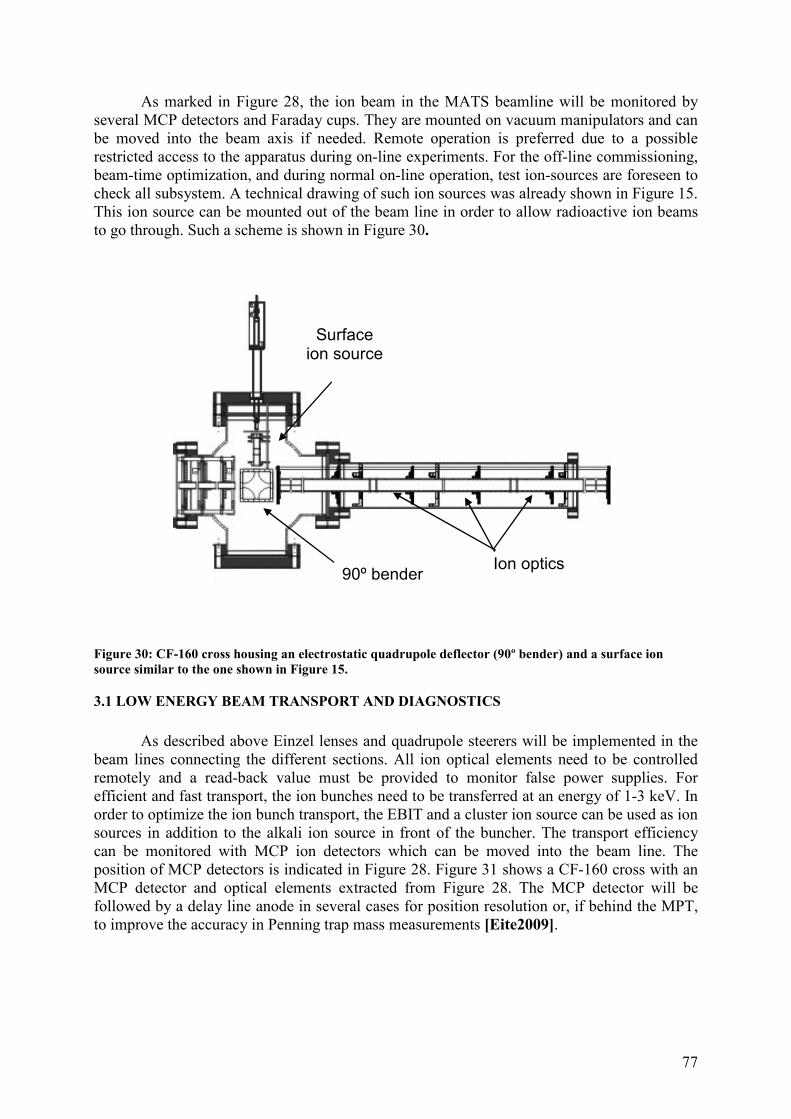
77
As marked in Figure 28, the ion beam in the MATS beamline will be monitored by several MCP detectors and Faraday cups. They are mounted on vacuum manipulators and can be moved into the beam axis if needed. Remote operation is preferred due to a possible restricted access to the apparatus during on-line experiments. For the off-line commissioning, beam-time optimization, and during normal on-line operation, test ion-sources are foreseen to check all subsystem. A technical drawing of such ion sources was already shown in Figure 15. This ion source can be mounted out of the beam line in order to allow radioactive ion beams to go through. Such a scheme is shown in Figure 30.
Figure 30: CF-160 cross housing an electrostatic quadrupole deflector (90º bender) and a surface ion source similar to the one shown in Figure 15.
3.1 LOW ENERGY BEAM TRANSPORT AND DIAGNOSTICS
As described above Einzel lenses and quadrupole steerers will be implemented in the beam lines connecting the different sections. All ion optical elements need to be controlled remotely and a read-back value must be provided to monitor false power supplies. For efficient and fast transport, the ion bunches need to be transferred at an energy of 1-3 keV. In order to optimize the ion bunch transport, the EBIT and a cluster ion source can be used as ion sources in addition to the alkali ion source in front of the buncher. The transport efficiency can be monitored with MCP ion detectors which can be moved into the beam line. The position of MCP detectors is indicated in Figure 28. Figure 31 shows a CF-160 cross with an MCP detector and optical elements extracted from Figure 28. The MCP detector will be followed by a delay line anode in several cases for position resolution or, if behind the MPT, to improve the accuracy in Penning trap mass measurements [Eite2009].
Surface ion source
90º bender Ion optics
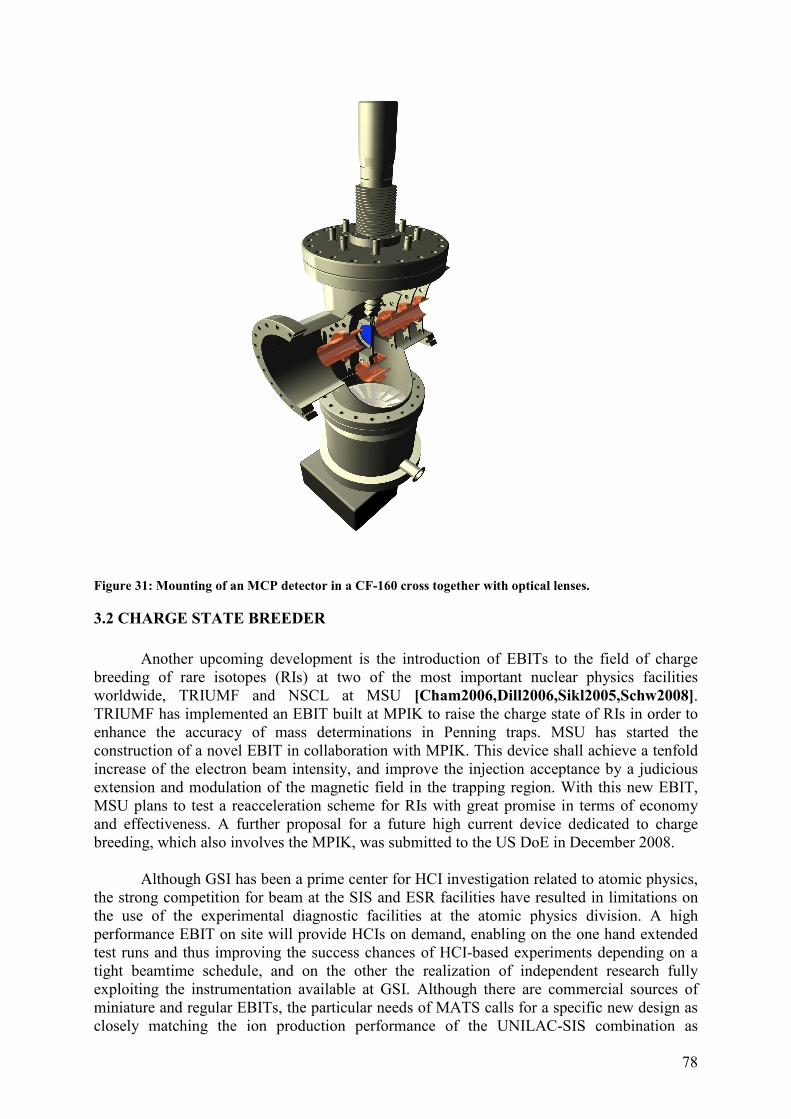
78
Figure 31: Mounting of an MCP detector in a CF-160 cross together with optical lenses.
3.2 CHARGE STATE BREEDER
Another upcoming development is the introduction of EBITs to the field of charge breeding of rare isotopes (RIs) at two of the most important nuclear physics facilities worldwide, TRIUMF and NSCL at MSU [Cham2006,Dill2006,Sikl2005,Schw2008]. TRIUMF has implemented an EBIT built at MPIK to raise the charge state of RIs in order to enhance the accuracy of mass determinations in Penning traps. MSU has started the construction of a novel EBIT in collaboration with MPIK. This device shall achieve a tenfold increase of the electron beam intensity, and improve the injection acceptance by a judicious extension and modulation of the magnetic field in the trapping region. With this new EBIT, MSU plans to test a reacceleration scheme for RIs with great promise in terms of economy and effectiveness. A further proposal for a future high current device dedicated to charge breeding, which also involves the MPIK, was submitted to the US DoE in December 2008. Although GSI has been a prime center for HCI investigation related to atomic physics, the strong competition for beam at the SIS and ESR facilities have resulted in limitations on the use of the experimental diagnostic facilities at the atomic physics division. A high performance EBIT on site will provide HCIs on demand, enabling on the one hand extended test runs and thus improving the success chances of HCI-based experiments depending on a tight beamtime schedule, and on the other the realization of independent research fully exploiting the instrumentation available at GSI. Although there are commercial sources of miniature and regular EBITs, the particular needs of MATS calls for a specific new design as closely matching the ion production performance of the UNILAC-SIS combination as
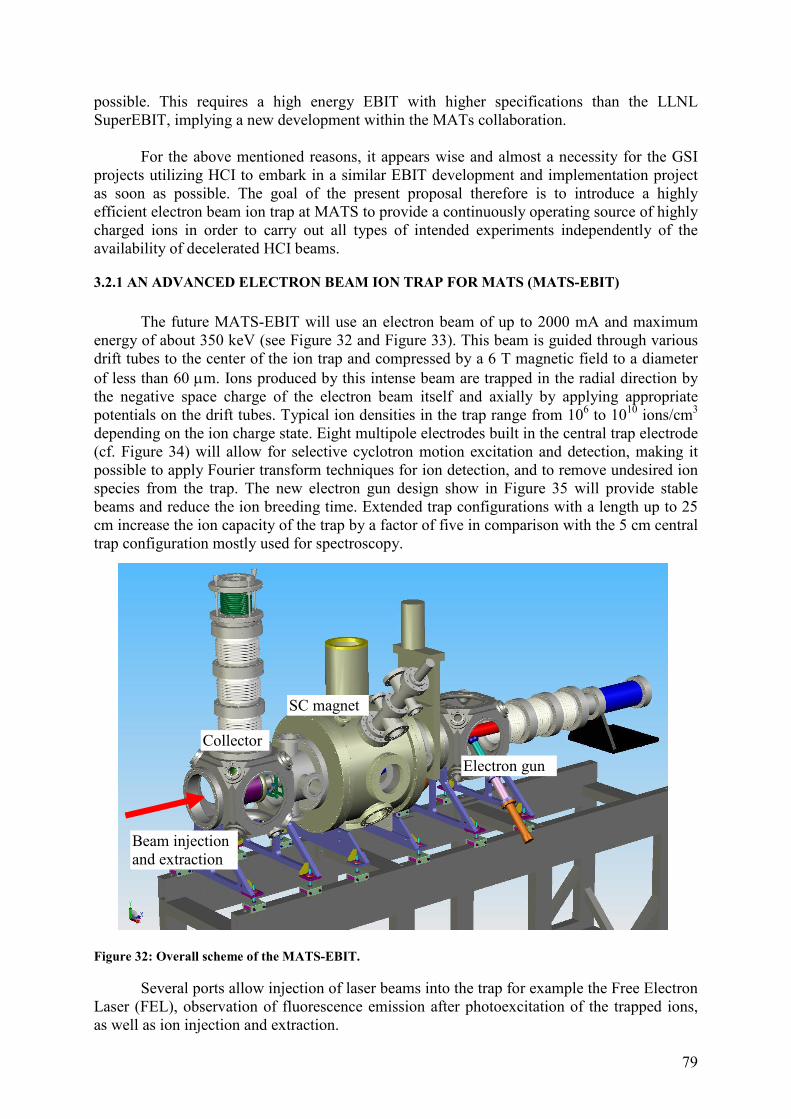
79
possible. This requires a high energy EBIT with higher specifications than the LLNL SuperEBIT, implying a new development within the MATs collaboration. For the above mentioned reasons, it appears wise and almost a necessity for the GSI projects utilizing HCI to embark in a similar EBIT development and implementation project as soon as possible. The goal of the present proposal therefore is to introduce a highly efficient electron beam ion trap at MATS to provide a continuously operating source of highly charged ions in order to carry out all types of intended experiments independently of the availability of decelerated HCI beams.
3.2.1 AN ADVANCED ELECTRON BEAM ION TRAP FOR MATS (MATS-EBIT)
The future MATS-EBIT will use an electron beam of up to 2000 mA and maximum energy of about 350 keV (see Figure 32 and Figure 33). This beam is guided through various drift tubes to the center of the ion trap and compressed by a 6 T magnetic field to a diameter of less than 60 µm. Ions produced by this intense beam are trapped in the radial direction by the negative space charge of the electron beam itself and axially by applying appropriate potentials on the drift tubes. Typical ion densities in the trap range from 106 to 1010 ions/cm3 depending on the ion charge state. Eight multipole electrodes built in the central trap electrode (cf. Figure 34) will allow for selective cyclotron motion excitation and detection, making it possible to apply Fourier transform techniques for ion detection, and to remove undesired ion species from the trap. The new electron gun design show in Figure 35 will provide stable beams and reduce the ion breeding time. Extended trap configurations with a length up to 25 cm increase the ion capacity of the trap by a factor of five in comparison with the 5 cm central trap configuration mostly used for spectroscopy.
Figure 32: Overall scheme of the MATS-EBIT. Several ports allow injection of laser beams into the trap for example the Free Electron Laser (FEL), observation of fluorescence emission after photoexcitation of the trapped ions, as well as ion injection and extraction.
Beam injection and extraction
SC magnet
Electron gun
Collector
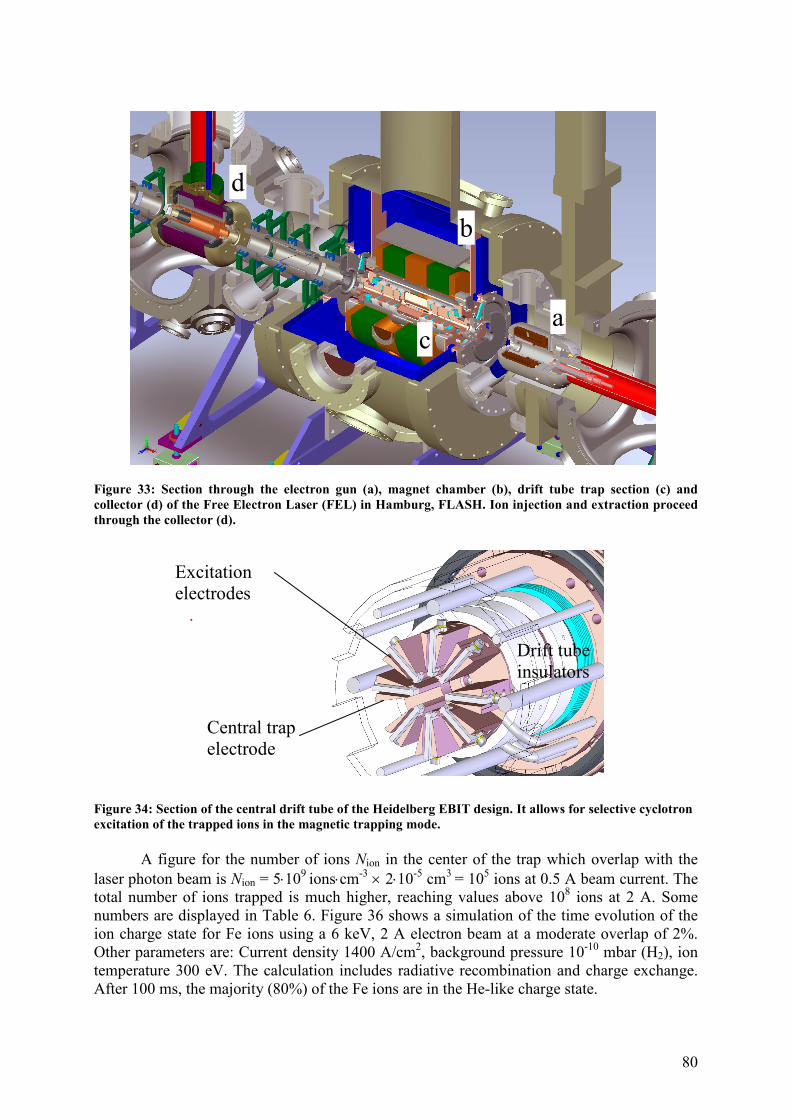
80
Figure 33: Section through the electron gun (a), magnet chamber (b), drift tube trap section (c) and collector (d) of the Free Electron Laser (FEL) in Hamburg, FLASH. Ion injection and extraction proceed through the collector (d). Figure 34: Section of the central drift tube of the Heidelberg EBIT design. It allows for selective cyclotron excitation of the trapped ions in the magnetic trapping mode. A figure for the number of ions Nion in the center of the trap which overlap with the laser photon beam is Nion = 5⋅109 ions⋅cm-3 × 2⋅10-5 cm3 = 105 ions at 0.5 A beam current. The total number of ions trapped is much higher, reaching values above 108 ions at 2 A. Some numbers are displayed in Table 6. Figure 36 shows a simulation of the time evolution of the ion charge state for Fe ions using a 6 keV, 2 A electron beam at a moderate overlap of 2%. Other parameters are: Current density 1400 A/cm2, background pressure 10-10 mbar (H2), ion temperature 300 eV. The calculation includes radiative recombination and charge exchange. After 100 ms, the majority (80%) of the Fe ions are in the He-like charge state.
c
b
a
d
Excitation electrodes .
Central trap electrode .
Drift tube insulators
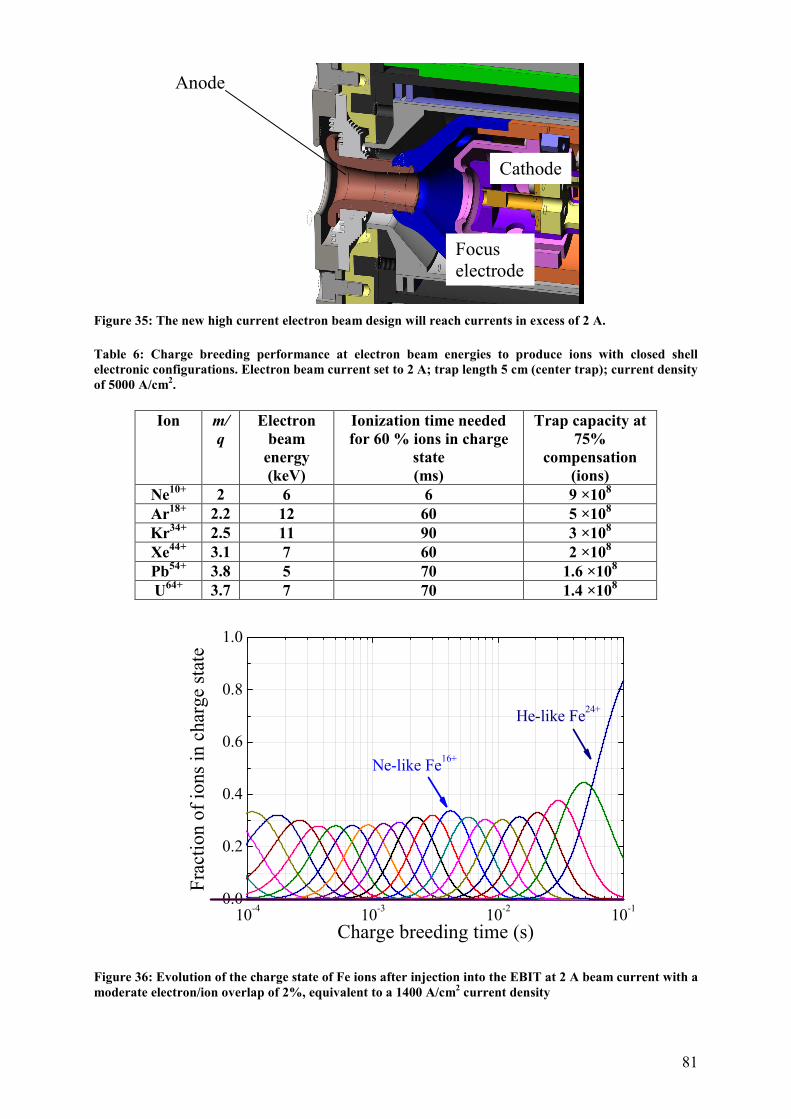
81
Figure 35: The new high current electron beam design will reach currents in excess of 2 A. Table 6: Charge breeding performance at electron beam energies to produce ions with closed shell electronic configurations. Electron beam current set to 2 A; trap length 5 cm (center trap); current density of 5000 A/cm2.
Ion m/
q
Electron beam
energy (keV)
Ionization time needed for 60 % ions in charge
state (ms)
Trap capacity at 75%
compensation (ions)
Ne10+ 2 6 6 9 ×10⁸
Ar18+ 2.2 12 60 5 ×10⁸ Kr34+ 2.5 11 90 3 ×10⁸ Xe44+ 3.1 7 60 2 ×10⁸ Pb54+ 3.8 5 70 1.6 ×10⁸ U64+ 3.7 7 70 1.4 ×10⁸
10-4
10-3
10-2
10-1
0.0
0.2
0.4
0.6
0.8
1.0
Ne-like Fe16+
Fra
ctio
n of
ion
s in
cha
rge
stat
e
Charge breeding time (s)
He-like Fe24+
Figure 36: Evolution of the charge state of Fe ions after injection into the EBIT at 2 A beam current with a moderate electron/ion overlap of 2%, equivalent to a 1400 A/cm2 current density
Anode
Cathode
Focus electrode
82
3.2.2 PARTS AND EQUIPMENT
The essential elements, electron gun, drift tube section, and electron collector are to be built at the MPIK workshop. The following equipment is additionally required:
-A cryogen-free 6 T superconducting magnet, UHV design. -A 350 kV high voltage platform (1 m by 1 m) for electron gun -High voltage cage (3 m by 3 m). -5 turbomolecular pumps (300 l/s). -6 turbomolecular pumps (70 l/s). -3 NEG modules (1000 l/s). -NEG conditioning unit. -3 scroll pumps, 2 diaphragm pumps. -A 300 mm Z-manipulator with tilt stage and XY 25 mm by 25 mm adjustment. -A 350 kV, 0.5 mA power supply (acceleration). -A 40 kV, 0.5 mA power supply (drift tube assembly). -A 5 kV, 2000 mA power supply (gun). -Two 100 A, 20 V coil power supplies. -20 modules 5 kV, 100 µA (drift tubes). -Three high voltage (Trek) amplifiers (+/- 40 kV, 20 mA; +/- 20 kV, 20 mA; +/- 10
kV, 20 mA) for acceleration energy control and electron beam emission control. -Two insulation transformers (300 kV, 10 kVA and 50 kV, 4 kVA) for high voltage
platforms. -A dielectric liquid cooling system for 350 kV, 8 kW. -Three control computers including (each) 20 analogue DAC channels and 20
analogue ADC channels for experiment control. -A safety interlock system for the high voltage cages, x-ray emission, and magnetic
field. -Lead shielding (8 mm, 4 m2, about 400 kg) surrounding the central EBIT chamber,
the electron gun chamber, and the collector chamber.
3.2.3 DIAGNOSTICS
The ions produced in the EBIT can be extracted at low energy and transferred to other experiments. A Q/A diagnostic unit and a beam emittance meter will be required to monitor the beam quality. The emittance meter has to use a position sensitive detector, since the ion flux from an EBIT renders standard current measurements too noisy. A “pepper pot” emittance meter is well suited for the purpose. In addition to the extracted ion mass analysis system, five different spectroscopic arrangements are proposed: 1) a low-resolution solid state x-ray detector with large solid angle. 2) a high-resolution x-ray crystal/grating spectrometer. 3) a VUV spectrometer with high resolution. 4) a high resolution optical spectrometer. 5) a fluorescence detection system equipped with several cooled photomultipliers and a optical filter system. This instrumentation will allow the monitoring of the charge breeding process with sufficient resolution to follow the time dependence. A multi-parameter data-acquisition
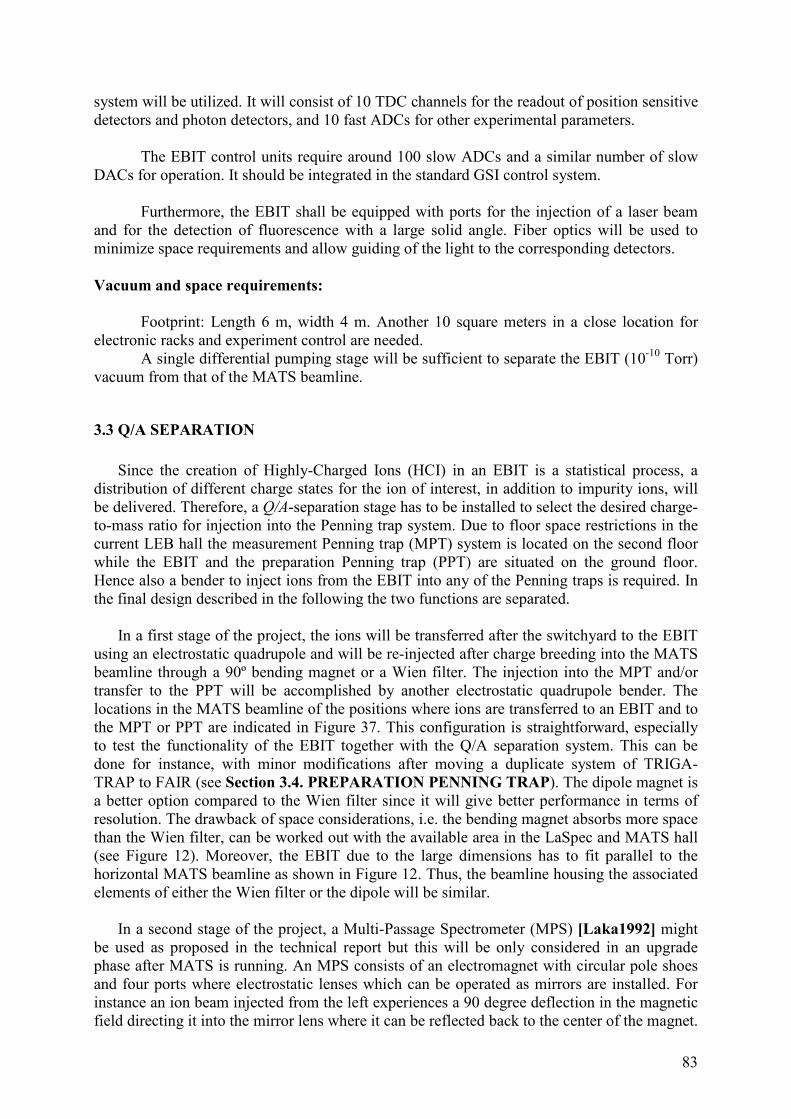
83
system will be utilized. It will consist of 10 TDC channels for the readout of position sensitive detectors and photon detectors, and 10 fast ADCs for other experimental parameters. The EBIT control units require around 100 slow ADCs and a similar number of slow DACs for operation. It should be integrated in the standard GSI control system. Furthermore, the EBIT shall be equipped with ports for the injection of a laser beam and for the detection of fluorescence with a large solid angle. Fiber optics will be used to minimize space requirements and allow guiding of the light to the corresponding detectors. Vacuum and space requirements: Footprint: Length 6 m, width 4 m. Another 10 square meters in a close location for electronic racks and experiment control are needed. A single differential pumping stage will be sufficient to separate the EBIT (10-10 Torr)
vacuum from that of the MATS beamline.
3.3 Q/A SEPARATION
Since the creation of Highly-Charged Ions (HCI) in an EBIT is a statistical process, a
distribution of different charge states for the ion of interest, in addition to impurity ions, will be delivered. Therefore, a Q/A-separation stage has to be installed to select the desired charge-to-mass ratio for injection into the Penning trap system. Due to floor space restrictions in the current LEB hall the measurement Penning trap (MPT) system is located on the second floor while the EBIT and the preparation Penning trap (PPT) are situated on the ground floor. Hence also a bender to inject ions from the EBIT into any of the Penning traps is required. In the final design described in the following the two functions are separated.
In a first stage of the project, the ions will be transferred after the switchyard to the EBIT
using an electrostatic quadrupole and will be re-injected after charge breeding into the MATS beamline through a 90º bending magnet or a Wien filter. The injection into the MPT and/or transfer to the PPT will be accomplished by another electrostatic quadrupole bender. The locations in the MATS beamline of the positions where ions are transferred to an EBIT and to the MPT or PPT are indicated in Figure 37. This configuration is straightforward, especially to test the functionality of the EBIT together with the Q/A separation system. This can be done for instance, with minor modifications after moving a duplicate system of TRIGA-TRAP to FAIR (see Section 3.4. PREPARATION PENNING TRAP). The dipole magnet is a better option compared to the Wien filter since it will give better performance in terms of resolution. The drawback of space considerations, i.e. the bending magnet absorbs more space than the Wien filter, can be worked out with the available area in the LaSpec and MATS hall (see Figure 12). Moreover, the EBIT due to the large dimensions has to fit parallel to the horizontal MATS beamline as shown in Figure 12. Thus, the beamline housing the associated elements of either the Wien filter or the dipole will be similar.
In a second stage of the project, a Multi-Passage Spectrometer (MPS) [Laka1992] might
be used as proposed in the technical report but this will be only considered in an upgrade phase after MATS is running. An MPS consists of an electromagnet with circular pole shoes and four ports where electrostatic lenses which can be operated as mirrors are installed. For instance an ion beam injected from the left experiences a 90 degree deflection in the magnetic field directing it into the mirror lens where it can be reflected back to the center of the magnet.
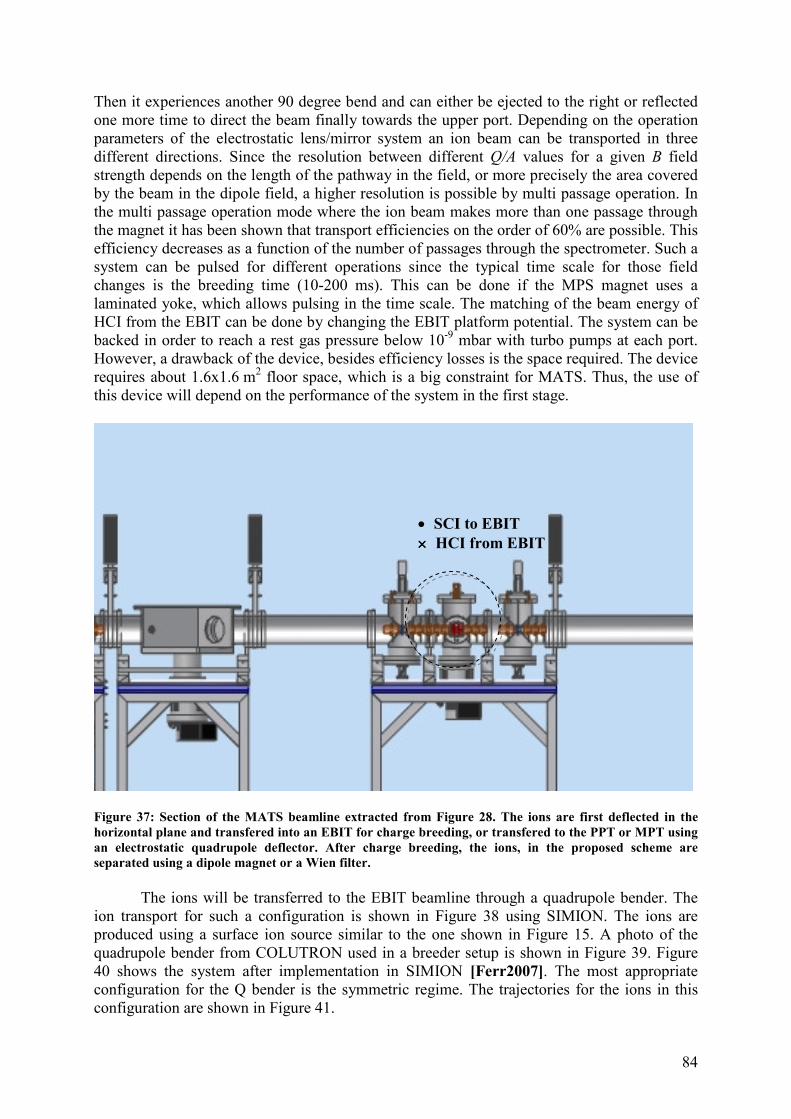
84
Then it experiences another 90 degree bend and can either be ejected to the right or reflected one more time to direct the beam finally towards the upper port. Depending on the operation parameters of the electrostatic lens/mirror system an ion beam can be transported in three different directions. Since the resolution between different Q/A values for a given B field strength depends on the length of the pathway in the field, or more precisely the area covered by the beam in the dipole field, a higher resolution is possible by multi passage operation. In the multi passage operation mode where the ion beam makes more than one passage through the magnet it has been shown that transport efficiencies on the order of 60% are possible. This efficiency decreases as a function of the number of passages through the spectrometer. Such a system can be pulsed for different operations since the typical time scale for those field changes is the breeding time (10-200 ms). This can be done if the MPS magnet uses a laminated yoke, which allows pulsing in the time scale. The matching of the beam energy of HCI from the EBIT can be done by changing the EBIT platform potential. The system can be backed in order to reach a rest gas pressure below 10-9 mbar with turbo pumps at each port. However, a drawback of the device, besides efficiency losses is the space required. The device requires about 1.6x1.6 m2 floor space, which is a big constraint for MATS. Thus, the use of this device will depend on the performance of the system in the first stage.
Figure 37: Section of the MATS beamline extracted from Figure 28. The ions are first deflected in the horizontal plane and transfered into an EBIT for charge breeding, or transfered to the PPT or MPT using an electrostatic quadrupole deflector. After charge breeding, the ions, in the proposed scheme are separated using a dipole magnet or a Wien filter. The ions will be transferred to the EBIT beamline through a quadrupole bender. The ion transport for such a configuration is shown in Figure 38 using SIMION. The ions are produced using a surface ion source similar to the one shown in Figure 15. A photo of the quadrupole bender from COLUTRON used in a breeder setup is shown in Figure 39. Figure 40 shows the system after implementation in SIMION [Ferr2007]. The most appropriate configuration for the Q bender is the symmetric regime. The trajectories for the ions in this configuration are shown in Figure 41.
• SCI to EBIT ×××× HCI from EBIT
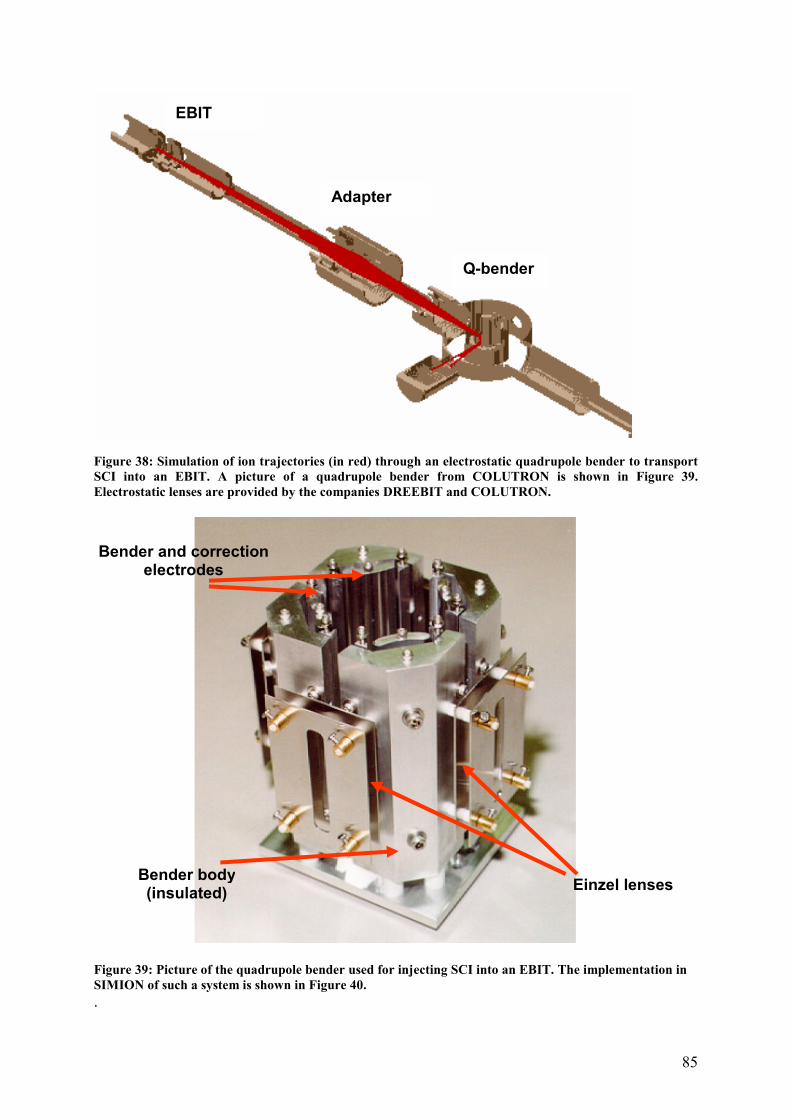
85
Figure 38: Simulation of ion trajectories (in red) through an electrostatic quadrupole bender to transport SCI into an EBIT. A picture of a quadrupole bender from COLUTRON is shown in Figure 39. Electrostatic lenses are provided by the companies DREEBIT and COLUTRON.
Figure 39: Picture of the quadrupole bender used for injecting SCI into an EBIT. The implementation in SIMION of such a system is shown in Figure 40. .
Bender body (insulated)
Einzel lenses
Bender and correction electrodes
EBIT
Adapter
Q-bender
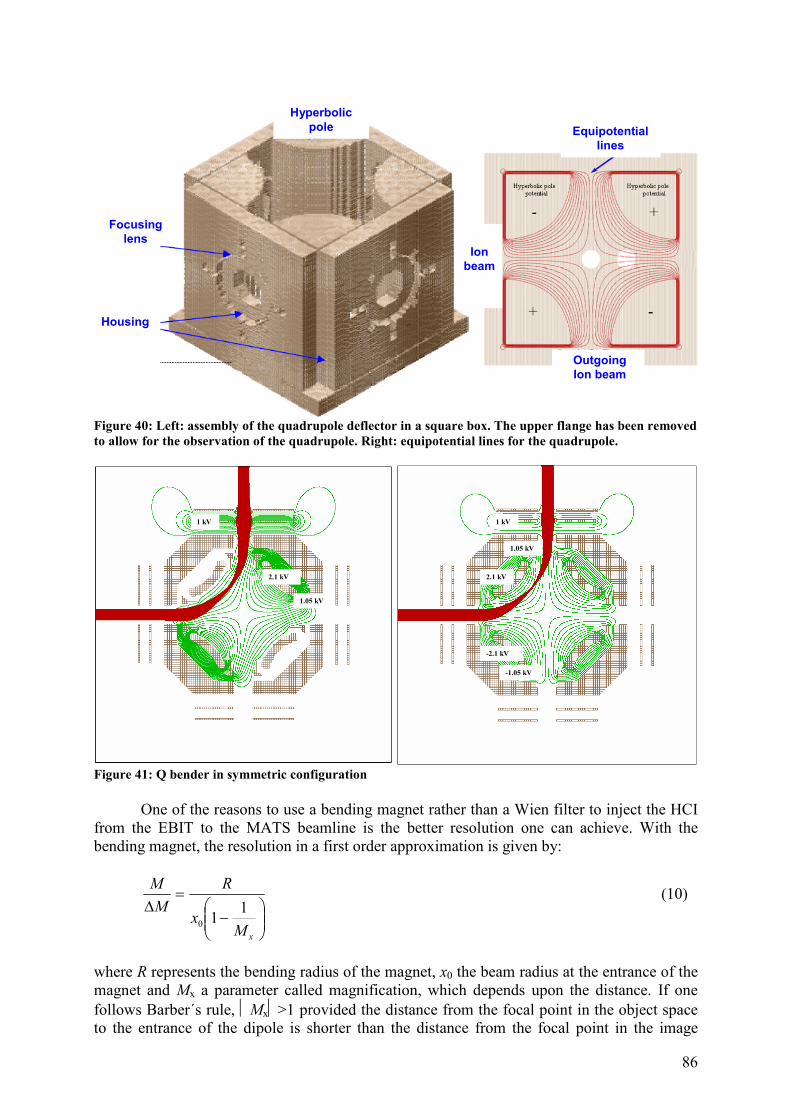
86
Figure 40: Left: assembly of the quadrupole deflector in a square box. The upper flange has been removed to allow for the observation of the quadrupole. Right: equipotential lines for the quadrupole.
Figure 41: Q bender in symmetric configuration One of the reasons to use a bending magnet rather than a Wien filter to inject the HCI from the EBIT to the MATS beamline is the better resolution one can achieve. With the bending magnet, the resolution in a first order approximation is given by:
−
=∆
xMx
R
M
M
110
(10)
where R represents the bending radius of the magnet, x0 the beam radius at the entrance of the magnet and Mx a parameter called magnification, which depends upon the distance. If one follows Barber´s rule, Mx>1 provided the distance from the focal point in the object space to the entrance of the dipole is shorter than the distance from the focal point in the image
Focusing
lens
Housing
Hyperbolic
pole
Outgoing
Ion beam
Ion
beam
Equipotential
lines
1 kV
1.05 kV
2.1 kV
1 kV
1.05 kV
-1.05 kV
2.1 kV
-2.1 kV
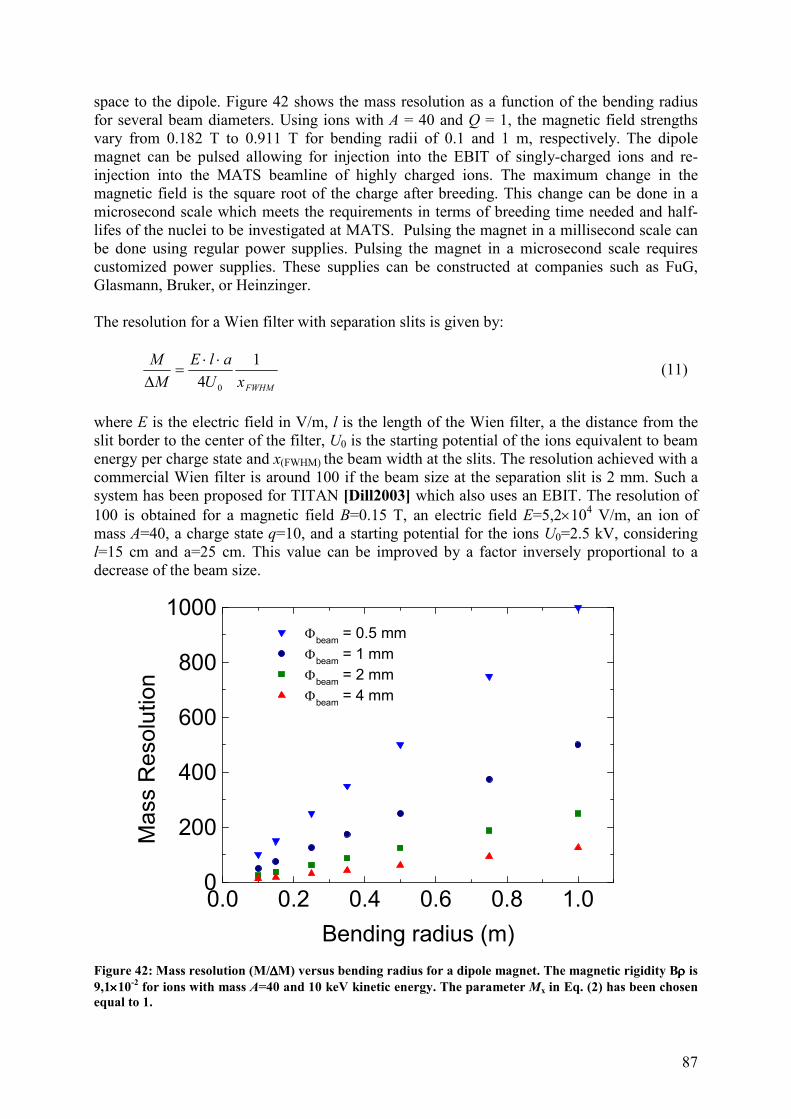
87
space to the dipole. Figure 42 shows the mass resolution as a function of the bending radius for several beam diameters. Using ions with A = 40 and Q = 1, the magnetic field strengths vary from 0.182 T to 0.911 T for bending radii of 0.1 and 1 m, respectively. The dipole magnet can be pulsed allowing for injection into the EBIT of singly-charged ions and re-injection into the MATS beamline of highly charged ions. The maximum change in the magnetic field is the square root of the charge after breeding. This change can be done in a microsecond scale which meets the requirements in terms of breeding time needed and half-lifes of the nuclei to be investigated at MATS. Pulsing the magnet in a millisecond scale can be done using regular power supplies. Pulsing the magnet in a microsecond scale requires customized power supplies. These supplies can be constructed at companies such as FuG, Glasmann, Bruker, or Heinzinger. The resolution for a Wien filter with separation slits is given by:
FWHMxU
alE
M
M 1
4 0
⋅⋅=
∆ (11)
where E is the electric field in V/m, l is the length of the Wien filter, a the distance from the slit border to the center of the filter, U0 is the starting potential of the ions equivalent to beam energy per charge state and x(FWHM) the beam width at the slits. The resolution achieved with a commercial Wien filter is around 100 if the beam size at the separation slit is 2 mm. Such a system has been proposed for TITAN [Dill2003] which also uses an EBIT. The resolution of 100 is obtained for a magnetic field B=0.15 T, an electric field E=5,2×10⁴ V/m, an ion of mass A=40, a charge state q=10, and a starting potential for the ions U0=2.5 kV, considering l=15 cm and a=25 cm. This value can be improved by a factor inversely proportional to a decrease of the beam size.
Figure 42: Mass resolution (M/∆∆∆∆M) versus bending radius for a dipole magnet. The magnetic rigidity Bρρρρ is 9,1××××10-2 for ions with mass A=40 and 10 keV kinetic energy. The parameter Mx in Eq. (2) has been chosen equal to 1.
0.0 0.2 0.4 0.6 0.8 1.00
200
400
600
800
1000
Φbeam
= 0.5 mm
Φbeam
= 1 mm
Φbeam
= 2 mm
Φbeam
= 4 mm
Ma
ss
Re
so
luti
on
Bending radius (m)
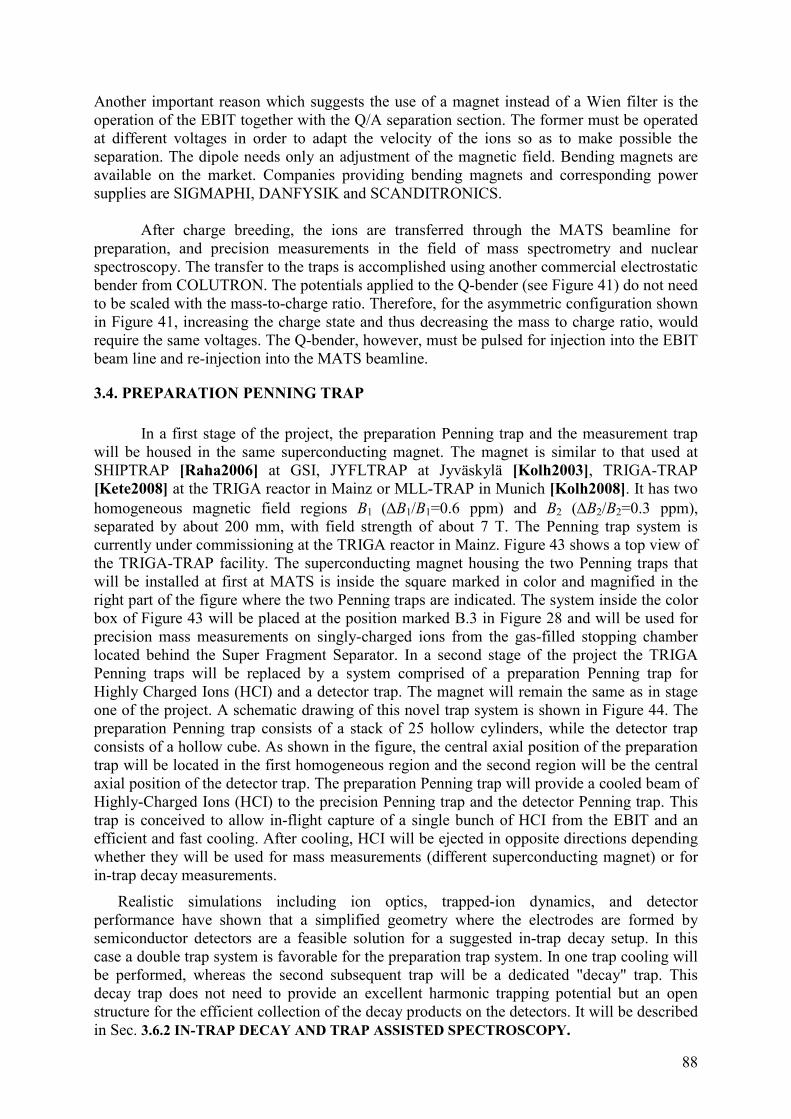
88
Another important reason which suggests the use of a magnet instead of a Wien filter is the operation of the EBIT together with the Q/A separation section. The former must be operated at different voltages in order to adapt the velocity of the ions so as to make possible the separation. The dipole needs only an adjustment of the magnetic field. Bending magnets are available on the market. Companies providing bending magnets and corresponding power supplies are SIGMAPHI, DANFYSIK and SCANDITRONICS. After charge breeding, the ions are transferred through the MATS beamline for preparation, and precision measurements in the field of mass spectrometry and nuclear spectroscopy. The transfer to the traps is accomplished using another commercial electrostatic bender from COLUTRON. The potentials applied to the Q-bender (see Figure 41) do not need to be scaled with the mass-to-charge ratio. Therefore, for the asymmetric configuration shown in Figure 41, increasing the charge state and thus decreasing the mass to charge ratio, would require the same voltages. The Q-bender, however, must be pulsed for injection into the EBIT beam line and re-injection into the MATS beamline.
3.4. PREPARATION PENNING TRAP
In a first stage of the project, the preparation Penning trap and the measurement trap
will be housed in the same superconducting magnet. The magnet is similar to that used at SHIPTRAP [Raha2006] at GSI, JYFLTRAP at Jyväskylä [Kolh2003], TRIGA-TRAP [Kete2008] at the TRIGA reactor in Mainz or MLL-TRAP in Munich [Kolh2008]. It has two homogeneous magnetic field regions B1 (∆B1/B1=0.6 ppm) and B2 (∆B2/B2=0.3 ppm), separated by about 200 mm, with field strength of about 7 T. The Penning trap system is currently under commissioning at the TRIGA reactor in Mainz. Figure 43 shows a top view of the TRIGA-TRAP facility. The superconducting magnet housing the two Penning traps that will be installed at first at MATS is inside the square marked in color and magnified in the right part of the figure where the two Penning traps are indicated. The system inside the color box of Figure 43 will be placed at the position marked B.3 in Figure 28 and will be used for precision mass measurements on singly-charged ions from the gas-filled stopping chamber located behind the Super Fragment Separator. In a second stage of the project the TRIGA Penning traps will be replaced by a system comprised of a preparation Penning trap for Highly Charged Ions (HCI) and a detector trap. The magnet will remain the same as in stage one of the project. A schematic drawing of this novel trap system is shown in Figure 44. The preparation Penning trap consists of a stack of 25 hollow cylinders, while the detector trap consists of a hollow cube. As shown in the figure, the central axial position of the preparation trap will be located in the first homogeneous region and the second region will be the central axial position of the detector trap. The preparation Penning trap will provide a cooled beam of Highly-Charged Ions (HCI) to the precision Penning trap and the detector Penning trap. This trap is conceived to allow in-flight capture of a single bunch of HCI from the EBIT and an efficient and fast cooling. After cooling, HCI will be ejected in opposite directions depending whether they will be used for mass measurements (different superconducting magnet) or for in-trap decay measurements.
Realistic simulations including ion optics, trapped-ion dynamics, and detector performance have shown that a simplified geometry where the electrodes are formed by semiconductor detectors are a feasible solution for a suggested in-trap decay setup. In this case a double trap system is favorable for the preparation trap system. In one trap cooling will be performed, whereas the second subsequent trap will be a dedicated "decay" trap. This decay trap does not need to provide an excellent harmonic trapping potential but an open structure for the efficient collection of the decay products on the detectors. It will be described in Sec. 3.6.2 IN-TRAP DECAY AND TRAP ASSISTED SPECTROSCOPY.
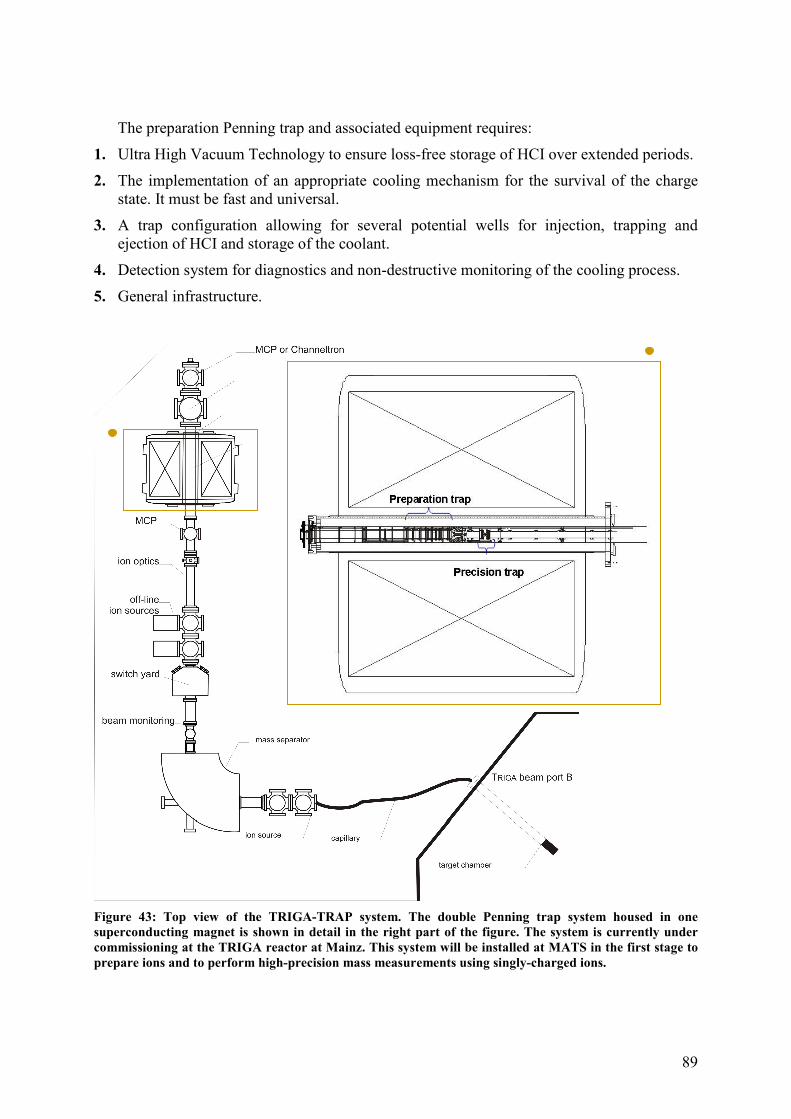
89
The preparation Penning trap and associated equipment requires:
1. Ultra High Vacuum Technology to ensure loss-free storage of HCI over extended periods.
2. The implementation of an appropriate cooling mechanism for the survival of the charge state. It must be fast and universal.
3. A trap configuration allowing for several potential wells for injection, trapping and ejection of HCI and storage of the coolant.
4. Detection system for diagnostics and non-destructive monitoring of the cooling process.
5. General infrastructure.
Figure 43: Top view of the TRIGA-TRAP system. The double Penning trap system housed in one superconducting magnet is shown in detail in the right part of the figure. The system is currently under commissioning at the TRIGA reactor at Mainz. This system will be installed at MATS in the first stage to prepare ions and to perform high-precision mass measurements using singly-charged ions.
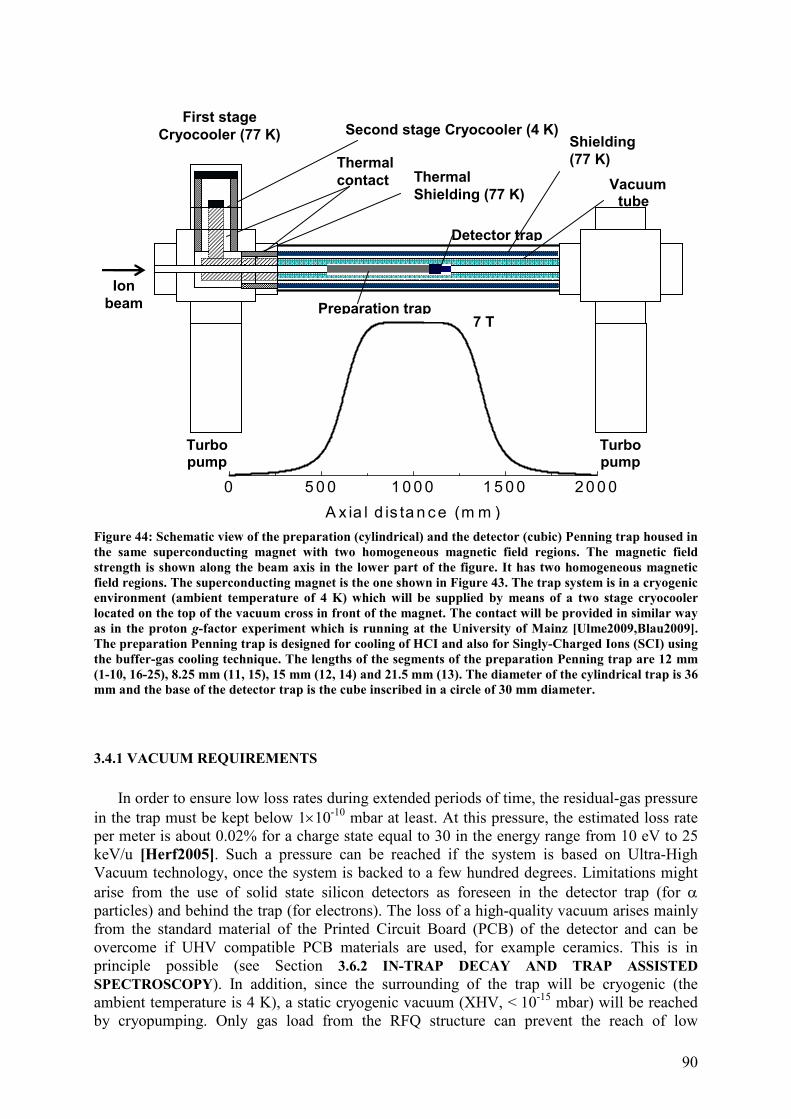
90
Figure 44: Schematic view of the preparation (cylindrical) and the detector (cubic) Penning trap housed in the same superconducting magnet with two homogeneous magnetic field regions. The magnetic field strength is shown along the beam axis in the lower part of the figure. It has two homogeneous magnetic field regions. The superconducting magnet is the one shown in Figure 43. The trap system is in a cryogenic environment (ambient temperature of 4 K) which will be supplied by means of a two stage cryocooler located on the top of the vacuum cross in front of the magnet. The contact will be provided in similar way as in the proton g-factor experiment which is running at the University of Mainz [Ulme2009,Blau2009]. The preparation Penning trap is designed for cooling of HCI and also for Singly-Charged Ions (SCI) using the buffer-gas cooling technique. The lengths of the segments of the preparation Penning trap are 12 mm (1-10, 16-25), 8.25 mm (11, 15), 15 mm (12, 14) and 21.5 mm (13). The diameter of the cylindrical trap is 36 mm and the base of the detector trap is the cube inscribed in a circle of 30 mm diameter.
3.4.1 VACUUM REQUIREMENTS
In order to ensure low loss rates during extended periods of time, the residual-gas pressure
in the trap must be kept below 1×10⁻¹⁰ mbar at least. At this pressure, the estimated loss rate per meter is about 0.02% for a charge state equal to 30 in the energy range from 10 eV to 25 keV/u [Herf2005]. Such a pressure can be reached if the system is based on Ultra-High Vacuum technology, once the system is backed to a few hundred degrees. Limitations might arise from the use of solid state silicon detectors as foreseen in the detector trap (for α particles) and behind the trap (for electrons). The loss of a high-quality vacuum arises mainly from the standard material of the Printed Circuit Board (PCB) of the detector and can be overcome if UHV compatible PCB materials are used, for example ceramics. This is in principle possible (see Section 3.6.2 IN-TRAP DECAY AND TRAP ASSISTED SPECTROSCOPY). In addition, since the surrounding of the trap will be cryogenic (the ambient temperature is 4 K), a static cryogenic vacuum (XHV, < 10-15 mbar) will be reached by cryopumping. Only gas load from the RFQ structure can prevent the reach of low
0 5 0 0 1 0 0 0 1 5 0 0 2 0 0 0
A x ia l d is ta n c e (m m )
Vacuum tube
Preparation trap
Detector trap
Thermal
contact
Second stage Cryocooler (4 K)
Ion
beam
Thermal
Shielding (77 K)
First stage
Cryocooler (77 K)
Turbo pump
Turbo pump
7 T
Shielding
(77 K)
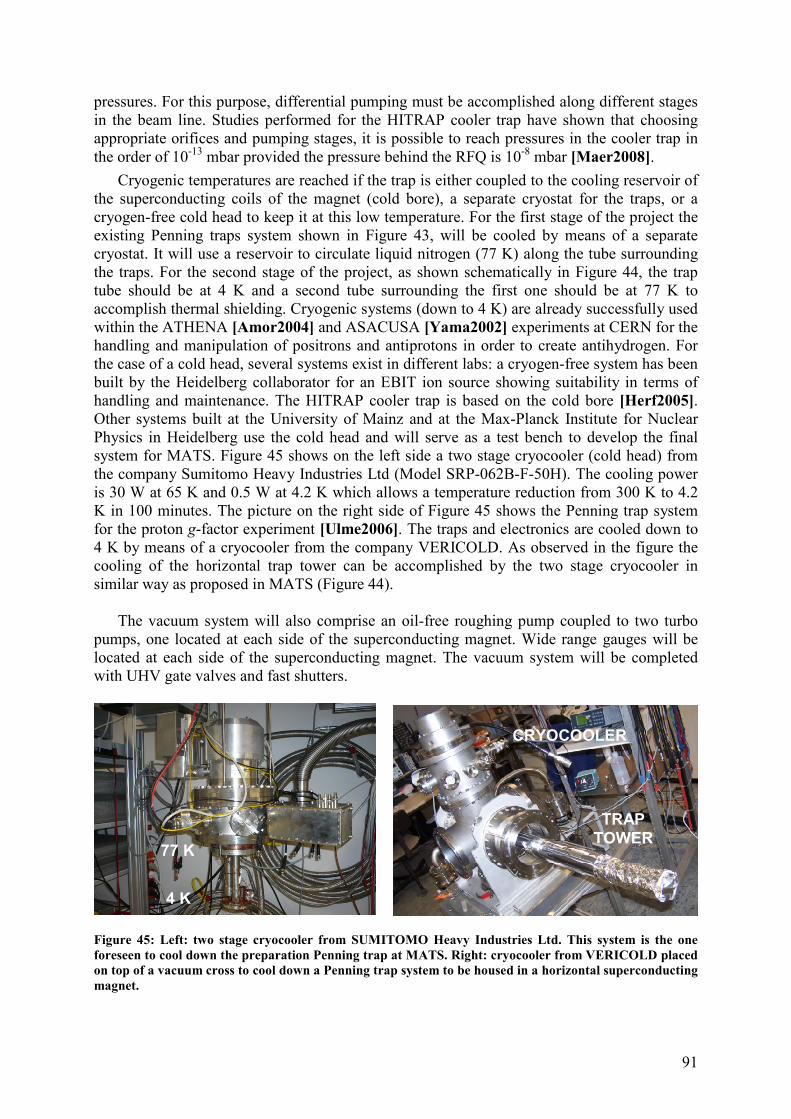
91
pressures. For this purpose, differential pumping must be accomplished along different stages in the beam line. Studies performed for the HITRAP cooler trap have shown that choosing appropriate orifices and pumping stages, it is possible to reach pressures in the cooler trap in the order of 10-13 mbar provided the pressure behind the RFQ is 10-8 mbar [Maer2008].
Cryogenic temperatures are reached if the trap is either coupled to the cooling reservoir of the superconducting coils of the magnet (cold bore), a separate cryostat for the traps, or a cryogen-free cold head to keep it at this low temperature. For the first stage of the project the existing Penning traps system shown in Figure 43, will be cooled by means of a separate cryostat. It will use a reservoir to circulate liquid nitrogen (77 K) along the tube surrounding the traps. For the second stage of the project, as shown schematically in Figure 44, the trap tube should be at 4 K and a second tube surrounding the first one should be at 77 K to accomplish thermal shielding. Cryogenic systems (down to 4 K) are already successfully used within the ATHENA [Amor2004] and ASACUSA [Yama2002] experiments at CERN for the handling and manipulation of positrons and antiprotons in order to create antihydrogen. For the case of a cold head, several systems exist in different labs: a cryogen-free system has been built by the Heidelberg collaborator for an EBIT ion source showing suitability in terms of handling and maintenance. The HITRAP cooler trap is based on the cold bore [Herf2005]. Other systems built at the University of Mainz and at the Max-Planck Institute for Nuclear Physics in Heidelberg use the cold head and will serve as a test bench to develop the final system for MATS. Figure 45 shows on the left side a two stage cryocooler (cold head) from the company Sumitomo Heavy Industries Ltd (Model SRP-062B-F-50H). The cooling power is 30 W at 65 K and 0.5 W at 4.2 K which allows a temperature reduction from 300 K to 4.2 K in 100 minutes. The picture on the right side of Figure 45 shows the Penning trap system for the proton g-factor experiment [Ulme2006]. The traps and electronics are cooled down to 4 K by means of a cryocooler from the company VERICOLD. As observed in the figure the cooling of the horizontal trap tower can be accomplished by the two stage cryocooler in similar way as proposed in MATS (Figure 44).
The vacuum system will also comprise an oil-free roughing pump coupled to two turbo pumps, one located at each side of the superconducting magnet. Wide range gauges will be located at each side of the superconducting magnet. The vacuum system will be completed with UHV gate valves and fast shutters.
Figure 45: Left: two stage cryocooler from SUMITOMO Heavy Industries Ltd. This system is the one foreseen to cool down the preparation Penning trap at MATS. Right: cryocooler from VERICOLD placed on top of a vacuum cross to cool down a Penning trap system to be housed in a horizontal superconducting magnet.
4 K
77 K
TRAP
TOWER
CRYOCOOLER
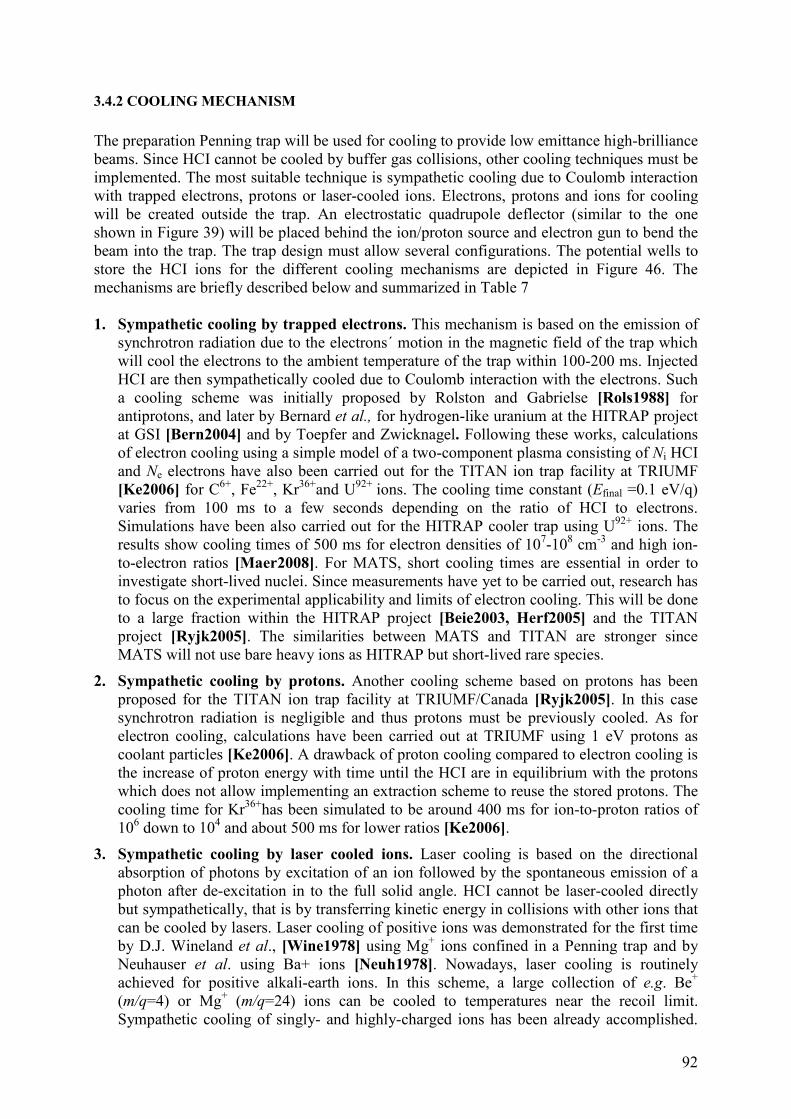
92
3.4.2 COOLING MECHANISM
The preparation Penning trap will be used for cooling to provide low emittance high-brilliance beams. Since HCI cannot be cooled by buffer gas collisions, other cooling techniques must be implemented. The most suitable technique is sympathetic cooling due to Coulomb interaction with trapped electrons, protons or laser-cooled ions. Electrons, protons and ions for cooling will be created outside the trap. An electrostatic quadrupole deflector (similar to the one shown in Figure 39) will be placed behind the ion/proton source and electron gun to bend the beam into the trap. The trap design must allow several configurations. The potential wells to store the HCI ions for the different cooling mechanisms are depicted in Figure 46. The mechanisms are briefly described below and summarized in Table 7 1. Sympathetic cooling by trapped electrons. This mechanism is based on the emission of
synchrotron radiation due to the electrons´ motion in the magnetic field of the trap which will cool the electrons to the ambient temperature of the trap within 100-200 ms. Injected HCI are then sympathetically cooled due to Coulomb interaction with the electrons. Such a cooling scheme was initially proposed by Rolston and Gabrielse [Rols1988] for antiprotons, and later by Bernard et al., for hydrogen-like uranium at the HITRAP project at GSI [Bern2004] and by Toepfer and Zwicknagel. Following these works, calculations of electron cooling using a simple model of a two-component plasma consisting of Ni HCI and Ne electrons have also been carried out for the TITAN ion trap facility at TRIUMF [Ke2006] for C6+, Fe22+, Kr36+and U92+ ions. The cooling time constant (Efinal =0.1 eV/q) varies from 100 ms to a few seconds depending on the ratio of HCI to electrons. Simulations have been also carried out for the HITRAP cooler trap using U92+ ions. The results show cooling times of 500 ms for electron densities of 107-108 cm-3 and high ion-to-electron ratios [Maer2008]. For MATS, short cooling times are essential in order to investigate short-lived nuclei. Since measurements have yet to be carried out, research has to focus on the experimental applicability and limits of electron cooling. This will be done to a large fraction within the HITRAP project [Beie2003, Herf2005] and the TITAN project [Ryjk2005]. The similarities between MATS and TITAN are stronger since MATS will not use bare heavy ions as HITRAP but short-lived rare species.
2. Sympathetic cooling by protons. Another cooling scheme based on protons has been proposed for the TITAN ion trap facility at TRIUMF/Canada [Ryjk2005]. In this case synchrotron radiation is negligible and thus protons must be previously cooled. As for electron cooling, calculations have been carried out at TRIUMF using 1 eV protons as coolant particles [Ke2006]. A drawback of proton cooling compared to electron cooling is the increase of proton energy with time until the HCI are in equilibrium with the protons which does not allow implementing an extraction scheme to reuse the stored protons. The cooling time for Kr36+has been simulated to be around 400 ms for ion-to-proton ratios of 106 down to 104 and about 500 ms for lower ratios [Ke2006].
3. Sympathetic cooling by laser cooled ions. Laser cooling is based on the directional absorption of photons by excitation of an ion followed by the spontaneous emission of a photon after de-excitation in to the full solid angle. HCI cannot be laser-cooled directly but sympathetically, that is by transferring kinetic energy in collisions with other ions that can be cooled by lasers. Laser cooling of positive ions was demonstrated for the first time by D.J. Wineland et al., [Wine1978] using Mg+ ions confined in a Penning trap and by Neuhauser et al. using Ba+ ions [Neuh1978]. Nowadays, laser cooling is routinely achieved for positive alkali-earth ions. In this scheme, a large collection of e.g. Be+ (m/q=4) or Mg+ (m/q=24) ions can be cooled to temperatures near the recoil limit. Sympathetic cooling of singly- and highly-charged ions has been already accomplished.
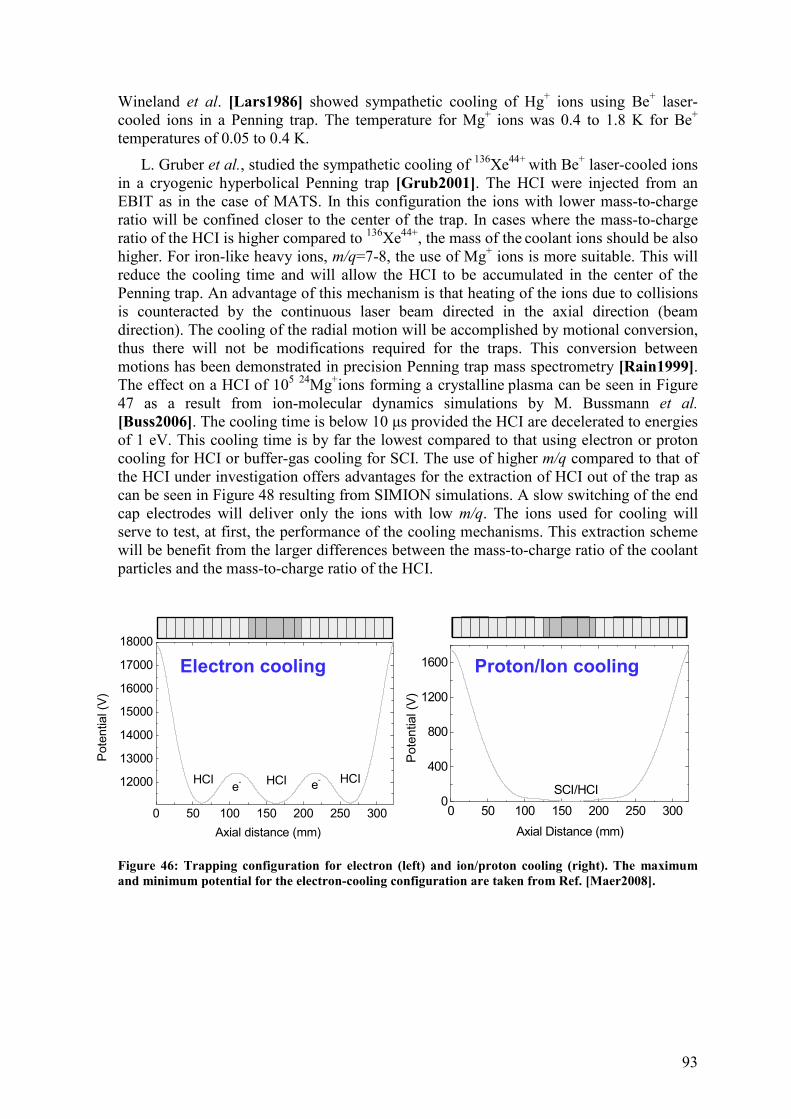
93
Wineland et al. [Lars1986] showed sympathetic cooling of Hg+ ions using Be+ laser-cooled ions in a Penning trap. The temperature for Mg+ ions was 0.4 to 1.8 K for Be+ temperatures of 0.05 to 0.4 K.
L. Gruber et al., studied the sympathetic cooling of 136Xe44+ with Be+ laser-cooled ions in a cryogenic hyperbolical Penning trap [Grub2001]. The HCI were injected from an EBIT as in the case of MATS. In this configuration the ions with lower mass-to-charge ratio will be confined closer to the center of the trap. In cases where the mass-to-charge ratio of the HCI is higher compared to 136Xe44+, the mass of the coolant ions should be also higher. For iron-like heavy ions, m/q=7-8, the use of Mg+ ions is more suitable. This will reduce the cooling time and will allow the HCI to be accumulated in the center of the Penning trap. An advantage of this mechanism is that heating of the ions due to collisions is counteracted by the continuous laser beam directed in the axial direction (beam direction). The cooling of the radial motion will be accomplished by motional conversion, thus there will not be modifications required for the traps. This conversion between motions has been demonstrated in precision Penning trap mass spectrometry [Rain1999]. The effect on a HCI of 105 24Mg+ions forming a crystalline plasma can be seen in Figure 47 as a result from ion-molecular dynamics simulations by M. Bussmann et al.
[Buss2006]. The cooling time is below 10 µs provided the HCI are decelerated to energies of 1 eV. This cooling time is by far the lowest compared to that using electron or proton cooling for HCI or buffer-gas cooling for SCI. The use of higher m/q compared to that of the HCI under investigation offers advantages for the extraction of HCI out of the trap as can be seen in Figure 48 resulting from SIMION simulations. A slow switching of the end cap electrodes will deliver only the ions with low m/q. The ions used for cooling will serve to test, at first, the performance of the cooling mechanisms. This extraction scheme will be benefit from the larger differences between the mass-to-charge ratio of the coolant particles and the mass-to-charge ratio of the HCI.
Figure 46: Trapping configuration for electron (left) and ion/proton cooling (right). The maximum and minimum potential for the electron-cooling configuration are taken from Ref. [Maer2008].
0 50 100 150 200 250 300
12000
13000
14000
15000
16000
17000
18000
e-
e- HCIHCI
Po
ten
tia
l (V
)
Axial distance (mm)
HCI
0 50 100 150 200 250 3000
400
800
1200
1600
Po
ten
tia
l (V
)
Axial Distance (mm)
SCI/HCI
Electron cooling Proton/Ion cooling
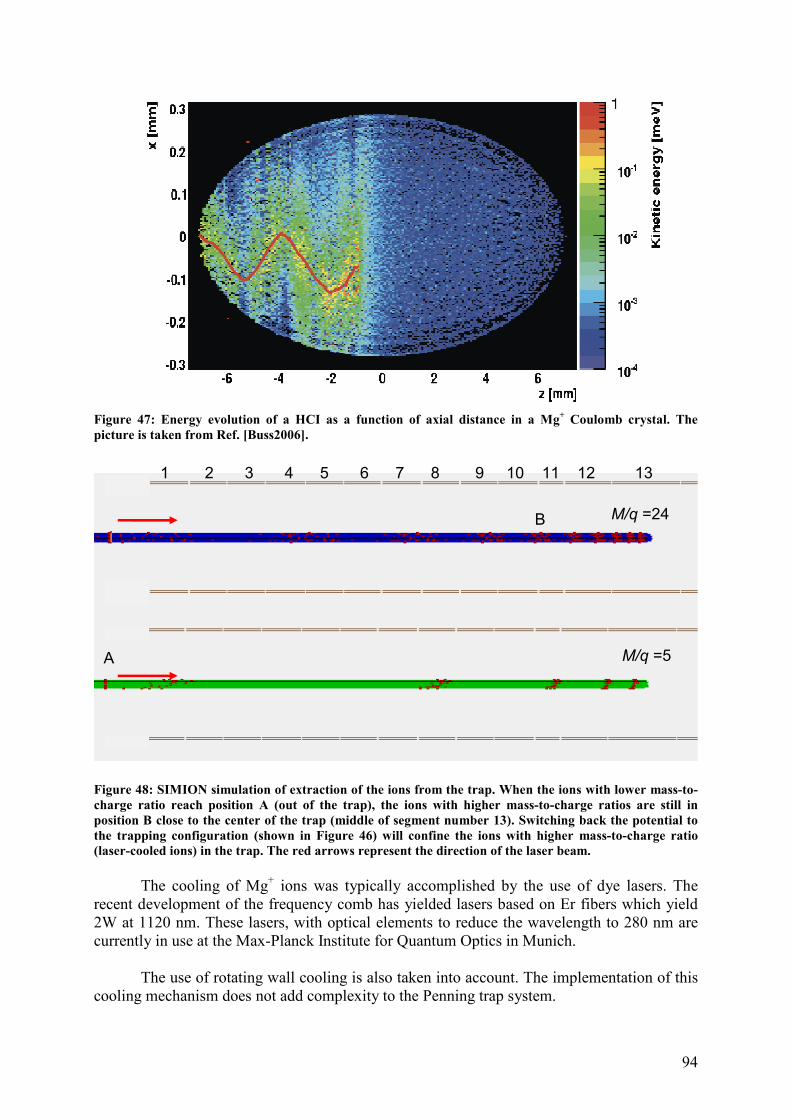
94
Figure 47: Energy evolution of a HCI as a function of axial distance in a Mg+ Coulomb crystal. The picture is taken from Ref. [Buss2006].
Figure 48: SIMION simulation of extraction of the ions from the trap. When the ions with lower mass-to-charge ratio reach position A (out of the trap), the ions with higher mass-to-charge ratios are still in position B close to the center of the trap (middle of segment number 13). Switching back the potential to the trapping configuration (shown in Figure 46) will confine the ions with higher mass-to-charge ratio (laser-cooled ions) in the trap. The red arrows represent the direction of the laser beam. The cooling of Mg+ ions was typically accomplished by the use of dye lasers. The recent development of the frequency comb has yielded lasers based on Er fibers which yield 2W at 1120 nm. These lasers, with optical elements to reduce the wavelength to 280 nm are currently in use at the Max-Planck Institute for Quantum Optics in Munich. The use of rotating wall cooling is also taken into account. The implementation of this cooling mechanism does not add complexity to the Penning trap system.
A
B M/q =24
M/q =5
1 2 3 4 5 6 7 8 9 10 11 12 13
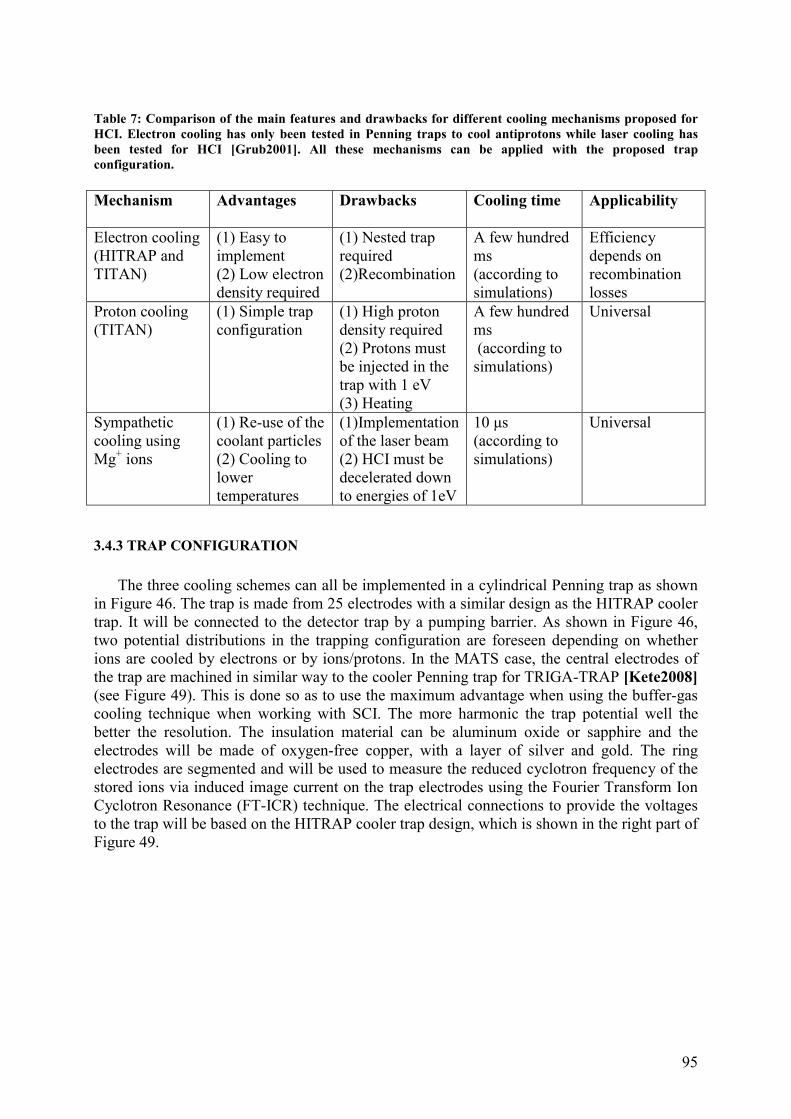
95
Table 7: Comparison of the main features and drawbacks for different cooling mechanisms proposed for HCI. Electron cooling has only been tested in Penning traps to cool antiprotons while laser cooling has been tested for HCI [Grub2001]. All these mechanisms can be applied with the proposed trap configuration. Mechanism
Advantages
Drawbacks
Cooling time
Applicability
Electron cooling (HITRAP and TITAN)
(1) Easy to implement (2) Low electron density required
(1) Nested trap required (2)Recombination
A few hundred ms (according to simulations)
Efficiency depends on recombination losses
Proton cooling (TITAN)
(1) Simple trap configuration
(1) High proton density required (2) Protons must be injected in the trap with 1 eV (3) Heating
A few hundred ms (according to simulations)
Universal
Sympathetic cooling using Mg+ ions
(1) Re-use of the coolant particles (2) Cooling to lower temperatures
(1)Implementation of the laser beam (2) HCI must be decelerated down to energies of 1eV
10 µs (according to simulations)
Universal
3.4.3 TRAP CONFIGURATION
The three cooling schemes can all be implemented in a cylindrical Penning trap as shown
in Figure 46. The trap is made from 25 electrodes with a similar design as the HITRAP cooler trap. It will be connected to the detector trap by a pumping barrier. As shown in Figure 46, two potential distributions in the trapping configuration are foreseen depending on whether ions are cooled by electrons or by ions/protons. In the MATS case, the central electrodes of the trap are machined in similar way to the cooler Penning trap for TRIGA-TRAP [Kete2008] (see Figure 49). This is done so as to use the maximum advantage when using the buffer-gas cooling technique when working with SCI. The more harmonic the trap potential well the better the resolution. The insulation material can be aluminum oxide or sapphire and the electrodes will be made of oxygen-free copper, with a layer of silver and gold. The ring electrodes are segmented and will be used to measure the reduced cyclotron frequency of the stored ions via induced image current on the trap electrodes using the Fourier Transform Ion Cyclotron Resonance (FT-ICR) technique. The electrical connections to provide the voltages to the trap will be based on the HITRAP cooler trap design, which is shown in the right part of Figure 49.
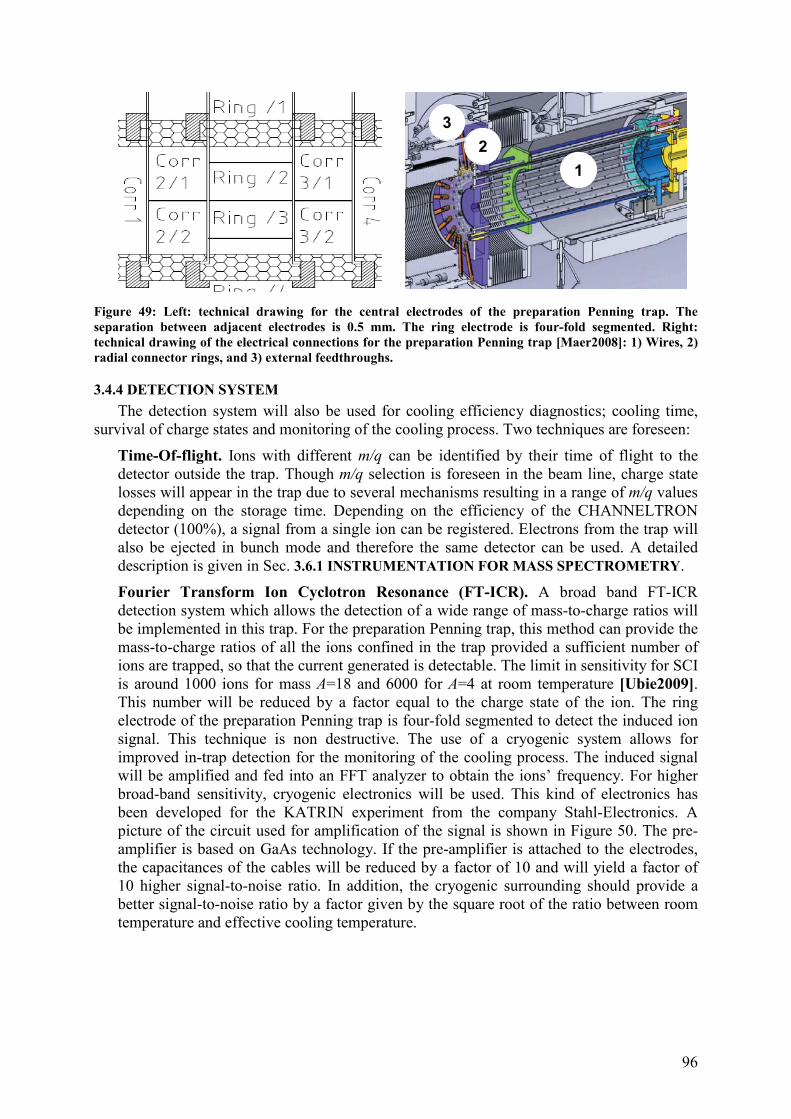
96
Figure 49: Left: technical drawing for the central electrodes of the preparation Penning trap. The separation between adjacent electrodes is 0.5 mm. The ring electrode is four-fold segmented. Right: technical drawing of the electrical connections for the preparation Penning trap [Maer2008]: 1) Wires, 2) radial connector rings, and 3) external feedthroughs.
3.4.4 DETECTION SYSTEM
The detection system will also be used for cooling efficiency diagnostics; cooling time, survival of charge states and monitoring of the cooling process. Two techniques are foreseen:
Time-Of-flight. Ions with different m/q can be identified by their time of flight to the detector outside the trap. Though m/q selection is foreseen in the beam line, charge state losses will appear in the trap due to several mechanisms resulting in a range of m/q values depending on the storage time. Depending on the efficiency of the CHANNELTRON detector (100%), a signal from a single ion can be registered. Electrons from the trap will also be ejected in bunch mode and therefore the same detector can be used. A detailed description is given in Sec. 3.6.1 INSTRUMENTATION FOR MASS SPECTROMETRY.
Fourier Transform Ion Cyclotron Resonance (FT-ICR). A broad band FT-ICR detection system which allows the detection of a wide range of mass-to-charge ratios will be implemented in this trap. For the preparation Penning trap, this method can provide the mass-to-charge ratios of all the ions confined in the trap provided a sufficient number of ions are trapped, so that the current generated is detectable. The limit in sensitivity for SCI is around 1000 ions for mass A=18 and 6000 for A=4 at room temperature [Ubie2009]. This number will be reduced by a factor equal to the charge state of the ion. The ring electrode of the preparation Penning trap is four-fold segmented to detect the induced ion signal. This technique is non destructive. The use of a cryogenic system allows for improved in-trap detection for the monitoring of the cooling process. The induced signal will be amplified and fed into an FFT analyzer to obtain the ions’ frequency. For higher broad-band sensitivity, cryogenic electronics will be used. This kind of electronics has been developed for the KATRIN experiment from the company Stahl-Electronics. A picture of the circuit used for amplification of the signal is shown in Figure 50. The pre-amplifier is based on GaAs technology. If the pre-amplifier is attached to the electrodes, the capacitances of the cables will be reduced by a factor of 10 and will yield a factor of 10 higher signal-to-noise ratio. In addition, the cryogenic surrounding should provide a better signal-to-noise ratio by a factor given by the square root of the ratio between room temperature and effective cooling temperature.
1
2
3
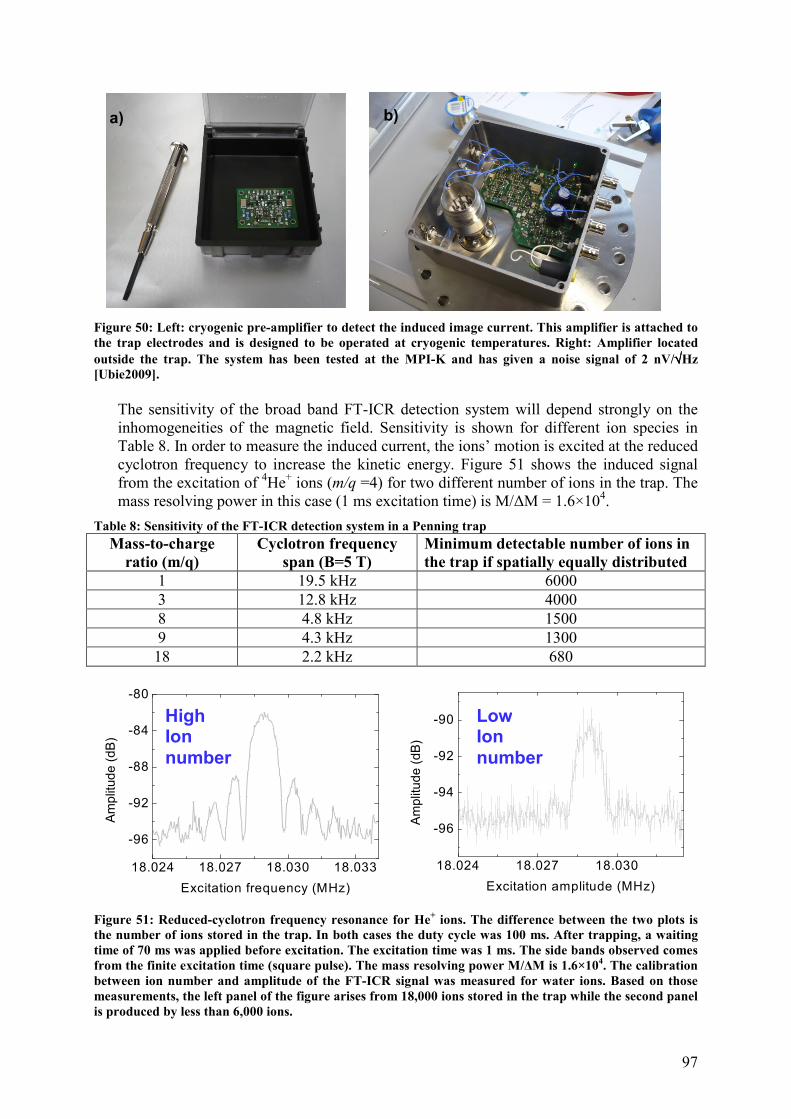
97
Figure 50: Left: cryogenic pre-amplifier to detect the induced image current. This amplifier is attached to the trap electrodes and is designed to be operated at cryogenic temperatures. Right: Amplifier located outside the trap. The system has been tested at the MPI-K and has given a noise signal of 2 nV/√√√√Hz [Ubie2009].
The sensitivity of the broad band FT-ICR detection system will depend strongly on the inhomogeneities of the magnetic field. Sensitivity is shown for different ion species in Table 8. In order to measure the induced current, the ions’ motion is excited at the reduced cyclotron frequency to increase the kinetic energy. Figure 51 shows the induced signal from the excitation of 4He+ ions (m/q =4) for two different number of ions in the trap. The mass resolving power in this case (1 ms excitation time) is M/∆M = 1.6×10⁴.
Table 8: Sensitivity of the FT-ICR detection system in a Penning trap
Mass-to-charge ratio (m/q)
Cyclotron frequency span (B=5 T)
Minimum detectable number of ions in the trap if spatially equally distributed
1 19.5 kHz 6000 3 12.8 kHz 4000 8 4.8 kHz 1500 9 4.3 kHz 1300
18 2.2 kHz 680
Figure 51: Reduced-cyclotron frequency resonance for He+ ions. The difference between the two plots is the number of ions stored in the trap. In both cases the duty cycle was 100 ms. After trapping, a waiting time of 70 ms was applied before excitation. The excitation time was 1 ms. The side bands observed comes from the finite excitation time (square pulse). The mass resolving power M/∆M is 1.6×10⁴. The calibration between ion number and amplitude of the FT-ICR signal was measured for water ions. Based on those measurements, the left panel of the figure arises from 18,000 ions stored in the trap while the second panel is produced by less than 6,000 ions.
a) b)
18.024 18.027 18.030 18.033
-96
-92
-88
-84
-80
Am
plit
ud
e (
dB
)
Excitation frequency (MHz)
18.024 18.027 18.030
-96
-94
-92
-90
Am
plit
ud
e (
dB
)
Excitation amplitude (MHz)
High Ion
number
Low Ion
number

98
3.4.5 GENERAL INFRASTRUCTURE
Electronics for general purposes comprises for example power supplies, switches and oscilloscopes. The superconducting magnet requires the use of an external power supply. A detailed description of devices and the cost is given in . Below a brief list is given
List of devices needed
• Superconducting magnet • DC power supplies, high stability and high precision • FFT analyser • Vacuum components (tubes, crosses, bellows) • Turbomolecular pumps • Cryopumps and/or ion getter pumps • Scroll pumps • Ion gauges / cold cathode, ionivac • Arbitrary function generators • HV switches • Low noise differential amplifier • Broad-band cryogenic detection electronics • Ion and electron source • Laser system plus ion optics elements
3.5. MEASUREMENT PENNING TRAP
The measurement Penning trap will be devoted to mass spectrometry of stable and short-
lived radionuclides which is a well established flourishing field. Many accurate results providing answers to important fundamental physics questions have been obtained in recent years. The physics of a charged particle stored in a Penning trap has already been discussed in detail about twenty years ago [Brow1986]. The latest developments in high-precision mass spectrometry are summarized in several review articles; see e.g. [Klug2003a,Lunn2003, Boll2004,Blau2006]. The groups forming the MATS collaboration are among the world leaders in the field and have contributed to many of these developments. They have a sound experience in the construction and operation of Penning trap systems so that the research and development efforts for MATS will be minimized considerably.
Among the cutting edge experiments planned at MATS are mass measurements of rare
isotopes with a relative uncertainty as low as δm/m=10-9. Among the key ingredients to achieve the envisaged accuracy are the use of a high magnetic field (B ≥ 7 T), the application of charge breeding in an EBIT and the use of advanced measurement techniques such as Ramsey [Geor2007b,Kret2007,Geor2008] and octupolar excitation schemes. In addition, several requirements for the measurement trap design have to be fulfilled to minimize systematic cyclotron frequency shifts arising, for example, from inhomogeneities of the trapping fields. Furthermore, temporal changes of the trapping fields have to be low. The storage of highly charged ions in the precision trap requires a design in compliance with XHV vacuum conditions to avoid recombination losses and contaminations from charge exchange with background gas atoms. In general, advanced ion-beam manipulation techniques will be applied for a fast preparation of cooled and purified ion samples to access very short-lived exotic nuclides. The most important requirements will be addressed in more detail in the following.
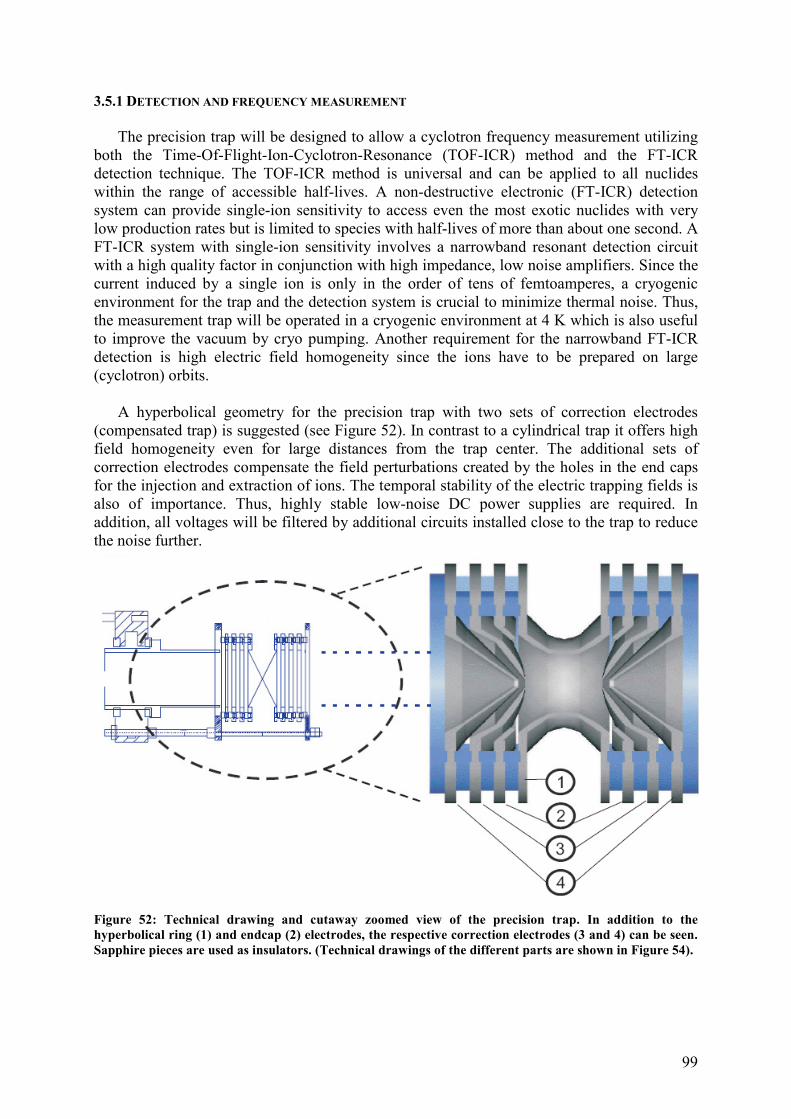
99
3.5.1 DETECTION AND FREQUENCY MEASUREMENT The precision trap will be designed to allow a cyclotron frequency measurement utilizing
both the Time-Of-Flight-Ion-Cyclotron-Resonance (TOF-ICR) method and the FT-ICR detection technique. The TOF-ICR method is universal and can be applied to all nuclides within the range of accessible half-lives. A non-destructive electronic (FT-ICR) detection system can provide single-ion sensitivity to access even the most exotic nuclides with very low production rates but is limited to species with half-lives of more than about one second. A FT-ICR system with single-ion sensitivity involves a narrowband resonant detection circuit with a high quality factor in conjunction with high impedance, low noise amplifiers. Since the current induced by a single ion is only in the order of tens of femtoamperes, a cryogenic environment for the trap and the detection system is crucial to minimize thermal noise. Thus, the measurement trap will be operated in a cryogenic environment at 4 K which is also useful to improve the vacuum by cryo pumping. Another requirement for the narrowband FT-ICR detection is high electric field homogeneity since the ions have to be prepared on large (cyclotron) orbits.
A hyperbolical geometry for the precision trap with two sets of correction electrodes
(compensated trap) is suggested (see Figure 52). In contrast to a cylindrical trap it offers high field homogeneity even for large distances from the trap center. The additional sets of correction electrodes compensate the field perturbations created by the holes in the end caps for the injection and extraction of ions. The temporal stability of the electric trapping fields is also of importance. Thus, highly stable low-noise DC power supplies are required. In addition, all voltages will be filtered by additional circuits installed close to the trap to reduce the noise further.
Figure 52: Technical drawing and cutaway zoomed view of the precision trap. In addition to the hyperbolical ring (1) and endcap (2) electrodes, the respective correction electrodes (3 and 4) can be seen. Sapphire pieces are used as insulators. (Technical drawings of the different parts are shown in Figure 54).
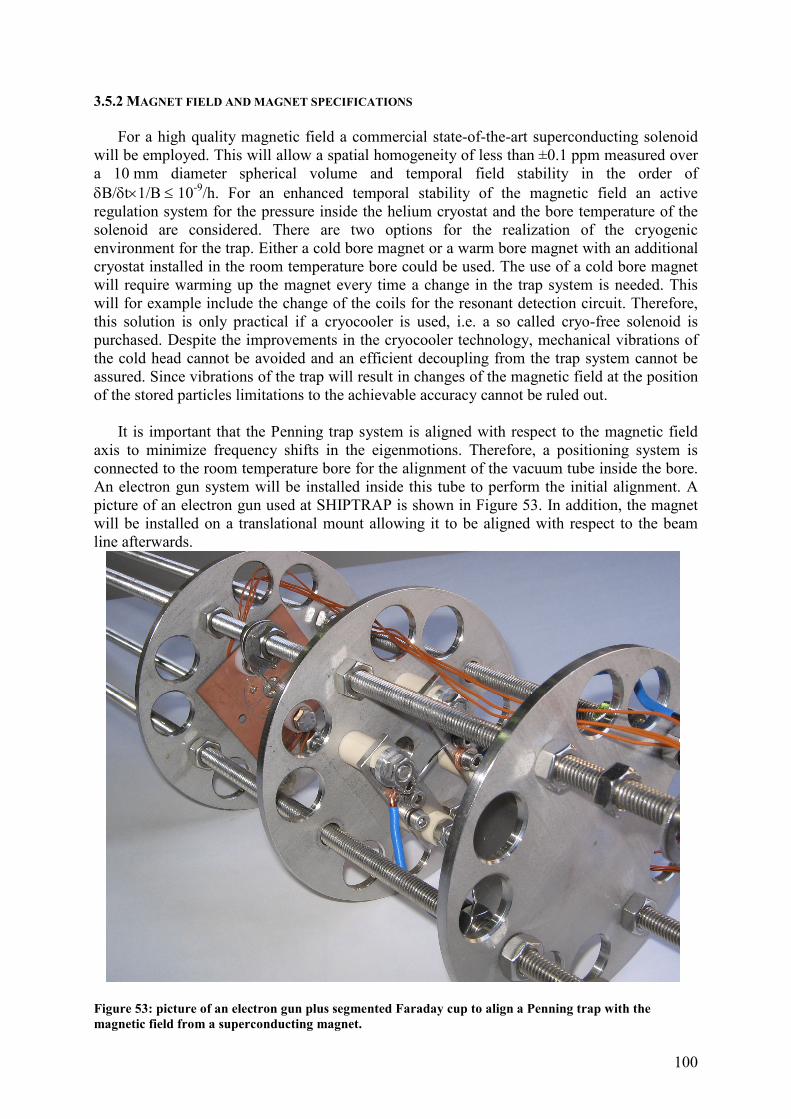
100
3.5.2 MAGNET FIELD AND MAGNET SPECIFICATIONS For a high quality magnetic field a commercial state-of-the-art superconducting solenoid
will be employed. This will allow a spatial homogeneity of less than ±0.1 ppm measured over a 10 mm diameter spherical volume and temporal field stability in the order of δB/δt×1/B ≤ 10-9/h. For an enhanced temporal stability of the magnetic field an active regulation system for the pressure inside the helium cryostat and the bore temperature of the solenoid are considered. There are two options for the realization of the cryogenic environment for the trap. Either a cold bore magnet or a warm bore magnet with an additional cryostat installed in the room temperature bore could be used. The use of a cold bore magnet will require warming up the magnet every time a change in the trap system is needed. This will for example include the change of the coils for the resonant detection circuit. Therefore, this solution is only practical if a cryocooler is used, i.e. a so called cryo-free solenoid is purchased. Despite the improvements in the cryocooler technology, mechanical vibrations of the cold head cannot be avoided and an efficient decoupling from the trap system cannot be assured. Since vibrations of the trap will result in changes of the magnetic field at the position of the stored particles limitations to the achievable accuracy cannot be ruled out.
It is important that the Penning trap system is aligned with respect to the magnetic field
axis to minimize frequency shifts in the eigenmotions. Therefore, a positioning system is connected to the room temperature bore for the alignment of the vacuum tube inside the bore. An electron gun system will be installed inside this tube to perform the initial alignment. A picture of an electron gun used at SHIPTRAP is shown in Figure 53. In addition, the magnet will be installed on a translational mount allowing it to be aligned with respect to the beam line afterwards.
Figure 53: picture of an electron gun plus segmented Faraday cup to align a Penning trap with the magnetic field from a superconducting magnet.
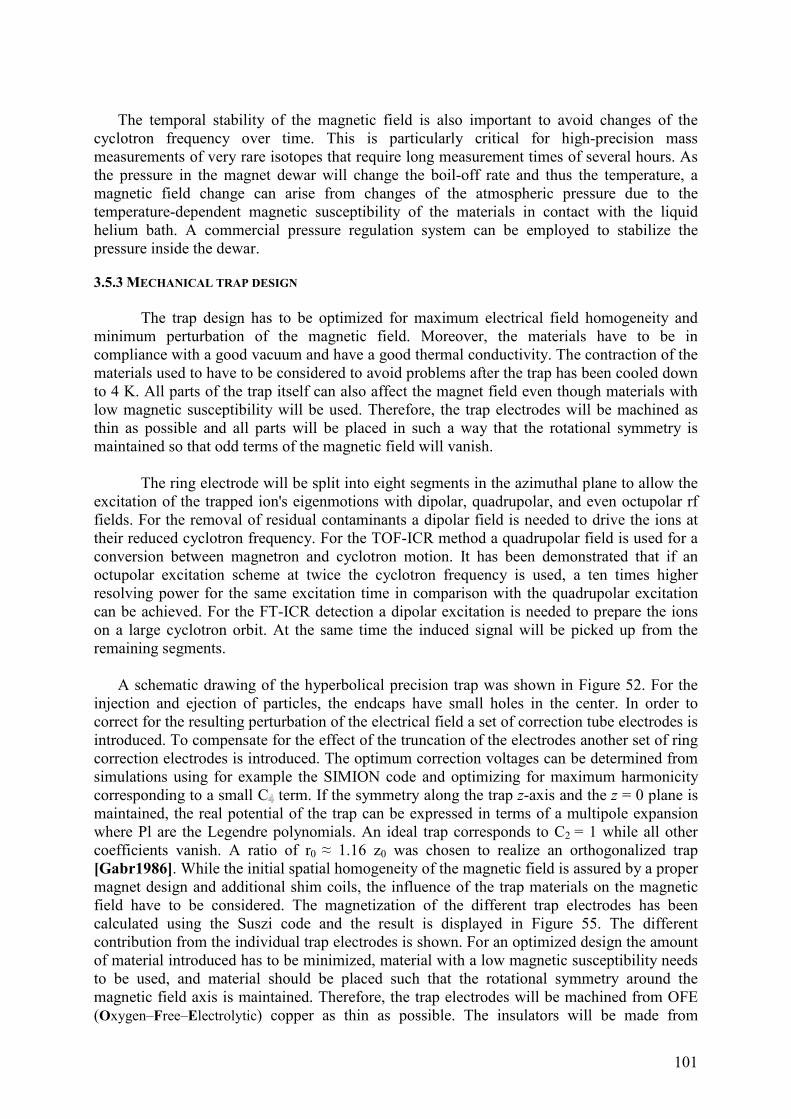
101
The temporal stability of the magnetic field is also important to avoid changes of the
cyclotron frequency over time. This is particularly critical for high-precision mass measurements of very rare isotopes that require long measurement times of several hours. As the pressure in the magnet dewar will change the boil-off rate and thus the temperature, a magnetic field change can arise from changes of the atmospheric pressure due to the temperature-dependent magnetic susceptibility of the materials in contact with the liquid helium bath. A commercial pressure regulation system can be employed to stabilize the pressure inside the dewar.
3.5.3 MECHANICAL TRAP DESIGN
The trap design has to be optimized for maximum electrical field homogeneity and minimum perturbation of the magnetic field. Moreover, the materials have to be in compliance with a good vacuum and have a good thermal conductivity. The contraction of the materials used to have to be considered to avoid problems after the trap has been cooled down to 4 K. All parts of the trap itself can also affect the magnet field even though materials with low magnetic susceptibility will be used. Therefore, the trap electrodes will be machined as thin as possible and all parts will be placed in such a way that the rotational symmetry is maintained so that odd terms of the magnetic field will vanish. The ring electrode will be split into eight segments in the azimuthal plane to allow the excitation of the trapped ion's eigenmotions with dipolar, quadrupolar, and even octupolar rf fields. For the removal of residual contaminants a dipolar field is needed to drive the ions at their reduced cyclotron frequency. For the TOF-ICR method a quadrupolar field is used for a conversion between magnetron and cyclotron motion. It has been demonstrated that if an octupolar excitation scheme at twice the cyclotron frequency is used, a ten times higher resolving power for the same excitation time in comparison with the quadrupolar excitation can be achieved. For the FT-ICR detection a dipolar excitation is needed to prepare the ions on a large cyclotron orbit. At the same time the induced signal will be picked up from the remaining segments.
A schematic drawing of the hyperbolical precision trap was shown in Figure 52. For the injection and ejection of particles, the endcaps have small holes in the center. In order to correct for the resulting perturbation of the electrical field a set of correction tube electrodes is introduced. To compensate for the effect of the truncation of the electrodes another set of ring correction electrodes is introduced. The optimum correction voltages can be determined from simulations using for example the SIMION code and optimizing for maximum harmonicity corresponding to a small C4 term. If the symmetry along the trap z-axis and the z = 0 plane is maintained, the real potential of the trap can be expressed in terms of a multipole expansion where Pl are the Legendre polynomials. An ideal trap corresponds to C2 = 1 while all other coefficients vanish. A ratio of r0 ≈ 1.16 z0 was chosen to realize an orthogonalized trap [Gabr1986]. While the initial spatial homogeneity of the magnetic field is assured by a proper magnet design and additional shim coils, the influence of the trap materials on the magnetic field have to be considered. The magnetization of the different trap electrodes has been calculated using the Suszi code and the result is displayed in Figure 55. The different contribution from the individual trap electrodes is shown. For an optimized design the amount of material introduced has to be minimized, material with a low magnetic susceptibility needs to be used, and material should be placed such that the rotational symmetry around the magnetic field axis is maintained. Therefore, the trap electrodes will be machined from OFE (Oxygen–Free–Electrolytic) copper as thin as possible. The insulators will be made from
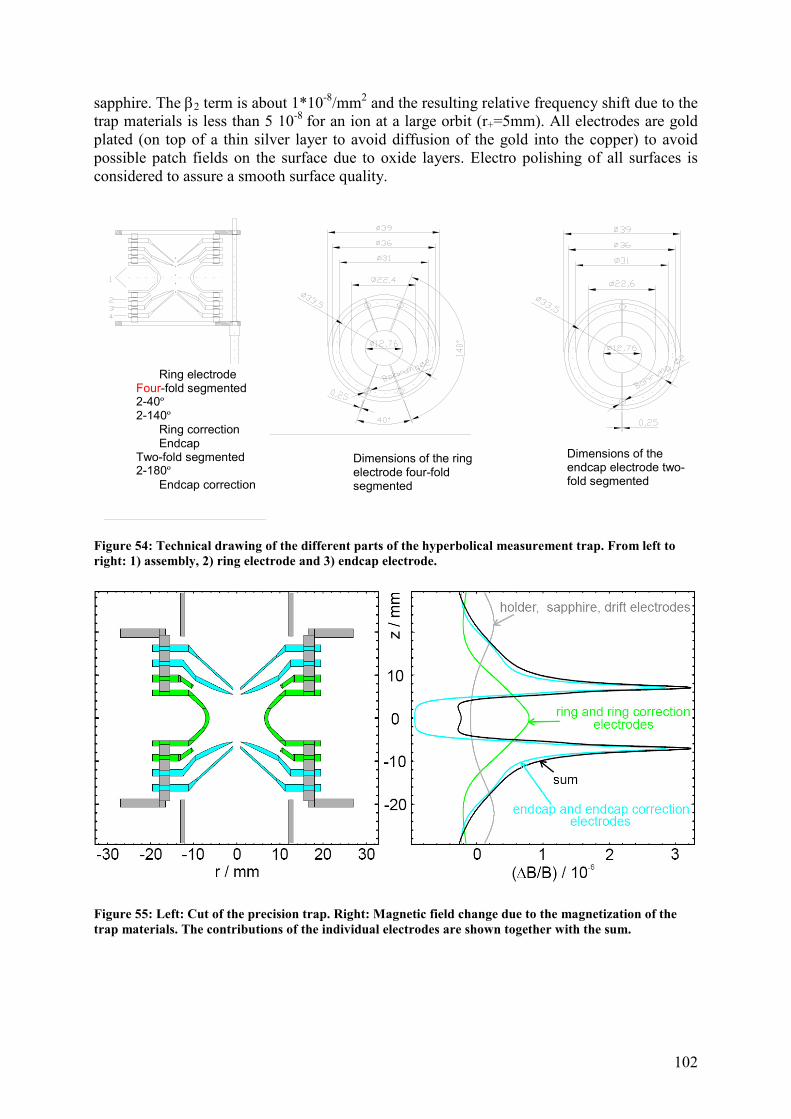
102
sapphire. The β2 term is about 1*10-8/mm2 and the resulting relative frequency shift due to the trap materials is less than 5 10-8 for an ion at a large orbit (r+=5mm). All electrodes are gold plated (on top of a thin silver layer to avoid diffusion of the gold into the copper) to avoid possible patch fields on the surface due to oxide layers. Electro polishing of all surfaces is considered to assure a smooth surface quality.
Figure 54: Technical drawing of the different parts of the hyperbolical measurement trap. From left to right: 1) assembly, 2) ring electrode and 3) endcap electrode.
Figure 55: Left: Cut of the precision trap. Right: Magnetic field change due to the magnetization of the trap materials. The contributions of the individual electrodes are shown together with the sum.
Ring electrode Four-fold segmented 2-40º 2-140º
Ring correction Endcap
Two-fold segmented 2-180º
Endcap correction
Dimensions of the ring electrode four-fold segmented
Dimensions of the endcap electrode two-fold segmented
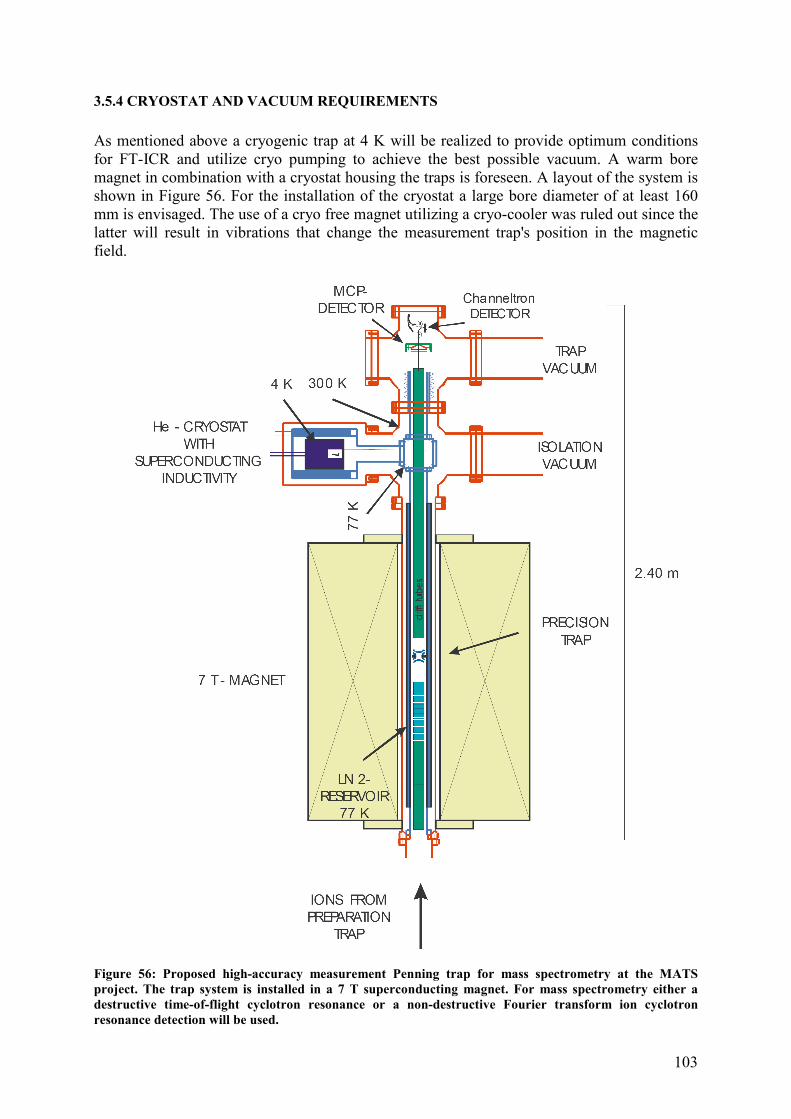
103
3.5.4 CRYOSTAT AND VACUUM REQUIREMENTS
As mentioned above a cryogenic trap at 4 K will be realized to provide optimum conditions for FT-ICR and utilize cryo pumping to achieve the best possible vacuum. A warm bore magnet in combination with a cryostat housing the traps is foreseen. A layout of the system is shown in Figure 56. For the installation of the cryostat a large bore diameter of at least 160 mm is envisaged. The use of a cryo free magnet utilizing a cryo-cooler was ruled out since the latter will result in vibrations that change the measurement trap's position in the magnetic field.
Figure 56: Proposed high-accuracy measurement Penning trap for mass spectrometry at the MATS project. The trap system is installed in a 7 T superconducting magnet. For mass spectrometry either a destructive time-of-flight cyclotron resonance or a non-destructive Fourier transform ion cyclotron resonance detection will be used.
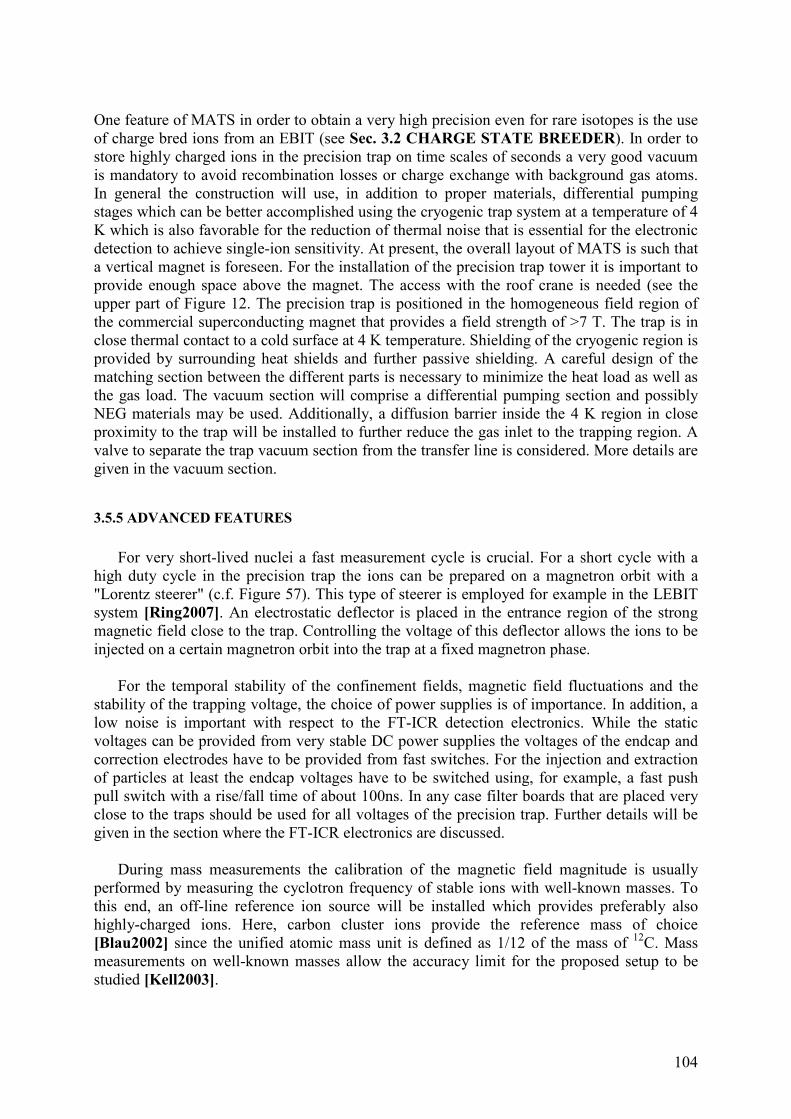
104
One feature of MATS in order to obtain a very high precision even for rare isotopes is the use of charge bred ions from an EBIT (see Sec. 3.2 CHARGE STATE BREEDER). In order to store highly charged ions in the precision trap on time scales of seconds a very good vacuum is mandatory to avoid recombination losses or charge exchange with background gas atoms. In general the construction will use, in addition to proper materials, differential pumping stages which can be better accomplished using the cryogenic trap system at a temperature of 4 K which is also favorable for the reduction of thermal noise that is essential for the electronic detection to achieve single-ion sensitivity. At present, the overall layout of MATS is such that a vertical magnet is foreseen. For the installation of the precision trap tower it is important to provide enough space above the magnet. The access with the roof crane is needed (see the upper part of Figure 12. The precision trap is positioned in the homogeneous field region of the commercial superconducting magnet that provides a field strength of >7 T. The trap is in close thermal contact to a cold surface at 4 K temperature. Shielding of the cryogenic region is provided by surrounding heat shields and further passive shielding. A careful design of the matching section between the different parts is necessary to minimize the heat load as well as the gas load. The vacuum section will comprise a differential pumping section and possibly NEG materials may be used. Additionally, a diffusion barrier inside the 4 K region in close proximity to the trap will be installed to further reduce the gas inlet to the trapping region. A valve to separate the trap vacuum section from the transfer line is considered. More details are given in the vacuum section.
3.5.5 ADVANCED FEATURES
For very short-lived nuclei a fast measurement cycle is crucial. For a short cycle with a
high duty cycle in the precision trap the ions can be prepared on a magnetron orbit with a "Lorentz steerer" (c.f. Figure 57). This type of steerer is employed for example in the LEBIT system [Ring2007]. An electrostatic deflector is placed in the entrance region of the strong magnetic field close to the trap. Controlling the voltage of this deflector allows the ions to be injected on a certain magnetron orbit into the trap at a fixed magnetron phase.
For the temporal stability of the confinement fields, magnetic field fluctuations and the
stability of the trapping voltage, the choice of power supplies is of importance. In addition, a low noise is important with respect to the FT-ICR detection electronics. While the static voltages can be provided from very stable DC power supplies the voltages of the endcap and correction electrodes have to be provided from fast switches. For the injection and extraction of particles at least the endcap voltages have to be switched using, for example, a fast push pull switch with a rise/fall time of about 100ns. In any case filter boards that are placed very close to the traps should be used for all voltages of the precision trap. Further details will be given in the section where the FT-ICR electronics are discussed.
During mass measurements the calibration of the magnetic field magnitude is usually
performed by measuring the cyclotron frequency of stable ions with well-known masses. To this end, an off-line reference ion source will be installed which provides preferably also highly-charged ions. Here, carbon cluster ions provide the reference mass of choice [Blau2002] since the unified atomic mass unit is defined as 1/12 of the mass of 12C. Mass measurements on well-known masses allow the accuracy limit for the proposed setup to be studied [Kell2003].
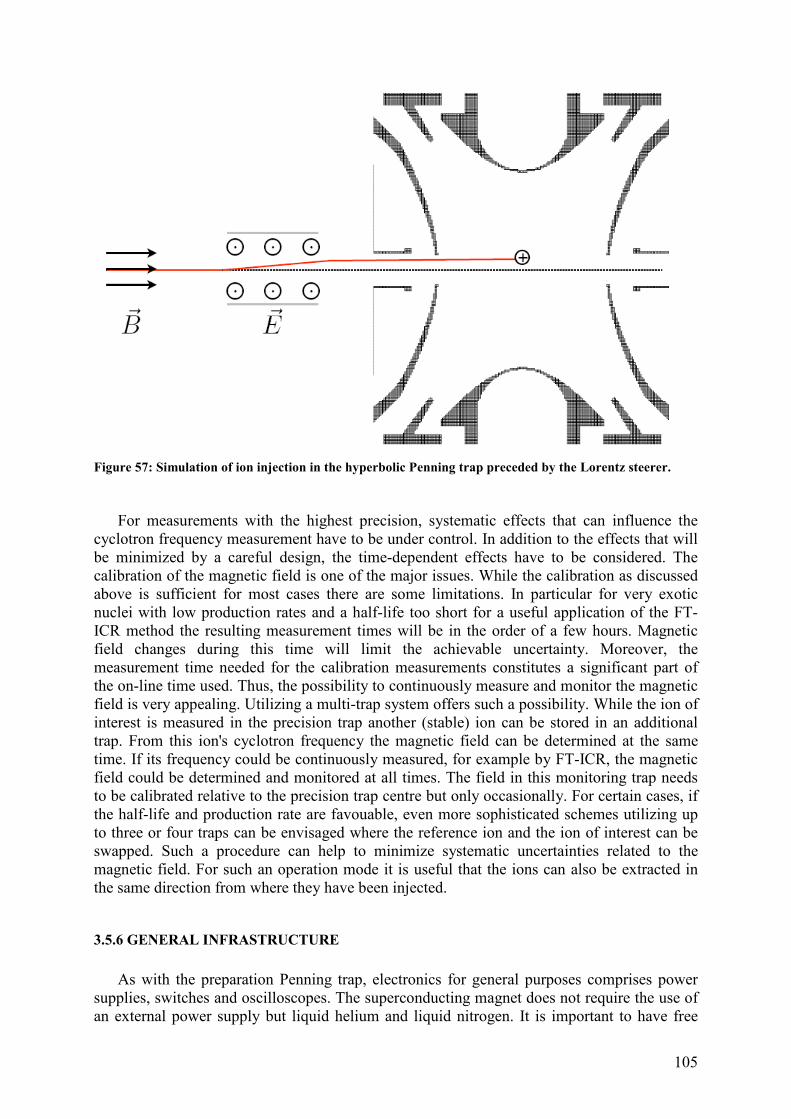
105
Figure 57: Simulation of ion injection in the hyperbolic Penning trap preceded by the Lorentz steerer.
For measurements with the highest precision, systematic effects that can influence the cyclotron frequency measurement have to be under control. In addition to the effects that will be minimized by a careful design, the time-dependent effects have to be considered. The calibration of the magnetic field is one of the major issues. While the calibration as discussed above is sufficient for most cases there are some limitations. In particular for very exotic nuclei with low production rates and a half-life too short for a useful application of the FT-ICR method the resulting measurement times will be in the order of a few hours. Magnetic field changes during this time will limit the achievable uncertainty. Moreover, the measurement time needed for the calibration measurements constitutes a significant part of the on-line time used. Thus, the possibility to continuously measure and monitor the magnetic field is very appealing. Utilizing a multi-trap system offers such a possibility. While the ion of interest is measured in the precision trap another (stable) ion can be stored in an additional trap. From this ion's cyclotron frequency the magnetic field can be determined at the same time. If its frequency could be continuously measured, for example by FT-ICR, the magnetic field could be determined and monitored at all times. The field in this monitoring trap needs to be calibrated relative to the precision trap centre but only occasionally. For certain cases, if the half-life and production rate are favouable, even more sophisticated schemes utilizing up to three or four traps can be envisaged where the reference ion and the ion of interest can be swapped. Such a procedure can help to minimize systematic uncertainties related to the magnetic field. For such an operation mode it is useful that the ions can also be extracted in the same direction from where they have been injected.
3.5.6 GENERAL INFRASTRUCTURE
As with the preparation Penning trap, electronics for general purposes comprises power
supplies, switches and oscilloscopes. The superconducting magnet does not require the use of an external power supply but liquid helium and liquid nitrogen. It is important to have free
106
access to the magnet for refilling every 3 weeks with liquid nitrogen and every 3 months with liquid helium. A more detailed description as well as the arrangement of devices is given in . Here below only a brief description is given.
List of devices needed
• Superconducting magnet • DC power supplies, high stability and high precision • FFT analyser • vacuum components (tubes, crosses, bellows) • turbomolecular pumps • cryopumps and/or ion getter pumps • scroll pumps • ion gauges / cold cathode, ionivac • arbitrary function generators • HV switches • low noise differential amplifier • cryogenic detection electronics
3.6 INSTRUMENTATION
Instrumentation is divided in four sections comprising the instrumentation for mass measurements, in-trap and trap-assisted spectroscopy, total absorption and neutron spectroscopy assisted by Penning traps
3.6.1 INSTRUMENTATION FOR MASS SPECTROMETRY
In Penning trap mass spectrometry the relevant observable quantity is the cyclotron frequency )2/( mqeBc πν = of the ion with charge q and mass m confined in a magnetic field
with strength B inside the Penning trap. The invariance theorem [Gabr1982, Gabr2009a,Gabr2009b], which links the motional eigenfrequencies, allows for several ways to obtain cν . Two main detection techniques are to be exploited at the MATS experiment. A
destructive detection, where the trapped ions are lost in each detection cycle and thus a reloading of the trap is required, and a non-destructive detection where subsequent measurement cycles can be performed on the same trap content.
Destructive detection
The destructive detection comprises the well-established TOF-ICR technique, where the
cyclotron frequency of a stored ion sample is probed with an external radio-frequency (RF) excitation signal [Koni1995], applied usually on the segmented ring electrode in the radial plane of the Penning Trap. The ions confined in the trap are subjected to the rf-signal for a certain duration which may last from milliseconds to seconds. After the rf-excitation the trap is emptied and the stored ions are sent towards an ion counting detector and their flight time is recorded. This procedure is repeated with a new value for the quadrupolar excitation frequency signal until the resonance is found indicated by a minimum in the time-of-flight spectrum (see Figure 58). This technique was introduced two decades ago [Graf1980] and ever since it has been continuously developed further. Using this technique, information about the number of ions reaching a detector, and their flight time relative to a start trigger signal is obtained typically by using a time digitizer (see also section on the control system). A detector
107
with high ion detection efficiency close to unity is preferred, since for high precision experiments only one or a few ions are stored simultaneously in the trap. Typically standard detectors based on the secondary electron emission principle such as micro-channel plate detectors (MCP) [Wiza1979] or a channel electron multiplier (CEM), also called continuous-dynode electron multiplier, is used. The MCP is a resistively matched double-plate Chevron configuration with a bias network which reaches absolute detection efficiencies of 30 to 50% [Stra1999] for low energy keV ions.
Figure 58: Time-of-Flight (TOF) resonance for Cs+ ions. The solid line is the fit of the experimental data using the theoretical line shape described in Ref. [Koni1995]. This figure has been taken from Ref. [Elis2007].
The MCP detector can be assembled in a cost-effective way using commercial MCP
plates available in a variety of dimensions and shapes. The mechanical assembly holding the MCP plates and the metallic anode in a sandwich structure and the required bias network for the electrical powering are home built. Optionally the MCP detector assembly can be mounted on a movable linear feedthrough with custom travel distance allowing linear manipulation of the detector in a UHV environment.
The CEM is a standard commercial plug-in detector module which is capable of reaching
significantly higher absolute detection efficiencies of >90 % [Yazi2006]. The new commercial models have in addition a conversion dynode and enlarged detection area up to 25 mm in diameter [DeTech].
For both detectors the readout is relatively simple. The detector signal is carefully picked up from the anode and fed into a commercial fast low-noise preamplifier, optionally a constant fraction discriminator and amplifier, analogue-to-digital converter can be used and finally the signal is processed by a commercial time digitizer or multichannel scaler/analyzer. Both detectors can produce a fast clean signal with rise times of a few ns. The CEM signal is narrower and with the same preamplifier gain the peak height is also smaller for the recorded single event.
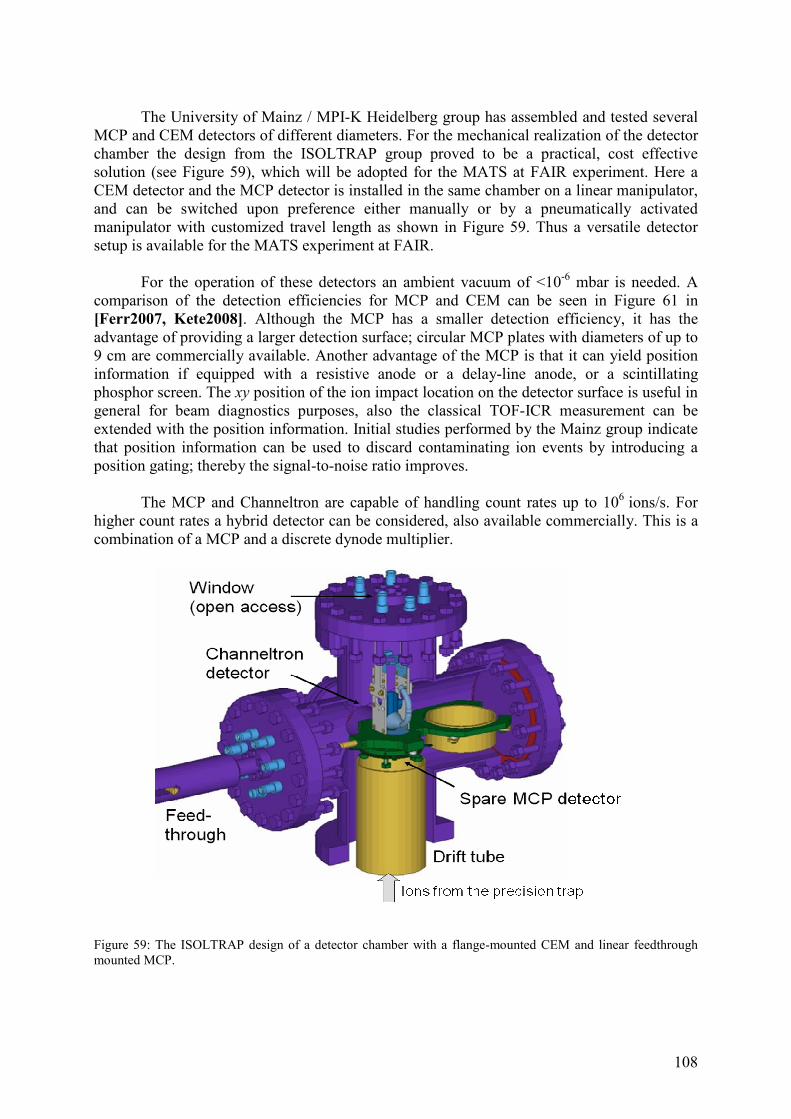
108
The University of Mainz / MPI-K Heidelberg group has assembled and tested several MCP and CEM detectors of different diameters. For the mechanical realization of the detector chamber the design from the ISOLTRAP group proved to be a practical, cost effective solution (see Figure 59), which will be adopted for the MATS at FAIR experiment. Here a CEM detector and the MCP detector is installed in the same chamber on a linear manipulator, and can be switched upon preference either manually or by a pneumatically activated manipulator with customized travel length as shown in Figure 59. Thus a versatile detector setup is available for the MATS experiment at FAIR.
For the operation of these detectors an ambient vacuum of <10-6 mbar is needed. A
comparison of the detection efficiencies for MCP and CEM can be seen in Figure 61 in [Ferr2007, Kete2008]. Although the MCP has a smaller detection efficiency, it has the advantage of providing a larger detection surface; circular MCP plates with diameters of up to 9 cm are commercially available. Another advantage of the MCP is that it can yield position information if equipped with a resistive anode or a delay-line anode, or a scintillating phosphor screen. The xy position of the ion impact location on the detector surface is useful in general for beam diagnostics purposes, also the classical TOF-ICR measurement can be extended with the position information. Initial studies performed by the Mainz group indicate that position information can be used to discard contaminating ion events by introducing a position gating; thereby the signal-to-noise ratio improves.
The MCP and Channeltron are capable of handling count rates up to 106 ions/s. For higher count rates a hybrid detector can be considered, also available commercially. This is a combination of a MCP and a discrete dynode multiplier.
Figure 59: The ISOLTRAP design of a detector chamber with a flange-mounted CEM and linear feedthrough mounted MCP.
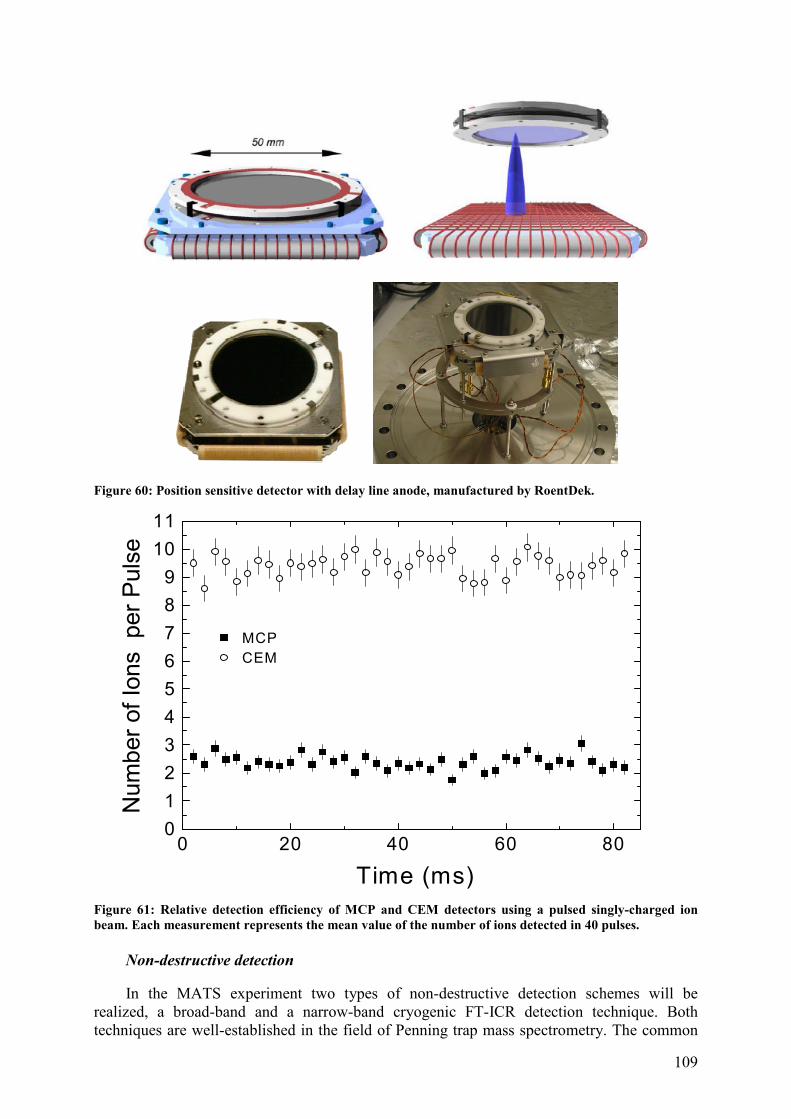
109
Figure 60: Position sensitive detector with delay line anode, manufactured by RoentDek.
Figure 61: Relative detection efficiency of MCP and CEM detectors using a pulsed singly-charged ion beam. Each measurement represents the mean value of the number of ions detected in 40 pulses.
Non-destructive detection
In the MATS experiment two types of non-destructive detection schemes will be realized, a broad-band and a narrow-band cryogenic FT-ICR detection technique. Both techniques are well-established in the field of Penning trap mass spectrometry. The common
0 20 40 60 800
1
2
3
4
5
6
7
8
9
10
11
MCP
CEM
Nu
mb
er
of
Ion
s
pe
r P
uls
e
Time (ms)
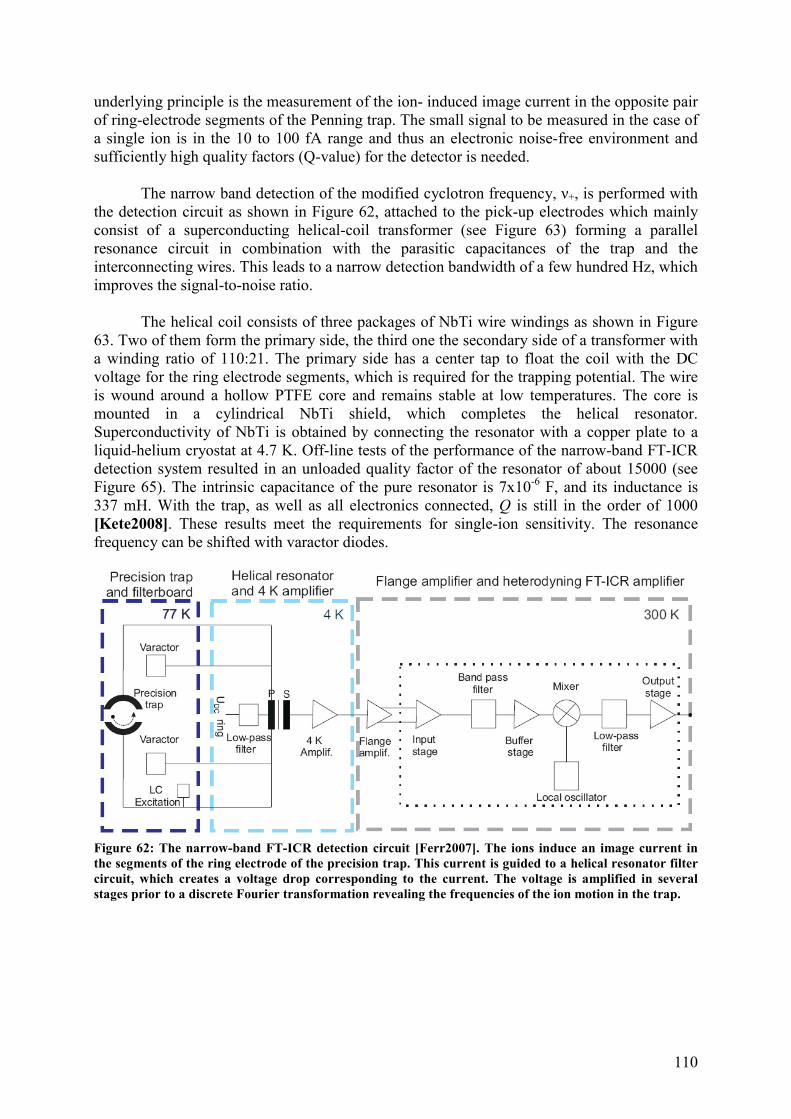
110
underlying principle is the measurement of the ion- induced image current in the opposite pair of ring-electrode segments of the Penning trap. The small signal to be measured in the case of a single ion is in the 10 to 100 fA range and thus an electronic noise-free environment and sufficiently high quality factors (Q-value) for the detector is needed.
The narrow band detection of the modified cyclotron frequency, ν+, is performed with the detection circuit as shown in Figure 62, attached to the pick-up electrodes which mainly consist of a superconducting helical-coil transformer (see Figure 63) forming a parallel resonance circuit in combination with the parasitic capacitances of the trap and the interconnecting wires. This leads to a narrow detection bandwidth of a few hundred Hz, which improves the signal-to-noise ratio.
The helical coil consists of three packages of NbTi wire windings as shown in Figure
63. Two of them form the primary side, the third one the secondary side of a transformer with a winding ratio of 110:21. The primary side has a center tap to float the coil with the DC voltage for the ring electrode segments, which is required for the trapping potential. The wire is wound around a hollow PTFE core and remains stable at low temperatures. The core is mounted in a cylindrical NbTi shield, which completes the helical resonator. Superconductivity of NbTi is obtained by connecting the resonator with a copper plate to a liquid-helium cryostat at 4.7 K. Off-line tests of the performance of the narrow-band FT-ICR detection system resulted in an unloaded quality factor of the resonator of about 15000 (see Figure 65). The intrinsic capacitance of the pure resonator is 7x10⁻⁶ F, and its inductance is 337 mH. With the trap, as well as all electronics connected, Q is still in the order of 1000 [Kete2008]. These results meet the requirements for single-ion sensitivity. The resonance frequency can be shifted with varactor diodes.
Figure 62: The narrow-band FT-ICR detection circuit [Ferr2007]. The ions induce an image current in the segments of the ring electrode of the precision trap. This current is guided to a helical resonator filter circuit, which creates a voltage drop corresponding to the current. The voltage is amplified in several stages prior to a discrete Fourier transformation revealing the frequencies of the ion motion in the trap.
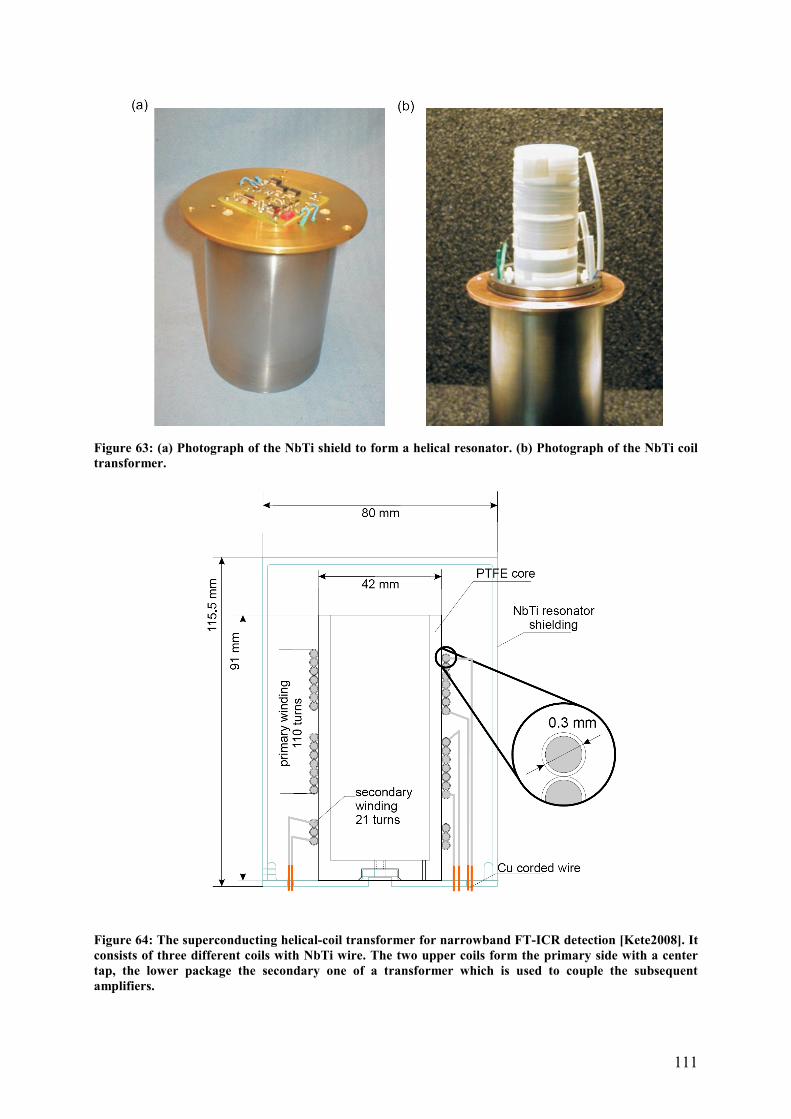
111
Figure 63: (a) Photograph of the NbTi shield to form a helical resonator. (b) Photograph of the NbTi coil transformer.
Figure 64: The superconducting helical-coil transformer for narrowband FT-ICR detection [Kete2008]. It consists of three different coils with NbTi wire. The two upper coils form the primary side with a center tap, the lower package the secondary one of a transformer which is used to couple the subsequent amplifiers.
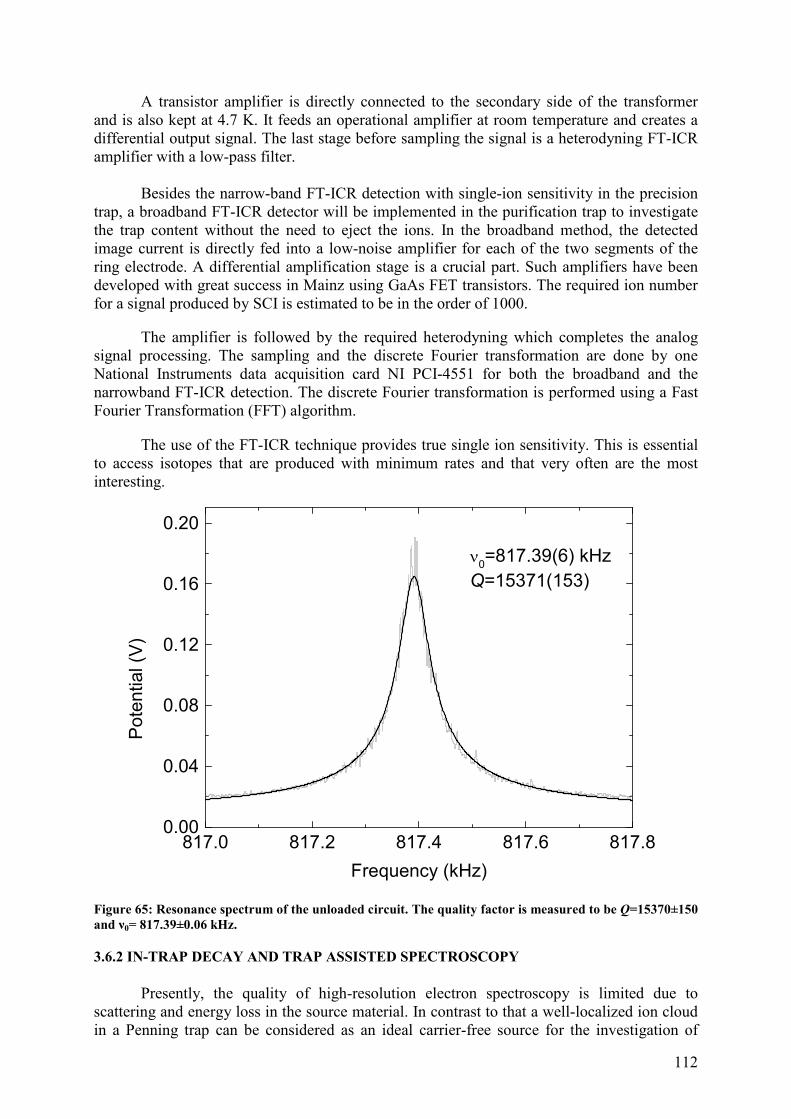
112
A transistor amplifier is directly connected to the secondary side of the transformer and is also kept at 4.7 K. It feeds an operational amplifier at room temperature and creates a differential output signal. The last stage before sampling the signal is a heterodyning FT-ICR amplifier with a low-pass filter.
Besides the narrow-band FT-ICR detection with single-ion sensitivity in the precision
trap, a broadband FT-ICR detector will be implemented in the purification trap to investigate the trap content without the need to eject the ions. In the broadband method, the detected image current is directly fed into a low-noise amplifier for each of the two segments of the ring electrode. A differential amplification stage is a crucial part. Such amplifiers have been developed with great success in Mainz using GaAs FET transistors. The required ion number for a signal produced by SCI is estimated to be in the order of 1000.
The amplifier is followed by the required heterodyning which completes the analog signal processing. The sampling and the discrete Fourier transformation are done by one National Instruments data acquisition card NI PCI-4551 for both the broadband and the narrowband FT-ICR detection. The discrete Fourier transformation is performed using a Fast Fourier Transformation (FFT) algorithm.
The use of the FT-ICR technique provides true single ion sensitivity. This is essential to access isotopes that are produced with minimum rates and that very often are the most interesting.
Figure 65: Resonance spectrum of the unloaded circuit. The quality factor is measured to be Q=15370±150 and ν0= 817.39±0.06 kHz.
3.6.2 IN-TRAP DECAY AND TRAP ASSISTED SPECTROSCOPY
Presently, the quality of high-resolution electron spectroscopy is limited due to scattering and energy loss in the source material. In contrast to that a well-localized ion cloud in a Penning trap can be considered as an ideal carrier-free source for the investigation of
817.0 817.2 817.4 817.6 817.80.00
0.04
0.08
0.12
0.16
0.20
Po
ten
tia
l (V
)
Frequency (kHz)
ν0=817.39(6) kHz
Q=15371(153)
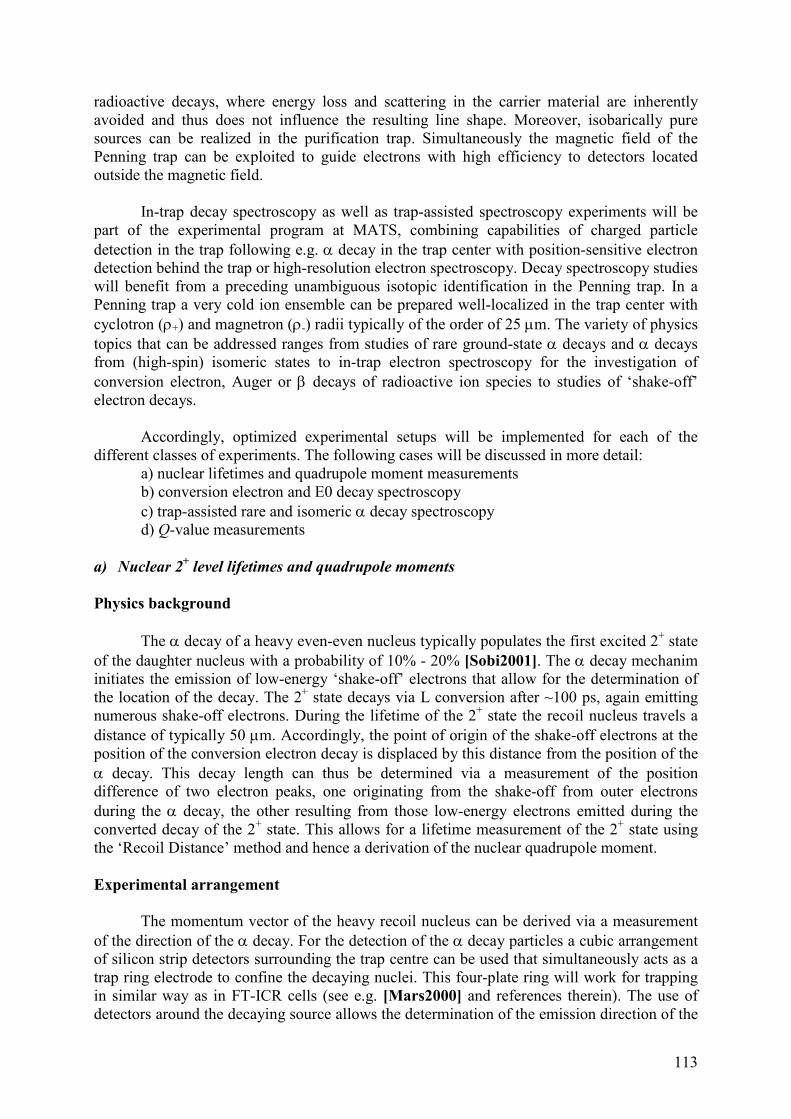
113
radioactive decays, where energy loss and scattering in the carrier material are inherently avoided and thus does not influence the resulting line shape. Moreover, isobarically pure sources can be realized in the purification trap. Simultaneously the magnetic field of the Penning trap can be exploited to guide electrons with high efficiency to detectors located outside the magnetic field. In-trap decay spectroscopy as well as trap-assisted spectroscopy experiments will be part of the experimental program at MATS, combining capabilities of charged particle detection in the trap following e.g. α decay in the trap center with position-sensitive electron detection behind the trap or high-resolution electron spectroscopy. Decay spectroscopy studies will benefit from a preceding unambiguous isotopic identification in the Penning trap. In a Penning trap a very cold ion ensemble can be prepared well-localized in the trap center with cyclotron (ρ+) and magnetron (ρ-) radii typically of the order of 25 µm. The variety of physics topics that can be addressed ranges from studies of rare ground-state α decays and α decays from (high-spin) isomeric states to in-trap electron spectroscopy for the investigation of conversion electron, Auger or β decays of radioactive ion species to studies of ‘shake-off’ electron decays. Accordingly, optimized experimental setups will be implemented for each of the different classes of experiments. The following cases will be discussed in more detail:
a) nuclear lifetimes and quadrupole moment measurements b) conversion electron and E0 decay spectroscopy c) trap-assisted rare and isomeric α decay spectroscopy d) Q-value measurements
a) Nuclear 2
+ level lifetimes and quadrupole moments
Physics background The α decay of a heavy even-even nucleus typically populates the first excited 2+ state of the daughter nucleus with a probability of 10% - 20% [Sobi2001]. The α decay mechanim initiates the emission of low-energy ‘shake-off’ electrons that allow for the determination of the location of the decay. The 2+ state decays via L conversion after ~100 ps, again emitting numerous shake-off electrons. During the lifetime of the 2+ state the recoil nucleus travels a distance of typically 50 µm. Accordingly, the point of origin of the shake-off electrons at the position of the conversion electron decay is displaced by this distance from the position of the α decay. This decay length can thus be determined via a measurement of the position difference of two electron peaks, one originating from the shake-off from outer electrons during the α decay, the other resulting from those low-energy electrons emitted during the converted decay of the 2+ state. This allows for a lifetime measurement of the 2+ state using the ‘Recoil Distance’ method and hence a derivation of the nuclear quadrupole moment. Experimental arrangement The momentum vector of the heavy recoil nucleus can be derived via a measurement of the direction of the α decay. For the detection of the α decay particles a cubic arrangement of silicon strip detectors surrounding the trap centre can be used that simultaneously acts as a trap ring electrode to confine the decaying nuclei. This four-plate ring will work for trapping in similar way as in FT-ICR cells (see e.g. [Mars2000] and references therein). The use of detectors around the decaying source allows the determination of the emission direction of the
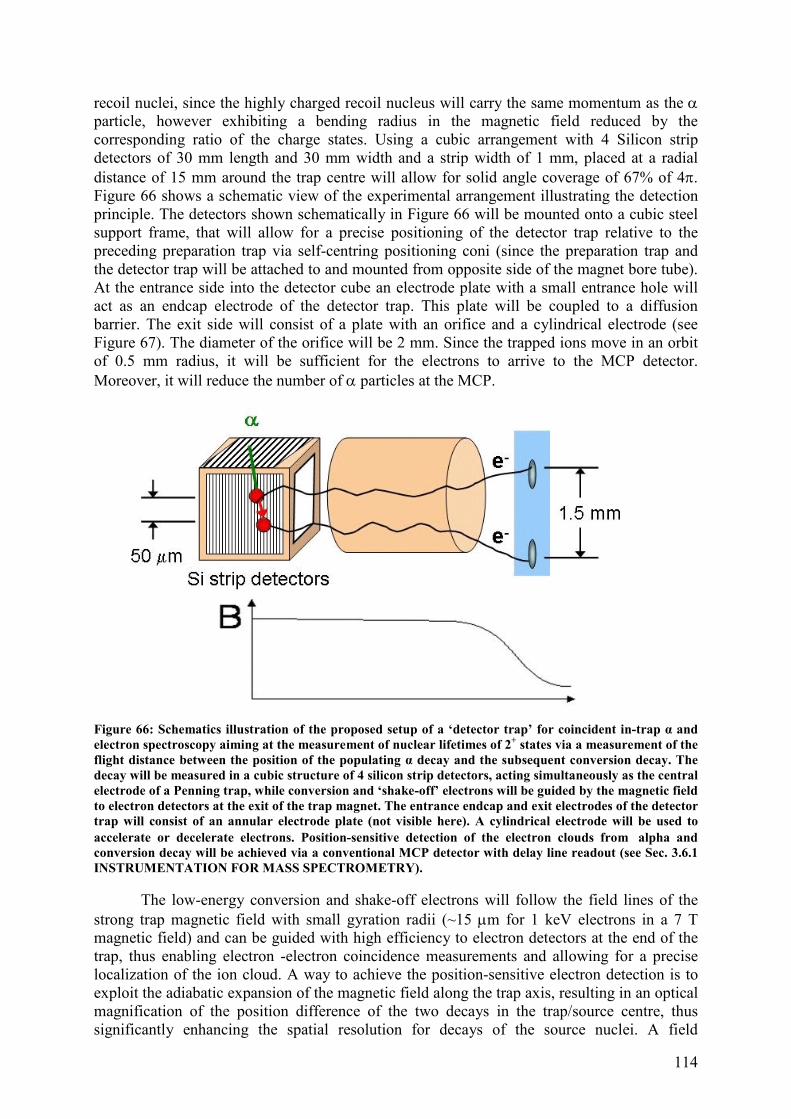
114
recoil nuclei, since the highly charged recoil nucleus will carry the same momentum as the α particle, however exhibiting a bending radius in the magnetic field reduced by the corresponding ratio of the charge states. Using a cubic arrangement with 4 Silicon strip detectors of 30 mm length and 30 mm width and a strip width of 1 mm, placed at a radial distance of 15 mm around the trap centre will allow for solid angle coverage of 67% of 4π. Figure 66 shows a schematic view of the experimental arrangement illustrating the detection principle. The detectors shown schematically in Figure 66 will be mounted onto a cubic steel support frame, that will allow for a precise positioning of the detector trap relative to the preceding preparation trap via self-centring positioning coni (since the preparation trap and the detector trap will be attached to and mounted from opposite side of the magnet bore tube). At the entrance side into the detector cube an electrode plate with a small entrance hole will act as an endcap electrode of the detector trap. This plate will be coupled to a diffusion barrier. The exit side will consist of a plate with an orifice and a cylindrical electrode (see Figure 67). The diameter of the orifice will be 2 mm. Since the trapped ions move in an orbit of 0.5 mm radius, it will be sufficient for the electrons to arrive to the MCP detector. Moreover, it will reduce the number of α particles at the MCP.
Figure 66: Schematics illustration of the proposed setup of a ‘detector trap’ for coincident in-trap α and electron spectroscopy aiming at the measurement of nuclear lifetimes of 2+ states via a measurement of the flight distance between the position of the populating α decay and the subsequent conversion decay. The decay will be measured in a cubic structure of 4 silicon strip detectors, acting simultaneously as the central electrode of a Penning trap, while conversion and ‘shake-off’ electrons will be guided by the magnetic field to electron detectors at the exit of the trap magnet. The entrance endcap and exit electrodes of the detector trap will consist of an annular electrode plate (not visible here). A cylindrical electrode will be used to accelerate or decelerate electrons. Position-sensitive detection of the electron clouds from alpha and conversion decay will be achieved via a conventional MCP detector with delay line readout (see Sec. 3.6.1 INSTRUMENTATION FOR MASS SPECTROMETRY).
The low-energy conversion and shake-off electrons will follow the field lines of the strong trap magnetic field with small gyration radii (~15 µm for 1 keV electrons in a 7 T magnetic field) and can be guided with high efficiency to electron detectors at the end of the trap, thus enabling electron -electron coincidence measurements and allowing for a precise localization of the ion cloud. A way to achieve the position-sensitive electron detection is to exploit the adiabatic expansion of the magnetic field along the trap axis, resulting in an optical magnification of the position difference of the two decays in the trap/source centre, thus significantly enhancing the spatial resolution for decays of the source nuclei. A field
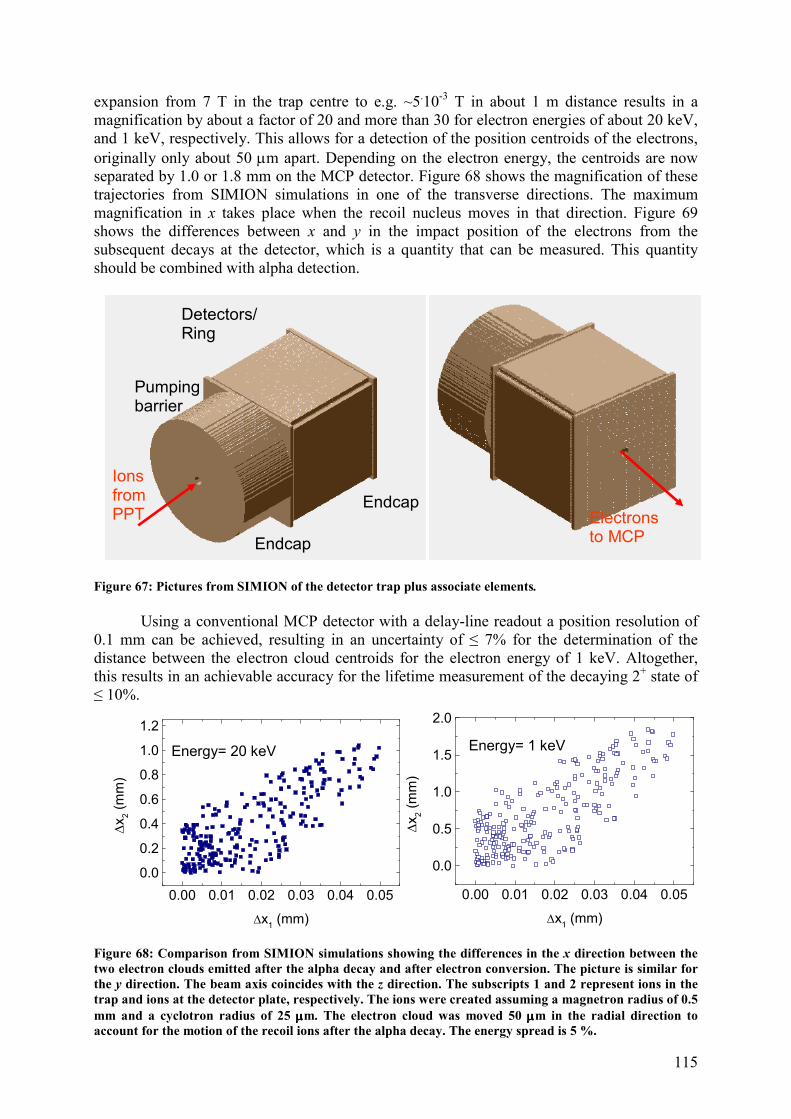
115
expansion from 7 T in the trap centre to e.g. ~5.10-3 T in about 1 m distance results in a magnification by about a factor of 20 and more than 30 for electron energies of about 20 keV, and 1 keV, respectively. This allows for a detection of the position centroids of the electrons, originally only about 50 µm apart. Depending on the electron energy, the centroids are now separated by 1.0 or 1.8 mm on the MCP detector. Figure 68 shows the magnification of these trajectories from SIMION simulations in one of the transverse directions. The maximum magnification in x takes place when the recoil nucleus moves in that direction. Figure 69 shows the differences between x and y in the impact position of the electrons from the subsequent decays at the detector, which is a quantity that can be measured. This quantity should be combined with alpha detection.
Figure 67: Pictures from SIMION of the detector trap plus associate elements. Using a conventional MCP detector with a delay-line readout a position resolution of 0.1 mm can be achieved, resulting in an uncertainty of ≤ 7% for the determination of the distance between the electron cloud centroids for the electron energy of 1 keV. Altogether, this results in an achievable accuracy for the lifetime measurement of the decaying 2+ state of ≤ 10%.
Figure 68: Comparison from SIMION simulations showing the differences in the x direction between the two electron clouds emitted after the alpha decay and after electron conversion. The picture is similar for the y direction. The beam axis coincides with the z direction. The subscripts 1 and 2 represent ions in the trap and ions at the detector plate, respectively. The ions were created assuming a magnetron radius of 0.5 mm and a cyclotron radius of 25 µµµµm. The electron cloud was moved 50 µµµµm in the radial direction to account for the motion of the recoil ions after the alpha decay. The energy spread is 5 %.
0.00 0.01 0.02 0.03 0.04 0.05
0.0
0.2
0.4
0.6
0.8
1.0
1.2
∆x2 (
mm
)
∆x1 (mm)
Energy= 20 keV V
0.00 0.01 0.02 0.03 0.04 0.05
0.0
0.5
1.0
1.5
2.0
∆x
2 (
mm
)
∆x1 (mm)
Energy= 1 keV
Pumping barrier
Detectors/ Ring electrode
Endcap
Endcap
Ions from PPT Electrons
to MCP
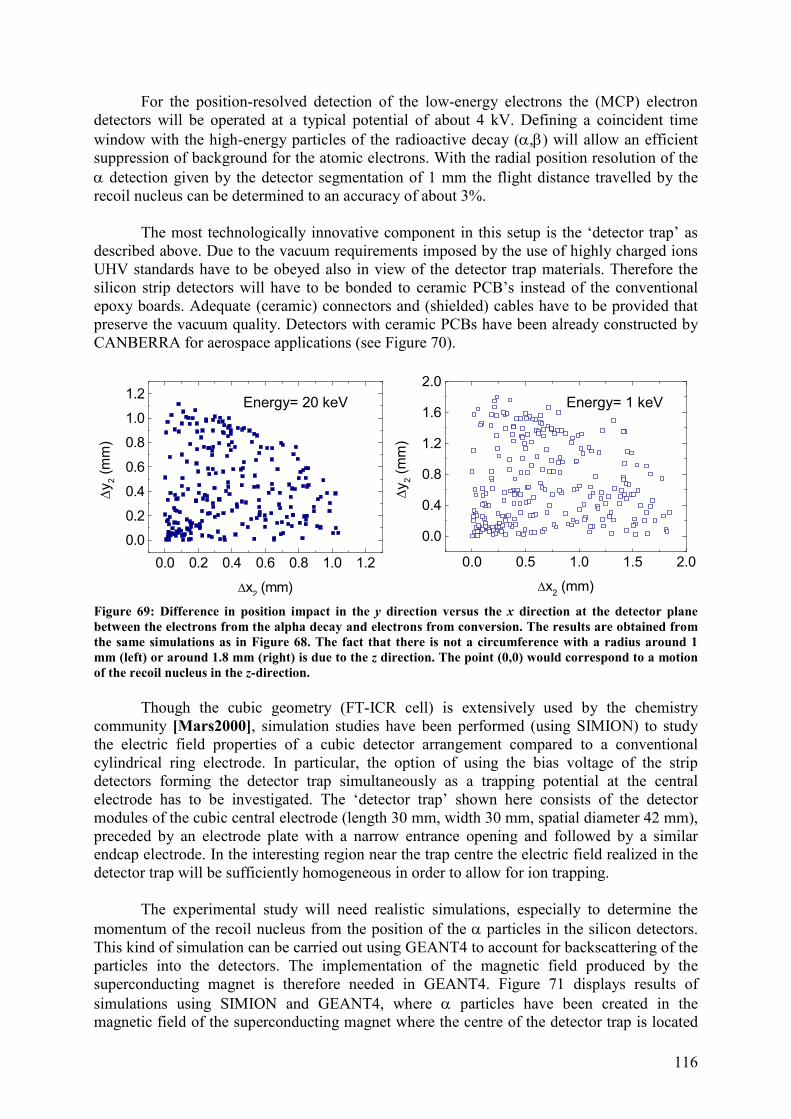
116
For the position-resolved detection of the low-energy electrons the (MCP) electron detectors will be operated at a typical potential of about 4 kV. Defining a coincident time window with the high-energy particles of the radioactive decay (α,β) will allow an efficient suppression of background for the atomic electrons. With the radial position resolution of the α detection given by the detector segmentation of 1 mm the flight distance travelled by the recoil nucleus can be determined to an accuracy of about 3%.
The most technologically innovative component in this setup is the ‘detector trap’ as
described above. Due to the vacuum requirements imposed by the use of highly charged ions UHV standards have to be obeyed also in view of the detector trap materials. Therefore the silicon strip detectors will have to be bonded to ceramic PCB’s instead of the conventional epoxy boards. Adequate (ceramic) connectors and (shielded) cables have to be provided that preserve the vacuum quality. Detectors with ceramic PCBs have been already constructed by CANBERRA for aerospace applications (see Figure 70).
Figure 69: Difference in position impact in the y direction versus the x direction at the detector plane between the electrons from the alpha decay and electrons from conversion. The results are obtained from the same simulations as in Figure 68. The fact that there is not a circumference with a radius around 1 mm (left) or around 1.8 mm (right) is due to the z direction. The point (0,0) would correspond to a motion of the recoil nucleus in the z-direction.
Though the cubic geometry (FT-ICR cell) is extensively used by the chemistry community [Mars2000], simulation studies have been performed (using SIMION) to study the electric field properties of a cubic detector arrangement compared to a conventional cylindrical ring electrode. In particular, the option of using the bias voltage of the strip detectors forming the detector trap simultaneously as a trapping potential at the central electrode has to be investigated. The ‘detector trap’ shown here consists of the detector modules of the cubic central electrode (length 30 mm, width 30 mm, spatial diameter 42 mm), preceded by an electrode plate with a narrow entrance opening and followed by a similar endcap electrode. In the interesting region near the trap centre the electric field realized in the detector trap will be sufficiently homogeneous in order to allow for ion trapping.
The experimental study will need realistic simulations, especially to determine the
momentum of the recoil nucleus from the position of the α particles in the silicon detectors. This kind of simulation can be carried out using GEANT4 to account for backscattering of the particles into the detectors. The implementation of the magnetic field produced by the superconducting magnet is therefore needed in GEANT4. Figure 71 displays results of simulations using SIMION and GEANT4, where α particles have been created in the magnetic field of the superconducting magnet where the centre of the detector trap is located
0.0 0.5 1.0 1.5 2.0
0.0
0.4
0.8
1.2
1.6
2.0
∆y2 (
mm
)
∆x2 (mm)
0.0 0.2 0.4 0.6 0.8 1.0 1.2
0.0
0.2
0.4
0.6
0.8
1.0
1.2
∆y
2 (
mm
)
∆x2 (mm)
Energy= 1 keV Energy= 20 keV V
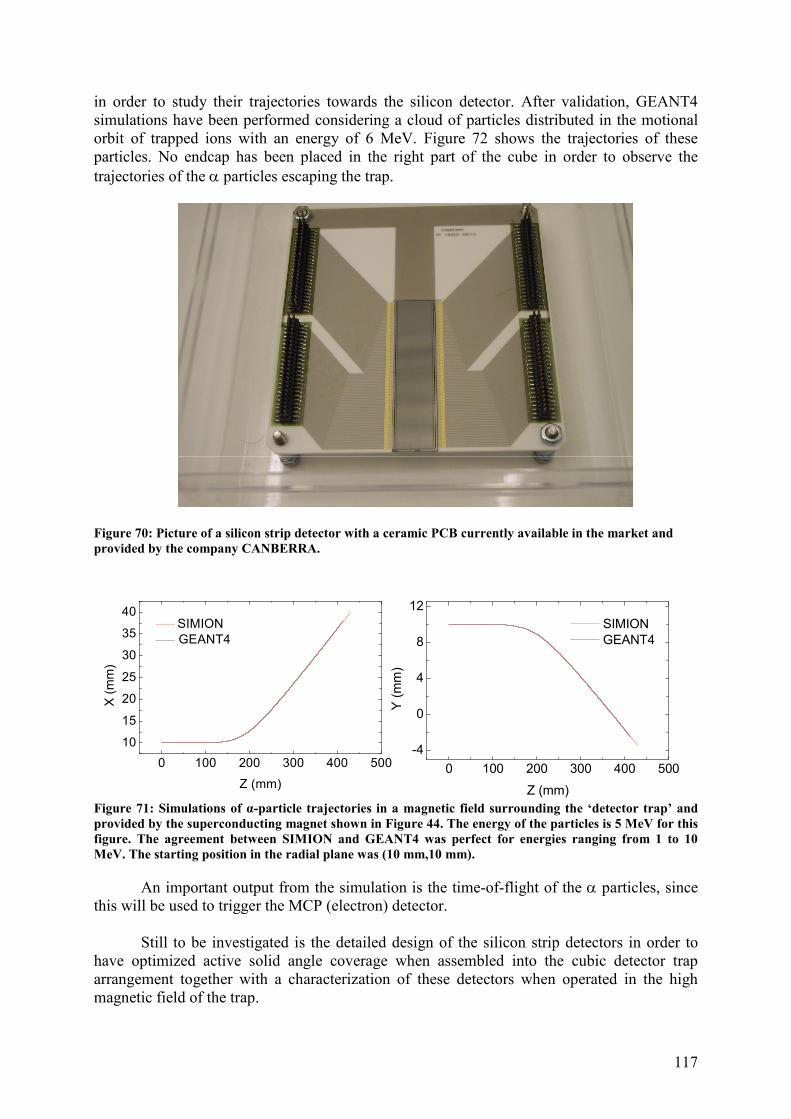
117
in order to study their trajectories towards the silicon detector. After validation, GEANT4 simulations have been performed considering a cloud of particles distributed in the motional orbit of trapped ions with an energy of 6 MeV. Figure 72 shows the trajectories of these particles. No endcap has been placed in the right part of the cube in order to observe the trajectories of the α particles escaping the trap.
Figure 70: Picture of a silicon strip detector with a ceramic PCB currently available in the market and provided by the company CANBERRA.
Figure 71: Simulations of α-particle trajectories in a magnetic field surrounding the ‘detector trap’ and provided by the superconducting magnet shown in Figure 44. The energy of the particles is 5 MeV for this figure. The agreement between SIMION and GEANT4 was perfect for energies ranging from 1 to 10 MeV. The starting position in the radial plane was (10 mm,10 mm).
An important output from the simulation is the time-of-flight of the α particles, since this will be used to trigger the MCP (electron) detector.
Still to be investigated is the detailed design of the silicon strip detectors in order to
have optimized active solid angle coverage when assembled into the cubic detector trap arrangement together with a characterization of these detectors when operated in the high magnetic field of the trap.
0 100 200 300 400 500
10
15
20
25
30
35
40
SIMION
GEANT4
X (
mm
)
Z (mm)
0 100 200 300 400 500
-4
0
4
8
12
SIMION
GEANT4
Y (
mm
)
Z (mm)
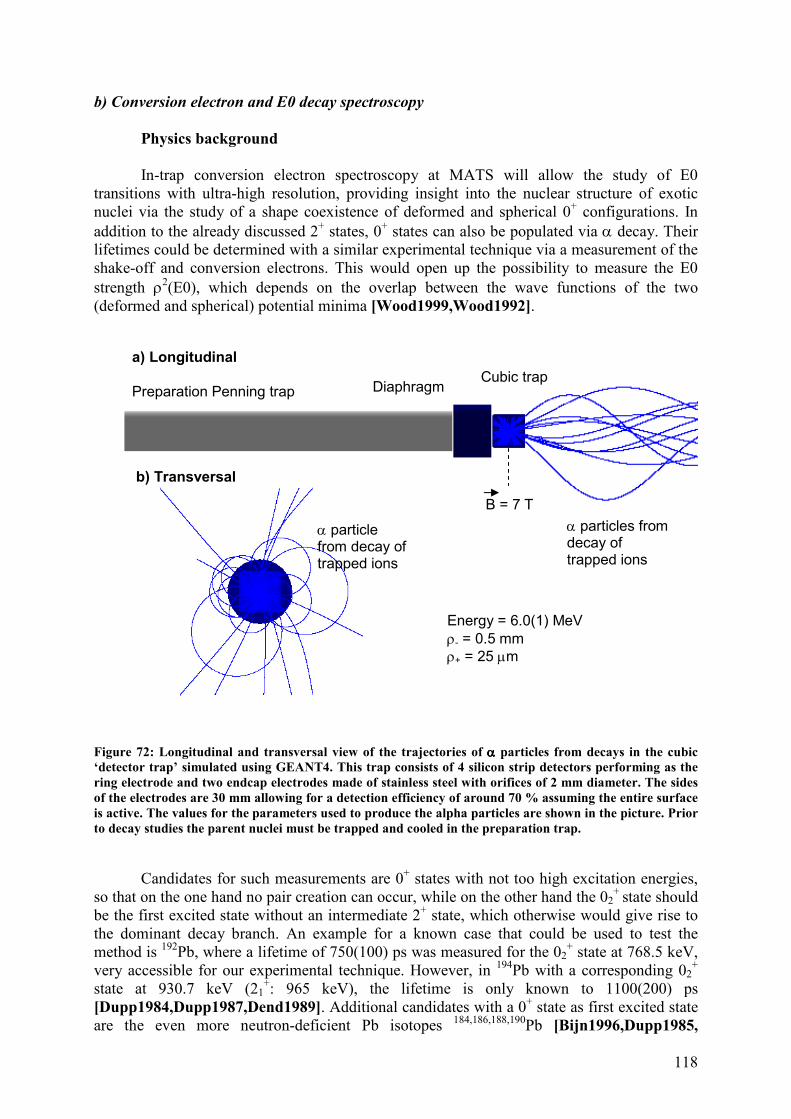
118
b) Conversion electron and E0 decay spectroscopy
Physics background In-trap conversion electron spectroscopy at MATS will allow the study of E0
transitions with ultra-high resolution, providing insight into the nuclear structure of exotic nuclei via the study of a shape coexistence of deformed and spherical 0+ configurations. In addition to the already discussed 2+ states, 0+ states can also be populated via α decay. Their lifetimes could be determined with a similar experimental technique via a measurement of the shake-off and conversion electrons. This would open up the possibility to measure the E0 strength ρ2(E0), which depends on the overlap between the wave functions of the two (deformed and spherical) potential minima [Wood1999,Wood1992].
Figure 72: Longitudinal and transversal view of the trajectories of αααα particles from decays in the cubic ‘detector trap’ simulated using GEANT4. This trap consists of 4 silicon strip detectors performing as the ring electrode and two endcap electrodes made of stainless steel with orifices of 2 mm diameter. The sides of the electrodes are 30 mm allowing for a detection efficiency of around 70 % assuming the entire surface is active. The values for the parameters used to produce the alpha particles are shown in the picture. Prior to decay studies the parent nuclei must be trapped and cooled in the preparation trap.
Candidates for such measurements are 0+ states with not too high excitation energies, so that on the one hand no pair creation can occur, while on the other hand the 02
+ state should be the first excited state without an intermediate 2+ state, which otherwise would give rise to the dominant decay branch. An example for a known case that could be used to test the method is 192Pb, where a lifetime of 750(100) ps was measured for the 02
+ state at 768.5 keV, very accessible for our experimental technique. However, in 194Pb with a corresponding 02
+ state at 930.7 keV (21
+: 965 keV), the lifetime is only known to 1100(200) ps [Dupp1984,Dupp1987,Dend1989]. Additional candidates with a 0+ state as first excited state are the even more neutron-deficient Pb isotopes 184,186,188,190Pb [Bijn1996,Dupp1985,
B = 7 T α particles from decay of trapped ions
a) Longitudinal view
b) Transversal view
α particle from decay of trapped ions
Preparation Penning trap Diaphragm Cubic trap
Energy = 6.0(1) MeV
ρ- = 0.5 mm
ρ+ = 25 µm
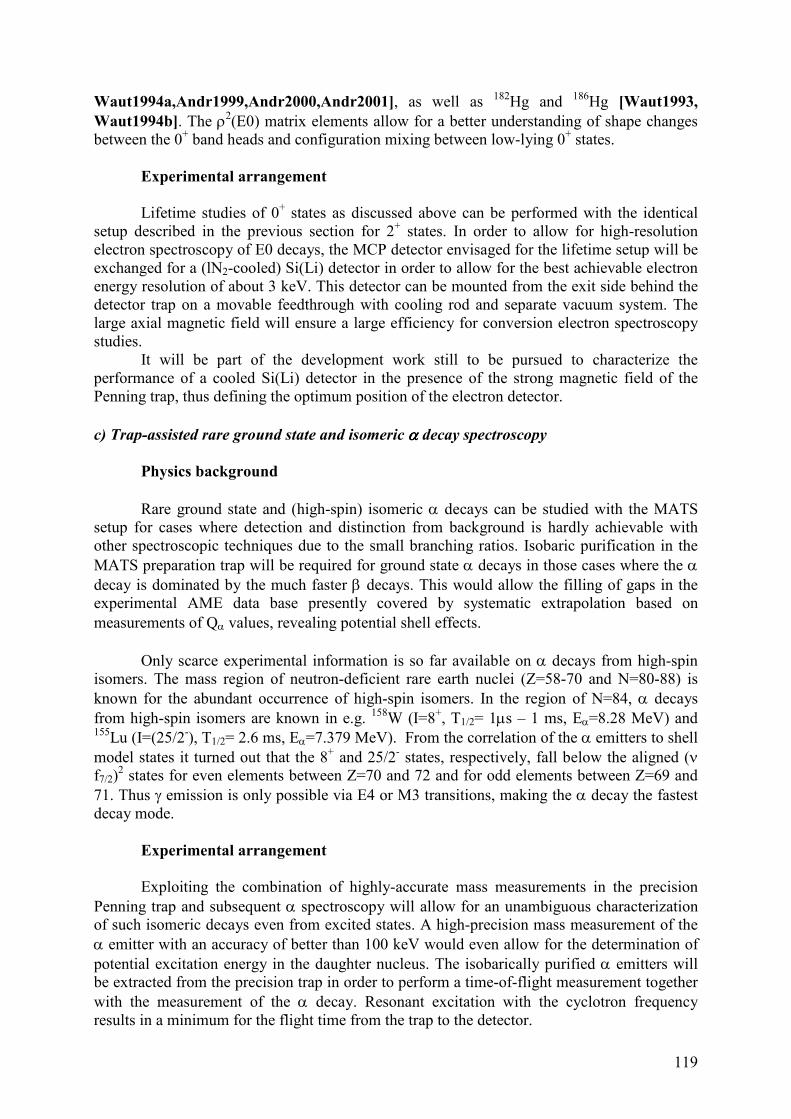
119
Waut1994a,Andr1999,Andr2000,Andr2001], as well as 182Hg and 186Hg [Waut1993, Waut1994b]. The ρ2(E0) matrix elements allow for a better understanding of shape changes between the 0+ band heads and configuration mixing between low-lying 0+ states.
Experimental arrangement Lifetime studies of 0+ states as discussed above can be performed with the identical
setup described in the previous section for 2+ states. In order to allow for high-resolution electron spectroscopy of E0 decays, the MCP detector envisaged for the lifetime setup will be exchanged for a (lN2-cooled) Si(Li) detector in order to allow for the best achievable electron energy resolution of about 3 keV. This detector can be mounted from the exit side behind the detector trap on a movable feedthrough with cooling rod and separate vacuum system. The large axial magnetic field will ensure a large efficiency for conversion electron spectroscopy studies.
It will be part of the development work still to be pursued to characterize the performance of a cooled Si(Li) detector in the presence of the strong magnetic field of the Penning trap, thus defining the optimum position of the electron detector.
c) Trap-assisted rare ground state and isomeric αααα decay spectroscopy
Physics background Rare ground state and (high-spin) isomeric α decays can be studied with the MATS
setup for cases where detection and distinction from background is hardly achievable with other spectroscopic techniques due to the small branching ratios. Isobaric purification in the MATS preparation trap will be required for ground state α decays in those cases where the α decay is dominated by the much faster β decays. This would allow the filling of gaps in the experimental AME data base presently covered by systematic extrapolation based on measurements of Qα values, revealing potential shell effects.
Only scarce experimental information is so far available on α decays from high-spin
isomers. The mass region of neutron-deficient rare earth nuclei (Z=58-70 and N=80-88) is known for the abundant occurrence of high-spin isomers. In the region of N=84, α decays from high-spin isomers are known in e.g. 158W (I=8+, T1/2= 1µs – 1 ms, Eα=8.28 MeV) and 155Lu (I=(25/2-), T1/2= 2.6 ms, Eα=7.379 MeV). From the correlation of the α emitters to shell model states it turned out that the 8+ and 25/2- states, respectively, fall below the aligned (ν f7/2)
2 states for even elements between Z=70 and 72 and for odd elements between Z=69 and 71. Thus γ emission is only possible via E4 or M3 transitions, making the α decay the fastest decay mode.
Experimental arrangement Exploiting the combination of highly-accurate mass measurements in the precision
Penning trap and subsequent α spectroscopy will allow for an unambiguous characterization of such isomeric decays even from excited states. A high-precision mass measurement of the α emitter with an accuracy of better than 100 keV would even allow for the determination of potential excitation energy in the daughter nucleus. The isobarically purified α emitters will be extracted from the precision trap in order to perform a time-of-flight measurement together with the measurement of the α decay. Resonant excitation with the cyclotron frequency results in a minimum for the flight time from the trap to the detector.
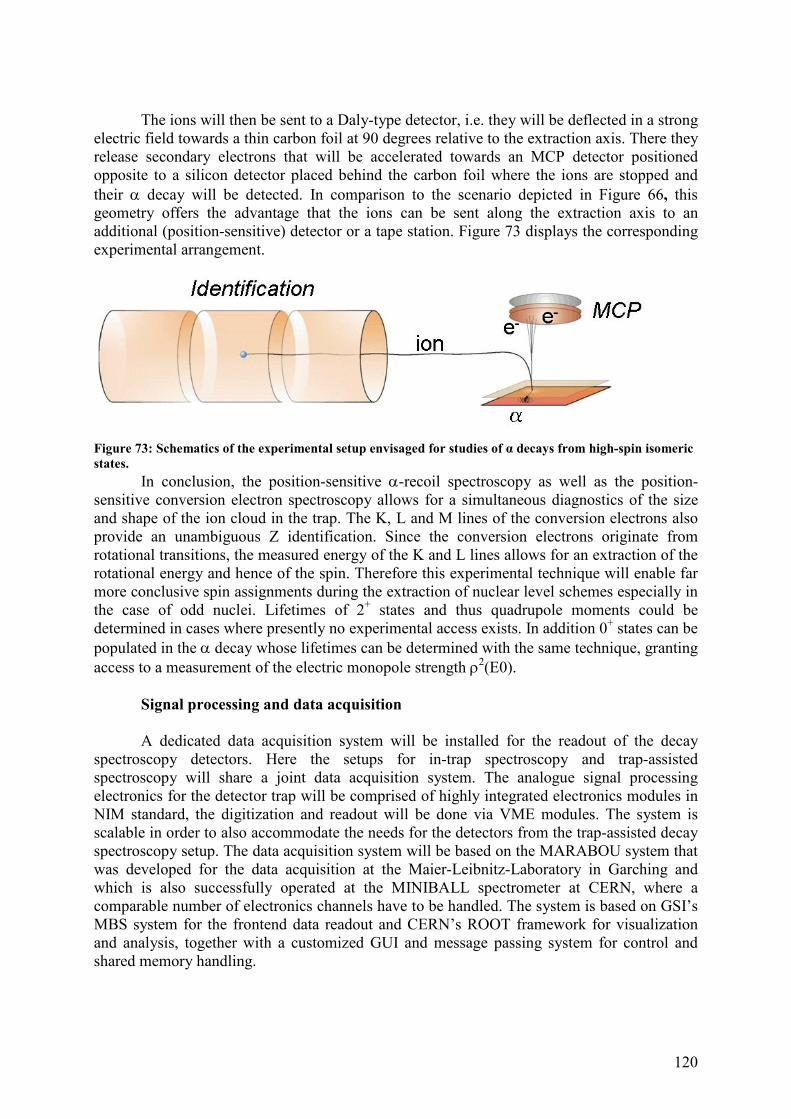
120
The ions will then be sent to a Daly-type detector, i.e. they will be deflected in a strong
electric field towards a thin carbon foil at 90 degrees relative to the extraction axis. There they release secondary electrons that will be accelerated towards an MCP detector positioned opposite to a silicon detector placed behind the carbon foil where the ions are stopped and their α decay will be detected. In comparison to the scenario depicted in Figure 66, this geometry offers the advantage that the ions can be sent along the extraction axis to an additional (position-sensitive) detector or a tape station. Figure 73 displays the corresponding experimental arrangement.
Figure 73: Schematics of the experimental setup envisaged for studies of α decays from high-spin isomeric states.
In conclusion, the position-sensitive α-recoil spectroscopy as well as the position-sensitive conversion electron spectroscopy allows for a simultaneous diagnostics of the size and shape of the ion cloud in the trap. The K, L and M lines of the conversion electrons also provide an unambiguous Z identification. Since the conversion electrons originate from rotational transitions, the measured energy of the K and L lines allows for an extraction of the rotational energy and hence of the spin. Therefore this experimental technique will enable far more conclusive spin assignments during the extraction of nuclear level schemes especially in the case of odd nuclei. Lifetimes of 2+ states and thus quadrupole moments could be determined in cases where presently no experimental access exists. In addition 0+ states can be populated in the α decay whose lifetimes can be determined with the same technique, granting access to a measurement of the electric monopole strength ρ2(E0).
Signal processing and data acquisition A dedicated data acquisition system will be installed for the readout of the decay
spectroscopy detectors. Here the setups for in-trap spectroscopy and trap-assisted spectroscopy will share a joint data acquisition system. The analogue signal processing electronics for the detector trap will be comprised of highly integrated electronics modules in NIM standard, the digitization and readout will be done via VME modules. The system is scalable in order to also accommodate the needs for the detectors from the trap-assisted decay spectroscopy setup. The data acquisition system will be based on the MARABOU system that was developed for the data acquisition at the Maier-Leibnitz-Laboratory in Garching and which is also successfully operated at the MINIBALL spectrometer at CERN, where a comparable number of electronics channels have to be handled. The system is based on GSI’s MBS system for the frontend data readout and CERN’s ROOT framework for visualization and analysis, together with a customized GUI and message passing system for control and shared memory handling.
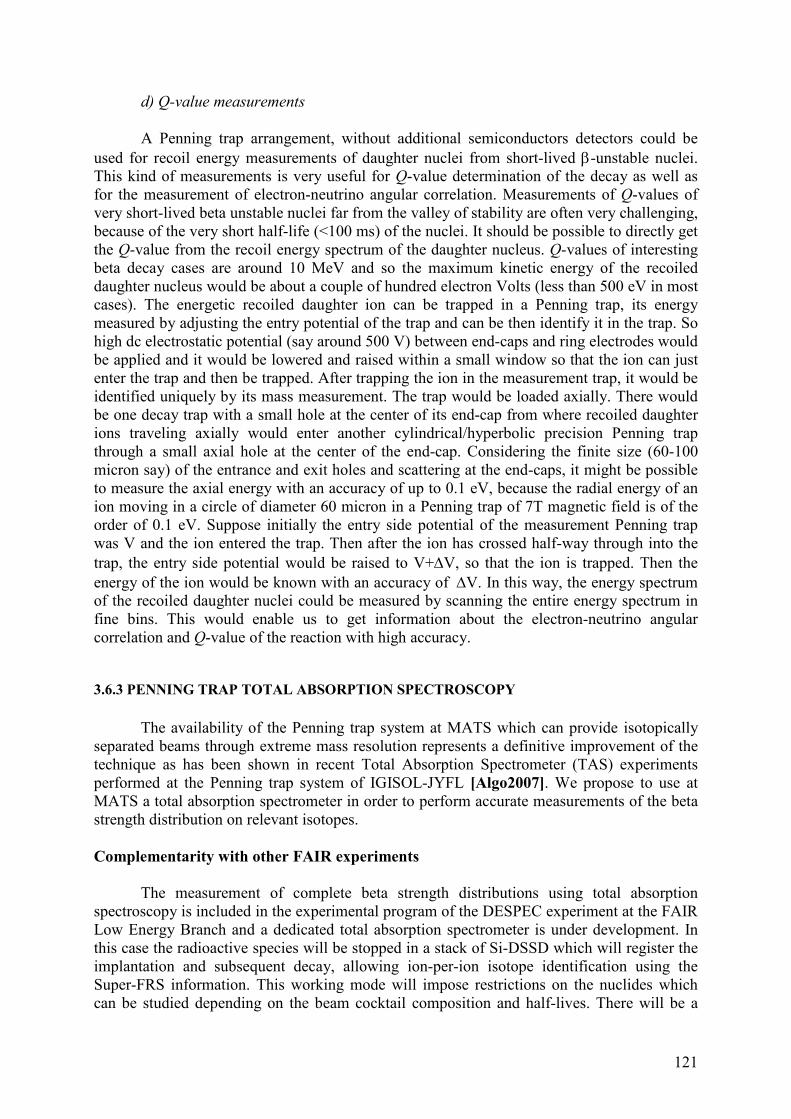
121
d) Q-value measurements
A Penning trap arrangement, without additional semiconductors detectors could be
used for recoil energy measurements of daughter nuclei from short-lived β-unstable nuclei. This kind of measurements is very useful for Q-value determination of the decay as well as for the measurement of electron-neutrino angular correlation. Measurements of Q-values of very short-lived beta unstable nuclei far from the valley of stability are often very challenging, because of the very short half-life (<100 ms) of the nuclei. It should be possible to directly get the Q-value from the recoil energy spectrum of the daughter nucleus. Q-values of interesting beta decay cases are around 10 MeV and so the maximum kinetic energy of the recoiled daughter nucleus would be about a couple of hundred electron Volts (less than 500 eV in most cases). The energetic recoiled daughter ion can be trapped in a Penning trap, its energy measured by adjusting the entry potential of the trap and can be then identify it in the trap. So high dc electrostatic potential (say around 500 V) between end-caps and ring electrodes would be applied and it would be lowered and raised within a small window so that the ion can just enter the trap and then be trapped. After trapping the ion in the measurement trap, it would be identified uniquely by its mass measurement. The trap would be loaded axially. There would be one decay trap with a small hole at the center of its end-cap from where recoiled daughter ions traveling axially would enter another cylindrical/hyperbolic precision Penning trap through a small axial hole at the center of the end-cap. Considering the finite size (60-100 micron say) of the entrance and exit holes and scattering at the end-caps, it might be possible to measure the axial energy with an accuracy of up to 0.1 eV, because the radial energy of an ion moving in a circle of diameter 60 micron in a Penning trap of 7T magnetic field is of the order of 0.1 eV. Suppose initially the entry side potential of the measurement Penning trap was V and the ion entered the trap. Then after the ion has crossed half-way through into the trap, the entry side potential would be raised to V+∆V, so that the ion is trapped. Then the energy of the ion would be known with an accuracy of ∆V. In this way, the energy spectrum of the recoiled daughter nuclei could be measured by scanning the entire energy spectrum in fine bins. This would enable us to get information about the electron-neutrino angular correlation and Q-value of the reaction with high accuracy.
3.6.3 PENNING TRAP TOTAL ABSORPTION SPECTROSCOPY
The availability of the Penning trap system at MATS which can provide isotopically separated beams through extreme mass resolution represents a definitive improvement of the technique as has been shown in recent Total Absorption Spectrometer (TAS) experiments performed at the Penning trap system of IGISOL-JYFL [Algo2007]. We propose to use at MATS a total absorption spectrometer in order to perform accurate measurements of the beta strength distribution on relevant isotopes. Complementarity with other FAIR experiments The measurement of complete beta strength distributions using total absorption spectroscopy is included in the experimental program of the DESPEC experiment at the FAIR Low Energy Branch and a dedicated total absorption spectrometer is under development. In this case the radioactive species will be stopped in a stack of Si-DSSD which will register the implantation and subsequent decay, allowing ion-per-ion isotope identification using the Super-FRS information. This working mode will impose restrictions on the nuclides which can be studied depending on the beam cocktail composition and half-lives. There will be a
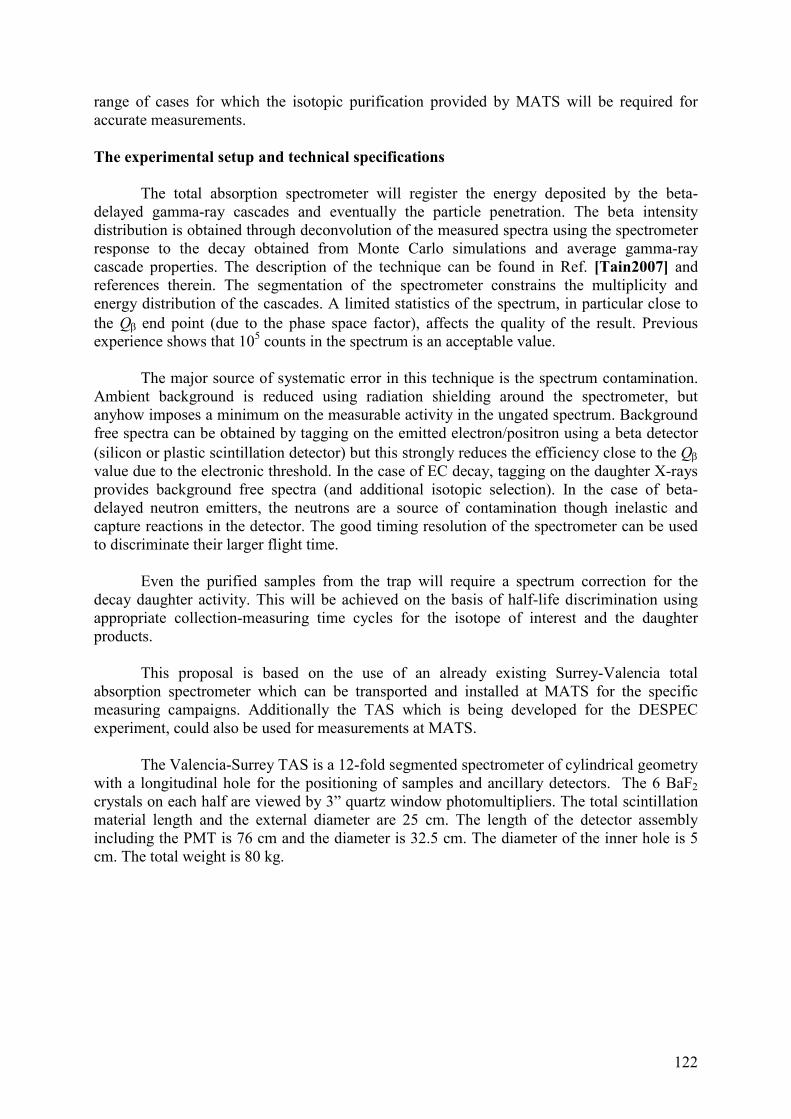
122
range of cases for which the isotopic purification provided by MATS will be required for accurate measurements. The experimental setup and technical specifications The total absorption spectrometer will register the energy deposited by the beta-delayed gamma-ray cascades and eventually the particle penetration. The beta intensity distribution is obtained through deconvolution of the measured spectra using the spectrometer response to the decay obtained from Monte Carlo simulations and average gamma-ray cascade properties. The description of the technique can be found in Ref. [Tain2007] and references therein. The segmentation of the spectrometer constrains the multiplicity and energy distribution of the cascades. A limited statistics of the spectrum, in particular close to the Qβ end point (due to the phase space factor), affects the quality of the result. Previous experience shows that 105 counts in the spectrum is an acceptable value. The major source of systematic error in this technique is the spectrum contamination. Ambient background is reduced using radiation shielding around the spectrometer, but anyhow imposes a minimum on the measurable activity in the ungated spectrum. Background free spectra can be obtained by tagging on the emitted electron/positron using a beta detector (silicon or plastic scintillation detector) but this strongly reduces the efficiency close to the Qβ value due to the electronic threshold. In the case of EC decay, tagging on the daughter X-rays provides background free spectra (and additional isotopic selection). In the case of beta-delayed neutron emitters, the neutrons are a source of contamination though inelastic and capture reactions in the detector. The good timing resolution of the spectrometer can be used to discriminate their larger flight time. Even the purified samples from the trap will require a spectrum correction for the decay daughter activity. This will be achieved on the basis of half-life discrimination using appropriate collection-measuring time cycles for the isotope of interest and the daughter products. This proposal is based on the use of an already existing Surrey-Valencia total absorption spectrometer which can be transported and installed at MATS for the specific measuring campaigns. Additionally the TAS which is being developed for the DESPEC experiment, could also be used for measurements at MATS. The Valencia-Surrey TAS is a 12-fold segmented spectrometer of cylindrical geometry with a longitudinal hole for the positioning of samples and ancillary detectors. The 6 BaF2 crystals on each half are viewed by 3” quartz window photomultipliers. The total scintillation material length and the external diameter are 25 cm. The length of the detector assembly including the PMT is 76 cm and the diameter is 32.5 cm. The diameter of the inner hole is 5 cm. The total weight is 80 kg.
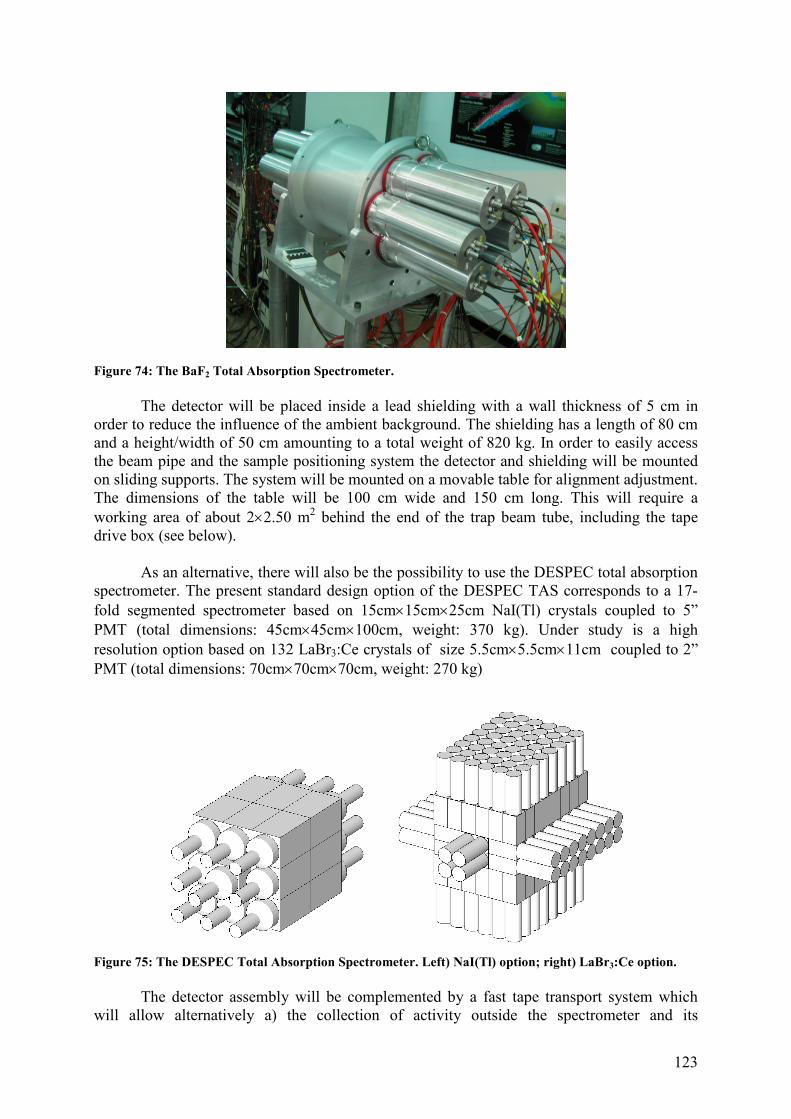
123
Figure 74: The BaF2 Total Absorption Spectrometer. The detector will be placed inside a lead shielding with a wall thickness of 5 cm in order to reduce the influence of the ambient background. The shielding has a length of 80 cm and a height/width of 50 cm amounting to a total weight of 820 kg. In order to easily access the beam pipe and the sample positioning system the detector and shielding will be mounted on sliding supports. The system will be mounted on a movable table for alignment adjustment. The dimensions of the table will be 100 cm wide and 150 cm long. This will require a working area of about 2×2.50 m2 behind the end of the trap beam tube, including the tape drive box (see below). As an alternative, there will also be the possibility to use the DESPEC total absorption spectrometer. The present standard design option of the DESPEC TAS corresponds to a 17-fold segmented spectrometer based on 15cm×15cm×25cm NaI(Tl) crystals coupled to 5” PMT (total dimensions: 45cm×45cm×100cm, weight: 370 kg). Under study is a high resolution option based on 132 LaBr3:Ce crystals of size 5.5cm×5.5cm×11cm coupled to 2” PMT (total dimensions: 70cm×70cm×70cm, weight: 270 kg)
Figure 75: The DESPEC Total Absorption Spectrometer. Left) NaI(Tl) option; right) LaBr3:Ce option. The detector assembly will be complemented by a fast tape transport system which will allow alternatively a) the collection of activity outside the spectrometer and its
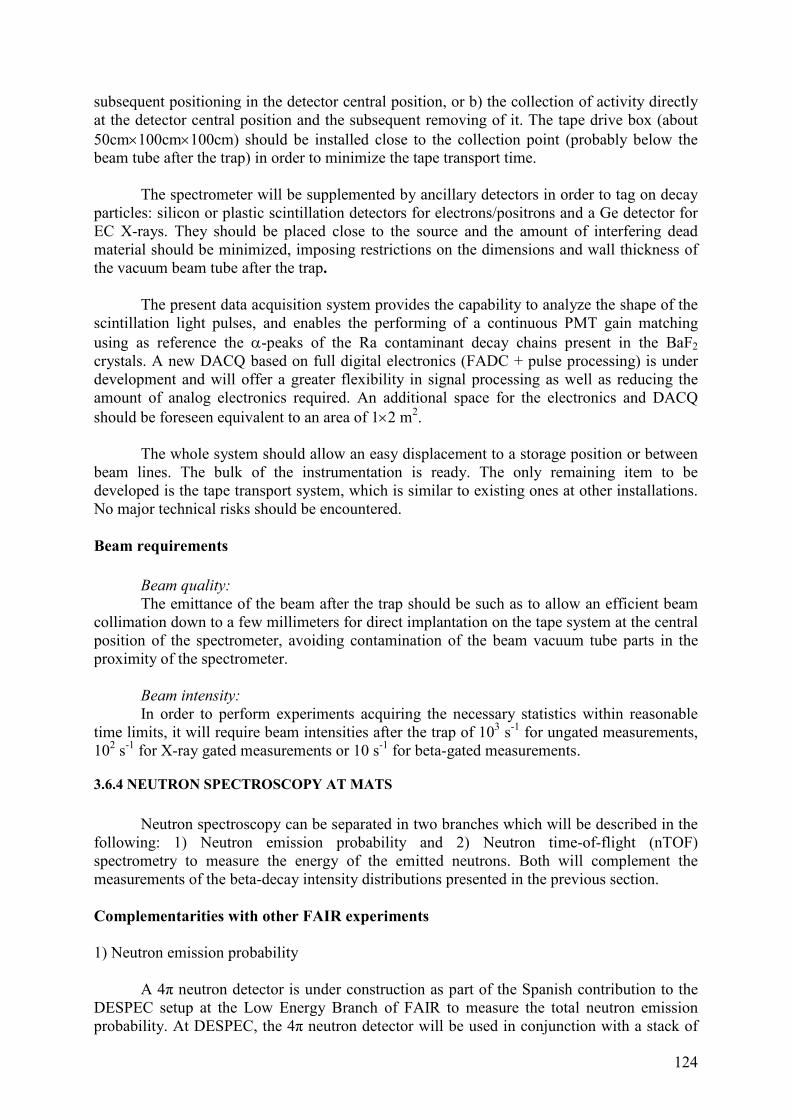
124
subsequent positioning in the detector central position, or b) the collection of activity directly at the detector central position and the subsequent removing of it. The tape drive box (about 50cm×100cm×100cm) should be installed close to the collection point (probably below the beam tube after the trap) in order to minimize the tape transport time. The spectrometer will be supplemented by ancillary detectors in order to tag on decay particles: silicon or plastic scintillation detectors for electrons/positrons and a Ge detector for EC X-rays. They should be placed close to the source and the amount of interfering dead material should be minimized, imposing restrictions on the dimensions and wall thickness of the vacuum beam tube after the trap. The present data acquisition system provides the capability to analyze the shape of the scintillation light pulses, and enables the performing of a continuous PMT gain matching using as reference the α-peaks of the Ra contaminant decay chains present in the BaF2 crystals. A new DACQ based on full digital electronics (FADC + pulse processing) is under development and will offer a greater flexibility in signal processing as well as reducing the amount of analog electronics required. An additional space for the electronics and DACQ should be foreseen equivalent to an area of 1×2 m2. The whole system should allow an easy displacement to a storage position or between beam lines. The bulk of the instrumentation is ready. The only remaining item to be developed is the tape transport system, which is similar to existing ones at other installations. No major technical risks should be encountered. Beam requirements Beam quality:
The emittance of the beam after the trap should be such as to allow an efficient beam collimation down to a few millimeters for direct implantation on the tape system at the central position of the spectrometer, avoiding contamination of the beam vacuum tube parts in the proximity of the spectrometer. Beam intensity:
In order to perform experiments acquiring the necessary statistics within reasonable time limits, it will require beam intensities after the trap of 103 s-1 for ungated measurements, 102 s-1 for X-ray gated measurements or 10 s-1 for beta-gated measurements.
3.6.4 NEUTRON SPECTROSCOPY AT MATS
Neutron spectroscopy can be separated in two branches which will be described in the following: 1) Neutron emission probability and 2) Neutron time-of-flight (nTOF) spectrometry to measure the energy of the emitted neutrons. Both will complement the measurements of the beta-decay intensity distributions presented in the previous section. Complementarities with other FAIR experiments 1) Neutron emission probability A 4π neutron detector is under construction as part of the Spanish contribution to the DESPEC setup at the Low Energy Branch of FAIR to measure the total neutron emission probability. At DESPEC, the 4π neutron detector will be used in conjunction with a stack of
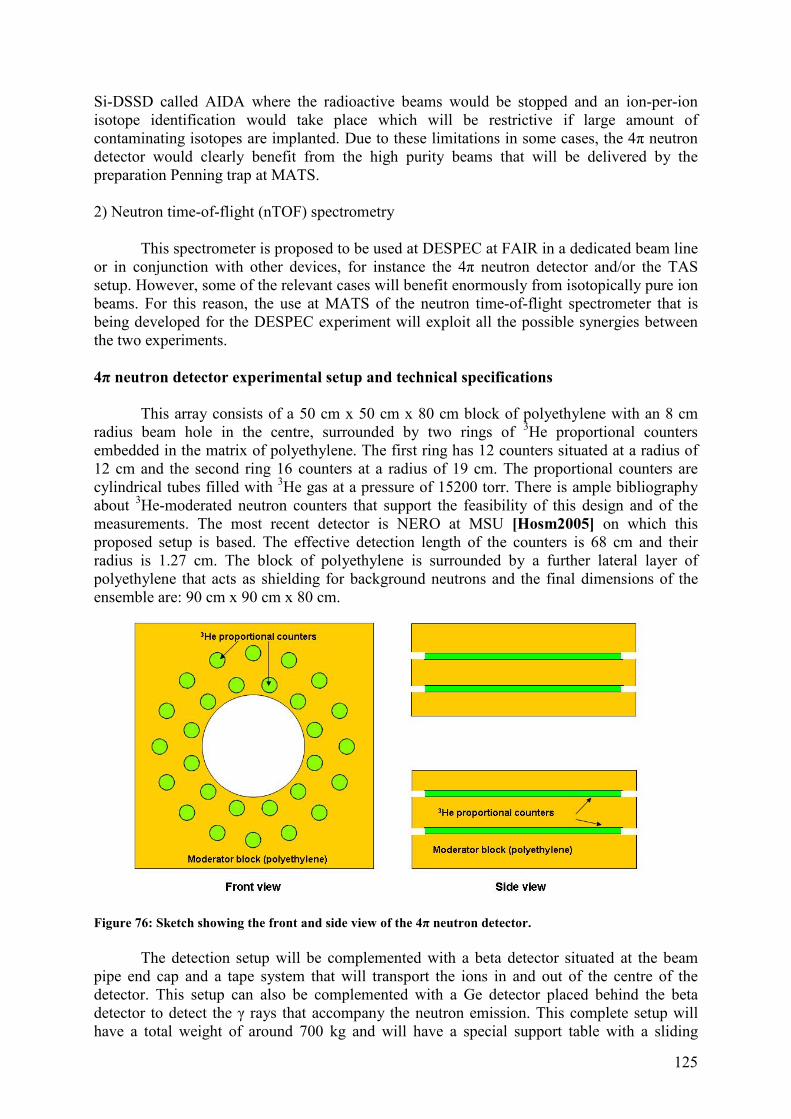
125
Si-DSSD called AIDA where the radioactive beams would be stopped and an ion-per-ion isotope identification would take place which will be restrictive if large amount of contaminating isotopes are implanted. Due to these limitations in some cases, the 4π neutron detector would clearly benefit from the high purity beams that will be delivered by the preparation Penning trap at MATS. 2) Neutron time-of-flight (nTOF) spectrometry This spectrometer is proposed to be used at DESPEC at FAIR in a dedicated beam line or in conjunction with other devices, for instance the 4π neutron detector and/or the TAS setup. However, some of the relevant cases will benefit enormously from isotopically pure ion beams. For this reason, the use at MATS of the neutron time-of-flight spectrometer that is being developed for the DESPEC experiment will exploit all the possible synergies between the two experiments. 4π neutron detector experimental setup and technical specifications This array consists of a 50 cm x 50 cm x 80 cm block of polyethylene with an 8 cm radius beam hole in the centre, surrounded by two rings of 3He proportional counters embedded in the matrix of polyethylene. The first ring has 12 counters situated at a radius of 12 cm and the second ring 16 counters at a radius of 19 cm. The proportional counters are cylindrical tubes filled with 3He gas at a pressure of 15200 torr. There is ample bibliography about 3He-moderated neutron counters that support the feasibility of this design and of the measurements. The most recent detector is NERO at MSU [Hosm2005] on which this proposed setup is based. The effective detection length of the counters is 68 cm and their radius is 1.27 cm. The block of polyethylene is surrounded by a further lateral layer of polyethylene that acts as shielding for background neutrons and the final dimensions of the ensemble are: 90 cm x 90 cm x 80 cm.
Figure 76: Sketch showing the front and side view of the 4π neutron detector. The detection setup will be complemented with a beta detector situated at the beam pipe end cap and a tape system that will transport the ions in and out of the centre of the detector. This setup can also be complemented with a Ge detector placed behind the beta detector to detect the γ rays that accompany the neutron emission. This complete setup will have a total weight of around 700 kg and will have a special support table with a sliding
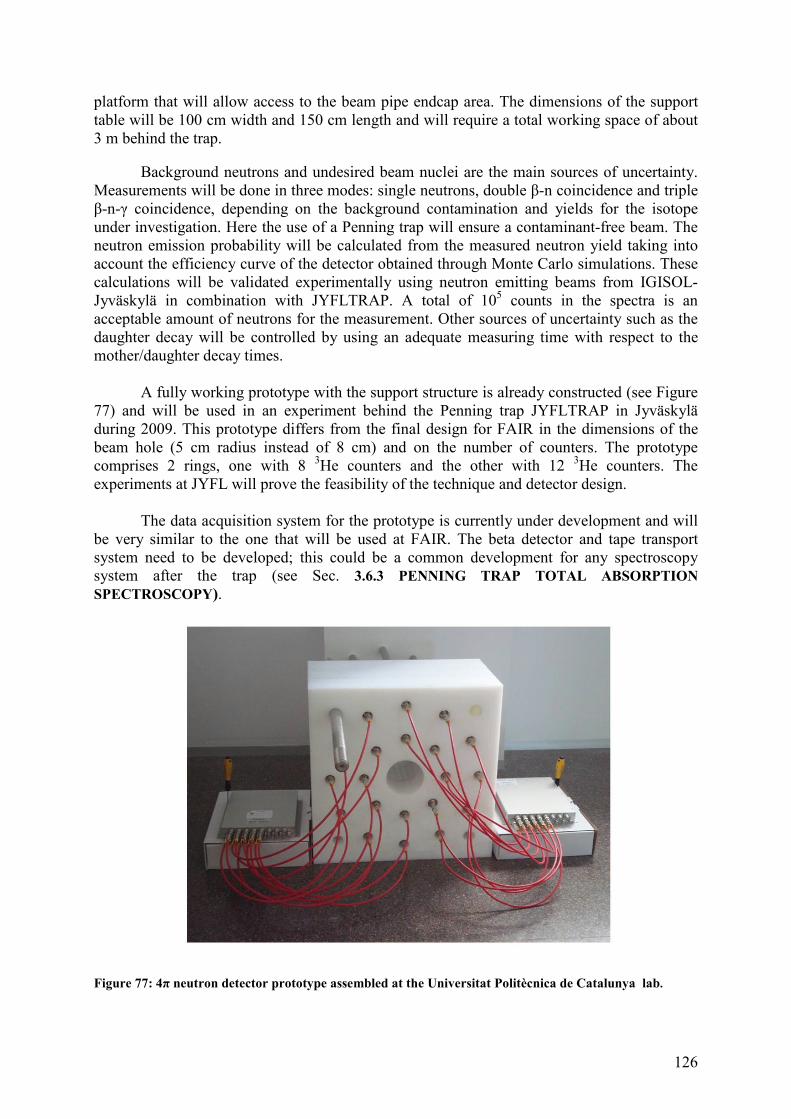
126
platform that will allow access to the beam pipe endcap area. The dimensions of the support table will be 100 cm width and 150 cm length and will require a total working space of about 3 m behind the trap. Background neutrons and undesired beam nuclei are the main sources of uncertainty. Measurements will be done in three modes: single neutrons, double β-n coincidence and triple β-n-γ coincidence, depending on the background contamination and yields for the isotope under investigation. Here the use of a Penning trap will ensure a contaminant-free beam. The neutron emission probability will be calculated from the measured neutron yield taking into account the efficiency curve of the detector obtained through Monte Carlo simulations. These calculations will be validated experimentally using neutron emitting beams from IGISOL-Jyväskylä in combination with JYFLTRAP. A total of 105 counts in the spectra is an acceptable amount of neutrons for the measurement. Other sources of uncertainty such as the daughter decay will be controlled by using an adequate measuring time with respect to the mother/daughter decay times. A fully working prototype with the support structure is already constructed (see Figure 77) and will be used in an experiment behind the Penning trap JYFLTRAP in Jyväskylä during 2009. This prototype differs from the final design for FAIR in the dimensions of the beam hole (5 cm radius instead of 8 cm) and on the number of counters. The prototype comprises 2 rings, one with 8 3He counters and the other with 12 3He counters. The experiments at JYFL will prove the feasibility of the technique and detector design. The data acquisition system for the prototype is currently under development and will be very similar to the one that will be used at FAIR. The beta detector and tape transport system need to be developed; this could be a common development for any spectroscopy system after the trap (see Sec. 3.6.3 PENNING TRAP TOTAL ABSORPTION SPECTROSCOPY).
Figure 77: 4π neutron detector prototype assembled at the Universitat Politècnica de Catalunya lab.
127
nTOF-spectrometer experimental setup and technical specifications The nTOF neutron spectrometer will consist of a set of 100 cylindrical modules filled with BC501A liquid scintillator. Each cell has a diameter of 20 cm and a thickness of 5 cm, thus providing an estimated intrinsic efficiency ranging from 50% at 1 MeV to 22% at 10 MeV. Currently, 30 cells have been funded. Such an array can be considered as a demonstrator. The overall strategy that is being adopted in designing the new array is the following. Improved energy resolution and elimination of asymmetric lineshapes in the TOF spectra.
→ thin, small volume detectors with increased TOF flight paths (~4–6 m) Lowest possible neutron-energy threshold.
→ thin, small volume detectors and digital electronics/signal processing. Cross-talk rejection ⇒ enable β-Xn detection.
→ modular, highly granular array with variable geometry/configuration. Neutron-γ discrimination ⇒ reduced backgrounds, enable β-Xn detection. liquid scintillators or new solid scintillators.
Figure 78: General view of the nTOF spectrometer proposed for DESPEC. Each cell has a dimension of 20 cm diameter x 5 cm thickness. This design will offer several improvements with respect to an array such as TONNERRE [Buta2000]. TONNERRE suffers from a poor energy resolution, which will hinder studies of nuclei with moderate to high level densities, relatively high (low-energy) thresholds (typically ~200-300 keV) and asymmetric lineshapes. The 30 cell demonstrator (see Figure 79) offers some of the general characteristics sought but still a moderate energy-resolution using a relatively small number of liquid scintillators, and could prove useful in the initial stages of MATS and also in those instances
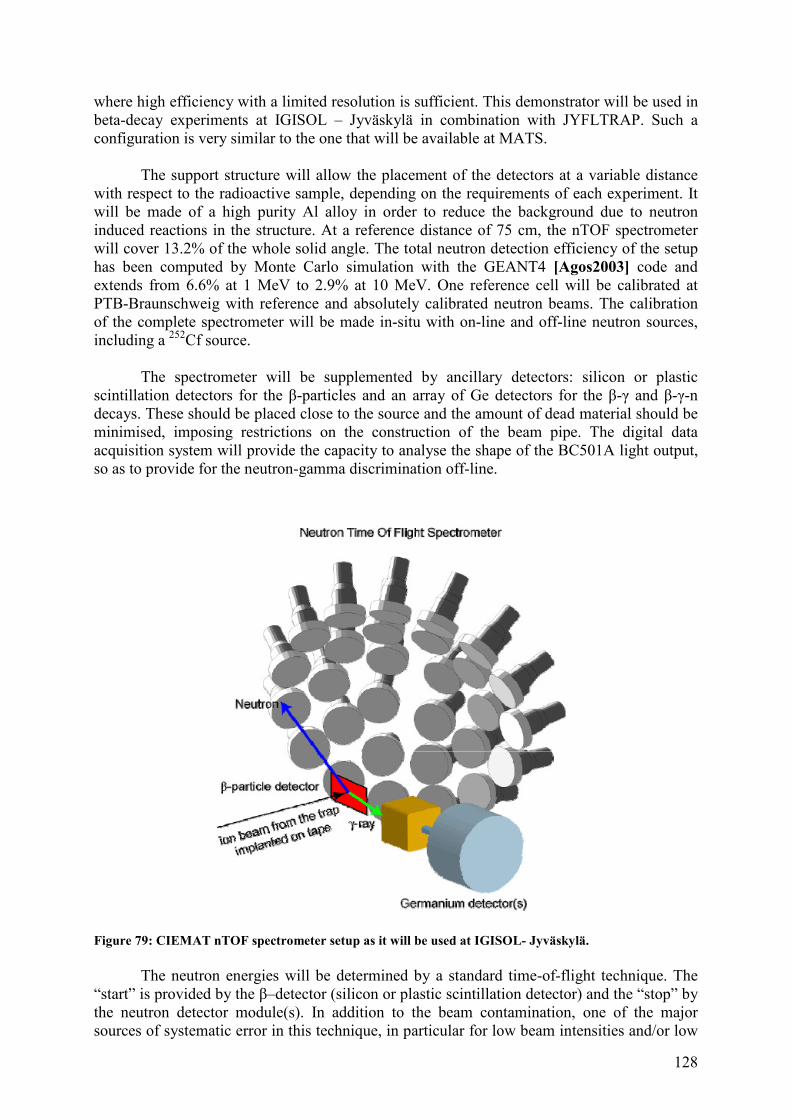
128
where high efficiency with a limited resolution is sufficient. This demonstrator will be used in beta-decay experiments at IGISOL – Jyväskylä in combination with JYFLTRAP. Such a configuration is very similar to the one that will be available at MATS. The support structure will allow the placement of the detectors at a variable distance with respect to the radioactive sample, depending on the requirements of each experiment. It will be made of a high purity Al alloy in order to reduce the background due to neutron induced reactions in the structure. At a reference distance of 75 cm, the nTOF spectrometer will cover 13.2% of the whole solid angle. The total neutron detection efficiency of the setup has been computed by Monte Carlo simulation with the GEANT4 [Agos2003] code and extends from 6.6% at 1 MeV to 2.9% at 10 MeV. One reference cell will be calibrated at PTB-Braunschweig with reference and absolutely calibrated neutron beams. The calibration of the complete spectrometer will be made in-situ with on-line and off-line neutron sources, including a 252Cf source. The spectrometer will be supplemented by ancillary detectors: silicon or plastic scintillation detectors for the β-particles and an array of Ge detectors for the β-γ and β-γ-n decays. These should be placed close to the source and the amount of dead material should be minimised, imposing restrictions on the construction of the beam pipe. The digital data acquisition system will provide the capacity to analyse the shape of the BC501A light output, so as to provide for the neutron-gamma discrimination off-line.
Figure 79: CIEMAT nTOF spectrometer setup as it will be used at IGISOL- Jyväskylä. The neutron energies will be determined by a standard time-of-flight technique. The “start” is provided by the β–detector (silicon or plastic scintillation detector) and the “stop” by the neutron detector module(s). In addition to the beam contamination, one of the major sources of systematic error in this technique, in particular for low beam intensities and/or low
129
neutron-emission probabilities, is the presence of a featureless background from the ambient γ-rays (and to some extent the cosmic-ray) flux. Such effects have plagued measurements using arrays of plastic scintillators, for instance TONNERRE [Buta2000], and have rendered impossible any multi-neutron detection capabilities. This background will be eliminated, as outlined below, by using for example the pulse shape discrimination capabilities of a liquid scintillator (BC501A). In general, the isotopic selection of the mass separated beam is achieved on the basis of half-life discrimination using appropriate collection-counting cycles for the isotope of interest and the possible contamination (which in the most favourable case is only the daughter activity). This will be done at the DESPEC experiment. However, the use of element selective ion sources is essential in the cases where half-life differences are small or the contaminant activity dominates. The availability of a Penning trap system at MATS which can provide very good mass separation will provide a significant improvement and thus potentially benefit certain measurements, as will be the case for the TAS setup.
The overall time resolution of the β-n coincidence setup will be 1ns. With such a value, the energy resolution of the spectrometer will range between 160 keV at 1 MeV to 3 MeV at 10 MeV for a flight path of 75 cm.
The detector assembly will be complemented by a fast tape transport system which will allow the activity to be collected and subsequently moved into the counting position and for it to be evacuated at the end of the counting period. The whole system should allow reasonably easy displacement to a storage position.
Beam requirements Beam quality:
The emittance should be such as to allow an efficient beam collimation down to a few millimeters for direct implantation on the tape system at the central position of the spectrometer, avoiding contamination of the beam vacuum tube parts in the proximity of the spectrometer. Beam intensity:
The exact requirements are a function of the type of measurement to be undertaken, the neutron emission probability of the nucleus under study and the number of individual transitions. For neutron-decay probability, the estimated required production rate from the trap in order to obtain 100000 neutron counts per measured isotope in the spectra would be about 700/s for ungated neutron measurements and 2000/s for beta-gated measurements. For the nTOF, in order to perform experiments acquiring the necessary statistics within a reasonable timeframe will require beam intensities of order 103−104
pps for β−γ−n type coincidence measurements.
3.7 SPECIFICATIONS OF THE MATS EXPERIMENT
The RFQ is designed to provide bunched beams with a longitudinal emittance of about
10 eV µs and a transversal emittance of ~10 π mm mrad at 2.5 keV energy, ideally suited for injection into an EBIT. The cooling time within the buncher is 1 to a few ms and the overall efficiency can be as high as 50%. The EBIT can hold more than 109 charges for an electron-
130
beam charge-compensation of 10%. The most dominant charge states (>30%) for some typical ions, charge bred for 20 ms in an EBIT with the parameters given above, are listed in Table 9.
Table 9: Peak charge-state after 20 ms breeding time
Element Charge-state Element Charge-state
8O 7+ 20Ca 12+
11Na 9+ 36Kr 16+
12Mg 9+ 37Rb 18+
18Ar 11+ 51Sb 19+
19K 11+ 54Xe 21+
Special requirements are needed for the superconducting magnet of the precision trap
with respect to the magnetic field magnitude (B ≥ 7 T), homogeneity (≤ ±0.1 ppm measured over a 10 mm diameter spherical volume), and stability (δB/δt×1/B ≤ 10-9 / h). For the superconducting magnet of the preparation trap and the EBIT, standard devices can be used. Limitations in the precision of mass determinations are caused by temperature and pressure fluctuations in the helium and nitrogen reservoir of the superconducting magnets. They cause changes in the magnetic susceptibility of the materials surrounding the precision Penning trap and thus in the magnetic field homogeneity. The effect of temperature and pressure fluctuations should be minimized by the implementation of a temperature (∆T < 0.1 K) and pressure (∆p < 0.2 mbar) stabilization system. The transport, capture, and ejection efficiency of a trap are close to 100%.
The resolving power achieved in a Penning trap is approximately equal to the product
of the cyclotron frequency and the excitation duration Tex and the accuracy scales with the resolving power. The relative statistical mass uncertainty is then given by
δm/m ≈ m / (Tex q B N
1/2) (SI units) (12)
where N is the number of detected ions. In order to obtain a high accuracy, i.e. a low mass uncertainty, high cyclotron frequencies through strong magnetic fields or high charge states, and long observation times are desirable. For radioactive ions far from stability the observation time is limited by the half-life while the number of detected ions is depending on the production yield and the available beam time. Since highly-charged ions have higher cyclotron frequencies the resolving power and the accuracy are increased; or vice versa, a high-accuracy mass measurement can be performed in a much shorter time as compared to the case of singly-charged ions, which gives access to very short-lived nuclides. Figure 80 shows the advantage of using highly-charged ions with respect to the accuracy in the case of an ion with mass 100 in a 7 T strong magnetic field.
The Channeltron detectors used for mass spectrometry experiments have overall
efficiencies of 100%, MCP detectors in the order of 30-40%, depending on the kinetic energy of the ion.
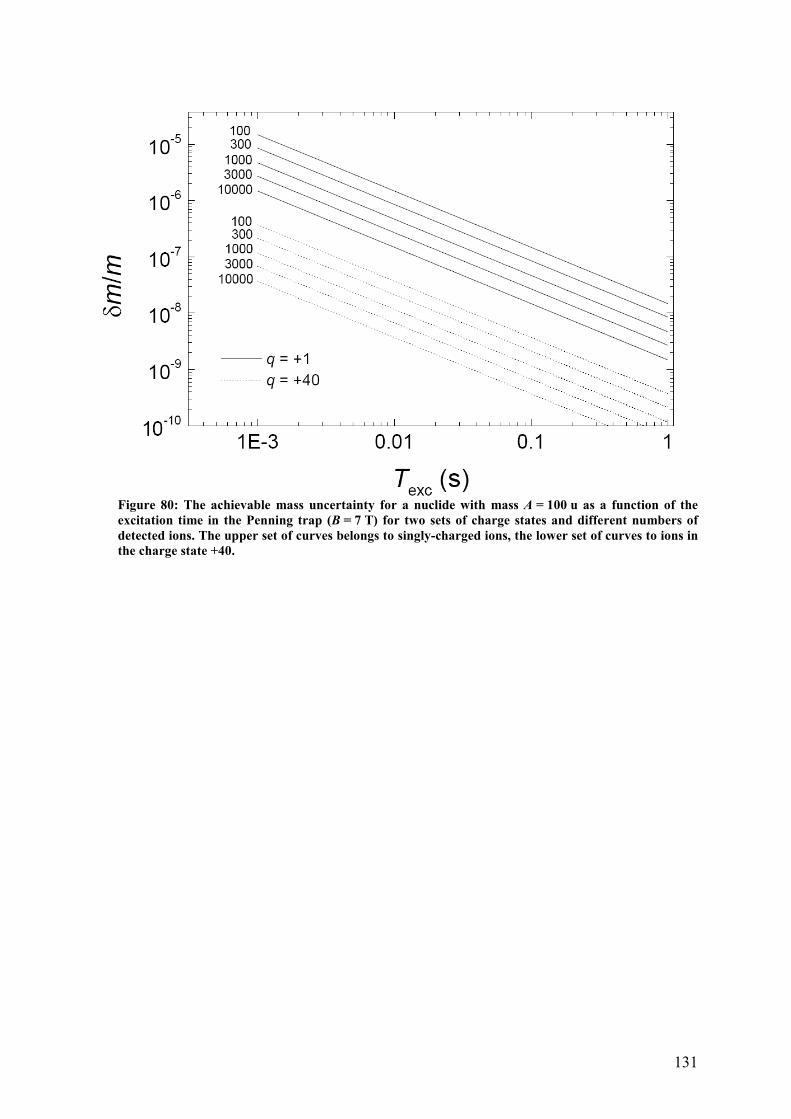
131
Figure 80: The achievable mass uncertainty for a nuclide with mass A = 100 u as a function of the excitation time in the Penning trap (B = 7 T) for two sets of charge states and different numbers of detected ions. The upper set of curves belongs to singly-charged ions, the lower set of curves to ions in the charge state +40.
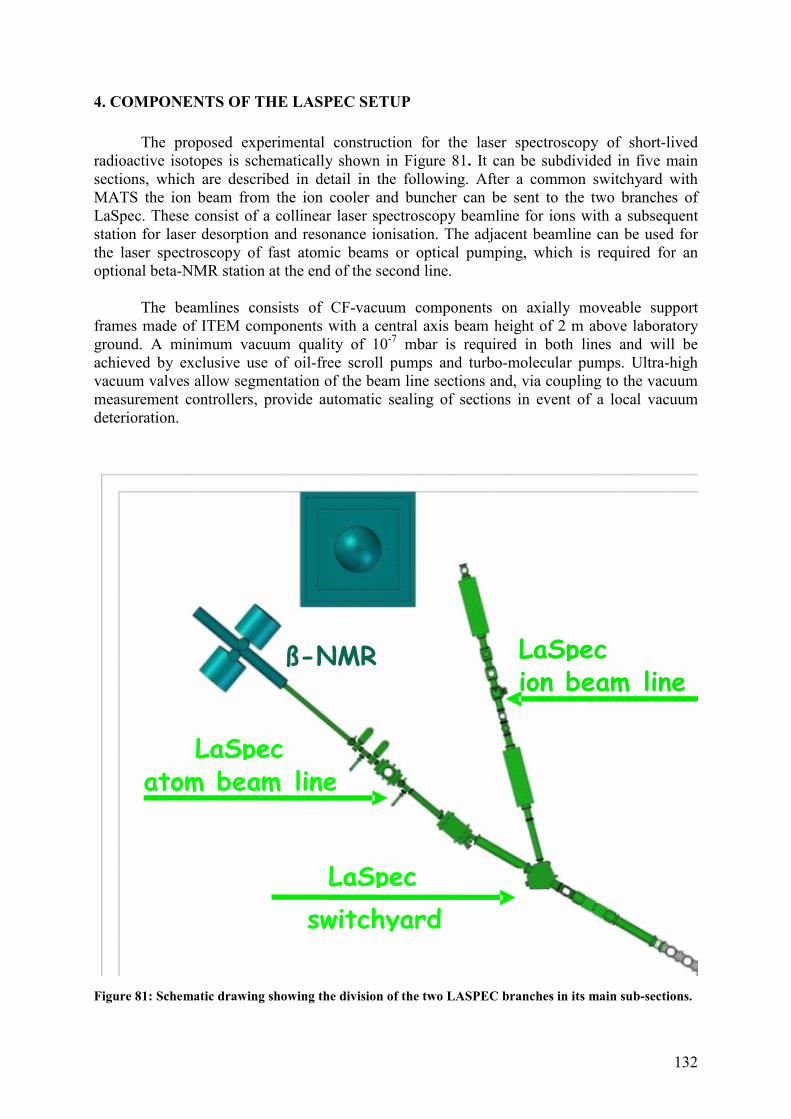
132
4. COMPONENTS OF THE LASPEC SETUP
The proposed experimental construction for the laser spectroscopy of short-lived
radioactive isotopes is schematically shown in Figure 81. It can be subdivided in five main sections, which are described in detail in the following. After a common switchyard with MATS the ion beam from the ion cooler and buncher can be sent to the two branches of LaSpec. These consist of a collinear laser spectroscopy beamline for ions with a subsequent station for laser desorption and resonance ionisation. The adjacent beamline can be used for the laser spectroscopy of fast atomic beams or optical pumping, which is required for an optional beta-NMR station at the end of the second line.
The beamlines consists of CF-vacuum components on axially moveable support
frames made of ITEM components with a central axis beam height of 2 m above laboratory ground. A minimum vacuum quality of 10-7 mbar is required in both lines and will be achieved by exclusive use of oil-free scroll pumps and turbo-molecular pumps. Ultra-high vacuum valves allow segmentation of the beam line sections and, via coupling to the vacuum measurement controllers, provide automatic sealing of sections in event of a local vacuum deterioration.
Figure 81: Schematic drawing showing the division of the two LASPEC branches in its main sub-sections.
LaSpec
ion beam line
LaSpec
atom beam line
ß - NMR
LaSpec
switchyard
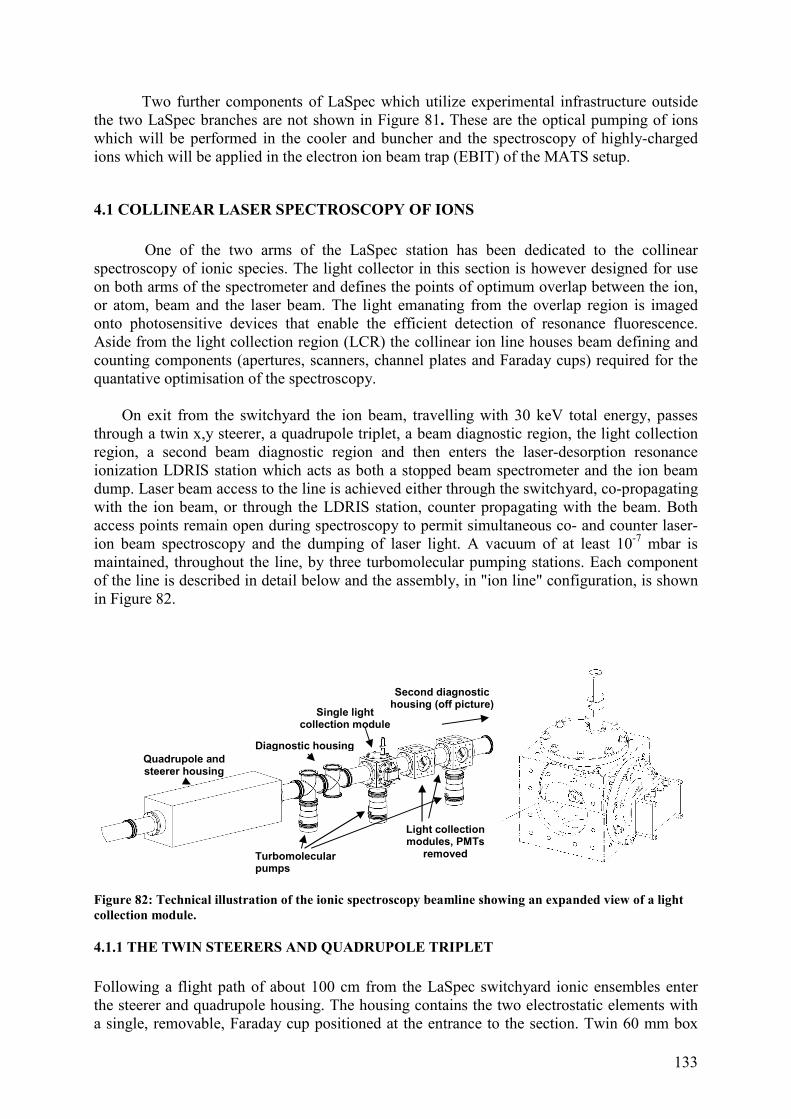
133
Two further components of LaSpec which utilize experimental infrastructure outside the two LaSpec branches are not shown in Figure 81. These are the optical pumping of ions which will be performed in the cooler and buncher and the spectroscopy of highly-charged ions which will be applied in the electron ion beam trap (EBIT) of the MATS setup.
4.1 COLLINEAR LASER SPECTROSCOPY OF IONS
One of the two arms of the LaSpec station has been dedicated to the collinear
spectroscopy of ionic species. The light collector in this section is however designed for use on both arms of the spectrometer and defines the points of optimum overlap between the ion, or atom, beam and the laser beam. The light emanating from the overlap region is imaged onto photosensitive devices that enable the efficient detection of resonance fluorescence. Aside from the light collection region (LCR) the collinear ion line houses beam defining and counting components (apertures, scanners, channel plates and Faraday cups) required for the quantative optimisation of the spectroscopy.
On exit from the switchyard the ion beam, travelling with 30 keV total energy, passes
through a twin x,y steerer, a quadrupole triplet, a beam diagnostic region, the light collection region, a second beam diagnostic region and then enters the laser-desorption resonance ionization LDRIS station which acts as both a stopped beam spectrometer and the ion beam dump. Laser beam access to the line is achieved either through the switchyard, co-propagating with the ion beam, or through the LDRIS station, counter propagating with the beam. Both access points remain open during spectroscopy to permit simultaneous co- and counter laser-ion beam spectroscopy and the dumping of laser light. A vacuum of at least 10-7 mbar is maintained, throughout the line, by three turbomolecular pumping stations. Each component of the line is described in detail below and the assembly, in "ion line" configuration, is shown in Figure 82.
Figure 82: Technical illustration of the ionic spectroscopy beamline showing an expanded view of a light collection module.
4.1.1 THE TWIN STEERERS AND QUADRUPOLE TRIPLET
Following a flight path of about 100 cm from the LaSpec switchyard ionic ensembles enter the steerer and quadrupole housing. The housing contains the two electrostatic elements with a single, removable, Faraday cup positioned at the entrance to the section. Twin 60 mm box
Diagnostic housing
Quadrupole and steerer housing
Turbomolecular pumps
Single light collection module
Light collection modules, PMTs
removed
Second diagnostic housing (off picture)
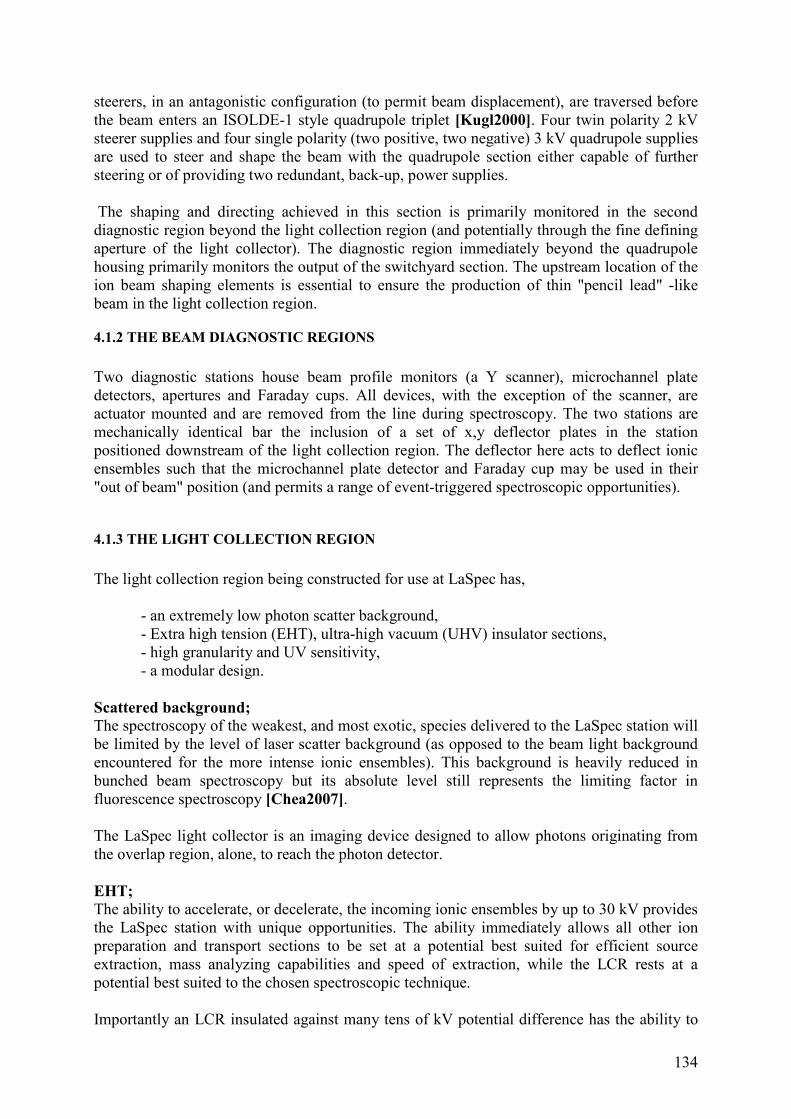
134
steerers, in an antagonistic configuration (to permit beam displacement), are traversed before the beam enters an ISOLDE-1 style quadrupole triplet [Kugl2000]. Four twin polarity 2 kV steerer supplies and four single polarity (two positive, two negative) 3 kV quadrupole supplies are used to steer and shape the beam with the quadrupole section either capable of further steering or of providing two redundant, back-up, power supplies. The shaping and directing achieved in this section is primarily monitored in the second diagnostic region beyond the light collection region (and potentially through the fine defining aperture of the light collector). The diagnostic region immediately beyond the quadrupole housing primarily monitors the output of the switchyard section. The upstream location of the ion beam shaping elements is essential to ensure the production of thin "pencil lead" -like beam in the light collection region.
4.1.2 THE BEAM DIAGNOSTIC REGIONS
Two diagnostic stations house beam profile monitors (a Y scanner), microchannel plate detectors, apertures and Faraday cups. All devices, with the exception of the scanner, are actuator mounted and are removed from the line during spectroscopy. The two stations are mechanically identical bar the inclusion of a set of x,y deflector plates in the station positioned downstream of the light collection region. The deflector here acts to deflect ionic ensembles such that the microchannel plate detector and Faraday cup may be used in their "out of beam" position (and permits a range of event-triggered spectroscopic opportunities).
4.1.3 THE LIGHT COLLECTION REGION
The light collection region being constructed for use at LaSpec has,
- an extremely low photon scatter background, - Extra high tension (EHT), ultra-high vacuum (UHV) insulator sections, - high granularity and UV sensitivity, - a modular design.
Scattered background; The spectroscopy of the weakest, and most exotic, species delivered to the LaSpec station will be limited by the level of laser scatter background (as opposed to the beam light background encountered for the more intense ionic ensembles). This background is heavily reduced in bunched beam spectroscopy but its absolute level still represents the limiting factor in fluorescence spectroscopy [Chea2007]. The LaSpec light collector is an imaging device designed to allow photons originating from the overlap region, alone, to reach the photon detector. EHT; The ability to accelerate, or decelerate, the incoming ionic ensembles by up to 30 kV provides the LaSpec station with unique opportunities. The ability immediately allows all other ion preparation and transport sections to be set at a potential best suited for efficient source extraction, mass analyzing capabilities and speed of extraction, while the LCR rests at a potential best suited to the chosen spectroscopic technique. Importantly an LCR insulated against many tens of kV potential difference has the ability to
135
significantly decelerate fast beams and extend all in-flight laser-ion interaction times. At the LEB our produced cooled ion beams may require rapid transport to the LaSpec station but do not need `standard' high potential acceleration in order to achieve the desired forward velocity compression (the ensembles are previously cooled). Granularity & UV; Fast ionic transitions and the bountiful production of the Super FRS will result in cooled ion bunches producing more than one detectable photon when the ensemble is brought to resonance. A physically segmented, axially granular, photon detector is thus essential for the efficient counting of these photon 'bursts' which would correspond to an effective continuous rate of many millions of photons per second. Furthermore demanding the detection of rapid multiple photon events, and rejecting all others, provides an essentially background-free optical spectroscopy -- greater than 107-fold random background rejection can be achieved as shown in Figure 83
Figure 83: Burst spectroscopy of a 40,000/s niobium ion beam showing a single hyperfine resonance observed with a) a 15us observation window, b) a 25us observation window, c) >2 photons counted in a 25us window (the “burst” spectrum) and d) the single photon counts. To fully exploit the production range of the Super-FRS the LCR must be capable of efficiently detecting photons at wavelengths down to 200 nm (corresponding to the energy of photons emitted from excited and charged species). The light collection optics must also, by definition, be made from material capable of transmitting light at these wavelengths. A prototype LCR module (a single segmented detector) based on an extended cathode Hamamatsu 5900-L16 photomultiplier is already under development (see Figure 82). The photomultiplier is capable of efficiently detecting ~ 220 nm photons, transported to it by fused
0 0.5 1 1.50
5
10
15
0 0.5 1 1.50
10
20
30
40
50
0 0.5 1 1.5700
750
800
850
900
0 0.5 1 1.50
10
20
30
40
50
a) b)
c) d)
Frequency (GHz)
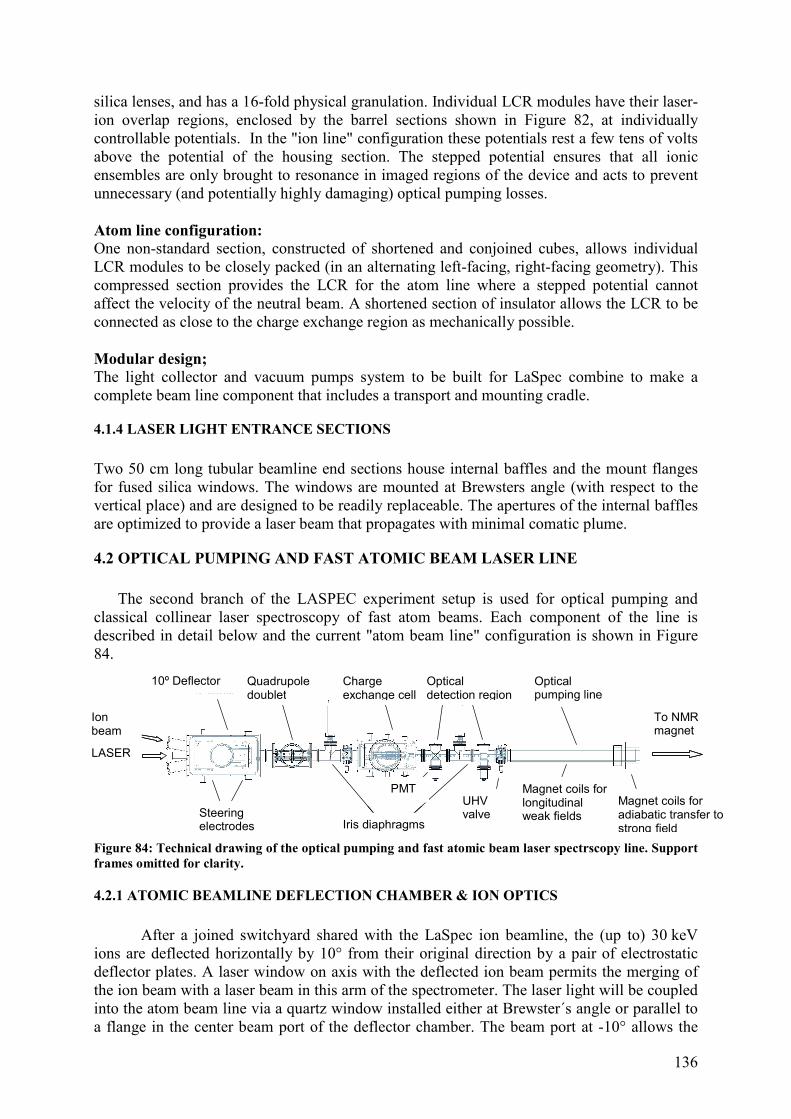
136
silica lenses, and has a 16-fold physical granulation. Individual LCR modules have their laser-ion overlap regions, enclosed by the barrel sections shown in Figure 82, at individually controllable potentials. In the "ion line" configuration these potentials rest a few tens of volts above the potential of the housing section. The stepped potential ensures that all ionic ensembles are only brought to resonance in imaged regions of the device and acts to prevent unnecessary (and potentially highly damaging) optical pumping losses. Atom line configuration: One non-standard section, constructed of shortened and conjoined cubes, allows individual LCR modules to be closely packed (in an alternating left-facing, right-facing geometry). This compressed section provides the LCR for the atom line where a stepped potential cannot affect the velocity of the neutral beam. A shortened section of insulator allows the LCR to be connected as close to the charge exchange region as mechanically possible. Modular design; The light collector and vacuum pumps system to be built for LaSpec combine to make a complete beam line component that includes a transport and mounting cradle.
4.1.4 LASER LIGHT ENTRANCE SECTIONS
Two 50 cm long tubular beamline end sections house internal baffles and the mount flanges for fused silica windows. The windows are mounted at Brewsters angle (with respect to the vertical place) and are designed to be readily replaceable. The apertures of the internal baffles are optimized to provide a laser beam that propagates with minimal comatic plume.
4.2 OPTICAL PUMPING AND FAST ATOMIC BEAM LASER LINE
The second branch of the LASPEC experiment setup is used for optical pumping and
classical collinear laser spectroscopy of fast atom beams. Each component of the line is described in detail below and the current "atom beam line" configuration is shown in Figure 84.
10° deflector quadrupole
doublet
charge exchange
cell
optical detection
region
optical pumping line
iris diaphragms
UHV valve magnet coils for
longitudinal weak field
magnet coils for
adiabatic transfer
to strong field
Ion beam
LASER
PMT
Steering
electrodes
to NMR
magnet
10° deflector quadrupole
doublet
charge exchange
cell
optical detection
region
optical pumping line
iris diaphragms
UHV valve magnet coils for
longitudinal weak field
magnet coils for
adiabatic transfer
to strong field
Ion beam
LASER
PMT
Steering
electrodes
to NMR
magnet
Figure 84: Technical drawing of the optical pumping and fast atomic beam laser spectrscopy line. Support frames omitted for clarity.
4.2.1 ATOMIC BEAMLINE DEFLECTION CHAMBER & ION OPTICS
After a joined switchyard shared with the LaSpec ion beamline, the (up to) 30 keV
ions are deflected horizontally by 10° from their original direction by a pair of electrostatic deflector plates. A laser window on axis with the deflected ion beam permits the merging of the ion beam with a laser beam in this arm of the spectrometer. The laser light will be coupled into the atom beam line via a quartz window installed either at Brewster´s angle or parallel to a flange in the center beam port of the deflector chamber. The beam port at -10° allows the
Quadrupole doublet
10º Deflector Charge exchange cell
Optical detection region
Optical pumping line
To NMR magnet
Steering electrodes Iris diaphragms
PMT UHV valve
Magnet coils for longitudinal weak fields
Magnet coils for adiabatic transfer to strong field
LASER
Ion beam
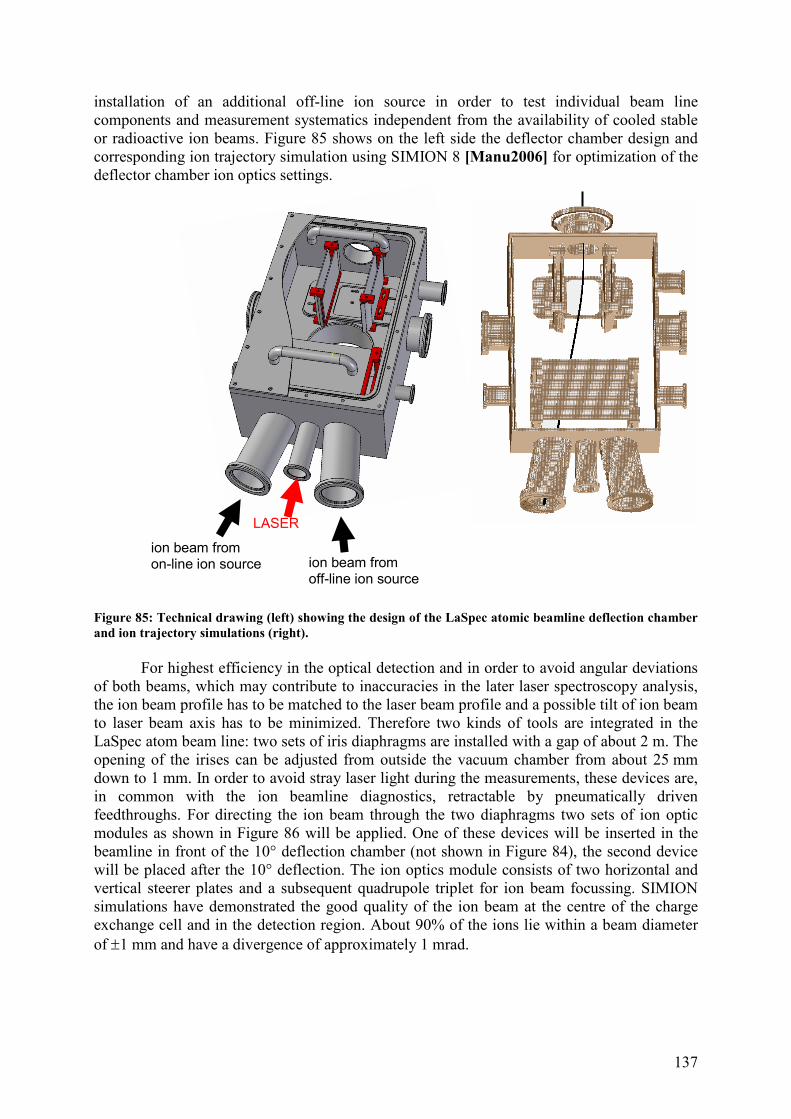
137
installation of an additional off-line ion source in order to test individual beam line components and measurement systematics independent from the availability of cooled stable or radioactive ion beams. Figure 85 shows on the left side the deflector chamber design and corresponding ion trajectory simulation using SIMION 8 [Manu2006] for optimization of the deflector chamber ion optics settings.
Figure 85: Technical drawing (left) showing the design of the LaSpec atomic beamline deflection chamber and ion trajectory simulations (right).
For highest efficiency in the optical detection and in order to avoid angular deviations of both beams, which may contribute to inaccuracies in the later laser spectroscopy analysis, the ion beam profile has to be matched to the laser beam profile and a possible tilt of ion beam to laser beam axis has to be minimized. Therefore two kinds of tools are integrated in the LaSpec atom beam line: two sets of iris diaphragms are installed with a gap of about 2 m. The opening of the irises can be adjusted from outside the vacuum chamber from about 25 mm down to 1 mm. In order to avoid stray laser light during the measurements, these devices are, in common with the ion beamline diagnostics, retractable by pneumatically driven feedthroughs. For directing the ion beam through the two diaphragms two sets of ion optic modules as shown in Figure 86 will be applied. One of these devices will be inserted in the beamline in front of the 10° deflection chamber (not shown in Figure 84), the second device will be placed after the 10° deflection. The ion optics module consists of two horizontal and vertical steerer plates and a subsequent quadrupole triplet for ion beam focussing. SIMION simulations have demonstrated the good quality of the ion beam at the centre of the charge exchange cell and in the detection region. About 90% of the ions lie within a beam diameter of ±1 mm and have a divergence of approximately 1 mrad.
ion beam from on-line ion source
LASER
ion beam from off-line ion source
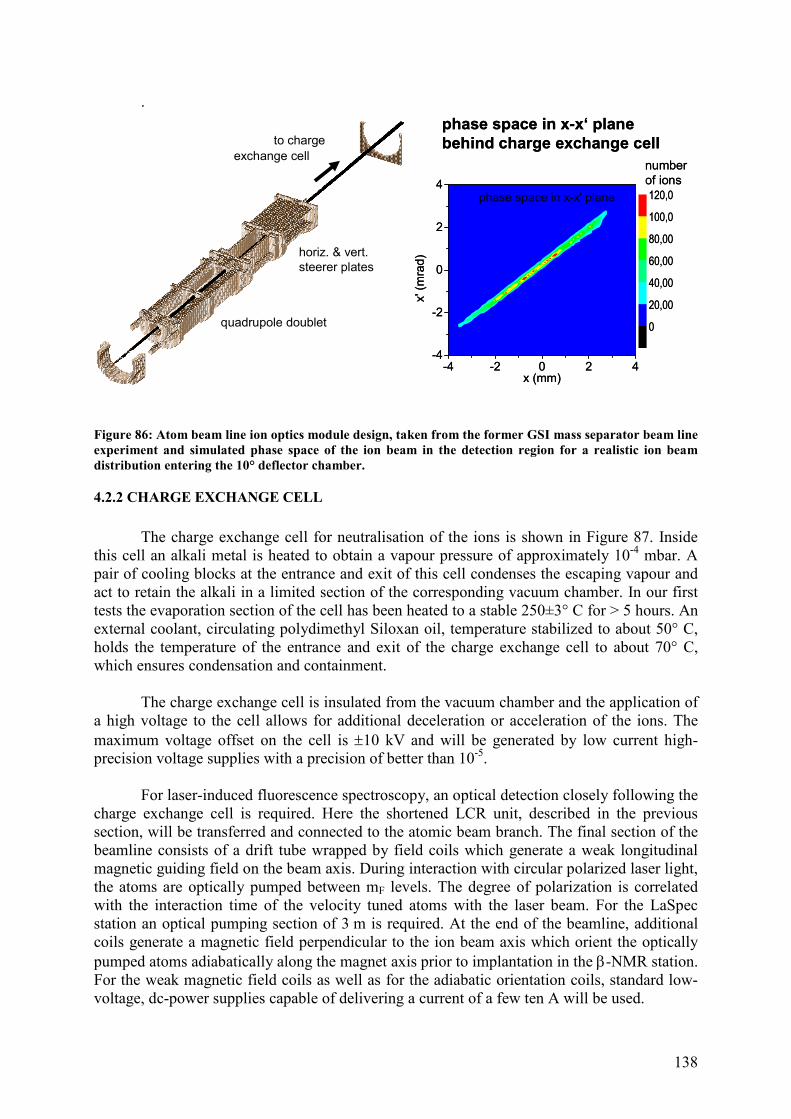
138
.
-4 -2 0 2 4-4
-2
0
2
4
x (mm)
x' (
mra
d)
0
20,00
40,00
60,00
80,00
100,0
120,0phase space in x-x' plane
Z
X
Y
to charge
exchange cell
horiz. & vert.
steerer plates
quadrupole doublet
phase space in x-x‘ plane
behind charge exchange cell
number
of ions
-4 -2 0 2 4-4
-2
0
2
4
x (mm)
x' (
mra
d)
0
20,00
40,00
60,00
80,00
100,0
120,0phase space in x-x' plane
Z
X
YZ
X
Y
to charge
exchange cell
horiz. & vert.
steerer plates
quadrupole doublet
phase space in x-x‘ plane
behind charge exchange cell
number
of ions
Figure 86: Atom beam line ion optics module design, taken from the former GSI mass separator beam line experiment and simulated phase space of the ion beam in the detection region for a realistic ion beam distribution entering the 10° deflector chamber.
4.2.2 CHARGE EXCHANGE CELL
The charge exchange cell for neutralisation of the ions is shown in Figure 87. Inside
this cell an alkali metal is heated to obtain a vapour pressure of approximately 10-4 mbar. A pair of cooling blocks at the entrance and exit of this cell condenses the escaping vapour and act to retain the alkali in a limited section of the corresponding vacuum chamber. In our first tests the evaporation section of the cell has been heated to a stable 250±3° C for > 5 hours. An external coolant, circulating polydimethyl Siloxan oil, temperature stabilized to about 50° C, holds the temperature of the entrance and exit of the charge exchange cell to about 70° C, which ensures condensation and containment.
The charge exchange cell is insulated from the vacuum chamber and the application of
a high voltage to the cell allows for additional deceleration or acceleration of the ions. The maximum voltage offset on the cell is ±10 kV and will be generated by low current high-precision voltage supplies with a precision of better than 10-5.
For laser-induced fluorescence spectroscopy, an optical detection closely following the
charge exchange cell is required. Here the shortened LCR unit, described in the previous section, will be transferred and connected to the atomic beam branch. The final section of the beamline consists of a drift tube wrapped by field coils which generate a weak longitudinal magnetic guiding field on the beam axis. During interaction with circular polarized laser light, the atoms are optically pumped between mF levels. The degree of polarization is correlated with the interaction time of the velocity tuned atoms with the laser beam. For the LaSpec station an optical pumping section of 3 m is required. At the end of the beamline, additional coils generate a magnetic field perpendicular to the ion beam axis which orient the optically pumped atoms adiabatically along the magnet axis prior to implantation in the β-NMR station. For the weak magnetic field coils as well as for the adiabatic orientation coils, standard low-voltage, dc-power supplies capable of delivering a current of a few ten A will be used.
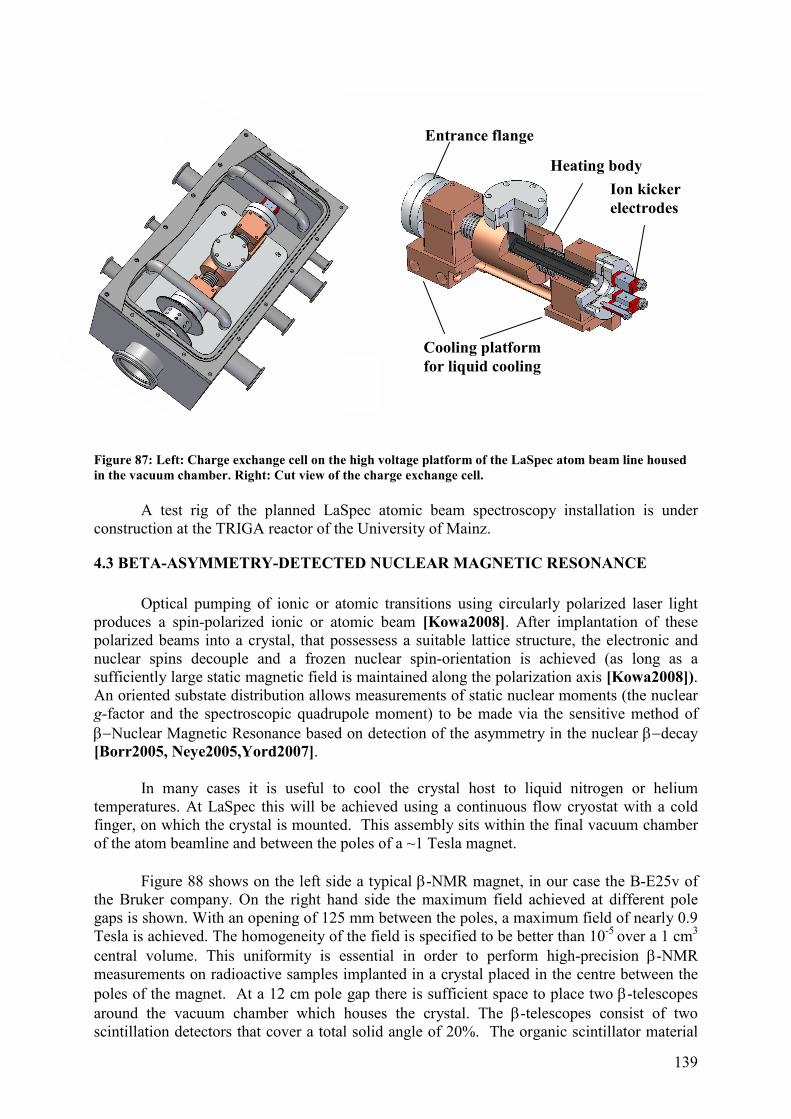
139
Figure 87: Left: Charge exchange cell on the high voltage platform of the LaSpec atom beam line housed in the vacuum chamber. Right: Cut view of the charge exchange cell.
A test rig of the planned LaSpec atomic beam spectroscopy installation is under
construction at the TRIGA reactor of the University of Mainz.
4.3 BETA-ASYMMETRY-DETECTED NUCLEAR MAGNETIC RESONANCE
Optical pumping of ionic or atomic transitions using circularly polarized laser light
produces a spin-polarized ionic or atomic beam [Kowa2008]. After implantation of these polarized beams into a crystal, that possessess a suitable lattice structure, the electronic and nuclear spins decouple and a frozen nuclear spin-orientation is achieved (as long as a sufficiently large static magnetic field is maintained along the polarization axis [Kowa2008]). An oriented substate distribution allows measurements of static nuclear moments (the nuclear g-factor and the spectroscopic quadrupole moment) to be made via the sensitive method of β−Nuclear Magnetic Resonance based on detection of the asymmetry in the nuclear β−decay [Borr2005, Neye2005,Yord2007].
In many cases it is useful to cool the crystal host to liquid nitrogen or helium
temperatures. At LaSpec this will be achieved using a continuous flow cryostat with a cold finger, on which the crystal is mounted. This assembly sits within the final vacuum chamber of the atom beamline and between the poles of a ~1 Tesla magnet.
Figure 88 shows on the left side a typical β-NMR magnet, in our case the B-E25v of the Bruker company. On the right hand side the maximum field achieved at different pole gaps is shown. With an opening of 125 mm between the poles, a maximum field of nearly 0.9 Tesla is achieved. The homogeneity of the field is specified to be better than 10-5 over a 1 cm3 central volume. This uniformity is essential in order to perform high-precision β-NMR measurements on radioactive samples implanted in a crystal placed in the centre between the poles of the magnet. At a 12 cm pole gap there is sufficient space to place two β-telescopes around the vacuum chamber which houses the crystal. The β-telescopes consist of two scintillation detectors that cover a total solid angle of 20%. The organic scintillator material
Entrance flange
Heating body
Cooling platform for liquid cooling
Ion kicker electrodes
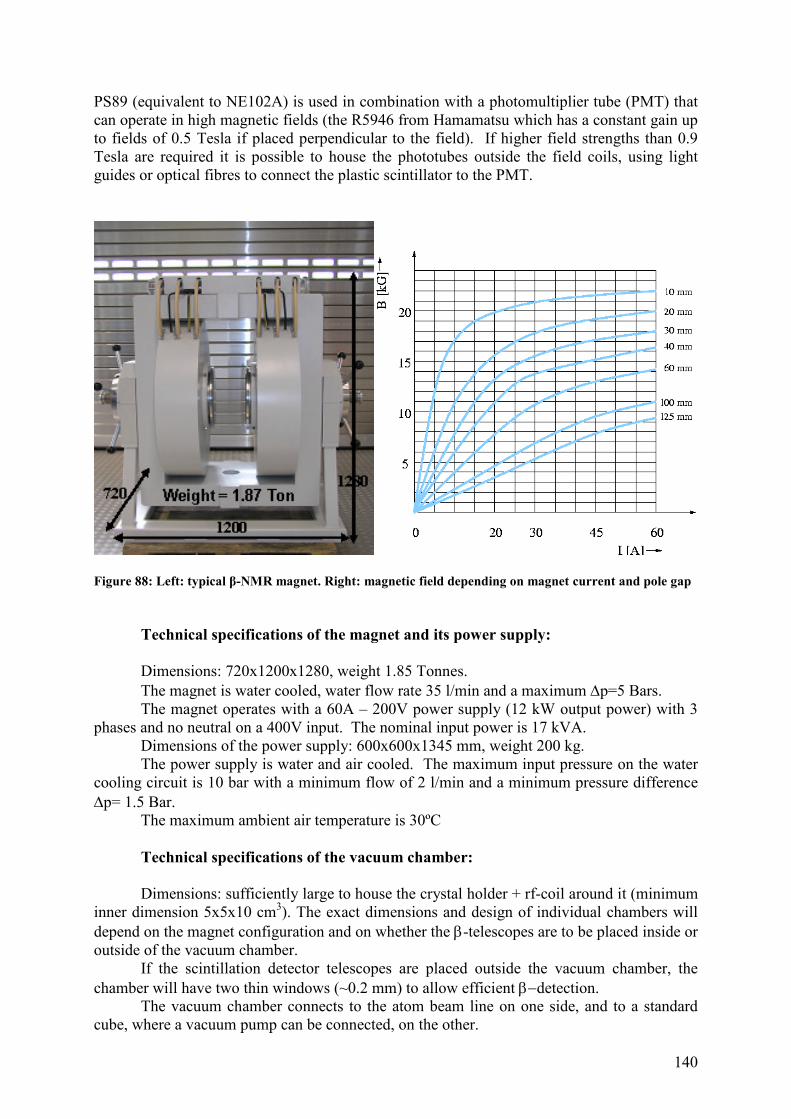
140
PS89 (equivalent to NE102A) is used in combination with a photomultiplier tube (PMT) that can operate in high magnetic fields (the R5946 from Hamamatsu which has a constant gain up to fields of 0.5 Tesla if placed perpendicular to the field). If higher field strengths than 0.9 Tesla are required it is possible to house the phototubes outside the field coils, using light guides or optical fibres to connect the plastic scintillator to the PMT.
Figure 88: Left: typical β-NMR magnet. Right: magnetic field depending on magnet current and pole gap
Technical specifications of the magnet and its power supply: Dimensions: 720x1200x1280, weight 1.85 Tonnes. The magnet is water cooled, water flow rate 35 l/min and a maximum ∆p=5 Bars. The magnet operates with a 60A – 200V power supply (12 kW output power) with 3 phases and no neutral on a 400V input. The nominal input power is 17 kVA. Dimensions of the power supply: 600x600x1345 mm, weight 200 kg. The power supply is water and air cooled. The maximum input pressure on the water cooling circuit is 10 bar with a minimum flow of 2 l/min and a minimum pressure difference ∆p= 1.5 Bar. The maximum ambient air temperature is 30ºC
Technical specifications of the vacuum chamber: Dimensions: sufficiently large to house the crystal holder + rf-coil around it (minimum inner dimension 5x5x10 cm3). The exact dimensions and design of individual chambers will depend on the magnet configuration and on whether the β-telescopes are to be placed inside or outside of the vacuum chamber. If the scintillation detector telescopes are placed outside the vacuum chamber, the chamber will have two thin windows (~0.2 mm) to allow efficient β−detection. The vacuum chamber connects to the atom beam line on one side, and to a standard cube, where a vacuum pump can be connected, on the other.
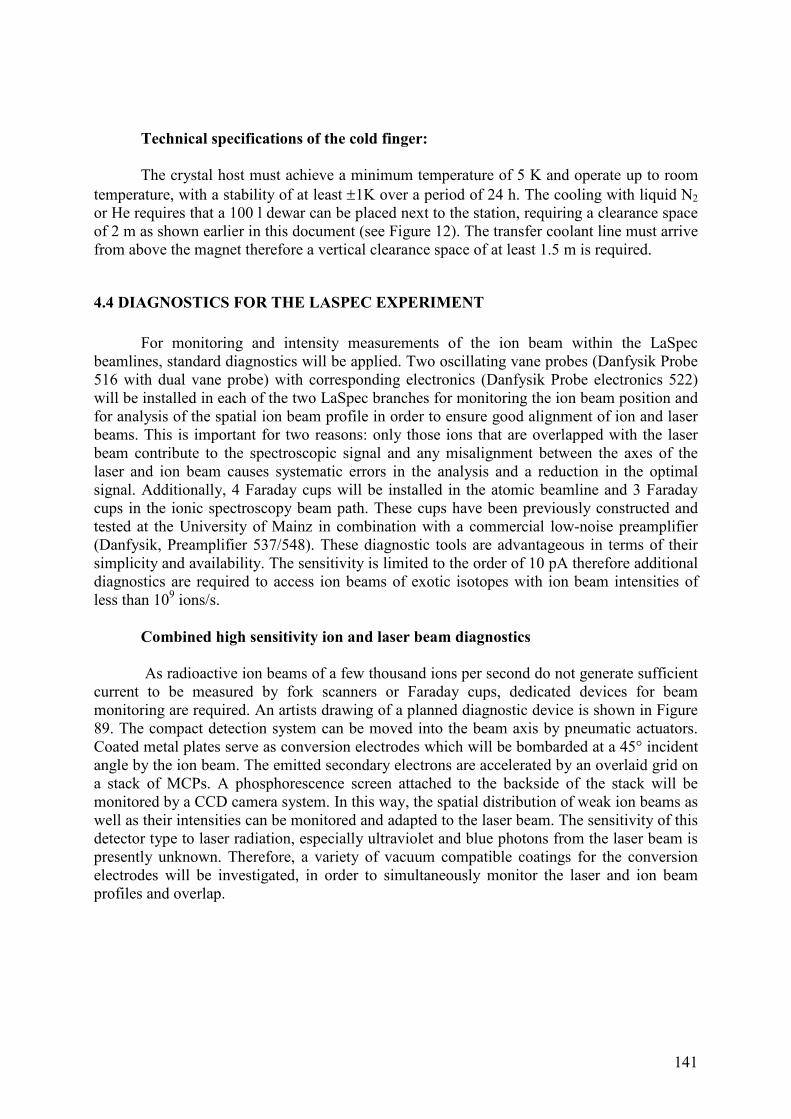
141
Technical specifications of the cold finger: The crystal host must achieve a minimum temperature of 5 K and operate up to room temperature, with a stability of at least ±1K over a period of 24 h. The cooling with liquid N2 or He requires that a 100 l dewar can be placed next to the station, requiring a clearance space of 2 m as shown earlier in this document (see Figure 12). The transfer coolant line must arrive from above the magnet therefore a vertical clearance space of at least 1.5 m is required.
4.4 DIAGNOSTICS FOR THE LASPEC EXPERIMENT
For monitoring and intensity measurements of the ion beam within the LaSpec
beamlines, standard diagnostics will be applied. Two oscillating vane probes (Danfysik Probe 516 with dual vane probe) with corresponding electronics (Danfysik Probe electronics 522) will be installed in each of the two LaSpec branches for monitoring the ion beam position and for analysis of the spatial ion beam profile in order to ensure good alignment of ion and laser beams. This is important for two reasons: only those ions that are overlapped with the laser beam contribute to the spectroscopic signal and any misalignment between the axes of the laser and ion beam causes systematic errors in the analysis and a reduction in the optimal signal. Additionally, 4 Faraday cups will be installed in the atomic beamline and 3 Faraday cups in the ionic spectroscopy beam path. These cups have been previously constructed and tested at the University of Mainz in combination with a commercial low-noise preamplifier (Danfysik, Preamplifier 537/548). These diagnostic tools are advantageous in terms of their simplicity and availability. The sensitivity is limited to the order of 10 pA therefore additional diagnostics are required to access ion beams of exotic isotopes with ion beam intensities of less than 109 ions/s. Combined high sensitivity ion and laser beam diagnostics
As radioactive ion beams of a few thousand ions per second do not generate sufficient current to be measured by fork scanners or Faraday cups, dedicated devices for beam monitoring are required. An artists drawing of a planned diagnostic device is shown in Figure 89. The compact detection system can be moved into the beam axis by pneumatic actuators. Coated metal plates serve as conversion electrodes which will be bombarded at a 45° incident angle by the ion beam. The emitted secondary electrons are accelerated by an overlaid grid on a stack of MCPs. A phosphorescence screen attached to the backside of the stack will be monitored by a CCD camera system. In this way, the spatial distribution of weak ion beams as well as their intensities can be monitored and adapted to the laser beam. The sensitivity of this detector type to laser radiation, especially ultraviolet and blue photons from the laser beam is presently unknown. Therefore, a variety of vacuum compatible coatings for the conversion electrodes will be investigated, in order to simultaneously monitor the laser and ion beam profiles and overlap.
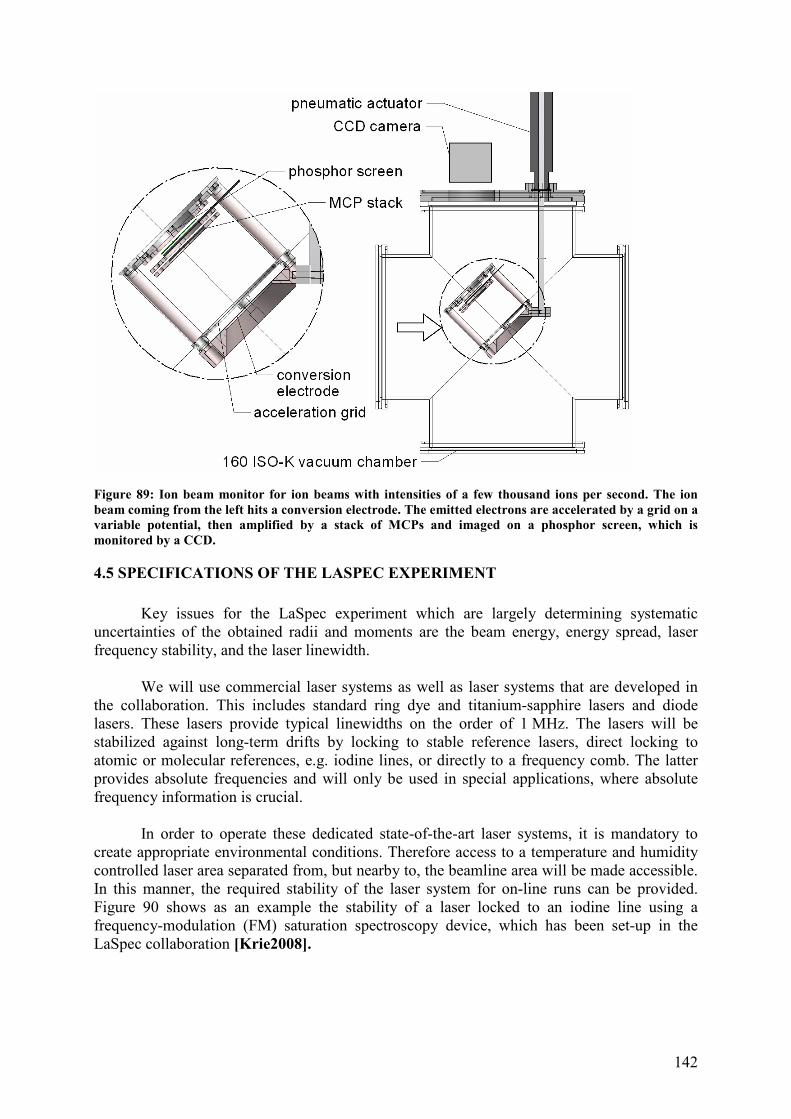
142
Figure 89: Ion beam monitor for ion beams with intensities of a few thousand ions per second. The ion beam coming from the left hits a conversion electrode. The emitted electrons are accelerated by a grid on a variable potential, then amplified by a stack of MCPs and imaged on a phosphor screen, which is monitored by a CCD.
4.5 SPECIFICATIONS OF THE LASPEC EXPERIMENT
Key issues for the LaSpec experiment which are largely determining systematic
uncertainties of the obtained radii and moments are the beam energy, energy spread, laser frequency stability, and the laser linewidth.
We will use commercial laser systems as well as laser systems that are developed in
the collaboration. This includes standard ring dye and titanium-sapphire lasers and diode lasers. These lasers provide typical linewidths on the order of 1 MHz. The lasers will be stabilized against long-term drifts by locking to stable reference lasers, direct locking to atomic or molecular references, e.g. iodine lines, or directly to a frequency comb. The latter provides absolute frequencies and will only be used in special applications, where absolute frequency information is crucial.
In order to operate these dedicated state-of-the-art laser systems, it is mandatory to
create appropriate environmental conditions. Therefore access to a temperature and humidity controlled laser area separated from, but nearby to, the beamline area will be made accessible. In this manner, the required stability of the laser system for on-line runs can be provided. Figure 90 shows as an example the stability of a laser locked to an iodine line using a frequency-modulation (FM) saturation spectroscopy device, which has been set-up in the LaSpec collaboration [Krie2008].
143
Figure 90: Long term stabilization to the a1-line in the hyperfine structure of the P(132)(9-3)-transition in molecular iodine (I2). Data was taken over a 4 hour period. Left: recorded beat frequency with a mode of a frequency comb. Right: frequency distribution as a histogram, the fitted Gaussian function has a half-width of only 2.1 kHz.
The example shows a standard variation of 2.1 kHz over the measurement time period of 4 hours. The stabilization fulfils all needs for collinear spectroscopy in the laser wavelength ranges where iodine lines are available (~550 – 800 nm). The applicability and stability of the above mentioned iodine cell laser stabilization setup has recently been successfully demonstrated at beamtimes at ISOLDE/CERN. In the blue region, tellurium molecules [Tell2009]) will provide reference lines down to about 400 nm.
Ultraviolet laser light will be produced via second-harmonic generation (SHG), again
either with self-made or commercial frequency doublers. For special applications, for example resonance ionization, pulsed lasers will also be used. All these laser systems exist in the collaboration or at GSI and will be continuously serviced, updated and improved.
Crucial factors are the high voltage supplies of the ion source and the detection region,
which determine the total beam energy – and thus the velocity – of the ions during the interaction with the laser beam. The high voltage supplies require an accuracy of at least 10-5 and a relative stability of better than or equal to 10-5. The high voltage can be measured using commercially available high-voltage dividers. At present, supplies with accuracies better than 10-4 are not commercially available. Hence, a new high-precision voltage divider with a relative accuracy better than 10 ppm is being developed specifically for LaSpec.
Figure 91 shows a measurement of the high voltage at ISOLDE with the KATRIN
high voltage divider [Thüm2007]. This divider has been developed at the University of Münster in the group of Ch. Weinheimer together with the PTB Braunschweig and provides an accuracy of better than 1 ppm. The graph shows the high voltage applied to the ISOLDE frontend after turning on the power supply. The warm-up phase lasts about 15 min before the high voltage reaches the final value at which it is constant to approximately ±0.1 V over 1 hour measuring time. Even during the warm-up phase, the drift is only about 1.2 V, which corresponds to a relative shift of 3×10⁻⁵.
There is also the possibility to measure the high voltage using laser spectroscopy, as
recently demonstrated at ISOLDE [Krie2008]. This will provide further information, e.g. about potential differences in the ion source or storage potentials in the RFQ cooler and buncher. For very specific measurements it is also possible to measure isotope shifts and
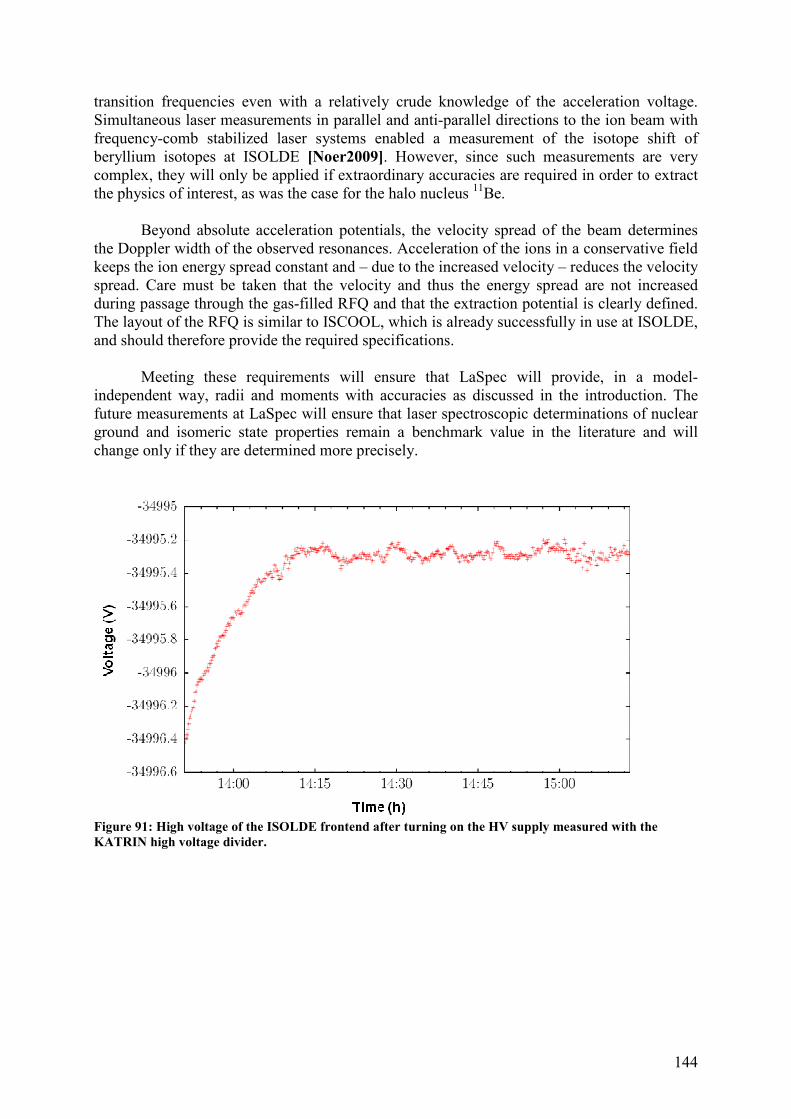
144
transition frequencies even with a relatively crude knowledge of the acceleration voltage. Simultaneous laser measurements in parallel and anti-parallel directions to the ion beam with frequency-comb stabilized laser systems enabled a measurement of the isotope shift of beryllium isotopes at ISOLDE [Noer2009]. However, since such measurements are very complex, they will only be applied if extraordinary accuracies are required in order to extract the physics of interest, as was the case for the halo nucleus 11Be.
Beyond absolute acceleration potentials, the velocity spread of the beam determines
the Doppler width of the observed resonances. Acceleration of the ions in a conservative field keeps the ion energy spread constant and – due to the increased velocity – reduces the velocity spread. Care must be taken that the velocity and thus the energy spread are not increased during passage through the gas-filled RFQ and that the extraction potential is clearly defined. The layout of the RFQ is similar to ISCOOL, which is already successfully in use at ISOLDE, and should therefore provide the required specifications.
Meeting these requirements will ensure that LaSpec will provide, in a model-
independent way, radii and moments with accuracies as discussed in the introduction. The future measurements at LaSpec will ensure that laser spectroscopic determinations of nuclear ground and isomeric state properties remain a benchmark value in the literature and will change only if they are determined more precisely.
Figure 91: High voltage of the ISOLDE frontend after turning on the HV supply measured with the KATRIN high voltage divider.
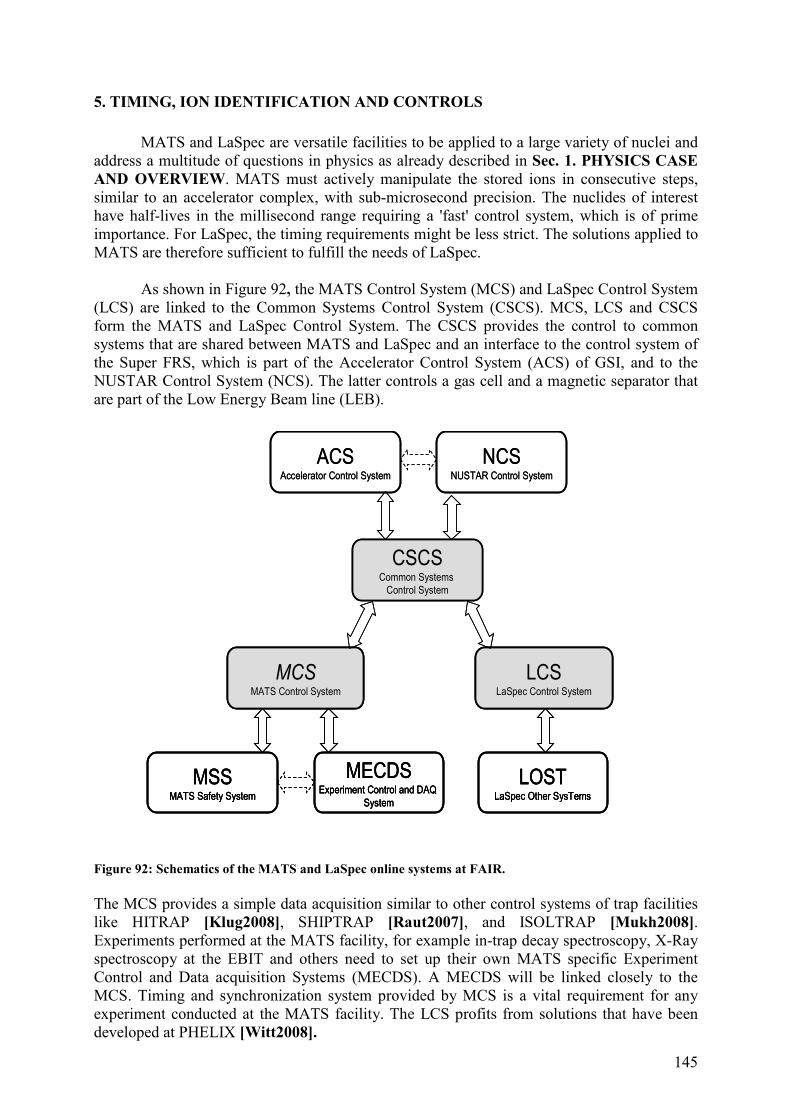
145
5. TIMING, ION IDENTIFICATION AND CONTROLS
MATS and LaSpec are versatile facilities to be applied to a large variety of nuclei and address a multitude of questions in physics as already described in Sec. 1. PHYSICS CASE AND OVERVIEW. MATS must actively manipulate the stored ions in consecutive steps, similar to an accelerator complex, with sub-microsecond precision. The nuclides of interest have half-lives in the millisecond range requiring a 'fast' control system, which is of prime importance. For LaSpec, the timing requirements might be less strict. The solutions applied to MATS are therefore sufficient to fulfill the needs of LaSpec.
As shown in Figure 92, the MATS Control System (MCS) and LaSpec Control System
(LCS) are linked to the Common Systems Control System (CSCS). MCS, LCS and CSCS form the MATS and LaSpec Control System. The CSCS provides the control to common systems that are shared between MATS and LaSpec and an interface to the control system of the Super FRS, which is part of the Accelerator Control System (ACS) of GSI, and to the NUSTAR Control System (NCS). The latter controls a gas cell and a magnetic separator that are part of the Low Energy Beam line (LEB).
Figure 92: Schematics of the MATS and LaSpec online systems at FAIR.
The MCS provides a simple data acquisition similar to other control systems of trap facilities like HITRAP [Klug2008], SHIPTRAP [Raut2007], and ISOLTRAP [Mukh2008]. Experiments performed at the MATS facility, for example in-trap decay spectroscopy, X-Ray spectroscopy at the EBIT and others need to set up their own MATS specific Experiment Control and Data acquisition Systems (MECDS). A MECDS will be linked closely to the MCS. Timing and synchronization system provided by MCS is a vital requirement for any experiment conducted at the MATS facility. The LCS profits from solutions that have been developed at PHELIX [Witt2008].
ACSAccelerator Control System
NCSNUSTAR Control System
MCSMATS Control System
MECDSExperiment Control and DAQ
System
MSSMATS Safety System
CSCSCommon Systems
Control System
LCSLaSpec Control System
LOSTLaSpec Other SysTems
ACSAccelerator Control System
NCSNUSTAR Control System
MCSMATS Control System
MECDSExperiment Control and DAQ
System
MSSMATS Safety System
MCSMATS Control System
MECDSExperiment Control and DAQ
System
MSSMATS Safety System
CSCSCommon Systems
Control System
LCSLaSpec Control System
LOSTLaSpec Other SysTems
LCSLaSpec Control System
LOSTLaSpec Other SysTems
146
The MATS and LaSpec Control System will be based on the CS framework, which has been in use for a number of years at about 12 experiments at five institutes [Beck2004a,Beck2007]. It is based on the programming language LabVIEW [Jama1999] and extents that graphical programming language by an object oriented approach. [Here ref to our NIM paper, Beck2004a?]. For MATS and LaSpec, the control system profit from the developments that have already been done at other trap facilities like ISOLTRAP, or laser facilities like PHELIX. In the following, a brief sketch of some key devices for both MATS and LaSpec is given. Pattern generator: It must provide bit patterns of arbitrary length. Each pattern has typically 64 bits, where each bit is obtained as an individual TTL or NIM signal. The granularity and precision of bit pattern generation is in the few-nanosecond range and can barely be provided by software even on real-time operating systems. The advent of Field-Programmable Gate Arrays (FPGAs) provides a new technology for massive and parallel processing of data within a guaranteed execution time. A basic board is completely sufficient to fulfill all requirements. The FPGA is clocked with 80 MHz, thus providing a sufficient granularity of 12.5 ns for bit pattern generation. Distributed I/O: Distributed input and output plays a major role when laboratory instruments such as power supplies are not controlled via a field-bus interface, but by analog voltages or digital signals. Field-buses like Profibus have the advantage that optical transceivers can be used to decouple the participants on the field-bus which is required if, for example, a sub-system of MATS or LaSpec is placed not on ground potential but in a high-voltage cage. Fast switching power supplies: The transfer of ions between the various traps requires fast switching of trap electrode voltages when capturing or ejecting ions with a trap. The required amplitudes of the switched voltages can be in the order of a few hundred volts with a ramping speed of about 100 V per microsecond. In order to sustain the capacitive load while ramping, the power supply needs to provide a current of a few hundred mA. At the same time, the power supply needs a 16 bit precision and low noise is required on the output. Such a power supply was already required at other trap facilities and has been developed at GSI [Hahn2005]. Up to six independent high voltage channels are grouped into one 19" crate which can be addressed via a standard RS485 serial bus.
High-voltage power supplies: The standard solution is provided by CAEN as crates which can be equipped with high-voltage modules covering different high-voltage ranges, channel counts, precision etc. For these devices, CAEN provides an OPC server, which publishes set- and get-values as OPC items.
Data acquisition: Data processing is restricted to data acquired with multi-channel-scalers for counting of ions and photons or transient recorders when detected image currents of stored ions. The MCS and LCS do not aim at providing data acquisition required for nuclear spectroscopy experiments. Solutions for such a data acquisition are already available at GSI [Esse1996,Esse2000]. For MATS and LaSpec, a multi-channel scaler (MCS) allows time resolved counting of ion or photon signals. This is required for diagnosis of the bunched beams in the beam lines between the traps and for the standard operation mode for very short-lived ions, if a destructive detection method is used. A most cost effective solution has been developed within the CS framework based on a FPGA card from National Instruments. When
147
the FPGA is overclocked to 80 MHz, time resolved ion counting can be done with a rate up to 40 MHz, which is sufficient for most applications.
Transient Recorder: Investigations on long lived ions with low production cross section requires the image current that is induced in the trap electrodes by the ion motion for determining the eigenfrequencies of the ions. Special low-noise electronics at cryogenic temperature is required to pick up and amplify the electronic signal. A transient recorder is used for recording the analog signal which is then transferred to the frequency domain via Fourier transformation. A fairly large bandwidth is required between the transient recorder and the computer performing the Fourier transformation. An oscilloscope card plugged into a PC, capable of Direct Memory Access (DMA) transfer of the data, is sufficient. Such cards with PCI(e)/PXI(e) interface are available. Laser System: The laser system is independent of the control system but readout of diagnostics elements, such as photodiode voltages and a wavemeter is required. A wavemeter can be addressed via GPIB and a LabView dll-library is available. Charge exchange cell: The heating current for the charge exchange cell can be controlled by a 0-10 V analog input, whereas the temperature sensor delivers an analog output. Both are floated on a potential up to 10 kV. If remote control is required, it should be realized via an optocoupler. Active regulation of the oven temperature is not required. The potential of the charge exchange cell or the optical detection region will be set with a high-precision high-voltage supply (Heinzinger, NCHp 10000-6). A precision voltmeter (Agilent, 34401A) will be used to readout the applied voltage. The events of two photomultipliers, converted into fast NIM signals by standard NIM electronics have to be recorded as a function of the applied voltage. During a measurement the dwell time for a single voltage step will be on the order of 10-100 ms. Thus, a typical scan will last a few seconds but a few 100 cycles will be summed to achieve reasonable statistics. The magnet power supply must be controlled to allow for fast switching between isotopes in order to reduce systematic shifts between the measurements.

148
REFERENCES AND ACKNOWLEDGEMENTS
[Abel2002] H. Abele et al., Phys. Rev. Lett. 88 (2002) 211801. [Agos2003] S. Agostinelli et al., Nucl. Instrum. Methods A 506 (2003) 250. [Algo2007] http://nd2007.edpsciences.org/articles/ndata/pdf/2007/01/ndata07707.pdf [Alic2003] ALICE TDR 010, CERN-LHCC-2003-062. [Amor2004] M. Amoretti et al., Nucl. Instrum. Methods A 518 (2004) 679. [Andr1999] A. N. Andreyev et al., Eur. Phys. Jour. A 6 (1999) 381. [Andr2000] A. N. Andreyev et al., Nature 405 (2000) 430. [Andr2001] A. N. Andreyev et al., Nucl. Phys. A 682 (2001) 482c. [Andr2002] A. N. Andreyev et al., Eur. Phys. J. A 14 (2002) 63. [Arno1987] E. Arnold et al., Phys. Lett. B 197 (1987) 311. [Arno1992] E. Arnold et al., Phys. Lett. B 281 (1992) 16. [Arno1994] E. Arnold et al., Zeitschrift für Physik A 349 (1994) 337. [Audi2003] G. Audi, A.H. Wapstra and C. Thibault, Nucl. Phys. A 729 (2003) 337. [Auma2007] T. Aumann, Prog. Part. Nucl. Phys. 59 (2007) 3. [Back1998] H. Backe et al., Phys. Rev. Lett. 80 (1998) 920. [Back2000] H. Backe et al., Hyp. Int. 127 (2000) 35. [Back2007] H. Backe et al., Eur. Phys. J. D 45 (2007) 99. [Baru2008] S. Baruah et al., Phys. Rev. Lett. 101 (2008) 262501. [Beck2003] D. Beck and H. Brandt, GSI Scientific Rep. 2002 (2003) 210. [Beck2004a] D. Beck et al., Nucl. Instrum. Methods A 527 (2004) 567. [Beck2004b] D. Beck et al., Proc. “Virtuelle Instrumente in der praxis 2004” VIP 2004,
Furstenfeldbruck, Germany, Editors R. Jamal and H. Jaschinski, ISBN 3-7785-2932-3 (2004) 250.
[Beck2007] D. Beck and H. Brand proc. “SEIFruhjahrstatung 2007”, Rossendorf, Germany, Editor F. Wulf, ISSN 0936-0891 (2007) 191.
[Beie2003] Th. Beier et al., HITRAP Technical Design Report, GSI 2003 (2003). [Beie2003b] P. Beiersdorfer, et al., Science 300 (2003) 1558. [Beie2005] P. Beiersdorfer, et al., Phys. Rev. Lett. 95 (2005) 233003. [Bend2004] M. Bender, G.F. Bertsch, P.-H. Heenen, preprint nucl-th/0410023 (2004). [Bend2008] M. Bender, G. F. Bertsch, and P.-H. Heenen, Phys. Rev. C 78 (2008) 054312. [Bern2004] J. Bernard et al., Nucl. Instrum. Methods A 532 (2004) 224. [Bijn1996] N. Bijnens et al., Z. Phys. A 356 (1996) 3. [Bill1995] J. Billowes and P. Campbell, J. Phys. G 21 (1995) 707. [Blau2002] K. Blaum et al., Eur. Phys. J. A 15 (2002) 245. [Blau2003] K. Blaum et al., Nucl. Instrum. Methods B 204 (2003) 331. [Blau2003b] K. Blaum et al., Phys. Rev. Lett. 91 (2003) 260801. [Blau2004] K. Blaum et al., Europhys. Lett. 67 (2004) 586. [Blau2005a] K. Blaum et al., Nucl. Phys. A 752 (2005) 317c. [Blau2005b] K. Blaum et al., "Summary of Cost Estimates for MATS", presented at the
CORE-Meeting, Darmstadt, May 31 and June 1, 2005. [Blau2006] K. Blaum, Phys. Rep. 425 (2006) 1. [Blau2009] K. Blaum et al., J. Phys. B 42 (2009) 15402. [Blau2010] K. Blaum, Yu. N. Novikov and G. Werth, Contemp. Phys. 51 (2010) 149. [Bloc2008] M. Block et al., Phys. Rev. Lett. 100 (2008) 132501. [Bloc2010] M. Block et al., Nature 463 (2010) 785. [Boll2001] G. Bollen, Nucl. Phys. A 693 (2001) 3. [Boll2004] G. Bollen, Lect. Notes Phys. 651 (2004) 169. [Boll2006] G. Bollen et al., Phys. Rev. Lett. 96 (2006) 152501. [Borr2005] D. Borremans et al., Phys. Rev. C 72 (2005) 044309.
149
[Bout2007] D. Boutin et al., GSI Scientific Report 2006 (2007), p. 55. [Brad1936] N.E. Bradbury, R.A. Nielsen, Phys. Rev. 49 (1936) 388. [Brei2009] M. Breitenfeldt et al., Phys. Rev. C 80 (2009) 035805. [Bren1990] D.S. Brenner et al., Phys. Lett. B 243 (1990) 1. [Bren2006] D.S. Brenner et al., Phys. Rev. C 73 (2006) 034315. [Bren2007] G. Brenner, et al., Rev. A 75 (2007) 032504. [Brow1986] L.S. Brown and G. Gabrielse, Rev. Mod. Phys. 58 (1986) 233. [Bruh2007] H. Bruhns, et al., Phys. Rev. Lett. 99 (2007) 113001. [Buss2006] M. Bussman et al., Int. J. Mass Spectrom. 251 (2006) 176. [Buta2000] A. Buta, et al., Nucl. Instrum. Methods A 455 (2000) 412 [Caki2005] R.B. Cakirli et al., Phys. Rev. Lett. 94 (2005) 092501, and Phys. Rev. Lett. 95
(2005) 119903. [Camp2002] P. Campbell et al., Phys. Lett. Lett. 89 (2002) 082501. [Camp2006] P. Campbell, Hyp. Int. 171 (2006) 143. [Cham2006] C. Champagne et al., Hyp. Int. 173 (2006) 85. [Chea2007] B. Cheal et al., Phys. Lett. B 645 (2007) 133. [Chea2008] B. Cheal et al., Hyp. Int. 181 (2008) 107. [Chea2009] B. Cheal et al., Phys. Rev. Lett. 102 (2009) 222501. [Clar2004] J. A. Clark et al., Phys. Rev. Lett. 92 (2004) 192501. [Clar2005] J. A. Clark et al., Eur. Phys. J. A. 25 S01 (2005) 629. [Clar2007] J. A. Clark et al., Phys. Rev. C 75 (2007) 032801. [Cres2001] J. R. Crespo López-Urrutia et al., Physica Scripta TB 92 (2001) 110. [Cres2008] J. R. Crespo López-Urrutia, Can. J. Phys. 86 (2008) 111. [Dend1989] P. Dendooven et al., Phys. Lett. B 226 (1989) 27. [Deut1988] J. Deutsch, in: Workshop on the breaking of fundamental symmetries in nuclei,
Santa Fe, 1988; B.R. Holstein and S. B. Treiman, Phys. Rev. D 16 (1977) 2369.
[DeTech] www.detechinc.com [DeWi2004] H. De Witte, et al., Phys. Rev. C, 69 (2004) 044305. [Dick2006] T. Dickel, Diploma Thesis, Justus-Liebig-Universität Gießen, Germany (2006). [Dick2007] T. Dickel et al., GSI Scientific Report 2006 (2007), p. 204. [Dill2000] J. Dilling et al., Hyp. Int. 127 (2000) 491. [Dill2003] J. Dilling et al., Nucl. Instrum. Methods B 204 (2003) 492. [Dill2006] J. Dilling et al., Int. J. Mass Spectrom. 251 (2006) 198. [Dilm2003] I. Dillman et al., Phys. Rev. Lett. 91 (2003) 162503. [Drag2003] I. N. Draganic, et al., Phys. Rev. Lett. 81 (2003) 183001. [Dupp1984] P. Van Duppen et al., Phys. Rev. Lett. 52 (1984) 1974. [Dupp1985] P. Van Duppen et al., Phys. Lett. B 154 (1985) 354. [Dupp1987] P. Van Duppen et al., Phys. Rev. C 35 (1987) 1861. [Dwor2008] M. Dworschak et al., Phys. Rev. Lett. 100 (2008) 072501. [Eite2009] G. Eitel et al., Nucl. Instrum. Methods A 606 (2009) 475. [Elis2004] S. Eliseev, PhD Thesis, Justus-Liebig-Universität Gießen, Germany (2004). [Elis2007] S. Eliseev et al., Nucl. Instrum. Methods B 258 (2007) 479. [Elom2008] V.-V. Elomaa et al., Eur. Phys. J. A 40 (2009) 1. [Elom2009] V.-V. Elomaa et al., Phys. Rev. Lett. 102 (2009) 252501. [ElSa2007a] A. S. El-Said, et al., Nucl. Instrum. Methods B 256 (2007) 346. [ElSa2007b] A. S. El-Said, et al., Nucl. Instrum. and Methods B 258, (2007) 167. [Eron2006a] T. Eronen, et al., Phys. Rev. Lett. 97 (2006) 232501. [Eron2006b] T. Eronen, et al., Phys. Lett. B 636 (2006) 191. [Eron2008a] T. Eronen, et al., Phys. Rev. Lett. 100 (2008) 132502. [Eron2008b] T. Eronen, PhD Thesis, University of Jyväskylä, Finland (2008).
150
[Eron2009] T. Eronen, et al., Phys. Rev. C 79 (2009) 032802(R). [Esse1996] H.G. Essel et al., IEEE Trans. of Nucl. Science, Vol.43, No.1 (1996) 132. [Esse2000] H.G. Essel and N. Kurz, IEEE Trans. of Nucl. Science, Vol.47, No.2 (2000)
337. [Ewal2004] G. Ewald et al., Phys. Rev. Lett. 93 (2004) 113002. [Fall2007] http://nd2007.edpsciences.org/articles/ndata/pdf/2007/01/ndata07758.pdf [Fall2008a] J. Fallis et al., Phys. Rev. C 78 (2008) 022801. [Fall2008b] J. Fallis et al., PoS (NIC X) 044. [Fedo2000] V.N. Fedoseyev et al., Hyp. Int., 127 (2000) 409. [Fedo2003] V.N. Fedoseyev et al., Nucl. Instrum. Methods B 204 (2003) 353. [Ferr2007] R. Ferrer, PhD Thesis, Johannes Gutenberg University Mainz, Germany
(2007). [Fisk2007] J. L. Fisker, R. D. Hoffman, and J. Pruet (2007), arXiv:0711.1502. [Flec2009] X. Fléchard, private communication. [Flei2004] P. Fleischer et al., Phys. Rev. C 70 (2004) 054321. [Foge1999] B. Fogelberg et al., Phys. Rev. Lett. 82 (1999) 1823. [Fran2008] H. Franberg et al., Nucl. Instrum. Methods B 266 (2008) 4502. [Fric2004] G. Fricke and K. Heilig, Nuclear Charge Radii, in Landolt-Börnstein, Vol 20,
Ed. H. Schopper, Springer Verlag (2004). [Froh2006] C. Fröhlich et al., Phys. Rev. Lett. 96 (2006) 142502. [Gabr1982] L.S. Brown and G. Gabrielse, Phys. Rev. A 25 (1982) 2423. [Gabr1986] L.S. Brown and G. Gabrielse, Rev. Mod. Phys. 58 (1986) 233. [Gabr2009a] G. Gabrielse, Phys. Rev. Lett. 102 (2009) 172501. [Gabr2009b] G. Gabrielse, Int. J. Mass Spectrom. 279 (2009) 107. [Gasp2000] C. Gaspard, M. Donszelmann, Ph. Charpentier, International Conference on
Computing in High Energy and Nuclear Physics (Padova, Italy 1-11 February 2000), http://www.cern.ch/dim
[Geit2002] W. Geitner, PhD Thesis, Johannes Gutenberg University Mainz, Germany (2002).
[Geit2008] W. Geithner et al., Phys. Rev. Lett. 101 (2008) 252502. [Geor2007a] S. George et al., Phys. Rev. Lett. 98 (2007) 162501. [Geor2007b] S. George et al., Int. J. Mass Spectrom. 264 (2007) 110. [Geor2008] S. George et al., Eur. Phys. Lett., 82 (2008) 50005. [Gonz2005] A. J. González Martínez, et al., Phys. Rev. Lett. 94 (2005) 203201. [Gonz2006] A. J. González Martínez, et al., Phys. Rev. A 73 (2006) 052710. [Gori2003] S. Goriely et al., Phys. Rev. C 68 (2003) 054325; M. Samyn et al., Nucl. Phys.
A 700 (2002) 024308; F. Tondeur et al., Phys. Rev. C 62 (2000) 024308. [Gori2009a] S. Goriely, N. Chamel, and J. M. Pearson, Phys. Rev. Lett. 102 (2009) 152503. [Gori2009b] S. Goriely, S. Hilaire, M. Girod, and S. Peru, Phys. Rev. Lett. 102 (2009)
242501. [Graf1980] G. Gräff, H. Kalinowsky, J. Traut, Z. Phys. A 297 (1980) 35. [Gras1975] B. Grasemann, Atomic Inner Shell Processes, Academic Press (1975). [Graw2007] H. Grawe et al., Rep. Prog. Phys. 70 (2007) 1525. [Grub2001] L. Gruber et al., Phys., Rev. Lett. 86 (2001) 636. [Haet2008] E. Haetner et al., GSI Scientific Report 2008, p. 134. [Hage2007] U. Hager et al., Phys. Rev. C 75 (2007) 064302. [Hagi2002] K. Hagiwara et al., Phys. Rev. D 66 (2002) 010001. [Hahn2005] H. Hahn and U. Thiemer, GSI Scientific Report 2004 (2005) 343. [Haka2008] J. Hakala et al., Phys. Rev. Lett. 101 (2008) 052502. [Hama1994] I. Hamamoto, Nucl. Phys. A 577 (1994) 19c. [Hard1977] J. C. Hardy et al., Phys. Lett. B 71 (1977) 307.
151
[Hard2002] J. C. Hardy et al., Phys. Rev. Lett. 88 (2002) 252501. [Hard2009] J.C. Hardy and I.S. Towner, Phys. Rev. C 79 (2004) 055502. [Harm2006] Z. Harman et al., Phys. Rev. A 73 (2006) 052711. [Hei1974] K. Heilig, and A. Steudel, At. Data Nucl. Data Tab. 14 (1974) 613. [Heil1985] K. Heilig, Hyp. Int. 24 (1985) 345. [Herf2001a] F. Herfurth et al., Phys. Rev. Lett. 87 (2001) 142501. [Herf2001b] F. Herfurth et al., Nucl. Instrum. Methods A 469 (2001) 254. [Herf2003] F. Herfurth et al., J. Phys. B 36 (2003) 931. [Herf2005] F. Herfurth et al., AIP conf. proc. 793 (2005) 278. [Heyd1983] K. Heyde et al., Phys. Rep. 102 (1983) 291. [Hoff2008] R. D. Hoffman, et al., (2008), arXiv:0801.1502. [Hosn2005] P.T. Hosmer, PhD Thesis, MSU NSCL, United States (2005). http://www.nscl.msu.edu/ourlab/publications/download/Hosmer2005_207.pdf [Jama1999] R. Jamal and H. Pichlik, ”LabVIEW Applications and Solutions” (1999)
Prentice Hall. [Jäne1988] J. Jänecke, P.J. Masson, At. Data Nucl. Data Tab. 39 (1988) 265. [Jesc2008] C. Jesch, Diploma Thesis, Justus-Liebig-Universität Gießen, Germany (2008). [Kall2007] R. Kallman and P. Palmeri, Rev. Mod. Phys.79 (2007) 79. [Kank2006] A. Kankainen et al., Eur. Phys. J. A 29 (2006) 271. [Karv2008] P. Karvonen et al., Nucl. Instrum. Methods B 266 (2008) 4794. [Ke2006] Z. Ke et al., Hyp. Int. 173 (2006) 103. [Keim2000] M. Keim et al., Eur. Phys. J. A 8 (2000) 31. [Kell2003] A. Kellerbauer et al., Eur. Phys. J. D 22 (2003) 53. [Kell2004] A. Kellerbauer et al., Phys. Rev. Lett. 93 (2004) 072502. [Kete2008] J. Ketelaer et al., Nucl. Instrum. Methods A 594 (2008) 162. [Kest2002] O. Kester et al., Nucl. Phys. A. 701 (2002) 71. [King1984] W. H. King, Isotope Shifts in Atomic Spectra, Springer Verlag (1984). [Klap1983] H.V. Klapdor, Prog. Part. Nucl. Phys. 10 (1983) 131. [Klug2003a] H.-J. Kluge et al., Phys. Scripta T 104 (2003) 167. [Klug2003b] H.-J Kluge and W. Nörtershäuser, Spectrochimica Acta B 58 (2003) 1031. [Klug2004] H.-J. Kluge and K. Blaum, Nucl. Phys. A 746 (2004) 200c. [Klug2008] H.-J. Kluge et al., Adv. Quantum Chem. 53 (2008) 83. [Köhl1997] S. Köhler et al., Spectrochimica Acta B 52 (1997) 717. [Köni1995] M. König et al., Int. J. Mass Spectrom. Ion Processes 142 (1995) 95. [Kolh2003] V. Kolhinen et al., Nucl. Instrum. Methods B 204 (2003) 502. [Kolh2008] V. Kolhinen et al., Nucl. Instrum. Methods B 266 (2008) 4547. [Kost2003] U. Köster, V.N. Fedoseyev, and V.I. Mishin, Spectrochimica Acta B 58 (2003)
1047. [Kowa2008] M. Kowalska et al., Phys. Rev. C 77 (2008) 034307. [Kret2007] M. Kretzschmar et al., Int. J. Mass Spectrom. 264 (2007) 122. [Krie2008] A. Krieger, Diploma Thesis, Johannes Gutenberg University Mainz, Germany
(2008). [Kugl2000] E. Kugler, Hyp. Int. 129 (2000) 23. [Laka1992] Andreas Lakatos, Diploma Thesis, J.W. Goethe-University Frankfurt, Germany
(1992). [Lang1988] P. Langacker and D. London, Phys. Rev. D 38 (1988) 886. [Lang1992] P. Langacker and M. Luo, Phys. Rev. D 45 (1992) 278. [Lapi2005] A. Lapierre et al., Phys. Rev. Lett. 95 (2005) 183001. [Lars1986] D. J. Larson et al., Phys. Rev. Lett. 57 (1986) 70. [LeBl1997] F. Le Blanc et al., Phys. Rev. Lett. 79 (1997) 2213. [LeBl1999] F. Le Blanc et al., Phys. Rev. C 60 (1999) 054310.
152
[Lee1971] G.E. Lee-Whiting and L. Yamazaki, Nucl. Instrum. Methods 94 (1971) 315. [Levi1998] M. A. Levine, et al., Phys. Scripta T 22 (1988) 157. [Levi1999] J.M.G. Levins et al., Phys. Rev. Lett. 82 (1999) 2476. [Liev1992] P. Lievens et al., Nucl. Instrum. Methods B 70 (1992) 532. [Liao2001] Y. Liao and X. Li, Phys. Lett. B 503 (2001) 301. [Lobo2000] A. Loboda et al., Eur. J. Mass Spectrom. 6 (2000) 531. [Lu2003] Z.-T. Lu and K. Wendt, Rev. Sci. Instrum. 74 (2003) 1169. [Lunn2003] D. Lunney, J.M. Pearson and C. Thibault, Rev. Mod. Phys. 75 (2003) 1021. [Maal1990] J. Maalampi and M. Roos, Phys. Rep. 186 (1990) 53. [Maer2008] G. Maero, PhD Thesis, Ruprecht-Karls-University Heidelberg, Germany
(2008). [Mane2009] E. Mané et al., Eur. Phys. J. A 42 (2009) 503. [Manu2006] D. Manura: SIMION 7.0 user program to create non-repeating waveform of
line segments. www.simion.com/info/User Programming (2006). [Marc1986] W.J. Marciano and A. Sirlin, Phys. Rev. Lett. 56 (1986) 22. [Marc1987] W.J. Marciano and A. Sirlin, Phys. Rev. D 35 (1987) 1672. [Marc2006] W.J. Marciano and A. Sirlin, Phys. Rev. Lett. 96 (2006) 032002. [Mars2000] A.G. Marshall, Int. J. Mass Spectrom. 200 (2000) 331. [Mart2007] A. Martín et al., Eur. Phys. J. A 34 (2007) 341. [Maul2004] J. Maul et al., Nucl. Instrum. Methods B 226 (2004) 644. [Mazz2007] C. Mazzochi et al., Phys. Rev. Lett. 98 (2007) 212501. [Meis2006] W. Meissl, et al., Rev. Sci. Instrum. 77 (2006) 093303. [Meis2007] W. Meissl, et al., Nucl. Instrum. Methods B 256 (2007) 520. [Mokl2008] P. H. Mokler, et al., Phys. Rev. A 77 (2008) 012506. [Mukh2004] M. Mukherjee et al., Phys. Rev. Lett. 93 (2004) 150801. [Mukh2008] M. Mukherjee et al., Eur. Phys. J. A 35 (2008) 1. [Muel2007] P. Müller et al., Phys. Rev. Lett. 99 (2007) 252501. [Naka2002] T. Nakamura et al., Optics Communications 205 (2002) 329. [Naka2006] T. Nakamura, et al.. Phys. Rev. A. 74 (2006) 052503. [Neid2009a] D. Neidherr et al., Phys. Rev. Lett. C 80 (2009) 044323. [Neid2009b] D. Neidherr et al., Phys. Rev. Lett. 102 (2009) 112501. [Neug2000] R. Neugart, Hyp. Int. 127 (2000) 101. [Neug2002] R. Neugart, Eur. Phys. J. A 15 (2002) 35. [Neug2008] R. Neugart et al., Phys. Rev. Lett. 101 (2008) 132502. [Neuh1978] W. Neuhäuser et al., Phys. Rev. Lett. 41 (1978) 233. [Neye2005] G. Neyens et al., Phys. Rev. Lett. 94 (2005) 022501. [Niem2001] A. Nieminen et al., Nucl. Instrum. Methods A 469 (2001) 244. [Niem2002] A. Nieminen et al., Phys. Rev. Lett. 88 (2002) 094801. [Noer2009] W. Nörtershäuser et al., Phys. Rev. Lett. 102 (2009) 062503. [Okad2008] K. Okada et al., Phys. Rev. Lett. 101 (2008) 212502. [Otte1989] E.W. Otten, Nuclear radii and moments of unstable isotopes, in Treatise on
heavy-ion science, D.A. Bromley, Editor. 1989. p. 517-638. [Payn1994] M.G. Payne, L. Deng, and N. Thonnard, Rev. Sci. Instrum., 65 (1994) 2433. [Pear1996] J. M. Pearson, R. C. Nayak, and S. Goriely, Phys. Lett. B 387 (1996) 455. [Pere2009] J. Pereira et al., 2009 arXiv:0902.1705v1 [Pfei2001] B. Pfeiffer et al., Nucl. Phys. A 693 (2001) 282. [Poda2005] I. Podadera-Aliseda, PhD Thesis, Universitat Politècnica de Catalunya and
CERN, 2006 or I. Podadera, et al., Eur. Phys. J. A 25 s01 (2005) 743. [Prue2006] J. Pruet et al., Astrophys. J. 644 (2006) 1028. [Petr2008a] M. Petrick et al., Nucl. Instrum. Methods B 266 (2008) 4493. [Petr2008b] M. Petrick, PhD Thesis, Justus-Liebig-Universität Gießen, Germany (2008).
153
[Plas2007] W.R. Plaß et al., Eur. Phys. J. Special Topics 150 (2007) 367. [Plas2008] W.R. Plaß et al., Nucl. Instrum. Methods B 266 (2008) 4560. [Puch2006] M. Puchalski, A.M. Moro, and K. Pachucki, Phys. Rev. Lett. 97 (2006)
133001. [Puch2008] M. Puchalski and K. Pachucki, Phys. Rev. A 78 (2008) 052511. [Quin2000] W. Quint et al., Hyp. Int. 132 (2000) 453. [Raha2006] S. Rahaman et al., Int. J. Mass Spectrom. 251 2-3 (2006) 146. [Rain1999] S. Rainville et al., Phys. Rev. Lett. 83 (1999) 4510. [Raut2007] C. Rauth et al., Eur. Phys. J. D 45 (2007) 47. [Raut2008] C. Rauth et al., Phys. Rev. Lett. 100 (2008) 012501. [Rein2008] K. Reinheimer, Diploma Thesis, Justus-Liebig-Universität Gießen, Germany
(2008). [Ring2007] R. Ringle et al., Int. J. Mass Spectrom. 263 (2007) 38. [Rodr2003] D. Rodríguez, PhD Thesis, University of Valencia, Spain (2003). [Rodr2004] D. Rodríguez et al., Phys. Rev. Lett. 93 (2004) 161104. [Rodr2006] D. Rodríguez et al., Nucl. Phys. A 769 (2006) 1. [Rols1988] S. L. Rolston and G. Gabrielse, Hyp. Int. 44 (1988) 233. [Ryjk2005] V.L. Ryjkov et al., Eur. Phys. J. A 25s (2005) 53. [Ryjk2008] V.L. Ryjkov et al., Phys. Rev. Lett. 101 (2008) 012501. [Sanc2006] R. Sánchez et al., Hyp. Int. 171 (2006) 181. [Sauv2000] J. Sauvage et al., Hyp. Int., 129 (2000) 303. [Sava2001] G. Savard et al., Hyp. Int. 132 (2001) 221. [Sava2005] G. Savard et al., Phys. Rev. Lett. 95 (2005) 102501. [Scha2001] H. Schatz et al., Phys. Rev. Lett. 86 (2001) 3471. [Scha2006] H. Schatz, Int. J. Mass Spectrom. 251 (2006) 293. [Sche2003] C. Scheidenberger et al., Nucl. Instrum. Methods B 204 (2003) 119. [Schu2007] P. Schury et al., Phys. Rev. C 75 (2007) 055801. [Schw2001] S. Schwarz et al., Nucl. Phys. A 693 (2001) 533. [Schw2003a] S. Schwarz et al., Nucl. Instrum. Methods B 204 (2003) 474. [Schw2003b] S. Schwarz et al., Nucl. Instrum. Methods B 204 (2003) 507. [Schw2008] S. Schwarz et al., Nucl. Instrum. Methods B 266 (2008) 4466. [Scia2008] B Sciascia and the FlavaNet Kaon Working Group, Nucl. Phys. Proc. Suppl.
181-182 (2008) 83. [Seel1998] P. Seelig et al., Phys. Rev. Lett. 81 (1998) 4824. [Sikl2005] G. Sikler et al., Eur. Phys. J. 25s (2005) 63. [Silv1987] R.E. Silverans, P. Lievens and L. Vermeeren, Nucl. Instrum. Methods B 26
(1987) 591. [Simo2008] A. Simon, Bachelor Thesis, Justus-Liebig-Universität Gießen, Germany
(2008). [Simo2009] M. C. Simon et al., submitted to Phys. Rev. Lett. (2009). [Smit2008] M. Smith et al., Phys. Rev. Lett. 101 (2008) 202501. [Sobi2001] A. Sobiczewski et al., Phys. Rev. C 63 (2001) 034306. [Sori2006] R. Soria-Orts et al., Phys. Rev. Lett. 97 (2006) 103002. [Sori2007] R. Soria-Orts, et al., Phys. Rev. A 76 (2007) 052501. [Stra1999] H. C. Straub et al., Rev. Sci. Instr.70 (1999) 4238. [Sun2008a] B. Sun et al., Nucl. Phys. A 812 (2008) 1. [Sun2008b] B. Sun et al., Phys. Rev C 78 (2008) 025806. [Sewt2003] M. Sewtz et al., Phys. Rev. Lett. 90 (2003) 163002. [Tach1988] T. Tachibana et al., At. Data Nucl. Data Tab. 39 (1988) 251. [Tain2007] http://nd2007.edpsciences.org/articles/ndata/pdf/2007/01/ndata07304.pdf [Tell2009] http://www.lac.u-psud.fr/-Atlas-de-l-iode-et-du-tellure-
154
[Thüm2007] Thomas Thümmler,Diploma Thesis, Westfälische Wilhelms Universität Münster, Germany (2007).
[Toiv2008] J. Toivanen, J. Dobaczewski, M. Kortelainen, and K. Mizuyama, Phys. Rev. C 78 (2008) 034306.
[Town2003] I.S. Towner and J.C. Hardy, J. Phys. G 29 (2003) 197. [Town2008] I.S. Towner and J.C. Hardy, Phys. Rev. C 77 (2008) 025501. [Tupi2003] I. I. Tupitsyn, et al., Phys. Rev. A 68 (2003) 022511. [Ubie2009] M. Ubieto-Díaz et al., Int. J. Mass Spectrom., 288 (2009) 1. [Ulme2009] S. Ulmer et al, Rev. Sci. Instrum. 80 (2009) 123302. [VanI1995] P. Van Isacker, D.D. Warner and D.S. Brenner, Phys. Rev. Lett. 74 (1995)
4607. [VanR2004] J. Van Roosbroeck et al., Phys. Rev. Lett. 92 (2004) 112501. [Veren2005] A.N. Verentchikov et al., Tech. Phys. 50 (2005) 73. [Wang2004] L.B. Wang et al., Phys. Rev. Lett. 93 (2004) 142501. [Wang2006] Z. Wang, PhD Thesis, Justus-Liebig-Universität Gießen, Germany (2006). [Waps2003] A.H. Wapstra et al., Nucl. Phys. A 729 (2003) 129. [Waut1993] J. Wauters et al., Z. Phys. A 345 (1993) 21. [Waut1994a] J. Wauters et al., Phys. Rev. Lett. 72 (1994) 1329. [Waut1994b] J. Wauters et al., Phys. Rev. C 50 (1994) 2768. [Webe2008] C. Weber et al., Phys. Rev. C 78 (2008) 054310. [Weid2003] M. Weidenmüller et al., Hyp. Int. 146 (2003) 219. [Weis2002a] L. Weissman et al., Nucl. Instrum Methods A 492 (2002) 451. [Weis2002b] L. Weissman et al., Phys. Rev. C, 65 (2002) 024315. [Lu2003] Z. Lu-T. and K. Wendt, Rev. Sci. Instrum. 74 (2003) 1169. [Wend2004] K. Wendt et al., Nucl. Phys. A 746 (2004) 47c. [WPEC-SG6] http://www.nea.fr/html/science/wpec/volume6/volume6.pdf [WEpp2007] S. W. Epp, et al., Phys. Rev. Lett. 98 (2007) 183001. [Wile1955] W.C. Wiley, I.H. McLaren, Rev. Sci. Instrum. 26 (1955) 1150. [Wine1978] D.J. Wineland et al., Phys. Rev. Lett. 40 (1978) 1639. [Witt2008] GSI Scientific Report 2007 (2008) 315. [Wiza1979] J. L. Wiza, Nucl. Instrum. Methods A 162 (1979) 587. [Woln2004] H. Wollnik et al., Nucl. Instrum. Methods A 519 (2004) 373. [Wood1992] J.L. Wood et al., Phys. Rep. 215 (1992) 291. [Wood1999] J.L. Wood et al., Nucl. Phys. A 651 (1999) 323. [Yama2002] T. Yamazaki et al., Phys. Rep. 366 (2002) 183. [Yan2000] Z. C. Yan and G. W. F. Drake, Phys. Rev. A 61 (2000) 022504. [Yan2008] Z. C. Yan, W. Nörtershäuser, and G. W. F. Drake, Phys. Rev. Lett. 100 (2008)
243002. [Yazi2006] C. Yazidjian et al., Hyp. Int. 173 (2006) 181. [Yord2007] D. Yordanov et al., Phys. Rev. Lett. 99 (2007) 212501. [YZou2003] Y. Zou, J. R. Crespo López-Urrutia, and J. Ullrich, Phys. Rev. A 67 (2003)
42703. [Zako2010] M. Záková et al., J. Phys. G 37 (2010). [Zhan1989] J.-Y. Zhang, R.F. Casten and D.S. Brenner, Phys. Lett. B 227 (1989) 1.
This manuscript has been acomplished by the contributions from several members of the MATS and LaSpec collaborations. All the contributions are acknowledged and without them this document would not exist. We also acknowledge support from the Max-Planck Society as well as from several funding agencies in Spain which provided economical support for the organization of the 3rd LaSpec-MATS collaboration meeting held in Matalascñas

155
(Huelva) in October 2008. This meeting served to fix the TDR contents. These funding agencies are Junta de Andalucía and CPAN (Centro Nacional de Partículas Astropartículas y Nuclear).
Related Documents