Solar Integration Workshop, Berlin, 24.10.2017 Mathias Schoeneberger, Sören Patzack, Hendrik Vennegeerts Forschungsgemeinschaft für elektrische Analgen und Stromwirtschaft e.V. (FGH) Marco Lindner, Rolf Witzmann Technical University of Munich (TUM) Derivation of a Q(U)-control tolerance band for inverters in order to meet voltage quality criteria

Welcome message from author
This document is posted to help you gain knowledge. Please leave a comment to let me know what you think about it! Share it to your friends and learn new things together.
Transcript
Solar Integration Workshop, Berlin, 24.10.2017
Mathias Schoeneberger, Sören Patzack, Hendrik Vennegeerts
Forschungsgemeinschaft für elektrische Analgen und Stromwirtschaft e.V. (FGH)
Marco Lindner, Rolf Witzmann
Technical University of Munich (TUM)
Derivation of a Q(U)-control toleranceband for inverters in order to meetvoltage quality criteria

FGH e.V. | M. Schoeneberger | Derivation of a Q(U)-control tolerance band in order to meet voltage quality criteria 2
SIW 2016
„Stability Assessment for Automated Voltage Controlling Equipment in
Distribution Grids“
one key finding:
Q(U)-control with PT1 behavior can ensure voltage stability in distribution
networks, while increasing the hosting capacity
last years outlook: tolerance band for stability evaluation of controls
what are testing scenarios in order to ensure sufficient limitation of over-
shoot and setting time for all real situations?
what are the maximum allowed deviations from the ideal PT1 behavior?

FGH e.V. | M. Schoeneberger | Derivation of a Q(U)-control tolerance band in order to meet voltage quality criteria 3
SIW 2016
„Stability Assessment for Automated Voltage Controlling Equipment in
Distribution Grids“
one key finding:
Q(U)-control with PT1 behavior can ensure voltage stability in distribution
networks, while increasing the hosting capacity
last years outlook: tolerance band for stability evaluation of controls
what are testing scenarios in order to ensure sufficient limitation of over-
shoot and setting time for all situations?
what are the maximum allowed deviations from the ideal PT1 behavior?
what is a reasonable value for x?
Q
t
x %
FGH e.V. | M. Schoeneberger | Derivation of a Q(U)-control tolerance band in order to meet voltage quality criteria 4
Agenda
motivation for Q(U)-control in distribution networks
dynamic behavior, stability and voltage quality
requirements in standards for inverters with Q(U)-control
methodology for tolerance band derivation
results
FGH e.V. | M. Schoeneberger | Derivation of a Q(U)-control tolerance band in order to meet voltage quality criteria 5
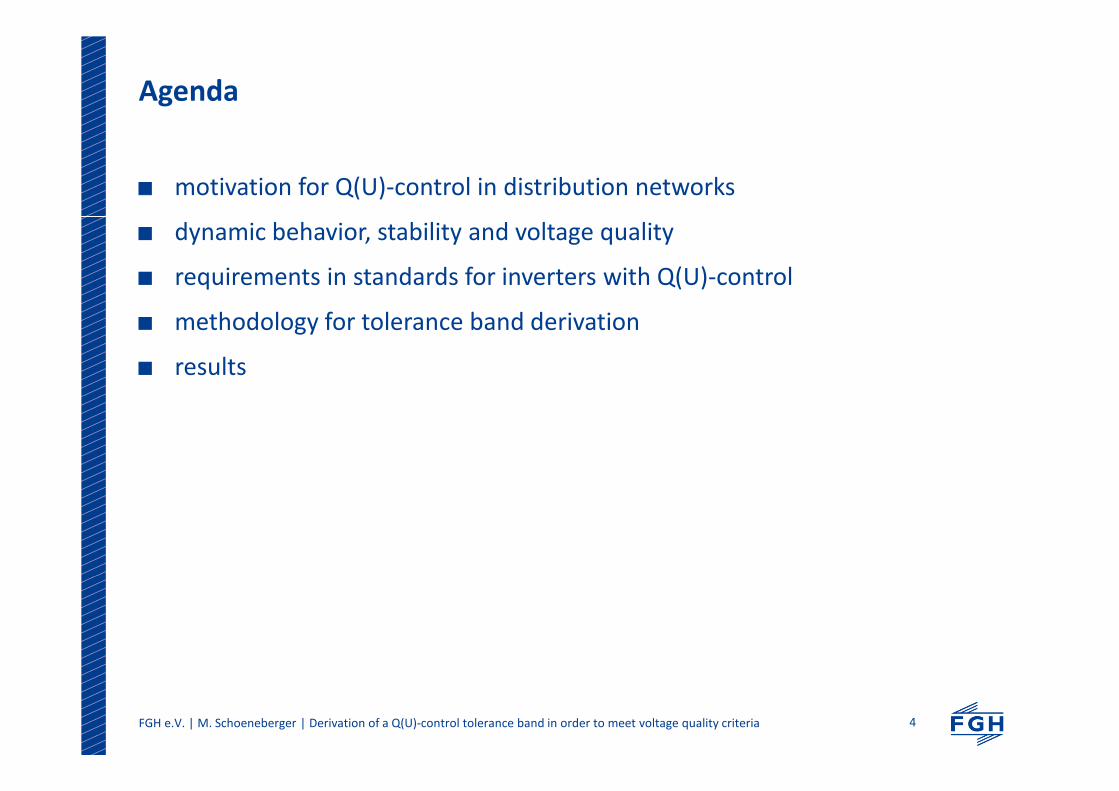
Distributed Generation with Q(U)-control
Dynamic Modelling of Automated Voltage Controlling Equipment
ideal model of DG with Q(U)-control
simplified block representation
PT1-output-characteristic required in EN 50438
slope gradient
hysteresis
Q
U
dead-band
measurement
U
QDGUPCC
Q(U)-
characteristic PT1
grid
U
Q
UQset
Q(U)-control
PCC: point of common coupling
Q(U) Parameters
measurement delay Tm
slope gradient Kslope
PT1 time constant TPT1
PT1 gain KPT1

FGH e.V. | M. Schoeneberger | Stability Assessment for Automated Voltage Controlling Equipment in Distribution Grids 6
Distributed Generation with Q(U)-control
Dynamic Modelling of Automated Voltage Controlling Equipment
ideal model of DG with Q(U)-control
simplified block representation
PT1-output-characteristic required in EN 50438
Q(U) Parameters
measurement delay Tm
slope gradient Kslope
PT1 time constant TPT1
PT1 gain KPT1
measurement
U
QDGUPCC
Q(U)-
characteristic PT1
grid
U
Q
UQset
Q(U)-control
first order lag element
PCC: point of common coupling

FGH e.V. | M. Schoeneberger | Derivation of a Q(U)-control tolerance band in order to meet voltage quality criteria 7
Motivation for Q(U)-control in distribution networks
characteristic rural network
scenario
reg
ula
rtr
an
sfo
rma
r
no voltage-
control
Q(U) 0.95
Q(U) 0.9
cosϕ(P) 0.95
cosϕ(P) 0.9
VR
DT
no voltage-
control
Q(U) 0.95
Q(U) 0.9
cosϕ(P) 0.95
cosϕ(P) 0.9
70
90
104
98
123
231
226
222
217
205
0 200 400 600
0 100 200 300
1
2
3
4
5
6
7
8
9
10
Maximale Netzanschlusskapazität
Investitionen Spannungshaltungskonzept
Investitionen konventioneller Netzausbau
source: FNN-study on new methods for static voltage control
investment in €/kWp
hosting capacity in kWp
maximal hosting capacity
investment voltage controlling equipment
investment network expansion
0.95; 0.9: cosϕ(P)min
voltage rise can limit the further
integration of distributed generation (DG)
static voltage control of DG shows
a significant cost benefit
in comparison to network expansion
positive interplay of Q(U)-control
with voltage regulated distribution
transformers (VRDTs)
FGH e.V. | M. Schoeneberger | Derivation of a Q(U)-control tolerance band in order to meet voltage quality criteria 8
Motivation for Q(U)-control in distribution networks
0
5
10
15
20
25
30
35
40
45
Re
act
ive
En
erg
y[G
varh
]
Grid 1 Grid 2 Grid 3 Grid 4
Grid 5 Grid 6 Grid 7 Grid 8
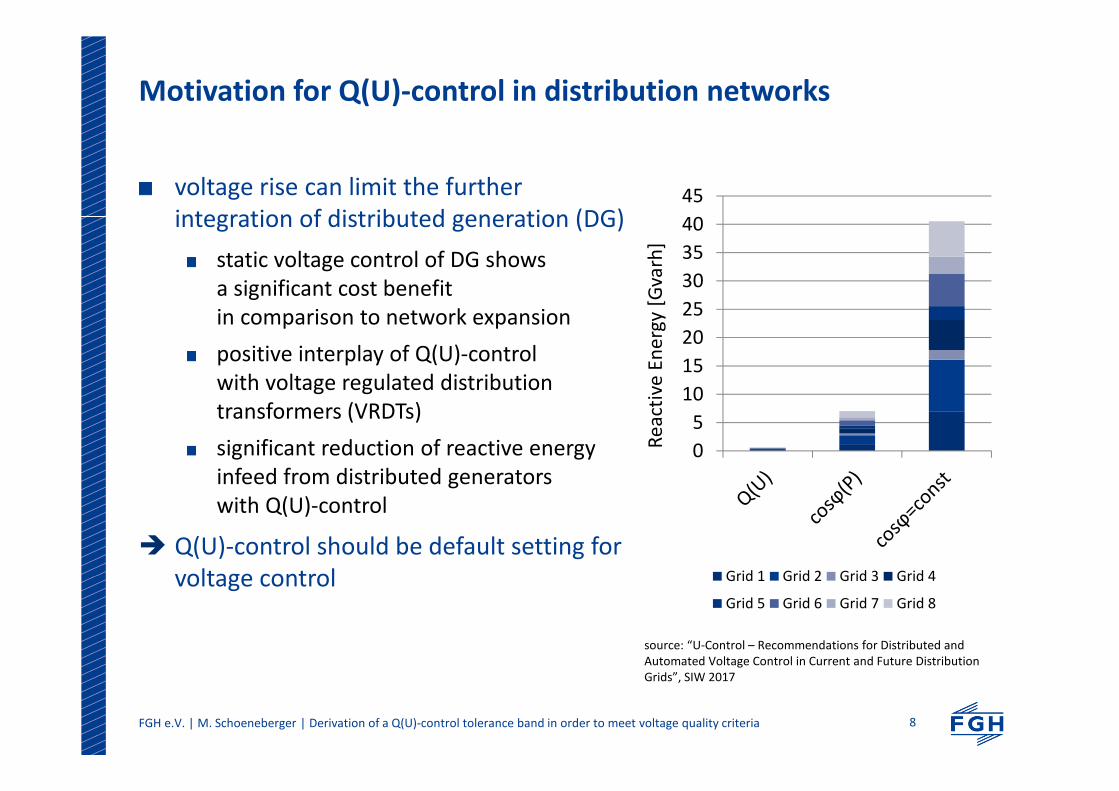
voltage rise can limit the further
integration of distributed generation (DG)
static voltage control of DG shows
a significant cost benefit
in comparison to network expansion
positive interplay of Q(U)-control
with voltage regulated distribution
transformers (VRDTs)
significant reduction of reactive energy
infeed from distributed generators
with Q(U)-control
Q(U)-control should be default setting for
voltage control
source: “U-Control – Recommendations for Distributed and
Automated Voltage Control in Current and Future Distribution
Grids”, SIW 2017

FGH e.V. | M. Schoeneberger | Derivation of a Q(U)-control tolerance band in order to meet voltage quality criteria 9
Voltage Stability
Closed Control Loop
Q(U)-control represents a closed control loop
and can in some cases be prone to unstable behavior
oscillation of reactive power infeed
<-> oscillation of voltage
0
0 ? t
Q
t
Q
ideal dynamic
behavior
unwanted
oscillations

FGH e.V. | M. Schoeneberger | Derivation of a Q(U)-control tolerance band in order to meet voltage quality criteria 10
Voltage Stability
Closed Control Loop
Q(U)-control represents a closed control loop
and can in some cases be prone to unstable behavior
oscillation of reactive power infeed
<-> oscillation of voltage
example shows
slow oscillation: f ≈ 0.05 Hz
Stability assessment required
0
0
Source: ETG/FNN Schutz- und Leittechnik Tutorial 2016,
„Auswirkung von Parkregelungskonzepten auf die Netzstabilität“
-3,00
-2,00
-1,00
0,00
1,00
2,00
3,00
19,80
20,00
20,20
20,40
20,60
20,80
21,00
21,20
Voltage Reactive Power
Uref
U [kV]
Q[Mvar]
exemplary field test data with
erroneous controller parameters
FGH e.V. | M. Schoeneberger | Derivation of a Q(U)-control tolerance band in order to meet voltage quality criteria 11
Worst-Case Assumptions for Stability Assessment
Critical Network
impact of Q(U)-control on the local voltage increases with
increasing available reactive power (Qmax)
increasing impedance (X) /increasing line length (l)
increasing slope gradient (Kslope)
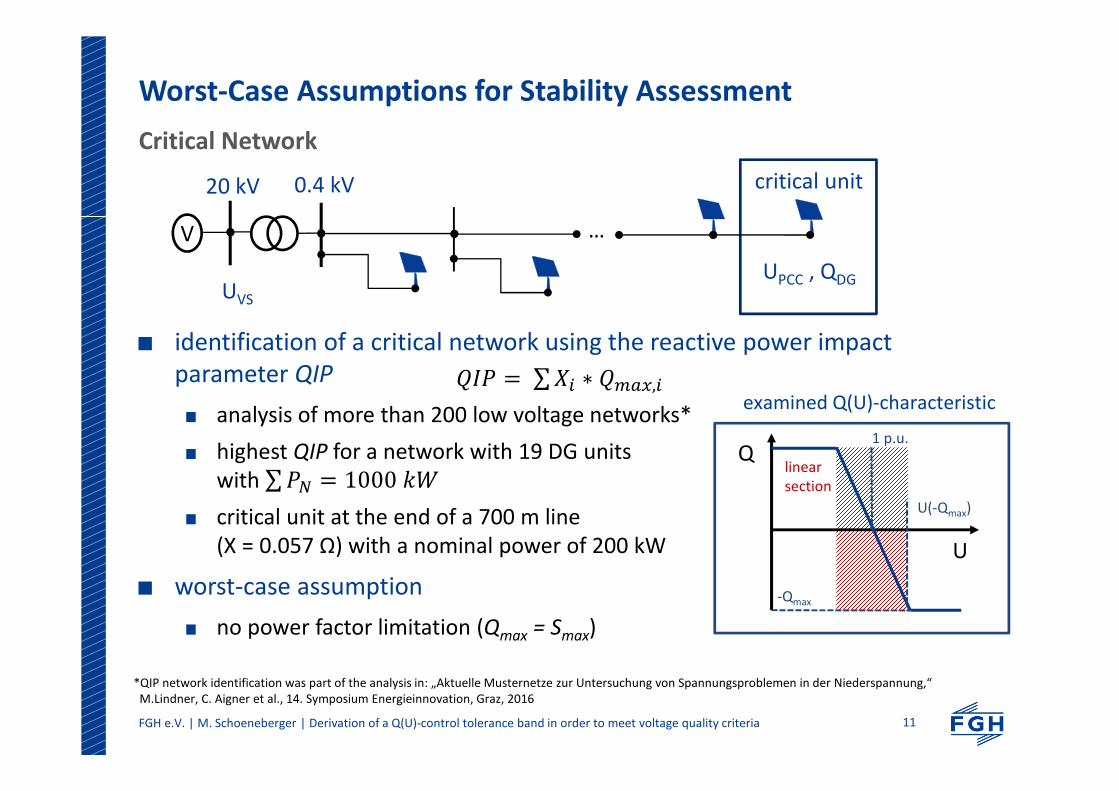
identification of a critical network using the reactive power impact
parameter QIP
analysis of more than 200 low voltage networks*
highest QIP for a network with 19 DG units
with ∑ 1000
critical unit at the end of a 700 m line
(X = 0.057 Ω) with a nominal power of 200 kW
worst-case assumption
no power factor limitation (Qmax = Smax)
network parameters
controller parameter
∑ ∗ ,
*QIP network identification was part of the analysis in: „Aktuelle Musternetze zur Untersuchung von Spannungsproblemen in der Niederspannung,“
M.Lindner, C. Aigner et al., 14. Symposium Energieinnovation, Graz, 2016
20 kV 0.4 kV
V
UVS
UPCC , QDG
…
critical unit
U(-Qmax)
Q
U
-Qmax
linear
section
1 p.u.
examined Q(U)-characteristic

FGH e.V. | M. Schoeneberger | Derivation of a Q(U)-control tolerance band in order to meet voltage quality criteria 12
Worst-Case Assumptions for Stability Assessment
Trigger
impact of Q(U)-control on the local voltage increases with
increasing available reactive power (Qmax)
increasing impedance (X) /increasing line length (l)
increasing slope gradient (Kslope)
reaction of the voltage controllers triggered by sudden voltage change
of ∆Utrigger = 6 % upstream of the transformer
reference value for sudden voltage change in medium voltage level according
to DIN EN 50160
network parameters
controller parameter
20 kV 0.4 kV
V
UVS
UPCC , QDG
…
critical unit
0,96
0,98
1,00
1,02
1,04
-4 -2 0 2 4 6 8 10
UOS[V]
t [s]
sudden voltage change at transformer
∆U = 6 %

FGH e.V. | M. Schoeneberger | Derivation of a Q(U)-control tolerance band in order to meet voltage quality criteria 13
Criteria for Voltage Stability Assessment
Stability and Voltage Quality
sudden voltage change - ∆Ust < 3 %
German standard VDE-AR-4105 defines ∆Ust as a change in voltage between
two consecutive rms-values
short term flicker - Pst < 1
maximal voltage change - ∆Umax < ∆Utrigger
∆Utrigger: voltage jump triggering a reaction of the inverter with Q(U)-control
∆Umax: maximal change in voltage after trigger
all criteria are met
one criterion violated
more than one criterion violated
unstable – the dynamic process after the trigger does not reach a stationary
terminal value
stable – a stationary terminal
value is reached

FGH e.V. | M. Schoeneberger | Derivation of a Q(U)-control tolerance band in order to meet voltage quality criteria 14
Stability Assessment
Exemplary Dynamic Response
exemplary simulation
with high slope
gradient and small
PT1 time constant
examination of
voltage and reactive
power infeed of
critical unit
clear overshoot
two criteria violated
stationary operating point
reached within 10 s
stable operation, despite
extreme parameters
-100
-60
-20
20
60
100
370
390
410
430
-5 0 5 10 15 20
U_NVP
Q_EZA
triggerU [V]
Q [kvar]
t[s]
Q(U) Parameters Assessment Criteria
Tm 0.3 s sudden voltage change 0.2 %
Slope 1 %* maximal voltage change 6.6 %
TPT1 5 s short term flicker 1.24
* steepest slope, U(-Qmax) = 1.01 p.u.
dynamic response of the critical unit
QDG
UPCC
5 10 15 20 25 30 35 40 45 50 55 600.010.310.610.911.21
1.01
1.02
1.03
1.04
1.05
TU in sT
Q in s
U(-
Qm
ax)
in p
.u.
∆Umax > 6 %
short term flicker
Pst > 1
FGH e.V. | M. Schoeneberger | Derivation of a Q(U)-control tolerance band in order to meet voltage quality criteria 15
Stability Assessment
Variation of Controller Parameters
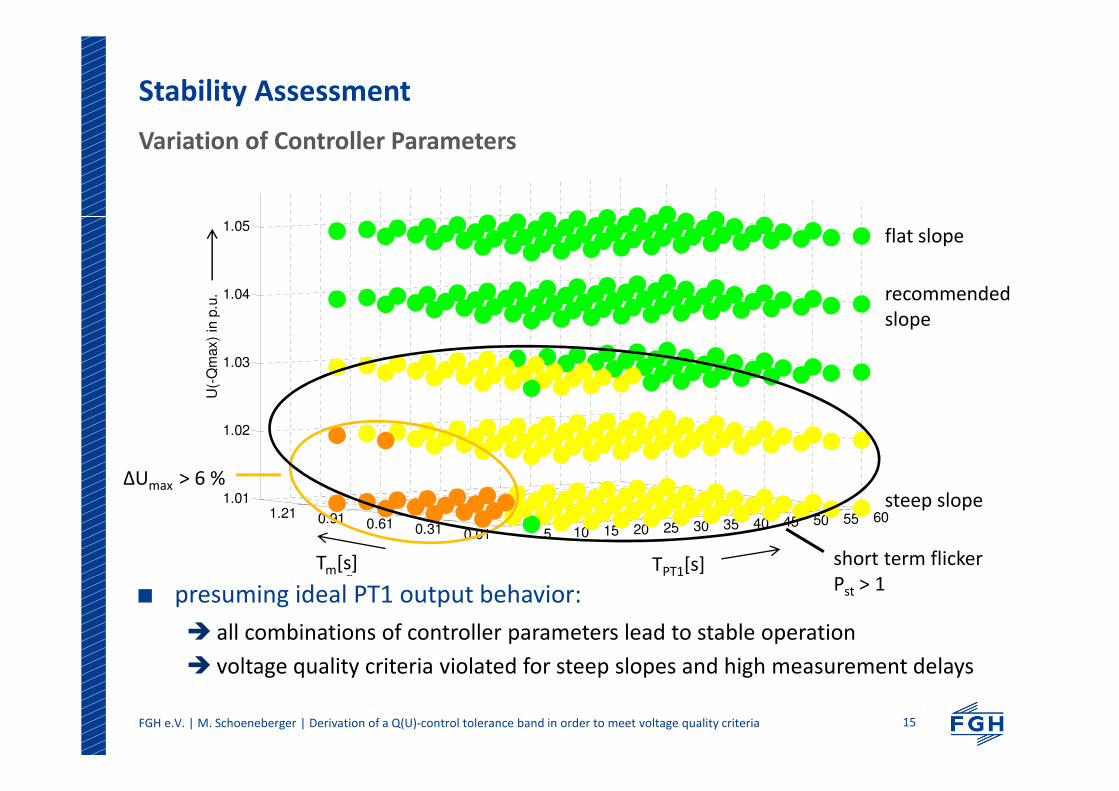
presuming ideal PT1 output behavior:
all combinations of controller parameters lead to stable operation
voltage quality criteria violated for steep slopes and high measurement delays
Tm[s] TPT1[s]
flat slope
steep slope
recommended
slope

FGH e.V. | M. Schoeneberger | Derivation of a Q(U)-control tolerance band in order to meet voltage quality criteria 16
Requirements
European and German Standards
key requirement for the dynamic response from DIN EN 50438 (European
standard) and VDE-AR-4105 (German standard, draft of the amendment,
currently in revision)
the output characteristic of the Q(U)-controller should correspond to a PT1
characteristic
requirement confirmed by stability assessment
compliance critical for voltage stability
verification with test procedure required
tolerance band: allowed deviation between ideal and measured dynamic
response of Q(U)-controller
limit for the tolerance band required

FGH e.V. | M. Schoeneberger | Derivation of a Q(U)-control tolerance band in order to meet voltage quality criteria 17
Requirements
European and German Standards
key requirement for the dynamic response from DIN EN 50438 (European
standard) and VDE-AR-4105 (German standard, draft of the amendment,
currently in revision)
the output characteristic of the Q(U)-controller should correspond to a PT1
characteristic
requirement confirmed by stability assessment
compliance critical for voltage stability
verification with test procedure required
tolerance band: allowed deviation between ideal and measured dynamic
response of Q(U)-controller
limit for the tolerance band required
Q
t
x %
FGH e.V. | M. Schoeneberger | Derivation of a Q(U)-control tolerance band in order to meet voltage quality criteria 18
Methodology for Tolerance Band Derivation
Voltage Quality Assessment
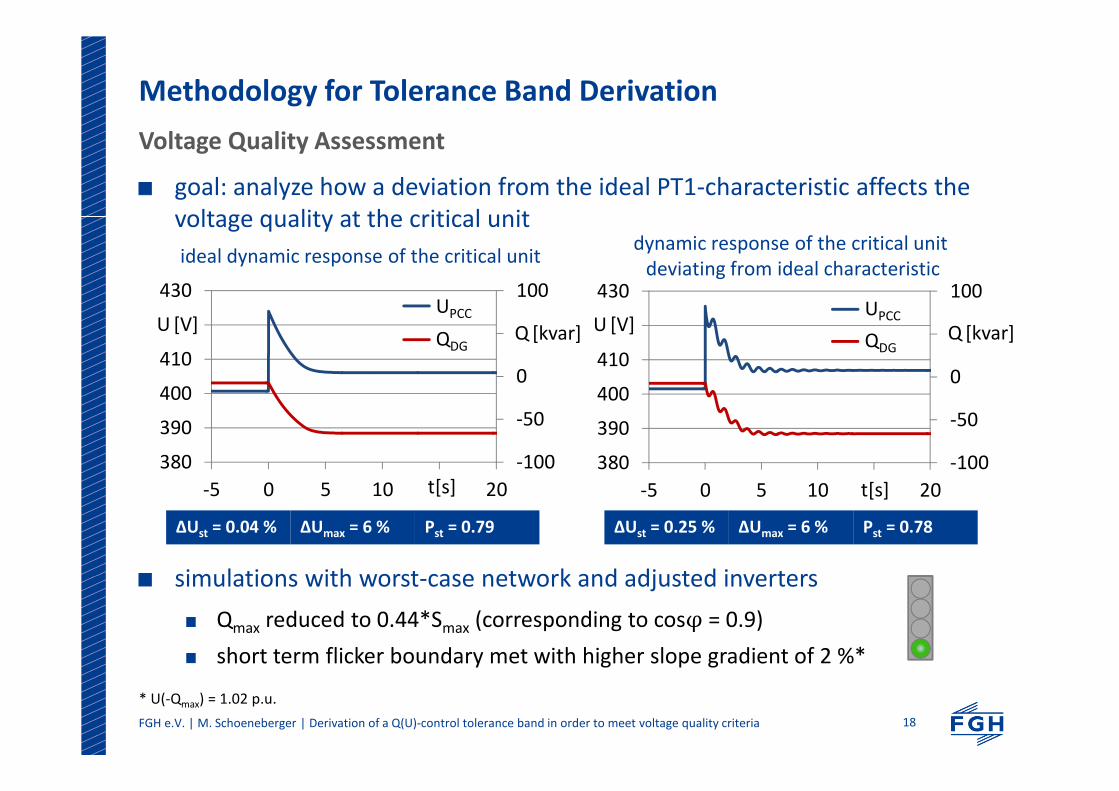
goal: analyze how a deviation from the ideal PT1-characteristic affects the
voltage quality at the critical unit
simulations with worst-case network and adjusted inverters
Qmax reduced to 0.44*Smax (corresponding to cosφ = 0.9)
short term flicker boundary met with higher slope gradient of 2 %*
* U(-Qmax) = 1.02 p.u.
-100
-50
0
50
100
380
390
400
410
420
430
-5 0 5 10 15 20
UPCC
QDG
ideal dynamic response of the critical unit
-100
-50
0
50
100
380
390
400
410
420
430
-5 0 5 10 15 20
UPCC
QDG
dynamic response of the critical unit
deviating from ideal characteristic
∆Ust = 0.04 % ∆Umax = 6 % Pst = 0.79
U [V] Q [kvar]
t[s]
QDG
UPCCU [V]
t[s]
Q [kvar]QDG
UPCC
∆Ust = 0.25 % ∆Umax = 6 % Pst = 0.78

FGH e.V. | M. Schoeneberger | Derivation of a Q(U)-control tolerance band in order to meet voltage quality criteria 19
Methodology for Tolerance Band Derivation
Voltage Quality Assessment
characteristics of deviation significantly influence the voltage quality
variation of amplitude, shape
and frequency
“pseudo-controllers”
predefined time-series of
simulated ideal characteristic
plus deviation
no reaction to voltage
measurement
(therefore “pseudo”)
amplitude of pseudo-controller deviation reinterpreted as tolerance band (TB)
+QDG
Network
Qideal
deviation
ideal PT1
Qdeviation
Declining SineSine
Step
TB
FGH e.V. | M. Schoeneberger | Derivation of a Q(U)-control tolerance band in order to meet voltage quality criteria 20
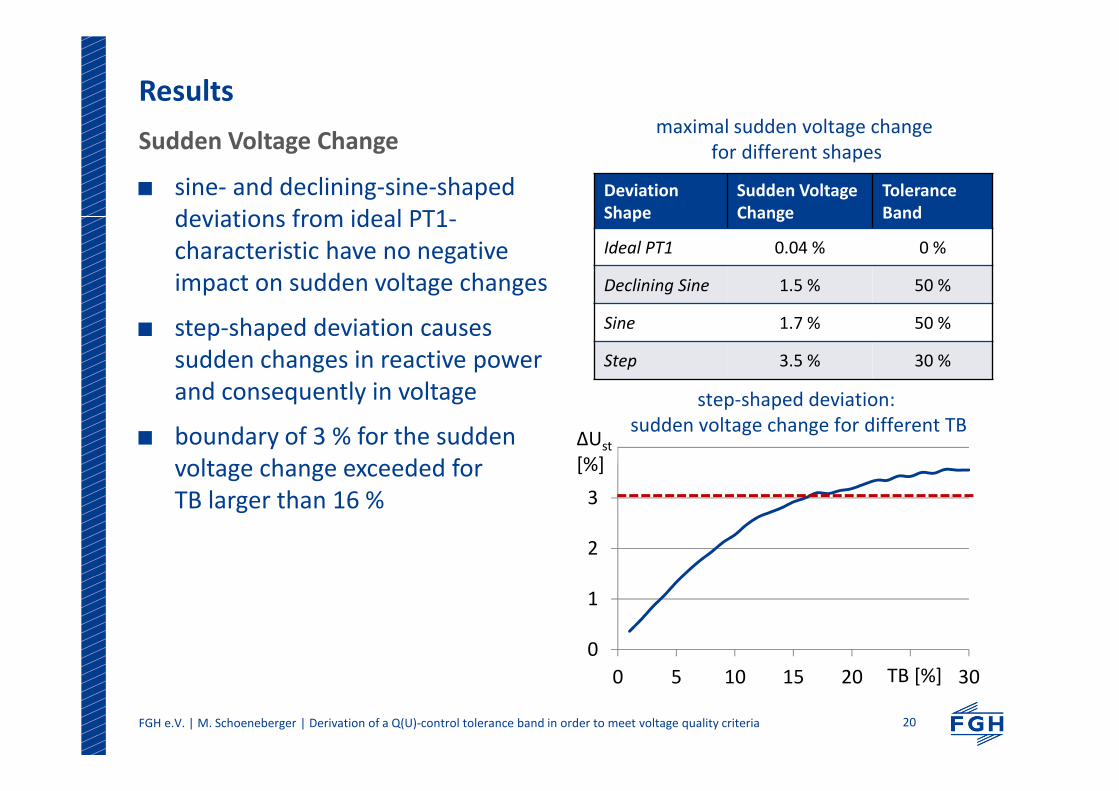
Results
Sudden Voltage Change
sine- and declining-sine-shaped
deviations from ideal PT1-
characteristic have no negative
impact on sudden voltage changes
step-shaped deviation causes
sudden changes in reactive power
and consequently in voltage
boundary of 3 % for the sudden
voltage change exceeded for
TB larger than 16 %
0
1
2
3
4
0 5 10 15 20 25 30
∆Ust
[%]
TB [%]
step-shaped deviation:
sudden voltage change for different TB
Deviation
Shape
Sudden Voltage
Change
Tolerance
Band
Ideal PT1 0.04 % 0 %
Declining Sine 1.5 % 50 %
Sine 1.7 % 50 %
Step 3.5 % 30 %
maximal sudden voltage change
for different shapes

FGH e.V. | M. Schoeneberger | Derivation of a Q(U)-control tolerance band in order to meet voltage quality criteria 21
Results
Maximal Voltage Change
∆Umax > 6 % indicates an overreaction
from the voltage controllers
for sine- and declining-sine shaped
deviations ∆ Umax depends on TB and
frequency
slow deviations (f < 0.5 Hz) able to
meet 6 % boundary, even for
TB = 50 %
fast deviations
(f = 5 Hz)
have to be limited in
amplitude
TB < 15 %
Deviation
Shape
Maximal
Voltage Change
Tolerance
Band
Ideal PT1 6.0 % 0 %
Declining Sine 7.9 % 50 %
Sine 8.8 % 50 %
Step 6.2 % 30 %
maximal sudden voltage change
for different shapes
5
6
7
8
9
0 10 20 30 40 50
0.1 Hz 0.2 Hz 0.3 Hz 0.4 Hz 0.5 Hz
1 Hz 2 Hz 3 Hz 5 Hz
∆Umax[%]
TB [%]
∆Utrigger
= 6 %
declining-sine-shaped deviation:
maximal voltage change for different TB

FGH e.V. | M. Schoeneberger | Derivation of a Q(U)-control tolerance band in order to meet voltage quality criteria 22
Results
Short Term Flicker
deviations with small amplitude and
frequency have no influence on the
short term flicker
for f = 5 Hz, the short term flicker
limit is reached with a TB of 20 %
TB < 20 %
Deviation
Shape
Short Term
Flicker
Tolerance
Band
Ideal PT1 0.79 0 %
Declining Sine 1.99 50 %
Sine 3.61 50 %
Step 1.07 30 %
maximal short term flicker
for different shapes
Pstf = 0.1 Hz 0.2 Hz 0.3 Hz 0.4 Hz 0.5 Hz 1 Hz 2 Hz 3 Hz 5 Hz
TB = 1 % 0.79 0.79 0.79 0.79 0.79 0.79 0.79 0.79 0.79
2 % 0.79 0.79 0.79 0.79 0.79 0.79 0.79 0.79 0.79
5 % 0.79 0.79 0.79 0.79 0.79 0.79 0.80 0.79 0.79
10 % 0.79 0.79 0.79 0.79 0.79 0.78 0.80 0.79 0.81
15 % 0.79 0.79 0.80 0.79 0.79 0.78 0.81 0.80 0.92
20 % 0.79 0.79 0.80 0.79 0.79 0.78 0.83 0.88 1.06
30 % 0.79 0.80 0.80 0.79 0.79 0.78 0.96 1.01 1.36
40 % 0.79 0.80 0.80 0.79 0.79 0.82 1.06 1.16 1.68
50 % 0.80 0.80 0.80 0.80 0.79 0.86 1.17 1.37 1.99
short term flicker for declining-sine shaped deviation
FGH e.V. | M. Schoeneberger | Derivation of a Q(U)-control tolerance band in order to meet voltage quality criteria 23
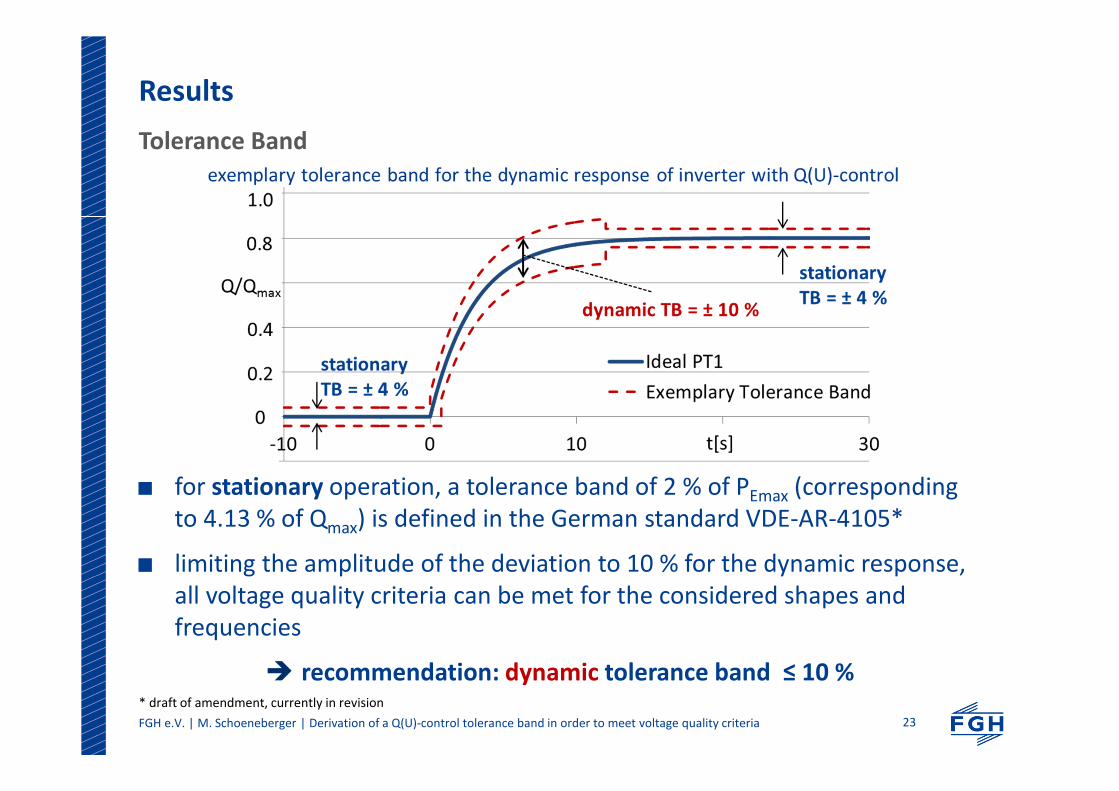
Results
Tolerance Band
for stationary operation, a tolerance band of 2 % of PEmax (corresponding
to 4.13 % of Qmax) is defined in the German standard VDE-AR-4105*
limiting the amplitude of the deviation to 10 % for the dynamic response,
all voltage quality criteria can be met for the considered shapes and
frequencies
recommendation: dynamic tolerance band ≤ 10 %* draft of amendment, currently in revision
Solar Integration Workshop, Berlin, 24.10.2017
Mathias Schoeneberger, Sören Patzack, Hendrik Vennegeerts
Forschungsgemeinschaft für elektrische Analgen und Stromwirtschaft e.V. (FGH)
Marco Lindner, Rolf Witzmann
Technical University of Munich (TUM)
Derivation of a Q(U)-control toleranceband for inverters in order to meetvoltage quality criteria
Thank you for your attention.
Contact Information:
T : +49 241 997857-241
Related Documents