2012 L.20 1/16 Page 1 of 19 L.20 NAME SCHOOL TEACHER Pre-Leaving Certificate Examination, 2012 Mathematics (Project Maths – Phase 1) Paper 2 Higher Level Time: 2 hours, 30 minutes 300 marks For examiner Question Mark 1 2 3 Centre stamp 4 5 6 7 8 Grade Running total Total

Welcome message from author
This document is posted to help you gain knowledge. Please leave a comment to let me know what you think about it! Share it to your friends and learn new things together.
Transcript

2012 L.20 1/16 Page 1 of 19
L.20
NAME
SCHOOL
TEACHER
Pre-Leaving Certificate Examination, 2012
Mathematics (Project Maths – Phase 1)
Paper 2
Higher Level
Time: 2 hours, 30 minutes
300 marks
For examiner
Question Mark
1
2
3
Centre stamp 4
5
6
7
8
Grade
Running total
Total
2012 L.20 2/20
Page 2 of 19
Project Maths, Phase 1Paper 2 – Higher Level
Instructions There are two sections in this examination paper.
Section A Concepts and Skills 150 marks 6 question
Section B Contexts and Applications 150 marks 2 questions
Answer all eight questions, as follows:
In Section A, answer:
Questions 1 to 5 and
either Question 6A or Question 6B.
In Section B, answer Question 7 and Question 8.
Write your answers in the spaces provided in this booklet. There is space for extra work at the back of the booklet. You may also ask the superintendent for more paper. Label any extra work clearly with the question number and part.
The superintendent will give you a copy of the booklet of Formulae and Tables. You must return it at the end of the examination. You are not allowed to bring your own copy into the examination.
Marks will be lost if all necessary work is not clearly shown.
Answers should include the appropriate units of measurement, where relevant.
Answers should be given in simplest form, where relevant.
Write the make and model of your calculator(s) here:

2012 L.20 3/20
Page 3 of 19
Project Maths, Phase 1Paper 2 – Higher Level
Section A Concepts and Skills 150 marks
Answer all six questions from this section. Question 1 (25 marks) The table below shows the age and annual salary of a sample of eight employees in a large company.
Age 32 25 49 40 59 57 38 28
Salary (€) 35,000 29,000 54,000 45,000 61,000 64,000 42,000 30,000
(a) Show this information on a scatter plot.
Calculate the correlation coefficient. Answer: _____________
Add the line of best fit to your scatter plot.
(b) Find the equation of the line of best fit of your scatter plot.
(c) What annual increase should a company employee expect?
page running

2012 L.20 4/20
Page 4 of 19
Project Maths, Phase 1Paper 2 – Higher Level
Question 2 (25 marks) (a) Explain what is meant by random selection.
(b) A survey was carried out on 2500 randomly selected members of the population eligible to vote. 1650 of those surveyed said they would support the government in a General Election.
(i) At the 95% confidence level, find the margin of error.
(ii) Hence, find the confidence interval for the section of the population who would support
the government.
(iii) A month later another survey was carried out among 2250 voters and it was found that
1395 would support the government in the same election. At the 95% confidence level for this survey, would you accept that there is no change in support for the government?

2012 L.20 5/20
Page 5 of 19
Project Maths, Phase 1Paper 2 – Higher Level
Question 3 (25 marks) (a) Write down the centre and radius of the circle x2 y2 6y 16 0
and show that the point C(7, 4) lies outside the circle.
(b) The line CD touches the circle at the point D. Find | CD |.
(c) Find the possible equations of CD.
page running

2012 L.20 6/20
Page 6 of 19
Project Maths, Phase 1Paper 2 – Higher Level
Question 4 (25 marks) (a) Write down the slope of the line k in the given diagram. Hence, find the equation of k in the form ax by c 0.
(b) Find the equations of the two lines through the point (1, -1) which make an angle of 45 with k.
2
1
2
3
4
5
3 4 5
x
y
1�1
k
�1

2012 L.20 7/20
Page 7 of 19
Project Maths, Phase 1Paper 2 – Higher Level
Question 5 (25 marks) (a) On the diagram below, sketch the graphs of the functions f : x 2sin x and g : x sin 2x
in the domain 0 ≤ x ≤ 2, x ℝ. Indicate clearly which is f and which is g.
(b) From your graph, state the range of values of x for which sin 2x 2sin x.
(c) PQR is a triangle with | PR | 3 3 cm, | QR | 3 2 cm and | RPQ | 45. Find two possible values for | PQR |.
page running
0 � ��
x
y
2
�
2
3�
2012 L.20 8/20
Page 8 of 19
Project Maths, Phase 1Paper 2 – Higher Level
Question 6 (25 marks)
Answer either 6A or 6B.
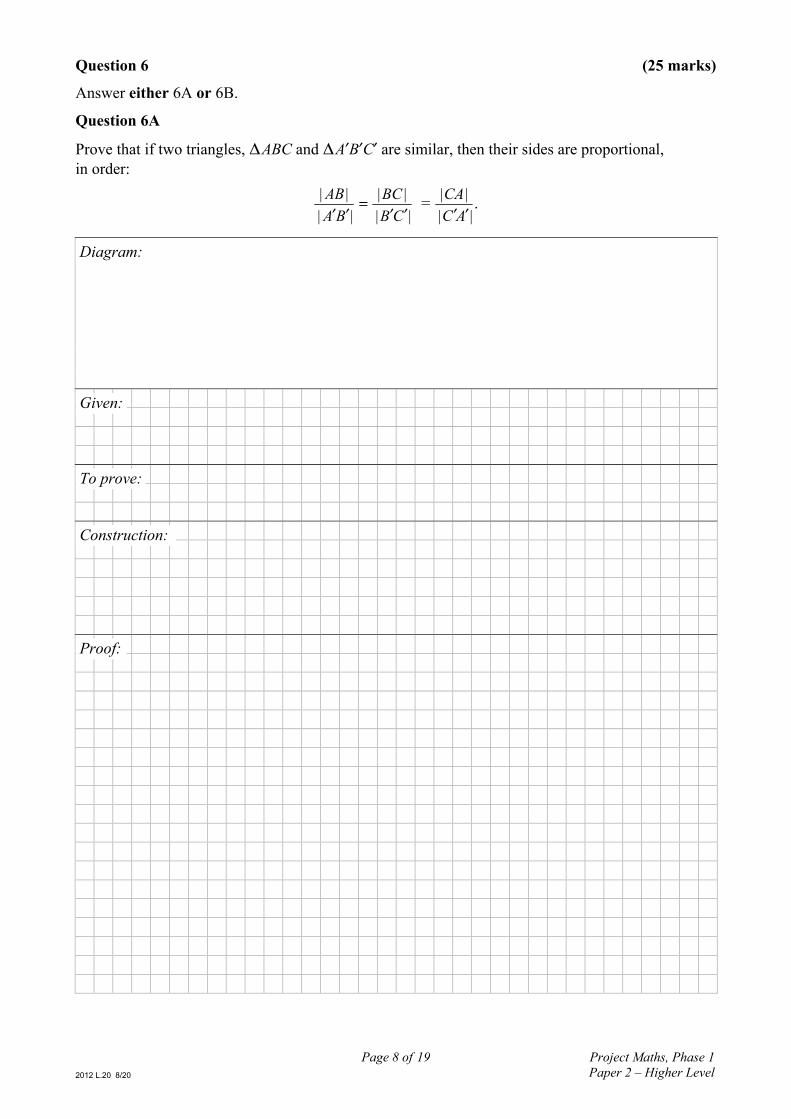
Question 6A
Prove that if two triangles, ABC and ABC are similar, then their sides are proportional, in order:
||
||
BA
AB
||
||
CB
BC
= ||
||
AC
CA
.
Diagram:
Given:
To prove:
Proof:
Construction:

2012 L.20 9/20
Page 9 of 19
Project Maths, Phase 1Paper 2 – Higher Level
OR
Question 6B
(a) P, Q and R are three villages. The distance from P to Q is 32·5 km, from Q to R is 30 km and from P to R is 20 km.
(i) Using the scale 1 cm 2·5 km, construct a triangle PQR to represent this information.
(ii) A new school is to be built equidistant from each of the three villages.
Indicate the location of the new school on your diagram. Show all construction lines clearly.
(b) ABC is a triangle with | AB | 29 cm, | BC | 21 cm and | AC | 20 cm.
Find the area of the triangle ABC and hence, find the radius of its incircle.
page running
A B
C
2012 L.20 10/20
Page 10 of 19
Project Maths, Phase 1Paper 2 – Higher Level
Section B Contexts and Applications 150 marks
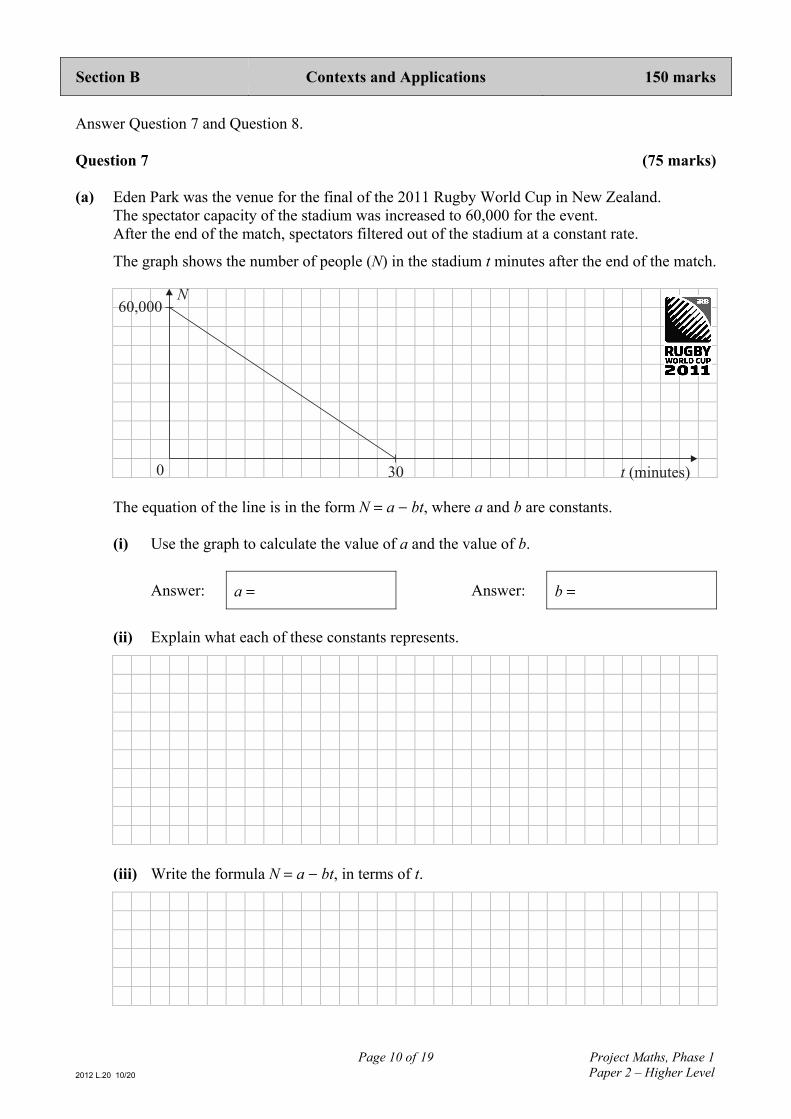
Answer Question 7 and Question 8. Question 7 (75 marks) (a) Eden Park was the venue for the final of the 2011 Rugby World Cup in New Zealand.
The spectator capacity of the stadium was increased to 60,000 for the event. After the end of the match, spectators filtered out of the stadium at a constant rate.
The graph shows the number of people (N) in the stadium t minutes after the end of the match.
The equation of the line is in the form N a bt, where a and b are constants. (i) Use the graph to calculate the value of a and the value of b.
Answer: a Answer: b
(ii) Explain what each of these constants represents.
(iii) Write the formula N a bt, in terms of t.
30 t (minutes)
N60,000
0

2012 L.20 11/20
Page 11 of 19
Project Maths, Phase 1Paper 2 – Higher Level
(iv) How long did it take 10 000 people to leave the stadium?
(v) Half of the stadium exits were closed 15 minutes after the end of the match,
reducing the rate at which people could leave. On the graph above, draw another graph of N against t to represent this new circumstance.
(b) A teacher brought his Maths class to see a recent rugby match.
After the match, the teacher set his students the task of finding out the width and height of the goalposts using a clinometer. Due to restricted access to the pitch, all measurements were taken from a particular point P.
A groundskeeper measured the distances from P to the foot of each of the goalposts, as shown in the diagram.
(i) Given that the angle between P and the two goalposts is 293, calculate the width between the goalposts, correct to one decimal place.
page running
10 m
P
6 m
29 3� �

2012 L.20 12/20
Page 12 of 19
Project Maths, Phase 1Paper 2 – Higher Level
(ii) Students measured the angle of elevation from P to the top of one of the goalposts, as shown in the diagram, to be 577.
Calculate the height of the goalposts, correct to one decimal place.
(iii) Find the angle of elevation from P to the top of the second goalpost.
Give your answer correct to one decimal place.

2012 L.20 13/20
Page 13 of 19
Project Maths, Phase 1Paper 2 – Higher Level
(c) There are five rugby matches on each week for the duration of an 18-week season.
Seán takes part in a competition in which he attempts to select the winning team in each of the scheduled matches. He is awarded one point if he picks more than half of the winning teams in each week’s matches.
The probability that Seán correctly picks the winning team in any given match is 3
2.
(i) Calculate the probability that Seán is awarded one point in any particular week, correct to four decimal places.
(ii) Hence, find the probability that Seán is awarded one point every week of the season.
Give your answer correct to four decimal places.
(iii) Find the probability that Seán is awarded no more than 16 points during the season.
Give your answer correct to four decimal places.
page running

2012 L.20 14/20
Page 14 of 19
Project Maths, Phase 1Paper 2 – Higher Level
Question 8 (75 marks) (a) A school wants to find out whether students who participate in the Transition Year
Programme improved their performance in the Leaving Certificate Examination. The most recent data available to analyse is for the year group who completed their Leaving Certificate in 2007. The data is given in the table below.
Points in
Leaving Certificate % which participated in T.Y. Programme
% which did not participatein T.Y. Programme
< 150 29 71 151–300 32 68 301–450 41 59 451–600 53 47
(i) Create a suitable graphical representation of the distributions.
(ii) Comment on the distributions.

2012 L.20 15/20
Page 15 of 19
Project Maths, Phase 1Paper 2 – Higher Level
(ii) Do you think that there is evidence that participation in the Transition Year Programme impacts on students’ performance in the Leaving Certificate Examination? Justify your answer.
Answer:
Reason 1:
Reason 2:
(b) A group of Transition Year students went to Egypt on a school tour.
They visited the Great Pyramid of Giza on the banks of the River Nile. Each student was asked to estimate the height of the pyramid.
The mean estimated height was 135 m and standard deviation 15 m. (i) A student was selected at random from the group.
Find the probability that the student’s estimate was less than or equal to 145 m.
page running
2012 L.20 16/20
Page 16 of 19
Project Maths, Phase 1Paper 2 – Higher Level
(ii) 85% of the estimates were less than or equal to a certain height. Find that height.
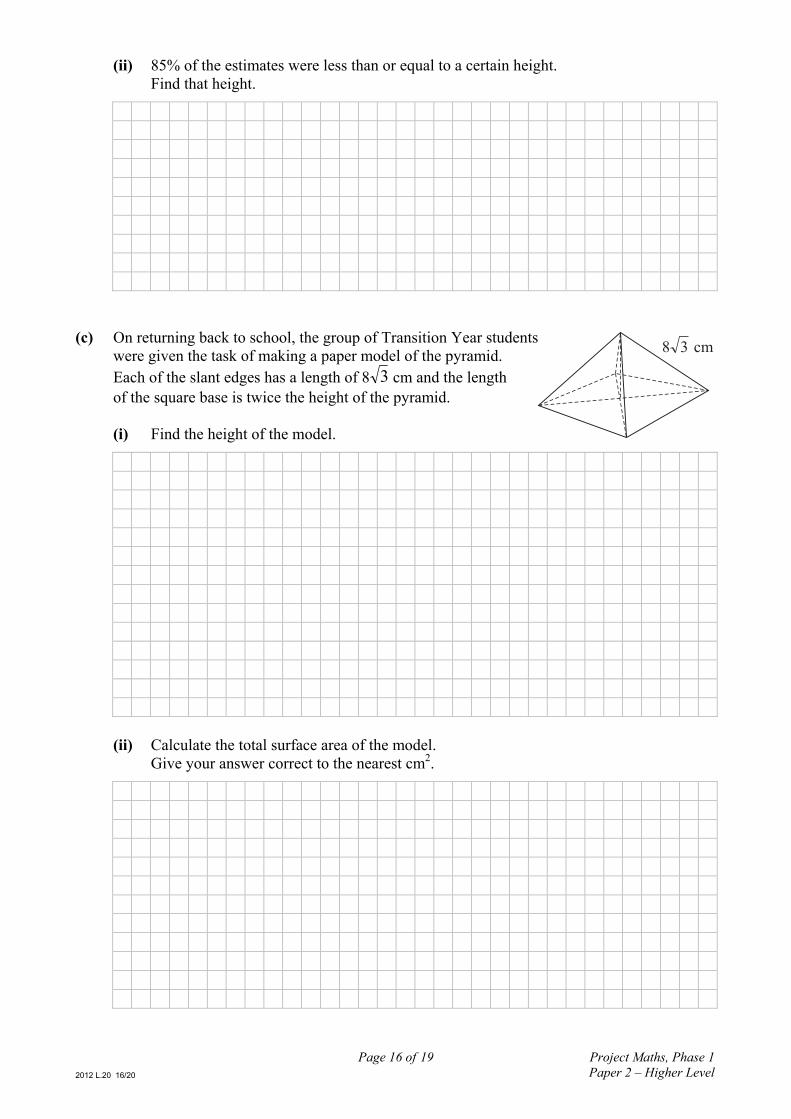
(c) On returning back to school, the group of Transition Year students
were given the task of making a paper model of the pyramid. Each of the slant edges has a length of 8 3 cm and the length of the square base is twice the height of the pyramid.
(i) Find the height of the model.
(ii) Calculate the total surface area of the model. Give your answer correct to the nearest cm2.
cm38

2012 L.20 17/20
Page 17 of 19
Project Maths, Phase 1Paper 2 – Higher Level
You may use this page for extra work.
page running

2012 L.20 18/20
Page 18 of 19
Project Maths, Phase 1Paper 2 – Higher Level
You may use this page for extra work.

2012 L.20 19/20
Page 19 of 19
Project Maths, Phase 1Paper 2 – Higher Level
You may use this page for extra work.
page running

2012 L.20 20/20
Page 20 of 19
Project Maths, Phase 1Paper 2 – Higher Level
Pre-Leaving Certificate 2012 – Higher Level
Mathematics (Project Maths – Phase 1) – Paper 2 Time: 2 hours, 30 minutes
Related Documents