101 Edexcel GCSE Mathematics (Linear) – 1MA0 SIMULTANEOUS EQUATIONS WITH A QUADRATIC Materials required for examination Items included with question papers Ruler graduated in centimetres and Nil millimetres, protractor, compasses, pen, HB pencil, eraser. Tracing paper may be used. Instructions Use black ink or ball-point pen. Fill in the boxes at the top of this page with your name, centre number and candidate number. Answer all questions. Answer the questions in the spaces provided – there may be more space than you need. Calculators may be used. Information The marks for each question are shown in brackets – use this as a guide as to how much time to spend on each question. Questions labelled with an asterisk (*) are ones where the quality of your written communication will be assessed – you should take particular care on these questions with your spelling, punctuation and grammar, as well as the clarity of expression. Advice Read each question carefully before you start to answer it. Keep an eye on the time. Try to answer every question. Check your answers if you have time at the end. 832

Welcome message from author
This document is posted to help you gain knowledge. Please leave a comment to let me know what you think about it! Share it to your friends and learn new things together.
Transcript
101 Edexcel GCSE Mathematics (Linear) – 1MA0
SIMULTANEOUS EQUATIONS WITH A QUADRATICMaterials required for examination Items included with question papers Ruler graduated in centimetres and Nil
millimetres, protractor, compasses,
pen, HB pencil, eraser.
Tracing paper may be used.
Instructions
Use black ink or ball-point pen.
Fill in the boxes at the top of this page with your name, centre number and candidate number.
Answer all questions.
Answer the questions in the spaces provided – there may be more space than you need.
Calculators may be used.
Information
The marks for each question are shown in brackets – use this as a guide as to how much time to
spend on each question.
Questions labelled with an asterisk (*) are ones where the quality of your written communication
will be assessed – you should take particular care on these questions with your spelling, punctuation
and grammar, as well as the clarity of expression.
Advice
Read each question carefully before you start to answer it.
Keep an eye on the time.
Try to answer every question.
Check your answers if you have time at the end.
832

1. Solve the simultaneous equations
x2 + y2 = 29
y – x = 3
………………………………………………………
(Total 7 marks)
833

2. Bill said that the line y = 6 cuts the curve x2 + y2 = 25 at two points.
(a) By eliminating y show that Bill is incorrect.
(2)
(b) By eliminating y, find the solutions to the simultaneous equations
x2 + y2 = 25
y = 2x – 2
x = ........................ y = ...................
or x = ........................ y = ...................
(6) (Total 8 marks)
834

3. By eliminating y, find the solutions to the simultaneous equations
x2 + y2 = 25
y = x – 7
x = .............................. y = ..............................
or x = .............................. y = ..............................
(Total 6 marks)
835

4. By eliminating y, find the solutions to the simultaneous equations
y – 2x = 3
x2 + y2 = 18
x =……………………. y =…………………….
or x =……………………. y =…………………….
(Total 7 marks)
836
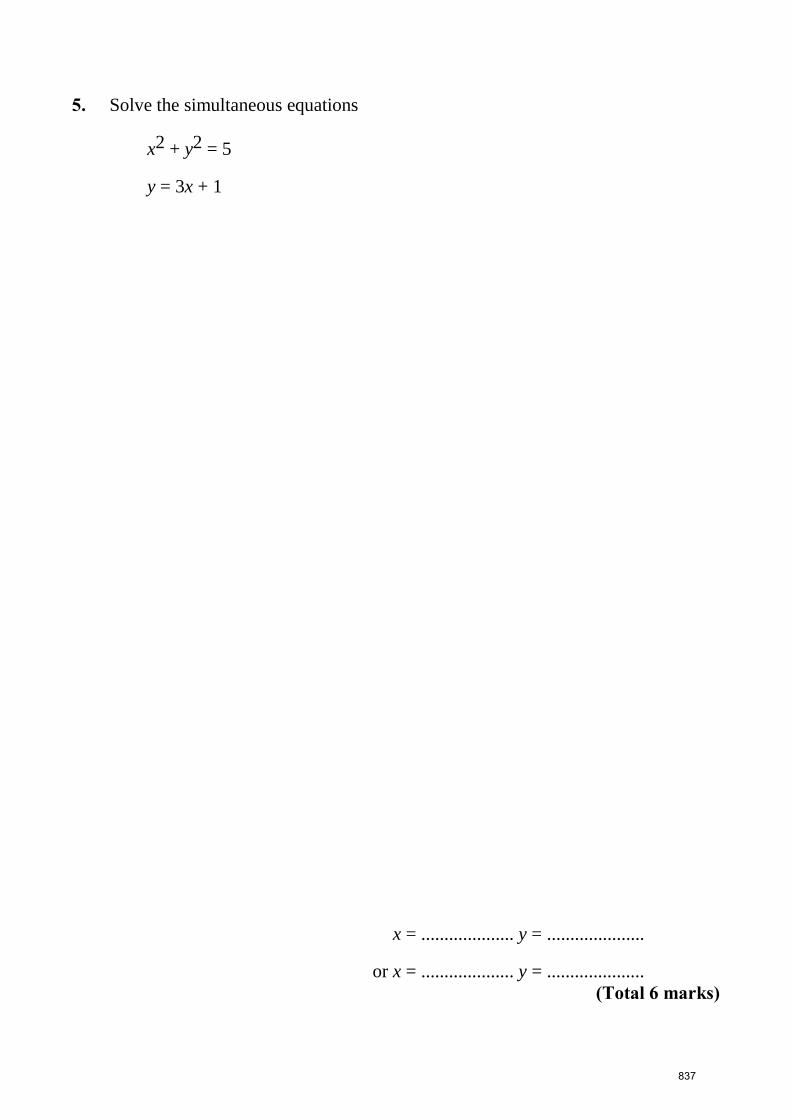
5. Solve the simultaneous equations
x2 + y2 = 5
y = 3x + 1
x = .................... y = .....................
or x = .................... y = .....................
(Total 6 marks)
837

6. Solve the simultaneous equations
x + y = 4
x2 + y2 = 40
x =................., y = .................
or
x =................., y = .................
(Total 7 marks)
838

7. By eliminating x, find the solutions to the simultaneous equations
x – 2y = 1
x2 + y2 = 13
x = ……….., y = ……….
or x = ……….., y = ……….
(Total 7 marks)
839

102 Edexcel GCSE Mathematics (Linear) – 1MA0
TRANSFORMATION OF GRAPHS
Materials required for examination Items included with question papers Ruler graduated in centimetres and Nil
millimetres, protractor, compasses,
pen, HB pencil, eraser.
Tracing paper may be used.
Instructions
Use black ink or ball-point pen.
Fill in the boxes at the top of this page with your name, centre number and candidate number.
Answer all questions.
Answer the questions in the spaces provided – there may be more space than you need.
Calculators may be used.
Information
The marks for each question are shown in brackets – use this as a guide as to how much time to
spend on each question.
Questions labelled with an asterisk (*) are ones where the quality of your written communication
will be assessed – you should take particular care on these questions with your spelling, punctuation
and grammar, as well as the clarity of expression.
Advice
Read each question carefully before you start to answer it.
Keep an eye on the time.
Try to answer every question.
Check your answers if you have time at the end.
840

1. The graph of y = f(x) is shown on the grids.
(a) On this grid, sketch the graph of y = f(x) + 2
(2)
(b) On this grid, sketch the graph of y = – f(x)
(2)
(4 marks)
841

2.
The diagram shows part of the curve with equation y = f(x).
The coordinates of the maximum point of this curve are (2, 3).
Write down the coordinates of the maximum point of the curve with equation
(a) y = f(x – 2)
(......... , ..........)
(1)
(b) y = 2f(x)
(......... , ..........)
(1)
(2 marks)
3.
The curve with equation y = f(x) is translated so that the point at (0, 0) is mapped onto
the point (4, 0).
Find an equation of the translated curve.
.....................................
(2 marks)
y = f(x)
y
xO
(2, 3)
y
y = f(x)
2 4 6–2 O x
842

4. The graph of y = f(x) is shown on the grids.
(a) On this grid, sketch the graph of y = f(x) – 4
(2)
(b) On this grid, sketch the graph of y = f( x).
(2)
(4 marks)
y
2
4
6
8
10
12
–2
–4
–6
–8
–10
–12
–14
–16
–18
2 4 6 8 10–2–4–6–8–10 O x
2
1
y
2
4
6
8
10
12
–2
–4
–6
–8
–10
–12
–14
–16
–18
2 4 6 8 10–2–4–6–8–10 O x
843
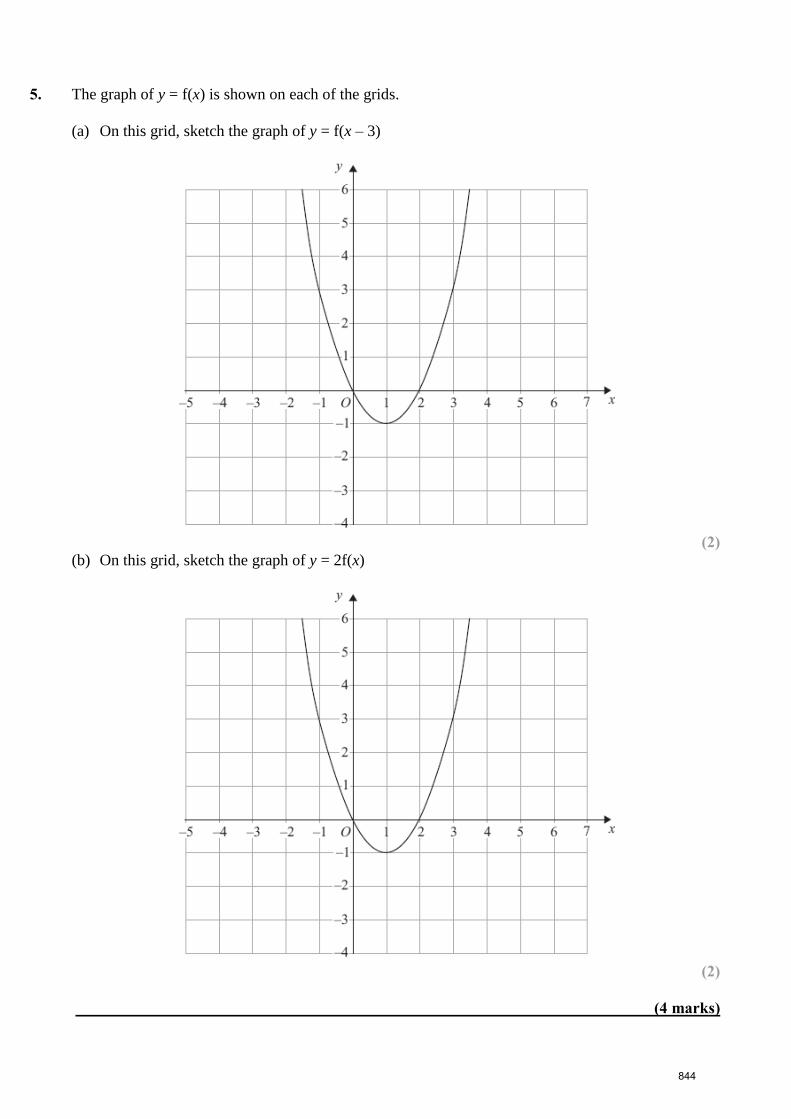
5. The graph of y = f(x) is shown on each of the grids.
(a) On this grid, sketch the graph of y = f(x – 3)
(2)
(b) On this grid, sketch the graph of y = 2f(x)
(2)
(4 marks)
844

6. y = f(x)
The graph of y = f(x) is shown on the grid.
(a) On the grid above, sketch the graph of y = –f(x).
(2)
The graph of y = f(x) is shown on the grid.
The graph G is a translation of the graph of y = f(x).
(b) Write down the equation of graph G.
....................................................................
(2)
(4 marks)
845

7.
The diagram shows part of the curve with equation y = f(x).
The coordinates of the minimum point of this curve are (3, 1).
Write down the coordinates of the minimum point of the curve with equation
(a) y = f(x) + 3
(1)
(…………, …………)
(b) y = f(x – 2)
(1)
(…………, …………)
(c) y = f x21
(1)
(…………, …………)
(3 marks) 8.
The curve with equation y = f(x) is translated so that the point at (0, 0) is mapped onto the point (4,
0).
Find an equation of the translated curve.
.....................................
(2 marks)
846

9. This is a sketch of the curve with the equation y = f(x).
The only minimum point of the curve is at P(3, –4).
(a) Write down the coordinates of the minimum point of the curve with the equation
y = f(x – 2).
(............ , ............)
(2)
(b) Write down the coordinates of the minimum point of the curve with the equation
y = f(x + 5) + 6
(............ , ............)
(2)
(4 marks)
847

103 Edexcel GCSE Mathematics (Linear) – 1MA0
ENLARGEMENT: NEGATIVE SCALE FACTOR
Materials required for examination Items included with question papers Ruler graduated in centimetres and Nil
millimetres, protractor, compasses,
pen, HB pencil, eraser.
Tracing paper may be used.
Instructions
Use black ink or ball-point pen.
Fill in the boxes at the top of this page with your name, centre number and candidate number.
Answer all questions.
Answer the questions in the spaces provided – there may be more space than you need.
Calculators may be used.
Information
The marks for each question are shown in brackets – use this as a guide as to how much time to
spend on each question.
Questions labelled with an asterisk (*) are ones where the quality of your written communication
will be assessed – you should take particular care on these questions with your spelling, punctuation
and grammar, as well as the clarity of expression.
Advice
Read each question carefully before you start to answer it.
Keep an eye on the time.
Try to answer every question.
Check your answers if you have time at the end.
848

1.
Enlarge the shaded triangle by a scale factor 1 , centre P.
(Total 3 marks)
3
2
1
–1
–2
–3
–4
–5
–4 –3 –2 –1 1 2 3 4 5x
y
O
P×
2
1
849

2.
Enlarge triangle A by scale factor –1 , centre O.
(Total 3 marks)
5
4
3
2
1
–1
–2
–3
–4
–5
5 6 74321–1–2–3–4–5
A
Ox
y
2
1
850
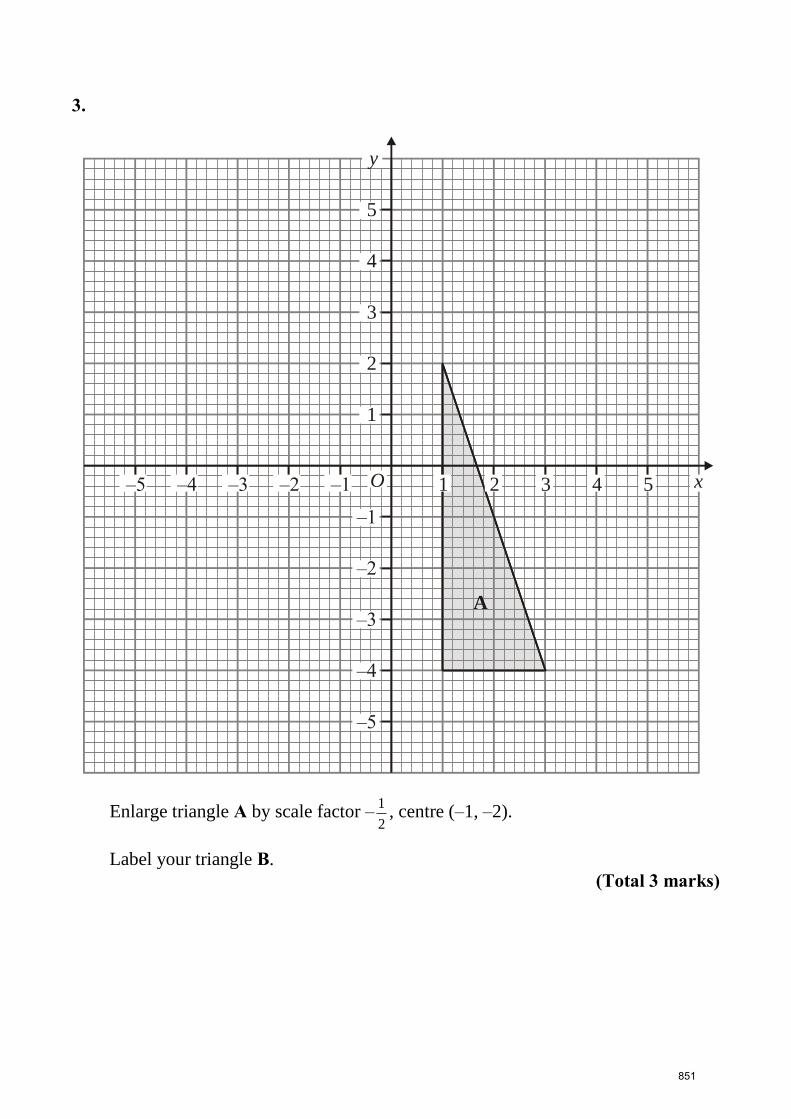
3.
Enlarge triangle A by scale factor – , centre (–1, –2).
Label your triangle B.
(Total 3 marks)
–5 –4 –3 –2 –1 3 4 5
5
4
3
2
1
–1
–2
–3
–4
–5
O x
y
A
1 2
2
1
851
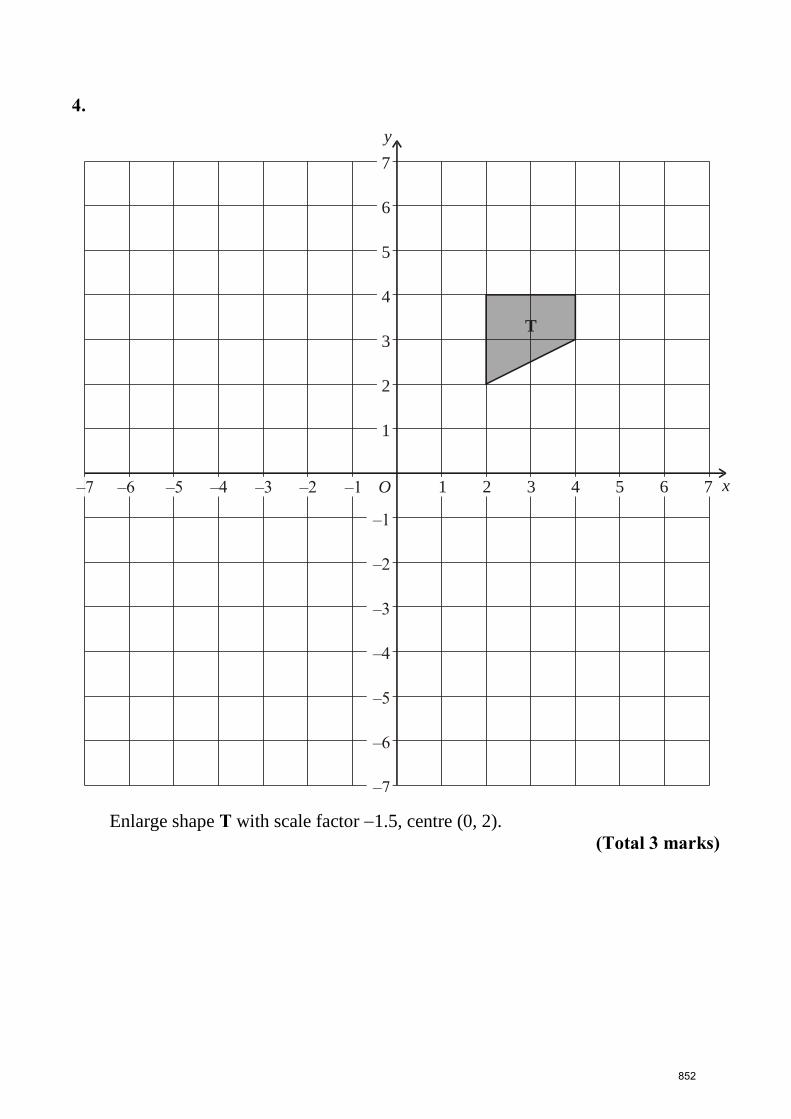
4.
Enlarge shape T with scale factor 1.5, centre (0, 2).
(Total 3 marks)
x
y
–2–3–4–5–6–7 –1 1 2 3 4 5 6 7
7
6
5
4
3
2
1
–1
–2
–3
–4
–5
–6
–7
O
T
852

5.
Enlarge the triangle by a scale factor of , centre O
(Total 2 marks)
y
xO
2
1–
853

6. The triangle ABC is to be enlarged, using E as the centre, to give the triangle
PQR. The line PQ is the image of the line BA.
(a) Write down the scale factor of the enlargement.
…………………………
(1)
(b) Complete the triangle PQR.
(1) (Total 2 marks)
A B
C
E
P Q
854

7.
Enlarge triangle T, scale factor –2, centre O.
(Total 2 marks)
y
xO
T
855
104 Edexcel GCSE Mathematics (Linear) – 1MA0
SINE AND COSINE RULES & AREA OF TRIANGLES
Materials required for examination Items included with question papers Ruler graduated in centimetres and Nil
millimetres, protractor, compasses,
pen, HB pencil, eraser.
Tracing paper may be used.
Instructions
Use black ink or ball-point pen.
Fill in the boxes at the top of this page with your name, centre number and candidate number.
Answer all questions.
Answer the questions in the spaces provided – there may be more space than you need.
Calculators may be used.
Information
The marks for each question are shown in brackets – use this as a guide as to how much time to
spend on each question.
Questions labelled with an asterisk (*) are ones where the quality of your written communication
will be assessed – you should take particular care on these questions with your spelling, punctuation
and grammar, as well as the clarity of expression.
Advice
Read each question carefully before you start to answer it.
Keep an eye on the time.
Try to answer every question.
Check your answers if you have time at the end.
856

1.
AB = 11.7 m.
BC = 28.3 m.
Angle ABC = 670.
(a) Calculate the area of the triangle ABC.
Give your answer correct to 3 significant figures.
…………………………. m2
(2)
(b) Calculate the length of AC.
Give your answer correct to 3 significant figures.
…………………………. m
(3) (Total 5 marks)
Diagram accurately drawn
NOT
67°
11.7 m
28.3 m
A
B C
857

2.
In triangle ABC,
AC = 7 cm,
BC = 10 cm,
angle ACB = 73°.
Calculate the length of AB.
Give your answer correct to 3 significant figures.
……………………. cm
(Total 4 marks)
A B
C
7 cm10 cm
73°
Diagram accurately drawn
NOT
858

3.
ABC is a triangle.
AB = 8 cm
BC = 14 cm
Angle ABC = 106
Calculate the area of the triangle.
Give your answer correct to 3 significant figures.
………………..cm2
(Total 3 marks)
859

4.
Diagram NOT accurately drawn
The lengths of the sides of a triangle are 4.2 cm, 5.3 cm and 7.6 cm.
(a) Calculate the size of the largest angle of the triangle.
Give your answer correct to 1 decimal place.
....................................°
(3)
(b) Calculate the area of the triangle.
Give your answer correct to 3 significant figures.
............................... cm2
(3) (Total 6 marks)
860

5.
Diagram NOT accurately drawn
In triangle ABC,
AC = 8 cm,
BC =15 cm,
Angle ACB = 70°.
(a) Calculate the length of AB.
Give your answer correct to 3 significant figures.
................................ cm
(3)
(b) Calculate the size of angle BAC.
Give your answer correct to 1 decimal place.
...................................°
(2) (Total 5 marks)
B
A
C
8 cm
15 cm
70º
861
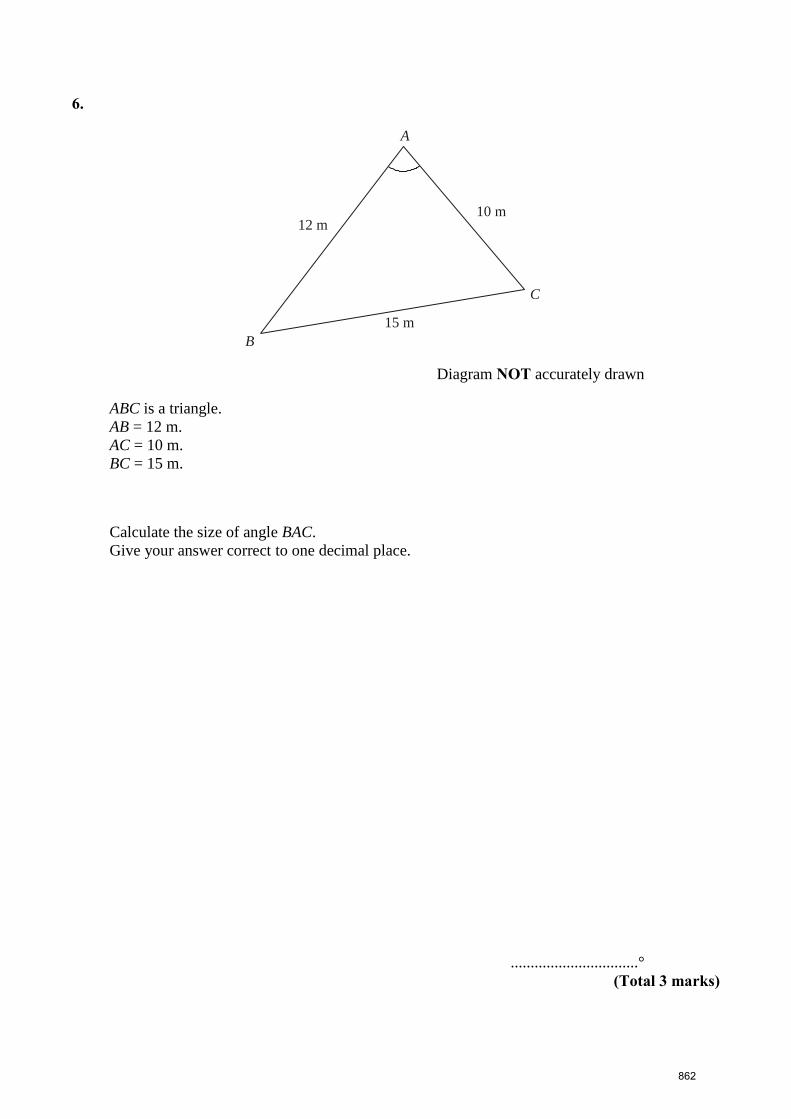
6.
Diagram NOT accurately drawn
ABC is a triangle.
AB = 12 m.
AC = 10 m.
BC = 15 m.
Calculate the size of angle BAC.
Give your answer correct to one decimal place.
................................° (Total 3 marks)
A
C
B
10 m12 m
15 m
862

7.
AB = 3.2 cm
BC = 8.4 cm
The area of triangle ABC is 10 cm2.
Calculate the perimeter of triangle ABC.
Give your answer correct to three significant figures.
..................... cm
(Total 6 marks)
3.2 cm
A
B C8.4 cm
Diagram accurately drawn
NOT
863

105 Edexcel GCSE Mathematics (Linear) – 1MA0
3D PYTHAGORAS Materials required for examination Items included with question papers Ruler graduated in centimetres and Nil
millimetres, protractor, compasses,
pen, HB pencil, eraser.
Tracing paper may be used.
Instructions
Use black ink or ball-point pen.
Fill in the boxes at the top of this page with your name, centre number and candidate number.
Answer all questions.
Answer the questions in the spaces provided – there may be more space than you need.
Calculators may be used.
Information
The marks for each question are shown in brackets – use this as a guide as to how much time to
spend on each question.
Questions labelled with an asterisk (*) are ones where the quality of your written communication
will be assessed – you should take particular care on these questions with your spelling, punctuation
and grammar, as well as the clarity of expression.
Advice
Read each question carefully before you start to answer it.
Keep an eye on the time.
Try to answer every question.
Check your answers if you have time at the end.
864

1.
The diagram represents a cuboid ABCDEFGH.
AB = 5 cm.
BC = 7 cm.
AE = 3 cm.
Calculate the length of AG.
Give your answer correct to 3 significant figures.
...................................... cm
(3)
A
B
CD
EF
G
H
3 cm
5 cm7 cm
Diagram accurately drawn
NOT
865
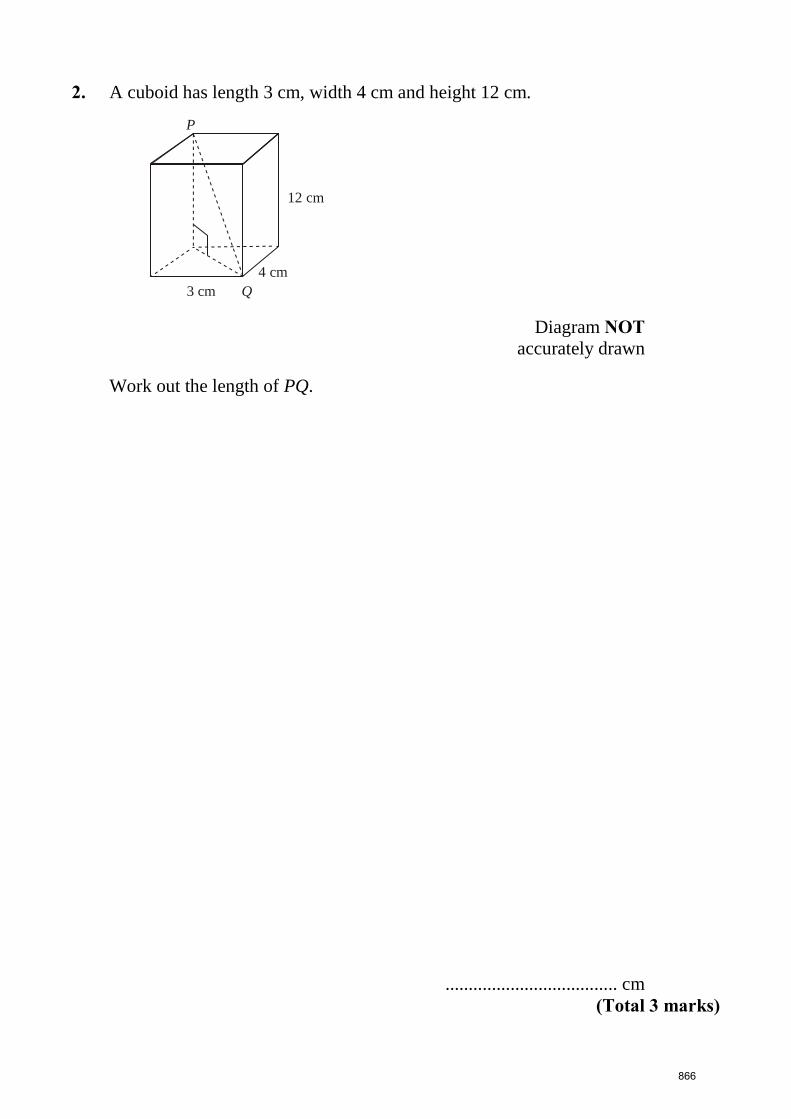
2. A cuboid has length 3 cm, width 4 cm and height 12 cm.
Diagram NOT accurately drawn
Work out the length of PQ.
..................................... cm
(Total 3 marks)
P
12 cm
Q
4 cm
3 cm
866
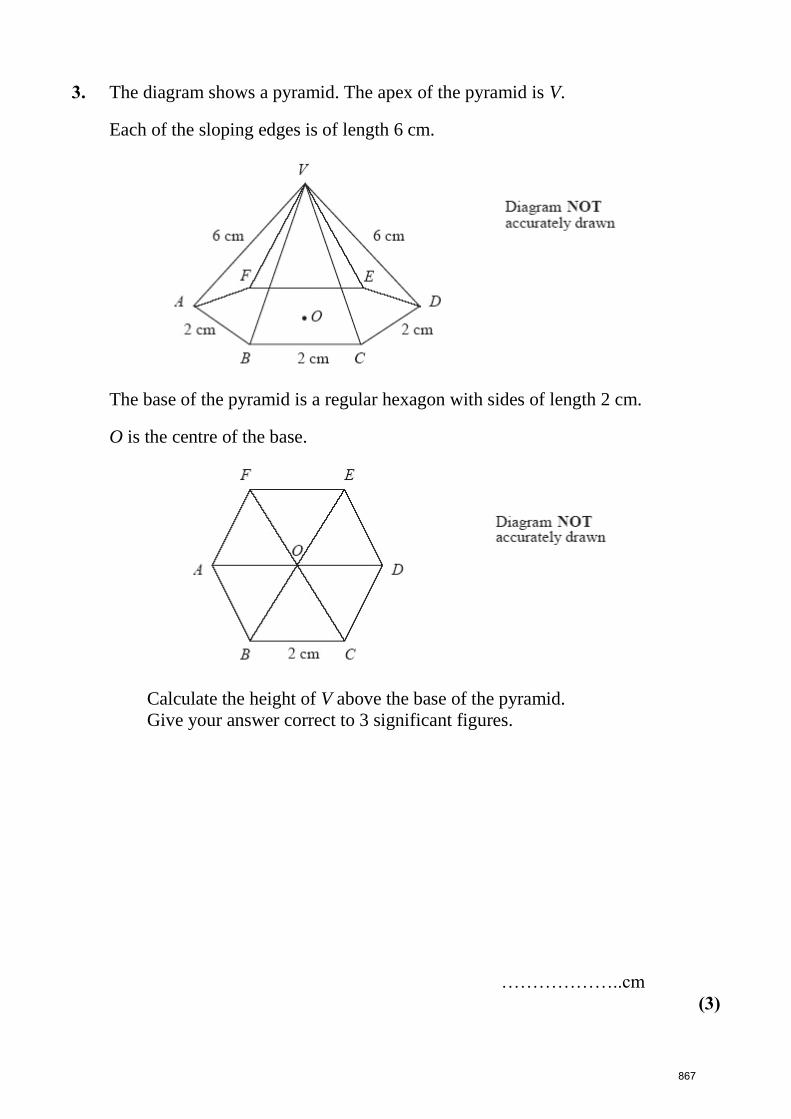
3. The diagram shows a pyramid. The apex of the pyramid is V.
Each of the sloping edges is of length 6 cm.
The base of the pyramid is a regular hexagon with sides of length 2 cm.
O is the centre of the base.
Calculate the height of V above the base of the pyramid.
Give your answer correct to 3 significant figures.
………………..cm
(3)
867
106 Edexcel GCSE Mathematics (Linear) – 1MA0
SPHERES AND CONES Materials required for examination Items included with question papers Ruler graduated in centimetres and Nil
millimetres, protractor, compasses,
pen, HB pencil, eraser.
Tracing paper may be used.
Instructions
Use black ink or ball-point pen.
Fill in the boxes at the top of this page with your name, centre number and candidate number.
Answer all questions.
Answer the questions in the spaces provided – there may be more space than you need.
Calculators may be used.
Information
The marks for each question are shown in brackets – use this as a guide as to how much time to
spend on each question.
Questions labelled with an asterisk (*) are ones where the quality of your written communication
will be assessed – you should take particular care on these questions with your spelling, punctuation
and grammar, as well as the clarity of expression.
Advice
Read each question carefully before you start to answer it.
Keep an eye on the time.
Try to answer every question.
Check your answers if you have time at the end.
868
1.
Diagram NOT accurately drawn
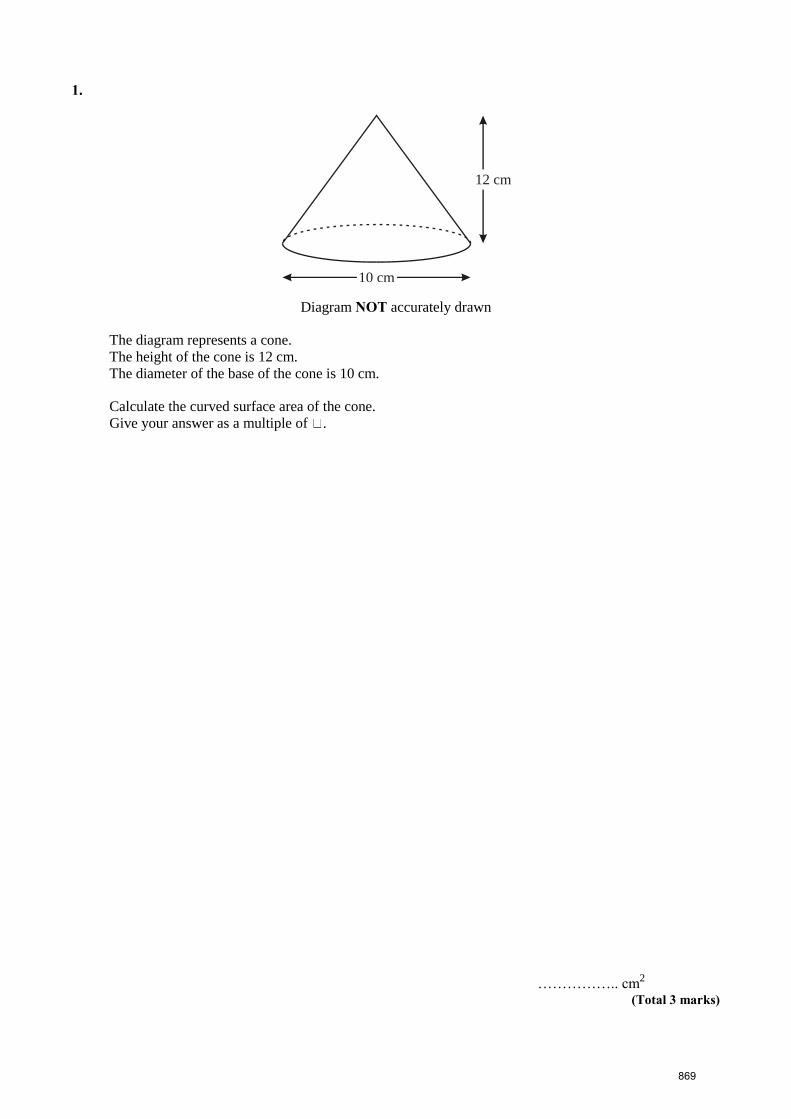
The diagram represents a cone.
The height of the cone is 12 cm.
The diameter of the base of the cone is 10 cm.
Calculate the curved surface area of the cone.
Give your answer as a multiple of .
…………….. cm2
(Total 3 marks)
12 cm
10 cm
869

2.
Diagram NOT accurately drawn
The radius of the base of a cone is 5.7 cm.
Its slant height is 12.6 cm.
Calculate the volume of the cone.
Give your answer correct to 3 significant figures.
…………………….. cm3
(Total 4 marks)
12.6 cm
5.7 cm
870
3.
Diagram NOT
accurately drawn
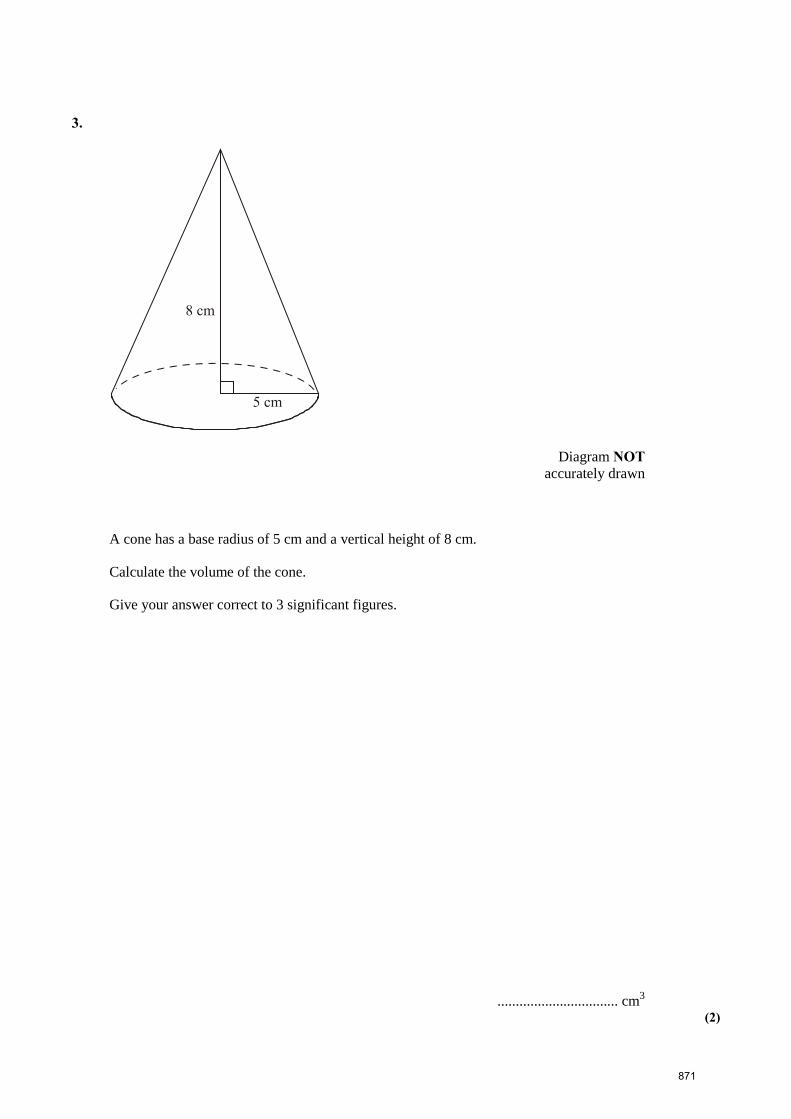
A cone has a base radius of 5 cm and a vertical height of 8 cm.
Calculate the volume of the cone.
Give your answer correct to 3 significant figures.
................................. cm3
(2)
871

4. The diagram shows a child’s toy.
Diagram NOT accurately drawn
The toy is made from a cone on top of a hemisphere.
The cone and hemisphere each have radius 7 cm.
The total height of the toy is 22 cm.
Work out the volume of the toy.
Give your answer correct to 3 significant figures.
............................................................... cm3
(Total 3 marks)
872

5. The diagram shows a solid hemisphere of radius 8 cm.
Work out the total surface area of the hemisphere.
Give your answer correct to 3 significant figures.
............................. cm2
(Total 3 marks)
873
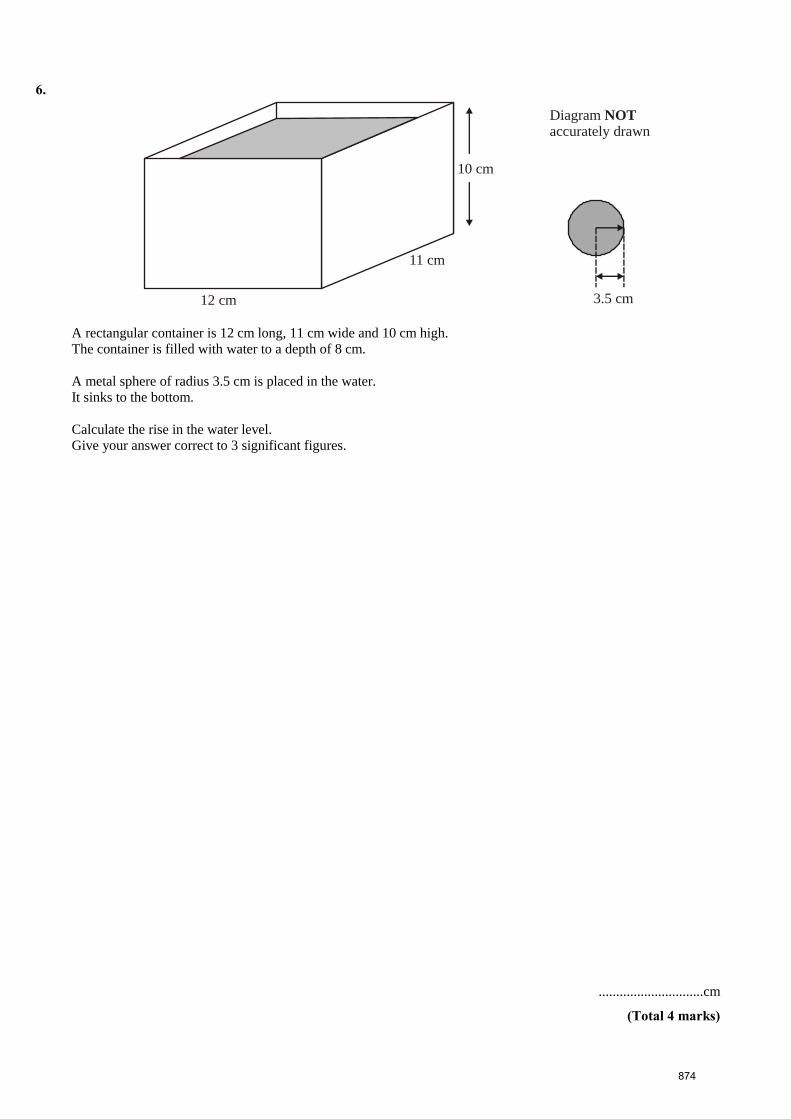
6.
A rectangular container is 12 cm long, 11 cm wide and 10 cm high.
The container is filled with water to a depth of 8 cm.
A metal sphere of radius 3.5 cm is placed in the water.
It sinks to the bottom.
Calculate the rise in the water level.
Give your answer correct to 3 significant figures.
..............................cm
(Total 4 marks)
12 cm
11 cm
3.5 cm
10 cm
Diagram accurately drawn
NOT
874
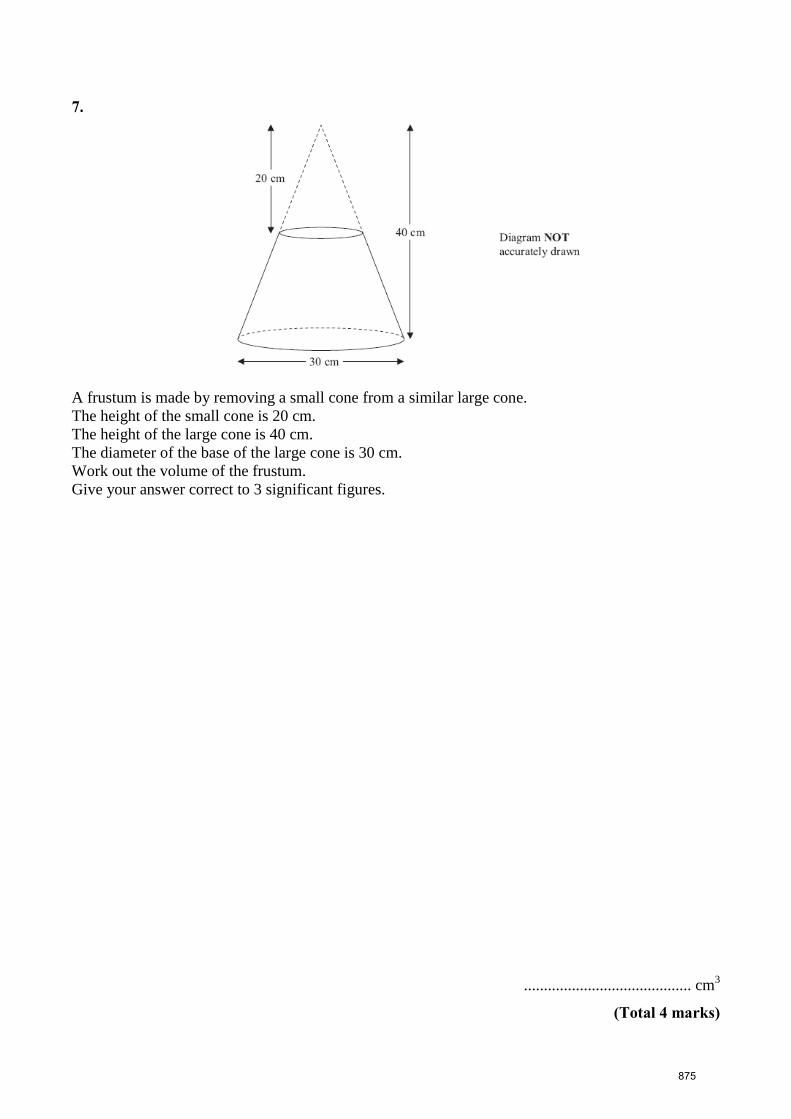
7.
A frustum is made by removing a small cone from a similar large cone.
The height of the small cone is 20 cm.
The height of the large cone is 40 cm.
The diameter of the base of the large cone is 30 cm.
Work out the volume of the frustum.
Give your answer correct to 3 significant figures.
.......................................... cm3
(Total 4 marks)
875

107 Edexcel GCSE Mathematics (Linear) – 1MA0
AREA OF SECTOR AND LENGTH OF ARCS Materials required for examination Items included with question papers Ruler graduated in centimetres and Nil
millimetres, protractor, compasses,
pen, HB pencil, eraser.
Tracing paper may be used.
Instructions
Use black ink or ball-point pen.
Fill in the boxes at the top of this page with your name, centre number and candidate number.
Answer all questions.
Answer the questions in the spaces provided – there may be more space than you need.
Calculators may be used.
Information
The marks for each question are shown in brackets – use this as a guide as to how much time to
spend on each question.
Questions labelled with an asterisk (*) are ones where the quality of your written communication
will be assessed – you should take particular care on these questions with your spelling, punctuation
and grammar, as well as the clarity of expression.
Advice
Read each question carefully before you start to answer it.
Keep an eye on the time.
Try to answer every question.
Check your answers if you have time at the end.
876
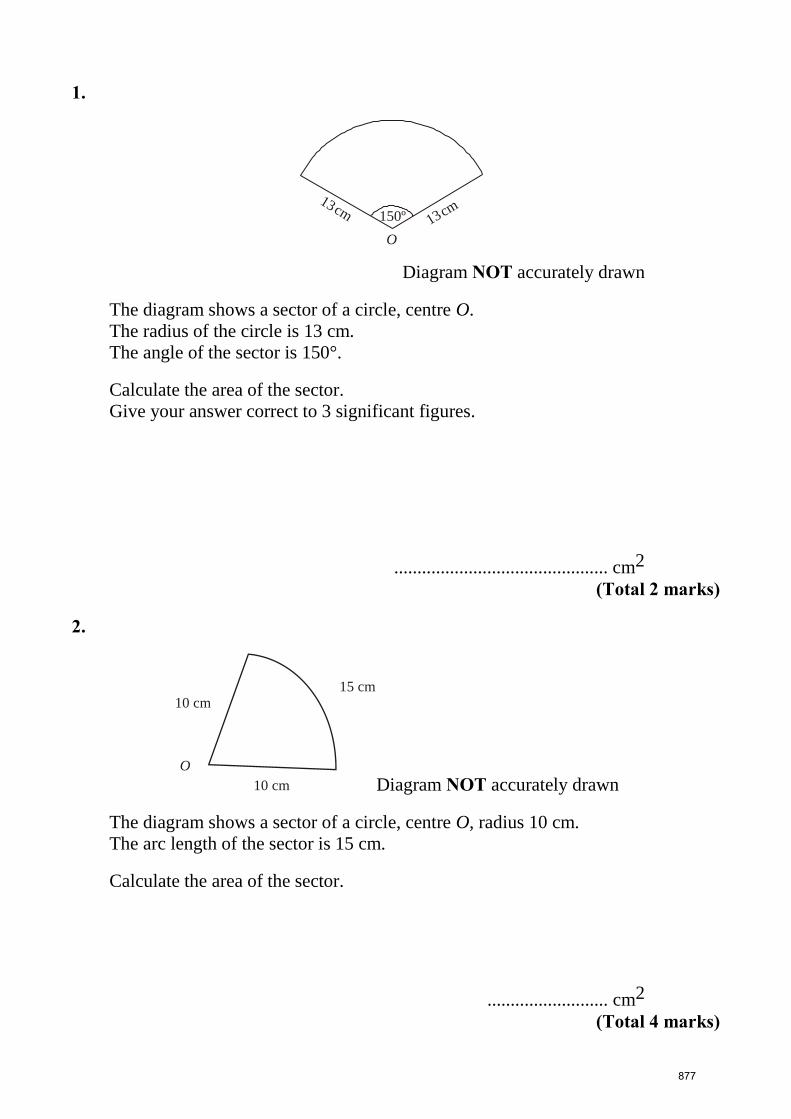
1.
Diagram NOT accurately drawn
The diagram shows a sector of a circle, centre O.
The radius of the circle is 13 cm.
The angle of the sector is 150°.
Calculate the area of the sector.
Give your answer correct to 3 significant figures.
.............................................. cm2
(Total 2 marks)
2.
Diagram NOT accurately drawn
The diagram shows a sector of a circle, centre O, radius 10 cm.
The arc length of the sector is 15 cm.
Calculate the area of the sector.
.......................... cm2
(Total 4 marks)
150º
O
13 cm13 cm
10 cm
10 cm
15 cm
O
877

3.
Diagram NOT accurately drawn
OAB is a sector of a circle, centre O.
Angle AOB = 60º.
OA = OB = 12 cm.
Work out the length of the arc AB.
Give your answer in terms of π.
.................................... cm
(Total 3 marks)
878

4.
Diagram NOT accurately drawn
The diagram shows a sector of a circle, centre O.
The radius of the circle is 6 cm.
Angle AOB = 120°.
Work out the perimeter of the sector.
Give your answer in terms of π in its simplest form.
............................. cm
(Total 3 marks)
B
O
A
6 cm 6 cm
120°
879
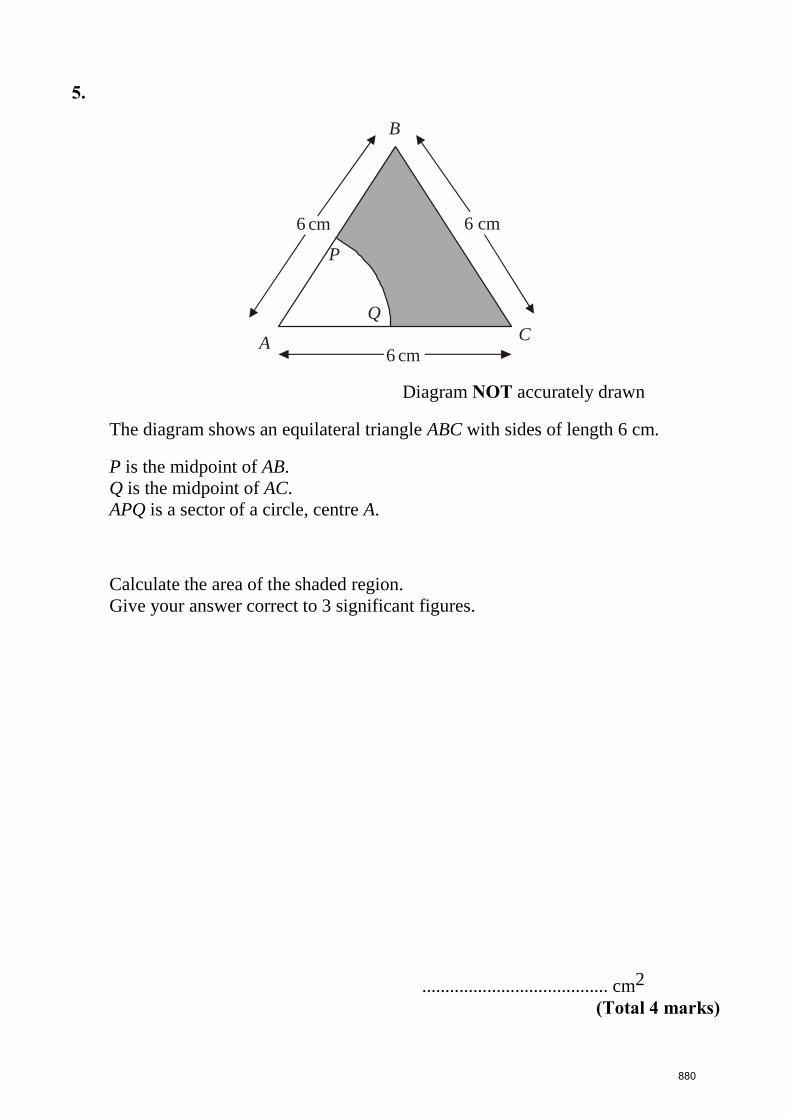
5.
Diagram NOT accurately drawn
The diagram shows an equilateral triangle ABC with sides of length 6 cm.
P is the midpoint of AB.
Q is the midpoint of AC.
APQ is a sector of a circle, centre A.
Calculate the area of the shaded region.
Give your answer correct to 3 significant figures.
........................................ cm2
(Total 4 marks)
6 cm 6 cm
Q
P
C A
B
6 cm
880

6.
Diagram NOT accurately drawn
The diagram shows a sector OABC of a circle with centre O.
OA = OC = 10.4 cm.
Angle AOC = 120°.
(a) Calculate the length of the arc ABC of the sector.
Give your answer correct to 3 significant figures.
.....................................cm
(3)
(b) Calculate the area of the shaded segment ABC.
Give your answer correct to 3 significant figures.
.....................................cm2
(4) (Total 7 marks)
A
B
C
O
10.4 cm
120°
10.4 cm
881

7. The diagram shows a sector of a circle with centre O.
The radius of the circle is 8 cm.
PRS is an arc of the circle.
PS is a chord of the circle.
Angle POS = 40°
Calculate the area of the shaded segment.
Give your answer correct to 3 significant figures.
............................. cm2
(Total 5 marks)
882

8.
ABC is an arc of a circle centre O with radius 80 m.
AC is a chord of the circle.
Angle AOC = 35°.
Calculate the area of the shaded region.
Give your answer correct to 3 significant figures.
............................... m2
(Total 5 marks)
883

108 Edexcel GCSE Mathematics (Linear) – 1MA0
VECTORS Materials required for examination Items included with question papers Ruler graduated in centimetres and Nil
millimetres, protractor, compasses,
pen, HB pencil, eraser.
Tracing paper may be used.
Instructions
Use black ink or ball-point pen.
Fill in the boxes at the top of this page with your name, centre number and candidate number.
Answer all questions.
Answer the questions in the spaces provided – there may be more space than you need.
Calculators may be used.
Information
The marks for each question are shown in brackets – use this as a guide as to how much time to
spend on each question.
Questions labelled with an asterisk (*) are ones where the quality of your written communication
will be assessed – you should take particular care on these questions with your spelling, punctuation
and grammar, as well as the clarity of expression.
Advice
Read each question carefully before you start to answer it.
Keep an eye on the time.
Try to answer every question.
Check your answers if you have time at the end.
884

1.
ABCDEF is a regular hexagon, with centre O.
OA = a , OB = b.
(a) Write the vector AB in terms of a and b.
.....................................
(1)
The line AB is extended to the point K so that AB : BK = 1 : 2
(b) Write the vector CK in terms of a and b.
Give your answer in its simplest form.
.....................................
(3)
(4 marks)
885

2.
OAB is a triangle.
OA = a OB = b
(a) Find AB in terms of a and b.
..............................................
(1)
P is the point on AB such that AP : PB = 3 : 1
(b) Find OP in terms of a and b.
Give your answer in its simplest form.
..............................................
(3)
(4 marks)
886

3.
APB is a triangle.
N is a point on AP.
AB = a AN = 2b NP = b
(a) Find the vector PB , in terms of a and b.
.....................................................
(1) B is the midpoint of AC.
M is the midpoint of PB.
*(b) Show that NMC is a straight line.
(4)
(5 marks)
887

4.
OAYB is a quadrilateral.
OA = 3a
OB = 6b
(a) Express AB in terms of a and b.
....................................................................
(1)
X is the point on AB such that AX : XB = 1 : 2
and BY = 5a – b
* (b) Prove that OX = 5
2 OY
(4)
(5 marks)
888

5.
Diagram NOT accurately drawn
PQRS is a trapezium.
PS is parallel to QR.
QR = 2PS
PQ = a PS = b
X is the point on QR such that QX : XR = 3 : 1
Express in terms of a and b.
(i) PR
(2)
......................................................
(ii) SX
(3)
......................................................
(5 marks)
889

6.
OPQ is a triangle.
R is the midpoint of OP.
S is the midpoint of PQ.
OP = p and OQ = q
(i) Find OS in terms of p and q.
OS = ..........................
(ii) Show that RS is parallel to OQ.
(5 marks)
p
q
P
Q
R S
O
Diagram accurately drawn
NOT
890

6.
OAB is a triangle.
OA = 2a
OB = 3b
(a) Find AB in terms of a and b.
AB = ............................
(1)
P is the point on AB such that AP : PB = 2 : 3
(b) Show that OP is parallel to the vector a + b.
(3)
(4 marks)
891

109 Edexcel GCSE Mathematics (Linear) – 1MA0
HISTOGRAMS Materials required for examination Items included with question papers Ruler graduated in centimetres and Nil
millimetres, protractor, compasses,
pen, HB pencil, eraser.
Tracing paper may be used.
Instructions
Use black ink or ball-point pen.
Fill in the boxes at the top of this page with your name, centre number and candidate number.
Answer all questions.
Answer the questions in the spaces provided – there may be more space than you need.
Calculators may be used.
Information
The marks for each question are shown in brackets – use this as a guide as to how much time to
spend on each question.
Questions labelled with an asterisk (*) are ones where the quality of your written communication
will be assessed – you should take particular care on these questions with your spelling, punctuation
and grammar, as well as the clarity of expression.
Advice
Read each question carefully before you start to answer it.
Keep an eye on the time.
Try to answer every question.
Check your answers if you have time at the end.
892

1. The table gives some information about the speeds, in km/h, of 100 cars.
Speed(s km/h) Frequency
60 < s 65 15
65 < s 70 25
70 < s 80 36
80 < s 100 24
(a) On the grid, draw a histogram for the information in the table.
(3)
(b) Work out an estimate for the number of cars with a speed of more than 85 km/h.
..............................................
(2)
(5 marks) ______________________________________________________________________________
893

2. The table gives information about the heights, h metres, of trees in a wood.
Height (h metres) Frequency
0 < h 2 7
2 < h 4 14
4 < h 8 18
8 < h 16 24
16 < h 20 10
Draw a histogram to show this information.
(3 marks) ______________________________________________________________________________
894

3. The histogram shows some information about the weights of a sample of apples.
Work out the proportion of apples in the sample with a weight between 140 grams and 200 grams.
..........................................
(4 marks) ___________________________________________________________________________
895

4. The table shows information about the lengths of time, t minutes, it took some students to do their
maths homework last week.
Time (t minutes) Frequency
0 < t 10 4
10 < t 15 8
15 < t 20 24
20 < t 30 16
30 < t 50 5
Draw a histogram for this information.
(Total 3 marks)
896

5. The table shows information about the total times that 35 students spent using their mobile phones
one week.
On the grid below, draw a histogram for this information.
(Total for Question 23 = 3 marks)
897

6. The incomplete table and histogram give some information about the ages of the people who live in a
village.
(a) Use the information in the histogram to complete the frequency table below.
Age (x) in years Frequency
0 < x 10 160
10 < x 25
25 < x 30
30 < x 40 100
40 < x 70 120
(2)
(b) Complete the histogram.
(2)
(Total 4 marks) ______________________________________________________________________________
Frequencydensity
0 10 20 30 40 50 60 70
Age in years
898

7. The table shows the distribution of the ages of passengers travelling on a plane from London
to Belfast.
Age (x years) Frequency
0 < x 20 28
20 < x 35 36
35 < x 45 20
45 < x 65 30
On the grid below, draw a histogram to show this distribution.
(Total 3 marks)
______________________________________________ _____________________________
0 10 20 30 40 50 60 70
Age ( years)x
899
110 Edexcel GCSE Mathematics (Linear) – 1MA0
STRATIFIED SAMPLING
Materials required for examination Items included with question papers Ruler graduated in centimetres and Nil
millimetres, protractor, compasses,
pen, HB pencil, eraser.
Tracing paper may be used.
Instructions
Use black ink or ball-point pen.
Fill in the boxes at the top of this page with your name, centre number and candidate number.
Answer all questions.
Answer the questions in the spaces provided – there may be more space than you need.
Calculators may be used.
Information
The marks for each question are shown in brackets – use this as a guide as to how much time to
spend on each question.
Questions labelled with an asterisk (*) are ones where the quality of your written communication
will be assessed – you should take particular care on these questions with your spelling, punctuation
and grammar, as well as the clarity of expression.
Advice
Read each question carefully before you start to answer it.
Keep an eye on the time.
Try to answer every question.
Check your answers if you have time at the end.
900

1. The grouped frequency table shows information about the weights, in
kilograms, of 20 students, chosen at random from Year 11.
Weight (w
kg)
Frequenc
y
50 w < 60 7
60 w < 70 8
70 w < 80 3
80 w < 90 2
There are 300 students in Year 11.
Work out an estimate for the number of students in Year 11 whose weight is
between 50 kg and 60 kg.
…………………………………
(Total 3 marks)
2. The table shows the number of students in each year group at a school.
Year group 7 8 9 10 11
Number of students 190 145 145 140 130
Jenny is carrying out a survey for her GCSE Mathematics project.
She uses a stratified sample of 60 students according to year group.
Calculate the number of Year 11 students that should be in her sample.
...............................................
(Total 3 marks)
901

3. A school has 450 students.
Each student studies one of Greek or Spanish or German or French.
The table shows the number of students who study each of these languages.
Language Number of students
Greek 145
Spanish 121
German 198
French 186
An inspector wants to look at the work of a stratified sample of 70 of these
students.
Find the number of students studying each of these languages that should be
in the sample.
Greek ...........................
Spanish ........................
German ........................
French .........................
(Total 3 marks)
902

4. There are three age groups in a competition.
The table shows the number of competitors in each age group.
16-18
years
19-24
years
25+ years
120 250 200
John wants to do a survey of the competitors.
He uses a stratified sample of exactly 50 competitors according to each age
group.
Work out the number of competitors in each age group that should be in his
stratified
sample of 50.
16-18 years: ..................
19-24 years: ..................
25+ years: ..................
(Total 3 marks)
903
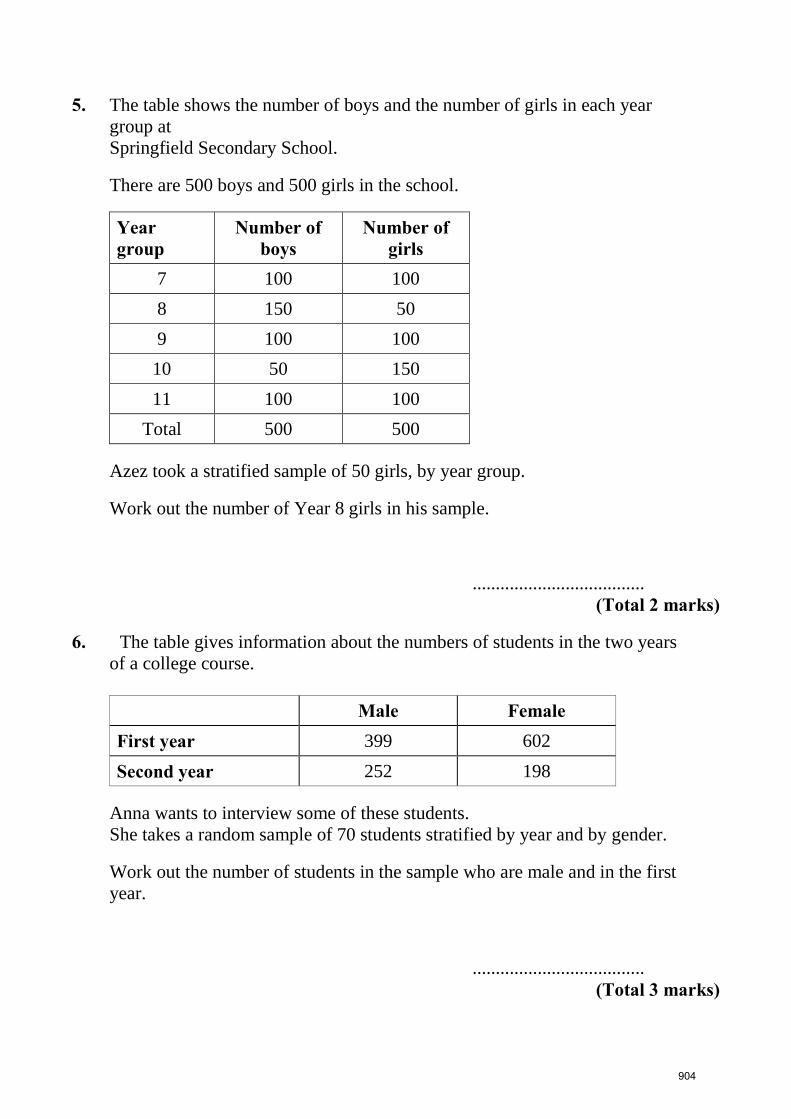
5. The table shows the number of boys and the number of girls in each year
group at
Springfield Secondary School.
There are 500 boys and 500 girls in the school.
Year group
Number of boys
Number of girls
7 100 100
8 150 50
9 100 100
10 50 150
11 100 100
Total 500 500
Azez took a stratified sample of 50 girls, by year group.
Work out the number of Year 8 girls in his sample.
..................................... (Total 2 marks)
6. The table gives information about the numbers of students in the two years
of a college course.
Male Female
First year 399 602
Second year 252 198
Anna wants to interview some of these students.
She takes a random sample of 70 students stratified by year and by gender.
Work out the number of students in the sample who are male and in the first
year.
.....................................
(Total 3 marks)
904

7. 258 students each study one of three languages.
The table shows information about these students.
Language studied
German French Spanish
Male 45 52 26
Female 25 48 62
A sample, stratified by the language studied and by gender, of 50 of the 258
students is taken.
(a) Work out the number of male students studying Spanish in the sample.
..........................
(2)
(b) Work out the number of female students in the sample.
..........................
(2) (Total 4 marks)
905
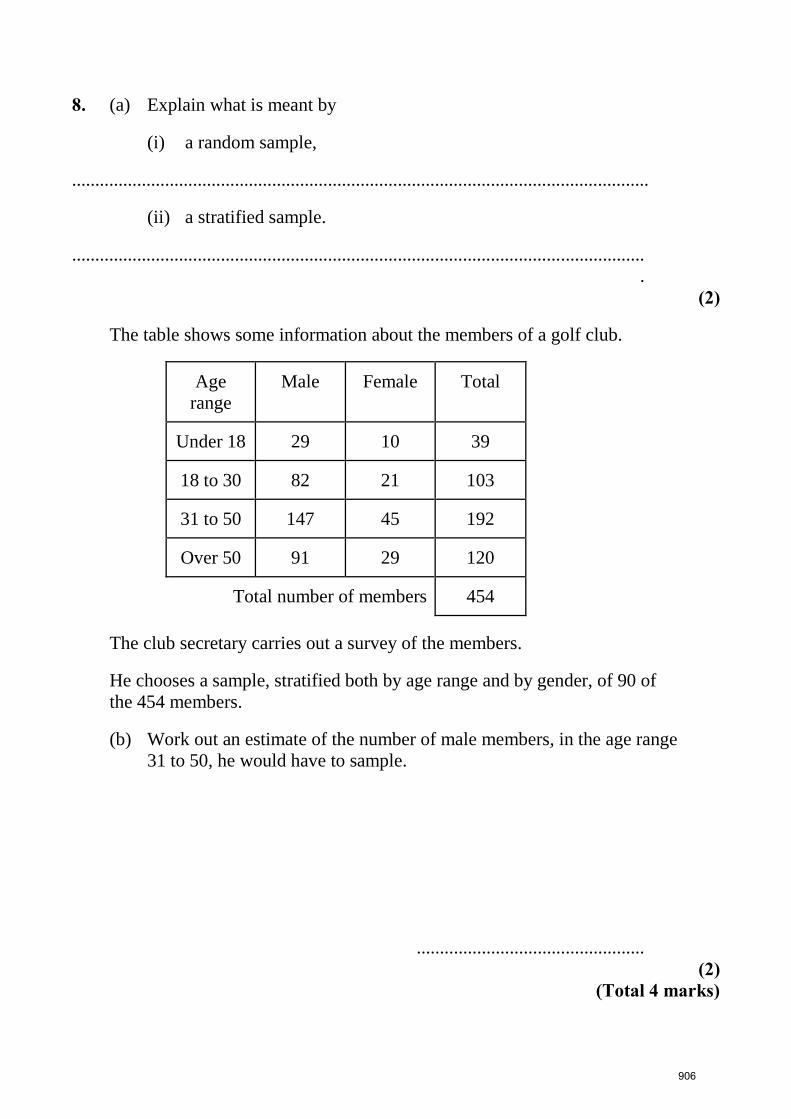
8. (a) Explain what is meant by
(i) a random sample,
............................................................................................................................
(ii) a stratified sample.
...........................................................................................................................
.
(2)
The table shows some information about the members of a golf club.
Age
range
Male Female Total
Under 18 29 10 39
18 to 30 82 21 103
31 to 50 147 45 192
Over 50 91 29 120
Total number of members 454
The club secretary carries out a survey of the members.
He chooses a sample, stratified both by age range and by gender, of 90 of
the 454 members.
(b) Work out an estimate of the number of male members, in the age range
31 to 50, he would have to sample.
.................................................
(2) (Total 4 marks)
906

9. Hamid wants to find out what people in Melworth think about the sports
facilities in the town.
Hamid plans to stand outside the Melworth sports centre one Monday
morning.
He plans to ask people going into the sports centre to complete a
questionnaire.
Carol tells Hamid that his survey will be biased.
(i) Give one reason why the survey will be biased.
…………………………………………………………………………
…...…….....……………………………………………………………
…………………....……………………………………………………
(ii) Describe one change Hamid could make to the way in which he is
going to carry out his survey so that it will be less biased.
…………………………………………………………………………
…………………………………………………………………………
…………………………………………………………………………
(Total 2 marks)
10. There are 970 students in Bayton High School.
Brian takes a random sample of 100 students.
He asks these 100 students which subject they like best.
They can choose English or Maths or Science.
Brian is going to use his results to work out an estimate of how many of the
970 students like English best.
Explain how.
...........................................................................................................................
...........................................................................................................................
...........................................................................................................................
...........................................................................................................................
(Total 2 marks)
907

11. 340 475 people live in Brinton.
A company carried out a survey.
It used a random sample of 1500 of the 340 475 people.
870 of this sample of 1500 people were male.
Work out an estimate for the number of females living in Brinton.
………………….
(Total 3 marks)
12. The table shows some information about the pupils at Statson School.
Year group Boys Girls Total
Year 7 104 71 175
Year 8 94 98 192
Year 9 80 120 200
Total 278 289 567
Kelly carries out a survey of the pupils at Statson School.
She takes a sample of 80 pupils, stratified by both Year group and gender.
(a) Work out the number of Year 8 boys in her sample.
………………….
(2)
(b) Describe a method that Kelly could use to take a random sample of
Year 8 boys.
………………………………………………………………………
………………………………………………………………………
………………………………………………………………………
(2) (Total 4 marks)
908

13. The table gives information about the number of girls in each of four
schools.
School A B C D Total
Number of girls 126 82 201 52 461
Jenny did a survey of these girls.
She used a stratified sample of exactly 80 girls according to school.
Work out the number of girls from each school that were in her sample of
80.
Complete the table.
School A B C D Total
Number of girls 80
(Total 3 marks)
14. The table shows the number of boys in each of four groups.
Group A B C D Total
Number of boys 32 43 38 19 132
Jamie takes a sample of 40 boys stratified by group.
Calculate the number of boys from group B that should be in his sample.
.....................................
(Total 2 marks)
909
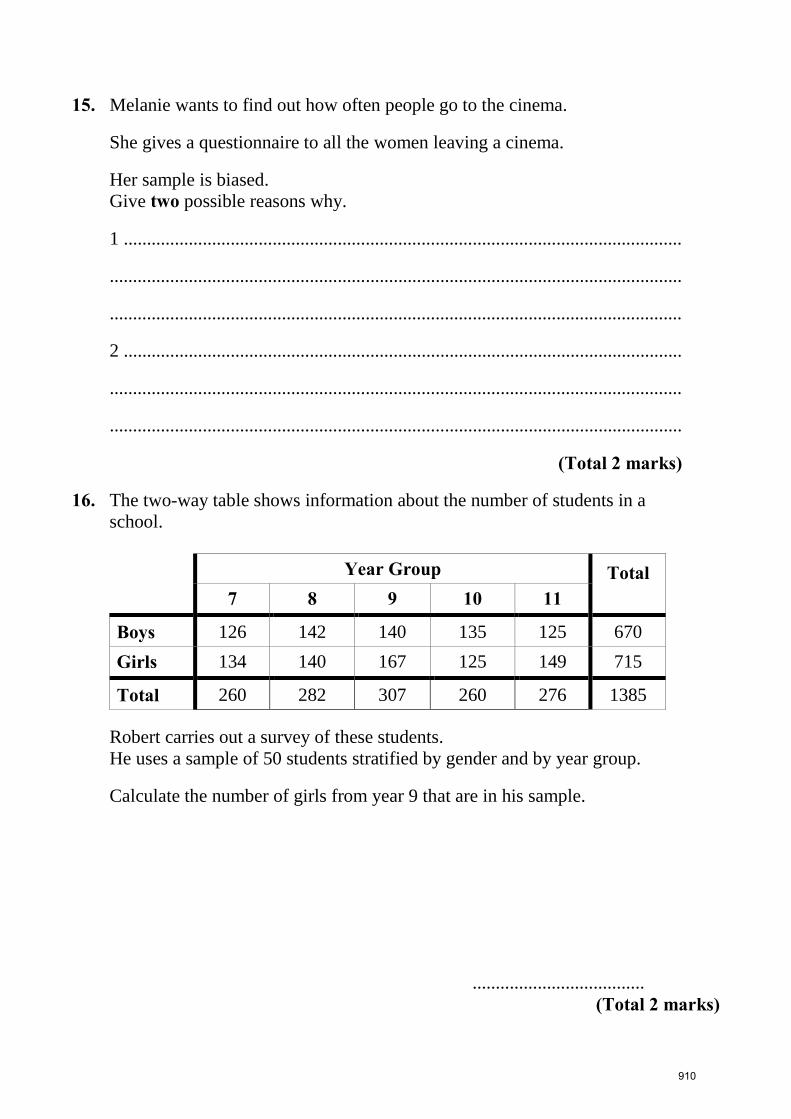
15. Melanie wants to find out how often people go to the cinema.
She gives a questionnaire to all the women leaving a cinema.
Her sample is biased.
Give two possible reasons why.
1 ........................................................................................................................
...........................................................................................................................
...........................................................................................................................
2 ........................................................................................................................
...........................................................................................................................
...........................................................................................................................
(Total 2 marks)
16. The two-way table shows information about the number of students in a
school.
Year Group Total 7 8 9 10 11
Boys 126 142 140 135 125 670
Girls 134 140 167 125 149 715
Total 260 282 307 260 276 1385
Robert carries out a survey of these students.
He uses a sample of 50 students stratified by gender and by year group.
Calculate the number of girls from year 9 that are in his sample.
.....................................
(Total 2 marks)
910

111 Edexcel GCSE Mathematics (Linear) – 1MA0
PROOF
Materials required for examination Items included with question papers Ruler graduated in centimetres and Nil
millimetres, protractor, compasses,
pen, HB pencil, eraser.
Tracing paper may be used.
Instructions
Use black ink or ball-point pen.
Fill in the boxes at the top of this page with your name, centre number and candidate number.
Answer all questions.
Answer the questions in the spaces provided – there may be more space than you need.
Calculators may be used.
Information
The marks for each question are shown in brackets – use this as a guide as to how much time to
spend on each question.
Questions labelled with an asterisk (*) are ones where the quality of your written communication
will be assessed – you should take particular care on these questions with your spelling, punctuation
and grammar, as well as the clarity of expression.
Advice
Read each question carefully before you start to answer it.
Keep an eye on the time.
Try to answer every question.
Check your answers if you have time at the end.
911
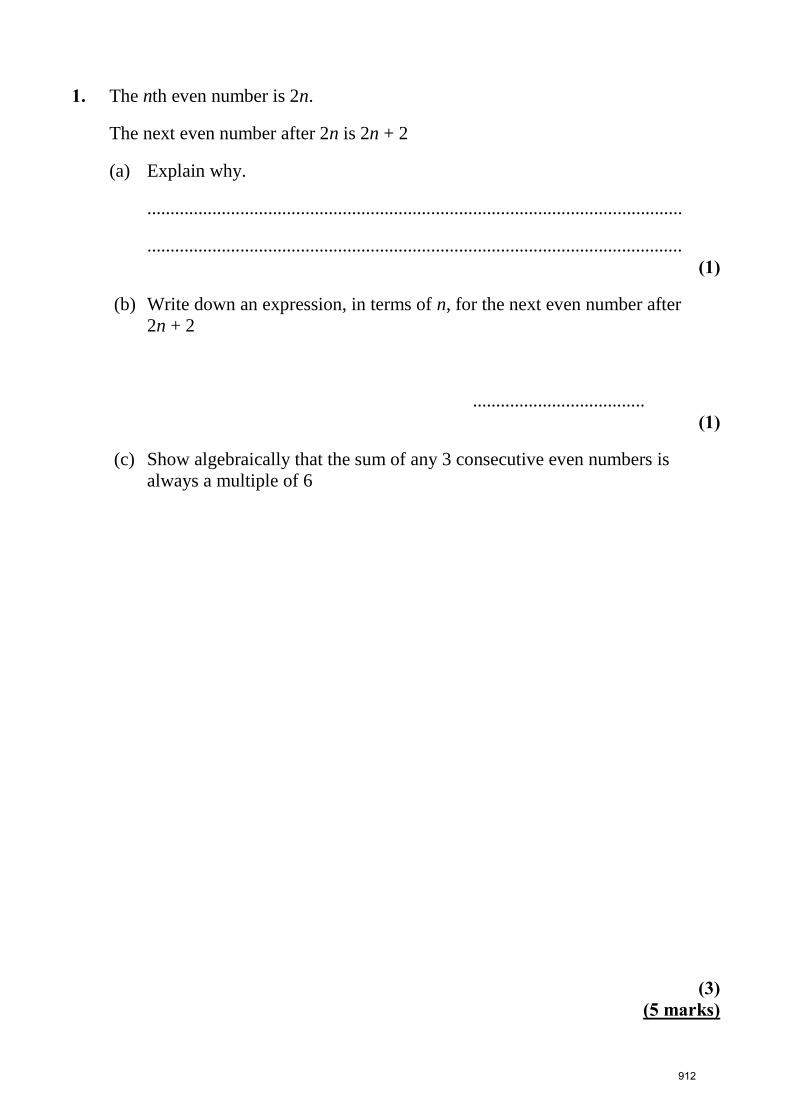
1. The nth even number is 2n.
The next even number after 2n is 2n + 2
(a) Explain why.
...................................................................................................................
...................................................................................................................
(1)
(b) Write down an expression, in terms of n, for the next even number after
2n + 2
.....................................
(1)
(c) Show algebraically that the sum of any 3 consecutive even numbers is
always a multiple of 6
(3) (5 marks)
912
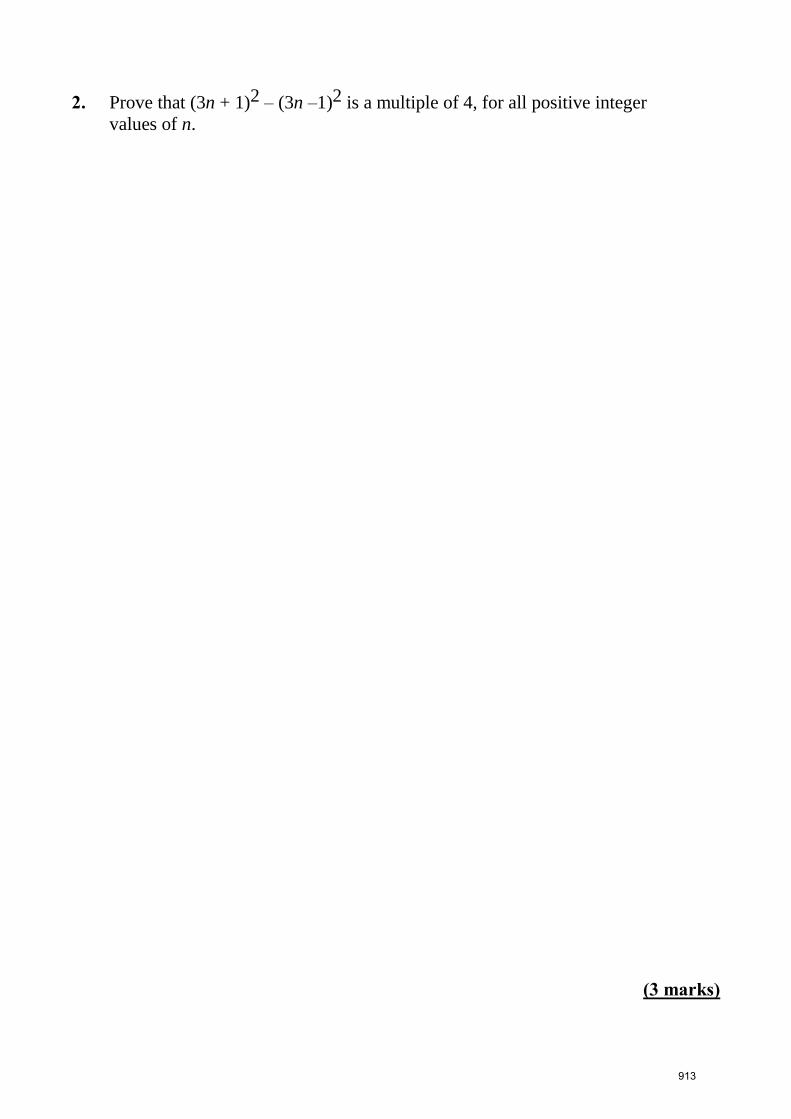
2. Prove that (3n + 1)2 – (3n –1)2 is a multiple of 4, for all positive integer
values of n.
(3 marks)
913

3. Prove, using algebra, that the sum of two consecutive whole numbers is always an
odd number.
(3 marks)
914

4. Prove that
(2n + 3)2 – (2n – 3)
2 is a multiple of 8
for all positive integer values of n.
(3 marks)
915

*5. Prove algebraically that the difference between the squares of any two
consecutive integers is equal to the sum of these two integers.
(4 marks)
916

6. Prove that (5n + 1)2 – (5n –1)2 is a multiple of 5, for all positive integer
values of n.
(3 marks)
917
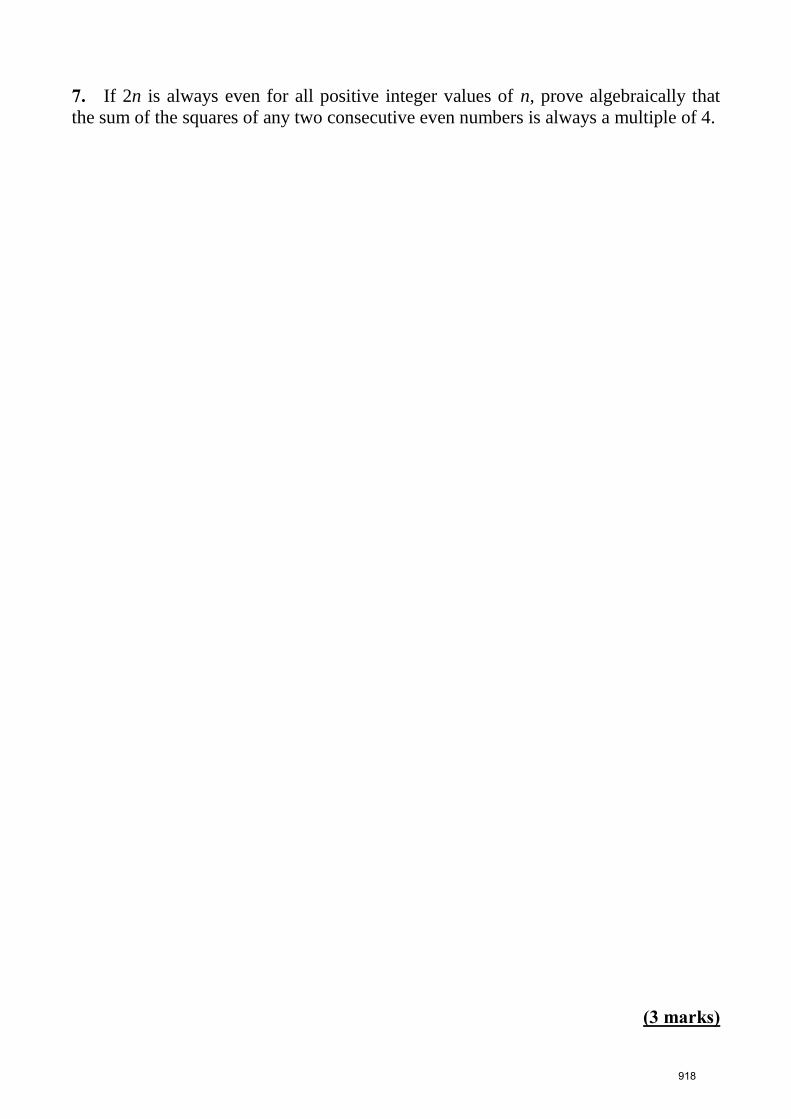
7. If 2n is always even for all positive integer values of n, prove algebraically that
the sum of the squares of any two consecutive even numbers is always a multiple of 4.
(3 marks)
918

8. Prove that
(n + 1)2 – (n – 1)
2 + 1 is always odd for all positive integer values of n.
(3 marks)
919

9. Prove algebraically that the sum of the squares of any two consecutive numbers
always leaves a remainder of 1 when divided by 4.
(4 marks)
920
Related Documents


![SIMULTANEOUS EQUATIONS (QUADRATIC) SOLUTIONS · 2017. 12. 19. · SIMULTANEOUS EQUATIONS SOLUTIONS (QUADRATIC) GCSE (+ IGCSE) EXAM QUESTION PRACTICE 1. [Edexcel, 2006] Simultaneous](https://static.cupdf.com/doc/110x72/61216357d4e8c92bd4719ae9/simultaneous-equations-quadratic-solutions-2017-12-19-simultaneous-equations.jpg)
