BABA BANDA SINGH BAHADUR ENGINEERING COLLEGE Department of Applied Sciences Question Bank Semester: 2 nd Subject: Mathematics-II (Probability and Statistics) - BTAM204-18 Name of Faculty: Dr. Amritbir Singh, Dr. Manish Gogna, Prof. Amarjit Singh 1. Explain the meaning of the word ‘statistics’ as used in different sense. Discuss the scope of the study of the science. 2. Distinguish between primary and secondary data. What are the various methods by which primary data are collected? 3. Describe different types of data used in measurement and explain various graphical techniques used for each type of data by giving example. 4. Compute the mean , mode and median for the following data: 2, 3, 1, 2, 6,4,2,1,5,3,2,3,1,2,2,1,3,1,2,2,4,2,1,2,8,3,2,1,1,3 5. “Statistics is a method of decision making in the face of uncertainty on the basis of numerical data and calculated risk” Explain with suitable illustrations. 6. The frequency distribution of weight in grams of mangoes of a given variety is given. Calculate the arithmetic mean and median. Weight in grams 410-419 420-429 430-439 440-449 450-459 460-469 470-479 Number of mangoes 14 20 42 54 45 18 7 7. Write short notes(including merits and demerits) on: (i) Arithmetic mean (ii) Geometric mean (iii) Harmonic mean (iv) Median (iv) Mode 8. The mean of marks obtained in an examination by a group of 100 students was found to be 49.96. the mean of the marks obtained in the same examination by another group of 200 students was 52.32. Find the mean of the marks obtained by both the groups of students taken together. 9. The numbers 3.2, 5.8, 7.9 and 4.5 have frequencies x, (x+2), (x-3) and (x+6) respectively. If their arithmetic mean is 4.876, find the value of x. 10. Calculate A.M. , G.M and Harmonic mean of the following distribution: X 2.5-7.5 7.5-12.5 12.5-17.5 17.5-22.5 F 12 28 65 121 11. The A.M. of 100 students was given 45. But later on it was found that the marks of a student ‘64’ were wrongly misread as ‘46’. Calculate the correct mean. 12. The value of a machine decreases at a constant rate from the cost price of Rs. 10000 to the scrap value of Rs. 1000 in a period of 10 years. Find the annual percentage rate of decrease per hundred.

Welcome message from author
This document is posted to help you gain knowledge. Please leave a comment to let me know what you think about it! Share it to your friends and learn new things together.
Transcript
BABA BANDA SINGH BAHADUR ENGINEERING COLLEGE
Department of Applied Sciences
Question Bank
Semester: 2nd
Subject: Mathematics-II (Probability and Statistics) - BTAM204-18
Name of Faculty: Dr. Amritbir Singh, Dr. Manish Gogna, Prof. Amarjit Singh
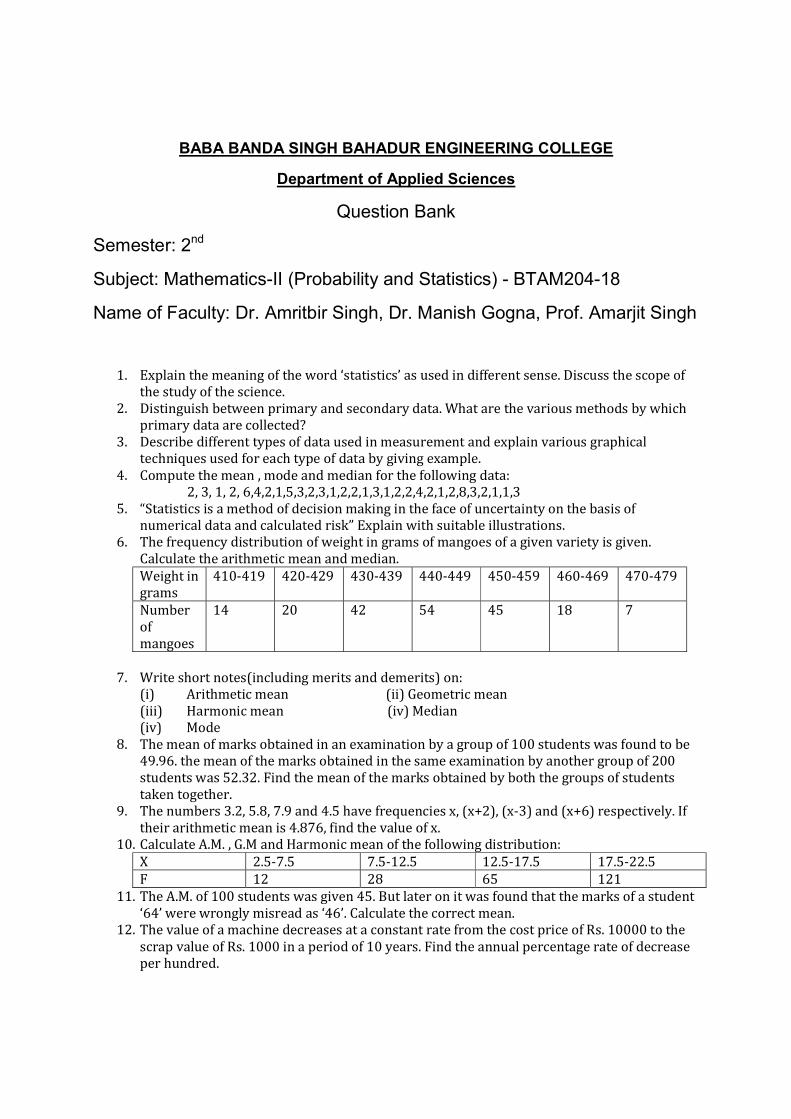
1. Explain the meaning of the word ‘statistics’ as used in different sense. Discuss the scope of the study of the science.
2. Distinguish between primary and secondary data. What are the various methods by which primary data are collected?
3. Describe different types of data used in measurement and explain various graphical techniques used for each type of data by giving example.
4. Compute the mean , mode and median for the following data: 2, 3, 1, 2, 6,4,2,1,5,3,2,3,1,2,2,1,3,1,2,2,4,2,1,2,8,3,2,1,1,3
5. “Statistics is a method of decision making in the face of uncertainty on the basis of numerical data and calculated risk” Explain with suitable illustrations.
6. The frequency distribution of weight in grams of mangoes of a given variety is given. Calculate the arithmetic mean and median. Weight in grams
410-419 420-429 430-439 440-449 450-459 460-469 470-479
Number of mangoes
14 20 42 54 45 18 7
7. Write short notes(including merits and demerits) on:
(i) Arithmetic mean (ii) Geometric mean (iii) Harmonic mean (iv) Median (iv) Mode
8. The mean of marks obtained in an examination by a group of 100 students was found to be 49.96. the mean of the marks obtained in the same examination by another group of 200 students was 52.32. Find the mean of the marks obtained by both the groups of students taken together.
9. The numbers 3.2, 5.8, 7.9 and 4.5 have frequencies x, (x+2), (x-3) and (x+6) respectively. If their arithmetic mean is 4.876, find the value of x.
10. Calculate A.M. , G.M and Harmonic mean of the following distribution: X 2.5-7.5 7.5-12.5 12.5-17.5 17.5-22.5 F 12 28 65 121
11. The A.M. of 100 students was given 45. But later on it was found that the marks of a student ‘64’ were wrongly misread as ‘46’. Calculate the correct mean.
12. The value of a machine decreases at a constant rate from the cost price of Rs. 10000 to the scrap value of Rs. 1000 in a period of 10 years. Find the annual percentage rate of decrease per hundred.

13. A man travels from Delhi to Mathura at the speed of 60 km/hr and returen at the speed of 40 km/hr. find his average speed.
14. Calculate Mean and Median of the following data: Height (cm)
135-140
140-145
145-150
150-155
155-160
160-165
165-170
170-175
Number of boys
4 9 18 28 24 10 5 2
15. The marks obtained by 70 students in Mathematics are given below. Calculate Q1,D3 and P95 for the distribution: Marks more than
80 70 60 50 40 30 20
No. of Students
0 7 18 40 40 63 70
16. Determine missing values in the following data, when mode is 67 and total of frequencies is 47. Classes 40-50 50-60 60-70 70-80 80-90 Frequency 5 A 15 B 7
17. Determine the value of the Mode by grouping method: X: 21 22 25 26 27 28 29 30 F : 7 10 15 18 13 7 3 2
18. What is standard deviation? Explain its superiority over other methods of variation. 19. Average scores of three Batsman A, B and C are respectively 40,45, 55 and their standard
deviation are respectively 9,11,15. Which batsman is more consistent? 20. In a study on Diabetic patients, the following data is obtained. Find the average age at first
detection and also the variance of the data: Age at detection (in years)
10-19 20-29 30-39 40-49 50-59 60-69 70-79 80-89
Number of Cases
1 0 1 10 17 38 9 3
21. The first three moments of a distribution about the value 5 of the variable are 2, 20 and 40. Find the mean, the variance and the third moment about mean.
22. For the following data, calculate (i) Mean , (ii) Median (iii) Semi inter- quartile range (iv) coefficient of variation and (v) 1 2 and coefficients.
Wages in Rupees
170-180
180-190
190-200
200-210
210-220
220-230
230-240
240-250
No. of persons
52 68 85 92 100 95 70 28
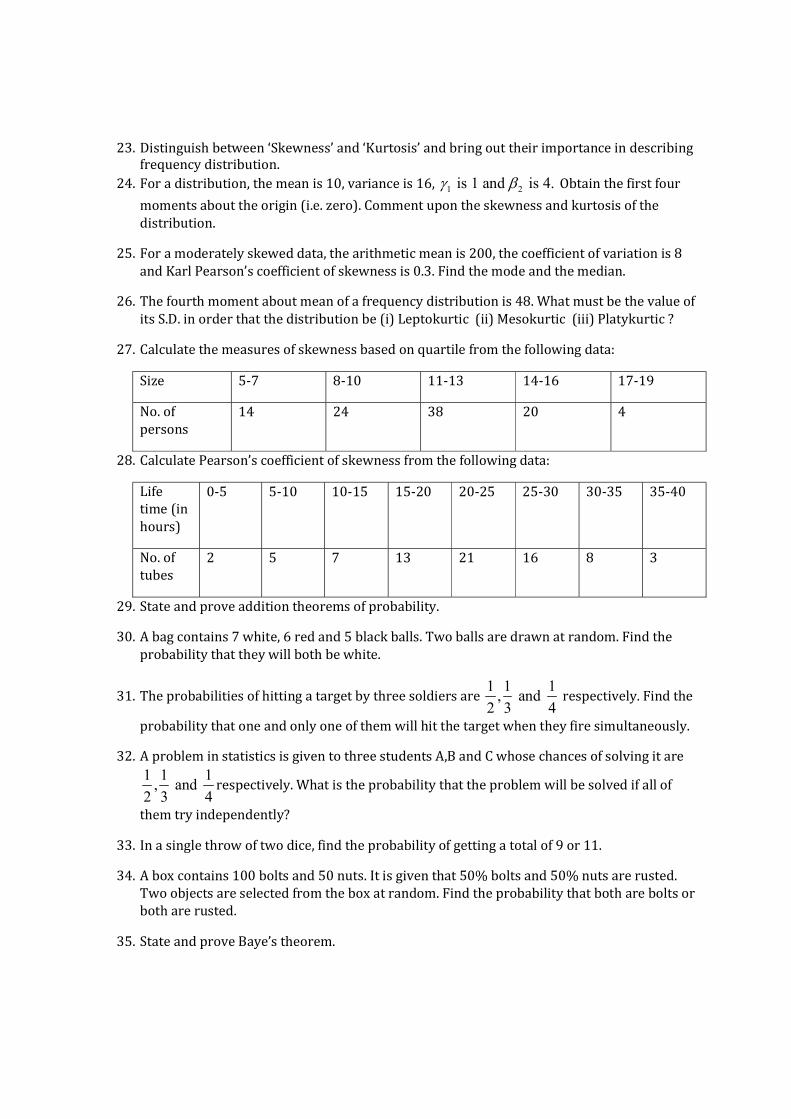
23. Distinguish between ‘Skewness’ and ‘Kurtosis’ and bring out their importance in describing frequency distribution.
24. For a distribution, the mean is 10, variance is 16,
1 2 is 1 and is 4. Obtain the first four
moments about the origin (i.e. zero). Comment upon the skewness and kurtosis of the distribution.
25. For a moderately skewed data, the arithmetic mean is 200, the coefficient of variation is 8 and Karl Pearson’s coefficient of skewness is 0.3. Find the mode and the median.
26. The fourth moment about mean of a frequency distribution is 48. What must be the value of its S.D. in order that the distribution be (i) Leptokurtic (ii) Mesokurtic (iii) Platykurtic ?
27. Calculate the measures of skewness based on quartile from the following data:
Size 5-7 8-10 11-13 14-16 17-19
No. of persons
14 24 38 20 4
28. Calculate Pearson’s coefficient of skewness from the following data:
Life time (in hours)
0-5 5-10 10-15 15-20 20-25 25-30 30-35 35-40
No. of tubes
2 5 7 13 21 16 8 3
29. State and prove addition theorems of probability.
30. A bag contains 7 white, 6 red and 5 black balls. Two balls are drawn at random. Find the probability that they will both be white.
31. The probabilities of hitting a target by three soldiers are 1 1 1
, and 2 3 4
respectively. Find the
probability that one and only one of them will hit the target when they fire simultaneously.
32. A problem in statistics is given to three students A,B and C whose chances of solving it are 1 1 1
, and 2 3 4
respectively. What is the probability that the problem will be solved if all of
them try independently?
33. In a single throw of two dice, find the probability of getting a total of 9 or 11.
34. A box contains 100 bolts and 50 nuts. It is given that 50% bolts and 50% nuts are rusted. Two objects are selected from the box at random. Find the probability that both are bolts or both are rusted.
35. State and prove Baye’s theorem.
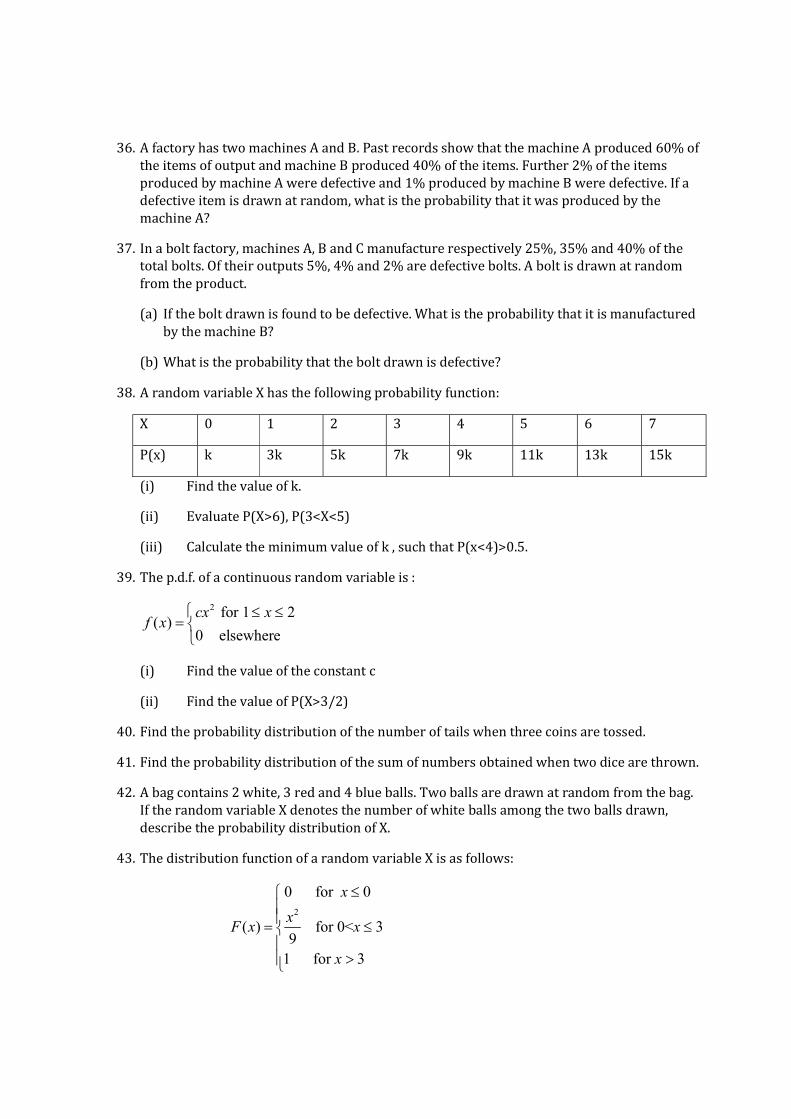
36. A factory has two machines A and B. Past records show that the machine A produced 60% of the items of output and machine B produced 40% of the items. Further 2% of the items produced by machine A were defective and 1% produced by machine B were defective. If a defective item is drawn at random, what is the probability that it was produced by the machine A?
37. In a bolt factory, machines A, B and C manufacture respectively 25%, 35% and 40% of the total bolts. Of their outputs 5%, 4% and 2% are defective bolts. A bolt is drawn at random from the product.
(a) If the bolt drawn is found to be defective. What is the probability that it is manufactured by the machine B?
(b) What is the probability that the bolt drawn is defective?
38. A random variable X has the following probability function:
X 0 1 2 3 4 5 6 7
P(x) k 3k 5k 7k 9k 11k 13k 15k
(i) Find the value of k.
(ii) Evaluate P(X>6), P(3<X<5)
(iii) Calculate the minimum value of k , such that P(x<4)>0.5.
39. The p.d.f. of a continuous random variable is :
2 for 1 2( )
0 elsewhere
cx xf x
(i) Find the value of the constant c
(ii) Find the value of P(X>3/2)
40. Find the probability distribution of the number of tails when three coins are tossed.
41. Find the probability distribution of the sum of numbers obtained when two dice are thrown.
42. A bag contains 2 white, 3 red and 4 blue balls. Two balls are drawn at random from the bag. If the random variable X denotes the number of white balls among the two balls drawn, describe the probability distribution of X.
43. The distribution function of a random variable X is as follows:
2
0 for 0
( ) for 0< 39
1 for 3
x
xF x x
x
Find the probability density function of X.
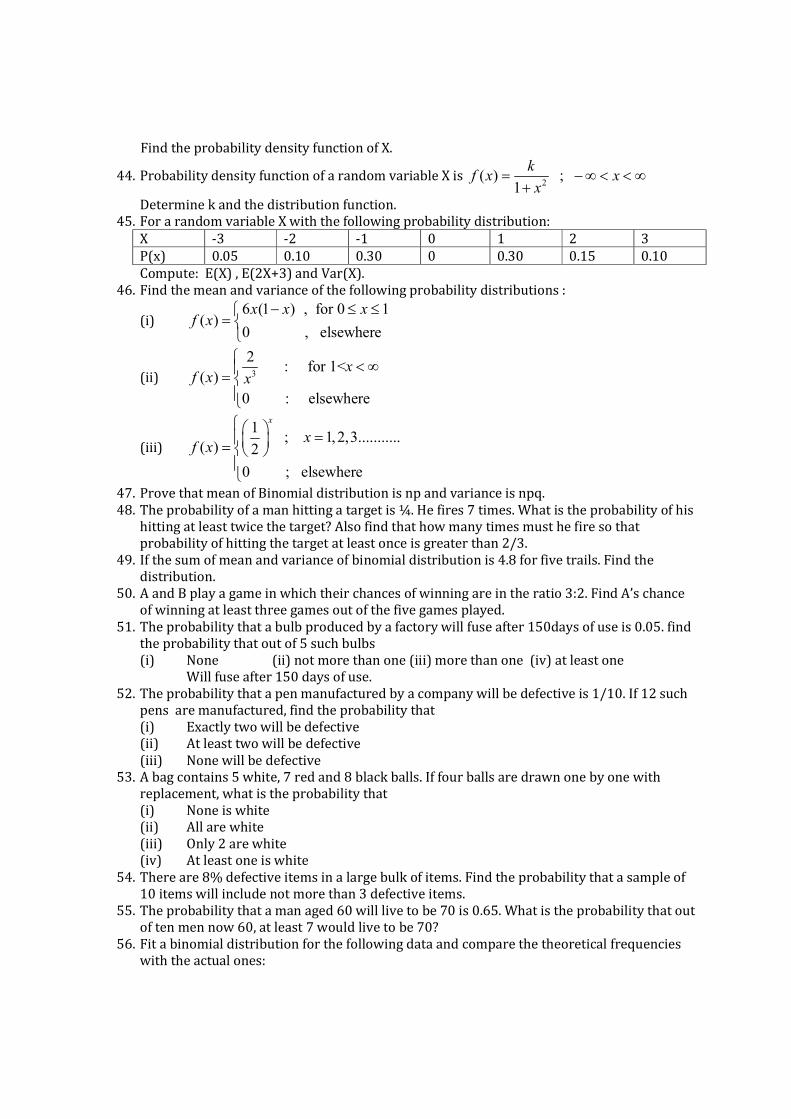
44. Probability density function of a random variable X is 2
( ) ; 1
kf x x
x
Determine k and the distribution function. 45. For a random variable X with the following probability distribution:
X -3 -2 -1 0 1 2 3 P(x) 0.05 0.10 0.30 0 0.30 0.15 0.10 Compute: E(X) , E(2X+3) and Var(X).
46. Find the mean and variance of the following probability distributions :
(i) 6 (1 ) , for 0 1
( )0 , elsewhere
x x xf x
(ii) 3
2 : for 1<
( )0 : elsewhere
xf x x
(iii) 1
; 1,2,3...........( ) 2
0 ; elsewhere
x
xf x
47. Prove that mean of Binomial distribution is np and variance is npq. 48. The probability of a man hitting a target is ¼. He fires 7 times. What is the probability of his
hitting at least twice the target? Also find that how many times must he fire so that probability of hitting the target at least once is greater than 2/3.
49. If the sum of mean and variance of binomial distribution is 4.8 for five trails. Find the distribution.
50. A and B play a game in which their chances of winning are in the ratio 3:2. Find A’s chance of winning at least three games out of the five games played.
51. The probability that a bulb produced by a factory will fuse after 150days of use is 0.05. find the probability that out of 5 such bulbs (i) None (ii) not more than one (iii) more than one (iv) at least one
Will fuse after 150 days of use. 52. The probability that a pen manufactured by a company will be defective is 1/10. If 12 such
pens are manufactured, find the probability that (i) Exactly two will be defective (ii) At least two will be defective (iii) None will be defective
53. A bag contains 5 white, 7 red and 8 black balls. If four balls are drawn one by one with replacement, what is the probability that (i) None is white (ii) All are white (iii) Only 2 are white (iv) At least one is white
54. There are 8% defective items in a large bulk of items. Find the probability that a sample of 10 items will include not more than 3 defective items.
55. The probability that a man aged 60 will live to be 70 is 0.65. What is the probability that out of ten men now 60, at least 7 would live to be 70?
56. Fit a binomial distribution for the following data and compare the theoretical frequencies with the actual ones:
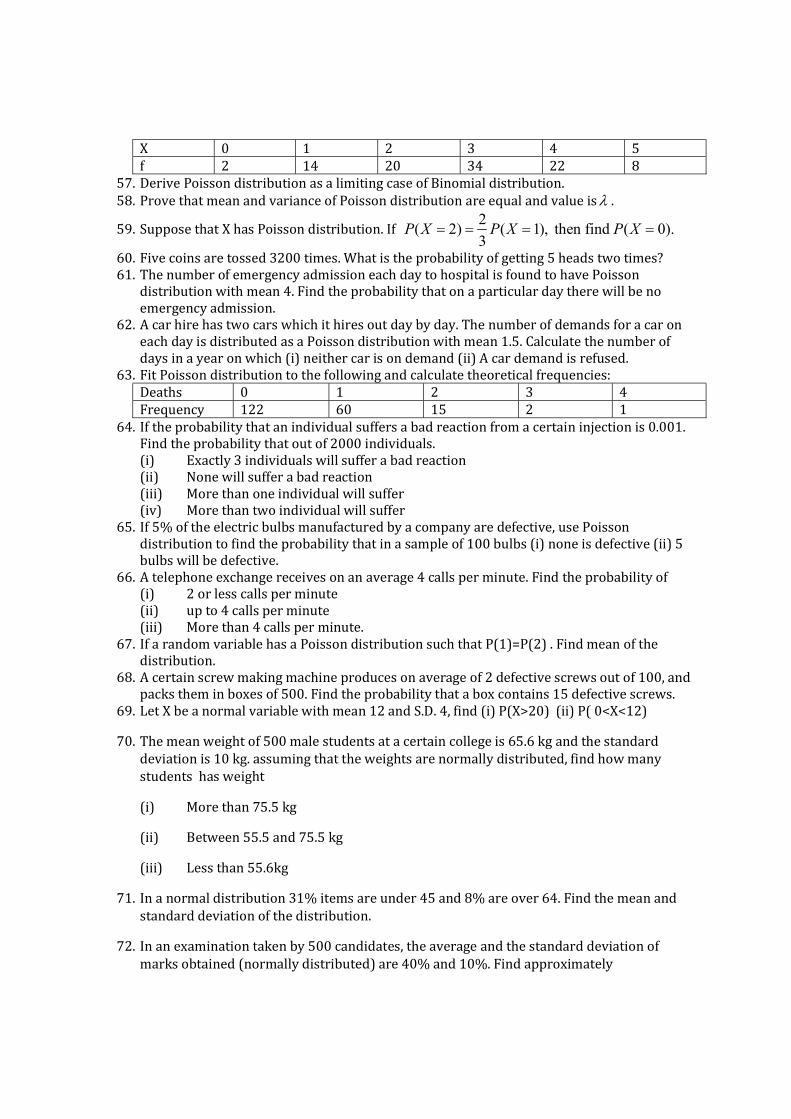
X 0 1 2 3 4 5 f 2 14 20 34 22 8
57. Derive Poisson distribution as a limiting case of Binomial distribution. 58. Prove that mean and variance of Poisson distribution are equal and value is .
59. Suppose that X has Poisson distribution. If 2
( 2) ( 1), then find ( 0).3
P X P X P X
60. Five coins are tossed 3200 times. What is the probability of getting 5 heads two times? 61. The number of emergency admission each day to hospital is found to have Poisson
distribution with mean 4. Find the probability that on a particular day there will be no emergency admission.
62. A car hire has two cars which it hires out day by day. The number of demands for a car on each day is distributed as a Poisson distribution with mean 1.5. Calculate the number of days in a year on which (i) neither car is on demand (ii) A car demand is refused.
63. Fit Poisson distribution to the following and calculate theoretical frequencies: Deaths 0 1 2 3 4 Frequency 122 60 15 2 1
64. If the probability that an individual suffers a bad reaction from a certain injection is 0.001. Find the probability that out of 2000 individuals. (i) Exactly 3 individuals will suffer a bad reaction (ii) None will suffer a bad reaction (iii) More than one individual will suffer (iv) More than two individual will suffer
65. If 5% of the electric bulbs manufactured by a company are defective, use Poisson distribution to find the probability that in a sample of 100 bulbs (i) none is defective (ii) 5 bulbs will be defective.
66. A telephone exchange receives on an average 4 calls per minute. Find the probability of (i) 2 or less calls per minute (ii) up to 4 calls per minute (iii) More than 4 calls per minute.
67. If a random variable has a Poisson distribution such that P(1)=P(2) . Find mean of the distribution.
68. A certain screw making machine produces on average of 2 defective screws out of 100, and packs them in boxes of 500. Find the probability that a box contains 15 defective screws.
69. Let X be a normal variable with mean 12 and S.D. 4, find (i) P(X>20) (ii) P( 0<X<12)
70. The mean weight of 500 male students at a certain college is 65.6 kg and the standard deviation is 10 kg. assuming that the weights are normally distributed, find how many students has weight
(i) More than 75.5 kg
(ii) Between 55.5 and 75.5 kg
(iii) Less than 55.6kg
71. In a normal distribution 31% items are under 45 and 8% are over 64. Find the mean and standard deviation of the distribution.
72. In an examination taken by 500 candidates, the average and the standard deviation of marks obtained (normally distributed) are 40% and 10%. Find approximately
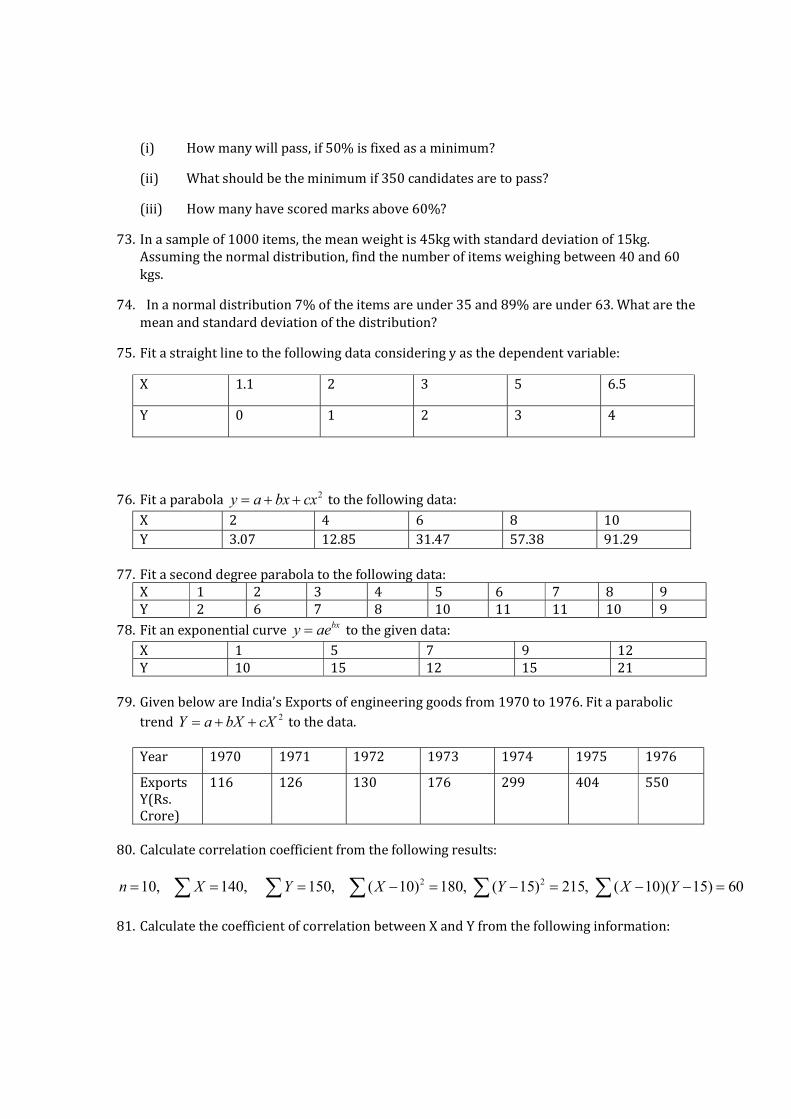
(i) How many will pass, if 50% is fixed as a minimum?
(ii) What should be the minimum if 350 candidates are to pass?
(iii) How many have scored marks above 60%?
73. In a sample of 1000 items, the mean weight is 45kg with standard deviation of 15kg. Assuming the normal distribution, find the number of items weighing between 40 and 60 kgs.
74. In a normal distribution 7% of the items are under 35 and 89% are under 63. What are the mean and standard deviation of the distribution?
75. Fit a straight line to the following data considering y as the dependent variable:
X 1.1 2 3 5 6.5
Y 0 1 2 3 4
76. Fit a parabola 2y a bx cx to the following data: X 2 4 6 8 10 Y 3.07 12.85 31.47 57.38 91.29
77. Fit a second degree parabola to the following data: X 1 2 3 4 5 6 7 8 9 Y 2 6 7 8 10 11 11 10 9
78. Fit an exponential curve bxy ae to the given data: X 1 5 7 9 12 Y 10 15 12 15 21
79. Given below are India’s Exports of engineering goods from 1970 to 1976. Fit a parabolic trend 2Y a bX cX to the data. Year 1970 1971 1972 1973 1974 1975 1976
Exports Y(Rs. Crore)
116 126 130 176 299 404 550
80. Calculate correlation coefficient from the following results:
2 210, 140, 150, ( 10) 180, ( 15) 215, ( 10)( 15) 60n X Y X Y X Y 81. Calculate the coefficient of correlation between X and Y from the following information:

X Y
Number of observations 15 15
S.D. 3.01 3.03
Sum of product of deviations from the mean is 122.
82. Ten students got the following percentage of marks in Principles of Economics and Statistics. Calculate the coefficient of correlation.
Roll no.
1 2 3 4 5 6 7 8 9 10
Marks in Eco.
78 36 98 25 75 82 90 62 39 65
Marks in Stat.
84 51 91 60 68 62 86 58 47 53
83. Calculate Karl Pearson’s coefficient of correlation from following data:
X 27 26 25 24 23 22 21
Y 22 21 20 19 18 15 10
84. Two Judges in a competition rank 12 entries as follows:
X 1 2 3 4 5 6 7 8 9 10 11 12
Y 12 9 6 10 3 5 4 7 8 2 11 1
What degree of agreement is there between the judges?
85. Calculate coefficient of rank correlation from the data given below:
X 20 30 40 50 60 70 80
Y 14 5 30 32 40 45 65
86. Calculate the Rank correlation coefficient for the following distribution:
X 11 6 9 13 6 27 15 16 17 10 1

Y 21 30 37 40 29 34 39 24 20 40 38
87. From the following data, find the two regression lines:
X 2 4 6 8 10
Y 12 16 14 12 16
88. Find , and X Y r from the following two regression equations:
3 2 26, 6 31X Y X Y
89. The correlation coefficient between two variables X and Y is 0.6, If
1.5, 2, 10, 20.x y X Y find equations of regression lines of X on Y and Y on X.
90. Obtain the two regression lines and estimate the blood pressure when the age is 50 years from the following data:
Age(x) 56 42 72 36 63 47 35 49 38 42 68 60
Blood pressure (y)
147 125 160 118 149 128 150 145 155 140 152 155
91. Explain the following terms, with examples.
(a) Null hypothesis, alternative hypothesis and testing of hypothesis
(b) Critical region , critical point and level of significance
92. Explain the types of errors in testing of hypothesis.
93. Explain Standard Error in sampling distributions.
94. Sugar is packed in bags by an automatic machine with mean contents of bags as 1.000kg. A random sample of 36 bags is selected and mean mass has been found to be 1.003kg with a S.D. of 0.01kg, is acceptable on all the bags being packed, determine on the basis of sample test whether the machine requires adjustment.
95. The average income of persons was Rs. 210 with a S.D. of Rs. 10 in sample of 100 people of a city. For another sample of 150 persons, the average income was Rs. 220 with S.D of Rs. 12. Test whether the difference between the average incomes of the localities is significant or not.
96. A sample of heights of 6400 soldiers has a mean of 67.85 inches and a S.D. of 2.56 inches. While another sample of heights of 1600 sailors has a mean of 68.55 inches with S.D. of 2.52 inches. Do the data indicate that the sailors are on the average taller than soldiers?
97. A coin was tossed 400 times and head turned up 216 times. Test the hypothesis that the coin is unbiased.
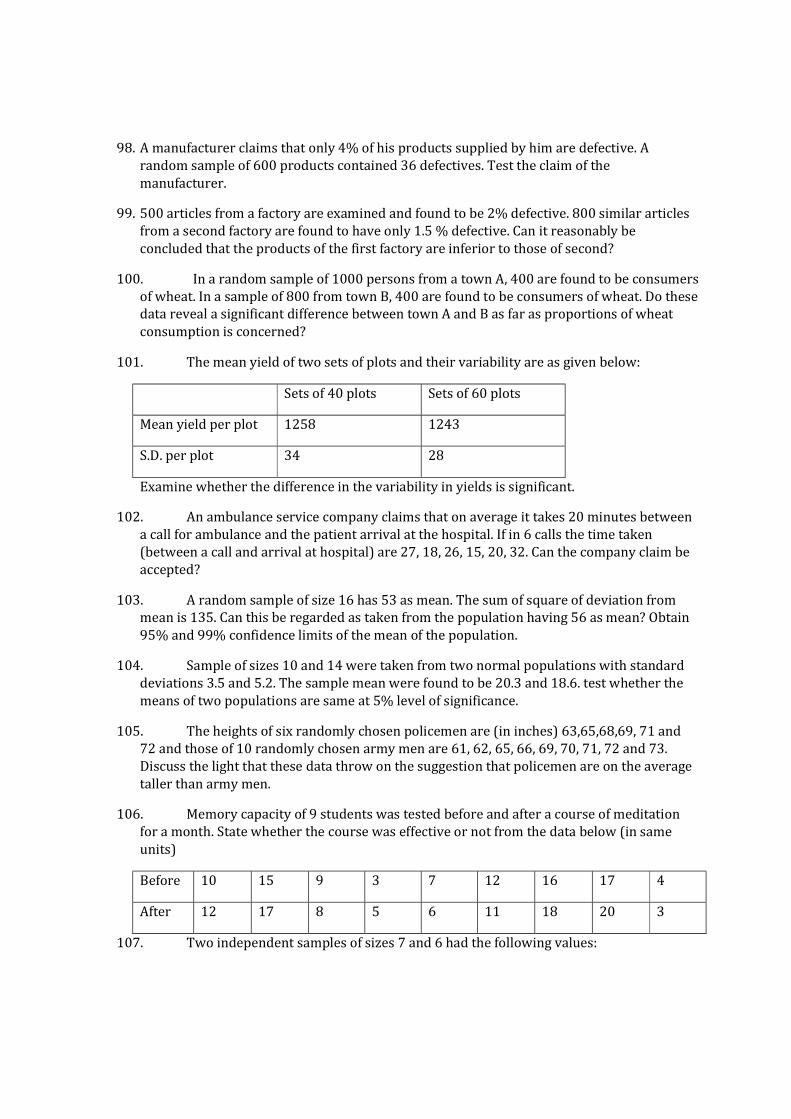
98. A manufacturer claims that only 4% of his products supplied by him are defective. A random sample of 600 products contained 36 defectives. Test the claim of the manufacturer.
99. 500 articles from a factory are examined and found to be 2% defective. 800 similar articles from a second factory are found to have only 1.5 % defective. Can it reasonably be concluded that the products of the first factory are inferior to those of second?
100. In a random sample of 1000 persons from a town A, 400 are found to be consumers of wheat. In a sample of 800 from town B, 400 are found to be consumers of wheat. Do these data reveal a significant difference between town A and B as far as proportions of wheat consumption is concerned?
101. The mean yield of two sets of plots and their variability are as given below:
Sets of 40 plots Sets of 60 plots
Mean yield per plot 1258 1243
S.D. per plot 34 28
Examine whether the difference in the variability in yields is significant.
102. An ambulance service company claims that on average it takes 20 minutes between a call for ambulance and the patient arrival at the hospital. If in 6 calls the time taken (between a call and arrival at hospital) are 27, 18, 26, 15, 20, 32. Can the company claim be accepted?
103. A random sample of size 16 has 53 as mean. The sum of square of deviation from mean is 135. Can this be regarded as taken from the population having 56 as mean? Obtain 95% and 99% confidence limits of the mean of the population.
104. Sample of sizes 10 and 14 were taken from two normal populations with standard deviations 3.5 and 5.2. The sample mean were found to be 20.3 and 18.6. test whether the means of two populations are same at 5% level of significance.
105. The heights of six randomly chosen policemen are (in inches) 63,65,68,69, 71 and 72 and those of 10 randomly chosen army men are 61, 62, 65, 66, 69, 70, 71, 72 and 73. Discuss the light that these data throw on the suggestion that policemen are on the average taller than army men.
106. Memory capacity of 9 students was tested before and after a course of meditation for a month. State whether the course was effective or not from the data below (in same units)
Before 10 15 9 3 7 12 16 17 4
After 12 17 8 5 6 11 18 20 3
107. Two independent samples of sizes 7 and 6 had the following values:
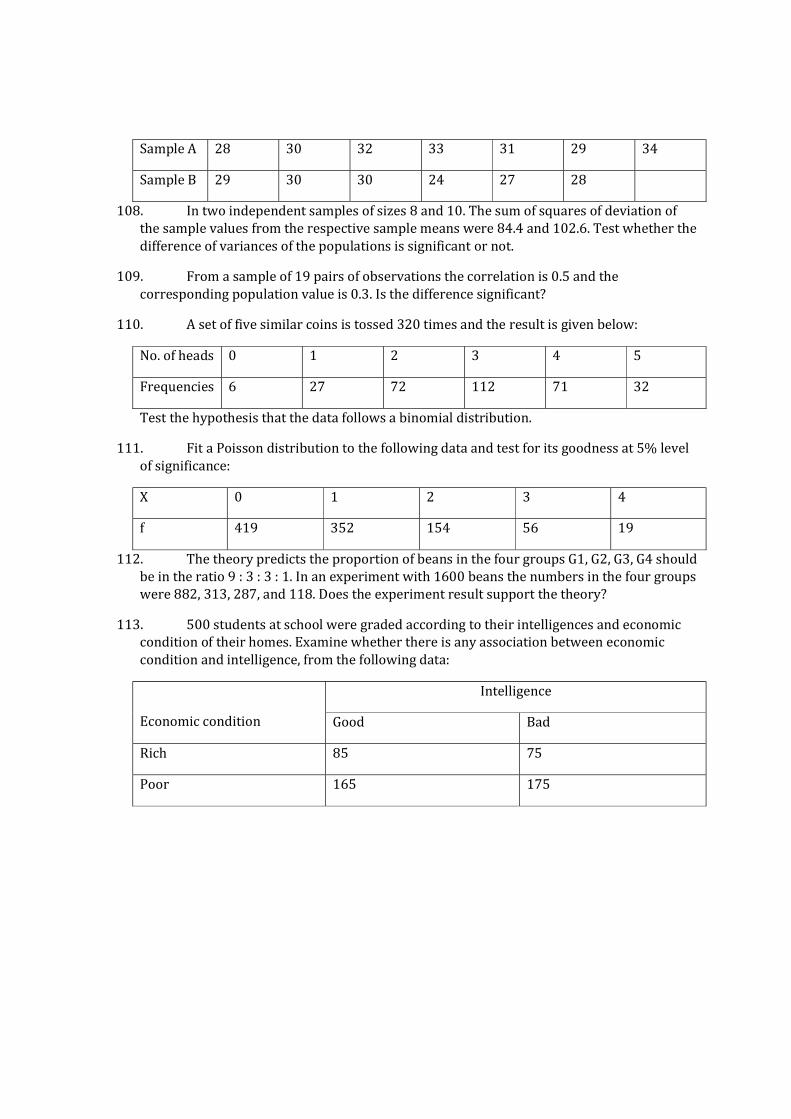
Sample A 28 30 32 33 31 29 34
Sample B 29 30 30 24 27 28
108. In two independent samples of sizes 8 and 10. The sum of squares of deviation of the sample values from the respective sample means were 84.4 and 102.6. Test whether the difference of variances of the populations is significant or not.
109. From a sample of 19 pairs of observations the correlation is 0.5 and the corresponding population value is 0.3. Is the difference significant?
110. A set of five similar coins is tossed 320 times and the result is given below:
No. of heads 0 1 2 3 4 5
Frequencies 6 27 72 112 71 32
Test the hypothesis that the data follows a binomial distribution.
111. Fit a Poisson distribution to the following data and test for its goodness at 5% level of significance:
X 0 1 2 3 4
f 419 352 154 56 19
112. The theory predicts the proportion of beans in the four groups G1, G2, G3, G4 should be in the ratio 9 : 3 : 3 : 1. In an experiment with 1600 beans the numbers in the four groups were 882, 313, 287, and 118. Does the experiment result support the theory?
113. 500 students at school were graded according to their intelligences and economic condition of their homes. Examine whether there is any association between economic condition and intelligence, from the following data:
Economic condition
Intelligence
Good Bad
Rich 85 75
Poor 165 175
Related Documents