sustainability Article Mathematical Competence Scale (MCS) for Primary School: The Psychometric Properties and the Validation of an Instrument to Enhance the Sustainability of Talents Development through the Numeracy Skills Assessment Diego Bellini 1, *, Alberto Crescentini 2 , Giovanna Zanolla 2 , Serena Cubico 1, * , Giuseppe Favretto 1 , Lorenzo Faccincani 1 , Piermatteo Ardolino 1 and Giovanna Gianesini 1 1 Department of Business Administration, University of Verona, I-37129 Verona, Italy; [email protected] (G.F.); [email protected] (L.F.); [email protected] (P.A.); [email protected] (G.G.) 2 Department of Education and Learning, University of Applied Sciences and Arts of Southern Switzerland (SUPSI), 6928 Manno, Switzerland; [email protected] (A.C.); [email protected] (G.Z.) * Correspondence: [email protected] (D.B); [email protected] (S.C.); Tel.: +39-045-8028132 (D.B); +39-045-8028132 (S.C.) Received: 28 February 2019; Accepted: 22 April 2019; Published: 3 May 2019 Abstract: The adequate development of the numeracy skills is a target of the fourth of the Sustainable Development Goals and is considered the basis for a financial literacy: both are competences needed for successful social and professional inclusion. Building on these goals, we carried out a unidimensional Mathematical Competence Scale (MCS) for primary school. The aim of this study was to present the psychometric properties and the validation process of MCS, designed basing on Item Response Theory. The final version of the scale, which measures different domains of mathematical knowledge (Data Analysis and Relationships, Geometry, Dimensions and Measurements, Numbers and Calculations), was validated on the entire population of 2935 fourth graders in Ticino Canton, Switzerland. The results reveal the high level of correlation between the six mathematical dimensions and confirm the assumption of a latent “mathematical construct”. However, even the multidimensional model could be considered a good model because it fitted the data significantly better than the one-dimensional model. In particular, the differences of the deviance between the two models are significant (χ 2 (20) = 642.66, p < 0.001). Moreover, findings show a significant gender effect and a positive correlation between students’ actual school performance during the same academic year and MCS scores. MCS allows a reading of the learning and teaching process in the perspective of the psychology of sustainability and sustainable development and helps a teacher to sustain student talent through the development of numeracy skills; in fact, the scale is intended both as an assessment tool and an innovative approach for shaping the development of curriculum, and therefore has potential to serve as a bridge between empirical research, classroom practice and a positive (school and professional) career development. Keywords: mathematical competence assessment; mathematics education; MCS; domains of mathematical knowledge; primary school; Switzerland; psychology of sustainability and sustainable development; STEM Sustainability 2019, 11, 2569; doi:10.3390/su11092569 www.mdpi.com/journal/sustainability

Welcome message from author
This document is posted to help you gain knowledge. Please leave a comment to let me know what you think about it! Share it to your friends and learn new things together.
Transcript
sustainability
Article
Mathematical Competence Scale (MCS) for PrimarySchool: The Psychometric Properties and theValidation of an Instrument to Enhance theSustainability of Talents Development through theNumeracy Skills Assessment
Diego Bellini 1,*, Alberto Crescentini 2, Giovanna Zanolla 2, Serena Cubico 1,* ,Giuseppe Favretto 1, Lorenzo Faccincani 1 , Piermatteo Ardolino 1 and Giovanna Gianesini 1
1 Department of Business Administration, University of Verona, I-37129 Verona, Italy;[email protected] (G.F.); [email protected] (L.F.); [email protected] (P.A.);[email protected] (G.G.)
2 Department of Education and Learning, University of Applied Sciences and Arts of SouthernSwitzerland (SUPSI), 6928 Manno, Switzerland; [email protected] (A.C.);[email protected] (G.Z.)
* Correspondence: [email protected] (D.B); [email protected] (S.C.);Tel.: +39-045-8028132 (D.B); +39-045-8028132 (S.C.)
Received: 28 February 2019; Accepted: 22 April 2019; Published: 3 May 2019�����������������
Abstract: The adequate development of the numeracy skills is a target of the fourth of the SustainableDevelopment Goals and is considered the basis for a financial literacy: both are competencesneeded for successful social and professional inclusion. Building on these goals, we carried out aunidimensional Mathematical Competence Scale (MCS) for primary school. The aim of this study wasto present the psychometric properties and the validation process of MCS, designed basing on ItemResponse Theory. The final version of the scale, which measures different domains of mathematicalknowledge (Data Analysis and Relationships, Geometry, Dimensions and Measurements, Numbersand Calculations), was validated on the entire population of 2935 fourth graders in Ticino Canton,Switzerland. The results reveal the high level of correlation between the six mathematical dimensionsand confirm the assumption of a latent “mathematical construct”. However, even the multidimensionalmodel could be considered a good model because it fitted the data significantly better than theone-dimensional model. In particular, the differences of the deviance between the two models aresignificant (χ2 (20) = 642.66, p < 0.001). Moreover, findings show a significant gender effect and apositive correlation between students’ actual school performance during the same academic yearand MCS scores. MCS allows a reading of the learning and teaching process in the perspective ofthe psychology of sustainability and sustainable development and helps a teacher to sustain studenttalent through the development of numeracy skills; in fact, the scale is intended both as an assessmenttool and an innovative approach for shaping the development of curriculum, and therefore haspotential to serve as a bridge between empirical research, classroom practice and a positive (schooland professional) career development.
Keywords: mathematical competence assessment; mathematics education; MCS; domains ofmathematical knowledge; primary school; Switzerland; psychology of sustainability and sustainabledevelopment; STEM
Sustainability 2019, 11, 2569; doi:10.3390/su11092569 www.mdpi.com/journal/sustainability

Sustainability 2019, 11, 2569 2 of 13
1. Introduction
The research area in the psychology of sustainability and sustainable development offers a usefulframework to improve the quality of scholar life of teachers and their students [1–5]. Specifically, goal 4(i.e., 4.4 and 4.6) of the 17th Sustainable Development Goals refers to quality education (Retrived on28 April 2019, from https://www.un.org/sustainabledevelopment/education). Goal 4.4 targets toincrease the number of people who have relevant skills, for employment, jobs and entrepreneurship.Goal 4.6 targets to ensure that all youth and a substantial proportion of adults, both men and women,achieve literacy and numeracy.
One of the reasons for lack of quality education are due to inadequately trained teachers who do nothave assessment tools to sustain relevant skills (e.g., numeracy) and students’ talents. Mathematics skills,found to be predictive of later mathematics achievement and relevant for the acquisition of financialliteracy [6–8], are important for the design of interventions to teach those skills [9]. Research cansupport the development of math-related competences [10,11], and this journal has paid attention tothe sustainable learning of mathematics [12]. However, the literature has to date partially consideredthe examination of how performance on various math tasks might be interrelated [13,14] to sustainquality education. Observing that there is little research on this topic, we add to this small body ofliterature by presenting the validation process of the unidimensional Mathematical Competence Scale(MCS) for primary school and its psychometrics properties. This study was carried out in Switzerlandon the entire population of 2935 fourth graders in Ticino Canton.
This paper considers multiple domains of children’s mathematical knowledge and makesconclusions about how these competencies might influence long-run mathematical developmentand lifelong learning. Everyone has the right to acquire and understand which skills allow fullparticipation in society and also help people choose appropriate fields of study [15]. Its aim is toprovide a standard framework for both research and practice to support sustainable mathematicalcompetences [16,17].
1.1. Mathematical Competence and Talents Sustainability Development
Education for 21st-century skills has stimulated researchers to suggest competencies that canpromote talents development [18]. Among these competences, mathematical competence learning playsan important role in education. Mathematical Competence is defined in the European Recommendationsfor learning [19] as “the ability to develop and apply mathematical thinking to solve a range of problemsin everyday situations” and is considered to be of key importance for lifelong learning within Europeancountries. Numeracy, the basic mathematical skill [20], is the ability and disposition to use and applymathematics in a range of context outside the mathematics classroom. In building a sound mastery ofnumeracy, process and activity are relevant as knowledge as well. In the European Recommendations forlearning [19], mathematical competence involves the ability and willingness to use mathematical modelsof thought (logical and spatial thinking) and presentation (i.e., formulas, models, constructs, graphs,and charts). Counting competencies have been emphasised internationally as of primary importance forchildren’s development of mathematical proficiency. Clements and Sarama [21,22] shown that children’smathematical skills are the strongholds of early numerical knowledge and are useful for all further workwith number and operations. Counting competencies, particularly advanced counting skills, are alsohighly relevant for learning arithmetic. More advanced counting competencies, requiring complexthinking and procedures, are also necessary for later-grade mathematics achievement, such as algebraicreasoning. Moreover, at the elementary school level, geometry, measurement, data analysis, pattering,and spatial ability, as they support logical thinking and problem solving, have been shown to play animportant role in children’s mathematical developments [9,23]. Geary et al. [24] found in an eight-yearlongitudinal study through eighth grade that the importance of prior mathematical competencies onsubsequent mathematics achievements increase across grades, with number knowledge and arithmeticskills. Overall, they shown that domain-general abilities were more important than domain-specificknowledge for mathematics learning in early grades.
Sustainability 2019, 11, 2569 3 of 13
Nguyen et al. [9], in another longitudinal study found early numeracy abilities to be the strongestpredictors of later mathematics achievement, with advanced counting competencies more predictivethan basic counting competencies. They developed a theory of the developmental relationships betweendifferent sets of children’s mathematical competencies to help practitioners considerably improvemathematics education, especially among low socioeconomic status (SES) children. Research findingssupport the practice of evaluating children’s mathematical competencies during childhood as a meanof assessing any difficulties and forecasting academic achievement in future grades. A recent study onmathematics achievement in Turkish fifth graders [25] revealed that there is a significant differencebetween learning styles and students’ achievements in mathematics. Moreover, students with highmetacognitive awareness, achieve better grades in mathematics than other students. A significantdifference was also found between the metacognitive awareness scores of males and females.These differences maybe the results of biological, social and cultural factors [25]. Early predictors ofmathematics achievement can be successfully targeted by educators in elementary school.
Assessing key mathematics competencies can support researchers and practitioners to identifychildren likely to struggle with math in later grades, and target more services toward these childrenable to support the sustainable development of their talents [4,5].
1.2. Assessing Mathematical Competence: The Use of Standardised Test
To assess mathematical competences, Curzon [26] suggested multiple-choice questions (MCQs).Ebel [27]. This methodological approach enables reliable and objective marking, quick feedbacks, and itallows for the standardisation and meaningful comparison of scores and students. Nevertheless, thereare disadvantages to the use of MCQs, although Curzon [26] (p. 374) believed that “guessing inmultiple-choice tests is not regarded as a major problem by examination boards, guessing multiplechoice questions may be critical in certain circumstances, and additionally it may not allow studentsto attempt questions if those should be answered in a more discursive manner”. Further, the debateabout the use of standardised tests in school underlines several potential problems, for instance theymay evaluate only competence in short timeframe [28], tests results can be influenced by anxiety [29]and the use of these instruments may require preparatory work for teachers, thus take time awayfrom teaching [30]. Conversely, standardised tests can provide useful and more objective informationto teachers than the classical class evaluation. Standardised tests are usually administered, scored,and interpreted in standardised manner, which requires all test takers to answer the same questions,in a consistent way, with the same testing directions, time limits and scoring [31]. In school, tests areused as a fair and objective measure of student achievement [32]. They can be criterion-referenced(designed to measure student performance against a fixed set of predetermined criteria or learningstandards) or standard-referenced [33], where students have to meet expected standards to be deemed“proficient“. In this second case, tests are designed to compare and rank test takers in relation to oneanother, and students’ results are compared against the performance results of a statistically selectedgroup of similar test takers, typically of the same age or grade level, who took the same test [34].The development of numerical abilities and math-related skills is a heavily researched topic. Despite thenumber of research studies, however, the current literature still lacks a thorough examination of howperformance on various math tasks might be interrelated [13,14]. To combine these two types of testsand overcome issues and limitations in the assessment of students’ mathematical competence, the MCSwas designed based on Item Response Theory (IRT) [35–37], as described in Section 2.
Furthermore, building on the most recent research literature on mathematics assessment andeducation and the work of vom Hofe and colleagues, the MCS was developed as a tool to analysecognitive processing skills, different mathematical actions and the use of certain verbs to describe anddifferentiate the different levels of understanding.

Sustainability 2019, 11, 2569 4 of 13
1.3. The MCS Theoretical Framework
The MCS theoretical framework is aligned with the conceptualisation of mathematical literacy [38]used in the Program for International Student Assessment (PISA) to monitor the outcomes ofeducation systems. A draft of the Pisa [39] mathematics framework was circulated for feedbackto over 170 mathematics experts from 40 countries. The overall intention of PISA is to give aforward-looking assessment of the outcome of primary schooling, by evaluating students’ learningin relation to the challenge of real life in different contexts in the three major areas of reading,mathematics and science [40]. PISA survey items have been prepared with the intention of assessingdifferent parts of mathematical literacy independently of each other, and describe key conceptualideas in mathematical modelling and problem solving [41,42] with emphasis on the acquisition ofmathematical knowledge. In particular, Pisa’s second section “Organizing the Domain” describesthe way mathematical knowledge is organised and the content knowledge that is relevant to anassessment of mathematical processes and the fundamental mathematical competencies underlyingthose processes. Specifically, the process of learning addressed in the OCDE [43] is characterised notonly by the transmission of knowledge occurring during formal teaching, but also by individual andcontextual variables affecting the children’s everyday learning process. Knowledge concerned on thatstudent need to perform, while competences that on putting mathematical knowledge and skills to use(i.e., the process that students need to perform), rather than simply testing this knowledge as taughtwithin the school curriculum [43,44]. In looking at the aspects of the content mathematical knowledgecombined with mathematical competence, Swiss experts in didactic of mathematics have workedtogether since 2015 to produce a shared theoretical framework of the fundamental competences thateach student needs to develop at the different stages of the compulsory education. Building on themathematical knowledge and process, based on the PISA research theoretical background, the groupdeveloped the MCS. This instrument covers parts of the math curriculum in schools through thesix dimensions reported in Section 2.2. The different domains are relevant for the fourth graders ofprimary school.
1.4. Objectives
This paper presents the psychometric properties and the results of the validation process of aninnovative one-dimensional Mathematical Competence Scale (MCS) assessing six different domains ofmathematical knowledge.
2. Materials and Methods
2.1. Context of the Study
The study was carried out in Switzerland, which is a federated nation with 26 different cantons andno common educational system. The Swiss school system, based on an inter-cantonal agreement [45],provides guidelines and a list of core educational competences, including mathematics, in an effortto standardise education across cantons. In 2011, the Plenary Assembly of the Swiss Conference ofCantonal Ministers of Education specifically asked the Centre for Innovation and Research on EducationSystems (CIRSE) to develop standardised tests for assessing students’ mathematical competence inprimary schools.
2.2. Scale Development
The content of the test has been decided by a group of school stakeholders in Switzerland (schooldirectors, teachers, and disciplinary experts). The items have been produced by a group of teachersand disciplinary experts and evaluated by a teacher of didactic of mathematics to grant the adequacyto the content of the discipline and the pupils’ abilities. The scale comprises six different domainsof mathematical knowledge: (1) data analysis and relationships (i.e., “knowing, recognizing anddescribing” (AR_SRD); (2) geometry 1 (i.e., “knowing, recognizing and describing” (GEO_SRD);
Sustainability 2019, 11, 2569 5 of 13
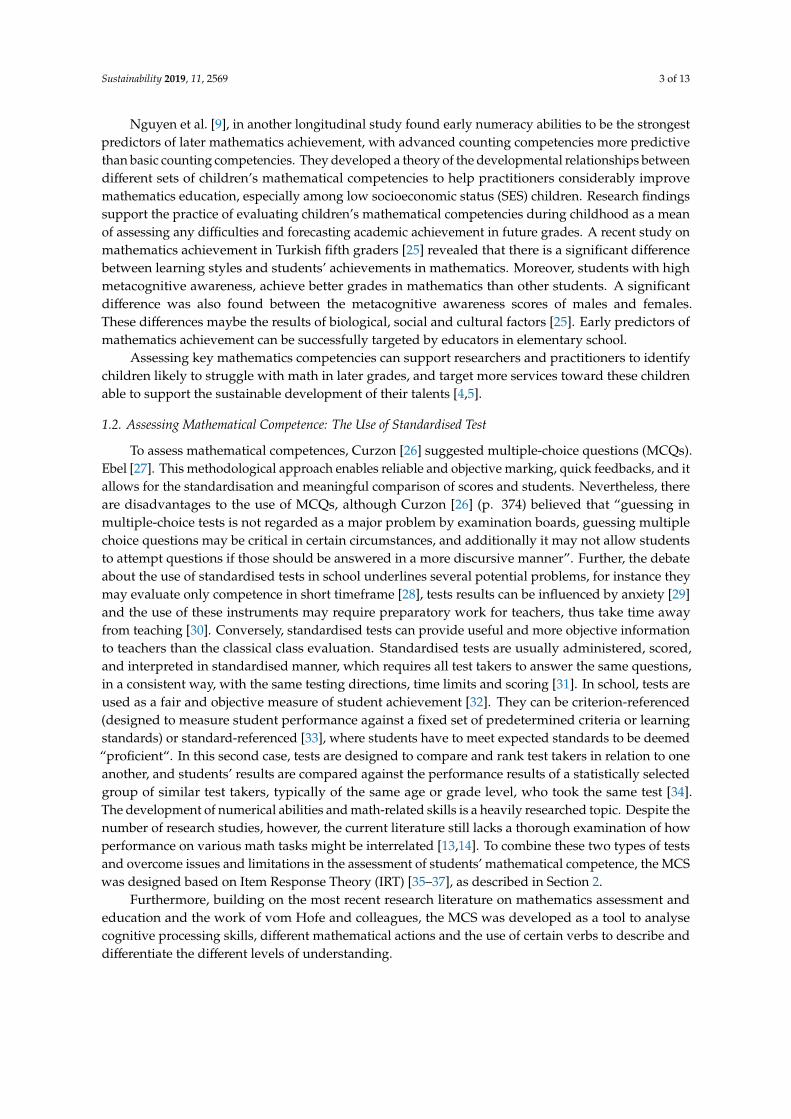
(3) geometry 2 (i.e., “performing and applying” (GEO_EA); (4) dimensions and measurements (i.e.,“performing and applying); (GM_EA); (5) numbers and calculations 1 (i.e., “arguing and justifying”(NC_AG); and (6) numbers and calculations 2 (i.e., “performing and applying”(NC_EA). The entire setof items are reported in [46]. The six dimensions of the scale and their characteristics are presented inTable 1.
Table 1. MCS six dimensions of mathematical knowledge.
Competence Dimensions Activities Description
AR_SDR Data Analysis andRelationships
Knowing, recognising,describing
Display and analyse data; use various measures associatedwith data to draw conclusions, identify trends anddescribe relationships.
GEO_SRD Geometry Knowing, recognisingand describing Identify, compare, sort, and classify two dimensional shapes
GEO_EA Geometry Performing and applying Understand concepts of two-dimensions and applying thistechnique to solve real world problems.
GM_EA Dimensions andmeasurements Performing and applying
Compare and transform unit of measurement (money, lengths,widths, mass, time, capacity)Calculate
NC_AG Numbers andcalculations Arguing and justifying Motivate statements concerning mathematical rules
NC_EA Numbers andcalculations Performing and applying
Perform with mental and written calculation techniques the4 operations with numbers up to 5 digits and decimals upto hudredths.Apply the properties of operations to simplify the calculation.Compare two calculations and decide equivalence.
2.3. Participants
The MCS was initially administered to a random sub-sample of 1683 fourth graders, of primaryschool, with the purpose of items selection. Successively, the scale was validated on the entirepopulation of 2935 fourth graders of primary schools, aged 10–14 years, 1517 males (51.7%) and1418 females (48.3%), from all 196 elementary schools in Canton Ticino, Switzerland. The majority ofstudents (n = 2539) were 10 years old at the time of testing, 4 were 9 years old, 364 were 11 years old,27 were 12 years old and just 1 was 13 years old.
2.4. Data Analysis: Item Response Theory
The MCS was designed based on Item Response Theory (IRT) [35–37]. IRT, by estimating eachindividual item’s discrimination on the latent trait and difficulty within a population, providesinformation on the validity of the items and identifies low performance indicators. Through thespecification of a mathematical statistical model, IRT allows the evaluation of the performance of a givensubject as a function of his/her latent ability. As a result, IRT assesses both respondents’ performanceand the characteristics of each item offering the possibility to evaluate individual characteristics andto compare performance across subjects [37,47]. In other words, IRT is appropriate for developinginstruments aimed at accurately measuring a specific level of the ability assessed. One example ofthe IRT is the Mathematical Achievement Test (MAT) [48,49], used across all grades of secondaryschool, which measures students’ modelling competencies and algorithmic competencies in arithmetic,algebra, and geometry. In psychometric field, the true unknown measure is latent and unobservableso the classical calibration models cannot be applied. In some statistical models, the answers tothe items (Y1, Y2, . . . , Yn) are functions of some psychological characteristic (X) that is called latent.As suggested by De Battisti, Salini and Crescentini [49]: the most important model to define themeasure of a latent variables is the Rasch model (Rasch, Copenhagen, Denmark, 1960) [50]”. The Raschmodel allows measuring both item difficulty and subject ability. The following relation expresses theprobability of a right answer in the dichotomous case: xij is the answer of subject i (i = 1, . . . , n) to itemj (j = 1, . . . , k), i depicting the skill of the subject i and j is the difficulty of the item j.

Sustainability 2019, 11, 2569 6 of 13
According to IRT, to measure the discrimination capacity of an item, as well as its consistency withinthe six identified dimensions of mathematical knowledge, each item needs to be relevant to only onedimension. For this reason, it is recommended to administer an item to a least 200–300 students to getreliable results on the quality of the item. From the original pool of 300 items, previously identified [51],we selected the more suitable based on their measurement and discrimination quality [52], that is,the number of correct answers for each item. Items receiving a high number of correct answers only bystudents with the lowest overall score, and items with no or all correct answers were eliminated.
Analyses were performed using SPSS for descriptive analyses and ConQuest software (Version 3,Acer, Camberwell, Australian) for model fit and item analysis based on Item Response Theory(IRT) [53,54].
2.5. Procedure
This validation of the scale has structured into two phases, “test administration” and “model fitand item selection”
Phase 1: Test Administration
As shown in Figure 1, the initial pool of 300 items was administered over 10 test booklets (A–K)to a sample of 1683 fourth grader students. Every booklet consisted of about 30 items ranked byincreasing difficulty. Consequently, we expected a very large number of students to initially respondcorrectly and this number to decline with the increasing difficulty, to reach the smallest number for themost difficult items, which only the most competent students could answer correctly (from three out ofthe six identified dimensions of mathematical knowledge). As each booklet covered only three of thesix mathematical dimensions, they were combined and administered in pairs, to guarantee items fromall six dimensions. Furthermore, every booklet was included in two different pairs, in different order.
Figure 1. Multi Matrix Test Design.
Each student was administered two booklets covering items from all six mathematical dimensions.The second booklet was administered one week after the first administration, to reduce the effect oflearning. However, in the second administration the number of correct answers slightly increasedcompared to the first. All students had enough time to confront all items. The Rasch model requiresthat each item be approached by all subjects and that the items be proposed in a growing difficultyorder. For this reason, the test was split into two session, each 50 min.
Phase 2: Model Fit and Items Selection
Through IRT [55,56] analysis and subsequent trials, 120 items, divided into six dimensions, wereselected from the original 300. We then analyzed whether the model fit could be improved by choosinga multidimensional Rash model instead of a one-dimensional model, following a three-step procedure.
First, we analyzed the fit of the data to different item response models (i.e., with one dimensionand multidimension). Secondly, we matched the two models and the one-dimensional model with thesubdomains. Finally, analyzed both items quality and item fit for the two models.

Sustainability 2019, 11, 2569 7 of 13
3. Results
The results of the first step analysis confirm that the multidimensional model fitted the datasignificantly better than the one-dimensional model. In particular, the differences of the deviancebetween the two models are significant (χ2 (20) = 642.66, p < 0.001). However, the correlationscoefficient between the six dimensions are high varying, from 0.67 to 0.84 [57], as shown in Table 2.
Table 2. Correlation between the MCS subdomains of mathematical knowledge.
Competences AR_SRD GEO_EA GEO_SRD GM_EA NC_AG NC_EA
GEO_EA 0.76 1.00 - - - -
GEO_SRD 0.69 0.84 1.00 - -
GM_EA 0.78 0.84 0.77 1.00 - -
NC_AG 0.72 0.80 0.78 0.83 1.00 -
NC_EA 0.67 0.68 0.74 0.79 0.81 1.00
In looking at the high correlation between the six dimensions (from 0.67 to 0.84), we decided for aone-dimensional model. Those high correlation signal the existence of a “Mathematics” latent construct.The deviances of the one-dimensional model and the one-dimensional model with subdomains werecompared. The results indicate the model with subdomains fitted the data significantly better thanthe one-dimensional model (χ2 (274) = 558.17, p < 0.001). The items with the highest quality andfit for testing the ability of the students were identified and selected by considering five indicators:percentage of correct answer for item and per dimension; item ability to discriminate; fit of the item toRash Model (Weighted Mean Square; MNSQ); T statistics; and Items Characteristics Curve (ICC).
The difficulty of an item was represented by the percentage of students that solved it correctly.It can be expected that most of students have an average mathematical ability, consequently itemsshould have average difficulty (i.e., a percentage of correct answer between 25% and 75%). Figure 2shows the percentage of correct responses per item for each of the six dimensions. While the dimension“AR_SRD” presented a few items difficult to very difficult, all other dimensions were distributed in amore balanced way.
Figure 2. Percentage of correct responses per item (20) for each dimension.
The discrimination of an item refers to its correlation with the number of items solved correctly.Therefore, if an item received a high number of correct answers, but only by students with low overallscores in the test, it was eliminated. Moreover, items with all or no correct answers were also eliminated,due to their poor ability to discriminate. A discrimination coefficient between 0.3 and 1 reflects
Sustainability 2019, 11, 2569 8 of 13
differences in student achievement, high and low score in different dimensions so that distinctions maybe made among the performances of students [58]. A coefficient near 0 indicates that an item does notdifferentiate between students and a negative coefficient indicates that expert students solve the itemcorrectly less often than non-expert students. Items with a negative discrimination coefficient weretherefore excluded as well. The presence of items covering all levels of difficulty in a mathematical testmakes it possible to identify students at all levels of expertise.
The model in fit (Weighted Mean Square; MSNQ) indicates the fit of an item to the Raschmodel by analyzing the number of unexpected answers that differ from the prediction of the Raschmodel. A value close to 1 indicates that the item fits the model well [59]. However, values smallerthan 1 indicate that the item discriminates stronger than predicted by the model (over-fit), whilevalues greater than 1 indicate that the item discriminates less than predicted by the model (under-fit).Therefore, only items with MSNQ scores between 0.7 and 1.3 were selected for the final version of theMCS. Moreover, for every fit value, showing whether the in fit differs statistically and significantlyfrom expected value 1, a t-test was calculated (MSNQ shows the difference between expected andobserved value). This difference is statistically significant if t value is less than −1.96 or greater than1.96 (p < 0.05) [58]. However, it is important to note that t statistics depends on the sample size [56].
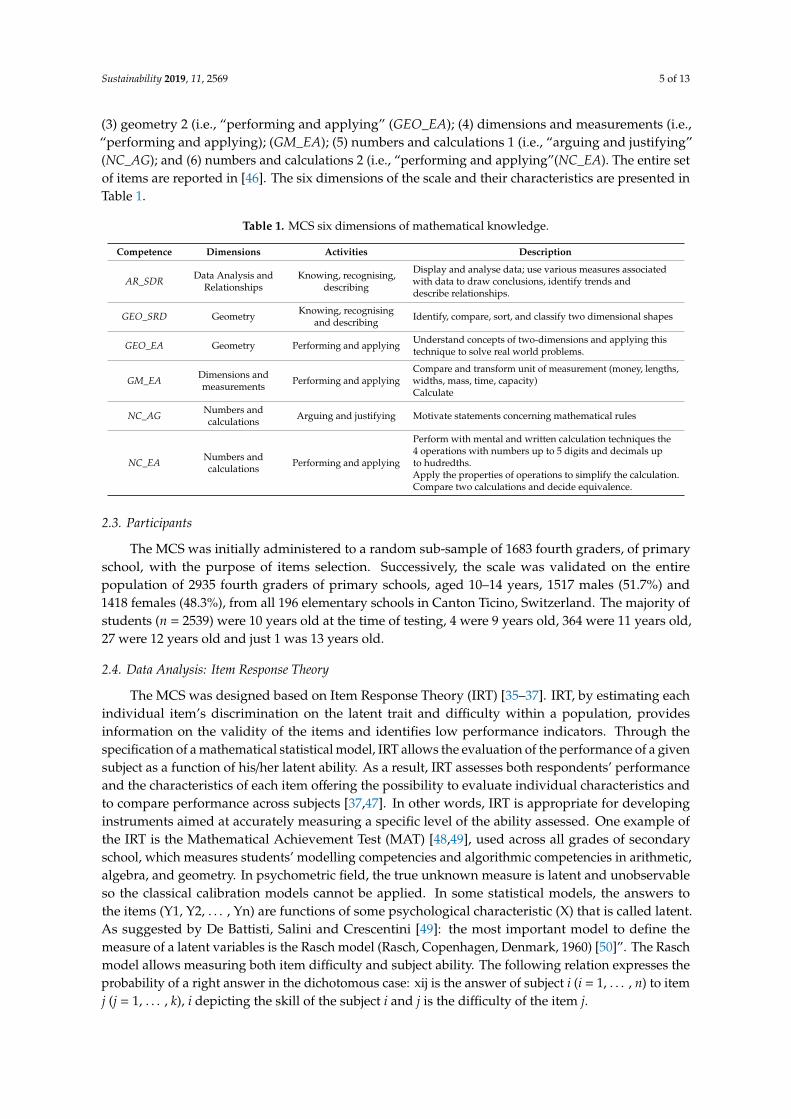
Furthermore, the item characteristic curve (ICC) of each item was considered. ICC is a function ofthe ability of the students and the probability for solving an item correctly. It gives further informationabout the fit of item to the Rash model. The continuous line represents the expected curve of the itemaccording to the model. The dotted line represents the observed curve. Figure 3 shows an ICC of anitem that fit very well to the Rasch model. The two lines are close together, which indicates a goodmodel fit.
Figure 3. Item characteristic curve of an item the fit very well to the Rasch model.
At the end of the item selection, only 120 items, from the initial 300, fitted well the five indicatorsdescribed above and were included in the final version of the MCS scale. Once aggregated in onemathematical factor, it showed a good reliability with a Cronbach’s alpha of 0.91. Cronbach’s alphawas also consistent across gender (male = 0.90 and female = 0.91; see Table 3).
Table 3. Gender difference and Cronbach’s alpha for the MCS.
Gender n Mean SD F-Value α
M 1517 51.378 106.61 700.179 * 0.91F 1418 49.732 103.54 697.260 * 0.90
n = 2935; * p < 0.05.
Sustainability 2019, 11, 2569 9 of 13
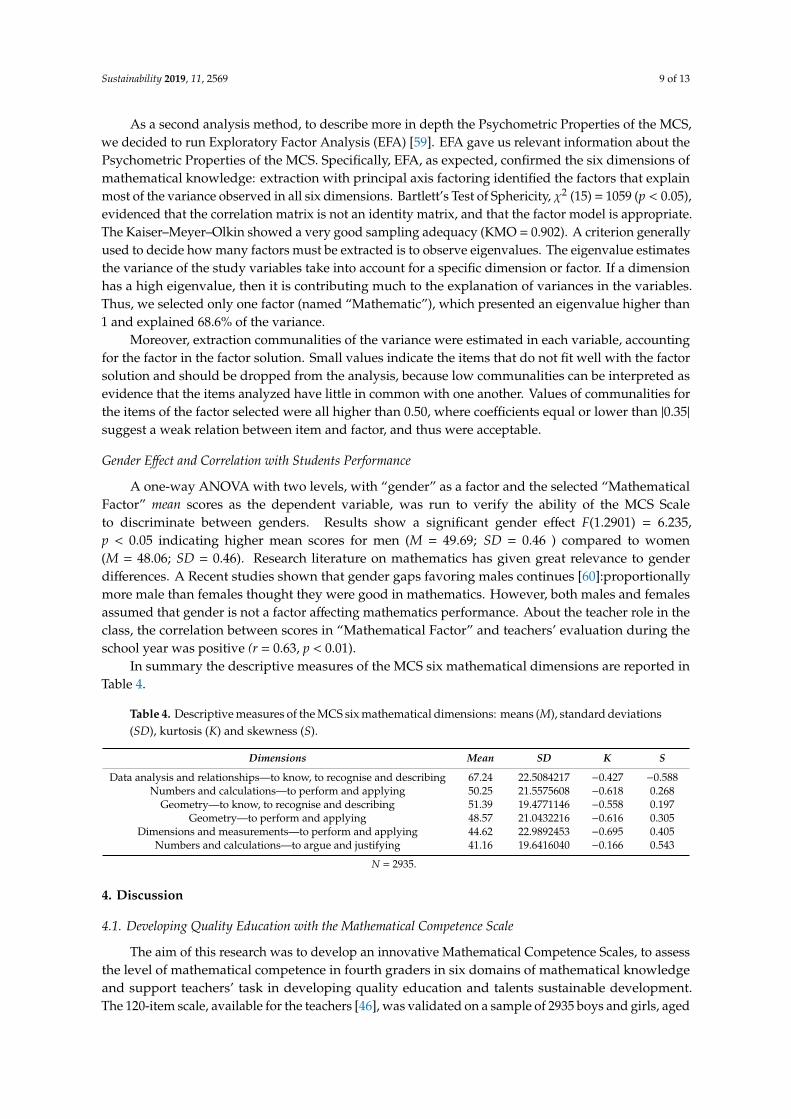
As a second analysis method, to describe more in depth the Psychometric Properties of the MCS,we decided to run Exploratory Factor Analysis (EFA) [59]. EFA gave us relevant information about thePsychometric Properties of the MCS. Specifically, EFA, as expected, confirmed the six dimensions ofmathematical knowledge: extraction with principal axis factoring identified the factors that explainmost of the variance observed in all six dimensions. Bartlett’s Test of Sphericity, χ2 (15) = 1059 (p < 0.05),evidenced that the correlation matrix is not an identity matrix, and that the factor model is appropriate.The Kaiser–Meyer–Olkin showed a very good sampling adequacy (KMO = 0.902). A criterion generallyused to decide how many factors must be extracted is to observe eigenvalues. The eigenvalue estimatesthe variance of the study variables take into account for a specific dimension or factor. If a dimensionhas a high eigenvalue, then it is contributing much to the explanation of variances in the variables.Thus, we selected only one factor (named “Mathematic”), which presented an eigenvalue higher than1 and explained 68.6% of the variance.
Moreover, extraction communalities of the variance were estimated in each variable, accountingfor the factor in the factor solution. Small values indicate the items that do not fit well with the factorsolution and should be dropped from the analysis, because low communalities can be interpreted asevidence that the items analyzed have little in common with one another. Values of communalities forthe items of the factor selected were all higher than 0.50, where coefficients equal or lower than |0.35|
suggest a weak relation between item and factor, and thus were acceptable.
Gender Effect and Correlation with Students Performance
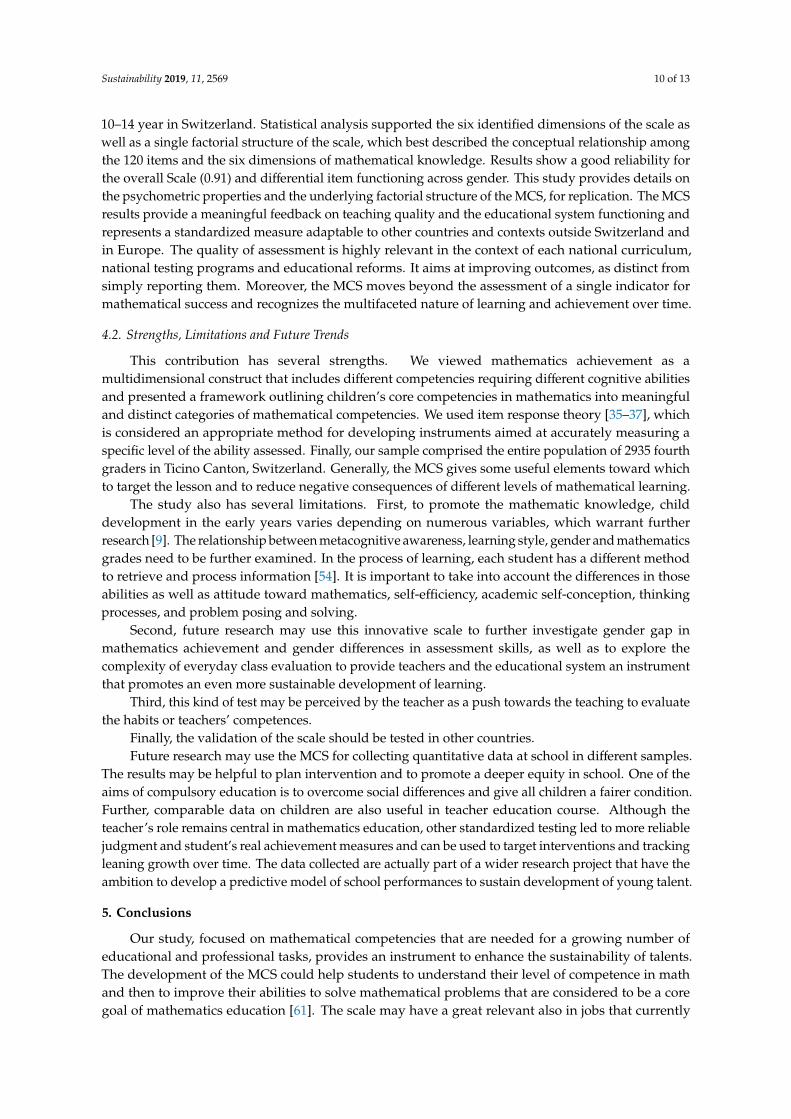
A one-way ANOVA with two levels, with “gender” as a factor and the selected “MathematicalFactor” mean scores as the dependent variable, was run to verify the ability of the MCS Scaleto discriminate between genders. Results show a significant gender effect F(1.2901) = 6.235,p < 0.05 indicating higher mean scores for men (M = 49.69; SD = 0.46 ) compared to women(M = 48.06; SD = 0.46). Research literature on mathematics has given great relevance to genderdifferences. A Recent studies shown that gender gaps favoring males continues [60]:proportionallymore male than females thought they were good in mathematics. However, both males and femalesassumed that gender is not a factor affecting mathematics performance. About the teacher role in theclass, the correlation between scores in “Mathematical Factor” and teachers’ evaluation during theschool year was positive (r = 0.63, p < 0.01).
In summary the descriptive measures of the MCS six mathematical dimensions are reported inTable 4.
Table 4. Descriptive measures of the MCS six mathematical dimensions: means (M), standard deviations(SD), kurtosis (K) and skewness (S).
Dimensions Mean SD K S
Data analysis and relationships—to know, to recognise and describing 67.24 22.5084217 −0.427 −0.588Numbers and calculations—to perform and applying 50.25 21.5575608 −0.618 0.268
Geometry—to know, to recognise and describing 51.39 19.4771146 −0.558 0.197Geometry—to perform and applying 48.57 21.0432216 −0.616 0.305
Dimensions and measurements—to perform and applying 44.62 22.9892453 −0.695 0.405Numbers and calculations—to argue and justifying 41.16 19.6416040 −0.166 0.543
N = 2935.
4. Discussion
4.1. Developing Quality Education with the Mathematical Competence Scale
The aim of this research was to develop an innovative Mathematical Competence Scales, to assessthe level of mathematical competence in fourth graders in six domains of mathematical knowledgeand support teachers’ task in developing quality education and talents sustainable development.The 120-item scale, available for the teachers [46], was validated on a sample of 2935 boys and girls, aged
Sustainability 2019, 11, 2569 10 of 13
10–14 year in Switzerland. Statistical analysis supported the six identified dimensions of the scale aswell as a single factorial structure of the scale, which best described the conceptual relationship amongthe 120 items and the six dimensions of mathematical knowledge. Results show a good reliability forthe overall Scale (0.91) and differential item functioning across gender. This study provides details onthe psychometric properties and the underlying factorial structure of the MCS, for replication. The MCSresults provide a meaningful feedback on teaching quality and the educational system functioning andrepresents a standardized measure adaptable to other countries and contexts outside Switzerland andin Europe. The quality of assessment is highly relevant in the context of each national curriculum,national testing programs and educational reforms. It aims at improving outcomes, as distinct fromsimply reporting them. Moreover, the MCS moves beyond the assessment of a single indicator formathematical success and recognizes the multifaceted nature of learning and achievement over time.
4.2. Strengths, Limitations and Future Trends
This contribution has several strengths. We viewed mathematics achievement as amultidimensional construct that includes different competencies requiring different cognitive abilitiesand presented a framework outlining children’s core competencies in mathematics into meaningfuland distinct categories of mathematical competencies. We used item response theory [35–37], whichis considered an appropriate method for developing instruments aimed at accurately measuring aspecific level of the ability assessed. Finally, our sample comprised the entire population of 2935 fourthgraders in Ticino Canton, Switzerland. Generally, the MCS gives some useful elements toward whichto target the lesson and to reduce negative consequences of different levels of mathematical learning.
The study also has several limitations. First, to promote the mathematic knowledge, childdevelopment in the early years varies depending on numerous variables, which warrant furtherresearch [9]. The relationship between metacognitive awareness, learning style, gender and mathematicsgrades need to be further examined. In the process of learning, each student has a different methodto retrieve and process information [54]. It is important to take into account the differences in thoseabilities as well as attitude toward mathematics, self-efficiency, academic self-conception, thinkingprocesses, and problem posing and solving.
Second, future research may use this innovative scale to further investigate gender gap inmathematics achievement and gender differences in assessment skills, as well as to explore thecomplexity of everyday class evaluation to provide teachers and the educational system an instrumentthat promotes an even more sustainable development of learning.
Third, this kind of test may be perceived by the teacher as a push towards the teaching to evaluatethe habits or teachers’ competences.
Finally, the validation of the scale should be tested in other countries.Future research may use the MCS for collecting quantitative data at school in different samples.
The results may be helpful to plan intervention and to promote a deeper equity in school. One of theaims of compulsory education is to overcome social differences and give all children a fairer condition.Further, comparable data on children are also useful in teacher education course. Although theteacher’s role remains central in mathematics education, other standardized testing led to more reliablejudgment and student’s real achievement measures and can be used to target interventions and trackingleaning growth over time. The data collected are actually part of a wider research project that have theambition to develop a predictive model of school performances to sustain development of young talent.
5. Conclusions
Our study, focused on mathematical competencies that are needed for a growing number ofeducational and professional tasks, provides an instrument to enhance the sustainability of talents.The development of the MCS could help students to understand their level of competence in mathand then to improve their abilities to solve mathematical problems that are considered to be a coregoal of mathematics education [61]. The scale may have a great relevant also in jobs that currently

Sustainability 2019, 11, 2569 11 of 13
require higher mathematical proficiency than ever before [9]. Our findings suggest the importance toconsider the sub-dimensions of mathematical competence to fill the gap among students in specificdomains of mathematical competence. This result holds promise for future research; for instance,it gives teachers some useful elements for targeting interventions to enhance children’s learning speed.Primary schools, in particular, have a central role to grow children’s mathematical competence [62].Generally, an understanding of mathematics plays a central role to young person’s preparedness for lifein modern society. The MCS could promote a positive experience in mathematics early in school that isa critical moment to facilitate future engagement in the subject. Furthermore, the teaching of Science,Technology, Engineering, and Mathematics (STEM) [63] has taken on new importance as economiccompetition has become truly global. Engaging teacher and students in high quality STEM educationrequires tests to assess mathematics curriculum, and also promote scientific inquiry. To address theecological and social problems of sustainability in our modern times, students need to be supported bythe teacher in understanding of STEM concepts and practices [64].
Author Contributions: Conceptualization: D.B., A.C., S.C., G.F., L.F. and P.A.; Methodology: D.B.; Formalanalysis: D.B and G.Z.; Investigation: D.B., A.C., G.Z., S.C., G.F., L.F. and P.A.; Resources: A.C. and G.Z.; Datacuration: D.B.; Writing—original draft preparation: D.B. and G.G; Writing—review and editing: A.C., S.C., G.F.,L.F., P.A. and G.G; Visualization: D.B.; Supervision: S.C.; Project administration: D.B.
Funding: This research received no external funding.
Conflicts of Interest: The authors declare no conflict of interest.
References
1. National Research Council. Mathematics in Early Childhood: Learning Paths toward Excellence and Equity;National Academy Press: Washington, DC, USA, 2009.
2. Di Fabio, A. The psychology of sustainability and sustainable development for well-being in organizations.Front. Psychol. 2017, 8, 1534. [CrossRef] [PubMed]
3. Di Fabio, A. Positive Healthy Organizations: Promoting well-being, meaningfulness, and sustainability inorganizations. Front. Psychol. 2017, 8, 1938. [CrossRef] [PubMed]
4. Di Fabio, A.; Rosen, M.A. Opening the Black Box of Psychological Processes in the Science of SustainableDevelopment: A New Frontier. Eur. J. Sustain. Dev. Res. 2018, 2, 47. [CrossRef]
5. Di Fabio, A.; Kenny, M.E. Connectedness to nature, personality traits and empathy from a sustainabilityperspective. Curr. Psychol. 2018, 1–12. [CrossRef]
6. Jappelli, T.; Padula, M. Investment in financial literacy and saving decisions. J. Bank. Financ. 2013, 37,2779–2792. [CrossRef]
7. Kennedy, T.J.; Odell, M.R.L. Engaging Students in STEM Education. Sci. Educ. Int. 2014, 25, 246–258.8. OECD. PISA 2015 Assessment and Analytical Framework: Science, Reading, Mathematic, Financial Literacy and
Collaborative Problem Solving; OECD Publishing: Paris, France, 2017.9. Nguyen, T.; Watts, T.W.; Duncan, G.J.; Clements, D.H.; Sarama, J.S.; Wolfe, C.; Spitler, M.E. Which preschool
mathematics competencies are most predictive of fifth grade achievement? Early Child. Res. Q. 2016, 36,550–560. [CrossRef]
10. Salekhova, L.L.; Tuktamyshov, N.K.; Zaripova, R.R.; Salakhov, R.F. Definition of Development Level ofCommunicative Features of Mathematical Speech of Bilingual Students. Life Sci. J. 2014, 11, 524–526.
11. Alpyssov, A.; Mukanova, Z.; Kireyeva, A.; Sakenov, J.; Kervenev, K. Development of Intellectual Activity inSolving Exponential Inequalities. Int. J. Environ. Sci. Educ. 2016, 11, 6671–6686.
12. Liu, X.; Gao, X.; Ping, S. Post-1990s College Students Academic Sustainability: The Role of Negative Emotions,Achievement Goals, and Self-efficacy on Academic Performance. Sustainability 2019, 11, 775. [CrossRef]
13. Kriegbaum, K.; Jansen, M.; Spinath, B. Motivation: A predictor of PISA’s mathematical competence beyondintelligence and prior test achievement. Learn. Individ. Differ. 2015, 43, 140–148. [CrossRef]
14. Moore, A.M.; Ashcraft, M.H. Children’s mathematical performance: Five cognitive tasks across five grades.J. Exp. Child Psychol. 2015, 135, 1–24. [CrossRef]
15. Maree, J.; Di Fabio, A. Integrating Personal and Career Counseling to Promote Sustainable Development andChange. Sustainability 2018, 10, 4176. [CrossRef]
Sustainability 2019, 11, 2569 12 of 13
16. Bascopé, M.; Perasso, P.; Reiss, K. Systematic Review of Education for Sustainable Development at an EarlyStage: Cornerstones and Pedagogical Approaches for Teacher Professional Development. Sustainability 2019,11, 719. [CrossRef]
17. Joutsenlahti, J.; Perkkilä, P. Sustainability Development in Mathematics Education—A Case Study of WhatKind of Meanings Do Prospective Class Teachers Find for the Mathematical Symbol “2/3”? Sustainability2019, 11, 457. [CrossRef]
18. Ambrose, D.; Sternberg, R.J. Giftedness and talent in the 21st century. Adapting to the turbulence ofglobalization. Australas. J. Gift. Educ. 2016, 25, 70–73.
19. European Parliament. Recommendation of the European Parliament and of the Council of 18 December2006 on Key Competences for Lifelong Learning; Official Journal of the European Union L394: 2006.Available online: https://eur-lex.europa.eu/legal-content/EN/TXT/PDF/?uri=CELEX:32006H0962&from=EN(accessed on 18 February 2019).
20. Perso, T. Assessing Numeracy and NAPLAN. Aust. Math. Teach. 2011, 67, 32–35.21. Clements, D.H.; Sarama, J. Early childhood mathematics learning. In Second Handbook on Mathematics Teaching
and Learning; Lester, F.K., Jr., Ed.; Information Age: Charlotte, NC, USA, 2007; pp. 461–555.22. Adelson, J.L.; Dickinson, E.R.; Cunningham, B.C. Differences in the reading–mathematics relationship: A
multi-grade, multi-year statewide examination. Learn. Individ. Differ. 2015, 43, 118–123. [CrossRef]23. Schoenfeld, A. Reflections on problem solving theory and practice. Math. Enthus. 2013, 10, 9–34.24. Geary, D.C.; Nicholas, A.; Li, Y.; Sun, J. Developmental change in the influence of domain-general abilities and
domain-specific knowledge on mathematics achievement: An eight-year longitudinal study. J. Educ. Psychol.2017, 109, 680–693. [CrossRef] [PubMed]
25. Baltaci, S.; Yildiz, A.; Ozeakir, B. The Relationship between Metacognitive Awareness Levels, Learning Styles,Genders and Mathematics Grades of Fifth Graders. J. Educ. Learn. 2016, 5, 78–89. [CrossRef]
26. Curzon, L.B. Teaching in Further Education: An Outline of Principles and Practice, 5th ed.; Cassell: London, UK, 1997.27. Ebel, R.L. Essentials of Educational Measurement, 1st ed.; Prentice Hall: Upper Saddle River, NJ, USA, 1972.28. Boaler, J. When learning no longer matters: Standardized testing and the creation of inequality.
Phi Delta Kappan 2003, 84, 502–506. [CrossRef]29. Buck, S.; Ritter, G.W.; Jensen, N.C.; Rose, C.P. Teachers say the most interesting things—An alternative view
of testing. Phi Delta Kappan 2010, 91, 50–54. [CrossRef]30. Barrier-Ferreira, J. Producing commodities or educating children? Nurturing the personal growth of students
in the face of standardized testing. Clear. House 2008, 81, 138–140. [CrossRef]31. Woolfolk, A. Educational Psychology, 10th ed.; Pearson Education Inc.: Boston, MA, USA, 2007.32. Boncori, L. Teoria e Tecniche dei Test; Bollati Boringhieri: Torino, Italy, 1993.33. EACEA. National Testing of Pupils in Europe: Objectives, Organisation and Use of Results; Education, Audiovisual
and Culture Executive Agency: Brussels, Belgium, 2009. [CrossRef]34. Popham, W.J. Classroom Assessment: What Teachers Need to Know, 6th ed.; Pearson Education, Inc.: Boston,
MA, USA, 2011.35. Lord, F.M. Applications of Item Response Theory to Practical Testing Problems; Erlbaum: Hillside, NJ, USA, 1980.36. Embretson, S.E.; Reise, S. Item Response Theory for Psychologists; Lawrence Erlbaum Associates: Mahwah, NJ,
USA, 2000.37. Liu, Y.; Maydeu-Olivares, A. Local dependence diagnostics in IRT modeling of binary data. Educ. Psychol. Meas.
2013, 73, 254–274. [CrossRef]38. OECD. Assessing Scientific, Reading and Mathematical Literacy. A Framework for PISA 2006; OECD Publishing:
Paris, France, 2006. Available online: https://www.oecd-ilibrary.org/docserver/9789264026407-en.pdf(accessed on 18 February 2019).
39. OECD. PISA 2012 Assessment and Analytical Framework: Mathematics, Reading, Science, Problem Solving andFinancial Literacy; OECD Publishing: Paris, France, 2013. [CrossRef]
40. OECD. The PISA 2003 Assessment Framework: Mathematics, Reading, Science and Problem Solving Knowledge andSkills, OECD Publishing: Paris, France, 2004. [CrossRef]
41. Blum, W. On the role of “Grundvorstellunge” for reality-related proofs—Examples and reflections.In Mathematical Modeling—Teaching and Assessment in a Technology-Rich World; Galbraith, P., Blum, W.,Booker, G., Huntley, I., Eds.; Harwood Publishing: Chichester, UK, 1998; pp. 63–74.
Sustainability 2019, 11, 2569 13 of 13
42. Vom Hofe, R.; vom Kleine, M.; Blum, W.; Pekrun, R. On the role of “Grundvorstellungen” for the developmentof mathematical literacy first results of the longitudinal study PALMA. Mediterr. J. Res. Math. Educ. 2005, 4,67–84.
43. OECD. The PISA 2009 Technical Report; OECD Publishing: Paris, France, 2004. Available online: https://www.oecd.org/pisa/pisaproducts/50036771.pdf (accessed on 18 February 2019).
44. Benz, C. Attitudes of kindergarten educators about math. J. Für Math. Didakt. 2012, 33, 203–232. [CrossRef]45. CDPE—Conferenza Svizzera dei Direttori Cantonali Della Pubblica Educazione. HarmoS Concordat Accordo
Intercantonale del 14 Giugno 2007 Sull’armonizzazione Della Scuola Obbligatoria (Concordato HarmoS). Commento.Istoriato e Prospettive. Strumenti, CDPE: Berna, Switzerland, 2011. Available online: https://edudoc.ch/record/
100376/files/Harmos-konkordat_i.pdf(accessed on 18 February 2019).46. Sbaragli, S.; Franchini, E. Valutazione Didattica Delle Prove Standardizzate di Matematica di Quarta Elementare;
Dipartimento Formazione e Apprendimento: Locarno, Switzerland, 2014. Available online: http://repository.supsi.ch/8159/1/quaderno_di_ricerca_matedida.pdf (accessed on 18 February 2019).
47. Lord, F.; Novick, M. Statistical Theories of Mental Tests; Addison-Wesley: Reading, MA, USA, 1968.48. Hofe, R.; vom Pekrun, R.; Kleine, M.; Goetz, T. Projekt zur Analyse der Leistungsentwicklung in Mathematik
(PALMA): Konstruktion des Regensburger Mathematikleistungstests flir 5–10. Klassen. Z. Für Pädagogik2002, 45, 83–100.
49. Hofe, R.; vom Kleine, M.; Pekrun, R.; Blum, W. Zur Entwicklung mathematischer Grundbildung in derSekundarstufe r theoretische, empirische und diagnostische Aspekte. In Jahrbuch for Piidagogisch PsychologischeDiagnostik. Tests und Trends; Hasselhorn, M., Ed.; Hogrefe: Goettingen, Germany, 2005; pp. 263–292.
50. Rasch, G. Probabilistic Models for Some Intelligence and Attainment Tests; Danish Institute for EducationalResearch: Copenhagen, Denmark, 1960.
51. De Battisti, F.; Salini, S.; Crescentini, A. Statistical calibration of psychometric tests. Stat. E Appl. 2006, 2, 1–25.52. Crescentini, A.; Zanolla, G. The Evaluation of Mathematical Competency: Elaboration of a Standardized Test
in Ticino (Southern Switzerland). Procedia Soc. Behav. Sci. 2014, 112, 180–189. [CrossRef]53. Baker, F.; Kim, S. Item Response Theory. Parameter Estimation Techniques, 2nd ed.; Dekker: New York, NY, USA, 2004.54. Wu, M.L.; Adams, R.J.; Wilson, M.R. ACER Conquest Version 3: Generalised Item Response Modelling Software
[Computer Program]; Australian Council for Educational Research: Camberwell, Australia, 2012.55. Lord, F. A theory of test scores. Psychom. Monogr. 1952, 7, 1–84.56. Bond, T.G.; Fox, C.M. Applying the Rasch Model: Fundamental Measurement in the Human Sciences; Lawrence
Erlbaum: Mahwah, NJ, USA, 2001.57. Cohen, J. Statistical Power Analysis for the Behavioral Sciences, 2nd ed.; Erlbaum: Hillsdale, NJ, USA, 1988.58. Wu, M.; Adams, R. Applying the Rasch Model to Psycho-Social Measurement: A Practical Approach; Educational
Measurement Solutions: Melbourne, Australia, 2007.59. Costello, A.B.; Osborne, J. Best practices in exploratory factor analysis: Four recommendations for getting
the most from your analysis. Pract. Assess. Res. Eval. 2005, 7, 1–9.60. Leder, G.C.; Forgasz, H.J. I Liked It till Pythagoras: The Public’s Views of Mathematics.
Mathematics Education Research Group of Australasia. In Shaping the Future of Mathematics Education:Proceedings of the 33rd Annual Conference of the Mathematics Education Research Group of Australasia; Sparrow, L.,Kissane, B., Hurst, C., Eds.; Merga: Fremantle, Australia, 2010; pp. 328–335.
61. Schoenfeld, A. Learning to think mathematically: Problem solving, metacognition, and sense making inmathematics. In Handbook of Research on Mathematics Teaching and Learning; Grouws, D.A., Ed.; MacMillan:New York, NY, USA, 1992; pp. 165–197.
62. Newman, M.A. An analysis of sixth-grade pupils’ errors on written mathematical tasks. Vic. Inst. Educ.Res. Bull. 1977, 39, 31–43.
63. McDonald, C.V. STEM Education: A review of the contribution of the disciplines of science, technology,engineering and mathematics. Sci. Educ. Int. 2016, 27, 530–569.
64. Wahono, B.; Chang, C.-Y. Assessing Teacher’s Attitude, Knowledge, and Application (AKA) on STEM: AnEffort to Foster the Sustainable Development of STEM Education. Sustainability 2019, 11, 950. [CrossRef]
© 2019 by the authors. Licensee MDPI, Basel, Switzerland. This article is an open accessarticle distributed under the terms and conditions of the Creative Commons Attribution(CC BY) license (http://creativecommons.org/licenses/by/4.0/).
Related Documents