Math Gender Gap: The Role of Culture Natalia Nollenberger School of Business and Management, Queen Mary University of London Núria Rodríguez-Planas Queens College - CUNY, and IZA Almudena Sevilla School of Business and Management, Queen Mary University of London IZA July 2014 Abstract This paper explores the role of cultural attitudes towards women in determining math educational gender gaps using the epidemiological approach. To identify whether culture matters, we estimate whether the math gender gap for each immigrant group living in a particular host country (and exposed to the same host country's laws and institutions) is explained by measures of gender equality in the parents' country of ancestry. We find that the higher the degree of gender equality in the country of ancestry the higher the performance of second-generation immigrant girls relative to boys. This result is robust to alternative specifications, measures of gender equality, and the inclusion of other human development indicators in the country of ancestry. Culture seems primarily to operate through school peer effects. Our results suggest that policies aimed at changing beliefs can prove effective at reducing the gender gap in mathematics. Keywords: Gender Gap in Math, Immigrants, Gender Identity. JEL Codes: I21, I24, J16, Z13 ___________________________ The authors would like to express their thanks for the financial support provided by the Economic and Social Research Council (Grant Number ES/K003127/1) and the Spanish Ministry of Education and Science (Project ECO2012-34828). Correspondence to Núria Rodríguez-Planas, Queens College - CUNY, 300A Powdermaker Hall, 65-30 Kissena Blvd., Queens, New York 11367, USA. Email: [email protected]

Welcome message from author
This document is posted to help you gain knowledge. Please leave a comment to let me know what you think about it! Share it to your friends and learn new things together.
Transcript
Math Gender Gap: The Role of Culture
Natalia Nollenberger
School of Business and Management, Queen Mary University of London
Núria Rodríguez-Planas Queens College - CUNY, and IZA
Almudena Sevilla
School of Business and Management, Queen Mary University of London IZA
July 2014
Abstract
This paper explores the role of cultural attitudes towards women in determining math educational gender gaps using the epidemiological approach. To identify whether culture matters, we estimate whether the math gender gap for each immigrant group living in a particular host country (and exposed to the same host country's laws and institutions) is explained by measures of gender equality in the parents' country of ancestry. We find that the higher the degree of gender equality in the country of ancestry the higher the performance of second-generation immigrant girls relative to boys. This result is robust to alternative specifications, measures of gender equality, and the inclusion of other human development indicators in the country of ancestry. Culture seems primarily to operate through school peer effects. Our results suggest that policies aimed at changing beliefs can prove effective at reducing the gender gap in mathematics.
Keywords: Gender Gap in Math, Immigrants, Gender Identity. JEL Codes: I21, I24, J16, Z13 ___________________________
The authors would like to express their thanks for the financial support provided by the Economic and Social Research Council (Grant Number ES/K003127/1) and the Spanish Ministry of Education and Science (Project ECO2012-34828). Correspondence to Núria Rodríguez-Planas, Queens College - CUNY, 300A Powdermaker Hall, 65-30 Kissena Blvd., Queens, New York 11367, USA. Email: [email protected]

1
1. Introduction
It has been widely documented that teenage boys tend to outperform girls in math tests
in many industrialized countries.1 A recent study using longitudinal data for the US
found that by the end of fifth grade girls had fallen more than 0.2 standard deviations
behind boys, which is equivalent to 2.5 less months of schooling (Fryer and Levitt
2010). Using 2003 data from the Program for International Student Assessment (PISA)
that reports on mathematic tests scores of 15-year-old students from 40 countries, Guiso
et al. (2008) document that: "girls’ math scores average 10.5 (or 2 percent) lower score
points than those of boys, but the results vary by country: -22.6 in Turkey to 14.5 in
Iceland".2 Since mathematical ability appears to be an important determinant of field
choice for college graduates (Paglin and Rufolo 1990 and Turner and Bowen 1999) and
a significant part (between 8 and 20 percent) of the gender wage gap can be explained
by choice of major (Machin and Puhani 2003, and Black et al. 2008), understanding the
causes behind the divergence in math test scores between boys and girls is the first step
towards designing policies that aim to improve the conditions for female workers.3
Thus far the literature has focused on two broad explanations of the mathematics
gender gap: the biological versus the environment explanation. On the one hand, some
1Much of the research documenting gender gap in math scores has been based on US data. The size of the gap reported depends on the test and time-period. Some recent studies suggest that the average gender gap in math scores among teenagers has been narrowing (Hyde and Mertz 2009) while others document still large differences in the average performance of girls relative to boys (Fryer and Levitt 2010). There is a wide consensus that substantial differences persist at the top of the distribution (Ellison and Swanson 2010; Hyde and Mertz 2009) and that the fraction of males to females who score in the top 5 percent of the distribution in high school math has remained constant at two to one over the past 20 years (Xie and Shauman 2003). Ellison and Swanson (2010) document that the gender gap in secondary school math at high achievement levels is present in every US high school, although the size of the gap varies from school to school. Bedard and Cho (2010) review the existing evidence documenting gender gap in math scores in OECD countries. 2 The gender gap is calculated as the girls’ average score minus the boys’ average score, so that a negative gap means that boys over perform girls while a positive gap means that girls over perform boys. 3 Black et al. 2008 find that between 45 and 53 percent of the gender wage gap among college graduates in the US is explained by age, highest degree and major.

2
scholars claim that the math gender difference is innate and rooted in biology, and exists
because of genetic (Geary 1998), hormonal (Kimura 2000), or cerebral differences
(Halpern 2000). On the other hand, several theories rely on societal factors (including
gender differential treatment by teachers, parents' differential expectations on math
achievement for girls and boys, and gender differences in expected returns to math
skills, among others) as the cause for the math gender gap (see Fryer and Levitt 2010
for a thorough literature review--page 212). An influential article in Science using data
from 40 countries finds that "girls’ underperformance in math relative to boys is
eliminated in more gender-equal cultures" suggesting the important role of the
environment behind the math gender gap (Guiso et al. 2008). Using cross-country data
from 41 countries from Trends in Mathematics and Science Studies (TIMMS), Fryer
and Levitt (2010) also find support for this hypothesis when Muslin countries or
countries with high sex-segregated education are excluded from the sample.4, 5
However, these studies fail to distinguish between the role of institutional constraints
versus culture in influencing the math gender gap. It may be that lower performance in
math from girls may be the result of having internalized what constitutes to be a girl and
behave according to a girl’s gender identity (Akerlof and Kranton 2000).6
Alternatively, girls may choose to invest less in math than boys (independent on beliefs)
because they expect lower labor market returns to math skills given the laws,
regulations and labor market institutions in their society (Albanesi and Olivetti 2009).
In this paper, we investigate the extent to which beliefs and preferences (as opposed to
4 PISA and TIMSS data differ in their measurement of math skills. While TIMMS mainly assesses what students have learned in the classroom, PISA assesses “the capacity to identify and understand the role that mathematics plays in the world, to make well-founded judgments and to use and engage with mathematics in ways that meet the needs of that individual’s life as a constructive, concerned and reflective citizen” (OECD, 2004, p. 26). 5 Using 2009 PISA data, González de San Román and de la Rica (2012) find a similar relationship across regions within a country (Spain), which constitutes a more homogeneous institutional setting. 6 Note that girls' actions may be influenced by their own beliefs, or by those of their families or neighbours through the rewards and punishments associated with different actions.
3
institutional constraints) explain the math gender gap. If beliefs and preferences about
gender roles are important, policies aiming to alter them early in life would be optimal.
If instead institutional constraints are most relevant, then policies aiming at changing
institutions in both the labor market and education system would be preferred.
To examine whether culture can explain gender differences in math test
performance, we follow the epidemiological approach fully developed in Fernández and
Fogli (2009) and reviewed in Fernández (2011).7 This approach focuses on second-
generation immigrants who are exposed to the same host country's labor markets,
regulations, laws and institutions, but are also influenced by different cultural beliefs of
their parents. To identify the effect of culture, we estimate whether the math gender gap
for each immigrant group living in a particular host country is explained by measures of
gender identity in the country of ancestry.8 For this purpose we merge 2003, 2006,
2009 and 2012 data from PISA and the 2009 World Economic Forum’s gender gap
index (GGI) which reflects economic and political opportunities, education, and well-
being for women in the country of ancestry.9 Using a data set containing 12,027
second-generation migrants from 45 different countries of ancestry and living in twelve
host countries, we show that the same pattern found by Guiso et al.'s exists between the
math gender gap of 15-year-old second-generation migrants and the measures of gender
identity in the migrants' country of ancestry. We find that the higher the degree of
7 Using the epidemiological approach, several studies have examined the effect of culture on different socio-economic outcomes: savings rates (Carroll, Rhee, and Rhee 1994), fertility and female labor force participation (Antecol 2000; Raquel Fernández and Fogli 2006, 2009; Raquel Fernández 2007); living arrangements (Giuliano 2007), the demand for social insurance (Eugster et al. 2011), preferences for a child’s sex (Almond, Edlund, and Milligan 2013), and divorce (Furtado, Marcén, and Sevilla 2013). 8 We follow Fernández and Fogli (2009) and define culture as "systematic differences in preferences and beliefs across either socially or geographically differentiated groups". 9 This is the same index used by Guiso et al. (2008) and Fryer and Levitt (2010). As we explain in the data section, we are constrained to using contemporary measures of gender equality in the ancestry country because the GGI is only first available in 2006, but even then only for a subset of countries. In the robustness section, we use alternative proxies of culture measured in the 1990s, which is closer in time to when the parents left their country of birth.

4
gender equality in the country of ancestry, the higher the performance of second-
generation immigrant girls relative to boys. Our results suggest that cultural beliefs
about gender roles explain a large part of the difference in math’s performance between
girls and boys. To be precise we find that a one standard deviation increase in the
country of ancestry's GGI is associated with a decline in the math gender gap of second-
generation migrants of 15 per cent. Our results are robust to different: (1) specifications
strategies, (2) adjustments of standard errors, (3) measures of gender equality, as well as
to the inclusion of a large set of individual, parental and country of ancestry controls,
and (4) changes in sample criteria.
The effect of culture is mostly driven by immigrant girls, consistent with
stereotype threat hypothesis (Spencer, Steele, and Quinn 1999) and gender differential
responses to competitive testing environments (Niederle and Vesterlund 2010). The
effect of culture is particularly sensitive to the concentration of immigrants and girls in
the school, suggesting that schools play an important role in the transmission of culture.
In particular, we find that culture is less important in determining a second-generation
immigrant girl’s math score in schools with larger proportion of girls. This result
suggests that gender equality considerations are less important when peer pressure is
low, consistent with Fryer and Levitt's lack of finding in countries with same-sex
schools. We also find that the effect of culture increases with the proportion of
immigrants in the school, consistent with higher intergeneration transmission of culture
when ethnic social networks are stronger (Fernández and Fogli 2009; Furtado, Marcén,
and Sevilla 2013 find a similar result).
Our contribution to the math gender gap literature is threefold. First, we isolate
the role of culture from institutional constraints. Second, we shed some light on a

5
causal interpretation of Guiso et al.'s, 2008, and Fryer and Levitt's, 2010, findings
showing that the same pattern exists among second-immigration immigrants. Third, we
identify schools as the most important channel through which culture may be
transmitted.
The paper is organized as follows. Sections 2 and 3 describe the empirical
strategy, and the data and sample selection, respectively. Sections 4 and 5 present the
main results and the robustness checks, respectively. After presenting evidence on the
channels through which gender identity may be transmitted in Section 6, we conclude in
Section 7.
2. Empirical Strategy
To distinguish the effect of culture from that of institutions and other environmental
factors in explaining variation in math scores between girls and boys, our empirical
approach makes use of the fact that all second-generation immigrants have been
exposed to the host country´s markets and institutions. Thus, evidence that gender
equality in the immigrant´s country of ancestry can explain math scores of second-
generation immigrants is suggestive that the preferences and beliefs of the migrant's
ancesters matter and have been transmitted to them by their parents and/or their ethnic
community. We use OLS to estimate the following baseline specification:
Eijkt=α1femalei + α2(femalei GEj)+ λj+ λk+ δ(femalei λk)+ λt+ X’ijktβ1+ (X’ijktfemalei)β2 +
εijkt (1)

6
where i is the individual who was born in the country k but whose country of ancestry is
j and participates in PISA at time t.10 Eijkt indicates individual’s educational attainment
in math test scores. To identify the differences in educational attainment between sexes,
the variable femalei is a dummy equal to one if the individual is a girl and zero
otherwise.
The variable GEj is a measure of gender equality from the immigrant’s country
of ancestry, such that a higher value is associated with a more egalitarian culture. Our
coefficient of interest on the interaction between GEj and the female dummy, α2,
captures the role of gender equality in explaining the gender differences in the
educational achievement of second-generation immigrants boys and girls. A positive
and significant α2 would suggest that more egalitarian attitudes in the immigrant’s
country of ancestry are associated with a higher relative performance of second-
generation immigrant girls over boys, and thus smaller gender gap in children
educational attainment. Thus, the gender gap in math scores between a boy and a girl
from a country of ancestry j with more egalitarian gender roles (higher GEj) would be
smaller than the gender gap between a boy and a girl from a country of ancestry with
less egalitarian gender roles (lower GEj).
We also include country of ancestry fixed effects (λj) to account for
characteristics in the immigrant’s country of ancestry that may be related to gender roles
and educational achievements of second-generation immigrants. We include year fixed
effects (λt) to account for cohort differences and other time variation. In contrast to
10 Throughout the paper we will refer to the country where each individuals was born and lives (k) as their “host country”. Given that they are second-generation immigrants, the country where they were born and live is actually the host country of their parents.

7
previous studies using the epidemiological approach, which focus on second-generation
immigrants living in one country (in general US or Canada), we need to include host-
country fixed effects (λk) in our specification to account for host country’s
characteristics that may be related to educational attainment. Crucially, host country’s
dummies are interacted with the female dummy to account for variation in host
country’s educational gender gaps that may arise from cross-country differentials in
cultural or institutional channels.
The vector Xijkt includes a set of individual characteristics, which may affect
educational attainment for reasons unrelated to gender equality, and their interaction
with female dummy. In our baseline specification we only include the age of the child
at the time of the exam and, following Guiso et al. (2008), a dummy indicating whether
the individual is in a grade different from the modal one in the country. Since all
additional socio-demographic characteristics that we observe at age 15 are potentially
endogenous, we do not to include them in our baseline specification (see specification 3
instead).
A second specification further includes GDP per capita (in logarithms) from the
immigrant’s country of ancestry interacted by the female dummy.11 Including the
interaction between the female dummy and the level of development of the country of
ancestry ensures that our coefficient of interest α2, is capturing the effect of gender
equality and not differences in the level of development that may affect an immigrant’s
11 The gross domestic product per capita is expressed in real terms deflated with Laspeyres price index. Source: Alan Heston, Robert Summers and Bettina Aten, Penn World Table Version 7.0, Center for International Comparisons of Production, Income and Prices at the University of Pennsylvania, June 2011.
8
test scores for reasons unrelated to gender equality.12 Throughout the paper we will
refer to this specification as our “preferred specification”.
Eijkt=α1femalei + α2(femalei GEj)+ α3(femalei lgdpj)+ λj+ λk+ δ1(femalei λk) + λt+
X’ijktβ1+ (X’ijktfemalei)β
2 + εijkt (2)
There are several sources of heterogeneity across individuals other than cultural
beliefs on gender roles that may affect their educational attainment. To take this into
account, a third specification additionally adds to equation (2) socio-demographic
characteristics related to the immigrant’s family and school (vector Z) and their
interaction with the female dummy. In particular we include as controls family
characteristics: mother’s and father’s highest educational attainment, an index
indicating the highest level of occupation of parents, two indexes indicating the cultural
and educational resources at home respectively and a dummy variable indicating
whether the individual spoke a different language at home. Among school's
characteristics we include: the percentage of girls enrolled at school, whether the school
is publicly or privately financed, and whether the school is in a metropolitan area or not.
Information on how these variables are defined and descriptive statistics are shown in
Appendix Tables A.1.13 Without these controls α2 may be capturing spurious
correlation between the individuals' unobserved factors and our measures of gender
equality. For example, if more educated mothers increase the test performance of girls
12 As a robustness test, we also estimate a specification in which we also control for the Human Development Index (HDI) as proxy of the level of development of the country of ancestry.
13 To avoid losing observations due to item non-response in one or several of these questions, we impute the missing values following the MICE method of multiple multivariate imputation described by Van Buuren, Boshuizen, and Knook (1999). This multiple imputation approach is more appropriate when the assumption of random distribution of non-response is dubious. The basic idea is to create a small number of copies of the data (in our case 5), each of which has the missing values suitably imputed. To each imputation we use the command mvis in Stata and control for country of ancestry, year and country of birth. Then, estimates of the parameters of interest are averaged across the 5 copies to give a single estimate and standard errors are computed according to the “Rubin rules” (Rubin 1987).

9
relative to boys, and if it is less costly for a girl to perform relatively better in school if
her parents come from an egalitarian country, then the correlation captured by α2 would
be due to the correlation between parental characteristics by country of ancestry and
female education.
Eijkt=α1femalei+ α2(femalei GEj)+ α3(femalei lgdpj)+ λj+ λk+ δ1(femalei λk) + λt+
X’ijktβ1+ (X’ijktfemalei)β
2 + Z’ijktβ3+ (Z’ijktfemalei)β
4+ εijkt (3)
The fourth specification substitutes the interaction between the female dummy
and the host country fixed effects in equation (2) by the interaction between the female
dummy and gender equality (GEk) and GDP per capita (lgdpk) in the host country. In
doing so this specification accounts for the fact that immigrants from countries of
ancestry with less gender-equal culture may tend to settle in host countries with similar
gender-equal culture and institutions. If this is the case, our coefficient of interest in
equation 2 would be biased upwards as it would be capturing the effect of the host
country’s culture and institutions in addition to the effects of culture in the immigrant’s
country of ancestry.
Eijk= α1 femalei+ α2 (femalei GEj)+ α3(femalei lgdpj)+λj + λk +λt + δ1(femalei GEk)+
δ2(femalei lgdpk)+ X’ijktβ1+ (X’ijktfemalei)β
2 +εijk (4)
Because identification in our models comes from the variation of gender equality across
country of ancestry, standard errors are clustered at this level.
3. Data and Sample
Program for International Student Assessment (PISA) Data

10
Our main data set uses the 2003, 2006, 2009 and 2012 student-level data from the
Program for International Student Assessment (PISA), an internationally standardized
assessment conducted by the Organization for Economic Cooperation and Development
(OECD) and administered to 15-year olds in schools every three years since 2000. In
contrast to other international assessment, such as TIMSS which focuses on assessing
what students have learned in the classroom, the purpose of PISA is to test whether
students have acquired the knowledge and skills essential for full participation in
society near the end of compulsory education. These skills include whether they can
analyze, reason, and communicate effectively. According to the OECD the PISA math
test assesses “the capacity to identify and understand the role that mathematics plays in
the world, to make well-founded judgments and to use and engage with mathematics in
ways that meet the needs of that individual’s life as a constructive, concerned and
reflective citizen” (OECD, 2004, p. 26). Else-Quest, Hyde, and Linn (2010) suggest
that PISA may be more relevant to measure the math gender gap than TIMMS because
it is a more challenging assessment. Even if we wanted to use TIMMS, the lack of
information on country of ancestry of second-immigrants prevents us from doing so.14
PISA assesses a range of relevant skills and competencies in three main
domains: mathematics, reading and science. In addition, students and school principals
also answer questionnaires to provide information about the students' backgrounds,
schools and learning experiences and about the broader school system and learning
environment. Our analysis focuses on mathematics and begins in 2003 because
questions entering the math scores are not comparable before and after that year. PISA
tests are paper and pencil tests, lasting up to two hours for each student. Participation in
14 TIMSS is an international assessment of mathematics and science learning in eighth graders, conducted on a 4-year cycle by the International Association for the Evaluation of International Achievement (IEA), in collaboration with Statistics Canada and the Educational Testing Service.

11
PISA tests is voluntary for schools and students, although a minimum participation rate
of 65 percent (80 percent) of schools (students) from the original sample is required for
a country to be included in the international database. Each subject is tested using a
broad sample of tasks with differing levels of difficulty to represent a comprehensive
indicator of the continuum of students’ abilities. The PISA program presents the tests
scores standardized so that they have a mean of 500 test-score points and a standard
deviation of 100 test-score points across the OECD countries.
PISA uses imputation methods, denoted as plausible values (hereinafter PV), to
report student performance. In all of our analysis we use PV and follow the OECD
recommendations that involve estimating one regression for each set of PV (there are
five PV to each domain) and then report the arithmetic average of these estimates. In
addition, PISA sample is stratified at two stages: first, schools are randomly selected
and second, students at each school are randomly assigned to carry out the test in all
three subjects. Our results are robust to applying the Fay’s Balanced Repeated
Replicated (BRR) methodology that takes into account this two-stage sample design (as
shown in the results section).
Gender Equality Measures
To measure gender equality in an immigrant’s country of ancestry, we follow Guiso et
al. (2008) and use the Gender Gap Index and the Political Empowerment Index
(henceforth GGI, PEI, respectively) from The World Economic Forum (Hausmann,
Tyson, and Zahidi 2009). We also use female labor force participation in the
immigrant’s country of ancestry from the International Labour Organization. All these
measures are standard in the literature (Fryer and Levitt 2010; Guiso et al. 2008). The
GGI measures the relative position of women in a society taking into account the gap

12
between men and women in economic opportunities, economic participation,
educational attainment, political achievements, health, and well-being. The PEI is a
sub-index from the GGI and measures the gap between men and women in political
participation based on the ratio women to men with seats in parliament, the ratio of
women to men in ministerial level and the ratio of the number of years with a woman as
head of state to the years with a man. Both indicators range from 0 to 1 and larger
values point to a better position of women in society.
As an additional robustness check, in Section 5 we show that our results are
robust to using an index of cultural attitudes towards women from the World Value
Survey (also used in Guiso et al. 2008), and the ratio of young literate females to males
(ages 15 to 24).15 Appendix Table A.2 presents a detailed description of all the gender
equality measures used in the analysis, as well as basic descriptive statistics.
Information of GGI and PEI is available beginning 2006. In such year, 115
countries were included in the indexes, in 2007 128, in 2008 130 and in 2009 134. In
order to maximize the number of countries in our sample, we focus on 2009 values for
all our gender equality indicators in the immigrant’s country of ancestry. The use of
contemporaneous measures of gender equality instead of the ones observed at the time
parents migrate is a common practice in the literature. First, it is reasonable to expect
that countries' aggregated preferences and beliefs about the role of women in society
change slowly over time. Also, as Fernández and Fogli (2009) point out, "one could
argue that the values that parents and society transmit are best reflected in what their
contemporaneous counterparts are doing in the country of ancestry". Rather than
trying to solve this debate on theoretical grounds, we take an empirical approach and 15 Unfortunately these two variables are missing for many countries, precluding us from using it as main indicators.

13
also check the robustness of our results to using proxies of gender-equality measured in
the 1990s (shown in the Results Section).
Sample
Following the literature, our sample consists of second-generation immigrants who were
born and reside in a participating host country but whose parents (both of them) were
born in another country. We pool the 2003, 2006, 2009 and 2012 PISA waves so as to
have the larger variation possible in terms of both host countries and countries of
ancestry. To determine the students’ country of ancestry, we need specific information
on their parents’ country of birth. This question is not consistently asked among
participating countries. For instance, when asking about the country of origin, the US
only provided the options “United States of America” and “another country”. As a
consequence, only data from those participating countries providing detailed
information about the parents’ birth place were used in the analysis.16 Based on Blau et
al. (2013) who find that the effect of mother’s country of origin on second-generation
immigrants girls tend to be stronger than the effect of the father’s country of origin
when parents come from different countries, we assign the mother’s country of origin.17
We restrict our sample to those individuals for whom we observe gender equality
measures for both their country of ancestry and their host country, and focus our
analysis on host countries with immigrants from at least four countries of ancestry to
ensure that we do not compromise the identification in our model, which arises from
variation in the gender equality in the immigrant’s country of ancestry within a given
16These are Australia, Austria, Belgium, Denmark, Finland, Germany, Greece, Latvia, Liechtenstein, Luxembourg, New Zealand, Norway, Portugal, Switzerland and Scotland in 2003, 2006, 2009 and 2012 PISA, Argentina, Czech Republic, Israel, Netherlands and Qatar in 2009 and 2012 PISA, and China, Costa Rica and Turkey in 2012. 17In any case, 85 percent of the second-generation immigrants in our sample have parents who emigrate from the same country.

14
host country.18 We also drop second-generation immigrant children whose country of
ancestry has fewer than five observations in a given host country.19 In the robustness
section we explore the robustness of our results to changes in sample criteria.
Our final sample has 12,027 second-generation migrants from 45 different
countries of ancestry and living in twelve host countries (as described in Appendix
Table A.3). Host countries are mainly OECD countries, whereas countries of ancestry
are from various continents and levels of development. Indeed, the countries of ancestry
in our sample cover all continents, with many European (24 countries) and some
transition economies (Albania, Poland, Russia and Ukraine), several countries in the
Americas (Bolivia, Brazil, Chile, Paraguay, Suriname, United States and Uruguay),
some in Asia (Bangladesh, China, India, Korea, Malaysia, Philippines, Vietnam), some
in the Middle East (Iran, Egypt and Pakistan), some in Africa (Ethiopia, Morocco and
South Africa), and some in Oceania (Australia and New Zealand). Second-generation
immigrants whose country of ancestry is Portugal, Turkey or Italy represent 47 percent
of the sample. Host countries with the highest sample of second-generation immigrants
are Australia, Switzerland and Luxembourg (immigrants living in these countries
represent 68 percent of the sample).
Descriptive Statistics
18The lack of gender equality measures for all countries implies losing the following countries of ancestry: Afghanistan, Bosnia and Herzegovina, Cape Verde, Occupied Palestine, Iraq, Lebanon, Liechtenstein, Netherlands Antilles, Somalia, Somoa and Serbia-Montenegro (4,345 observations) and the host country of Liechtenstein (or 135 observations). In any case, most of the countries of ancestry we lose are from conflictive zones, which are commonly excluded from this kind of analysis (see Fernández and Fogli 2009, and Furtado, Marcen, and Sevilla 2013). In addition, by limiting our analysis to host countries with at least four different groups of immigrants we lose 3,983 observations from the following ten host countries (Costa Rica, China, Denmark, Germany, Greece, Latvia, Norway, Portugal, Qatar and Turkey), and seven countries of ancestry (Brazil, Bulgaria, Belarus, Jordan, Egypt, Nicaragua and Yemen). 19 This is a common practice in the literature. For instance, Fernández and Fogli (2009) eliminate those countries of ancestry with fewer than 15 observations. Given that our regressions are run at the individual level, including or not these small numbers of observations does not affect our results. With this adjustment, we lose only 20 individuals and five different countries of ancestry (Colombia, Czech Republic, Denmark, Panama and Thailand).
15
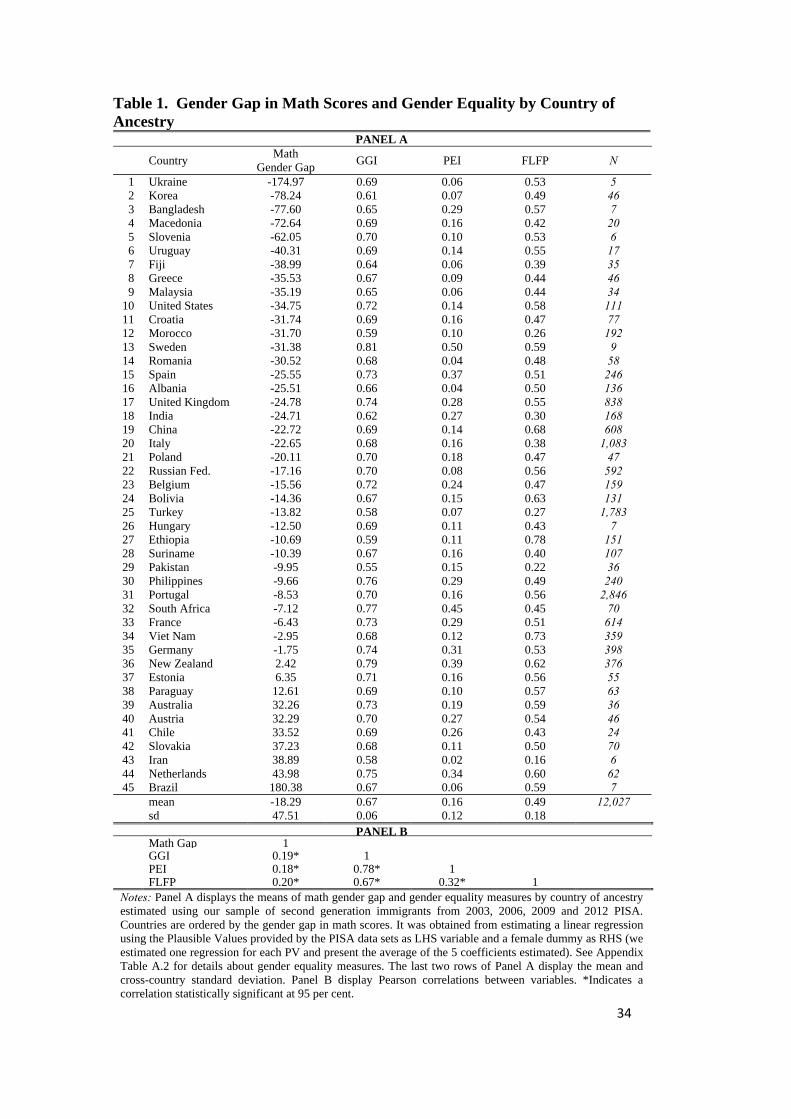
Table 1 presents summary statistics of our main country of ancestry's gender
equality measures for our sample of second-generation immigrants. Countries of
ancestry are ordered from highest to lowest gender gaps in math test scores measured as
the average boy’s minus the average girl’s scores. Panel A shows that there is a large
variation in the gender gap in math scores across countries of ancestry. At the bottom
10 percent of the distribution of the math gender gap by country of ancestry, second-
generation immigrant girls substantially underperform boys by 62 score points (0.6
standard deviation). Given that a difference of 40 points in PISA tests is equivalent to 1
year of schooling (OECD 2012), such a difference equivalent to about 1.5 years of
schooling. At the top 10 percent of the math gender gap distribution, second-generation
immigrant girls outperform boys by 34 scores points (0.3 standard deviation) or the
equivalent to ten months of schooling.
The average score of boys in our sample of second-generation immigrants is 491
points with a standard deviation of 110, whereas the average score of girls is 473 with a
standard deviation of 99. Thus, the difference in math score between girls and boys
across our sample is -18.29, which implies that girls underperform boys by 0.18
standard deviation, the equivalent to 5.5 months of schooling. This gender gap in math
scores is quite similar to the one observed among all second-generation immigrants and
natives living in the host countries included in our analysis, and not too distant from the
ones showed when all countries participating in PISA assessments are considered (see
Table A.4).
Panel A also shows the different measures of gender equality by country of
ancestry. The GGI takes values between zero and one and averages 0.68 with a
standard deviation of 0.06. It varies from 0.55 in Pakistan to 0.81 in Sweden. The PEI
16
displays also a high variation across countries with a minimum of 0.02 in Iran and a
maximum of 0.50 in Sweden--it averages 0.16 with a 0.12 standard deviation in the
whole sample. FLFP also varies widely by country, moving from 0.16 percent in Iran
to over 78 percent in Ethiopia--the average FLFP in the sample is 49 percent with a
standard deviation of 12 percent. Panel B shows the cross-country correlation across
the difference gender equality measures. Not surprisingly, we find that these measures
are correlated. The cross-country correlation between the GGI and PEI or the GGI and
the FLFP is high, ranging between 0.78 and 0.67, while the PEI and FLFP have a cross-
correlation of 0.32.
Figure 1 plots the average math gender gap of second-generation immigrants by
country of ancestry (column 1 of Table 1) versus the three measures of gender equality:
GGI, PEI, and FLFP (columns 2 to 4 of Table 1). Overall, the raw data show that the
more gender equality in the country of ancestry the higher the relative performance in
math scores of second-generation immigrant girls with respect to boys. The correlations
range from 0.18 to 0.20 percent and are statistically significant at conventional levels
(see column 1 in Panel B of Table 1).
4. Main Results
Can Gender Equality Explain the Gender Gap in Math Scores?
Table 2 displays the coefficient on the interaction between female dummy and gender
equality measure, α2, which informs us on the effect of gender equality on the gender
gap in mathematics. Each column displays the results from estimating the different
empirical specifications, while each row displays the results from using alternative
measures of gender equality in the country of ancestry.

17
Column 1 in Table 2 shows a positive and statistically significant coefficient on
the interaction between the female dummy and gender equality measure, α2, suggesting
that the gender gap in mathematics narrows among children whose country of ancestry
is one with more egalitarian attitudes towards women. Results are qualitatively the
same in our preferred specification shown in column 2, which includes the interaction
between the female dummy and the GDP per capita of the country of ancestry as in
equation (2). The coefficient of interest, α2, remains positive and statistically
significant. In fact, this coefficient increases in most specifications with respect to the
coefficient estimated in column 1, suggesting that not taking into account differences in
the economic development of the immigrant’s country of ancestry could lead to a
downward bias in the estimated effect of gender equality and the gap in math scores.20
The magnitude of the coefficient on the interaction between female dummy and
gender equality measure, α2, suggests that gender identity may explain an important part
of the variation in the gender gap in mathematics across immigrants from different
countries of ancestry. For instance, the coefficient α2 in the first row of column 2
estimates that an increase in the level of GGI by one standard deviation is associated
with a reduction of 6.94 score points in the gender gap in mathematics, the equivalent of
a bit over 2 months of schooling. It also accounts for a 15 percent of the variation in the
gender gap across countries of ancestry.21 Alternatively, if immigrants from Turkish
descent, whose country of ancestry has a GGI of 0.58 and who present a gender gap in
math scores of -13.82 score points, were characterized by the mean gender equality
20 Guiso et al. (2008) also find that not taking into account differences in the economic development across countries leads to a downward bias of the estimate effect of gender equality in the math gap (Table S4, supporting material on-line). 21 Using values from Table 1 this effect was calculated as
. ∗ . .
.0.15

18
(GGI = 0.67), our statistical model would suggest that the mean score performance in
mathematics of second-generation Turkish girls relative to boys would increase by 10
score points, which would practically eliminate their gender gap.22
Similar results are obtained when we use the other measures of gender equality.
According to the second row in column 2 of Table 2, an increase in the level of PEI by
one standard deviation (across countries of ancestry) is associated with a reduction in
the gender gap in mathematics of 7 score points, which is a 15 percent of the variation
in gender gap across different ancestries. When we use the labor force participation rate
to measure gender equality, we continue to find that the gender gap in math scores
decreases with gender equality. The coefficient in rows 3 of column 2 indicates that an
increase in the FLFP by one standard deviation is associated with a reduction in the
gender gap in math scores of 3.8 score points, which is 8 percent of the variation in the
gender gap across ancestries.23
Guiso et al.'s (2008) estimated effect of the gender equality measures over the
gender gap in math scores is of 105.49, 29.1 or 45.0 when the GGI, PEI or FLFP indices
are used as gender equality proxy, respectively. This implies that an increase in the
level of each of these measures by one standard deviation is associated with a reduction
in the gender gap across countries between 51 and 68 percent depending on the measure
used.24 While these magnitudes represent about four times our estimates, they are not
22 This is calculated as 0.67 0.58 0.09 ∗ 115.73 10.4. 23 This is calculated as
. ∗ . .
.0.08
24 The cross-country standard deviation of the GGI, PEI and FLFP in Guiso et al. (2008)’s sample is 0.05, 0.15 and 0.09 respectively. Given the coefficients estimated by the authors, an increase of one standard deviation in the GGI (0.05) implies a reduction of 5.3 score points in the math gender gap, which represent a reduction of 68 percent of the variation in the gender gap across countries in the their sample (the cross-country standard deviation in the math gender gap is 7.74 according to our own calculation using 2003 PISA). Similarly, an increase of one standard deviation in the PEI and FLFP reduces the gap in math scores in 4.4 or 4.1 points or 56 (51) percent of the cross-

19
directly comparable in that the identification across studies is different. In their analysis
the identification comes from the variation of the level of gender equality across home
countries using both natives and immigrants' gender differences in mathematics test
scores. In contrast, in our models identification comes from the variation across country
of ancestry within host country using only second-generation immigrant children.
Having said this, we can compare our analysis to what we would have obtained using
all individuals and exploiting only the cross-country of residence variation as in Guiso
et al. (2008) with PISA 2003-2012 to get an approximation of how much of math
gender gap across countries of residence is explained by culture versus institutional
constraints. When we replicate Guiso et al. (2008) using all countries in PISA 2003,
2006, 2009 and 2012, we find that the effect of GGI over the gender gap in math scores
is of 47.92 (standard error = 0.048), implying that an increase in the level of this
measure by one standard deviation is associated with a reduction in the gender gap
across countries of 25 percent. Although this is only a back-of-the-envelope exercise it
suggests that the transmission of beliefs and preferences accounts for 60 percent of the
total effect.25
While the results from Guiso et al. (2008) suggest an important role for a
country’s culture and institutions (as opposed to biological explanations) influencing the
relative performance of girls in mathematics, our results assess the relative importance
of culture versus institutions, suggesting that the former has an important role in
country variation in gender gap in their sample. Information about standard deviations of each gender equality measure is available in their Supporting Online Material, available in (www.sciencemag.org/cgi/content/full/320/5880/1164/DC1). To make their results of FLFP comparable with ours, we divide their FLFP measure by 100 (and also their coefficient estimated).
25 If this back of the envelope analysis is restricted to only host countries included in our analysis, we find a similar result. In particular, we find that the GGI the over the gender gap in math scores is of 26.55 (standard error = 0.036), implying that an increase in the level of each of these measures by one standard deviation is associated with a reduction in the gender gap across host countries of 22 percent.
20
explaining gender differences in mathematics. It is also important to highlight that
because of our identification strategy, we only capture the effect of inter-generationally
transmitted culture as opposed to the effect of culture in the host country, thus our
estimates of the effect of culture ought to be considered as a downward bias of the total
effect of culture.
5. Robustness Checks
This section explores the robustness of these results to omitted variable bias, alternative
specifications to account among other things for the self-selection of immigrants,
clustering of the standard errors, alternative measures of gender equality, and changes in
sample criteria.
Sensitivity Analysis
One concern is that our results may be capturing educational differences in the country
of ancestry rather than differences in gender equality. If those more egalitarian
countries have also more advanced educational systems, the effect of gender equality
measures on math gender gap would be upward bias. We check this possibility in
column 3 of Table 2 by adding the interaction between the female dummy and the
Human Development Index (HDI), which includes, in addition to income (as GDP per
capita), measures of life expectancy and education (such as mean years of schooling and
expected years of schooling). As can be seen, adding this variable has little effect when
using GGI or PEI, and reduces precision when using FLFP.
As explained in section 2, without individual controls, α2 may still be capturing
spurious correlation between the individuals' unobserved factors and our measures of

21
gender equality. To explore whether omitted variable bias is an issue, results from
equation (3) are reported in columns 4 and 5 of Table 2 where family and school
characteristics are controlled for, respectively. Column 6 includes both family and
school covariates. After controlling for the immigrants' family and school
characteristics, the coefficient α2 remains positive and statistically significant.
Column 7 in Table 2 also shows that our results remain practically unchanged
when we adopt even a more flexible specification where each year fixed-effect is
interacted by the female dummy to allow different math gender gaps by cohort assessed
in different PISA waves.
Columns 8 and 9 in Table 2 evaluate to what extent our results are biased due to
self-selection of migrants into host countries which are similar in terms of gender
equality by substituting the interaction between the female dummy and host country
dummies with interactions between the female dummy and gender equality measures
and log GDP per capita in the host country. To do so, column 8 estimates equation (4).
In terms of gender equality measures, we include the GGI, the PEI, the total FLFP and
the labor force participation for women between 35 and 54 years old, which captures the
cohort of women with the same age interval as the mothers of the PISA students under
analysis. The idea behind including all these host country gender equality measures is
to capture as many dimensions of gender equality as possible in the host country. If
those immigrants from countries with less gender-equal cultures tend to also settle in
host countries with less gender-equal cultures and institutions, our coefficient of interest
may be capturing the effect of the host country laws and institutions rather than the
effect of the culture of ancestry. While the results in column 8 are smaller and less
precise than those in our preferred specification (shown in column 2), they are
22
consistent with beliefs' from the ancestry country explaining the math gender gap.
Column 9 shows that the results are also robust to adding the interaction between the
female dummy and host country’s HDI to the specification in equation (4).
As explained in Section II, all of our estimates are calculated by clustering
standard errors at the country of ancestry level. However, because of the double
stratification of the sampling design employed by PISA, column 10 of Table 2 shows a
specification that applies the Fay’s Balanced Repeated Replicated (BRR) methodology.
Again, the results are robust to this alternative adjustment of the standard errors when
we use the GGI or PEI indices, but we lose precision with the FLFP.
Alternative Measures of Gender Equality
Table 3 displays the results from estimating our main specification using alternative
measures of gender equality. Panel A tests the robustness of our results to the use of
gender equality indexes measured in the 1990s. In particular we use the proportion of
seats held by women in national parliaments in 1990-1997, and female labor
participation rates in 1990. As can be seen, the effect remains positive in both cases,
but it loses significance when using female labor force participation rates measured in
1990. Following Guiso et al. (2008), panel B checks the robustness of our results to
using two alternative proxies of gender equality in the country of ancestry, namely an
indicator elaborated from a series of questions about gender roles included in the World
Values Survey (WVS). Alternatively, panel B also shows a specification in which the
gender equality measure is captured by the gender gap in the literacy rate, which

23
constitutes a good proxy of gender inequality in the access to the educational system.26
In both cases, our main results holds and remains statistically significant. Most
importantly, the magnitude of the effect remains consistent with our main findings. In
particular, an increase by one standard deviation in each of these gender equality
measures is associated with a reduction in the gender gap in mathematics of 5.55, 3.35,
5.87 or 5.89 score points, respectively, which accounts for a 12, 7, 11 and 14 percent of
the cross country variation in the gender gap in mathematics.27
Changes in Sample Criteria
Table 4 shows that our results are not driven by the main group of immigrants (the
Portuguese) or the host country with the largest sample of immigrants (Switzerland)--
shown in panels A and B. Panel C shows that the effect remains when only one host
country is used (although the coefficient is not longer statistically significant in the case
of Switzerland). Also, the fact that our results remains when using alternative measures
only available for a smaller number of countries of ancestry as in Panel B of Table 3,
represents additional evidence that our results are not sensitive to changes in sample
criteria.
6. Cultural Transmission Mechanisms
This section looks at the transmission mechanisms of culture. We first look at whether
the effect of culture on closing the gender gap in math is due to more positive attitudes 26 Both measures are described in Appendix Table A.3. Note that these measures are not available for many of the countries of ancestry in our dataset, precluding their use in main analysis. In the case of the WVS indicator we lose nine of the 45 countries of ancestry, while with the literacy rate we lose 28 countries of ancestry. 27 Columns 3 and 4 of Table 3 display the cross-country standard deviation of each of these alternative measures and of the math gender gap used to these calculations. Bear in mind that the countries of ancestry varies depending on the measure used.

24
about the role of women in society increasing a girl’s math scores as opposed to
decreasing a boy’s. Exceeding at mathematics is not considered to be part of a girl’s
identity. Cvencek, Meltzoff, and Greenwald (2011) show, using a sample of adults and
children, that ‘Girls don’t do math’ is a widespread cultural stereotype.28 This
stereotype works in an asymmetric way, particularly affecting girls who deviate from
the norm, as opposed to boys (Spencer, Steele, and Quinn 1999). This asymmetry has
also been shown in studies looking at the impact of teacher’s gender on girls and boys
math performance. For example, Carrell, Page, and West (2010) find a differential
effect of professor’s gender on the performance of boys and girls, which can be
rationalized by girls being affected when female students are reminded about the belief
that they are not supposed to be good at math when being taught by a male teacher. In
contrast, boys are not necessarily affected when reminded that they are supposed to be
good when taught by a male teacher. Similarly, Gneezy, Niederle, and Rustichini
(2003) present experimental evidence that women’s performance in competitive
environments substantially decreases when competing against males, while the
performance of men in single-sex tournaments is not significantly different than in
mixed-sex tournaments.
Table 5 presents the results from estimating Equations (1) to (4) separately for
boys and girls. As can be seen in Panel A, the effect of gender equality in the country
of ancestry on girls’ math tests scores is always positive and statistically significant. An
increase of one standard deviation of the GGI index increases girls’ score in
mathematics by 15 points, explaining almost 25 percent of the cross-country variation in
28 Anecdotally, in 1994 Mattel created a Barbie™ doll that said, “Math is hard.”

25
girls’ test scores 29 In contrast to what we find for girls, Panel B of Table 5 shows that
the effect of culture on boys’ math test scores is smaller and not statistically significant.
These findings corroborate the asymmetric effect of culture and show that the reduction
of the gender gap found in Table 1 as a result from more egalitarian cultural attitudes
toward women comes primarily from girls performing differentially better than boys.
To explore the cultural mechanisms which prompt girls from more equal
cultures to perform differentially better at math, we look at how culture is transmitted.
First panel A in Table 6 looks at transmission mechanisms of culture within the school.
For example, Booth and Nolen (2012) and Booth (2009) show that school gender peer
effects can explain why girls in only-girls school behave more like boys taking on more
risks. They also find that college female students attending female-only classes perform
better relative to female students attending mixed-sex classes. Here we test whether the
effect of more egalitarian attitudes toward women in the country of ancestry on girls’
math scores remains after controlling for school peer effects, and whether the effect of
culture through peer effects is greater when there is a higher proportion of boys in the
school.
In panel A we look at the proportion of girls in the school (as recorded by the
school’s principal) and at schools that are single-sex (where 95 percent or more pupils
are girls).30 The GGI coefficient remains positive and significant after controlling for
school gender composition. Crucially, the effect of gender equality is not so important
for girls with a higher proportion of girls in the school, as shown by the coefficient on
29 The cross-country standard deviation of girl’s math tests scores is 61.99, so that 15 divided by 61.99 is equal to 0.242
30 See Appendix Table A 5 for definition and descriptive statistics of these variables.
26
the interaction between the GGI index and the proportion of girls in the school (panel
A.1) and the single-sex dummy (panel A.2). For example, an increase in the GGI index
by one standard deviation increases a girl’s math test scores by 16 points if attending a
co-educational school, whereas the effect almost halves to 9 points when attending a
single-sex school. This evidence is consistent with Fryer and Levitt's lack of finding in
countries with same-sex schools, and can be rationalized by the fact that in single-sex
schools girls do not fear being perceived as different and thus the cultural effect from
the beliefs that girls are worse at math than boys on girls’ performance is less important.
In line with the above literature of gender peer effects in schools, we also find that more
girls in a school and attendance to a single-sex school is associated with higher math
scores for girls.
Panel B looks at the transmission within local communities by assessing to what
extent culture is more important for second-generation immigrant girls having a greater
exposure to the cultural norms in the country of ancestry. Fernández and Fogli (2009)
show that the impact of culture appears to be greater for the descendants of those
immigrant groups that have a greater tendency to cluster in the same communities.31 In
particular, they argue that an immigrant ethnic network may be crucial for transferring
and protecting cultural beliefs, independently of the human capital externalities derived
from an immigrant’s neighborhood effects (as argued by Borjas 1995). In our context it
is natural to think of an immigrant’s network as school communities. In particular, there
is evidence that the scores of immigrant children are different depending on the
31 Although the literature generally refers to immigrant concentration from the same ethnicity, we cannot undertake the analysis by ethnicity at the school level as sample sizes are very small. Rather we use the concentration of immigrants in a given school as a proxy for the concentration of immigrants from the same ethnicity. To the extent that immigrants are different from natives in a systematic way, independently of the ethnicity, this is not a very strong assumption.

27
immigrant concentration in the school although the direction of the effect is still unclear
(see for instance Jensen and Rasmussen 2011, and Schnepf 2007). Panel B in Table 6
explores what the implications for girls’ attainment of having more immigrants in the
school are, and whether the effect of culture depends on how many immigrants there are
in the school. To that end we include the concentration of immigrants in the school and
its interaction with the culture proxy (GGI) in Panel B.32
The estimates presented in Column (2) of Panel B show that the culture
coefficient remains positive and significant after controlling for the proportion of
immigrants in the school. Interestingly, when the interaction between the GGI index and
the proportion of immigrants in the school is included in Column (3), we see that the
effect of culture is higher for those second-generation immigrant students in schools
with a higher proportion of immigrants. For example, an increase in the GGI by one
standard deviation is associated with an increase of 18 points in the math scores for girls
attending schools with a proportion of immigrants one standard deviation above the
median (46 per cent), which is 4 points higher than the increase experimented for those
girls attending schools with the mean proportion of immigrants (34 per cent). The
coefficient on the proportion of immigrants in the school is negative, suggesting that
second generation immigrant girls perform worse in math the higher the concentration
of immigrants. 33
32 We follow Schnepf (2007) and calculate the proportion of immigrants in each school from PISA. We include both, first and second-generation immigrants and use final student weights included in PISA data. Given that schools and students participating in PISA are chosen randomly, this ratio should be representative (see Appendix Table A 5). 33 It is important to take into account that immigrants (both first and second generation) living in the host countries included in our analysis have, on average, a lower score in math tests than natives: 470.56 (standard deviation 104.71) versus 490.77 (standard deviation 98.77).

28
Panel C explores transmission of gender identity from parents to children, a
channel that has been extensively documented in the literature (Bisin and Verdier 2001;
Farré and Vella 2013). Using the 1995–2011 March Current Population Survey and
1970– 2000 Census data Blau et al. (2013) find evidence of intergenerational
transmission of gender roles among the immigrant population from parents to children,
and in particular from mothers to daughters in issues related to fertility and labor force
participation.
To test to what extent the effect of cultural norms persist after controlling for
mother characteristics and whether there is a different effect of culture depending on
mother’s characteristics, we include the mother’s educational level and the mother’s
labor status and its interactions with our culture proxy in Panel C of Table 6. The
proportion of second-generation immigrant girls in our sample who have a mother
working is relatively high (81 percent), although mother’s educational level is on
average below upper secondary school. Results in Panel C of Table 6 show that the
coefficient on culture remains positive and statistically significant after controlling for
mother’s characteristics. Similarly, having a mother who works is positively associated
with higher girl’s math scores. Interestingly however, the coefficient for the interaction
between the GGI and mother’s characteristics is not statistically significant. Although
the interaction of the GGI index with the mother’s work dummy is negative, suggesting
that for those girls whose mother is working the role of culture in determining a girl’s
math scores is less important, the coefficient is not precisely estimated.

29
6. Conclusion
This paper aims to rigorously disentangle the effects of markets and institutions from
the effects of culture in determining gender differences in educational attainment in
mathematics. Second-generation immigrants live in the host country and absorb their
country of ancestry’s culture from their parents and ethnic communities, but are
exposed to the host country’s laws and institutions. We thus interpret the estimated
effect of gender equality in the country of ancestry on math scores of second-generation
immigrants as evidence of the role of culture.
We find that the higher degree of gender equality in the country of ancestry
improves the performance of second-generation immigrant girls relative to boys. In
particular, the gender gap disappears among immigrants from more gender-equal
cultures. Our results are robust to a battery of sensitivity tests. We also rule out
alternative explanations for the result such as self-selection of immigrants from
countries of ancestry with more gender-equal cultures living in host countries with
lower gender gaps in math scores. Our findings are consistent with those of Guiso et
al.'s (2008), and Fryer and Levitt's (2010), using cross-country variation in cultural
attitudes toward women. Our findings show that the same pattern exists among second-
immigration immigrants, and that previous evidence on the importance of culture was
not driven by differences in institutional factors across countries.
We also explore the mechanisms through which culture is transmitted. We first
show that the effect of culture on closing the gender gap in math is due to more positive
attitudes about the role of women in society increasing a girl’s math scores as opposed
to decreasing a boy’s. We find that whereas the effect of culture on a girl’s math test
scores is independent of whether the mother works, positive cultural views toward

30
women seem to be more important in increasing a girl’s math record if she attends a
school where the concentration of immigrants and the ratio of boys to girls are greater.
The transmission channels seem to be operating within the school and among peers, as
opposed to between mothers and daughters within the family. However, we cannot rule
out that more egalitarian parents send their children to schools with higher
concentration of immigrants and boys.
Our findings that a more gender-equal culture affects girls’ academic
achievement with respect to boys yield support to policies that alter the believes about
gender roles early in life (see for example work on the transmission of preferences from
mothers to daughters and sons (Blau et al. 2013; Farré and Vella 2013; R Fernández,
Fogli, and Olivetti 2004). Our findings may also explain why similar educational
systems may have a differential impact on the relative performance on math for girls
and boys, and point to the interplay between culture and institutions as the key factor.
References
Akerlof, GA, and RE Kranton. 2000. “Economics and Identity.” The Quarterly Journal of Economics CXV(3): 715–53.
Albanesi, Stefania, and Claudia Olivetti. 2009. “Home Production, Market Production and the Gender Wage Gap: Incentives and Expectations.” Review of Economic Dynamics 12(1): 80–107.
Almond, Douglas, Lena Edlund, and Kevin Milligan. 2013. “Son Preference and the Persistence of Culture: Evidence from South and East Asian Immigrants to Canada.” Population and Development Review 39(1): 75–95. http://dx.doi.org/10.1111/j.1728-4457.2013.00574.x.
Antecol, H. 2000. “An Examination of Cross-Country Differences in the Gender Gap in Labor Force Participation Rates.” Labour Economics 7(4): 409–26.
Bedard, Kelly, and Insook Cho. 2010. “Early Gender Test Score Gaps across OECD Countries.” Economics of Education Review 29(3): 348–63.

31
Bisin, Alberto, and Thierry Verdier. 2001. “The Economics of Cultural Transmission and the Dynamics of Preferences.” Journal of Economic Theory 97(2): 298–319.
Black, Dan A, Amelia M Haviland, Seth G Sanders, and Lowell J Taylor. 2008. “Gender Wage Disparities among the Highly Educated.” Journal of Human Resources 43(3): 630–59.
Blau, FrancineD., LawrenceM. Kahn, AlbertYung-Hsu Liu, and KerryL. Papps. 2013. “The Transmission of Women’s Fertility, Human Capital, and Work Orientation across Immigrant Generations.” Journal of Population Economics 26(2): 405–35. http://dx.doi.org/10.1007/s00148-012-0424-x.
Booth, Alison L. 2009. “Gender and Competition.” Labour Economics 16(6): 599–606.
Booth, Alison L., and Patrick Nolen. 2012. “Gender Differences in Risk Behaviour: Does Nurture Matter?” The Economic Journal 122(558): 56–78.
Borjas, GJ. 1995. “Ethnicity, Neighborhoods, and Human-Capital Externalities.” American Economic Review 85: 365–90.
Van Buuren, S, H.C. Boshuizen, and D. L. Knook. 1999. “Multiple Imputation of Missing Blood Pressure Covariates in Survival Analysis.” Statistics in Medicine 18: 681–94.
Carrell, SE, ME Page, and JE West. 2010. “Sex and Science: How Professor Gender Perpetuates the Gender Gap.” The Quarterly Journal of Economics 125(3): 1101–44.
Carroll, CD, BK Rhee, and C Rhee. 1994. “Are There Cultural Effects on Saving? Some Cross-Sectional Evidence.” The Quarterly Journal of Economics 109(3): 685–99.
Cvencek, Dario, Andrew N Meltzoff, and Anthony G Greenwald. 2011. “Math-Gender Stereotypes in Elementary School Children.” Child development 82(3): 766–79.
Ellison, Glenn, and Ashley Swanson. 2010. “The Gender Gap in Secondary School Mathematics at High Achievement Levels: Evidence from the American Mathematics Competitions.” Journal of Economic Perspectives 24(2): 109–28.
Else-Quest, Nicole M, Janet Shibley Hyde, and Marcia C Linn. 2010. “Cross-National Patterns of Gender Differences in Mathematics: A Meta-Analysis.” Psychological bulletin 136(1): 103–27.
Eugster, Beatrix, Rafael Lalive, Andreas Steinhauer, and Josef Zweimüller. 2011. “The Demand for Social Insurance: Does Culture Matter?” The Economic Journal 121: 413–48.

32
Farré, Lídia, and Francis Vella. 2013. “The Intergenerational Transmission of Gender Role Attitudes and Its Implications for Female Labour Force Participation.” Economica 80(318): 219–47.
Fernández, R, A Fogli, and C Olivetti. 2004. “Mothers and Sons: Preference Formation and Female Labor Force Dynamics.” The Quarterly Journal of Economics 119(4): 1249–99.
Fernández, Raquel. 2007. “Women, Work and Culture.” Journal of the European Economic Association 24(4): 329–30.
———. 2011. “Does Culture Matter?” In Handbook of Social Economics, Elsevier Ltd, 481–510.
Fernández, Raquel, and A Fogli. 2006. “Fertility: The Role of Culture and Family Experience.” Journal of the European Economic Association 4(2-3): 552–61.
Fernández, Raquel, and Alessandra Fogli. 2009. “Culture: An Empirical Investigation of Beliefs, Work, and Fertility.” American Economic Journal: Macroeconomics 1(1): 146–77.
Fryer, Ronald, and Steven Levitt. 2010. “An Empirical Analysis of the Gender Gap in Mathematics.” American Economic Journal: Applied Economics 2(April): 210–40.
Furtado, Delia, Miriam Marcén, and Almudena Sevilla. 2013. “Does Culture Affect Divorce? Evidence from European Immigrants in the United States.” Demography 50(3): 1013–38.
Ganzeboom, HBG, PM De Graaf, and DJ Treiman. 1992. “A Standard International Socio-Economic Index of Occupational Status.” Social science research 21: 1–56.
Geary, David C. 1998. Male, Female: The Evolution of Human Sex Differences, Second Edition. American Psychological Association.
Giuliano, Paola. 2007. “Living Arrangements in Western Europe: Does Cultural Origin Matter?” Journal of the European Economic Association 5(September): 927–52.
Gneezy, U, M Niederle, and A Rustichini. 2003. “Performance in Competitive Environments: Gender Differences.” The Quarterly Journal of Economics 118(3): 1049–74.
González de San Román, Ainara, and Sara de la Rica. 2012. “Gender Gaps in PISA Test Scores: The Impact of Social Norms and the Mother’s Transmission of Role Attitudes.” IZA Discussion Papers (6338).
Guiso, Luigi, Ferdinando Monte, Paola Sapienza, and Luigi Zingales. 2008. “Culture, Gender, and Math.” Science (New York, N.Y.) 320: 1164–65.

33
Halpern, Diane F. 2000. Sex Differences in Cognitive Abilities. Psychology Press; 3 edition.
Hausmann, Ricardo, LDA Tyson, and Saadia Zahidi. 2009. The Global Gender Gap Report 2008. World Economic Forum.
Hyde, Janet S, and Janet E Mertz. 2009. “Gender, Culture, and Mathematics Performance.” Proceedings of the National Academy of Sciences of the United States of America 106(22): 8801–7.
Jensen, Peter, and AW Rasmussen. 2011. “The Effect of Immigrant Concentration in Schools on Native and Immigrant Children’s Reading and Math Skills.” Economics of Education Review 30(6): 1503–15.
Kimura, Doreen. 2000. Sex and Cognition. MIT Press.
Machin, Stephen, and Patrick A Puhani. 2003. “Subject of Degree and the Gender Wage Differential: Evidence from the UK and Germany.” Economics Letters 79(3): 393–400.
Niederle, Muriel, and Lise Vesterlund. 2010. “Explaining the Gender Gap in Math Test Scores: The Role of Competition.” Journal of Economic Perspectives 24(2): 129–44.
Paglin, M, and AM Rufolo. 1990. “Heterogeneous Human Capital, Occupational Choice, and Male-Female Earnings Differences.” Journal of Labor Economics 8(1): 123–44.
Rubin, Donald B. 1987. Multiple Imputation for Nonresponse in Surveys. John Wiley & Sons.
Schnepf, Sylke Viola. 2007. “Immigrants’ Educational Disadvantage: An Examination across Ten Countries and Three Surveys.” Journal of Population Economics 20(3): 527–45.
Spencer, SJ, CM Steele, and DM Quinn. 1999. “Stereotype Threat and Women’s Math Performance.” Journal of Experimental Social Psychology 35: 4–28.
Turner, Sarah E, and William G Bowen. 1999. “CHOICE OF MAJOR: THE CHANGING (UNCHANGING) GENDER GAP.” Industrial & Labor Relations Review 52(2): 289–313.
Xie, Yu, and KA Shauman. 2003. Women in Science: Career Processes and Outcomes. Harvard University Press.
34
Table 1. Gender Gap in Math Scores and Gender Equality by Country of Ancestry
PANEL A
Country Math
Gender Gap GGI PEI FLFP N
1 Ukraine -174.97 0.69 0.06 0.53 5 2 Korea -78.24 0.61 0.07 0.49 46 3 Bangladesh -77.60 0.65 0.29 0.57 7 4 Macedonia -72.64 0.69 0.16 0.42 20 5 Slovenia -62.05 0.70 0.10 0.53 6 6 Uruguay -40.31 0.69 0.14 0.55 17 7 Fiji -38.99 0.64 0.06 0.39 35 8 Greece -35.53 0.67 0.09 0.44 46 9 Malaysia -35.19 0.65 0.06 0.44 34
10 United States -34.75 0.72 0.14 0.58 111 11 Croatia -31.74 0.69 0.16 0.47 77 12 Morocco -31.70 0.59 0.10 0.26 192 13 Sweden -31.38 0.81 0.50 0.59 9 14 Romania -30.52 0.68 0.04 0.48 58 15 Spain -25.55 0.73 0.37 0.51 246 16 Albania -25.51 0.66 0.04 0.50 136 17 United Kingdom -24.78 0.74 0.28 0.55 838 18 India -24.71 0.62 0.27 0.30 168 19 China -22.72 0.69 0.14 0.68 608 20 Italy -22.65 0.68 0.16 0.38 1,083 21 Poland -20.11 0.70 0.18 0.47 47 22 Russian Fed. -17.16 0.70 0.08 0.56 592 23 Belgium -15.56 0.72 0.24 0.47 159 24 Bolivia -14.36 0.67 0.15 0.63 131 25 Turkey -13.82 0.58 0.07 0.27 1,783 26 Hungary -12.50 0.69 0.11 0.43 7 27 Ethiopia -10.69 0.59 0.11 0.78 151 28 Suriname -10.39 0.67 0.16 0.40 107 29 Pakistan -9.95 0.55 0.15 0.22 36 30 Philippines -9.66 0.76 0.29 0.49 240 31 Portugal -8.53 0.70 0.16 0.56 2,846 32 South Africa -7.12 0.77 0.45 0.45 70 33 France -6.43 0.73 0.29 0.51 614 34 Viet Nam -2.95 0.68 0.12 0.73 359 35 Germany -1.75 0.74 0.31 0.53 398 36 New Zealand 2.42 0.79 0.39 0.62 376 37 Estonia 6.35 0.71 0.16 0.56 55 38 Paraguay 12.61 0.69 0.10 0.57 63 39 Australia 32.26 0.73 0.19 0.59 36 40 Austria 32.29 0.70 0.27 0.54 46 41 Chile 33.52 0.69 0.26 0.43 24 42 Slovakia 37.23 0.68 0.11 0.50 70 43 Iran 38.89 0.58 0.02 0.16 6 44 Netherlands 43.98 0.75 0.34 0.60 62 45 Brazil 180.38 0.67 0.06 0.59 7 mean -18.29 0.67 0.16 0.49 12,027 sd 47.51 0.06 0.12 0.18
PANEL B Math Gap 1 GGI 0.19* 1 PEI 0.18* 0.78* 1 FLFP 0.20* 0.67* 0.32* 1 Notes: Panel A displays the means of math gender gap and gender equality measures by country of ancestry estimated using our sample of second generation immigrants from 2003, 2006, 2009 and 2012 PISA. Countries are ordered by the gender gap in math scores. It was obtained from estimating a linear regression using the Plausible Values provided by the PISA data sets as LHS variable and a female dummy as RHS (we estimated one regression for each PV and present the average of the 5 coefficients estimated). See Appendix Table A.2 for details about gender equality measures. The last two rows of Panel A display the mean and cross-country standard deviation. Panel B display Pearson correlations between variables. *Indicates a correlation statistically significant at 95 per cent.

35
Figure 1. Gender Gap in Math Scores of Second-generation Immigrants and Gender Equality in Countries of Ancestry
Notes: The figure displays the correlation between the average math gender gap among second-generation immigrants and our three measures of gender equality in the country of ancestry. The math gender gap was obtained from estimating a linear regression using the Plausible Values provided by the PISA data sets as LHS variable and a female dummy as RHS variable. We estimated one regression for each PV for each country and present the average of the 5 coefficients estimated. We use individuals whose both parents were born in a foreign country from the 2003, 2006, 2009 and 2012 PISA datasets. Definitions and data sources of the gender equality measures are presented in Appendix Table A.2. Just for presentation purposes, Brazil and Ukraine were not included in the Figure.
Uruguay
BoliviaBoliviaBoliviaBoliviaBoliviaBoliviaBoliviaBoliviaBoliviaBolivia
Paraguay
Bolivia
ParaguayParaguay
Bolivia
Uruguay
Chile
Paraguay
Chile
Bolivia
Paraguay
BoliviaBolivia
Paraguay
Bolivia
Paraguay
Bolivia
Uruguay
ParaguayParaguay
BoliviaBoliviaBolivia
Chile
Paraguay
Chile
BoliviaBoliviaBoliviaBoliviaBoliviaBoliviaBolivia
ParaguayParaguay
Bolivia
Chile
BoliviaBoliviaBolivia
Paraguay
BoliviaBoliviaBoliviaBoliviaBoliviaBoliviaBoliviaBoliviaBoliviaBoliviaBolivia
Paraguay
BoliviaBoliviaBoliviaBolivia
ParaguayParaguayParaguayParaguay
BoliviaBolivia
ParaguayParaguay
BoliviaBoliviaBoliviaBoliviaBoliviaBoliviaBolivia
ParaguayParaguayParaguay
BoliviaBolivia
Paraguay
Bolivia
Chile
ParaguayParaguay
BoliviaBoliviaBoliviaBoliviaBoliviaBolivia
Uruguay
BoliviaBoliviaBolivia
Uruguay
Bolivia
Paraguay
Bolivia
ParaguayParaguayParaguay
Bolivia
Chile
Uruguay
BoliviaBolivia
ChileChile
Paraguay
BoliviaBoliviaBolivia
UruguayUruguayUruguayUruguay
Paraguay
Uruguay
BoliviaBoliviaBoliviaBoliviaBolivia
Uruguay
Paraguay
BoliviaBolivia
ParaguayParaguayParaguay
Chile
Bolivia
ChileChile
BoliviaBolivia
UruguayUruguay
Bolivia
ParaguayParaguay
BoliviaBoliviaBoliviaBoliviaBolivia
Chile
BoliviaBoliviaBoliviaBolivia
ParaguayParaguay
Bolivia
Chile
BoliviaBoliviaBoliviaBolivia
Chile
Paraguay
Chile
ParaguayParaguayParaguay
Uruguay
ParaguayParaguayParaguay
Bolivia
ChileChile
Paraguay
Chile
Paraguay
Chile
Paraguay
Bolivia
Paraguay
BoliviaBoliviaBoliviaBoliviaBolivia
Uruguay
Bolivia
Chile
Uruguay
BoliviaBoliviaBoliviaBolivia
Paraguay
BoliviaBolivia
Paraguay
BoliviaBolivia
Paraguay
Bolivia
Chile
Bolivia
ParaguayParaguay
Bolivia
Paraguay
BoliviaBolivia
Paraguay
BoliviaBolivia
Paraguay
Bolivia
Paraguay
Chile
Bolivia
Paraguay
BoliviaBoliviaBolivia
Chile
BoliviaBoliviaBolivia
ParaguayParaguay
New Zealand
Korea
ChinaChina
Phillipines
New Zealand
India United Kingdom
Viet Nam
Phillipines
United Kingdom
Viet Nam
Phillipines
United KingdomIndia United KingdomUnited Kingdom
Viet Nam
Malaysia
ChinaChina
Viet NamSouth Africa
New Zealand
ChinaChina United Kingdom
PhillipinesPhillipines
Viet Nam
Greece
Viet Nam
Phillipines
New ZealandViet Nam
Phillipines
New Zealand
United KingdomUnited Kingdom
Viet Nam
China
New ZealandViet Nam
New Zealand
China
Phillipines
United KingdomChina United KingdomUnited KingdomUnited Kingdom
Phillipines
ItalyItaly
Phillipines
United KingdomUnited KingdomUnited KingdomChina
New Zealand
United Kingdom
New ZealandViet Nam
Phillipines
United KingdomUnited KingdomUnited KingdomUnited Kingdom
Malaysia
China
New Zealand
United Kingdom
New ZealandViet Nam
Phillipines
Malaysia
United Kingdom
Malaysia
New Zealand
United Kingdom
New Zealand
South AfricaPhillipines
United Kingdom
Viet Nam
United Kingdom
Phillipines
United Kingdom
Malaysia
Viet NamViet NamViet Nam
United States
United Kingdom
Viet Nam
MalaysiaMalaysiaMalaysia
Phillipines
MalaysiaMalaysia
Phillipines
United Kingdom
New Zealand
Italy
Phillipines
United Kingdom
New Zealand
Italy United KingdomUnited Kingdom
Viet Nam
Phillipines
United KingdomUnited Kingdom
New ZealandNew Zealand
India
Phillipines
United KingdomChina
Viet Nam
ChinaChinaChina
Viet NamNew Zealand
Italy United KingdomUnited Kingdom
United StatesGreece
India
Viet Nam
IndiaIndia
New Zealand
Phillipines
China
Viet Nam
India
United States
Phillipines
United KingdomUnited KingdomUnited Kingdom
South Africa
New ZealandNew Zealand
United KingdomChina
New Zealand
Netherlands
New Zealand
Netherlands
Viet Nam
India ChinaIndia United Kingdom
Greece
United Kingdom
Korea
Phillipines
China United KingdomUnited Kingdom
New Zealand
Malaysia
China
New ZealandNew ZealandNew Zealand
Phillipines
New ZealandNew ZealandNew Zealand
United KingdomUnited KingdomChina
New ZealandNew Zealand
United KingdomIndia
New Zealand
United Kingdom
New Zealand
United Kingdom
New Zealand
ChinaChina
New ZealandNew Zealand
United Kingdom
New Zealand
United KingdomChina
New Zealand
China
New Zealand
United Kingdom
New Zealand
United KingdomUnited Kingdom
New ZealandNew ZealandNew ZealandNew Zealand
United KingdomUnited Kingdom
Viet NamNew Zealand
United Kingdom
New Zealand
India
New ZealandNew ZealandNew Zealand
United KingdomUnited KingdomUnited Kingdom
New ZealandNew ZealandNew Zealand
China
New Zealand
United KingdomUnited Kingdom
United States
China
New Zealand
United Kingdom
New ZealandNew Zealand
Phillipines
New ZealandNew ZealandNew ZealandNew ZealandNew ZealandNew Zealand
United Kingdom
Phillipines
United KingdomUnited KingdomUnited Kingdom
New Zealand
United Kingdom
New ZealandNew Zealand
ChinaIndia
New Zealand
ChinaChina
Greece
United KingdomUnited Kingdom
Viet NamNew Zealand
Phillipines
United Kingdom
New ZealandNew Zealand
South Africa
New Zealand
India China
New Zealand
Phillipines
New Zealand
China
New ZealandNew ZealandViet Nam
Phillipines
New ZealandNew Zealand
United KingdomUnited Kingdom
New ZealandNew Zealand
United States
New ZealandViet Nam
United States
South AfricaPhillipines
New Zealand
Phillipines
New ZealandNew Zealand
India United KingdomUnited Kingdom
New Zealand
Italy United Kingdom
Viet NamNew ZealandNew Zealand
India China
Phillipines
United KingdomUnited Kingdom
New ZealandNew ZealandNew Zealand
Phillipines
New ZealandNew ZealandNew Zealand
Phillipines
United Kingdom
New Zealand
Phillipines
New Zealand
United Kingdom
New ZealandNew ZealandNew ZealandViet Nam
China
New ZealandViet Nam
United Kingdom
New ZealandNew ZealandNew ZealandNew ZealandViet Nam
China
New Zealand
China United KingdomUnited Kingdom
Phillipines
New ZealandNew ZealandNew Zealand
China
Viet Nam
Phillipines
India
Viet Nam
United KingdomUnited KingdomUnited KingdomUnited KingdomUnited KingdomUnited Kingdom
Phillipines
United KingdomChina United Kingdom
Phillipines
United KingdomUnited KingdomChina
Phillipines
India
Viet Nam
United KingdomIndia United KingdomUnited Kingdom
Viet Nam
ChinaItaly United KingdomUnited KingdomChina
New Zealand
United KingdomItalyChina
Malaysia
China United KingdomUnited Kingdom
Phillipines
United Kingdom
South Africa
United KingdomUnited KingdomUnited KingdomChina United Kingdom
Phillipines
United Kingdom
Viet Nam
United Kingdom
New Zealand
Korea
Phillipines
New Zealand
Italy
South AfricaSouth Africa
United KingdomItaly
New Zealand
United KingdomUnited Kingdom
Germany
Phillipines
ChinaChinaChina
Viet Nam
ChinaChina United Kingdom
Viet NamViet Nam
Italy
MalaysiaMalaysia
United Kingdom
Phillipines
China
Phillipines
United KingdomItaly
Phillipines
China
New Zealand
China United KingdomUnited Kingdom
New ZealandViet Nam
ChinaChina United KingdomUnited KingdomIndiaIndiaIndia
New ZealandNew Zealand
United Kingdom
New ZealandNew Zealand
United KingdomUnited KingdomUnited KingdomUnited Kingdom
Phillipines
China
South Africa
New Zealand
China
Korea
Phillipines
United Kingdom
New Zealand
United KingdomUnited Kingdom
KoreaKorea
New Zealand
India
New Zealand
United Kingdom
PhillipinesPhillipines
New ZealandNew Zealand
United KingdomUnited Kingdom
United States
Phillipines
United Kingdom
Korea
Phillipines
Italy
Phillipines
United KingdomIndia China
New Zealand
United KingdomUnited Kingdom
Viet NamViet NamNew ZealandNew Zealand
United KingdomItalyChina
Viet NamViet NamSouth AfricaSouth Africa
Malaysia
United KingdomUnited KingdomChina
New Zealand
United KingdomItaly
Viet Nam
India United KingdomUnited KingdomIndia
Phillipines
United KingdomChinaItalyItaly United Kingdom
Greece
China
Viet NamNew ZealandNew Zealand
Viet Nam
United Kingdom
Korea
Phillipines
China
Phillipines
United KingdomUnited KingdomIndia
Viet NamViet Nam
ItalyChinaIndia China
Phillipines
New Zealand
Italy
South Africa
Italy
Viet NamNew Zealand
United Kingdom
New Zealand
Netherlands
Phillipines
New Zealand
United Kingdom
Phillipines
New Zealand
India
New ZealandNew Zealand
United Kingdom
Viet Nam
United Kingdom
Phillipines
United KingdomIndia
Greece
United KingdomUnited KingdomChina
Viet Nam
United KingdomUnited KingdomUnited KingdomItalyItaly United Kingdom
South Africa
New Zealand
India
New Zealand
China
Viet Nam
United KingdomChina United KingdomUnited KingdomIndia
Phillipines
United KingdomChina
New Zealand
India United Kingdom
South Africa
China
Korea
United KingdomUnited KingdomUnited Kingdom
New Zealand
China United KingdomUnited KingdomUnited Kingdom
New Zealand
United Kingdom
Phillipines
United KingdomUnited KingdomChina
Viet Nam
ChinaChina
New Zealand
United KingdomItalyChinaChina United Kingdom
New ZealandNew ZealandViet NamViet Nam
United Kingdom
New Zealand
United States
South Africa
China
New Zealand
China United KingdomItalyIndia ItalyItaly United KingdomItalyChinaIndia
Viet Nam
Italy
Malaysia
United KingdomIndia United Kingdom
Viet NamNew Zealand
ChinaItalyIndia Italy United KingdomItaly
New Zealand
India China
New Zealand
China
Phillipines
Italy
Phillipines
Italy
Viet NamNew Zealand
South Africa
New Zealand
Phillipines
Viet Nam
United Kingdom
Phillipines
China
Viet NamNew ZealandNew ZealandNew ZealandNew Zealand
United Kingdom
Phillipines
Viet NamViet Nam
United Kingdom
Viet NamNew Zealand
South AfricaViet Nam
United KingdomChinaItalyItaly
New Zealand
ChinaChina
New Zealand
United Kingdom
United States
New Zealand
Malaysia
Viet Nam
United KingdomUnited Kingdom
Phillipines
China
Phillipines
New Zealand
Phillipines
United Kingdom
Phillipines
China
New ZealandViet Nam
United Kingdom
Phillipines
India
Phillipines
United KingdomItaly
New Zealand
United Kingdom
Phillipines
New Zealand
Greece
United Kingdom
Phillipines
India United KingdomChinaIndia United KingdomUnited KingdomUnited KingdomUnited KingdomUnited KingdomItaly
New Zealand
Phillipines
Viet Nam
ItalyItaly
Phillipines
United Kingdom
Phillipines
United Kingdom
Malaysia
ChinaItaly
Viet Nam
Greece
Phillipines
New Zealand
ItalyChinaIndia United KingdomUnited KingdomChina
New Zealand
United Kingdom
Viet NamNew Zealand
Phillipines
China
New ZealandNew ZealandViet Nam
United Kingdom
New ZealandViet Nam
United Kingdom
New Zealand
South Africa
Italy United Kingdom
Viet Nam
Korea
United KingdomChinaIndia
New Zealand
United KingdomUnited Kingdom
Viet NamViet Nam
China
Phillipines
China
New Zealand
China
Viet Nam
PhillipinesPhillipines
United Kingdom
New Zealand
India
New Zealand
India
Malaysia
Italy
Viet Nam
China
Phillipines
ChinaChina United Kingdom
Viet NamViet Nam
China
Viet Nam
United Kingdom
New ZealandNew Zealand
Greece
United KingdomIndia United KingdomChinaIndia United KingdomChinaChina United KingdomItaly
South Africa
India
New Zealand
ChinaIndiaIndia
New Zealand
Greece
United KingdomUnited KingdomUnited Kingdom
Malaysia
United KingdomIndiaIndia United KingdomItalyChinaChinaIndia
Viet Nam
United Kingdom
United States
Germany
IndiaIndiaIndia
Viet NamNew Zealand
China
Phillipines
India
New Zealand
India
Phillipines
ItalyIndia
Phillipines
India China
Malaysia
India China United KingdomIndia
Phillipines
IndiaIndia
Phillipines
India China
United States
India United KingdomIndia ChinaIndia
Viet Nam
United KingdomChina
Greece
China
GermanyNew Zealand
United Kingdom
Greece
United Kingdom
Viet Nam
United KingdomIndia China
New Zealand
Greece
United KingdomUnited Kingdom
Greece
United Kingdom
Greece
Viet Nam Germany
United Kingdom
Germany
India
New Zealand
United Kingdom
GermanyNew Zealand
United Kingdom
New Zealand
ChinaIndia China
Germany
ChinaChinaIndia
New ZealandGermany
ChinaItaly
Viet Nam
United Kingdom
New Zealand
ChinaChina
New Zealand
China United KingdomUnited KingdomUnited Kingdom
PhillipinesPhillipines
China
New Zealand
United Kingdom
Phillipines
India United KingdomUnited KingdomUnited Kingdom
PhillipinesSouth Africa
United Kingdom
New Zealand
Phillipines
United KingdomUnited KingdomChinaItaly United KingdomItalyItaly
Viet Nam
United KingdomChinaIndia
New ZealandViet Nam
United Kingdom
Viet NamNew ZealandNew ZealandNew Zealand
Italy
New ZealandNew Zealand
Italy
GreeceGreece
United Kingdom
Malaysia
United KingdomChina
United States
United Kingdom
Phillipines
Italy United Kingdom
New Zealand
China
Viet Nam
Phillipines
United KingdomChina
Phillipines
United Kingdom
Korea
New Zealand
United KingdomChina
Phillipines
New ZealandViet Nam
PhillipinesPhillipinesPhillipines
United Kingdom
PhillipinesPhillipinesPhillipinesPhillipines
China
Viet Nam
Phillipines
New Zealand
United Kingdom
Viet NamViet Nam
United Kingdom
South AfricaPhillipinesPhillipinesPhillipinesPhillipinesPhillipines
South AfricaPhillipinesPhillipines
United Kingdom
Netherlands
United KingdomChina United KingdomUnited KingdomUnited Kingdom
South Africa
India United KingdomUnited Kingdom
New Zealand
United Kingdom
Phillipines
ChinaChina
Greece
Phillipines
United Kingdom
Viet Nam
United Kingdom
Viet Nam
United KingdomUnited KingdomUnited KingdomUnited Kingdom
Viet Nam
United KingdomUnited Kingdom
New Zealand
Phillipines
United Kingdom
New Zealand
India
Phillipines
New Zealand
Greece
China United Kingdom
New Zealand
China
Viet Nam
United KingdomUnited Kingdom
Phillipines
Germany
Phillipines
United Kingdom
Greece
United KingdomUnited Kingdom
New Zealand
China United Kingdom
Korea
United KingdomUnited KingdomChina United Kingdom
Viet Nam
China United Kingdom
Phillipines
United KingdomUnited Kingdom
PhillipinesPhillipines
India United KingdomUnited KingdomChinaChina United Kingdom
Phillipines
United KingdomUnited Kingdom
Phillipines
United Kingdom
New Zealand
United Kingdom
Viet NamViet Nam
China
New Zealand
United Kingdom
New Zealand
Malaysia
ChinaIndia
Viet Nam
Greece
India United KingdomChina United KingdomUnited KingdomUnited Kingdom
Viet NamViet Nam
United KingdomUnited KingdomUnited KingdomUnited KingdomUnited KingdomUnited KingdomIndia
New Zealand
Korea
United KingdomUnited KingdomUnited Kingdom
South Africa
New Zealand
United KingdomUnited KingdomChina
Phillipines
New Zealand
United Kingdom
Viet Nam
United KingdomChina United KingdomUnited Kingdom
South AfricaViet Nam
United KingdomUnited Kingdom
Malaysia
China United KingdomChina United Kingdom
New Zealand
United Kingdom
Korea
Viet Nam
United KingdomChina
United States
India United Kingdom
New Zealand
United Kingdom
Malaysia
Phillipines
Italy United KingdomUnited Kingdom
New Zealand
United Kingdom
Phillipines
Viet NamNew Zealand
United Kingdom
PhillipinesPhillipines
Viet Nam
Phillipines
New Zealand
United KingdomChina
New Zealand
Phillipines
New Zealand
United Kingdom
New ZealandNew Zealand
South Africa
United KingdomChina
New Zealand
United Kingdom
Phillipines
Viet Nam
PhillipinesSouth Africa
China
Viet Nam
United KingdomUnited KingdomUnited KingdomChina
New ZealandViet Nam
New Zealand
United Kingdom
Viet Nam
Phillipines
United Kingdom
Greece
ChinaChina
Viet Nam
Korea
China
United States
ChinaChina United Kingdom
PhillipinesPhillipines
United KingdomIndia China
PhillipinesPhillipines
Korea
Phillipines
Viet NamViet Nam
China
Viet NamViet Nam
United KingdomUnited Kingdom
New Zealand
Greece
Phillipines
Greece
Phillipines
China United KingdomUnited Kingdom
Phillipines
China
Viet Nam
India ChinaChinaChinaChina United KingdomChinaIndia China
PhillipinesPhillipines
United KingdomChina
Phillipines
United KingdomUnited KingdomUnited Kingdom
Viet Nam
United KingdomUnited KingdomUnited KingdomChina
Viet Nam
ChinaChina
Viet Nam
China United Kingdom
New Zealand
United Kingdom
Phillipines
Viet Nam
United Kingdom
Phillipines
United KingdomUnited KingdomChina United KingdomChina United KingdomIndia
Phillipines
China
Korea
United KingdomUnited Kingdom
Netherlands
Viet Nam
United KingdomChina
Phillipines
Viet Nam
China
New ZealandNew ZealandViet Nam
United Kingdom
United States
United Kingdom
Phillipines
United KingdomChina
Phillipines
Greece
Phillipines
Viet Nam
United KingdomUnited KingdomUnited Kingdom
United States
United KingdomChinaIndia United KingdomChina
Viet NamViet NamViet Nam
United Kingdom
New ZealandViet Nam
China
Phillipines
China
New ZealandViet Nam
United Kingdom
South Africa
ItalyIndiaIndia
New Zealand
Phillipines
Viet Nam
United Kingdom
New ZealandNew Zealand
ChinaIndia
New Zealand
China
New ZealandViet NamViet Nam
ItalyChina United Kingdom
Germany
United KingdomUnited KingdomIndia
Phillipines
India
Greece
India
Netherlands
China
South Africa
New Zealand
China
Viet NamNew Zealand
United States
South AfricaPhillipines
New Zealand
United KingdomUnited KingdomChina United KingdomUnited Kingdom
Viet Nam
Phillipines
China United KingdomChina
New ZealandViet Nam
New Zealand
Greece
Viet NamNew ZealandNew Zealand
United KingdomUnited KingdomChinaIndia China United KingdomChinaItaly
New ZealandViet Nam
ChinaItaly United KingdomChina
South Africa
United Kingdom
Viet NamViet Nam
United KingdomUnited KingdomItalyChinaChinaChinaIndia
New Zealand
Phillipines
New Zealand
United Kingdom
Phillipines
United States
New Zealand
Phillipines
Korea
United KingdomUnited Kingdom
New Zealand
United KingdomUnited KingdomUnited Kingdom
Viet Nam
China
New ZealandViet Nam
United Kingdom
Phillipines
New ZealandViet Nam
China United Kingdom
Viet Nam
ChinaChina United Kingdom
New Zealand
United KingdomIndia
Korea
China
Viet Nam
China United Kingdom
Phillipines
ItalyChina United Kingdom
New Zealand
China
Korea
United Kingdom
Phillipines
ChinaChina United Kingdom
Phillipines
New Zealand
United KingdomIndia
New ZealandViet Nam
Phillipines
Greece
Phillipines
United KingdomUnited KingdomIndia
Viet Nam
United KingdomUnited KingdomUnited Kingdom
Viet Nam
China United Kingdom
Phillipines
ChinaChina
Viet Nam
ChinaChina
Viet NamNew Zealand
United States
New ZealandNew Zealand
United KingdomUnited KingdomUnited KingdomUnited Kingdom
Viet NamViet Nam
United KingdomChina United KingdomIndia
Greece
United Kingdom
Viet Nam
United KingdomChina
Viet NamViet Nam
China
Phillipines
New Zealand
United KingdomUnited KingdomIndia United KingdomUnited Kingdom
New Zealand
India
New Zealand
South Africa
United Kingdom
Viet Nam
India ItalyChina United Kingdom
Phillipines
ChinaChina
New Zealand
Phillipines
India ItalyChinaIndia
Greece
United Kingdom
New Zealand
Phillipines
China
Viet Nam
United KingdomUnited Kingdom
New Zealand
United KingdomIndiaIndia
Phillipines
United States
ChinaIndia
New Zealand
United Kingdom
New Zealand
United Kingdom
United StatesGreece
United KingdomChina United KingdomChinaIndia ItalyIndia
Korea
New ZealandViet Nam
United KingdomIndia United Kingdom
Viet Nam
India United Kingdom
Phillipines
United Kingdom
Malaysia
United Kingdom
Malaysia
China
New Zealand
United Kingdom
Korea
Viet NamViet Nam
Malaysia
New Zealand
ItalyChina United Kingdom
Phillipines
Viet Nam
United Kingdom
PhillipinesPhillipines
United Kingdom
New Zealand
United Kingdom
New Zealand
United Kingdom
Netherlands
China
Viet NamNew Zealand
ItalyItaly United KingdomUnited Kingdom
Phillipines
India
New Zealand
Phillipines
United Kingdom
Viet Nam
United KingdomUnited Kingdom
Viet Nam
China United KingdomUnited KingdomIndia
Germany
Phillipines
United Kingdom
Phillipines
New ZealandViet Nam
United KingdomUnited Kingdom
Phillipines
China
New Zealand
United States
United Kingdom
Viet NamNew Zealand
Viet Nam
ChinaChina
Viet Nam
China
Phillipines
United KingdomUnited KingdomUnited KingdomUnited KingdomUnited Kingdom
New Zealand
Phillipines
United KingdomChina United Kingdom
United States
United Kingdom
Phillipines
Greece
Viet Nam
United KingdomIndia
South Africa
New Zealand
United KingdomUnited KingdomChina
Viet Nam
China
Phillipines
United KingdomChina United Kingdom
Netherlands
China
Phillipines
New Zealand
India United KingdomUnited Kingdom
Korea
Viet NamNew Zealand
United Kingdom
New ZealandNew Zealand
United Kingdom
Greece
New Zealand
United KingdomUnited KingdomUnited Kingdom
Phillipines
India United KingdomUnited Kingdom
Viet NamNew Zealand
Phillipines
New Zealand
United States
New Zealand
China United Kingdom
New Zealand
United KingdomUnited KingdomChina United Kingdom
PhillipinesPhillipines
Viet NamSouth Africa
ChinaChinaItaly United KingdomIndiaIndia China
New Zealand
United States
United Kingdom
Phillipines
United Kingdom
South Africa
ChinaChina
Greece
United KingdomChina
Phillipines
United Kingdom
Viet NamViet NamViet NamViet NamViet NamViet NamViet Nam
United Kingdom
Viet Nam
China
Viet NamViet Nam
Phillipines
China
Viet NamViet NamViet Nam
United Kingdom
New ZealandNew ZealandViet NamViet NamViet NamViet NamViet Nam
China
Phillipines
China
Viet NamViet Nam
United Kingdom
Viet Nam
Netherlands
Phillipines
ChinaChina
Viet Nam
United Kingdom
New ZealandViet NamViet Nam
India
Phillipines
New Zealand
United States
United KingdomUnited KingdomChina
Viet Nam
United Kingdom
Viet Nam
China
Viet NamViet Nam
United States
Viet Nam
United Kingdom
Viet NamNew Zealand
Viet NamViet Nam
India United Kingdom
Viet Nam
United Kingdom
Viet NamViet Nam
Netherlands
United Kingdom
Viet Nam
Greece
New Zealand
India
Viet NamViet NamViet Nam
United Kingdom
Viet Nam
United KingdomUnited Kingdom
Viet Nam
United Kingdom
GermanyViet NamNew Zealand
United KingdomUnited Kingdom
Viet Nam
China United KingdomChina United Kingdom
New Zealand
India China
New Zealand
United KingdomUnited KingdomUnited KingdomChina United KingdomItaly
Viet Nam
United KingdomUnited Kingdom
Korea
ChinaIndia United Kingdom
New ZealandViet Nam
ChinaIndia
Phillipines
China
New Zealand
China
South Africa
United Kingdom
South Africa
United KingdomChina
South Africa
China
South AfricaPhillipines
India
Viet Nam
United KingdomChina United Kingdom
Viet NamSouth Africa
Greece
China
South AfricaSouth AfricaSouth Africa
New Zealand
United Kingdom
New ZealandViet Nam
South Africa
China
Phillipines
China United KingdomUnited KingdomUnited KingdomChina
Germany
Phillipines
United Kingdom
Greece
New ZealandViet Nam
United Kingdom
South Africa
United KingdomUnited Kingdom
Viet Nam
United KingdomUnited Kingdom
New Zealand
United KingdomChina United Kingdom
Viet Nam
ChinaChina
New Zealand
United Kingdom
Korea
Viet Nam GermanyViet Nam
China United KingdomUnited KingdomChinaChinaChina United Kingdom
Viet NamViet Nam
United KingdomChinaChina United Kingdom
Viet NamNew ZealandNew ZealandNew Zealand
Korea
United Kingdom
Viet NamNew Zealand
United KingdomChina United Kingdom
Greece
United KingdomUnited KingdomUnited KingdomUnited KingdomItalyChina
Germany
United Kingdom
Viet NamNew Zealand
Phillipines
China
New ZealandNew ZealandNew ZealandViet Nam
New ZealandNew Zealand
South Africa
India
New Zealand
China
New Zealand
United KingdomUnited Kingdom
New ZealandNew Zealand
United Kingdom
New ZealandViet Nam
New ZealandViet Nam
China
Viet Nam
United KingdomUnited Kingdom
Malaysia
New Zealand
United Kingdom
Viet NamNew Zealand
United States
New ZealandNew Zealand
Greece
India United Kingdom
Viet Nam
United Kingdom
Viet Nam
ChinaIndia
Netherlands
China
Phillipines
Viet Nam
China
South AfricaViet Nam
New Zealand
China
Phillipines
New Zealand
South Africa
New Zealand
India
New Zealand
United Kingdom
Viet Nam
Phillipines
China
Phillipines
Viet Nam
Korea
United KingdomChina United Kingdom
Phillipines
New Zealand
ChinaChina United Kingdom
PhillipinesPhillipines
India United Kingdom
Phillipines
India
Viet NamNew Zealand
United KingdomChina
New Zealand
ItalyIndia United KingdomIndia United KingdomChina United KingdomUnited KingdomChinaChina
Phillipines
United KingdomChinaChina
Malaysia
China
South Africa
United Kingdom
Phillipines
Italy
Viet Nam
China United KingdomUnited KingdomChinaItaly United Kingdom
South Africa
New Zealand
Phillipines
China
Phillipines
China
Greece
New Zealand
India
New ZealandViet Nam
China
Viet Nam
United KingdomChinaChina
Phillipines
China United KingdomItalyChina United KingdomUnited KingdomChina
Viet Nam
Malaysia
Viet NamNew ZealandNew Zealand
United KingdomUnited KingdomChinaChinaChina United KingdomUnited KingdomUnited Kingdom
Phillipines
China
Viet Nam
PhillipinesPhillipines
United KingdomUnited KingdomChina United KingdomChina
Viet Nam
ChinaIndia
Viet Nam
United KingdomUnited Kingdom
New Zealand
China United KingdomUnited KingdomIndia United Kingdom
Viet Nam
India
Phillipines
United KingdomUnited Kingdom
Viet Nam
United KingdomUnited KingdomItaly
Viet NamNew Zealand
PhillipinesPhillipines
Viet Nam
China United KingdomChina United Kingdom
New ZealandGermany
United KingdomUnited KingdomIndia
New Zealand
United Kingdom
New Zealand
United Kingdom
Korea
China
New ZealandNew Zealand
China United Kingdom
New Zealand
ChinaIndia
New Zealand
China
Viet Nam
China United Kingdom
Viet Nam
China United KingdomUnited KingdomChinaChinaChina United KingdomUnited KingdomChinaChinaItaly United Kingdom
Phillipines
Viet Nam
Phillipines
New Zealand
Phillipines
New Zealand
United KingdomIndia ChinaChinaItalyChina United KingdomUnited KingdomChina
New Zealand
China
Viet NamViet Nam
ChinaChina
Viet Nam
United KingdomUnited KingdomUnited Kingdom
New Zealand
United Kingdom
Viet Nam
Phillipines
New Zealand
ChinaChina
Viet Nam
Phillipines
United Kingdom
New ZealandViet Nam
India United Kingdom
Phillipines
United Kingdom
Malaysia
New Zealand
China United KingdomUnited KingdomChinaChina
Phillipines
China
Germany
United KingdomUnited Kingdom
New ZealandViet Nam
China United KingdomUnited Kingdom
New ZealandNew Zealand
ChinaChinaItaly United Kingdom
Germany
China
Phillipines
Greece
New Zealand
United KingdomChinaIndiaIndia
Viet NamNew Zealand
China
Viet Nam
United KingdomUnited KingdomChinaIndia
Viet Nam
China
South Africa
United KingdomUnited KingdomChina
Viet Nam
ChinaIndia ItalyChina
Viet Nam
ChinaChina
New Zealand
Korea
China
New Zealand
Phillipines
ChinaChinaChinaItaly
Viet Nam
Korea
Viet NamViet NamSouth Africa
United KingdomChina
Viet Nam
United Kingdom
Viet Nam
United Kingdom
New Zealand
China
New Zealand
ChinaChina
New Zealand
India
New ZealandViet Nam
India
South Africa
United Kingdom
Malaysia
Italy United KingdomIndia
Phillipines
New ZealandNew Zealand
Italy United Kingdom
Viet Nam
ChinaChinaItalyChina
New ZealandNew Zealand
ChinaChinaChina
Viet Nam
ChinaChina United Kingdom
Germany
China United KingdomChinaChina United KingdomUnited KingdomChina United Kingdom
Phillipines
India
Malaysia
United KingdomIndiaIndia China
Viet Nam
United States
ChinaChina
PhillipinesPhillipinesSouth Africa
China
Phillipines
United KingdomChinaItaly
New Zealand
United Kingdom
Viet Nam
India
New ZealandNew Zealand
Greece
New Zealand
United KingdomUnited KingdomChinaChina
Phillipines
Greece
PhillipinesSouth Africa
United KingdomUnited KingdomUnited Kingdom
Viet NamViet Nam
China United KingdomChina
New Zealand
United KingdomChinaChinaIndia ChinaIndia
Greece
United Kingdom
Phillipines
India ChinaIndia
Germany
ItalyChinaChina United Kingdom
Viet Nam
United KingdomChina United Kingdom
Viet Nam
China
Viet Nam
Italy
PhillipinesSouth Africa
Viet Nam
ItalyChina
South Africa
China
South Africa
Italy United KingdomChina United Kingdom
Netherlands
China
Phillipines
India
South Africa
China United KingdomChinaChinaChinaChina United KingdomChina United KingdomChina
New ZealandNew Zealand
China
Germany
Greece
ChinaChina
Korea
United Kingdom
South Africa
New Zealand
China
Phillipines
China
Greece
United KingdomIndia United Kingdom
Viet Nam
United KingdomItaly
New ZealandNew Zealand
India United KingdomIndia United KingdomChina
Viet Nam
China
New Zealand
United KingdomChina
Viet Nam
China
Turkey
Croatia
China
TurkeyTurkeyTurkey
Croatia
TurkeyTurkey
Romania
TurkeyTurkeyTurkeyTurkey
Germany
TurkeyTurkeyTurkey
Croatia
TurkeyTurkeyTurkey
Macedonia
Turkey
Germany
TurkeyTurkeyTurkeyTurkey
Romania
TurkeyTurkey
Germany
Turkey
Poland
TurkeyTurkey
Romania
Turkey
Poland
Turkey
CroatiaRomaniaCroatia
Turkey
Poland
HungaryTurkeyTurkeyTurkey
Poland
TurkeyTurkeyTurkeyTurkeyTurkeyTurkey
Croatia
TurkeyTurkeyTurkeyTurkey
Croatia
TurkeyTurkeyTurkeyTurkey
Germany
Romania
TurkeyTurkeyTurkeyTurkeyTurkeyTurkey
Romania
Germany
Romania
Turkey
Poland
Turkey
Poland
Turkey
Macedonia
Turkey
Croatia
Turkey
Poland
Turkey
Macedonia
Turkey
Croatia
Turkey
Germany
Turkey
Germany
Croatia
TurkeyTurkey
Croatia
TurkeyTurkey
Poland
Turkey
Croatia
Poland
TurkeyTurkey
Germany
CroatiaCroatiaRomaniaCroatia
TurkeyTurkeyTurkey
Germany
Romania
Turkey
Croatia
Poland
TurkeyTurkey
Croatia
TurkeyTurkeyTurkeyTurkey
Croatia
TurkeyTurkeyTurkeyTurkeyTurkeyTurkey
Romania
TurkeyTurkey
Romania
TurkeyTurkeyTurkey
CroatiaCroatiaRomaniaAlbania
TurkeyTurkeyTurkeyTurkey
Romania
TurkeyTurkeyTurkeyTurkey
Poland
Slovenia
Germany
Slovakia
TurkeyTurkeyTurkeyTurkeyTurkeyTurkeyTurkeyTurkey Hungary
Germany
TurkeyTurkeyTurkeyTurkeyTurkey
Romania
TurkeyTurkey
Croatia
Turkey
Croatia
Germany
TurkeyTurkeyTurkeyTurkeyTurkey
MacedoniaMacedonia
Poland
TurkeyTurkeyTurkey
Romania
TurkeyTurkey
Romania
TurkeyTurkeyTurkeyTurkeyTurkeyTurkey
Croatia
Turkey
Germany
Croatia
TurkeyTurkeyTurkeyTurkeyTurkeyTurkeyTurkeyTurkey
Romania
TurkeyTurkeyTurkeyTurkey
Germany
TurkeyTurkeyTurkey
Croatia
Germany
TurkeyTurkey
Croatia
Turkey
Poland
Macedonia
Poland
TurkeyTurkeyTurkeyTurkey
RomaniaCroatiaRomaniaCroatia
Germany
TurkeyTurkeyTurkey
Poland
Croatia
Turkey
Romania
Turkey
Croatia
Germany
Turkey
Germany
RomaniaRomaniaCroatiaCroatia
Slovenia
TurkeyTurkey
Poland
TurkeyTurkeyTurkeyTurkey
Croatia
TurkeyTurkey
Croatia
Poland
HungaryTurkeyTurkey HungaryTurkeyTurkey
Croatia
Slovenia
Turkey
Romania
Turkey
Croatia
TurkeyTurkey
Poland
TurkeyTurkeyTurkey
Macedonia
Turkey
Romania
TurkeyTurkeyTurkeyTurkeyTurkey
Romania
TurkeyTurkeyTurkeyTurkeyTurkeyTurkeyTurkey
Croatia
TurkeyTurkeyTurkeyTurkey HungaryTurkeyTurkeyTurkeyTurkeyTurkeyTurkeyTurkey
Poland
Croatia
TurkeyTurkey
Poland
Turkey
Poland
TurkeyTurkeyTurkey Hungary
Croatia
TurkeyTurkey
Croatia
TurkeyTurkeyTurkeyTurkeyTurkey
Romania
Turkey
RomaniaRomania
TurkeyTurkeyTurkeyTurkeyTurkey
Croatia
Poland
TurkeyTurkey
Croatia
TurkeyTurkey
Romania
TurkeyTurkey
Romania
TurkeyTurkeyTurkeyTurkeyTurkeyTurkey
Macedonia
Poland
Turkey
Romania
Turkey
Germany
Poland
TurkeyTurkeyTurkey
Croatia
Turkey
Germany
TurkeyTurkey
Germany
TurkeyTurkeyTurkeyTurkeyTurkey
Albania
Macedonia
Romania
Turkey
Romania
Germany
Russian Fed.TurkeyTurkey
Poland
Croatia
Turkey
Germany
TurkeyTurkeyTurkeyTurkeyTurkeyTurkeyTurkeyTurkey
Romania
TurkeyTurkeyTurkeyTurkeyTurkey
RomaniaRomania
TurkeyTurkeyTurkeyTurkeyTurkeyTurkeyTurkeyTurkeyTurkeyTurkey
Romania
TurkeyTurkeyTurkey
CroatiaCroatia
TurkeyTurkey
Poland
TurkeyTurkeyTurkeyTurkey
Romania
Poland
TurkeyTurkeyTurkey
Poland
TurkeyTurkey
Croatia
TurkeyTurkeyTurkeyTurkey
Romania
Poland
TurkeyTurkeyTurkeyTurkeyTurkeyTurkey
Poland
TurkeyTurkeyTurkeyTurkey
Croatia
TurkeyTurkey
Germany
Turkey
Romania
TurkeyTurkeyTurkeyTurkeyTurkeyTurkeyTurkeyTurkeyTurkeyTurkeyTurkey
Germany
Macedonia
TurkeyTurkey
Croatia
TurkeyTurkeyTurkeyTurkeyTurkeyTurkeyTurkey
Romania
Turkey
Romania
TurkeyTurkeyTurkeyTurkeyTurkeyTurkey
Macedonia
Turkey
RomaniaRomania
Turkey
Croatia
Slovenia
TurkeyTurkeyTurkeyRussian Fed.
Macedonia
TurkeyTurkeyTurkeyTurkeyTurkeyTurkey
Croatia
Turkey
Slovakia
Romania
TurkeyTurkeyTurkeyTurkeyTurkey
Romania
TurkeyTurkeyTurkeyTurkeyTurkeyTurkeyTurkey
Croatia
TurkeyTurkeyTurkeyTurkeyTurkeyTurkeyTurkey
Germany
Romania
TurkeyTurkeyTurkey
Macedonia
CroatiaCroatia
TurkeyTurkey
Croatia
TurkeyTurkeyTurkey
Romania
Germany
TurkeyTurkeyTurkeyTurkeyTurkey
Macedonia
Croatia
Turkey
Poland
Croatia
Macedonia
Croatia
Poland
TurkeyTurkeyTurkey
Romania
TurkeyTurkey
Germany
Poland
TurkeyTurkeyTurkeyTurkey
Germany
Turkey
Romania
TurkeyTurkey
Croatia
Germany
TurkeyTurkeyTurkey
Slovenia
TurkeyRussian Fed.
TurkeyTurkey
Macedonia
TurkeyTurkeyTurkeyTurkeyTurkey
Germany
TurkeyTurkey
Macedonia
Romania
Turkey
RomaniaCroatiaCroatia
Turkey
Poland
CroatiaCroatia
TurkeyTurkey
Romania
Poland
TurkeyTurkeyTurkeyTurkey
Croatia
TurkeyTurkey
Poland
TurkeyTurkeyTurkeyTurkeyTurkeyTurkeyTurkey
Macedonia
Turkey
Slovenia
Poland
Romania
TurkeyTurkeyTurkeyTurkeyTurkey
CroatiaCroatia
TurkeyTurkeyTurkey
Poland
TurkeyTurkey
Germany
Turkey
Poland
Turkey
Albania
TurkeyTurkeyTurkeyTurkeyTurkeyTurkey
Croatia
Germany
TurkeyTurkey
CroatiaRomania
TurkeyTurkey
Macedonia
Germany
CroatiaRomania
Poland
Turkey
Croatia
HungaryTurkeyTurkeyTurkeyTurkey
Croatia
TurkeyTurkeyTurkeyTurkeyTurkeyTurkeyTurkeyTurkeyTurkey
PolandAlbania
TurkeyTurkey
Croatia
Macedonia
Turkey
PolandPoland
TurkeyTurkeyTurkeyTurkey
Germany
Croatia
TurkeyTurkeyTurkeyTurkeyTurkey
Germany
TurkeyTurkeyTurkeyTurkeyTurkeyTurkeyTurkeyTurkeyTurkeyTurkey
Germany
TurkeyTurkey
Slovakia
Turkey
Croatia
TurkeyTurkeyTurkeyTurkeyTurkey
Romania
Turkey
Poland
TurkeyTurkey
China
Croatia
TurkeyTurkey
CroatiaCroatia
Turkey
Germany
TurkeyTurkeyTurkeyTurkeyTurkeyTurkeyTurkeyTurkeyTurkeyTurkey
Poland
TurkeyTurkeyTurkeyTurkeyTurkeyTurkeyTurkeyTurkey
PolandPoland
Turkey
Romania
TurkeyTurkey
Germany
TurkeyTurkeyTurkey
France
TurkeyTurkey
France
TurkeyTurkeyTurkeyTurkeyTurkeyTurkeyTurkeyTurkey
France
TurkeyTurkey
France
Netherlands
Turkey
France
TurkeyTurkey
France
Turkey
Netherlands
TurkeyTurkeyTurkeyTurkeyTurkeyTurkey
France
TurkeyTurkey
France
Turkey
France
Turkey
Netherlands
TurkeyTurkeyTurkeyTurkey
Netherlands
Turkey
Netherlands
TurkeyTurkey
FranceFrance
TurkeyTurkeyTurkey
Netherlands
France
Turkey
France
Turkey
France
TurkeyTurkeyTurkeyTurkeyTurkeyTurkeyTurkey
France
TurkeyTurkeyTurkeyTurkey
GermanyFrance
Turkey
France
Netherlands
Turkey
Germany
Turkey
France
TurkeyTurkeyTurkeyTurkeyTurkeyTurkeyTurkeyTurkey
France
Turkey
Germany
TurkeyTurkeyTurkey
Netherlands
Turkey
Netherlands
TurkeyTurkey
Netherlands
France
Netherlands
TurkeyTurkeyTurkeyTurkeyTurkeyTurkeyTurkeyTurkey
France
TurkeyTurkeyTurkeyTurkeyTurkey
France
Netherlands
Turkey
France
TurkeyTurkeyTurkey
NetherlandsNetherlands
TurkeyTurkeyTurkeyTurkeyTurkeyTurkeyTurkeyTurkeyTurkeyTurkey
Netherlands
Turkey
Netherlands
TurkeyTurkeyTurkeyTurkey
Germany
TurkeyTurkeyTurkey
France
Netherlands
TurkeyTurkeyTurkey
France
TurkeyTurkey
France
TurkeyTurkey
Netherlands
Turkey
Netherlands
Turkey
Germany
TurkeyTurkeyTurkeyTurkeyTurkeyTurkeyTurkeyTurkeyTurkey
Germany
TurkeyTurkey
Netherlands
Turkey
FranceFrance
TurkeyTurkeyTurkeyTurkeyTurkeyTurkey
FranceFrance
Turkey
Netherlands
TurkeyTurkeyTurkey
Germany
Turkey
Germany
TurkeyTurkey
FranceFrance
TurkeyTurkeyTurkey
Germany
Turkey
France
Netherlands
Turkey
Netherlands
TurkeyTurkeyTurkeyTurkey
France
Turkey
Germany
Turkey
France
TurkeyTurkeyTurkey
France
Turkey
France
Turkey
France
TurkeyTurkeyTurkeyTurkey
France
TurkeyTurkey
France
TurkeyTurkey
France
TurkeyTurkeyTurkeyTurkeyTurkey
France
TurkeyTurkeyTurkeyTurkeyTurkeyTurkeyTurkeyTurkeyTurkey
France
TurkeyTurkeyTurkey
France
TurkeyTurkeyTurkeyTurkeyTurkeyTurkey
Netherlands
TurkeyTurkeyTurkeyTurkeyTurkeyTurkey
France
TurkeyTurkeyTurkeyTurkeyTurkeyTurkey
NetherlandsNetherlands
Turkey
Germany
TurkeyTurkeyTurkeyTurkey
Netherlands
Germany
Turkey
France
TurkeyTurkey
Germany
TurkeyTurkeyTurkey
Germany
Turkey
FranceFranceFrance
TurkeyTurkey
France
TurkeyTurkeyTurkeyTurkey
FranceFranceGermany
TurkeyTurkeyTurkeyTurkeyTurkeyTurkeyTurkey
France
Turkey
Netherlands
FranceFrance
TurkeyTurkeyTurkeyTurkeyTurkeyTurkeyTurkeyTurkeyTurkeyTurkeyTurkey
France
TurkeyTurkeyTurkeyTurkeyTurkeyTurkeyTurkeyTurkeyTurkeyTurkey
FranceFranceFrance
Turkey
France
TurkeyTurkeyTurkeyTurkeyTurkey
France
TurkeyTurkeyTurkeyTurkey
FranceFrance
Netherlands
TurkeyTurkeyTurkey
France
TurkeyTurkeyTurkeyTurkeyTurkeyTurkey
France
TurkeyTurkey
Germany
Netherlands
Germany
Netherlands
TurkeyTurkey
France
TurkeyTurkey
Germany
Turkey
France
Turkey
Germany
TurkeyTurkey
Germany
TurkeyTurkey
Netherlands
Germany
TurkeyTurkey
Netherlands
TurkeyTurkeyTurkeyTurkeyTurkeyTurkey
France
Netherlands
FranceGermany
TurkeyTurkeyTurkey
Germany
Turkey
Germany
TurkeyTurkey
GermanyGermany
NetherlandsNetherlands
France
TurkeyTurkeyTurkeyTurkeyTurkeyTurkeyTurkeyTurkeyTurkeyTurkey
Netherlands
TurkeyTurkeyTurkeyTurkeyTurkeyTurkeyTurkey
France
Netherlands
France
TurkeyTurkeyTurkeyTurkeyTurkeyTurkeyTurkeyTurkeyTurkeyTurkey
FranceFranceFrance
TurkeyTurkeyTurkeyTurkeyTurkeyTurkey
FranceFrance
TurkeyTurkeyTurkey
Netherlands
TurkeyTurkeyTurkey
Netherlands
TurkeyTurkeyTurkeyTurkey
Germany
Turkey
France
Turkey
FranceGermany
TurkeyTurkeyTurkeyTurkey
Germany
Turkey
Germany
TurkeyTurkeyTurkey
France
Turkey
France
TurkeyTurkeyTurkeyTurkeyTurkeyTurkey
Netherlands
France
TurkeyTurkeyTurkeyTurkeyTurkey
Germany
TurkeyTurkey
Netherlands
TurkeyTurkeyTurkeyTurkey
France
TurkeyTurkeyTurkeyTurkeyTurkeyTurkey
Netherlands
France
TurkeyTurkey
Germany
Turkey
GermanyGermanyFrance
TurkeyTurkeyTurkeyTurkeyTurkeyTurkeyTurkeyTurkey
FranceFrance
Turkey
France
Turkey
France
Turkey
France
Turkey
France
Turkey
France
Turkey
Netherlands
TurkeyTurkeyTurkey
Netherlands
TurkeyTurkey
France
TurkeyTurkeyTurkeyTurkeyTurkeyTurkey
Germany
TurkeyTurkeyTurkeyTurkey
Germany
TurkeyTurkey
FranceFrance
TurkeyTurkeyTurkeyTurkeyTurkeyTurkeyTurkeyTurkeyTurkey
Netherlands
Germany
Netherlands
Turkey
France
TurkeyTurkeyTurkeyTurkeyTurkey
Germany
Netherlands
Turkey
Netherlands
Turkey
France
TurkeyTurkeyTurkey
Germany
Turkey
Germany
TurkeyTurkeyTurkeyTurkey
France
TurkeyTurkeyTurkey
FranceFranceFrance
TurkeyTurkeyTurkeyTurkeyTurkey
Netherlands
TurkeyTurkeyTurkeyTurkey
France
Slovakia
Viet Nam
SlovakiaSlovakiaSlovakia
Viet NamViet Nam
Slovakia
Viet NamViet NamViet Nam
Slovakia
Viet Nam
China
Viet NamViet Nam
Slovakia
Viet NamViet Nam
Slovakia
Viet NamViet NamViet Nam
SlovakiaSlovakiaSlovakia
Viet NamViet Nam
Russian Fed.
Viet NamViet NamViet Nam
Slovakia
Russian Fed.
SlovakiaSlovakiaSlovakia
Viet NamViet NamViet Nam
Slovakia
Viet Nam
Slovakia
Viet NamViet NamViet Nam
Slovakia
Viet Nam
Slovakia
Viet Nam
SlovakiaSlovakiaSlovakia
Viet Nam
Slovakia
Russian Fed.
Viet Nam
Russian Fed.
Viet Nam
China
Viet NamViet Nam
Russian Fed.
Slovakia
Viet Nam
Slovakia
Viet Nam
Slovakia
Viet NamViet NamViet Nam
Slovakia
Viet NamViet NamViet Nam
Russian Fed.
SlovakiaSlovakiaSlovakiaSlovakiaSlovakiaSlovakiaSlovakiaSlovakiaSlovakia
China
Slovakia
Viet NamViet Nam
Slovakia
Viet Nam
Slovakia
Viet NamViet NamViet Nam
Slovakia
Russian Fed.
SlovakiaSlovakia
Viet NamViet Nam
Russian Fed.
Slovakia
Viet NamViet NamViet NamViet Nam
SlovakiaSlovakia
Russian Fed.
SlovakiaSlovakiaSlovakia
Viet NamViet Nam
China
SlovakiaSlovakia
Viet Nam
China
Slovakia
Viet NamViet Nam
SlovakiaSlovakia
Viet NamViet Nam
SlovakiaSlovakiaSlovakia
Viet Nam
Slovakia
Viet Nam
Slovakia
Viet Nam
SlovakiaSlovakia
Viet Nam
Slovakia
Viet Nam
SlovakiaSlovakia
Viet Nam
SlovakiaSlovakia
Viet NamViet Nam
SlovakiaSlovakia
Russian Fed.Russian Fed.
Estonia
TurkeyRussian Fed.Russian Fed.
Estonia
China
Russian Fed.Turkey
Sweden
Russian Fed.
China
Russian Fed.Russian Fed.Russian Fed.Russian Fed.Russian Fed.Russian Fed.
EstoniaEstonia
Russian Fed.Russian Fed.Russian Fed.Russian Fed.
Estonia
China
Estonia
Russian Fed.
Sweden
Estonia
Russian Fed.
Estonia
Russian Fed.Russian Fed.Russian Fed.
EstoniaEstonia
Russian Fed.
EstoniaEstoniaEstoniaEstoniaEstonia
ChinaChina
Russian Fed.
Estonia
Russian Fed.Turkey
EstoniaEstonia
Sweden
Russian Fed.Russian Fed.Turkey
Sweden
Estonia
TurkeyRussian Fed.Russian Fed.Russian Fed.Russian Fed.Russian Fed.Russian Fed.Russian Fed.
TurkeyTurkeyRussian Fed.Russian Fed.
Estonia
Russian Fed.Turkey
EstoniaEstoniaEstonia
Russian Fed.Russian Fed.
Sweden
EstoniaEstonia
Russian Fed.Turkey
Estonia
Russian Fed.
China
Russian Fed.Russian Fed.Russian Fed.Russian Fed.Turkey
Estonia
Russian Fed.Russian Fed.
Estonia
Russian Fed.Turkey
EstoniaEstonia
China
Russian Fed.Russian Fed.
Estonia
Russian Fed.Russian Fed.Russian Fed.Russian Fed.Russian Fed.Russian Fed.Russian Fed.
Sweden
Russian Fed.Turkey
Estonia
Russian Fed.Russian Fed.Russian Fed.Russian Fed.
Sweden
Estonia
ChinaChina
TurkeyRussian Fed.Russian Fed.Russian Fed.Russian Fed.Russian Fed.
Sweden
Turkey
Estonia
China
Russian Fed.Russian Fed.Russian Fed.Russian Fed.
Estonia
Russian Fed.Russian Fed.
Estonia
Russian Fed.
Estonia
Russian Fed.TurkeyTurkey
Russian Fed.Russian Fed.
EstoniaEstoniaEstoniaEstonia
China
Turkey
EstoniaEstonia
Sweden
Estonia
Russian Fed.Russian Fed.
EstoniaEstonia
TurkeyRussian Fed.
EstoniaEstonia
Russian Fed.Turkey
Estonia
Russian Fed.Turkey
Russian Fed.
China
Turkey
Estonia
Russian Fed.
Estonia
Russian Fed.
EstoniaEstonia
Russian Fed.Russian Fed.Russian Fed.Russian Fed.
EstoniaEstonia
Russian Fed.
China
Russian Fed.Russian Fed.Russian Fed.Russian Fed.Russian Fed.Russian Fed.Russian Fed.Russian Fed.Russian Fed.
United States
Russian Fed.Russian Fed.
United States
Russian Fed.Russian Fed.
Ethiopia
United States
Ethiopia
United StatesUnited States
Russian Fed.Russian Fed.
Ethiopia
United States
Russian Fed.
Ethiopia
United States
Russian Fed.Russian Fed.Russian Fed.Russian Fed.Russian Fed.Russian Fed.
Ethiopia
Russian Fed.
Ethiopia
Russian Fed.
Ethiopia
Russian Fed.
United States
Russian Fed.
EthiopiaEthiopiaEthiopia
Russian Fed.Russian Fed.Russian Fed.Russian Fed.
United States
Russian Fed.Russian Fed.Russian Fed.Russian Fed.
United States
Ethiopia
Russian Fed.Russian Fed.
Ethiopia
Russian Fed.
Ethiopia
Russian Fed.Russian Fed.Russian Fed.
France
Russian Fed.
Ethiopia
Russian Fed.Russian Fed.
France
Russian Fed.Russian Fed.
United StatesUnited States
Russian Fed.
United States
France
Russian Fed.Russian Fed.Russian Fed.
EthiopiaFrance
Russian Fed.
France
Russian Fed.Russian Fed.Russian Fed.
United States
Russian Fed.Russian Fed.Russian Fed.Russian Fed.Russian Fed.Russian Fed.Russian Fed.Russian Fed.
Ethiopia
Russian Fed.
Ethiopia
Russian Fed.Russian Fed.Russian Fed.
France
United States
Russian Fed.
United States
Russian Fed.Russian Fed.
France
Russian Fed.Russian Fed.
Ethiopia
Russian Fed.
Ethiopia
Russian Fed.
France
United States
Russian Fed.
United States
Russian Fed.
France
Russian Fed.Russian Fed.Russian Fed.
United States
Russian Fed.Russian Fed.Russian Fed.Russian Fed.Russian Fed.Russian Fed.Russian Fed.Russian Fed.
France
United States
Ethiopia
Russian Fed.
Ethiopia
United States
Russian Fed.
Ethiopia
Russian Fed.Russian Fed.
France
Russian Fed.Russian Fed.
United States
Russian Fed.
United States
Russian Fed.
United States
Russian Fed.
EthiopiaEthiopia
Russian Fed.Russian Fed.
United StatesUnited States
Russian Fed.
United StatesUnited States
Russian Fed.
EthiopiaEthiopia
United States
France
Russian Fed.Russian Fed.
France
Russian Fed.Russian Fed.
United StatesUnited States
Russian Fed.Russian Fed.
United States
France
United States
Russian Fed.Russian Fed.Russian Fed.Russian Fed.
United States
Russian Fed.Russian Fed.
France
Russian Fed.
France
United States
Russian Fed.
United States
Russian Fed.Russian Fed.
United States
France
United States
Russian Fed.
Ethiopia
Russian Fed.Russian Fed.Russian Fed.
United States
France
Russian Fed.Russian Fed.
EthiopiaEthiopia
United StatesUnited States
Russian Fed.
France
Russian Fed.Russian Fed.
United States
Russian Fed.Russian Fed.Russian Fed.
Ethiopia
Russian Fed.
Ethiopia
Russian Fed.Russian Fed.
Ethiopia
Russian Fed.Russian Fed.Russian Fed.
United States
France
United States
Russian Fed.
EthiopiaFrance
Russian Fed.Russian Fed.Russian Fed.Russian Fed.
Ethiopia
Russian Fed.Russian Fed.Russian Fed.Russian Fed.Russian Fed.Russian Fed.Russian Fed.Russian Fed.Russian Fed.
Ethiopia
Russian Fed.Russian Fed.Russian Fed.Russian Fed.Russian Fed.Russian Fed.Russian Fed.Russian Fed.Russian Fed.Russian Fed.Russian Fed.Russian Fed.Russian Fed.
United States
France
Russian Fed.Russian Fed.
Ethiopia
Russian Fed.Russian Fed.
United States
Russian Fed.
United States
France
Russian Fed.
FranceFranceFrance
Russian Fed.Russian Fed.Russian Fed.
Ethiopia
Russian Fed.
Ethiopia
Russian Fed.Russian Fed.
France
Russian Fed.Russian Fed.
Ethiopia
Russian Fed.Russian Fed.Russian Fed.
Ethiopia
Russian Fed.
France
Russian Fed.Russian Fed.Russian Fed.Russian Fed.Russian Fed.Russian Fed.
France
Russian Fed.
EthiopiaEthiopiaFrance
Russian Fed.Russian Fed.
FranceEthiopia
Russian Fed.Russian Fed.Russian Fed.Russian Fed.
EthiopiaEthiopia
Russian Fed.
France
Russian Fed.
France
Russian Fed.
EthiopiaEthiopia
United States
France
Russian Fed.Russian Fed.
Ethiopia
Russian Fed.
EthiopiaFrance
Russian Fed.Russian Fed.Russian Fed.Russian Fed.Russian Fed.Russian Fed.
France
Russian Fed.Russian Fed.Russian Fed.Russian Fed.Russian Fed.Russian Fed.Russian Fed.Russian Fed.Russian Fed.
EthiopiaEthiopiaEthiopia
Russian Fed.Russian Fed.
Ethiopia
Russian Fed.
Ethiopia
Russian Fed.
Ethiopia
Russian Fed.
United States
Russian Fed.Russian Fed.Russian Fed.Russian Fed.
Ethiopia
Russian Fed.
FranceFrance
Russian Fed.
EthiopiaFrance
Russian Fed.
EthiopiaFrance
United States
Russian Fed.
France
United States
Ethiopia
Russian Fed.Russian Fed.Russian Fed.Russian Fed.
Ethiopia
Russian Fed.Russian Fed.Russian Fed.Russian Fed.Russian Fed.Russian Fed.
EthiopiaEthiopiaEthiopia
Russian Fed.Russian Fed.Russian Fed.
EthiopiaFrance
Russian Fed.Russian Fed.Russian Fed.Russian Fed.Russian Fed.
United States
Russian Fed.Russian Fed.Russian Fed.
EthiopiaEthiopia
Russian Fed.Russian Fed.
United States
Ethiopia
Russian Fed.Russian Fed.Russian Fed.Russian Fed.Russian Fed.
United States
FranceEthiopia
Russian Fed.Russian Fed.Russian Fed.Russian Fed.
Ethiopia
Russian Fed.
Ethiopia
Russian Fed.
Ethiopia
Russian Fed.
EthiopiaEthiopiaEthiopia
Russian Fed.
Ethiopia
Russian Fed.
Ethiopia
Russian Fed.Russian Fed.
Ethiopia
Russian Fed.
EthiopiaEthiopia
Russian Fed.Russian Fed.
United States
Russian Fed.
Ethiopia
Russian Fed.Russian Fed.Russian Fed.
FranceEthiopiaEthiopia
Russian Fed.
United States
Russian Fed.Russian Fed.Russian Fed.Russian Fed.Russian Fed.Russian Fed.
EthiopiaEthiopia
Russian Fed.
Ethiopia
Russian Fed.
Ethiopia
United States
Russian Fed.Russian Fed.Russian Fed.
Ethiopia
Russian Fed.
Ethiopia
Russian Fed.
EthiopiaEthiopia
United States
EthiopiaEthiopiaEthiopiaFrance
Russian Fed.
United States
Ethiopia
Russian Fed.Russian Fed.Russian Fed.Russian Fed.
EthiopiaFrance
Russian Fed.
France
Russian Fed.Russian Fed.
Ethiopia
Russian Fed.Russian Fed.Russian Fed.
Ethiopia
Russian Fed.Russian Fed.
Ethiopia
Russian Fed.Russian Fed.
Ethiopia
Russian Fed.Russian Fed.
Ethiopia
Russian Fed.Russian Fed.
EthiopiaEthiopia
Russian Fed.Russian Fed.
Ethiopia
Russian Fed.
United States
EthiopiaEthiopiaFrance
Russian Fed.Russian Fed.
Ethiopia
Russian Fed.Russian Fed.
Ethiopia
Russian Fed.Russian Fed.
Ethiopia
Russian Fed.Russian Fed.Russian Fed.Russian Fed.Russian Fed.Russian Fed.Russian Fed.Russian Fed.Russian Fed.Russian Fed.Russian Fed.
FranceEthiopia
Russian Fed.
United States
Russian Fed.Russian Fed.Russian Fed.Russian Fed.
EthiopiaFrance
Russian Fed.
FranceFrance
Russian Fed.
United States
Russian Fed.Russian Fed.Russian Fed.
Ethiopia
Russian Fed.Russian Fed.
France
Russian Fed.Russian Fed.Russian Fed.
Ethiopia
Russian Fed.
United States
Russian Fed.
Ethiopia
Russian Fed.Russian Fed.
France
Russian Fed.
France
Russian Fed.Russian Fed.Russian Fed.Russian Fed.Russian Fed.
France
Russian Fed.Russian Fed.Russian Fed.Russian Fed.
Ethiopia
Russian Fed.Russian Fed.Russian Fed.Russian Fed.
United States
Ethiopia
Russian Fed.Russian Fed.Russian Fed.
Ethiopia
United States
Russian Fed.
Ethiopia
Russian Fed.
United StatesUnited States
Russian Fed.
United States
Russian Fed.Russian Fed.
EthiopiaEthiopia
Russian Fed.Russian Fed.
FranceEthiopia
United States
Russian Fed.
France
Russian Fed.Russian Fed.
United States
Russian Fed.
FranceEthiopia
Russian Fed.Russian Fed.Russian Fed.Russian Fed.Russian Fed.Russian Fed.
Ethiopia
Russian Fed.Russian Fed.Russian Fed.Russian Fed.
Ethiopia
Russian Fed.Russian Fed.Russian Fed.Russian Fed.Russian Fed.Russian Fed.Russian Fed.Russian Fed.
United States
Russian Fed.Russian Fed.Russian Fed.
France
Russian Fed.
FranceFrance
Russian Fed.Russian Fed.Russian Fed.
France
Russian Fed.
Ethiopia
Russian Fed.Russian Fed.Russian Fed.Russian Fed.
United StatesUnited States
Russian Fed.Russian Fed.Russian Fed.Russian Fed.Russian Fed.Russian Fed.
Ethiopia
Russian Fed.Russian Fed.Russian Fed.Russian Fed.Russian Fed.Russian Fed.Russian Fed.Russian Fed.Russian Fed.Russian Fed.
United States
Russian Fed.Russian Fed.
Ethiopia
Russian Fed.Russian Fed.Russian Fed.
Ethiopia
United States
Ethiopia
Russian Fed.Russian Fed.Russian Fed.
United States
Russian Fed.
Ethiopia
Russian Fed.Russian Fed.Russian Fed.Russian Fed.Russian Fed.
France
Russian Fed.Russian Fed.Russian Fed.Russian Fed.Russian Fed.Russian Fed.Russian Fed.Russian Fed.Russian Fed.Russian Fed.Russian Fed.Russian Fed.Russian Fed.Russian Fed.Russian Fed.Russian Fed.Russian Fed.Russian Fed.Russian Fed.Russian Fed.Russian Fed.Russian Fed.Russian Fed.Russian Fed.Russian Fed.Russian Fed.
Ethiopia
Russian Fed.Russian Fed.Russian Fed.Russian Fed.Russian Fed.Russian Fed.
Ethiopia
Russian Fed.Russian Fed.Russian Fed.
Ethiopia
United States
Russian Fed.
EthiopiaEthiopia
Russian Fed.
United States
Russian Fed.
France
United States
EthiopiaEthiopia
Russian Fed.Russian Fed.
Ethiopia
United States
Russian Fed.
France
Russian Fed.
United States
EthiopiaEthiopia
Russian Fed.
Ethiopia
Russian Fed.Russian Fed.Russian Fed.Russian Fed.Russian Fed.Russian Fed.
FranceEthiopiaEthiopia
Russian Fed.Russian Fed.Russian Fed.Russian Fed.
Ethiopia
Russian Fed.
Ethiopia
Russian Fed.
EthiopiaEthiopia
Russian Fed.Russian Fed.Russian Fed.
Ethiopia
Russian Fed.
Ethiopia
Russian Fed.
United States
EthiopiaEthiopia
Russian Fed.
EthiopiaPortugal
Belgium
PortugalPortugal
Italy
PortugalPortugal FranceFrancePortugal
Italy
PortugalPortugalPortugalPortugalPortugalPortugalPortugalPortugalPortugalPortugalPortugalPortugalPortugalPortugalPortugal
Belgium
PortugalPortugalPortugalPortugalPortugalPortugalPortugalPortugalPortugalPortugalPortugalPortugal FrancePortugalPortugalPortugalPortugal
BelgiumBelgium
GermanyFrancePortugalPortugalPortugalPortugalPortugalPortugal FrancePortugalPortugal FrancePortugalPortugalPortugalPortugalPortugalPortugalPortugalPortugal
Germany
PortugalPortugalPortugalPortugal FrancePortugalPortugal FranceFranceFrance
Belgium
PortugalPortugal
Belgium
PortugalPortugalPortugalPortugal
Belgium
Italy
Belgium
Portugal
Italy
PortugalPortugalPortugalPortugal FrancePortugal FrancePortugalPortugalPortugalPortugalPortugal
Italy
FrancePortugal
Italy
PortugalPortugal
Italy
PortugalPortugalPortugalPortugalPortugal
Italy
PortugalPortugalPortugalPortugalPortugalPortugal
Italy
PortugalPortugalPortugalPortugal
Germany
PortugalPortugalPortugalPortugalPortugalPortugal FrancePortugalPortugalPortugalPortugalPortugalPortugal
Italy
Belgium
PortugalPortugalPortugal
Italy
PortugalPortugalPortugalPortugal FrancePortugalPortugalPortugal
Italy
Portugal
Italy
PortugalPortugalPortugalPortugalPortugalPortugal
Italy
PortugalPortugalPortugalPortugalPortugalPortugal
Belgium
PortugalPortugalPortugalPortugalPortugalPortugalPortugal
Germany
Belgium
Portugal
Germany
PortugalPortugalPortugalPortugal
Belgium
FranceFrancePortugalPortugalPortugalPortugalPortugalPortugalPortugal
Italy
PortugalPortugalPortugalPortugal
Italy
PortugalPortugalPortugalPortugalPortugal
Belgium
PortugalPortugalPortugalPortugal
Germany
PortugalPortugal
Germany
Italy
Belgium
FrancePortugal
Germany
PortugalPortugal
Italy
Belgium
PortugalPortugal FranceFrancePortugal
Belgium
Portugal
Italy
PortugalPortugal
Belgium
FrancePortugal France
Italy
PortugalPortugal
Germany
Portugal FrancePortugal
Italy
Belgium
Portugal
Italy
PortugalPortugalPortugalPortugalPortugal
Belgium
PortugalPortugal FrancePortugalPortugalPortugalPortugal
Belgium
Italy
PortugalPortugalPortugal
Belgium
PortugalPortugalPortugalPortugalPortugalPortugalPortugalPortugalPortugalPortugalPortugalPortugalPortugal
Italy
PortugalPortugalPortugal FrancePortugalPortugalPortugalPortugal
Italy
PortugalPortugalPortugalPortugalPortugal FrancePortugal
Italy
PortugalPortugal
Germany
Portugal FrancePortugalPortugal
Italy
Portugal FrancePortugalPortugalPortugalPortugalPortugalPortugalPortugalPortugalPortugalPortugal FranceFrance
Belgium
Italy
Portugal
Belgium
ItalyItaly
Germany
PortugalPortugalPortugal
Italy
PortugalPortugalPortugal FrancePortugal
Belgium
Italy
FrancePortugalPortugal
Belgium
Portugal
Germany
PortugalPortugal
Belgium
Portugal
Italy
PortugalPortugalPortugalPortugalPortugal
Italy
PortugalPortugalPortugalPortugal
ItalyItaly
Portugal
Belgium
PortugalPortugal FrancePortugalPortugalPortugalPortugalPortugalPortugalPortugal
Belgium
PortugalPortugalPortugalPortugalPortugalPortugalPortugalPortugalPortugalPortugalPortugalPortugalPortugal
Italy
Belgium
PortugalPortugalPortugal
Germany
PortugalPortugalPortugalPortugalPortugal FrancePortugalPortugalPortugalPortugalPortugalPortugal
Italy
Portugal
Italy
PortugalPortugalPortugalPortugalPortugalPortugalPortugalPortugalPortugalPortugal FrancePortugalPortugal
Belgium
FrancePortugalPortugalPortugalPortugalPortugalPortugal
Italy
PortugalPortugal
Italy
PortugalPortugalPortugalPortugalPortugalPortugalPortugalPortugalPortugalPortugalPortugal
Italy
Portugal
Belgium
PortugalPortugalPortugalPortugal
Germany
PortugalPortugalPortugalPortugalPortugal
BelgiumBelgium
PortugalPortugalPortugalPortugalPortugalPortugalPortugal
Italy
PortugalPortugalPortugalPortugalPortugalPortugalPortugal FrancePortugalPortugal FrancePortugalPortugalPortugal FrancePortugalPortugalPortugalPortugalPortugalPortugalPortugalPortugalPortugalPortugalPortugal
ItalyItaly
PortugalPortugal
Italy
Germany
PortugalPortugalPortugalPortugalPortugal
Belgium
PortugalPortugalPortugalPortugalPortugalPortugalPortugalPortugal
Belgium
PortugalPortugalPortugalPortugalPortugalPortugalPortugalPortugalPortugalPortugalPortugalPortugalPortugalPortugalPortugalPortugal France
United Kingdom
PortugalPortugalPortugalPortugalPortugalPortugal FrancePortugal
Belgium
United Kingdom
PortugalPortugalPortugalPortugalPortugal
Germany
PortugalPortugalPortugalPortugalPortugalPortugalPortugalPortugalPortugalPortugalPortugalPortugal
Germany
PortugalPortugal
Italy
PortugalPortugalPortugalPortugalPortugalPortugalPortugalPortugalPortugalPortugalPortugalPortugalPortugal
Italy
PortugalPortugal FrancePortugalPortugalPortugalPortugal
Italy
PortugalPortugalPortugal FrancePortugalPortugalPortugal
Germany
PortugalPortugalPortugal FranceFrancePortugal FrancePortugalPortugalPortugalPortugal FrancePortugal
Belgium
Portugal
Germany
PortugalPortugalPortugal
Germany
Portugal
Italy
FrancePortugalPortugalPortugal
Belgium
Italy
PortugalPortugalPortugalPortugalPortugalPortugalPortugal
Belgium
Portugal
Germany
PortugalPortugalPortugalPortugalPortugal
Germany
Portugal
Belgium
Portugal
Belgium
Portugal FrancePortugalPortugal FrancePortugalPortugalPortugalPortugalPortugalPortugal
Italy
PortugalPortugalPortugalPortugalPortugal FranceFranceFrancePortugal FrancePortugalPortugalPortugal
Italy
PortugalPortugal France
Italy
Portugal
Germany
PortugalPortugalPortugalPortugalPortugalPortugalPortugal
Germany
Portugal
GermanyFrancePortugal
Germany
PortugalPortugalPortugal FranceGermany
Portugal
Italy
PortugalPortugalPortugal
Belgium
Germany
PortugalPortugal
Germany
PortugalPortugalPortugalPortugal
Germany
Belgium
GermanyFrancePortugal France
Germany
Italy
PortugalPortugalPortugalPortugalPortugalPortugal
Belgium
PortugalPortugalPortugal FranceGermany
Portugal
Germany
Portugal
GermanyGermany
PortugalPortugalPortugalPortugal
Italy
PortugalPortugal
Germany
PortugalPortugalPortugalPortugalPortugalPortugalPortugal
Germany
PortugalPortugal
Belgium
FrancePortugalPortugal
Italy
Portugal
Germany
Belgium
Germany
Belgium
PortugalPortugal
Germany
PortugalPortugalPortugalPortugal France
ItalyItaly
PortugalPortugalPortugalPortugalPortugal
Germany
Italy
Portugal
Germany
PortugalPortugalPortugalPortugal
Germany
PortugalPortugal
Germany
PortugalPortugal FrancePortugalPortugalPortugal France
Belgium
FrancePortugalPortugalPortugal FrancePortugalPortugalPortugalPortugalPortugalPortugalPortugalPortugalPortugalPortugalPortugalPortugalPortugalPortugalPortugal
Belgium
PortugalPortugalPortugalPortugal
GermanyFranceFrancePortugalPortugalPortugal
Italy
FrancePortugalPortugalPortugalPortugalPortugal
Italy
PortugalPortugalPortugalPortugal
ItalyItalyItaly
PortugalPortugal
Italy
PortugalPortugalPortugal FrancePortugalPortugal
Belgium
PortugalPortugal
Belgium
PortugalPortugal France
Belgium
FrancePortugalPortugalPortugalPortugal France
Italy
France
Italy
PortugalPortugalPortugal
Italy
PortugalPortugal
Germany
Belgium
Portugal FrancePortugal
Germany
Portugal
Italy
PortugalPortugalPortugalPortugalPortugal
Italy
FrancePortugalPortugalPortugalPortugalPortugal France
Italy
Portugal FranceFrancePortugalPortugalPortugal FrancePortugal FrancePortugal
Italy
FrancePortugal
Belgium
PortugalPortugal
Italy
PortugalPortugalPortugalPortugalPortugalPortugalPortugal
Belgium
PortugalPortugalPortugalPortugal FrancePortugalPortugal FrancePortugal
Italy
Belgium
PortugalPortugal France
Italy
FrancePortugalPortugal
ItalyItaly
Portugal FranceFrancePortugal
Belgium
France
Italy
PortugalPortugalPortugal
ItalyItaly
Portugal FrancePortugalPortugalPortugalPortugalPortugalPortugalPortugalPortugal
Germany
Italy
Portugal FranceFrancePortugal
ItalyItaly
PortugalPortugal
Belgium
PortugalPortugalPortugal FrancePortugalPortugal FrancePortugal FrancePortugalPortugalPortugal
Germany
Portugal
Italy
France
Belgium
PortugalPortugalPortugal France
Italy
Germany
Belgium
Italy
PortugalPortugal
Italy
Portugal
Italy
Portugal FrancePortugal
ItalyItalyItaly
Portugal FrancePortugalPortugalPortugalPortugalPortugal
Italy
PortugalPortugal France
Italy
Portugal France
Italy
Belgium
PortugalPortugalPortugalPortugalPortugalPortugalPortugalPortugalPortugal
Italy
Portugal
Belgium
Portugal FrancePortugalPortugal
Italy
PortugalPortugal
Belgium
PortugalPortugalPortugalPortugal
ItalyItaly
PortugalPortugalPortugalPortugalPortugal
Italy
France
Italy
Portugal
Germany
Italy
Germany
PortugalPortugalPortugalPortugal
Italy
Portugal FrancePortugal
Italy
Belgium
Portugal
ItalyItaly
Portugal
Italy
FranceFrancePortugal
Italy
Germany
Portugal
ItalyItalyItalyItaly
Portugal FrancePortugal
Italy
PortugalPortugal
Italy
PortugalPortugalPortugal
Italy
PortugalPortugalPortugalPortugal
Belgium
Portugal
Italy
PortugalPortugalPortugal
Italy
PortugalPortugalPortugal
Italy
Portugal
Belgium
PortugalPortugalPortugalPortugalPortugalPortugal
Belgium
FrancePortugalPortugalPortugal
Italy
PortugalPortugal
Germany
PortugalPortugal
Italy
PortugalPortugalPortugalPortugalPortugalPortugalPortugal
Italy
FrancePortugalPortugalPortugalPortugalPortugalPortugal
Italy
PortugalPortugal
Italy
PortugalPortugalPortugalPortugalPortugalPortugalPortugalPortugalPortugal
Belgium
Italy
Portugal
Italy
Portugal
Belgium
PortugalPortugal France
Belgium
Portugal
Belgium
PortugalPortugalPortugalPortugalPortugalPortugal
ItalyItaly
PortugalPortugalPortugalPortugalPortugal
ItalyItaly
PortugalPortugal
Italy
FrancePortugalPortugal
ItalyItaly
Portugal
GermanyFrance
Italy
Germany
Portugal
Italy
PortugalPortugalPortugalPortugalPortugal
Italy
Portugal France
Italy
Portugal
Italy
Belgium
PortugalPortugalPortugalPortugalPortugalPortugal
Italy
Portugal
Germany
Italy
Portugal
Belgium
ItalyItaly
Portugal
ItalyItaly
Portugal
Italy
PortugalPortugalPortugalPortugal
Germany
Portugal
Germany
Portugal
Italy
Germany
Portugal FrancePortugal
Italy
PortugalPortugalPortugal
Italy
PortugalPortugalPortugalPortugalPortugalPortugalPortugalPortugal
Belgium
Italy
France
Belgium
PortugalPortugalPortugalPortugal
Germany
PortugalPortugalPortugalPortugalPortugalPortugalPortugal
ItalyItaly
PortugalPortugalPortugalPortugalPortugalPortugalPortugalPortugalPortugalPortugal FrancePortugal France
Belgium
PortugalPortugalPortugal
Italy
Portugal FrancePortugal
Germany
Portugal
Italy
PortugalPortugalPortugalPortugalPortugalPortugal FrancePortugalPortugalPortugalPortugalPortugalPortugalPortugalPortugal
Germany
Portugal FrancePortugalPortugalPortugalPortugalPortugalPortugalPortugalPortugal FranceGermany
Portugal
Italy
Portugal FranceGermany
PortugalPortugalPortugalPortugal
Germany
Portugal
Italy
PortugalPortugalPortugalPortugal FrancePortugal
Germany
PortugalPortugalPortugalPortugalPortugalPortugalPortugal France
Belgium
Portugal FrancePortugalPortugalPortugalPortugalPortugalPortugalPortugal FrancePortugalPortugal
Belgium
PortugalPortugalPortugalPortugal
Belgium
FranceFrancePortugalPortugalPortugal FrancePortugalPortugalPortugalPortugalPortugalPortugal FrancePortugalPortugal
GermanyGermany
Italy
PortugalPortugalPortugal France
Belgium
Portugal
Italy
Belgium
Portugal
GermanyGermany
PortugalPortugal
Italy
FrancePortugalPortugal
Italy
PortugalPortugalPortugalPortugalPortugal
ItalyItaly
PortugalPortugal
Belgium
PortugalPortugalPortugalPortugal
Belgium
Italy
Germany
PortugalPortugalPortugalPortugal
Belgium
PortugalPortugalPortugalPortugalPortugalPortugalPortugalPortugal
Italy
PortugalPortugalPortugalPortugalPortugalPortugalPortugalPortugalPortugalPortugalPortugal FrancePortugalPortugalPortugal
Italy
PortugalPortugalPortugal
BelgiumBelgium
Italy
Portugal
Belgium
Portugal
Belgium
PortugalPortugal
Belgium
PortugalPortugalPortugalPortugalPortugal
Belgium
PortugalPortugal FrancePortugalPortugalPortugal
Italy
PortugalPortugalPortugalPortugalPortugal
Italy United Kingdom
Germany
PortugalPortugalPortugalPortugalPortugalPortugalPortugalPortugal FranceGermany
PortugalPortugal
Belgium
PortugalPortugalPortugalPortugalPortugal
Belgium
PortugalPortugal FranceFrancePortugal
Belgium
Portugal
United Kingdom
PortugalPortugalPortugalPortugal FrancePortugal
GermanyFrancePortugalPortugalPortugal
Belgium
PortugalPortugalPortugalPortugal
Italy
PortugalPortugal FrancePortugalPortugalPortugalPortugalPortugal FrancePortugalPortugal
Italy
FrancePortugalPortugalPortugalPortugalPortugal France
Italy
FrancePortugalPortugal France
Belgium
PortugalPortugalPortugalPortugalPortugalPortugal FranceFrancePortugalPortugal FrancePortugal
Italy
BelgiumBelgium
Germany
PortugalPortugalPortugalPortugalPortugalPortugal FrancePortugalPortugalPortugal
Belgium
PortugalPortugalPortugalPortugal France
Italy
PortugalPortugalPortugalPortugalPortugalPortugal
Germany
PortugalPortugal FrancePortugalPortugalPortugalPortugal FrancePortugalPortugalPortugalPortugalPortugalPortugalPortugalPortugalPortugal
Italy
PortugalPortugalPortugal
Belgium
PortugalPortugalPortugalPortugalPortugal France
Belgium
FrancePortugalPortugalPortugal
Germany
PortugalPortugal
ItalyItaly
PortugalPortugalPortugalPortugalPortugalPortugalPortugalPortugalPortugal FranceFrancePortugalPortugalPortugalPortugal
Italy
PortugalPortugalPortugalPortugalPortugalPortugalPortugalPortugalPortugal
Italy
PortugalPortugalPortugalPortugalPortugalPortugalPortugalPortugalPortugalPortugal
Italy
PortugalPortugalPortugalPortugalPortugalPortugal
Belgium
Italy
PortugalPortugalPortugal FrancePortugal
United Kingdom
PortugalPortugal
Italy
Portugal
Belgium
PortugalPortugalPortugalPortugalPortugalPortugalPortugalPortugal France
Belgium
Portugal France
Italy
FrancePortugalPortugalPortugalPortugal
Belgium
PortugalPortugalPortugal
Belgium
Portugal FrancePortugalPortugalPortugal
Belgium
PortugalPortugalPortugal
Germany
PortugalPortugalPortugalPortugal
Germany
PortugalPortugal FrancePortugalPortugalPortugal FrancePortugalPortugalPortugalPortugalPortugalPortugalPortugal France
United Kingdom
PortugalPortugalPortugal
Belgium
Portugal FrancePortugal
Italy
PortugalPortugal France
Belgium
Portugal
ItalyItaly
PortugalPortugalPortugalPortugal
Italy
Portugal
Belgium
Italy
PortugalPortugal FrancePortugalPortugalPortugal
Belgium
PortugalPortugalPortugalPortugal FranceGermany
Portugal
Italy
PortugalPortugalPortugal FrancePortugal FrancePortugalPortugal FrancePortugal
Belgium
PortugalPortugalPortugalPortugalPortugalPortugalPortugalPortugalPortugalPortugalPortugalPortugal France
Italy
FrancePortugalPortugal
Belgium
PortugalPortugalPortugalPortugalPortugalPortugalPortugalPortugalPortugal
Belgium
France
Belgium
PortugalPortugalPortugalPortugalPortugalPortugal FrancePortugal FrancePortugal
Germany
Belgium
PortugalPortugalPortugal
BelgiumBelgium
PortugalPortugal FrancePortugalPortugalPortugalPortugalPortugalPortugal FrancePortugal
Belgium
PortugalPortugalPortugal
Belgium
PortugalPortugalPortugalPortugalPortugal FrancePortugal
Belgium
Portugal
Italy
PortugalPortugalPortugal
Germany
PortugalPortugalPortugalPortugalPortugalPortugalPortugalPortugal
BelgiumBelgium
PortugalPortugalPortugalPortugalPortugal
Italy
Germany
PortugalPortugal
Italy
PortugalPortugalPortugalPortugalPortugalPortugal FrancePortugalPortugal
Belgium
FrancePortugal FrancePortugalPortugalPortugalPortugal
Belgium
PortugalPortugalPortugal FrancePortugalPortugalPortugalPortugalPortugalPortugalPortugalPortugalPortugalPortugalPortugalPortugalPortugal
Germany
Portugal
Italy
Portugal
Belgium
PortugalPortugal FrancePortugalPortugalPortugalPortugalPortugalPortugalPortugalPortugal
United Kingdom
PortugalPortugal France
Italy
PortugalPortugal FrancePortugalPortugal FrancePortugal FranceFrancePortugalPortugalPortugal
Germany
PortugalPortugal FrancePortugalPortugalPortugal
Germany
PortugalPortugal
Italy
PortugalPortugalPortugal
Italy
PortugalPortugalPortugalPortugalPortugalPortugalPortugalPortugalPortugal
United Kingdom
FrancePortugalPortugalPortugalPortugalPortugalPortugalPortugalPortugal FrancePortugal
Italy
FrancePortugalPortugalPortugalPortugal
Belgium
PortugalPortugalPortugal FrancePortugalPortugal
Belgium
PortugalPortugalPortugalPortugalPortugal
Italy
PortugalPortugalPortugalPortugalPortugalPortugalPortugalPortugalPortugalPortugal
ItalyItaly
Portugal
Germany
PortugalPortugalPortugalPortugal FrancePortugal
Belgium
PortugalPortugalPortugalPortugal
Italy
PortugalPortugalPortugalPortugalPortugal FrancePortugalPortugalPortugalPortugalPortugalPortugalPortugalPortugalPortugalPortugalPortugalPortugalPortugalPortugalPortugalPortugalPortugal
ItalyItaly
Germany
Portugal
Germany
PortugalPortugalPortugalPortugalPortugalPortugalPortugalPortugalPortugal FranceGermany
PortugalPortugalPortugalPortugal
Italy
PortugalPortugalPortugal
Italy
PortugalPortugal
Germany
PortugalPortugal France
Italy
Germany
PortugalPortugalPortugalPortugalPortugalPortugalPortugalPortugalPortugalPortugal
Italy
PortugalPortugalPortugalPortugalPortugalPortugalPortugalPortugalPortugalPortugalPortugalPortugalPortugal
ItalyItaly
PortugalPortugal FrancePortugalPortugal
Italy
PortugalPortugalPortugal
GermanyFrancePortugalPortugalPortugal
Italy
Portugal
Italy
Portugal
Belgium
PortugalPortugalPortugalPortugalPortugal
Belgium
PortugalPortugalPortugalPortugalPortugal
Italy
Portugal FrancePortugalPortugalPortugalPortugal
Germany
PortugalPortugal
Belgium
PortugalPortugalPortugal
Italy
PortugalPortugalPortugalPortugalPortugalPortugalPortugalPortugalPortugalPortugalPortugalPortugalPortugalPortugalPortugal FranceGermany
Portugal
GermanyFrancePortugalPortugalPortugalPortugalPortugalPortugalPortugalPortugalPortugalPortugalPortugalPortugalPortugalPortugalPortugalPortugal France
United Kingdom
PortugalPortugalPortugalPortugalPortugalPortugal
Germany
PortugalPortugalPortugalPortugalPortugalPortugalPortugalPortugal
Germany
PortugalPortugalPortugalPortugalPortugalPortugal
Italy
PortugalPortugalPortugal
Italy
PortugalPortugalPortugalPortugalPortugal
Belgium
Italy
PortugalPortugalPortugalPortugalPortugalPortugalPortugalPortugal FrancePortugalPortugal FrancePortugalPortugalPortugalPortugalPortugalPortugalPortugalPortugalPortugalPortugal
Italy
PortugalPortugalPortugalPortugalPortugalPortugal
Germany
PortugalPortugalPortugalPortugal
Belgium
Italy
PortugalPortugalPortugalPortugalPortugalPortugalPortugalPortugal
Belgium
PortugalPortugalPortugalPortugalPortugalPortugalPortugalPortugalPortugalPortugalPortugalPortugal FrancePortugalPortugal
Italy
Portugal
United Kingdom
PortugalPortugalPortugalPortugalPortugalPortugalPortugalPortugalPortugalPortugalPortugalPortugalPortugalPortugalPortugalPortugalPortugalPortugalPortugalPortugal France
Belgium
Portugal FrancePortugal FrancePortugalPortugalPortugalPortugalPortugal
Italy
PortugalPortugalPortugalPortugal
Belgium
PortugalPortugal
Italy
PortugalPortugalPortugalPortugalPortugalPortugal France
Belgium
PortugalPortugalPortugalPortugalPortugalPortugalPortugal
Germany
Portugal
Italy
PortugalPortugalPortugalPortugalPortugalPortugalPortugalPortugalPortugal
Italy
PortugalPortugalPortugalPortugalPortugalPortugalPortugal
Germany
Italy
Belgium
PortugalPortugalPortugalPortugalPortugalPortugal
United Kingdom
PortugalPortugalPortugalPortugalPortugal
Germany
PortugalPortugalPortugal
Italy
Portugal
Germany
PortugalPortugalPortugalPortugalPortugalPortugalPortugalPortugalPortugalPortugalPortugalPortugalPortugalPortugal FrancePortugalPortugalPortugalPortugalPortugal
Germany
PortugalPortugalPortugalPortugalPortugal FrancePortugalPortugal FrancePortugal
Italy
PortugalPortugal FrancePortugalPortugalPortugalPortugal FrancePortugalPortugalPortugalPortugalPortugalPortugalPortugalPortugal FrancePortugal
United KingdomItaly
PortugalPortugalPortugalPortugalPortugalPortugalPortugalPortugalPortugalPortugalPortugalPortugalPortugalPortugalPortugal
Germany
PortugalPortugalPortugal FrancePortugal FrancePortugalPortugalPortugalPortugalPortugalPortugal
Italy
PortugalPortugalPortugal
ItalyItaly
Portugal
Germany
Belgium
Portugal FrancePortugalPortugal
Italy
PortugalPortugal
Italy
PortugalPortugalPortugalPortugalPortugalPortugal
Germany
PortugalPortugal
Belgium
PortugalPortugalPortugalPortugal
Belgium
PortugalPortugalPortugal
Italy
FrancePortugalPortugalPortugal
Italy
PortugalPortugalPortugal
Italy
PortugalPortugalPortugalPortugal
Germany
PortugalPortugalPortugalPortugalPortugalPortugalPortugalPortugalPortugalPortugalPortugalPortugalPortugalPortugalPortugalPortugal FrancePortugalPortugalPortugalPortugalPortugal
Belgium
Portugal
Italy
PortugalPortugal France
Belgium
PortugalPortugalPortugalPortugalPortugalPortugalPortugalPortugal
Germany
PortugalPortugalPortugalPortugalPortugalPortugalPortugalPortugalPortugalPortugalPortugalPortugalPortugalPortugalPortugalPortugal
Italy
FrancePortugalPortugal
Belgium
Portugal FrancePortugalPortugal
Belgium
PortugalPortugalPortugalPortugalPortugal
Italy
Portugal
Germany
PortugalPortugalPortugalPortugalPortugal
Italy
PortugalPortugalPortugalPortugalPortugalPortugalPortugal
Germany
PortugalPortugalPortugalPortugalPortugalPortugalPortugalPortugalPortugalPortugalPortugalPortugalPortugalPortugal
Italy
PortugalPortugalPortugal
Belgium
Portugal FrancePortugalPortugalPortugal
Italy
PortugalPortugalPortugalPortugalPortugal France
Belgium
PortugalPortugalPortugalPortugal FrancePortugalPortugalPortugalPortugalPortugalPortugalPortugalPortugal
United Kingdom
Portugal
Italy
PortugalPortugalPortugalPortugal
Belgium
FrancePortugalPortugalPortugal
Germany
Portugal FrancePortugalPortugalPortugal
Belgium
PortugalPortugalPortugalPortugalPortugalPortugal FrancePortugal FrancePortugalPortugal
Belgium
PortugalPortugalPortugalPortugal
Belgium
Italy
PortugalPortugal FrancePortugal FrancePortugalPortugalPortugalPortugalPortugal
Belgium
FrancePortugalPortugalPortugal
Germany
PortugalPortugalPortugal
Italy
PortugalPortugal FrancePortugal
Italy
PortugalPortugalPortugalPortugalPortugalPortugalPortugalPortugalPortugalPortugalPortugalPortugalPortugalPortugalPortugalPortugal
Italy
PortugalPortugal
Italy
PortugalPortugalPortugalPortugalPortugalPortugalPortugal
GermanyFrancePortugalPortugalPortugalPortugalPortugalPortugal
Italy
PortugalPortugalPortugalPortugalPortugalPortugalPortugalPortugalPortugal
United Kingdom
FrancePortugalPortugalPortugalPortugalPortugalPortugal
Belgium
Portugal
Italy
Belgium
PortugalPortugalPortugalPortugalPortugalPortugalPortugalPortugalPortugalPortugalPortugal
Italy
PortugalPortugalPortugalPortugalPortugalPortugal
Italy
FrancePortugalPortugalPortugalPortugalPortugalPortugal
Italy
PortugalPortugalPortugal
Belgium
PortugalPortugalPortugalPortugal
Belgium
Italy
PortugalPortugalPortugalPortugalPortugalPortugalPortugalPortugalPortugalPortugalPortugalPortugal
Italy
Portugal FranceFrancePortugalPortugalPortugal
Italy
PortugalPortugal
Italy
PortugalPortugal
BelgiumBelgium
Portugal
Belgium
FrancePortugalPortugal
Morocco
TurkeyTurkeySuriname
Morocco
SurinameTurkey
China
Suriname
MoroccoMorocco
SurinameSuriname
MoroccoMorocco
TurkeyTurkey
Iran
Morocco
TurkeySuriname
TurkeySuriname
TurkeySurinameSuriname
Turkey
MoroccoMorocco
Turkey
MoroccoMorocco
TurkeyTurkey
Morocco
SurinameTurkeyTurkeyTurkeyTurkey
Morocco
TurkeyTurkey
Morocco
TurkeySuriname
China
TurkeyTurkeyTurkey
Morocco
TurkeySuriname
Morocco
Suriname
Morocco
TurkeyTurkeySuriname
China
Turkey
Morocco
TurkeySurinameSuriname
TurkeyTurkeySuriname
Turkey
MoroccoMorocco
Germany
Turkey
Morocco
Turkey
Morocco
TurkeyTurkeyTurkeyTurkeyTurkey
Morocco
TurkeyTurkeySuriname
TurkeyTurkeyTurkeyTurkey
Morocco
SurinameSurinameTurkey
Morocco
TurkeyTurkeySuriname
TurkeyTurkeyTurkeyTurkey
MoroccoMoroccoMorocco
SurinameTurkey
Morocco
TurkeyTurkeyTurkey
MoroccoMorocco
TurkeyTurkeyTurkeyTurkey
Morocco
Turkey
Morocco
TurkeySuriname
MoroccoMorocco
SurinameTurkeyTurkeyTurkey
Morocco
TurkeySuriname
Turkey
Morocco
TurkeySuriname
Turkey
United Kingdom
Morocco
Turkey
United Kingdom
Iran
MoroccoMorocco
United Kingdom
Morocco
TurkeySuriname
Morocco
SurinameSuriname
Morocco
Suriname
Morocco
Turkey
Morocco
China
TurkeySuriname
Morocco
Turkey
Morocco
TurkeyTurkeySuriname
Morocco
China
MoroccoMoroccoMorocco
SurinameTurkey
SurinameTurkeyTurkeyTurkeyTurkey
Morocco
TurkeyTurkeyTurkeyTurkeyTurkeyTurkeyTurkey
ChinaChina
Morocco
TurkeyTurkey
Morocco
TurkeyTurkey
MoroccoMoroccoMorocco
Turkey
Morocco
SurinameTurkey
Suriname
Morocco
TurkeyTurkey
MoroccoMorocco
TurkeyTurkeyTurkeyTurkeyTurkeyTurkey
Morocco
SurinameTurkey
SurinameTurkeyTurkeyTurkey
China
MoroccoMoroccoMorocco
TurkeyTurkey
MoroccoMoroccoMorocco
Turkey
Germany
Morocco
TurkeyTurkeyTurkey
Morocco
TurkeySuriname
Morocco
Iran
Turkey
MoroccoMorocco
TurkeyTurkeySuriname
Turkey
Morocco
ChinaChina
Suriname
MoroccoMoroccoMorocco
TurkeySuriname
Turkey
Morocco
Turkey
China
Suriname
MoroccoMoroccoMoroccoMorocco
TurkeyTurkey
Morocco
United Kingdom
Germany
Turkey
Morocco
Suriname
Morocco
TurkeyTurkey
MoroccoMoroccoMoroccoMorocco
TurkeySurinameSuriname
TurkeyTurkey
Morocco
Turkey
Morocco
TurkeySuriname
TurkeySuriname
TurkeyTurkeySuriname
TurkeyTurkeySuriname
Morocco
TurkeySurinameSuriname
Morocco
SurinameSurinameSurinameSurinameSurinameTurkey
MoroccoMorocco
Suriname
Morocco
Suriname
Morocco
SurinameSuriname
China
Morocco
Suriname
United Kingdom
Morocco
Suriname
Morocco
SurinameTurkey
MoroccoMorocco
Suriname
Morocco
SurinameSuriname
MoroccoMoroccoMoroccoMorocco
Suriname
Morocco
Iran
Suriname
MoroccoMoroccoMorocco
TurkeyTurkeySuriname
Morocco
Suriname
China
Morocco
China
Turkey
MoroccoMoroccoMorocco
SurinameTurkeyTurkey
MoroccoMorocco
Turkey
MoroccoMorocco
China
MoroccoMorocco
TurkeySuriname
Turkey
China
MoroccoMoroccoMoroccoMorocco
TurkeyTurkeyTurkeyTurkey
ChinaChina
TurkeySuriname
TurkeyTurkey
Morocco
Germany
Morocco
China
Morocco
China
Turkey
China
Turkey
MoroccoMoroccoMoroccoMoroccoMorocco
SurinameTurkey
Iran
Suriname
Morocco
Turkey
MoroccoMoroccoMoroccoMorocco
Turkey
China
SurinameTurkeyTurkey
Morocco
TurkeySuriname
China
Morocco
China
Suriname
MoroccoMorocco
Turkey
Morocco
TurkeyTurkey
Morocco
Turkey
MoroccoMoroccoMorocco
SurinameTurkey
Suriname
Morocco
TurkeyTurkey
Morocco
TurkeyTurkey
Germany
Morocco
TurkeyTurkey
Germany
Morocco
TurkeyTurkeyTurkey
Morocco
Turkey
Morocco
SurinameTurkey
SurinameTurkey
Suriname
Morocco
Turkey
Morocco
TurkeySuriname
Morocco
Turkey
Morocco
TurkeyTurkeySuriname
TurkeySuriname
Morocco
Suriname
Morocco
Turkey
Morocco
Suriname
Morocco
TurkeyTurkeySuriname
TurkeyTurkeySuriname
TurkeySuriname
Turkey
MoroccoMorocco
Turkey
Morocco
SurinameTurkeyTurkey
SurinameSuriname
MoroccoMoroccoMorocco
TurkeySuriname
TurkeyTurkeySuriname
MoroccoMorocco
Suriname
Morocco
TurkeyTurkey
MoroccoMorocco
TurkeyTurkeyTurkey
Morocco
TurkeyTurkey
Morocco
Turkey
China
SurinameSurinameTurkeyTurkey
Morocco
Turkey
China
MoroccoMoroccoMorocco
TurkeySuriname
Morocco
TurkeyTurkey
Morocco
Turkey
Morocco
TurkeySuriname
Iran
Morocco
TurkeyTurkey
Morocco
Turkey
China
Turkey
Morocco
Turkey
Morocco
SurinameTurkeyTurkey
Suriname
Morocco
TurkeyTurkey
Morocco
Suriname
Morocco
Suriname
Morocco
Suriname
MoroccoMorocco
TurkeyTurkey
South Africa
Fiji
China
South Africa
India United Kingdom
South Africa
United KingdomUnited KingdomUnited KingdomChina
Australia
Korea
United KingdomChinaChinaChina
Australia
United KingdomChina United KingdomChina United KingdomUnited Kingdom
Korea
United KingdomChina United KingdomUnited KingdomChina United KingdomUnited KingdomChinaChina United KingdomUnited KingdomChina United KingdomUnited KingdomUnited KingdomUnited KingdomChinaChina United KingdomUnited Kingdom
Australia
China United KingdomUnited KingdomUnited KingdomUnited Kingdom
South Africa
United KingdomUnited Kingdom
Australia
United KingdomChina
Australia
South Africa
ChinaChina United KingdomUnited KingdomUnited KingdomChina
Australia
United KingdomChina
FijiFijiFiji
United KingdomUnited KingdomChina United Kingdom
Australia
United Kingdom
Australia
ChinaChinaChina United KingdomChina United Kingdom
Australia
United KingdomChina United KingdomChina United Kingdom
Australia
United KingdomUnited KingdomChina
KoreaKorea
United KingdomUnited Kingdom
Australia
China United KingdomChinaChina United KingdomUnited KingdomUnited KingdomChinaChina United KingdomUnited Kingdom
FijiFiji
United KingdomChinaChina
Fiji
China
FijiFiji
Australia
United KingdomChina
Fiji
China
Fiji
United KingdomChina United KingdomChinaIndia ChinaChina
Fiji
South Africa
Fiji
United KingdomUnited Kingdom
Fiji
United KingdomChina
Korea
United KingdomUnited Kingdom
Fiji
United KingdomUnited Kingdom
Fiji
United KingdomUnited KingdomUnited Kingdom
Fiji
China
Fiji
United KingdomChinaChina United KingdomUnited KingdomChinaChina United KingdomUnited KingdomUnited KingdomChinaChina United Kingdom
Australia
United KingdomChinaChina
FijiFiji
China
Fiji
United KingdomChinaChina United Kingdom
Australia
United KingdomUnited KingdomChina
Fiji
United KingdomUnited KingdomChina
Fiji
China
Australia
ChinaChinaChinaChinaChina United KingdomChinaChina United KingdomUnited Kingdom
Australia
China United KingdomChina United Kingdom
South Africa
United KingdomChina United Kingdom
Korea
China United KingdomUnited Kingdom
Fiji
ChinaChinaChinaChina United KingdomChina
Korea
China United KingdomUnited KingdomChina United KingdomChina United KingdomUnited KingdomUnited KingdomChinaChina United Kingdom
KoreaKoreaKorea
United KingdomChina United KingdomUnited Kingdom
Australia
United KingdomUnited KingdomChina United KingdomUnited KingdomChinaChina
Fiji
China United Kingdom
AustraliaAustralia
Fiji
China United KingdomIndia
Australia
United KingdomUnited KingdomUnited KingdomChina United KingdomChinaChinaChina United KingdomUnited KingdomUnited KingdomUnited KingdomUnited KingdomChina United KingdomChinaChinaChinaChina United KingdomChina
Australia
Fiji
United Kingdom
Fiji
China
Australia
Fiji
United KingdomUnited KingdomUnited Kingdom
Fiji
Australia
ChinaChinaChina
Korea
ChinaChinaChina
Fiji
United Kingdom
Korea
Fiji
China
Korea
United KingdomUnited Kingdom
Australia
United KingdomUnited KingdomChina United KingdomChinaIndia United KingdomChinaChina United KingdomUnited KingdomIndia China United KingdomUnited KingdomUnited Kingdom
Australia
United KingdomChinaChina
Australia
United KingdomUnited KingdomUnited KingdomChina United KingdomUnited KingdomChina
Australia
Korea
United KingdomChina United KingdomUnited KingdomUnited KingdomUnited KingdomUnited KingdomUnited KingdomUnited KingdomUnited Kingdom
Australia
United KingdomChina United Kingdom
Australia
United Kingdom
Korea
United KingdomChina
Australia
ChinaChina United KingdomChinaChinaChina United KingdomChina United Kingdom
Australia
United KingdomChinaChina United KingdomUnited KingdomUnited Kingdom
Australia
United Kingdom
Fiji
Australia
United Kingdom
South Africa
China
Fiji
United KingdomChinaChina
Fiji
China United KingdomUnited KingdomUnited Kingdom
AustraliaAustralia
China
South Africa
United KingdomUnited KingdomChina
South Africa
United KingdomChina
Australia
Italy
France
ItalyItaly
PortugalTurkey
Albania
Portugal
ItalyItaly
Germany
Turkey
Italy
Germany
PortugalTurkey
AlbaniaItaly
PortugalTurkey
PortugalPortugalPortugalPortugalTurkey
SpainItaly
Germany
Portugal
Spain
FranceFrance
Italy
Turkey
Germany
ItalyItaly
Portugal
Albania
Germany
Portugal
Albania
FranceFrance
AlbaniaItaly
AlbaniaItalyItaly
Spain
TurkeyTurkey
Albania
Portugal France
Italy
France
ItalyItaly
TurkeyTurkey
Germany
Italy
Portugal
Spain
Portugal France
ItalyAlbania
ItalyAlbania
Italy
Germany
Albania
Portugal
ItalyItalyItaly
TurkeyTurkey
ItalyItalySpain
Portugal
Albania
France
Spain
Portugal
Italy
GermanyGermanyGermanyGermany
Spain
France
Albania
PortugalTurkey
Italy
PortugalTurkeyTurkey
Italy
PortugalPortugalPortugal
Italy
TurkeyTurkey
ItalyItaly
Turkey
Austria
Albania
PortugalTurkey
Germany
TurkeyTurkey
Spain
Turkey
AlbaniaItaly
Portugal
Italy
Portugal
Germany
Turkey
Italy
TurkeyTurkey
Italy
PortugalPortugalPortugal
Albania
TurkeyTurkey
France
Turkey
Italy
Turkey
SpainItalyItalyItalyItalyItalyItalyItaly
Portugal
Albania
Portugal
ItalyAlbania
Italy
Turkey
Italy
TurkeyPortugalPortugalPortugal
ItalyItalyItalyAlbania
ItalyAlbania
TurkeyTurkey
Italy
PortugalPortugal
Italy
Austria
Turkey
Italy
Turkey
SpainItalyItaly
Portugal
SpainItaly
Germany
Italy
GermanyGermany
Portugal
ItalyItalyItaly
PortugalPortugalPortugal FrancePortugal
ItalyItalyItalyItalyItaly
Germany
ItalyItaly
Turkey
Germany
ItalyItalyItalyItaly
PortugalTurkey
Italy
Turkey
Italy
Portugal
Italy
Turkey
SpainItaly
Turkey
Italy
PortugalPortugalPortugalPortugalTurkey
Germany
PortugalPortugal
Italy
Portugal
ItalyItalyItalyItalySpainAlbania
Italy
PortugalPortugalTurkey
Italy
PortugalTurkey
Portugal
Albania
PortugalTurkey
Italy
Portugal
Italy
PortugalTurkey
Italy
Portugal
ItalySpain
Italy
France
Turkey
ItalyItaly
FranceGermany
SpainAlbaniaAlbaniaItaly
Turkey
France
Italy
PortugalTurkey
AlbaniaAlbaniaItalyItaly
Turkey
Italy
Germany
Italy
Turkey
ItalyItaly
PortugalTurkey
Italy
Turkey
SpainAlbania SpainItaly
PortugalPortugalPortugal
ItalyAlbania
ItalyItaly
France
Italy
PortugalTurkey
Germany
Portugal FrancePortugal
Spain
Turkey
Albania
Germany
Albania
Austria
ItalyItaly
FranceGermany
PortugalPortugal France
ItalyItalyItaly
France
Italy
Portugal
Italy
PortugalPortugal
Spain
Germany
Italy
Turkey
SpainSpainAlbaniaItalyItalyItaly
Turkey
ItalyAlbania
TurkeyTurkeyPortugal
TurkeyPortugal
TurkeyTurkey
France
Italy
Portugal
ItalySpain
Turkey
Italy
Portugal France
Italy
Germany
SpainItaly
Turkey
ItalyItalyAlbania
Italy
Germany
Italy
Portugal
Italy
Portugal
Albania SpainAlbania
PortugalPortugal
Albania
PortugalPortugal
ItalyAlbania Spain
PortugalTurkey
ItalyItaly
Turkey
Italy
PortugalPortugalTurkey
ItalyItaly
Portugal
AlbaniaItalyItaly
France
TurkeyTurkeyTurkeyPortugal
SpainItaly
Turkey
Spain
FrancePortugalPortugalTurkeyTurkey
Portugal
ItalyItaly
PortugalPortugal
Italy
Turkey
Italy
PortugalTurkey
Italy
Turkey
Italy
Portugal
Austria
Portugal
ItalyItaly
Portugal
Germany
ItalyItaly
Austria
France
Spain
Austria
ItalySpain
Austria
France
Italy
Turkey
Spain
Portugal
Spain
Turkey
Germany
Austria
PortugalPortugal
Italy
FranceFrance
ItalyItaly
Turkey
FrancePortugal
Austria
Italy
AustriaAustria
Italy
Portugal
Italy
Germany
ItalyItaly
Portugal
Austria
Italy
Germany
PortugalPortugalTurkey
ItalyItaly
Portugal
Italy
Turkey
ItalyAlbania
TurkeyPortugal
Germany
ItalySpain
Italy
TurkeyPortugal
Italy
Portugal
ItalyItalyItalyItalyItaly
Turkey
Italy
PortugalTurkey
France
ItalyItalyItaly
France
TurkeyTurkeyPortugal
SpainItalyItaly
TurkeyPortugal
Germany
Portugal
Germany
SpainItaly
SpainItaly
Germany
Albania SpainAlbaniaItaly
Portugal France
Turkey
Italy
PortugalTurkey
FrancePortugal
ItalyItaly
PortugalPortugal
ItalyItalyItaly
Portugal
Italy
PortugalTurkey
Italy
Portugal FrancePortugal
Italy
TurkeyPortugal
Italy
Turkey
ItalyItalySpain
Germany
Turkey
Spain
TurkeyTurkeyPortugalPortugal France
Albania
Germany
TurkeyPortugalPortugal
Italy
PortugalTurkey
Italy
Portugal
ItalyItalyItaly
PortugalTurkey
Italy
Portugal France
Italy
PortugalPortugal
ItalySpain
ItalySpain
PortugalTurkey
Albania
Turkey
Italy
Turkey
Spain
Portugal
Albania
PortugalTurkey
France
SpainItalyItaly
Spain
Portugal
Germany
Italy
Portugal
ItalyItaly
Germany
Portugal
Italy
Portugal
Germany
ItalyItaly
TurkeyPortugal
Italy
Portugal
ItalyAlbania
Portugal
Italy
Portugal
AlbaniaItalyItaly
Spain
PortugalPortugal
Italy
TurkeyPortugal
Italy
PortugalPortugalPortugalPortugalTurkey
Italy
TurkeyTurkey
SpainSpainItalyItalyItaly
TurkeyPortugalPortugal
Turkey
Spain
PortugalPortugalPortugalPortugal
ItalyItaly
PortugalPortugal
ItalyItaly
France
Turkey
Spain
Turkey
Italy
Germany
PortugalTurkey
France
TurkeyTurkey
FranceFrancePortugal
Italy
GermanyGermany
TurkeyPortugalPortugal
ItalyItaly
Germany
Portugal
Italy
Portugal
Italy
Portugal
GermanyGermanyFrancePortugal
Germany
ItalyItaly
Turkey
SpainItaly
Portugal
Germany
Portugal
Italy
France
TurkeyTurkeyTurkeyTurkey
Albania
Portugal
Germany
ItalyItaly
Portugal
Germany
Italy
Germany
Portugal FrancePortugal
GermanyFrancePortugal
ItalyItaly
Austria
ItalyItaly
Portugal
Italy
PortugalTurkey
Germany
Italy
PortugalPortugalPortugal
Germany
Portugal FrancePortugal
Italy
TurkeyTurkey
Italy
Germany
Turkey
Spain
PortugalTurkey
Italy
Portugal
Germany
TurkeyTurkey
Spain
Germany
Spain
Turkey
FrancePortugal
AlbaniaItaly
TurkeyTurkey
Italy
Portugal
Germany
ItalyItaly
Germany
Italy
Germany
PortugalTurkeyTurkey
Portugal
Germany
Portugal
Italy
Turkey
Italy
France
Albania
Turkey
France
Turkey
France
SpainSpainAlbaniaItaly
GermanyFrancePortugalPortugal
Italy
Austria
Albania
Germany
TurkeyPortugal France
TurkeyTurkey
Italy
Portugal
Italy
Portugal
Germany
Spain
FranceGermanyGermany
ItalyAlbaniaAlbania
Turkey
AlbaniaAlbania
GermanyFrancePortugal
TurkeyTurkeyTurkey
Albania
Turkey
ItalyItaly
TurkeyTurkey
Albania
Portugal
Spain
PortugalPortugal
ItalyAlbania
Portugal
Spain
Turkey
Italy
Germany
ItalyAlbania
PortugalTurkey
ItalyItaly
Austria
Italy
Germany
Italy
Portugal
Italy
Portugal
Italy
France
Turkey
Italy
Portugal France
SpainItalyItaly
TurkeyTurkeyTurkeyPortugalPortugalPortugal
Turkey
Germany
PortugalPortugal
Italy
PortugalPortugalPortugal
Italy
Portugal
ItalyItaly
TurkeyPortugalPortugalPortugal France
Italy
Portugal
Albania
FrancePortugal
Albania
Turkey
Italy
Portugal
Italy
Portugal
Italy
PortugalPortugal France
ItalyItaly
Portugal
Italy
Austria
Italy
PortugalPortugal
Italy
TurkeyTurkeyPortugal
TurkeyPortugal FranceFrancePortugal
TurkeyTurkeyPortugalPortugal
TurkeyPortugal
TurkeyTurkey
Italy
Turkey
Spain
TurkeyPortugal
Turkey
Italy
Turkey
FrancePortugal
Italy
Turkey
Italy
TurkeyTurkey
France
TurkeyTurkeyTurkey
AlbaniaItalyItaly
France
SpainAlbania
Portugal FrancePortugalPortugal
Italy
PortugalPortugal
Spain
GermanyFrance
AlbaniaAlbaniaAlbania
FranceFrance
TurkeyPortugal
Turkey
Spain
Portugal FranceFrance
Italy
Turkey
France
Spain
France
TurkeyPortugal
Turkey
France
Italy
Portugal
Italy
Portugal
Italy
Turkey
Germany
Turkey
FrancePortugalTurkey
France
TurkeyTurkey
FranceFranceFrance
Spain
FranceGermany
FranceFranceGermany
Spain
Turkey
Italy
Portugal France
Turkey
FrancePortugal
Germany
Italy
Portugal France
Italy
PortugalPortugal France
Italy
Portugal
ItalyItaly
PortugalPortugal
Austria
TurkeyTurkeyPortugalPortugal
ItalyItaly
TurkeyPortugal
TurkeyTurkey
Italy
PortugalPortugal
ItalyItaly
Portugal
Spain
Turkey
ItalyItaly
France
Turkey
Italy
FranceFrance
TurkeyPortugal
Italy
Portugal
SpainAlbaniaItaly
Turkey
France
SpainItalyItalyItaly
Portugal
ItalyItaly
Turkey
Spain
Portugal
GermanyGermany
TurkeyTurkeyPortugal
Turkey
Italy
Turkey
Spain
TurkeyPortugal
Italy
PortugalTurkey
PortugalTurkeyTurkeyTurkeyTurkey
PortugalTurkeyTurkey
Spain
Turkey
SpainItaly
TurkeyTurkeyPortugalPortugal
Spain
Germany
ItalyItaly
TurkeyTurkeyTurkeyTurkeyTurkeyPortugal France
Italy
Austria
TurkeyTurkey
Spain
PortugalPortugalPortugal France
Turkey
France
Turkey
Spain
Portugal
Spain
PortugalTurkey
Germany
TurkeyTurkey
France
Italy
Turkey
Italy
Turkey
SpainSpain
Turkey
Italy
TurkeyPortugalPortugal
Italy
PortugalTurkey
Italy
PortugalPortugal
Spain
Portugal
Italy
Portugal
Italy
FranceFrance
Turkey
Spain
TurkeyPortugal
TurkeyTurkeyTurkeyPortugal
Germany
TurkeyTurkey
ItalySpain
PortugalTurkey
Italy
TurkeyTurkeyTurkey
ItalyItaly
TurkeyTurkeyPortugal
TurkeyPortugal
SpainSpain
Portugal
Germany
Italy
Turkey
ItalyAlbania
TurkeyTurkey
Italy
PortugalTurkey
FrancePortugalPortugalPortugal
Italy
TurkeyTurkey
Spain
PortugalPortugalPortugalPortugalTurkey
Italy
PortugalTurkeyTurkeyTurkey
Italy
Austria
Turkey
ItalyItaly
PortugalTurkey
PortugalPortugalTurkey
Germany
TurkeyTurkey
ItalySpain
ItalyItaly
Portugal
SpainSpain
PortugalPortugal
Italy
TurkeyPortugal
TurkeyTurkeyPortugalPortugal
TurkeyTurkeyPortugal
ItalySpain
Germany
Spain
Turkey
ItalyItaly
Turkey
Albania
TurkeyPortugal
Italy
Austria
Portugal
Italy
Germany
TurkeyTurkey
SpainItaly
Portugal
Italy
TurkeyTurkey
France
TurkeyTurkeyTurkey
France
Spain
Austria
Turkey
Spain
TurkeyPortugal
Austria
Italy
Portugal
SpainAlbania
France
Turkey
France
SpainSpain
Portugal
SpainSpainSpainSpain
FranceFrance
Italy
PortugalPortugalPortugal
SpainSpainSpainItaly
Spain
Turkey
Germany
SpainSpainSpain
Turkey
Spain
Portugal
SpainSpainItalyItaly
SpainItaly
Turkey
ItalyItalyItalySpainSpain
Portugal
Spain
Austria
Portugal
Spain
Portugal
Spain
Turkey
Italy
Turkey
SpainSpainSpainSpain
PortugalTurkey
PortugalPortugal
Italy
Germany
Portugal
Spain
PortugalPortugal
Italy
Portugal
ItalySpainSpain
Portugal
SpainSpainSpain
France
SpainItaly
Spain
Portugal
Spain
TurkeyTurkey
Spain
Turkey
ItalySpain
Germany
Italy
Portugal
ItalyItaly
Portugal
Austria
TurkeyPortugal
Albania
Turkey
Italy
FranceGermany
ItalyItaly
Turkey
ItalyItalyItalyItaly
Portugal
Italy
TurkeyTurkey
Austria
TurkeyPortugal
Turkey
Spain
FranceFrancePortugal
ItalyItalyItalyItaly
Turkey
Italy
TurkeyTurkey
ItalyItaly
Turkey
Spain
Germany
PortugalPortugalTurkey
ItalyItaly
Germany
ItalySpain
Italy
FranceFranceGermanyGermany
PortugalPortugal
Spain
TurkeyPortugal
Turkey
ItalyAlbania
Turkey
Italy
Portugal
Germany
TurkeyTurkey
SpainSpainItalyItaly
Turkey
Germany
PortugalPortugalTurkeyTurkey
Italy
TurkeyTurkeyTurkeyTurkey
ItalyItaly
Turkey
Germany
Italy
PortugalPortugalTurkey
AlbaniaItaly
Albania
PortugalPortugal
Spain
PortugalTurkeyTurkey
ItalyItaly
Portugal France
Italy
France
Italy
Turkey
Germany
PortugalPortugal
ItalyItalyAlbania
ItalyItalyAlbania
TurkeyTurkey
Italy
Turkey
GermanyGermany
Turkey
Austria
Turkey
ItalySpain
France
Albania
Turkey
GermanyFrancePortugal
TurkeyTurkeyPortugal
TurkeyTurkeyTurkeyTurkey
Spain
Turkey
Italy
PortugalTurkey
Italy
PortugalPortugalTurkey
ItalyItalyItaly
PortugalTurkey
ItalyItaly
PortugalPortugalPortugalPortugalPortugalTurkey
Austria
TurkeyPortugal
Turkey
Italy
TurkeyPortugal
TurkeyPortugal
TurkeyPortugal
ItalyItalyItaly
PortugalTurkey
Portugal
ItalyItaly
Germany
Turkey
Italy
Turkey
Italy
Portugal
Germany
Turkey
Germany
ItalyItalySpain
Turkey
Austria
Portugal
ItalySpain
Germany
Italy
PortugalPortugal
ItalyItaly
PortugalPortugal
Italy
FrancePortugal
Italy
Germany
PortugalTurkeyTurkey
Portugal
ItalyItaly
Portugal
Spain
Portugal
Italy
TurkeyPortugal
TurkeyTurkeyTurkey
SpainItaly
PortugalPortugal
Albania
PortugalTurkeyTurkeyTurkeyTurkey
Portugal
Spain
TurkeyPortugal
Italy
TurkeyPortugal
ItalyAlbania
Turkey
Spain
Germany
Portugal
Italy
France
Italy
PortugalPortugal
ItalyItaly
Turkey
France
ItalyAlbania
Portugal
Italy
Turkey
Italy
Portugal FrancePortugal
SpainItaly
Spain
Germany
Turkey
Germany
Italy
PortugalTurkey
Italy
TurkeyPortugal France
Spain
Turkey
Spain
PortugalPortugalTurkeyTurkeyTurkeyTurkey
FrancePortugalPortugalTurkey
Italy
TurkeyPortugal
Turkey
GermanyFrance
ItalyItaly
PortugalPortugal
Italy
PortugalPortugal
Italy
TurkeyPortugal
Italy
Germany
Albania
Turkey
Italy
Turkey
Spain
Germany
Portugal
SpainItaly
Portugal FrancePortugalPortugalTurkeyTurkey
PortugalTurkeyTurkey
Germany
ItalyItalyItalyItaly
Germany
AlbaniaItaly
Turkey
Italy
TurkeyPortugalPortugalPortugal
Italy
Turkey
Spain
Germany
Spain
Turkey
ItalySpain
ItalySpain
Turkey
Italy
PortugalTurkey
Italy
France
ItalyAlbania
PortugalTurkey
SpainAlbaniaItaly
Portugal
Albania
France
Turkey
Spain
TurkeyPortugalPortugal
Austria
Turkey
Italy
TurkeyPortugal
Albania
GermanyFrancePortugal
ItalyItaly
Turkey
Germany
TurkeyTurkey
FrancePortugalPortugalTurkey
PortugalPortugalPortugalPortugal
Germany
ItalyItaly
TurkeyTurkeyPortugalPortugal
Turkey
ItalySpain
ItalyAlbania
France
Austria
Turkey
Italy
FrancePortugalPortugalPortugal
Albania
France
TurkeyPortugalPortugal
ItalyItaly
PortugalTurkey
PortugalTurkey
Portugal
Austria
Portugal
Italy
Turkey
France
TurkeyPortugal
ItalyItaly
Austria
Italy
Portugal
Italy
PortugalTurkey
PortugalTurkey
PortugalTurkey
Italy
Portugal
Germany
Spain
Turkey
Italy
Portugal
Spain
Portugal FranceFrance
Italy
Germany
Turkey
Italy
PortugalPortugalPortugalTurkeyTurkey
PortugalTurkey
Portugal
Italy
TurkeyPortugal
ItalySpain
Portugal
ItalySpain
Italy
PortugalTurkey
PortugalPortugalPortugal
Italy
TurkeyPortugalPortugalPortugalPortugal France
Turkey
ItalyItaly
Turkey
Spain
PortugalPortugalPortugal
Albania
PortugalPortugalTurkey
Italy
PortugalPortugal
ItalySpain
TurkeyTurkeyTurkey
ItalyItaly
Turkey
AlbaniaAlbaniaItaly
PortugalTurkey
Portugal
Albania
PortugalPortugal
Spain
Germany
TurkeyPortugal
SpainItaly
FrancePortugal
ItalyItaly
PortugalTurkey
Italy
Germany
Turkey
FrancePortugal
Germany
Italy
Portugal
Spain
Turkey
Austria
Portugal
Italy
Germany
TurkeyTurkeyTurkey
FrancePortugal
ItalySpain
PortugalPortugalPortugalPortugal
Albania
PortugalPortugal
Albania
FrancePortugalPortugal
Italy
France
SpainItaly
Germany
Albania
Turkey
Italy
TurkeyPortugal
TurkeyPortugal
ItalyItaly
PortugalTurkey
Portugal
ItalyAlbania
Portugal
ItalyItalyItalyItaly
Turkey
ItalySpain
Portugal
ItalyItalyItaly
Portugal
ItalyAlbania
TurkeyTurkey
FranceFrance
TurkeyPortugal
Germany
Portugal
Italy
Portugal
Germany
Italy
Portugal
ItalyAlbania
Turkey
Italy
TurkeyTurkeyPortugalPortugalPortugal
Turkey
Spain
Turkey
France
SpainSpain
PortugalPortugal
Italy
Portugal France
Turkey
Albania
FrancePortugal
Italy
PortugalPortugal
Albania
PortugalPortugal
Spain
Portugal
Germany
ItalyItaly
France
Italy
Portugal
Italy
PortugalTurkeyTurkey
Italy
PortugalPortugal
Italy
Turkey
Italy
PortugalPortugal
Albania Spain
TurkeyPortugal
Albania Spain
Portugal
Italy
TurkeyPortugal
ItalyItalyAlbania
Portugal
Germany
TurkeyPortugal
Spain
PortugalPortugalPortugal
Italy
TurkeyTurkeyTurkey
Italy
Portugal
Spain
TurkeyPortugalPortugal
TurkeyPortugal
Germany
Portugal
Austria
PortugalPortugal
Germany
Italy
TurkeyPortugalPortugal
ItalyAlbania
FrancePortugal
ItalyItaly
Portugal
SpainAlbaniaItaly
PortugalPortugalPortugalTurkey
PortugalTurkey
France
ItalyItaly
Turkey
France
Spain
TurkeyPortugal
AlbaniaItaly
FrancePortugal
Austria
PortugalTurkey
PortugalTurkey
FrancePortugalPortugalTurkey
Spain
Portugal
SpainItaly
TurkeyTurkey
Spain
Portugal
Spain
TurkeyTurkeyPortugalPortugalPortugalPortugal
Turkey
Italy
Germany
Portugal
Italy
PortugalTurkeyTurkey
Portugal
Italy
Germany
ItalyAlbaniaAlbania Spain
TurkeyPortugalPortugal
Spain
TurkeyPortugal
ItalyItalyAlbania
Portugal
Italy
PortugalPortugal
Spain
France
Spain
PortugalTurkey
PortugalPortugal FranceFranceGermanyGermany
PortugalTurkey
PortugalPortugal
Italy
PortugalTurkeyTurkey
SpainItaly
SpainItaly
TurkeyPortugalPortugal
TurkeyTurkeyPortugalPortugal
ItalySpain
Italy
Portugal France
Italy
PortugalTurkey
Portugal
Germany
ItalyItaly
Portugal France
ItalyItaly
Portugal
Germany
Turkey
Spain
PortugalPortugalPortugal
Germany
Italy
Germany
ItalySpainAlbania
TurkeyPortugal
Italy
Germany
TurkeyTurkeyPortugal
Italy
PortugalPortugal
Germany
PortugalPortugalPortugal
SpainItaly
Portugal France
TurkeyPortugalPortugal FrancePortugalPortugal
Germany
Turkey
Germany
Italy
PortugalTurkeyTurkey
PortugalPortugalPortugalPortugal France
Turkey
ItalyItaly
Portugal
Germany
ItalyAlbania Spain
Italy
Portugal
SpainItaly
PortugalPortugal
ItalyItaly
PortugalPortugalTurkey
ItalyItalySpain
Portugal
Spain
PortugalTurkey
Italy
Turkey
Italy
Portugal
Italy
PortugalPortugalPortugal
Italy
Germany
Spain
Portugal
ItalyAlbania
Portugal
Italy
PortugalTurkey
France
Italy
PortugalTurkey
ItalySpain
GermanyGermany
TurkeyPortugalPortugal
Germany
PortugalPortugalTurkey
FrancePortugalTurkey
Portugal
Italy
PortugalPortugal
ItalyItaly
PortugalTurkeyTurkey
PortugalPortugalPortugalPortugalPortugalPortugal FranceFrance
Austria
SpainItalyItalyItaly
Portugal
GermanyFrancePortugal France
Italy
Portugal
SpainItaly
PortugalPortugalPortugal
Italy
Turkey
Albania
Turkey
Germany
AlbaniaItaly
FrancePortugalPortugalPortugalTurkey
ItalyItalyItaly
Portugal
Italy
PortugalTurkey
Portugal
ItalyItaly
TurkeyTurkey
FrancePortugalPortugal FrancePortugalPortugalPortugalTurkey
Italy
TurkeyTurkey
ItalySpain
ItalyAlbania
TurkeyPortugalPortugalPortugalPortugal
Spain
France
Italy
Portugal
AlbaniaItaly
Spain
Portugal
ItalySpain
PortugalPortugal
Italy
Portugal
ItalySpain
France
Turkey
ItalySpain
Italy
Germany
Italy
Portugal France
Italy
Turkey
Italy
Portugal
Italy
Turkey
ItalyItaly
Portugal
Italy
TurkeyTurkey
Spain
Turkey
Germany
Portugal
Italy
TurkeyPortugal
TurkeyPortugal
Italy
Austria
Germany
TurkeyPortugal
SpainItaly
AlbaniaItaly
TurkeyTurkey
ItalyItalySpain
Turkey
FranceFrance
TurkeyTurkeyTurkey
ItalyItalyItalyItaly
PortugalPortugalPortugal
Austria
GermanyFrancePortugal
Albania
TurkeyTurkeyPortugalPortugalPortugalPortugal
Spain
Turkey
FranceFranceGermany
SpainItaly
PortugalPortugal
ItalyItaly
PortugalPortugal
Germany
PortugalPortugal FranceFrancePortugalPortugalPortugalTurkeyTurkey
Portugal
Italy
PortugalPortugal
ItalyItaly
Turkey
SpainItaly
Austria
Germany
Italy
Portugal France
Turkey
AlbaniaItaly
Turkey
Italy
PortugalPortugal
SpainItaly
FrancePortugalPortugalPortugalPortugal
SpainSpain
TurkeyPortugal
Turkey
Austria
Portugal
Italy
PortugalTurkey
PortugalTurkeyTurkey
Germany
Portugal
Germany
Portugal
Italy
Turkey
Italy
Turkey
SpainAlbaniaItaly
France
Turkey
SpainItalyItaly
Germany
Italy
PortugalPortugal
ItalyItaly
Turkey
Italy
Portugal
Germany
Italy
Portugal
ItalyItalySpain
TurkeyTurkeyTurkeyTurkey
Italy
PortugalPortugal
ItalyItalyItalySpain
PortugalTurkey
Albania SpainItaly
PortugalPortugal France
Italy
PortugalPortugal
Italy
Turkey
SpainItaly
PortugalPortugal
Italy
Portugal
Italy
Portugal France
Spain
PortugalTurkey
Portugal
Italy
Turkey
France
AlbaniaItaly
Germany
ItalyItaly
PortugalPortugalTurkey
PortugalPortugal
Germany
Turkey
SpainSpainItalyItaly
PortugalPortugal
Italy
TurkeyPortugal
AlbaniaItaly
FrancePortugal
Italy
Turkey
Italy
PortugalTurkey
SpainItaly
PortugalPortugal
ItalyItaly
Turkey
Albania
Turkey
Italy
Portugal
AlbaniaItaly
Portugal FrancePortugalTurkeyTurkey
Italy
PortugalPortugal
Germany
Italy
TurkeyPortugal France
Turkey
Spain
Portugal
Italy
Portugal
Italy
TurkeyPortugal France
Italy
Portugal
Italy
TurkeyPortugal
Turkey
Italy
Germany
Portugal
ItalyItalyItaly
PortugalPortugal FrancePortugal
Spain
PortugalPortugal
Spain
PortugalTurkey
Portugal
SpainItaly
Portugal
Albania Spain
Germany
PortugalTurkey
PortugalTurkey
GermanyGermany
ItalyItaly
PortugalPortugal
GermanyFrance
Italy
Portugal
Italy
Turkey
FranceGermany
Portugal
ItalySpain
TurkeyPortugalPortugal France
Turkey
FrancePortugal
ItalyItalyItaly
PortugalTurkeyTurkey
Spain
Portugal
Italy
Portugal France
ItalyItaly
Portugal
SpainItaly
Portugal
Italy
PortugalPortugal
Italy
Turkey
ItalyItaly
Austria
Italy
TurkeyPortugalPortugal
Italy
TurkeyTurkey
Italy
France
Turkey
Albania
Portugal
Italy
Portugal
Albania
TurkeyPortugal
Italy
TurkeyTurkey
ItalyItalyItalySpain
Italy
Portugal
Italy
Germany
TurkeyPortugal
Italy
Portugal France
Italy
Turkey
Italy
Turkey
Austria
France
Albania Spain
Turkey
Italy
Austria
France
ItalyItaly
TurkeyPortugalPortugalPortugal
TurkeyTurkeyPortugal
TurkeyPortugalPortugal
Germany
Italy
France
ItalyItaly
Portugal France
Austria
Turkey
France
SpainSpainAlbania
TurkeyPortugal
Albania
Turkey
Austria
Italy
Germany
PortugalTurkey
Spain
Portugal
Germany
Portugal
ItalyItaly
Turkey
Albania
France
Turkey
ItalySpain
TurkeyTurkeyTurkey
Italy
Portugal
Italy
France
SpainItalyItaly
Portugal
SpainSpain
Turkey
SpainSpain
Turkey
Germany
AlbaniaItalyItaly
PortugalPortugal
Germany
Italy
Turkey
Germany
PortugalPortugal FranceFrance
ItalyItaly
France
Turkey
Austria
GermanyFrancePortugal
ChinaChina
PakistanPakistanPakistan
China
Bangladesh
PakistanPakistan
China
PakistanPakistan
China
Pakistan
India
PakistanPakistanPakistan
China
Bangladesh
PakistanPakistanPakistanPakistanPakistanPakistan
ChinaChina
Pakistan
Bangladesh
PakistanPakistanPakistanPakistanPakistanPakistan
China
Pakistan
China
Bangladesh
PakistanPakistanPakistanPakistanPakistan
China
Pakistan
ChinaChinaChinaIndia ChinaChinaChina
Pakistan
India
Pakistan
Bangladesh
China
PakistanPakistanPakistan
ChinaIndiaIndia
BangladeshBangladesh
China
-100
-50
05
0
Gap
in M
ath
Sco
re
.55 .6 .65 .7 .75 .8GGI
Uruguay
BoliviaBoliviaBoliviaBoliviaBoliviaBoliviaBoliviaBoliviaBoliviaBolivia
Paraguay
Bolivia
ParaguayParaguay
Bolivia
Uruguay
Chile
Paraguay
Chile
Bolivia
Paraguay
BoliviaBolivia
Paraguay
Bolivia
Paraguay
Bolivia
Uruguay
ParaguayParaguay
BoliviaBoliviaBolivia
Chile
Paraguay
Chile
BoliviaBoliviaBoliviaBoliviaBoliviaBoliviaBolivia
ParaguayParaguay
Bolivia
Chile
BoliviaBoliviaBolivia
Paraguay
BoliviaBoliviaBoliviaBoliviaBoliviaBoliviaBoliviaBoliviaBoliviaBoliviaBolivia
Paraguay
BoliviaBoliviaBoliviaBolivia
ParaguayParaguayParaguayParaguay
BoliviaBolivia
ParaguayParaguay
BoliviaBoliviaBoliviaBoliviaBoliviaBoliviaBolivia
ParaguayParaguayParaguay
BoliviaBolivia
Paraguay
Bolivia
Chile
ParaguayParaguay
BoliviaBoliviaBoliviaBoliviaBoliviaBolivia
Uruguay
BoliviaBoliviaBolivia
Uruguay
Bolivia
Paraguay
Bolivia
ParaguayParaguayParaguay
Bolivia
Chile
Uruguay
BoliviaBolivia
ChileChile
Paraguay
BoliviaBoliviaBolivia
UruguayUruguayUruguayUruguay
Paraguay
Uruguay
BoliviaBoliviaBoliviaBoliviaBolivia
Uruguay
Paraguay
BoliviaBolivia
ParaguayParaguayParaguay
Chile
Bolivia
ChileChile
BoliviaBolivia
UruguayUruguay
Bolivia
ParaguayParaguay
BoliviaBoliviaBoliviaBoliviaBolivia
Chile
BoliviaBoliviaBoliviaBolivia
ParaguayParaguay
Bolivia
Chile
BoliviaBoliviaBoliviaBolivia
Chile
Paraguay
Chile
ParaguayParaguayParaguay
Uruguay
ParaguayParaguayParaguay
Bolivia
ChileChile
Paraguay
Chile
Paraguay
Chile
Paraguay
Bolivia
Paraguay
BoliviaBoliviaBoliviaBoliviaBolivia
Uruguay
Bolivia
Chile
Uruguay
BoliviaBoliviaBoliviaBolivia
Paraguay
BoliviaBolivia
Paraguay
BoliviaBolivia
Paraguay
Bolivia
Chile
Bolivia
ParaguayParaguay
Bolivia
Paraguay
BoliviaBolivia
Paraguay
BoliviaBolivia
Paraguay
Bolivia
Paraguay
Chile
Bolivia
Paraguay
BoliviaBoliviaBolivia
Chile
BoliviaBoliviaBolivia
ParaguayParaguay
New Zealand
Korea
ChinaChina
Phillipines
New Zealand
IndiaUnited Kingdom
Viet Nam
Phillipines
United Kingdom
Viet Nam
Phillipines
United KingdomIndiaUnited KingdomUnited Kingdom
Viet Nam
Malaysia
ChinaChina
Viet NamSouth Africa
New Zealand
ChinaChina United Kingdom
PhillipinesPhillipines
Viet Nam
Greece
Viet Nam
Phillipines
New ZealandViet Nam
Phillipines
New Zealand
United KingdomUnited Kingdom
Viet Nam
China
New ZealandViet Nam
New Zealand
China
Phillipines
United KingdomChina United KingdomUnited KingdomUnited Kingdom
Phillipines
ItalyItaly
Phillipines
United KingdomUnited KingdomUnited KingdomChina
New Zealand
United Kingdom
New ZealandViet Nam
Phillipines
United KingdomUnited KingdomUnited KingdomUnited Kingdom
Malaysia
China
New Zealand
United Kingdom
New ZealandViet Nam
Phillipines
Malaysia
United Kingdom
Malaysia
New Zealand
United Kingdom
New Zealand
South AfricaPhillipines
United Kingdom
Viet Nam
United Kingdom
Phillipines
United Kingdom
Malaysia
Viet NamViet NamViet Nam
United States
United Kingdom
Viet Nam
MalaysiaMalaysiaMalaysia
Phillipines
MalaysiaMalaysia
Phillipines
United Kingdom
New Zealand
Italy
Phillipines
United Kingdom
New Zealand
Italy United KingdomUnited Kingdom
Viet Nam
Phillipines
United KingdomUnited Kingdom
New ZealandNew Zealand
India
Phillipines
United KingdomChina
Viet Nam
ChinaChinaChina
Viet NamNew Zealand
Italy United KingdomUnited Kingdom
United StatesGreece
India
Viet Nam
IndiaIndia
New Zealand
Phillipines
China
Viet Nam
India
United States
Phillipines
United KingdomUnited KingdomUnited Kingdom
South Africa
New ZealandNew Zealand
United KingdomChina
New Zealand
Netherlands
New Zealand
Netherlands
Viet Nam
IndiaChina IndiaUnited Kingdom
Greece
United Kingdom
Korea
Phillipines
China United KingdomUnited Kingdom
New Zealand
Malaysia
China
New ZealandNew ZealandNew Zealand
Phillipines
New ZealandNew ZealandNew Zealand
United KingdomUnited KingdomChina
New ZealandNew Zealand
United KingdomIndia
New Zealand
United Kingdom
New Zealand
United Kingdom
New Zealand
ChinaChina
New ZealandNew Zealand
United Kingdom
New Zealand
United KingdomChina
New Zealand
China
New Zealand
United Kingdom
New Zealand
United KingdomUnited Kingdom
New ZealandNew ZealandNew ZealandNew Zealand
United KingdomUnited Kingdom
Viet NamNew Zealand
United Kingdom
New Zealand
India
New ZealandNew ZealandNew Zealand
United KingdomUnited KingdomUnited Kingdom
New ZealandNew ZealandNew Zealand
China
New Zealand
United KingdomUnited Kingdom
United States
China
New Zealand
United Kingdom
New ZealandNew Zealand
Phillipines
New ZealandNew ZealandNew ZealandNew ZealandNew ZealandNew Zealand
United Kingdom
Phillipines
United KingdomUnited KingdomUnited Kingdom
New Zealand
United Kingdom
New ZealandNew Zealand
China India
New Zealand
ChinaChina
Greece
United KingdomUnited Kingdom
Viet NamNew Zealand
Phillipines
United Kingdom
New ZealandNew Zealand
South Africa
New Zealand
IndiaChina
New Zealand
Phillipines
New Zealand
China
New ZealandNew ZealandViet Nam
Phillipines
New ZealandNew Zealand
United KingdomUnited Kingdom
New ZealandNew Zealand
United States
New ZealandViet Nam
United States
South AfricaPhillipines
New Zealand
Phillipines
New ZealandNew Zealand
IndiaUnited KingdomUnited Kingdom
New Zealand
Italy United Kingdom
Viet NamNew ZealandNew Zealand
IndiaChina
Phillipines
United KingdomUnited Kingdom
New ZealandNew ZealandNew Zealand
Phillipines
New ZealandNew ZealandNew Zealand
Phillipines
United Kingdom
New Zealand
Phillipines
New Zealand
United Kingdom
New ZealandNew ZealandNew ZealandViet Nam
China
New ZealandViet Nam
United Kingdom
New ZealandNew ZealandNew ZealandNew ZealandViet Nam
China
New Zealand
China United KingdomUnited Kingdom
Phillipines
New ZealandNew ZealandNew Zealand
China
Viet Nam
Phillipines
India
Viet Nam
United KingdomUnited KingdomUnited KingdomUnited KingdomUnited KingdomUnited Kingdom
Phillipines
United KingdomChina United Kingdom
Phillipines
United KingdomUnited KingdomChina
Phillipines
India
Viet Nam
United KingdomIndiaUnited KingdomUnited Kingdom
Viet Nam
China Italy United KingdomUnited KingdomChina
New Zealand
United KingdomItalyChina
Malaysia
China United KingdomUnited Kingdom
Phillipines
United Kingdom
South Africa
United KingdomUnited KingdomUnited KingdomChina United Kingdom
Phillipines
United Kingdom
Viet Nam
United Kingdom
New Zealand
Korea
Phillipines
New Zealand
Italy
South AfricaSouth Africa
United KingdomItaly
New Zealand
United KingdomUnited Kingdom
Germany
Phillipines
ChinaChinaChina
Viet Nam
ChinaChina United Kingdom
Viet NamViet Nam
Italy
MalaysiaMalaysia
United Kingdom
Phillipines
China
Phillipines
United KingdomItaly
Phillipines
China
New Zealand
China United KingdomUnited Kingdom
New ZealandViet Nam
ChinaChina United KingdomUnited KingdomIndiaIndiaIndia
New ZealandNew Zealand
United Kingdom
New ZealandNew Zealand
United KingdomUnited KingdomUnited KingdomUnited Kingdom
Phillipines
China
South Africa
New Zealand
China
Korea
Phillipines
United Kingdom
New Zealand
United KingdomUnited Kingdom
KoreaKorea
New Zealand
India
New Zealand
United Kingdom
PhillipinesPhillipines
New ZealandNew Zealand
United KingdomUnited Kingdom
United States
Phillipines
United Kingdom
Korea
Phillipines
Italy
Phillipines
United KingdomIndiaChina
New Zealand
United KingdomUnited Kingdom
Viet NamViet NamNew ZealandNew Zealand
United KingdomItalyChina
Viet NamViet NamSouth AfricaSouth Africa
Malaysia
United KingdomUnited KingdomChina
New Zealand
United KingdomItaly
Viet Nam
IndiaUnited KingdomUnited KingdomIndia
Phillipines
United KingdomChina ItalyItaly United Kingdom
Greece
China
Viet NamNew ZealandNew Zealand
Viet Nam
United Kingdom
Korea
Phillipines
China
Phillipines
United KingdomUnited KingdomIndia
Viet NamViet Nam
ItalyChina IndiaChina
Phillipines
New Zealand
Italy
South Africa
Italy
Viet NamNew Zealand
United Kingdom
New Zealand
Netherlands
Phillipines
New Zealand
United Kingdom
Phillipines
New Zealand
India
New ZealandNew Zealand
United Kingdom
Viet Nam
United Kingdom
Phillipines
United KingdomIndia
Greece
United KingdomUnited KingdomChina
Viet Nam
United KingdomUnited KingdomUnited KingdomItalyItaly United Kingdom
South Africa
New Zealand
India
New Zealand
China
Viet Nam
United KingdomChina United KingdomUnited KingdomIndia
Phillipines
United KingdomChina
New Zealand
IndiaUnited Kingdom
South Africa
China
Korea
United KingdomUnited KingdomUnited Kingdom
New Zealand
China United KingdomUnited KingdomUnited Kingdom
New Zealand
United Kingdom
Phillipines
United KingdomUnited KingdomChina
Viet Nam
ChinaChina
New Zealand
United KingdomItalyChinaChina United Kingdom
New ZealandNew ZealandViet NamViet Nam
United Kingdom
New Zealand
United States
South Africa
China
New Zealand
China United KingdomItaly IndiaItalyItaly United KingdomItalyChina India
Viet Nam
Italy
Malaysia
United KingdomIndiaUnited Kingdom
Viet NamNew Zealand
China Italy IndiaItaly United KingdomItaly
New Zealand
IndiaChina
New Zealand
China
Phillipines
Italy
Phillipines
Italy
Viet NamNew Zealand
South Africa
New Zealand
Phillipines
Viet Nam
United Kingdom
Phillipines
China
Viet NamNew ZealandNew ZealandNew ZealandNew Zealand
United Kingdom
Phillipines
Viet NamViet Nam
United Kingdom
Viet NamNew Zealand
South AfricaViet Nam
United KingdomChina ItalyItaly
New Zealand
ChinaChina
New Zealand
United Kingdom
United States
New Zealand
Malaysia
Viet Nam
United KingdomUnited Kingdom
Phillipines
China
Phillipines
New Zealand
Phillipines
United Kingdom
Phillipines
China
New ZealandViet Nam
United Kingdom
Phillipines
India
Phillipines
United KingdomItaly
New Zealand
United Kingdom
Phillipines
New Zealand
Greece
United Kingdom
Phillipines
IndiaUnited KingdomChina IndiaUnited KingdomUnited KingdomUnited KingdomUnited KingdomUnited KingdomItaly
New Zealand
Phillipines
Viet Nam
ItalyItaly
Phillipines
United Kingdom
Phillipines
United Kingdom
Malaysia
China Italy
Viet Nam
Greece
Phillipines
New Zealand
ItalyChina IndiaUnited KingdomUnited KingdomChina
New Zealand
United Kingdom
Viet NamNew Zealand
Phillipines
China
New ZealandNew ZealandViet Nam
United Kingdom
New ZealandViet Nam
United Kingdom
New Zealand
South Africa
Italy United Kingdom
Viet Nam
Korea
United KingdomChina India
New Zealand
United KingdomUnited Kingdom
Viet NamViet Nam
China
Phillipines
China
New Zealand
China
Viet Nam
PhillipinesPhillipines
United Kingdom
New Zealand
India
New Zealand
India
Malaysia
Italy
Viet Nam
China
Phillipines
ChinaChina United Kingdom
Viet NamViet Nam
China
Viet Nam
United Kingdom
New ZealandNew Zealand
Greece
United KingdomIndiaUnited KingdomChina IndiaUnited KingdomChinaChina United KingdomItaly
South Africa
India
New Zealand
China IndiaIndia
New Zealand
Greece
United KingdomUnited KingdomUnited Kingdom
Malaysia
United KingdomIndiaIndiaUnited KingdomItalyChinaChina India
Viet Nam
United Kingdom
United States
Germany
IndiaIndiaIndia
Viet NamNew Zealand
China
Phillipines
India
New Zealand
India
Phillipines
Italy India
Phillipines
IndiaChina
Malaysia
IndiaChina United KingdomIndia
Phillipines
IndiaIndia
Phillipines
IndiaChina
United States
IndiaUnited KingdomIndiaChina India
Viet Nam
United KingdomChina
Greece
China
GermanyNew Zealand
United Kingdom
Greece
United Kingdom
Viet Nam
United KingdomIndiaChina
New Zealand
Greece
United KingdomUnited Kingdom
Greece
United Kingdom
Greece
Viet Nam Germany
United Kingdom
Germany
India
New Zealand
United Kingdom
GermanyNew Zealand
United Kingdom
New Zealand
China IndiaChina
Germany
ChinaChina India
New ZealandGermany
China Italy
Viet Nam
United Kingdom
New Zealand
ChinaChina
New Zealand
China United KingdomUnited KingdomUnited Kingdom
PhillipinesPhillipines
China
New Zealand
United Kingdom
Phillipines
IndiaUnited KingdomUnited KingdomUnited Kingdom
PhillipinesSouth Africa
United Kingdom
New Zealand
Phillipines
United KingdomUnited KingdomChina Italy United KingdomItalyItaly
Viet Nam
United KingdomChina India
New ZealandViet Nam
United Kingdom
Viet NamNew ZealandNew ZealandNew Zealand
Italy
New ZealandNew Zealand
Italy
GreeceGreece
United Kingdom
Malaysia
United KingdomChina
United States
United Kingdom
Phillipines
Italy United Kingdom
New Zealand
China
Viet Nam
Phillipines
United KingdomChina
Phillipines
United Kingdom
Korea
New Zealand
United KingdomChina
Phillipines
New ZealandViet Nam
PhillipinesPhillipinesPhillipines
United Kingdom
PhillipinesPhillipinesPhillipinesPhillipines
China
Viet Nam
Phillipines
New Zealand
United Kingdom
Viet NamViet Nam
United Kingdom
South AfricaPhillipinesPhillipinesPhillipinesPhillipinesPhillipines
South AfricaPhillipinesPhillipines
United Kingdom
Netherlands
United KingdomChina United KingdomUnited KingdomUnited Kingdom
South Africa
IndiaUnited KingdomUnited Kingdom
New Zealand
United Kingdom
Phillipines
ChinaChina
Greece
Phillipines
United Kingdom
Viet Nam
United Kingdom
Viet Nam
United KingdomUnited KingdomUnited KingdomUnited Kingdom
Viet Nam
United KingdomUnited Kingdom
New Zealand
Phillipines
United Kingdom
New Zealand
India
Phillipines
New Zealand
Greece
China United Kingdom
New Zealand
China
Viet Nam
United KingdomUnited Kingdom
Phillipines
Germany
Phillipines
United Kingdom
Greece
United KingdomUnited Kingdom
New Zealand
China United Kingdom
Korea
United KingdomUnited KingdomChina United Kingdom
Viet Nam
China United Kingdom
Phillipines
United KingdomUnited Kingdom
PhillipinesPhillipines
IndiaUnited KingdomUnited KingdomChinaChina United Kingdom
Phillipines
United KingdomUnited Kingdom
Phillipines
United Kingdom
New Zealand
United Kingdom
Viet NamViet Nam
China
New Zealand
United Kingdom
New Zealand
Malaysia
China India
Viet Nam
Greece
IndiaUnited KingdomChina United KingdomUnited KingdomUnited Kingdom
Viet NamViet Nam
United KingdomUnited KingdomUnited KingdomUnited KingdomUnited KingdomUnited KingdomIndia
New Zealand
Korea
United KingdomUnited KingdomUnited Kingdom
South Africa
New Zealand
United KingdomUnited KingdomChina
Phillipines
New Zealand
United Kingdom
Viet Nam
United KingdomChina United KingdomUnited Kingdom
South AfricaViet Nam
United KingdomUnited Kingdom
Malaysia
China United KingdomChina United Kingdom
New Zealand
United Kingdom
Korea
Viet Nam
United KingdomChina
United States
IndiaUnited Kingdom
New Zealand
United Kingdom
Malaysia
Phillipines
Italy United KingdomUnited Kingdom
New Zealand
United Kingdom
Phillipines
Viet NamNew Zealand
United Kingdom
PhillipinesPhillipines
Viet Nam
Phillipines
New Zealand
United KingdomChina
New Zealand
Phillipines
New Zealand
United Kingdom
New ZealandNew Zealand
South Africa
United KingdomChina
New Zealand
United Kingdom
Phillipines
Viet Nam
PhillipinesSouth Africa
China
Viet Nam
United KingdomUnited KingdomUnited KingdomChina
New ZealandViet Nam
New Zealand
United Kingdom
Viet Nam
Phillipines
United Kingdom
Greece
ChinaChina
Viet Nam
Korea
China
United States
ChinaChina United Kingdom
PhillipinesPhillipines
United KingdomIndiaChina
PhillipinesPhillipines
Korea
Phillipines
Viet NamViet Nam
China
Viet NamViet Nam
United KingdomUnited Kingdom
New Zealand
Greece
Phillipines
Greece
Phillipines
China United KingdomUnited Kingdom
Phillipines
China
Viet Nam
IndiaChinaChinaChinaChina United KingdomChina IndiaChina
PhillipinesPhillipines
United KingdomChina
Phillipines
United KingdomUnited KingdomUnited Kingdom
Viet Nam
United KingdomUnited KingdomUnited KingdomChina
Viet Nam
ChinaChina
Viet Nam
China United Kingdom
New Zealand
United Kingdom
Phillipines
Viet Nam
United Kingdom
Phillipines
United KingdomUnited KingdomChina United KingdomChina United KingdomIndia
Phillipines
China
Korea
United KingdomUnited Kingdom
Netherlands
Viet Nam
United KingdomChina
Phillipines
Viet Nam
China
New ZealandNew ZealandViet Nam
United Kingdom
United States
United Kingdom
Phillipines
United KingdomChina
Phillipines
Greece
Phillipines
Viet Nam
United KingdomUnited KingdomUnited Kingdom
United States
United KingdomChina IndiaUnited KingdomChina
Viet NamViet NamViet Nam
United Kingdom
New ZealandViet Nam
China
Phillipines
China
New ZealandViet Nam
United Kingdom
South Africa
Italy IndiaIndia
New Zealand
Phillipines
Viet Nam
United Kingdom
New ZealandNew Zealand
China India
New Zealand
China
New ZealandViet NamViet Nam
ItalyChina United Kingdom
Germany
United KingdomUnited KingdomIndia
Phillipines
India
Greece
India
Netherlands
China
South Africa
New Zealand
China
Viet NamNew Zealand
United States
South AfricaPhillipines
New Zealand
United KingdomUnited KingdomChina United KingdomUnited Kingdom
Viet Nam
Phillipines
China United KingdomChina
New ZealandViet Nam
New Zealand
Greece
Viet NamNew ZealandNew Zealand
United KingdomUnited KingdomChina IndiaChina United KingdomChina Italy
New ZealandViet Nam
China Italy United KingdomChina
South Africa
United Kingdom
Viet NamViet Nam
United KingdomUnited KingdomItalyChinaChinaChina India
New Zealand
Phillipines
New Zealand
United Kingdom
Phillipines
United States
New Zealand
Phillipines
Korea
United KingdomUnited Kingdom
New Zealand
United KingdomUnited KingdomUnited Kingdom
Viet Nam
China
New ZealandViet Nam
United Kingdom
Phillipines
New ZealandViet Nam
China United Kingdom
Viet Nam
ChinaChina United Kingdom
New Zealand
United KingdomIndia
Korea
China
Viet Nam
China United Kingdom
Phillipines
ItalyChina United Kingdom
New Zealand
China
Korea
United Kingdom
Phillipines
ChinaChina United Kingdom
Phillipines
New Zealand
United KingdomIndia
New ZealandViet Nam
Phillipines
Greece
Phillipines
United KingdomUnited KingdomIndia
Viet Nam
United KingdomUnited KingdomUnited Kingdom
Viet Nam
China United Kingdom
Phillipines
ChinaChina
Viet Nam
ChinaChina
Viet NamNew Zealand
United States
New ZealandNew Zealand
United KingdomUnited KingdomUnited KingdomUnited Kingdom
Viet NamViet Nam
United KingdomChina United KingdomIndia
Greece
United Kingdom
Viet Nam
United KingdomChina
Viet NamViet Nam
China
Phillipines
New Zealand
United KingdomUnited KingdomIndiaUnited KingdomUnited Kingdom
New Zealand
India
New Zealand
South Africa
United Kingdom
Viet Nam
IndiaItalyChina United Kingdom
Phillipines
ChinaChina
New Zealand
Phillipines
IndiaItalyChina India
Greece
United Kingdom
New Zealand
Phillipines
China
Viet Nam
United KingdomUnited Kingdom
New Zealand
United KingdomIndiaIndia
Phillipines
United States
China India
New Zealand
United Kingdom
New Zealand
United Kingdom
United StatesGreece
United KingdomChina United KingdomChina IndiaItaly India
Korea
New ZealandViet Nam
United KingdomIndiaUnited Kingdom
Viet Nam
IndiaUnited Kingdom
Phillipines
United Kingdom
Malaysia
United Kingdom
Malaysia
China
New Zealand
United Kingdom
Korea
Viet NamViet Nam
Malaysia
New Zealand
ItalyChina United Kingdom
Phillipines
Viet Nam
United Kingdom
PhillipinesPhillipines
United Kingdom
New Zealand
United Kingdom
New Zealand
United Kingdom
Netherlands
China
Viet NamNew Zealand
ItalyItaly United KingdomUnited Kingdom
Phillipines
India
New Zealand
Phillipines
United Kingdom
Viet Nam
United KingdomUnited Kingdom
Viet Nam
China United KingdomUnited KingdomIndia
Germany
Phillipines
United Kingdom
Phillipines
New ZealandViet Nam
United KingdomUnited Kingdom
Phillipines
China
New Zealand
United States
United Kingdom
Viet NamNew Zealand
Viet Nam
ChinaChina
Viet Nam
China
Phillipines
United KingdomUnited KingdomUnited KingdomUnited KingdomUnited Kingdom
New Zealand
Phillipines
United KingdomChina United Kingdom
United States
United Kingdom
Phillipines
Greece
Viet Nam
United KingdomIndia
South Africa
New Zealand
United KingdomUnited KingdomChina
Viet Nam
China
Phillipines
United KingdomChina United Kingdom
Netherlands
China
Phillipines
New Zealand
IndiaUnited KingdomUnited Kingdom
Korea
Viet NamNew Zealand
United Kingdom
New ZealandNew Zealand
United Kingdom
Greece
New Zealand
United KingdomUnited KingdomUnited Kingdom
Phillipines
IndiaUnited KingdomUnited Kingdom
Viet NamNew Zealand
Phillipines
New Zealand
United States
New Zealand
China United Kingdom
New Zealand
United KingdomUnited KingdomChina United Kingdom
PhillipinesPhillipines
Viet NamSouth Africa
ChinaChina Italy United KingdomIndiaIndiaChina
New Zealand
United States
United Kingdom
Phillipines
United Kingdom
South Africa
ChinaChina
Greece
United KingdomChina
Phillipines
United Kingdom
Viet NamViet NamViet NamViet NamViet NamViet NamViet Nam
United Kingdom
Viet Nam
China
Viet NamViet Nam
Phillipines
China
Viet NamViet NamViet Nam
United Kingdom
New ZealandNew ZealandViet NamViet NamViet NamViet NamViet Nam
China
Phillipines
China
Viet NamViet Nam
United Kingdom
Viet Nam
Netherlands
Phillipines
ChinaChina
Viet Nam
United Kingdom
New ZealandViet NamViet Nam
India
Phillipines
New Zealand
United States
United KingdomUnited KingdomChina
Viet Nam
United Kingdom
Viet Nam
China
Viet NamViet Nam
United States
Viet Nam
United Kingdom
Viet NamNew Zealand
Viet NamViet Nam
IndiaUnited Kingdom
Viet Nam
United Kingdom
Viet NamViet Nam
Netherlands
United Kingdom
Viet Nam
Greece
New Zealand
India
Viet NamViet NamViet Nam
United Kingdom
Viet Nam
United KingdomUnited Kingdom
Viet Nam
United Kingdom
GermanyViet NamNew Zealand
United KingdomUnited Kingdom
Viet Nam
China United KingdomChina United Kingdom
New Zealand
IndiaChina
New Zealand
United KingdomUnited KingdomUnited KingdomChina United KingdomItaly
Viet Nam
United KingdomUnited Kingdom
Korea
China IndiaUnited Kingdom
New ZealandViet Nam
China India
Phillipines
China
New Zealand
China
South Africa
United Kingdom
South Africa
United KingdomChina
South Africa
China
South AfricaPhillipines
India
Viet Nam
United KingdomChina United Kingdom
Viet NamSouth Africa
Greece
China
South AfricaSouth AfricaSouth Africa
New Zealand
United Kingdom
New ZealandViet Nam
South Africa
China
Phillipines
China United KingdomUnited KingdomUnited KingdomChina
Germany
Phillipines
United Kingdom
Greece
New ZealandViet Nam
United Kingdom
South Africa
United KingdomUnited Kingdom
Viet Nam
United KingdomUnited Kingdom
New Zealand
United KingdomChina United Kingdom
Viet Nam
ChinaChina
New Zealand
United Kingdom
Korea
Viet Nam GermanyViet Nam
China United KingdomUnited KingdomChinaChinaChina United Kingdom
Viet NamViet Nam
United KingdomChinaChina United Kingdom
Viet NamNew ZealandNew ZealandNew Zealand
Korea
United Kingdom
Viet NamNew Zealand
United KingdomChina United Kingdom
Greece
United KingdomUnited KingdomUnited KingdomUnited KingdomItalyChina
Germany
United Kingdom
Viet NamNew Zealand
Phillipines
China
New ZealandNew ZealandNew ZealandViet Nam
New ZealandNew Zealand
South Africa
India
New Zealand
China
New Zealand
United KingdomUnited Kingdom
New ZealandNew Zealand
United Kingdom
New ZealandViet Nam
New ZealandViet Nam
China
Viet Nam
United KingdomUnited Kingdom
Malaysia
New Zealand
United Kingdom
Viet NamNew Zealand
United States
New ZealandNew Zealand
Greece
IndiaUnited Kingdom
Viet Nam
United Kingdom
Viet Nam
China India
Netherlands
China
Phillipines
Viet Nam
China
South AfricaViet Nam
New Zealand
China
Phillipines
New Zealand
South Africa
New Zealand
India
New Zealand
United Kingdom
Viet Nam
Phillipines
China
Phillipines
Viet Nam
Korea
United KingdomChina United Kingdom
Phillipines
New Zealand
ChinaChina United Kingdom
PhillipinesPhillipines
IndiaUnited Kingdom
Phillipines
India
Viet NamNew Zealand
United KingdomChina
New Zealand
Italy IndiaUnited KingdomIndiaUnited KingdomChina United KingdomUnited KingdomChinaChina
Phillipines
United KingdomChinaChina
Malaysia
China
South Africa
United Kingdom
Phillipines
Italy
Viet Nam
China United KingdomUnited KingdomChina Italy United Kingdom
South Africa
New Zealand
Phillipines
China
Phillipines
China
Greece
New Zealand
India
New ZealandViet Nam
China
Viet Nam
United KingdomChinaChina
Phillipines
China United KingdomItalyChina United KingdomUnited KingdomChina
Viet Nam
Malaysia
Viet NamNew ZealandNew Zealand
United KingdomUnited KingdomChinaChinaChina United KingdomUnited KingdomUnited Kingdom
Phillipines
China
Viet Nam
PhillipinesPhillipines
United KingdomUnited KingdomChina United KingdomChina
Viet Nam
China India
Viet Nam
United KingdomUnited Kingdom
New Zealand
China United KingdomUnited KingdomIndiaUnited Kingdom
Viet Nam
India
Phillipines
United KingdomUnited Kingdom
Viet Nam
United KingdomUnited KingdomItaly
Viet NamNew Zealand
PhillipinesPhillipines
Viet Nam
China United KingdomChina United Kingdom
New ZealandGermany
United KingdomUnited KingdomIndia
New Zealand
United Kingdom
New Zealand
United Kingdom
Korea
China
New ZealandNew Zealand
China United Kingdom
New Zealand
China India
New Zealand
China
Viet Nam
China United Kingdom
Viet Nam
China United KingdomUnited KingdomChinaChinaChina United KingdomUnited KingdomChinaChina Italy United Kingdom
Phillipines
Viet Nam
Phillipines
New Zealand
Phillipines
New Zealand
United KingdomIndiaChinaChina ItalyChina United KingdomUnited KingdomChina
New Zealand
China
Viet NamViet Nam
ChinaChina
Viet Nam
United KingdomUnited KingdomUnited Kingdom
New Zealand
United Kingdom
Viet Nam
Phillipines
New Zealand
ChinaChina
Viet Nam
Phillipines
United Kingdom
New ZealandViet Nam
IndiaUnited Kingdom
Phillipines
United Kingdom
Malaysia
New Zealand
China United KingdomUnited KingdomChinaChina
Phillipines
China
Germany
United KingdomUnited Kingdom
New ZealandViet Nam
China United KingdomUnited Kingdom
New ZealandNew Zealand
ChinaChina Italy United Kingdom
Germany
China
Phillipines
Greece
New Zealand
United KingdomChina IndiaIndia
Viet NamNew Zealand
China
Viet Nam
United KingdomUnited KingdomChina India
Viet Nam
China
South Africa
United KingdomUnited KingdomChina
Viet Nam
China IndiaItalyChina
Viet Nam
ChinaChina
New Zealand
Korea
China
New Zealand
Phillipines
ChinaChinaChina Italy
Viet Nam
Korea
Viet NamViet NamSouth Africa
United KingdomChina
Viet Nam
United Kingdom
Viet Nam
United Kingdom
New Zealand
China
New Zealand
ChinaChina
New Zealand
India
New ZealandViet Nam
India
South Africa
United Kingdom
Malaysia
Italy United KingdomIndia
Phillipines
New ZealandNew Zealand
Italy United Kingdom
Viet Nam
ChinaChina ItalyChina
New ZealandNew Zealand
ChinaChinaChina
Viet Nam
ChinaChina United Kingdom
Germany
China United KingdomChinaChina United KingdomUnited KingdomChina United Kingdom
Phillipines
India
Malaysia
United KingdomIndiaIndiaChina
Viet Nam
United States
ChinaChina
PhillipinesPhillipinesSouth Africa
China
Phillipines
United KingdomChina Italy
New Zealand
United Kingdom
Viet Nam
India
New ZealandNew Zealand
Greece
New Zealand
United KingdomUnited KingdomChinaChina
Phillipines
Greece
PhillipinesSouth Africa
United KingdomUnited KingdomUnited Kingdom
Viet NamViet Nam
China United KingdomChina
New Zealand
United KingdomChinaChina IndiaChina India
Greece
United Kingdom
Phillipines
IndiaChina India
Germany
ItalyChinaChina United Kingdom
Viet Nam
United KingdomChina United Kingdom
Viet Nam
China
Viet Nam
Italy
PhillipinesSouth Africa
Viet Nam
ItalyChina
South Africa
China
South Africa
Italy United KingdomChina United Kingdom
Netherlands
China
Phillipines
India
South Africa
China United KingdomChinaChinaChinaChina United KingdomChina United KingdomChina
New ZealandNew Zealand
China
Germany
Greece
ChinaChina
Korea
United Kingdom
South Africa
New Zealand
China
Phillipines
China
Greece
United KingdomIndiaUnited Kingdom
Viet Nam
United KingdomItaly
New ZealandNew Zealand
IndiaUnited KingdomIndiaUnited KingdomChina
Viet Nam
China
New Zealand
United KingdomChina
Viet Nam
China
Turkey
Croatia
China
TurkeyTurkeyTurkey
Croatia
TurkeyTurkey
Romania
TurkeyTurkeyTurkeyTurkey
Germany
TurkeyTurkeyTurkey
Croatia
TurkeyTurkeyTurkey
Macedonia
Turkey
Germany
TurkeyTurkeyTurkeyTurkey
Romania
TurkeyTurkey
Germany
Turkey
Poland
TurkeyTurkey
Romania
Turkey
Poland
Turkey
CroatiaRomania Croatia
Turkey
Poland
HungaryTurkeyTurkeyTurkey
Poland
TurkeyTurkeyTurkeyTurkeyTurkeyTurkey
Croatia
TurkeyTurkeyTurkeyTurkey
Croatia
TurkeyTurkeyTurkeyTurkey
Germany
Romania
TurkeyTurkeyTurkeyTurkeyTurkeyTurkey
Romania
Germany
Romania
Turkey
Poland
Turkey
Poland
Turkey
Macedonia
Turkey
Croatia
Turkey
Poland
Turkey
Macedonia
Turkey
Croatia
Turkey
Germany
Turkey
Germany
Croatia
TurkeyTurkey
Croatia
TurkeyTurkey
Poland
Turkey
Croatia
Poland
TurkeyTurkey
Germany
CroatiaCroatiaRomania Croatia
TurkeyTurkeyTurkey
Germany
Romania
Turkey
Croatia
Poland
TurkeyTurkey
Croatia
TurkeyTurkeyTurkeyTurkey
Croatia
TurkeyTurkeyTurkeyTurkeyTurkeyTurkey
Romania
TurkeyTurkey
Romania
TurkeyTurkeyTurkey
CroatiaCroatiaRomaniaAlbania
TurkeyTurkeyTurkeyTurkey
Romania
TurkeyTurkeyTurkeyTurkey
Poland
Slovenia
Germany
Slovakia
TurkeyTurkeyTurkeyTurkeyTurkeyTurkeyTurkeyTurkey Hungary
Germany
TurkeyTurkeyTurkeyTurkeyTurkey
Romania
TurkeyTurkey
Croatia
Turkey
Croatia
Germany
TurkeyTurkeyTurkeyTurkeyTurkey
MacedoniaMacedonia
Poland
TurkeyTurkeyTurkey
Romania
TurkeyTurkey
Romania
TurkeyTurkeyTurkeyTurkeyTurkeyTurkey
Croatia
Turkey
Germany
Croatia
TurkeyTurkeyTurkeyTurkeyTurkeyTurkeyTurkeyTurkey
Romania
TurkeyTurkeyTurkeyTurkey
Germany
TurkeyTurkeyTurkey
Croatia
Germany
TurkeyTurkey
Croatia
Turkey
Poland
Macedonia
Poland
TurkeyTurkeyTurkeyTurkey
Romania CroatiaRomania Croatia
Germany
TurkeyTurkeyTurkey
Poland
Croatia
Turkey
Romania
Turkey
Croatia
Germany
Turkey
Germany
RomaniaRomania CroatiaCroatia
Slovenia
TurkeyTurkey
Poland
TurkeyTurkeyTurkeyTurkey
Croatia
TurkeyTurkey
Croatia
Poland
HungaryTurkeyTurkey HungaryTurkeyTurkey
Croatia
Slovenia
Turkey
Romania
Turkey
Croatia
TurkeyTurkey
Poland
TurkeyTurkeyTurkey
Macedonia
Turkey
Romania
TurkeyTurkeyTurkeyTurkeyTurkey
Romania
TurkeyTurkeyTurkeyTurkeyTurkeyTurkeyTurkey
Croatia
TurkeyTurkeyTurkeyTurkey HungaryTurkeyTurkeyTurkeyTurkeyTurkeyTurkeyTurkey
Poland
Croatia
TurkeyTurkey
Poland
Turkey
Poland
TurkeyTurkeyTurkey Hungary
Croatia
TurkeyTurkey
Croatia
TurkeyTurkeyTurkeyTurkeyTurkey
Romania
Turkey
RomaniaRomania
TurkeyTurkeyTurkeyTurkeyTurkey
Croatia
Poland
TurkeyTurkey
Croatia
TurkeyTurkey
Romania
TurkeyTurkey
Romania
TurkeyTurkeyTurkeyTurkeyTurkeyTurkey
Macedonia
Poland
Turkey
Romania
Turkey
Germany
Poland
TurkeyTurkeyTurkey
Croatia
Turkey
Germany
TurkeyTurkey
Germany
TurkeyTurkeyTurkeyTurkeyTurkey
Albania
Macedonia
Romania
Turkey
Romania
Germany
Russian Fed.TurkeyTurkey
Poland
Croatia
Turkey
Germany
TurkeyTurkeyTurkeyTurkeyTurkeyTurkeyTurkeyTurkey
Romania
TurkeyTurkeyTurkeyTurkeyTurkey
RomaniaRomania
TurkeyTurkeyTurkeyTurkeyTurkeyTurkeyTurkeyTurkeyTurkeyTurkey
Romania
TurkeyTurkeyTurkey
CroatiaCroatia
TurkeyTurkey
Poland
TurkeyTurkeyTurkeyTurkey
Romania
Poland
TurkeyTurkeyTurkey
Poland
TurkeyTurkey
Croatia
TurkeyTurkeyTurkeyTurkey
Romania
Poland
TurkeyTurkeyTurkeyTurkeyTurkeyTurkey
Poland
TurkeyTurkeyTurkeyTurkey
Croatia
TurkeyTurkey
Germany
Turkey
Romania
TurkeyTurkeyTurkeyTurkeyTurkeyTurkeyTurkeyTurkeyTurkeyTurkeyTurkey
Germany
Macedonia
TurkeyTurkey
Croatia
TurkeyTurkeyTurkeyTurkeyTurkeyTurkeyTurkey
Romania
Turkey
Romania
TurkeyTurkeyTurkeyTurkeyTurkeyTurkey
Macedonia
Turkey
RomaniaRomania
Turkey
Croatia
Slovenia
TurkeyTurkeyTurkeyRussian Fed.
Macedonia
TurkeyTurkeyTurkeyTurkeyTurkeyTurkey
Croatia
Turkey
Slovakia
Romania
TurkeyTurkeyTurkeyTurkeyTurkey
Romania
TurkeyTurkeyTurkeyTurkeyTurkeyTurkeyTurkey
Croatia
TurkeyTurkeyTurkeyTurkeyTurkeyTurkeyTurkey
Germany
Romania
TurkeyTurkeyTurkey
Macedonia
CroatiaCroatia
TurkeyTurkey
Croatia
TurkeyTurkeyTurkey
Romania
Germany
TurkeyTurkeyTurkeyTurkeyTurkey
Macedonia
Croatia
Turkey
Poland
Croatia
Macedonia
Croatia
Poland
TurkeyTurkeyTurkey
Romania
TurkeyTurkey
Germany
Poland
TurkeyTurkeyTurkeyTurkey
Germany
Turkey
Romania
TurkeyTurkey
Croatia
Germany
TurkeyTurkeyTurkey
Slovenia
TurkeyRussian Fed.TurkeyTurkey
Macedonia
TurkeyTurkeyTurkeyTurkeyTurkey
Germany
TurkeyTurkey
Macedonia
Romania
Turkey
Romania CroatiaCroatia
Turkey
Poland
CroatiaCroatia
TurkeyTurkey
Romania
Poland
TurkeyTurkeyTurkeyTurkey
Croatia
TurkeyTurkey
Poland
TurkeyTurkeyTurkeyTurkeyTurkeyTurkeyTurkey
Macedonia
Turkey
Slovenia
Poland
Romania
TurkeyTurkeyTurkeyTurkeyTurkey
CroatiaCroatia
TurkeyTurkeyTurkey
Poland
TurkeyTurkey
Germany
Turkey
Poland
Turkey
Albania
TurkeyTurkeyTurkeyTurkeyTurkeyTurkey
Croatia
Germany
TurkeyTurkey
CroatiaRomania
TurkeyTurkey
Macedonia
Germany
CroatiaRomania
Poland
Turkey
Croatia
HungaryTurkeyTurkeyTurkeyTurkey
Croatia
TurkeyTurkeyTurkeyTurkeyTurkeyTurkeyTurkeyTurkeyTurkey
PolandAlbania
TurkeyTurkey
Croatia
Macedonia
Turkey
PolandPoland
TurkeyTurkeyTurkeyTurkey
Germany
Croatia
TurkeyTurkeyTurkeyTurkeyTurkey
Germany
TurkeyTurkeyTurkeyTurkeyTurkeyTurkeyTurkeyTurkeyTurkeyTurkey
Germany
TurkeyTurkey
Slovakia
Turkey
Croatia
TurkeyTurkeyTurkeyTurkeyTurkey
Romania
Turkey
Poland
TurkeyTurkey
China
Croatia
TurkeyTurkey
CroatiaCroatia
Turkey
Germany
TurkeyTurkeyTurkeyTurkeyTurkeyTurkeyTurkeyTurkeyTurkeyTurkey
Poland
TurkeyTurkeyTurkeyTurkeyTurkeyTurkeyTurkeyTurkey
PolandPoland
Turkey
Romania
TurkeyTurkey
Germany
TurkeyTurkeyTurkey
France
TurkeyTurkey
France
TurkeyTurkeyTurkeyTurkeyTurkeyTurkeyTurkeyTurkey
France
TurkeyTurkey
France
Netherlands
Turkey
France
TurkeyTurkey
France
Turkey
Netherlands
TurkeyTurkeyTurkeyTurkeyTurkeyTurkey
France
TurkeyTurkey
France
Turkey
France
Turkey
Netherlands
TurkeyTurkeyTurkeyTurkey
Netherlands
Turkey
Netherlands
TurkeyTurkey
FranceFrance
TurkeyTurkeyTurkey
Netherlands
France
Turkey
France
Turkey
France
TurkeyTurkeyTurkeyTurkeyTurkeyTurkeyTurkey
France
TurkeyTurkeyTurkeyTurkey
GermanyFrance
Turkey
France
Netherlands
Turkey
Germany
Turkey
France
TurkeyTurkeyTurkeyTurkeyTurkeyTurkeyTurkeyTurkey
France
Turkey
Germany
TurkeyTurkeyTurkey
Netherlands
Turkey
Netherlands
TurkeyTurkey
Netherlands
France
Netherlands
TurkeyTurkeyTurkeyTurkeyTurkeyTurkeyTurkeyTurkey
France
TurkeyTurkeyTurkeyTurkeyTurkey
France
Netherlands
Turkey
France
TurkeyTurkeyTurkey
NetherlandsNetherlands
TurkeyTurkeyTurkeyTurkeyTurkeyTurkeyTurkeyTurkeyTurkeyTurkey
Netherlands
Turkey
Netherlands
TurkeyTurkeyTurkeyTurkey
Germany
TurkeyTurkeyTurkey
France
Netherlands
TurkeyTurkeyTurkey
France
TurkeyTurkey
France
TurkeyTurkey
Netherlands
Turkey
Netherlands
Turkey
Germany
TurkeyTurkeyTurkeyTurkeyTurkeyTurkeyTurkeyTurkeyTurkey
Germany
TurkeyTurkey
Netherlands
Turkey
FranceFrance
TurkeyTurkeyTurkeyTurkeyTurkeyTurkey
FranceFrance
Turkey
Netherlands
TurkeyTurkeyTurkey
Germany
Turkey
Germany
TurkeyTurkey
FranceFrance
TurkeyTurkeyTurkey
Germany
Turkey
France
Netherlands
Turkey
Netherlands
TurkeyTurkeyTurkeyTurkey
France
Turkey
Germany
Turkey
France
TurkeyTurkeyTurkey
France
Turkey
France
Turkey
France
TurkeyTurkeyTurkeyTurkey
France
TurkeyTurkey
France
TurkeyTurkey
France
TurkeyTurkeyTurkeyTurkeyTurkey
France
TurkeyTurkeyTurkeyTurkeyTurkeyTurkeyTurkeyTurkeyTurkey
France
TurkeyTurkeyTurkey
France
TurkeyTurkeyTurkeyTurkeyTurkeyTurkey
Netherlands
TurkeyTurkeyTurkeyTurkeyTurkeyTurkey
France
TurkeyTurkeyTurkeyTurkeyTurkeyTurkey
NetherlandsNetherlands
Turkey
Germany
TurkeyTurkeyTurkeyTurkey
Netherlands
Germany
Turkey
France
TurkeyTurkey
Germany
TurkeyTurkeyTurkey
Germany
Turkey
FranceFranceFrance
TurkeyTurkey
France
TurkeyTurkeyTurkeyTurkey
FranceFranceGermany
TurkeyTurkeyTurkeyTurkeyTurkeyTurkeyTurkey
France
Turkey
Netherlands
FranceFrance
TurkeyTurkeyTurkeyTurkeyTurkeyTurkeyTurkeyTurkeyTurkeyTurkeyTurkey
France
TurkeyTurkeyTurkeyTurkeyTurkeyTurkeyTurkeyTurkeyTurkeyTurkey
FranceFranceFrance
Turkey
France
TurkeyTurkeyTurkeyTurkeyTurkey
France
TurkeyTurkeyTurkeyTurkey
FranceFrance
Netherlands
TurkeyTurkeyTurkey
France
TurkeyTurkeyTurkeyTurkeyTurkeyTurkey
France
TurkeyTurkey
Germany
Netherlands
Germany
Netherlands
TurkeyTurkey
France
TurkeyTurkey
Germany
Turkey
France
Turkey
Germany
TurkeyTurkey
Germany
TurkeyTurkey
Netherlands
Germany
TurkeyTurkey
Netherlands
TurkeyTurkeyTurkeyTurkeyTurkeyTurkey
France
Netherlands
FranceGermany
TurkeyTurkeyTurkey
Germany
Turkey
Germany
TurkeyTurkey
GermanyGermany
NetherlandsNetherlands
France
TurkeyTurkeyTurkeyTurkeyTurkeyTurkeyTurkeyTurkeyTurkeyTurkey
Netherlands
TurkeyTurkeyTurkeyTurkeyTurkeyTurkeyTurkey
France
Netherlands
France
TurkeyTurkeyTurkeyTurkeyTurkeyTurkeyTurkeyTurkeyTurkeyTurkey
FranceFranceFrance
TurkeyTurkeyTurkeyTurkeyTurkeyTurkey
FranceFrance
TurkeyTurkeyTurkey
Netherlands
TurkeyTurkeyTurkey
Netherlands
TurkeyTurkeyTurkeyTurkey
Germany
Turkey
France
Turkey
FranceGermany
TurkeyTurkeyTurkeyTurkey
Germany
Turkey
Germany
TurkeyTurkeyTurkey
France
Turkey
France
TurkeyTurkeyTurkeyTurkeyTurkeyTurkey
Netherlands
France
TurkeyTurkeyTurkeyTurkeyTurkey
Germany
TurkeyTurkey
Netherlands
TurkeyTurkeyTurkeyTurkey
France
TurkeyTurkeyTurkeyTurkeyTurkeyTurkey
Netherlands
France
TurkeyTurkey
Germany
Turkey
GermanyGermanyFrance
TurkeyTurkeyTurkeyTurkeyTurkeyTurkeyTurkeyTurkey
FranceFrance
Turkey
France
Turkey
France
Turkey
France
Turkey
France
Turkey
France
Turkey
Netherlands
TurkeyTurkeyTurkey
Netherlands
TurkeyTurkey
France
TurkeyTurkeyTurkeyTurkeyTurkeyTurkey
Germany
TurkeyTurkeyTurkeyTurkey
Germany
TurkeyTurkey
FranceFrance
TurkeyTurkeyTurkeyTurkeyTurkeyTurkeyTurkeyTurkeyTurkey
Netherlands
Germany
Netherlands
Turkey
France
TurkeyTurkeyTurkeyTurkeyTurkey
Germany
Netherlands
Turkey
Netherlands
Turkey
France
TurkeyTurkeyTurkey
Germany
Turkey
Germany
TurkeyTurkeyTurkeyTurkey
France
TurkeyTurkeyTurkey
FranceFranceFrance
TurkeyTurkeyTurkeyTurkeyTurkey
Netherlands
TurkeyTurkeyTurkeyTurkey
France
Slovakia
Viet Nam
SlovakiaSlovakiaSlovakia
Viet NamViet Nam
Slovakia
Viet NamViet NamViet Nam
Slovakia
Viet Nam
China
Viet NamViet Nam
Slovakia
Viet NamViet Nam
Slovakia
Viet NamViet NamViet Nam
SlovakiaSlovakiaSlovakia
Viet NamViet Nam
Russian Fed.
Viet NamViet NamViet Nam
Slovakia
Russian Fed.
SlovakiaSlovakiaSlovakia
Viet NamViet NamViet Nam
Slovakia
Viet Nam
Slovakia
Viet NamViet NamViet Nam
Slovakia
Viet Nam
Slovakia
Viet Nam
SlovakiaSlovakiaSlovakia
Viet Nam
Slovakia
Russian Fed.
Viet Nam
Russian Fed.
Viet Nam
China
Viet NamViet Nam
Russian Fed.
Slovakia
Viet Nam
Slovakia
Viet Nam
Slovakia
Viet NamViet NamViet Nam
Slovakia
Viet NamViet NamViet Nam
Russian Fed.
SlovakiaSlovakiaSlovakiaSlovakiaSlovakiaSlovakiaSlovakiaSlovakiaSlovakia
China
Slovakia
Viet NamViet Nam
Slovakia
Viet Nam
Slovakia
Viet NamViet NamViet Nam
Slovakia
Russian Fed.
SlovakiaSlovakia
Viet NamViet Nam
Russian Fed.
Slovakia
Viet NamViet NamViet NamViet Nam
SlovakiaSlovakia
Russian Fed.
SlovakiaSlovakiaSlovakia
Viet NamViet Nam
China
SlovakiaSlovakia
Viet Nam
China
Slovakia
Viet NamViet Nam
SlovakiaSlovakia
Viet NamViet Nam
SlovakiaSlovakiaSlovakia
Viet Nam
Slovakia
Viet Nam
Slovakia
Viet Nam
SlovakiaSlovakia
Viet Nam
Slovakia
Viet Nam
SlovakiaSlovakia
Viet Nam
SlovakiaSlovakia
Viet NamViet Nam
SlovakiaSlovakia
Russian Fed.Russian Fed.
Estonia
TurkeyRussian Fed.Russian Fed.
Estonia
China
Russian Fed.Turkey
Sweden
Russian Fed.
China
Russian Fed.Russian Fed.Russian Fed.Russian Fed.Russian Fed.Russian Fed.
EstoniaEstonia
Russian Fed.Russian Fed.Russian Fed.Russian Fed.
Estonia
China
Estonia
Russian Fed.
Sweden
Estonia
Russian Fed.
Estonia
Russian Fed.Russian Fed.Russian Fed.
EstoniaEstonia
Russian Fed.
EstoniaEstoniaEstoniaEstoniaEstonia
ChinaChina
Russian Fed.
Estonia
Russian Fed.Turkey
EstoniaEstonia
Sweden
Russian Fed.Russian Fed.Turkey
Sweden
Estonia
TurkeyRussian Fed.Russian Fed.Russian Fed.Russian Fed.Russian Fed.Russian Fed.Russian Fed.TurkeyTurkey
Russian Fed.Russian Fed.
Estonia
Russian Fed.Turkey
EstoniaEstoniaEstonia
Russian Fed.Russian Fed.
Sweden
EstoniaEstonia
Russian Fed.Turkey
Estonia
Russian Fed.
China
Russian Fed.Russian Fed.Russian Fed.Russian Fed.Turkey
Estonia
Russian Fed.Russian Fed.
Estonia
Russian Fed.Turkey
EstoniaEstonia
China
Russian Fed.Russian Fed.
Estonia
Russian Fed.Russian Fed.Russian Fed.Russian Fed.Russian Fed.Russian Fed.Russian Fed.
Sweden
Russian Fed.Turkey
Estonia
Russian Fed.Russian Fed.Russian Fed.Russian Fed.
Sweden
Estonia
ChinaChina
TurkeyRussian Fed.Russian Fed.Russian Fed.Russian Fed.Russian Fed.
Sweden
Turkey
Estonia
China
Russian Fed.Russian Fed.Russian Fed.Russian Fed.
Estonia
Russian Fed.Russian Fed.
Estonia
Russian Fed.
Estonia
Russian Fed.TurkeyTurkey
Russian Fed.Russian Fed.
EstoniaEstoniaEstoniaEstonia
China
Turkey
EstoniaEstonia
Sweden
Estonia
Russian Fed.Russian Fed.
EstoniaEstonia
TurkeyRussian Fed.
EstoniaEstonia
Russian Fed.Turkey
Estonia
Russian Fed.Turkey
Russian Fed.
China
Turkey
Estonia
Russian Fed.
Estonia
Russian Fed.
EstoniaEstonia
Russian Fed.Russian Fed.Russian Fed.Russian Fed.
EstoniaEstonia
Russian Fed.
China
Russian Fed.Russian Fed.Russian Fed.Russian Fed.Russian Fed.Russian Fed.Russian Fed.Russian Fed.Russian Fed.
United States
Russian Fed.Russian Fed.
United States
Russian Fed.Russian Fed.
Ethiopia
United States
Ethiopia
United StatesUnited States
Russian Fed.Russian Fed.
Ethiopia
United States
Russian Fed.
Ethiopia
United States
Russian Fed.Russian Fed.Russian Fed.Russian Fed.Russian Fed.Russian Fed.
Ethiopia
Russian Fed.
Ethiopia
Russian Fed.
Ethiopia
Russian Fed.
United States
Russian Fed.
EthiopiaEthiopiaEthiopia
Russian Fed.Russian Fed.Russian Fed.Russian Fed.
United States
Russian Fed.Russian Fed.Russian Fed.Russian Fed.
United States
Ethiopia
Russian Fed.Russian Fed.
Ethiopia
Russian Fed.
Ethiopia
Russian Fed.Russian Fed.Russian Fed.
France
Russian Fed.
Ethiopia
Russian Fed.Russian Fed.
France
Russian Fed.Russian Fed.
United StatesUnited States
Russian Fed.
United States
France
Russian Fed.Russian Fed.Russian Fed.
EthiopiaFrance
Russian Fed.
France
Russian Fed.Russian Fed.Russian Fed.
United States
Russian Fed.Russian Fed.Russian Fed.Russian Fed.Russian Fed.Russian Fed.Russian Fed.Russian Fed.
Ethiopia
Russian Fed.
Ethiopia
Russian Fed.Russian Fed.Russian Fed.
France
United States
Russian Fed.
United States
Russian Fed.Russian Fed.
France
Russian Fed.Russian Fed.
Ethiopia
Russian Fed.
Ethiopia
Russian Fed.
France
United States
Russian Fed.
United States
Russian Fed.
France
Russian Fed.Russian Fed.Russian Fed.
United States
Russian Fed.Russian Fed.Russian Fed.Russian Fed.Russian Fed.Russian Fed.Russian Fed.Russian Fed.
France
United States
Ethiopia
Russian Fed.
Ethiopia
United States
Russian Fed.
Ethiopia
Russian Fed.Russian Fed.
France
Russian Fed.Russian Fed.
United States
Russian Fed.
United States
Russian Fed.
United States
Russian Fed.
EthiopiaEthiopia
Russian Fed.Russian Fed.
United StatesUnited States
Russian Fed.
United StatesUnited States
Russian Fed.
EthiopiaEthiopia
United States
France
Russian Fed.Russian Fed.
France
Russian Fed.Russian Fed.
United StatesUnited States
Russian Fed.Russian Fed.
United States
France
United States
Russian Fed.Russian Fed.Russian Fed.Russian Fed.
United States
Russian Fed.Russian Fed.
France
Russian Fed.
France
United States
Russian Fed.
United States
Russian Fed.Russian Fed.
United States
France
United States
Russian Fed.
Ethiopia
Russian Fed.Russian Fed.Russian Fed.
United States
France
Russian Fed.Russian Fed.
EthiopiaEthiopia
United StatesUnited States
Russian Fed.
France
Russian Fed.Russian Fed.
United States
Russian Fed.Russian Fed.Russian Fed.
Ethiopia
Russian Fed.
Ethiopia
Russian Fed.Russian Fed.
Ethiopia
Russian Fed.Russian Fed.Russian Fed.
United States
France
United States
Russian Fed.
EthiopiaFrance
Russian Fed.Russian Fed.Russian Fed.Russian Fed.
Ethiopia
Russian Fed.Russian Fed.Russian Fed.Russian Fed.Russian Fed.Russian Fed.Russian Fed.Russian Fed.Russian Fed.
Ethiopia
Russian Fed.Russian Fed.Russian Fed.Russian Fed.Russian Fed.Russian Fed.Russian Fed.Russian Fed.Russian Fed.Russian Fed.Russian Fed.Russian Fed.Russian Fed.
United States
France
Russian Fed.Russian Fed.
Ethiopia
Russian Fed.Russian Fed.
United States
Russian Fed.
United States
France
Russian Fed.
FranceFranceFrance
Russian Fed.Russian Fed.Russian Fed.
Ethiopia
Russian Fed.
Ethiopia
Russian Fed.Russian Fed.
France
Russian Fed.Russian Fed.
Ethiopia
Russian Fed.Russian Fed.Russian Fed.
Ethiopia
Russian Fed.
France
Russian Fed.Russian Fed.Russian Fed.Russian Fed.Russian Fed.Russian Fed.
France
Russian Fed.
EthiopiaEthiopiaFrance
Russian Fed.Russian Fed.
FranceEthiopia
Russian Fed.Russian Fed.Russian Fed.Russian Fed.
EthiopiaEthiopia
Russian Fed.
France
Russian Fed.
France
Russian Fed.
EthiopiaEthiopia
United States
France
Russian Fed.Russian Fed.
Ethiopia
Russian Fed.
EthiopiaFrance
Russian Fed.Russian Fed.Russian Fed.Russian Fed.Russian Fed.Russian Fed.
France
Russian Fed.Russian Fed.Russian Fed.Russian Fed.Russian Fed.Russian Fed.Russian Fed.Russian Fed.Russian Fed.
EthiopiaEthiopiaEthiopia
Russian Fed.Russian Fed.
Ethiopia
Russian Fed.
Ethiopia
Russian Fed.
Ethiopia
Russian Fed.
United States
Russian Fed.Russian Fed.Russian Fed.Russian Fed.
Ethiopia
Russian Fed.
FranceFrance
Russian Fed.
EthiopiaFrance
Russian Fed.
EthiopiaFrance
United States
Russian Fed.
France
United States
Ethiopia
Russian Fed.Russian Fed.Russian Fed.Russian Fed.
Ethiopia
Russian Fed.Russian Fed.Russian Fed.Russian Fed.Russian Fed.Russian Fed.
EthiopiaEthiopiaEthiopia
Russian Fed.Russian Fed.Russian Fed.
EthiopiaFrance
Russian Fed.Russian Fed.Russian Fed.Russian Fed.Russian Fed.
United States
Russian Fed.Russian Fed.Russian Fed.
EthiopiaEthiopia
Russian Fed.Russian Fed.
United States
Ethiopia
Russian Fed.Russian Fed.Russian Fed.Russian Fed.Russian Fed.
United States
FranceEthiopia
Russian Fed.Russian Fed.Russian Fed.Russian Fed.
Ethiopia
Russian Fed.
Ethiopia
Russian Fed.
Ethiopia
Russian Fed.
EthiopiaEthiopiaEthiopia
Russian Fed.
Ethiopia
Russian Fed.
Ethiopia
Russian Fed.Russian Fed.
Ethiopia
Russian Fed.
EthiopiaEthiopia
Russian Fed.Russian Fed.
United States
Russian Fed.
Ethiopia
Russian Fed.Russian Fed.Russian Fed.
FranceEthiopiaEthiopia
Russian Fed.
United States
Russian Fed.Russian Fed.Russian Fed.Russian Fed.Russian Fed.Russian Fed.
EthiopiaEthiopia
Russian Fed.
Ethiopia
Russian Fed.
Ethiopia
United States
Russian Fed.Russian Fed.Russian Fed.
Ethiopia
Russian Fed.
Ethiopia
Russian Fed.
EthiopiaEthiopia
United States
EthiopiaEthiopiaEthiopiaFrance
Russian Fed.
United States
Ethiopia
Russian Fed.Russian Fed.Russian Fed.Russian Fed.
EthiopiaFrance
Russian Fed.
France
Russian Fed.Russian Fed.
Ethiopia
Russian Fed.Russian Fed.Russian Fed.
Ethiopia
Russian Fed.Russian Fed.
Ethiopia
Russian Fed.Russian Fed.
Ethiopia
Russian Fed.Russian Fed.
Ethiopia
Russian Fed.Russian Fed.
EthiopiaEthiopia
Russian Fed.Russian Fed.
Ethiopia
Russian Fed.
United States
EthiopiaEthiopiaFrance
Russian Fed.Russian Fed.
Ethiopia
Russian Fed.Russian Fed.
Ethiopia
Russian Fed.Russian Fed.
Ethiopia
Russian Fed.Russian Fed.Russian Fed.Russian Fed.Russian Fed.Russian Fed.Russian Fed.Russian Fed.Russian Fed.Russian Fed.Russian Fed.
FranceEthiopia
Russian Fed.
United States
Russian Fed.Russian Fed.Russian Fed.Russian Fed.
EthiopiaFrance
Russian Fed.
FranceFrance
Russian Fed.
United States
Russian Fed.Russian Fed.Russian Fed.
Ethiopia
Russian Fed.Russian Fed.
France
Russian Fed.Russian Fed.Russian Fed.
Ethiopia
Russian Fed.
United States
Russian Fed.
Ethiopia
Russian Fed.Russian Fed.
France
Russian Fed.
France
Russian Fed.Russian Fed.Russian Fed.Russian Fed.Russian Fed.
France
Russian Fed.Russian Fed.Russian Fed.Russian Fed.
Ethiopia
Russian Fed.Russian Fed.Russian Fed.Russian Fed.
United States
Ethiopia
Russian Fed.Russian Fed.Russian Fed.
Ethiopia
United States
Russian Fed.
Ethiopia
Russian Fed.
United StatesUnited States
Russian Fed.
United States
Russian Fed.Russian Fed.
EthiopiaEthiopia
Russian Fed.Russian Fed.
FranceEthiopia
United States
Russian Fed.
France
Russian Fed.Russian Fed.
United States
Russian Fed.
FranceEthiopia
Russian Fed.Russian Fed.Russian Fed.Russian Fed.Russian Fed.Russian Fed.
Ethiopia
Russian Fed.Russian Fed.Russian Fed.Russian Fed.
Ethiopia
Russian Fed.Russian Fed.Russian Fed.Russian Fed.Russian Fed.Russian Fed.Russian Fed.Russian Fed.
United States
Russian Fed.Russian Fed.Russian Fed.
France
Russian Fed.
FranceFrance
Russian Fed.Russian Fed.Russian Fed.
France
Russian Fed.
Ethiopia
Russian Fed.Russian Fed.Russian Fed.Russian Fed.
United StatesUnited States
Russian Fed.Russian Fed.Russian Fed.Russian Fed.Russian Fed.Russian Fed.
Ethiopia
Russian Fed.Russian Fed.Russian Fed.Russian Fed.Russian Fed.Russian Fed.Russian Fed.Russian Fed.Russian Fed.Russian Fed.
United States
Russian Fed.Russian Fed.
Ethiopia
Russian Fed.Russian Fed.Russian Fed.
Ethiopia
United States
Ethiopia
Russian Fed.Russian Fed.Russian Fed.
United States
Russian Fed.
Ethiopia
Russian Fed.Russian Fed.Russian Fed.Russian Fed.Russian Fed.
France
Russian Fed.Russian Fed.Russian Fed.Russian Fed.Russian Fed.Russian Fed.Russian Fed.Russian Fed.Russian Fed.Russian Fed.Russian Fed.Russian Fed.Russian Fed.Russian Fed.Russian Fed.Russian Fed.Russian Fed.Russian Fed.Russian Fed.Russian Fed.Russian Fed.Russian Fed.Russian Fed.Russian Fed.Russian Fed.Russian Fed.
Ethiopia
Russian Fed.Russian Fed.Russian Fed.Russian Fed.Russian Fed.Russian Fed.
Ethiopia
Russian Fed.Russian Fed.Russian Fed.
Ethiopia
United States
Russian Fed.
EthiopiaEthiopia
Russian Fed.
United States
Russian Fed.
France
United States
EthiopiaEthiopia
Russian Fed.Russian Fed.
Ethiopia
United States
Russian Fed.
France
Russian Fed.
United States
EthiopiaEthiopia
Russian Fed.
Ethiopia
Russian Fed.Russian Fed.Russian Fed.Russian Fed.Russian Fed.Russian Fed.
FranceEthiopiaEthiopia
Russian Fed.Russian Fed.Russian Fed.Russian Fed.
Ethiopia
Russian Fed.
Ethiopia
Russian Fed.
EthiopiaEthiopia
Russian Fed.Russian Fed.Russian Fed.
Ethiopia
Russian Fed.
Ethiopia
Russian Fed.
United States
EthiopiaEthiopia
Russian Fed.
EthiopiaPortugal
Belgium
PortugalPortugal
Italy
PortugalPortugal FranceFrancePortugal
Italy
PortugalPortugalPortugalPortugalPortugalPortugalPortugalPortugalPortugalPortugalPortugalPortugalPortugalPortugalPortugal
Belgium
PortugalPortugalPortugalPortugalPortugalPortugalPortugalPortugalPortugalPortugalPortugalPortugal FrancePortugalPortugalPortugalPortugal
BelgiumBelgium
GermanyFrancePortugalPortugalPortugalPortugalPortugalPortugal FrancePortugalPortugal FrancePortugalPortugalPortugalPortugalPortugalPortugalPortugalPortugal
Germany
PortugalPortugalPortugalPortugal FrancePortugalPortugal FranceFranceFrance
Belgium
PortugalPortugal
Belgium
PortugalPortugalPortugalPortugal
Belgium
Italy
Belgium
Portugal
Italy
PortugalPortugalPortugalPortugal FrancePortugal FrancePortugalPortugalPortugalPortugalPortugal
Italy
FrancePortugal
Italy
PortugalPortugal
Italy
PortugalPortugalPortugalPortugalPortugal
Italy
PortugalPortugalPortugalPortugalPortugalPortugal
Italy
PortugalPortugalPortugalPortugal
Germany
PortugalPortugalPortugalPortugalPortugalPortugal FrancePortugalPortugalPortugalPortugalPortugalPortugal
Italy
Belgium
PortugalPortugalPortugal
Italy
PortugalPortugalPortugalPortugal FrancePortugalPortugalPortugal
Italy
Portugal
Italy
PortugalPortugalPortugalPortugalPortugalPortugal
Italy
PortugalPortugalPortugalPortugalPortugalPortugal
Belgium
PortugalPortugalPortugalPortugalPortugalPortugalPortugal
Germany
Belgium
Portugal
Germany
PortugalPortugalPortugalPortugal
Belgium
FranceFrancePortugalPortugalPortugalPortugalPortugalPortugalPortugal
Italy
PortugalPortugalPortugalPortugal
Italy
PortugalPortugalPortugalPortugalPortugal
Belgium
PortugalPortugalPortugalPortugal
Germany
PortugalPortugal
Germany
Italy
Belgium
FrancePortugal
Germany
PortugalPortugal
Italy
Belgium
PortugalPortugal FranceFrancePortugal
Belgium
Portugal
Italy
PortugalPortugal
Belgium
FrancePortugal France
Italy
PortugalPortugal
Germany
Portugal FrancePortugal
Italy
Belgium
Portugal
Italy
PortugalPortugalPortugalPortugalPortugal
Belgium
PortugalPortugal FrancePortugalPortugalPortugalPortugal
Belgium
Italy
PortugalPortugalPortugal
Belgium
PortugalPortugalPortugalPortugalPortugalPortugalPortugalPortugalPortugalPortugalPortugalPortugalPortugal
Italy
PortugalPortugalPortugal FrancePortugalPortugalPortugalPortugal
Italy
PortugalPortugalPortugalPortugalPortugal FrancePortugal
Italy
PortugalPortugal
Germany
Portugal FrancePortugalPortugal
Italy
Portugal FrancePortugalPortugalPortugalPortugalPortugalPortugalPortugalPortugalPortugalPortugal FranceFrance
Belgium
Italy
Portugal
Belgium
ItalyItaly
Germany
PortugalPortugalPortugal
Italy
PortugalPortugalPortugal FrancePortugal
Belgium
Italy
FrancePortugalPortugal
Belgium
Portugal
Germany
PortugalPortugal
Belgium
Portugal
Italy
PortugalPortugalPortugalPortugalPortugal
Italy
PortugalPortugalPortugalPortugal
ItalyItaly
Portugal
Belgium
PortugalPortugal FrancePortugalPortugalPortugalPortugalPortugalPortugalPortugal
Belgium
PortugalPortugalPortugalPortugalPortugalPortugalPortugalPortugalPortugalPortugalPortugalPortugalPortugal
Italy
Belgium
PortugalPortugalPortugal
Germany
PortugalPortugalPortugalPortugalPortugal FrancePortugalPortugalPortugalPortugalPortugalPortugal
Italy
Portugal
Italy
PortugalPortugalPortugalPortugalPortugalPortugalPortugalPortugalPortugalPortugal FrancePortugalPortugal
Belgium
FrancePortugalPortugalPortugalPortugalPortugalPortugal
Italy
PortugalPortugal
Italy
PortugalPortugalPortugalPortugalPortugalPortugalPortugalPortugalPortugalPortugalPortugal
Italy
Portugal
Belgium
PortugalPortugalPortugalPortugal
Germany
PortugalPortugalPortugalPortugalPortugal
BelgiumBelgium
PortugalPortugalPortugalPortugalPortugalPortugalPortugal
Italy
PortugalPortugalPortugalPortugalPortugalPortugalPortugal FrancePortugalPortugal FrancePortugalPortugalPortugal FrancePortugalPortugalPortugalPortugalPortugalPortugalPortugalPortugalPortugalPortugalPortugal
ItalyItaly
PortugalPortugal
Italy
Germany
PortugalPortugalPortugalPortugalPortugal
Belgium
PortugalPortugalPortugalPortugalPortugalPortugalPortugalPortugal
Belgium
PortugalPortugalPortugalPortugalPortugalPortugalPortugalPortugalPortugalPortugalPortugalPortugalPortugalPortugalPortugalPortugal France
United Kingdom
PortugalPortugalPortugalPortugalPortugalPortugal FrancePortugal
Belgium
United Kingdom
PortugalPortugalPortugalPortugalPortugal
Germany
PortugalPortugalPortugalPortugalPortugalPortugalPortugalPortugalPortugalPortugalPortugalPortugal
Germany
PortugalPortugal
Italy
PortugalPortugalPortugalPortugalPortugalPortugalPortugalPortugalPortugalPortugalPortugalPortugalPortugal
Italy
PortugalPortugal FrancePortugalPortugalPortugalPortugal
Italy
PortugalPortugalPortugal FrancePortugalPortugalPortugal
Germany
PortugalPortugalPortugal FranceFrancePortugal FrancePortugalPortugalPortugalPortugal FrancePortugal
Belgium
Portugal
Germany
PortugalPortugalPortugal
Germany
Portugal
Italy
FrancePortugalPortugalPortugal
Belgium
Italy
PortugalPortugalPortugalPortugalPortugalPortugalPortugal
Belgium
Portugal
Germany
PortugalPortugalPortugalPortugalPortugal
Germany
Portugal
Belgium
Portugal
Belgium
Portugal FrancePortugalPortugal FrancePortugalPortugalPortugalPortugalPortugalPortugal
Italy
PortugalPortugalPortugalPortugalPortugal FranceFranceFrancePortugal FrancePortugalPortugalPortugal
Italy
PortugalPortugal France
Italy
Portugal
Germany
PortugalPortugalPortugalPortugalPortugalPortugalPortugal
Germany
Portugal
GermanyFrancePortugal
Germany
PortugalPortugalPortugal FranceGermany
Portugal
Italy
PortugalPortugalPortugal
Belgium
Germany
PortugalPortugal
Germany
PortugalPortugalPortugalPortugal
Germany
Belgium
GermanyFrancePortugal France
Germany
Italy
PortugalPortugalPortugalPortugalPortugalPortugal
Belgium
PortugalPortugalPortugal FranceGermany
Portugal
Germany
Portugal
GermanyGermany
PortugalPortugalPortugalPortugal
Italy
PortugalPortugal
Germany
PortugalPortugalPortugalPortugalPortugalPortugalPortugal
Germany
PortugalPortugal
Belgium
FrancePortugalPortugal
Italy
Portugal
Germany
Belgium
Germany
Belgium
PortugalPortugal
Germany
PortugalPortugalPortugalPortugal France
ItalyItaly
PortugalPortugalPortugalPortugalPortugal
Germany
Italy
Portugal
Germany
PortugalPortugalPortugalPortugal
Germany
PortugalPortugal
Germany
PortugalPortugal FrancePortugalPortugalPortugal France
Belgium
FrancePortugalPortugalPortugal FrancePortugalPortugalPortugalPortugalPortugalPortugalPortugalPortugalPortugalPortugalPortugalPortugalPortugalPortugalPortugal
Belgium
PortugalPortugalPortugalPortugal
GermanyFranceFrancePortugalPortugalPortugal
Italy
FrancePortugalPortugalPortugalPortugalPortugal
Italy
PortugalPortugalPortugalPortugal
ItalyItalyItaly
PortugalPortugal
Italy
PortugalPortugalPortugal FrancePortugalPortugal
Belgium
PortugalPortugal
Belgium
PortugalPortugal France
Belgium
FrancePortugalPortugalPortugalPortugal France
Italy
France
Italy
PortugalPortugalPortugal
Italy
PortugalPortugal
Germany
Belgium
Portugal FrancePortugal
Germany
Portugal
Italy
PortugalPortugalPortugalPortugalPortugal
Italy
FrancePortugalPortugalPortugalPortugalPortugal France
Italy
Portugal FranceFrancePortugalPortugalPortugal FrancePortugal FrancePortugal
Italy
FrancePortugal
Belgium
PortugalPortugal
Italy
PortugalPortugalPortugalPortugalPortugalPortugalPortugal
Belgium
PortugalPortugalPortugalPortugal FrancePortugalPortugal FrancePortugal
Italy
Belgium
PortugalPortugal France
Italy
FrancePortugalPortugal
ItalyItaly
Portugal FranceFrancePortugal
Belgium
France
Italy
PortugalPortugalPortugal
ItalyItaly
Portugal FrancePortugalPortugalPortugalPortugalPortugalPortugalPortugalPortugal
Germany
Italy
Portugal FranceFrancePortugal
ItalyItaly
PortugalPortugal
Belgium
PortugalPortugalPortugal FrancePortugalPortugal FrancePortugal FrancePortugalPortugalPortugal
Germany
Portugal
Italy
France
Belgium
PortugalPortugalPortugal France
Italy
Germany
Belgium
Italy
PortugalPortugal
Italy
Portugal
Italy
Portugal FrancePortugal
ItalyItalyItaly
Portugal FrancePortugalPortugalPortugalPortugalPortugal
Italy
PortugalPortugal France
Italy
Portugal France
Italy
Belgium
PortugalPortugalPortugalPortugalPortugalPortugalPortugalPortugalPortugal
Italy
Portugal
Belgium
Portugal FrancePortugalPortugal
Italy
PortugalPortugal
Belgium
PortugalPortugalPortugalPortugal
ItalyItaly
PortugalPortugalPortugalPortugalPortugal
Italy
France
Italy
Portugal
Germany
Italy
Germany
PortugalPortugalPortugalPortugal
Italy
Portugal FrancePortugal
Italy
Belgium
Portugal
ItalyItaly
Portugal
Italy
FranceFrancePortugal
Italy
Germany
Portugal
ItalyItalyItalyItaly
Portugal FrancePortugal
Italy
PortugalPortugal
Italy
PortugalPortugalPortugal
Italy
PortugalPortugalPortugalPortugal
Belgium
Portugal
Italy
PortugalPortugalPortugal
Italy
PortugalPortugalPortugal
Italy
Portugal
Belgium
PortugalPortugalPortugalPortugalPortugalPortugal
Belgium
FrancePortugalPortugalPortugal
Italy
PortugalPortugal
Germany
PortugalPortugal
Italy
PortugalPortugalPortugalPortugalPortugalPortugalPortugal
Italy
FrancePortugalPortugalPortugalPortugalPortugalPortugal
Italy
PortugalPortugal
Italy
PortugalPortugalPortugalPortugalPortugalPortugalPortugalPortugalPortugal
Belgium
Italy
Portugal
Italy
Portugal
Belgium
PortugalPortugal France
Belgium
Portugal
Belgium
PortugalPortugalPortugalPortugalPortugalPortugal
ItalyItaly
PortugalPortugalPortugalPortugalPortugal
ItalyItaly
PortugalPortugal
Italy
FrancePortugalPortugal
ItalyItaly
Portugal
GermanyFrance
Italy
Germany
Portugal
Italy
PortugalPortugalPortugalPortugalPortugal
Italy
Portugal France
Italy
Portugal
Italy
Belgium
PortugalPortugalPortugalPortugalPortugalPortugal
Italy
Portugal
Germany
Italy
Portugal
Belgium
ItalyItaly
Portugal
ItalyItaly
Portugal
Italy
PortugalPortugalPortugalPortugal
Germany
Portugal
Germany
Portugal
Italy
Germany
Portugal FrancePortugal
Italy
PortugalPortugalPortugal
Italy
PortugalPortugalPortugalPortugalPortugalPortugalPortugalPortugal
Belgium
Italy
France
Belgium
PortugalPortugalPortugalPortugal
Germany
PortugalPortugalPortugalPortugalPortugalPortugalPortugal
ItalyItaly
PortugalPortugalPortugalPortugalPortugalPortugalPortugalPortugalPortugalPortugal FrancePortugal France
Belgium
PortugalPortugalPortugal
Italy
Portugal FrancePortugal
Germany
Portugal
Italy
PortugalPortugalPortugalPortugalPortugalPortugal FrancePortugalPortugalPortugalPortugalPortugalPortugalPortugalPortugal
Germany
Portugal FrancePortugalPortugalPortugalPortugalPortugalPortugalPortugalPortugal FranceGermany
Portugal
Italy
Portugal FranceGermany
PortugalPortugalPortugalPortugal
Germany
Portugal
Italy
PortugalPortugalPortugalPortugal FrancePortugal
Germany
PortugalPortugalPortugalPortugalPortugalPortugalPortugal France
Belgium
Portugal FrancePortugalPortugalPortugalPortugalPortugalPortugalPortugal FrancePortugalPortugal
Belgium
PortugalPortugalPortugalPortugal
Belgium
FranceFrancePortugalPortugalPortugal FrancePortugalPortugalPortugalPortugalPortugalPortugal FrancePortugalPortugal
GermanyGermany
Italy
PortugalPortugalPortugal France
Belgium
Portugal
Italy
Belgium
Portugal
GermanyGermany
PortugalPortugal
Italy
FrancePortugalPortugal
Italy
PortugalPortugalPortugalPortugalPortugal
ItalyItaly
PortugalPortugal
Belgium
PortugalPortugalPortugalPortugal
Belgium
Italy
Germany
PortugalPortugalPortugalPortugal
Belgium
PortugalPortugalPortugalPortugalPortugalPortugalPortugalPortugal
Italy
PortugalPortugalPortugalPortugalPortugalPortugalPortugalPortugalPortugalPortugalPortugal FrancePortugalPortugalPortugal
Italy
PortugalPortugalPortugal
BelgiumBelgium
Italy
Portugal
Belgium
Portugal
Belgium
PortugalPortugal
Belgium
PortugalPortugalPortugalPortugalPortugal
Belgium
PortugalPortugal FrancePortugalPortugalPortugal
Italy
PortugalPortugalPortugalPortugalPortugal
Italy United Kingdom
Germany
PortugalPortugalPortugalPortugalPortugalPortugalPortugalPortugal FranceGermany
PortugalPortugal
Belgium
PortugalPortugalPortugalPortugalPortugal
Belgium
PortugalPortugal FranceFrancePortugal
Belgium
Portugal
United Kingdom
PortugalPortugalPortugalPortugal FrancePortugal
GermanyFrancePortugalPortugalPortugal
Belgium
PortugalPortugalPortugalPortugal
Italy
PortugalPortugal FrancePortugalPortugalPortugalPortugalPortugal FrancePortugalPortugal
Italy
FrancePortugalPortugalPortugalPortugalPortugal France
Italy
FrancePortugalPortugal France
Belgium
PortugalPortugalPortugalPortugalPortugalPortugal FranceFrancePortugalPortugal FrancePortugal
Italy
BelgiumBelgium
Germany
PortugalPortugalPortugalPortugalPortugalPortugal FrancePortugalPortugalPortugal
Belgium
PortugalPortugalPortugalPortugal France
Italy
PortugalPortugalPortugalPortugalPortugalPortugal
Germany
PortugalPortugal FrancePortugalPortugalPortugalPortugal FrancePortugalPortugalPortugalPortugalPortugalPortugalPortugalPortugalPortugal
Italy
PortugalPortugalPortugal
Belgium
PortugalPortugalPortugalPortugalPortugal France
Belgium
FrancePortugalPortugalPortugal
Germany
PortugalPortugal
ItalyItaly
PortugalPortugalPortugalPortugalPortugalPortugalPortugalPortugalPortugal FranceFrancePortugalPortugalPortugalPortugal
Italy
PortugalPortugalPortugalPortugalPortugalPortugalPortugalPortugalPortugal
Italy
PortugalPortugalPortugalPortugalPortugalPortugalPortugalPortugalPortugalPortugal
Italy
PortugalPortugalPortugalPortugalPortugalPortugal
Belgium
Italy
PortugalPortugalPortugal FrancePortugal
United Kingdom
PortugalPortugal
Italy
Portugal
Belgium
PortugalPortugalPortugalPortugalPortugalPortugalPortugalPortugal France
Belgium
Portugal France
Italy
FrancePortugalPortugalPortugalPortugal
Belgium
PortugalPortugalPortugal
Belgium
Portugal FrancePortugalPortugalPortugal
Belgium
PortugalPortugalPortugal
Germany
PortugalPortugalPortugalPortugal
Germany
PortugalPortugal FrancePortugalPortugalPortugal FrancePortugalPortugalPortugalPortugalPortugalPortugalPortugal France
United Kingdom
PortugalPortugalPortugal
Belgium
Portugal FrancePortugal
Italy
PortugalPortugal France
Belgium
Portugal
ItalyItaly
PortugalPortugalPortugalPortugal
Italy
Portugal
Belgium
Italy
PortugalPortugal FrancePortugalPortugalPortugal
Belgium
PortugalPortugalPortugalPortugal FranceGermany
Portugal
Italy
PortugalPortugalPortugal FrancePortugal FrancePortugalPortugal FrancePortugal
Belgium
PortugalPortugalPortugalPortugalPortugalPortugalPortugalPortugalPortugalPortugalPortugalPortugal France
Italy
FrancePortugalPortugal
Belgium
PortugalPortugalPortugalPortugalPortugalPortugalPortugalPortugalPortugal
Belgium
France
Belgium
PortugalPortugalPortugalPortugalPortugalPortugal FrancePortugal FrancePortugal
Germany
Belgium
PortugalPortugalPortugal
BelgiumBelgium
PortugalPortugal FrancePortugalPortugalPortugalPortugalPortugalPortugal FrancePortugal
Belgium
PortugalPortugalPortugal
Belgium
PortugalPortugalPortugalPortugalPortugal FrancePortugal
Belgium
Portugal
Italy
PortugalPortugalPortugal
Germany
PortugalPortugalPortugalPortugalPortugalPortugalPortugalPortugal
BelgiumBelgium
PortugalPortugalPortugalPortugalPortugal
Italy
Germany
PortugalPortugal
Italy
PortugalPortugalPortugalPortugalPortugalPortugal FrancePortugalPortugal
Belgium
FrancePortugal FrancePortugalPortugalPortugalPortugal
Belgium
PortugalPortugalPortugal FrancePortugalPortugalPortugalPortugalPortugalPortugalPortugalPortugalPortugalPortugalPortugalPortugalPortugal
Germany
Portugal
Italy
Portugal
Belgium
PortugalPortugal FrancePortugalPortugalPortugalPortugalPortugalPortugalPortugalPortugal
United Kingdom
PortugalPortugal France
Italy
PortugalPortugal FrancePortugalPortugal FrancePortugal FranceFrancePortugalPortugalPortugal
Germany
PortugalPortugal FrancePortugalPortugalPortugal
Germany
PortugalPortugal
Italy
PortugalPortugalPortugal
Italy
PortugalPortugalPortugalPortugalPortugalPortugalPortugalPortugalPortugal
United Kingdom
FrancePortugalPortugalPortugalPortugalPortugalPortugalPortugalPortugal FrancePortugal
Italy
FrancePortugalPortugalPortugalPortugal
Belgium
PortugalPortugalPortugal FrancePortugalPortugal
Belgium
PortugalPortugalPortugalPortugalPortugal
Italy
PortugalPortugalPortugalPortugalPortugalPortugalPortugalPortugalPortugalPortugal
ItalyItaly
Portugal
Germany
PortugalPortugalPortugalPortugal FrancePortugal
Belgium
PortugalPortugalPortugalPortugal
Italy
PortugalPortugalPortugalPortugalPortugal FrancePortugalPortugalPortugalPortugalPortugalPortugalPortugalPortugalPortugalPortugalPortugalPortugalPortugalPortugalPortugalPortugalPortugal
ItalyItaly
Germany
Portugal
Germany
PortugalPortugalPortugalPortugalPortugalPortugalPortugalPortugalPortugal FranceGermany
PortugalPortugalPortugalPortugal
Italy
PortugalPortugalPortugal
Italy
PortugalPortugal
Germany
PortugalPortugal France
Italy
Germany
PortugalPortugalPortugalPortugalPortugalPortugalPortugalPortugalPortugalPortugal
Italy
PortugalPortugalPortugalPortugalPortugalPortugalPortugalPortugalPortugalPortugalPortugalPortugalPortugal
ItalyItaly
PortugalPortugal FrancePortugalPortugal
Italy
PortugalPortugalPortugal
GermanyFrancePortugalPortugalPortugal
Italy
Portugal
Italy
Portugal
Belgium
PortugalPortugalPortugalPortugalPortugal
Belgium
PortugalPortugalPortugalPortugalPortugal
Italy
Portugal FrancePortugalPortugalPortugalPortugal
Germany
PortugalPortugal
Belgium
PortugalPortugalPortugal
Italy
PortugalPortugalPortugalPortugalPortugalPortugalPortugalPortugalPortugalPortugalPortugalPortugalPortugalPortugalPortugal FranceGermany
Portugal
GermanyFrancePortugalPortugalPortugalPortugalPortugalPortugalPortugalPortugalPortugalPortugalPortugalPortugalPortugalPortugalPortugalPortugal France
United Kingdom
PortugalPortugalPortugalPortugalPortugalPortugal
Germany
PortugalPortugalPortugalPortugalPortugalPortugalPortugalPortugal
Germany
PortugalPortugalPortugalPortugalPortugalPortugal
Italy
PortugalPortugalPortugal
Italy
PortugalPortugalPortugalPortugalPortugal
Belgium
Italy
PortugalPortugalPortugalPortugalPortugalPortugalPortugalPortugal FrancePortugalPortugal FrancePortugalPortugalPortugalPortugalPortugalPortugalPortugalPortugalPortugalPortugal
Italy
PortugalPortugalPortugalPortugalPortugalPortugal
Germany
PortugalPortugalPortugalPortugal
Belgium
Italy
PortugalPortugalPortugalPortugalPortugalPortugalPortugalPortugal
Belgium
PortugalPortugalPortugalPortugalPortugalPortugalPortugalPortugalPortugalPortugalPortugalPortugal FrancePortugalPortugal
Italy
Portugal
United Kingdom
PortugalPortugalPortugalPortugalPortugalPortugalPortugalPortugalPortugalPortugalPortugalPortugalPortugalPortugalPortugalPortugalPortugalPortugalPortugalPortugal France
Belgium
Portugal FrancePortugal FrancePortugalPortugalPortugalPortugalPortugal
Italy
PortugalPortugalPortugalPortugal
Belgium
PortugalPortugal
Italy
PortugalPortugalPortugalPortugalPortugalPortugal France
Belgium
PortugalPortugalPortugalPortugalPortugalPortugalPortugal
Germany
Portugal
Italy
PortugalPortugalPortugalPortugalPortugalPortugalPortugalPortugalPortugal
Italy
PortugalPortugalPortugalPortugalPortugalPortugalPortugal
Germany
Italy
Belgium
PortugalPortugalPortugalPortugalPortugalPortugal
United Kingdom
PortugalPortugalPortugalPortugalPortugal
Germany
PortugalPortugalPortugal
Italy
Portugal
Germany
PortugalPortugalPortugalPortugalPortugalPortugalPortugalPortugalPortugalPortugalPortugalPortugalPortugalPortugal FrancePortugalPortugalPortugalPortugalPortugal
Germany
PortugalPortugalPortugalPortugalPortugal FrancePortugalPortugal FrancePortugal
Italy
PortugalPortugal FrancePortugalPortugalPortugalPortugal FrancePortugalPortugalPortugalPortugalPortugalPortugalPortugalPortugal FrancePortugal
United KingdomItaly
PortugalPortugalPortugalPortugalPortugalPortugalPortugalPortugalPortugalPortugalPortugalPortugalPortugalPortugalPortugal
Germany
PortugalPortugalPortugal FrancePortugal FrancePortugalPortugalPortugalPortugalPortugalPortugal
Italy
PortugalPortugalPortugal
ItalyItaly
Portugal
Germany
Belgium
Portugal FrancePortugalPortugal
Italy
PortugalPortugal
Italy
PortugalPortugalPortugalPortugalPortugalPortugal
Germany
PortugalPortugal
Belgium
PortugalPortugalPortugalPortugal
Belgium
PortugalPortugalPortugal
Italy
FrancePortugalPortugalPortugal
Italy
PortugalPortugalPortugal
Italy
PortugalPortugalPortugalPortugal
Germany
PortugalPortugalPortugalPortugalPortugalPortugalPortugalPortugalPortugalPortugalPortugalPortugalPortugalPortugalPortugalPortugal FrancePortugalPortugalPortugalPortugalPortugal
Belgium
Portugal
Italy
PortugalPortugal France
Belgium
PortugalPortugalPortugalPortugalPortugalPortugalPortugalPortugal
Germany
PortugalPortugalPortugalPortugalPortugalPortugalPortugalPortugalPortugalPortugalPortugalPortugalPortugalPortugalPortugalPortugal
Italy
FrancePortugalPortugal
Belgium
Portugal FrancePortugalPortugal
Belgium
PortugalPortugalPortugalPortugalPortugal
Italy
Portugal
Germany
PortugalPortugalPortugalPortugalPortugal
Italy
PortugalPortugalPortugalPortugalPortugalPortugalPortugal
Germany
PortugalPortugalPortugalPortugalPortugalPortugalPortugalPortugalPortugalPortugalPortugalPortugalPortugalPortugal
Italy
PortugalPortugalPortugal
Belgium
Portugal FrancePortugalPortugalPortugal
Italy
PortugalPortugalPortugalPortugalPortugal France
Belgium
PortugalPortugalPortugalPortugal FrancePortugalPortugalPortugalPortugalPortugalPortugalPortugalPortugal
United Kingdom
Portugal
Italy
PortugalPortugalPortugalPortugal
Belgium
FrancePortugalPortugalPortugal
Germany
Portugal FrancePortugalPortugalPortugal
Belgium
PortugalPortugalPortugalPortugalPortugalPortugal FrancePortugal FrancePortugalPortugal
Belgium
PortugalPortugalPortugalPortugal
Belgium
Italy
PortugalPortugal FrancePortugal FrancePortugalPortugalPortugalPortugalPortugal
Belgium
FrancePortugalPortugalPortugal
Germany
PortugalPortugalPortugal
Italy
PortugalPortugal FrancePortugal
Italy
PortugalPortugalPortugalPortugalPortugalPortugalPortugalPortugalPortugalPortugalPortugalPortugalPortugalPortugalPortugalPortugal
Italy
PortugalPortugal
Italy
PortugalPortugalPortugalPortugalPortugalPortugalPortugal
GermanyFrancePortugalPortugalPortugalPortugalPortugalPortugal
Italy
PortugalPortugalPortugalPortugalPortugalPortugalPortugalPortugalPortugal
United Kingdom
FrancePortugalPortugalPortugalPortugalPortugalPortugal
Belgium
Portugal
Italy
Belgium
PortugalPortugalPortugalPortugalPortugalPortugalPortugalPortugalPortugalPortugalPortugal
Italy
PortugalPortugalPortugalPortugalPortugalPortugal
Italy
FrancePortugalPortugalPortugalPortugalPortugalPortugal
Italy
PortugalPortugalPortugal
Belgium
PortugalPortugalPortugalPortugal
Belgium
Italy
PortugalPortugalPortugalPortugalPortugalPortugalPortugalPortugalPortugalPortugalPortugalPortugal
Italy
Portugal FranceFrancePortugalPortugalPortugal
Italy
PortugalPortugal
Italy
PortugalPortugal
BelgiumBelgium
Portugal
Belgium
FrancePortugalPortugal
Morocco
TurkeyTurkeySuriname
Morocco
SurinameTurkey
China
Suriname
MoroccoMorocco
SurinameSuriname
MoroccoMorocco
TurkeyTurkey
Iran
Morocco
TurkeySuriname
TurkeySuriname
TurkeySurinameSuriname
Turkey
MoroccoMorocco
Turkey
MoroccoMorocco
TurkeyTurkey
Morocco
SurinameTurkeyTurkeyTurkeyTurkey
Morocco
TurkeyTurkey
Morocco
TurkeySuriname
China
TurkeyTurkeyTurkey
Morocco
TurkeySuriname
Morocco
Suriname
Morocco
TurkeyTurkeySuriname
China
Turkey
Morocco
TurkeySurinameSuriname
TurkeyTurkeySuriname
Turkey
MoroccoMorocco
Germany
Turkey
Morocco
Turkey
Morocco
TurkeyTurkeyTurkeyTurkeyTurkey
Morocco
TurkeyTurkeySuriname
TurkeyTurkeyTurkeyTurkey
Morocco
SurinameSurinameTurkey
Morocco
TurkeyTurkeySuriname
TurkeyTurkeyTurkeyTurkey
MoroccoMoroccoMorocco
SurinameTurkey
Morocco
TurkeyTurkeyTurkey
MoroccoMorocco
TurkeyTurkeyTurkeyTurkey
Morocco
Turkey
Morocco
TurkeySuriname
MoroccoMorocco
SurinameTurkeyTurkeyTurkey
Morocco
TurkeySuriname
Turkey
Morocco
TurkeySuriname
Turkey
United Kingdom
Morocco
Turkey
United Kingdom
Iran
MoroccoMorocco
United Kingdom
Morocco
TurkeySuriname
Morocco
SurinameSuriname
Morocco
Suriname
Morocco
Turkey
Morocco
China
TurkeySuriname
Morocco
Turkey
Morocco
TurkeyTurkeySuriname
Morocco
China
MoroccoMoroccoMorocco
SurinameTurkey
SurinameTurkeyTurkeyTurkeyTurkey
Morocco
TurkeyTurkeyTurkeyTurkeyTurkeyTurkeyTurkey
ChinaChina
Morocco
TurkeyTurkey
Morocco
TurkeyTurkey
MoroccoMoroccoMorocco
Turkey
Morocco
SurinameTurkey
Suriname
Morocco
TurkeyTurkey
MoroccoMorocco
TurkeyTurkeyTurkeyTurkeyTurkeyTurkey
Morocco
SurinameTurkey
SurinameTurkeyTurkeyTurkey
China
MoroccoMoroccoMorocco
TurkeyTurkey
MoroccoMoroccoMorocco
Turkey
Germany
Morocco
TurkeyTurkeyTurkey
Morocco
TurkeySuriname
Morocco
Iran
Turkey
MoroccoMorocco
TurkeyTurkeySuriname
Turkey
Morocco
ChinaChina
Suriname
MoroccoMoroccoMorocco
TurkeySuriname
Turkey
Morocco
Turkey
China
Suriname
MoroccoMoroccoMoroccoMorocco
TurkeyTurkey
Morocco
United Kingdom
Germany
Turkey
Morocco
Suriname
Morocco
TurkeyTurkey
MoroccoMoroccoMoroccoMorocco
TurkeySurinameSuriname
TurkeyTurkey
Morocco
Turkey
Morocco
TurkeySuriname
TurkeySuriname
TurkeyTurkeySuriname
TurkeyTurkeySuriname
Morocco
TurkeySurinameSuriname
Morocco
SurinameSurinameSurinameSurinameSurinameTurkey
MoroccoMorocco
Suriname
Morocco
Suriname
Morocco
SurinameSuriname
China
Morocco
Suriname
United Kingdom
Morocco
Suriname
Morocco
SurinameTurkey
MoroccoMorocco
Suriname
Morocco
SurinameSuriname
MoroccoMoroccoMoroccoMorocco
Suriname
Morocco
Iran
Suriname
MoroccoMoroccoMorocco
TurkeyTurkeySuriname
Morocco
Suriname
China
Morocco
China
Turkey
MoroccoMoroccoMorocco
SurinameTurkeyTurkey
MoroccoMorocco
Turkey
MoroccoMorocco
China
MoroccoMorocco
TurkeySuriname
Turkey
China
MoroccoMoroccoMoroccoMorocco
TurkeyTurkeyTurkeyTurkey
ChinaChina
TurkeySuriname
TurkeyTurkey
Morocco
Germany
Morocco
China
Morocco
China
Turkey
China
Turkey
MoroccoMoroccoMoroccoMoroccoMorocco
SurinameTurkey
Iran
Suriname
Morocco
Turkey
MoroccoMoroccoMoroccoMorocco
Turkey
China
SurinameTurkeyTurkey
Morocco
TurkeySuriname
China
Morocco
China
Suriname
MoroccoMorocco
Turkey
Morocco
TurkeyTurkey
Morocco
Turkey
MoroccoMoroccoMorocco
SurinameTurkey
Suriname
Morocco
TurkeyTurkey
Morocco
TurkeyTurkey
Germany
Morocco
TurkeyTurkey
Germany
Morocco
TurkeyTurkeyTurkey
Morocco
Turkey
Morocco
SurinameTurkey
SurinameTurkey
Suriname
Morocco
Turkey
Morocco
TurkeySuriname
Morocco
Turkey
Morocco
TurkeyTurkeySuriname
TurkeySuriname
Morocco
Suriname
Morocco
Turkey
Morocco
Suriname
Morocco
TurkeyTurkeySuriname
TurkeyTurkeySuriname
TurkeySuriname
Turkey
MoroccoMorocco
Turkey
Morocco
SurinameTurkeyTurkey
SurinameSuriname
MoroccoMoroccoMorocco
TurkeySuriname
TurkeyTurkeySuriname
MoroccoMorocco
Suriname
Morocco
TurkeyTurkey
MoroccoMorocco
TurkeyTurkeyTurkey
Morocco
TurkeyTurkey
Morocco
Turkey
China
SurinameSurinameTurkeyTurkey
Morocco
Turkey
China
MoroccoMoroccoMorocco
TurkeySuriname
Morocco
TurkeyTurkey
Morocco
Turkey
Morocco
TurkeySuriname
Iran
Morocco
TurkeyTurkey
Morocco
Turkey
China
Turkey
Morocco
Turkey
Morocco
SurinameTurkeyTurkey
Suriname
Morocco
TurkeyTurkey
Morocco
Suriname
Morocco
Suriname
Morocco
Suriname
MoroccoMorocco
TurkeyTurkey
South Africa
Fiji
China
South Africa
IndiaUnited Kingdom
South Africa
United KingdomUnited KingdomUnited KingdomChina
Australia
Korea
United KingdomChinaChinaChina
Australia
United KingdomChina United KingdomChina United KingdomUnited Kingdom
Korea
United KingdomChina United KingdomUnited KingdomChina United KingdomUnited KingdomChinaChina United KingdomUnited KingdomChina United KingdomUnited KingdomUnited KingdomUnited KingdomChinaChina United KingdomUnited Kingdom
Australia
China United KingdomUnited KingdomUnited KingdomUnited Kingdom
South Africa
United KingdomUnited Kingdom
Australia
United KingdomChina
Australia
South Africa
ChinaChina United KingdomUnited KingdomUnited KingdomChina
Australia
United KingdomChina
FijiFijiFiji
United KingdomUnited KingdomChina United Kingdom
Australia
United Kingdom
Australia
ChinaChinaChina United KingdomChina United Kingdom
Australia
United KingdomChina United KingdomChina United Kingdom
Australia
United KingdomUnited KingdomChina
KoreaKorea
United KingdomUnited Kingdom
Australia
China United KingdomChinaChina United KingdomUnited KingdomUnited KingdomChinaChina United KingdomUnited Kingdom
FijiFiji
United KingdomChinaChina
Fiji
China
FijiFiji
Australia
United KingdomChina
Fiji
China
Fiji
United KingdomChina United KingdomChina IndiaChinaChina
Fiji
South Africa
Fiji
United KingdomUnited Kingdom
Fiji
United KingdomChina
Korea
United KingdomUnited Kingdom
Fiji
United KingdomUnited Kingdom
Fiji
United KingdomUnited KingdomUnited Kingdom
Fiji
China
Fiji
United KingdomChinaChina United KingdomUnited KingdomChinaChina United KingdomUnited KingdomUnited KingdomChinaChina United Kingdom
Australia
United KingdomChinaChina
FijiFiji
China
Fiji
United KingdomChinaChina United Kingdom
Australia
United KingdomUnited KingdomChina
Fiji
United KingdomUnited KingdomChina
Fiji
China
Australia
ChinaChinaChinaChinaChina United KingdomChinaChina United KingdomUnited Kingdom
Australia
China United KingdomChina United Kingdom
South Africa
United KingdomChina United Kingdom
Korea
China United KingdomUnited Kingdom
Fiji
ChinaChinaChinaChina United KingdomChina
Korea
China United KingdomUnited KingdomChina United KingdomChina United KingdomUnited KingdomUnited KingdomChinaChina United Kingdom
KoreaKoreaKorea
United KingdomChina United KingdomUnited Kingdom
Australia
United KingdomUnited KingdomChina United KingdomUnited KingdomChinaChina
Fiji
China United Kingdom
AustraliaAustralia
Fiji
China United KingdomIndia
Australia
United KingdomUnited KingdomUnited KingdomChina United KingdomChinaChinaChina United KingdomUnited KingdomUnited KingdomUnited KingdomUnited KingdomChina United KingdomChinaChinaChinaChina United KingdomChina
Australia
Fiji
United Kingdom
Fiji
China
Australia
Fiji
United KingdomUnited KingdomUnited Kingdom
Fiji
Australia
ChinaChinaChina
Korea
ChinaChinaChina
Fiji
United Kingdom
Korea
Fiji
China
Korea
United KingdomUnited Kingdom
Australia
United KingdomUnited KingdomChina United KingdomChina IndiaUnited KingdomChinaChina United KingdomUnited KingdomIndiaChina United KingdomUnited KingdomUnited Kingdom
Australia
United KingdomChinaChina
Australia
United KingdomUnited KingdomUnited KingdomChina United KingdomUnited KingdomChina
Australia
Korea
United KingdomChina United KingdomUnited KingdomUnited KingdomUnited KingdomUnited KingdomUnited KingdomUnited KingdomUnited Kingdom
Australia
United KingdomChina United Kingdom
Australia
United Kingdom
Korea
United KingdomChina
Australia
ChinaChina United KingdomChinaChinaChina United KingdomChina United Kingdom
Australia
United KingdomChinaChina United KingdomUnited KingdomUnited Kingdom
Australia
United Kingdom
Fiji
Australia
United Kingdom
South Africa
China
Fiji
United KingdomChinaChina
Fiji
China United KingdomUnited KingdomUnited Kingdom
AustraliaAustralia
China
South Africa
United KingdomUnited KingdomChina
South Africa
United KingdomChina
Australia
Italy
France
ItalyItaly
PortugalTurkey
Albania
Portugal
ItalyItaly
Germany
Turkey
Italy
Germany
PortugalTurkey
AlbaniaItaly
PortugalTurkey
PortugalPortugalPortugalPortugalTurkey
SpainItaly
Germany
Portugal
Spain
FranceFrance
Italy
Turkey
Germany
ItalyItaly
Portugal
Albania
Germany
Portugal
Albania
FranceFrance
AlbaniaItaly
AlbaniaItalyItaly
Spain
TurkeyTurkey
Albania
Portugal France
Italy
France
ItalyItaly
TurkeyTurkey
Germany
Italy
Portugal
Spain
Portugal France
ItalyAlbania
ItalyAlbania
Italy
Germany
Albania
Portugal
ItalyItalyItaly
TurkeyTurkey
ItalyItalySpain
Portugal
Albania
France
Spain
Portugal
Italy
GermanyGermanyGermanyGermany
Spain
France
Albania
PortugalTurkey
Italy
PortugalTurkeyTurkey
Italy
PortugalPortugalPortugal
Italy
TurkeyTurkey
ItalyItaly
Turkey
Austria
Albania
PortugalTurkey
Germany
TurkeyTurkey
Spain
Turkey
AlbaniaItaly
Portugal
Italy
Portugal
Germany
Turkey
Italy
TurkeyTurkey
Italy
PortugalPortugalPortugal
Albania
TurkeyTurkey
France
Turkey
Italy
Turkey
SpainItalyItalyItalyItalyItalyItalyItaly
Portugal
Albania
Portugal
ItalyAlbania
Italy
Turkey
Italy
TurkeyPortugalPortugalPortugal
ItalyItalyItalyAlbania
ItalyAlbania
TurkeyTurkey
Italy
PortugalPortugal
Italy
Austria
Turkey
Italy
Turkey
SpainItalyItaly
Portugal
SpainItaly
Germany
Italy
GermanyGermany
Portugal
ItalyItalyItaly
PortugalPortugalPortugal FrancePortugal
ItalyItalyItalyItalyItaly
Germany
ItalyItaly
Turkey
Germany
ItalyItalyItalyItaly
PortugalTurkey
Italy
Turkey
Italy
Portugal
Italy
Turkey
SpainItaly
Turkey
Italy
PortugalPortugalPortugalPortugalTurkey
Germany
PortugalPortugal
Italy
Portugal
ItalyItalyItalyItalySpainAlbania
Italy
PortugalPortugalTurkey
Italy
PortugalTurkey
Portugal
Albania
PortugalTurkey
Italy
Portugal
Italy
PortugalTurkey
Italy
Portugal
ItalySpain
Italy
France
Turkey
ItalyItaly
FranceGermany
SpainAlbaniaAlbaniaItaly
Turkey
France
Italy
PortugalTurkey
AlbaniaAlbaniaItalyItaly
Turkey
Italy
Germany
Italy
Turkey
ItalyItaly
PortugalTurkey
Italy
Turkey
SpainAlbania SpainItaly
PortugalPortugalPortugal
ItalyAlbania
ItalyItaly
France
Italy
PortugalTurkey
Germany
Portugal FrancePortugal
Spain
Turkey
Albania
Germany
Albania
Austria
ItalyItaly
FranceGermany
PortugalPortugal France
ItalyItalyItaly
France
Italy
Portugal
Italy
PortugalPortugal
Spain
Germany
Italy
Turkey
SpainSpainAlbaniaItalyItalyItaly
Turkey
ItalyAlbania
TurkeyTurkeyPortugal
TurkeyPortugal
TurkeyTurkey
France
Italy
Portugal
ItalySpain
Turkey
Italy
Portugal France
Italy
Germany
SpainItaly
Turkey
ItalyItalyAlbania
Italy
Germany
Italy
Portugal
Italy
Portugal
Albania SpainAlbania
PortugalPortugal
Albania
PortugalPortugal
ItalyAlbania Spain
PortugalTurkey
ItalyItaly
Turkey
Italy
PortugalPortugalTurkey
ItalyItaly
Portugal
AlbaniaItalyItaly
France
TurkeyTurkeyTurkeyPortugal
SpainItaly
Turkey
Spain
FrancePortugalPortugalTurkeyTurkey
Portugal
ItalyItaly
PortugalPortugal
Italy
Turkey
Italy
PortugalTurkey
Italy
Turkey
Italy
Portugal
Austria
Portugal
ItalyItaly
Portugal
Germany
ItalyItaly
Austria
France
Spain
Austria
ItalySpain
Austria
France
Italy
Turkey
Spain
Portugal
Spain
Turkey
Germany
Austria
PortugalPortugal
Italy
FranceFrance
ItalyItaly
Turkey
FrancePortugal
Austria
Italy
AustriaAustria
Italy
Portugal
Italy
Germany
ItalyItaly
Portugal
Austria
Italy
Germany
PortugalPortugalTurkey
ItalyItaly
Portugal
Italy
Turkey
ItalyAlbania
TurkeyPortugal
Germany
ItalySpain
Italy
TurkeyPortugal
Italy
Portugal
ItalyItalyItalyItalyItaly
Turkey
Italy
PortugalTurkey
France
ItalyItalyItaly
France
TurkeyTurkeyPortugal
SpainItalyItaly
TurkeyPortugal
Germany
Portugal
Germany
SpainItaly
SpainItaly
Germany
Albania SpainAlbaniaItaly
Portugal France
Turkey
Italy
PortugalTurkey
FrancePortugal
ItalyItaly
PortugalPortugal
ItalyItalyItaly
Portugal
Italy
PortugalTurkey
Italy
Portugal FrancePortugal
Italy
TurkeyPortugal
Italy
Turkey
ItalyItalySpain
Germany
Turkey
Spain
TurkeyTurkeyPortugalPortugal France
Albania
Germany
TurkeyPortugalPortugal
Italy
PortugalTurkey
Italy
Portugal
ItalyItalyItaly
PortugalTurkey
Italy
Portugal France
Italy
PortugalPortugal
ItalySpain
ItalySpain
PortugalTurkey
Albania
Turkey
Italy
Turkey
Spain
Portugal
Albania
PortugalTurkey
France
SpainItalyItaly
Spain
Portugal
Germany
Italy
Portugal
ItalyItaly
Germany
Portugal
Italy
Portugal
Germany
ItalyItaly
TurkeyPortugal
Italy
Portugal
ItalyAlbania
Portugal
Italy
Portugal
AlbaniaItalyItaly
Spain
PortugalPortugal
Italy
TurkeyPortugal
Italy
PortugalPortugalPortugalPortugalTurkey
Italy
TurkeyTurkey
SpainSpainItalyItalyItaly
TurkeyPortugalPortugal
Turkey
Spain
PortugalPortugalPortugalPortugal
ItalyItaly
PortugalPortugal
ItalyItaly
France
Turkey
Spain
Turkey
Italy
Germany
PortugalTurkey
France
TurkeyTurkey
FranceFrancePortugal
Italy
GermanyGermany
TurkeyPortugalPortugal
ItalyItaly
Germany
Portugal
Italy
Portugal
Italy
Portugal
GermanyGermanyFrancePortugal
Germany
ItalyItaly
Turkey
SpainItaly
Portugal
Germany
Portugal
Italy
France
TurkeyTurkeyTurkeyTurkey
Albania
Portugal
Germany
ItalyItaly
Portugal
Germany
Italy
Germany
Portugal FrancePortugal
GermanyFrancePortugal
ItalyItaly
Austria
ItalyItaly
Portugal
Italy
PortugalTurkey
Germany
Italy
PortugalPortugalPortugal
Germany
Portugal FrancePortugal
Italy
TurkeyTurkey
Italy
Germany
Turkey
Spain
PortugalTurkey
Italy
Portugal
Germany
TurkeyTurkey
Spain
Germany
Spain
Turkey
FrancePortugal
AlbaniaItaly
TurkeyTurkey
Italy
Portugal
Germany
ItalyItaly
Germany
Italy
Germany
PortugalTurkeyTurkey
Portugal
Germany
Portugal
Italy
Turkey
Italy
France
Albania
Turkey
France
Turkey
France
SpainSpainAlbaniaItaly
GermanyFrancePortugalPortugal
Italy
Austria
Albania
Germany
TurkeyPortugal France
TurkeyTurkey
Italy
Portugal
Italy
Portugal
Germany
Spain
FranceGermanyGermany
ItalyAlbaniaAlbania
Turkey
AlbaniaAlbania
GermanyFrancePortugal
TurkeyTurkeyTurkey
Albania
Turkey
ItalyItaly
TurkeyTurkey
Albania
Portugal
Spain
PortugalPortugal
ItalyAlbania
Portugal
Spain
Turkey
Italy
Germany
ItalyAlbania
PortugalTurkey
ItalyItaly
Austria
Italy
Germany
Italy
Portugal
Italy
Portugal
Italy
France
Turkey
Italy
Portugal France
SpainItalyItaly
TurkeyTurkeyTurkeyPortugalPortugalPortugal
Turkey
Germany
PortugalPortugal
Italy
PortugalPortugalPortugal
Italy
Portugal
ItalyItaly
TurkeyPortugalPortugalPortugal France
Italy
Portugal
Albania
FrancePortugal
Albania
Turkey
Italy
Portugal
Italy
Portugal
Italy
PortugalPortugal France
ItalyItaly
Portugal
Italy
Austria
Italy
PortugalPortugal
Italy
TurkeyTurkeyPortugal
TurkeyPortugal FranceFrancePortugal
TurkeyTurkeyPortugalPortugal
TurkeyPortugal
TurkeyTurkey
Italy
Turkey
Spain
TurkeyPortugal
Turkey
Italy
Turkey
FrancePortugal
Italy
Turkey
Italy
TurkeyTurkey
France
TurkeyTurkeyTurkey
AlbaniaItalyItaly
France
SpainAlbania
Portugal FrancePortugalPortugal
Italy
PortugalPortugal
Spain
GermanyFrance
AlbaniaAlbaniaAlbania
FranceFrance
TurkeyPortugal
Turkey
Spain
Portugal FranceFrance
Italy
Turkey
France
Spain
France
TurkeyPortugal
Turkey
France
Italy
Portugal
Italy
Portugal
Italy
Turkey
Germany
Turkey
FrancePortugalTurkey
France
TurkeyTurkey
FranceFranceFrance
Spain
FranceGermany
FranceFranceGermany
Spain
Turkey
Italy
Portugal France
Turkey
FrancePortugal
Germany
Italy
Portugal France
Italy
PortugalPortugal France
Italy
Portugal
ItalyItaly
PortugalPortugal
Austria
TurkeyTurkeyPortugalPortugal
ItalyItaly
TurkeyPortugal
TurkeyTurkey
Italy
PortugalPortugal
ItalyItaly
Portugal
Spain
Turkey
ItalyItaly
France
Turkey
Italy
FranceFrance
TurkeyPortugal
Italy
Portugal
SpainAlbaniaItaly
Turkey
France
SpainItalyItalyItaly
Portugal
ItalyItaly
Turkey
Spain
Portugal
GermanyGermany
TurkeyTurkeyPortugal
Turkey
Italy
Turkey
Spain
TurkeyPortugal
Italy
PortugalTurkey
PortugalTurkeyTurkeyTurkeyTurkey
PortugalTurkeyTurkey
Spain
Turkey
SpainItaly
TurkeyTurkeyPortugalPortugal
Spain
Germany
ItalyItaly
TurkeyTurkeyTurkeyTurkeyTurkeyPortugal France
Italy
Austria
TurkeyTurkey
Spain
PortugalPortugalPortugal France
Turkey
France
Turkey
Spain
Portugal
Spain
PortugalTurkey
Germany
TurkeyTurkey
France
Italy
Turkey
Italy
Turkey
SpainSpain
Turkey
Italy
TurkeyPortugalPortugal
Italy
PortugalTurkey
Italy
PortugalPortugal
Spain
Portugal
Italy
Portugal
Italy
FranceFrance
Turkey
Spain
TurkeyPortugal
TurkeyTurkeyTurkeyPortugal
Germany
TurkeyTurkey
ItalySpain
PortugalTurkey
Italy
TurkeyTurkeyTurkey
ItalyItaly
TurkeyTurkeyPortugal
TurkeyPortugal
SpainSpain
Portugal
Germany
Italy
Turkey
ItalyAlbania
TurkeyTurkey
Italy
PortugalTurkey
FrancePortugalPortugalPortugal
Italy
TurkeyTurkey
Spain
PortugalPortugalPortugalPortugalTurkey
Italy
PortugalTurkeyTurkeyTurkey
Italy
Austria
Turkey
ItalyItaly
PortugalTurkey
PortugalPortugalTurkey
Germany
TurkeyTurkey
ItalySpain
ItalyItaly
Portugal
SpainSpain
PortugalPortugal
Italy
TurkeyPortugal
TurkeyTurkeyPortugalPortugal
TurkeyTurkeyPortugal
ItalySpain
Germany
Spain
Turkey
ItalyItaly
Turkey
Albania
TurkeyPortugal
Italy
Austria
Portugal
Italy
Germany
TurkeyTurkey
SpainItaly
Portugal
Italy
TurkeyTurkey
France
TurkeyTurkeyTurkey
France
Spain
Austria
Turkey
Spain
TurkeyPortugal
Austria
Italy
Portugal
SpainAlbania
France
Turkey
France
SpainSpain
Portugal
SpainSpainSpainSpain
FranceFrance
Italy
PortugalPortugalPortugal
SpainSpainSpainItaly
Spain
Turkey
Germany
SpainSpainSpain
Turkey
Spain
Portugal
SpainSpainItalyItaly
SpainItaly
Turkey
ItalyItalyItalySpainSpain
Portugal
Spain
Austria
Portugal
Spain
Portugal
Spain
Turkey
Italy
Turkey
SpainSpainSpainSpain
PortugalTurkey
PortugalPortugal
Italy
Germany
Portugal
Spain
PortugalPortugal
Italy
Portugal
ItalySpainSpain
Portugal
SpainSpainSpain
France
SpainItaly
Spain
Portugal
Spain
TurkeyTurkey
Spain
Turkey
ItalySpain
Germany
Italy
Portugal
ItalyItaly
Portugal
Austria
TurkeyPortugal
Albania
Turkey
Italy
FranceGermany
ItalyItaly
Turkey
ItalyItalyItalyItaly
Portugal
Italy
TurkeyTurkey
Austria
TurkeyPortugal
Turkey
Spain
FranceFrancePortugal
ItalyItalyItalyItaly
Turkey
Italy
TurkeyTurkey
ItalyItaly
Turkey
Spain
Germany
PortugalPortugalTurkey
ItalyItaly
Germany
ItalySpain
Italy
FranceFranceGermanyGermany
PortugalPortugal
Spain
TurkeyPortugal
Turkey
ItalyAlbania
Turkey
Italy
Portugal
Germany
TurkeyTurkey
SpainSpainItalyItaly
Turkey
Germany
PortugalPortugalTurkeyTurkey
Italy
TurkeyTurkeyTurkeyTurkey
ItalyItaly
Turkey
Germany
Italy
PortugalPortugalTurkey
AlbaniaItaly
Albania
PortugalPortugal
Spain
PortugalTurkeyTurkey
ItalyItaly
Portugal France
Italy
France
Italy
Turkey
Germany
PortugalPortugal
ItalyItalyAlbania
ItalyItalyAlbania
TurkeyTurkey
Italy
Turkey
GermanyGermany
Turkey
Austria
Turkey
ItalySpain
France
Albania
Turkey
GermanyFrancePortugal
TurkeyTurkeyPortugal
TurkeyTurkeyTurkeyTurkey
Spain
Turkey
Italy
PortugalTurkey
Italy
PortugalPortugalTurkey
ItalyItalyItaly
PortugalTurkey
ItalyItaly
PortugalPortugalPortugalPortugalPortugalTurkey
Austria
TurkeyPortugal
Turkey
Italy
TurkeyPortugal
TurkeyPortugal
TurkeyPortugal
ItalyItalyItaly
PortugalTurkey
Portugal
ItalyItaly
Germany
Turkey
Italy
Turkey
Italy
Portugal
Germany
Turkey
Germany
ItalyItalySpain
Turkey
Austria
Portugal
ItalySpain
Germany
Italy
PortugalPortugal
ItalyItaly
PortugalPortugal
Italy
FrancePortugal
Italy
Germany
PortugalTurkeyTurkey
Portugal
ItalyItaly
Portugal
Spain
Portugal
Italy
TurkeyPortugal
TurkeyTurkeyTurkey
SpainItaly
PortugalPortugal
Albania
PortugalTurkeyTurkeyTurkeyTurkey
Portugal
Spain
TurkeyPortugal
Italy
TurkeyPortugal
ItalyAlbania
Turkey
Spain
Germany
Portugal
Italy
France
Italy
PortugalPortugal
ItalyItaly
Turkey
France
ItalyAlbania
Portugal
Italy
Turkey
Italy
Portugal FrancePortugal
SpainItaly
Spain
Germany
Turkey
Germany
Italy
PortugalTurkey
Italy
TurkeyPortugal France
Spain
Turkey
Spain
PortugalPortugalTurkeyTurkeyTurkeyTurkey
FrancePortugalPortugalTurkey
Italy
TurkeyPortugal
Turkey
GermanyFrance
ItalyItaly
PortugalPortugal
Italy
PortugalPortugal
Italy
TurkeyPortugal
Italy
Germany
Albania
Turkey
Italy
Turkey
Spain
Germany
Portugal
SpainItaly
Portugal FrancePortugalPortugalTurkeyTurkey
PortugalTurkeyTurkey
Germany
ItalyItalyItalyItaly
Germany
AlbaniaItaly
Turkey
Italy
TurkeyPortugalPortugalPortugal
Italy
Turkey
Spain
Germany
Spain
Turkey
ItalySpain
ItalySpain
Turkey
Italy
PortugalTurkey
Italy
France
ItalyAlbania
PortugalTurkey
SpainAlbaniaItaly
Portugal
Albania
France
Turkey
Spain
TurkeyPortugalPortugal
Austria
Turkey
Italy
TurkeyPortugal
Albania
GermanyFrancePortugal
ItalyItaly
Turkey
Germany
TurkeyTurkey
FrancePortugalPortugalTurkey
PortugalPortugalPortugalPortugal
Germany
ItalyItaly
TurkeyTurkeyPortugalPortugal
Turkey
ItalySpain
ItalyAlbania
France
Austria
Turkey
Italy
FrancePortugalPortugalPortugal
Albania
France
TurkeyPortugalPortugal
ItalyItaly
PortugalTurkey
PortugalTurkey
Portugal
Austria
Portugal
Italy
Turkey
France
TurkeyPortugal
ItalyItaly
Austria
Italy
Portugal
Italy
PortugalTurkey
PortugalTurkey
PortugalTurkey
Italy
Portugal
Germany
Spain
Turkey
Italy
Portugal
Spain
Portugal FranceFrance
Italy
Germany
Turkey
Italy
PortugalPortugalPortugalTurkeyTurkey
PortugalTurkey
Portugal
Italy
TurkeyPortugal
ItalySpain
Portugal
ItalySpain
Italy
PortugalTurkey
PortugalPortugalPortugal
Italy
TurkeyPortugalPortugalPortugalPortugal France
Turkey
ItalyItaly
Turkey
Spain
PortugalPortugalPortugal
Albania
PortugalPortugalTurkey
Italy
PortugalPortugal
ItalySpain
TurkeyTurkeyTurkey
ItalyItaly
Turkey
AlbaniaAlbaniaItaly
PortugalTurkey
Portugal
Albania
PortugalPortugal
Spain
Germany
TurkeyPortugal
SpainItaly
FrancePortugal
ItalyItaly
PortugalTurkey
Italy
Germany
Turkey
FrancePortugal
Germany
Italy
Portugal
Spain
Turkey
Austria
Portugal
Italy
Germany
TurkeyTurkeyTurkey
FrancePortugal
ItalySpain
PortugalPortugalPortugalPortugal
Albania
PortugalPortugal
Albania
FrancePortugalPortugal
Italy
France
SpainItaly
Germany
Albania
Turkey
Italy
TurkeyPortugal
TurkeyPortugal
ItalyItaly
PortugalTurkey
Portugal
ItalyAlbania
Portugal
ItalyItalyItalyItaly
Turkey
ItalySpain
Portugal
ItalyItalyItaly
Portugal
ItalyAlbania
TurkeyTurkey
FranceFrance
TurkeyPortugal
Germany
Portugal
Italy
Portugal
Germany
Italy
Portugal
ItalyAlbania
Turkey
Italy
TurkeyTurkeyPortugalPortugalPortugal
Turkey
Spain
Turkey
France
SpainSpain
PortugalPortugal
Italy
Portugal France
Turkey
Albania
FrancePortugal
Italy
PortugalPortugal
Albania
PortugalPortugal
Spain
Portugal
Germany
ItalyItaly
France
Italy
Portugal
Italy
PortugalTurkeyTurkey
Italy
PortugalPortugal
Italy
Turkey
Italy
PortugalPortugal
Albania Spain
TurkeyPortugal
Albania Spain
Portugal
Italy
TurkeyPortugal
ItalyItalyAlbania
Portugal
Germany
TurkeyPortugal
Spain
PortugalPortugalPortugal
Italy
TurkeyTurkeyTurkey
Italy
Portugal
Spain
TurkeyPortugalPortugal
TurkeyPortugal
Germany
Portugal
Austria
PortugalPortugal
Germany
Italy
TurkeyPortugalPortugal
ItalyAlbania
FrancePortugal
ItalyItaly
Portugal
SpainAlbaniaItaly
PortugalPortugalPortugalTurkey
PortugalTurkey
France
ItalyItaly
Turkey
France
Spain
TurkeyPortugal
AlbaniaItaly
FrancePortugal
Austria
PortugalTurkey
PortugalTurkey
FrancePortugalPortugalTurkey
Spain
Portugal
SpainItaly
TurkeyTurkey
Spain
Portugal
Spain
TurkeyTurkeyPortugalPortugalPortugalPortugal
Turkey
Italy
Germany
Portugal
Italy
PortugalTurkeyTurkey
Portugal
Italy
Germany
ItalyAlbaniaAlbania Spain
TurkeyPortugalPortugal
Spain
TurkeyPortugal
ItalyItalyAlbania
Portugal
Italy
PortugalPortugal
Spain
France
Spain
PortugalTurkey
PortugalPortugal FranceFranceGermanyGermany
PortugalTurkey
PortugalPortugal
Italy
PortugalTurkeyTurkey
SpainItaly
SpainItaly
TurkeyPortugalPortugal
TurkeyTurkeyPortugalPortugal
ItalySpain
Italy
Portugal France
Italy
PortugalTurkey
Portugal
Germany
ItalyItaly
Portugal France
ItalyItaly
Portugal
Germany
Turkey
Spain
PortugalPortugalPortugal
Germany
Italy
Germany
ItalySpainAlbania
TurkeyPortugal
Italy
Germany
TurkeyTurkeyPortugal
Italy
PortugalPortugal
Germany
PortugalPortugalPortugal
SpainItaly
Portugal France
TurkeyPortugalPortugal FrancePortugalPortugal
Germany
Turkey
Germany
Italy
PortugalTurkeyTurkey
PortugalPortugalPortugalPortugal France
Turkey
ItalyItaly
Portugal
Germany
ItalyAlbania Spain
Italy
Portugal
SpainItaly
PortugalPortugal
ItalyItaly
PortugalPortugalTurkey
ItalyItalySpain
Portugal
Spain
PortugalTurkey
Italy
Turkey
Italy
Portugal
Italy
PortugalPortugalPortugal
Italy
Germany
Spain
Portugal
ItalyAlbania
Portugal
Italy
PortugalTurkey
France
Italy
PortugalTurkey
ItalySpain
GermanyGermany
TurkeyPortugalPortugal
Germany
PortugalPortugalTurkey
FrancePortugalTurkey
Portugal
Italy
PortugalPortugal
ItalyItaly
PortugalTurkeyTurkey
PortugalPortugalPortugalPortugalPortugalPortugal FranceFrance
Austria
SpainItalyItalyItaly
Portugal
GermanyFrancePortugal France
Italy
Portugal
SpainItaly
PortugalPortugalPortugal
Italy
Turkey
Albania
Turkey
Germany
AlbaniaItaly
FrancePortugalPortugalPortugalTurkey
ItalyItalyItaly
Portugal
Italy
PortugalTurkey
Portugal
ItalyItaly
TurkeyTurkey
FrancePortugalPortugal FrancePortugalPortugalPortugalTurkey
Italy
TurkeyTurkey
ItalySpain
ItalyAlbania
TurkeyPortugalPortugalPortugalPortugal
Spain
France
Italy
Portugal
AlbaniaItaly
Spain
Portugal
ItalySpain
PortugalPortugal
Italy
Portugal
ItalySpain
France
Turkey
ItalySpain
Italy
Germany
Italy
Portugal France
Italy
Turkey
Italy
Portugal
Italy
Turkey
ItalyItaly
Portugal
Italy
TurkeyTurkey
Spain
Turkey
Germany
Portugal
Italy
TurkeyPortugal
TurkeyPortugal
Italy
Austria
Germany
TurkeyPortugal
SpainItaly
AlbaniaItaly
TurkeyTurkey
ItalyItalySpain
Turkey
FranceFrance
TurkeyTurkeyTurkey
ItalyItalyItalyItaly
PortugalPortugalPortugal
Austria
GermanyFrancePortugal
Albania
TurkeyTurkeyPortugalPortugalPortugalPortugal
Spain
Turkey
FranceFranceGermany
SpainItaly
PortugalPortugal
ItalyItaly
PortugalPortugal
Germany
PortugalPortugal FranceFrancePortugalPortugalPortugalTurkeyTurkey
Portugal
Italy
PortugalPortugal
ItalyItaly
Turkey
SpainItaly
Austria
Germany
Italy
Portugal France
Turkey
AlbaniaItaly
Turkey
Italy
PortugalPortugal
SpainItaly
FrancePortugalPortugalPortugalPortugal
SpainSpain
TurkeyPortugal
Turkey
Austria
Portugal
Italy
PortugalTurkey
PortugalTurkeyTurkey
Germany
Portugal
Germany
Portugal
Italy
Turkey
Italy
Turkey
SpainAlbaniaItaly
France
Turkey
SpainItalyItaly
Germany
Italy
PortugalPortugal
ItalyItaly
Turkey
Italy
Portugal
Germany
Italy
Portugal
ItalyItalySpain
TurkeyTurkeyTurkeyTurkey
Italy
PortugalPortugal
ItalyItalyItalySpain
PortugalTurkey
Albania SpainItaly
PortugalPortugal France
Italy
PortugalPortugal
Italy
Turkey
SpainItaly
PortugalPortugal
Italy
Portugal
Italy
Portugal France
Spain
PortugalTurkey
Portugal
Italy
Turkey
France
AlbaniaItaly
Germany
ItalyItaly
PortugalPortugalTurkey
PortugalPortugal
Germany
Turkey
SpainSpainItalyItaly
PortugalPortugal
Italy
TurkeyPortugal
AlbaniaItaly
FrancePortugal
Italy
Turkey
Italy
PortugalTurkey
SpainItaly
PortugalPortugal
ItalyItaly
Turkey
Albania
Turkey
Italy
Portugal
AlbaniaItaly
Portugal FrancePortugalTurkeyTurkey
Italy
PortugalPortugal
Germany
Italy
TurkeyPortugal France
Turkey
Spain
Portugal
Italy
Portugal
Italy
TurkeyPortugal France
Italy
Portugal
Italy
TurkeyPortugal
Turkey
Italy
Germany
Portugal
ItalyItalyItaly
PortugalPortugal FrancePortugal
Spain
PortugalPortugal
Spain
PortugalTurkey
Portugal
SpainItaly
Portugal
Albania Spain
Germany
PortugalTurkey
PortugalTurkey
GermanyGermany
ItalyItaly
PortugalPortugal
GermanyFrance
Italy
Portugal
Italy
Turkey
FranceGermany
Portugal
ItalySpain
TurkeyPortugalPortugal France
Turkey
FrancePortugal
ItalyItalyItaly
PortugalTurkeyTurkey
Spain
Portugal
Italy
Portugal France
ItalyItaly
Portugal
SpainItaly
Portugal
Italy
PortugalPortugal
Italy
Turkey
ItalyItaly
Austria
Italy
TurkeyPortugalPortugal
Italy
TurkeyTurkey
Italy
France
Turkey
Albania
Portugal
Italy
Portugal
Albania
TurkeyPortugal
Italy
TurkeyTurkey
ItalyItalyItalySpain
Italy
Portugal
Italy
Germany
TurkeyPortugal
Italy
Portugal France
Italy
Turkey
Italy
Turkey
Austria
France
Albania Spain
Turkey
Italy
Austria
France
ItalyItaly
TurkeyPortugalPortugalPortugal
TurkeyTurkeyPortugal
TurkeyPortugalPortugal
Germany
Italy
France
ItalyItaly
Portugal France
Austria
Turkey
France
SpainSpainAlbania
TurkeyPortugal
Albania
Turkey
Austria
Italy
Germany
PortugalTurkey
Spain
Portugal
Germany
Portugal
ItalyItaly
Turkey
Albania
France
Turkey
ItalySpain
TurkeyTurkeyTurkey
Italy
Portugal
Italy
France
SpainItalyItaly
Portugal
SpainSpain
Turkey
SpainSpain
Turkey
Germany
AlbaniaItalyItaly
PortugalPortugal
Germany
Italy
Turkey
Germany
PortugalPortugal FranceFrance
ItalyItaly
France
Turkey
Austria
GermanyFrancePortugal
ChinaChina
PakistanPakistanPakistan
China
Bangladesh
PakistanPakistan
China
PakistanPakistan
China
Pakistan
India
PakistanPakistanPakistan
China
Bangladesh
PakistanPakistanPakistanPakistanPakistanPakistan
ChinaChina
Pakistan
Bangladesh
PakistanPakistanPakistanPakistanPakistanPakistan
China
Pakistan
China
Bangladesh
PakistanPakistanPakistanPakistanPakistan
China
Pakistan
ChinaChinaChina IndiaChinaChinaChina
Pakistan
India
Pakistan
Bangladesh
China
PakistanPakistanPakistan
China IndiaIndia
BangladeshBangladesh
China
-100
-50
05
0
Gap
in M
ath
Sco
re
0 .1 .2 .3 .4 .5PEI
Uruguay
BoliviaBoliviaBoliviaBoliviaBoliviaBoliviaBoliviaBoliviaBoliviaBolivia
Paraguay
Bolivia
ParaguayParaguay
Bolivia
Uruguay
Chile
Paraguay
Chile
Bolivia
Paraguay
BoliviaBolivia
Paraguay
Bolivia
Paraguay
Bolivia
Uruguay
ParaguayParaguay
BoliviaBoliviaBolivia
Chile
Paraguay
Chile
BoliviaBoliviaBoliviaBoliviaBoliviaBoliviaBolivia
ParaguayParaguay
Bolivia
Chile
BoliviaBoliviaBolivia
Paraguay
BoliviaBoliviaBoliviaBoliviaBoliviaBoliviaBoliviaBoliviaBoliviaBoliviaBolivia
Paraguay
BoliviaBoliviaBoliviaBolivia
ParaguayParaguayParaguayParaguay
BoliviaBolivia
ParaguayParaguay
BoliviaBoliviaBoliviaBoliviaBoliviaBoliviaBolivia
ParaguayParaguayParaguay
BoliviaBolivia
Paraguay
Bolivia
Chile
ParaguayParaguay
BoliviaBoliviaBoliviaBoliviaBoliviaBolivia
Uruguay
BoliviaBoliviaBolivia
Uruguay
Bolivia
Paraguay
Bolivia
ParaguayParaguayParaguay
Bolivia
Chile
Uruguay
BoliviaBolivia
ChileChile
Paraguay
BoliviaBoliviaBolivia
UruguayUruguayUruguayUruguay
Paraguay
Uruguay
BoliviaBoliviaBoliviaBoliviaBolivia
Uruguay
Paraguay
BoliviaBolivia
ParaguayParaguayParaguay
Chile
Bolivia
ChileChile
BoliviaBolivia
UruguayUruguay
Bolivia
ParaguayParaguay
BoliviaBoliviaBoliviaBoliviaBolivia
Chile
BoliviaBoliviaBoliviaBolivia
ParaguayParaguay
Bolivia
Chile
BoliviaBoliviaBoliviaBolivia
Chile
Paraguay
Chile
ParaguayParaguayParaguay
Uruguay
ParaguayParaguayParaguay
Bolivia
ChileChile
Paraguay
Chile
Paraguay
Chile
Paraguay
Bolivia
Paraguay
BoliviaBoliviaBoliviaBoliviaBolivia
Uruguay
Bolivia
Chile
Uruguay
BoliviaBoliviaBoliviaBolivia
Paraguay
BoliviaBolivia
Paraguay
BoliviaBolivia
Paraguay
Bolivia
Chile
Bolivia
ParaguayParaguay
Bolivia
Paraguay
BoliviaBolivia
Paraguay
BoliviaBolivia
Paraguay
Bolivia
Paraguay
Chile
Bolivia
Paraguay
BoliviaBoliviaBolivia
Chile
BoliviaBoliviaBolivia
ParaguayParaguay
New Zealand
Korea
ChinaChina
Phillipines
New Zealand
India United Kingdom
Viet Nam
Phillipines
United Kingdom
Viet Nam
Phillipines
United KingdomIndia United KingdomUnited Kingdom
Viet Nam
Malaysia
ChinaChina
Viet NamSouth Africa
New Zealand
ChinaChinaUnited Kingdom
PhillipinesPhillipines
Viet Nam
Greece
Viet Nam
Phillipines
New ZealandViet Nam
Phillipines
New Zealand
United KingdomUnited Kingdom
Viet Nam
China
New ZealandViet Nam
New Zealand
China
Phillipines
United Kingdom ChinaUnited KingdomUnited KingdomUnited Kingdom
Phillipines
ItalyItaly
Phillipines
United KingdomUnited KingdomUnited Kingdom China
New Zealand
United Kingdom
New ZealandViet Nam
Phillipines
United KingdomUnited KingdomUnited KingdomUnited Kingdom
Malaysia
China
New Zealand
United Kingdom
New ZealandViet Nam
Phillipines
Malaysia
United Kingdom
Malaysia
New Zealand
United Kingdom
New Zealand
South AfricaPhillipines
United Kingdom
Viet Nam
United Kingdom
Phillipines
United Kingdom
Malaysia
Viet NamViet NamViet Nam
United States
United Kingdom
Viet Nam
MalaysiaMalaysiaMalaysia
Phillipines
MalaysiaMalaysia
Phillipines
United Kingdom
New Zealand
Italy
Phillipines
United Kingdom
New Zealand
Italy United KingdomUnited Kingdom
Viet Nam
Phillipines
United KingdomUnited Kingdom
New ZealandNew Zealand
India
Phillipines
United Kingdom China
Viet Nam
ChinaChinaChina
Viet NamNew Zealand
Italy United KingdomUnited Kingdom
United StatesGreece
India
Viet Nam
IndiaIndia
New Zealand
Phillipines
China
Viet Nam
India
United States
Phillipines
United KingdomUnited KingdomUnited Kingdom
South Africa
New ZealandNew Zealand
United Kingdom China
New Zealand
Netherlands
New Zealand
Netherlands
Viet Nam
India ChinaIndia United Kingdom
Greece
United Kingdom
Korea
Phillipines
ChinaUnited KingdomUnited Kingdom
New Zealand
Malaysia
China
New ZealandNew ZealandNew Zealand
Phillipines
New ZealandNew ZealandNew Zealand
United KingdomUnited Kingdom China
New ZealandNew Zealand
United KingdomIndia
New Zealand
United Kingdom
New Zealand
United Kingdom
New Zealand
ChinaChina
New ZealandNew Zealand
United Kingdom
New Zealand
United Kingdom China
New Zealand
China
New Zealand
United Kingdom
New Zealand
United KingdomUnited Kingdom
New ZealandNew ZealandNew ZealandNew Zealand
United KingdomUnited Kingdom
Viet NamNew Zealand
United Kingdom
New Zealand
India
New ZealandNew ZealandNew Zealand
United KingdomUnited KingdomUnited Kingdom
New ZealandNew ZealandNew Zealand
China
New Zealand
United KingdomUnited Kingdom
United States
China
New Zealand
United Kingdom
New ZealandNew Zealand
Phillipines
New ZealandNew ZealandNew ZealandNew ZealandNew ZealandNew Zealand
United Kingdom
Phillipines
United KingdomUnited KingdomUnited Kingdom
New Zealand
United Kingdom
New ZealandNew Zealand
ChinaIndia
New Zealand
ChinaChina
Greece
United KingdomUnited Kingdom
Viet NamNew Zealand
Phillipines
United Kingdom
New ZealandNew Zealand
South Africa
New Zealand
India China
New Zealand
Phillipines
New Zealand
China
New ZealandNew ZealandViet Nam
Phillipines
New ZealandNew Zealand
United KingdomUnited Kingdom
New ZealandNew Zealand
United States
New ZealandViet Nam
United States
South AfricaPhillipines
New Zealand
Phillipines
New ZealandNew Zealand
India United KingdomUnited Kingdom
New Zealand
Italy United Kingdom
Viet NamNew ZealandNew Zealand
India China
Phillipines
United KingdomUnited Kingdom
New ZealandNew ZealandNew Zealand
Phillipines
New ZealandNew ZealandNew Zealand
Phillipines
United Kingdom
New Zealand
Phillipines
New Zealand
United Kingdom
New ZealandNew ZealandNew ZealandViet Nam
China
New ZealandViet Nam
United Kingdom
New ZealandNew ZealandNew ZealandNew ZealandViet Nam
China
New Zealand
ChinaUnited KingdomUnited Kingdom
Phillipines
New ZealandNew ZealandNew Zealand
China
Viet Nam
Phillipines
India
Viet Nam
United KingdomUnited KingdomUnited KingdomUnited KingdomUnited KingdomUnited Kingdom
Phillipines
United Kingdom ChinaUnited Kingdom
Phillipines
United KingdomUnited Kingdom China
Phillipines
India
Viet Nam
United KingdomIndia United KingdomUnited Kingdom
Viet Nam
ChinaItaly United KingdomUnited Kingdom China
New Zealand
United KingdomItaly China
Malaysia
ChinaUnited KingdomUnited Kingdom
Phillipines
United Kingdom
South Africa
United KingdomUnited KingdomUnited Kingdom ChinaUnited Kingdom
Phillipines
United Kingdom
Viet Nam
United Kingdom
New Zealand
Korea
Phillipines
New Zealand
Italy
South AfricaSouth Africa
United KingdomItaly
New Zealand
United KingdomUnited Kingdom
Germany
Phillipines
ChinaChinaChina
Viet Nam
ChinaChinaUnited Kingdom
Viet NamViet Nam
Italy
MalaysiaMalaysia
United Kingdom
Phillipines
China
Phillipines
United KingdomItaly
Phillipines
China
New Zealand
ChinaUnited KingdomUnited Kingdom
New ZealandViet Nam
ChinaChinaUnited KingdomUnited KingdomIndiaIndiaIndia
New ZealandNew Zealand
United Kingdom
New ZealandNew Zealand
United KingdomUnited KingdomUnited KingdomUnited Kingdom
Phillipines
China
South Africa
New Zealand
China
Korea
Phillipines
United Kingdom
New Zealand
United KingdomUnited Kingdom
KoreaKorea
New Zealand
India
New Zealand
United Kingdom
PhillipinesPhillipines
New ZealandNew Zealand
United KingdomUnited Kingdom
United States
Phillipines
United Kingdom
Korea
Phillipines
Italy
Phillipines
United KingdomIndia China
New Zealand
United KingdomUnited Kingdom
Viet NamViet NamNew ZealandNew Zealand
United KingdomItaly China
Viet NamViet NamSouth AfricaSouth Africa
Malaysia
United KingdomUnited Kingdom China
New Zealand
United KingdomItaly
Viet Nam
India United KingdomUnited KingdomIndia
Phillipines
United Kingdom ChinaItalyItaly United Kingdom
Greece
China
Viet NamNew ZealandNew Zealand
Viet Nam
United Kingdom
Korea
Phillipines
China
Phillipines
United KingdomUnited KingdomIndia
Viet NamViet Nam
Italy ChinaIndia China
Phillipines
New Zealand
Italy
South Africa
Italy
Viet NamNew Zealand
United Kingdom
New Zealand
Netherlands
Phillipines
New Zealand
United Kingdom
Phillipines
New Zealand
India
New ZealandNew Zealand
United Kingdom
Viet Nam
United Kingdom
Phillipines
United KingdomIndia
Greece
United KingdomUnited Kingdom China
Viet Nam
United KingdomUnited KingdomUnited KingdomItalyItaly United Kingdom
South Africa
New Zealand
India
New Zealand
China
Viet Nam
United Kingdom ChinaUnited KingdomUnited KingdomIndia
Phillipines
United Kingdom China
New Zealand
India United Kingdom
South Africa
China
Korea
United KingdomUnited KingdomUnited Kingdom
New Zealand
ChinaUnited KingdomUnited KingdomUnited Kingdom
New Zealand
United Kingdom
Phillipines
United KingdomUnited Kingdom China
Viet Nam
ChinaChina
New Zealand
United KingdomItaly ChinaChinaUnited Kingdom
New ZealandNew ZealandViet NamViet Nam
United Kingdom
New Zealand
United States
South Africa
China
New Zealand
ChinaUnited KingdomItalyIndia ItalyItaly United KingdomItaly ChinaIndia
Viet Nam
Italy
Malaysia
United KingdomIndia United Kingdom
Viet NamNew Zealand
ChinaItalyIndia Italy United KingdomItaly
New Zealand
India China
New Zealand
China
Phillipines
Italy
Phillipines
Italy
Viet NamNew Zealand
South Africa
New Zealand
Phillipines
Viet Nam
United Kingdom
Phillipines
China
Viet NamNew ZealandNew ZealandNew ZealandNew Zealand
United Kingdom
Phillipines
Viet NamViet Nam
United Kingdom
Viet NamNew Zealand
South AfricaViet Nam
United Kingdom ChinaItalyItaly
New Zealand
ChinaChina
New Zealand
United Kingdom
United States
New Zealand
Malaysia
Viet Nam
United KingdomUnited Kingdom
Phillipines
China
Phillipines
New Zealand
Phillipines
United Kingdom
Phillipines
China
New ZealandViet Nam
United Kingdom
Phillipines
India
Phillipines
United KingdomItaly
New Zealand
United Kingdom
Phillipines
New Zealand
Greece
United Kingdom
Phillipines
India United Kingdom ChinaIndia United KingdomUnited KingdomUnited KingdomUnited KingdomUnited KingdomItaly
New Zealand
Phillipines
Viet Nam
ItalyItaly
Phillipines
United Kingdom
Phillipines
United Kingdom
Malaysia
ChinaItaly
Viet Nam
Greece
Phillipines
New Zealand
Italy ChinaIndia United KingdomUnited Kingdom China
New Zealand
United Kingdom
Viet NamNew Zealand
Phillipines
China
New ZealandNew ZealandViet Nam
United Kingdom
New ZealandViet Nam
United Kingdom
New Zealand
South Africa
Italy United Kingdom
Viet Nam
Korea
United Kingdom ChinaIndia
New Zealand
United KingdomUnited Kingdom
Viet NamViet Nam
China
Phillipines
China
New Zealand
China
Viet Nam
PhillipinesPhillipines
United Kingdom
New Zealand
India
New Zealand
India
Malaysia
Italy
Viet Nam
China
Phillipines
ChinaChinaUnited Kingdom
Viet NamViet Nam
China
Viet Nam
United Kingdom
New ZealandNew Zealand
Greece
United KingdomIndia United Kingdom ChinaIndia United Kingdom ChinaChinaUnited KingdomItaly
South Africa
India
New Zealand
ChinaIndiaIndia
New Zealand
Greece
United KingdomUnited KingdomUnited Kingdom
Malaysia
United KingdomIndiaIndia United KingdomItaly ChinaChinaIndia
Viet Nam
United Kingdom
United States
Germany
IndiaIndiaIndia
Viet NamNew Zealand
China
Phillipines
India
New Zealand
India
Phillipines
ItalyIndia
Phillipines
India China
Malaysia
India ChinaUnited KingdomIndia
Phillipines
IndiaIndia
Phillipines
India China
United States
India United KingdomIndia ChinaIndia
Viet Nam
United Kingdom China
Greece
China
GermanyNew Zealand
United Kingdom
Greece
United Kingdom
Viet Nam
United KingdomIndia China
New Zealand
Greece
United KingdomUnited Kingdom
Greece
United Kingdom
Greece
Viet NamGermany
United Kingdom
Germany
India
New Zealand
United Kingdom
GermanyNew Zealand
United Kingdom
New Zealand
ChinaIndia China
Germany
ChinaChinaIndia
New ZealandGermany
ChinaItaly
Viet Nam
United Kingdom
New Zealand
ChinaChina
New Zealand
ChinaUnited KingdomUnited KingdomUnited Kingdom
PhillipinesPhillipines
China
New Zealand
United Kingdom
Phillipines
India United KingdomUnited KingdomUnited Kingdom
PhillipinesSouth Africa
United Kingdom
New Zealand
Phillipines
United KingdomUnited Kingdom ChinaItaly United KingdomItalyItaly
Viet Nam
United Kingdom ChinaIndia
New ZealandViet Nam
United Kingdom
Viet NamNew ZealandNew ZealandNew Zealand
Italy
New ZealandNew Zealand
Italy
GreeceGreece
United Kingdom
Malaysia
United Kingdom China
United States
United Kingdom
Phillipines
Italy United Kingdom
New Zealand
China
Viet Nam
Phillipines
United Kingdom China
Phillipines
United Kingdom
Korea
New Zealand
United Kingdom China
Phillipines
New ZealandViet Nam
PhillipinesPhillipinesPhillipines
United Kingdom
PhillipinesPhillipinesPhillipinesPhillipines
China
Viet Nam
Phillipines
New Zealand
United Kingdom
Viet NamViet Nam
United Kingdom
South AfricaPhillipinesPhillipinesPhillipinesPhillipinesPhillipines
South AfricaPhillipinesPhillipines
United Kingdom
Netherlands
United Kingdom ChinaUnited KingdomUnited KingdomUnited Kingdom
South Africa
India United KingdomUnited Kingdom
New Zealand
United Kingdom
Phillipines
ChinaChina
Greece
Phillipines
United Kingdom
Viet Nam
United Kingdom
Viet Nam
United KingdomUnited KingdomUnited KingdomUnited Kingdom
Viet Nam
United KingdomUnited Kingdom
New Zealand
Phillipines
United Kingdom
New Zealand
India
Phillipines
New Zealand
Greece
ChinaUnited Kingdom
New Zealand
China
Viet Nam
United KingdomUnited Kingdom
Phillipines
Germany
Phillipines
United Kingdom
Greece
United KingdomUnited Kingdom
New Zealand
ChinaUnited Kingdom
Korea
United KingdomUnited Kingdom ChinaUnited Kingdom
Viet Nam
ChinaUnited Kingdom
Phillipines
United KingdomUnited Kingdom
PhillipinesPhillipines
India United KingdomUnited Kingdom ChinaChinaUnited Kingdom
Phillipines
United KingdomUnited Kingdom
Phillipines
United Kingdom
New Zealand
United Kingdom
Viet NamViet Nam
China
New Zealand
United Kingdom
New Zealand
Malaysia
ChinaIndia
Viet Nam
Greece
India United Kingdom ChinaUnited KingdomUnited KingdomUnited Kingdom
Viet NamViet Nam
United KingdomUnited KingdomUnited KingdomUnited KingdomUnited KingdomUnited KingdomIndia
New Zealand
Korea
United KingdomUnited KingdomUnited Kingdom
South Africa
New Zealand
United KingdomUnited Kingdom China
Phillipines
New Zealand
United Kingdom
Viet Nam
United Kingdom ChinaUnited KingdomUnited Kingdom
South AfricaViet Nam
United KingdomUnited Kingdom
Malaysia
ChinaUnited Kingdom ChinaUnited Kingdom
New Zealand
United Kingdom
Korea
Viet Nam
United Kingdom China
United States
India United Kingdom
New Zealand
United Kingdom
Malaysia
Phillipines
Italy United KingdomUnited Kingdom
New Zealand
United Kingdom
Phillipines
Viet NamNew Zealand
United Kingdom
PhillipinesPhillipines
Viet Nam
Phillipines
New Zealand
United Kingdom China
New Zealand
Phillipines
New Zealand
United Kingdom
New ZealandNew Zealand
South Africa
United Kingdom China
New Zealand
United Kingdom
Phillipines
Viet Nam
PhillipinesSouth Africa
China
Viet Nam
United KingdomUnited KingdomUnited Kingdom China
New ZealandViet Nam
New Zealand
United Kingdom
Viet Nam
Phillipines
United Kingdom
Greece
ChinaChina
Viet Nam
Korea
China
United States
ChinaChinaUnited Kingdom
PhillipinesPhillipines
United KingdomIndia China
PhillipinesPhillipines
Korea
Phillipines
Viet NamViet Nam
China
Viet NamViet Nam
United KingdomUnited Kingdom
New Zealand
Greece
Phillipines
Greece
Phillipines
ChinaUnited KingdomUnited Kingdom
Phillipines
China
Viet Nam
India ChinaChinaChinaChinaUnited Kingdom ChinaIndia China
PhillipinesPhillipines
United Kingdom China
Phillipines
United KingdomUnited KingdomUnited Kingdom
Viet Nam
United KingdomUnited KingdomUnited Kingdom China
Viet Nam
ChinaChina
Viet Nam
ChinaUnited Kingdom
New Zealand
United Kingdom
Phillipines
Viet Nam
United Kingdom
Phillipines
United KingdomUnited Kingdom ChinaUnited Kingdom ChinaUnited KingdomIndia
Phillipines
China
Korea
United KingdomUnited Kingdom
Netherlands
Viet Nam
United Kingdom China
Phillipines
Viet Nam
China
New ZealandNew ZealandViet Nam
United Kingdom
United States
United Kingdom
Phillipines
United Kingdom China
Phillipines
Greece
Phillipines
Viet Nam
United KingdomUnited KingdomUnited Kingdom
United States
United Kingdom ChinaIndia United Kingdom China
Viet NamViet NamViet Nam
United Kingdom
New ZealandViet Nam
China
Phillipines
China
New ZealandViet Nam
United Kingdom
South Africa
ItalyIndiaIndia
New Zealand
Phillipines
Viet Nam
United Kingdom
New ZealandNew Zealand
ChinaIndia
New Zealand
China
New ZealandViet NamViet Nam
Italy ChinaUnited Kingdom
Germany
United KingdomUnited KingdomIndia
Phillipines
India
Greece
India
Netherlands
China
South Africa
New Zealand
China
Viet NamNew Zealand
United States
South AfricaPhillipines
New Zealand
United KingdomUnited Kingdom ChinaUnited KingdomUnited Kingdom
Viet Nam
Phillipines
ChinaUnited Kingdom China
New ZealandViet Nam
New Zealand
Greece
Viet NamNew ZealandNew Zealand
United KingdomUnited Kingdom ChinaIndia ChinaUnited Kingdom ChinaItaly
New ZealandViet Nam
ChinaItaly United Kingdom China
South Africa
United Kingdom
Viet NamViet Nam
United KingdomUnited KingdomItaly ChinaChinaChinaIndia
New Zealand
Phillipines
New Zealand
United Kingdom
Phillipines
United States
New Zealand
Phillipines
Korea
United KingdomUnited Kingdom
New Zealand
United KingdomUnited KingdomUnited Kingdom
Viet Nam
China
New ZealandViet Nam
United Kingdom
Phillipines
New ZealandViet Nam
ChinaUnited Kingdom
Viet Nam
ChinaChinaUnited Kingdom
New Zealand
United KingdomIndia
Korea
China
Viet Nam
ChinaUnited Kingdom
Phillipines
Italy ChinaUnited Kingdom
New Zealand
China
Korea
United Kingdom
Phillipines
ChinaChinaUnited Kingdom
Phillipines
New Zealand
United KingdomIndia
New ZealandViet Nam
Phillipines
Greece
Phillipines
United KingdomUnited KingdomIndia
Viet Nam
United KingdomUnited KingdomUnited Kingdom
Viet Nam
ChinaUnited Kingdom
Phillipines
ChinaChina
Viet Nam
ChinaChina
Viet NamNew Zealand
United States
New ZealandNew Zealand
United KingdomUnited KingdomUnited KingdomUnited Kingdom
Viet NamViet Nam
United Kingdom ChinaUnited KingdomIndia
Greece
United Kingdom
Viet Nam
United Kingdom China
Viet NamViet Nam
China
Phillipines
New Zealand
United KingdomUnited KingdomIndia United KingdomUnited Kingdom
New Zealand
India
New Zealand
South Africa
United Kingdom
Viet Nam
India Italy ChinaUnited Kingdom
Phillipines
ChinaChina
New Zealand
Phillipines
India Italy ChinaIndia
Greece
United Kingdom
New Zealand
Phillipines
China
Viet Nam
United KingdomUnited Kingdom
New Zealand
United KingdomIndiaIndia
Phillipines
United States
ChinaIndia
New Zealand
United Kingdom
New Zealand
United Kingdom
United StatesGreece
United Kingdom ChinaUnited Kingdom ChinaIndia ItalyIndia
Korea
New ZealandViet Nam
United KingdomIndia United Kingdom
Viet Nam
India United Kingdom
Phillipines
United Kingdom
Malaysia
United Kingdom
Malaysia
China
New Zealand
United Kingdom
Korea
Viet NamViet Nam
Malaysia
New Zealand
Italy ChinaUnited Kingdom
Phillipines
Viet Nam
United Kingdom
PhillipinesPhillipines
United Kingdom
New Zealand
United Kingdom
New Zealand
United Kingdom
Netherlands
China
Viet NamNew Zealand
ItalyItaly United KingdomUnited Kingdom
Phillipines
India
New Zealand
Phillipines
United Kingdom
Viet Nam
United KingdomUnited Kingdom
Viet Nam
ChinaUnited KingdomUnited KingdomIndia
Germany
Phillipines
United Kingdom
Phillipines
New ZealandViet Nam
United KingdomUnited Kingdom
Phillipines
China
New Zealand
United States
United Kingdom
Viet NamNew Zealand
Viet Nam
ChinaChina
Viet Nam
China
Phillipines
United KingdomUnited KingdomUnited KingdomUnited KingdomUnited Kingdom
New Zealand
Phillipines
United Kingdom ChinaUnited Kingdom
United States
United Kingdom
Phillipines
Greece
Viet Nam
United KingdomIndia
South Africa
New Zealand
United KingdomUnited Kingdom China
Viet Nam
China
Phillipines
United Kingdom ChinaUnited Kingdom
Netherlands
China
Phillipines
New Zealand
India United KingdomUnited Kingdom
Korea
Viet NamNew Zealand
United Kingdom
New ZealandNew Zealand
United Kingdom
Greece
New Zealand
United KingdomUnited KingdomUnited Kingdom
Phillipines
India United KingdomUnited Kingdom
Viet NamNew Zealand
Phillipines
New Zealand
United States
New Zealand
ChinaUnited Kingdom
New Zealand
United KingdomUnited Kingdom ChinaUnited Kingdom
PhillipinesPhillipines
Viet NamSouth Africa
ChinaChinaItaly United KingdomIndiaIndia China
New Zealand
United States
United Kingdom
Phillipines
United Kingdom
South Africa
ChinaChina
Greece
United Kingdom China
Phillipines
United Kingdom
Viet NamViet NamViet NamViet NamViet NamViet NamViet Nam
United Kingdom
Viet Nam
China
Viet NamViet Nam
Phillipines
China
Viet NamViet NamViet Nam
United Kingdom
New ZealandNew ZealandViet NamViet NamViet NamViet NamViet Nam
China
Phillipines
China
Viet NamViet Nam
United Kingdom
Viet Nam
Netherlands
Phillipines
ChinaChina
Viet Nam
United Kingdom
New ZealandViet NamViet Nam
India
Phillipines
New Zealand
United States
United KingdomUnited Kingdom China
Viet Nam
United Kingdom
Viet Nam
China
Viet NamViet Nam
United States
Viet Nam
United Kingdom
Viet NamNew Zealand
Viet NamViet Nam
India United Kingdom
Viet Nam
United Kingdom
Viet NamViet Nam
Netherlands
United Kingdom
Viet Nam
Greece
New Zealand
India
Viet NamViet NamViet Nam
United Kingdom
Viet Nam
United KingdomUnited Kingdom
Viet Nam
United Kingdom
Germany Viet NamNew Zealand
United KingdomUnited Kingdom
Viet Nam
ChinaUnited Kingdom ChinaUnited Kingdom
New Zealand
India China
New Zealand
United KingdomUnited KingdomUnited Kingdom ChinaUnited KingdomItaly
Viet Nam
United KingdomUnited Kingdom
Korea
ChinaIndia United Kingdom
New ZealandViet Nam
ChinaIndia
Phillipines
China
New Zealand
China
South Africa
United Kingdom
South Africa
United Kingdom China
South Africa
China
South AfricaPhillipines
India
Viet Nam
United Kingdom ChinaUnited Kingdom
Viet NamSouth Africa
Greece
China
South AfricaSouth AfricaSouth Africa
New Zealand
United Kingdom
New ZealandViet Nam
South Africa
China
Phillipines
ChinaUnited KingdomUnited KingdomUnited Kingdom China
Germany
Phillipines
United Kingdom
Greece
New ZealandViet Nam
United Kingdom
South Africa
United KingdomUnited Kingdom
Viet Nam
United KingdomUnited Kingdom
New Zealand
United Kingdom ChinaUnited Kingdom
Viet Nam
ChinaChina
New Zealand
United Kingdom
Korea
Viet NamGermany Viet Nam
ChinaUnited KingdomUnited Kingdom ChinaChinaChinaUnited Kingdom
Viet NamViet Nam
United Kingdom ChinaChinaUnited Kingdom
Viet NamNew ZealandNew ZealandNew Zealand
Korea
United Kingdom
Viet NamNew Zealand
United Kingdom ChinaUnited Kingdom
Greece
United KingdomUnited KingdomUnited KingdomUnited KingdomItaly China
Germany
United Kingdom
Viet NamNew Zealand
Phillipines
China
New ZealandNew ZealandNew ZealandViet Nam
New ZealandNew Zealand
South Africa
India
New Zealand
China
New Zealand
United KingdomUnited Kingdom
New ZealandNew Zealand
United Kingdom
New ZealandViet Nam
New ZealandViet Nam
China
Viet Nam
United KingdomUnited Kingdom
Malaysia
New Zealand
United Kingdom
Viet NamNew Zealand
United States
New ZealandNew Zealand
Greece
India United Kingdom
Viet Nam
United Kingdom
Viet Nam
ChinaIndia
Netherlands
China
Phillipines
Viet Nam
China
South AfricaViet Nam
New Zealand
China
Phillipines
New Zealand
South Africa
New Zealand
India
New Zealand
United Kingdom
Viet Nam
Phillipines
China
Phillipines
Viet Nam
Korea
United Kingdom ChinaUnited Kingdom
Phillipines
New Zealand
ChinaChinaUnited Kingdom
PhillipinesPhillipines
India United Kingdom
Phillipines
India
Viet NamNew Zealand
United Kingdom China
New Zealand
ItalyIndia United KingdomIndia United Kingdom ChinaUnited KingdomUnited Kingdom ChinaChina
Phillipines
United Kingdom ChinaChina
Malaysia
China
South Africa
United Kingdom
Phillipines
Italy
Viet Nam
ChinaUnited KingdomUnited Kingdom ChinaItaly United Kingdom
South Africa
New Zealand
Phillipines
China
Phillipines
China
Greece
New Zealand
India
New ZealandViet Nam
China
Viet Nam
United Kingdom ChinaChina
Phillipines
ChinaUnited KingdomItaly ChinaUnited KingdomUnited Kingdom China
Viet Nam
Malaysia
Viet NamNew ZealandNew Zealand
United KingdomUnited Kingdom ChinaChinaChinaUnited KingdomUnited KingdomUnited Kingdom
Phillipines
China
Viet Nam
PhillipinesPhillipines
United KingdomUnited Kingdom ChinaUnited Kingdom China
Viet Nam
ChinaIndia
Viet Nam
United KingdomUnited Kingdom
New Zealand
ChinaUnited KingdomUnited KingdomIndia United Kingdom
Viet Nam
India
Phillipines
United KingdomUnited Kingdom
Viet Nam
United KingdomUnited KingdomItaly
Viet NamNew Zealand
PhillipinesPhillipines
Viet Nam
ChinaUnited Kingdom ChinaUnited Kingdom
New ZealandGermany
United KingdomUnited KingdomIndia
New Zealand
United Kingdom
New Zealand
United Kingdom
Korea
China
New ZealandNew Zealand
ChinaUnited Kingdom
New Zealand
ChinaIndia
New Zealand
China
Viet Nam
ChinaUnited Kingdom
Viet Nam
ChinaUnited KingdomUnited Kingdom ChinaChinaChinaUnited KingdomUnited Kingdom ChinaChinaItaly United Kingdom
Phillipines
Viet Nam
Phillipines
New Zealand
Phillipines
New Zealand
United KingdomIndia ChinaChinaItaly ChinaUnited KingdomUnited Kingdom China
New Zealand
China
Viet NamViet Nam
ChinaChina
Viet Nam
United KingdomUnited KingdomUnited Kingdom
New Zealand
United Kingdom
Viet Nam
Phillipines
New Zealand
ChinaChina
Viet Nam
Phillipines
United Kingdom
New ZealandViet Nam
India United Kingdom
Phillipines
United Kingdom
Malaysia
New Zealand
ChinaUnited KingdomUnited Kingdom ChinaChina
Phillipines
China
Germany
United KingdomUnited Kingdom
New ZealandViet Nam
ChinaUnited KingdomUnited Kingdom
New ZealandNew Zealand
ChinaChinaItaly United Kingdom
Germany
China
Phillipines
Greece
New Zealand
United Kingdom ChinaIndiaIndia
Viet NamNew Zealand
China
Viet Nam
United KingdomUnited Kingdom ChinaIndia
Viet Nam
China
South Africa
United KingdomUnited Kingdom China
Viet Nam
ChinaIndia Italy China
Viet Nam
ChinaChina
New Zealand
Korea
China
New Zealand
Phillipines
ChinaChinaChinaItaly
Viet Nam
Korea
Viet NamViet NamSouth Africa
United Kingdom China
Viet Nam
United Kingdom
Viet Nam
United Kingdom
New Zealand
China
New Zealand
ChinaChina
New Zealand
India
New ZealandViet Nam
India
South Africa
United Kingdom
Malaysia
Italy United KingdomIndia
Phillipines
New ZealandNew Zealand
Italy United Kingdom
Viet Nam
ChinaChinaItaly China
New ZealandNew Zealand
ChinaChinaChina
Viet Nam
ChinaChinaUnited Kingdom
Germany
ChinaUnited Kingdom ChinaChinaUnited KingdomUnited Kingdom ChinaUnited Kingdom
Phillipines
India
Malaysia
United KingdomIndiaIndia China
Viet Nam
United States
ChinaChina
PhillipinesPhillipinesSouth Africa
China
Phillipines
United Kingdom ChinaItaly
New Zealand
United Kingdom
Viet Nam
India
New ZealandNew Zealand
Greece
New Zealand
United KingdomUnited Kingdom ChinaChina
Phillipines
Greece
PhillipinesSouth Africa
United KingdomUnited KingdomUnited Kingdom
Viet NamViet Nam
ChinaUnited Kingdom China
New Zealand
United Kingdom ChinaChinaIndia ChinaIndia
Greece
United Kingdom
Phillipines
India ChinaIndia
Germany
Italy ChinaChinaUnited Kingdom
Viet Nam
United Kingdom ChinaUnited Kingdom
Viet Nam
China
Viet Nam
Italy
PhillipinesSouth Africa
Viet Nam
Italy China
South Africa
China
South Africa
Italy United Kingdom ChinaUnited Kingdom
Netherlands
China
Phillipines
India
South Africa
ChinaUnited Kingdom ChinaChinaChinaChinaUnited Kingdom ChinaUnited Kingdom China
New ZealandNew Zealand
China
Germany
Greece
ChinaChina
Korea
United Kingdom
South Africa
New Zealand
China
Phillipines
China
Greece
United KingdomIndia United Kingdom
Viet Nam
United KingdomItaly
New ZealandNew Zealand
India United KingdomIndia United Kingdom China
Viet Nam
China
New Zealand
United Kingdom China
Viet Nam
China
Turkey
Croatia
China
TurkeyTurkeyTurkey
Croatia
TurkeyTurkey
Romania
TurkeyTurkeyTurkeyTurkey
Germany
TurkeyTurkeyTurkey
Croatia
TurkeyTurkeyTurkey
Macedonia
Turkey
Germany
TurkeyTurkeyTurkeyTurkey
Romania
TurkeyTurkey
Germany
Turkey
Poland
TurkeyTurkey
Romania
Turkey
Poland
Turkey
CroatiaRomaniaCroatia
Turkey
Poland
HungaryTurkeyTurkeyTurkey
Poland
TurkeyTurkeyTurkeyTurkeyTurkeyTurkey
Croatia
TurkeyTurkeyTurkeyTurkey
Croatia
TurkeyTurkeyTurkeyTurkey
Germany
Romania
TurkeyTurkeyTurkeyTurkeyTurkeyTurkey
Romania
Germany
Romania
Turkey
Poland
Turkey
Poland
Turkey
Macedonia
Turkey
Croatia
Turkey
Poland
Turkey
Macedonia
Turkey
Croatia
Turkey
Germany
Turkey
Germany
Croatia
TurkeyTurkey
Croatia
TurkeyTurkey
Poland
Turkey
Croatia
Poland
TurkeyTurkey
Germany
CroatiaCroatiaRomaniaCroatia
TurkeyTurkeyTurkey
Germany
Romania
Turkey
Croatia
Poland
TurkeyTurkey
Croatia
TurkeyTurkeyTurkeyTurkey
Croatia
TurkeyTurkeyTurkeyTurkeyTurkeyTurkey
Romania
TurkeyTurkey
Romania
TurkeyTurkeyTurkey
CroatiaCroatiaRomaniaAlbania
TurkeyTurkeyTurkeyTurkey
Romania
TurkeyTurkeyTurkeyTurkey
Poland
Slovenia
Germany
Slovakia
TurkeyTurkeyTurkeyTurkeyTurkeyTurkeyTurkeyTurkey Hungary
Germany
TurkeyTurkeyTurkeyTurkeyTurkey
Romania
TurkeyTurkey
Croatia
Turkey
Croatia
Germany
TurkeyTurkeyTurkeyTurkeyTurkey
MacedoniaMacedonia
Poland
TurkeyTurkeyTurkey
Romania
TurkeyTurkey
Romania
TurkeyTurkeyTurkeyTurkeyTurkeyTurkey
Croatia
Turkey
Germany
Croatia
TurkeyTurkeyTurkeyTurkeyTurkeyTurkeyTurkeyTurkey
Romania
TurkeyTurkeyTurkeyTurkey
Germany
TurkeyTurkeyTurkey
Croatia
Germany
TurkeyTurkey
Croatia
Turkey
Poland
Macedonia
Poland
TurkeyTurkeyTurkeyTurkey
RomaniaCroatiaRomaniaCroatia
Germany
TurkeyTurkeyTurkey
Poland
Croatia
Turkey
Romania
Turkey
Croatia
Germany
Turkey
Germany
RomaniaRomaniaCroatiaCroatia
Slovenia
TurkeyTurkey
Poland
TurkeyTurkeyTurkeyTurkey
Croatia
TurkeyTurkey
Croatia
Poland
HungaryTurkeyTurkey HungaryTurkeyTurkey
Croatia
Slovenia
Turkey
Romania
Turkey
Croatia
TurkeyTurkey
Poland
TurkeyTurkeyTurkey
Macedonia
Turkey
Romania
TurkeyTurkeyTurkeyTurkeyTurkey
Romania
TurkeyTurkeyTurkeyTurkeyTurkeyTurkeyTurkey
Croatia
TurkeyTurkeyTurkeyTurkey HungaryTurkeyTurkeyTurkeyTurkeyTurkeyTurkeyTurkey
Poland
Croatia
TurkeyTurkey
Poland
Turkey
Poland
TurkeyTurkeyTurkey Hungary
Croatia
TurkeyTurkey
Croatia
TurkeyTurkeyTurkeyTurkeyTurkey
Romania
Turkey
RomaniaRomania
TurkeyTurkeyTurkeyTurkeyTurkey
Croatia
Poland
TurkeyTurkey
Croatia
TurkeyTurkey
Romania
TurkeyTurkey
Romania
TurkeyTurkeyTurkeyTurkeyTurkeyTurkey
Macedonia
Poland
Turkey
Romania
Turkey
Germany
Poland
TurkeyTurkeyTurkey
Croatia
Turkey
Germany
TurkeyTurkey
Germany
TurkeyTurkeyTurkeyTurkeyTurkey
Albania
Macedonia
Romania
Turkey
Romania
Germany
Russian Fed.TurkeyTurkey
Poland
Croatia
Turkey
Germany
TurkeyTurkeyTurkeyTurkeyTurkeyTurkeyTurkeyTurkey
Romania
TurkeyTurkeyTurkeyTurkeyTurkey
RomaniaRomania
TurkeyTurkeyTurkeyTurkeyTurkeyTurkeyTurkeyTurkeyTurkeyTurkey
Romania
TurkeyTurkeyTurkey
CroatiaCroatia
TurkeyTurkey
Poland
TurkeyTurkeyTurkeyTurkey
Romania
Poland
TurkeyTurkeyTurkey
Poland
TurkeyTurkey
Croatia
TurkeyTurkeyTurkeyTurkey
Romania
Poland
TurkeyTurkeyTurkeyTurkeyTurkeyTurkey
Poland
TurkeyTurkeyTurkeyTurkey
Croatia
TurkeyTurkey
Germany
Turkey
Romania
TurkeyTurkeyTurkeyTurkeyTurkeyTurkeyTurkeyTurkeyTurkeyTurkeyTurkey
Germany
Macedonia
TurkeyTurkey
Croatia
TurkeyTurkeyTurkeyTurkeyTurkeyTurkeyTurkey
Romania
Turkey
Romania
TurkeyTurkeyTurkeyTurkeyTurkeyTurkey
Macedonia
Turkey
RomaniaRomania
Turkey
Croatia
Slovenia
TurkeyTurkeyTurkeyRussian Fed.
Macedonia
TurkeyTurkeyTurkeyTurkeyTurkeyTurkey
Croatia
Turkey
Slovakia
Romania
TurkeyTurkeyTurkeyTurkeyTurkey
Romania
TurkeyTurkeyTurkeyTurkeyTurkeyTurkeyTurkey
Croatia
TurkeyTurkeyTurkeyTurkeyTurkeyTurkeyTurkey
Germany
Romania
TurkeyTurkeyTurkey
Macedonia
CroatiaCroatia
TurkeyTurkey
Croatia
TurkeyTurkeyTurkey
Romania
Germany
TurkeyTurkeyTurkeyTurkeyTurkey
Macedonia
Croatia
Turkey
Poland
Croatia
Macedonia
Croatia
Poland
TurkeyTurkeyTurkey
Romania
TurkeyTurkey
Germany
Poland
TurkeyTurkeyTurkeyTurkey
Germany
Turkey
Romania
TurkeyTurkey
Croatia
Germany
TurkeyTurkeyTurkey
Slovenia
TurkeyRussian Fed.
TurkeyTurkey
Macedonia
TurkeyTurkeyTurkeyTurkeyTurkey
Germany
TurkeyTurkey
Macedonia
Romania
Turkey
RomaniaCroatiaCroatia
Turkey
Poland
CroatiaCroatia
TurkeyTurkey
Romania
Poland
TurkeyTurkeyTurkeyTurkey
Croatia
TurkeyTurkey
Poland
TurkeyTurkeyTurkeyTurkeyTurkeyTurkeyTurkey
Macedonia
Turkey
Slovenia
Poland
Romania
TurkeyTurkeyTurkeyTurkeyTurkey
CroatiaCroatia
TurkeyTurkeyTurkey
Poland
TurkeyTurkey
Germany
Turkey
Poland
Turkey
Albania
TurkeyTurkeyTurkeyTurkeyTurkeyTurkey
Croatia
Germany
TurkeyTurkey
CroatiaRomania
TurkeyTurkey
Macedonia
Germany
CroatiaRomania
Poland
Turkey
Croatia
HungaryTurkeyTurkeyTurkeyTurkey
Croatia
TurkeyTurkeyTurkeyTurkeyTurkeyTurkeyTurkeyTurkeyTurkey
PolandAlbania
TurkeyTurkey
Croatia
Macedonia
Turkey
PolandPoland
TurkeyTurkeyTurkeyTurkey
Germany
Croatia
TurkeyTurkeyTurkeyTurkeyTurkey
Germany
TurkeyTurkeyTurkeyTurkeyTurkeyTurkeyTurkeyTurkeyTurkeyTurkey
Germany
TurkeyTurkey
Slovakia
Turkey
Croatia
TurkeyTurkeyTurkeyTurkeyTurkey
Romania
Turkey
Poland
TurkeyTurkey
China
Croatia
TurkeyTurkey
CroatiaCroatia
Turkey
Germany
TurkeyTurkeyTurkeyTurkeyTurkeyTurkeyTurkeyTurkeyTurkeyTurkey
Poland
TurkeyTurkeyTurkeyTurkeyTurkeyTurkeyTurkeyTurkey
PolandPoland
Turkey
Romania
TurkeyTurkey
Germany
TurkeyTurkeyTurkey
France
TurkeyTurkey
France
TurkeyTurkeyTurkeyTurkeyTurkeyTurkeyTurkeyTurkey
France
TurkeyTurkey
France
Netherlands
Turkey
France
TurkeyTurkey
France
Turkey
Netherlands
TurkeyTurkeyTurkeyTurkeyTurkeyTurkey
France
TurkeyTurkey
France
Turkey
France
Turkey
Netherlands
TurkeyTurkeyTurkeyTurkey
Netherlands
Turkey
Netherlands
TurkeyTurkey
FranceFrance
TurkeyTurkeyTurkey
Netherlands
France
Turkey
France
Turkey
France
TurkeyTurkeyTurkeyTurkeyTurkeyTurkeyTurkey
France
TurkeyTurkeyTurkeyTurkey
GermanyFrance
Turkey
France
Netherlands
Turkey
Germany
Turkey
France
TurkeyTurkeyTurkeyTurkeyTurkeyTurkeyTurkeyTurkey
France
Turkey
Germany
TurkeyTurkeyTurkey
Netherlands
Turkey
Netherlands
TurkeyTurkey
Netherlands
France
Netherlands
TurkeyTurkeyTurkeyTurkeyTurkeyTurkeyTurkeyTurkey
France
TurkeyTurkeyTurkeyTurkeyTurkey
France
Netherlands
Turkey
France
TurkeyTurkeyTurkey
NetherlandsNetherlands
TurkeyTurkeyTurkeyTurkeyTurkeyTurkeyTurkeyTurkeyTurkeyTurkey
Netherlands
Turkey
Netherlands
TurkeyTurkeyTurkeyTurkey
Germany
TurkeyTurkeyTurkey
France
Netherlands
TurkeyTurkeyTurkey
France
TurkeyTurkey
France
TurkeyTurkey
Netherlands
Turkey
Netherlands
Turkey
Germany
TurkeyTurkeyTurkeyTurkeyTurkeyTurkeyTurkeyTurkeyTurkey
Germany
TurkeyTurkey
Netherlands
Turkey
FranceFrance
TurkeyTurkeyTurkeyTurkeyTurkeyTurkey
FranceFrance
Turkey
Netherlands
TurkeyTurkeyTurkey
Germany
Turkey
Germany
TurkeyTurkey
FranceFrance
TurkeyTurkeyTurkey
Germany
Turkey
France
Netherlands
Turkey
Netherlands
TurkeyTurkeyTurkeyTurkey
France
Turkey
Germany
Turkey
France
TurkeyTurkeyTurkey
France
Turkey
France
Turkey
France
TurkeyTurkeyTurkeyTurkey
France
TurkeyTurkey
France
TurkeyTurkey
France
TurkeyTurkeyTurkeyTurkeyTurkey
France
TurkeyTurkeyTurkeyTurkeyTurkeyTurkeyTurkeyTurkeyTurkey
France
TurkeyTurkeyTurkey
France
TurkeyTurkeyTurkeyTurkeyTurkeyTurkey
Netherlands
TurkeyTurkeyTurkeyTurkeyTurkeyTurkey
France
TurkeyTurkeyTurkeyTurkeyTurkeyTurkey
NetherlandsNetherlands
Turkey
Germany
TurkeyTurkeyTurkeyTurkey
Netherlands
Germany
Turkey
France
TurkeyTurkey
Germany
TurkeyTurkeyTurkey
Germany
Turkey
FranceFranceFrance
TurkeyTurkey
France
TurkeyTurkeyTurkeyTurkey
FranceFranceGermany
TurkeyTurkeyTurkeyTurkeyTurkeyTurkeyTurkey
France
Turkey
Netherlands
FranceFrance
TurkeyTurkeyTurkeyTurkeyTurkeyTurkeyTurkeyTurkeyTurkeyTurkeyTurkey
France
TurkeyTurkeyTurkeyTurkeyTurkeyTurkeyTurkeyTurkeyTurkeyTurkey
FranceFranceFrance
Turkey
France
TurkeyTurkeyTurkeyTurkeyTurkey
France
TurkeyTurkeyTurkeyTurkey
FranceFrance
Netherlands
TurkeyTurkeyTurkey
France
TurkeyTurkeyTurkeyTurkeyTurkeyTurkey
France
TurkeyTurkey
Germany
Netherlands
Germany
Netherlands
TurkeyTurkey
France
TurkeyTurkey
Germany
Turkey
France
Turkey
Germany
TurkeyTurkey
Germany
TurkeyTurkey
Netherlands
Germany
TurkeyTurkey
Netherlands
TurkeyTurkeyTurkeyTurkeyTurkeyTurkey
France
Netherlands
FranceGermany
TurkeyTurkeyTurkey
Germany
Turkey
Germany
TurkeyTurkey
GermanyGermany
NetherlandsNetherlands
France
TurkeyTurkeyTurkeyTurkeyTurkeyTurkeyTurkeyTurkeyTurkeyTurkey
Netherlands
TurkeyTurkeyTurkeyTurkeyTurkeyTurkeyTurkey
France
Netherlands
France
TurkeyTurkeyTurkeyTurkeyTurkeyTurkeyTurkeyTurkeyTurkeyTurkey
FranceFranceFrance
TurkeyTurkeyTurkeyTurkeyTurkeyTurkey
FranceFrance
TurkeyTurkeyTurkey
Netherlands
TurkeyTurkeyTurkey
Netherlands
TurkeyTurkeyTurkeyTurkey
Germany
Turkey
France
Turkey
FranceGermany
TurkeyTurkeyTurkeyTurkey
Germany
Turkey
Germany
TurkeyTurkeyTurkey
France
Turkey
France
TurkeyTurkeyTurkeyTurkeyTurkeyTurkey
Netherlands
France
TurkeyTurkeyTurkeyTurkeyTurkey
Germany
TurkeyTurkey
Netherlands
TurkeyTurkeyTurkeyTurkey
France
TurkeyTurkeyTurkeyTurkeyTurkeyTurkey
Netherlands
France
TurkeyTurkey
Germany
Turkey
GermanyGermanyFrance
TurkeyTurkeyTurkeyTurkeyTurkeyTurkeyTurkeyTurkey
FranceFrance
Turkey
France
Turkey
France
Turkey
France
Turkey
France
Turkey
France
Turkey
Netherlands
TurkeyTurkeyTurkey
Netherlands
TurkeyTurkey
France
TurkeyTurkeyTurkeyTurkeyTurkeyTurkey
Germany
TurkeyTurkeyTurkeyTurkey
Germany
TurkeyTurkey
FranceFrance
TurkeyTurkeyTurkeyTurkeyTurkeyTurkeyTurkeyTurkeyTurkey
Netherlands
Germany
Netherlands
Turkey
France
TurkeyTurkeyTurkeyTurkeyTurkey
Germany
Netherlands
Turkey
Netherlands
Turkey
France
TurkeyTurkeyTurkey
Germany
Turkey
Germany
TurkeyTurkeyTurkeyTurkey
France
TurkeyTurkeyTurkey
FranceFranceFrance
TurkeyTurkeyTurkeyTurkeyTurkey
Netherlands
TurkeyTurkeyTurkeyTurkey
France
Slovakia
Viet Nam
SlovakiaSlovakiaSlovakia
Viet NamViet Nam
Slovakia
Viet NamViet NamViet Nam
Slovakia
Viet Nam
China
Viet NamViet Nam
Slovakia
Viet NamViet Nam
Slovakia
Viet NamViet NamViet Nam
SlovakiaSlovakiaSlovakia
Viet NamViet Nam
Russian Fed.
Viet NamViet NamViet Nam
Slovakia
Russian Fed.
SlovakiaSlovakiaSlovakia
Viet NamViet NamViet Nam
Slovakia
Viet Nam
Slovakia
Viet NamViet NamViet Nam
Slovakia
Viet Nam
Slovakia
Viet Nam
SlovakiaSlovakiaSlovakia
Viet Nam
Slovakia
Russian Fed.
Viet Nam
Russian Fed.
Viet Nam
China
Viet NamViet Nam
Russian Fed.
Slovakia
Viet Nam
Slovakia
Viet Nam
Slovakia
Viet NamViet NamViet Nam
Slovakia
Viet NamViet NamViet Nam
Russian Fed.
SlovakiaSlovakiaSlovakiaSlovakiaSlovakiaSlovakiaSlovakiaSlovakiaSlovakia
China
Slovakia
Viet NamViet Nam
Slovakia
Viet Nam
Slovakia
Viet NamViet NamViet Nam
Slovakia
Russian Fed.
SlovakiaSlovakia
Viet NamViet Nam
Russian Fed.
Slovakia
Viet NamViet NamViet NamViet Nam
SlovakiaSlovakia
Russian Fed.
SlovakiaSlovakiaSlovakia
Viet NamViet Nam
China
SlovakiaSlovakia
Viet Nam
China
Slovakia
Viet NamViet Nam
SlovakiaSlovakia
Viet NamViet Nam
SlovakiaSlovakiaSlovakia
Viet Nam
Slovakia
Viet Nam
Slovakia
Viet Nam
SlovakiaSlovakia
Viet Nam
Slovakia
Viet Nam
SlovakiaSlovakia
Viet Nam
SlovakiaSlovakia
Viet NamViet Nam
SlovakiaSlovakia
Russian Fed.Russian Fed.
Estonia
TurkeyRussian Fed.Russian Fed.
Estonia
China
Russian Fed.Turkey
Sweden
Russian Fed.
China
Russian Fed.Russian Fed.Russian Fed.Russian Fed.Russian Fed.Russian Fed.
EstoniaEstonia
Russian Fed.Russian Fed.Russian Fed.Russian Fed.
Estonia
China
Estonia
Russian Fed.
Sweden
Estonia
Russian Fed.
Estonia
Russian Fed.Russian Fed.Russian Fed.
EstoniaEstonia
Russian Fed.
EstoniaEstoniaEstoniaEstoniaEstonia
ChinaChina
Russian Fed.
Estonia
Russian Fed.Turkey
EstoniaEstonia
Sweden
Russian Fed.Russian Fed.Turkey
Sweden
Estonia
TurkeyRussian Fed.Russian Fed.Russian Fed.Russian Fed.Russian Fed.Russian Fed.Russian Fed.
TurkeyTurkeyRussian Fed.Russian Fed.
Estonia
Russian Fed.Turkey
EstoniaEstoniaEstonia
Russian Fed.Russian Fed.
Sweden
EstoniaEstonia
Russian Fed.Turkey
Estonia
Russian Fed.
China
Russian Fed.Russian Fed.Russian Fed.Russian Fed.Turkey
Estonia
Russian Fed.Russian Fed.
Estonia
Russian Fed.Turkey
EstoniaEstonia
China
Russian Fed.Russian Fed.
Estonia
Russian Fed.Russian Fed.Russian Fed.Russian Fed.Russian Fed.Russian Fed.Russian Fed.
Sweden
Russian Fed.Turkey
Estonia
Russian Fed.Russian Fed.Russian Fed.Russian Fed.
Sweden
Estonia
ChinaChina
TurkeyRussian Fed.Russian Fed.Russian Fed.Russian Fed.Russian Fed.
Sweden
Turkey
Estonia
China
Russian Fed.Russian Fed.Russian Fed.Russian Fed.
Estonia
Russian Fed.Russian Fed.
Estonia
Russian Fed.
Estonia
Russian Fed.TurkeyTurkey
Russian Fed.Russian Fed.
EstoniaEstoniaEstoniaEstonia
China
Turkey
EstoniaEstonia
Sweden
Estonia
Russian Fed.Russian Fed.
EstoniaEstonia
TurkeyRussian Fed.
EstoniaEstonia
Russian Fed.Turkey
Estonia
Russian Fed.Turkey
Russian Fed.
China
Turkey
Estonia
Russian Fed.
Estonia
Russian Fed.
EstoniaEstonia
Russian Fed.Russian Fed.Russian Fed.Russian Fed.
EstoniaEstonia
Russian Fed.
China
Russian Fed.Russian Fed.Russian Fed.Russian Fed.Russian Fed.Russian Fed.Russian Fed.Russian Fed.Russian Fed.
United States
Russian Fed.Russian Fed.
United States
Russian Fed.Russian Fed.
Ethiopia
United States
Ethiopia
United StatesUnited States
Russian Fed.Russian Fed.
Ethiopia
United States
Russian Fed.
Ethiopia
United States
Russian Fed.Russian Fed.Russian Fed.Russian Fed.Russian Fed.Russian Fed.
Ethiopia
Russian Fed.
Ethiopia
Russian Fed.
Ethiopia
Russian Fed.
United States
Russian Fed.
EthiopiaEthiopiaEthiopia
Russian Fed.Russian Fed.Russian Fed.Russian Fed.
United States
Russian Fed.Russian Fed.Russian Fed.Russian Fed.
United States
Ethiopia
Russian Fed.Russian Fed.
Ethiopia
Russian Fed.
Ethiopia
Russian Fed.Russian Fed.Russian Fed.
France
Russian Fed.
Ethiopia
Russian Fed.Russian Fed.
France
Russian Fed.Russian Fed.
United StatesUnited States
Russian Fed.
United States
France
Russian Fed.Russian Fed.Russian Fed.
EthiopiaFrance
Russian Fed.
France
Russian Fed.Russian Fed.Russian Fed.
United States
Russian Fed.Russian Fed.Russian Fed.Russian Fed.Russian Fed.Russian Fed.Russian Fed.Russian Fed.
Ethiopia
Russian Fed.
Ethiopia
Russian Fed.Russian Fed.Russian Fed.
France
United States
Russian Fed.
United States
Russian Fed.Russian Fed.
France
Russian Fed.Russian Fed.
Ethiopia
Russian Fed.
Ethiopia
Russian Fed.
France
United States
Russian Fed.
United States
Russian Fed.
France
Russian Fed.Russian Fed.Russian Fed.
United States
Russian Fed.Russian Fed.Russian Fed.Russian Fed.Russian Fed.Russian Fed.Russian Fed.Russian Fed.
France
United States
Ethiopia
Russian Fed.
Ethiopia
United States
Russian Fed.
Ethiopia
Russian Fed.Russian Fed.
France
Russian Fed.Russian Fed.
United States
Russian Fed.
United States
Russian Fed.
United States
Russian Fed.
EthiopiaEthiopia
Russian Fed.Russian Fed.
United StatesUnited States
Russian Fed.
United StatesUnited States
Russian Fed.
EthiopiaEthiopia
United States
France
Russian Fed.Russian Fed.
France
Russian Fed.Russian Fed.
United StatesUnited States
Russian Fed.Russian Fed.
United States
France
United States
Russian Fed.Russian Fed.Russian Fed.Russian Fed.
United States
Russian Fed.Russian Fed.
France
Russian Fed.
France
United States
Russian Fed.
United States
Russian Fed.Russian Fed.
United States
France
United States
Russian Fed.
Ethiopia
Russian Fed.Russian Fed.Russian Fed.
United States
France
Russian Fed.Russian Fed.
EthiopiaEthiopia
United StatesUnited States
Russian Fed.
France
Russian Fed.Russian Fed.
United States
Russian Fed.Russian Fed.Russian Fed.
Ethiopia
Russian Fed.
Ethiopia
Russian Fed.Russian Fed.
Ethiopia
Russian Fed.Russian Fed.Russian Fed.
United States
France
United States
Russian Fed.
EthiopiaFrance
Russian Fed.Russian Fed.Russian Fed.Russian Fed.
Ethiopia
Russian Fed.Russian Fed.Russian Fed.Russian Fed.Russian Fed.Russian Fed.Russian Fed.Russian Fed.Russian Fed.
Ethiopia
Russian Fed.Russian Fed.Russian Fed.Russian Fed.Russian Fed.Russian Fed.Russian Fed.Russian Fed.Russian Fed.Russian Fed.Russian Fed.Russian Fed.Russian Fed.
United States
France
Russian Fed.Russian Fed.
Ethiopia
Russian Fed.Russian Fed.
United States
Russian Fed.
United States
France
Russian Fed.
FranceFranceFrance
Russian Fed.Russian Fed.Russian Fed.
Ethiopia
Russian Fed.
Ethiopia
Russian Fed.Russian Fed.
France
Russian Fed.Russian Fed.
Ethiopia
Russian Fed.Russian Fed.Russian Fed.
Ethiopia
Russian Fed.
France
Russian Fed.Russian Fed.Russian Fed.Russian Fed.Russian Fed.Russian Fed.
France
Russian Fed.
EthiopiaEthiopiaFrance
Russian Fed.Russian Fed.
FranceEthiopia
Russian Fed.Russian Fed.Russian Fed.Russian Fed.
EthiopiaEthiopia
Russian Fed.
France
Russian Fed.
France
Russian Fed.
EthiopiaEthiopia
United States
France
Russian Fed.Russian Fed.
Ethiopia
Russian Fed.
EthiopiaFrance
Russian Fed.Russian Fed.Russian Fed.Russian Fed.Russian Fed.Russian Fed.
France
Russian Fed.Russian Fed.Russian Fed.Russian Fed.Russian Fed.Russian Fed.Russian Fed.Russian Fed.Russian Fed.
EthiopiaEthiopiaEthiopia
Russian Fed.Russian Fed.
Ethiopia
Russian Fed.
Ethiopia
Russian Fed.
Ethiopia
Russian Fed.
United States
Russian Fed.Russian Fed.Russian Fed.Russian Fed.
Ethiopia
Russian Fed.
FranceFrance
Russian Fed.
EthiopiaFrance
Russian Fed.
EthiopiaFrance
United States
Russian Fed.
France
United States
Ethiopia
Russian Fed.Russian Fed.Russian Fed.Russian Fed.
Ethiopia
Russian Fed.Russian Fed.Russian Fed.Russian Fed.Russian Fed.Russian Fed.
EthiopiaEthiopiaEthiopia
Russian Fed.Russian Fed.Russian Fed.
EthiopiaFrance
Russian Fed.Russian Fed.Russian Fed.Russian Fed.Russian Fed.
United States
Russian Fed.Russian Fed.Russian Fed.
EthiopiaEthiopia
Russian Fed.Russian Fed.
United States
Ethiopia
Russian Fed.Russian Fed.Russian Fed.Russian Fed.Russian Fed.
United States
FranceEthiopia
Russian Fed.Russian Fed.Russian Fed.Russian Fed.
Ethiopia
Russian Fed.
Ethiopia
Russian Fed.
Ethiopia
Russian Fed.
EthiopiaEthiopiaEthiopia
Russian Fed.
Ethiopia
Russian Fed.
Ethiopia
Russian Fed.Russian Fed.
Ethiopia
Russian Fed.
EthiopiaEthiopia
Russian Fed.Russian Fed.
United States
Russian Fed.
Ethiopia
Russian Fed.Russian Fed.Russian Fed.
FranceEthiopiaEthiopia
Russian Fed.
United States
Russian Fed.Russian Fed.Russian Fed.Russian Fed.Russian Fed.Russian Fed.
EthiopiaEthiopia
Russian Fed.
Ethiopia
Russian Fed.
Ethiopia
United States
Russian Fed.Russian Fed.Russian Fed.
Ethiopia
Russian Fed.
Ethiopia
Russian Fed.
EthiopiaEthiopia
United States
EthiopiaEthiopiaEthiopiaFrance
Russian Fed.
United States
Ethiopia
Russian Fed.Russian Fed.Russian Fed.Russian Fed.
EthiopiaFrance
Russian Fed.
France
Russian Fed.Russian Fed.
Ethiopia
Russian Fed.Russian Fed.Russian Fed.
Ethiopia
Russian Fed.Russian Fed.
Ethiopia
Russian Fed.Russian Fed.
Ethiopia
Russian Fed.Russian Fed.
Ethiopia
Russian Fed.Russian Fed.
EthiopiaEthiopia
Russian Fed.Russian Fed.
Ethiopia
Russian Fed.
United States
EthiopiaEthiopiaFrance
Russian Fed.Russian Fed.
Ethiopia
Russian Fed.Russian Fed.
Ethiopia
Russian Fed.Russian Fed.
Ethiopia
Russian Fed.Russian Fed.Russian Fed.Russian Fed.Russian Fed.Russian Fed.Russian Fed.Russian Fed.Russian Fed.Russian Fed.Russian Fed.
FranceEthiopia
Russian Fed.
United States
Russian Fed.Russian Fed.Russian Fed.Russian Fed.
EthiopiaFrance
Russian Fed.
FranceFrance
Russian Fed.
United States
Russian Fed.Russian Fed.Russian Fed.
Ethiopia
Russian Fed.Russian Fed.
France
Russian Fed.Russian Fed.Russian Fed.
Ethiopia
Russian Fed.
United States
Russian Fed.
Ethiopia
Russian Fed.Russian Fed.
France
Russian Fed.
France
Russian Fed.Russian Fed.Russian Fed.Russian Fed.Russian Fed.
France
Russian Fed.Russian Fed.Russian Fed.Russian Fed.
Ethiopia
Russian Fed.Russian Fed.Russian Fed.Russian Fed.
United States
Ethiopia
Russian Fed.Russian Fed.Russian Fed.
Ethiopia
United States
Russian Fed.
Ethiopia
Russian Fed.
United StatesUnited States
Russian Fed.
United States
Russian Fed.Russian Fed.
EthiopiaEthiopia
Russian Fed.Russian Fed.
FranceEthiopia
United States
Russian Fed.
France
Russian Fed.Russian Fed.
United States
Russian Fed.
FranceEthiopia
Russian Fed.Russian Fed.Russian Fed.Russian Fed.Russian Fed.Russian Fed.
Ethiopia
Russian Fed.Russian Fed.Russian Fed.Russian Fed.
Ethiopia
Russian Fed.Russian Fed.Russian Fed.Russian Fed.Russian Fed.Russian Fed.Russian Fed.Russian Fed.
United States
Russian Fed.Russian Fed.Russian Fed.
France
Russian Fed.
FranceFrance
Russian Fed.Russian Fed.Russian Fed.
France
Russian Fed.
Ethiopia
Russian Fed.Russian Fed.Russian Fed.Russian Fed.
United StatesUnited States
Russian Fed.Russian Fed.Russian Fed.Russian Fed.Russian Fed.Russian Fed.
Ethiopia
Russian Fed.Russian Fed.Russian Fed.Russian Fed.Russian Fed.Russian Fed.Russian Fed.Russian Fed.Russian Fed.Russian Fed.
United States
Russian Fed.Russian Fed.
Ethiopia
Russian Fed.Russian Fed.Russian Fed.
Ethiopia
United States
Ethiopia
Russian Fed.Russian Fed.Russian Fed.
United States
Russian Fed.
Ethiopia
Russian Fed.Russian Fed.Russian Fed.Russian Fed.Russian Fed.
France
Russian Fed.Russian Fed.Russian Fed.Russian Fed.Russian Fed.Russian Fed.Russian Fed.Russian Fed.Russian Fed.Russian Fed.Russian Fed.Russian Fed.Russian Fed.Russian Fed.Russian Fed.Russian Fed.Russian Fed.Russian Fed.Russian Fed.Russian Fed.Russian Fed.Russian Fed.Russian Fed.Russian Fed.Russian Fed.Russian Fed.
Ethiopia
Russian Fed.Russian Fed.Russian Fed.Russian Fed.Russian Fed.Russian Fed.
Ethiopia
Russian Fed.Russian Fed.Russian Fed.
Ethiopia
United States
Russian Fed.
EthiopiaEthiopia
Russian Fed.
United States
Russian Fed.
France
United States
EthiopiaEthiopia
Russian Fed.Russian Fed.
Ethiopia
United States
Russian Fed.
France
Russian Fed.
United States
EthiopiaEthiopia
Russian Fed.
Ethiopia
Russian Fed.Russian Fed.Russian Fed.Russian Fed.Russian Fed.Russian Fed.
FranceEthiopiaEthiopia
Russian Fed.Russian Fed.Russian Fed.Russian Fed.
Ethiopia
Russian Fed.
Ethiopia
Russian Fed.
EthiopiaEthiopia
Russian Fed.Russian Fed.Russian Fed.
Ethiopia
Russian Fed.
Ethiopia
Russian Fed.
United States
EthiopiaEthiopia
Russian Fed.
EthiopiaPortugal
Belgium
PortugalPortugal
Italy
PortugalPortugalFranceFrance Portugal
Italy
PortugalPortugalPortugalPortugalPortugalPortugalPortugalPortugalPortugalPortugalPortugalPortugalPortugalPortugalPortugal
Belgium
PortugalPortugalPortugalPortugalPortugalPortugalPortugalPortugalPortugalPortugalPortugalPortugalFrance PortugalPortugalPortugalPortugal
BelgiumBelgium
GermanyFrance PortugalPortugalPortugalPortugalPortugalPortugalFrance PortugalPortugalFrance PortugalPortugalPortugalPortugalPortugalPortugalPortugalPortugal
Germany
PortugalPortugalPortugalPortugalFrance PortugalPortugalFranceFranceFrance
Belgium
PortugalPortugal
Belgium
PortugalPortugalPortugalPortugal
Belgium
Italy
Belgium
Portugal
Italy
PortugalPortugalPortugalPortugalFrance PortugalFrance PortugalPortugalPortugalPortugalPortugal
Italy
France Portugal
Italy
PortugalPortugal
Italy
PortugalPortugalPortugalPortugalPortugal
Italy
PortugalPortugalPortugalPortugalPortugalPortugal
Italy
PortugalPortugalPortugalPortugal
Germany
PortugalPortugalPortugalPortugalPortugalPortugalFrance PortugalPortugalPortugalPortugalPortugalPortugal
Italy
Belgium
PortugalPortugalPortugal
Italy
PortugalPortugalPortugalPortugalFrance PortugalPortugalPortugal
Italy
Portugal
Italy
PortugalPortugalPortugalPortugalPortugalPortugal
Italy
PortugalPortugalPortugalPortugalPortugalPortugal
Belgium
PortugalPortugalPortugalPortugalPortugalPortugalPortugal
Germany
Belgium
Portugal
Germany
PortugalPortugalPortugalPortugal
Belgium
FranceFrance PortugalPortugalPortugalPortugalPortugalPortugalPortugal
Italy
PortugalPortugalPortugalPortugal
Italy
PortugalPortugalPortugalPortugalPortugal
Belgium
PortugalPortugalPortugalPortugal
Germany
PortugalPortugal
Germany
Italy
Belgium
France Portugal
Germany
PortugalPortugal
Italy
Belgium
PortugalPortugalFranceFrance Portugal
Belgium
Portugal
Italy
PortugalPortugal
Belgium
France PortugalFrance
Italy
PortugalPortugal
Germany
PortugalFrance Portugal
Italy
Belgium
Portugal
Italy
PortugalPortugalPortugalPortugalPortugal
Belgium
PortugalPortugalFrance PortugalPortugalPortugalPortugal
Belgium
Italy
PortugalPortugalPortugal
Belgium
PortugalPortugalPortugalPortugalPortugalPortugalPortugalPortugalPortugalPortugalPortugalPortugalPortugal
Italy
PortugalPortugalPortugalFrance PortugalPortugalPortugalPortugal
Italy
PortugalPortugalPortugalPortugalPortugalFrance Portugal
Italy
PortugalPortugal
Germany
PortugalFrance PortugalPortugal
Italy
PortugalFrance PortugalPortugalPortugalPortugalPortugalPortugalPortugalPortugalPortugalPortugalFranceFrance
Belgium
Italy
Portugal
Belgium
ItalyItaly
Germany
PortugalPortugalPortugal
Italy
PortugalPortugalPortugalFrance Portugal
Belgium
Italy
France PortugalPortugal
Belgium
Portugal
Germany
PortugalPortugal
Belgium
Portugal
Italy
PortugalPortugalPortugalPortugalPortugal
Italy
PortugalPortugalPortugalPortugal
ItalyItaly
Portugal
Belgium
PortugalPortugalFrance PortugalPortugalPortugalPortugalPortugalPortugalPortugal
Belgium
PortugalPortugalPortugalPortugalPortugalPortugalPortugalPortugalPortugalPortugalPortugalPortugalPortugal
Italy
Belgium
PortugalPortugalPortugal
Germany
PortugalPortugalPortugalPortugalPortugalFrance PortugalPortugalPortugalPortugalPortugalPortugal
Italy
Portugal
Italy
PortugalPortugalPortugalPortugalPortugalPortugalPortugalPortugalPortugalPortugalFrance PortugalPortugal
Belgium
France PortugalPortugalPortugalPortugalPortugalPortugal
Italy
PortugalPortugal
Italy
PortugalPortugalPortugalPortugalPortugalPortugalPortugalPortugalPortugalPortugalPortugal
Italy
Portugal
Belgium
PortugalPortugalPortugalPortugal
Germany
PortugalPortugalPortugalPortugalPortugal
BelgiumBelgium
PortugalPortugalPortugalPortugalPortugalPortugalPortugal
Italy
PortugalPortugalPortugalPortugalPortugalPortugalPortugalFrance PortugalPortugalFrance PortugalPortugalPortugalFrance PortugalPortugalPortugalPortugalPortugalPortugalPortugalPortugalPortugalPortugalPortugal
ItalyItaly
PortugalPortugal
Italy
Germany
PortugalPortugalPortugalPortugalPortugal
Belgium
PortugalPortugalPortugalPortugalPortugalPortugalPortugalPortugal
Belgium
PortugalPortugalPortugalPortugalPortugalPortugalPortugalPortugalPortugalPortugalPortugalPortugalPortugalPortugalPortugalPortugalFrance
United Kingdom
PortugalPortugalPortugalPortugalPortugalPortugalFrance Portugal
Belgium
United Kingdom
PortugalPortugalPortugalPortugalPortugal
Germany
PortugalPortugalPortugalPortugalPortugalPortugalPortugalPortugalPortugalPortugalPortugalPortugal
Germany
PortugalPortugal
Italy
PortugalPortugalPortugalPortugalPortugalPortugalPortugalPortugalPortugalPortugalPortugalPortugalPortugal
Italy
PortugalPortugalFrance PortugalPortugalPortugalPortugal
Italy
PortugalPortugalPortugalFrance PortugalPortugalPortugal
Germany
PortugalPortugalPortugalFranceFrance PortugalFrance PortugalPortugalPortugalPortugalFrance Portugal
Belgium
Portugal
Germany
PortugalPortugalPortugal
Germany
Portugal
Italy
France PortugalPortugalPortugal
Belgium
Italy
PortugalPortugalPortugalPortugalPortugalPortugalPortugal
Belgium
Portugal
Germany
PortugalPortugalPortugalPortugalPortugal
Germany
Portugal
Belgium
Portugal
Belgium
PortugalFrance PortugalPortugalFrance PortugalPortugalPortugalPortugalPortugalPortugal
Italy
PortugalPortugalPortugalPortugalPortugalFranceFranceFrance PortugalFrance PortugalPortugalPortugal
Italy
PortugalPortugalFrance
Italy
Portugal
Germany
PortugalPortugalPortugalPortugalPortugalPortugalPortugal
Germany
Portugal
GermanyFrance Portugal
Germany
PortugalPortugalPortugalFranceGermany
Portugal
Italy
PortugalPortugalPortugal
Belgium
Germany
PortugalPortugal
Germany
PortugalPortugalPortugalPortugal
Germany
Belgium
GermanyFrance PortugalFrance
Germany
Italy
PortugalPortugalPortugalPortugalPortugalPortugal
Belgium
PortugalPortugalPortugalFranceGermany
Portugal
Germany
Portugal
GermanyGermany
PortugalPortugalPortugalPortugal
Italy
PortugalPortugal
Germany
PortugalPortugalPortugalPortugalPortugalPortugalPortugal
Germany
PortugalPortugal
Belgium
France PortugalPortugal
Italy
Portugal
Germany
Belgium
Germany
Belgium
PortugalPortugal
Germany
PortugalPortugalPortugalPortugalFrance
ItalyItaly
PortugalPortugalPortugalPortugalPortugal
Germany
Italy
Portugal
Germany
PortugalPortugalPortugalPortugal
Germany
PortugalPortugal
Germany
PortugalPortugalFrance PortugalPortugalPortugalFrance
Belgium
France PortugalPortugalPortugalFrance PortugalPortugalPortugalPortugalPortugalPortugalPortugalPortugalPortugalPortugalPortugalPortugalPortugalPortugalPortugal
Belgium
PortugalPortugalPortugalPortugal
GermanyFranceFrance PortugalPortugalPortugal
Italy
France PortugalPortugalPortugalPortugalPortugal
Italy
PortugalPortugalPortugalPortugal
ItalyItalyItaly
PortugalPortugal
Italy
PortugalPortugalPortugalFrance PortugalPortugal
Belgium
PortugalPortugal
Belgium
PortugalPortugalFrance
Belgium
France PortugalPortugalPortugalPortugalFrance
Italy
France
Italy
PortugalPortugalPortugal
Italy
PortugalPortugal
Germany
Belgium
PortugalFrance Portugal
Germany
Portugal
Italy
PortugalPortugalPortugalPortugalPortugal
Italy
France PortugalPortugalPortugalPortugalPortugalFrance
Italy
PortugalFranceFrance PortugalPortugalPortugalFrance PortugalFrance Portugal
Italy
France Portugal
Belgium
PortugalPortugal
Italy
PortugalPortugalPortugalPortugalPortugalPortugalPortugal
Belgium
PortugalPortugalPortugalPortugalFrance PortugalPortugalFrance Portugal
Italy
Belgium
PortugalPortugalFrance
Italy
France PortugalPortugal
ItalyItaly
PortugalFranceFrance Portugal
Belgium
France
Italy
PortugalPortugalPortugal
ItalyItaly
PortugalFrance PortugalPortugalPortugalPortugalPortugalPortugalPortugalPortugal
Germany
Italy
PortugalFranceFrance Portugal
ItalyItaly
PortugalPortugal
Belgium
PortugalPortugalPortugalFrance PortugalPortugalFrance PortugalFrance PortugalPortugalPortugal
Germany
Portugal
Italy
France
Belgium
PortugalPortugalPortugalFrance
Italy
Germany
Belgium
Italy
PortugalPortugal
Italy
Portugal
Italy
PortugalFrance Portugal
ItalyItalyItaly
PortugalFrance PortugalPortugalPortugalPortugalPortugal
Italy
PortugalPortugalFrance
Italy
PortugalFrance
Italy
Belgium
PortugalPortugalPortugalPortugalPortugalPortugalPortugalPortugalPortugal
Italy
Portugal
Belgium
PortugalFrance PortugalPortugal
Italy
PortugalPortugal
Belgium
PortugalPortugalPortugalPortugal
ItalyItaly
PortugalPortugalPortugalPortugalPortugal
Italy
France
Italy
Portugal
Germany
Italy
Germany
PortugalPortugalPortugalPortugal
Italy
PortugalFrance Portugal
Italy
Belgium
Portugal
ItalyItaly
Portugal
Italy
FranceFrance Portugal
Italy
Germany
Portugal
ItalyItalyItalyItaly
PortugalFrance Portugal
Italy
PortugalPortugal
Italy
PortugalPortugalPortugal
Italy
PortugalPortugalPortugalPortugal
Belgium
Portugal
Italy
PortugalPortugalPortugal
Italy
PortugalPortugalPortugal
Italy
Portugal
Belgium
PortugalPortugalPortugalPortugalPortugalPortugal
Belgium
France PortugalPortugalPortugal
Italy
PortugalPortugal
Germany
PortugalPortugal
Italy
PortugalPortugalPortugalPortugalPortugalPortugalPortugal
Italy
France PortugalPortugalPortugalPortugalPortugalPortugal
Italy
PortugalPortugal
Italy
PortugalPortugalPortugalPortugalPortugalPortugalPortugalPortugalPortugal
Belgium
Italy
Portugal
Italy
Portugal
Belgium
PortugalPortugalFrance
Belgium
Portugal
Belgium
PortugalPortugalPortugalPortugalPortugalPortugal
ItalyItaly
PortugalPortugalPortugalPortugalPortugal
ItalyItaly
PortugalPortugal
Italy
France PortugalPortugal
ItalyItaly
Portugal
GermanyFrance
Italy
Germany
Portugal
Italy
PortugalPortugalPortugalPortugalPortugal
Italy
PortugalFrance
Italy
Portugal
Italy
Belgium
PortugalPortugalPortugalPortugalPortugalPortugal
Italy
Portugal
Germany
Italy
Portugal
Belgium
ItalyItaly
Portugal
ItalyItaly
Portugal
Italy
PortugalPortugalPortugalPortugal
Germany
Portugal
Germany
Portugal
Italy
Germany
PortugalFrance Portugal
Italy
PortugalPortugalPortugal
Italy
PortugalPortugalPortugalPortugalPortugalPortugalPortugalPortugal
Belgium
Italy
France
Belgium
PortugalPortugalPortugalPortugal
Germany
PortugalPortugalPortugalPortugalPortugalPortugalPortugal
ItalyItaly
PortugalPortugalPortugalPortugalPortugalPortugalPortugalPortugalPortugalPortugalFrance PortugalFrance
Belgium
PortugalPortugalPortugal
Italy
PortugalFrance Portugal
Germany
Portugal
Italy
PortugalPortugalPortugalPortugalPortugalPortugalFrance PortugalPortugalPortugalPortugalPortugalPortugalPortugalPortugal
Germany
PortugalFrance PortugalPortugalPortugalPortugalPortugalPortugalPortugalPortugalFranceGermany
Portugal
Italy
PortugalFranceGermany
PortugalPortugalPortugalPortugal
Germany
Portugal
Italy
PortugalPortugalPortugalPortugalFrance Portugal
Germany
PortugalPortugalPortugalPortugalPortugalPortugalPortugalFrance
Belgium
PortugalFrance PortugalPortugalPortugalPortugalPortugalPortugalPortugalFrance PortugalPortugal
Belgium
PortugalPortugalPortugalPortugal
Belgium
FranceFrance PortugalPortugalPortugalFrance PortugalPortugalPortugalPortugalPortugalPortugalFrance PortugalPortugal
GermanyGermany
Italy
PortugalPortugalPortugalFrance
Belgium
Portugal
Italy
Belgium
Portugal
GermanyGermany
PortugalPortugal
Italy
France PortugalPortugal
Italy
PortugalPortugalPortugalPortugalPortugal
ItalyItaly
PortugalPortugal
Belgium
PortugalPortugalPortugalPortugal
Belgium
Italy
Germany
PortugalPortugalPortugalPortugal
Belgium
PortugalPortugalPortugalPortugalPortugalPortugalPortugalPortugal
Italy
PortugalPortugalPortugalPortugalPortugalPortugalPortugalPortugalPortugalPortugalPortugalFrance PortugalPortugalPortugal
Italy
PortugalPortugalPortugal
BelgiumBelgium
Italy
Portugal
Belgium
Portugal
Belgium
PortugalPortugal
Belgium
PortugalPortugalPortugalPortugalPortugal
Belgium
PortugalPortugalFrance PortugalPortugalPortugal
Italy
PortugalPortugalPortugalPortugalPortugal
Italy United Kingdom
Germany
PortugalPortugalPortugalPortugalPortugalPortugalPortugalPortugalFranceGermany
PortugalPortugal
Belgium
PortugalPortugalPortugalPortugalPortugal
Belgium
PortugalPortugalFranceFrance Portugal
Belgium
Portugal
United Kingdom
PortugalPortugalPortugalPortugalFrance Portugal
GermanyFrance PortugalPortugalPortugal
Belgium
PortugalPortugalPortugalPortugal
Italy
PortugalPortugalFrance PortugalPortugalPortugalPortugalPortugalFrance PortugalPortugal
Italy
France PortugalPortugalPortugalPortugalPortugalFrance
Italy
France PortugalPortugalFrance
Belgium
PortugalPortugalPortugalPortugalPortugalPortugalFranceFrance PortugalPortugalFrance Portugal
Italy
BelgiumBelgium
Germany
PortugalPortugalPortugalPortugalPortugalPortugalFrance PortugalPortugalPortugal
Belgium
PortugalPortugalPortugalPortugalFrance
Italy
PortugalPortugalPortugalPortugalPortugalPortugal
Germany
PortugalPortugalFrance PortugalPortugalPortugalPortugalFrance PortugalPortugalPortugalPortugalPortugalPortugalPortugalPortugalPortugal
Italy
PortugalPortugalPortugal
Belgium
PortugalPortugalPortugalPortugalPortugalFrance
Belgium
France PortugalPortugalPortugal
Germany
PortugalPortugal
ItalyItaly
PortugalPortugalPortugalPortugalPortugalPortugalPortugalPortugalPortugalFranceFrance PortugalPortugalPortugalPortugal
Italy
PortugalPortugalPortugalPortugalPortugalPortugalPortugalPortugalPortugal
Italy
PortugalPortugalPortugalPortugalPortugalPortugalPortugalPortugalPortugalPortugal
Italy
PortugalPortugalPortugalPortugalPortugalPortugal
Belgium
Italy
PortugalPortugalPortugalFrance Portugal
United Kingdom
PortugalPortugal
Italy
Portugal
Belgium
PortugalPortugalPortugalPortugalPortugalPortugalPortugalPortugalFrance
Belgium
PortugalFrance
Italy
France PortugalPortugalPortugalPortugal
Belgium
PortugalPortugalPortugal
Belgium
PortugalFrance PortugalPortugalPortugal
Belgium
PortugalPortugalPortugal
Germany
PortugalPortugalPortugalPortugal
Germany
PortugalPortugalFrance PortugalPortugalPortugalFrance PortugalPortugalPortugalPortugalPortugalPortugalPortugalFrance
United Kingdom
PortugalPortugalPortugal
Belgium
PortugalFrance Portugal
Italy
PortugalPortugalFrance
Belgium
Portugal
ItalyItaly
PortugalPortugalPortugalPortugal
Italy
Portugal
Belgium
Italy
PortugalPortugalFrance PortugalPortugalPortugal
Belgium
PortugalPortugalPortugalPortugalFranceGermany
Portugal
Italy
PortugalPortugalPortugalFrance PortugalFrance PortugalPortugalFrance Portugal
Belgium
PortugalPortugalPortugalPortugalPortugalPortugalPortugalPortugalPortugalPortugalPortugalPortugalFrance
Italy
France PortugalPortugal
Belgium
PortugalPortugalPortugalPortugalPortugalPortugalPortugalPortugalPortugal
Belgium
France
Belgium
PortugalPortugalPortugalPortugalPortugalPortugalFrance PortugalFrance Portugal
Germany
Belgium
PortugalPortugalPortugal
BelgiumBelgium
PortugalPortugalFrance PortugalPortugalPortugalPortugalPortugalPortugalFrance Portugal
Belgium
PortugalPortugalPortugal
Belgium
PortugalPortugalPortugalPortugalPortugalFrance Portugal
Belgium
Portugal
Italy
PortugalPortugalPortugal
Germany
PortugalPortugalPortugalPortugalPortugalPortugalPortugalPortugal
BelgiumBelgium
PortugalPortugalPortugalPortugalPortugal
Italy
Germany
PortugalPortugal
Italy
PortugalPortugalPortugalPortugalPortugalPortugalFrance PortugalPortugal
Belgium
France PortugalFrance PortugalPortugalPortugalPortugal
Belgium
PortugalPortugalPortugalFrance PortugalPortugalPortugalPortugalPortugalPortugalPortugalPortugalPortugalPortugalPortugalPortugalPortugal
Germany
Portugal
Italy
Portugal
Belgium
PortugalPortugalFrance PortugalPortugalPortugalPortugalPortugalPortugalPortugalPortugal
United Kingdom
PortugalPortugalFrance
Italy
PortugalPortugalFrance PortugalPortugalFrance PortugalFranceFrance PortugalPortugalPortugal
Germany
PortugalPortugalFrance PortugalPortugalPortugal
Germany
PortugalPortugal
Italy
PortugalPortugalPortugal
Italy
PortugalPortugalPortugalPortugalPortugalPortugalPortugalPortugalPortugal
United Kingdom
France PortugalPortugalPortugalPortugalPortugalPortugalPortugalPortugalFrance Portugal
Italy
France PortugalPortugalPortugalPortugal
Belgium
PortugalPortugalPortugalFrance PortugalPortugal
Belgium
PortugalPortugalPortugalPortugalPortugal
Italy
PortugalPortugalPortugalPortugalPortugalPortugalPortugalPortugalPortugalPortugal
ItalyItaly
Portugal
Germany
PortugalPortugalPortugalPortugalFrance Portugal
Belgium
PortugalPortugalPortugalPortugal
Italy
PortugalPortugalPortugalPortugalPortugalFrance PortugalPortugalPortugalPortugalPortugalPortugalPortugalPortugalPortugalPortugalPortugalPortugalPortugalPortugalPortugalPortugalPortugal
ItalyItaly
Germany
Portugal
Germany
PortugalPortugalPortugalPortugalPortugalPortugalPortugalPortugalPortugalFranceGermany
PortugalPortugalPortugalPortugal
Italy
PortugalPortugalPortugal
Italy
PortugalPortugal
Germany
PortugalPortugalFrance
Italy
Germany
PortugalPortugalPortugalPortugalPortugalPortugalPortugalPortugalPortugalPortugal
Italy
PortugalPortugalPortugalPortugalPortugalPortugalPortugalPortugalPortugalPortugalPortugalPortugalPortugal
ItalyItaly
PortugalPortugalFrance PortugalPortugal
Italy
PortugalPortugalPortugal
GermanyFrance PortugalPortugalPortugal
Italy
Portugal
Italy
Portugal
Belgium
PortugalPortugalPortugalPortugalPortugal
Belgium
PortugalPortugalPortugalPortugalPortugal
Italy
PortugalFrance PortugalPortugalPortugalPortugal
Germany
PortugalPortugal
Belgium
PortugalPortugalPortugal
Italy
PortugalPortugalPortugalPortugalPortugalPortugalPortugalPortugalPortugalPortugalPortugalPortugalPortugalPortugalPortugalFranceGermany
Portugal
GermanyFrance PortugalPortugalPortugalPortugalPortugalPortugalPortugalPortugalPortugalPortugalPortugalPortugalPortugalPortugalPortugalPortugalFrance
United Kingdom
PortugalPortugalPortugalPortugalPortugalPortugal
Germany
PortugalPortugalPortugalPortugalPortugalPortugalPortugalPortugal
Germany
PortugalPortugalPortugalPortugalPortugalPortugal
Italy
PortugalPortugalPortugal
Italy
PortugalPortugalPortugalPortugalPortugal
Belgium
Italy
PortugalPortugalPortugalPortugalPortugalPortugalPortugalPortugalFrance PortugalPortugalFrance PortugalPortugalPortugalPortugalPortugalPortugalPortugalPortugalPortugalPortugal
Italy
PortugalPortugalPortugalPortugalPortugalPortugal
Germany
PortugalPortugalPortugalPortugal
Belgium
Italy
PortugalPortugalPortugalPortugalPortugalPortugalPortugalPortugal
Belgium
PortugalPortugalPortugalPortugalPortugalPortugalPortugalPortugalPortugalPortugalPortugalPortugalFrance PortugalPortugal
Italy
Portugal
United Kingdom
PortugalPortugalPortugalPortugalPortugalPortugalPortugalPortugalPortugalPortugalPortugalPortugalPortugalPortugalPortugalPortugalPortugalPortugalPortugalPortugalFrance
Belgium
PortugalFrance PortugalFrance PortugalPortugalPortugalPortugalPortugal
Italy
PortugalPortugalPortugalPortugal
Belgium
PortugalPortugal
Italy
PortugalPortugalPortugalPortugalPortugalPortugalFrance
Belgium
PortugalPortugalPortugalPortugalPortugalPortugalPortugal
Germany
Portugal
Italy
PortugalPortugalPortugalPortugalPortugalPortugalPortugalPortugalPortugal
Italy
PortugalPortugalPortugalPortugalPortugalPortugalPortugal
Germany
Italy
Belgium
PortugalPortugalPortugalPortugalPortugalPortugal
United Kingdom
PortugalPortugalPortugalPortugalPortugal
Germany
PortugalPortugalPortugal
Italy
Portugal
Germany
PortugalPortugalPortugalPortugalPortugalPortugalPortugalPortugalPortugalPortugalPortugalPortugalPortugalPortugalFrance PortugalPortugalPortugalPortugalPortugal
Germany
PortugalPortugalPortugalPortugalPortugalFrance PortugalPortugalFrance Portugal
Italy
PortugalPortugalFrance PortugalPortugalPortugalPortugalFrance PortugalPortugalPortugalPortugalPortugalPortugalPortugalPortugalFrance Portugal
United KingdomItaly
PortugalPortugalPortugalPortugalPortugalPortugalPortugalPortugalPortugalPortugalPortugalPortugalPortugalPortugalPortugal
Germany
PortugalPortugalPortugalFrance PortugalFrance PortugalPortugalPortugalPortugalPortugalPortugal
Italy
PortugalPortugalPortugal
ItalyItaly
Portugal
Germany
Belgium
PortugalFrance PortugalPortugal
Italy
PortugalPortugal
Italy
PortugalPortugalPortugalPortugalPortugalPortugal
Germany
PortugalPortugal
Belgium
PortugalPortugalPortugalPortugal
Belgium
PortugalPortugalPortugal
Italy
France PortugalPortugalPortugal
Italy
PortugalPortugalPortugal
Italy
PortugalPortugalPortugalPortugal
Germany
PortugalPortugalPortugalPortugalPortugalPortugalPortugalPortugalPortugalPortugalPortugalPortugalPortugalPortugalPortugalPortugalFrance PortugalPortugalPortugalPortugalPortugal
Belgium
Portugal
Italy
PortugalPortugalFrance
Belgium
PortugalPortugalPortugalPortugalPortugalPortugalPortugalPortugal
Germany
PortugalPortugalPortugalPortugalPortugalPortugalPortugalPortugalPortugalPortugalPortugalPortugalPortugalPortugalPortugalPortugal
Italy
France PortugalPortugal
Belgium
PortugalFrance PortugalPortugal
Belgium
PortugalPortugalPortugalPortugalPortugal
Italy
Portugal
Germany
PortugalPortugalPortugalPortugalPortugal
Italy
PortugalPortugalPortugalPortugalPortugalPortugalPortugal
Germany
PortugalPortugalPortugalPortugalPortugalPortugalPortugalPortugalPortugalPortugalPortugalPortugalPortugalPortugal
Italy
PortugalPortugalPortugal
Belgium
PortugalFrance PortugalPortugalPortugal
Italy
PortugalPortugalPortugalPortugalPortugalFrance
Belgium
PortugalPortugalPortugalPortugalFrance PortugalPortugalPortugalPortugalPortugalPortugalPortugalPortugal
United Kingdom
Portugal
Italy
PortugalPortugalPortugalPortugal
Belgium
France PortugalPortugalPortugal
Germany
PortugalFrance PortugalPortugalPortugal
Belgium
PortugalPortugalPortugalPortugalPortugalPortugalFrance PortugalFrance PortugalPortugal
Belgium
PortugalPortugalPortugalPortugal
Belgium
Italy
PortugalPortugalFrance PortugalFrance PortugalPortugalPortugalPortugalPortugal
Belgium
France PortugalPortugalPortugal
Germany
PortugalPortugalPortugal
Italy
PortugalPortugalFrance Portugal
Italy
PortugalPortugalPortugalPortugalPortugalPortugalPortugalPortugalPortugalPortugalPortugalPortugalPortugalPortugalPortugalPortugal
Italy
PortugalPortugal
Italy
PortugalPortugalPortugalPortugalPortugalPortugalPortugal
GermanyFrance PortugalPortugalPortugalPortugalPortugalPortugal
Italy
PortugalPortugalPortugalPortugalPortugalPortugalPortugalPortugalPortugal
United Kingdom
France PortugalPortugalPortugalPortugalPortugalPortugal
Belgium
Portugal
Italy
Belgium
PortugalPortugalPortugalPortugalPortugalPortugalPortugalPortugalPortugalPortugalPortugal
Italy
PortugalPortugalPortugalPortugalPortugalPortugal
Italy
France PortugalPortugalPortugalPortugalPortugalPortugal
Italy
PortugalPortugalPortugal
Belgium
PortugalPortugalPortugalPortugal
Belgium
Italy
PortugalPortugalPortugalPortugalPortugalPortugalPortugalPortugalPortugalPortugalPortugalPortugal
Italy
PortugalFranceFrance PortugalPortugalPortugal
Italy
PortugalPortugal
Italy
PortugalPortugal
BelgiumBelgium
Portugal
Belgium
France PortugalPortugal
Morocco
TurkeyTurkeySuriname
Morocco
SurinameTurkey
China
Suriname
MoroccoMorocco
SurinameSuriname
MoroccoMorocco
TurkeyTurkey
Iran
Morocco
TurkeySuriname
TurkeySuriname
TurkeySurinameSuriname
Turkey
MoroccoMorocco
Turkey
MoroccoMorocco
TurkeyTurkey
Morocco
SurinameTurkeyTurkeyTurkeyTurkey
Morocco
TurkeyTurkey
Morocco
TurkeySuriname
China
TurkeyTurkeyTurkey
Morocco
TurkeySuriname
Morocco
Suriname
Morocco
TurkeyTurkeySuriname
China
Turkey
Morocco
TurkeySurinameSuriname
TurkeyTurkeySuriname
Turkey
MoroccoMorocco
Germany
Turkey
Morocco
Turkey
Morocco
TurkeyTurkeyTurkeyTurkeyTurkey
Morocco
TurkeyTurkeySuriname
TurkeyTurkeyTurkeyTurkey
Morocco
SurinameSurinameTurkey
Morocco
TurkeyTurkeySuriname
TurkeyTurkeyTurkeyTurkey
MoroccoMoroccoMorocco
SurinameTurkey
Morocco
TurkeyTurkeyTurkey
MoroccoMorocco
TurkeyTurkeyTurkeyTurkey
Morocco
Turkey
Morocco
TurkeySuriname
MoroccoMorocco
SurinameTurkeyTurkeyTurkey
Morocco
TurkeySuriname
Turkey
Morocco
TurkeySuriname
Turkey
United Kingdom
Morocco
Turkey
United Kingdom
Iran
MoroccoMorocco
United Kingdom
Morocco
TurkeySuriname
Morocco
SurinameSuriname
Morocco
Suriname
Morocco
Turkey
Morocco
China
TurkeySuriname
Morocco
Turkey
Morocco
TurkeyTurkeySuriname
Morocco
China
MoroccoMoroccoMorocco
SurinameTurkey
SurinameTurkeyTurkeyTurkeyTurkey
Morocco
TurkeyTurkeyTurkeyTurkeyTurkeyTurkeyTurkey
ChinaChina
Morocco
TurkeyTurkey
Morocco
TurkeyTurkey
MoroccoMoroccoMorocco
Turkey
Morocco
SurinameTurkey
Suriname
Morocco
TurkeyTurkey
MoroccoMorocco
TurkeyTurkeyTurkeyTurkeyTurkeyTurkey
Morocco
SurinameTurkey
SurinameTurkeyTurkeyTurkey
China
MoroccoMoroccoMorocco
TurkeyTurkey
MoroccoMoroccoMorocco
Turkey
Germany
Morocco
TurkeyTurkeyTurkey
Morocco
TurkeySuriname
Morocco
Iran
Turkey
MoroccoMorocco
TurkeyTurkeySuriname
Turkey
Morocco
ChinaChina
Suriname
MoroccoMoroccoMorocco
TurkeySuriname
Turkey
Morocco
Turkey
China
Suriname
MoroccoMoroccoMoroccoMorocco
TurkeyTurkey
Morocco
United Kingdom
Germany
Turkey
Morocco
Suriname
Morocco
TurkeyTurkey
MoroccoMoroccoMoroccoMorocco
TurkeySurinameSuriname
TurkeyTurkey
Morocco
Turkey
Morocco
TurkeySuriname
TurkeySuriname
TurkeyTurkeySuriname
TurkeyTurkeySuriname
Morocco
TurkeySurinameSuriname
Morocco
SurinameSurinameSurinameSurinameSurinameTurkey
MoroccoMorocco
Suriname
Morocco
Suriname
Morocco
SurinameSuriname
China
Morocco
Suriname
United Kingdom
Morocco
Suriname
Morocco
SurinameTurkey
MoroccoMorocco
Suriname
Morocco
SurinameSuriname
MoroccoMoroccoMoroccoMorocco
Suriname
Morocco
Iran
Suriname
MoroccoMoroccoMorocco
TurkeyTurkeySuriname
Morocco
Suriname
China
Morocco
China
Turkey
MoroccoMoroccoMorocco
SurinameTurkeyTurkey
MoroccoMorocco
Turkey
MoroccoMorocco
China
MoroccoMorocco
TurkeySuriname
Turkey
China
MoroccoMoroccoMoroccoMorocco
TurkeyTurkeyTurkeyTurkey
ChinaChina
TurkeySuriname
TurkeyTurkey
Morocco
Germany
Morocco
China
Morocco
China
Turkey
China
Turkey
MoroccoMoroccoMoroccoMoroccoMorocco
SurinameTurkey
Iran
Suriname
Morocco
Turkey
MoroccoMoroccoMoroccoMorocco
Turkey
China
SurinameTurkeyTurkey
Morocco
TurkeySuriname
China
Morocco
China
Suriname
MoroccoMorocco
Turkey
Morocco
TurkeyTurkey
Morocco
Turkey
MoroccoMoroccoMorocco
SurinameTurkey
Suriname
Morocco
TurkeyTurkey
Morocco
TurkeyTurkey
Germany
Morocco
TurkeyTurkey
Germany
Morocco
TurkeyTurkeyTurkey
Morocco
Turkey
Morocco
SurinameTurkey
SurinameTurkey
Suriname
Morocco
Turkey
Morocco
TurkeySuriname
Morocco
Turkey
Morocco
TurkeyTurkeySuriname
TurkeySuriname
Morocco
Suriname
Morocco
Turkey
Morocco
Suriname
Morocco
TurkeyTurkeySuriname
TurkeyTurkeySuriname
TurkeySuriname
Turkey
MoroccoMorocco
Turkey
Morocco
SurinameTurkeyTurkey
SurinameSuriname
MoroccoMoroccoMorocco
TurkeySuriname
TurkeyTurkeySuriname
MoroccoMorocco
Suriname
Morocco
TurkeyTurkey
MoroccoMorocco
TurkeyTurkeyTurkey
Morocco
TurkeyTurkey
Morocco
Turkey
China
SurinameSurinameTurkeyTurkey
Morocco
Turkey
China
MoroccoMoroccoMorocco
TurkeySuriname
Morocco
TurkeyTurkey
Morocco
Turkey
Morocco
TurkeySuriname
Iran
Morocco
TurkeyTurkey
Morocco
Turkey
China
Turkey
Morocco
Turkey
Morocco
SurinameTurkeyTurkey
Suriname
Morocco
TurkeyTurkey
Morocco
Suriname
Morocco
Suriname
Morocco
Suriname
MoroccoMorocco
TurkeyTurkey
South Africa
Fiji
China
South Africa
India United Kingdom
South Africa
United KingdomUnited KingdomUnited Kingdom China
Australia
Korea
United Kingdom ChinaChinaChina
Australia
United Kingdom ChinaUnited Kingdom ChinaUnited KingdomUnited Kingdom
Korea
United Kingdom ChinaUnited KingdomUnited Kingdom ChinaUnited KingdomUnited Kingdom ChinaChinaUnited KingdomUnited Kingdom ChinaUnited KingdomUnited KingdomUnited KingdomUnited Kingdom ChinaChinaUnited KingdomUnited Kingdom
Australia
ChinaUnited KingdomUnited KingdomUnited KingdomUnited Kingdom
South Africa
United KingdomUnited Kingdom
Australia
United Kingdom China
Australia
South Africa
ChinaChinaUnited KingdomUnited KingdomUnited Kingdom China
Australia
United Kingdom China
FijiFijiFiji
United KingdomUnited Kingdom ChinaUnited Kingdom
Australia
United Kingdom
Australia
ChinaChinaChinaUnited Kingdom ChinaUnited Kingdom
Australia
United Kingdom ChinaUnited Kingdom ChinaUnited Kingdom
Australia
United KingdomUnited Kingdom China
KoreaKorea
United KingdomUnited Kingdom
Australia
ChinaUnited Kingdom ChinaChinaUnited KingdomUnited KingdomUnited Kingdom ChinaChinaUnited KingdomUnited Kingdom
FijiFiji
United Kingdom ChinaChina
Fiji
China
FijiFiji
Australia
United Kingdom China
Fiji
China
Fiji
United Kingdom ChinaUnited Kingdom ChinaIndia ChinaChina
Fiji
South Africa
Fiji
United KingdomUnited Kingdom
Fiji
United Kingdom China
Korea
United KingdomUnited Kingdom
Fiji
United KingdomUnited Kingdom
Fiji
United KingdomUnited KingdomUnited Kingdom
Fiji
China
Fiji
United Kingdom ChinaChinaUnited KingdomUnited Kingdom ChinaChinaUnited KingdomUnited KingdomUnited Kingdom ChinaChinaUnited Kingdom
Australia
United Kingdom ChinaChina
FijiFiji
China
Fiji
United Kingdom ChinaChinaUnited Kingdom
Australia
United KingdomUnited Kingdom China
Fiji
United KingdomUnited Kingdom China
Fiji
China
Australia
ChinaChinaChinaChinaChinaUnited Kingdom ChinaChinaUnited KingdomUnited Kingdom
Australia
ChinaUnited Kingdom ChinaUnited Kingdom
South Africa
United Kingdom ChinaUnited Kingdom
Korea
ChinaUnited KingdomUnited Kingdom
Fiji
ChinaChinaChinaChinaUnited Kingdom China
Korea
ChinaUnited KingdomUnited Kingdom ChinaUnited Kingdom ChinaUnited KingdomUnited KingdomUnited Kingdom ChinaChinaUnited Kingdom
KoreaKoreaKorea
United Kingdom ChinaUnited KingdomUnited Kingdom
Australia
United KingdomUnited Kingdom ChinaUnited KingdomUnited Kingdom ChinaChina
Fiji
ChinaUnited Kingdom
AustraliaAustralia
Fiji
ChinaUnited KingdomIndia
Australia
United KingdomUnited KingdomUnited Kingdom ChinaUnited Kingdom ChinaChinaChinaUnited KingdomUnited KingdomUnited KingdomUnited KingdomUnited Kingdom ChinaUnited Kingdom ChinaChinaChinaChinaUnited Kingdom China
Australia
Fiji
United Kingdom
Fiji
China
Australia
Fiji
United KingdomUnited KingdomUnited Kingdom
Fiji
Australia
ChinaChinaChina
Korea
ChinaChinaChina
Fiji
United Kingdom
Korea
Fiji
China
Korea
United KingdomUnited Kingdom
Australia
United KingdomUnited Kingdom ChinaUnited Kingdom ChinaIndia United Kingdom ChinaChinaUnited KingdomUnited KingdomIndia ChinaUnited KingdomUnited KingdomUnited Kingdom
Australia
United Kingdom ChinaChina
Australia
United KingdomUnited KingdomUnited Kingdom ChinaUnited KingdomUnited Kingdom China
Australia
Korea
United Kingdom ChinaUnited KingdomUnited KingdomUnited KingdomUnited KingdomUnited KingdomUnited KingdomUnited KingdomUnited Kingdom
Australia
United Kingdom ChinaUnited Kingdom
Australia
United Kingdom
Korea
United Kingdom China
Australia
ChinaChinaUnited Kingdom ChinaChinaChinaUnited Kingdom ChinaUnited Kingdom
Australia
United Kingdom ChinaChinaUnited KingdomUnited KingdomUnited Kingdom
Australia
United Kingdom
Fiji
Australia
United Kingdom
South Africa
China
Fiji
United Kingdom ChinaChina
Fiji
ChinaUnited KingdomUnited KingdomUnited Kingdom
AustraliaAustralia
China
South Africa
United KingdomUnited Kingdom China
South Africa
United Kingdom China
Australia
Italy
France
ItalyItaly
PortugalTurkey
Albania
Portugal
ItalyItaly
Germany
Turkey
Italy
Germany
PortugalTurkey
AlbaniaItaly
PortugalTurkey
PortugalPortugalPortugalPortugalTurkey
SpainItaly
Germany
Portugal
Spain
FranceFrance
Italy
Turkey
Germany
ItalyItaly
Portugal
Albania
Germany
Portugal
Albania
FranceFrance
AlbaniaItaly
AlbaniaItalyItaly
Spain
TurkeyTurkey
Albania
PortugalFrance
Italy
France
ItalyItaly
TurkeyTurkey
Germany
Italy
Portugal
Spain
PortugalFrance
ItalyAlbania
ItalyAlbania
Italy
Germany
Albania
Portugal
ItalyItalyItaly
TurkeyTurkey
ItalyItalySpain
Portugal
Albania
France
Spain
Portugal
Italy
GermanyGermanyGermanyGermany
Spain
France
Albania
PortugalTurkey
Italy
PortugalTurkeyTurkey
Italy
PortugalPortugalPortugal
Italy
TurkeyTurkey
ItalyItaly
Turkey
Austria
Albania
PortugalTurkey
Germany
TurkeyTurkey
Spain
Turkey
AlbaniaItaly
Portugal
Italy
Portugal
Germany
Turkey
Italy
TurkeyTurkey
Italy
PortugalPortugalPortugal
Albania
TurkeyTurkey
France
Turkey
Italy
Turkey
SpainItalyItalyItalyItalyItalyItalyItaly
Portugal
Albania
Portugal
ItalyAlbania
Italy
Turkey
Italy
TurkeyPortugalPortugalPortugal
ItalyItalyItalyAlbania
ItalyAlbania
TurkeyTurkey
Italy
PortugalPortugal
Italy
Austria
Turkey
Italy
Turkey
SpainItalyItaly
Portugal
SpainItaly
Germany
Italy
GermanyGermany
Portugal
ItalyItalyItaly
PortugalPortugalPortugalFrance Portugal
ItalyItalyItalyItalyItaly
Germany
ItalyItaly
Turkey
Germany
ItalyItalyItalyItaly
PortugalTurkey
Italy
Turkey
Italy
Portugal
Italy
Turkey
SpainItaly
Turkey
Italy
PortugalPortugalPortugalPortugalTurkey
Germany
PortugalPortugal
Italy
Portugal
ItalyItalyItalyItalySpainAlbania
Italy
PortugalPortugalTurkey
Italy
PortugalTurkey
Portugal
Albania
PortugalTurkey
Italy
Portugal
Italy
PortugalTurkey
Italy
Portugal
ItalySpain
Italy
France
Turkey
ItalyItaly
FranceGermany
SpainAlbaniaAlbaniaItaly
Turkey
France
Italy
PortugalTurkey
AlbaniaAlbaniaItalyItaly
Turkey
Italy
Germany
Italy
Turkey
ItalyItaly
PortugalTurkey
Italy
Turkey
SpainAlbaniaSpainItaly
PortugalPortugalPortugal
ItalyAlbania
ItalyItaly
France
Italy
PortugalTurkey
Germany
PortugalFrance Portugal
Spain
Turkey
Albania
Germany
Albania
Austria
ItalyItaly
FranceGermany
PortugalPortugalFrance
ItalyItalyItaly
France
Italy
Portugal
Italy
PortugalPortugal
Spain
Germany
Italy
Turkey
SpainSpainAlbaniaItalyItalyItaly
Turkey
ItalyAlbania
TurkeyTurkeyPortugal
TurkeyPortugal
TurkeyTurkey
France
Italy
Portugal
ItalySpain
Turkey
Italy
PortugalFrance
Italy
Germany
SpainItaly
Turkey
ItalyItalyAlbania
Italy
Germany
Italy
Portugal
Italy
Portugal
AlbaniaSpainAlbania
PortugalPortugal
Albania
PortugalPortugal
ItalyAlbaniaSpain
PortugalTurkey
ItalyItaly
Turkey
Italy
PortugalPortugalTurkey
ItalyItaly
Portugal
AlbaniaItalyItaly
France
TurkeyTurkeyTurkeyPortugal
SpainItaly
Turkey
Spain
France PortugalPortugalTurkeyTurkey
Portugal
ItalyItaly
PortugalPortugal
Italy
Turkey
Italy
PortugalTurkey
Italy
Turkey
Italy
Portugal
Austria
Portugal
ItalyItaly
Portugal
Germany
ItalyItaly
Austria
France
Spain
Austria
ItalySpain
Austria
France
Italy
Turkey
Spain
Portugal
Spain
Turkey
Germany
Austria
PortugalPortugal
Italy
FranceFrance
ItalyItaly
Turkey
France Portugal
Austria
Italy
AustriaAustria
Italy
Portugal
Italy
Germany
ItalyItaly
Portugal
Austria
Italy
Germany
PortugalPortugalTurkey
ItalyItaly
Portugal
Italy
Turkey
ItalyAlbania
TurkeyPortugal
Germany
ItalySpain
Italy
TurkeyPortugal
Italy
Portugal
ItalyItalyItalyItalyItaly
Turkey
Italy
PortugalTurkey
France
ItalyItalyItaly
France
TurkeyTurkeyPortugal
SpainItalyItaly
TurkeyPortugal
Germany
Portugal
Germany
SpainItaly
SpainItaly
Germany
AlbaniaSpainAlbaniaItaly
PortugalFrance
Turkey
Italy
PortugalTurkey
France Portugal
ItalyItaly
PortugalPortugal
ItalyItalyItaly
Portugal
Italy
PortugalTurkey
Italy
PortugalFrance Portugal
Italy
TurkeyPortugal
Italy
Turkey
ItalyItalySpain
Germany
Turkey
Spain
TurkeyTurkeyPortugalPortugalFrance
Albania
Germany
TurkeyPortugalPortugal
Italy
PortugalTurkey
Italy
Portugal
ItalyItalyItaly
PortugalTurkey
Italy
PortugalFrance
Italy
PortugalPortugal
ItalySpain
ItalySpain
PortugalTurkey
Albania
Turkey
Italy
Turkey
Spain
Portugal
Albania
PortugalTurkey
France
SpainItalyItaly
Spain
Portugal
Germany
Italy
Portugal
ItalyItaly
Germany
Portugal
Italy
Portugal
Germany
ItalyItaly
TurkeyPortugal
Italy
Portugal
ItalyAlbania
Portugal
Italy
Portugal
AlbaniaItalyItaly
Spain
PortugalPortugal
Italy
TurkeyPortugal
Italy
PortugalPortugalPortugalPortugalTurkey
Italy
TurkeyTurkey
SpainSpainItalyItalyItaly
TurkeyPortugalPortugal
Turkey
Spain
PortugalPortugalPortugalPortugal
ItalyItaly
PortugalPortugal
ItalyItaly
France
Turkey
Spain
Turkey
Italy
Germany
PortugalTurkey
France
TurkeyTurkey
FranceFrance Portugal
Italy
GermanyGermany
TurkeyPortugalPortugal
ItalyItaly
Germany
Portugal
Italy
Portugal
Italy
Portugal
GermanyGermanyFrance Portugal
Germany
ItalyItaly
Turkey
SpainItaly
Portugal
Germany
Portugal
Italy
France
TurkeyTurkeyTurkeyTurkey
Albania
Portugal
Germany
ItalyItaly
Portugal
Germany
Italy
Germany
PortugalFrance Portugal
GermanyFrance Portugal
ItalyItaly
Austria
ItalyItaly
Portugal
Italy
PortugalTurkey
Germany
Italy
PortugalPortugalPortugal
Germany
PortugalFrance Portugal
Italy
TurkeyTurkey
Italy
Germany
Turkey
Spain
PortugalTurkey
Italy
Portugal
Germany
TurkeyTurkey
Spain
Germany
Spain
Turkey
France Portugal
AlbaniaItaly
TurkeyTurkey
Italy
Portugal
Germany
ItalyItaly
Germany
Italy
Germany
PortugalTurkeyTurkey
Portugal
Germany
Portugal
Italy
Turkey
Italy
France
Albania
Turkey
France
Turkey
France
SpainSpainAlbaniaItaly
GermanyFrance PortugalPortugal
Italy
Austria
Albania
Germany
TurkeyPortugalFrance
TurkeyTurkey
Italy
Portugal
Italy
Portugal
Germany
Spain
FranceGermanyGermany
ItalyAlbaniaAlbania
Turkey
AlbaniaAlbania
GermanyFrance Portugal
TurkeyTurkeyTurkey
Albania
Turkey
ItalyItaly
TurkeyTurkey
Albania
Portugal
Spain
PortugalPortugal
ItalyAlbania
Portugal
Spain
Turkey
Italy
Germany
ItalyAlbania
PortugalTurkey
ItalyItaly
Austria
Italy
Germany
Italy
Portugal
Italy
Portugal
Italy
France
Turkey
Italy
PortugalFrance
SpainItalyItaly
TurkeyTurkeyTurkeyPortugalPortugalPortugal
Turkey
Germany
PortugalPortugal
Italy
PortugalPortugalPortugal
Italy
Portugal
ItalyItaly
TurkeyPortugalPortugalPortugalFrance
Italy
Portugal
Albania
France Portugal
Albania
Turkey
Italy
Portugal
Italy
Portugal
Italy
PortugalPortugalFrance
ItalyItaly
Portugal
Italy
Austria
Italy
PortugalPortugal
Italy
TurkeyTurkeyPortugal
TurkeyPortugalFranceFrance Portugal
TurkeyTurkeyPortugalPortugal
TurkeyPortugal
TurkeyTurkey
Italy
Turkey
Spain
TurkeyPortugal
Turkey
Italy
Turkey
France Portugal
Italy
Turkey
Italy
TurkeyTurkey
France
TurkeyTurkeyTurkey
AlbaniaItalyItaly
France
SpainAlbania
PortugalFrance PortugalPortugal
Italy
PortugalPortugal
Spain
GermanyFrance
AlbaniaAlbaniaAlbania
FranceFrance
TurkeyPortugal
Turkey
Spain
PortugalFranceFrance
Italy
Turkey
France
Spain
France
TurkeyPortugal
Turkey
France
Italy
Portugal
Italy
Portugal
Italy
Turkey
Germany
Turkey
France PortugalTurkey
France
TurkeyTurkey
FranceFranceFrance
Spain
FranceGermany
FranceFranceGermany
Spain
Turkey
Italy
PortugalFrance
Turkey
France Portugal
Germany
Italy
PortugalFrance
Italy
PortugalPortugalFrance
Italy
Portugal
ItalyItaly
PortugalPortugal
Austria
TurkeyTurkeyPortugalPortugal
ItalyItaly
TurkeyPortugal
TurkeyTurkey
Italy
PortugalPortugal
ItalyItaly
Portugal
Spain
Turkey
ItalyItaly
France
Turkey
Italy
FranceFrance
TurkeyPortugal
Italy
Portugal
SpainAlbaniaItaly
Turkey
France
SpainItalyItalyItaly
Portugal
ItalyItaly
Turkey
Spain
Portugal
GermanyGermany
TurkeyTurkeyPortugal
Turkey
Italy
Turkey
Spain
TurkeyPortugal
Italy
PortugalTurkey
PortugalTurkeyTurkeyTurkeyTurkey
PortugalTurkeyTurkey
Spain
Turkey
SpainItaly
TurkeyTurkeyPortugalPortugal
Spain
Germany
ItalyItaly
TurkeyTurkeyTurkeyTurkeyTurkeyPortugalFrance
Italy
Austria
TurkeyTurkey
Spain
PortugalPortugalPortugalFrance
Turkey
France
Turkey
Spain
Portugal
Spain
PortugalTurkey
Germany
TurkeyTurkey
France
Italy
Turkey
Italy
Turkey
SpainSpain
Turkey
Italy
TurkeyPortugalPortugal
Italy
PortugalTurkey
Italy
PortugalPortugal
Spain
Portugal
Italy
Portugal
Italy
FranceFrance
Turkey
Spain
TurkeyPortugal
TurkeyTurkeyTurkeyPortugal
Germany
TurkeyTurkey
ItalySpain
PortugalTurkey
Italy
TurkeyTurkeyTurkey
ItalyItaly
TurkeyTurkeyPortugal
TurkeyPortugal
SpainSpain
Portugal
Germany
Italy
Turkey
ItalyAlbania
TurkeyTurkey
Italy
PortugalTurkey
France PortugalPortugalPortugal
Italy
TurkeyTurkey
Spain
PortugalPortugalPortugalPortugalTurkey
Italy
PortugalTurkeyTurkeyTurkey
Italy
Austria
Turkey
ItalyItaly
PortugalTurkey
PortugalPortugalTurkey
Germany
TurkeyTurkey
ItalySpain
ItalyItaly
Portugal
SpainSpain
PortugalPortugal
Italy
TurkeyPortugal
TurkeyTurkeyPortugalPortugal
TurkeyTurkeyPortugal
ItalySpain
Germany
Spain
Turkey
ItalyItaly
Turkey
Albania
TurkeyPortugal
Italy
Austria
Portugal
Italy
Germany
TurkeyTurkey
SpainItaly
Portugal
Italy
TurkeyTurkey
France
TurkeyTurkeyTurkey
France
Spain
Austria
Turkey
Spain
TurkeyPortugal
Austria
Italy
Portugal
SpainAlbania
France
Turkey
France
SpainSpain
Portugal
SpainSpainSpainSpain
FranceFrance
Italy
PortugalPortugalPortugal
SpainSpainSpainItaly
Spain
Turkey
Germany
SpainSpainSpain
Turkey
Spain
Portugal
SpainSpainItalyItaly
SpainItaly
Turkey
ItalyItalyItalySpainSpain
Portugal
Spain
Austria
Portugal
Spain
Portugal
Spain
Turkey
Italy
Turkey
SpainSpainSpainSpain
PortugalTurkey
PortugalPortugal
Italy
Germany
Portugal
Spain
PortugalPortugal
Italy
Portugal
ItalySpainSpain
Portugal
SpainSpainSpain
France
SpainItaly
Spain
Portugal
Spain
TurkeyTurkey
Spain
Turkey
ItalySpain
Germany
Italy
Portugal
ItalyItaly
Portugal
Austria
TurkeyPortugal
Albania
Turkey
Italy
FranceGermany
ItalyItaly
Turkey
ItalyItalyItalyItaly
Portugal
Italy
TurkeyTurkey
Austria
TurkeyPortugal
Turkey
Spain
FranceFrance Portugal
ItalyItalyItalyItaly
Turkey
Italy
TurkeyTurkey
ItalyItaly
Turkey
Spain
Germany
PortugalPortugalTurkey
ItalyItaly
Germany
ItalySpain
Italy
FranceFranceGermanyGermany
PortugalPortugal
Spain
TurkeyPortugal
Turkey
ItalyAlbania
Turkey
Italy
Portugal
Germany
TurkeyTurkey
SpainSpainItalyItaly
Turkey
Germany
PortugalPortugalTurkeyTurkey
Italy
TurkeyTurkeyTurkeyTurkey
ItalyItaly
Turkey
Germany
Italy
PortugalPortugalTurkey
AlbaniaItaly
Albania
PortugalPortugal
Spain
PortugalTurkeyTurkey
ItalyItaly
PortugalFrance
Italy
France
Italy
Turkey
Germany
PortugalPortugal
ItalyItalyAlbania
ItalyItalyAlbania
TurkeyTurkey
Italy
Turkey
GermanyGermany
Turkey
Austria
Turkey
ItalySpain
France
Albania
Turkey
GermanyFrance Portugal
TurkeyTurkeyPortugal
TurkeyTurkeyTurkeyTurkey
Spain
Turkey
Italy
PortugalTurkey
Italy
PortugalPortugalTurkey
ItalyItalyItaly
PortugalTurkey
ItalyItaly
PortugalPortugalPortugalPortugalPortugalTurkey
Austria
TurkeyPortugal
Turkey
Italy
TurkeyPortugal
TurkeyPortugal
TurkeyPortugal
ItalyItalyItaly
PortugalTurkey
Portugal
ItalyItaly
Germany
Turkey
Italy
Turkey
Italy
Portugal
Germany
Turkey
Germany
ItalyItalySpain
Turkey
Austria
Portugal
ItalySpain
Germany
Italy
PortugalPortugal
ItalyItaly
PortugalPortugal
Italy
France Portugal
Italy
Germany
PortugalTurkeyTurkey
Portugal
ItalyItaly
Portugal
Spain
Portugal
Italy
TurkeyPortugal
TurkeyTurkeyTurkey
SpainItaly
PortugalPortugal
Albania
PortugalTurkeyTurkeyTurkeyTurkey
Portugal
Spain
TurkeyPortugal
Italy
TurkeyPortugal
ItalyAlbania
Turkey
Spain
Germany
Portugal
Italy
France
Italy
PortugalPortugal
ItalyItaly
Turkey
France
ItalyAlbania
Portugal
Italy
Turkey
Italy
PortugalFrance Portugal
SpainItaly
Spain
Germany
Turkey
Germany
Italy
PortugalTurkey
Italy
TurkeyPortugalFrance
Spain
Turkey
Spain
PortugalPortugalTurkeyTurkeyTurkeyTurkey
France PortugalPortugalTurkey
Italy
TurkeyPortugal
Turkey
GermanyFrance
ItalyItaly
PortugalPortugal
Italy
PortugalPortugal
Italy
TurkeyPortugal
Italy
Germany
Albania
Turkey
Italy
Turkey
Spain
Germany
Portugal
SpainItaly
PortugalFrance PortugalPortugalTurkeyTurkey
PortugalTurkeyTurkey
Germany
ItalyItalyItalyItaly
Germany
AlbaniaItaly
Turkey
Italy
TurkeyPortugalPortugalPortugal
Italy
Turkey
Spain
Germany
Spain
Turkey
ItalySpain
ItalySpain
Turkey
Italy
PortugalTurkey
Italy
France
ItalyAlbania
PortugalTurkey
SpainAlbaniaItaly
Portugal
Albania
France
Turkey
Spain
TurkeyPortugalPortugal
Austria
Turkey
Italy
TurkeyPortugal
Albania
GermanyFrance Portugal
ItalyItaly
Turkey
Germany
TurkeyTurkey
France PortugalPortugalTurkey
PortugalPortugalPortugalPortugal
Germany
ItalyItaly
TurkeyTurkeyPortugalPortugal
Turkey
ItalySpain
ItalyAlbania
France
Austria
Turkey
Italy
France PortugalPortugalPortugal
Albania
France
TurkeyPortugalPortugal
ItalyItaly
PortugalTurkey
PortugalTurkey
Portugal
Austria
Portugal
Italy
Turkey
France
TurkeyPortugal
ItalyItaly
Austria
Italy
Portugal
Italy
PortugalTurkey
PortugalTurkey
PortugalTurkey
Italy
Portugal
Germany
Spain
Turkey
Italy
Portugal
Spain
PortugalFranceFrance
Italy
Germany
Turkey
Italy
PortugalPortugalPortugalTurkeyTurkey
PortugalTurkey
Portugal
Italy
TurkeyPortugal
ItalySpain
Portugal
ItalySpain
Italy
PortugalTurkey
PortugalPortugalPortugal
Italy
TurkeyPortugalPortugalPortugalPortugalFrance
Turkey
ItalyItaly
Turkey
Spain
PortugalPortugalPortugal
Albania
PortugalPortugalTurkey
Italy
PortugalPortugal
ItalySpain
TurkeyTurkeyTurkey
ItalyItaly
Turkey
AlbaniaAlbaniaItaly
PortugalTurkey
Portugal
Albania
PortugalPortugal
Spain
Germany
TurkeyPortugal
SpainItaly
France Portugal
ItalyItaly
PortugalTurkey
Italy
Germany
Turkey
France Portugal
Germany
Italy
Portugal
Spain
Turkey
Austria
Portugal
Italy
Germany
TurkeyTurkeyTurkey
France Portugal
ItalySpain
PortugalPortugalPortugalPortugal
Albania
PortugalPortugal
Albania
France PortugalPortugal
Italy
France
SpainItaly
Germany
Albania
Turkey
Italy
TurkeyPortugal
TurkeyPortugal
ItalyItaly
PortugalTurkey
Portugal
ItalyAlbania
Portugal
ItalyItalyItalyItaly
Turkey
ItalySpain
Portugal
ItalyItalyItaly
Portugal
ItalyAlbania
TurkeyTurkey
FranceFrance
TurkeyPortugal
Germany
Portugal
Italy
Portugal
Germany
Italy
Portugal
ItalyAlbania
Turkey
Italy
TurkeyTurkeyPortugalPortugalPortugal
Turkey
Spain
Turkey
France
SpainSpain
PortugalPortugal
Italy
PortugalFrance
Turkey
Albania
France Portugal
Italy
PortugalPortugal
Albania
PortugalPortugal
Spain
Portugal
Germany
ItalyItaly
France
Italy
Portugal
Italy
PortugalTurkeyTurkey
Italy
PortugalPortugal
Italy
Turkey
Italy
PortugalPortugal
AlbaniaSpain
TurkeyPortugal
AlbaniaSpain
Portugal
Italy
TurkeyPortugal
ItalyItalyAlbania
Portugal
Germany
TurkeyPortugal
Spain
PortugalPortugalPortugal
Italy
TurkeyTurkeyTurkey
Italy
Portugal
Spain
TurkeyPortugalPortugal
TurkeyPortugal
Germany
Portugal
Austria
PortugalPortugal
Germany
Italy
TurkeyPortugalPortugal
ItalyAlbania
France Portugal
ItalyItaly
Portugal
SpainAlbaniaItaly
PortugalPortugalPortugalTurkey
PortugalTurkey
France
ItalyItaly
Turkey
France
Spain
TurkeyPortugal
AlbaniaItaly
France Portugal
Austria
PortugalTurkey
PortugalTurkey
France PortugalPortugalTurkey
Spain
Portugal
SpainItaly
TurkeyTurkey
Spain
Portugal
Spain
TurkeyTurkeyPortugalPortugalPortugalPortugal
Turkey
Italy
Germany
Portugal
Italy
PortugalTurkeyTurkey
Portugal
Italy
Germany
ItalyAlbaniaAlbaniaSpain
TurkeyPortugalPortugal
Spain
TurkeyPortugal
ItalyItalyAlbania
Portugal
Italy
PortugalPortugal
Spain
France
Spain
PortugalTurkey
PortugalPortugalFranceFranceGermanyGermany
PortugalTurkey
PortugalPortugal
Italy
PortugalTurkeyTurkey
SpainItaly
SpainItaly
TurkeyPortugalPortugal
TurkeyTurkeyPortugalPortugal
ItalySpain
Italy
PortugalFrance
Italy
PortugalTurkey
Portugal
Germany
ItalyItaly
PortugalFrance
ItalyItaly
Portugal
Germany
Turkey
Spain
PortugalPortugalPortugal
Germany
Italy
Germany
ItalySpainAlbania
TurkeyPortugal
Italy
Germany
TurkeyTurkeyPortugal
Italy
PortugalPortugal
Germany
PortugalPortugalPortugal
SpainItaly
PortugalFrance
TurkeyPortugalPortugalFrance PortugalPortugal
Germany
Turkey
Germany
Italy
PortugalTurkeyTurkey
PortugalPortugalPortugalPortugalFrance
Turkey
ItalyItaly
Portugal
Germany
ItalyAlbaniaSpain
Italy
Portugal
SpainItaly
PortugalPortugal
ItalyItaly
PortugalPortugalTurkey
ItalyItalySpain
Portugal
Spain
PortugalTurkey
Italy
Turkey
Italy
Portugal
Italy
PortugalPortugalPortugal
Italy
Germany
Spain
Portugal
ItalyAlbania
Portugal
Italy
PortugalTurkey
France
Italy
PortugalTurkey
ItalySpain
GermanyGermany
TurkeyPortugalPortugal
Germany
PortugalPortugalTurkey
France PortugalTurkey
Portugal
Italy
PortugalPortugal
ItalyItaly
PortugalTurkeyTurkey
PortugalPortugalPortugalPortugalPortugalPortugalFranceFrance
Austria
SpainItalyItalyItaly
Portugal
GermanyFrance PortugalFrance
Italy
Portugal
SpainItaly
PortugalPortugalPortugal
Italy
Turkey
Albania
Turkey
Germany
AlbaniaItaly
France PortugalPortugalPortugalTurkey
ItalyItalyItaly
Portugal
Italy
PortugalTurkey
Portugal
ItalyItaly
TurkeyTurkey
France PortugalPortugalFrance PortugalPortugalPortugalTurkey
Italy
TurkeyTurkey
ItalySpain
ItalyAlbania
TurkeyPortugalPortugalPortugalPortugal
Spain
France
Italy
Portugal
AlbaniaItaly
Spain
Portugal
ItalySpain
PortugalPortugal
Italy
Portugal
ItalySpain
France
Turkey
ItalySpain
Italy
Germany
Italy
PortugalFrance
Italy
Turkey
Italy
Portugal
Italy
Turkey
ItalyItaly
Portugal
Italy
TurkeyTurkey
Spain
Turkey
Germany
Portugal
Italy
TurkeyPortugal
TurkeyPortugal
Italy
Austria
Germany
TurkeyPortugal
SpainItaly
AlbaniaItaly
TurkeyTurkey
ItalyItalySpain
Turkey
FranceFrance
TurkeyTurkeyTurkey
ItalyItalyItalyItaly
PortugalPortugalPortugal
Austria
GermanyFrance Portugal
Albania
TurkeyTurkeyPortugalPortugalPortugalPortugal
Spain
Turkey
FranceFranceGermany
SpainItaly
PortugalPortugal
ItalyItaly
PortugalPortugal
Germany
PortugalPortugalFranceFrance PortugalPortugalPortugalTurkeyTurkey
Portugal
Italy
PortugalPortugal
ItalyItaly
Turkey
SpainItaly
Austria
Germany
Italy
PortugalFrance
Turkey
AlbaniaItaly
Turkey
Italy
PortugalPortugal
SpainItaly
France PortugalPortugalPortugalPortugal
SpainSpain
TurkeyPortugal
Turkey
Austria
Portugal
Italy
PortugalTurkey
PortugalTurkeyTurkey
Germany
Portugal
Germany
Portugal
Italy
Turkey
Italy
Turkey
SpainAlbaniaItaly
France
Turkey
SpainItalyItaly
Germany
Italy
PortugalPortugal
ItalyItaly
Turkey
Italy
Portugal
Germany
Italy
Portugal
ItalyItalySpain
TurkeyTurkeyTurkeyTurkey
Italy
PortugalPortugal
ItalyItalyItalySpain
PortugalTurkey
AlbaniaSpainItaly
PortugalPortugalFrance
Italy
PortugalPortugal
Italy
Turkey
SpainItaly
PortugalPortugal
Italy
Portugal
Italy
PortugalFrance
Spain
PortugalTurkey
Portugal
Italy
Turkey
France
AlbaniaItaly
Germany
ItalyItaly
PortugalPortugalTurkey
PortugalPortugal
Germany
Turkey
SpainSpainItalyItaly
PortugalPortugal
Italy
TurkeyPortugal
AlbaniaItaly
France Portugal
Italy
Turkey
Italy
PortugalTurkey
SpainItaly
PortugalPortugal
ItalyItaly
Turkey
Albania
Turkey
Italy
Portugal
AlbaniaItaly
PortugalFrance PortugalTurkeyTurkey
Italy
PortugalPortugal
Germany
Italy
TurkeyPortugalFrance
Turkey
Spain
Portugal
Italy
Portugal
Italy
TurkeyPortugalFrance
Italy
Portugal
Italy
TurkeyPortugal
Turkey
Italy
Germany
Portugal
ItalyItalyItaly
PortugalPortugalFrance Portugal
Spain
PortugalPortugal
Spain
PortugalTurkey
Portugal
SpainItaly
Portugal
AlbaniaSpain
Germany
PortugalTurkey
PortugalTurkey
GermanyGermany
ItalyItaly
PortugalPortugal
GermanyFrance
Italy
Portugal
Italy
Turkey
FranceGermany
Portugal
ItalySpain
TurkeyPortugalPortugalFrance
Turkey
France Portugal
ItalyItalyItaly
PortugalTurkeyTurkey
Spain
Portugal
Italy
PortugalFrance
ItalyItaly
Portugal
SpainItaly
Portugal
Italy
PortugalPortugal
Italy
Turkey
ItalyItaly
Austria
Italy
TurkeyPortugalPortugal
Italy
TurkeyTurkey
Italy
France
Turkey
Albania
Portugal
Italy
Portugal
Albania
TurkeyPortugal
Italy
TurkeyTurkey
ItalyItalyItalySpain
Italy
Portugal
Italy
Germany
TurkeyPortugal
Italy
PortugalFrance
Italy
Turkey
Italy
Turkey
Austria
France
AlbaniaSpain
Turkey
Italy
Austria
France
ItalyItaly
TurkeyPortugalPortugalPortugal
TurkeyTurkeyPortugal
TurkeyPortugalPortugal
Germany
Italy
France
ItalyItaly
PortugalFrance
Austria
Turkey
France
SpainSpainAlbania
TurkeyPortugal
Albania
Turkey
Austria
Italy
Germany
PortugalTurkey
Spain
Portugal
Germany
Portugal
ItalyItaly
Turkey
Albania
France
Turkey
ItalySpain
TurkeyTurkeyTurkey
Italy
Portugal
Italy
France
SpainItalyItaly
Portugal
SpainSpain
Turkey
SpainSpain
Turkey
Germany
AlbaniaItalyItaly
PortugalPortugal
Germany
Italy
Turkey
Germany
PortugalPortugalFranceFrance
ItalyItaly
France
Turkey
Austria
GermanyFrance Portugal
ChinaChina
PakistanPakistanPakistan
China
Bangladesh
PakistanPakistan
China
PakistanPakistan
China
Pakistan
India
PakistanPakistanPakistan
China
Bangladesh
PakistanPakistanPakistanPakistanPakistanPakistan
ChinaChina
Pakistan
Bangladesh
PakistanPakistanPakistanPakistanPakistanPakistan
China
Pakistan
China
Bangladesh
PakistanPakistanPakistanPakistanPakistan
China
Pakistan
ChinaChinaChinaIndia ChinaChinaChina
Pakistan
India
Pakistan
Bangladesh
China
PakistanPakistanPakistan
ChinaIndiaIndia
BangladeshBangladesh
China
-100
-50
05
0
Gap
in M
ath
Sco
re
.2 .4 .6 .8FLFP

36
Table 2. Math Scores and Gender Equality
(1) (2) (3) (4) (5) (6) (7) (8) (9) (10) 1. GGI*Female 96.19** 115.73** 132.59** 112.24** 112.86** 109.65** 116.84** 101.15** 97.64* 115.73* [41.85] [44.85] [52.83] [53.55] [44.91] [53.88] [49.51] [45.57] [48.93] [61.28] 2. PEI*Female 55.81** 58.31** 57.58** 60.21* 57.89** 59.50* 55.16* 50.03* 49.54* 58.31* [27.00] [26.43] [25.90] [31.49] [26.02] [31.59] [27.93] [27.18] [27.71] [34.54] 3. FLFP*Female 30.29* 31.56* 30.97 34.62** 30.22* 33.86** 32.60* 22.41 20.46 31.56 [16.26] [16.99] [18.49] [16.39] [16.74] [16.16] [18.18] [14.70] [15.46] [23.49] Observations 12,027 12,027 12,027 12,027 12,027 12,027 12,027 12,027 12,027 12,027
Year FE X X X X X X X X X XCountry of ancestry FE X X X X X X X X X XHost country FE X X X X X X X X X XHost country FE*Female X X X X X X X XIndividuals' age and grade level and its interactions with Female dummy
X X X X X X X X X X
GDP (country of ancestry)*Female X X X X X X X X XHDI (country of ancestry)*Female XFamily characteristics and its interaction with female X XSchool characteristics and its interaction with female X XYear FE*Female XGender equality (host)*Female X XGDP (host)*Female X XHDI (host)*Female XSE adjusted by BRR XNotes: Results from estimating equations (1) to (4) on individuals’ math scores. Specification (1) includes year, country of ancestry and host country FE, the interaction between host country FE and female dummy, and control for individuals’ age and dummies for any students who are in a grade different from the modal one in the country and its interactions with the female dummy. Specification (2), our preferred specification, adds the GDP per capita from the country of ancestry interacted by the female dummy. Specification (3) adds the HDI interacted by the female dummy. Specifications (4), (5) and (6) include family, school characteristics or both and their interaction with the female dummy (see details in Appendix Table A.1). Specification (7) replicate specification (2) but adds the interaction between year FE and female dummy. Specification (8) replaces the interaction between the female dummy and host country FE by the interaction between the female dummy and (i) gender equality measures for the host country (see details in main text) (ii) the host country’s GDP per capita. Specification (9) also adds the interaction with the host country’s HDI. In specifications (1) to (9), standard errors are clustered at country of ancestry’s level, while specification (10) replicates specification (2) adjusting the Standard Error with the BRR methodology. * p<0.1, ** p<0.05, *** p<0.01.

37
Table 3. Alternative Measures of Gender Equality
Table 4. Sensitivity of Sample Selection
GGI*female (Baseline) 115.73**
[44.85]
N 12,027 A. Dropping the origin with more observations (Portugal)
GGI*female 110.34**
[47.57]
N 9,181
B. Dropping the host country with more observations (Switzerland) GGI*female 111.50**
[55.00]
N 9,117
C. Keeping only one host country Switzerland
GGI*female 163.12
[106.77]
N 2,910
Australia
GGI*female 199.08**
[84.98]
N 2,447
Notes: Results from estimating equation 2 (preferred specification) on individuals’ math scores using different samples of countries of ancestry (Panel A) and host countries (Panel B and C). Standard Errors are clustered at the country of ancestry level, which implies 44, 42, 8 and 14 clusters, respectively. * p<0.1, ** p<0.05, *** p<0.01.
Mean and St.Dev
Effect estimated (1)
GE measure (2)
Math Gender Gap (3)
A. Measures from 1990-1997
Parliament seats held by women (1990-97)*female 85.32*** 0.106 -18.21
[30.07] [0.065] [47.23]
N 12,007
FLFP(1990)*female 28.16 0.471 -18.29
[21.05] [0.119] [47.51]
N 12,027
B. Other measures of Gender Equality
WVS indicator*female 27.97** 2.72 -14.85
[13.27] [0.22] [51.88]
N 10,949
Gap in literacy rate*female 2.12*** 99.13 -19.10
[0.27] [2.78] [42.71]
N 6,797
Note: Column (1) displays the results from estimating equation 2 (preferred specification) on individuals’ math tests scores using alternative measures of gender equality (see Appendix Table A.2 for details and definition of each measure). Columns (2) and (3) display the mean and cross-country-of-ancestry standard deviation of each measure and the math gender gap, respectively. Standard Errors are clustered at country of ancestry level, which implies 44, 45, 36 and 17 clusters, respectively. * p<0.1, ** p<0.05, *** p<0.01.

38
Table 5. Effect of culture of ancestry on girls and boys
Panel A. Girls (1) (2) (3) (4) GGI 236.31** 253.95** 251.61** 233.36** [107.52] [107.68] [107.40] [94.66] PEI 40.83 17.08 17.15 18.22 [75.16] [77.50] [77.74] [78.02] FLFP 134.06** 136.48** 135.32** 116.01** [52.84] [51.72] [51.50] [48.38] N 6106 6106 6106 6106 Panel B. Boys GGI 157.63 154.82 154.89 140.94 [121.37] [128.56] [127.72] [119.19] PEI -15.08 -45.93 -45.68 -40.74 [79.98] [88.94] [88.32] [92.24] FLFP 95.64 101.11* 101.30* 89.97* [57.21] [52.18] [51.55] [51.50] N 5921 5921 5921 5921 Year FE X X X X Host country FE X X X GDP country of ancestry X X X Individuals' age and grade level X X X X Family and school characteristics X Host country Gender Equality and GDP
X
Notes: Results from estimating equations (1) to (4) on girls and boys’ math scores separately. Specification (1) includes year and host countries fixed-effects and individual controls. Specification (2) adds the GDP per capita of each country of ancestry. Specification (3) adds family and school characteristics and specification (4) replace host country fixed-effect for host countries’ gender equality measures and GDP per cápita. Standard errors clustered at country of ancestry level (45 clusters). * p<0.1, ** p<0.05, *** p<0.01.
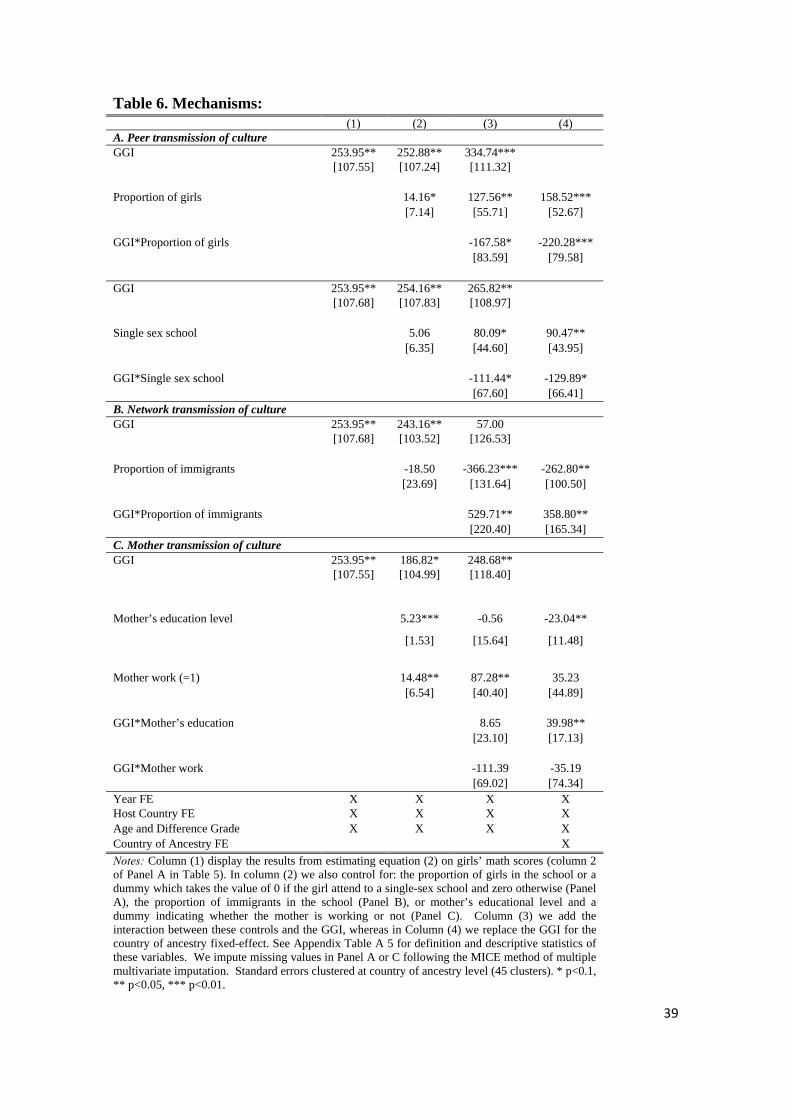
39
Table 6. Mechanisms: (1) (2) (3) (4)
A. Peer transmission of culture GGI 253.95** 252.88** 334.74*** [107.55] [107.24] [111.32] Proportion of girls 14.16* 127.56** 158.52*** [7.14] [55.71] [52.67] GGI*Proportion of girls -167.58* -220.28*** [83.59] [79.58] GGI 253.95** 254.16** 265.82** [107.68] [107.83] [108.97] Single sex school 5.06 80.09* 90.47** [6.35] [44.60] [43.95] GGI*Single sex school -111.44* -129.89* [67.60] [66.41] B. Network transmission of culture GGI 253.95** 243.16** 57.00 [107.68] [103.52] [126.53] Proportion of immigrants -18.50 -366.23*** -262.80** [23.69] [131.64] [100.50] GGI*Proportion of immigrants 529.71** 358.80** [220.40] [165.34] C. Mother transmission of culture GGI 253.95** 186.82* 248.68** [107.55] [104.99] [118.40]
Mother’s education level 5.23*** -0.56 -23.04**
[1.53] [15.64] [11.48]
Mother work (=1) 14.48** 87.28** 35.23 [6.54] [40.40] [44.89] GGI*Mother’s education 8.65 39.98** [23.10] [17.13] GGI*Mother work -111.39 -35.19 [69.02] [74.34] Year FE X X X X Host Country FE X X X X Age and Difference Grade X X X X Country of Ancestry FE X
Notes: Column (1) display the results from estimating equation (2) on girls’ math scores (column 2 of Panel A in Table 5). In column (2) we also control for: the proportion of girls in the school or a dummy which takes the value of 0 if the girl attend to a single-sex school and zero otherwise (Panel A), the proportion of immigrants in the school (Panel B), or mother’s educational level and a dummy indicating whether the mother is working or not (Panel C). Column (3) we add the interaction between these controls and the GGI, whereas in Column (4) we replace the GGI for the country of ancestry fixed-effect. See Appendix Table A 5 for definition and descriptive statistics of these variables. We impute missing values in Panel A or C following the MICE method of multiple multivariate imputation. Standard errors clustered at country of ancestry level (45 clusters). * p<0.1, ** p<0.05, *** p<0.01.

40
Appendix Table A. 1 Individual-level variables: Definition and Descriptive Statistics
Name Definition Mean St. Dev. across
countries of ancestry A. Individual Characteristics Female Dummy variable equal to 1 if the individual is a girl 0.51 0.11 Age Years and months 15.77 0.07
Different grade Dummy equal to 1 if the current individual’s grade is different from the modal grade at the children age in the host country and 0 otherwise.
0.38 0.21
B. Family characteristics Mother highest level of education (MISCED)
Index constructed by the PISA program based on the highest education level of each parent. It has the following categories: (0) None; (1) ISCED 1 (primary education); (2) ISCED 2 (lower secondary); (3) ISCED Level 3B or 3C (vocational/pre-vocational upper secondary); (4) ISCED 3A (upper secondary) and/or ISCED 4 (non-tertiary post-secondary); (5) ISCED 5B (vocational tertiary); and (6) ISCED 5A, 6 (theoretically oriented tertiary and post-graduate).
3.48 0.93
Father highest level of education (FISCED)
3.77 0.82
Index of parents level of occupation (hisei)
The highest occupational level of parents (HISEI), elaborated by the PISA program, corresponds to the higher ISEI score of either parent or to the only available parent’s ISEI score. The ISEI (international socio-economic index of occupational status) score created by Ganzeboom, Graaf, and Treiman (1992) is based in the International Standard Classification of Occupation (ISCO) from ILO. This index ranges from 11 to 90, and higher values indicate higher level of occupational status.
45.43 9.37
Index of cultural possessions (cultposs)
The CULTPOSS index, is based on the students' responses to whether they had the following at home: classic literature, books of poetry and works of art. These variables are binary and the scale construction is done (by the PISA program) through IRT (item respond theory) scaling. Positive values on this index indicate higher levels of cultural possessions.
-0.30 0.35
Index of home educational resources (hedres)
The index of home educational resources (HEDRES) is based on the items measuring the existence of educational resources at home including a desk and a quiet place to study, a computer that students can use for schoolwork, educational software, books to help with students' school work, technical reference books and a dictionary. Again, These variables are binary and the scale construction is done through IRT scaling. Positive values on this index indicate higher levels of home educational resources.
-0.07 0.39
Language at home 1 if language spoken at home is different from the test language
0.37 0.25
C. School characteristics
Percentage of girls
PISA index of the proportion of girls enrolled in each school derived from school principals’ responses regarding the number of girls divided by the total of girls and boys at a school.
0.49 0.04
Private school Dummy equal to 1 if school is private and 0 otherwise.
0.18 0.09
Place of residence Dummy equal to 1 if the school is in a metropolis and 0 otherwise.
0.14 0.07

41
Table A. 2 Country-level variables: Definition and Descriptive Statistics
Name Definition Mean Cross-country-of-ancestry St.
Dev. A. Gender Equality Measures Gender Gap Index (GGI)
Synthesizes the position of women by considering economic opportunities, economic participation, educational attainment, political achievements, health and well-being. The index range between 0 and 1. Larger values point to a better position of women in society. We use the 2009 index. Source: World Economic Forum, 2009 Report.
0.67 0.06
Political Empowerment Index (PEI)
Measure women's political participation based on three components: (1) the ratio women to men with seats in parliament; (2) the ratio of women to men in ministerial level and (3) the ratio of the number of years with a women as head of state to the years with a man. Larger values point to a better position of women in society. We use the 2009 indexes. This index is also elaborated for the World Economic Forum as part of the Gender Gap Index. Source: World Economic Forum, 2009 Report.
0.16 0.12
FLFP Female Labor Force Participation, from 15 years old. We use the 2009 rates. Source: International Labour Organization.
0.49 0.12
WVS Index elaborated from data of the World Value Survey based on the following questions: (1)"When jobs are scarce, men should have more right to a job than women", (2)"A working mother can establish just as warm and secure a relationship with her children as a mother who does not work", (3)"Being a housewife is just as fulfilling as working for pay", (4)"Both the husband and wife should contribute to household income", (5)"On the whole, men make better political leaders than women do", (6)"If a woman earns more money than her husband, it's almost certain to cause problems" and (7)"A university education is more important for a boy than for a girl". For all but the first, levels of agreements had to be expressed on a scale from 1 to 4. In the first question the answers were "agree," "neither," and "disagree," to which we attributed the respective scores of 1.5, 2.5, and 3.5. We inverted the answers to questions (2) and (4), so that higher values indicate a better position of women in society. The final index is the average by country of the answers to all these questions. We use all waves, except the wave 2005-2008 because it doesn’t include most of these questions.
2.63 0.18
Literacy rate GPI The literacy rate gender parity index (GPI) is the ratio of female to male literacy rates (adults of +15years old). Source: World Bank. The index range from 0 to 100, and take the maximum value when male and females have the same literacy rate.
97.38 4.26
B. Macro Variables GDP per capita Gross Domestic Product per capita in real terms deflated
with Laspeyres price index. We average the 2003, 2006 and 2009 values. Source: Heston, A., Summers, R. and Aten, B, Penn, World Table Version 7.0, Center for International Comparisons of Production, Income and Prices at the University of Pennsylvania, May 2011.
14,721 12,558
Human Development Index (HDI)
The HDI measures the level of development of a country, combining information on people’s life expectancies, adult literacy rates, gross enrollment ratios in different educational levels and the GDP. The index range from 0 to 100. Source: http://hdr.undp.org/en/statistics/hdi.
0.74 0.14

42
Table A. 3 Sample Size by Country of Ancestry and Destiny ARG AUS AUT BEL CHE CZE FIN GBR ISR LUX NLD NZL Total
1 Albania 4 132 136 2 Australia 36 36 3 Austria 46 46 4 Bangladesh 7 7 5 Belgium 159 159 6 Bolivia 131 131 7 Brazil 7 7 8 Chile 24 24 9 China 410 3 5 13 20 27 130 608
10 Croatia 77 77 11 Ethiopia 151 151 12 Estonia 55 55 13 Fiji 35 35 14 France 102 203 67 242 614 15 Germany 21 38 41 176 116 6 398 16 Greece 46 46 17 Hungary 7 7 18 India 158 5 5 168 19 Iran 6 6 20 Italy 88 739 256 1,083 21 Korea 31 15 46 22 Malaysia 34 34 23 Morocco 192 192 24 Netherlands 12 50 62 25 New Zealand 376 376 26 Pakistan 36 36 27 Paraguay 63 63 28 Philippines 240 240 29 Poland 47 47 30 Portugal 777 2,069 2,846 31 Romania 58 58 32 Russian Fed. 3 9 89 491 592 33 Slovakia 3 67 70 34 Viet Nam 291 68 359 35 Slovenia 6 6 36 South Africa 60 10 70 37 Spain 246 246 38 Suriname 107 107 39 Sweden 9 9 40 Turkey 509 440 591 21 222 1,783 41 Ukraine 5 5 42 Macedonia 20 20 43 United
Kingdom 651 14 5 168 838 44 United States 29 82 111 45 Uruguay 17 17
Total 242 2,447 775 633 2,910 154 187 68 791 2,856 565 399 12,027 Notes: Final sample of second-generation immigrants from 2003, 2006, 2009 and 2012 PISA datasets. ARG=Argentina, AUS=Australia, AUT=Austria, BEL=Belgium, CHE=Switzerland, CZE=Czech Republic, FIN=Finland, SCT=Scotland, ISR=Israel, LUX=Luxembourg, NLD=Netherlands, NZL= New Zealand.

43
Table A. 4 Gender Gap in Test Scores All Countries participating in PISA Countries included in our sample
All individuals Second-
generation immigrants
All individuals Second-
generation immigrants
Second-generation immigrants
(final sample) Math Scores (1) (2) (3) (4) (5) Boys 459.24 [104.74] 469.95 [94.60] 494.45 [101.94] 492.45 [100.27] 490.96 [109.95] Girls 446.78 [99.95] 459.77 [92.79] 478.99 [97.38] 475.13 [95.83] 472.67 [99.25] Gender Gap -12.46 -10.18 -15.46 -17.32 -18.29 Reading Scores Boys 440.81 [103.28] 453.74 [100.59] 468.92 [105.61] 468.31 [104.14] 462.54 [112.86] Girls 471.89 [97.10] 487.71 [94.74] 500.94 [98.20] 498.78 [97.72] 491.17 [103.11] Gender Gap 31.09 33.97 32.02 30.47 28.63 Notes: Author's calculations based on 2003, 2006, 2009 and 2012 PISA datasets. Mean and Standard Deviation in brackets. See Data section for details about which countries are included in our sample.
Table A 5 School and Mother characteristics used in the analysis of mechanisms over the sample of girls: Definitions and Descriptive Statistics
Name Definition Mean St. Dev. across
countries of ancestry A. School characteristics
Percentage of immigrants
Number of immigrants (either first or second-generation) divided the total individuals by school. Own calculation based on PISA samples by year, weighted by student final weight.
0.34 0.11
Percentage of girls See definition in Appendix Table A1. 0.50 0.04
Single-sex school Dummy equal to 1 if the percentage of girls in the school is higher than 95 per cent.
0.10 0.06
Mom work Dummy equal to 1 if mother work and 0 otherwise. 0.81 0.12 Mother highest level of education (MISCED)
See definition in Appendix Table A1. 3.34 1.05
Related Documents