Math 485 Modeling Multistability in the Expression of the lac Operon in Escherichia coli Analysis of: “Multistability in the lactose utilization network of Escherichia coli” Written by: Ertugrul M. Ozbudak, Mukund Thattai, Han N. Lim, Boris I. Shraiman & Alexander van Oudenaarden Group Members: Lauren Nakonechny, Katherine Smith, Michael Volk, & Robert Wallace Mentor: J. Ruby Abrams

Welcome message from author
This document is posted to help you gain knowledge. Please leave a comment to let me know what you think about it! Share it to your friends and learn new things together.
Transcript
Math 485
Modeling Multistability in the Expression of the lac Operon in Escherichia coli Analysis of: “Multistability in the lactose utilization network of Escherichia coli”
Written by: Ertugrul M. Ozbudak, Mukund Thattai, Han N. Lim, Boris I.
Shraiman & Alexander van Oudenaarden
Group Members: Lauren Nakonechny, Katherine Smith, Michael Volk, & Robert Wallace
Mentor: J. Ruby Abrams
2
Abstract
The lac operon is a segment of DNA in the bacteria Escherichia coli that controls the
metabolism of lactose in the absence of glucose, its preferred carbon source. The
expression of this gene segment is highly regulated in order to maximize efficiency and
minimize energy waste within the cell. Due to the presence of a positive feedback loop
within this system, the mathematical model of the lactose utilization network is multistable.
For our project, we recreated and verified the mathematical model presented by Ozbudak
et al. in their paper, “Multistability in the lactose utilization network of Escherichia coli.” We
also thoroughly analyzed the dynamics of the system by breaking down the model and
varying its parameters, linearizing and classifying its fixed points, and creating a simulation
that generates data points based on fixed initial conditions. As a result of this analysis, we
were able to quantitatively characterize the behavior of the expression of the lac operon.
Introduction
The multistability of a system contributes to the existence of a phenomenon called
biological switching. A multistable system has the capacity to develop many internal states
from only one set of external inputs; the potential for this multistability is the defining
characteristic of a switch. Biological switches play a role in a variety of systems within cells -
including whether a cell multiplies through the process of mitosis - and thus studying the
underlying mathematics is an important step in understanding (and predicting) an
organism’s fate.
Gene expression is another process within a cell that can be described by analyzing the
multistability of the system. In the bacteria Escherichia coli, a segment of DNA called the lac
operon is responsible for metabolizing lactose. This gene is not expressed consistently;
rather, it is turned on only when there is an absence of glucose, and the metabolism of
lactose is crucial to keep the cell alive. There exists a positive feedback loop in the
regulatory network of this system, which creates the potential for multistability. The

3
resulting multistability is responsible for turning the expression of this gene “on” and “off”
at any given time - that is, it is responsible for flipping the biological switch.
In their paper, Ozbudak et al. performs experiments that measure the expression of the lac
operon in a variety of situations. This allows them to develop a mathematical model that
describes the behavior of the system, and this analysis results in the generation of a phase
diagram. The phase diagram describes the internal states of the system (whether the lac
operon is expressed) as external parameters are varied (glucose and lactose). This presents
the criteria that determines how to produce a functional biological switch.
Our group has reconstructed and verified the results of the paper by Ozbudak et al. and
analyzed their mathematical model. We performed parameter reduction, system
linearization, and fixed point analysis to determine the behavior of the system as
parameters are varied. We also generated our own data points in the confines of the initial
conditions of the system to determine if our reconstructed simulation produced an
accurate representation of the system. This data was compared to that of Ozbudak et al.
We then interpreted the mathematical analysis in terms of the biological consequences.
Background
Biological Background:
Escherichia coli is a type of bacteria that is found in the intestines of various mammals. E.
coli is considered a model organism because it is (relatively) harmless, easy to breed, and
contains genes similar to those of humans. As a result, it is one of the most common types
of cells used in biological research. In their paper, Ozbudak et al. studied a segment of E.
coli’s DNA called the lac operon. DNA is like a recipe book found in every living cell. This
book has all of the instructions required to make functional proteins. The process of
protein production includes transcription (reading the recipe) and translation (making the
protein from the recipe). The lac operon in E. coli is a gene segment that specifically codes
for proteins that are responsible for breaking down lactose.
4
E. coli prefers to obtain and break down - that is, metabolize - glucose in order to gain
carbon molecules. These carbon molecules are used to complete various functions in the
cell. The uptake and breakdown of glucose is the most energy-efficient way to obtain these
carbon molecules. However, when there is not enough glucose in the cell, E. coli will
metabolize lactose instead. When lactose is present, the lac operon comes into play; E. coli
essentially “turns on” the lac operon, and it begins creating proteins and enzymes that are
built to break down lactose. This is called lac operon expression - though it is usually turned
off, when lactose is present, the gene segment is expressed (turns on), and is transcribed
and translated. When this happens, lactose is broken down into two smaller sugars:
glucose and galactose. These sugars are then used for their carbon molecules in a variety
of cell processes.
So, how is the lac operon turned on?
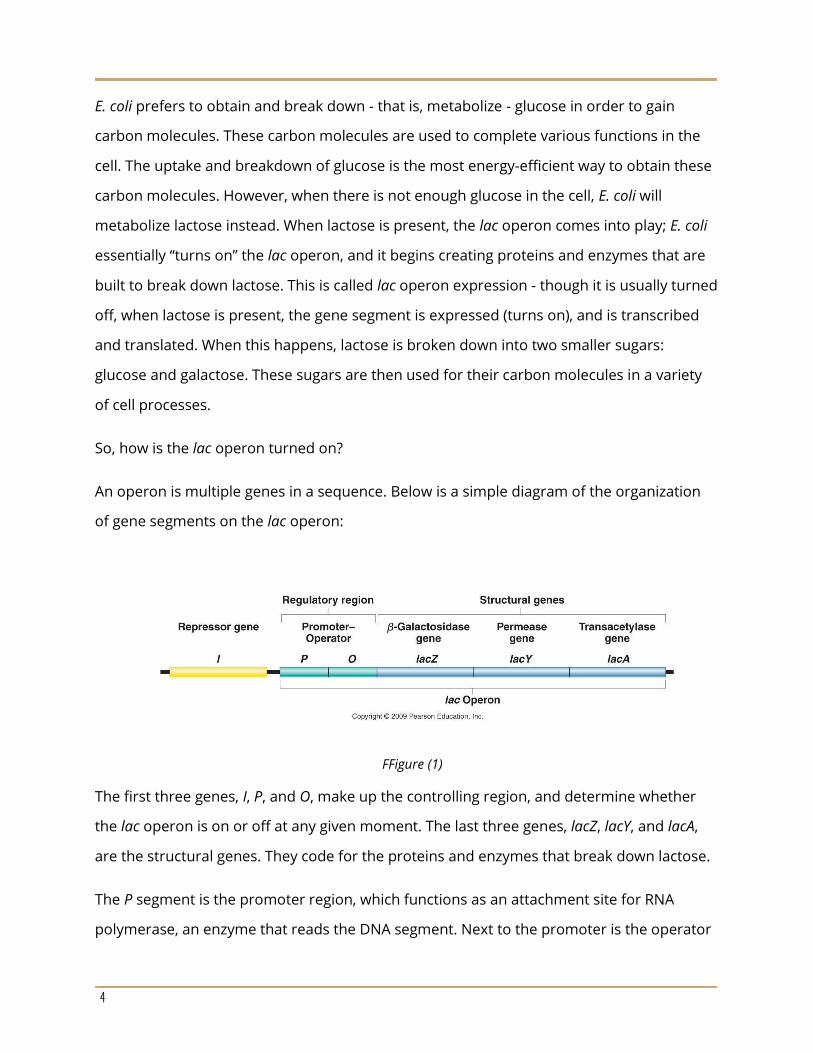
An operon is multiple genes in a sequence. Below is a simple diagram of the organization
of gene segments on the lac operon:
FFigure (1)
The first three genes, I, P, and O, make up the controlling region, and determine whether
the lac operon is on or off at any given moment. The last three genes, lacZ, lacY, and lacA,
are the structural genes. They code for the proteins and enzymes that break down lactose.
The P segment is the promoter region, which functions as an attachment site for RNA
polymerase, an enzyme that reads the DNA segment. Next to the promoter is the operator

5
(O) region on the DNA. This site is where the repressor protein for the lac operon attaches.
The repressor protein is called LacI (I=inhibitor). When glucose is present, LacI is bound to
the operator, preventing RNA polymerase from reading the gene segment. This stops
expression of the lac operon (keeps it turned off). When there is lactose present in the cell,
it binds to the repressor, which lifts LacI off of the operator. RNA polymerase is then able to
transcribe the lac operon, turning on its expression, and lactose is metabolized.
Figure (2) illustrates the portions of the gene segment that function as attachment sites for
proteins.
Figure (2)
There is also a second level to lac operon control and expression. This two-pronged control
system prevents the system from metabolizing lactose if there is any glucose present in the
cell; this ensures that the cell does not waste energy breaking down lactose if the preferred
carbon source - glucose - is available. At the promoter region at the beginning of the
operon, RNA polymerase binds, along with a protein called the catabolite activator protein
(CAP). For the lac operon to be turned on, the CAP must be bound to a molecule called
cyclic AMP (cAMP). cAMP is essentially a direct measure of the level of glucose in the cell.
When glucose levels are high, there is low cAMP in the cell, and when glucose levels are
low, there is high cAMP in the cell. So, if glucose is present, the CAP-cAMP complex does not
bind efficiently, and the lac operon does not turn on.
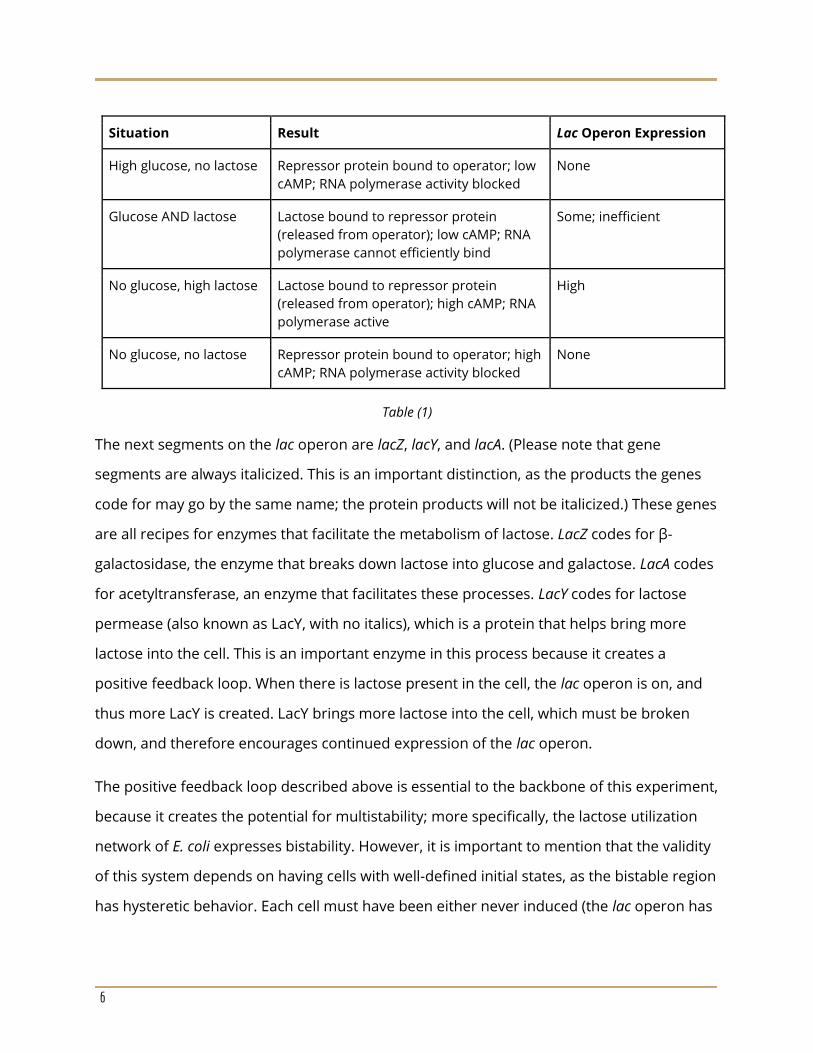
The table below summarizes lac operon expression in a variety of situations.
6
Situation Result Lac Operon Expression
High glucose, no lactose Repressor protein bound to operator; low
cAMP; RNA polymerase activity blocked
None
Glucose AND lactose Lactose bound to repressor protein
(released from operator); low cAMP; RNA
polymerase cannot efficiently bind
Some; inefficient
No glucose, high lactose Lactose bound to repressor protein
(released from operator); high cAMP; RNA
polymerase active
High
No glucose, no lactose Repressor protein bound to operator; high
cAMP; RNA polymerase activity blocked
None
Table (1)
The next segments on the lac operon are lacZ, lacY, and lacA. (Please note that gene
segments are always italicized. This is an important distinction, as the products the genes
code for may go by the same name; the protein products will not be italicized.) These genes
are all recipes for enzymes that facilitate the metabolism of lactose. LacZ codes for β-
galactosidase, the enzyme that breaks down lactose into glucose and galactose. LacA codes
for acetyltransferase, an enzyme that facilitates these processes. LacY codes for lactose
permease (also known as LacY, with no italics), which is a protein that helps bring more
lactose into the cell. This is an important enzyme in this process because it creates a
positive feedback loop. When there is lactose present in the cell, the lac operon is on, and
thus more LacY is created. LacY brings more lactose into the cell, which must be broken
down, and therefore encourages continued expression of the lac operon.
The positive feedback loop described above is essential to the backbone of this experiment,
because it creates the potential for multistability; more specifically, the lactose utilization
network of E. coli expresses bistability. However, it is important to mention that the validity
of this system depends on having cells with well-defined initial states, as the bistable region
has hysteretic behavior. Each cell must have been either never induced (the lac operon has

7
never been expressed), or fully induced (the lac operon is currently being expressed), as the
system response is dependent upon its history.
Mathematical Background:
Modeling Positive Feedback and Bistability
In order to model the bistability of the lac operon, three equations are used. The first
equation models the relationship between the concentration of LacI (the repressor protein)
and the intracellular concentration of TMG. This equation denotes the active fraction of LacI
in the system.
𝑅
𝑅𝑇=
1
1+(𝑥/𝑥0)𝑛
Equation (1)
Ozbudak et al.
R is the concentration of active LacI, RT is the total concentration of LacI, x is the intracellular
concentration of TMG, x0 is the half-saturation of TMG, and the exponent, n, is the Hill
coefficient. For modeling purposes x0 can be chosen and is set to 1, and the hill coefficient n
is set to 2 based off of experimental evidence.
Equation (1) behaves as a decreasing sigmoidal function of x. This is the case because even
the smallest amount of binding of TMG to LacI will interfere with its inhibitory activity, and
as more TMG binds, the level of inhibition of the lac operon increases.
The second equation gives the rate of generation of lactose permease (LacY). Recall that as
TMG binds, LacY is expressed and facilitates the uptake of more TMG. This makes up the
positive feedback loop. Equation (3) shows that the generation of LacY is a decreasing
hyperbolic function of LacI.
𝜏𝑦𝑑𝑦
𝑑𝑡= 𝛼
1
1 + 𝑅/𝑅0 − 𝑦
Equation (2)
8
Ozbudak et al.
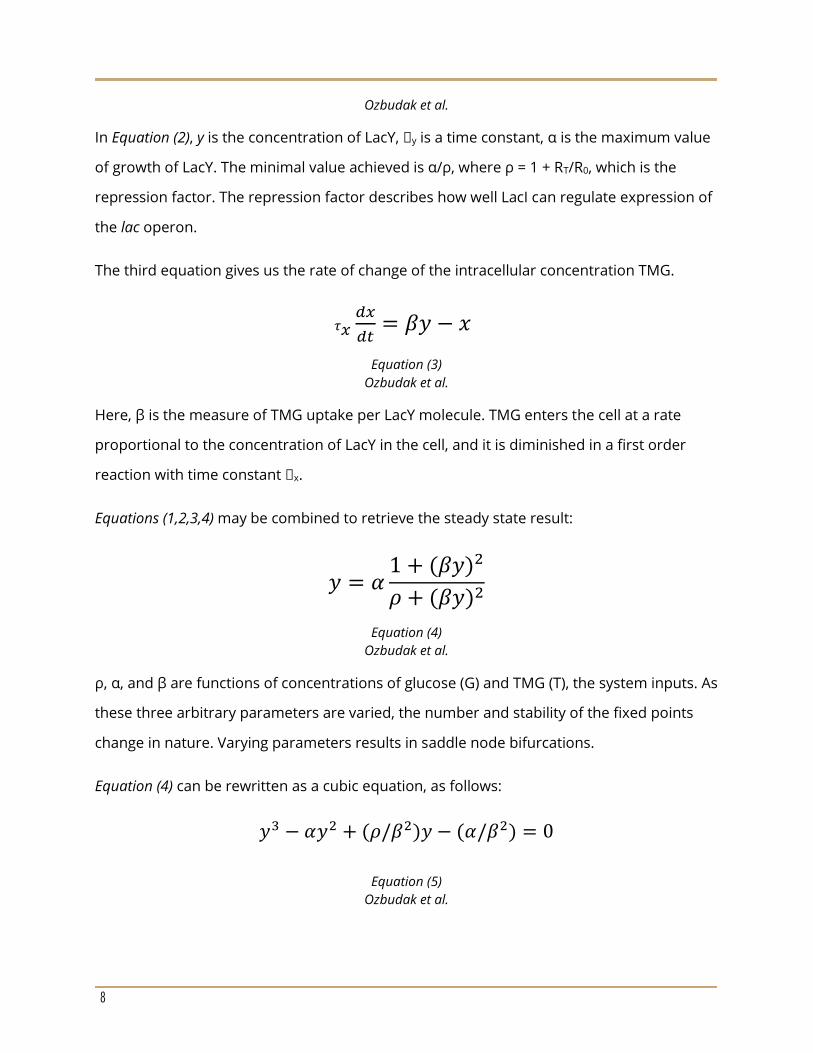
In Equation (2), y is the concentration of LacY, 𝛕y is a time constant, α is the maximum value
of growth of LacY. The minimal value achieved is α/ρ, where ρ = 1 + RT/R0, which is the
repression factor. The repression factor describes how well LacI can regulate expression of
the lac operon.
The third equation gives us the rate of change of the intracellular concentration TMG.
𝜏𝑥𝑑𝑥
𝑑𝑡= 𝛽𝑦 − 𝑥
Equation (3)
Ozbudak et al.
Here, β is the measure of TMG uptake per LacY molecule. TMG enters the cell at a rate
proportional to the concentration of LacY in the cell, and it is diminished in a first order
reaction with time constant 𝛕x.
Equations (1,2,3,4) may be combined to retrieve the steady state result:
𝑦 = 𝛼1 + (𝛽𝑦)2
𝜌 + (𝛽𝑦)2
Equation (4)
Ozbudak et al.
ρ, α, and β are functions of concentrations of glucose (G) and TMG (T), the system inputs. As
these three arbitrary parameters are varied, the number and stability of the fixed points
change in nature. Varying parameters results in saddle node bifurcations.
Equation (4) can be rewritten as a cubic equation, as follows:
𝑦3 − 𝛼𝑦2 + (𝜌/𝛽2)𝑦 − (𝛼/𝛽2) = 0
Equation (5)
Ozbudak et al.

9
To attack this, it should be recalled how to deal with general cubic equations with two
identical roots. We choose to deal with two roots because we seek two stable states. The
general cubic can be written in the following form:
(𝑦 − 𝑎)(𝑦 − 𝑎)(𝑦 − 𝜃𝑎) = 𝑦3 − (2 + 𝜃)𝑎𝑦2 + (1 + 2𝜃)𝑎2𝑦 − 𝜃𝑎3
In the above equation, θ is the dimensionless ratio of roots. By rewriting Equation (5) in this
form and comparing coefficients, we can define our arbitrary functions.
𝜌 = (1 + 2𝜃)(1 + 2/𝜃)
𝛼𝛽 = (2 + 𝜃)3/2
/𝜃1/2
Equations (6) and (7)
Ozbudak et al.
Equations (6, 7) denote the boundary of the bistable region.
Measuring Network Parameters
As mentioned earlier, ρ, α, and β are functions of inputs of glucose (G) and TMG (T). These
parameters are functions of the initial conditions (G and T), and these functions are
determined by experimental data. Some information on how they were derived by
Ozbudak et al. will be provided.
The physical meanings of the network parameters:
● α refers to the level of lac operon expression that would be seen if every repressor
molecule were inactivated. α is the maximum induction level.
● ρ refers to the ratio of the maximal induction level to the basal induction level. The
basal induction level is the level of lac operon expression that would be seen if every
repressor molecule were activated. ρ is the repression factor.
● β refers to the rate of TMG uptake per molecule of LacY.

10
Calculating the functional equations of these three parameters required numerous single-
cell experiments, where their dependence on glucose and TMG levels were measured. See
Figure (3) for the results of these in vivo experiments.
Figure (3)
These calculations also required the application of some caveats. First, the saddle node
condition was applied at each boundary of the bistable region; this was done separately at
what was referred to as ON (induced) and OFF (uninduced) regions. Second, it was taken
into account that α was approximately 15% higher at the OFF threshold than the ON
threshold. Third, due to low fluorescence values in the OFF region, there was a large error
in the calculation of ρ. Therefore, the authors decided to estimate both α and ρ at the ON
threshold only. Lastly, the net TMG uptake rate was decomposed as:
𝛽(𝑇, 𝐺) = 𝛽𝑇(𝑇)𝛽𝐺(𝐺)
Recall that T refers to TMG concentrations and G refers to glucose concentrations. The
power law was assumed for the first half of the equation, and the least-square fitting
technique was used to extract the necessary functions.
It was determined that:

11
𝛼 =84.4
1 + (𝐺/8.1)1.2
+ 16.1, 𝜌 = 167.1
𝛽𝑇 = (1.23 ∗ 10−3)𝑇0.6, 𝛽𝐺(𝐺 > 10) ≅ 65
Equations (8) and (9)
Ozbudak et al.
Methodology
Biological Methods:
To explore the multistability of the lactose utilization network, Ozbudak et al. measured the
expression of the lac operon in E. coli cells in a variety of conditions. This required a method
that would allow for the visualization of operon expression; two reporter proteins were
inserted into the cell’s DNA to measure relative levels of expression. Ozbudak et al. inserted
a copy of the green fluorescent protein (GFP) into the cell’s DNA at the site of lac promoter,
and red fluorescent reporter (HcRed) at the site of the gat promoter. GFP served as a direct
indicator of lac operon expression, and HcRed essentially revealed the levels of the CAP-
cAMP complex.
Using the reporter proteins as indicators, the behavior of cell populations was measured
for lac operon expression as levels of extracellular glucose and lactose were varied. Since
the presence of GFP indicates lac expression, observing at what concentrations of lactose
GFP is present will determine when the lac operon is multistable. A population of 1000 E.
coli cells were observed in varying levels of lactose. At certain levels of lactose, the lac
operon is either expressed or not. In a particular range of lactose, the lac operon is
multistable. In this range of lactose, some of the 1000 cells will be induced and will produce
GFP and some will not. In this range, the expression of the lac operon is multistable
because it can either be induced or not.

12
It is important to note that in this particular experiment, levels of thiomethylgalactoside
(TMG) were measured instead of lactose. TMG is a lactose analog that cannot be readily
metabolized by the system.
It is also important to note that the cells used in this experiment had well-defined initial
states. More specifically, each cell was either uninduced (the lac operon had never been
expressed), or fully induced (the lac operon was currently being expressed).
Mathematical Methods:
3D Manifold
To analyze the steady state solution of the system (Equation (4)) a change in variables was
performed to reduce the total number of parameters from 2 to 3. The change in variables
goes as follows:
𝑦 = 𝛼𝑧 Equation (10)
Following substitution of the newly 𝑧:
𝑧 =
1𝜌2 + (
𝛼𝛽𝜌
𝑧)2
1𝜌
+ (𝛼𝛽𝜌
𝑧)2
Equation (11)
Variables are then redefined as follows:
𝜇 =1𝜌
Equation (12)
𝜆 = 𝛼𝛽𝜌
Equation (12)
13
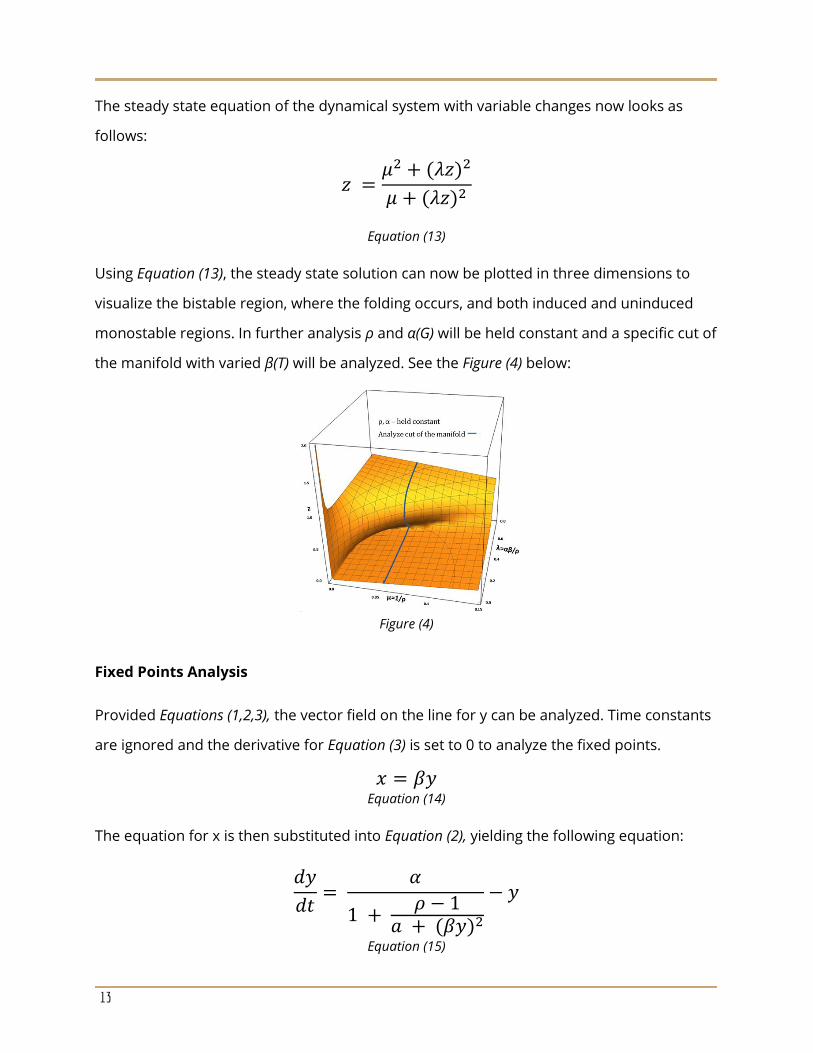
The steady state equation of the dynamical system with variable changes now looks as
follows:
𝑧 =𝜇2 + (𝜆𝑧)2
𝜇 + (𝜆𝑧)2
Equation (13)
Using Equation (13), the steady state solution can now be plotted in three dimensions to
visualize the bistable region, where the folding occurs, and both induced and uninduced
monostable regions. In further analysis ρ and α(G) will be held constant and a specific cut of
the manifold with varied β(T) will be analyzed. See the Figure (4) below:
Figure (4)
Fixed Points Analysis
Provided Equations (1,2,3), the vector field on the line for y can be analyzed. Time constants
are ignored and the derivative for Equation (3) is set to 0 to analyze the fixed points.
𝑥 = 𝛽𝑦 Equation (14)
The equation for x is then substituted into Equation (2), yielding the following equation:
𝑑𝑦
𝑑𝑡=
𝛼
1 + 𝜌 − 1
𝑎 + (𝛽𝑦)2
− 𝑦
Equation (15)

14
After simplification:
𝑑𝑦
𝑑𝑡=
𝛼 (1 + 𝑥2)
(𝜌 + 𝑥2)− 𝑦
Equation (16)
Setting α = 3, and β = 5, the Vector field on the line can be plotted. Note that function
appears to be a cubic and that the derivative of y intersects y = 0 three times for the given
parameter set. This indicates that there are at most three fixed points. See Figure (5).
Figure (5)
A linearization of the fixed points is performed to classify fixed point type. To do this, the
Jacobian is computed.
J(x, y) = (
𝜕𝑥(𝛽𝑦 − 𝑥) 𝜕𝑦(𝛽𝑦 − 𝑥)
𝜕𝑥(𝛼(1 + 𝑥2)
𝜌 + 𝑥2− 𝑦) 𝜕𝑦(
𝛼(1 + 𝑥2)
𝜌 + 𝑥2− 𝑦)
)
Equation (17)
From the Jacobian, the trace and the determinant are computed
𝛥 = 1 − 2𝛼(𝜌 − 1)𝛽
2𝑦
(𝜌 + (𝛽𝑦)2)
2
Equation (18)
𝜏 = −2 Equation (19)
15
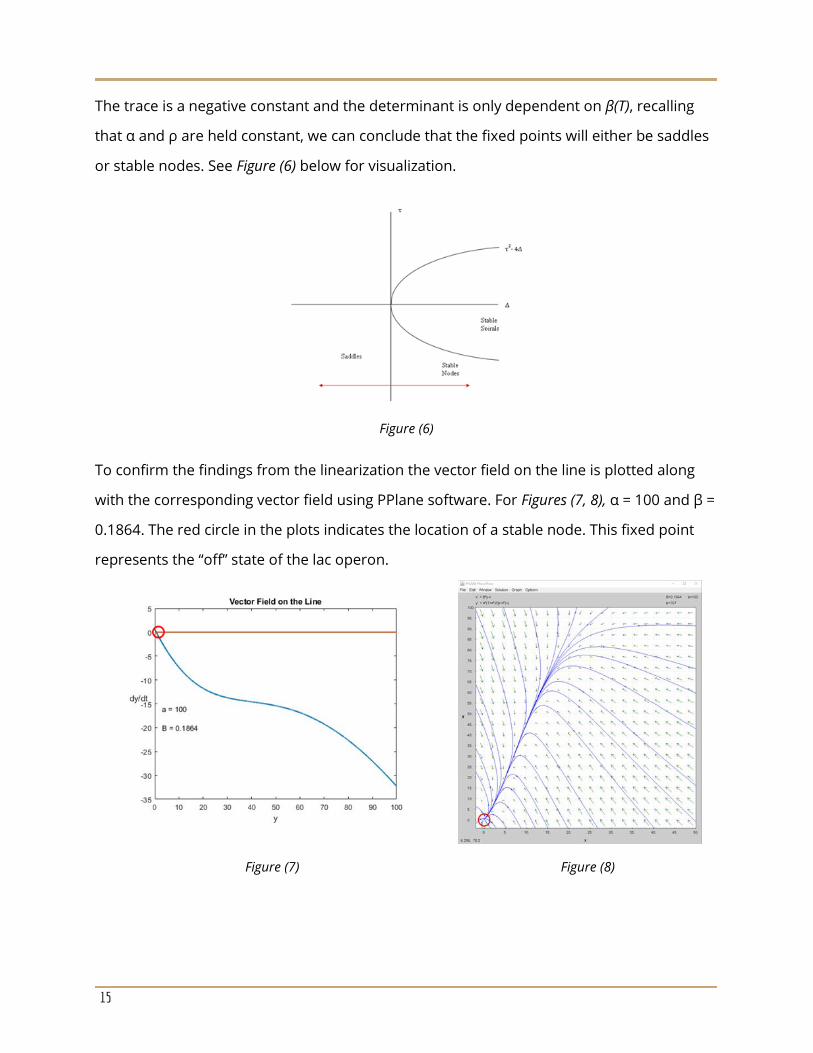
The trace is a negative constant and the determinant is only dependent on β(T), recalling
that α and ρ are held constant, we can conclude that the fixed points will either be saddles
or stable nodes. See Figure (6) below for visualization.
Figure (6)
To confirm the findings from the linearization the vector field on the line is plotted along
with the corresponding vector field using PPlane software. For Figures (7, 8), α = 100 and β =
0.1864. The red circle in the plots indicates the location of a stable node. This fixed point
represents the “off” state of the lac operon.
Figure (7) Figure (8)
16
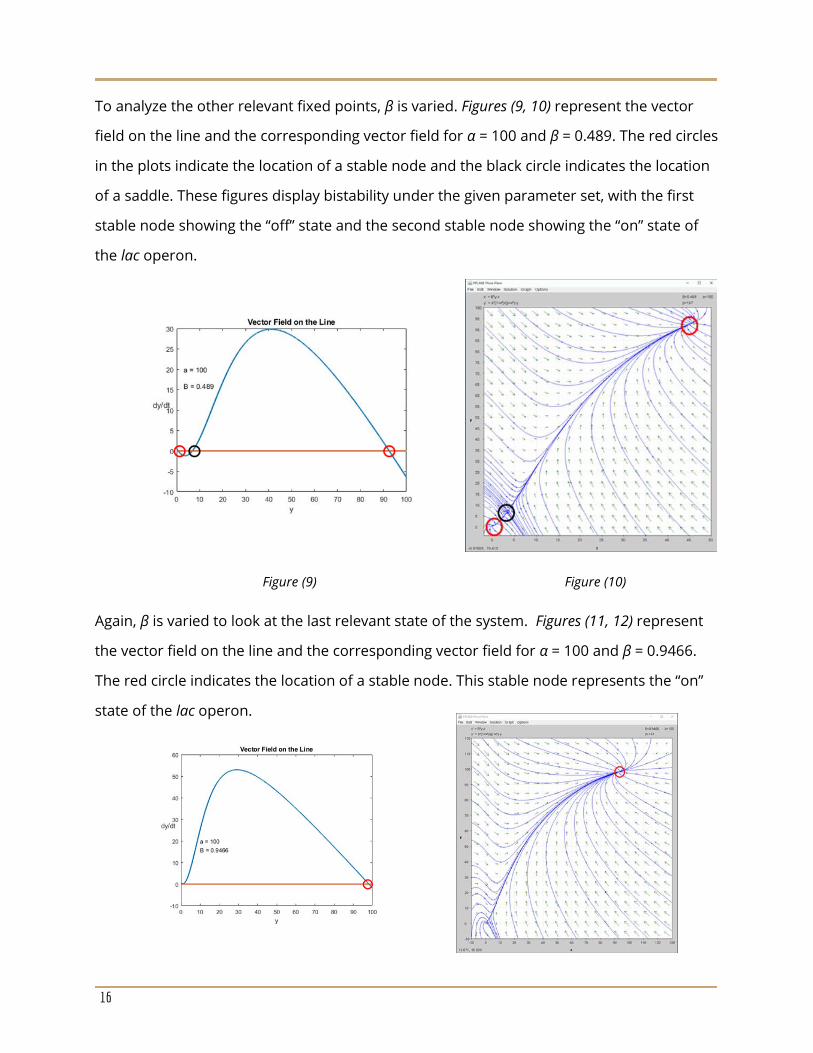
To analyze the other relevant fixed points, β is varied. Figures (9, 10) represent the vector
field on the line and the corresponding vector field for α = 100 and β = 0.489. The red circles
in the plots indicate the location of a stable node and the black circle indicates the location
of a saddle. These figures display bistability under the given parameter set, with the first
stable node showing the “off” state and the second stable node showing the “on” state of
the lac operon.
Figure (9) Figure (10)
Again, β is varied to look at the last relevant state of the system. Figures (11, 12) represent
the vector field on the line and the corresponding vector field for α = 100 and β = 0.9466.
The red circle indicates the location of a stable node. This stable node represents the “on”
state of the lac operon.

17
Sigmoidal Switching
To analyze the switching behavior of
the dynamical system, the ordinary differential equations from Equations (2,3) were
simulated in MATLAB using function ODE45. Parameters were selected so α = 3 and β = 6.2.
This set of parameters allows the turning on of the lac operon to be visualized. Paying
attention to the blue line in Figure (13), we see that y goes from a value of 2 to 16 and looks
similar to a step function indicating that lactose breakdown will be initialized given the
proper parameter values.
Figure (13)
Simulation
Figure (11) Figure (12)

18
Experimental data from Ozbudak et al. will be used as a reference in comparison to the
MATLAB simulations that were performed. See Figure (14) for reference. Note that the
colored circles, green, blue, purple, and red have corresponding matches on in following
phase diagrams pictured in Figures (15, 16, 17). The bottom panel displays the uninduced
state of the lac operon and the top panel displays the induced state of the lac operon.
Using ODE45 in MATLAB, a range of initial conditions x0 and y0 were
selected to encapsulate all relevant fixed point values. The array of initial
conditions can be visualized in as black dots in Figures (15, 16, 17). Additionally, the vector
fields were added to the background of all off the phase diagrams for these plots. A darker
grey hue shows that initial conditions will flow more quickly whereas the light grey hue
shows initial conditions will travel more slowly as they approach their final values. The final
yf values are expected to be found in the region of the lightest colored hue. Figure (15)
shows the dynamical simulation for T = 2, Figure (16) shows the dynamical simulation for T =
10, and Figure (17) shows a dynamical simulation for T = 30. The simulation ran for t = 10s in
order to avoid complete convergence to yf steady state values.
Figure (14)
19
Figure (15) Figure (16)
Figure (17)
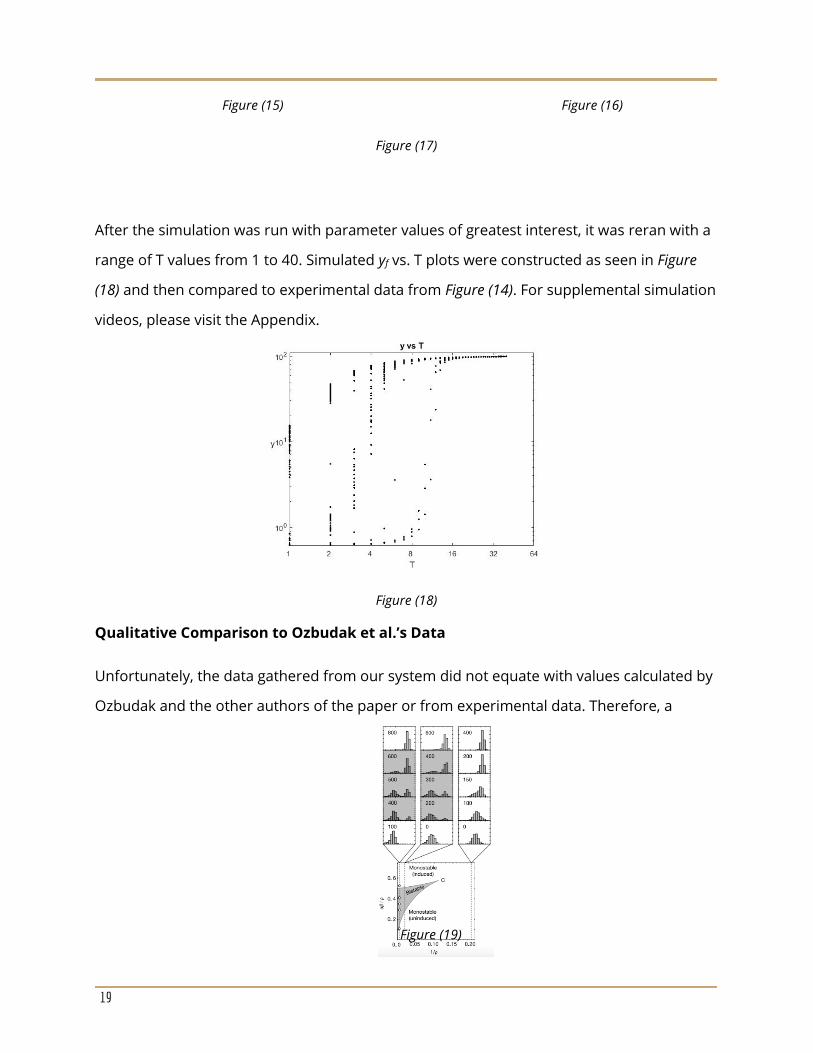
After the simulation was run with parameter values of greatest interest, it was reran with a
range of T values from 1 to 40. Simulated yf vs. T plots were constructed as seen in Figure
(18) and then compared to experimental data from Figure (14). For supplemental simulation
videos, please visit the Appendix.
Figure (18)
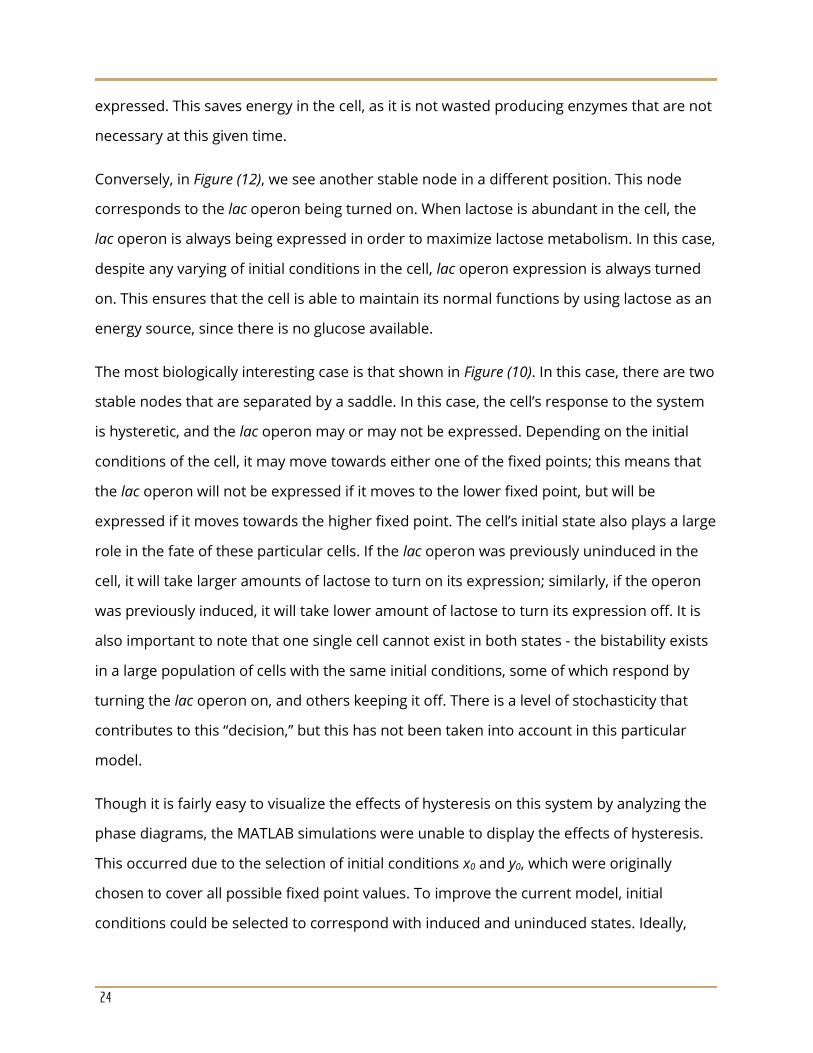
Qualitative Comparison to Ozbudak et al.’s Data
Unfortunately, the data gathered from our system did not equate with values calculated by
Ozbudak and the other authors of the paper or from experimental data. Therefore, a
Figure (19)

20
qualitative comparison between the data from our system and Ozbudak’s data will have to
suffice instead of a quantitative comparison. To do this, it is important to take note of the
following graph again and compare Ozbudak’s data distributions to our own.
In Figure (19), the three dotted vertical lines correspond to differing values of 1/𝜌 that “cut”
the manifold discussed earlier. The two vertical lines on the left are situated in such a way
that as the extracellular TMG concentration is increased (which in turn increases 𝛽since it is
an increasing function of TMG), the system switches from monostable to bistable and back
to monostable. On the other hand, the dotted vertical line on the right illustrates how as
the extracellular TMG concentration increases, the system moves from the lower stable
point to the higher stable point in a graded fashion (it never switches to bistable. The three
series of panels above each of these three dotted lines illustrate the distributions of the
natural log of the green fluorescence values as the TMG level varies (the TMG level is the
number in the box in each panel).
Compare this to the distribution of the log of the green fluorescence values from our
simulation:
Figure (20)

21
These are distributions of the natural log of green fluorescence values generated by our
system after ten seconds for differing levels of extracellular TMG concentrations (which are
labeled on each graph). The distributions generated by our system can be fairly closely
related to one of the series of distributions on the previous figure where data from
Ozbudak et al. data moves from monostable to bistable and back to monostable. It is clear
that in our series of distributions, as extracellular TMG concentrations increase, the
congregation of green fluorescence values shifts from the lower stable point to the higher
stable point.
One stark contrast between our distributions and Ozbudak’s is that for low levels of
extracellular TMG, the green fluorescence distribution is still bistable when it should be
closer to monostable. This difference is most likely due to an error in the setting of the
initial conditions. Additionally, it is clear that as higher TMG values are approached, nearly
all of the green fluorescence values converge to the higher stable value, which is very
reminiscent of Ozbudak’s distributions as well as actual experimental data. However, it
should be noted that Ozbudak’s distributions exhibit much more variability than the
distributions our system generated. More variability is more reminiscent of experimental
data.
Results
Biological Results:

22
The results of the biological experiment performed by Ozbudak et al. is included in Figure
(21). This figure shows that induction of the lac operon takes place hysteretically (see the
grey bistable region that cuts through the graph).
The cells increase and decrease their expression of
the lac operon discontinuously as they cross the
boundaries of the bistable region (the so-called
“switching thresholds”). In other words, initially
uninduced cells are only turned on if the TMG
concentration is above a certain level, and initially
induced cells are only turned off if the TMG
concentration is below a certain level. This tells us
that the response of the system to external conditions is
dependent upon the system’s history.
The experiment also successfully determined the approximate TMG levels at which these
biological “switches” occur. When there is no glucose present in the cell, lac operon
expression is turned off at TMG concentrations below 3μM and turned on at TMG levels
above 30μM. However, when the system is between these switching thresholds, its
response is fully dependent on the history of the cell. TMG levels must drop below 3μM to
turn off initially induced (“on”) cells and must exceed 30μM to turn on initially uninduced
(“off”) cells. The bistable region occurs between 3μM and 30μM. In this region, some of the
1000 E. coli cells that were observed were induced and some were not. Initially, in the
bistable region, more cells are uninduced than not. As the concentration of TMG increases,
more cells are induced and produce GFP until the concentration reaches 30μM. After
which, the lac operon is fully induced.
Mathematical Results:
Ozbudak et al. generated a phase diagram based on their mathematical model of the
lactose utilization network of E. coli. This phase diagram shows us that cells may shift from
Figure (21)

23
being uninduced to induced, or vice versa, hysteretically or in a graded fashion. In the
bistable region, the system is hysteretic and behaves in the same way as the wild-type
system. However, this region of bistability decreases as the repression factor (degree of lac
operon expression), ρ, decreases. At a critical factor of ρ=9, the bistable region hits a cusp
and comes to an end, and the system response occurs in a graded fashion. That is,
expression of the lac operon in each cell can move continuously between low and high
values. This can be seen in the white regions of the graph.
Analysis of fixed points indicates that increasing the amount of extracellular TMG,
parameter T, causes the lac operon to switch from the “off” position to the “on” position.
Expected switching behavior was confirmed using MATLAB ODE45 simulations as depicted
in Figure (13). After running larger scale simulations with a range of initial conditions it can
be concluded that the dynamical system representing the lactose utilization network is
accurate displaying sigmoidal switching behavior. The model was not able to properly
replicate induced and uninduced states as displayed in Figure (14), this means that the
simulation did not capture the effect of hysteresis.
Discussion & Conclusion
The mathematical analysis above provides a quantitative representation of how lac operon
expression behaves as the amounts of lactose and glucose in the cell are varied. There are
three critical states of this system: two states with single stable fixed points, and one state
with two stable fixed points separated by a saddle node. Each of these mathematical states
represent different states in the cell; we will go through each state separately.
In Figure (8), we see that there is one stable node. This node corresponds to the lac operon
being turned off. At these given values of lactose and glucose (low lactose and high
glucose), the lac operon is never being expressed. The initial conditions of the cell may be
varied, but the external parameters of the system dictate that the lac operon is not being
24
expressed. This saves energy in the cell, as it is not wasted producing enzymes that are not
necessary at this given time.
Conversely, in Figure (12), we see another stable node in a different position. This node
corresponds to the lac operon being turned on. When lactose is abundant in the cell, the
lac operon is always being expressed in order to maximize lactose metabolism. In this case,
despite any varying of initial conditions in the cell, lac operon expression is always turned
on. This ensures that the cell is able to maintain its normal functions by using lactose as an
energy source, since there is no glucose available.
The most biologically interesting case is that shown in Figure (10). In this case, there are two
stable nodes that are separated by a saddle. In this case, the cell’s response to the system
is hysteretic, and the lac operon may or may not be expressed. Depending on the initial
conditions of the cell, it may move towards either one of the fixed points; this means that
the lac operon will not be expressed if it moves to the lower fixed point, but will be
expressed if it moves towards the higher fixed point. The cell’s initial state also plays a large
role in the fate of these particular cells. If the lac operon was previously uninduced in the
cell, it will take larger amounts of lactose to turn on its expression; similarly, if the operon
was previously induced, it will take lower amount of lactose to turn its expression off. It is
also important to note that one single cell cannot exist in both states - the bistability exists
in a large population of cells with the same initial conditions, some of which respond by
turning the lac operon on, and others keeping it off. There is a level of stochasticity that
contributes to this “decision,” but this has not been taken into account in this particular
model.
Though it is fairly easy to visualize the effects of hysteresis on this system by analyzing the
phase diagrams, the MATLAB simulations were unable to display the effects of hysteresis.
This occurred due to the selection of initial conditions x0 and y0, which were originally
chosen to cover all possible fixed point values. To improve the current model, initial
conditions could be selected to correspond with induced and uninduced states. Ideally,

25
initial conditions would be selected based on the original experimental data, which was not
available during the simulation trials.
Appendix
https://www.youtube.com/watch?v=V-MgNAJtNJw&feature=youtu.be
https://www.youtube.com/watch?v=kL_k8FZYmoQ&feature=youtu.be
https://www.youtube.com/watch?v=AHUsa-4BrcQ&feature=youtu.be
Sources
Ozbudak, Ertugrul M., Thattai, Mukund, Lim, Han N., Shraiman, Boris I., & van
Oudenaarden, Alexander. Multistability in the lactose utilization network of Escherichia coli.
Nature. 427, 737-740 (2004).1
Hansen, L. H., Knudsen, S. & Sorenson, S. J. The effect of the lacY gene on the induction of
IPTG inducible promoters, studied in Escherichia coli and Pseudomonas fluorescens. Curr.
Microbiol. 36, 341-347 (1998).2
The lac operon. (n.d.). Retrieved from https://www.khanacademy.org/science/biology/gene-
regulation/gene-regulation-in-bacteria/a/the-lac-operon3
The lactose operon of Escherichia coli. (n.d.). Retrieved from
https://www.nature.com/scitable/content/the-lactose-operon-of-escherichia-coli-70054
Yagil, G. & Yagil, E. On the relation between effector concentration and the rate of induced
enzyme synthesis. Biophys. J. 11, 11-27 (1971).5

26
Related Documents