Math 3 Warm Up 4/23/12 Find the probability mean and standard deviation for the following data. 2, 4, 5, 6, 5, 5, 5, 2, 2, 4, 4, 3, 3, 1, 2, 2, 3, 4, 6, 5 Hint: First create a probability distribution.

Math 3Warm Up4/23/12
Jan 03, 2016
Math 3Warm Up4/23/12. Find the probability mean and standard deviation for the following data. 2, 4, 5, 6, 5, 5, 5, 2, 2, 4, 4, 3, 3, 1, 2, 2, 3, 4, 6, 5 Hint: First create a probability distribution. Unit 6: Data Analysis. Z-Score. - PowerPoint PPT Presentation
Welcome message from author
This document is posted to help you gain knowledge. Please leave a comment to let me know what you think about it! Share it to your friends and learn new things together.
Transcript
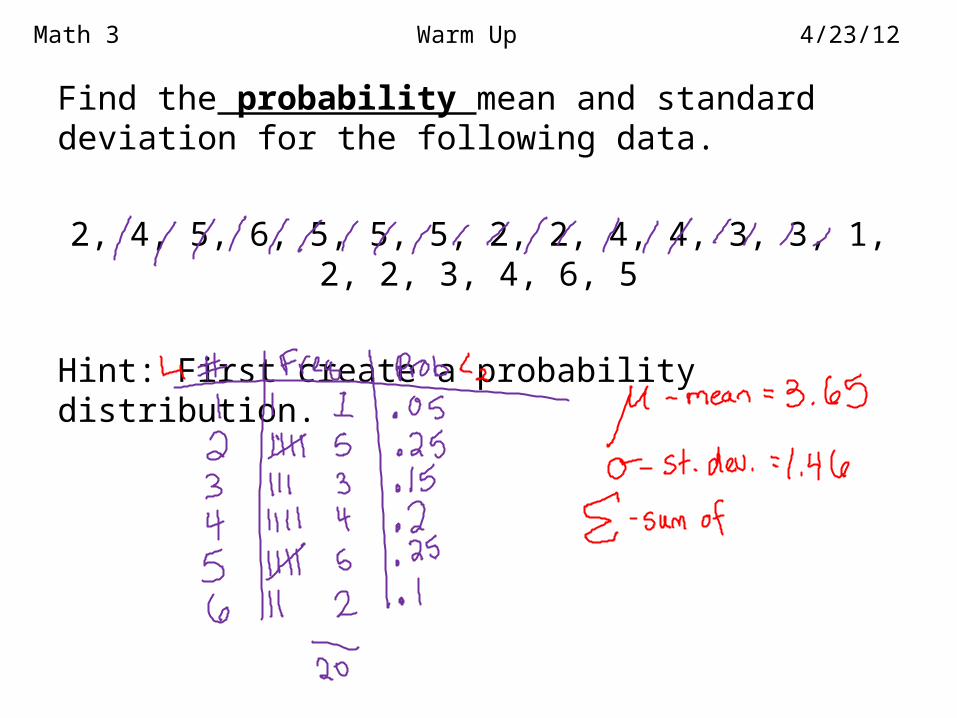
Math 3 Warm Up 4/23/12
Find the probability mean and standard deviation for the following data.
2, 4, 5, 6, 5, 5, 5, 2, 2, 4, 4, 3, 3, 1, 2, 2, 3, 4, 6, 5
Hint: First create a probability distribution.


Z-SCOREUnit 6: Data Analysis
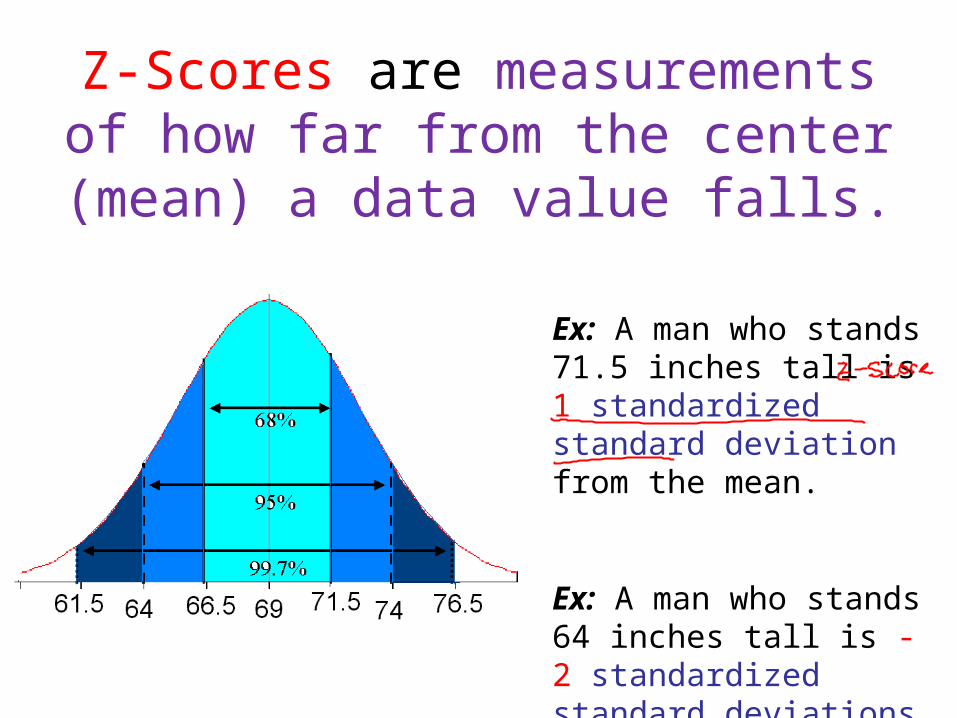
Z-Scores are measurements of how far from the center (mean) a
data value falls.
Ex: A man who stands 71.5 inches tall is 1 standardized standard deviation from the mean.
Ex: A man who stands 64 inches tall is -2 standardized standard deviations from the mean.
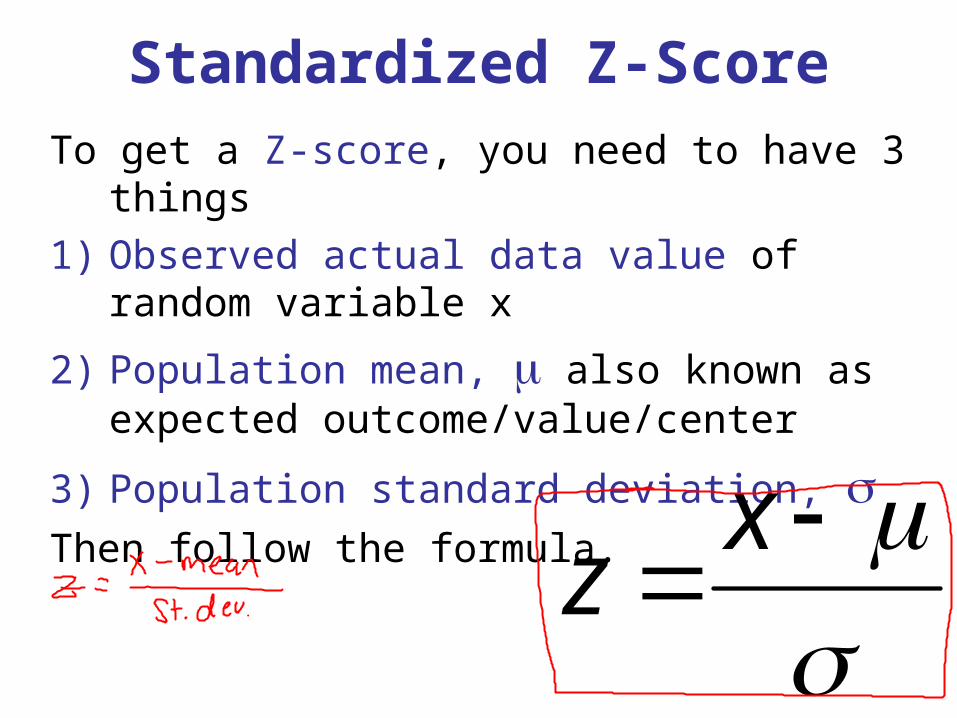
Standardized Z-Score
To get a Z-score, you need to have 3 things
1) Observed actual data value of random variable x
2) Population mean, also known as expected outcome/value/center
3) Population standard deviation, Then follow the formula.
x
z
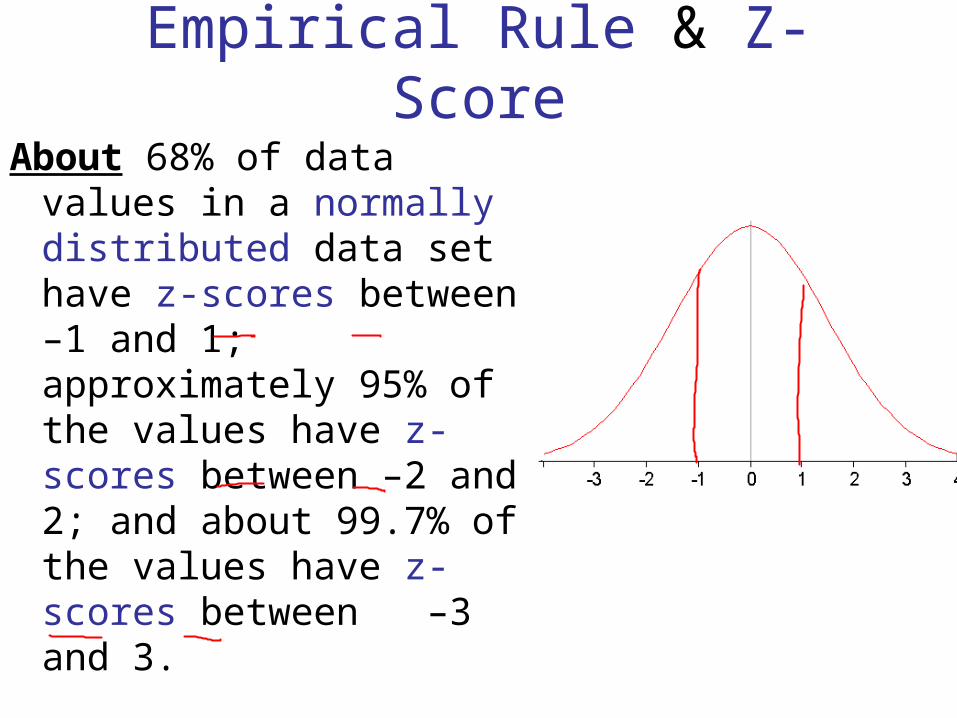
Empirical Rule & Z-Score
About 68% of data values in a normally distributed data set have z-scores between –1 and 1; approximately 95% of the values have z-scores between –2 and 2; and about 99.7% of the values have z-scores between –3 and 3.
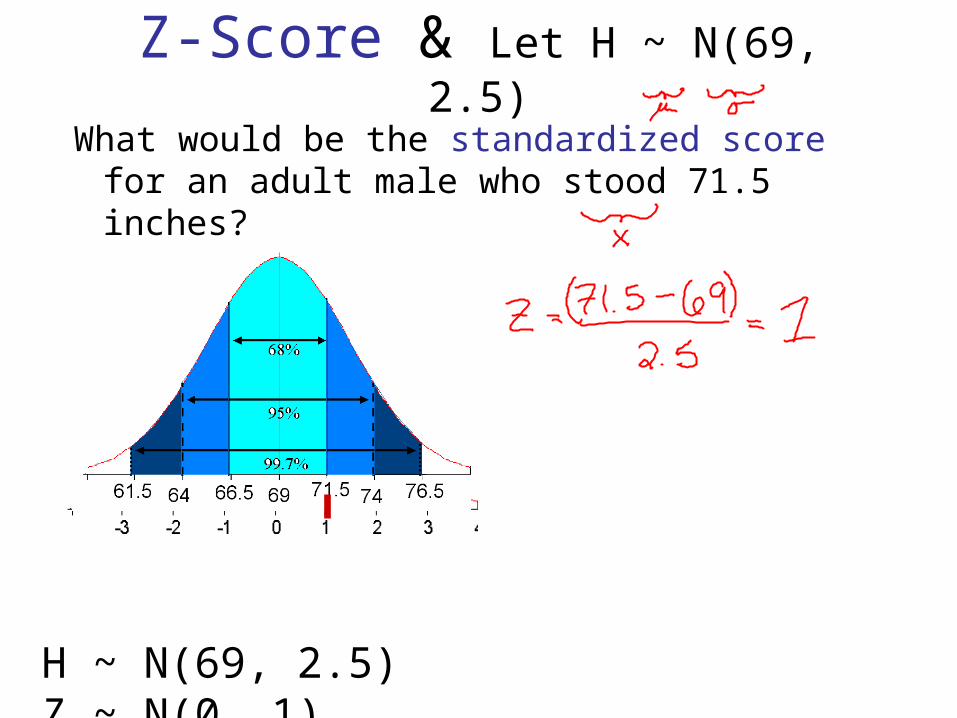
Z-Score & Let H ~ N(69, 2.5)
What would be the standardized score for an adult male who stood 71.5 inches?
H ~ N(69, 2.5) Z ~ N(0, 1)
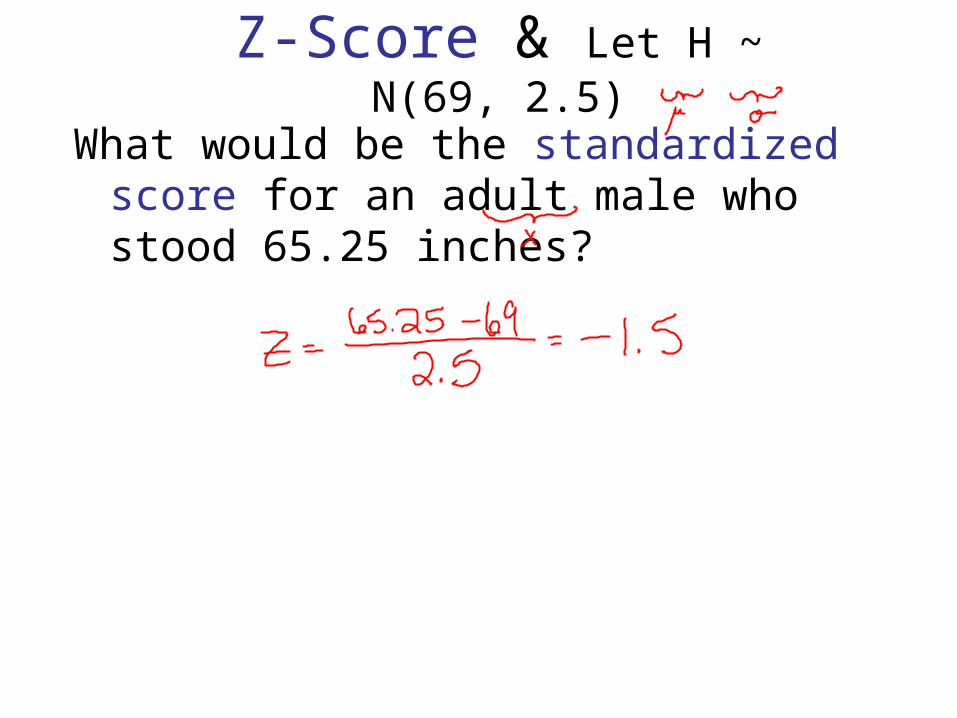
Z-Score & Let H ~ N(69, 2.5)
What would be the standardized score for an adult male who stood 65.25 inches?
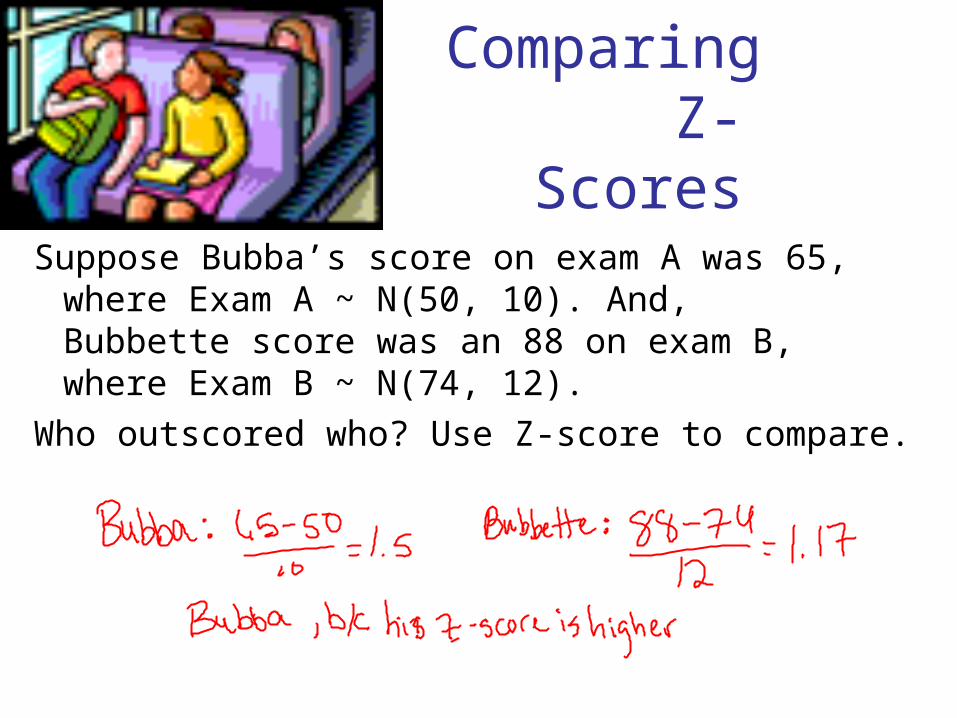
Comparing Z-Scores
Suppose Bubba’s score on exam A was 65, where Exam A ~ N(50, 10). And, Bubbette score was an 88 on exam B, where Exam B ~ N(74, 12).
Who outscored who? Use Z-score to compare.
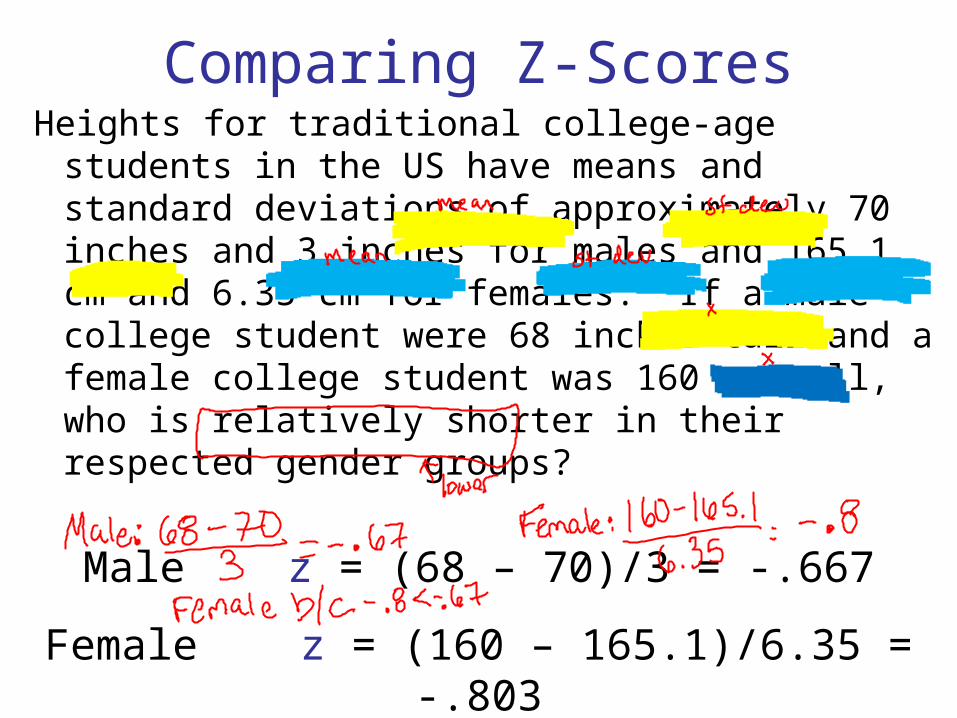
Comparing Z-ScoresHeights for traditional college-age students in the
US have means and standard deviations of approximately 70 inches and 3 inches for males and 165.1 cm and 6.35 cm for females. If a male college student were 68 inches tall and a female college student was 160 cm tall, who is relatively shorter in their respected gender groups?
Male z = (68 – 70)/3 = -.667
Female z = (160 – 165.1)/6.35 = -.803

What if I want to know the PROBABILITY of a certain
z-score?
Use the calculator! Normcdf!!!
2nd Vars
2: normcdf(
normcdf(lower, upper, mean(0), std. dev(1))
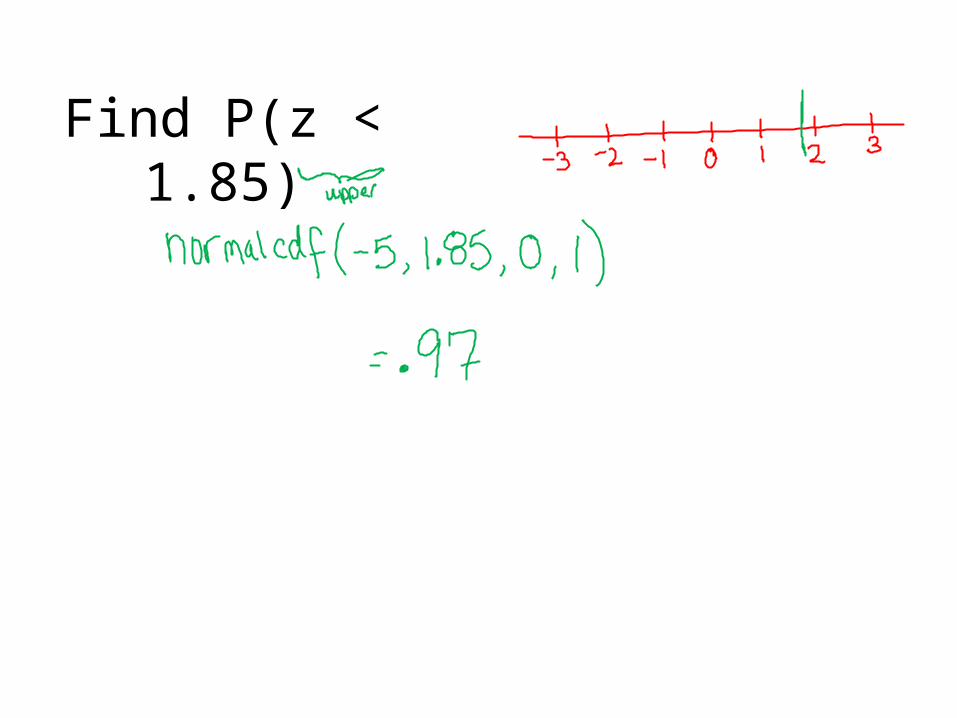
Find P(z < 1.85)
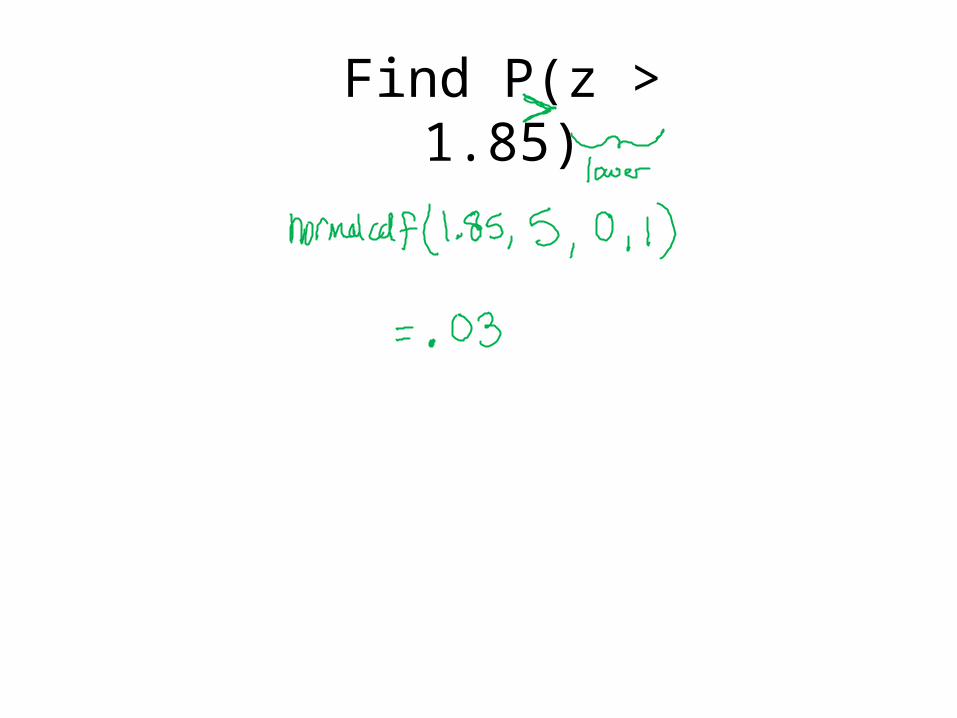
Find P(z > 1.85)
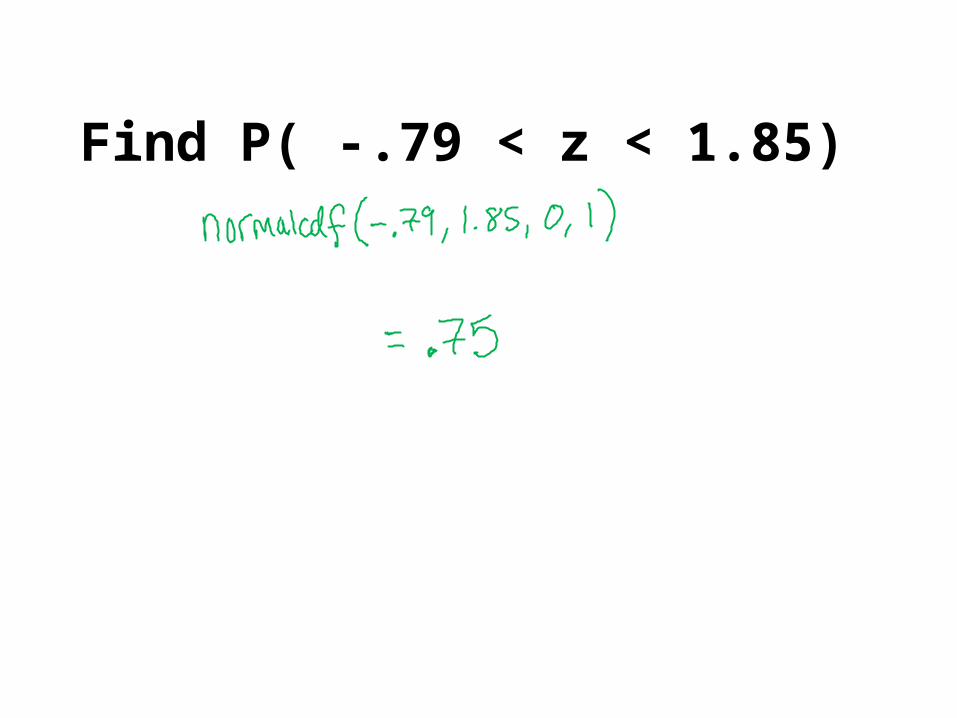
Find P( -.79 < z < 1.85)
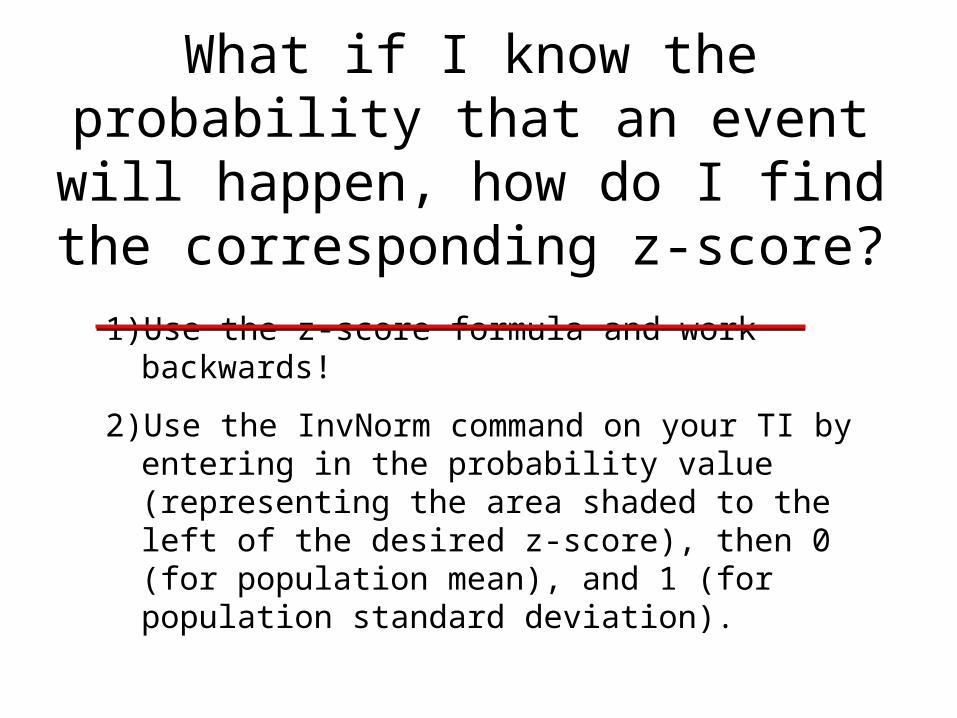
What if I know the probability that an event will happen, how do I find
the corresponding z-score?
1) Use the z-score formula and work backwards!
2) Use the InvNorm command on your TI by entering in the probability value (representing the area shaded to the left of the desired z-score), then 0 (for population mean), and 1 (for population standard deviation).
P(Z < z*) = .8289What is the value of z*?

Using TI-84
P(Z < x) = .80What is the value of x?
P(Z < z*) = .77What is the value of z*?
Related Documents