Math 093 and Math 117A – Linear Functions Your Name: __________________ Reading Ahead –this page must be completed before the first class of the semester • Go to my website: http://faculty.montgomerycollege.edu/maronne/ • Go to your class: o Math 093; then Linear Functions o Math 117A – Algebra and Statistics – Fall 2015 then Algebra page • Read the following power point presentations: o 1-SK-Qualitative graphs o 2-SK-Graphs o 3-SK-Slope of a line and 4-SK-Slope Again Answer the following: Variables 1) From the power point: Qualitative graphs; show an example a) Identify the independent (input) variable b) Identify the dependent (output) variable c) Graph; label axes in context d) Is the graph increasing or decreasing? e) Identify the intercepts on the axes Graphing Lines 2) From the power point: Graphs a) Construct a table of ordered pairs for the line y = 2x + 3; b) Graph. 3) From the power point: Graphs – Read and find intercepts a) Graph using the intercepts: W = -2t +1. a) If t = 0, find W b) If W = 0, find t c) Graph the line. 1

Welcome message from author
This document is posted to help you gain knowledge. Please leave a comment to let me know what you think about it! Share it to your friends and learn new things together.
Transcript

Math 093 and Math 117A – Linear Functions Your Name: __________________
Reading Ahead –this page must be completed before the first class of the semester
• Go to my website: http://faculty.montgomerycollege.edu/maronne/ • Go to your class:
o Math 093; then Linear Functions
o Math 117A – Algebra and Statistics – Fall 2015 then Algebra page
• Read the following power point presentations: o 1-SK-Qualitative graphs o 2-SK-Graphs o 3-SK-Slope of a line and 4-SK-Slope Again
Answer the following: Variables
1) From the power point: Qualitative graphs; show an example a) Identify the independent (input) variable b) Identify the dependent (output) variable c) Graph; label axes in context d) Is the graph increasing or decreasing? e) Identify the intercepts on the axes
Graphing Lines
2) From the power point: Graphs a) Construct a table of ordered pairs for the line y = 2x + 3; b) Graph.
3) From the power point: Graphs – Read and find intercepts a) Graph using the intercepts: W = -2t +1.
a) If t = 0, find W b) If W = 0, find t c) Graph the line.
1

Slope of a Line 4) From the power point: Slope of a line and Slope Again
Show work BELOW the questions a) Write the slope formula b) Find the slope of the line going through points A(-2, 3) and B(4, 6) c) Is the slope positive or negative? What does this tell you about the graph of the line going
through the points A and B? Average Rate of Change
5) From the power point 12-APP-Slope as a rate of change a) Give one of the examples from the power point
a. Write the coordinates of the two points b. Calculate the average rate of change c. Interpret in context.
b) Make up your own story, calculate the average rate of change and write a complete sentence interpreting in context.
Finding the Equation of a Line Through Two Points 6) From the power point 5-SK-Equation of the Line
a) Read the examples and show here how you find the equation of the line going through the two points (-2, 6) and (3, -4). (This is one of the examples in the power point)
2

Math 093 and Math 117A – Linear Functions: Modeling and Applications From a given Linear Model
7) Hot Air Balloon
A person lowers his hot-air balloon by gradually releasing air from it. Let t be the number of minutes that he has been releasing air from the balloon, and let h be the height of the balloon (in feet). Assume that the relationship between t and h is described by the equation h = −200𝑡𝑡 + 800.
a) Identify the quantity and units represented by the independent variable. b) Identify the quantity and units represented by the dependent variable. c) Complete the table of values and sketch the graph by plotting the ordered pairs. d) Find the h-intercept (ordered pair). Include units. e) Write the meaning of the h-intercept in a complete sentence using correct units. f) Find the t-intercept (ordered pair). Include units. g) Write the meaning of the t-intercept in a complete sentence using correct units. h) What is the slope of the model? Include units. i) Write the meaning of the slope in a complete sentence using correct units.
t h 0 1 2 3 4 5
3
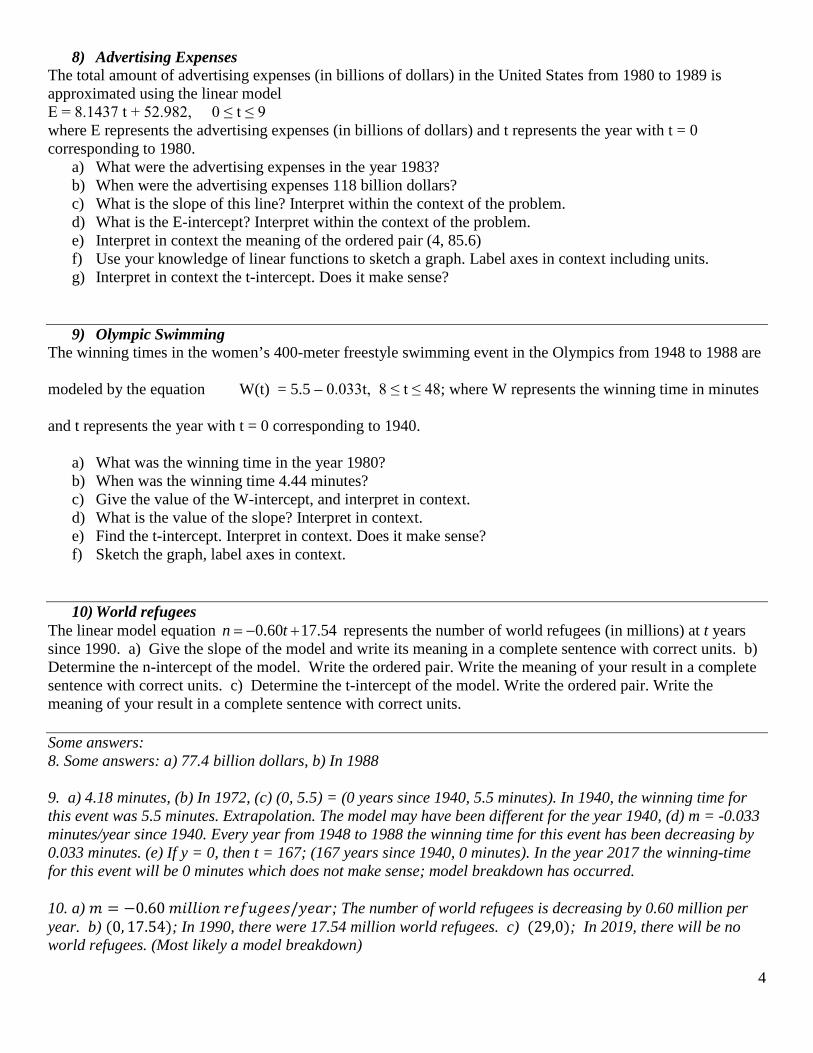
8) Advertising Expenses The total amount of advertising expenses (in billions of dollars) in the United States from 1980 to 1989 is approximated using the linear model E = 8.1437 t + 52.982, 0 ≤ t ≤ 9 where E represents the advertising expenses (in billions of dollars) and t represents the year with t = 0 corresponding to 1980.
a) What were the advertising expenses in the year 1983? b) When were the advertising expenses 118 billion dollars? c) What is the slope of this line? Interpret within the context of the problem. d) What is the E-intercept? Interpret within the context of the problem. e) Interpret in context the meaning of the ordered pair (4, 85.6) f) Use your knowledge of linear functions to sketch a graph. Label axes in context including units. g) Interpret in context the t-intercept. Does it make sense?
9) Olympic Swimming The winning times in the women’s 400-meter freestyle swimming event in the Olympics from 1948 to 1988 are
modeled by the equation W(t) = 5.5 – 0.033t, 8 ≤ t ≤ 48; where W represents the winning time in minutes
and t represents the year with t = 0 corresponding to 1940.
a) What was the winning time in the year 1980? b) When was the winning time 4.44 minutes? c) Give the value of the W-intercept, and interpret in context. d) What is the value of the slope? Interpret in context. e) Find the t-intercept. Interpret in context. Does it make sense? f) Sketch the graph, label axes in context.
10) World refugees The linear model equation 0.60 17.54n t= − + represents the number of world refugees (in millions) at t years since 1990. a) Give the slope of the model and write its meaning in a complete sentence with correct units. b) Determine the n-intercept of the model. Write the ordered pair. Write the meaning of your result in a complete sentence with correct units. c) Determine the t-intercept of the model. Write the ordered pair. Write the meaning of your result in a complete sentence with correct units. Some answers: 8. Some answers: a) 77.4 billion dollars, b) In 1988 9. a) 4.18 minutes, (b) In 1972, (c) (0, 5.5) = (0 years since 1940, 5.5 minutes). In 1940, the winning time for this event was 5.5 minutes. Extrapolation. The model may have been different for the year 1940, (d) m = -0.033 minutes/year since 1940. Every year from 1948 to 1988 the winning time for this event has been decreasing by 0.033 minutes. (e) If y = 0, then t = 167; (167 years since 1940, 0 minutes). In the year 2017 the winning-time for this event will be 0 minutes which does not make sense; model breakdown has occurred. 10. a) 𝑚𝑚 = −0.60 𝑚𝑚𝑚𝑚𝑚𝑚𝑚𝑚𝑚𝑚𝑚𝑚𝑚𝑚 𝑟𝑟𝑟𝑟𝑟𝑟𝑟𝑟𝑟𝑟𝑟𝑟𝑟𝑟𝑟𝑟/𝑦𝑦𝑟𝑟𝑦𝑦𝑟𝑟; The number of world refugees is decreasing by 0.60 million per year. b) (0, 17.54); In 1990, there were 17.54 million world refugees. c) (29,0); In 2019, there will be no world refugees. (Most likely a model breakdown)
4

Math 093 and Math 117A – Slope as a Rate of Change
11) The line graph represents the amount of water (in gallons) in a swimming pool after x hours. There is a pump that can either add or remove water from the pool.
a) Label axes in context; include units. b) Find the slope of the line segment from (0, 60) to (2, 443); round to the nearest tenth. c) In the context of the problem, interpret this slope as a rate of change. During the first two hours, the amount of water in the pool increase / decrease (circle one) at a rate of ........................ .............................. per ................................... d) Find the slope of the line segment from (5, 443) to (7, 0); round to the nearest tenth. e) In the context of the problem, interpret the slope as a rate of change over the time interval 5 to 7 hours: f) In the context of the problem, describe the action of the pump during the time interval 2 to 5 hours. Common format used when interpreting the slope: The ............(description of the variable y)............ is .......(increasing / decreasing) ......... at a rate of ………………(units of y per units of x).
5
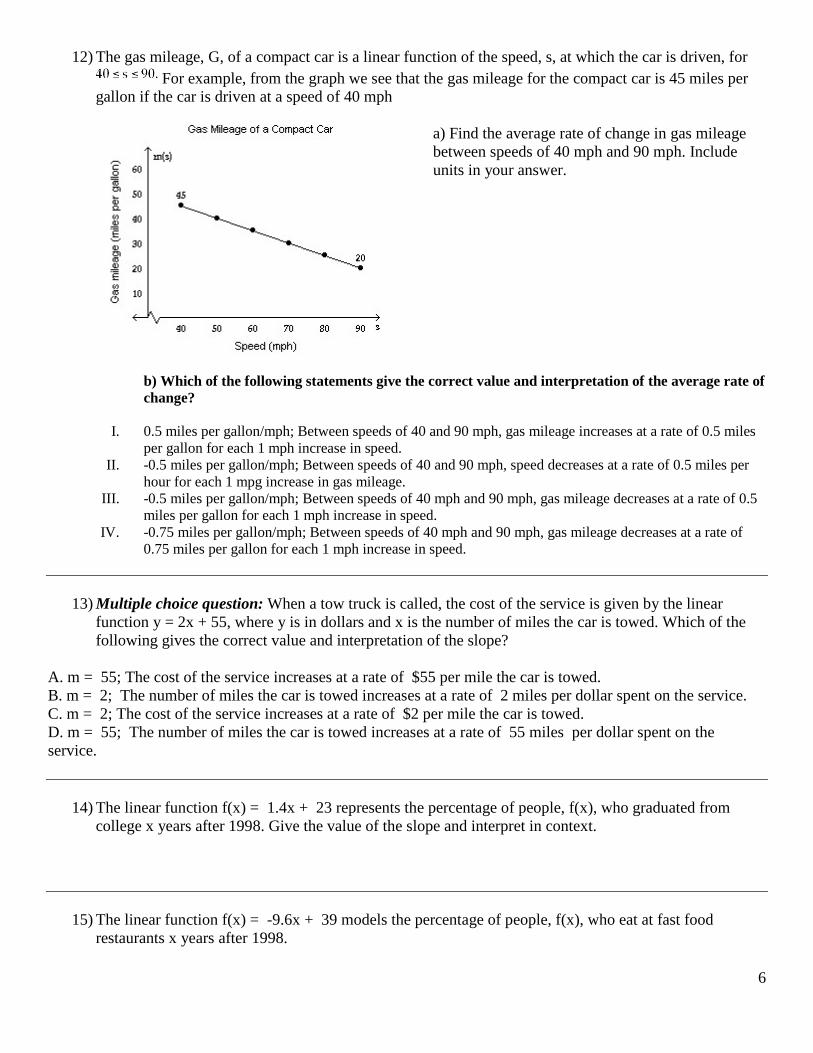
12) The gas mileage, G, of a compact car is a linear function of the speed, s, at which the car is driven, for For example, from the graph we see that the gas mileage for the compact car is 45 miles per
gallon if the car is driven at a speed of 40 mph
a) Find the average rate of change in gas mileage between speeds of 40 mph and 90 mph. Include units in your answer.
b) Which of the following statements give the correct value and interpretation of the average rate of change?
I. 0.5 miles per gallon/mph; Between speeds of 40 and 90 mph, gas mileage increases at a rate of 0.5 miles
per gallon for each 1 mph increase in speed. II. -0.5 miles per gallon/mph; Between speeds of 40 and 90 mph, speed decreases at a rate of 0.5 miles per
hour for each 1 mpg increase in gas mileage. III. -0.5 miles per gallon/mph; Between speeds of 40 mph and 90 mph, gas mileage decreases at a rate of 0.5
miles per gallon for each 1 mph increase in speed. IV. -0.75 miles per gallon/mph; Between speeds of 40 mph and 90 mph, gas mileage decreases at a rate of
0.75 miles per gallon for each 1 mph increase in speed.
13) Multiple choice question: When a tow truck is called, the cost of the service is given by the linear function y = 2x + 55, where y is in dollars and x is the number of miles the car is towed. Which of the following gives the correct value and interpretation of the slope?
A. m = 55; The cost of the service increases at a rate of $55 per mile the car is towed. B. m = 2; The number of miles the car is towed increases at a rate of 2 miles per dollar spent on the service. C. m = 2; The cost of the service increases at a rate of $2 per mile the car is towed. D. m = 55; The number of miles the car is towed increases at a rate of 55 miles per dollar spent on the service.
14) The linear function f(x) = 1.4x + 23 represents the percentage of people, f(x), who graduated from college x years after 1998. Give the value of the slope and interpret in context.
15) The linear function f(x) = -9.6x + 39 models the percentage of people, f(x), who eat at fast food
restaurants x years after 1998.
6
Math 093 and Math 117A - Finding the equation of a line going through two points
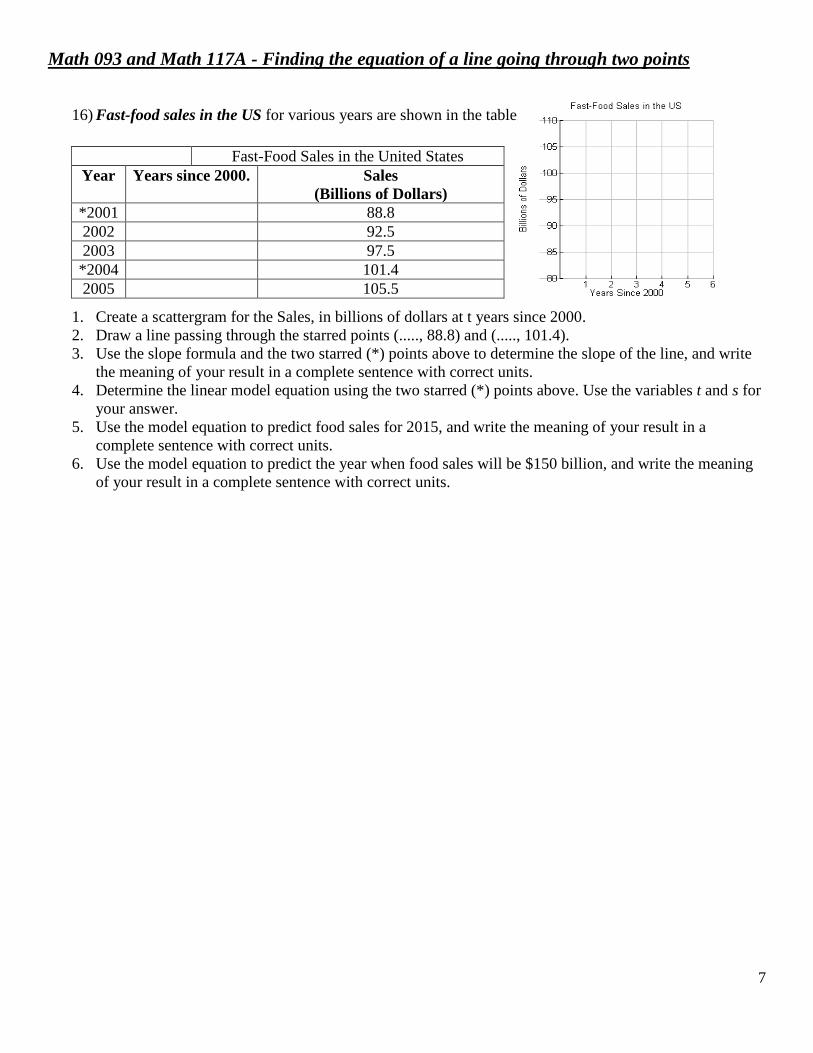
16) Fast-food sales in the US for various years are shown in the table.
1. Create a scattergram for the Sales, in billions of dollars at t years since 2000. 2. Draw a line passing through the starred points (....., 88.8) and (....., 101.4). 3. Use the slope formula and the two starred (*) points above to determine the slope of the line, and write
the meaning of your result in a complete sentence with correct units. 4. Determine the linear model equation using the two starred (*) points above. Use the variables t and s for
your answer. 5. Use the model equation to predict food sales for 2015, and write the meaning of your result in a
complete sentence with correct units. 6. Use the model equation to predict the year when food sales will be $150 billion, and write the meaning
of your result in a complete sentence with correct units.
Fast-Food Sales in the United States Year Years since 2000. Sales
(Billions of Dollars) *2001 88.8 2002 92.5 2003 97.5 *2004 101.4 2005 105.5
7

17) The death rate from heart disease in the US for various years is shown in the table. Let r be the death rate (number of deaths per 100,000) from heart disease for the year that is t years since 1960.
a) Create a scattergram of the data on the given axes. Draw a line that comes close to the points in your
scattergram. Make sure your line touches both axes.
b) What is the independent variable? What quantity does this variable represent?
c) What is the dependent variable? What quantity does this variable represent?
d) What does the ordered pair (0, 559) mean? Write the meaning in a complete sentence using correct
units.
e) What does the ordered pair (40, 258) mean? Write the meaning in a complete sentence using correct
units.
f) Use algebra and the ordered pairs (10, 493) and (40, 258) to find the equation of the linear model.
Write the answer using function notation with the variables R and t.
g) Write the meaning of slope in a complete sentence using correct units.
h) What is the R-intercept of your model equation; write as an ordered pair. Interpret in context with
correct units.
i) Use your model to calculate the t-intercept of the model (ordered pair please). Write the meaning of
the t-intercept in a complete sentence using correct units.
j) Find R(25). Write the meaning of your result in a complete sentence using correct units.
k) Solve R(t) = 200. Write the meaning of your result in a complete sentence using correct units.
US Death Rates Due to Heart Disease t Years
Since 1960 Death Rate
(Number of Deaths per 100,000)
0 559 10 493 20 412 30 322 40 258
8
18) Air Temperature and Altitude The relationship between the air temperature T (in ºF) and the altitude h (in feet above sea level) is approximately linear for 0 ≤ h ≤ 20,000. If the temperature at sea level is 60º, an increase of 5000 feet in altitude lowers the air temperature about 18º.
a) Write the linear function that models the situation. Use T and h for your variables. b) Approximate the air temperature at an altitude of 15,000 feet. c) Approximate the altitude at which the temperature is 0º. d) Sketch the graph, label in context.
19) Nutrition. There are approximately 126 calories in a 2-ounce serving of lean hamburger and approximately 189 calories in a 3-ounce serving.
a) Write a linear equation for the number of calories in lean hamburger in terms of the size of the serving. b) Use your equation to estimate the number of calories in a 5-ounce serving of lean hamburger. c) Interpret in context the ordered pair (10, 630) d) Sketch the graph and label in context
20) Loan repayment A college student receives an interest-free loan of $8250 from a relative. The student will repay $125 per month until the loan is paid off.
a) Express the amount L (in dollars) remaining to be paid in terms of time t (in months). b) After how many months will the student owe $5000? c) Find the t-intercept and interpret in context. d) Sketch a graph and label in context.
21) Flying Lessons Flying lessons cost $645 for an 8 hour course and $1425 for a 20 hour course. Both prices include a fixed insurance fee.
a) Express the cost, C, of flying lessons in terms of the length, h, of the course. b) What is the fixed insurance fee? c) Find C(9). Interpret in context. d) Solve C(h) = 1100. Interpret in context. e) Sketch a graph and label in context.
Some answers 18. a) T = (-9/2500) h + 60, b) T = 6 ºF, c) h = 16,667 ft. 19. a) y = 63 x, (b) 315 cal. (c) A ten-ounce hamburger has 630 calories. 20. a) P = -125t +8250, b) 26 months, c) (66 months, 0 dollars), after 66 months the loan will be paid off. 21. (a) C = 65 h + 125; (b) the y intercept is 125; (0,$125). The fixed insurance fee is $125.
9
Math 093 and Math 117A – Linear Models from data Linear Regression
Instructions on the next page
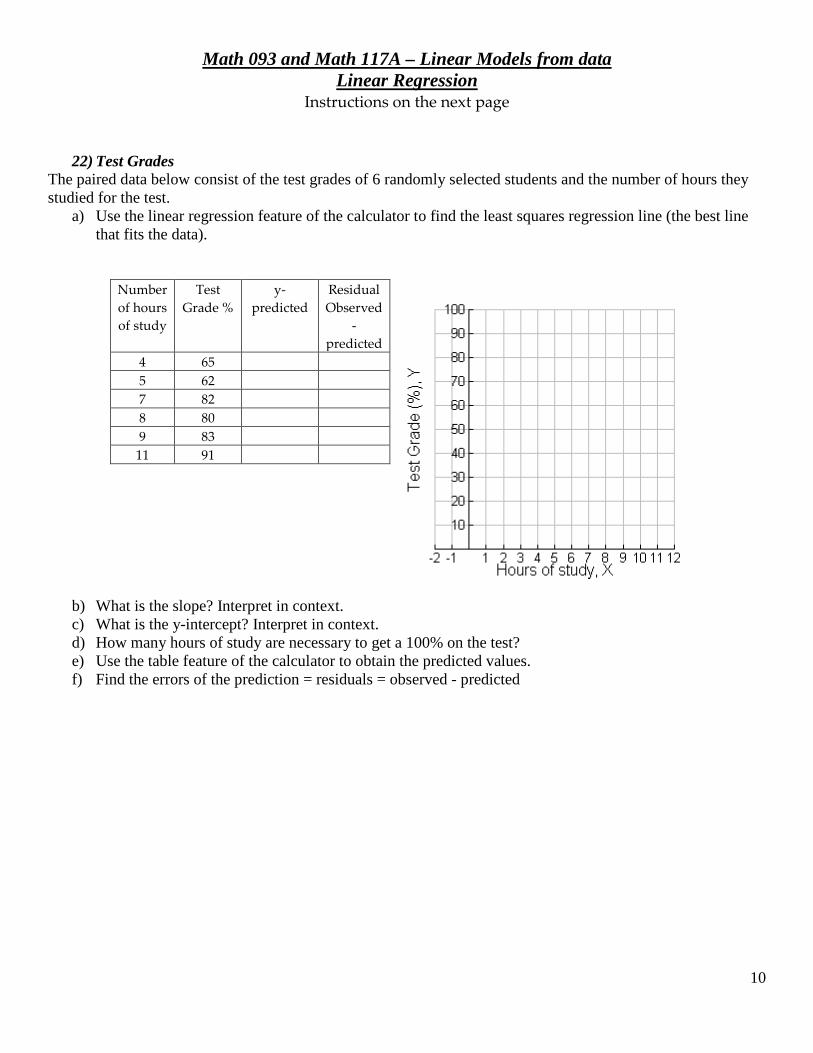
22) Test Grades
The paired data below consist of the test grades of 6 randomly selected students and the number of hours they studied for the test.
a) Use the linear regression feature of the calculator to find the least squares regression line (the best line that fits the data).
Number of hours of study
Test Grade %
y-predicted
Residual Observed
- predicted
4 65 5 62 7 82 8 80 9 83
11 91
b) What is the slope? Interpret in context. c) What is the y-intercept? Interpret in context. d) How many hours of study are necessary to get a 100% on the test? e) Use the table feature of the calculator to obtain the predicted values. f) Find the errors of the prediction = residuals = observed - predicted
10
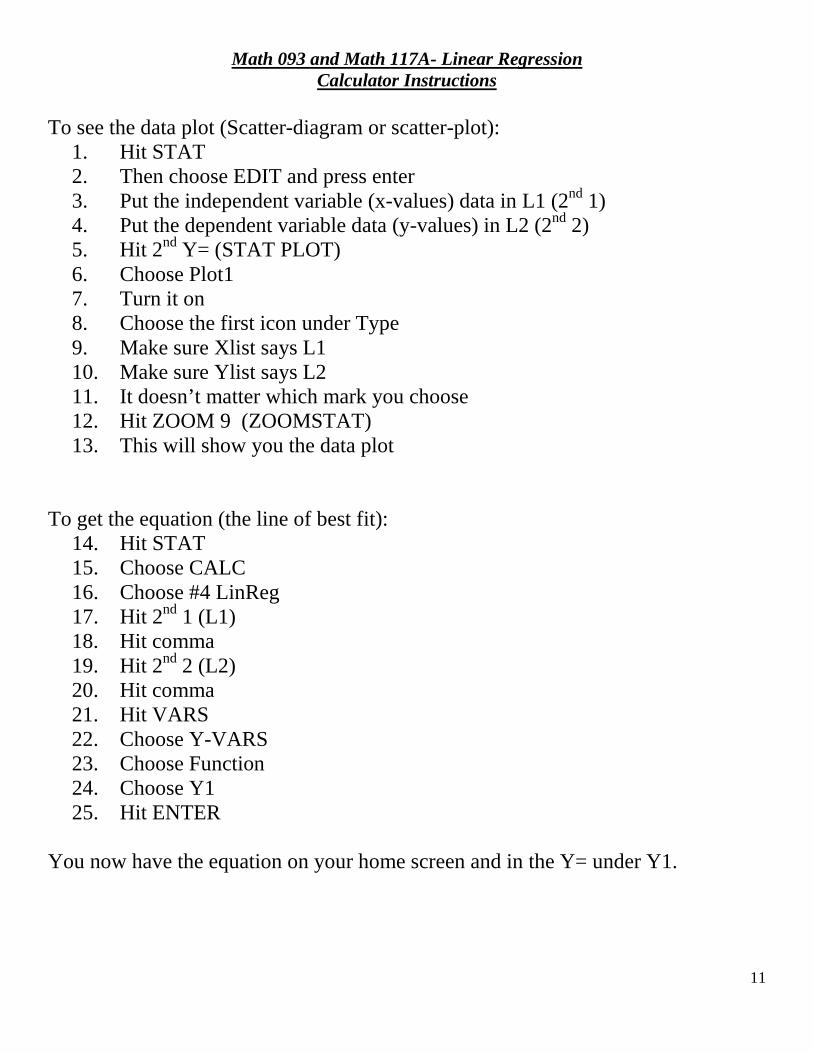
Math 093 and Math 117A- Linear Regression Calculator Instructions
To see the data plot (Scatter-diagram or scatter-plot):
1. Hit STAT 2. Then choose EDIT and press enter 3. Put the independent variable (x-values) data in L1 (2nd 1) 4. Put the dependent variable data (y-values) in L2 (2nd 2) 5. Hit 2nd Y= (STAT PLOT) 6. Choose Plot1 7. Turn it on 8. Choose the first icon under Type 9. Make sure Xlist says L1 10. Make sure Ylist says L2 11. It doesn’t matter which mark you choose 12. Hit ZOOM 9 (ZOOMSTAT) 13. This will show you the data plot
To get the equation (the line of best fit):
14. Hit STAT 15. Choose CALC 16. Choose #4 LinReg 17. Hit 2nd 1 (L1) 18. Hit comma 19. Hit 2nd 2 (L2) 20. Hit comma 21. Hit VARS 22. Choose Y-VARS 23. Choose Function 24. Choose Y1 25. Hit ENTER
You now have the equation on your home screen and in the Y= under Y1.
11
Linear Functions – Linear Regression
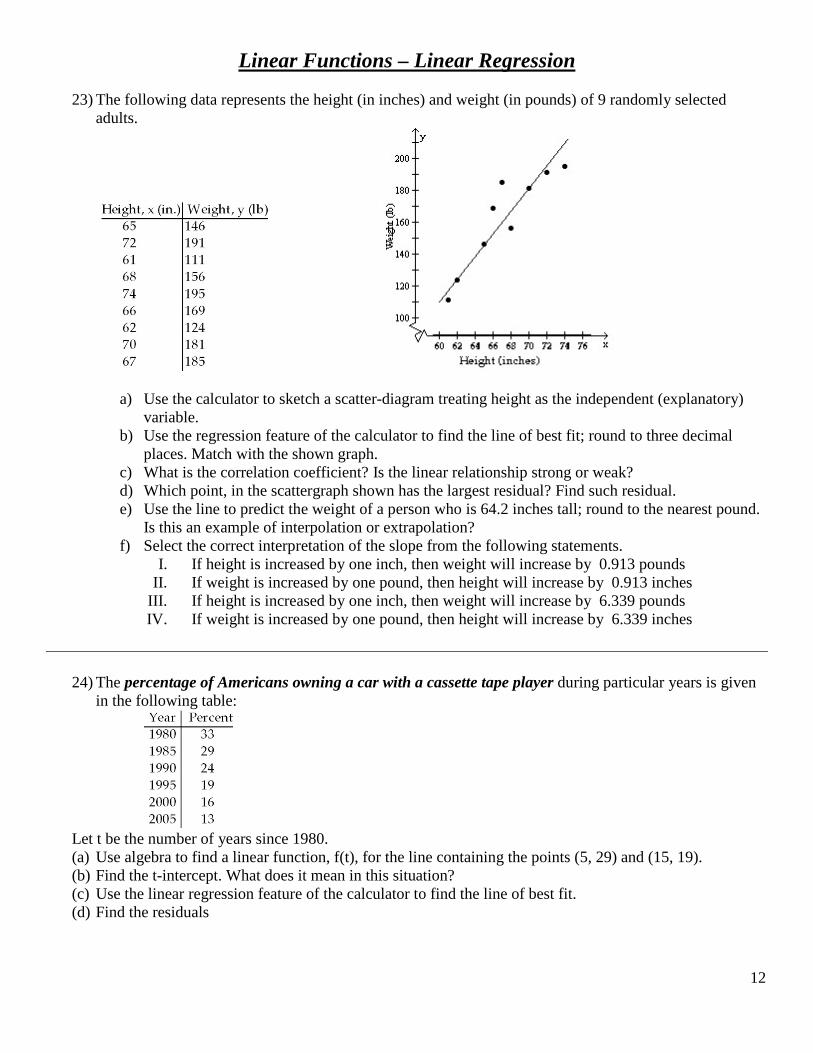
23) The following data represents the height (in inches) and weight (in pounds) of 9 randomly selected adults.
a) Use the calculator to sketch a scatter-diagram treating height as the independent (explanatory) variable.
b) Use the regression feature of the calculator to find the line of best fit; round to three decimal places. Match with the shown graph.
c) What is the correlation coefficient? Is the linear relationship strong or weak? d) Which point, in the scattergraph shown has the largest residual? Find such residual. e) Use the line to predict the weight of a person who is 64.2 inches tall; round to the nearest pound.
Is this an example of interpolation or extrapolation? f) Select the correct interpretation of the slope from the following statements.
I. If height is increased by one inch, then weight will increase by 0.913 pounds II. If weight is increased by one pound, then height will increase by 0.913 inches
III. If height is increased by one inch, then weight will increase by 6.339 pounds IV. If weight is increased by one pound, then height will increase by 6.339 inches
24) The percentage of Americans owning a car with a cassette tape player during particular years is given in the following table:
Let t be the number of years since 1980. (a) Use algebra to find a linear function, f(t), for the line containing the points (5, 29) and (15, 19). (b) Find the t-intercept. What does it mean in this situation? (c) Use the linear regression feature of the calculator to find the line of best fit. (d) Find the residuals
12

25) Percentages of Americans Who Are Baseball Fans
a) Use the linear regression feature of your calculator to find an equation for the percent of Americans who
are baseball fans P at t years since 1990. Label variables in context, include units.
b) What is the slope? What does it mean in context?
26) Visitors to the Grand Canyon
a) Use the linear regression feature of your calculator to find an equation for the number of visitors to the Grand Canyon at t years since 1960. Use V and t for your variables. Label variables in context, include units.
b) Use the model to predict the number of visitors in 2012. Is this an example of interpolation or extrapolation?
13
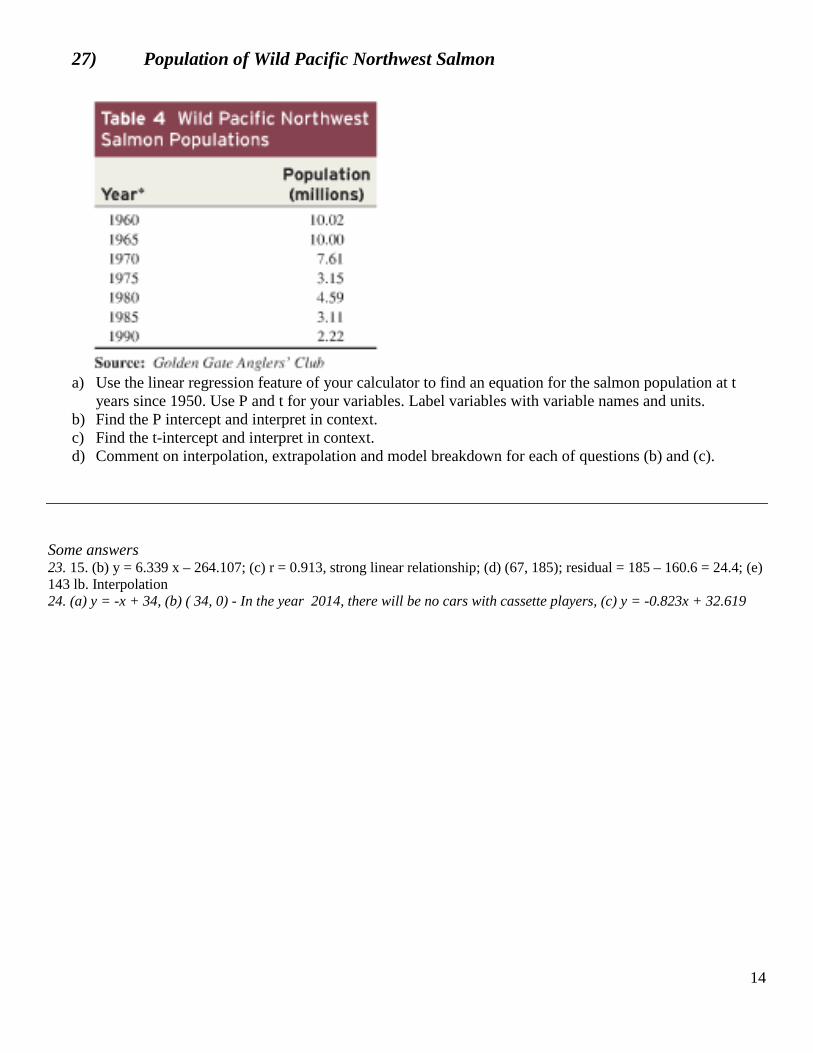
27) Population of Wild Pacific Northwest Salmon
a) Use the linear regression feature of your calculator to find an equation for the salmon population at t
years since 1950. Use P and t for your variables. Label variables with variable names and units. b) Find the P intercept and interpret in context. c) Find the t-intercept and interpret in context. d) Comment on interpolation, extrapolation and model breakdown for each of questions (b) and (c).
Some answers 23. 15. (b) y = 6.339 x – 264.107; (c) r = 0.913, strong linear relationship; (d) (67, 185); residual = 185 – 160.6 = 24.4; (e) 143 lb. Interpolation 24. (a) y = -x + 34, (b) ( 34, 0) - In the year 2014, there will be no cars with cassette players, (c) y = -0.823x + 32.619
14
Related Documents