Emma Louise Slack A thesis submitted for the degree of Doctor of Philosophy Faculty of Medical Sciences, Newcastle University February 2019 MATERNAL ETHNIC GROUP AND PREGNANCY ANTHROPOMETRICS IN THE DEVELOPMENT OF MATERNAL AND INFANT HEALTH OUTCOMES

Welcome message from author
This document is posted to help you gain knowledge. Please leave a comment to let me know what you think about it! Share it to your friends and learn new things together.
Transcript
Emma Louise Slack
A thesis submitted for the degree of Doctor of Philosophy Faculty of Medical Sciences, Newcastle University
February 2019
MATERNAL ETHNIC GROUP AND PREGNANCY ANTHROPOMETRICS
IN THE DEVELOPMENT OF MATERNAL AND INFANT HEALTH
OUTCOMES

I
II
Abstract
Aim: To investigate associations between pregnancy outcomes, South Asian
ethnicity and pre-/early-pregnancy maternal anthropometrics (MA) and gestational
anthropometric change (GAC).
Methods: A mixed methods approach was used to develop an evidence-based
conceptual model of associations between outcomes and MA/GAC, involving: a
systematic review, a framework-based synthesis and expert opinion. The conceptual
model was tested using the Born in Bradford cohort data for Pakistani and White
women. Regression models were used to investigate associations, adjusting for
socio-demographic, behavioural and clinical factors.
Results: The evidence-based conceptual model hypothesised that gestational
diabetes (GDM), hypertensive disorders of pregnancy (HDP), mode of delivery,
maternal mortality, birth weight, gestational age at delivery, stillbirth, perinatal
mortality, post-partum IGT, PPWR, breastfeeding, infant anthropometrics and
maternal and child blood pressure in the longer term were associated with MA and
GAC.
Pakistani women had significantly increased odds of GDM (Adjusted odds ratio
(AOR) 1.08 (95%CI 1.06-1.11), HDP (AOR 1.11 (95%CI 1.08-1.15), Cesarean-
section (AOR 1.05 (95%CI 1.01-1.08)), and induction (AOR 1.07 (95%CI 1.05-1.09)),
and increased birth weight (adjusted coefficients; 13.77g (95%CI 9.24-18.30)
associated with increasing BMI. With increasing GWG, birth weight increased for
Pakistani women (adjusted coefficients; 22.92g (95%CI 18.07-27.78)). Significant
interactions were identified for BMI and ethnicity on GDM (p=0.045), pre-term birth
(p=0.049) following adjustment. There were no significant interactions between GWG
and ethnicity on other pregnancy outcomes following adjustment. This was also true
when using Asian-specific BMI criteria to calculate GWG.
Conclusion: There were ethnic differences in the shape of the association between
BMI and GDM, and pre-term birth, following adjustment. In this cohort, there was no
evidence of an ethnic difference in the association between any pregnancy outcome
investigated and GWG following adjustment. More research is needed to investigate
additional measures of GAC, and using other datasets looking at all South Asian
subgroups.

III
IV
Acknowledgements
This PhD has been a wonderful experience, but also the most challenging time of my
life. During the PhD, I was diagnosed with chronic fatigue syndrome/Myalgiac
Encephalomyelitis. Doing a PhD is hard enough, but learning to live with, and
manage a chronic condition at the same time has been harder than I could have ever
imagined. Without the love, help and support of my family, friends and colleagues I
would not be where I am today- words are not enough to express my gratitude to you
all.
Firstly, I would like to express my eternal gratitude to my supervisory team all of
whom provided me with support and guidance throughout. I would particularly like to
thank Dr Nicola Heslehurst and Prof Judith Rankin for always finding time to listen
and advise, for challenging and supporting me, and for pushing me to get to where I
am today; and Prof Steve Rushton for his expert guidance, both on statistical and
theoretical matters, and on the importance of looking after myself. I would also like to
thank my assessors Dr Ruth Bell and Prof Mark Pearce who have provided expert
feedback, support and guidance. I would also like to express my gratitude to Dr Kate
Best for always taking the time to explain and debate statistical issues with me.
I would like to thank my Mum; Dr Linda Turnbull, who has been my rock throughout,
always supporting, inspiring and motivating me to continue. I would also like to thank
my Husband, Alex, for his unconditional love, support and friendship, and for always
making sure I remember to rest. I would like to thank my late father in law Anthony
Redpath, who we miss dearly, and without whom I would not have been in a financial
position to complete my studies. In addition, I would like to thank my Mother-in-law,
Patricia Sutherland, my Dad, Bryan Slack and all of my friends, but in particular,
Laura Watkins, Kate Best, Becca Watson, Emily Harkleroad, Kate Cullen, and Vishal
Sharma who have always provided a listening ear.
I would like to thank the BiB research team, in particular those who gave up their time
to attend the meeting to provide expert opinion on my conceptual model. I would also
like to thank all the families who took part in the BiB project, without whom this
research would not have been possible. Finally, I would like to thank the MRC and
the Faculty of Medical Sciences for funding this studentship.
V
Publications from this studentship
Articles
Slack E, Rankin J, Jones D, Heslehurst N. Effects of maternal anthropometrics on
pregnancy outcomes in South Asian women: a systematic review. Obesity
Reviews. 2018;19(4):485-500.
Heslehurst N, Vieira R, Hayes L, Crowe L, Jones D, Robalino S, Slack E and
Rankin J. Maternal body mass index and post-term birth: a systematic review and
meta-analysis. Obesity Reviews. 2016.
Slack E, Rankin J, Best, K, Heslehurst, N. Maternal obesity classes, pre-term and
post-term birth: a retrospective analysis of 479,864 births in England. (Under
review. 2019)
Heslehurst N, Vieira R, Akhter Z, Bailey H, Slack E, Ngongalah L, Pemu A,
Rankin J. The association between maternal body mass index and child obesity:
a systematic review and meta-analysis (Under review. 2019)
Abstracts from conference presentations
Slack E, Rankin J, Rushton S, Heslehurst N. O1.6Gestational weight gain (GWG)
and pregnancy outcomes in Pakistani and White British women: An analysis of
data from the Born in Bradford (BiB) cohort in Abstracts from the 5th UK
Congress on Obesity 2018: Oral Presentation Abstracts. International Journal of
Obesity Supplements. 2018;8(1):6-13.
Slack E, Best K, Rankin J, Heslehurst N. The impact of extreme maternal obesity
on gestational age at delivery; a national study of births in England. Journal of
Epidemiology & Community Health. 2016;70 Supplement 1:A29.2-A30.
Slack E, Best K, Rankin J, Heslehurst N. Extreme obesity in pregnancy and the
association with pre-term and postdate birth: A national study of births in England,
UK. Obesity Facts. 2015;8:191.
Slack E, Heslehurst N, Best K, Rankin J. Association between maternal extreme
obesity and pre- and post-term birth: a national study: PP.30 [Abstract]. BJOG: An
International Journal of Obstetrics & Gynaecology. 2015;122 Supplement(2):111.

VI
Book Chapter
Slack E, Brandon H, Heslehurst N. Obesity and Pregnancy. In: Weaver J, editor.
Practical Guide to Obesity Medicine. USA: Elsevier; 2018. p. 143-53.
VII
Contents
Contents ................................................................................................................... VII
List of Tables ........................................................................................................... XIII
List of Figures ......................................................................................................... XVII
Abbreviations ............................................................................................................... 1
Chapter 1. Background ............................................................................................... 3
1.1 Obesity ........................................................................................................... 3
Defining obesity in adults ......................................................................... 3
Defining obesity in children ...................................................................... 5
Prevalence of, and risks associated with, obesity in the general
population ............................................................................................................. 6
Economic impact of obesity ..................................................................... 7
Obesity related health inequalities ........................................................... 8
Determinants of obesity ......................................................................... 10
1.2 Maternal obesity ........................................................................................... 14
Defining maternal obesity ...................................................................... 14
Maternal obesity prevalence .................................................................. 16
Risks associated with maternal obesity ................................................. 17
1.3 Gestational weight gain ................................................................................ 19
Defining gestational weight gain ............................................................ 19
Determinants of gestational weight gain ................................................ 20
Prevalence of excessive gestational weight gain ................................... 20
Risks associated with gestational weight gain ....................................... 21
Gestational weight gain guidelines ........................................................ 22
1.4 The combined effect of maternal body mass index and gestational weight
gain ………………………………………………………………………………………24
1.5 Potential mechanisms linking maternal obesity and gestational weight gain to
adverse pregnancy outcomes ................................................................................ 25
VIII
1.6 Effect of interventions on maternal obesity and gestational weight gain ...... 26
1.7 Ethnic groups, maternal obesity and gestational weight gain ...................... 27
Ethnicity and socioeconomic status ...................................................... 30
Suitability of guidelines for ethnic minority groups in the UK ................. 30
1.8 Rationale ..................................................................................................... 32
1.9 Aim .............................................................................................................. 34
1.10 Objectives ................................................................................................. 34
Chapter 2. Methodology ............................................................................................ 36
2.1 Structural equation modelling ...................................................................... 36
2.2 Mixed methods ............................................................................................ 39
Phase 1: Systematic review ............................................................................... 41
Phase 2: Mixed research synthesis .................................................................... 41
Phase 3: Validation study ................................................................................... 42
Phase 4: Secondary data analysis of prospective cohort ................................... 42
Chapter 3. Systematic review of the effects of maternal pre-/early pregnancy
anthropometrics and anthropometric change during pregnancy on short- and long-
term pregnancy outcomes in South Asian women (Phase 1) ................................... 44
3.1 Introduction .................................................................................................. 44
3.2 Aim .............................................................................................................. 45
3.3 Objectives .................................................................................................... 46
3.4 Methods ....................................................................................................... 46
Inclusion and exclusion criteria ............................................................. 46
Definitions of included ethnic groups ..................................................... 47
Searches ............................................................................................... 48
Data extraction and quality assessment ................................................ 50
Data synthesis ....................................................................................... 52
3.5 Results ......................................................................................................... 53
Quality of included studies .................................................................... 61
IX
Maternal pre-/early pregnancy anthropometry and pregnancy
outcomes…………………………………………………………………………….…62
Antenatal outcomes associated with maternal pre-/early pregnancy
anthropometry ..................................................................................................... 68
Maternal and infant birth outcomes associated with maternal pre-/early
pregnancy anthropometry ................................................................................... 79
Longer term maternal outcomes associated with maternal
anthropometrics .................................................................................................. 88
Change in gestational anthropometric change during pregnancy and
pregnancy outcomes........................................................................................... 93
Combined influence of maternal anthropometrics, gestational
anthropometric change and pregnancy outcomes .............................................. 99
3.6 Discussion .................................................................................................. 105
Comparison with outcomes Institute of Medicine guidelines for weight
gain during pregnancy ...................................................................................... 112
Chapter 4. A mixed methods systematic literature search and framework-based
synthesis of qualitative and quantitative literature to identify the confounding and
mediating variables (Phase 2) ................................................................................. 115
4.1 Introduction ................................................................................................ 115
Defining confounding and mediating variables .................................... 115
4.2 Aim ............................................................................................................. 116
4.3 Objectives .................................................................................................. 117
4.4 Methods ..................................................................................................... 117
Synthesis design .................................................................................. 118
Synthesis methods .............................................................................. 119
Familiarisation and literature searching ............................................... 120
Identifying a thematic framework ......................................................... 123
Indexing ............................................................................................... 123
Charting ............................................................................................... 124
Mapping and interpretation .................................................................. 127
X
4.5 Results ....................................................................................................... 127
Familiarisation ..................................................................................... 127
Refining the inclusion criteria .............................................................. 129
Maternal anthropometric measurements ............................................. 131
Gestational anthropometric change .................................................... 135
Antenatal outcomes .......................................................................................... 136
Maternal and infant pregnancy outcomes ........................................... 143
Longer term outcomes ........................................................................ 156
Ethnic differences in mediating and confounding variables ................. 167
Conceptual model development .......................................................... 169
Discussion of the strengths and limitations of the framework-based
synthesis .......................................................................................................... 172
Chapter 5. Validation study and discussion of conceptual model development (Phase
3) ............................................................................................................................ 175
5.1 Validation study ......................................................................................... 175
5.2 Aim ............................................................................................................ 175
5.3 Objectives .................................................................................................. 176
5.4 Methods ..................................................................................................... 176
5.5 Results ....................................................................................................... 177
5.6 Discussion of the strengths and limitations of the expert opinion phase .... 180
5.7 Discussion of conceptual model development ........................................... 180
Chapter 6. Methods for analysis of data from the Born in Bradford cohort ............. 183
6.1 Conceptual model for gestational weight gain to be tested using Born in
Bradford data ....................................................................................................... 185
6.2 Data analysis ............................................................................................. 189
6.2.1 Dealing with missing data.................................................................... 190
6.2.2 Exploratory analysis ............................................................................ 191
6.2.3 Structural equation modelling (Path analysis where no latent variables
used)…………………………………………………………………………………..196
XI
6.3 Defining variables ....................................................................................... 199
6.3.1 Exposure variables: ............................................................................. 199
6.3.2 Outcome variables ............................................................................... 202
6.3.3 Confounding and mediating variables .................................................. 205
6.3.4 Ethical considerations .......................................................................... 208
Chapter 7. Results from analysis of data from the Born in Bradford cohort ............. 209
7.1 Born in Bradford population included in the analysis .................................. 209
7.1.1 Ethnic differences in maternal anthropometrics ................................... 209
7.1.2 Ethnic differences in gestational weight gain ....................................... 214
7.1.3 Ethnic differences in demographic characteristics at baseline
questionnaire .................................................................................................... 220
7.1.4 Ethnic differences in pregnancy outcomes .......................................... 225
7.1.5 Exploring the association between maternal body mass index,
gestational weight gain and antenatal pregnancy outcomes in Pakistani and
White women .................................................................................................... 229
7.1.6 Exploring the association between maternal body mass index,
gestational weight gain and pregnancy outcomes for mother and infant in
Pakistani and White women: Maternal outcomes ............................................. 236
7.1.7 Exploring the association between maternal body mass index,
gestational weight gain and pregnancy outcomes for mother and infant in
Pakistani and White women: Infant outcomes .................................................. 243
7.1.8 Gestational weight gain per week ........................................................ 263
7.1.9 Gestational weight gain categorised according to maternal body mass
index; comparing use of general population body mass index criteria with Asian
specific body mass index criteria ...................................................................... 263
7.2 Structural equation modelling for gestational weight gain .......................... 268
7.3 Exploring missing data ............................................................................... 277
7.3.1 Maternal body mass index at booking ................................................. 284
7.3.2 Gestational weight gain ....................................................................... 284
7.4 Discussion of Chapter 7 ............................................................................. 285
XII
7.4.1 Comparison of the Born in Bradford cohort and UK population........... 286
7.4.2 Discussion of the strengths and limitations of the analysis of the data
from the Born in Bradford cohort ...................................................................... 288
Chapter 8. Discussion ............................................................................................. 293
8.1 Summary of findings .................................................................................. 293
8.2 Strengths and limitations ........................................................................... 297
8.3 Policy and practice ..................................................................................... 299
8.4 Future research ......................................................................................... 300
8.5 Conclusions ............................................................................................... 304
Appendices ............................................................................................................. 305
References ............................................................................................................. 377
XIII
List of Tables
Table 1 World Health Organisation BMI categories .................................................... 4
Table 2 Level of intervention required based on BMI, waist circumference level and
presence of comorbidities. .......................................................................................... 5
Table 3 Maternal BMI categories .............................................................................. 15
Table 4 Geographical distribution of maternal first trimester obesity in England 2007*
using Ordinance Survey Government Office Region boundaries .............................. 17
Table 5 Factors influencing GWG according to the Institute of Medicine .................. 20
Table 6 1990 Institute of Medicine GWG recommendations ..................................... 22
Table 7 2009 Institute of Medicine GWG recommendations ..................................... 23
Table 8 Comparison of the World Health Organisation BMI criteria for the general
population and specific to the Asian population......................................................... 31
Table 9 Summary of reasons for conducting mixed methods research .................... 40
Table 10 Search term development using PICOS .................................................... 49
Table 11 Summary of included studies ..................................................................... 57
Table 12 Effects of maternal BMI on pregnancy outcomes in South Asian and White
women ....................................................................................................................... 64
Table 13 Effects of maternal BMI on pregnancy outcomes in South Asian women
compared with White women .................................................................................... 67
Table 14 MA measurements of women in population of women with pregnancy
outcome..................................................................................................................... 69
Table 15 GAC in women with different pregnancy complications ............................. 75
Table 16 GAC from 14 to 28 weeks gestation........................................................... 77
Table 17 Summary table of the results relating to MA and outcomes during
pregnancy.................................................................................................................. 78
Table 18 Ethnic difference in distance from skin to lumbar epidural space by
maternal BMI ............................................................................................................. 80
Table 19 Summary table of the results relating to MA and birth outcomes for model
development .............................................................................................................. 86
Table 20 Change in anthropometric measures from 14 weeks gestation to 14 weeks
post-partum ............................................................................................................... 90
Table 21 Summary table of the results relating to MA and post-partum outcomes for
model development ................................................................................................... 91
XIV
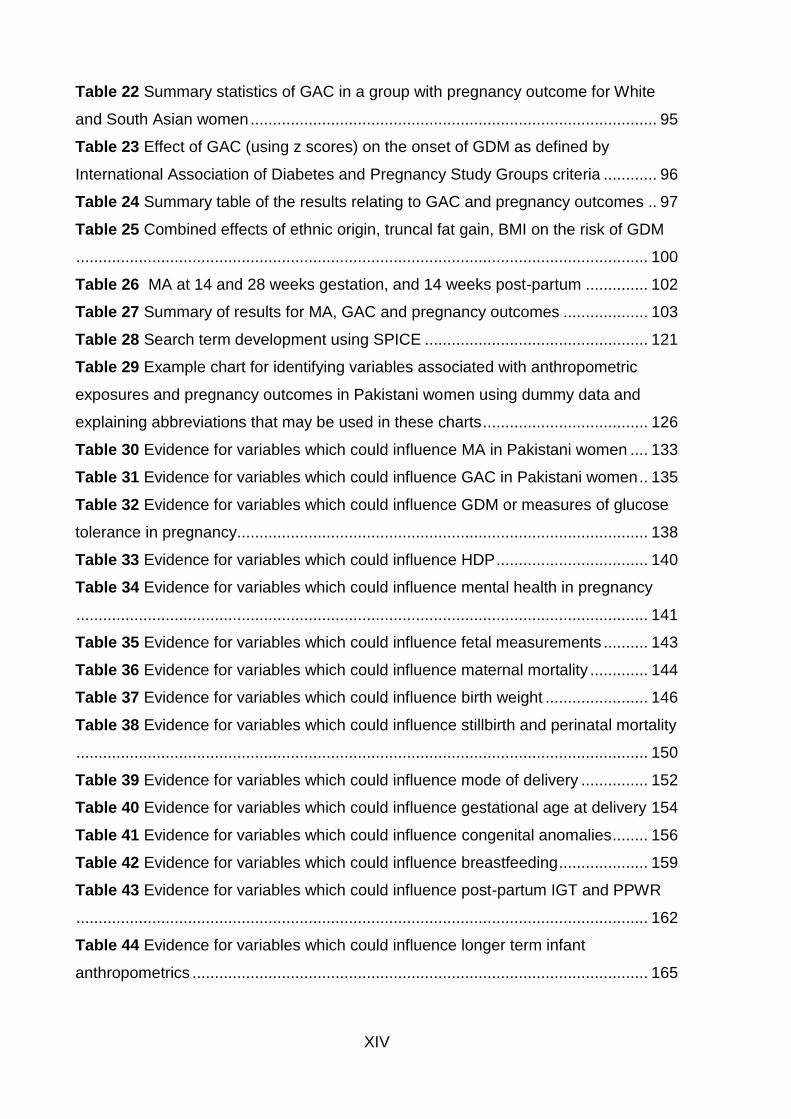
Table 22 Summary statistics of GAC in a group with pregnancy outcome for White
and South Asian women ........................................................................................... 95
Table 23 Effect of GAC (using z scores) on the onset of GDM as defined by
International Association of Diabetes and Pregnancy Study Groups criteria ............ 96
Table 24 Summary table of the results relating to GAC and pregnancy outcomes .. 97
Table 25 Combined effects of ethnic origin, truncal fat gain, BMI on the risk of GDM
................................................................................................................................ 100
Table 26 MA at 14 and 28 weeks gestation, and 14 weeks post-partum .............. 102
Table 27 Summary of results for MA, GAC and pregnancy outcomes ................... 103
Table 28 Search term development using SPICE .................................................. 121
Table 29 Example chart for identifying variables associated with anthropometric
exposures and pregnancy outcomes in Pakistani women using dummy data and
explaining abbreviations that may be used in these charts ..................................... 126
Table 30 Evidence for variables which could influence MA in Pakistani women .... 133
Table 31 Evidence for variables which could influence GAC in Pakistani women .. 135
Table 32 Evidence for variables which could influence GDM or measures of glucose
tolerance in pregnancy............................................................................................ 138
Table 33 Evidence for variables which could influence HDP .................................. 140
Table 34 Evidence for variables which could influence mental health in pregnancy
................................................................................................................................ 141
Table 35 Evidence for variables which could influence fetal measurements .......... 143
Table 36 Evidence for variables which could influence maternal mortality ............. 144
Table 37 Evidence for variables which could influence birth weight ....................... 146
Table 38 Evidence for variables which could influence stillbirth and perinatal mortality
................................................................................................................................ 150
Table 39 Evidence for variables which could influence mode of delivery ............... 152
Table 40 Evidence for variables which could influence gestational age at delivery 154
Table 41 Evidence for variables which could influence congenital anomalies ........ 156
Table 42 Evidence for variables which could influence breastfeeding .................... 159
Table 43 Evidence for variables which could influence post-partum IGT and PPWR
................................................................................................................................ 162
Table 44 Evidence for variables which could influence longer term infant
anthropometrics ...................................................................................................... 165
XV
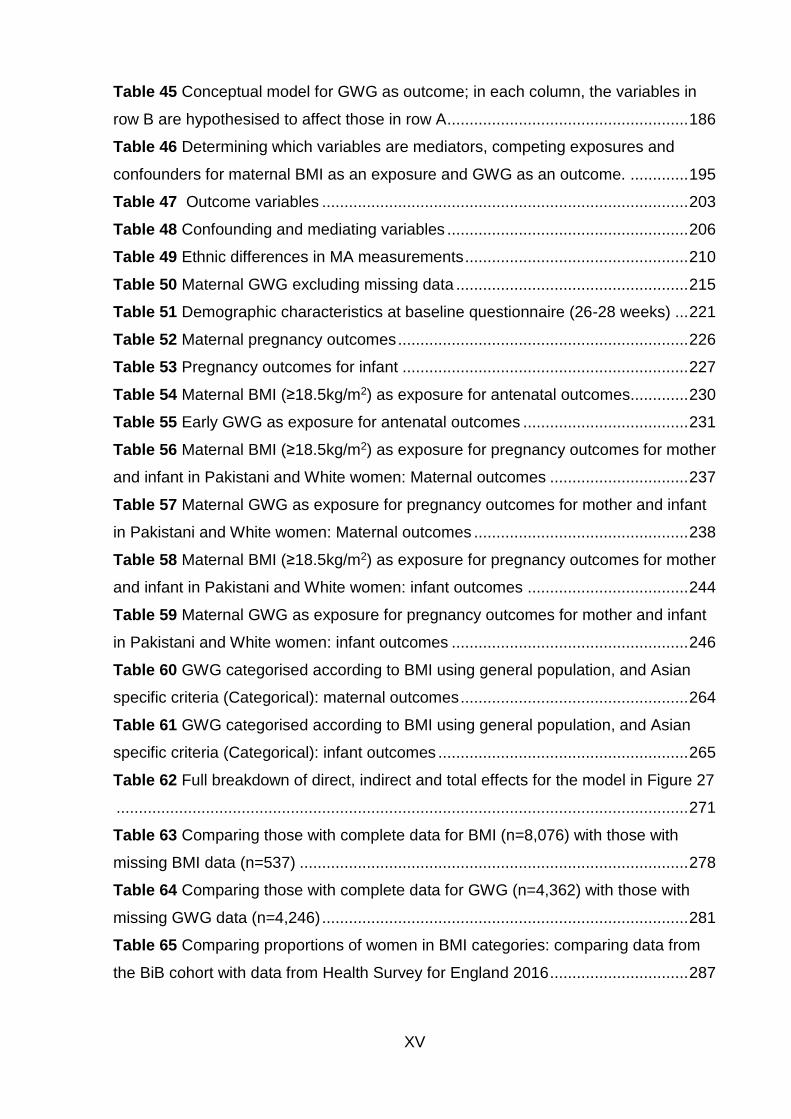
Table 45 Conceptual model for GWG as outcome; in each column, the variables in
row B are hypothesised to affect those in row A ...................................................... 186
Table 46 Determining which variables are mediators, competing exposures and
confounders for maternal BMI as an exposure and GWG as an outcome. ............. 195
Table 47 Outcome variables .................................................................................. 203
Table 48 Confounding and mediating variables ...................................................... 206
Table 49 Ethnic differences in MA measurements .................................................. 210
Table 50 Maternal GWG excluding missing data .................................................... 215
Table 51 Demographic characteristics at baseline questionnaire (26-28 weeks) ... 221
Table 52 Maternal pregnancy outcomes ................................................................. 226
Table 53 Pregnancy outcomes for infant ................................................................ 227
Table 54 Maternal BMI (≥18.5kg/m2) as exposure for antenatal outcomes............. 230
Table 55 Early GWG as exposure for antenatal outcomes ..................................... 231
Table 56 Maternal BMI (≥18.5kg/m2) as exposure for pregnancy outcomes for mother
and infant in Pakistani and White women: Maternal outcomes ............................... 237
Table 57 Maternal GWG as exposure for pregnancy outcomes for mother and infant
in Pakistani and White women: Maternal outcomes ................................................ 238
Table 58 Maternal BMI (≥18.5kg/m2) as exposure for pregnancy outcomes for mother
and infant in Pakistani and White women: infant outcomes .................................... 244
Table 59 Maternal GWG as exposure for pregnancy outcomes for mother and infant
in Pakistani and White women: infant outcomes ..................................................... 246
Table 60 GWG categorised according to BMI using general population, and Asian
specific criteria (Categorical): maternal outcomes ................................................... 264
Table 61 GWG categorised according to BMI using general population, and Asian
specific criteria (Categorical): infant outcomes ........................................................ 265
Table 62 Full breakdown of direct, indirect and total effects for the model in Figure 27
................................................................................................................................ 271
Table 63 Comparing those with complete data for BMI (n=8,076) with those with
missing BMI data (n=537) ....................................................................................... 278
Table 64 Comparing those with complete data for GWG (n=4,362) with those with
missing GWG data (n=4,246) .................................................................................. 281
Table 65 Comparing proportions of women in BMI categories: comparing data from
the BiB cohort with data from Health Survey for England 2016 ............................... 287

XVI
Table 66 Comparing proportions of women in GWG categories; data from Goldstein
et al (97) and data from the BiB cohort ................................................................... 288
XVII
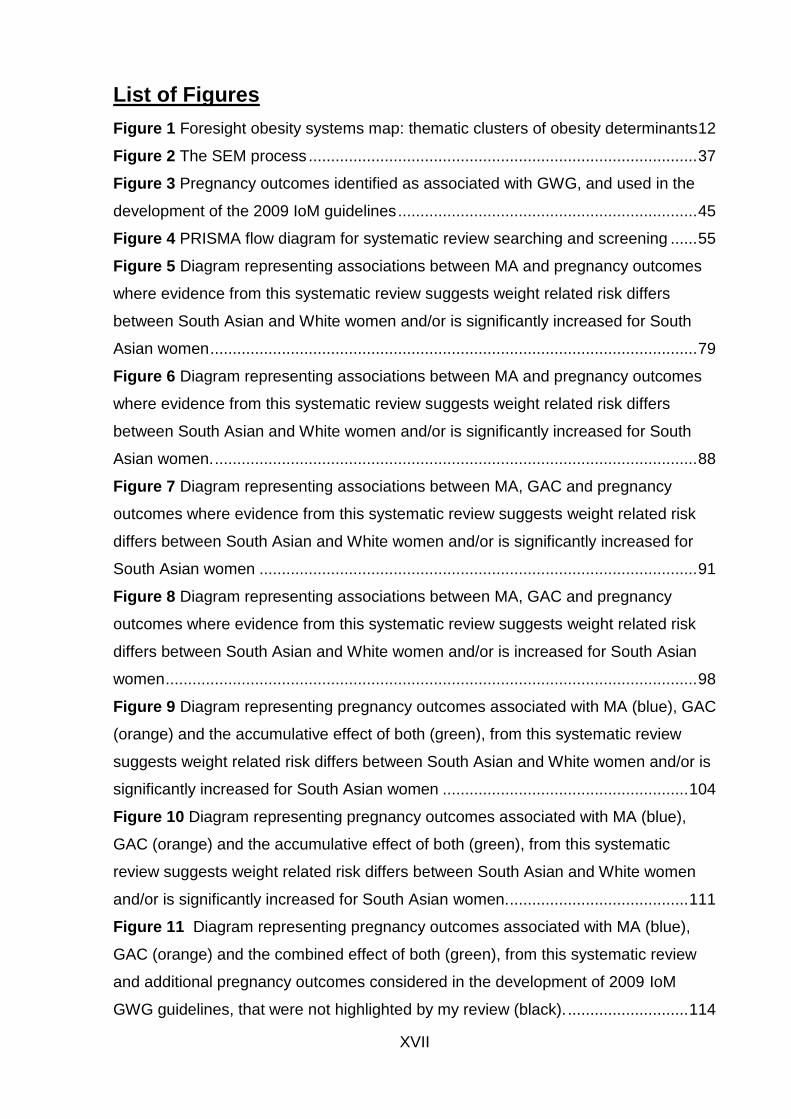
List of Figures
Figure 1 Foresight obesity systems map: thematic clusters of obesity determinants 12
Figure 2 The SEM process ....................................................................................... 37
Figure 3 Pregnancy outcomes identified as associated with GWG, and used in the
development of the 2009 IoM guidelines ................................................................... 45
Figure 4 PRISMA flow diagram for systematic review searching and screening ...... 55
Figure 5 Diagram representing associations between MA and pregnancy outcomes
where evidence from this systematic review suggests weight related risk differs
between South Asian and White women and/or is significantly increased for South
Asian women ............................................................................................................. 79
Figure 6 Diagram representing associations between MA and pregnancy outcomes
where evidence from this systematic review suggests weight related risk differs
between South Asian and White women and/or is significantly increased for South
Asian women. ............................................................................................................ 88
Figure 7 Diagram representing associations between MA, GAC and pregnancy
outcomes where evidence from this systematic review suggests weight related risk
differs between South Asian and White women and/or is significantly increased for
South Asian women .................................................................................................. 91
Figure 8 Diagram representing associations between MA, GAC and pregnancy
outcomes where evidence from this systematic review suggests weight related risk
differs between South Asian and White women and/or is increased for South Asian
women ....................................................................................................................... 98
Figure 9 Diagram representing pregnancy outcomes associated with MA (blue), GAC
(orange) and the accumulative effect of both (green), from this systematic review
suggests weight related risk differs between South Asian and White women and/or is
significantly increased for South Asian women ....................................................... 104
Figure 10 Diagram representing pregnancy outcomes associated with MA (blue),
GAC (orange) and the accumulative effect of both (green), from this systematic
review suggests weight related risk differs between South Asian and White women
and/or is significantly increased for South Asian women. ........................................ 111
Figure 11 Diagram representing pregnancy outcomes associated with MA (blue),
GAC (orange) and the combined effect of both (green), from this systematic review
and additional pregnancy outcomes considered in the development of 2009 IoM
GWG guidelines, that were not highlighted by my review (black). ........................... 114
XVIII
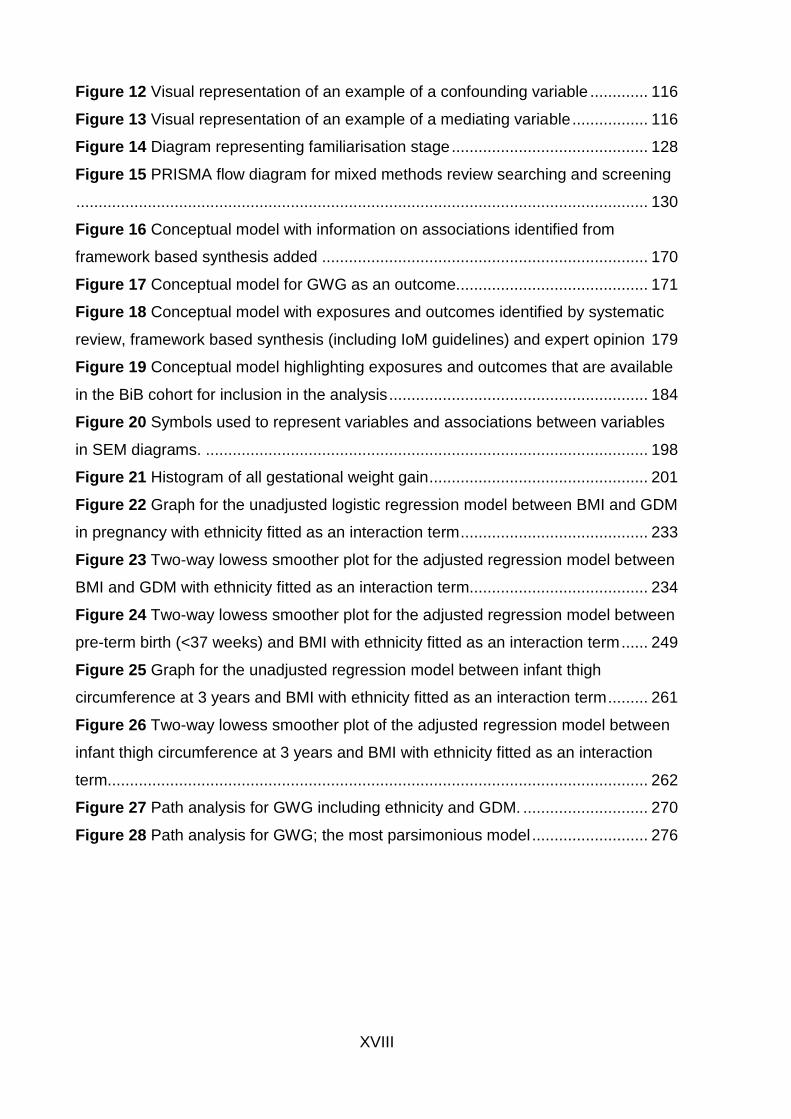
Figure 12 Visual representation of an example of a confounding variable ............. 116
Figure 13 Visual representation of an example of a mediating variable ................. 116
Figure 14 Diagram representing familiarisation stage ............................................ 128
Figure 15 PRISMA flow diagram for mixed methods review searching and screening
................................................................................................................................ 130
Figure 16 Conceptual model with information on associations identified from
framework based synthesis added ......................................................................... 170
Figure 17 Conceptual model for GWG as an outcome........................................... 171
Figure 18 Conceptual model with exposures and outcomes identified by systematic
review, framework based synthesis (including IoM guidelines) and expert opinion 179
Figure 19 Conceptual model highlighting exposures and outcomes that are available
in the BiB cohort for inclusion in the analysis .......................................................... 184
Figure 20 Symbols used to represent variables and associations between variables
in SEM diagrams. ................................................................................................... 198
Figure 21 Histogram of all gestational weight gain ................................................. 201
Figure 22 Graph for the unadjusted logistic regression model between BMI and GDM
in pregnancy with ethnicity fitted as an interaction term .......................................... 233
Figure 23 Two-way lowess smoother plot for the adjusted regression model between
BMI and GDM with ethnicity fitted as an interaction term........................................ 234
Figure 24 Two-way lowess smoother plot for the adjusted regression model between
pre-term birth (<37 weeks) and BMI with ethnicity fitted as an interaction term ...... 249
Figure 25 Graph for the unadjusted regression model between infant thigh
circumference at 3 years and BMI with ethnicity fitted as an interaction term ......... 261
Figure 26 Two-way lowess smoother plot of the adjusted regression model between
infant thigh circumference at 3 years and BMI with ethnicity fitted as an interaction
term......................................................................................................................... 262
Figure 27 Path analysis for GWG including ethnicity and GDM. ............................ 270
Figure 28 Path analysis for GWG; the most parsimonious model .......................... 276
1
Abbreviations
AOR: Adjusted odds ratio
ARR: Adjusted risk ratio
BiB: Born in Bradford
BMI: Body Mass Index
CI: Confidence interval
CMACE: Centre for Maternal and Child Enquiries
GAC: Gestational anthropometric change
GDM: Gestational diabetes mellitus
GOR: Government Office Region
GWG: Gestational weight gain
HDP: Hypertensive disorders of pregnancy
IMD: Index of multiple deprivation
IoM: Institute of Medicine
LSCS: lower segment caesarean section
LGA: Large for gestational age
MA: Maternal anthropometrics
MI: Multiple imputation
MOOSE: Meta-analysis of observational studies in epidemiology
MUAC: Mid upper arm circumference
NHS: National Health Service
NICE: National Institute for Health and Care Excellence
NICU: Neonatal intensive care unit
2
PAF: Population attributable fraction
PICOS: Population, intervention, comparison, outcome, study type
PPH: Post-partum haemorrhage
PPWR: Post-partum weight retention
PRISMA: Preferred Reporting Items for Systematic Reviews and Meta-Analyses
RCOG: Royal College of Obstetricians and Gynaecologists
RR: Risk Ratio
SEM: Structural equation modelling
SES: Socioeconomic status
SGA: Small for gestational age
SFT: Skinfold thickness
UK: United Kingdom
USA: United States of America
WHO: World Health Organisation
3
Chapter 1. Background
This chapter will discuss the background to this PhD project. It will summarise the
existing evidence relating to obesity, maternal obesity, gestational weight gain
(GWG) and maternal ethnicity, highlighting why this research is important and go on
to state the aim and objectives.
1.1 Obesity
The increasing prevalence of people with overweight (body mass index (BMI)
≥25kg/m2) and obesity (BMI≥30kg/m2) is a global problem (1). Overweight and
obesity are directly linked to a number of chronic diseases, including diabetes,
cardiovascular diseases and cancer (1, 2). Risk of these associated diseases differs
both by the amount of excess fat stored, and also in relation to the distribution of the
excess fat (3). Excess abdominal (or central) fat alone is thought to be as great a risk
factor for disease as is excess body fat (3). Obesity, and the diseases associated
with it, have a major impact on human morbidity, mortality and quality of life, and
place a large burden on healthcare resources (4). This section will give an overview
of the existing evidence base on obesity in the general population, including
international definitions of obesity, prevalence in the UK, related health inequalities
and potential causes.
Defining obesity in adults
In the UK, the National Institute for Health and Care Excellence (NICE) guidelines
(Obesity: identification, assessment and management of overweight and obesity in
children, young people and adults) published in 2014 (and checked by NICE in May
2018) state that BMI should be used primarily as an estimate of adiposity in adults
(5). BMI is a measurement of weight for height and is calculated by dividing a
person’s weight (in kilograms) by their height (in meters squared) (1). BMI is a useful
measure of population-level overweight and obesity (1). However, it may not
correspond to the same degree of fatness in different individuals (1). Where BMI is
<35kg/m2, the use of waist circumference measurement should also be considered
(5); this additional measurement enables both the amount and the distribution of
body fat to be taken into account. Internationally, a BMI≥25kg/m2, is considered to
4
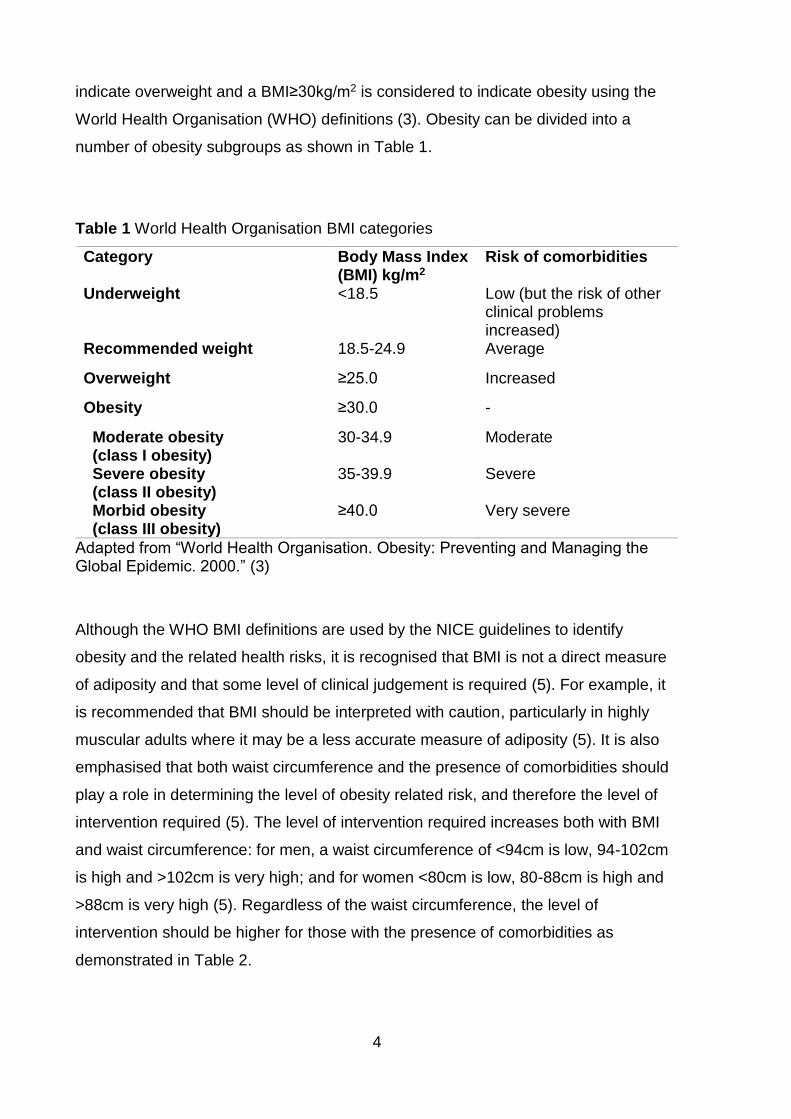
indicate overweight and a BMI≥30kg/m2 is considered to indicate obesity using the
World Health Organisation (WHO) definitions (3). Obesity can be divided into a
number of obesity subgroups as shown in Table 1.
Table 1 World Health Organisation BMI categories
Category Body Mass Index (BMI) kg/m2
Risk of comorbidities
Underweight <18.5 Low (but the risk of other clinical problems increased)
Recommended weight 18.5-24.9 Average
Overweight ≥25.0 Increased
Obesity ≥30.0 -
Moderate obesity (class I obesity)
30-34.9 Moderate
Severe obesity (class II obesity)
35-39.9 Severe
Morbid obesity (class III obesity)
≥40.0 Very severe
Adapted from “World Health Organisation. Obesity: Preventing and Managing the Global Epidemic. 2000.” (3)
Although the WHO BMI definitions are used by the NICE guidelines to identify
obesity and the related health risks, it is recognised that BMI is not a direct measure
of adiposity and that some level of clinical judgement is required (5). For example, it
is recommended that BMI should be interpreted with caution, particularly in highly
muscular adults where it may be a less accurate measure of adiposity (5). It is also
emphasised that both waist circumference and the presence of comorbidities should
play a role in determining the level of obesity related risk, and therefore the level of
intervention required (5). The level of intervention required increases both with BMI
and waist circumference: for men, a waist circumference of <94cm is low, 94-102cm
is high and >102cm is very high; and for women <80cm is low, 80-88cm is high and
>88cm is very high (5). Regardless of the waist circumference, the level of
intervention should be higher for those with the presence of comorbidities as
demonstrated in Table 2.
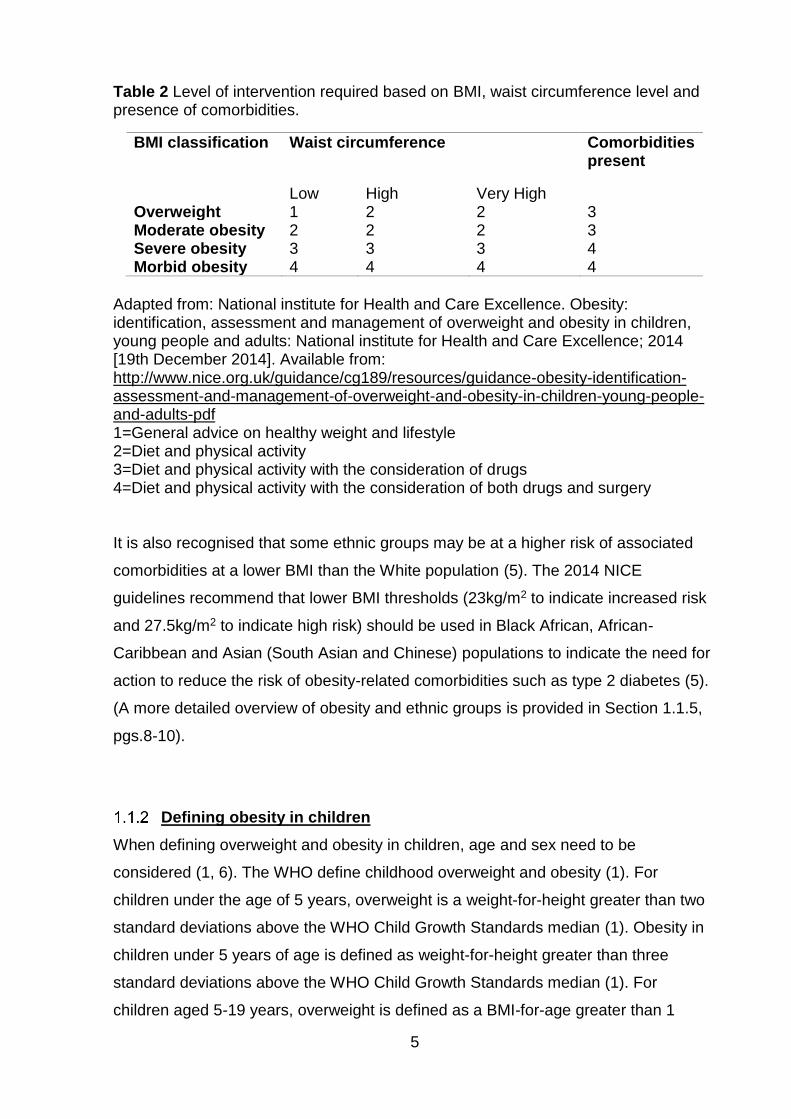
5
Table 2 Level of intervention required based on BMI, waist circumference level and presence of comorbidities.
BMI classification Waist circumference Comorbidities present
Low High Very High Overweight 1 2 2 3 Moderate obesity 2 2 2 3 Severe obesity 3 3 3 4 Morbid obesity 4 4 4 4
Adapted from: National institute for Health and Care Excellence. Obesity: identification, assessment and management of overweight and obesity in children, young people and adults: National institute for Health and Care Excellence; 2014 [19th December 2014]. Available from: http://www.nice.org.uk/guidance/cg189/resources/guidance-obesity-identification-assessment-and-management-of-overweight-and-obesity-in-children-young-people-and-adults-pdf 1=General advice on healthy weight and lifestyle 2=Diet and physical activity 3=Diet and physical activity with the consideration of drugs 4=Diet and physical activity with the consideration of both drugs and surgery It is also recognised that some ethnic groups may be at a higher risk of associated
comorbidities at a lower BMI than the White population (5). The 2014 NICE
guidelines recommend that lower BMI thresholds (23kg/m2 to indicate increased risk
and 27.5kg/m2 to indicate high risk) should be used in Black African, African-
Caribbean and Asian (South Asian and Chinese) populations to indicate the need for
action to reduce the risk of obesity-related comorbidities such as type 2 diabetes (5).
(A more detailed overview of obesity and ethnic groups is provided in Section 1.1.5,
pgs.8-10).
Defining obesity in children
When defining overweight and obesity in children, age and sex need to be
considered (1, 6). The WHO define childhood overweight and obesity (1). For
children under the age of 5 years, overweight is a weight-for-height greater than two
standard deviations above the WHO Child Growth Standards median (1). Obesity in
children under 5 years of age is defined as weight-for-height greater than three
standard deviations above the WHO Child Growth Standards median (1). For
children aged 5-19 years, overweight is defined as a BMI-for-age greater than 1
6
standard deviation above the WHO Growth Reference median, and obesity is a BMI-
for-age 2 standard deviations above the WHO Growth Reference median (1).
In the UK, children’s BMI is categorised using variable thresholds that take into
account the child’s age and sex (7); these thresholds are known as a child growth
reference. The child growth reference thresholds are calculated by measuring and
weighing a large sample of children (the reference population) to identify how BMI
varies by age and sex across the population (7). These data provide an average BMI
for a girl and a boy at a particular age, as well as the distribution of measurements
above and below the average (7). Therefore, individual children can be compared to
the reference population, and from this the degree of variation from an expected
value can be calculated (7). The National Obesity Observatory states z-scores1 or
centiles are used to define BMI thresholds on a child growth reference (7).
Prevalence of, and risks associated with, obesity in the general
population
The most recent WHO factsheet (2018) on obesity states that since 1975 the number
of people who have obesity has nearly tripled worldwide (1). Today, most of the
world's population live in countries where overweight and obesity kill more people
than underweight (1). In 2016, more than 1.9 billion adults ages 18 years and older
who were overweight, 650 million of whom had obesity (1). This equates to 39% of
adults aged 18 years or over who had overweight (38% of men and 40% of women),
and 13% who had obesity (11% of men and 15% of women) (1). In high income
countries, around half the women of childbearing age (sometimes referred to as
reproductive age; age 15-49 years (8)) have either overweight or obesity (9); for
example in England in 2015-16, 37% of women age 16-24, 49% of women age 25-34
years, and 59% of women age 35-44 had a BMI≥25kg/m2 (10). In 2016, 41 million
children under the age of five years worldwide were classified as either overweight or
obese, and over 340 million children and adolescents aged five to 19 had overweight
or obesity (1).
1 A BMI z score or standard deviation score indicates how many units (of the standard deviation) a
child’s BMI is above or below the average BMI value for their age group and sex. For instance, a z
score of 1.5 indicates that a child is 1.5 standard deviations above the average value.
7
A raised BMI is a major risk factor for non-communicable disease and it is thought
that the more increased BMI is, the higher the risk (1). Non-communicable diseases
that have been associated with BMI include cardiovascular disease, diabetes,
musculoskeletal disorders such as osteoarthritis and also some cancers including
endometrial, breast, kidney and colon (1). Childhood obesity is also associated with
adverse health outcomes; this relates both to the long and short term (1). Children
with obesity have an increased risk of breathing difficulties, fractures, hypertension,
insulin resistance, early markers of cardiovascular disease and also psychological
effects (1). They also have an increased risk of obesity in the future, premature death
and disability in adulthood (11).
Obesity prevalence is increasing in the UK. Between 1993 and 2013, the proportion
of men who were categorised as having obesity increased from 13.2% to 26% (12),
this was still the same at 26% in 2016 (13) and the proportion of women rose from
16.4% to 23.8% (12), this had increased further to 27.0% in 2016 (13). In 2016/17,
results from the National Child Measurement Program2 found that 9.6% of reception-
aged children (aged 4-5 years; 10.0% of boys and 9.2% of girls) were classified as
having obesity according to the British 1990 population monitoring definition of
obesity (≥95th centile) (14); this was a slight decrease from 9.9% in 2006/7 (10.07%
in boys and 9.0% in girls) (15). For year six children (aged 10-11 years), 20.0%
(21.8% of boys and 18.0% of girls) were classified as having obesity (14), this was an
increase from 2006/7 where 17.5% were classified as having obesity (19.0% of boys,
and 15.8% of girls) (15). By 2050, it is predicted that 60% of adult men, 50% of adult
women and 25% of children will have obesity (16).
Economic impact of obesity
A systematic review published in 2017 included 23 studies (from Canada, USA,
Brazil, Germany, Thailand, Mexico, Korea, Czech Republic, Republic of Ireland,
Spain and Sweden) (17). The review found that when considering adults aged 18
years or older, obesity accounted for substantial economic burden, both in developed
and developing countries despite considerable heterogeneity in methodological
approaches, study populations and time frames (17). Poor health associated with
2National Child Measurement Program measures the height and weight of around one million school children in England each year
8
obesity is related to increased work absenteeism, mortality and decreased
employment, personal income and quality of life (18). Statistical modelling of
economic implications of obesity in the USA has found that relative to a matched
normal weight population, adults with obesity average $3900 higher medical
expenditures in an initial year, this increased to $4600 more in the tenth year (18).
This excess cost differed by obesity class. Over a ten-year period, the excess
expenditure relating to obesity averaged $4280 per year; this was $2820 for those
with obesity class I, $5100 for those with obesity class II and $8710 for those with
obesity class III (18). Additional simulation evidence has looked at predicted
economic burden of obesity in the UK and USA to 2030 (19). Current trends project
that 11 million more adults will have obesity in the UK and 65 million more adults will
have obesity in the USA by 2030. The combined medical costs associated with
treatment of associated preventable diseases are estimated to increase by $48–66
billion/year in the USA and by £1·9–2 billion/year in the UK by 2030 (19).
Obesity related health inequalities
Health inequalities are defined by WHO as “differences in health status, or in the
distribution of health determinants between different population groups” (20). Health
inequalities are strongly related to obesity in the general population, both worldwide
and in the UK (21). This means that obesity levels differ across different populations,
for example; across different ethnic groups, or different levels of socioeconomic
status (SES). These inequalities relate to potentially modifiable factors such as
education, SES (e.g. income and employment) and to non-modifiable factors such as
age, ethnicity and gender. Identification of groups particularly at risk of obesity and
the associated comorbidities is important to inform the development of targeted
interventions, and where relevant the development of public health guidelines.
Age and sex
Obesity prevalence differs by both age and sex in the UK (22, 23). In adults aged 16
and over, prevalence of obesity is higher in men compared with women. In England
between 2013 and 2015, the three-year average of those with overweight or obesity
was 66.8% for men and 57.8% for women (22). However, there was very little
9
difference in three-year average for those with just obesity; 25.7% for men and
25.8% for women (22). Among both men and women, overweight and obesity
prevalence is lowest between the ages of 16-24 years, generally higher in the older
age groups and decreases in the oldest age group (75+ years); this final decrease in
prevalence is most apparent for men (22). In England in 2015, at all ages there was a
higher proportion of men with overweight or obesity compared with women (22). The
sex and age differences can also be seen in children; in 2016/17 10.0% of boys and
9.2% of girls aged 4-5 were classified as having obesity (14). However, for children
aged 10-11 years, 21.8% of boys and 18.0% of girls were classified as having
obesity (14).
Ethnicity
Obesity and overweight has been found to vary by ethnicity in both adults and
children (21, 24). In England in 2016/17, 22.6% of 4-5 year olds had overweight. This
was 34.2% in 10-11 year olds (24). In 4-5 year olds, Black African children had the
highest proportion with overweight (31.1%) and Indian children had the lowest
(14.9%) (24). In 10-11 year olds, this had changed. Although Black African children
still had the highest proportion with overweight (46.2%), White British children now
had the lowest (31.6%) (24). In 2016/17, 61% of all adults had obesity; this was
highest for Black adults (69%) and lowest for Chinese adults (32%).
The relationship between obesity and ethnicity is a complex one (25). This is due to
an interplay of factors affecting health in different ethnic groups (26). For example,
health behaviors may differ by ethnic group in accordance with religious, cultural and
socioeconomic factors, as well as by geography (25, 26). In the UK, it is thought that
some ethnic minority groups have a healthier diet than that of the White majority
population (26, 27). However, for some ethnic minority groups, particularly those of
South Asian origin, low physical activity levels and unhealthy diets are known to be of
concern (26, 27). In addition, members of minority ethnic groups in the UK are often
found to have lower SES then the majority White population (27), and low SES has
also been associated with a greater risk of obesity, particularly in women and
children (26). More information on the interrelationship between ethnicity and SES is
given in section 1.7.1, pg.30.
10
Deprivation
Until the 1960s, it is thought that socioeconomic inequalities in obesity prevalence
were largely absent (28). As obesity rates have increased over time, inequalities
have strengthened; obesity rates in both adults and children have increased most in
those with the poorest background (21, 29). In England in 2016/17, 13% of children
aged 4-5 who had obesity lived in most deprived areas, compared with 7% in the
least deprived areas (30). At age 10-11, the difference was more marked; 26% of
children had obesity compared with 13% in the least deprived areas (30). In 2016/1,
adults living in the most deprived parts of England were 46% more likely to have
obesity compared with adults living in the least deprived parts (30). Data from
England in 2014 showed that obesity prevalence in women increases with greater
levels of deprivation, independent of the measure of deprivation used (22). For men,
on the other hand, obesity prevalence has only been found to be associated with
occupation, education and qualification-based measures of deprivation (22).
Disability
Obesity has also been associated with disability (31). Although there is limited data
available, it has been observed that adults with disabilities are more likely to have
obesity and lower physical activity levels than those without disabilities in the general
population (31). This association has been found to vary with both age and gender
(26). Children with a disability have also been found to have a higher risk of obesity;
one report found that children who have a limiting illness (the meaning of limiting
illness was not defined in the report) were also more likely to have overweight or
obesity; this association was found to be stronger in those children who also had a
learning disability (32). Another study found that children with chronic conditions
(asthma, hearing or vision condition, learning disability, autism and attention-
deficit/hyperactivity disorder) had a higher risk of obesity compared to those children
without a chronic condition (33).
Determinants of obesity
All aspects of our health, including whether or not we have obesity, are dependent on
a number of complex factors including our individual genetics, lifestyle and
11
environment. This idea has been depicted in a model developed by Dhalgren and
Whitehead (34) which places the social determinants of health in order of factors
relating to the wider environment, to factors that only affect the individual. In
Dhalgren and Whitehead’s model, these factors are (from wider environment to
individual level factors); General socioeconomic, cultural and environmental
conditions; Living and working conditions including agriculture and food production,
education, work environment, unemployment, water and sanitation, health care
services, housing; Social and community networks; Individual lifestyle factors and
Age, sex and constitutional factors. Factors are both fixed and unchangeable for
example; genetics, ethnicity, sex and age, and potentially modifiable for example
smoking, diet and physical activity.
Biologically, obesity is caused through energy imbalance leading to excess fat
deposition when the energy intake from the consumption of food and drink is greater
than the energy expended through the body’s metabolism and through physical
activity over a prolonged period of time (1, 35). In 2007, the Foresight report
highlighted that the causes of obesity are more complex and multifaceted than a
simple positive energy imbalance (16). This complexity was depicted by the report’s
systems map of obesity (Figure 1) which shows that there are a large number of
interrelated factors contributing to obesity development (16).
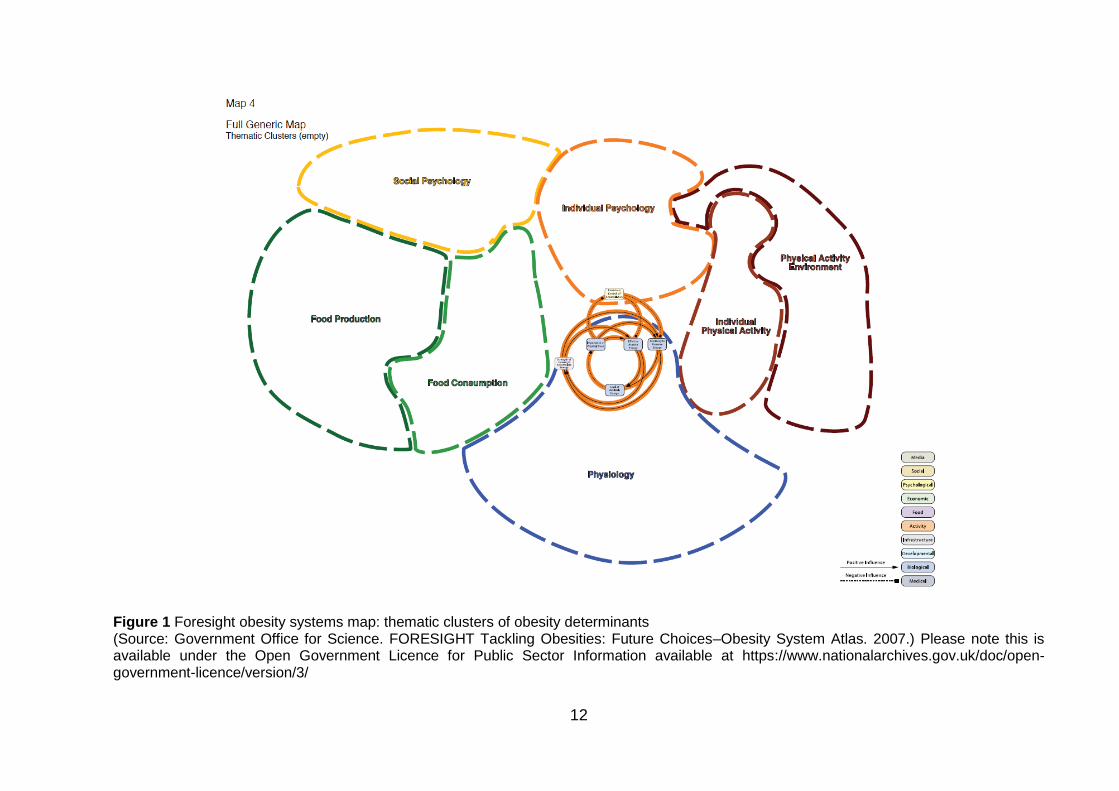
12
Figure 1 Foresight obesity systems map: thematic clusters of obesity determinants (Source: Government Office for Science. FORESIGHT Tackling Obesities: Future Choices–Obesity System Atlas. 2007.) Please note this is available under the Open Government Licence for Public Sector Information available at https://www.nationalarchives.gov.uk/doc/open-government-licence/version/3/
13
The factors thought to influence the development of obesity include an individual’s
genetics and ill health which relates to any conditions which may pre-dispose an
individual to obesity (35). There are also a number of other potential causes of
obesity which vary both by population and also across a person’s life course (16).
These include behaviour; particularly physical activity and eating, and how these
behaviours influence energy imbalance within the body (16). A positive energy
imbalance (i.e. too much energy in) leads to the development of excess adipose
tissue and subsequent obesity (16). Individual psychology and motivation may also
contribute to obesity development, for example motivation for physical activity or
particular foods and food consumption patterns (35). Type, level and frequency of
physical activity may also be involved. This in turn may be influenced by
opportunities for physical activity and the obesogenic environment we live in (35). For
example, one may want to walk to work; however, this decision may be dictated by
whether or not there is a safe route with street lighting. Another influencing factor is
the quality, quantity and frequency of food consumption; and also access to food and
drink; the availability and affordability of healthy food products such as fruit and
vegetables may influence consumption (35).
In the UK, it is thought that obesity is primarily caused by people’s latent biological
susceptibility to develop obesity interacting with the changing environment which
increasingly includes lower physical activity and more dietary abundance (16).
However, evidence from epidemiological studies and animal models suggests that
the development of obesity and the related metabolic disorders lies both in the
interactions between genes and adult risk factors such as low physical activity level
and unbalanced diet, and also the interaction between genes and the embryonic,
fetal and early postnatal environment (4).
The idea that maternal health may influence the future health of the infant is not a
new concept (4). The social and geographical health inequalities have been debated
since Victorian times (4). However, it was not until 1977 that epidemiological
evidence in Norway led to the suggestion of a causal link between environmental
factors in early life and subsequent disease (36). Years later in the UK, Barker and
Osmond put forward the suggestion that it was poverty, poor nutrition and the
general health of the mother producing both high infant mortality rates and a lifetime
risk of coronary heart disease (37). This suggestion was followed with studies of UK
14
cohorts looking at fetal and placental size and the risk of hypertension in adult life
(38), fetal nutrition and cardiovascular disease in adult life (39) and the fetal origins of
coronary heart disease (40). This research led to the hypothesis that adverse
environmental factors in early life cause disruption of normal growth and
development of an adult phenotype prone to the development of cardiovascular
disease; also known as the developmental origins of health and disease hypothesis.
Both under- and over-nutrition in utero are thought to influence risk of obesity in later
life, this is suggested by the U- or J-shaped association which has been observed
between birth weight and subsequent obesity (41, 42). Two factors that are thought
to influence nutrition in utero are maternal pre-pregnancy BMI; whether the mothers
BMI is in the underweight, overweight or recommended range (18.5-24.9kg/m2), and
also how much weight a women gains during pregnancy, known as gestational
weight gain (GWG).
1.2 Maternal obesity
This section will give an overview of how maternal obesity is defined using current
guidelines, the existing evidence base on maternal obesity including prevalence in
the UK and also the associated risks for both mother and infant.
Defining maternal obesity
While there is an absence of pregnancy-specific BMI criteria to define maternal
weight status during pregnancy, research, guidelines and clinical practice use the
WHO BMI classification categories which reflect the risk of type 2 diabetes and
cardiovascular disease in the non-pregnant population (3, 43). As in the non-
pregnant population, maternal obesity (≥30kg/m2) can be divided into a number of
subgroups. An additional BMI category is often used in pregnancy which includes
women with a BMI≥50kg/m2 and is termed “extreme obesity” (or sometimes referred
to as “super-morbid obesity”) (44) (Table 3).
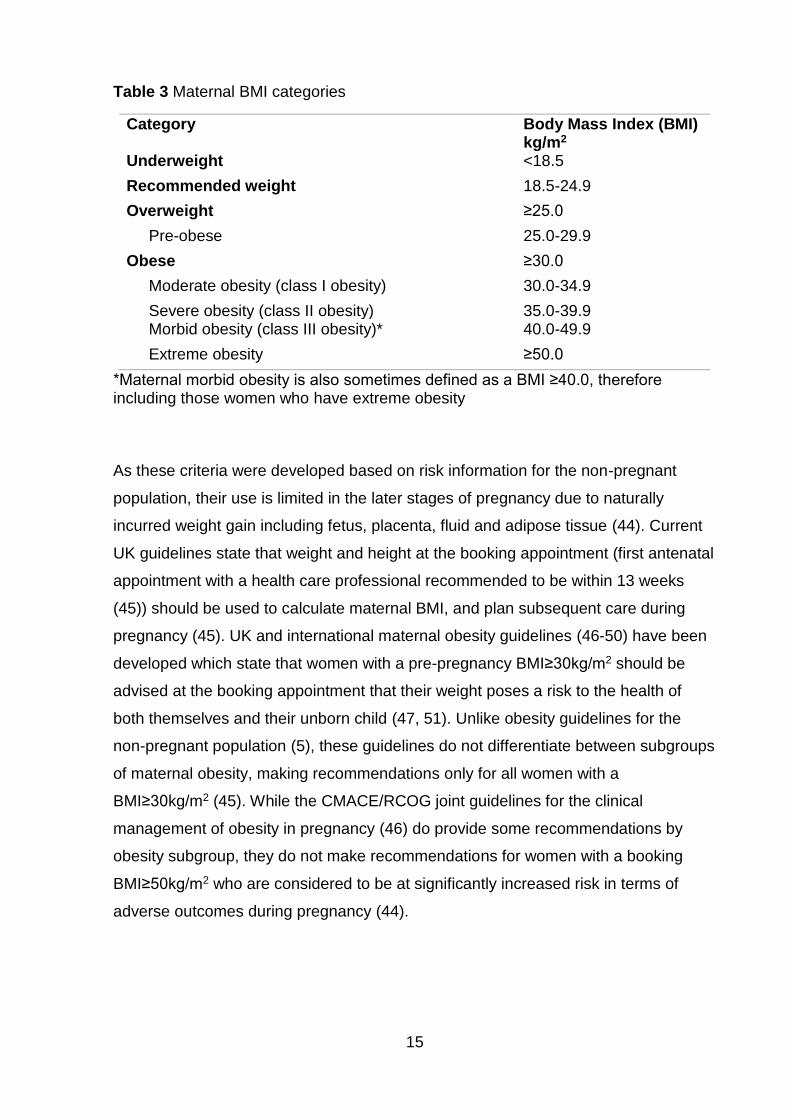
15
Table 3 Maternal BMI categories
Category Body Mass Index (BMI) kg/m2
Underweight <18.5
Recommended weight 18.5-24.9
Overweight ≥25.0
Pre-obese 25.0-29.9
Obese ≥30.0
Moderate obesity (class I obesity) 30.0-34.9
Severe obesity (class II obesity) 35.0-39.9 Morbid obesity (class III obesity)* 40.0-49.9
Extreme obesity ≥50.0
*Maternal morbid obesity is also sometimes defined as a BMI ≥40.0, therefore including those women who have extreme obesity
As these criteria were developed based on risk information for the non-pregnant
population, their use is limited in the later stages of pregnancy due to naturally
incurred weight gain including fetus, placenta, fluid and adipose tissue (44). Current
UK guidelines state that weight and height at the booking appointment (first antenatal
appointment with a health care professional recommended to be within 13 weeks
(45)) should be used to calculate maternal BMI, and plan subsequent care during
pregnancy (45). UK and international maternal obesity guidelines (46-50) have been
developed which state that women with a pre-pregnancy BMI≥30kg/m2 should be
advised at the booking appointment that their weight poses a risk to the health of
both themselves and their unborn child (47, 51). Unlike obesity guidelines for the
non-pregnant population (5), these guidelines do not differentiate between subgroups
of maternal obesity, making recommendations only for all women with a
BMI≥30kg/m2 (45). While the CMACE/RCOG joint guidelines for the clinical
management of obesity in pregnancy (46) do provide some recommendations by
obesity subgroup, they do not make recommendations for women with a booking
BMI≥50kg/m2 who are considered to be at significantly increased risk in terms of
adverse outcomes during pregnancy (44).
16
Maternal obesity prevalence
As with obesity in the general population, maternal obesity has been increasing over
time internationally. In the 1980s, data from Europe, USA and Australia show that
between 2% and 8% of women had obesity in pregnancy, by the 2000s, this had
increased to 20-30% in the USA, and 10-15% in Australia and Europe (52-57). In the
UK, prevalence of overweight and obesity in females age 16-44 years increased
between 1993 and 2013 from 25% to 29%, and 12% to 19%, respectively (12).
Findings from the 2010 The Centre for Maternal and Child Enquiries (CMACE)
national project report (58) identified that the UK prevalence of women with a known
BMI≥35kg/m2 at any point in pregnancy was 4.99% which translating to
approximately 38,478 maternities each year in the UK. The prevalence of women
with a pregnancy BMI≥40kg/m2 in the UK was 2.01%, while having a BMI≥50kg/m2
affected 0.19% of all women giving birth. In addition, a retrospective epidemiological
study of a nationally representative dataset looking at first trimester obesity in
England found that maternal obesity doubled between 1989 and 2007 from 7.6% to
15.6% (59). This increasing trend has also been observed in Cardiff where the
incidence of maternal obesity more than doubled from 3.2% to 8.9% between 1990
and 1999 (60), and also in Glasgow where maternal obesity rose from 9.4% to 18.9%
between 1990 and 2002/4 (52). Recent data from the Maternal and Perinatal Audit
from the 1st April 2015 to the 31st March 2016 in England, Scotland and Wales
showed that only 47.3% of pregnant women had a BMI in the recommended range
(BMI≥18.5 to <25.0kg/m2) and 21.3% of pregnant women have a BMI in the obese
range (≥30kg/m2) (61).
Regional variation in the prevalence of maternal obesity in the UK has also been
reported (59). Heslehurst et al. (59) mapped nationally representative data on first
trimester obesity from 2007 using the Ordinance Survey Government Office Region
(GOR) boundaries, Table 4 shows the geographical distribution of first trimester
obesity in England by GOR compared to the national average for 2007 which was
15.6% (59).
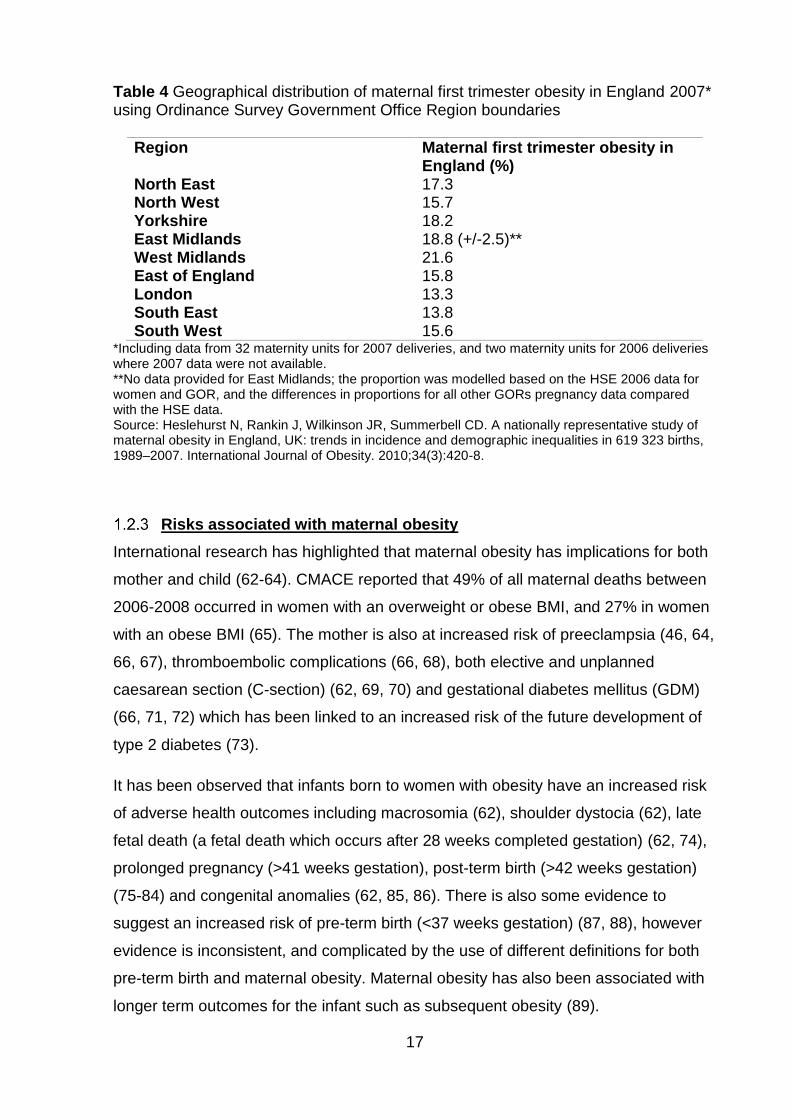
17
Table 4 Geographical distribution of maternal first trimester obesity in England 2007* using Ordinance Survey Government Office Region boundaries
Region Maternal first trimester obesity in England (%)
North East 17.3 North West 15.7 Yorkshire 18.2 East Midlands 18.8 (+/-2.5)** West Midlands 21.6 East of England 15.8 London 13.3 South East 13.8 South West 15.6
*Including data from 32 maternity units for 2007 deliveries, and two maternity units for 2006 deliveries where 2007 data were not available. **No data provided for East Midlands; the proportion was modelled based on the HSE 2006 data for women and GOR, and the differences in proportions for all other GORs pregnancy data compared with the HSE data. Source: Heslehurst N, Rankin J, Wilkinson JR, Summerbell CD. A nationally representative study of maternal obesity in England, UK: trends in incidence and demographic inequalities in 619 323 births, 1989–2007. International Journal of Obesity. 2010;34(3):420-8.
Risks associated with maternal obesity
International research has highlighted that maternal obesity has implications for both
mother and child (62-64). CMACE reported that 49% of all maternal deaths between
2006-2008 occurred in women with an overweight or obese BMI, and 27% in women
with an obese BMI (65). The mother is also at increased risk of preeclampsia (46, 64,
66, 67), thromboembolic complications (66, 68), both elective and unplanned
caesarean section (C-section) (62, 69, 70) and gestational diabetes mellitus (GDM)
(66, 71, 72) which has been linked to an increased risk of the future development of
type 2 diabetes (73).
It has been observed that infants born to women with obesity have an increased risk
of adverse health outcomes including macrosomia (62), shoulder dystocia (62), late
fetal death (a fetal death which occurs after 28 weeks completed gestation) (62, 74),
prolonged pregnancy (>41 weeks gestation), post-term birth (>42 weeks gestation)
(75-84) and congenital anomalies (62, 85, 86). There is also some evidence to
suggest an increased risk of pre-term birth (<37 weeks gestation) (87, 88), however
evidence is inconsistent, and complicated by the use of different definitions for both
pre-term birth and maternal obesity. Maternal obesity has also been associated with
longer term outcomes for the infant such as subsequent obesity (89).
18
There are also associations between maternal obesity and complications during
labour and the need for more induced and operative deliveries (62). As a result,
women with obesity may experience limited choices relating to where and how they
can give birth; there may be restrictions on home births, the use of a birthing pool
and also the type of pain relief that can be administered (47). More pain relief may be
required due to reduced mobility during labour; as pain relief is difficult to administer
in women with obesity, there is an increased need for general anaesthesia which is
also associated with higher risk (47). There are also complications associated with
maternal obesity after birth (64). Compared to women of recommended weight,
wound healing can be slower in women with obesity, with an increased risk of
infection (90), there is a higher likelihood that extra support will be required in
establishing breastfeeding (64, 90), and there is also an increased risk of depression
both during pregnancy (91) and following delivery (64, 91). Furthermore, due to the
increased morbidity during pregnancy and labour associated with increased maternal
weight, women with obesity are also more likely to be hospitalised and to spend
longer in hospital following pregnancy than women of recommended BMI (64, 90).
In addition to the increased health risks for both mother and infant associated with
maternal obesity, there is also a demand for additional care and resources from
health service providers (90). Although the exact cost of maternal obesity in the UK is
hard to quantify due to the absence of a national information strategy relating to the
collection of maternal obesity data in the UK (90). A qualitative study of the perceived
impact of maternal services identified by healthcare professionals caring for obese
women in the North East of England identified that healthcare professionals caring
for women in pregnancy feel that maternal obesity has major implications for service
delivery (90). This included resource and cost implications, additional care
requirements due to the complications associated with maternal obesity, restriction in
care options for the mother, difficulty carrying out certain procedures and also the
impact on the psychological wellbeing of the mother (90). Managing and minimising
the risks of these complications, therefore, has a major impact on maternity services
(79, 90, 92).
19
1.3 Gestational weight gain
This section will give an overview of the existing evidence base on GWG, including
how it is defined, the associated risks for both mother and infant and also a
discussion of current GWG guidelines.
Defining gestational weight gain
The weight a woman gains between the time of conception and the onset of labour is
known as GWG (93). GWG is a complex and unique biological phenomenon which
supports the growth and development of the fetus (94). This section will provide a
brief background on normal physiologic and metabolic changes, which take place
during pregnancy and are related to GWG in singleton pregnancies. Firstly, I will
consider the components of GWG. There are maternal, placental and fetal
components of GWG. The maternal components are made up of total body water
accretion, fat free mass, or protein accretion and fat mass accretion (94). Placental
components are made up of placental weight, placental growth, placental
development and placental composition (94). Fetal components are made up of fetal
growth including fat free mass and fat mass, and also amniotic fluid composition (94).
In general, water, protein and fat in the fetus, amniotic fluid, placenta, uterus,
mammary gland, maternal blood volume and maternal adipose tissue make up GWG
(95). The minimal amount of GWG thought to be sufficient for both fetal growth, and
maternal post-partum lactation is 8kg (17.6lbs) (95).
The total amount of weight gained in normal-term pregnancies differs from woman to
woman (94). However, some generalisations can be made about the tendencies and
patterns of GWG (94). Evidence from the USA between 1985 and 2009 suggested
that in singleton pregnancies, the mean total GWG of adult women with a
recommended weight, giving birth to term infants ranged from 10.0kg to 16.7kg.
Evidence also found that adolescents gained more weight during pregnancy
compared with adult women (means ranged from 14.6 to 18.0kg in the studies
examined) (94), and there was an inverse association between maternal BMI and
GWG; the higher the BMI, the lower the amount of GWG (94). The pattern of GWG is
generally higher in the second trimester and is related to maternal BMI (94).
However, this may differ according to maternal age and ethnicity (94).
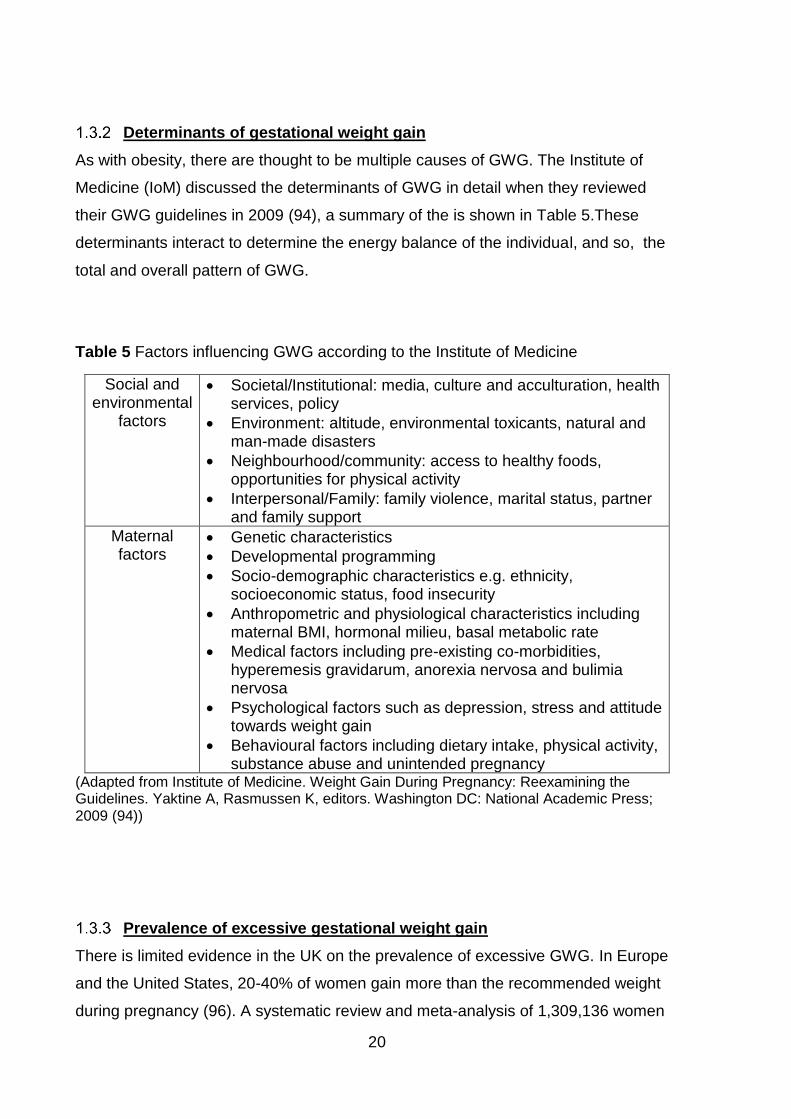
20
Determinants of gestational weight gain
As with obesity, there are thought to be multiple causes of GWG. The Institute of
Medicine (IoM) discussed the determinants of GWG in detail when they reviewed
their GWG guidelines in 2009 (94), a summary of the is shown in Table 5.These
determinants interact to determine the energy balance of the individual, and so, the
total and overall pattern of GWG.
Table 5 Factors influencing GWG according to the Institute of Medicine
Social and environmental
factors
Societal/Institutional: media, culture and acculturation, health services, policy
Environment: altitude, environmental toxicants, natural and man-made disasters
Neighbourhood/community: access to healthy foods, opportunities for physical activity
Interpersonal/Family: family violence, marital status, partner and family support
Maternal factors
Genetic characteristics
Developmental programming
Socio-demographic characteristics e.g. ethnicity, socioeconomic status, food insecurity
Anthropometric and physiological characteristics including maternal BMI, hormonal milieu, basal metabolic rate
Medical factors including pre-existing co-morbidities, hyperemesis gravidarum, anorexia nervosa and bulimia nervosa
Psychological factors such as depression, stress and attitude towards weight gain
Behavioural factors including dietary intake, physical activity, substance abuse and unintended pregnancy
(Adapted from Institute of Medicine. Weight Gain During Pregnancy: Reexamining the Guidelines. Yaktine A, Rasmussen K, editors. Washington DC: National Academic Press; 2009 (94))
Prevalence of excessive gestational weight gain
There is limited evidence in the UK on the prevalence of excessive GWG. In Europe
and the United States, 20-40% of women gain more than the recommended weight
during pregnancy (96). A systematic review and meta-analysis of 1,309,136 women
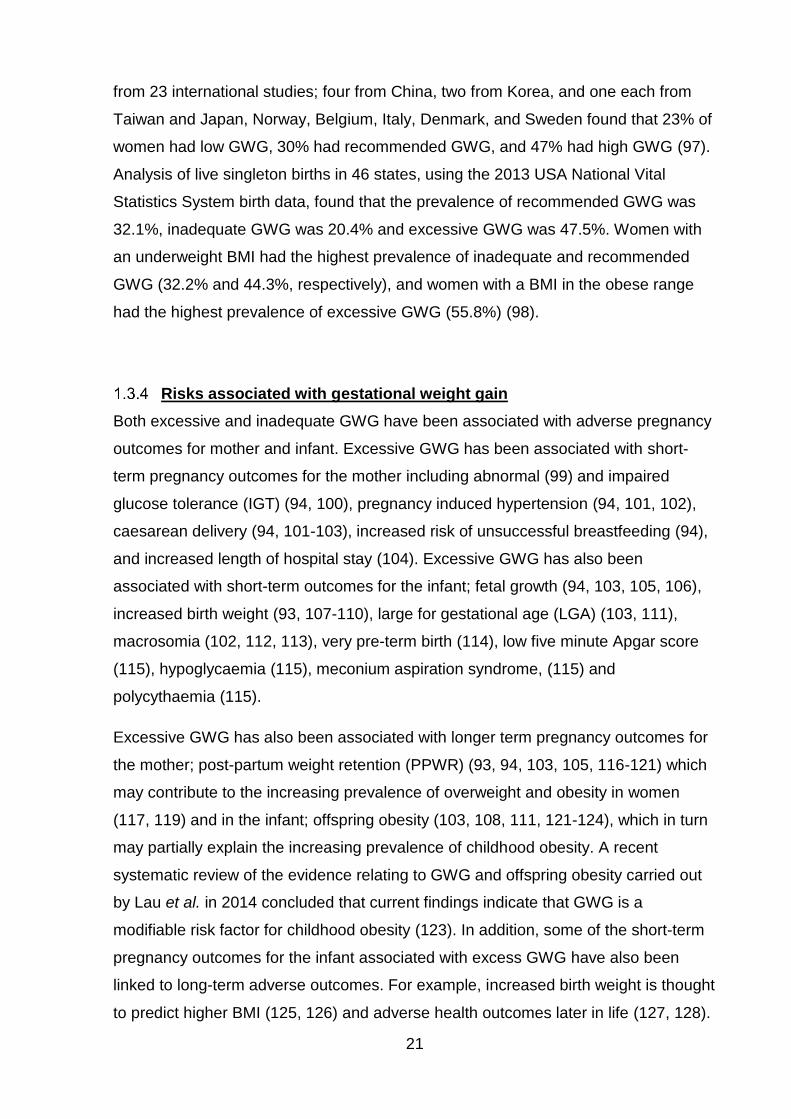
21
from 23 international studies; four from China, two from Korea, and one each from
Taiwan and Japan, Norway, Belgium, Italy, Denmark, and Sweden found that 23% of
women had low GWG, 30% had recommended GWG, and 47% had high GWG (97).
Analysis of live singleton births in 46 states, using the 2013 USA National Vital
Statistics System birth data, found that the prevalence of recommended GWG was
32.1%, inadequate GWG was 20.4% and excessive GWG was 47.5%. Women with
an underweight BMI had the highest prevalence of inadequate and recommended
GWG (32.2% and 44.3%, respectively), and women with a BMI in the obese range
had the highest prevalence of excessive GWG (55.8%) (98).
Risks associated with gestational weight gain
Both excessive and inadequate GWG have been associated with adverse pregnancy
outcomes for mother and infant. Excessive GWG has been associated with short-
term pregnancy outcomes for the mother including abnormal (99) and impaired
glucose tolerance (IGT) (94, 100), pregnancy induced hypertension (94, 101, 102),
caesarean delivery (94, 101-103), increased risk of unsuccessful breastfeeding (94),
and increased length of hospital stay (104). Excessive GWG has also been
associated with short-term outcomes for the infant; fetal growth (94, 103, 105, 106),
increased birth weight (93, 107-110), large for gestational age (LGA) (103, 111),
macrosomia (102, 112, 113), very pre-term birth (114), low five minute Apgar score
(115), hypoglycaemia (115), meconium aspiration syndrome, (115) and
polycythaemia (115).
Excessive GWG has also been associated with longer term pregnancy outcomes for
the mother; post-partum weight retention (PPWR) (93, 94, 103, 105, 116-121) which
may contribute to the increasing prevalence of overweight and obesity in women
(117, 119) and in the infant; offspring obesity (103, 108, 111, 121-124), which in turn
may partially explain the increasing prevalence of childhood obesity. A recent
systematic review of the evidence relating to GWG and offspring obesity carried out
by Lau et al. in 2014 concluded that current findings indicate that GWG is a
modifiable risk factor for childhood obesity (123). In addition, some of the short-term
pregnancy outcomes for the infant associated with excess GWG have also been
linked to long-term adverse outcomes. For example, increased birth weight is thought
to predict higher BMI (125, 126) and adverse health outcomes later in life (127, 128).
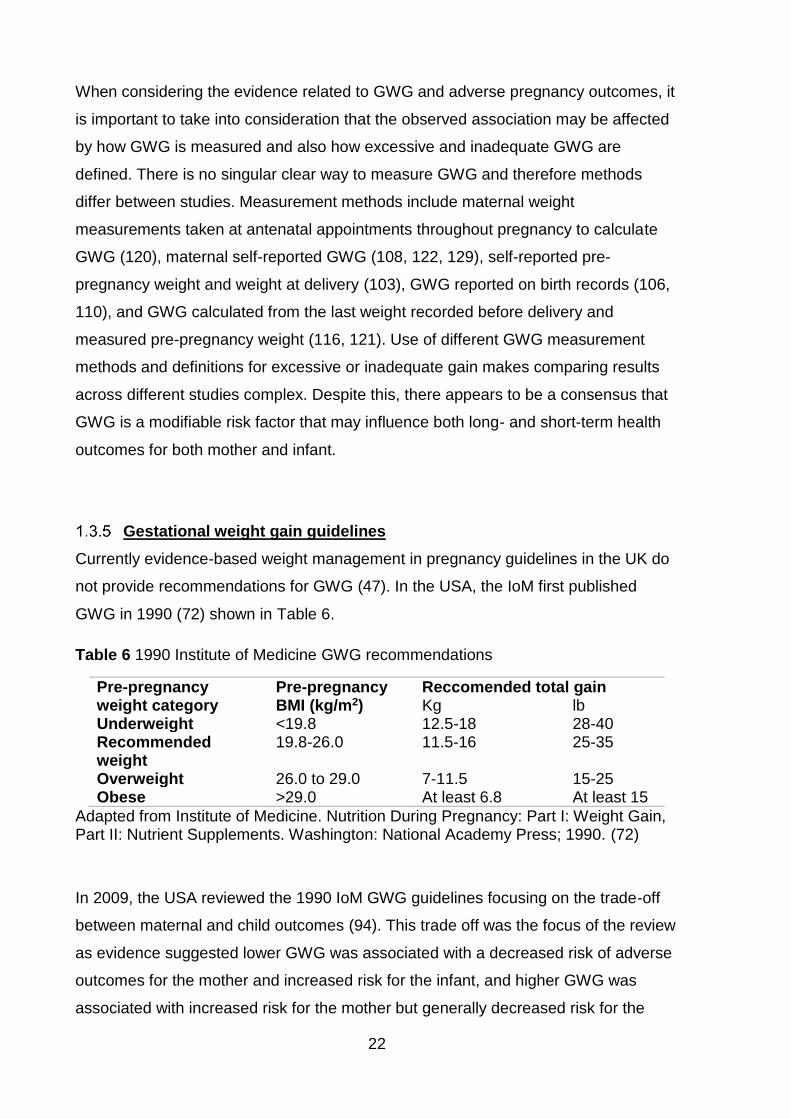
22
When considering the evidence related to GWG and adverse pregnancy outcomes, it
is important to take into consideration that the observed association may be affected
by how GWG is measured and also how excessive and inadequate GWG are
defined. There is no singular clear way to measure GWG and therefore methods
differ between studies. Measurement methods include maternal weight
measurements taken at antenatal appointments throughout pregnancy to calculate
GWG (120), maternal self-reported GWG (108, 122, 129), self-reported pre-
pregnancy weight and weight at delivery (103), GWG reported on birth records (106,
110), and GWG calculated from the last weight recorded before delivery and
measured pre-pregnancy weight (116, 121). Use of different GWG measurement
methods and definitions for excessive or inadequate gain makes comparing results
across different studies complex. Despite this, there appears to be a consensus that
GWG is a modifiable risk factor that may influence both long- and short-term health
outcomes for both mother and infant.
Gestational weight gain guidelines
Currently evidence-based weight management in pregnancy guidelines in the UK do
not provide recommendations for GWG (47). In the USA, the IoM first published
GWG in 1990 (72) shown in Table 6.
Table 6 1990 Institute of Medicine GWG recommendations
Pre-pregnancy weight category
Pre-pregnancy BMI (kg/m2)
Reccomended total gain Kg lb
Underweight <19.8 12.5-18 28-40 Recommended weight
19.8-26.0 11.5-16 25-35
Overweight 26.0 to 29.0 7-11.5 15-25 Obese >29.0 At least 6.8 At least 15
Adapted from Institute of Medicine. Nutrition During Pregnancy: Part I: Weight Gain, Part II: Nutrient Supplements. Washington: National Academy Press; 1990. (72)
In 2009, the USA reviewed the 1990 IoM GWG guidelines focusing on the trade-off
between maternal and child outcomes (94). This trade off was the focus of the review
as evidence suggested lower GWG was associated with a decreased risk of adverse
outcomes for the mother and increased risk for the infant, and higher GWG was
associated with increased risk for the mother but generally decreased risk for the
23
infant (94). The 2009 review therefore prioritised making recommendations that
minimised risk for both mother and infant (94). Outcomes considered were PPWR,
caesarean delivery, fetal size (small for gestational age (SGA) and large for
gestational age (LGA)) and childhood obesity. However, evidence was limited as all
of the studies included in the review (94) considered GWG as a categorical rather
than continuous variable, with no agreement on the definitions of the GWG groups
used (94). In addition, none of the included studies provided information on obesity in
childhood as an outcome, or provided information on the consequences of variation
among women of different ethnic subgroups (94). The 2009 review resulted in the
development of BMI specific GWG guidelines, which are independent of age, parity,
smoking history, and ethnicity based on observational evidence shown in Table 7.
Table 7 2009 Institute of Medicine GWG recommendations
Pre-pregnancy weight category
BMI (kg/m2)
Recommended range of total weight kg (lbs)
Recommended rates of weight gain in the second and third trimesters (Mean range (kg/week))
Underweight <18.5 12.5-18 (28-40) 0.51 (0.44-0.58)
Recommended weight 18.5-24.9 11.5-16 (25-35) 0.42 (0.35-0.50) Overweight 25.0-29.9 7.5-11.5 (15-25) 0.28 (0.23-0.33) Obese ≥30.0 5-9 (11-20) 0.22 (0.17-0.27)
(Adapted from Institute of Medicine. Weight Gain During Pregnancy: Re-examining the Guidelines. Yaktine A, Rasmussen K, editors. Washington DC: National Academic Press; 2009. (94))
The American College of Obstetricians and Gynaecologists Committee Opinion on
the updated IoM guidelines states that the guidelines have come under some
criticism from physicians who believe that the weight targets are too high especially
for women with a BMI≥25kg/m2, and also that they do not address concerns in
relation to PPWR (130). The guidelines also do not differentiate between the
subgroups of obesity (moderate 30-34.9kg/m2, severe 35-39.9kg/m2, morbid obesity
≥40kg/m2 and extreme obesity ≥50kg/m2) due to a lack of evidence of the short- and
long-term outcomes for both mother and infant (130). As the risks of adverse
pregnancy outcomes may differ across obesity subgroups as they do for conditions
outside of pregnancy such as diabetes, heart disease and hypertension (131), a
24
single GWG recommendation for all obesity classes may warrant some concern,
particularly in women in the highest obesity subgroups.
A systematic review and meta-analysis by Kapadia et al. in 2015 considered whether
it would be safe to recommend GWG below the 2009 IoM guidelines in obese women
(132). The review included 18 cohort studies primarily from developed countries, 13
of which were representative of an average pregnant population, five focused on low-
income populations, high risk pregnant population and in an African American
population through subscribers to a popular ethnic magazine (132). Results from the
analysis of primary outcomes showed that GWG below the 2009 IoM guidelines was
associated with increased adjusted odd ratios (AOR) of pre-term birth (<37 weeks)
and SGA (defined as a birth weight less than the 10th percentile of weight for infant
sex and gestational age at delivery) but decreased AORs of LGA (defined as a birth
weight more than the 90th percentile for infant sex and gestational age at delivery),
macrosomia (>4000 and >4500g), gestational hypertension, pre-eclampsia and
caesarean delivery (132). The review concluded that although GWG below the IoM
2009 guidelines may be beneficial for some people if individualized taking into
account their existing co-morbidities. Routine recommendation cannot be advised
without better risk prediction models to identify women who were at risk of adverse
pregnancy outcomes below the 2009 IoM GWG guidelines (132).
In the UK, NICE highlight that the 2009 IoM BMI specific GWG guidelines (94) have
not been validated by intervention studies and there is no evidence from large scale
trials (47). Therefore, although the UK weight management in pregnancy guidelines
have recently been reviewed (51), NICE have not adopted the IoM GWG guidelines.
NICE state that the lack of evidence-based GWG guidelines in the UK remains an
urgent research need, in particular considering the long term outcomes for the child
and also relating to ethnic diversity (47, 51).
1.4 The combined effect of maternal body mass index and
gestational weight gain
It is also important to consider whether there is a combined effect of BMI and GWG
on pregnancy outcomes. This information could be used in the development of BMI
25
specific GWG guidelines and potentially to inform future research which furthers
understanding of the mechanisms linking GWG and maternal BMI to adverse
pregnancy outcomes. Current evidence suggests that, in addition to the independent
effects of BMI and GWG, there is also a combined effect (67, 102, 133, 134). The
association between GWG and adverse pregnancy outcome is thought to vary by
maternal pre-pregnancy BMI, although the exact association is different for different
outcomes. Risk of adverse pregnancy outcomes including C-section and PPWR have
been found to increase with level of obesity and be amplified by excess GWG (64,
66, 135); GWG and high maternal BMI decreased the risk of growth restrictions, LGA
and low Apgar score (135).
While there is some evidence to suggest that limited or no weight gain in women with
obesity would have favourable pregnancy outcomes (134, 136), inadequate GWG
has been associated with an increased risk of infants being born SGA (93, 103, 115).
As weight loss during pregnancy is not advised (45), BMI specific GWG guidelines
may help to decrease the risk in women who are already pregnant, in order to inform
whether there is a need for the development of such guidelines. The combined effect
of maternal BMI and GWG should be investigated within UK populations.
1.5 Potential mechanisms linking maternal obesity and gestational
weight gain to adverse pregnancy outcomes
This section will consider the evidence relating to the potential mechanisms, which
link maternal obesity and GWG to adverse pregnancy outcomes. Currently, the
mechanisms by which maternal obesity and excess GWG cause adverse pregnancy
outcomes are unclear and are likely to be different for different pregnancy outcomes.
One theory suggests that rather than being a result of either maternal obesity or
GWG individually, adverse pregnancy outcomes occur due to the excess adipose
tissue (fat) and consequential insulin resistance (137). Both maternal obesity and
excess GWG are associated with a greater risk of GDM (66, 72, 94, 100, 138) which
in turn is associated with the subsequent development of type 2 diabetes (73). This
increased insulin resistance in the mother is also thought to effect fetal outcomes.
During pregnancy, insulin resistance develops in the mother in order to provide the
26
growing fetus with vital nutrients (137). It has been suggested that in mothers with
greater amounts of adipose tissue during pregnancy, either as a result of having
overweight at the start of pregnancy or through excessive GWG (or both), delivery of
nutrients to the fetus is exaggerated through further increased insulin resistance and
possible interference with maternal hormones that regulate placental nutrient
transporters (137). Greater concentrations of glucose and fatty acids cross the
placenta to the fetus as it develops (4, 139, 140) leads to increased fetal production
of insulin, and consequently, increased fetal growth (4, 110, 139). This is known as
the fetal over nutrition hypothesis (110, 140).
It is also thought that this increased fetal insulin may influence longer-term outcomes
for the infant including greater adiposity in adult life through permanent changes to
pancreatic islet cells, hypothalamus and adipose tissue in the fetus (4, 139). It is,
however, also possible that the association between maternal BMI and GWG and
offspring obesity may be explained by shared genetic and environmental exposures
between the mother and her offspring (124). However, Lawlor et al. found that, in
women with a maternal BMI in the recommended range, most of the association
between BMI and GWG and offspring obesity could be explained by shared familial
characteristics such as lifestyle and environment (124). When considering women
with a maternal BMI in either the overweight or obese categories, there was evidence
to suggest that there was a contribution from mechanisms in utero (124).
1.6 Effect of interventions on maternal obesity and gestational
weight gain
“Pregnancy is thought to be a teachable period that can have positive, long term
outcomes” (141).
Phelan suggests that the concern women have for the health of their unborn infant
can provide significant motivation in itself to promote lifestyle change (141). This idea
has led to the development of interventions in an attempt to reduce maternal obesity,
and excessive GWG. These interventions have consisted of weight management
using various types of diets, increased physical activity and behaviour modification
(142). Review evidence shows that healthy eating or physical activity interventions
27
have had moderate success in reducing excessive GWG (143); on average in 21
randomised controlled trials, 1.81kg of GWG was limited in pregnant women with
overweight and obesity compared with those not receiving intervention. Despite this,
randomised controlled trials have had little effect on pregnancy outcomes
investigated to date, including GDM, pre-eclampsia or macrosomia (142). Some of
the lack of success in these trials has been attributed to poor compliance with
protocols, and low statistical power (142). However, research suggests that pre-and
early pregnancy metabolic condition effect early gene expression and placental
function (142). Therefore, the lack of success in these interventions may also be due
to when the interventions started in pregnancy. Catalano suggests that for these
interventions to be more successful, they need to start prior to pregnancy (142). It is
also possible that the lack of effectiveness of these interventions could be high
heterogeneity between participants for example in ethnicity. It might be that
interventions tailored to target populations, for example, specific ethnic groups may
have more success than less specific interventions targeted at wider populations with
many ethnic groups.
1.7 Ethnic groups, maternal obesity and gestational weight gain
This section will discuss ethnic differences in patterns of childbirth, maternal obesity,
GWG, and evidence relating to the associated outcomes, it will then go on to discuss
the suitability of current guidelines for weight management during pregnancy in the
UK for ethnic minority groups. Globally, in 2017, the average fertility rate (births per
woman) was 2.4 children (144). However, there are different patterns of childbirth for
different countries. The highest fertility rate in 2017 was for women in Niger at 7.2
children per woman, followed by Somalia at 6.2 children per woman (144). Korea,
Puerto Rico and Hong Kong had the lowest fertility at 1.1 children per woman, this
was followed by Singapore and Moldova at 1.2 children per woman(144). Patterns of
childbirth also differ within countries by ethnicity. For example; in the USA, in 2017,
52% of births were to White women, 14% to Black women, 7% to Asian women and
23% to Hispanic women (145). While in England and Wales in 2017, 59.5% of all live
births were to women of White British ethnicity and 11.6% were born to women who
described themselves as “White Other”. “All other” ethnic groups had 11.5% of live
births, South Asian women had 8.76%, the majority of whom were Pakistani (1.49%
Bangladeshi, 3.12% Indian and 4.15% Pakistani), Black women had 4.19% of live
28
births (Black African women 3.35% and Black Caribbean 0.84%), 4.52% of live births
in England and Wales were born to women who did not specify their ethnicity (146).
Ethnic differences also exist both in the prevalence of obesity and also with regard to
obesity related illness (5). Like obesity in the general population, maternal obesity
has been associated with ethnic minority groups in the UK (59, 81, 147). Heslehurst
et al. (59) and Knight et al. (81) found that Black ethnic group was associated with
increased maternal obesity compared to White ethnic group when using the WHO
BMI criteria to diagnose weight status during pregnancy. In another study, Heslehurst
et al. (147) identified that Black and South Asian women have a higher incidence of
first trimester obesity compared to White women, and that this was most pronounced
for Pakistani women.
GWG has also been found to vary by ethnic group; the evidence available is
predominantly from the USA (148-151). Studies found that White women tended to
have higher GWG than other ethnic groups (including Black, Hispanic and Asian
(primarily East Asian populations i.e. Chinese, Japanese, Philippine)), and so White
women were less likely to have inadequate GWG and more likely to have excessive
GWG (148-151). There is also one study from Europe by Kinnunen et al. who
considered GWG in a population of 632 healthy pregnant women in Groruddalen,
Oslo, Norway (152). Findings showed that there were no ethnic differences in GWG
at 15 weeks gestation, by 28 weeks, Eastern European and Middle Eastern
European women had gained significantly more weight than their western European
counterparts had, and there was no significant difference for the other ethnic groups
(South Asian, East Asian and African). However, when considering fat mass gain,
both South and East Asian women gained significantly more than the White
European reference group, with South Asian women having the highest fat mass
gain at both 15 and 28 weeks gestation (152).
Headen et al. (153) found in a cohort study of 6,849 pregnancies in Black, Hispanic
and White mothers that both inadequate and excessive GWG (defined using the IoM
GWG recommendations (94)) differed by ethnicity. Black and Hispanic women were
observed to have an increased risk of inadequate GWG which remained significant
following adjustment for potentially confounding variables (pre-pregnancy BMI,
mother’s age at birth, parity, marital status, smoking during pregnancy, gest age of
child, and infant’s birth year). This finding has also been observed for Black and
29
Hispanic women who were also found to have an increased risk of excessive GWG
compared to White women. However, the association was no longer significant when
analysis adjusted for confounding variables. Current evidence on GWG and ethnicity
primarily considers Black and Hispanic ethnic groups; there is very little evidence
which considers GWG, and whether GWG is affected by maternal BMI in Asian
populations in particular those which reflect ethnic groups in the UK.
In addition to the difference in incidence of obesity, both the independent and
combined effects of maternal pre-pregnancy BMI and GWG on adverse pregnancy
outcome are also thought to differ by ethnic group (153). Research in the USA has
identified disparities in obstetric risk among African American and Hispanic women
(154-157). Compared to White women with obesity, Hispanic women with obesity
have been found to have an increased rate of GDM (155, 156), macrosomia (155),
pre-eclampsia (156) and C-section (155, 157). African American women also had
increased rates of C-section (155-157), and were the ethnic group most likely to have
adverse pregnancy outcomes overall compared to White women (154).
Outside pregnancy, people of Asain origin have been found to have a particularly
increased risk of obesity related comorbidites when compared to the White
population. For example, a review of the international evidence relating to obesity in
Asian populations found that people of Asian origin had an increased cardiometabolic
risk and all-cause mortality at a lower BMI compared with White populations (158).
However, this conclusion was limited by the use of varying definitions for different
ethnic groups. Since the review was published in 2009, further evidence has
associated the increased risk in Asian populations with a greater total fat mass,
which leads to more rapid and earlier accumulation of fat in the key organs linked to
diabetes (such as muscle and the liver), and a lesser ability to metabolise fat versus
carbohydrates which may increase their susceptibility to associated morbidities (159).
Maternal pre-pregnancy BMI has been found to have a significantly greater effect on
insulin resistance among Asian women compared with White women (155, 160, 161).
Results of another study carried out by Shen et al. (154) showed that insulin
sensitivity in Asian women with a pre-pregnancy BMI of 23kg/m2 was comparable to
that of a White woman with a BMI of 30kg/m2 (154). These finding suggest that
these Asian women were at a higher risk of insulin sensitivity at a lower BMI than
their White counterparts during pregnancy (154). As this was a cross-sectional study,
30
and the sample size was relatively small (n=116 White, n=28 Asian), the results
should be interpreted with caution. However, current evidence suggests that ethnicity
may modulate the effects of obesity on insulin resistance during pregnancy.
Ethnicity and socioeconomic status
While biological mechanisms are thought to account for some of the observed
association between maternal BMI, GWG and increased adverse pregnancy
outcomes in ethnic minority groups, there may also be some influence from the
interaction between SES and ethnicity. The association between ethnicity and both
obesity in the general population and also with maternal obesity is complicated by the
interrelationship between ethnicity and socioeconomic group. It has been identified
that health status varies by ethnicity, and also by SES (162). Maternal obesity is no
exception, and has been found to be associated with both ethnic minority groups and
socioeconomic deprivation in the UK (58, 59). The association shows higher levels of
maternal obesity in the most deprived socioeconomic groups (using the 2007 IMD
classification system) and also in ethnic minority groups (59). In the UK, ethnic
minority groups are usually among the most deprived social groups (27), although
the degree to which SES and ethnicity are confounded is dependent on the measure
of SES used (162). Investigations into whether disparities in health status are due to
either “ethnicity and social class”, or “ethnicity or social class” are complicated by this
overlap between ethnicity and SES (162).
Suitability of guidelines for ethnic minority groups in the UK
If the risk of adverse pregnancy outcomes related to obesity does indeed differ by
ethnicity, using the WHO BMI categories for the general population may not be
suitable in pregnancy or for all ethnic groups. In particular, they were not suitable for
Asians who are thought to have an increased susceptibility to the metabolic effects of
adiposity when compared with European Whites of a similar BMI (43, 45). The WHO
has defined Asian-specific BMI classification criteria for the non-pregnant population
to determine weight-related risk (43) which are lower than those for the general
population (3) (Table 8). The difference between the two classification categories
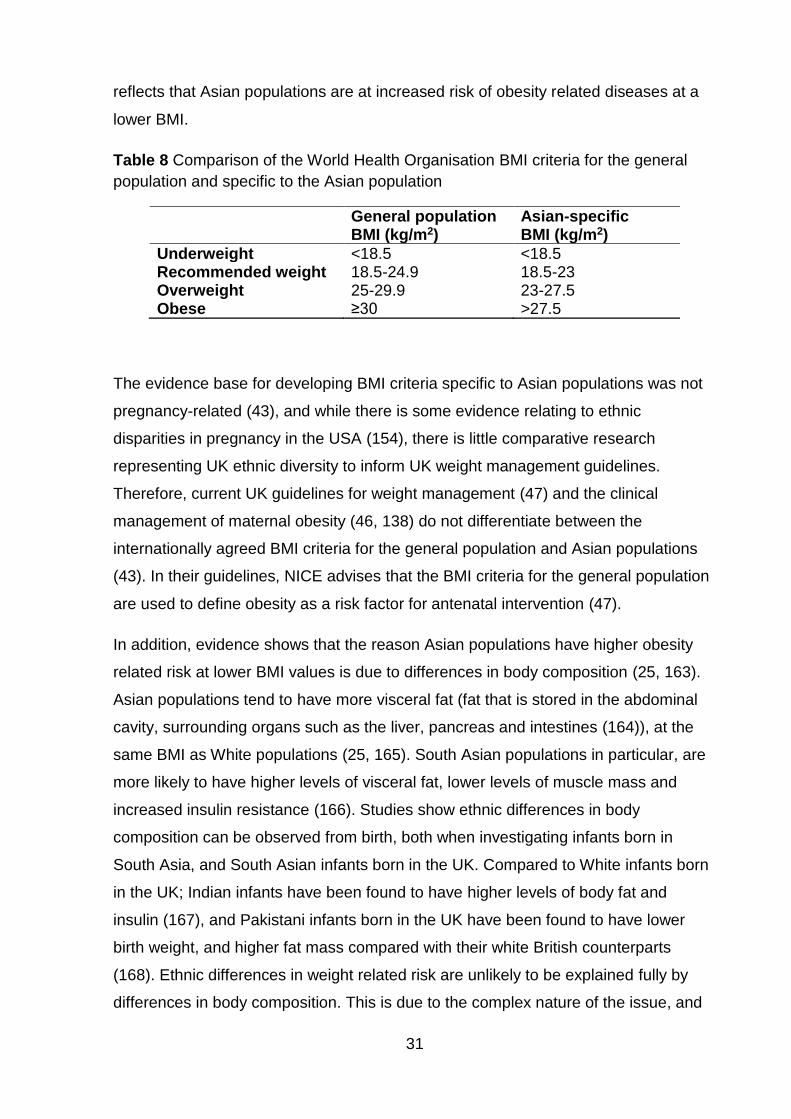
31
reflects that Asian populations are at increased risk of obesity related diseases at a
lower BMI.
Table 8 Comparison of the World Health Organisation BMI criteria for the general
population and specific to the Asian population
General population BMI (kg/m2)
Asian-specific BMI (kg/m2)
Underweight <18.5 <18.5 Recommended weight 18.5-24.9 18.5-23 Overweight 25-29.9 23-27.5 Obese ≥30 >27.5
The evidence base for developing BMI criteria specific to Asian populations was not
pregnancy-related (43), and while there is some evidence relating to ethnic
disparities in pregnancy in the USA (154), there is little comparative research
representing UK ethnic diversity to inform UK weight management guidelines.
Therefore, current UK guidelines for weight management (47) and the clinical
management of maternal obesity (46, 138) do not differentiate between the
internationally agreed BMI criteria for the general population and Asian populations
(43). In their guidelines, NICE advises that the BMI criteria for the general population
are used to define obesity as a risk factor for antenatal intervention (47).
In addition, evidence shows that the reason Asian populations have higher obesity
related risk at lower BMI values is due to differences in body composition (25, 163).
Asian populations tend to have more visceral fat (fat that is stored in the abdominal
cavity, surrounding organs such as the liver, pancreas and intestines (164)), at the
same BMI as White populations (25, 165). South Asian populations in particular, are
more likely to have higher levels of visceral fat, lower levels of muscle mass and
increased insulin resistance (166). Studies show ethnic differences in body
composition can be observed from birth, both when investigating infants born in
South Asia, and South Asian infants born in the UK. Compared to White infants born
in the UK; Indian infants have been found to have higher levels of body fat and
insulin (167), and Pakistani infants born in the UK have been found to have lower
birth weight, and higher fat mass compared with their white British counterparts
(168). Ethnic differences in weight related risk are unlikely to be explained fully by
differences in body composition. This is due to the complex nature of the issue, and
32
the number of different risk factors involved (for example genetics, life history (e.g.
growth), proteomics, behaviour, physiology, education, physical environment, values
and beliefs) (25). However, body composition is a valuable measure that reflects a
number of these factors including genetics and proteomics along with behavioural
and environmental factors (25).
Guidelines, which include recommendations based on lean and fat mass distribution
in addition to the relevant BMI cut offs for specific ethnic groups, may be
advantageous, and allow better prediction of weight related risk in pregnancy in
different ethnic groups. Such guidelines would need to include measures which
better reflect body composition. These would include measures of maternal
anthropometrics (MA) such as; waist to hip ratio, and anthropometric measures such
as tricep skinfold thickness (SFT), subscapular SFT, mid upper arm circumference,
and thigh circumference, along with the gestational change in these anthropometric
measurements; gestational anthropometric change (GAC).
1.8 Rationale
Variations in obesity related risk by ethnicity and SES lead to health inequalities (26).
These health inequalities also apply to maternal obesity and GWG making them
significant public health issues in the UK. Attempts to rectify ethnicity-related health
inequalities should begin with an accurate account of epidemiology (157). Asians are
the second largest ethnic group in the UK (7.5% of the population) after White ethnic
group (86.0% of the population). Within the Asian population, the majority are South
Asian; Indian (2.5%), Pakistani (2.0%) and Bangladeshi (0.8%) (169, 170). Recent
data from England and Wales show that the largest proportion of live births to a
minority ethnic group were to women of South Asian ethnicity 8.76%, the majority of
whom were Pakistani (1.49% Bangladeshi, 3.12% Indian and 4.15% Pakistani) (146).
In addition, 28.4% of live births were to women who were born outside the UK In the
England and Wales (146). Pakistan and Poland are the most common countries of
birth for women born outside the UK (2.5% and 3.1% of all live births, respectively in
2017), with other South Asian born women contributing 3.2% of all live births (Indian
women 2.0% and Bangladeshi women 1.1%). Therefore, South Asians make up a
large percentage of those accessing maternity services in some areas (147) and
inefficient care for such ethnic minority groups may widen the gap in health
33
inequalities (147). National data from England shows that the incidence of maternal
obesity in South Asian populations doubles when using ethnic group specific BMI
criteria (147). Therefore, a large proportion of South Asian women are potentially
being wrongly assigned to low risk care using current UK guidelines (147).
Additional evidence from a UK study carried out by Bryant et al. (171), using data on
8478 women from the Born in Bradford (BiB) project, shows that the prevalence of
maternal obesity in a Pakistani population rose from 18.8% when using the WHO
BMI criteria for the general population to 30.9% when the WHO Asian specific BMI
criteria were applied (171). Although this study found that the prevalence of maternal
obesity increased, application of the Asian specific BMI threshold was not found to
increase the predictive ability of those at risk of adverse pregnancy outcomes related
to obesity: caesarean section, hypertensive disorders of pregnancy (HDP),
macrosomia, GDM and pre-term births (171). The results of this study apply only to
maternal pre-pregnancy BMI and therefore do not take into account GWG and the
risk associated with it, or the combined effect of BMI and GWG on pregnancy
outcomes. In addition, the study did not consider long-term pregnancy outcomes
such as obesity in the offspring and PPWR for the mother. These outcomes may
influence future obesity prevalence and be of particular public health importance in
Asian populations, such as the Pakistani population, who are thought to have an
increased susceptibility to the metabolic effects of adiposity when compared with
European Whites of a similar BMI (43, 45).Research which furthers understanding of
both the short- and long-term outcomes, associated with MA and excessive GAC in
at risk populations could be used to inform the development of guidelines to improve
risk management and clinical care. Evidence shows that managing and minimising
risks associated with maternal obesity and excessive GWG has a major impact on
maternity services (70, 79, 90, 92), and may play a role in minimising future obesity
risk for both mother and infant. Epidemiological evidence has indicated that
exposures in early life are important for obesity development and later health but
there are gaps in the knowledge regarding the impact of factors during pregnancy
and early life, particularly in South Asian children (172). Further population-based,
epidemiological research is therefore required to identify relationships between UK
ethnic groups, MA, GAC, and the short- and long-term outcomes of pregnancy for the
34
mother and the child to ensure the best quality of care is provided for women
irrespective of their ethnicity.
1.9 Aim
The aim of my PhD was to investigate the relationship between UK ethnic groups
(White and South Asian), maternal anthropometrics (MA), gestational anthropometric
change (GAC), and short- and long-term pregnancy outcomes for mother and child.
1.10 Objectives
1. To develop a conceptual model of the association between maternal ethnicity,
maternal anthropometrics (MA), gestational anthropometric change (GAC),,
and the development of short- and long-term health outcomes for women and
their offspring using the existing evidence base and systematic review
methodology.
2. To use this conceptual model to inform the selection of both short- and long-
term pregnancy outcomes to be investigated in this project.
3. To carry out an analysis of the association between pregnancy outcomes
(maternal and child) and maternal body mass index (BMI) among White and
Pakistani women using data from the Born in Bradford (BiB) cohort.
4. To carry out an analysis of the association between pregnancy outcomes
(maternal and child) and gestational weight gain (GWG) among White and
Pakistani women using data from the BiB cohort.
5. To carry out an analysis of the combined effect of maternal body mass index
(BMI) and gestational weight gain (GWG) on pregnancy outcomes (maternal
and child) among White and Pakistan women using data from the Born in
Bradford (BiB) cohort.

35
6. To investigate the impacts of direct and indirect risk factors for gestational
weight gain (GWG) using Structural Equation Modelling.
36
Chapter 2. Methodology
This chapter discusses the methodological approach used for my PhD research
(individual methods are described in Chapter 3, Section 3.4 pgs.46-53; Chapter 4,
Section 4.4, pgs.117-127; Chapter 5, Section 5.4, pgs.176-177; and Chapter 6, all
sections, pgs.183-208) how this process has informed the study design used, and
the need for a mixed methods approach.
2.1 Structural equation modelling3
SEM refers not to a single statistical technique, but to a family of related procedures
(173). Other terms which are also used interchangeably in the literature are
“covariance structure analysis”, “covariance structure modelling” and “analysis of
covariance structures” (173). Another term which has also been associated with SEM
is “causal modelling”, however, this is a dated expression as the results of SEM
cannot generally be used as evidence of a causal association (173). Figure 2 gives
an overview of the SEM process (174).
3The term SEM will be used but this also refers to path analysis, which uses the same process as SEM, but does not include latent variables. For more information on SEM, please see Section 6.2.3 in Chapter 6, pgs.196-199).
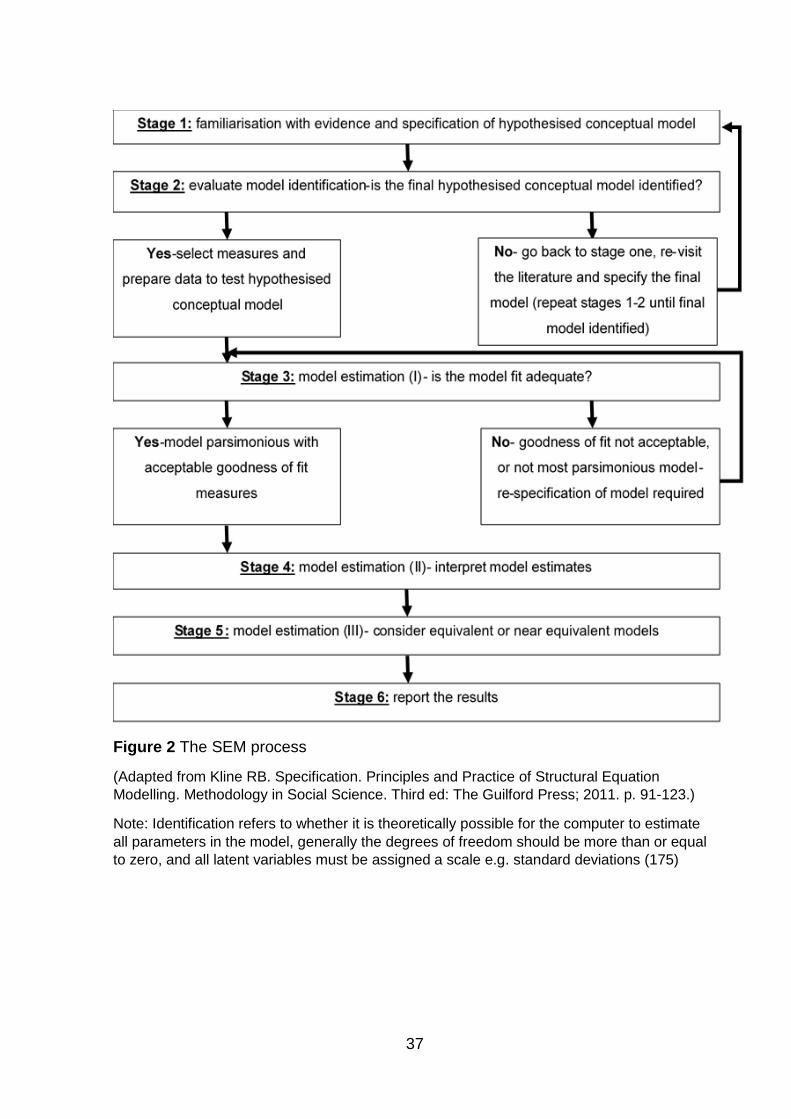
37
Figure 2 The SEM process
(Adapted from Kline RB. Specification. Principles and Practice of Structural Equation
Modelling. Methodology in Social Science. Third ed: The Guilford Press; 2011. p. 91-123.)
Note: Identification refers to whether it is theoretically possible for the computer to estimate
all parameters in the model, generally the degrees of freedom should be more than or equal
to zero, and all latent variables must be assigned a scale e.g. standard deviations (175)
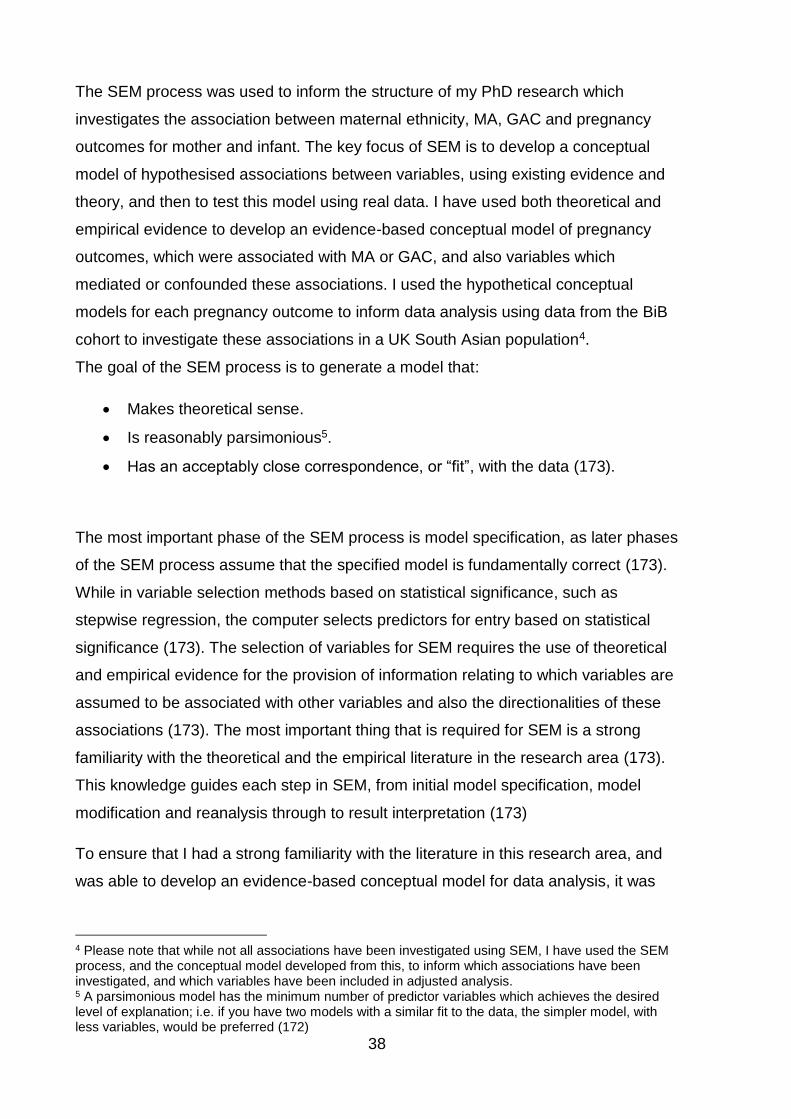
38
The SEM process was used to inform the structure of my PhD research which
investigates the association between maternal ethnicity, MA, GAC and pregnancy
outcomes for mother and infant. The key focus of SEM is to develop a conceptual
model of hypothesised associations between variables, using existing evidence and
theory, and then to test this model using real data. I have used both theoretical and
empirical evidence to develop an evidence-based conceptual model of pregnancy
outcomes, which were associated with MA or GAC, and also variables which
mediated or confounded these associations. I used the hypothetical conceptual
models for each pregnancy outcome to inform data analysis using data from the BiB
cohort to investigate these associations in a UK South Asian population4.
The goal of the SEM process is to generate a model that:
Makes theoretical sense.
Is reasonably parsimonious5.
Has an acceptably close correspondence, or “fit”, with the data (173).
The most important phase of the SEM process is model specification, as later phases
of the SEM process assume that the specified model is fundamentally correct (173).
While in variable selection methods based on statistical significance, such as
stepwise regression, the computer selects predictors for entry based on statistical
significance (173). The selection of variables for SEM requires the use of theoretical
and empirical evidence for the provision of information relating to which variables are
assumed to be associated with other variables and also the directionalities of these
associations (173). The most important thing that is required for SEM is a strong
familiarity with the theoretical and the empirical literature in the research area (173).
This knowledge guides each step in SEM, from initial model specification, model
modification and reanalysis through to result interpretation (173)
To ensure that I had a strong familiarity with the literature in this research area, and
was able to develop an evidence-based conceptual model for data analysis, it was
4 Please note that while not all associations have been investigated using SEM, I have used the SEM process, and the conceptual model developed from this, to inform which associations have been investigated, and which variables have been included in adjusted analysis. 5 A parsimonious model has the minimum number of predictor variables which achieves the desired level of explanation; i.e. if you have two models with a similar fit to the data, the simpler model, with less variables, would be preferred (172)
39
necessary for a mixed methods approach to be used. There was no review evidence
which considers the association between MA, GAC and specific pregnancy outcomes
in South Asian women that I could use or update to develop a relevant, evidence-
based conceptual model.
2.2 Mixed methods
“Mixed methods research means adopting a research strategy employing more than
one type of research method. The methods may be a mix of qualitative and
quantitative methods, a mix of quantitative methods or a mix of qualitative methods”
(176).
There are multiple reasons to choose a mixed-methods (or multimethod (177))
approach, described in detail by Green, Caraceli and Graham (178) and Bryman
(179). A summary of these reasons is given in Table 9. This PhD has included both
quantitative and qualitative research to provide a comprehensive account and
richness in detail to inform the development of a conceptual model. The reasons for
choosing mixed methods that are particularly important for this PhD are highlighted in
grey in Table 9.
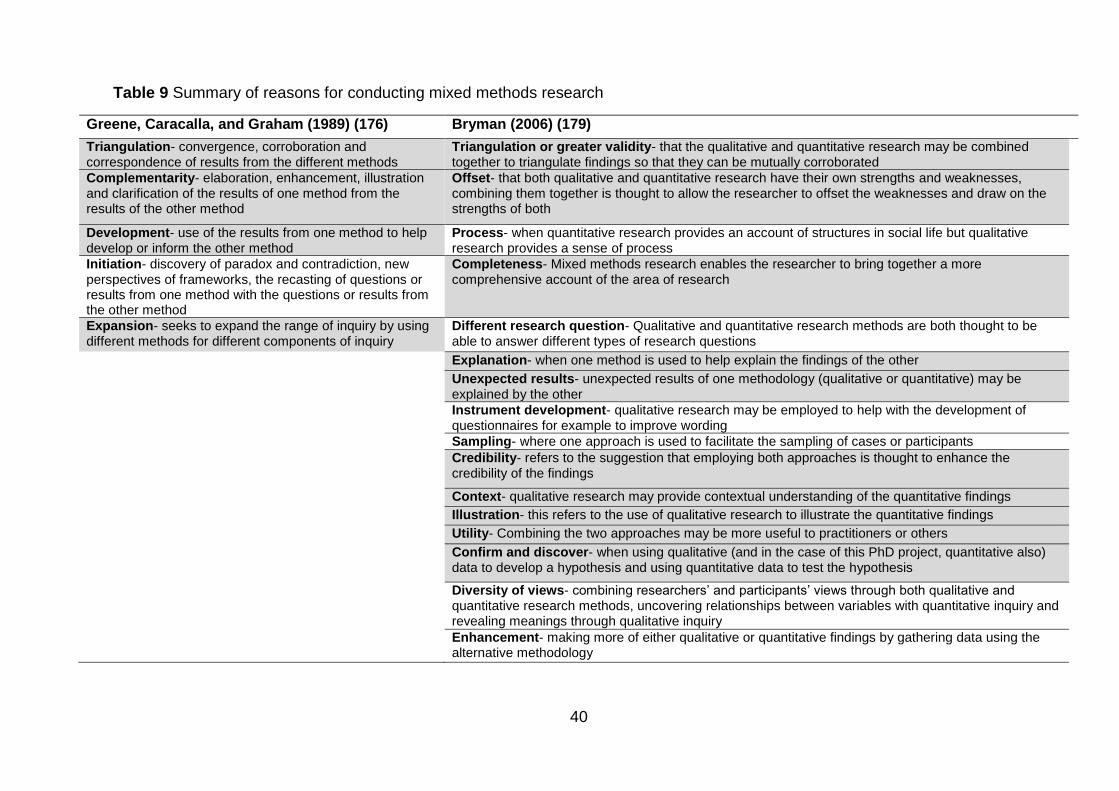
40
Table 9 Summary of reasons for conducting mixed methods research
Greene, Caracalla, and Graham (1989) (176) Bryman (2006) (179)
Triangulation- convergence, corroboration and correspondence of results from the different methods
Triangulation or greater validity- that the qualitative and quantitative research may be combined together to triangulate findings so that they can be mutually corroborated
Complementarity- elaboration, enhancement, illustration and clarification of the results of one method from the results of the other method
Offset- that both qualitative and quantitative research have their own strengths and weaknesses, combining them together is thought to allow the researcher to offset the weaknesses and draw on the strengths of both
Development- use of the results from one method to help develop or inform the other method
Process- when quantitative research provides an account of structures in social life but qualitative research provides a sense of process
Initiation- discovery of paradox and contradiction, new perspectives of frameworks, the recasting of questions or results from one method with the questions or results from the other method
Completeness- Mixed methods research enables the researcher to bring together a more comprehensive account of the area of research
Expansion- seeks to expand the range of inquiry by using different methods for different components of inquiry
Different research question- Qualitative and quantitative research methods are both thought to be able to answer different types of research questions
Explanation- when one method is used to help explain the findings of the other
Unexpected results- unexpected results of one methodology (qualitative or quantitative) may be explained by the other
Instrument development- qualitative research may be employed to help with the development of questionnaires for example to improve wording
Sampling- where one approach is used to facilitate the sampling of cases or participants
Credibility- refers to the suggestion that employing both approaches is thought to enhance the credibility of the findings
Context- qualitative research may provide contextual understanding of the quantitative findings
Illustration- this refers to the use of qualitative research to illustrate the quantitative findings
Utility- Combining the two approaches may be more useful to practitioners or others
Confirm and discover- when using qualitative (and in the case of this PhD project, quantitative also) data to develop a hypothesis and using quantitative data to test the hypothesis
Diversity of views- combining researchers’ and participants’ views through both qualitative and quantitative research methods, uncovering relationships between variables with quantitative inquiry and revealing meanings through qualitative inquiry
Enhancement- making more of either qualitative or quantitative findings by gathering data using the alternative methodology
41
Mixed methods designs can either be simultaneous or sequential in arrangement
(177). Simultaneous designs are where both types of methods are applied at the
same time, and sequential designs are where one method is followed by another
(177). This PhD utilises a sequential design to fulfil all stages of the SEM process,
focusing on the importance of conceptual model development and specification. The
sequential design consists of the following phases (relating back to Figure 2, pg.37;
phases 1-3 of this thesis make up Stage 1 and phase 4 makes up stages 2-6).
Phase 1: Systematic review
A quantitative systematic review relating to associations between MA, GAC and
short- and long-term maternal and infant outcomes in migrant and descendant South
Asian women was carried out (Chapter 3). This identified evidence to support
inclusion or exclusion of pregnancy outcomes in the conceptual model.
Phase 2: Mixed research synthesis
Systematic reviews aim to provide a high-level comprehensive overview of primary
research relating to a particular research question through the identification,
evaluation and summarisation of all relevant research (180-182). However, they often
conclude that not enough good quality evidence is available to answer the research
question, or to inform policy and practice (182). In addition, Dixon-Woods et al.
suggest that excluding any type of evidence based on the grounds of its methodology
could have potentially important implications (183). For example, a preoccupation
with methodology may divert attention away from understanding the nature and
content of research findings, and the fact that methodologically diverse primary
studies may yield similar findings (184). Mixed-methods systematic reviews (which
include both quantitative and qualitative evidence), also known as mixed research
syntheses, attempt to increase significance and relevance (182, 185). This is done by
maximising findings, and the ability of these findings to inform policy and practice
through the inclusion and integration of evidence from different types of research
(182, 185).
While the Phase 1 systematic review (Chapter 3) identified associations between MA,
GAC and pregnancy outcomes, it did not identify variables that influenced these
42
associations (i.e. mediating and confounding variables) in Pakistani women.
Therefore, a mixed methods framework-based synthesis was also carried out to
synthesize variables that may influence the associations, i.e. confounding and
mediating variables, between MA, GAC and pregnancy outcomes in Pakistani
women. Qualitative evidence was included in addition to quantitative evidence to
ensure exploration of potentially mediating and confounding variables relating to
women’s individual feelings, thoughts and experiences.
Phase 3: Validation study
Using any form of systematic review requires research to have been carried out,
evidence to have been published and available for inclusion in the synthesis. In
under-researched fields, this can be problematic and key factors could be missed.
The model specification and modification was driven by existing evidence and theory.
In order to limit the effect this had on the model, I consulted with experts in the field
at the BiB project about whether:
1. They agreed with the variables that had been identified through phases 1 and 2.
2. There were any other variables that they thought were relevant and should be
included.
Phase 4: Secondary data analysis of prospective cohort
The final phase was to use data from the BiB cohort to investigate the conceptual
model using data for White and Pakistani women. Analysis aimed to investigate
ethnic differences in the following associations:
MA and pregnancy outcomes.
GAC and pregnancy outcomes.
Combined effect of MA and GAC on pregnancy outcomes.
It also aimed to investigate how the application of WHO Asian specific BMI cut offs
influenced these associations, compared with application of WHO cut offs for the
general population and finally to investigate the contribution of mediating and
confounding variables in the association between MA and GAC using SEM.
Information on the BiB cohort is given in Appendix 1 (pgs.306-319).
43
Evidence from the two systematic reviews, and validation study was used to identify
variables for inclusion in the conceptual model including: all possible associations
between exposures of interest and pregnancy outcomes; and evidence of
confounding or mediating variables. Evidence of associations were included in the
conceptual model (irrespective of the strength or consistency of the evidence
supporting them). Associations within the model were only removed if not supported
by the data from the BiB cohort.
44
Chapter 3. Systematic review of the effects of maternal pre-
/early pregnancy anthropometrics and anthropometric
change during pregnancy on short- and long-term
pregnancy outcomes in South Asian women (Phase 1)
This chapter is a systematic review of the effects of MA and GAC on short- and long-
term pregnancy outcomes in South Asian women. An update of this systematic
review has been published in Obesity reviews (186).
3.1 Introduction
Although existing reviews consider the association between maternal BMI and
pregnancy outcomes (187), GWG and pregnancy outcomes within the 2009 IoM
GWG guidelines (94), and also of the evidence of adverse outcomes according to the
IoM guidelines (105); none of this review evidence related specifically to South Asian
women, or considered different measures of body composition other than BMI and
weight (kg). This chapter describes the rationale and process of conducting a
systematic review to identify pregnancy outcomes associated with MA and GAC
during pregnancy in migrant6 and descendant South Asian women.
Outcomes considered in the development of the IoM GWG recommendations were:
PPWR, caesarean delivery, fetal size (SGA and LGA) and childhood obesity (Figure
3).
6 The term migrant is defined as “a person who moves from one country to another to live there on a permanent or semi-permanent basis” (186).
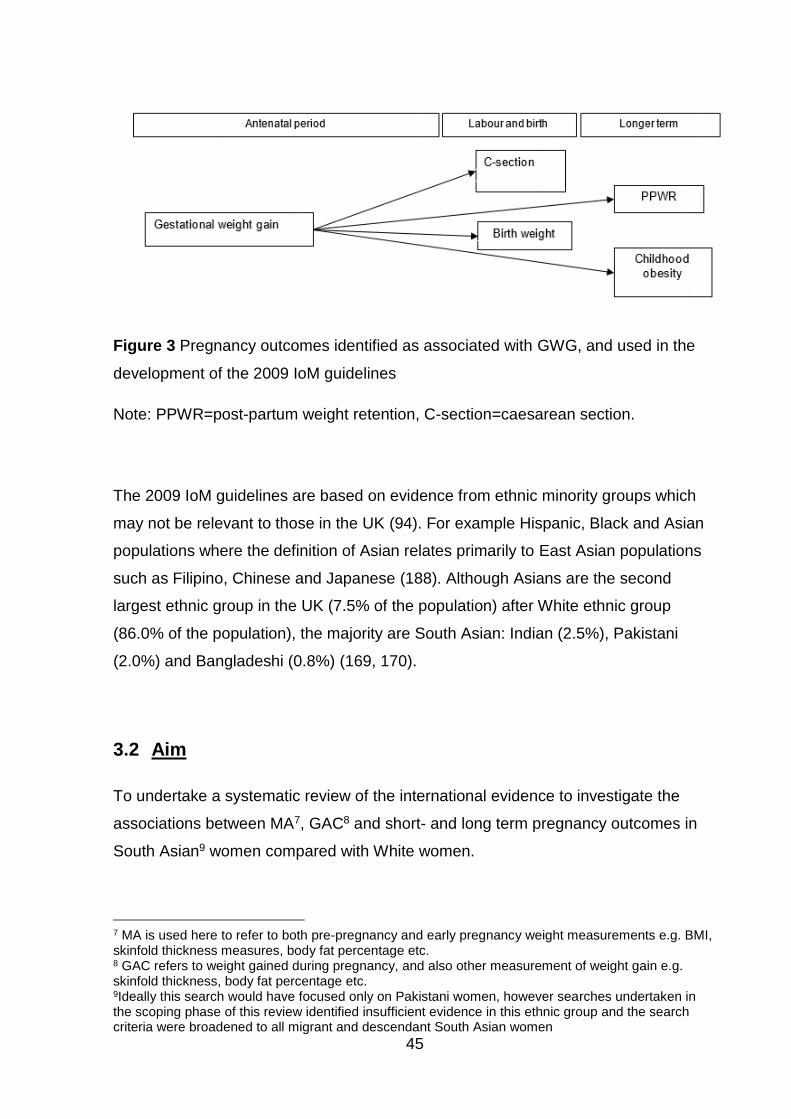
45
Figure 3 Pregnancy outcomes identified as associated with GWG, and used in the
development of the 2009 IoM guidelines
Note: PPWR=post-partum weight retention, C-section=caesarean section.
The 2009 IoM guidelines are based on evidence from ethnic minority groups which
may not be relevant to those in the UK (94). For example Hispanic, Black and Asian
populations where the definition of Asian relates primarily to East Asian populations
such as Filipino, Chinese and Japanese (188). Although Asians are the second
largest ethnic group in the UK (7.5% of the population) after White ethnic group
(86.0% of the population), the majority are South Asian: Indian (2.5%), Pakistani
(2.0%) and Bangladeshi (0.8%) (169, 170).
3.2 Aim
To undertake a systematic review of the international evidence to investigate the
associations between MA7, GAC8 and short- and long term pregnancy outcomes in
South Asian9 women compared with White women.
7 MA is used here to refer to both pre-pregnancy and early pregnancy weight measurements e.g. BMI, skinfold thickness measures, body fat percentage etc. 8 GAC refers to weight gained during pregnancy, and also other measurement of weight gain e.g. skinfold thickness, body fat percentage etc. 9Ideally this search would have focused only on Pakistani women, however searches undertaken in the scoping phase of this review identified insufficient evidence in this ethnic group and the search criteria were broadened to all migrant and descendant South Asian women
46
3.3 Objectives
To systematically identify and synthesise the current evidence base relating to
MA and GAC among South Asian women compared with White women.
To identify associations between MA and short-term pregnancy outcomes for
the mother and offspring.
To identify associations between MA and long-term pregnancy outcomes for
the mother and offspring.
To identify associations between GAC and short-term pregnancy outcomes for
the mother and offspring.
To identify associations between GAC and long-term pregnancy outcomes for
the mother and offspring.
To identify the combined effect of MA and GAC on short- and long-term
pregnancy outcomes for the mother and offspring.
To use the results of this systematic review to contribute to the development of
the conceptual model.
3.4 Methods
Inclusion and exclusion criteria
Inclusion criteria:
o Peer reviewed, full published studies (i.e. not editorials, abstracts, position
pieces, research letters or posters).
o Studies on humans.
o Any study date.
o Studies involving observational quantitative research methods; cross
sectional, case control and cohort study designs.
o Published in the English language (however, any studies identified in the
search strategy published in languages other than English have been
recorded).
o Published results for migrant and descendant South Asian women and White
women.
47
o Studies considering:
Any measure of MA and pregnancy outcomes
And/ or
Any measure of GAC and pregnancy outcomes.
Exclusion criteria:
o Includes only women using assisted reproductive techniques as these
pregnancies may have a different risk profile, for example assisted
reproductive techniques have been associated with both short-term adverse
pregnancy outcomes such as gestational hypertension and pre-term birth,
and also longer term adverse outcomes such as increased risk of childhood
illness (189).
o Only presents results for multiple pregnancies as these may also have a
different risk profile, for example a higher risk of low birth weight (190).
Definitions of included ethnic groups
The inclusion criteria were broadened to include all migrant and descendant South
Asian women, rather than Pakistani women only, because during the development of
the search strategy, searches carried out during the scoping phase of this review
identified limited papers relating to the systematic review topic and migrant and
descendant Pakistani women. For the purposes of this systematic review, the Asian
population was defined as South Asian in accordance with the definition used in the
2013 NICE guidelines (191) and include people who are:
“immigrants and descendants from Bangladesh, Bhutan, India, Indian-Caribbean
(migrants of South Asian family origin), Maldives, Nepal, Pakistan and Sri Lanka”
(192).
Studies were also included if they were carried out in the UK and referred to an Asian
population. This was decided, as in the UK, the term Asian is used to refer to people
with ancestry in the Indian subcontinent whereas in other countries the meaning is
much broader, particularly in the USA where the term Asian is mainly used to
describe East Asian populations e.g. Chinese, Japanese and Filipino (188). The
restriction to South Asian populations is due to the fact that the evidence synthesis
48
from this systematic review was to be used to inform the development of a
conceptual model of MA, GAC and pregnancy outcomes among Pakistani women
living in the UK.
White ethnic groups considered were those referring to White women e.g. White
European, Caucasian, or White British women. In studies which reported UK data
and more than one White or European ethnic group, the data for White British were
included in this systematic review.
Searches
Searches were carried out using keywords developed with advice from an
information specialist in accordance with the PICOS framework (Table 10) (193).
PICOS refers to the patient, population or disease being addressed; the interventions
or exposure; the comparator group; the outcome or endpoint; and the study design to
be included (193). PICOS framework was used to give structure to search term
development, and ensure no aspect of the search was left out. Scoping searches
were carried out using the terms in Table 10 to inform the development of a final
search strategy for each database searched. All final search strategies are given in
Appendix 2 (pgs.320-328).
49
Table 10 Search term development using PICOS
P: Patient, population or
disease being addressed
I: Intervention
or exposure
C: Comparator group
O: Outcome/ endpoint
S: Study
design
AND
OR
Ethnic group terms:
Ethnicity
Race
Racial
Asian
Pakistan
Bangladesh
Sri Lanka
Nepal
Bhutan
Maldives
India
Migrant
Immigration
Acculturation
Black and minority ethnic groups
Pregnancy terms:
Pregnancy
Maternal
Gravidity
Mother
Parent
Obesity
Body composition
BMI
Body mass index
Weight gain
Weight
Fat
Adiposity
Fatness
Waist circumference
W:H ratio
Waist to hip ratio
Waist-hip ratio
South Asian women must be compared to White women
Will not be restricted to specific pregnancy outcomes
Observational
studies only
Note: PICOS stands for patient, population or disease being addressed; the interventions or exposure; the comparator group; the outcome or endpoint; and the study design to be included (193)
Systematic reviews of epidemiological studies require comprehensive search
strategies to supplement database searching. This is due to the limited ability of
database searches alone to systematically identify the body of relevant
observational research (194). The search strategy for this review was designed to
maximise the identification of relevant epidemiological studies.
Electronic databases were searched between 1st December 2015 and 31st July
2016 using keywords. Search terms and subject headings were converted into the
relevant format for twelve databases: MEDLINE (Fig.1), Embase, Scopus, PsychInfo,
British Nursing Index (BNI) and Cumulative Index to Nursing and Allied Health
Literature (CINAHL), AMED (Allied and Complementary Medicine), Joanna Briggs
Institute database, PROSPERO, CRD database (DARE), Cochrane database of
systematic reviews and the federated search engine Epistemonikos which provides
access to systematic reviews, and primary articles included in these reviews (all
searches other than MEDLINE given in Appendix 2; pgs. 320-328). The reference
lists of relevant studies, or related reviews, identified by the database search were
hand searched for any relevant studies which had been cited by the studies. Each
50
study which met the inclusion criteria was subjected to citation searches using
Google Scholar to identify any published studies that had cited the included studies.
Authors of any relevant published abstracts were contacted to identify any
subsequent full publications of the research. Any studies identified by the
supplementary searches were also subject to reference list and citation searching
until no further eligible studies were identified. Authors of the final included studies
were contacted for additional data to include in the analyses when required.
After excluding duplicate studies using the function in Endnote, two researchers
screened all the studies identified by the search strategy. Study selection occurred in
two stages. First, the initial screening of titles and abstracts was carried out against
the pre-determined inclusion criteria to identify potentially relevant studies. Exclusion
at this stage occurred if both reviewers made the decision to exclude independently
because the study did not meet this review’s inclusion criteria. This stage was
followed by screening the full studies identified as potentially relevant in the initial
screening. Two researchers independently screened all full studies. Disagreements
regarding eligibility were resolved through discussion between the reviewers, and
where necessary, a third independent review by a member of the supervisory team
(this was not required). Where access to the full study was not available online
through Newcastle University Library, copies were requested using inter library loans.
References were managed and recorded in Endnote x7. A Preferred Reporting Items
for Systematic Reviews and Meta-Analyses (PRISMA) flow diagram (193) was used
to record the flow of studies through the review.
Data extraction and quality assessment
Data extraction and quality assessment for all included studies were carried out by
myself and another researcher independently; two of my supervisors (Nicola
Heslehurst and Judith Rankin) and a research assistant (Daniel Jones) supported me
with this process. All independent analyses were combined and any discrepancies
were resolved through discussion, and if necessary, by a third independent review by
an additional member of the supervisory team; this was not required for this review.
51
Data extraction
The Cochrane cohort study data extraction form was adapted to the context of the
research question for my review. This data extraction form was piloted by myself, one
of my supervisors and the research assistant to check for consistency in data
extraction between reviewers, and used to extract relevant information (The final data
extraction template is given in Appendix 3, pgs.329-332). The following study
information was extracted:
Title of the paper, author, year of study.
Setting.
Data collection time period, and methodology.
Information on ethnic groups included, how ethnicity was assigned.
Information on the outcome(s).
Information on the exposure(s).
The number of participants identified, included and excluded, and whether all
participants had been accounted for in each group.
Inclusion and exclusion criteria.
Whether baseline characteristics had been reported by ethnicity, and if they
had, data for the baseline characteristics by ethnic group.
Study results; all relevant results associated with maternal weight, GWG and
pregnancy outcomes, the factors that had been adjusted for in the analysis
and the data analysis methods.
Quality assessment
There are few validated quality assessment tools applicable to observational studies.
Three quality assessment tools were considered for this review; the NICE
methodology checklist (195), the National Heart Lung and Blood Institute for National
Institutes of Health Quality Assessment Tool for Observational Cohort and Cross-
Sectional Studies (196) and the Newcastle-Ottawa quality assessment scale for
cohort studies (197). While all three quality assessment tools had limitations, the
Newcastle-Ottawa scale was found to be the most appropriate for the research
question and study design following piloting of the three tools by myself, a member of
the supervision team and a research assistant. The Newcastle-Ottawa scale had also
52
been used previously in a topic-related systematic review of observational studies
investigating maternal BMI and post-term birth (84). The final quality assessment
form is given in Appendix 4 (pgs.333-336). The maximum quality score a paper can
receive is eight. For the purposes of this review, studies with a quality score above
four were deemed to be of reasonable quality.
Data synthesis
The type of data synthesis carried out was dependent on the studies included in the
review, and whether it was considered appropriate and useful to pool the results of
these studies (198). Primarily, the appropriateness of pooling the results of the
individual studies identified for inclusion in the systematic review was assessed. It
was decided that results would only be pooled where results for one pregnancy
outcome were available for two or more studies as this is the minimum recommended
number for meta-analysis (199), and the study methodology and measures of
exposure and outcome used in each study were sufficiently similar to support pooling
of the results. Pooling of the data was not appropriate due to the diversity of
exposure measures, and pregnancy outcomes used. Therefore, meta-analysis is not
possible, and data was synthesised to provide a narrative summary of the evidence.
This summary was structured around the subgroups of MA, GAC, the combined
effect of MA and GAC and type of pregnancy outcome. This review was interested in
two types of comparison:
1. Within each ethnic group i.e. exposed South Asian women compared with
control South Asian women in the reference group; and exposed White
women compared with control White women in the reference group. This
comparison would allow estimates of risk to be produced, for example, for
South Asian women with obesity compared with South Asian women of
recommended BMI, and also for White women with obesity compared with
White women of recommended BMI.
2. Between ethnic groups i.e. exposed South Asian women compared with White
women of the same exposure category, for example South Asian women with
obesity compared with White women with obesity. This comparison would
53
allow estimates of risk at each exposure level in South Asian women
compared with White women.
Where effect sizes were not presented for these comparisons the data presented in
studies (or provided when authors were contacted) were used to calculate
unadjusted odds ratios (OR) for the associations between MA/GAC and pregnancy
outcomes when possible. If mean and standard deviation (SD) for weight were
provided at baseline and at time points during pregnancy, then difference in means
and 95% confidence intervals (CI) were calculated to show the gain in exposure to
that time point. Where studies presented a summary statistic of an anthropometric
measure (e.g. mean weight or weight gained during pregnancy) of South Asian and
White women in a population with an outcome (e.g. GDM), these were also included.
All calculations were carried out using STATA 14.
Conceptual model
The results identified by this systematic review have been used to inform the
development of a conceptual model which represents the associations between MA,
GAC, the combined effect of MA and GAC, and pregnancy outcomes in South Asian
women. This has been done by considering whether or not there is evidence to
support the association between an exposure and an outcome. The model was
developed in three stages; including evidence relating to MA and pregnancy
outcomes, additionally including evidence for GAC and pregnancy outcomes, and
finally additionally including the evidence for the combined effect of MA and GAC and
pregnancy outcomes. Each stage of model development has been represented using
a diagram where the arrows represent associations between variables, and the
colour of the arrow represents the stage of descriptive synthesis. This diagram has
been expanded at each stage of the descriptive synthesis based on the findings of
the review.
3.5 Results
Searches identified 24,671 studies, of which 19 met the inclusion criteria, which
included a total of 346,319 births (306,254 White and 40,065 South Asian). A

54
PRISMA flow diagram (193) shows the studies which have been excluded and the
reasons for exclusion (Figure 4).
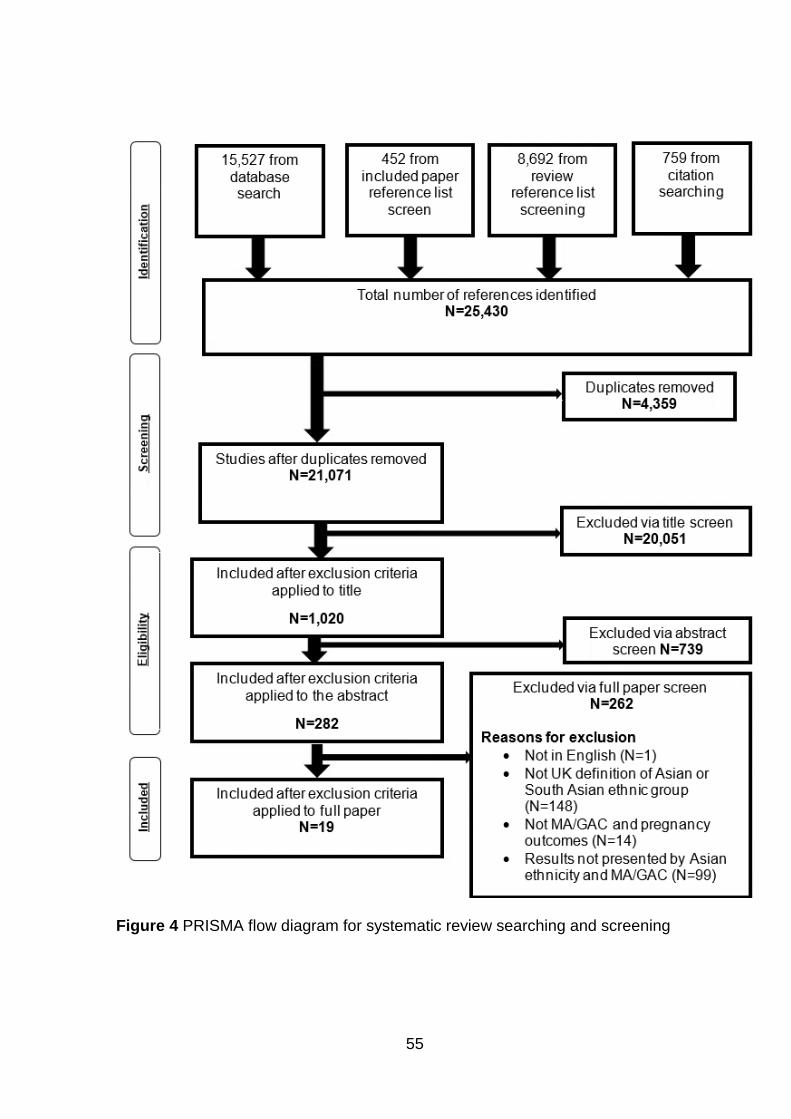
55
Figure 4 PRISMA flow diagram for systematic review searching and screening
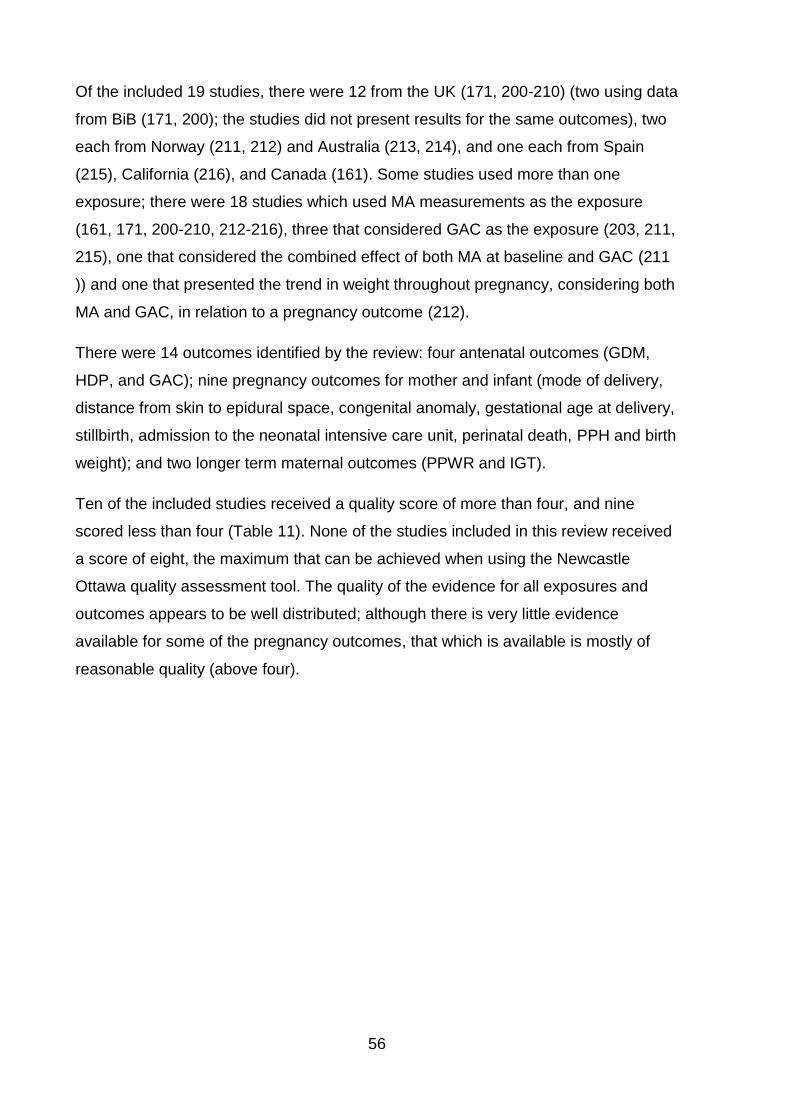
56
Of the included 19 studies, there were 12 from the UK (171, 200-210) (two using data
from BiB (171, 200); the studies did not present results for the same outcomes), two
each from Norway (211, 212) and Australia (213, 214), and one each from Spain
(215), California (216), and Canada (161). Some studies used more than one
exposure; there were 18 studies which used MA measurements as the exposure
(161, 171, 200-210, 212-216), three that considered GAC as the exposure (203, 211,
215), one that considered the combined effect of both MA at baseline and GAC (211
)) and one that presented the trend in weight throughout pregnancy, considering both
MA and GAC, in relation to a pregnancy outcome (212).
There were 14 outcomes identified by the review: four antenatal outcomes (GDM,
HDP, and GAC); nine pregnancy outcomes for mother and infant (mode of delivery,
distance from skin to epidural space, congenital anomaly, gestational age at delivery,
stillbirth, admission to the neonatal intensive care unit, perinatal death, PPH and birth
weight); and two longer term maternal outcomes (PPWR and IGT).
Ten of the included studies received a quality score of more than four, and nine
scored less than four (Table 11). None of the studies included in this review received
a score of eight, the maximum that can be achieved when using the Newcastle
Ottawa quality assessment tool. The quality of the evidence for all exposures and
outcomes appears to be well distributed; although there is very little evidence
available for some of the pregnancy outcomes, that which is available is mostly of
reasonable quality (above four).
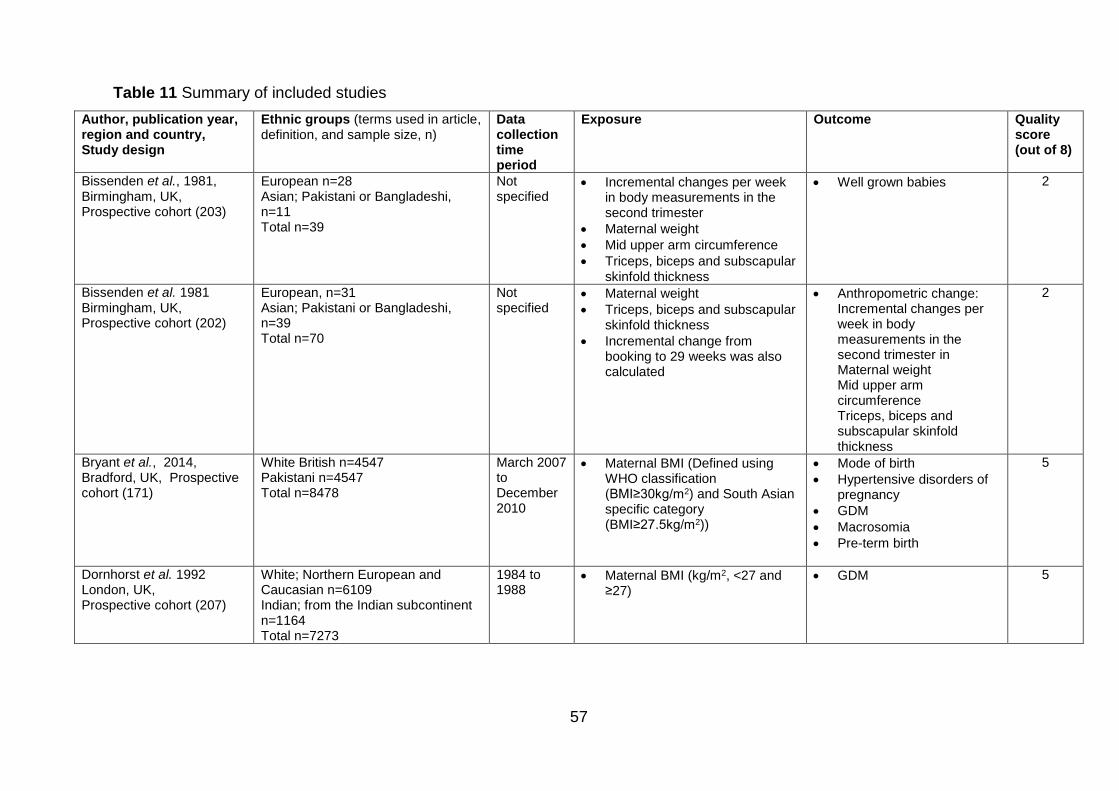
57
Table 11 Summary of included studies
Author, publication year, region and country, Study design
Ethnic groups (terms used in article, definition, and sample size, n)
Data collection time period
Exposure
Outcome Quality score (out of 8)
Bissenden et al., 1981, Birmingham, UK, Prospective cohort (203)
European n=28 Asian; Pakistani or Bangladeshi, n=11 Total n=39
Not specified
Incremental changes per week in body measurements in the second trimester
Maternal weight
Mid upper arm circumference
Triceps, biceps and subscapular skinfold thickness
Well grown babies 2
Bissenden et al. 1981 Birmingham, UK, Prospective cohort (202)
European, n=31 Asian; Pakistani or Bangladeshi, n=39 Total n=70
Not specified
Maternal weight
Triceps, biceps and subscapular skinfold thickness
Incremental change from booking to 29 weeks was also calculated
Anthropometric change: Incremental changes per week in body measurements in the second trimester in Maternal weight Mid upper arm circumference Triceps, biceps and subscapular skinfold thickness
2
Bryant et al., 2014, Bradford, UK, Prospective cohort (171)
White British n=4547 Pakistani n=4547 Total n=8478
March 2007 to December 2010
Maternal BMI (Defined using WHO classification (BMI≥30kg/m2) and South Asian specific category (BMI≥27.5kg/m2))
Mode of birth
Hypertensive disorders of pregnancy
GDM
Macrosomia
Pre-term birth
5
Dornhorst et al. 1992 London, UK, Prospective cohort (207)
White; Northern European and Caucasian n=6109 Indian; from the Indian subcontinent n=1164 Total n=7273
1984 to 1988
Maternal BMI (kg/m2, <27 and ≥27)
GDM 5
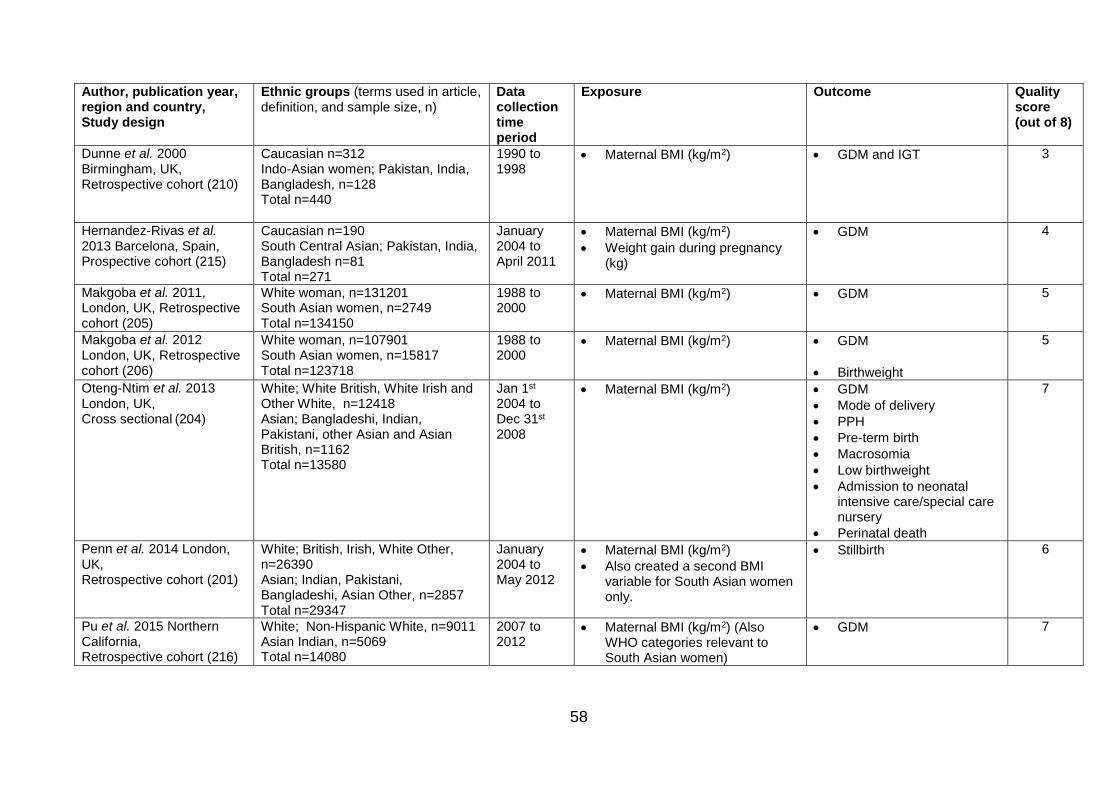
58
Author, publication year, region and country, Study design
Ethnic groups (terms used in article, definition, and sample size, n)
Data collection time period
Exposure
Outcome Quality score (out of 8)
Dunne et al. 2000 Birmingham, UK, Retrospective cohort (210)
Caucasian n=312 Indo-Asian women; Pakistan, India, Bangladesh, n=128 Total n=440
1990 to 1998
Maternal BMI (kg/m2) GDM and IGT 3
Hernandez-Rivas et al. 2013 Barcelona, Spain, Prospective cohort (215)
Caucasian n=190 South Central Asian; Pakistan, India, Bangladesh n=81 Total n=271
January 2004 to April 2011
Maternal BMI (kg/m2)
Weight gain during pregnancy (kg)
GDM 4
Makgoba et al. 2011, London, UK, Retrospective cohort (205)
White woman, n=131201 South Asian women, n=2749 Total n=134150
1988 to 2000
Maternal BMI (kg/m2)
GDM
5
Makgoba et al. 2012 London, UK, Retrospective cohort (206)
White woman, n=107901 South Asian women, n=15817 Total n=123718
1988 to 2000
Maternal BMI (kg/m2) GDM
Birthweight
5
Oteng-Ntim et al. 2013 London, UK, Cross sectional (204)
White; White British, White Irish and Other White, n=12418 Asian; Bangladeshi, Indian, Pakistani, other Asian and Asian British, n=1162 Total n=13580
Jan 1st 2004 to Dec 31st 2008
Maternal BMI (kg/m2) GDM
Mode of delivery
PPH
Pre-term birth
Macrosomia
Low birthweight
Admission to neonatal intensive care/special care nursery
Perinatal death
7
Penn et al. 2014 London, UK, Retrospective cohort (201)
White; British, Irish, White Other, n=26390 Asian; Indian, Pakistani, Bangladeshi, Asian Other, n=2857 Total n=29347
January 2004 to May 2012
Maternal BMI (kg/m2)
Also created a second BMI variable for South Asian women only.
Stillbirth 6
Pu et al. 2015 Northern California, Retrospective cohort (216)
White; Non-Hispanic White, n=9011 Asian Indian, n=5069 Total n=14080
2007 to 2012
Maternal BMI (kg/m2) (Also WHO categories relevant to South Asian women)
GDM 7
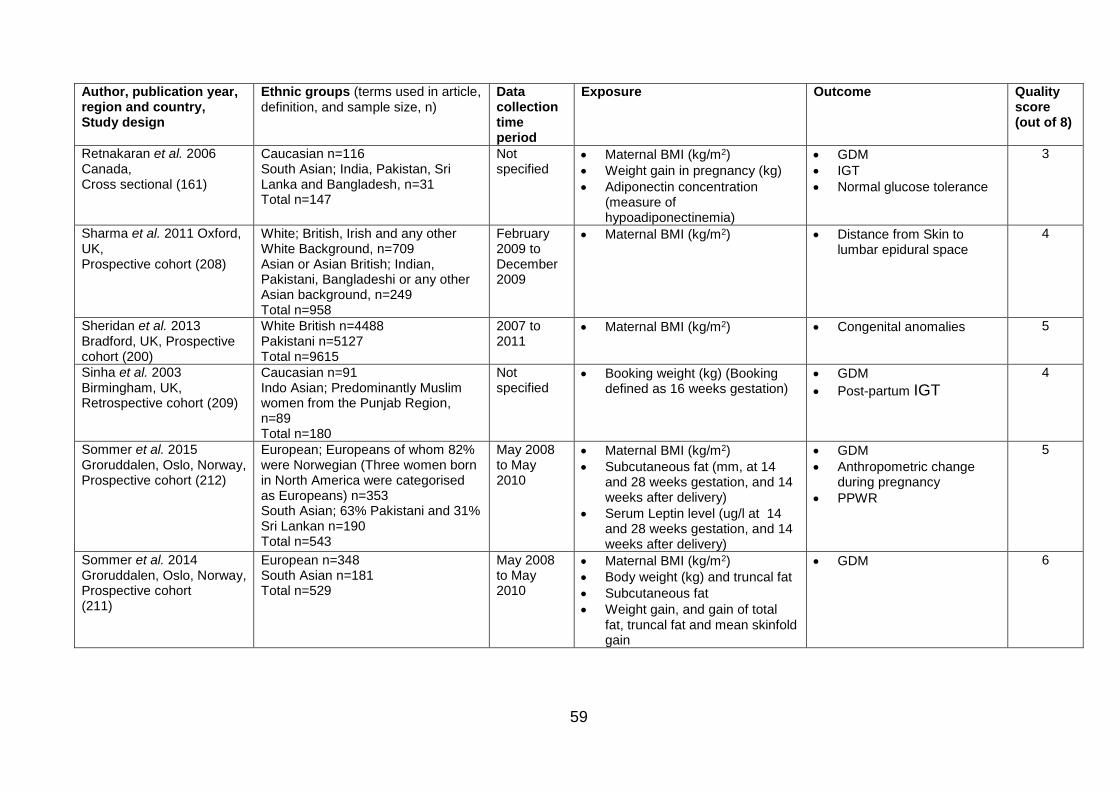
59
Author, publication year, region and country, Study design
Ethnic groups (terms used in article, definition, and sample size, n)
Data collection time period
Exposure
Outcome Quality score (out of 8)
Retnakaran et al. 2006 Canada, Cross sectional (161)
Caucasian n=116 South Asian; India, Pakistan, Sri Lanka and Bangladesh, n=31 Total n=147
Not specified
Maternal BMI (kg/m2)
Weight gain in pregnancy (kg)
Adiponectin concentration (measure of hypoadiponectinemia)
GDM
IGT
Normal glucose tolerance
3
Sharma et al. 2011 Oxford, UK, Prospective cohort (208)
White; British, Irish and any other White Background, n=709 Asian or Asian British; Indian, Pakistani, Bangladeshi or any other Asian background, n=249 Total n=958
February 2009 to December 2009
Maternal BMI (kg/m2) Distance from Skin to lumbar epidural space
4
Sheridan et al. 2013 Bradford, UK, Prospective cohort (200)
White British n=4488 Pakistani n=5127 Total n=9615
2007 to 2011
Maternal BMI (kg/m2) Congenital anomalies 5
Sinha et al. 2003 Birmingham, UK, Retrospective cohort (209)
Caucasian n=91 Indo Asian; Predominantly Muslim women from the Punjab Region, n=89 Total n=180
Not specified
Booking weight (kg) (Booking defined as 16 weeks gestation)
GDM
Post-partum IGT
4
Sommer et al. 2015 Groruddalen, Oslo, Norway, Prospective cohort (212)
European; Europeans of whom 82% were Norwegian (Three women born in North America were categorised as Europeans) n=353 South Asian; 63% Pakistani and 31% Sri Lankan n=190 Total n=543
May 2008 to May 2010
Maternal BMI (kg/m2)
Subcutaneous fat (mm, at 14 and 28 weeks gestation, and 14 weeks after delivery)
Serum Leptin level (ug/l at 14 and 28 weeks gestation, and 14 weeks after delivery)
GDM
Anthropometric change during pregnancy
PPWR
5
Sommer et al. 2014 Groruddalen, Oslo, Norway, Prospective cohort (211)
European n=348 South Asian n=181 Total n=529
May 2008 to May 2010
Maternal BMI (kg/m2)
Body weight (kg) and truncal fat
Subcutaneous fat
Weight gain, and gain of total fat, truncal fat and mean skinfold gain
GDM 6
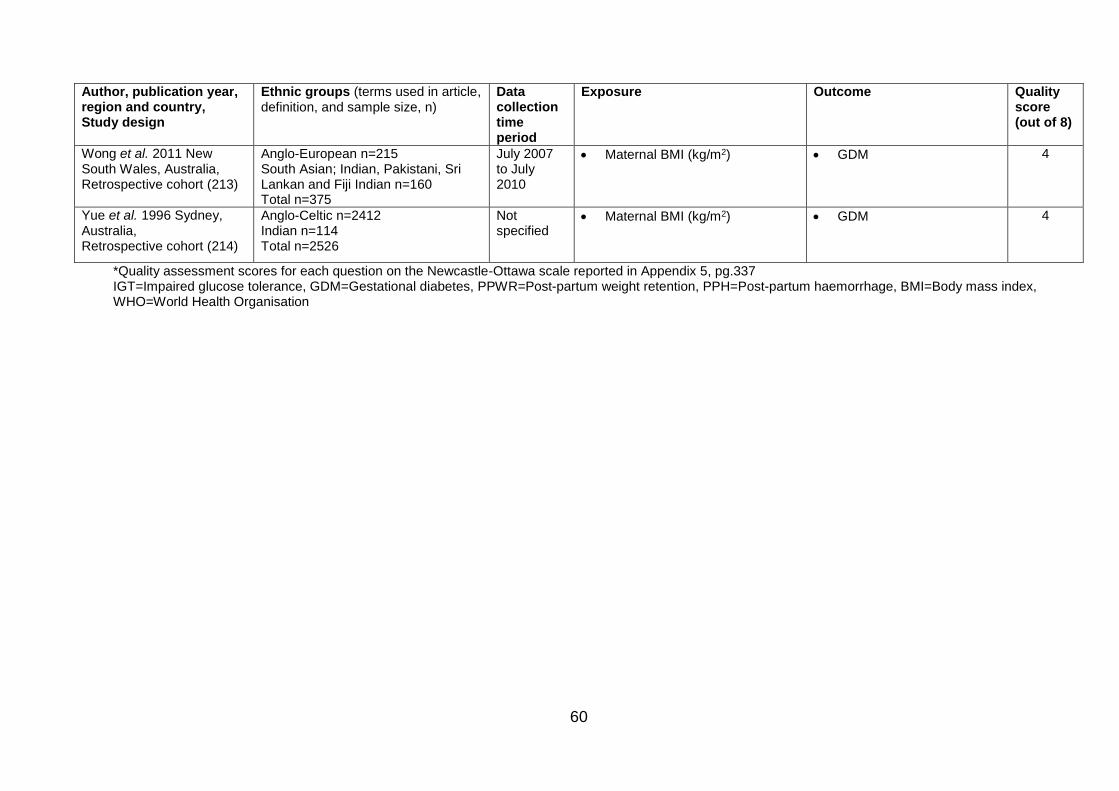
60
Author, publication year, region and country, Study design
Ethnic groups (terms used in article, definition, and sample size, n)
Data collection time period
Exposure
Outcome Quality score (out of 8)
Wong et al. 2011 New South Wales, Australia, Retrospective cohort (213)
Anglo-European n=215 South Asian; Indian, Pakistani, Sri Lankan and Fiji Indian n=160 Total n=375
July 2007 to July 2010
Maternal BMI (kg/m2) GDM 4
Yue et al. 1996 Sydney, Australia, Retrospective cohort (214)
Anglo-Celtic n=2412 Indian n=114 Total n=2526
Not specified
Maternal BMI (kg/m2) GDM 4
*Quality assessment scores for each question on the Newcastle-Ottawa scale reported in Appendix 5, pg.337 IGT=Impaired glucose tolerance, GDM=Gestational diabetes, PPWR=Post-partum weight retention, PPH=Post-partum haemorrhage, BMI=Body mass index, WHO=World Health Organisation
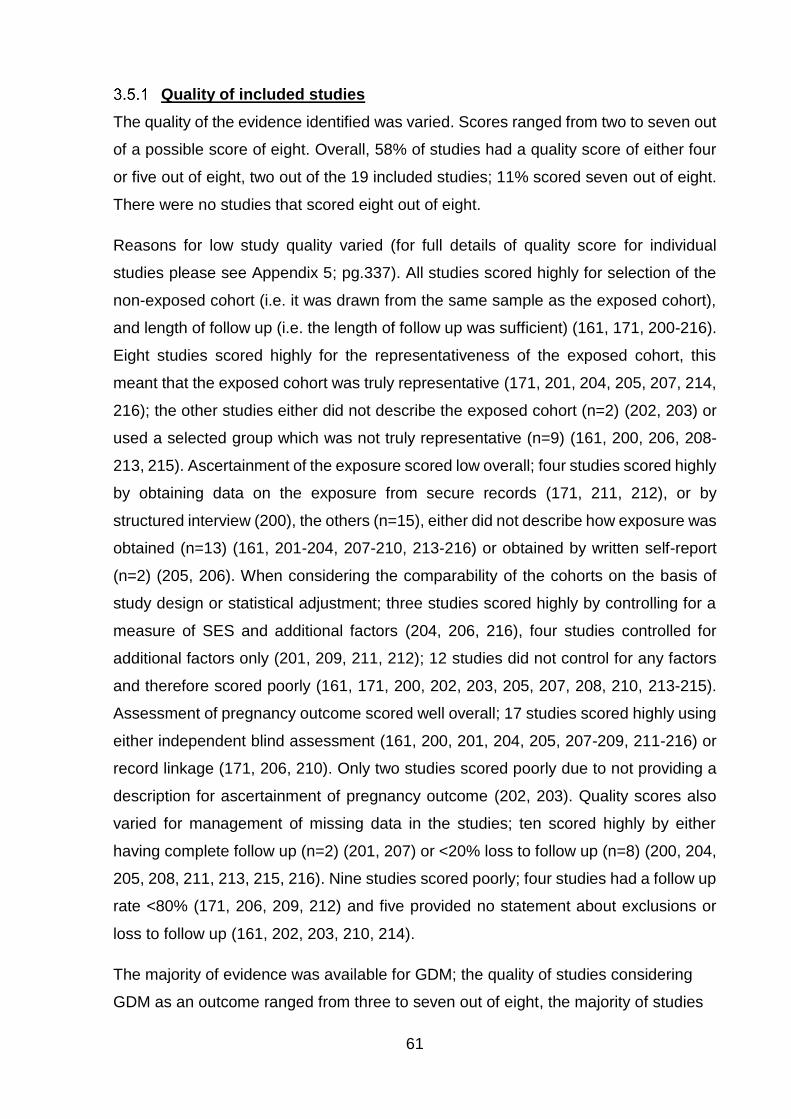
61
Quality of included studies
The quality of the evidence identified was varied. Scores ranged from two to seven out
of a possible score of eight. Overall, 58% of studies had a quality score of either four
or five out of eight, two out of the 19 included studies; 11% scored seven out of eight.
There were no studies that scored eight out of eight.
Reasons for low study quality varied (for full details of quality score for individual
studies please see Appendix 5; pg.337). All studies scored highly for selection of the
non-exposed cohort (i.e. it was drawn from the same sample as the exposed cohort),
and length of follow up (i.e. the length of follow up was sufficient) (161, 171, 200-216).
Eight studies scored highly for the representativeness of the exposed cohort, this
meant that the exposed cohort was truly representative (171, 201, 204, 205, 207, 214,
216); the other studies either did not describe the exposed cohort (n=2) (202, 203) or
used a selected group which was not truly representative (n=9) (161, 200, 206, 208-
213, 215). Ascertainment of the exposure scored low overall; four studies scored highly
by obtaining data on the exposure from secure records (171, 211, 212), or by
structured interview (200), the others (n=15), either did not describe how exposure was
obtained (n=13) (161, 201-204, 207-210, 213-216) or obtained by written self-report
(n=2) (205, 206). When considering the comparability of the cohorts on the basis of
study design or statistical adjustment; three studies scored highly by controlling for a
measure of SES and additional factors (204, 206, 216), four studies controlled for
additional factors only (201, 209, 211, 212); 12 studies did not control for any factors
and therefore scored poorly (161, 171, 200, 202, 203, 205, 207, 208, 210, 213-215).
Assessment of pregnancy outcome scored well overall; 17 studies scored highly using
either independent blind assessment (161, 200, 201, 204, 205, 207-209, 211-216) or
record linkage (171, 206, 210). Only two studies scored poorly due to not providing a
description for ascertainment of pregnancy outcome (202, 203). Quality scores also
varied for management of missing data in the studies; ten scored highly by either
having complete follow up (n=2) (201, 207) or <20% loss to follow up (n=8) (200, 204,
205, 208, 211, 213, 215, 216). Nine studies scored poorly; four studies had a follow up
rate <80% (171, 206, 209, 212) and five provided no statement about exclusions or
loss to follow up (161, 202, 203, 210, 214).
The majority of evidence was available for GDM; the quality of studies considering
GDM as an outcome ranged from three to seven out of eight, the majority of studies
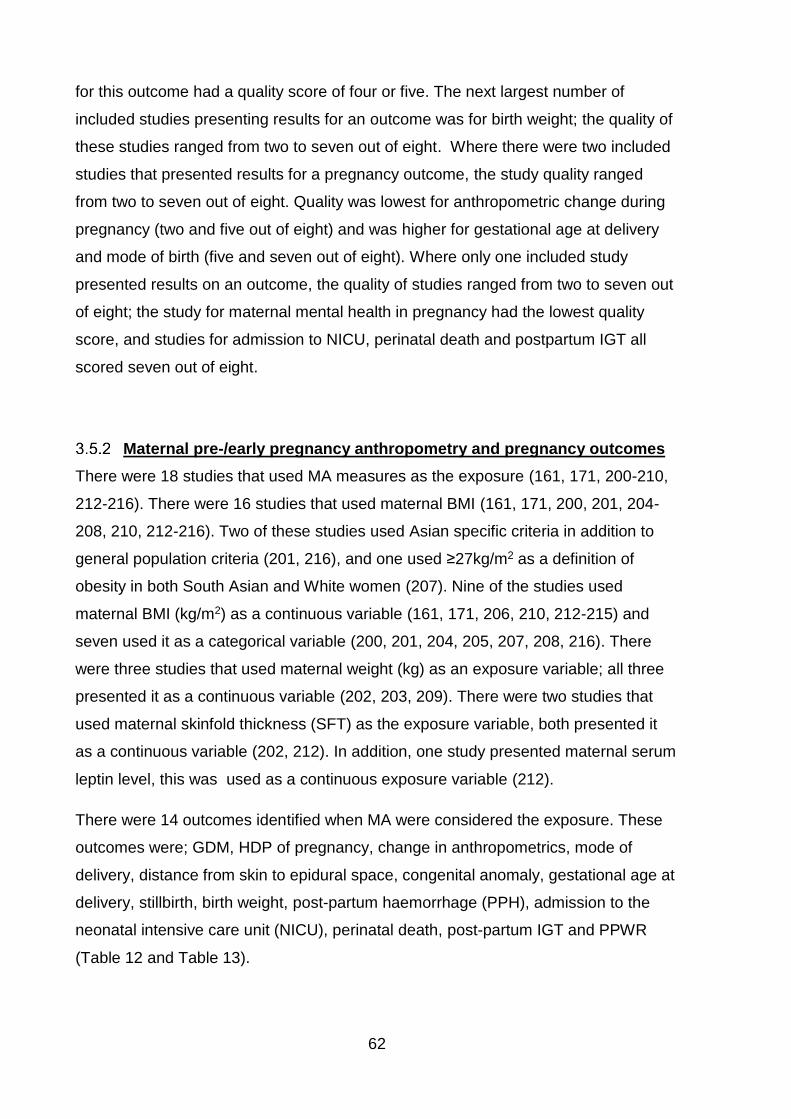
62
for this outcome had a quality score of four or five. The next largest number of
included studies presenting results for an outcome was for birth weight; the quality of
these studies ranged from two to seven out of eight. Where there were two included
studies that presented results for a pregnancy outcome, the study quality ranged
from two to seven out of eight. Quality was lowest for anthropometric change during
pregnancy (two and five out of eight) and was higher for gestational age at delivery
and mode of birth (five and seven out of eight). Where only one included study
presented results on an outcome, the quality of studies ranged from two to seven out
of eight; the study for maternal mental health in pregnancy had the lowest quality
score, and studies for admission to NICU, perinatal death and postpartum IGT all
scored seven out of eight.
Maternal pre-/early pregnancy anthropometry and pregnancy outcomes
There were 18 studies that used MA measures as the exposure (161, 171, 200-210,
212-216). There were 16 studies that used maternal BMI (161, 171, 200, 201, 204-
208, 210, 212-216). Two of these studies used Asian specific criteria in addition to
general population criteria (201, 216), and one used ≥27kg/m2 as a definition of
obesity in both South Asian and White women (207). Nine of the studies used
maternal BMI (kg/m2) as a continuous variable (161, 171, 206, 210, 212-215) and
seven used it as a categorical variable (200, 201, 204, 205, 207, 208, 216). There
were three studies that used maternal weight (kg) as an exposure variable; all three
presented it as a continuous variable (202, 203, 209). There were two studies that
used maternal skinfold thickness (SFT) as the exposure variable, both presented it
as a continuous variable (202, 212). In addition, one study presented maternal serum
leptin level, this was used as a continuous exposure variable (212).
There were 14 outcomes identified when MA were considered the exposure. These
outcomes were; GDM, HDP of pregnancy, change in anthropometrics, mode of
delivery, distance from skin to epidural space, congenital anomaly, gestational age at
delivery, stillbirth, birth weight, post-partum haemorrhage (PPH), admission to the
neonatal intensive care unit (NICU), perinatal death, post-partum IGT and PPWR
(Table 12 and Table 13).
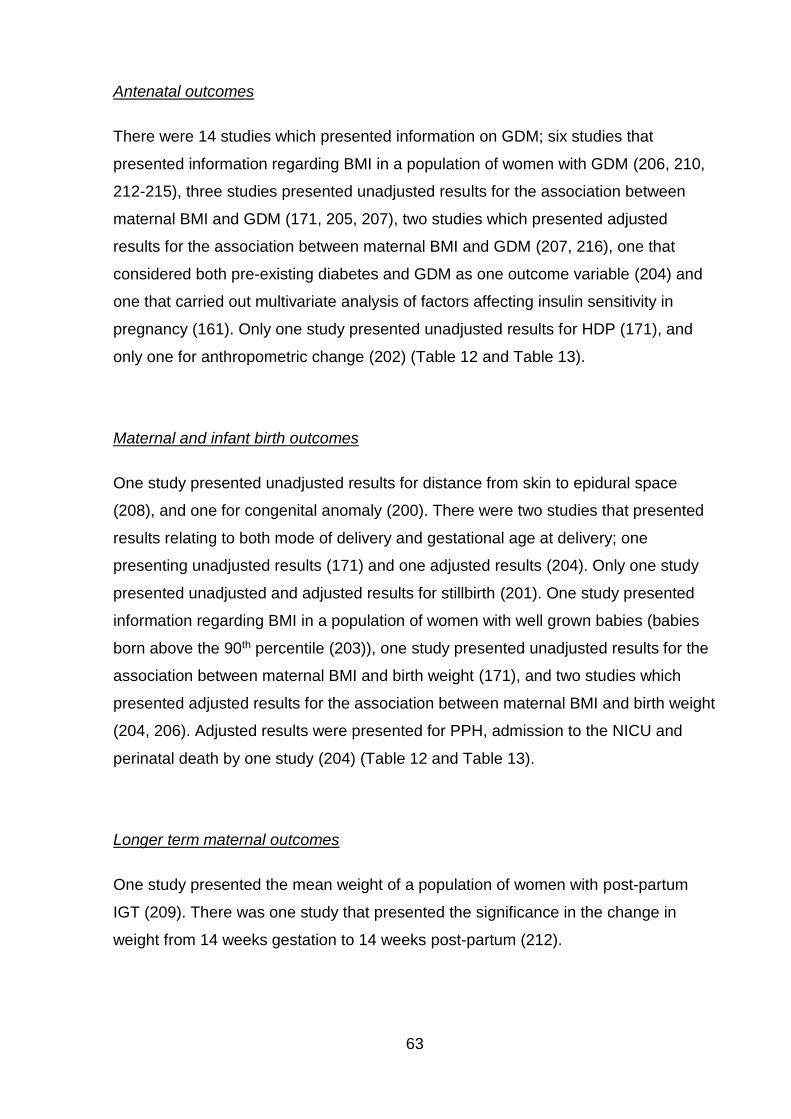
63
Antenatal outcomes
There were 14 studies which presented information on GDM; six studies that
presented information regarding BMI in a population of women with GDM (206, 210,
212-215), three studies presented unadjusted results for the association between
maternal BMI and GDM (171, 205, 207), two studies which presented adjusted
results for the association between maternal BMI and GDM (207, 216), one that
considered both pre-existing diabetes and GDM as one outcome variable (204) and
one that carried out multivariate analysis of factors affecting insulin sensitivity in
pregnancy (161). Only one study presented unadjusted results for HDP (171), and
only one for anthropometric change (202) (Table 12 and Table 13).
Maternal and infant birth outcomes
One study presented unadjusted results for distance from skin to epidural space
(208), and one for congenital anomaly (200). There were two studies that presented
results relating to both mode of delivery and gestational age at delivery; one
presenting unadjusted results (171) and one adjusted results (204). Only one study
presented unadjusted and adjusted results for stillbirth (201). One study presented
information regarding BMI in a population of women with well grown babies (babies
born above the 90th percentile (203)), one study presented unadjusted results for the
association between maternal BMI and birth weight (171), and two studies which
presented adjusted results for the association between maternal BMI and birth weight
(204, 206). Adjusted results were presented for PPH, admission to the NICU and
perinatal death by one study (204) (Table 12 and Table 13).
Longer term maternal outcomes
One study presented the mean weight of a population of women with post-partum
IGT (209). There was one study that presented the significance in the change in
weight from 14 weeks gestation to 14 weeks post-partum (212).
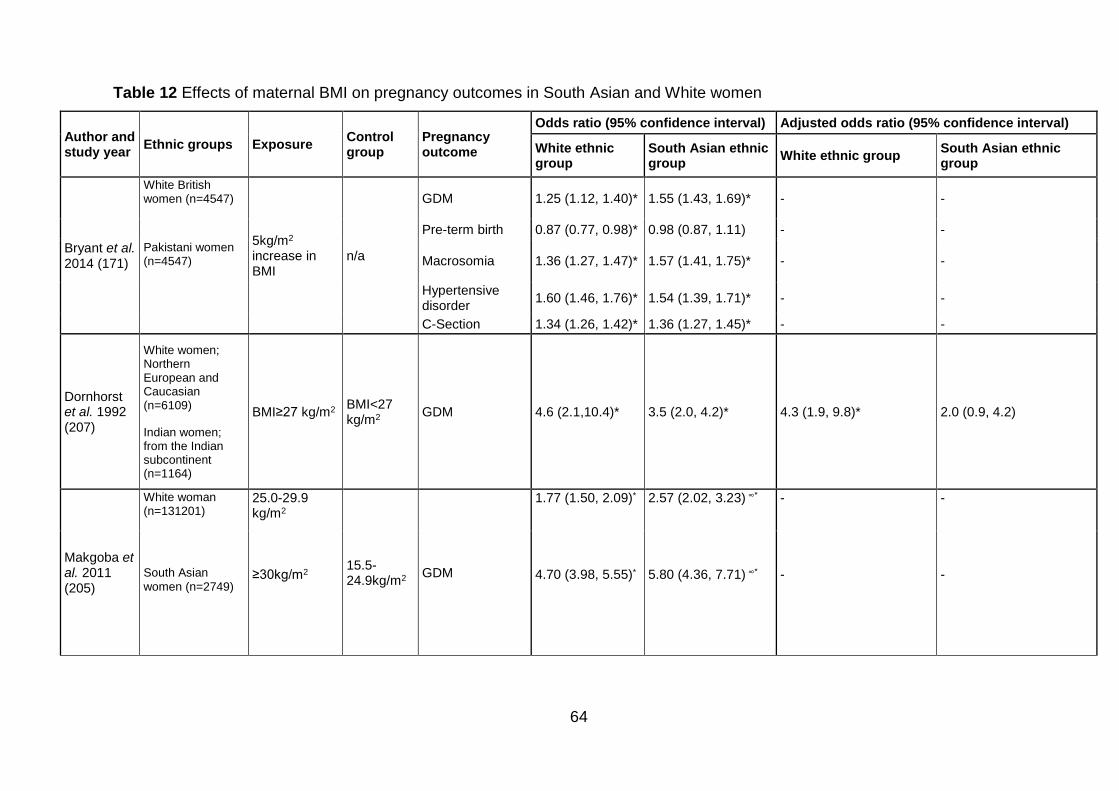
64
Table 12 Effects of maternal BMI on pregnancy outcomes in South Asian and White women
Author and study year
Ethnic groups Exposure Control group
Pregnancy outcome
Odds ratio (95% confidence interval) Adjusted odds ratio (95% confidence interval)
White ethnic group
South Asian ethnic group
White ethnic group South Asian ethnic group
Bryant et al. 2014 (171)
White British women (n=4547)
5kg/m2 increase in BMI
n/a
GDM 1.25 (1.12, 1.40)* 1.55 (1.43, 1.69)* - -
Pre-term birth 0.87 (0.77, 0.98)* 0.98 (0.87, 1.11) - -
Pakistani women (n=4547) Macrosomia 1.36 (1.27, 1.47)* 1.57 (1.41, 1.75)* - -
Hypertensive disorder
1.60 (1.46, 1.76)* 1.54 (1.39, 1.71)* - -
C-Section 1.34 (1.26, 1.42)* 1.36 (1.27, 1.45)* - -
Dornhorst et al. 1992 (207)
White women; Northern European and Caucasian (n=6109)
Indian women; from the Indian subcontinent (n=1164)
BMI≥27 kg/m2 BMI<27 kg/m2
GDM 4.6 (2.1,10.4)* 3.5 (2.0, 4.2)* 4.3 (1.9, 9.8)* 2.0 (0.9, 4.2)
Makgoba et al. 2011 (205)
White woman (n=131201)
25.0-29.9 kg/m2 ≥30kg/m2
15.5-24.9kg/m2
GDM
1.77 (1.50, 2.09)* 4.70 (3.98, 5.55)*
2.57 (2.02, 3.23) ∞* 5.80 (4.36, 7.71) ∞*
- -
- - South Asian
women (n=2749)
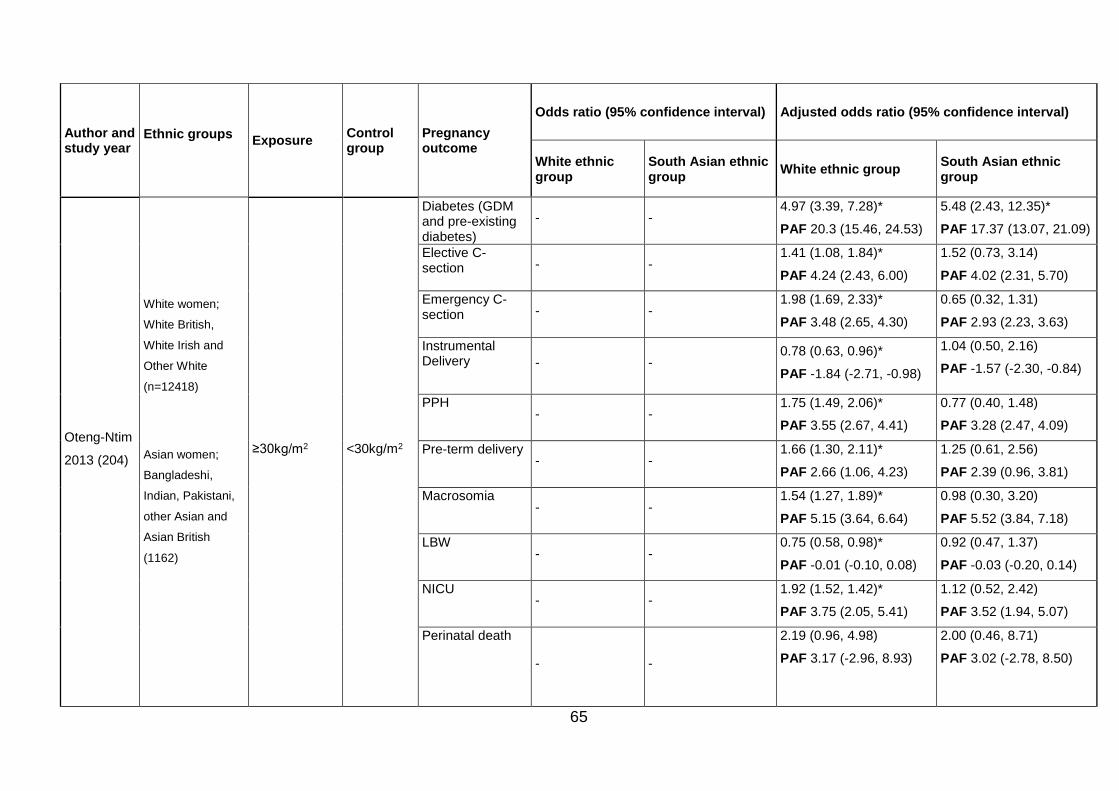
65
Author and study year
Ethnic groups Exposure
Control group
Pregnancy outcome
Odds ratio (95% confidence interval) Adjusted odds ratio (95% confidence interval)
White ethnic group
South Asian ethnic group
White ethnic group South Asian ethnic group
Oteng-Ntim
2013 (204)
White women;
White British,
White Irish and
Other White
(n=12418)
Asian women;
Bangladeshi,
Indian, Pakistani,
other Asian and
Asian British
(1162)
≥30kg/m2 <30kg/m2
Diabetes (GDM and pre-existing diabetes)
- - 4.97 (3.39, 7.28)*
PAF 20.3 (15.46, 24.53)
5.48 (2.43, 12.35)*
PAF 17.37 (13.07, 21.09)
Elective C-section - -
1.41 (1.08, 1.84)*
PAF 4.24 (2.43, 6.00)
1.52 (0.73, 3.14)
PAF 4.02 (2.31, 5.70)
Emergency C-section - -
1.98 (1.69, 2.33)*
PAF 3.48 (2.65, 4.30)
0.65 (0.32, 1.31)
PAF 2.93 (2.23, 3.63)
Instrumental Delivery - -
0.78 (0.63, 0.96)*
PAF -1.84 (-2.71, -0.98)
1.04 (0.50, 2.16)
PAF -1.57 (-2.30, -0.84)
PPH - -
1.75 (1.49, 2.06)*
PAF 3.55 (2.67, 4.41)
0.77 (0.40, 1.48)
PAF 3.28 (2.47, 4.09)
Pre-term delivery - -
1.66 (1.30, 2.11)*
PAF 2.66 (1.06, 4.23)
1.25 (0.61, 2.56)
PAF 2.39 (0.96, 3.81)
Macrosomia - -
1.54 (1.27, 1.89)*
PAF 5.15 (3.64, 6.64)
0.98 (0.30, 3.20)
PAF 5.52 (3.84, 7.18)
LBW - -
0.75 (0.58, 0.98)*
PAF -0.01 (-0.10, 0.08)
0.92 (0.47, 1.37)
PAF -0.03 (-0.20, 0.14)
NICU - -
1.92 (1.52, 1.42)*
PAF 3.75 (2.05, 5.41)
1.12 (0.52, 2.42)
PAF 3.52 (1.94, 5.07)
Perinatal death
- -
2.19 (0.96, 4.98)
PAF 3.17 (-2.96, 8.93)
2.00 (0.46, 8.71)
PAF 3.02 (-2.78, 8.50)
66
Author and study year
Ethnic groups Exposure
Control group
Pregnancy outcome
Odds ratio (95% confidence interval) Adjusted odds ratio (95% confidence interval)
White ethnic group
South Asian ethnic group
White ethnic group South Asian ethnic group
Penn et al. 2014 (201)
White women; British, Irish, White Other (n=26390)
Asian women; Indian, Pakistani, Bangladeshi, Asian Other (n=2857)
≥30kg/m2 <30kg/m2 Stillbirth
1.38 (0.72, 2.66)∞ 4.84 (1.97, 11.91)∞* 1.32 (0.68, 2.57) 4.64 (1.84, 11.70)*
≥27.5kg/m2 <27.5kg/m2 2.83 (1.17, 6.85)*
Pu et al. 2015 (216)
Non-Hispanic White (n=9011)
≥25kg/2
<25kg/m2
GDM
- - 2.0 (1.74, 2.4)*$ PAF 28.9 (22.4, 35.1)
1.17 (1.5, 2.0)* $
PAF 25.5 (17.4, 33.3)
1.9 (1.7, 2.2)* $
PAF 39.0 (29.7, 47.6) Asian Indian women (n=5069)
≥23kg/m2 <23kg/m2 - - -
Sheridan et al. 2013 (200)
White British (n=4488)
<18.5kg/m2 18.5-24.9kg/m2
Congenital anomalies
1.50 (0.47-4.18)$ 0.96 (0.54,1.73)$ - -
Pakistani (n=5127) 25-29.9 kg/m2 1.00 (0.59,1.70)$ 1.03 (0.76,1.39)$ - -
≥30kg/m2 1.22 (0.73, 2.04)$ 0.69 (0.45,1.03)$ - - ∞Effect size calculated from data provided in published paper using STATA 14 *Significant as 95% confidence interval does not cross 1.00 $Relative risk
PAF: population attributable fraction % and 95%CI (PAF is the reduction in population disease risk or mortality that would occur if the exposure
to a risk factor was eliminated or reduced to an ideal exposure scenario, where the distributions of other risk factors in the population remain
unchanged (217, 218)), PPH=postpartum haemorrhage, GDM=gestational diabetes, NICU=neonatal intensive care unit, LBW= low birth weight,
C-section=caesarean section
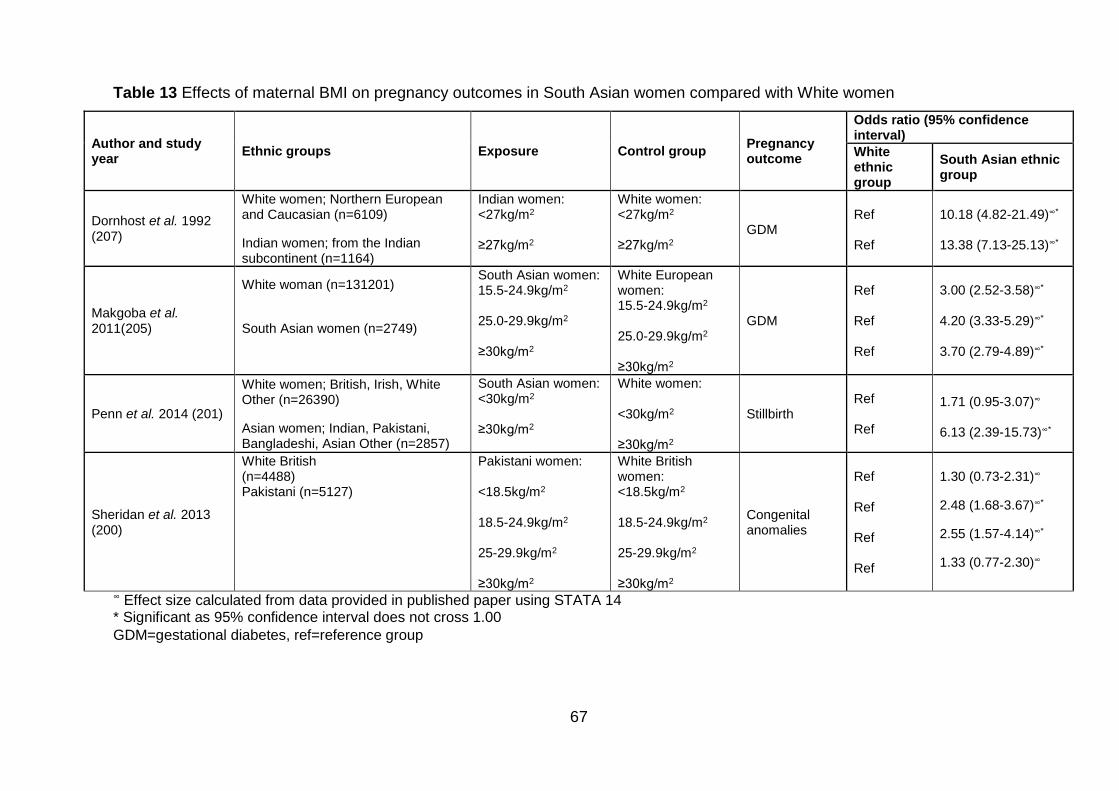
67
Table 13 Effects of maternal BMI on pregnancy outcomes in South Asian women compared with White women
Author and study year
Ethnic groups Exposure Control group Pregnancy outcome
Odds ratio (95% confidence interval)
White ethnic group
South Asian ethnic group
Dornhost et al. 1992 (207)
White women; Northern European and Caucasian (n=6109)
Indian women; from the Indian subcontinent (n=1164)
Indian women: <27kg/m2 ≥27kg/m2
White women: <27kg/m2 ≥27kg/m2
GDM
Ref Ref
10.18 (4.82-21.49)∞*
13.38 (7.13-25.13)∞*
Makgoba et al. 2011(205)
White woman (n=131201)
South Asian women (n=2749)
South Asian women: 15.5-24.9kg/m2
25.0-29.9kg/m2
≥30kg/m2
White European women: 15.5-24.9kg/m2
25.0-29.9kg/m2
≥30kg/m2
GDM
Ref Ref Ref
3.00 (2.52-3.58)∞* 4.20 (3.33-5.29)∞* 3.70 (2.79-4.89)∞*
Penn et al. 2014 (201)
White women; British, Irish, White Other (n=26390)
Asian women; Indian, Pakistani, Bangladeshi, Asian Other (n=2857)
South Asian women: <30kg/m2 ≥30kg/m2
White women: <30kg/m2 ≥30kg/m2
Stillbirth
Ref Ref
1.71 (0.95-3.07)∞
6.13 (2.39-15.73)∞*
Sheridan et al. 2013 (200)
White British (n=4488) Pakistani (n=5127)
Pakistani women: <18.5kg/m2 18.5-24.9kg/m2 25-29.9kg/m2 ≥30kg/m2
White British women: <18.5kg/m2 18.5-24.9kg/m2
25-29.9kg/m2 ≥30kg/m2
Congenital anomalies
Ref Ref Ref Ref
1.30 (0.73-2.31)∞
2.48 (1.68-3.67)∞*
2.55 (1.57-4.14)∞*
1.33 (0.77-2.30)∞
∞ Effect size calculated from data provided in published paper using STATA 14 * Significant as 95% confidence interval does not cross 1.00
GDM=gestational diabetes, ref=reference group
68
Antenatal outcomes associated with maternal pre-/early pregnancy
anthropometry
Gestational diabetes
Differences in means and trends in maternal anthropometrics in women with
gestational diabetes
Seven studies presented results on mean MA in a population of women with GDM
(MA is considered the exposure here due to temporality; GDM occurs after MA in this
instance). One study presented results for maternal weight (kg) (213), and a further
six presented information on BMI (206, 210, 212-215), one of which also presented
results for maternal skinfold thickness and serum leptin levels (212) (Table 14). The
one study that provided the mean weight of women with GDM found that mean
weight was only slightly lower in South Asian women (213). Four studies presented
the mean BMI of a population of women with GDM (210, 213, 215). Two of these
studies found that there was very little difference in mean BMI between South Asian
and White women with GDM (210, 215), and the other two found that South Asian
women had a lower mean BMI than White women with GDM (206, 213). There was
one additional study by Yue et al. which did not present any data but did contain a
graph showing that BMI was higher in women with GDM in both Indian and Ango-
Celtic10 women than those without GDM (214). It also showed that BMI was very
slightly higher in Indian women with GDM compared to Anglo-Celtic women with
GDM, and that Indian women without GDM had slightly lower BMI than Anglo-Celtic
women without GDM (214).
10 Definition not specified by author. Definition from Collins English Dictionary “Australian: of or relating to an inhabitant of Australia who was or whose ancestors were born in the British Isles”
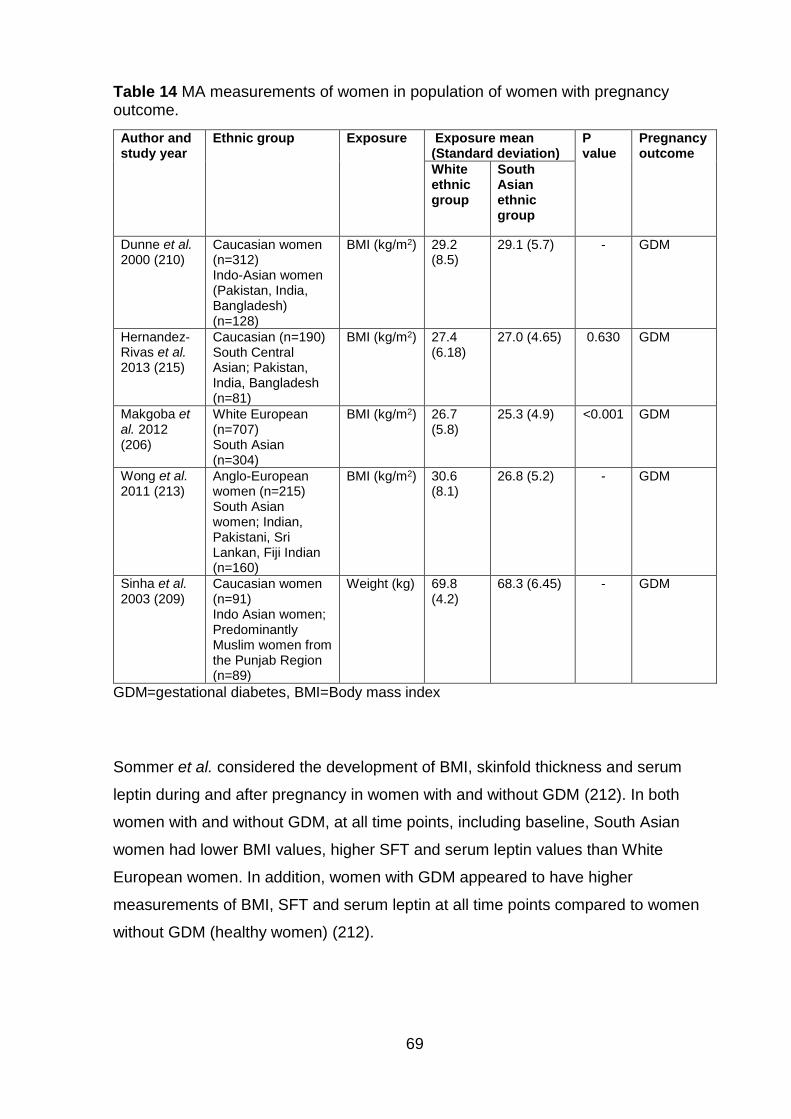
69
Table 14 MA measurements of women in population of women with pregnancy outcome.
Author and study year
Ethnic group Exposure Exposure mean (Standard deviation)
P value
Pregnancy outcome
White ethnic group
South Asian ethnic group
Dunne et al. 2000 (210)
Caucasian women (n=312) Indo-Asian women (Pakistan, India, Bangladesh) (n=128)
BMI (kg/m2) 29.2 (8.5)
29.1 (5.7) - GDM
Hernandez-Rivas et al. 2013 (215)
Caucasian (n=190) South Central Asian; Pakistan, India, Bangladesh (n=81)
BMI (kg/m2) 27.4 (6.18)
27.0 (4.65) 0.630 GDM
Makgoba et al. 2012 (206)
White European (n=707) South Asian (n=304)
BMI (kg/m2) 26.7 (5.8)
25.3 (4.9) <0.001 GDM
Wong et al. 2011 (213)
Anglo-European women (n=215) South Asian women; Indian, Pakistani, Sri Lankan, Fiji Indian (n=160)
BMI (kg/m2) 30.6 (8.1)
26.8 (5.2) - GDM
Sinha et al. 2003 (209)
Caucasian women (n=91) Indo Asian women; Predominantly Muslim women from the Punjab Region (n=89)
Weight (kg) 69.8 (4.2)
68.3 (6.45) - GDM
GDM=gestational diabetes, BMI=Body mass index
Sommer et al. considered the development of BMI, skinfold thickness and serum
leptin during and after pregnancy in women with and without GDM (212). In both
women with and without GDM, at all time points, including baseline, South Asian
women had lower BMI values, higher SFT and serum leptin values than White
European women. In addition, women with GDM appeared to have higher
measurements of BMI, SFT and serum leptin at all time points compared to women
without GDM (healthy women) (212).
70
Unadjusted effect size for the association between maternal anthropometrics and
gestational diabetes
Three studies presented unadjusted results for the association between maternal
BMI and GDM (171, 205, 207). Bryant et al. found that per 5kg/m2 increase in BMI,
Pakistani women had a higher OR of GDM than White British women (Pakistani: OR
1.55, 95%CI 1.43-1.69 and White: OR 1.25, 95%CI 1.12-1.40) (171) (Table 12).
Makgoba et al. presented odds for GDM in White women with a BMI 25.0-29.9kg/m2
and ≥30kg/m2 compared with women of BMI 15.5-24.9kg/m2, and presented the raw
data to calculate these results for South Asian women (205). Results showed that
South Asian women had higher odds of GDM than White women in both BMI groups
(BMI 25.0-29.9kg/m2, South Asian: OR 2.57, 95%CI 2.02-3.23, White: OR 1.77,
95%CI 1.50-2.09 and BMI≥30kg/m2 South Asian: OR 5.80, 95%CI 4.36-7.71 and
White: OR 4.70, 95%CI 3.98-5.55) (205) (Table 12). Dornhorst et al. found that when
women with a BMI≥27 kg/m2 are compared with women of BMI<27kg/m2, White
women had a higher OR of GDM than women from the Indian subcontinent (White:
OR 4.6, 95%CI 2.1-10.4 and Asian Indian: OR 3.5, 95%CI 2.0-4.2) (207) (Table 12).
Using the data presented in two of the included studies, unadjusted ORs were
calculated for GDM in a specified BMI group in South Asian women, compared with
White women (205, 207). The results from both studies showed that South Asian
women had an increased risk of GDM at all levels of BMI (205, 207). Dornhorst et al.
considered two BMI groups; BMI≥27kg/m2 and BMI<27kg/m2 and showed that when
compared with White women, South Asian women had a higher risk of GDM in both
BMI groups, and the OR was highest in the higher BMI group (BMI<27kg/m2, OR
10.18, 95%CI 4.82-21.49 and BMI≥27kg/m2 OR 13.38 95%CI 7.13-25.13) (207)
(Table 13). Data from Makgoba et al. allowed the calculation of ORs for three BMI
groups; 15.5-24.9 kg/m2, 25.0-29.9 kg/m2 and ≥30kg/m2 (205). When compared with
White women of the same BMI, South Asian women in the BMI group 25.0-29.9kg/m2
had the highest risk of GDM (OR 4.20, 95%CI 3.33-5.29) followed by those with a
BMI≥30kg/m2 (OR 3.70 95%CI 2.79-4.89) with a BMI 15.5-24.9kg/m2 (OR 3.00
95%CI 2.52-3.58) (205) (Table 13).
71
Adjusted effect size for the association between maternal anthropometrics and
gestational diabetes
There were four studies which also presented adjusted results for the association
between maternal BMI and GDM (161, 204, 207, 216), one that considered both pre-
existing diabetes and GDM as one outcome variable (204), two that considered GDM
as an outcome variable (207, 216) and one that carried out multivariate analysis of
factors affecting insulin sensitivity in pregnancy (161). Oteng-Ntim et al. found that
when Asian women with a BMI≥30kg/m2 were compared to Asian women with a
BMI<30kg/m2, the AOR for pre-existing diabetes and GDM was higher than that for
White women with a BMI≥30kg/m2 compared to White women with a BMI<30kg/m2
(South Asian: AOR 5.48, 95%CI 2.43-12.35 and White: AOR 4.97 95%CI 3.39-7.28).
The AORs were adjusted for age, parity and deprivation (204) (Table 12). Oteng-
Ntim et al. also presented PAFs (referred to in Table 12) which are the percentage
reduction in outcome (here this is GDM) if the exposure (maternal BMI≥30kg/m2) was
reduced to the ideal (maternal BMI<30kg/m2). PAFs can be interpreted as the
proportion of disease cases (GDM) that would be prevented following the reduction
of the exposure to an ideal, assuming that the exposure is causal (218). Results
showed that South Asian women had a lower reduction than White women (17.37%
95%CI 13.07, 21.09 in South Asian women and 20.3% 95%CI 15.46, 24.53 in White
women) (204) (Table 12).
Two studies provided adjusted results which suggested the effect size for GDM was
lower in South Asian women compared with White women (207, 216). Dornhorst et
al. considered the AOR of GDM in White (Northern European and Caucasian)
women and women from the Indian subcontinent, living in the UK, comparing those
with a BMI≥27 kg/m2 with those with a BMI<27 kg/m2 (207). Findings showed that
women from the Indian subcontinent had a lower AOR of GDM than White women
(AOR 2.0 (95%CI 0.9-4.2) and 4.3 (95%CI 1.9-9.8), respectively), AORs were
adjusted for age and parity (207) (Table 13). Pu et al. provided relative risks (RR),
adjusted for maternal education, parity, smoking, insurance status for the risk of GDM
associated with overweight and obesity in Asian Indian and Non-Hispanic White
women (216). They compared women with a BMI≥25kg/m2 with women with a
BMI<25kg/m2 (216). Results showed Asian Indian women had a lower adjusted RR
72
(ARR) than Non-Hispanic White women (Asian Indian ARR 1.17, 95%CI 1.5-2.0 and
White: ARR 2.0 95%CI 1.74-2.4) (216) (Table 12).
Pu et al. also considered the ARR in Asian Indian women using the Asian specific
BMI criteria, comparing women with a BMI≥23kg/m2, with women of BMI<23kg/m2
(216). Results showed that although the ARR increased, it remained lower than that
for the White population with a BMI≥23kg/m2 (ARR 1.9 95%CI 1.7-2.2) (216) (Table
12). Pu et al. also presented PAFs for GDM in South Asian and White women,
including a PAF for South Asian women at the lower BMI cut off. Results showed that
although at ≥25kg/m2 the PAF was lower in South Asian women (25.5% 95%CI 17.4,
33.3) than in White women (28.9% 95%CI 22.4, 35.1), when using the equivalent
Asian specific BMI criteria ≥23kg/m2 for the South Asian population, the PAF
increased to above that of White women with a BMI 25kg/m2 (39.0 95%CI 29.7, 47.6)
(216) (Table 12).
Retnakaran et al. carried out multivariate analysis of factors affecting insulin
sensitivity adjusted for age, weeks gestation, parity, pre-pregnancy BMI, weight gain
in pregnancy, previous history of GDM, family history of diabetes, glucose intolerance
and ethnicity (161). Results showed that BMI in South Asian women had only a
modest effect on insulin sensitivity compared with Caucasian women (slope of -0.4
(95%CI -0.22 to -0.13) in South Asians compared with -0.17 (95%CI -0.15 to 0.08) in
Caucasians). When adiponectin11 was added into the model as a covariate, it
replaced South Asian ethnicity (161).
Hypertensive disorders of pregnancy
Bryant et al. found that per 5kg/m2 increase in BMI, the odds of HDP was significantly
increased for both White and South Asian women (White OR 1.60 95%CI 1.46-1.76
and South Asian OR 1.54 95%CI 1.39-1.71) (171) (Table 12). There was no
information relating to differences in means and trends in weight or adjusted effect
sizes or the association between MA and HDP.
11 Adiponectin is a protein that is produced, and secreted by fat cells and has reduced expression in people with obesity and insulin resistance (217)
73
Anthropometric change
Two studies provided results for the association between MA and GAC (202, 212).
Both considered MA as continuous variables, Bissenden et al. presented mean
difference in gain of maternal weight and SFT (bicep, triceps and subscapular SFT)
(202) while Sommer et al. presented the change in BMI, triceps, subscapular,
suprailiac SFT measures and the sum of all these, and also serum leptin levels from
14 to 28 weeks gestation (212).
Differences in means and trends in maternal anthropometrics in women with
gestational anthropometric change
Bissenden et al. provided baseline measurements for maternal weight and SFT and
the amount of each of these measures gained at 29, 33 and 37 weeks gestation for
Asian and European women in four groups (202). The four groups were; Group A:
normal pregnancy, Group B: those with unexplained fetal growth retardation, Group
C: those with pregnancy pathology and normal fetal growth, and Group D: those with
pregnancy pathology and normal fetal growth (202). A pregnancy pathology was
defined as either hypertension (a diastolic blood pressure of more than 90 mmHg at
any stage during pregnancy outside labour or vaginal bleeding during labour
(threatened abortion or antepartum haemorrhage) (202). Fetal growth retardation
was defined as a baby born below the 10th centile in weight in accordance with data
from Thompson et al. 1968 (219).
Bissenden et al. presented results for weight measurements at different time points
during pregnancy (202) (Table 15). The baseline weight measurements (booking 8-
18 weeks) and the measurements at 29 (29-31) weeks, 33 (32-34) weeks and 37
(35-39) weeks gestation were used to calculate the mean difference in GAC from
baseline to each time point. In women who had normal pregnancies (group A),
weight at baseline was lower, all measurements of SFT were higher and at all-time
points, weight gain was slightly lower in South Asian women. Bicep and triceps SFT
were found to be higher in South Asian women, although subscapular SFT gain was
lower. In women who had a pregnancy pathology and normal fetal growth (Group C),
weight at baseline was lower in South Asian women, and all SFT measurements
were higher. Weight gain was lower in South Asian women at all time points, as were
74
gains in all SFT measurements. Data were not available for European women in
group B (those with unexplained fetal growth retardation), or South Asian women in
Group D (those with pregnancy pathology and normal fetal growth) so no
comparisons could be made.
Within the ethnic groups, those with pregnancy pathologies (groups C and D)
seemed to have a higher weight and SFT measurements at baseline than those with
a normal pregnancy. In the European group, those women that had a pregnancy
pathology and a light for gestational age baby appeared (group D) to gain more
weight and SFT than those without a light for gestational age baby (group C). The
results of this study were limited by both small sample size and the fact that there
was no data available for group B in European women and group D in South Asian
women, limiting the comparisons that could be made. There was no information
presented relating to differences in means and trends in weight or adjusted effect
sizes (Table 15).
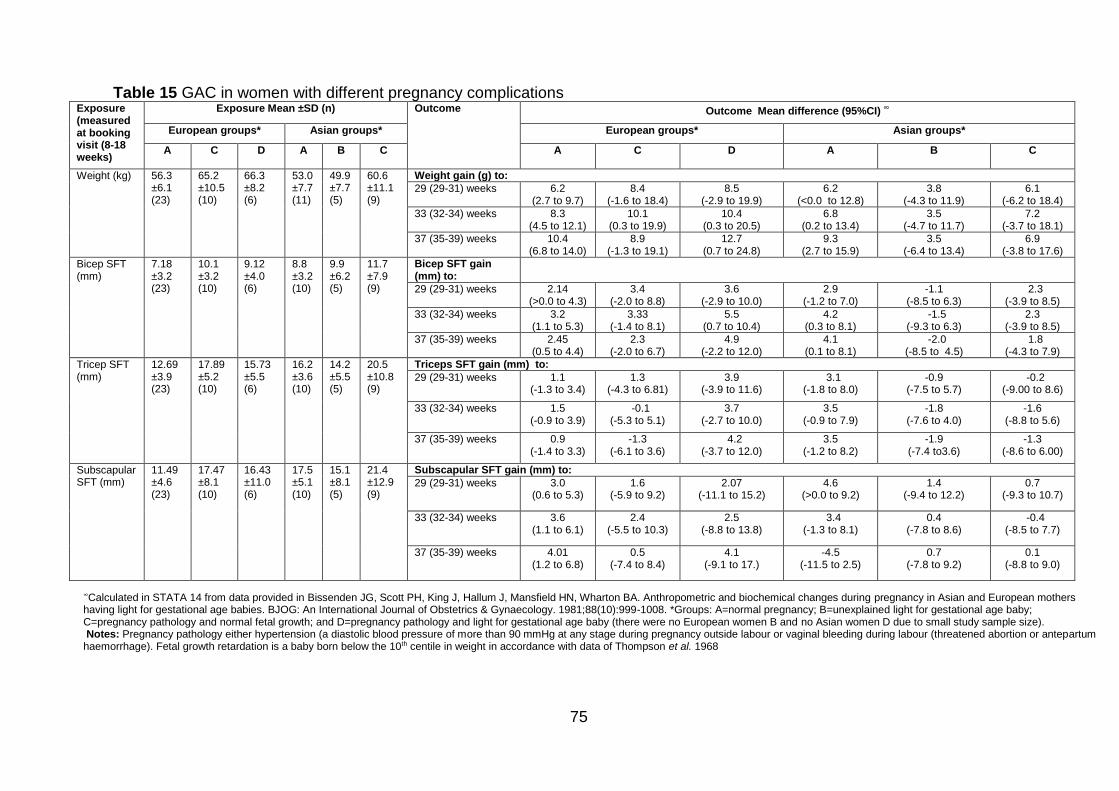
75
Table 15 GAC in women with different pregnancy complications Exposure (measured at booking visit (8-18 weeks)
Exposure Mean ±SD (n) Outcome Outcome Mean difference (95%CI) ∞
European groups* Asian groups* European groups* Asian groups*
A
C D A B C
A C D A B C
Weight (kg)
56.3 ±6.1 (23)
65.2 ±10.5 (10)
66.3 ±8.2 (6)
53.0 ±7.7 (11)
49.9 ±7.7 (5)
60.6 ±11.1 (9)
Weight gain (g) to:
29 (29-31) weeks 6.2 (2.7 to 9.7)
8.4 (-1.6 to 18.4)
8.5 (-2.9 to 19.9)
6.2 (<0.0 to 12.8)
3.8 (-4.3 to 11.9)
6.1 (-6.2 to 18.4)
33 (32-34) weeks 8.3 (4.5 to 12.1)
10.1 (0.3 to 19.9)
10.4 (0.3 to 20.5)
6.8 (0.2 to 13.4)
3.5 (-4.7 to 11.7)
7.2 (-3.7 to 18.1)
37 (35-39) weeks 10.4 (6.8 to 14.0)
8.9 (-1.3 to 19.1)
12.7 (0.7 to 24.8)
9.3 (2.7 to 15.9)
3.5 (-6.4 to 13.4)
6.9 (-3.8 to 17.6)
Bicep SFT (mm)
7.18 ±3.2 (23)
10.1 ±3.2 (10)
9.12 ±4.0 (6)
8.8 ±3.2 (10)
9.9 ±6.2 (5)
11.7 ±7.9 (9)
Bicep SFT gain (mm) to:
29 (29-31) weeks 2.14 (>0.0 to 4.3)
3.4 (-2.0 to 8.8)
3.6 (-2.9 to 10.0)
2.9 (-1.2 to 7.0)
-1.1 (-8.5 to 6.3)
2.3 (-3.9 to 8.5)
33 (32-34) weeks 3.2 (1.1 to 5.3)
3.33 (-1.4 to 8.1)
5.5 (0.7 to 10.4)
4.2 (0.3 to 8.1)
-1.5 (-9.3 to 6.3)
2.3 (-3.9 to 8.5)
37 (35-39) weeks 2.45 (0.5 to 4.4)
2.3 (-2.0 to 6.7)
4.9 (-2.2 to 12.0)
4.1 (0.1 to 8.1)
-2.0 (-8.5 to 4.5)
1.8 (-4.3 to 7.9)
Tricep SFT (mm)
12.69 ±3.9 (23)
17.89 ±5.2 (10)
15.73 ±5.5 (6)
16.2 ±3.6 (10)
14.2 ±5.5 (5)
20.5 ±10.8 (9)
Triceps SFT gain (mm) to:
29 (29-31) weeks 1.1 (-1.3 to 3.4)
1.3 (-4.3 to 6.81)
3.9 (-3.9 to 11.6)
3.1 (-1.8 to 8.0)
-0.9 (-7.5 to 5.7)
-0.2 (-9.00 to 8.6)
33 (32-34) weeks 1.5 (-0.9 to 3.9)
-0.1 (-5.3 to 5.1)
3.7 (-2.7 to 10.0)
3.5 (-0.9 to 7.9)
-1.8 (-7.6 to 4.0)
-1.6 (-8.8 to 5.6)
37 (35-39) weeks 0.9 (-1.4 to 3.3)
-1.3 (-6.1 to 3.6)
4.2 (-3.7 to 12.0)
3.5 (-1.2 to 8.2)
-1.9 (-7.4 to3.6)
-1.3 (-8.6 to 6.00)
Subscapular SFT (mm)
11.49 ±4.6 (23)
17.47 ±8.1 (10)
16.43 ±11.0 (6)
17.5 ±5.1 (10)
15.1 ±8.1 (5)
21.4 ±12.9 (9)
Subscapular SFT gain (mm) to:
29 (29-31) weeks 3.0 (0.6 to 5.3)
1.6 (-5.9 to 9.2)
2.07 (-11.1 to 15.2)
4.6 (>0.0 to 9.2)
1.4 (-9.4 to 12.2)
0.7 (-9.3 to 10.7)
33 (32-34) weeks 3.6 (1.1 to 6.1)
2.4 (-5.5 to 10.3)
2.5 (-8.8 to 13.8)
3.4 (-1.3 to 8.1)
0.4 (-7.8 to 8.6)
-0.4 (-8.5 to 7.7)
37 (35-39) weeks 4.01 (1.2 to 6.8)
0.5 (-7.4 to 8.4)
4.1 (-9.1 to 17.)
-4.5 (-11.5 to 2.5)
0.7 (-7.8 to 9.2)
0.1 (-8.8 to 9.0)
∞Calculated in STATA 14 from data provided in Bissenden JG, Scott PH, King J, Hallum J, Mansfield HN, Wharton BA. Anthropometric and biochemical changes during pregnancy in Asian and European mothers having light for gestational age babies. BJOG: An International Journal of Obstetrics & Gynaecology. 1981;88(10):999-1008. *Groups: A=normal pregnancy; B=unexplained light for gestational age baby; C=pregnancy pathology and normal fetal growth; and D=pregnancy pathology and light for gestational age baby (there were no European women B and no Asian women D due to small study sample size). Notes: Pregnancy pathology either hypertension (a diastolic blood pressure of more than 90 mmHg at any stage during pregnancy outside labour or vaginal bleeding during labour (threatened abortion or antepartum haemorrhage). Fetal growth retardation is a baby born below the 10th centile in weight in accordance with data of Thompson et al. 1968
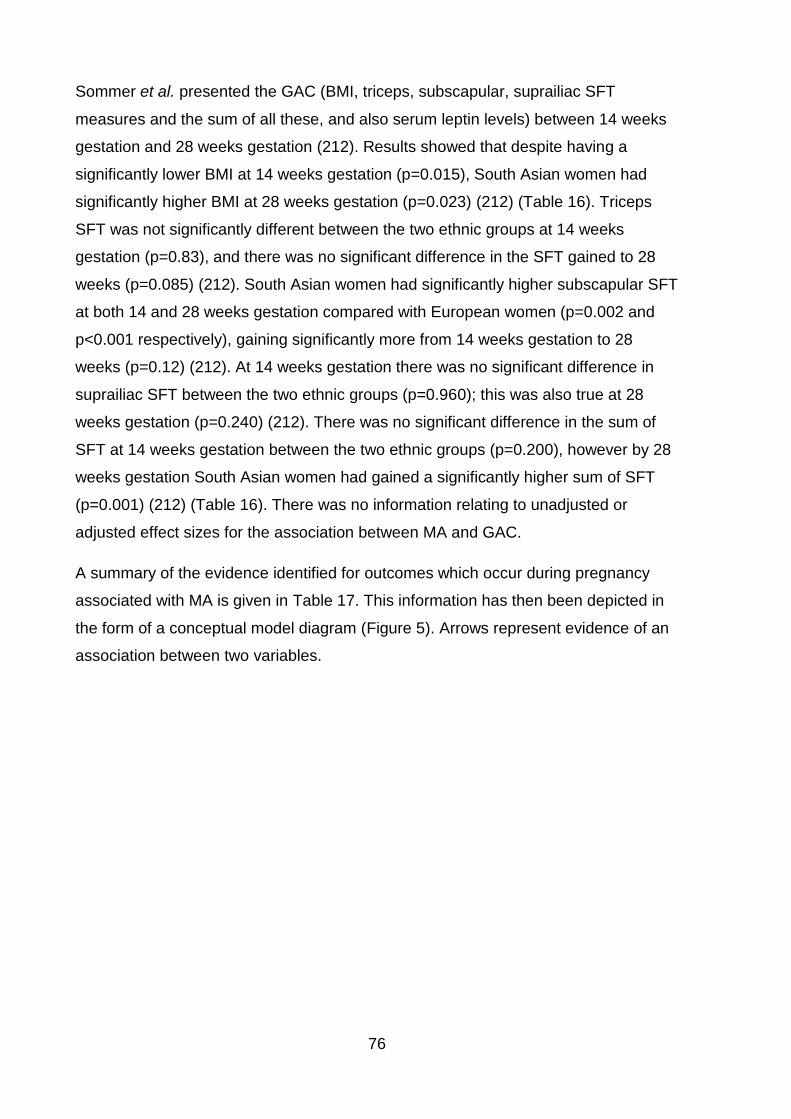
76
Sommer et al. presented the GAC (BMI, triceps, subscapular, suprailiac SFT
measures and the sum of all these, and also serum leptin levels) between 14 weeks
gestation and 28 weeks gestation (212). Results showed that despite having a
significantly lower BMI at 14 weeks gestation (p=0.015), South Asian women had
significantly higher BMI at 28 weeks gestation (p=0.023) (212) (Table 16). Triceps
SFT was not significantly different between the two ethnic groups at 14 weeks
gestation (p=0.83), and there was no significant difference in the SFT gained to 28
weeks (p=0.085) (212). South Asian women had significantly higher subscapular SFT
at both 14 and 28 weeks gestation compared with European women (p=0.002 and
p<0.001 respectively), gaining significantly more from 14 weeks gestation to 28
weeks (p=0.12) (212). At 14 weeks gestation there was no significant difference in
suprailiac SFT between the two ethnic groups (p=0.960); this was also true at 28
weeks gestation (p=0.240) (212). There was no significant difference in the sum of
SFT at 14 weeks gestation between the two ethnic groups (p=0.200), however by 28
weeks gestation South Asian women had gained a significantly higher sum of SFT
(p=0.001) (212) (Table 16). There was no information relating to unadjusted or
adjusted effect sizes for the association between MA and GAC.
A summary of the evidence identified for outcomes which occur during pregnancy
associated with MA is given in Table 17. This information has then been depicted in
the form of a conceptual model diagram (Figure 5). Arrows represent evidence of an
association between two variables.
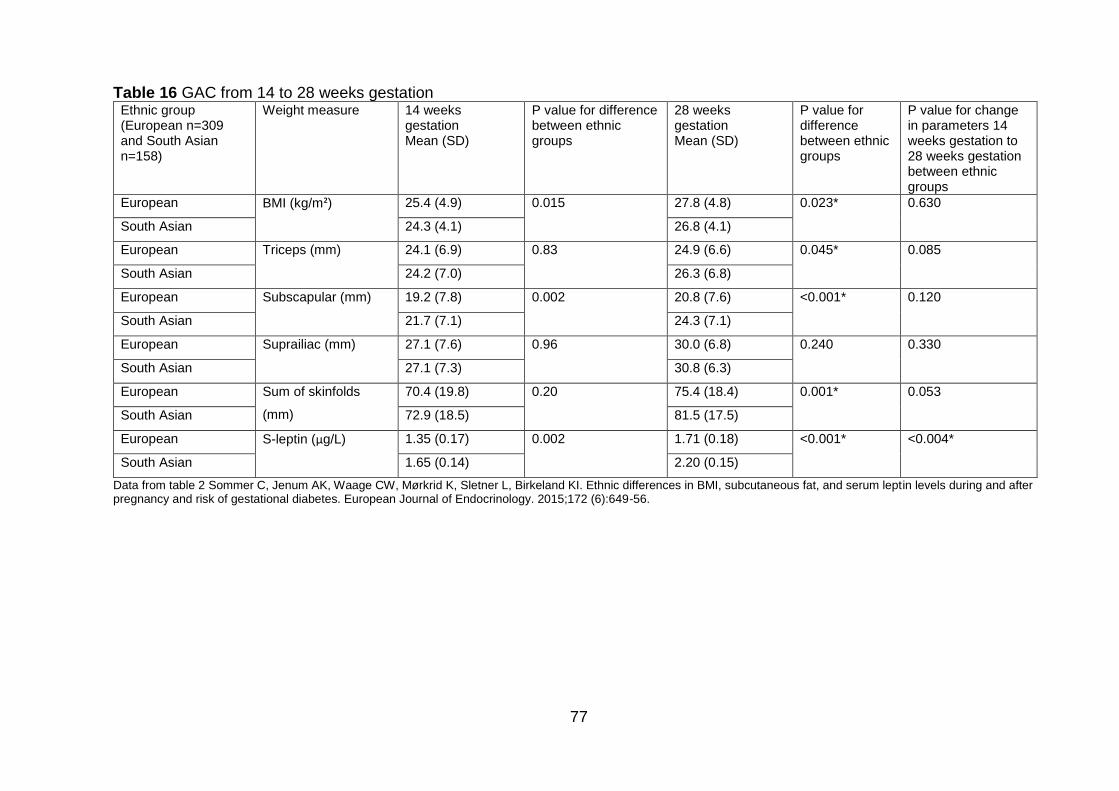
77
Table 16 GAC from 14 to 28 weeks gestation Ethnic group (European n=309 and South Asian n=158)
Weight measure 14 weeks gestation Mean (SD)
P value for difference between ethnic groups
28 weeks gestation Mean (SD)
P value for difference between ethnic groups
P value for change in parameters 14 weeks gestation to 28 weeks gestation between ethnic groups
European BMI (kg/m²) 25.4 (4.9) 0.015 27.8 (4.8) 0.023* 0.630
South Asian 24.3 (4.1) 26.8 (4.1)
European Triceps (mm) 24.1 (6.9) 0.83 24.9 (6.6) 0.045* 0.085
South Asian 24.2 (7.0) 26.3 (6.8)
European Subscapular (mm) 19.2 (7.8) 0.002 20.8 (7.6) <0.001* 0.120
South Asian 21.7 (7.1) 24.3 (7.1)
European Suprailiac (mm) 27.1 (7.6) 0.96 30.0 (6.8) 0.240 0.330
South Asian 27.1 (7.3) 30.8 (6.3)
European Sum of skinfolds
(mm)
70.4 (19.8) 0.20 75.4 (18.4) 0.001* 0.053
South Asian 72.9 (18.5) 81.5 (17.5)
European S-leptin (µg/L) 1.35 (0.17) 0.002 1.71 (0.18) <0.001* <0.004*
South Asian 1.65 (0.14) 2.20 (0.15)
Data from table 2 Sommer C, Jenum AK, Waage CW, Mørkrid K, Sletner L, Birkeland KI. Ethnic differences in BMI, subcutaneous fat, and serum leptin levels during and after pregnancy and risk of gestational diabetes. European Journal of Endocrinology. 2015;172 (6):649-56.
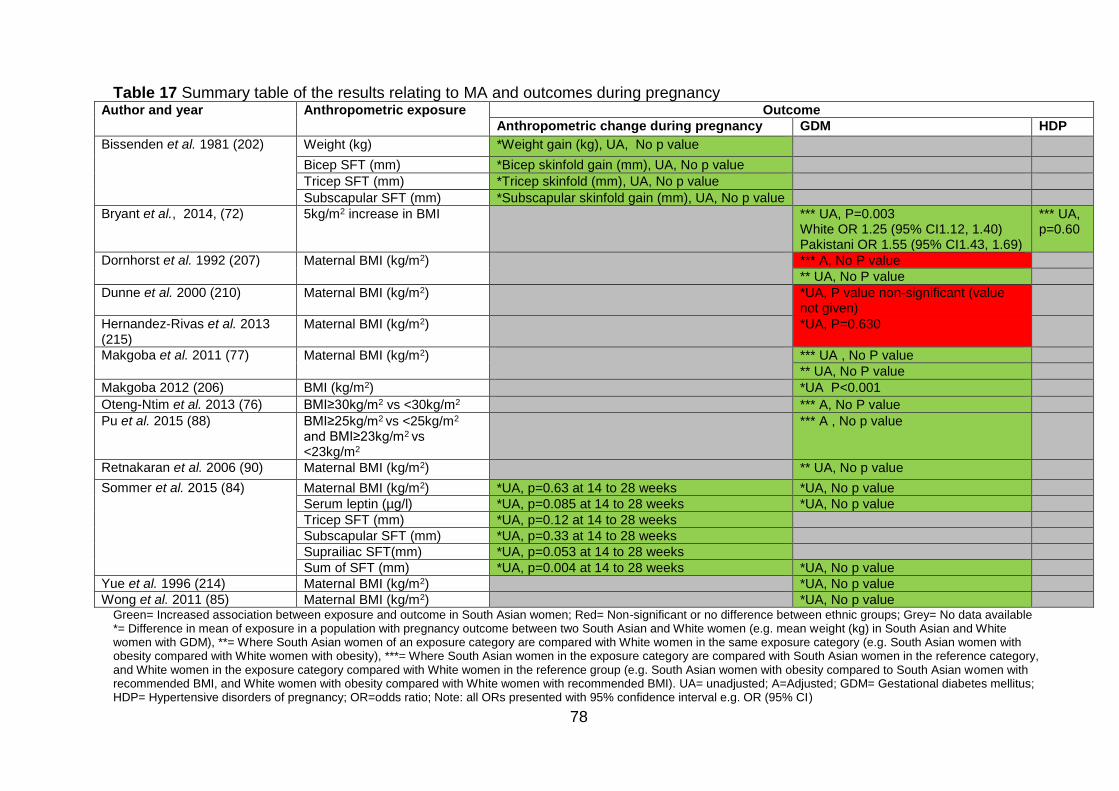
78
Table 17 Summary table of the results relating to MA and outcomes during pregnancy Author and year Anthropometric exposure Outcome
Anthropometric change during pregnancy GDM HDP
Bissenden et al. 1981 (202)
Weight (kg) *Weight gain (kg), UA, No p value
Bicep SFT (mm) *Bicep skinfold gain (mm), UA, No p value
Tricep SFT (mm) *Tricep skinfold (mm), UA, No p value
Subscapular SFT (mm) *Subscapular skinfold gain (mm), UA, No p value
Bryant et al., 2014, (72) 5kg/m2 increase in BMI *** UA, P=0.003 White OR 1.25 (95% CI1.12, 1.40) Pakistani OR 1.55 (95% CI1.43, 1.69)
*** UA, p=0.60
Dornhorst et al. 1992 (207)
Maternal BMI (kg/m2) *** A, No P value
** UA, No P value
Dunne et al. 2000 (210) Maternal BMI (kg/m2) *UA, P value non-significant (value not given)
Hernandez-Rivas et al. 2013 (215)
Maternal BMI (kg/m2) *UA, P=0.630
Makgoba et al. 2011 (77)
Maternal BMI (kg/m2)
*** UA , No P value
** UA, No P value
Makgoba 2012 (206) BMI (kg/m2) *UA P<0.001
Oteng-Ntim et al. 2013 (76) BMI≥30kg/m2 vs <30kg/m2 *** A, No P value
Pu et al. 2015 (88) BMI≥25kg/m2 vs <25kg/m2
and BMI≥23kg/m2 vs <23kg/m2
*** A , No p value
Retnakaran et al. 2006 (90) Maternal BMI (kg/m2) ** UA, No p value
Sommer et al. 2015 (84) Maternal BMI (kg/m2) *UA, p=0.63 at 14 to 28 weeks *UA, No p value
Serum leptin (µg/l) *UA, p=0.085 at 14 to 28 weeks *UA, No p value
Tricep SFT (mm) *UA, p=0.12 at 14 to 28 weeks
Subscapular SFT (mm) *UA, p=0.33 at 14 to 28 weeks
Suprailiac SFT(mm) *UA, p=0.053 at 14 to 28 weeks
Sum of SFT (mm) *UA, p=0.004 at 14 to 28 weeks *UA, No p value
Yue et al. 1996 (214) Maternal BMI (kg/m2) *UA, No p value
Wong et al. 2011 (85) Maternal BMI (kg/m2) *UA, No p value Green= Increased association between exposure and outcome in South Asian women; Red= Non-significant or no difference between ethnic groups; Grey= No data available *= Difference in mean of exposure in a population with pregnancy outcome between two South Asian and White women (e.g. mean weight (kg) in South Asian and White women with GDM), **= Where South Asian women of an exposure category are compared with White women in the same exposure category (e.g. South Asian women with obesity compared with White women with obesity), ***= Where South Asian women in the exposure category are compared with South Asian women in the reference category, and White women in the exposure category compared with White women in the reference group (e.g. South Asian women with obesity compared to South Asian women with recommended BMI, and White women with obesity compared with White women with recommended BMI). UA= unadjusted; A=Adjusted; GDM= Gestational diabetes mellitus; HDP= Hypertensive disorders of pregnancy; OR=odds ratio; Note: all ORs presented with 95% confidence interval e.g. OR (95% CI)
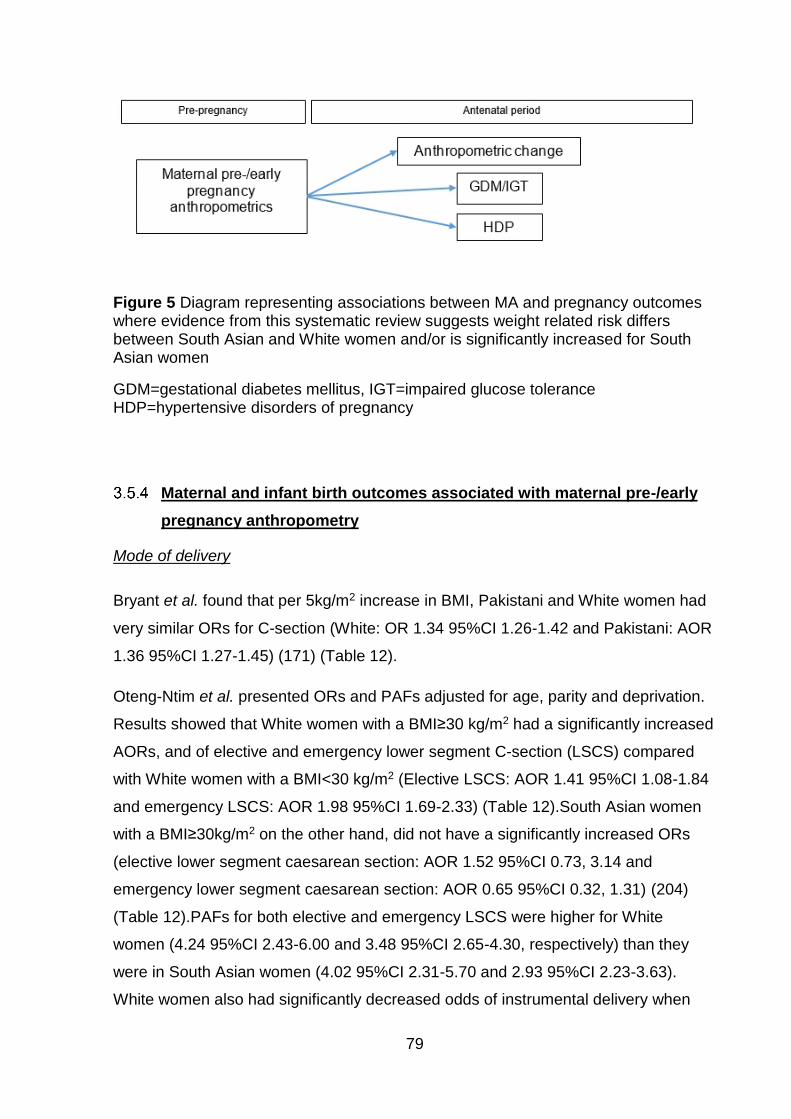
79
Maternal and infant birth outcomes associated with maternal pre-/early
pregnancy anthropometry
Mode of delivery
Bryant et al. found that per 5kg/m2 increase in BMI, Pakistani and White women had
very similar ORs for C-section (White: OR 1.34 95%CI 1.26-1.42 and Pakistani: AOR
1.36 95%CI 1.27-1.45) (171) (Table 12).
Oteng-Ntim et al. presented ORs and PAFs adjusted for age, parity and deprivation.
Results showed that White women with a BMI≥30 kg/m2 had a significantly increased
AORs, and of elective and emergency lower segment C-section (LSCS) compared
with White women with a BMI<30 kg/m2 (Elective LSCS: AOR 1.41 95%CI 1.08-1.84
and emergency LSCS: AOR 1.98 95%CI 1.69-2.33) (Table 12).South Asian women
with a BMI≥30kg/m2 on the other hand, did not have a significantly increased ORs
(elective lower segment caesarean section: AOR 1.52 95%CI 0.73, 3.14 and
emergency lower segment caesarean section: AOR 0.65 95%CI 0.32, 1.31) (204)
(Table 12).PAFs for both elective and emergency LSCS were higher for White
women (4.24 95%CI 2.43-6.00 and 3.48 95%CI 2.65-4.30, respectively) than they
were in South Asian women (4.02 95%CI 2.31-5.70 and 2.93 95%CI 2.23-3.63).
White women also had significantly decreased odds of instrumental delivery when
Figure 5 Diagram representing associations between MA and pregnancy outcomes where evidence from this systematic review suggests weight related risk differs between South Asian and White women and/or is significantly increased for South Asian women
GDM=gestational diabetes mellitus, IGT=impaired glucose tolerance HDP=hypertensive disorders of pregnancy
80
South Asian women did not (White: AOR 0.78 95% CI 0.63-0.96 and South Asian:
AOR 1.04 95%CI 0.50-2.16), PAFs for instrumental delivery were higher in White
women than South Asian (3.48 95%CI 2.65, 4.30 and -1.57 95%CI -2.30,-0.84,
respectively) (204) (Table 12).There was no evidence which provided difference in
means of MA in women with certain modes of delivery.
Distance from skin to epidural space
The systematic search identified only one study which investigated the distance from
skin to epidural space at a range of BMI values (204). Results showed that at each
BMI, the distance was higher for White women compared with South Asian, although
no p-values were available to indicate statistical significance of the ethnic difference
(208) (Table 18).
Table 18 Ethnic difference in distance from skin to lumbar epidural space by maternal BMI
Author and study year
Exposure: BMI (kg/m2)
Pregnancy outcome: Distance from skin to lumbar epidural space (cm)
White ethnic group South Asian ethnic group
Sharma et al. 2011
20 25 30 35 40
4.7 5.3 6.0 6.6 7.2
4.5 5.1 5.7 6.2 6.8
BMI: Body mass index
Congenital anomaly
Sheridan et al. found that when women with a BMI<18.5kg/m2 were compared with
women of BMI18.5-24.9kg/m2, there was no significant increase in the risk of
congenital anomaly for either White or Pakistani women (White: RR 1.50, 95%CI
0.47-4.18 and Pakistani: RR 0.96, 95%CI 0.54-1.73) (200) (Table 12).This was also
the case for women with a BMI 25-29.9 kg/m2 (White: RR 1.00 95%CI 0.59-1.70 and
Pakistani: RR 1.03, 95%CI 0.76-1.39) and those with a BMI≥30kg/m2 (White: RR
1.22 95%CI 0.73-2.04 and Pakistani RR 0.69 95%CI 0.45-1.03) (200) (Table 12).
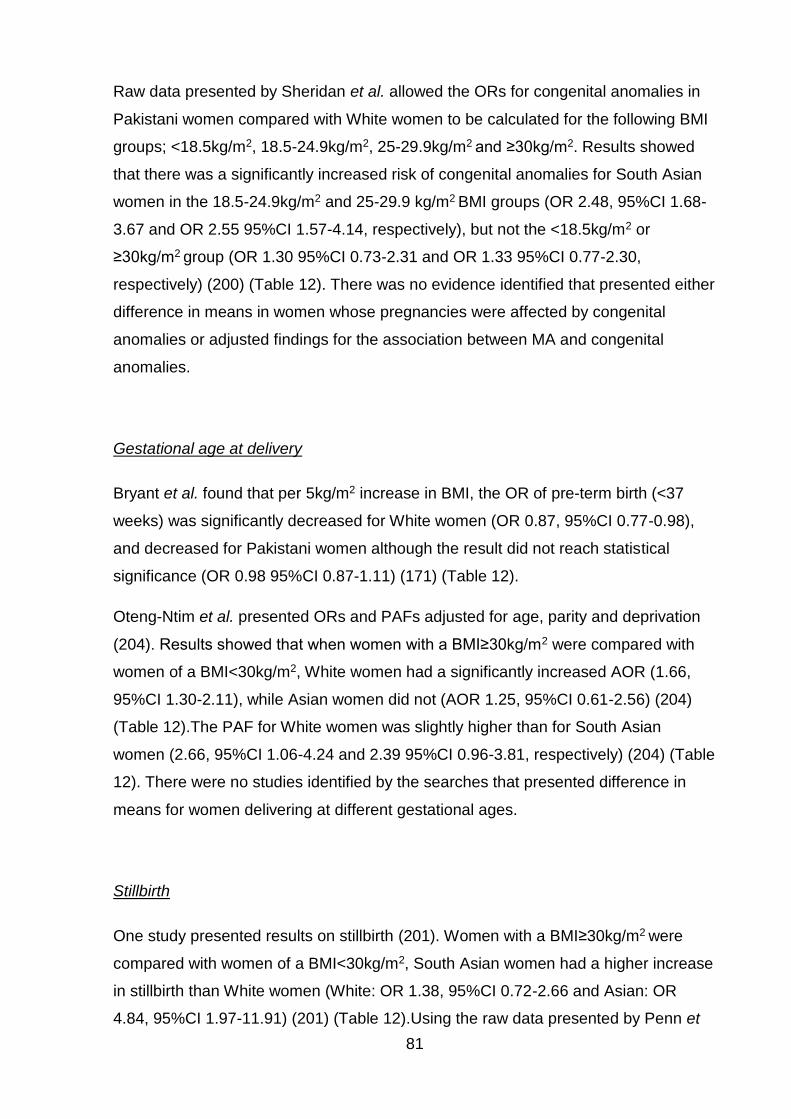
81
Raw data presented by Sheridan et al. allowed the ORs for congenital anomalies in
Pakistani women compared with White women to be calculated for the following BMI
groups; <18.5kg/m2, 18.5-24.9kg/m2, 25-29.9kg/m2 and ≥30kg/m2. Results showed
that there was a significantly increased risk of congenital anomalies for South Asian
women in the 18.5-24.9kg/m2 and 25-29.9 kg/m2 BMI groups (OR 2.48, 95%CI 1.68-
3.67 and OR 2.55 95%CI 1.57-4.14, respectively), but not the <18.5kg/m2 or
≥30kg/m2 group (OR 1.30 95%CI 0.73-2.31 and OR 1.33 95%CI 0.77-2.30,
respectively) (200) (Table 12). There was no evidence identified that presented either
difference in means in women whose pregnancies were affected by congenital
anomalies or adjusted findings for the association between MA and congenital
anomalies.
Gestational age at delivery
Bryant et al. found that per 5kg/m2 increase in BMI, the OR of pre-term birth (<37
weeks) was significantly decreased for White women (OR 0.87, 95%CI 0.77-0.98),
and decreased for Pakistani women although the result did not reach statistical
significance (OR 0.98 95%CI 0.87-1.11) (171) (Table 12).
Oteng-Ntim et al. presented ORs and PAFs adjusted for age, parity and deprivation
(204). Results showed that when women with a BMI≥30kg/m2 were compared with
women of a BMI<30kg/m2, White women had a significantly increased AOR (1.66,
95%CI 1.30-2.11), while Asian women did not (AOR 1.25, 95%CI 0.61-2.56) (204)
(Table 12).The PAF for White women was slightly higher than for South Asian
women (2.66, 95%CI 1.06-4.24 and 2.39 95%CI 0.96-3.81, respectively) (204) (Table
12). There were no studies identified by the searches that presented difference in
means for women delivering at different gestational ages.
Stillbirth
One study presented results on stillbirth (201). Women with a BMI≥30kg/m2 were
compared with women of a BMI<30kg/m2, South Asian women had a higher increase
in stillbirth than White women (White: OR 1.38, 95%CI 0.72-2.66 and Asian: OR
4.84, 95%CI 1.97-11.91) (201) (Table 12).Using the raw data presented by Penn et
82
al., unadjusted ORs for the risk of stillbirth were calculated comparing Asian women
to White women of the same BMI. Results showed that while there was no significant
increase in risk of stillbirth when South Asian women with a BMI<30kg/m2 were
compared with White women of the same BMI (OR 1.71, 95%CI 0.95-3.07), at a
BMI≥30kg/m2 South Asian women had a significantly higher risk (OR 6.13, 95%CI
2.39-15.73) (Table 13).
Penn et al. also presented ORs which were adjusted for maternal age, hypertension
and parity (201). When women with a BMI≥30kg/m2 were compared with women of a
BMI<30kg/m2, South Asian women had a higher increase in stillbirth than White
women, although in both White and Asian women the effect size was reduced
following adjustment (White AOR 1.32, 95%CI 0.68-2.57 and Asian AOR 4.64,
95%CI1.84-11.70) (201) (Table 12). Asian specific BMI criteria were also applied and
showed that South Asian women with obesity had an AOR of stillbirth of 2.83 (95%CI
1.17-6.85). While this is lower than the AOR when using the BMI criteria for the
general population, it is still higher than the AOR for the White population and the
confidence interval is narrower suggesting that it is a more precise estimate (201)
(Table 12). There were no studies identified by the review that presented difference
in means for women who had a stillbirth.
Birth weight
Bissenden et al. presented a graph that showed that in a population of women having
well grown babies (babies above the 10th centile according to Thomson et al. 1968
(219)), Asian women delivering well grown babies have mean weight (kg), middle
upper arm circumference and bicep SFT (mm) that was not significantly different than
that of White women delivering well grown babies (non-significant, no p-values
specified) South Asian women in this study did, however, have significantly higher
mean triceps and subscapular SFT (mm) than White women (p<0.025, and p<0.005,
respectively) (203).
Bryant et al. found that per 5kg/m2 increase in BMI, Pakistani women had a higher
OR for macrosomia than White British women (White British: OR 1.36, 95%CI 1.27-
1.47 and Pakistani: OR 1.57, 95%CI 1.41-1.75) (171) (Table 12).
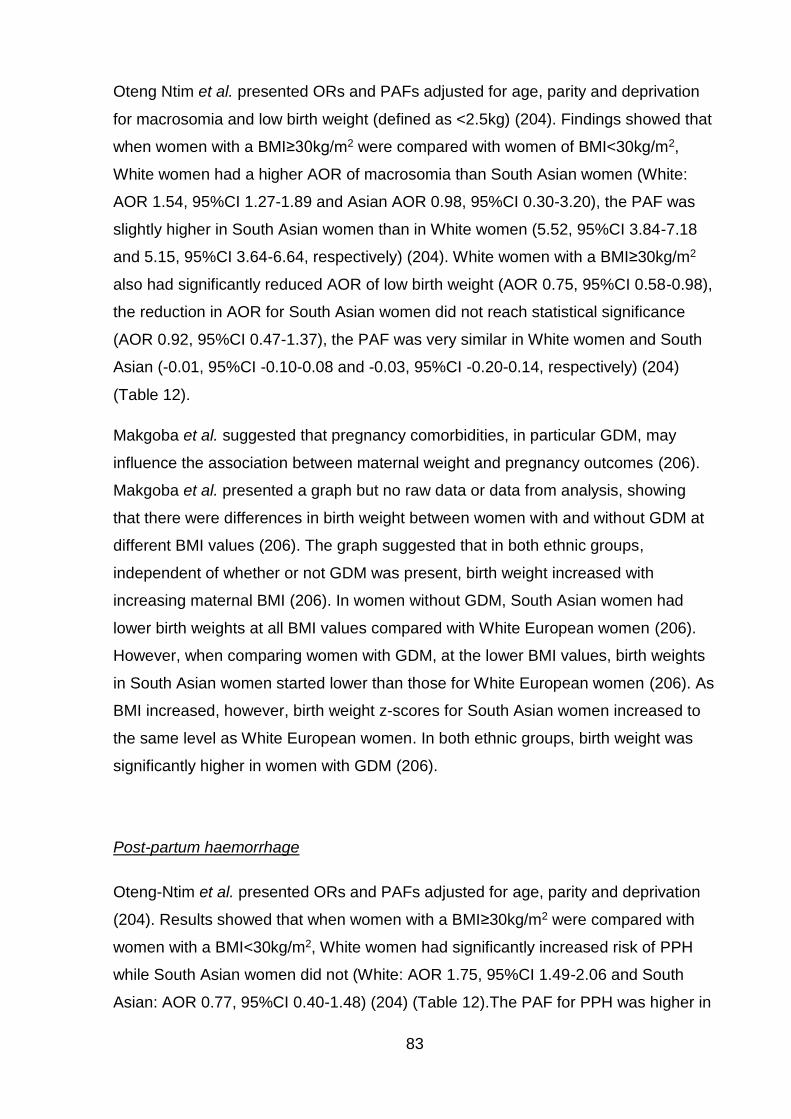
83
Oteng Ntim et al. presented ORs and PAFs adjusted for age, parity and deprivation
for macrosomia and low birth weight (defined as <2.5kg) (204). Findings showed that
when women with a BMI≥30kg/m2 were compared with women of BMI<30kg/m2,
White women had a higher AOR of macrosomia than South Asian women (White:
AOR 1.54, 95%CI 1.27-1.89 and Asian AOR 0.98, 95%CI 0.30-3.20), the PAF was
slightly higher in South Asian women than in White women (5.52, 95%CI 3.84-7.18
and 5.15, 95%CI 3.64-6.64, respectively) (204). White women with a BMI≥30kg/m2
also had significantly reduced AOR of low birth weight (AOR 0.75, 95%CI 0.58-0.98),
the reduction in AOR for South Asian women did not reach statistical significance
(AOR 0.92, 95%CI 0.47-1.37), the PAF was very similar in White women and South
Asian (-0.01, 95%CI -0.10-0.08 and -0.03, 95%CI -0.20-0.14, respectively) (204)
(Table 12).
Makgoba et al. suggested that pregnancy comorbidities, in particular GDM, may
influence the association between maternal weight and pregnancy outcomes (206).
Makgoba et al. presented a graph but no raw data or data from analysis, showing
that there were differences in birth weight between women with and without GDM at
different BMI values (206). The graph suggested that in both ethnic groups,
independent of whether or not GDM was present, birth weight increased with
increasing maternal BMI (206). In women without GDM, South Asian women had
lower birth weights at all BMI values compared with White European women (206).
However, when comparing women with GDM, at the lower BMI values, birth weights
in South Asian women started lower than those for White European women (206). As
BMI increased, however, birth weight z-scores for South Asian women increased to
the same level as White European women. In both ethnic groups, birth weight was
significantly higher in women with GDM (206).
Post-partum haemorrhage
Oteng-Ntim et al. presented ORs and PAFs adjusted for age, parity and deprivation
(204). Results showed that when women with a BMI≥30kg/m2 were compared with
women with a BMI<30kg/m2, White women had significantly increased risk of PPH
while South Asian women did not (White: AOR 1.75, 95%CI 1.49-2.06 and South
Asian: AOR 0.77, 95%CI 0.40-1.48) (204) (Table 12).The PAF for PPH was higher in
84
White women than South Asian (3.55%, 95%CI 2.67, 4.41 and 3.28%, 95%CI 2.47,
4.09, respectively) (204) (Table 12).There were no studies identified which presented
either difference in means in women with PPH, or the unadjusted effect size for the
association between MA and PPH.
Admission to neonatal intensive care unit
Oteng-Ntim et al. presented ORs and PAFs for admission to the NICU adjusted for
age, parity and deprivation (204). Results showed that when women of BMI≥30kg/m2
were compared with women of BMI<30kg/m2, White women had a significantly
increased AOR of admission to the NICU (White AOR 1.92, 95%CI 1.52-1.42 and
South Asian AOR 1.12, 95%CI 0.52-2.42), the PAF was higher in White women than
South Asian women (3.75%, 95%CI 2.05, 5.41 and 3.52%, 95%CI 1.94, 5.07,
respectively) (204) (Table 12).The searches did not identify any studies which
presented difference in means in women with admission to the NICU, or the
unadjusted effect size for the association between maternal pre-/early pregnancy
anthropometrics and admission to the NICU.
Perinatal death
Oteng-Ntim et al. presented ORs for perinatal death adjusted for age, parity and
deprivation (204). Results showed that when women with a BMI≥30kg/m2 were
compared with women with a BMI<30kg/m2,both White and South Asian women with
a BMI≥30kg/m2 had an increased AOR of perinatal death, neither AOR reached
statistical significance (White: AOR 2.19, 95%CI 0.96-4.98 and South Asian: AOR
2.00, 95%CI 0.46-8.71), the PAF was slightly higher in White women than South
Asian women (3.17%, 95%CI -2.96, 8.93 and 3.02%, 95%CI -2.78, 8.50,
respectively) (204) (Table 12).There were no studies identified which presented
either difference in means in women with perinatal death, or the unadjusted effect
size for the association between MA and perinatal death.
A summary of the evidence identified for birth outcomes associated with MA is given
in Table 19. This information has then been depicted in the form of a conceptual

85
model diagram (Figure 6). Arrows represent evidence of an association between two
variables.
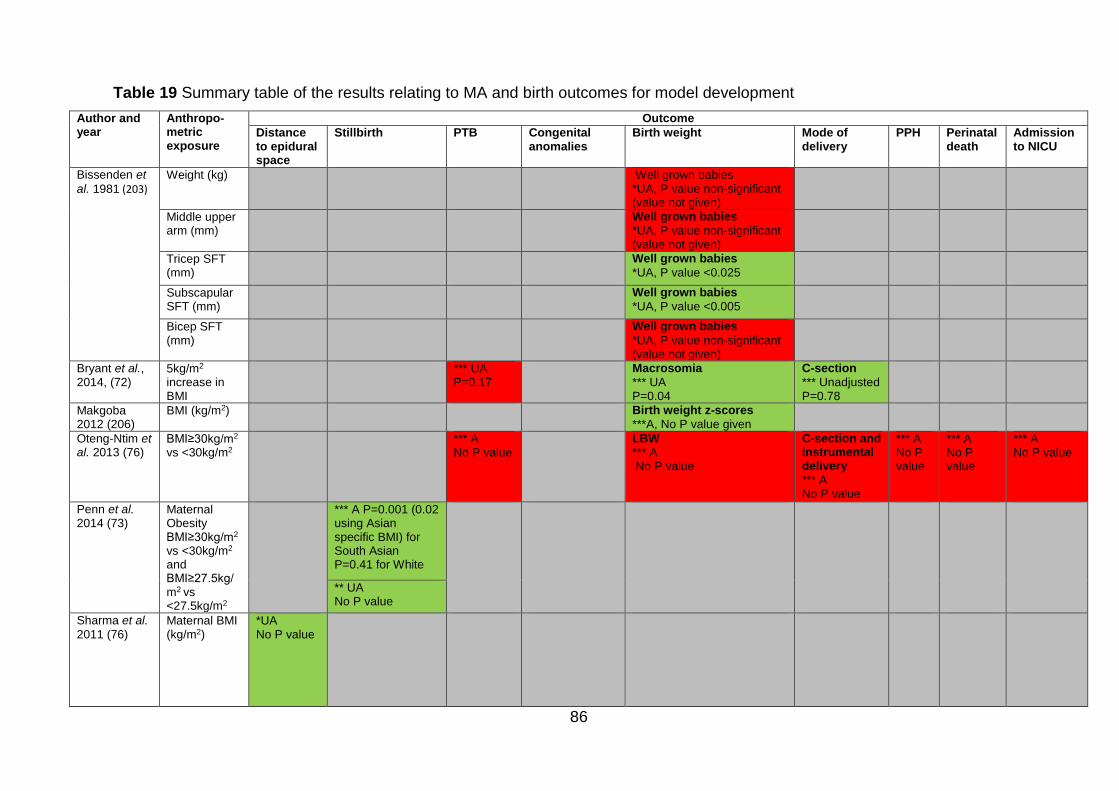
86
Table 19 Summary table of the results relating to MA and birth outcomes for model development
Author and year
Anthropo-metric exposure
Outcome
Distance to epidural space
Stillbirth PTB Congenital anomalies
Birth weight Mode of delivery
PPH Perinatal death
Admission to NICU
Bissenden et
al. 1981 (203)
Weight (kg) Well grown babies *UA, P value non-significant (value not given)
Middle upper arm (mm)
Well grown babies
*UA, P value non-significant (value not given)
Tricep SFT (mm)
Well grown babies
*UA, P value <0.025
Subscapular SFT (mm)
Well grown babies
*UA, P value <0.005
Bicep SFT (mm)
Well grown babies
*UA, P value non-significant (value not given)
Bryant et al., 2014, (72)
5kg/m2 increase in BMI
*** UA P=0.17
Macrosomia
*** UA P=0.04
C-section
*** Unadjusted P=0.78
Makgoba 2012 (206)
BMI (kg/m2) Birth weight z-scores
***A, No P value given
Oteng-Ntim et al. 2013 (76)
BMI≥30kg/m2 vs <30kg/m2
*** A No P value
LBW
*** A No P value
C-section and instrumental delivery
*** A No P value
*** A No P value
*** A No P value
*** A No P value
Penn et al. 2014 (73)
Maternal Obesity BMI≥30kg/m2
vs <30kg/m2
and BMI≥27.5kg/m2 vs <27.5kg/m2
*** A P=0.001 (0.02 using Asian specific BMI) for South Asian P=0.41 for White
** UA No P value
Sharma et al.
2011 (76) Maternal BMI (kg/m2)
*UA No P value
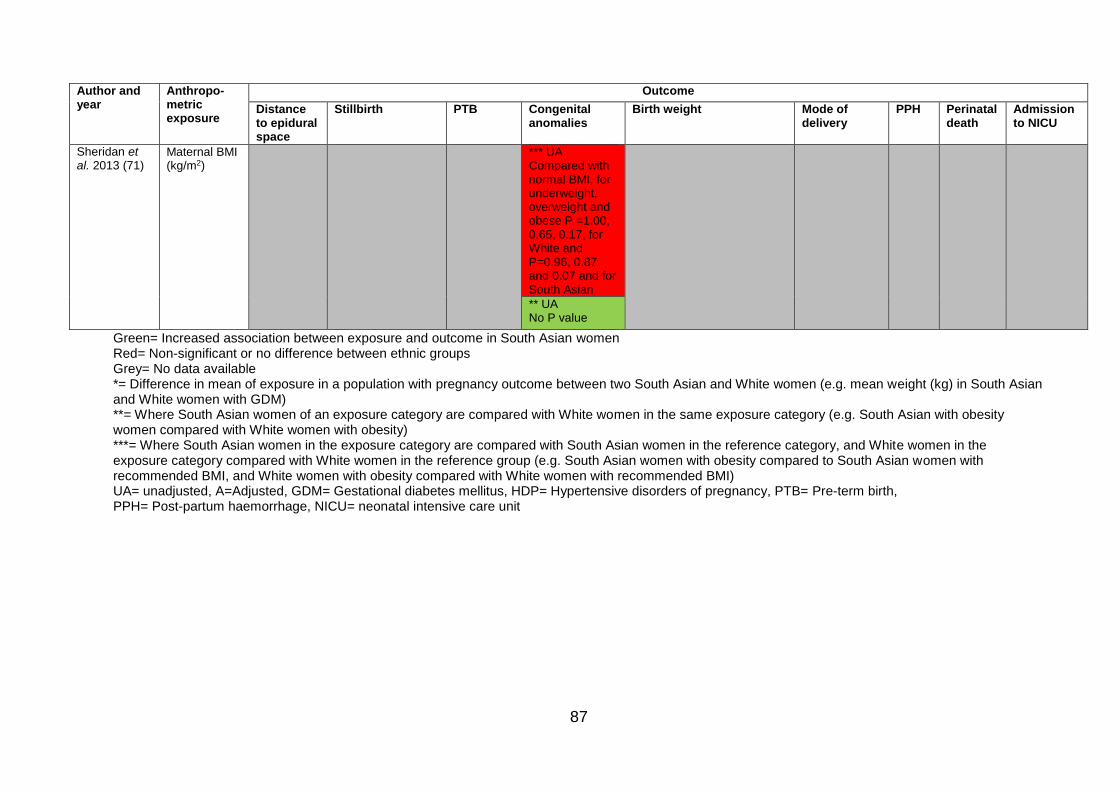
87
Author and year
Anthropo-metric exposure
Outcome
Distance to epidural space
Stillbirth PTB Congenital anomalies
Birth weight Mode of delivery
PPH Perinatal death
Admission to NICU
Sheridan et al. 2013 (71)
Maternal BMI (kg/m2)
*** UA Compared with normal BMI, for underweight, overweight and obese P =1.00, 0.65, 0.17, for White and P=0.96, 0.87 and 0.07 and for South Asian
** UA No P value
Green= Increased association between exposure and outcome in South Asian women Red= Non-significant or no difference between ethnic groups Grey= No data available *= Difference in mean of exposure in a population with pregnancy outcome between two South Asian and White women (e.g. mean weight (kg) in South Asian and White women with GDM) **= Where South Asian women of an exposure category are compared with White women in the same exposure category (e.g. South Asian with obesity women compared with White women with obesity) ***= Where South Asian women in the exposure category are compared with South Asian women in the reference category, and White women in the exposure category compared with White women in the reference group (e.g. South Asian women with obesity compared to South Asian women with recommended BMI, and White women with obesity compared with White women with recommended BMI) UA= unadjusted, A=Adjusted, GDM= Gestational diabetes mellitus, HDP= Hypertensive disorders of pregnancy, PTB= Pre-term birth, PPH= Post-partum haemorrhage, NICU= neonatal intensive care unit
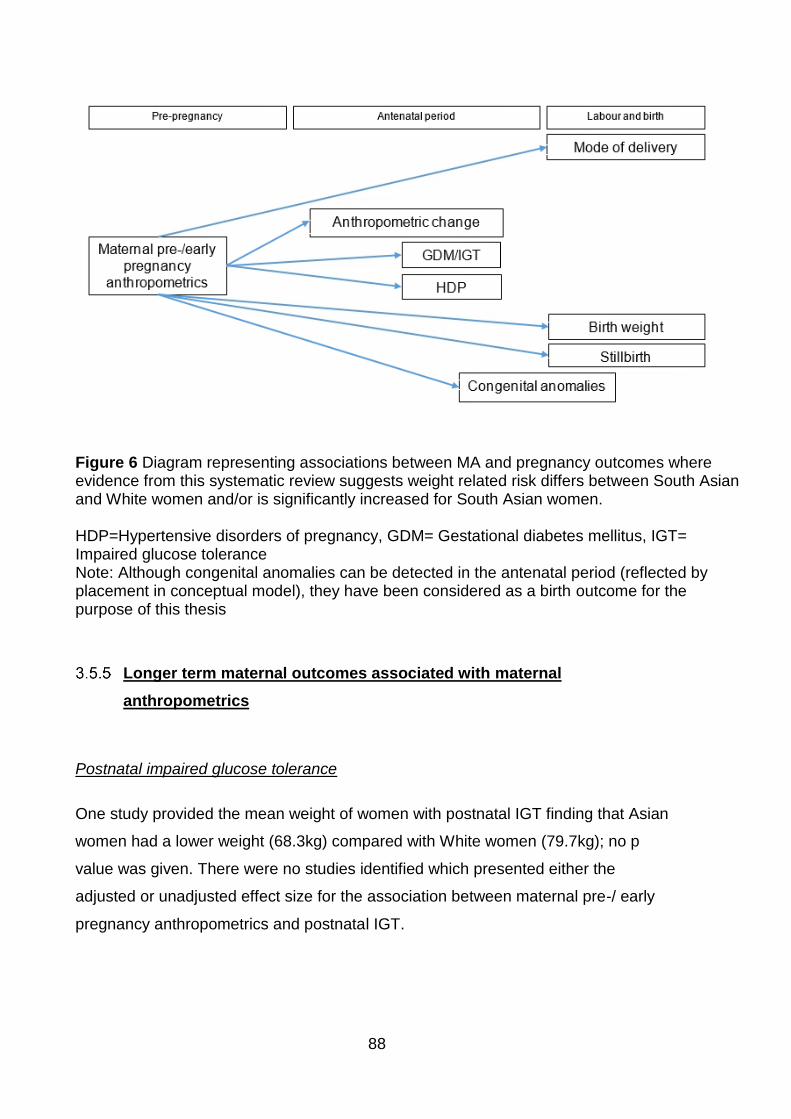
88
Longer term maternal outcomes associated with maternal
anthropometrics
Postnatal impaired glucose tolerance
One study provided the mean weight of women with postnatal IGT finding that Asian
women had a lower weight (68.3kg) compared with White women (79.7kg); no p
value was given. There were no studies identified which presented either the
adjusted or unadjusted effect size for the association between maternal pre-/ early
pregnancy anthropometrics and postnatal IGT.
Figure 6 Diagram representing associations between MA and pregnancy outcomes where evidence from this systematic review suggests weight related risk differs between South Asian and White women and/or is significantly increased for South Asian women. HDP=Hypertensive disorders of pregnancy, GDM= Gestational diabetes mellitus, IGT= Impaired glucose tolerance Note: Although congenital anomalies can be detected in the antenatal period (reflected by placement in conceptual model), they have been considered as a birth outcome for the purpose of this thesis
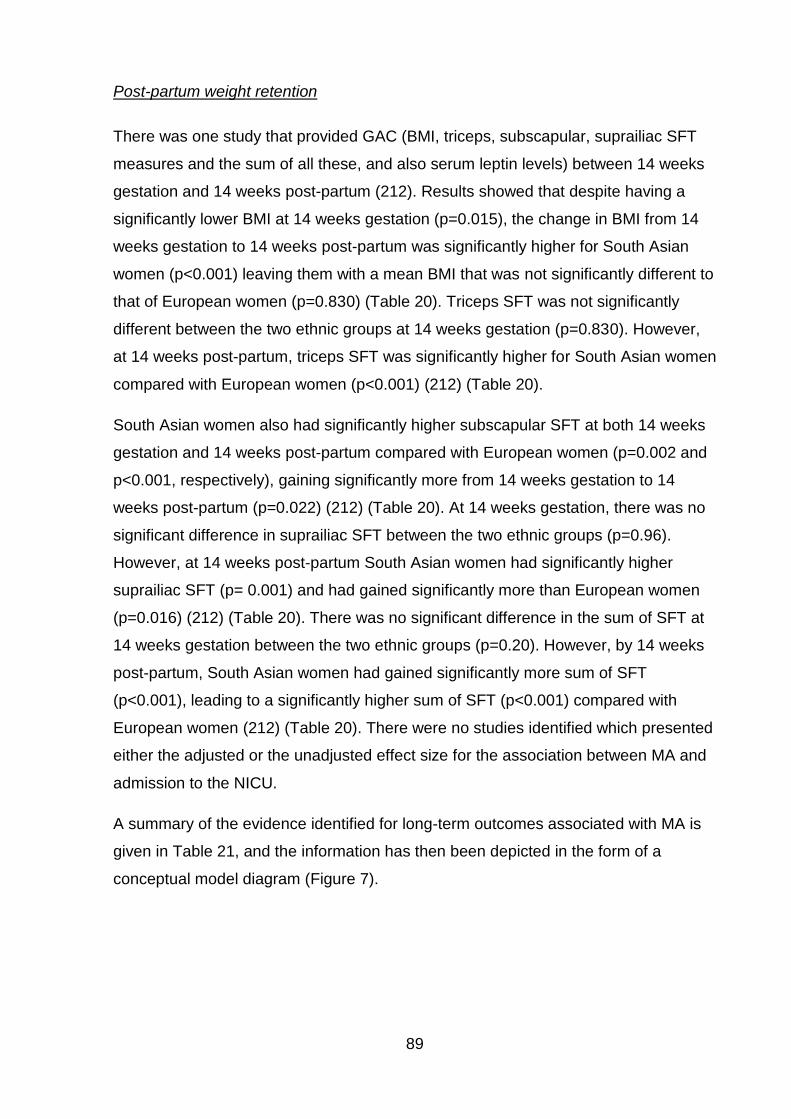
89
Post-partum weight retention
There was one study that provided GAC (BMI, triceps, subscapular, suprailiac SFT
measures and the sum of all these, and also serum leptin levels) between 14 weeks
gestation and 14 weeks post-partum (212). Results showed that despite having a
significantly lower BMI at 14 weeks gestation (p=0.015), the change in BMI from 14
weeks gestation to 14 weeks post-partum was significantly higher for South Asian
women (p<0.001) leaving them with a mean BMI that was not significantly different to
that of European women (p=0.830) (Table 20). Triceps SFT was not significantly
different between the two ethnic groups at 14 weeks gestation (p=0.830). However,
at 14 weeks post-partum, triceps SFT was significantly higher for South Asian women
compared with European women (p<0.001) (212) (Table 20).
South Asian women also had significantly higher subscapular SFT at both 14 weeks
gestation and 14 weeks post-partum compared with European women (p=0.002 and
p<0.001, respectively), gaining significantly more from 14 weeks gestation to 14
weeks post-partum (p=0.022) (212) (Table 20). At 14 weeks gestation, there was no
significant difference in suprailiac SFT between the two ethnic groups (p=0.96).
However, at 14 weeks post-partum South Asian women had significantly higher
suprailiac SFT (p= 0.001) and had gained significantly more than European women
(p=0.016) (212) (Table 20). There was no significant difference in the sum of SFT at
14 weeks gestation between the two ethnic groups (p=0.20). However, by 14 weeks
post-partum, South Asian women had gained significantly more sum of SFT
(p<0.001), leading to a significantly higher sum of SFT (p<0.001) compared with
European women (212) (Table 20). There were no studies identified which presented
either the adjusted or the unadjusted effect size for the association between MA and
admission to the NICU.
A summary of the evidence identified for long-term outcomes associated with MA is
given in Table 21, and the information has then been depicted in the form of a
conceptual model diagram (Figure 7).
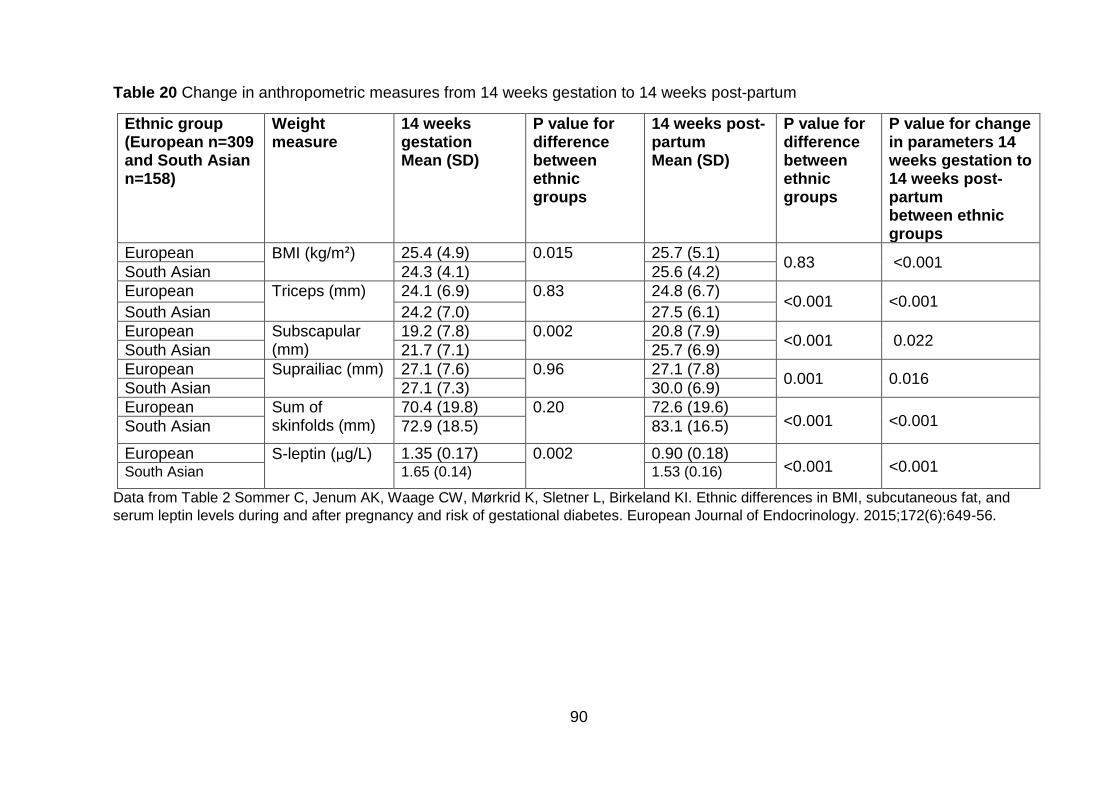
90
Table 20 Change in anthropometric measures from 14 weeks gestation to 14 weeks post-partum
Ethnic group (European n=309 and South Asian n=158)
Weight measure
14 weeks gestation Mean (SD)
P value for difference between ethnic groups
14 weeks post-partum Mean (SD)
P value for difference between ethnic groups
P value for change in parameters 14 weeks gestation to 14 weeks post-partum between ethnic groups
European BMI (kg/m²) 25.4 (4.9) 0.015 25.7 (5.1) 0.83 <0.001
South Asian 24.3 (4.1) 25.6 (4.2)
European Triceps (mm) 24.1 (6.9) 0.83 24.8 (6.7) <0.001 <0.001
South Asian 24.2 (7.0) 27.5 (6.1)
European Subscapular (mm)
19.2 (7.8) 0.002 20.8 (7.9) <0.001 0.022
South Asian 21.7 (7.1) 25.7 (6.9)
European Suprailiac (mm) 27.1 (7.6) 0.96 27.1 (7.8) 0.001 0.016
South Asian 27.1 (7.3) 30.0 (6.9)
European Sum of skinfolds (mm)
70.4 (19.8) 0.20 72.6 (19.6) <0.001 <0.001 South Asian 72.9 (18.5) 83.1 (16.5)
European S-leptin (µg/L) 1.35 (0.17) 0.002 0.90 (0.18) <0.001 <0.001 South Asian 1.65 (0.14) 1.53 (0.16)
Data from Table 2 Sommer C, Jenum AK, Waage CW, Mørkrid K, Sletner L, Birkeland KI. Ethnic differences in BMI, subcutaneous fat, and
serum leptin levels during and after pregnancy and risk of gestational diabetes. European Journal of Endocrinology. 2015;172(6):649-56.
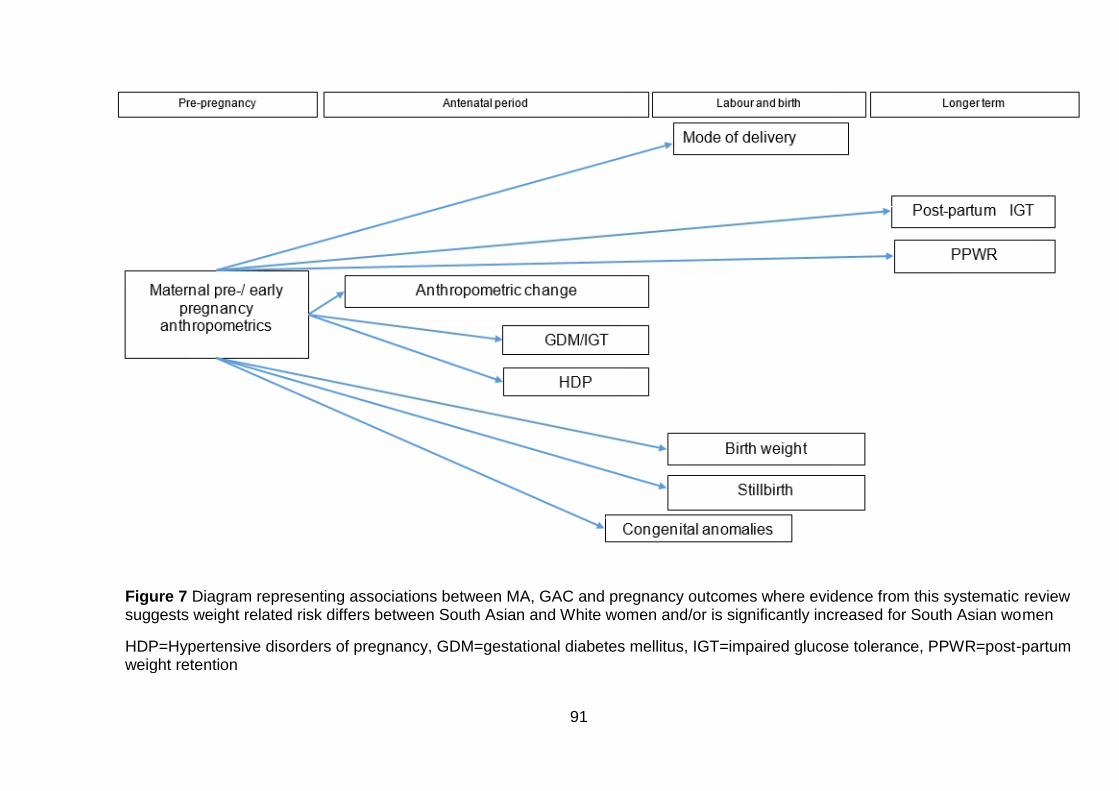
91
Figure 7 Diagram representing associations between MA, GAC and pregnancy outcomes where evidence from this systematic review suggests weight related risk differs between South Asian and White women and/or is significantly increased for South Asian women
HDP=Hypertensive disorders of pregnancy, GDM=gestational diabetes mellitus, IGT=impaired glucose tolerance, PPWR=post-partum weight retention
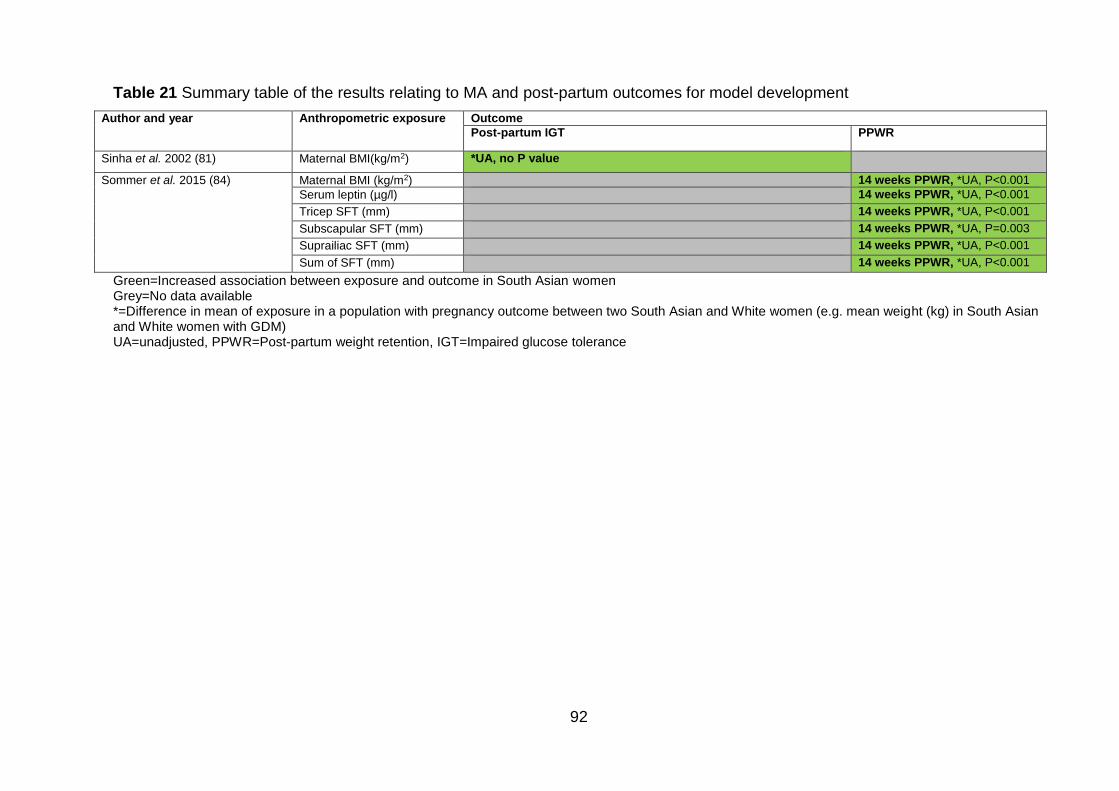
92
Table 21 Summary table of the results relating to MA and post-partum outcomes for model development
Author and year Anthropometric exposure Outcome
Post-partum IGT PPWR
Sinha et al. 2002 (81) Maternal BMI(kg/m2) *UA, no P value
Sommer et al. 2015 (84) Maternal BMI (kg/m2) 14 weeks PPWR, *UA, P<0.001
Serum leptin (µg/l) 14 weeks PPWR, *UA, P<0.001
Tricep SFT (mm) 14 weeks PPWR, *UA, P<0.001
Subscapular SFT (mm) 14 weeks PPWR, *UA, P=0.003
Suprailiac SFT (mm) 14 weeks PPWR, *UA, P<0.001
Sum of SFT (mm) 14 weeks PPWR, *UA, P<0.001
Green=Increased association between exposure and outcome in South Asian women Grey=No data available *=Difference in mean of exposure in a population with pregnancy outcome between two South Asian and White women (e.g. mean weight (kg) in South Asian and White women with GDM) UA=unadjusted, PPWR=Post-partum weight retention, IGT=Impaired glucose tolerance
93
Change in gestational anthropometric change during pregnancy and
pregnancy outcomes
Two studies presented results for GAC and pregnancy outcomes; both studies
considered GAC as a continuous variable (212, 215). One presented total weight
gain (kg) (215), and the other presented weight gain (kg per week), fat mass gain (kg
per week), truncal fat gain (kg per week), and mean skinfold gain (mm per week)
(212). Results were only available for the association between GWG and GDM.
Gestational diabetes
One study presented the mean GWG in a population of women with GDM (215).
Results showed that there was lower average weight gain in South Asian women
with GDM. However there was no significant difference between the two groups
(p=0.163) (215) (Table 22).
Sommer et al. calculated AORs for the association between measures of GAC
(weight gain (kg per week), fat mass gain (kg per week), truncal fat gain (kg), mean
skinfold gain (mm)) and GDM (211). When adjusting for ethnic origin, gestational
week at inclusion, age and parity, results showed that, compared to the White ethnic
group, South Asian women had an increased risk of GDM for all measures of GAC
(weight gain: AOR 2.43, 95%CI 1.62-3.65, fat mass gain: AOR 2.46, 95%CI 1.64-
3.69, truncal fat gain AOR 2.44, 95%CI 1.62-3.65, mean skinfold gain: AOR 2.50,
95%CI 1.62-3.84) (211) (Table 23).When additionally adjusting for maternal BMI
(model 2), the risk of GDM development increased (weight gain: AOR 2.77, 95%CI
1.83-4.21, fat mass gain: AOR 2.80, 95%CI 1.84-4.26, truncal fat gain AOR 2.78,
95%CI 1.83-4.22, mean skinfold gain: AOR 2.72, 95%CI 1.75-4.23) (211) (Table 23).
This suggests that when controlling for the effects of maternal BMI, the effect of
GWG, gain in SFT and truncal fat gain on the development of GDM was increased.
Maternal homeostatic model assessment (HOMA, also HOMA-IR), a method for
assessing β-cell function and insulin resistance (IR) from basal (fasting) glucose and
insulin or C-peptide concentrations, was also added into the model (model 3). Here,
the risk of GDM in South Asian women decreased, but remained significantly higher
than that for White women (weight gain: AOR 1.84 95%CI 1.16-2.90, fat mass gain:
AOR 1.86, 95%CI 1.18-2.95, truncal fat gain AOR 1.82, 95%CI 1.15-2.89, mean
94
skinfold gain: AOR 1.88, 95%CI 1.16-3.04) (211) (Table 23).There was no
information presented on unadjusted effect size for the association between change
in MA during pregnancy and GDM.
Birth weight
Bissenden et al. presented the incremental GAC from 9-20 weeks to 27-31 weeks
gestation in South Asian and White women having well grown babies (babies above
the 10th centile according to Thomson et al. 1968 (219)) (203). Results showed that
there was no significant difference in weight (kg) or mid upper arm muscle
circumference (mm) in South Asian women and White women delivering well grown
babies (no p values given) (Table 22) (203). Tricep and bicep SFT gain (mm) were
significantly higher in South Asian women than White (p<0.001 and p<0.050,
respectively), the difference in subscapular SFT was increased in South Asian
women although the difference did not reach statistical significance (p=0.070) (203)
(Table 22). There was no information presented on either the unadjusted or adjusted
effect size for the association between change in anthropometrics during pregnancy
and birth weight.
A summary of the evidence identified for outcomes associated with GAC is given in
Table 24, and depicted in the form of a conceptual model diagram in Figure 8.
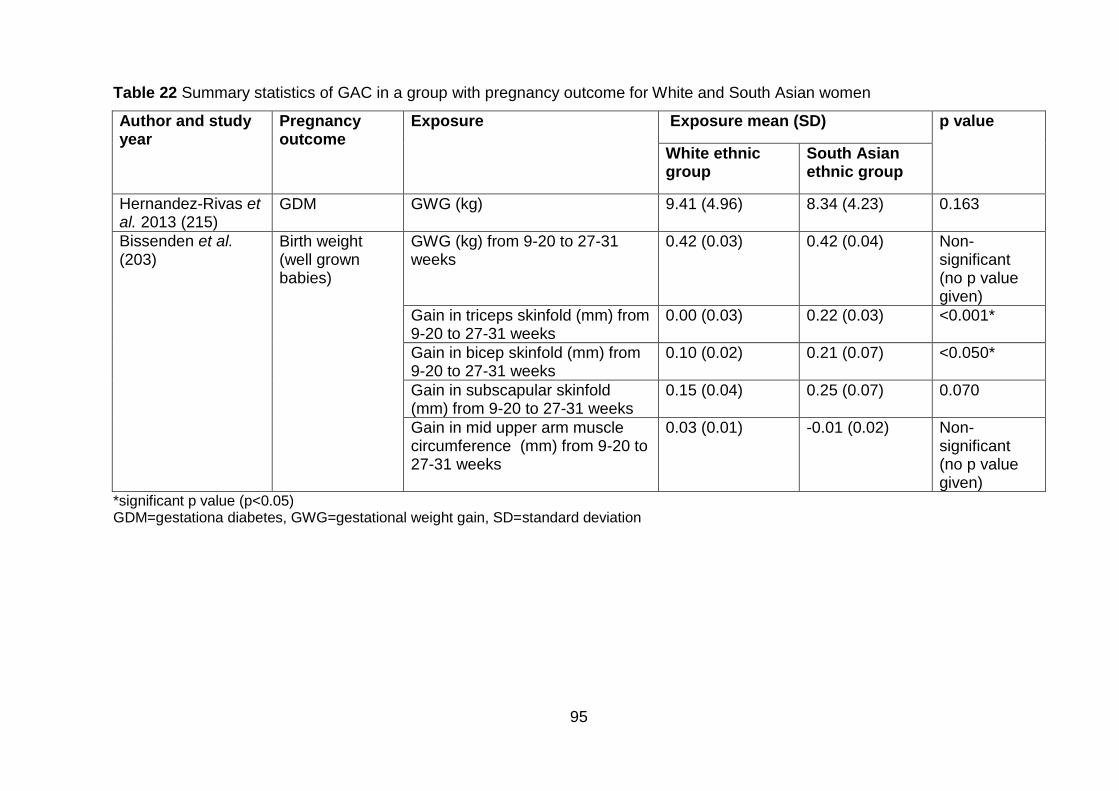
95
Table 22 Summary statistics of GAC in a group with pregnancy outcome for White and South Asian women
Author and study year
Pregnancy outcome
Exposure Exposure mean (SD) p value
White ethnic group
South Asian ethnic group
Hernandez-Rivas et al. 2013 (215)
GDM GWG (kg) 9.41 (4.96) 8.34 (4.23) 0.163
Bissenden et al. (203)
Birth weight (well grown babies)
GWG (kg) from 9-20 to 27-31 weeks
0.42 (0.03) 0.42 (0.04) Non-significant (no p value given)
Gain in triceps skinfold (mm) from 9-20 to 27-31 weeks
0.00 (0.03) 0.22 (0.03) <0.001*
Gain in bicep skinfold (mm) from 9-20 to 27-31 weeks
0.10 (0.02) 0.21 (0.07) <0.050*
Gain in subscapular skinfold (mm) from 9-20 to 27-31 weeks
0.15 (0.04) 0.25 (0.07) 0.070
Gain in mid upper arm muscle circumference (mm) from 9-20 to 27-31 weeks
0.03 (0.01) -0.01 (0.02) Non-significant (no p value given)
*significant p value (p<0.05) GDM=gestationa diabetes, GWG=gestational weight gain, SD=standard deviation
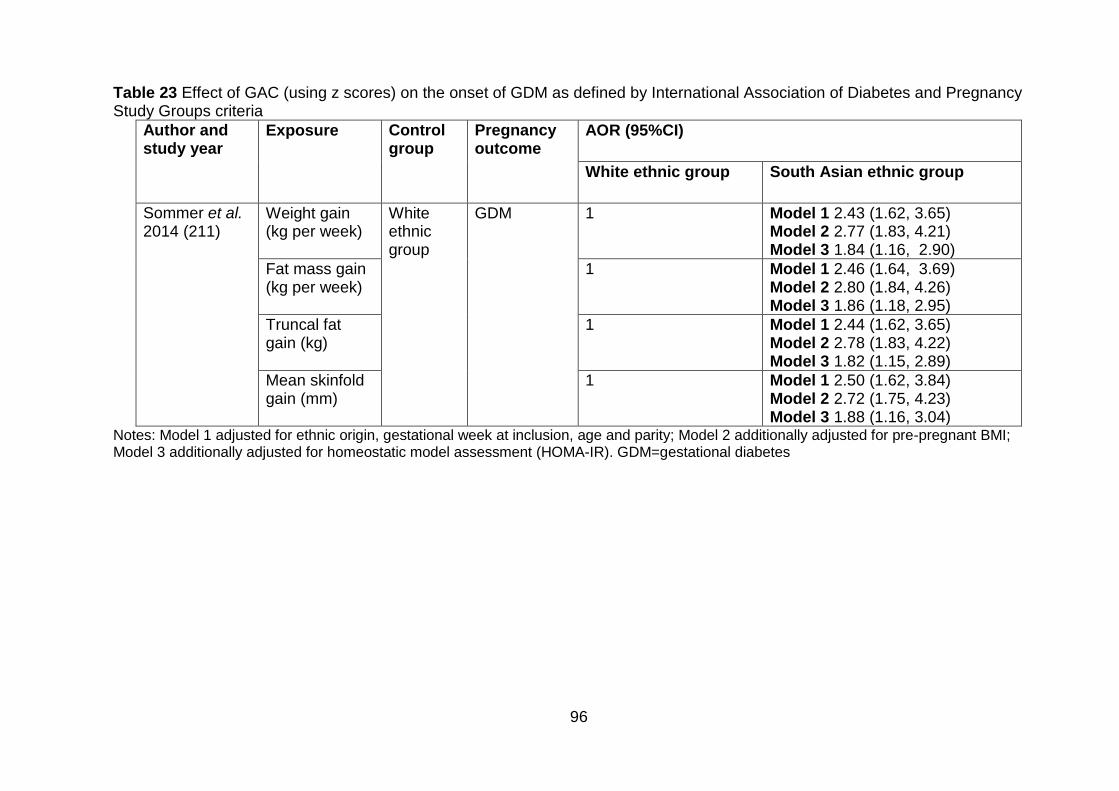
96
Table 23 Effect of GAC (using z scores) on the onset of GDM as defined by International Association of Diabetes and Pregnancy Study Groups criteria
Author and study year
Exposure Control group
Pregnancy outcome
AOR (95%CI)
White ethnic group South Asian ethnic group
Sommer et al. 2014 (211)
Weight gain (kg per week)
White ethnic group
GDM 1 Model 1 2.43 (1.62, 3.65) Model 2 2.77 (1.83, 4.21) Model 3 1.84 (1.16, 2.90)
Fat mass gain (kg per week)
1 Model 1 2.46 (1.64, 3.69) Model 2 2.80 (1.84, 4.26) Model 3 1.86 (1.18, 2.95)
Truncal fat gain (kg)
1 Model 1 2.44 (1.62, 3.65) Model 2 2.78 (1.83, 4.22) Model 3 1.82 (1.15, 2.89)
Mean skinfold gain (mm)
1 Model 1 2.50 (1.62, 3.84) Model 2 2.72 (1.75, 4.23) Model 3 1.88 (1.16, 3.04)
Notes: Model 1 adjusted for ethnic origin, gestational week at inclusion, age and parity; Model 2 additionally adjusted for pre-pregnant BMI; Model 3 additionally adjusted for homeostatic model assessment (HOMA-IR). GDM=gestational diabetes
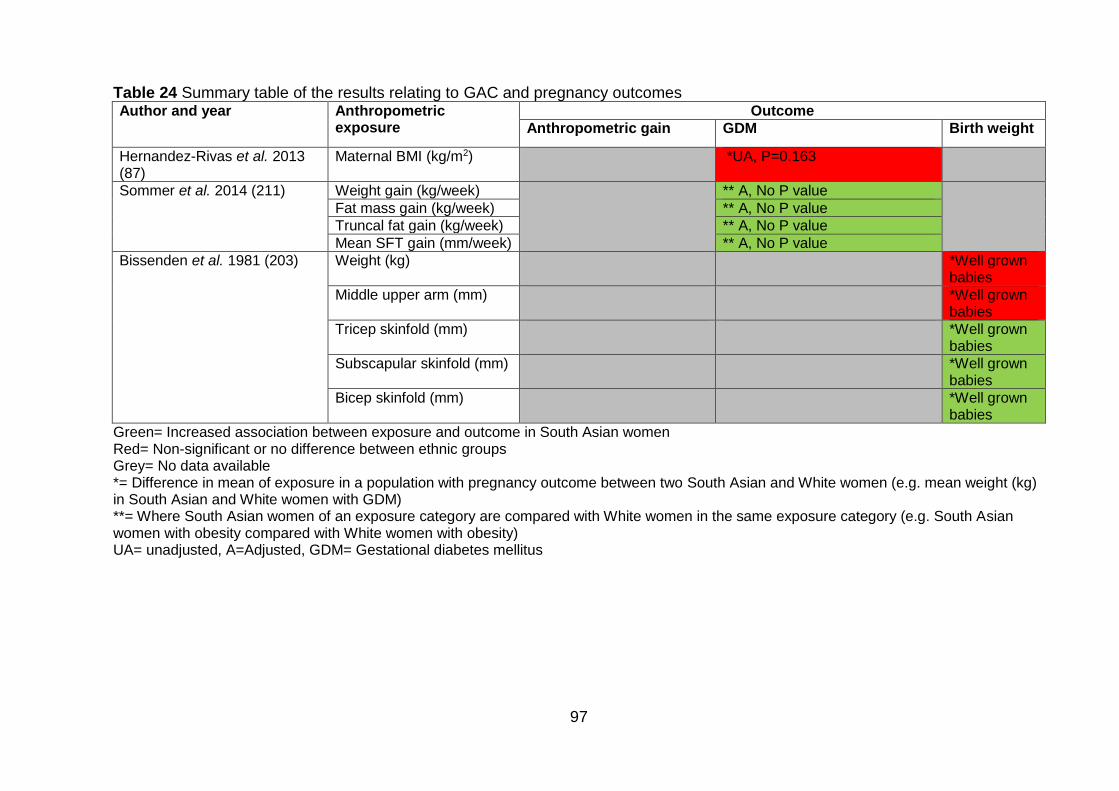
97
Table 24 Summary table of the results relating to GAC and pregnancy outcomes Author and year Anthropometric
exposure Outcome
Anthropometric gain GDM Birth weight
Hernandez-Rivas et al. 2013 (87)
Maternal BMI (kg/m2) *UA, P=0.163
Sommer et al. 2014 (211) Weight gain (kg/week) ** A, No P value
Fat mass gain (kg/week) ** A, No P value
Truncal fat gain (kg/week) ** A, No P value
Mean SFT gain (mm/week) ** A, No P value
Bissenden et al. 1981 (203)
Weight (kg) *Well grown
babies
Middle upper arm (mm) *Well grown babies
Tricep skinfold (mm)
*Well grown babies
Subscapular skinfold (mm) *Well grown babies
Bicep skinfold (mm) *Well grown babies
Green= Increased association between exposure and outcome in South Asian women Red= Non-significant or no difference between ethnic groups Grey= No data available *= Difference in mean of exposure in a population with pregnancy outcome between two South Asian and White women (e.g. mean weight (kg) in South Asian and White women with GDM) **= Where South Asian women of an exposure category are compared with White women in the same exposure category (e.g. South Asian women with obesity compared with White women with obesity) UA= unadjusted, A=Adjusted, GDM= Gestational diabetes mellitus
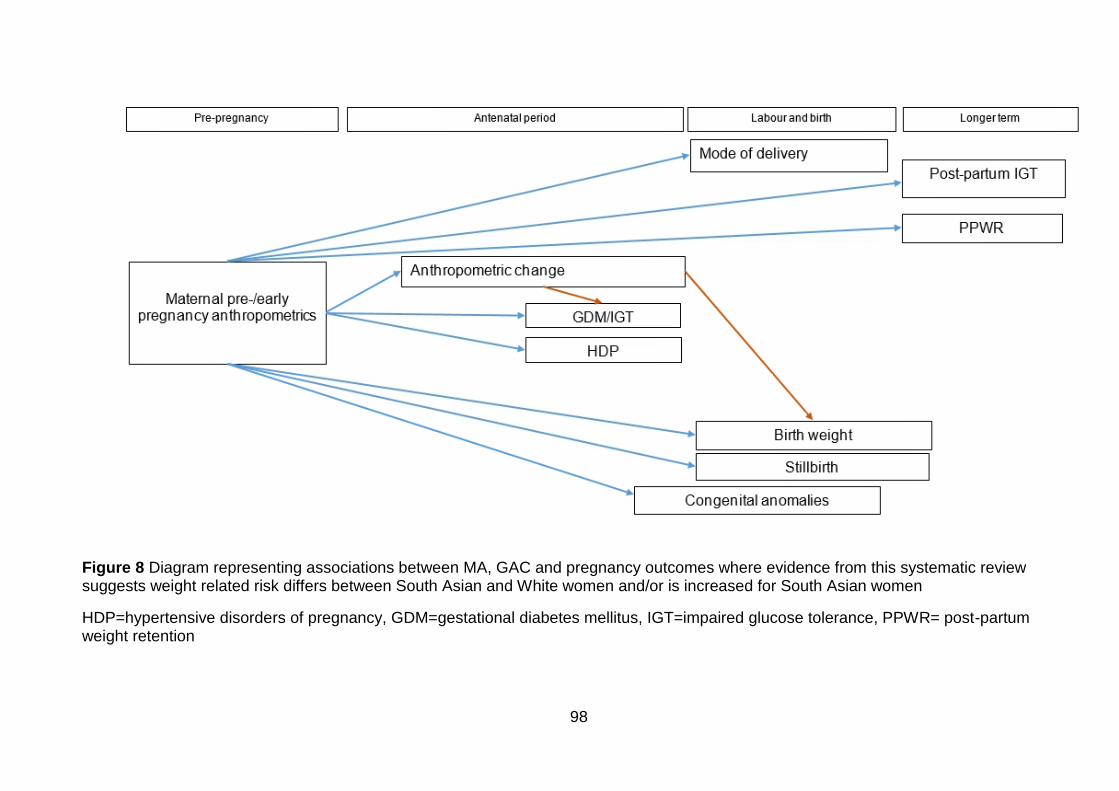
98
Figure 8 Diagram representing associations between MA, GAC and pregnancy outcomes where evidence from this systematic review suggests weight related risk differs between South Asian and White women and/or is increased for South Asian women
HDP=hypertensive disorders of pregnancy, GDM=gestational diabetes mellitus, IGT=impaired glucose tolerance, PPWR= post-partum weight retention
99
Combined influence of maternal anthropometrics, gestational
anthropometric change and pregnancy outcomes
Two studies considered the combined influence of MA and GAC on pregnancy
outcomes. One study investigated maternal BMI (kg/m2) and truncal fat gain (kg) on
the odds of GDM (211); in this study anthropometric measurements were considered
as continuous variables (83). The other study provided change in weight (BMI, tricep,
subscapular, suprailiac SFT measures and the sum of all these, and also serum
leptin levels) between 14 weeks gestation and both 28 weeks gestation and 14
weeks post-partum (212).
Gestational diabetes
Sommer et al. considered the combined influence of maternal BMI and truncal fat
gain on GDM in White and South Asian women (211). The results showed that South
Asian women had a higher odds of GDM compared with White women (211) (Table
25). When ethnic origin was combined with a one standard deviation (0.14kg per
week) truncal fat gain, the risk of GDM increased in both ethnic groups and remained
higher in the South Asian women, the same was true when ethnic origin was
combined with a one standard deviation (4.7kg/m2) increase in maternal BMI Across
both ethnic groups, the increase in risk of GDM was more with an increase in BMI
than truncal fat gain. The risk of GDM was highest in both ethnic groups when there
was both an increase in truncal fat gain and maternal BMI. It should be noted that the
confidence intervals appear wide in the South Asian ethnic group (Table 25).
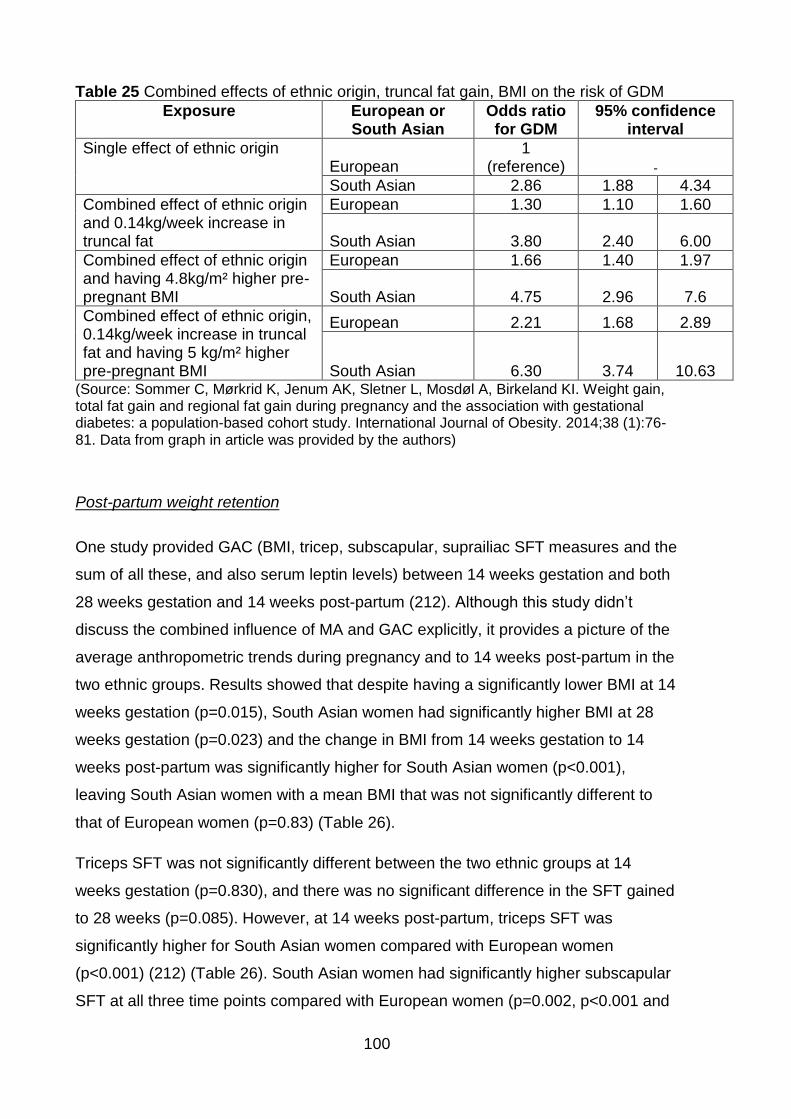
100
Table 25 Combined effects of ethnic origin, truncal fat gain, BMI on the risk of GDM
Exposure European or South Asian
Odds ratio for GDM
95% confidence interval
Single effect of ethnic origin European
1 (reference) -
South Asian 2.86 1.88 4.34
Combined effect of ethnic origin and 0.14kg/week increase in truncal fat
European 1.30 1.10 1.60
South Asian 3.80 2.40 6.00
Combined effect of ethnic origin and having 4.8kg/m² higher pre-pregnant BMI
European 1.66 1.40 1.97
South Asian 4.75 2.96 7.6
Combined effect of ethnic origin, 0.14kg/week increase in truncal fat and having 5 kg/m² higher pre-pregnant BMI
European 2.21 1.68 2.89
South Asian 6.30 3.74 10.63 (Source: Sommer C, Mørkrid K, Jenum AK, Sletner L, Mosdøl A, Birkeland KI. Weight gain, total fat gain and regional fat gain during pregnancy and the association with gestational diabetes: a population-based cohort study. International Journal of Obesity. 2014;38 (1):76-81. Data from graph in article was provided by the authors)
Post-partum weight retention
One study provided GAC (BMI, tricep, subscapular, suprailiac SFT measures and the
sum of all these, and also serum leptin levels) between 14 weeks gestation and both
28 weeks gestation and 14 weeks post-partum (212). Although this study didn’t
discuss the combined influence of MA and GAC explicitly, it provides a picture of the
average anthropometric trends during pregnancy and to 14 weeks post-partum in the
two ethnic groups. Results showed that despite having a significantly lower BMI at 14
weeks gestation (p=0.015), South Asian women had significantly higher BMI at 28
weeks gestation (p=0.023) and the change in BMI from 14 weeks gestation to 14
weeks post-partum was significantly higher for South Asian women (p<0.001),
leaving South Asian women with a mean BMI that was not significantly different to
that of European women (p=0.83) (Table 26).
Triceps SFT was not significantly different between the two ethnic groups at 14
weeks gestation (p=0.830), and there was no significant difference in the SFT gained
to 28 weeks (p=0.085). However, at 14 weeks post-partum, triceps SFT was
significantly higher for South Asian women compared with European women
(p<0.001) (212) (Table 26). South Asian women had significantly higher subscapular
SFT at all three time points compared with European women (p=0.002, p<0.001 and
101
p<0.001, respectively), gaining significantly more from 14 weeks gestation to both 28
weeks (p=0.120) and also to 14 weeks post-partum (p=0.022) (212) (Table 26). At 14
weeks gestation, there was no significant difference in suprailiac SFT between the
two ethnic groups (p=0.960). This was also true at 28 weeks gestation (p=0.240).
However, at 14 weeks post-partum South Asian women had significantly higher
suprailiac SFT (p= 0.001) and had gained significantly more than European women
(p=0.016) (212). There was no significant difference in the sum of SFT at 14 weeks
gestation between the two ethnic groups (p=0.200). However, by 28 weeks gestation,
South Asian women had gained a significantly higher sum of SFT (p=0.001),
although the gain between the two ethnic groups was not significantly different
(p=0.053) (212). By 14 weeks post-partum, South Asian women had gained
significantly more (p<0.001), leading to a significantly higher sum of SFT (p<0.001)
compared with European women (Table 26).
A summary of the evidence identified for outcomes associated with MA, and GAC is
given in Table 27, and depicted in the form of a conceptual model diagram in Figure
9. Arrows represent evidence of an association between two variables.
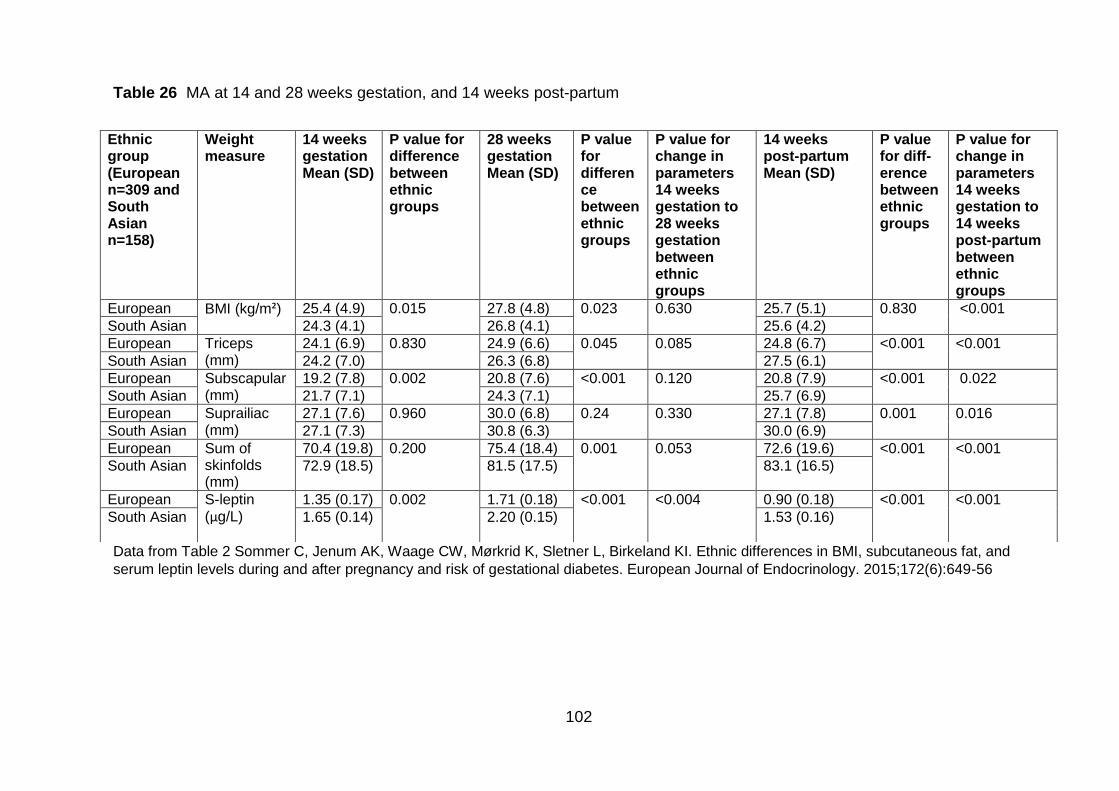
102
Table 26 MA at 14 and 28 weeks gestation, and 14 weeks post-partum
Data from Table 2 Sommer C, Jenum AK, Waage CW, Mørkrid K, Sletner L, Birkeland KI. Ethnic differences in BMI, subcutaneous fat, and
serum leptin levels during and after pregnancy and risk of gestational diabetes. European Journal of Endocrinology. 2015;172(6):649-56
Ethnic group (European n=309 and South Asian n=158)
Weight measure
14 weeks gestation Mean (SD)
P value for difference between ethnic groups
28 weeks gestation Mean (SD)
P value for difference between ethnic groups
P value for change in parameters 14 weeks gestation to 28 weeks gestation between ethnic groups
14 weeks post-partum Mean (SD)
P value for diff-erence between ethnic groups
P value for change in parameters 14 weeks gestation to 14 weeks post-partum between ethnic groups
European BMI (kg/m²) 25.4 (4.9) 0.015 27.8 (4.8) 0.023 0.630 25.7 (5.1) 0.830 <0.001
South Asian 24.3 (4.1) 26.8 (4.1) 25.6 (4.2)
European Triceps (mm)
24.1 (6.9) 0.830 24.9 (6.6) 0.045 0.085 24.8 (6.7) <0.001 <0.001
South Asian 24.2 (7.0) 26.3 (6.8) 27.5 (6.1)
European Subscapular (mm)
19.2 (7.8) 0.002 20.8 (7.6) <0.001 0.120 20.8 (7.9) <0.001 0.022
South Asian 21.7 (7.1) 24.3 (7.1) 25.7 (6.9)
European Suprailiac (mm)
27.1 (7.6) 0.960 30.0 (6.8) 0.24 0.330 27.1 (7.8) 0.001 0.016
South Asian 27.1 (7.3) 30.8 (6.3) 30.0 (6.9)
European Sum of skinfolds (mm)
70.4 (19.8) 0.200 75.4 (18.4) 0.001 0.053 72.6 (19.6) <0.001 <0.001
South Asian 72.9 (18.5) 81.5 (17.5) 83.1 (16.5)
European S-leptin (µg/L)
1.35 (0.17) 0.002 1.71 (0.18) <0.001 <0.004 0.90 (0.18) <0.001 <0.001
South Asian 1.65 (0.14) 2.20 (0.15) 1.53 (0.16)
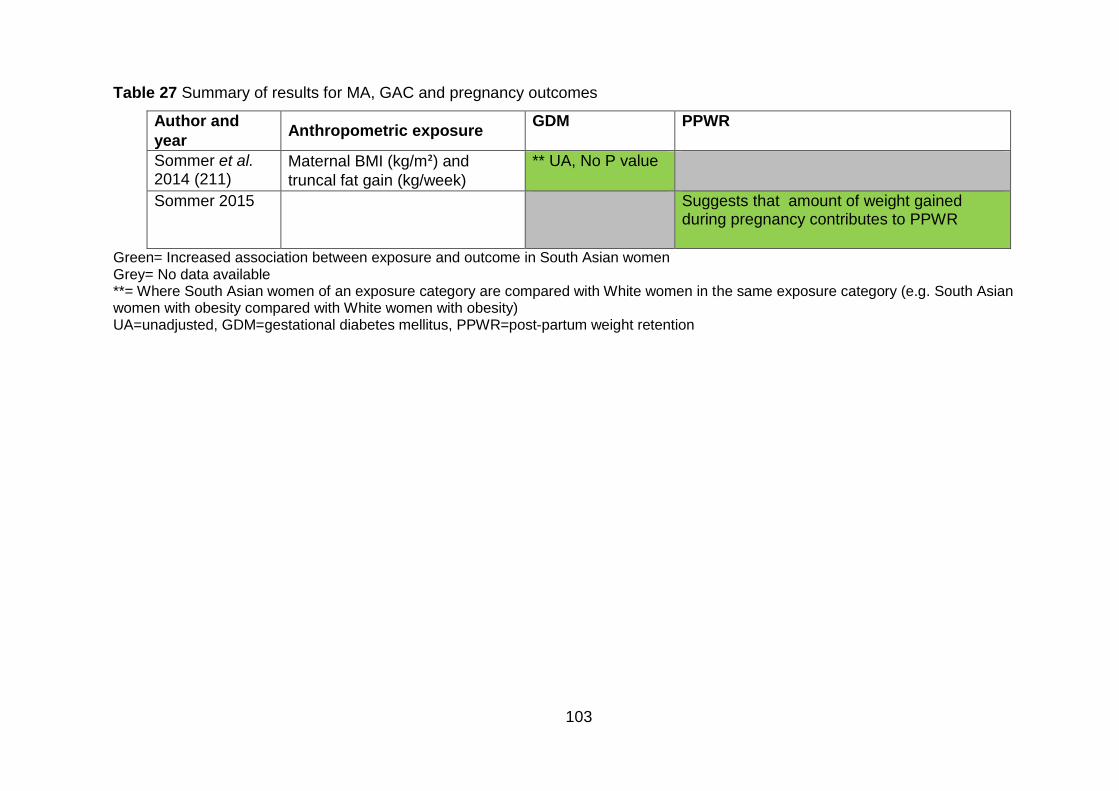
103
Table 27 Summary of results for MA, GAC and pregnancy outcomes
Author and
year Anthropometric exposure
GDM PPWR
Sommer et al. 2014 (211)
Maternal BMI (kg/m²) and
truncal fat gain (kg/week)
** UA, No P value
Sommer 2015 Suggests that amount of weight gained during pregnancy contributes to PPWR
Green= Increased association between exposure and outcome in South Asian women Grey= No data available **= Where South Asian women of an exposure category are compared with White women in the same exposure category (e.g. South Asian women with obesity compared with White women with obesity) UA=unadjusted, GDM=gestational diabetes mellitus, PPWR=post-partum weight retention
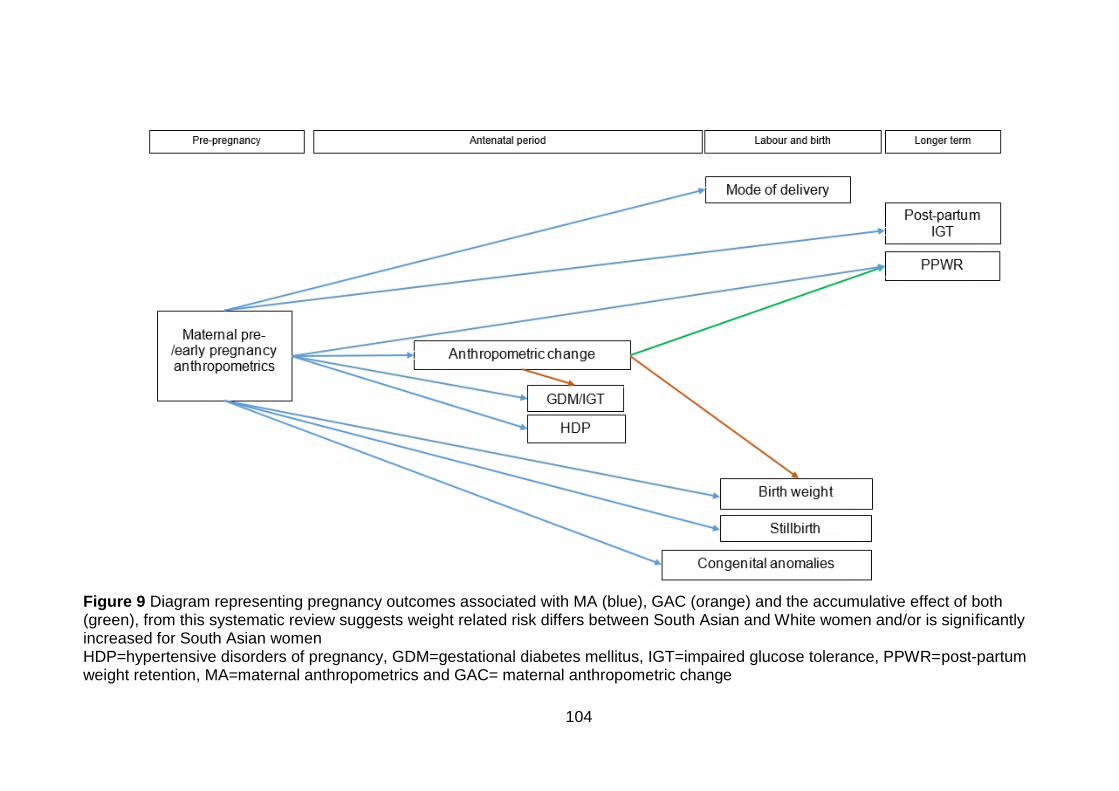
104
Figure 9 Diagram representing pregnancy outcomes associated with MA (blue), GAC (orange) and the accumulative effect of both (green), from this systematic review suggests weight related risk differs between South Asian and White women and/or is significantly increased for South Asian women HDP=hypertensive disorders of pregnancy, GDM=gestational diabetes mellitus, IGT=impaired glucose tolerance, PPWR=post-partum weight retention, MA=maternal anthropometrics and GAC= maternal anthropometric change
105
3.6 Discussion
This section summarises key findings from the systematic review, discusses the
strengths and limitations of the included evidence (both generally, and in terms of
conceptual model development), and compares outcomes identified by the evidence
in the in the systematic review with those identified by evidence in the 2009 IoM
guidelines.
This systematic review included 19 studies and data from 346,319 births (306,254
White and 40,065 South Asian) to compare the association between pregnancy
anthropometrics and pregnancy outcomes. This was the first review to consider the
association between pregnancy outcomes, MA and GAC in South Asian women. The
strongest evidence from included studies suggested that South Asian women have a
higher risk of GDM associated MA compared with White British women. There was
also evidence to suggest that South Asian women had a higher risk of GDM
associated with GAC compared with White British women. The review also found
that, when considering South Asian women alone (i.e. not comparing to White British
women), there was evidence to suggest an increased association between MA and
birth weight, C-Section and GDM. There was also evidence that suggested an
increased association between GAC and GDM in South Asian women. There was
limited evidence to suggest that there may be associations between MA and HDP,
congenital anomalies, PPWR and postnatal IGT. There was also limited evidence to
suggest that there was a combined effect of MA and GAC on GDM and PPWR.
One of the aims of this review was to use the results to contribute to the development
of the conceptual model. This was done by identifying pregnancy outcomes
associated with MA and GAC in South Asian women. Associations were included in
the conceptual model where there was evidence of an association between exposure
and outcome in South Asian women. Results from this review show that in South
Asian women, GAC, HDP, GDM, mode of delivery, birth weight, stillbirth, congenital
anomalies, weight retention and postnatal IGT are all associated with MA, and should
be included in the conceptual model. The review also identified that GDM was
associated with GAC, and MA and GAC appeared to have a combined effect on
GDM and PPWR. The evidence also suggests that there was no significant
106
association between gestational age at delivery, PPH, admission to the NICU,
perinatal death, and MA or GAC.
As this step was exploratory (i.e. to develop a conceptual (hypothetical) model that I
would then go on to test using data), associations were included independent of the
amount and quality of evidence. Had there been more evidence available, it may
have been beneficial to take into account study quality when deciding whether or not
to include an association in the conceptual model. Poor quality studies may be more
prone to bias compared with high quality studies. For example; by not adjusting for
relevant confounding variables in study design or analyses, observed results may be
biased. Biased results are those which do not reflect the true results for a population
under study. For conceptual model development, this was less of an issue for
significant associations as these were included at this stage, and if not true could be
removed from the model using evidence from analysis of the BiB cohort. This was
more of an issue where results were not significant, and therefore not included in the
conceptual model; it may have been that a significant association was not identified
due to poor study quality and not because there wasn’t actually an association.
This review found that there the majority of evidence was available for MA as an
exposure (18 studies), and the majority of these studies provided results for maternal
BMI (16 studies). The review also highlighted that the evidence relating to GAC as an
exposure was limited. There were three studies, which provided evidence for GAC as
an exposure, and only one considering the combined effect of MA and GAC.
Although nine of the 16 studies looking at maternal BMI as the exposure considered
BMI as a continuous variable (161, 171, 206, 210, 212-215), of the seven which used
categorical BMI (200, 201, 204, 205, 207, 208, 216), only two considered Asian-
specific BMI cut offs (201, 216). There was also one study which used ≥27kg/m2 as a
definition of obesity in both South Asian and White women (207). However, this does
not reflect the difference in weight related risk between the two ethnic groups and so
was not considered as application of Asian-specific BMI criteria. No studies
considered level of GWG for BMI using the Asian specific BMI criteria for South Asian
women.
In terms of pregnancy outcomes identified by the review, the majority of evidence
was available for GDM (14 studies). There was limited evidence for other outcomes;
four studies considered birth weight, two studies considered each GAC, mode of
107
delivery and gestational age at delivery (pre-term birth) and only one study was
available for each HDP, congenital anomalies, distance from skin to epidural space,
stillbirth, admission to the neonatal intensive care unit, perinatal death, PPH, PPWR
and post-partum IGT. Despite limited evidence for a number of pregnancy outcomes,
and for GAC as both an exposure and outcome, this systematic review has provided
evidence to facilitate the first stage of conceptual model development. It has also
highlighted gaps in the research, and areas for future research, in particular that
there is more research needed considering GAC as both and exposure and outcome
in South Asian women. To the best of my knowledge, this is the first systematic
review to consider the association between MA and GAC on pregnancy outcomes in
migrant and descendant South Asian women. The studies identified for inclusion for
this systematic review also allowed me to consider three levels of exposure; MA,
GAC and the combined effects of these on a number of different pregnancy
outcomes. Therefore, the review provides evidence for the association between
these exposures and outcomes in an ethnic group that is relevant to the UK.
Despite providing evidence to enable me to start to develop a conceptual model,
there are a number of limitations to the evidence identified by this systematic review.
The main limitation is that only two of the studies reporting BMI as a categorical
variable considered the BMI criteria suggested by the WHO that are specific to the
Asian population and compared the results in a White population using the WHO BMI
criteria for the general population. As a result, it is possible that the results from
studies that did not explore BMI cut offs for the Asian population, reflecting the
increased risk of obesity-related adverse outcomes at a lower BMI, may have
underestimated the effect size; this may have led to conclusions that there was not
an association, when in fact there may have been (i.e. a false negative, or type 2
error (220)). In terms of model development, this meant that I may have excluded a
variable from the conceptual model that may be relevant to Pakistani women living in
Bradford. In order to minimise the effect of this limitation on the model development, I
have also included all pregnancy outcomes identified by this review where the effect
size was increased but statistical significance was not detected (e.g. p>0.05 or the
95%CI included 1.00) and Asian specific BMI criteria were not applied. The
associations that this identified were between MA and both perinatal death and
gestational age at delivery.
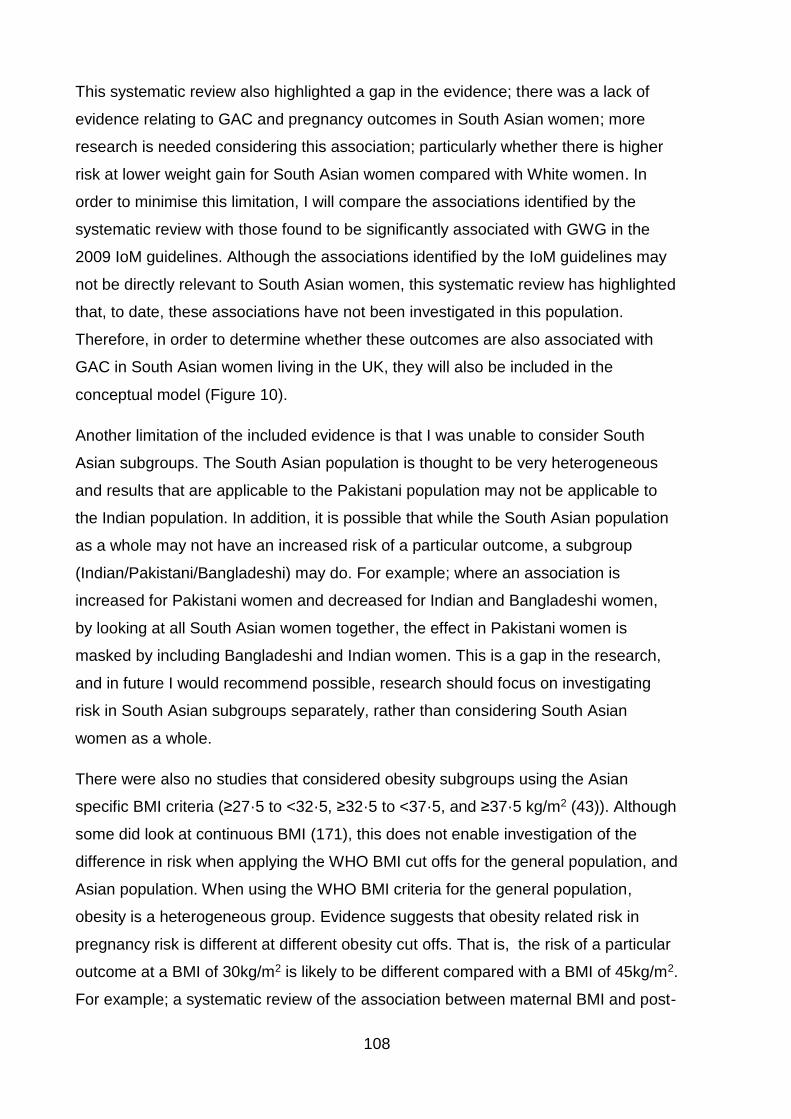
108
This systematic review also highlighted a gap in the evidence; there was a lack of
evidence relating to GAC and pregnancy outcomes in South Asian women; more
research is needed considering this association; particularly whether there is higher
risk at lower weight gain for South Asian women compared with White women. In
order to minimise this limitation, I will compare the associations identified by the
systematic review with those found to be significantly associated with GWG in the
2009 IoM guidelines. Although the associations identified by the IoM guidelines may
not be directly relevant to South Asian women, this systematic review has highlighted
that, to date, these associations have not been investigated in this population.
Therefore, in order to determine whether these outcomes are also associated with
GAC in South Asian women living in the UK, they will also be included in the
conceptual model (Figure 10).
Another limitation of the included evidence is that I was unable to consider South
Asian subgroups. The South Asian population is thought to be very heterogeneous
and results that are applicable to the Pakistani population may not be applicable to
the Indian population. In addition, it is possible that while the South Asian population
as a whole may not have an increased risk of a particular outcome, a subgroup
(Indian/Pakistani/Bangladeshi) may do. For example; where an association is
increased for Pakistani women and decreased for Indian and Bangladeshi women,
by looking at all South Asian women together, the effect in Pakistani women is
masked by including Bangladeshi and Indian women. This is a gap in the research,
and in future I would recommend possible, research should focus on investigating
risk in South Asian subgroups separately, rather than considering South Asian
women as a whole.
There were also no studies that considered obesity subgroups using the Asian
specific BMI criteria (≥27·5 to <32·5, ≥32·5 to <37·5, and ≥37·5 kg/m2 (43)). Although
some did look at continuous BMI (171), this does not enable investigation of the
difference in risk when applying the WHO BMI cut offs for the general population, and
Asian population. When using the WHO BMI criteria for the general population,
obesity is a heterogeneous group. Evidence suggests that obesity related risk in
pregnancy risk is different at different obesity cut offs. That is, the risk of a particular
outcome at a BMI of 30kg/m2 is likely to be different compared with a BMI of 45kg/m2.
For example; a systematic review of the association between maternal BMI and post-
109
term birth found in linear analysis that at midpoint of obese class I group, BMI
32.5kg/m2, the odds of post-term birth (≥42 weeks gestation) were 1.38 (95%CI 1.31
to 1.46), while in obese class II, BMI 42.5kg/m2, the odds of post-term birth were 1.95
(95%CI 1.88 to 2.02) (84). This risk difference within the pregnancy population with
obesity may also be present in South Asian women when applying the appropriate
BMI cut offs. However, it was not investigated by any of the included studies and is
therefore a gap in the evidence base. Future research should investigate the risk of
pregnancy outcomes for South Asian women, ideally within Pakistani, Bangladeshi,
and Indian populations, within each of the obesity subgroups and using Asian
specific BMI criteria.
There were also strengths and limitations of the systematic review methods used.
The search strategy for this systematic review was extremely comprehensive. I used
a gold standard duplicate screening approach and followed all stages on the
PRISMA protocol (193). I conducted a thorough search of 12 databases. Once all
references were in an endnote file, titles, abstracts and full papers were screened by
myself and another researcher. We also searched the reference lists of all studies
included and reviews that were related to the topic area. I also carried out citation
searching through Google Scholar and contacted authors of relevant abstracts and
posters to find out if there had been any further related studies and also for additional
information where possible. Despite how rigorous the review process was, grey
literature was not included in the searches. This was a limitation as including grey
literature can be important in adding up to date literature to a review; it includes
research which is ongoing but not published (for example ongoing but unpublished
systematic reviews and RCTs). It also includes published literature which are not in
journals, for example PhD theses and conference proceedings. By not including grey
literature in this review, it is vulnerable to publication bias. Publication bias occurs as
negative results are less likely to be published in peer reviewed journals, were this
occurs research in the published literature is systematically unrepresentative of all
completed studies (published and unpublished) (221).
In conclusion, this systematic review has been an important phase of conceptual
model development. It has identified pregnancy outcomes associated with MA and
GAC that are relevant to South Asian women. It has also highlighted the lack of
evidence in particular relating to GAC and pregnancy outcomes in South Asian
110
women. It is essential that the extent to which GAC influences pregnancy outcomes,
both independently and the combined effects with MA, should be investigated in
migrant and descendant South Asian women (and indeed all other UK ethnic groups)
to enable development of guidelines for weight management during pregnancy that
are appropriate for all women living in the UK.
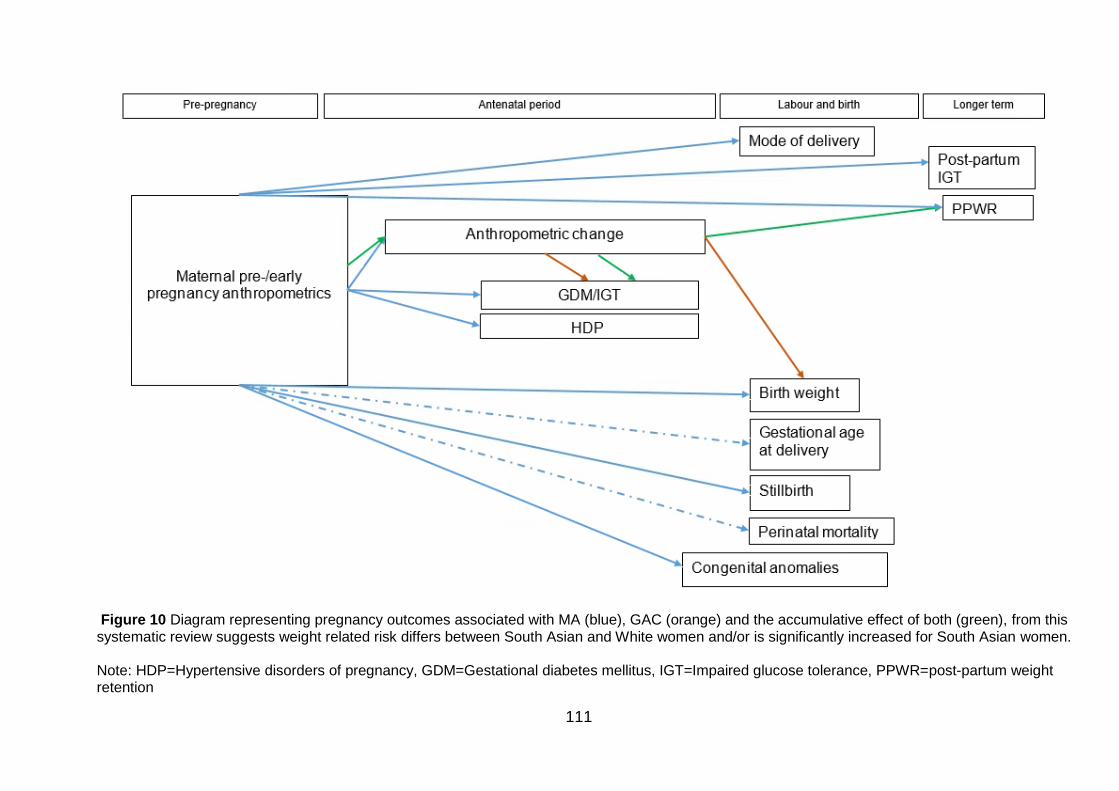
111
Figure 10 Diagram representing pregnancy outcomes associated with MA (blue), GAC (orange) and the accumulative effect of both (green), from this systematic review suggests weight related risk differs between South Asian and White women and/or is significantly increased for South Asian women. Note: HDP=Hypertensive disorders of pregnancy, GDM=Gestational diabetes mellitus, IGT=Impaired glucose tolerance, PPWR=post-partum weight retention
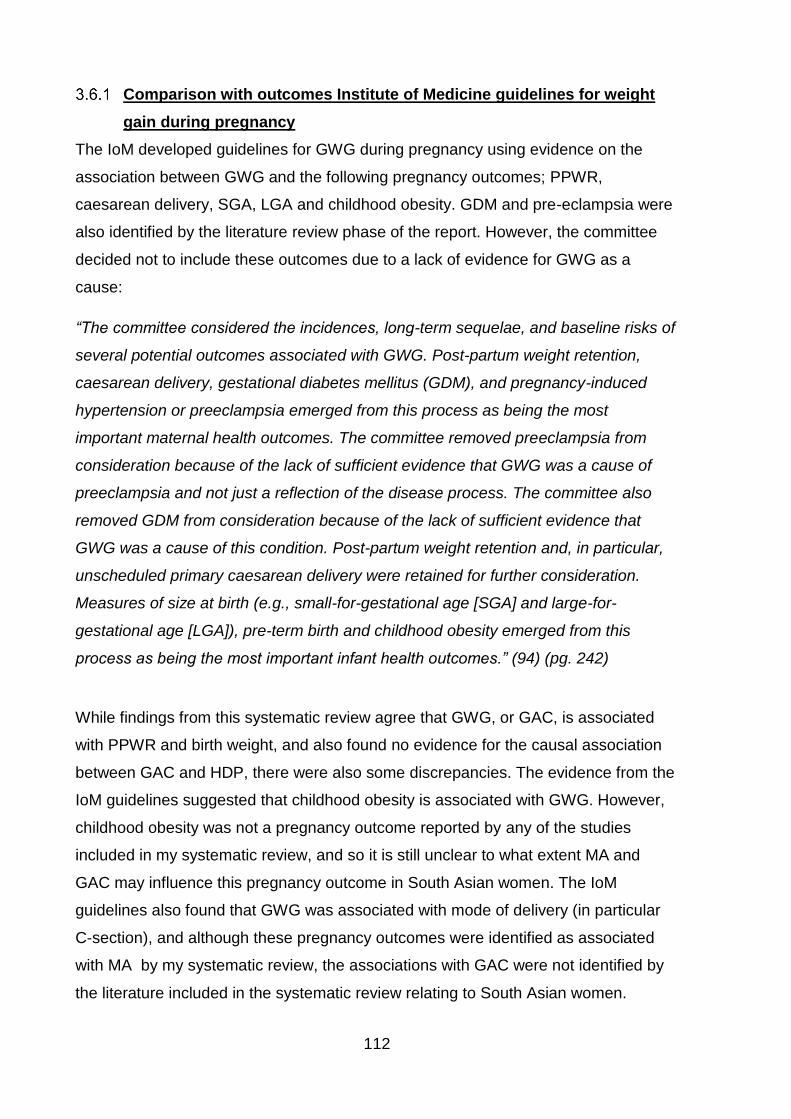
112
Comparison with outcomes Institute of Medicine guidelines for weight
gain during pregnancy
The IoM developed guidelines for GWG during pregnancy using evidence on the
association between GWG and the following pregnancy outcomes; PPWR,
caesarean delivery, SGA, LGA and childhood obesity. GDM and pre-eclampsia were
also identified by the literature review phase of the report. However, the committee
decided not to include these outcomes due to a lack of evidence for GWG as a
cause:
“The committee considered the incidences, long-term sequelae, and baseline risks of
several potential outcomes associated with GWG. Post-partum weight retention,
caesarean delivery, gestational diabetes mellitus (GDM), and pregnancy-induced
hypertension or preeclampsia emerged from this process as being the most
important maternal health outcomes. The committee removed preeclampsia from
consideration because of the lack of sufficient evidence that GWG was a cause of
preeclampsia and not just a reflection of the disease process. The committee also
removed GDM from consideration because of the lack of sufficient evidence that
GWG was a cause of this condition. Post-partum weight retention and, in particular,
unscheduled primary caesarean delivery were retained for further consideration.
Measures of size at birth (e.g., small-for-gestational age [SGA] and large-for-
gestational age [LGA]), pre-term birth and childhood obesity emerged from this
process as being the most important infant health outcomes.” (94) (pg. 242)
While findings from this systematic review agree that GWG, or GAC, is associated
with PPWR and birth weight, and also found no evidence for the causal association
between GAC and HDP, there were also some discrepancies. The evidence from the
IoM guidelines suggested that childhood obesity is associated with GWG. However,
childhood obesity was not a pregnancy outcome reported by any of the studies
included in my systematic review, and so it is still unclear to what extent MA and
GAC may influence this pregnancy outcome in South Asian women. The IoM
guidelines also found that GWG was associated with mode of delivery (in particular
C-section), and although these pregnancy outcomes were identified as associated
with MA by my systematic review, the associations with GAC were not identified by
the literature included in the systematic review relating to South Asian women.
113
In the evidence identified by my systematic review, GDM was found to be associated
with both MA and GAC (including GWG) in South Asian women. In the 2009 IoM
guidelines, although GDM was included as an outcome potentially associated with
GWG in the review of the literature, it was not included as a pregnancy outcome in
the development of the recommendations as there was insufficient evidence to
support GWG as a cause of GDM (94). The lack of inclusion of GDM in the GWG
guidelines is of particular relevance to women of South Asian origin for whom GDM
appears to be significantly associated with MA change during pregnancy. This
suggests that the 2009 IoM guidelines may not be applicable to South Asian women,
and more research is needed to investigate to what extent MA at baseline, GAC, and
the combined effect influence pregnancy outcomes, including GDM. This would
provide information regarding whether the current IoM guidelines are indeed
applicable to all ethnic groups as suggested, or need to be revised in order to be
relevant for UK ethnic groups.
The evidence identified by this systematic review has been used to develop the
conceptual model shown in Figure 11. This shows the associations between MA and
pregnancy outcomes (blue), GAC (orange), the combined effects of MA and GAC
(green), and finally the additional associations identified by the IoM guidelines for
which there was no data available for in my systematic review (black).
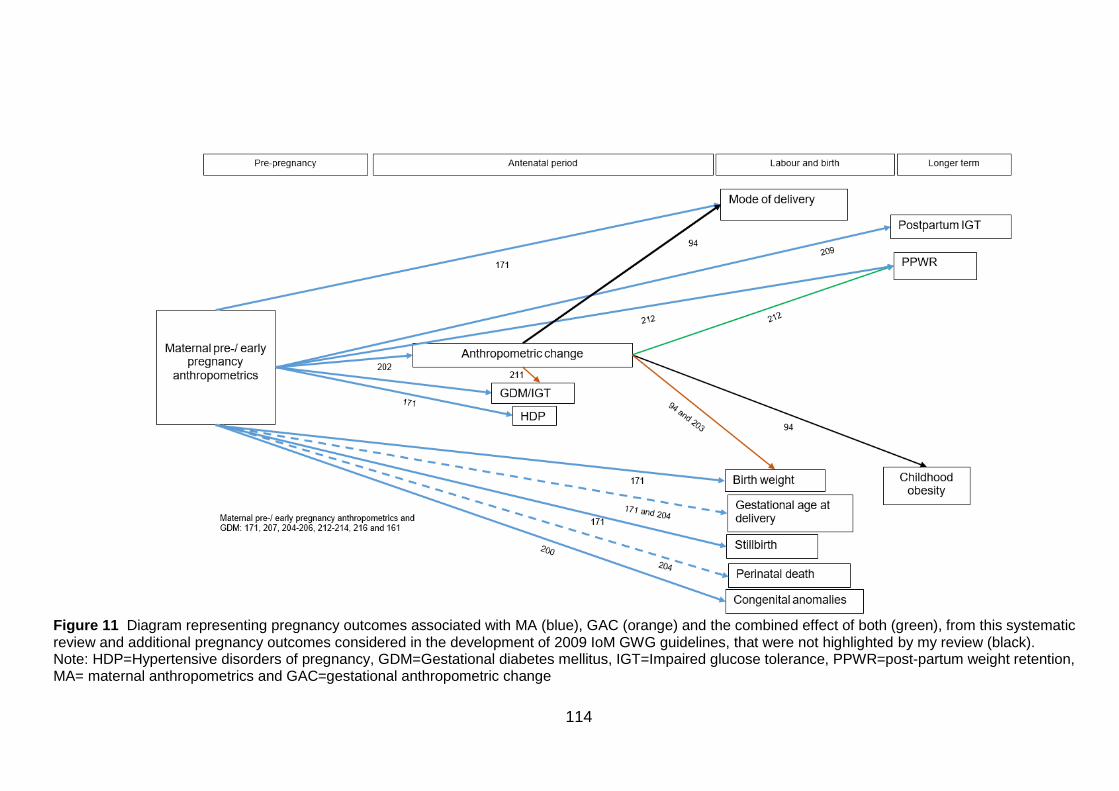
114
Figure 11 Diagram representing pregnancy outcomes associated with MA (blue), GAC (orange) and the combined effect of both (green), from this systematic review and additional pregnancy outcomes considered in the development of 2009 IoM GWG guidelines, that were not highlighted by my review (black). Note: HDP=Hypertensive disorders of pregnancy, GDM=Gestational diabetes mellitus, IGT=Impaired glucose tolerance, PPWR=post-partum weight retention, MA= maternal anthropometrics and GAC=gestational anthropometric change
115
Chapter 4. A mixed methods systematic literature search
and framework-based synthesis of qualitative and
quantitative literature to identify the confounding and
mediating variables (Phase 2)
This chapter is a systematic literature search and framework based synthesis to
identify confounding and mediating variables of the associations between of MA and
GAC on short- and long-term pregnancy outcomes in Pakistani women.
4.1 Introduction
The purpose of this review was to further develop the conceptual model specific to
Pakistani women and add information on confounding and mediating variables. The
results of the systematic review (Chapter 3) ,and evidence from the 2009 IoM
guidelines (94), provided evidence for the associations to start developing the
conceptual model (Shown in Figure 11, Chapter 3, Section 3.6.1, pg.114). However,
the evidence of variables that may influence MA, GAC and pregnancy outcomes in
Pakistani women (i.e. confounders and mediators such as maternal age, parity and
conditions in pregnancy such as GDM, depending on where they occur on the causal
pathway) were not considered. To explore the confounding and mediating variables
which may influence the associations between exposures and the outcomes identified
in Phase 1 (Chapter 3), a mixed methods research synthesis was carried out.
Defining confounding and mediating variables
When considering which variables to adjust for statistical analysis, it is important to
consider the variables that might influence the association you are investigating;
these variables can either be confounding, or mediating.
A confounding variable is a variable that influences the outcome in a population
unexposed to the exposure of interest, a variable that influences the exposure, and
must also be unaffected by the exposure and thus not a mediator (222). As an
example of this I have considered the association between maternal BMI and GDM
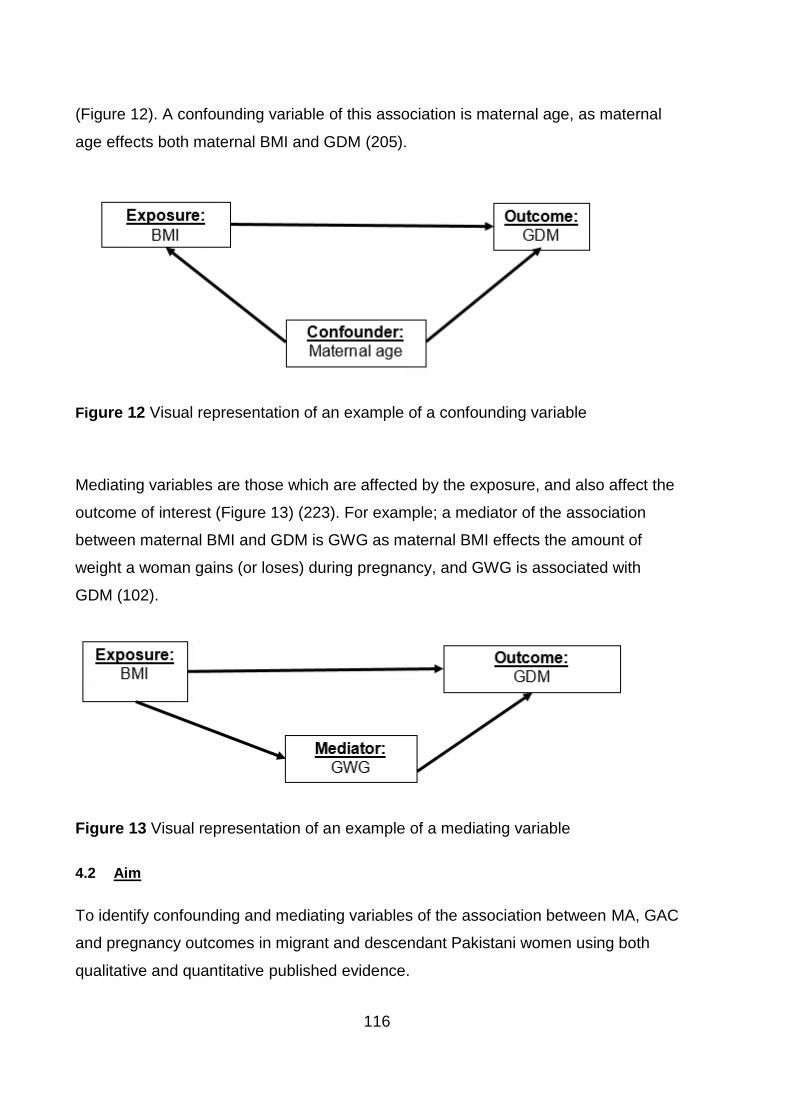
116
(Figure 12). A confounding variable of this association is maternal age, as maternal
age effects both maternal BMI and GDM (205).
Figure 12 Visual representation of an example of a confounding variable
Mediating variables are those which are affected by the exposure, and also affect the
outcome of interest (Figure 13) (223). For example; a mediator of the association
between maternal BMI and GDM is GWG as maternal BMI effects the amount of
weight a woman gains (or loses) during pregnancy, and GWG is associated with
GDM (102).
Figure 13 Visual representation of an example of a mediating variable
4.2 Aim
To identify confounding and mediating variables of the association between MA, GAC
and pregnancy outcomes in migrant and descendant Pakistani women using both
qualitative and quantitative published evidence.
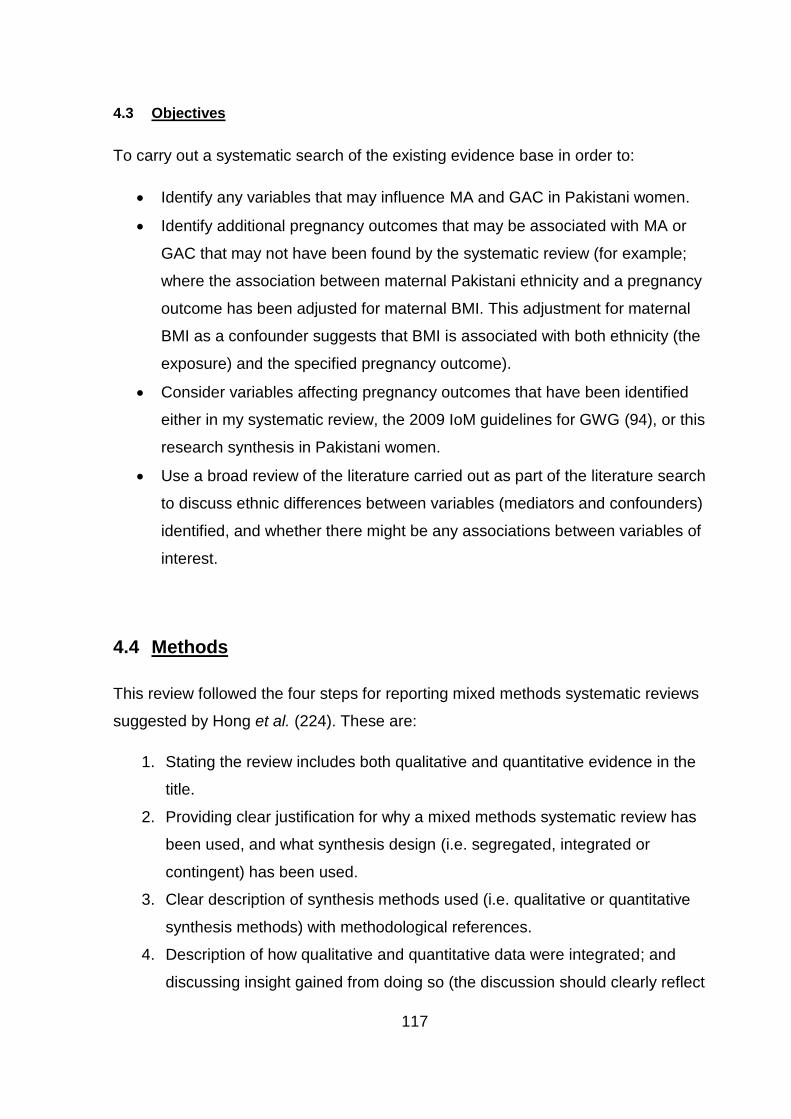
117
4.3 Objectives
To carry out a systematic search of the existing evidence base in order to:
Identify any variables that may influence MA and GAC in Pakistani women.
Identify additional pregnancy outcomes that may be associated with MA or
GAC that may not have been found by the systematic review (for example;
where the association between maternal Pakistani ethnicity and a pregnancy
outcome has been adjusted for maternal BMI. This adjustment for maternal
BMI as a confounder suggests that BMI is associated with both ethnicity (the
exposure) and the specified pregnancy outcome).
Consider variables affecting pregnancy outcomes that have been identified
either in my systematic review, the 2009 IoM guidelines for GWG (94), or this
research synthesis in Pakistani women.
Use a broad review of the literature carried out as part of the literature search
to discuss ethnic differences between variables (mediators and confounders)
identified, and whether there might be any associations between variables of
interest.
4.4 Methods
This review followed the four steps for reporting mixed methods systematic reviews
suggested by Hong et al. (224). These are:
1. Stating the review includes both qualitative and quantitative evidence in the
title.
2. Providing clear justification for why a mixed methods systematic review has
been used, and what synthesis design (i.e. segregated, integrated or
contingent) has been used.
3. Clear description of synthesis methods used (i.e. qualitative or quantitative
synthesis methods) with methodological references.
4. Description of how qualitative and quantitative data were integrated; and
discussing insight gained from doing so (the discussion should clearly reflect
118
on the added value and insight of combining qualitative and quantitative
evidence).
Synthesis design
Sandelowski et al. (185) proposed three general frameworks for mixed-research
syntheses; segregated, contingent and integrated methodologies:
Segregated methodology: Maintains a clear distinction between quantitative and
qualitative evidence requiring individual synthesis to be carried out prior to the final
mixed-research synthesis (185). The qualitative and quantitative findings may either
support each other (confirmation), contradict each other (refutation), or add to each
other (complementarity) (185). Provided that the individual qualitative and
quantitative syntheses focus on the same general phenomenon, confirmation,
refutation and complimentarily can all be used to inform the research question (185).
Integrated methodology: Direct combination of identified evidence into a single
mixed methods synthesis (185). Integrated methodologies require that the
quantitative and qualitative evidence is similar enough to be aggregated into a single
synthesis (185). This aggregation process requires that either the qualitative data is
converted into a numerical format and included with quantitative data in the statistical
analysis, or the quantitative data is converted into themes, coded and presented
alongside the qualitative data (185).
Contingent methodology: Two or more syntheses which are conducted sequentially
and based on the results from the previous synthesis (185). The process starts by
asking an initial research question and then conducting a qualitative, quantitative or
mixed methods research synthesis of which the results are used to generate a
second research question and research synthesis, and so on (185). Multiple
syntheses, either integrated and/or segregated, are carried out until the final result
addresses the researcher’s review objective (185).
I decided that because quantitative and qualitative evidence would be analysed
together to answer the same research question, an integrated design would be used.
This allowed both quantitative and qualitative evidence to be analysed together using
119
framework-based synthesis (225), a method that allows the systematic reviewing of
diverse literature (226).
Synthesis methods
This literature review used a qualitative synthesis method; framework-based
synthesis, to identify variables of interest to conceptual model development.
Framework-based synthesis has been adapted from framework analysis; a data
analysis method for conducting primary qualitative research (183, 227). While
framework analysis has been developed and refined over time, the core principals of
the approach have been found to be versatile across a number of different studies
(227). Framework analysis has been adapted for the synthesis of primary evidence in
a review by Oliver et al. (226). In framework synthesis, Oliver et al. use the principles
of framework analysis and apply them to a systematic review in order to label the
data of studies in meaningful and manageable sections, so later they can be
retrieved and explored (183). Framework-based synthesis involves the reviewers
choosing a conceptual model which is likely to be suitable for the review question;
this model is used for the basis of the initial coding (183). This model is then modified
in response to the evidence reported in the studies identified by the review (183). The
revised framework then includes both variables from the original conceptual model
hypothesised by the reviewers, along with any modified and additional variables
identified by the evidence in the review. While framework-based synthesis has
predominantly been used to synthesise qualitative research, here it will be applied to
a mixed methods research synthesis including quantitative, qualitative and mixed
methods evidence to modify an a priori framework (i.e. the conceptual model
developed in Chapter 3; final version shown in section 3.6.1, pg.114). The findings
from this mixed methods research synthesis will then be used to further develop the
conceptual model which will be used to inform later data analysis using the BiB
dataset.
As Framework-based synthesis is based on the core principles of framework
analysis, I have developed this mixed methods review using the five key stages for
120
framework analysis highlighted by Ritchie and Spencer (227), with the addition of a
literature searching stage as used by Oliver et al. (226). The stages used were:
1. Familiarisation and literature searching.
2. Identifying a thematic framework.
3. Indexing.
4. Charting.
5. Mapping and interpretation.
Familiarisation and literature searching
In framework analysis, familiarisation is the process of gaining an overview of the
material gathered before sifting and sorting any data, it also involves the beginning of
the process of abstraction and conceptualisation (227). As this mixed research
synthesis was complex and exploratory, with no specific outcome, I combined
familiarisation and literature searching stages together in order to ensure that all
relevant literature was included. A systematic literature search was carried out to
identify qualitative and quantitative studies that could be used to inform my
knowledge on the following topics in Pakistani women, or comparing Pakistani
women with White women:
Pregnancy and birth.
Pregnancy anthropometrics (both MA and GAC).
Pregnancy outcomes.
Methods for the search were as follows; those studies identified by the search for the
systematic review (Chapter 3, Section 3.4.3, pgs.48-50) were also screened for
inclusion in this mixed research synthesis. An additional search was carried out to
ensure that no relevant qualitative research was missed. Studies identified by both
searches were combined in Endnote prior to deduplication. The qualitative searches
were carried out using keywords developed using SPICE (228) (Table 28). SPICE
refers to the Setting, Perspective, Intervention or exposure, Comparator group, and
Evaluation to be included (228). Scoping searches were carried out to inform the
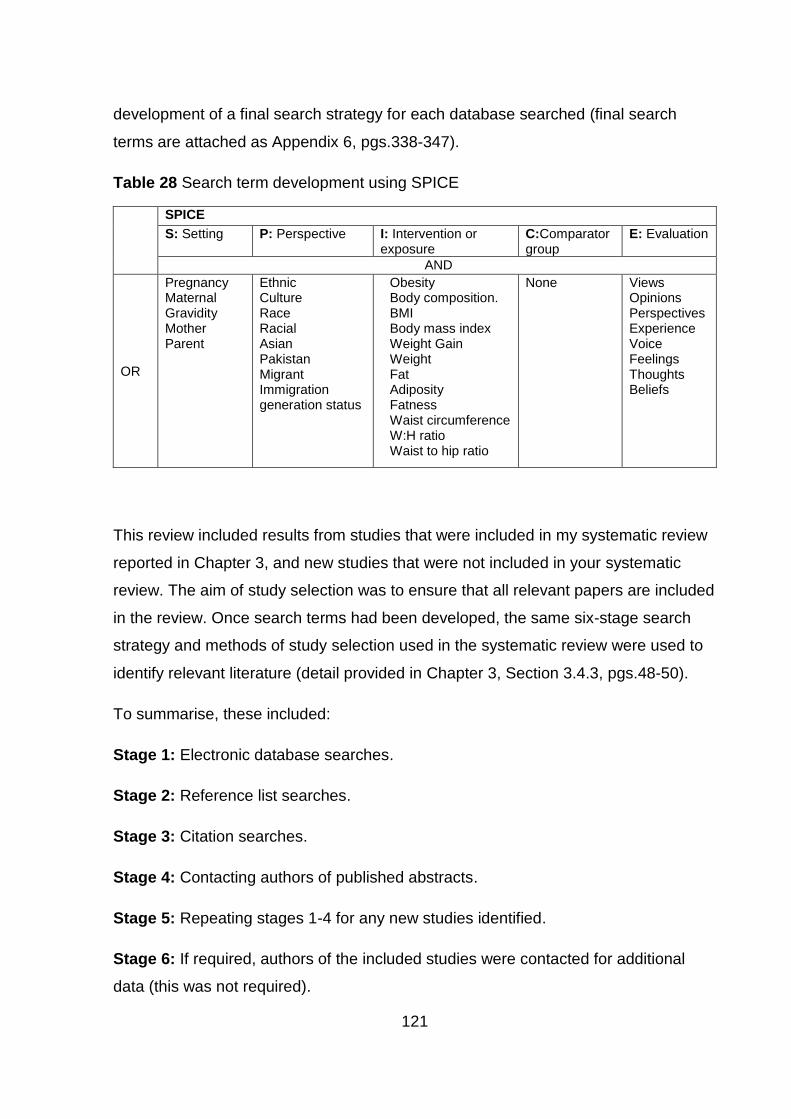
121
development of a final search strategy for each database searched (final search
terms are attached as Appendix 6, pgs.338-347).
Table 28 Search term development using SPICE
This review included results from studies that were included in my systematic review
reported in Chapter 3, and new studies that were not included in your systematic
review. The aim of study selection was to ensure that all relevant papers are included
in the review. Once search terms had been developed, the same six-stage search
strategy and methods of study selection used in the systematic review were used to
identify relevant literature (detail provided in Chapter 3, Section 3.4.3, pgs.48-50).
To summarise, these included:
Stage 1: Electronic database searches.
Stage 2: Reference list searches.
Stage 3: Citation searches.
Stage 4: Contacting authors of published abstracts.
Stage 5: Repeating stages 1-4 for any new studies identified.
Stage 6: If required, authors of the included studies were contacted for additional
data (this was not required).
SPICE
S: Setting P: Perspective
I: Intervention or exposure
C:Comparator group
E: Evaluation
AND
OR
Pregnancy Maternal Gravidity Mother Parent
Ethnic Culture Race Racial Asian Pakistan Migrant Immigration generation status
Obesity Body composition. BMI Body mass index Weight Gain Weight Fat Adiposity Fatness Waist circumference W:H ratio Waist to hip ratio
None Views Opinions Perspectives Experience Voice Feelings Thoughts Beliefs
122
Study selection included screening titles and abstracts followed by screening the full
papers of potentially relevant studies.
Once I had thoroughly familiarised myself with the literature available, I applied more
specific inclusion and exclusion criteria to the studies identified by the initial search.
This allowed me to limit the studies to only those relevant for inclusion in the
framework synthesis i.e. those considering variables influencing MA, GAC or
pregnancy outcomes in Pakistani women, in addition to those studies included in the
systematic review.
Inclusion criteria
o Qualitative, quantitative and mixed-methods research studies.
o Peer reviewed, full published studies (i.e. not editorials, abstracts etc.).
o Studies on humans.
o Any publication date.
o Must present evidence of variables which may influence MA, GAC or pregnancy
outcomes (GDM, HDP, mode of delivery, birth weight, stillbirth, perinatal death,
congenital anomalies, gestational age at delivery, post-partum IGT, PPWR and
infant anthropometrics) in Pakistani women (or South Asian in a study using data
from BiB cohort, or study already included in my systematic review in Chapter 3).
Or/
Presents evidence of a potential association between MA and a pregnancy
outcome not identified by my systematic review or the IoM guidelines e.g. where
adjustment made for maternal weight in the association between Pakistani
ethnicity (or South Asian in a study using data from BiB cohort, or study already
included in my systematic review in Chapter 3) and a pregnancy outcome (e.g.
birth weight).
Exclusion criteria
Studies were excluded if:
123
o Includes only women using assisted reproductive techniques as these
pregnancies may have a different risk profile, for example assisted reproductive
techniques have been associated with both short pregnancy outcomes such as
gestational hypertension and pre-term birth, and also longer term outcomes such
as increased risk of infant illness (189).
o Only presents results for multiple pregnancies as these may also have a different
risk profile, for example a higher risk of low birth weight (190).
o Not English language
Identifying a thematic framework
The conceptual model of pregnancy outcomes shown in Figure 11, Chapter 3,
Section 3.6.1, pg.114, has been used as an a-priori thematic framework for this
mixed research synthesis. This initial a priori framework has been built upon by
identifying variables associated with the variables identified in my systematic review
(Chapter 3) and 2009 IoM guidelines (94). It also allowed me to look for any other
pregnancy outcomes which are potentially associated with MA, or GAC. For example,
where an association between one variable and a pregnancy outcome has adjusted
for MA. This would suggest that there is evidence of an association between both the
exposure and outcome variable in the analysis, but also the potential confounder
which has been controlled for.
Indexing
Indexing is the process where the thematic framework is systematically applied to the
data (227). Here, this meant that papers identified as relevant for inclusion were read
and evidence of a variable influencing either an exposure or an outcome in the a-
priori framework was indexed using headings relevant to the variable e.g. “maternal
age”, “parity”, “SES” and so on. This was done for both quantitative and qualitative
studies. For quantitative studies, this related to statistical effect size, for qualitative
research this related to discussion of a particular variable (topic area; for example
parity, diet, physical activity). In addition, where analysis for the association between
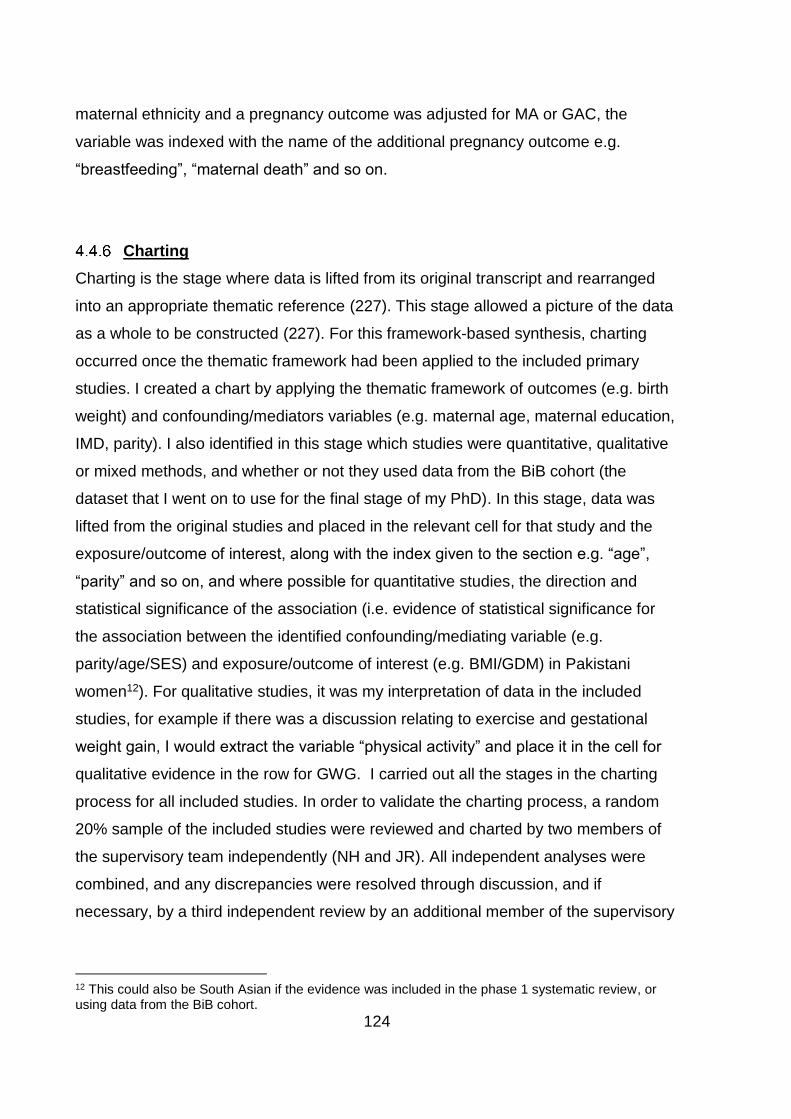
124
maternal ethnicity and a pregnancy outcome was adjusted for MA or GAC, the
variable was indexed with the name of the additional pregnancy outcome e.g.
“breastfeeding”, “maternal death” and so on.
Charting
Charting is the stage where data is lifted from its original transcript and rearranged
into an appropriate thematic reference (227). This stage allowed a picture of the data
as a whole to be constructed (227). For this framework-based synthesis, charting
occurred once the thematic framework had been applied to the included primary
studies. I created a chart by applying the thematic framework of outcomes (e.g. birth
weight) and confounding/mediators variables (e.g. maternal age, maternal education,
IMD, parity). I also identified in this stage which studies were quantitative, qualitative
or mixed methods, and whether or not they used data from the BiB cohort (the
dataset that I went on to use for the final stage of my PhD). In this stage, data was
lifted from the original studies and placed in the relevant cell for that study and the
exposure/outcome of interest, along with the index given to the section e.g. “age”,
“parity” and so on, and where possible for quantitative studies, the direction and
statistical significance of the association (i.e. evidence of statistical significance for
the association between the identified confounding/mediating variable (e.g.
parity/age/SES) and exposure/outcome of interest (e.g. BMI/GDM) in Pakistani
women12). For qualitative studies, it was my interpretation of data in the included
studies, for example if there was a discussion relating to exercise and gestational
weight gain, I would extract the variable “physical activity” and place it in the cell for
qualitative evidence in the row for GWG. I carried out all the stages in the charting
process for all included studies. In order to validate the charting process, a random
20% sample of the included studies were reviewed and charted by two members of
the supervisory team independently (NH and JR). All independent analyses were
combined, and any discrepancies were resolved through discussion, and if
necessary, by a third independent review by an additional member of the supervisory
12 This could also be South Asian if the evidence was included in the phase 1 systematic review, or using data from the BiB cohort.

125
team (this was not required). An example of the chart structure used is given in Table
29.
126
Table 29 Example chart for identifying variables associated with anthropometric exposures and pregnancy outcomes in Pakistani women using dummy data and explaining abbreviations that may be used in these charts
Exposure/ outcome
Study Evidence available in study to support type of association with outcome (statistical significance)
Variables used in adjusted analysis (or direction of association unclear)
Qualitative evidence
Positive (S/NS/NP)*
Negative (S/NS/NP)*
U-shaped (S/NS/NP)*
No association (S/NS/NP)*
Maternal BMI
Study A (Quant, SR)
Maternal age (S)
Food outlet availability (S)
- Fathers education (NS)
Maternal age, parity, smoking, family history of diabetes and insulin
-
Study B (FS, Qual)
- - - - - Marriage and parity
-No evidence identified SR= Evidence included in systematic review, FS= Evidence identified through systematic search Qual= Qualitative study not BiB data, QualB= Qualitative study using BiB data, Quant=Quantitative study not using BiB data, QuantB=Quantitative study using BiB data, MM= Mixed methods not using BiB data and MMB= mixed methods study using BiB data. *S= statistically significant association, NS=association not statistically significant, or NP= Evidence of statistical significance not available
127
Mapping and interpretation
Mapping and interpretation is the final stage in which all the variables identified by
the review were combined, allowing the data to be mapped and interpreted as a
whole (227). The aim of this review was to identify confounding and mediating
variables that may influence MA, GAC and pregnancy outcomes, and to find the
associations between these variables. Therefore, any additional pregnancy outcomes
identified by this review were added to the conceptual model diagram. All potentially
confounding and mediating variables identified for each exposure and outcome of
interest are summarised in tables. Based on the aim of this review, to identify
variables to inform conceptual model development, and to enable completion of the
project within the specified timeframe, a pragmatic, a-priori decision was made that
no detailed analysis of the qualitative data alone would be carried out.
4.5 Results
Familiarisation
Evidence from the systematic review, the 2009 IoM guidelines and this initial
systematic search which identified 92 studies, provided me with an overview of the
available evidence for familiarisation (here papers were still included if they identified
an ethnic difference in outcome but did not provide evidence of mediators or
confounders). The evidence was interrogated for variables which differed between
White and Pakistani women and might influence the association between MA, GAC
and pregnancy outcomes in Pakistani women. These variables were used to create a
diagram (Figure 14), informed by evidence and diagram structure used in the 2009
IoM guidelines; the original diagram used for familiarisation, adapted from the
diagram in the 2009 IoM guidelines is shown in Appendix 7 (pg.348). This diagram
gave a representation of the overall topic and allowed me to familiarise myself with
the research area.
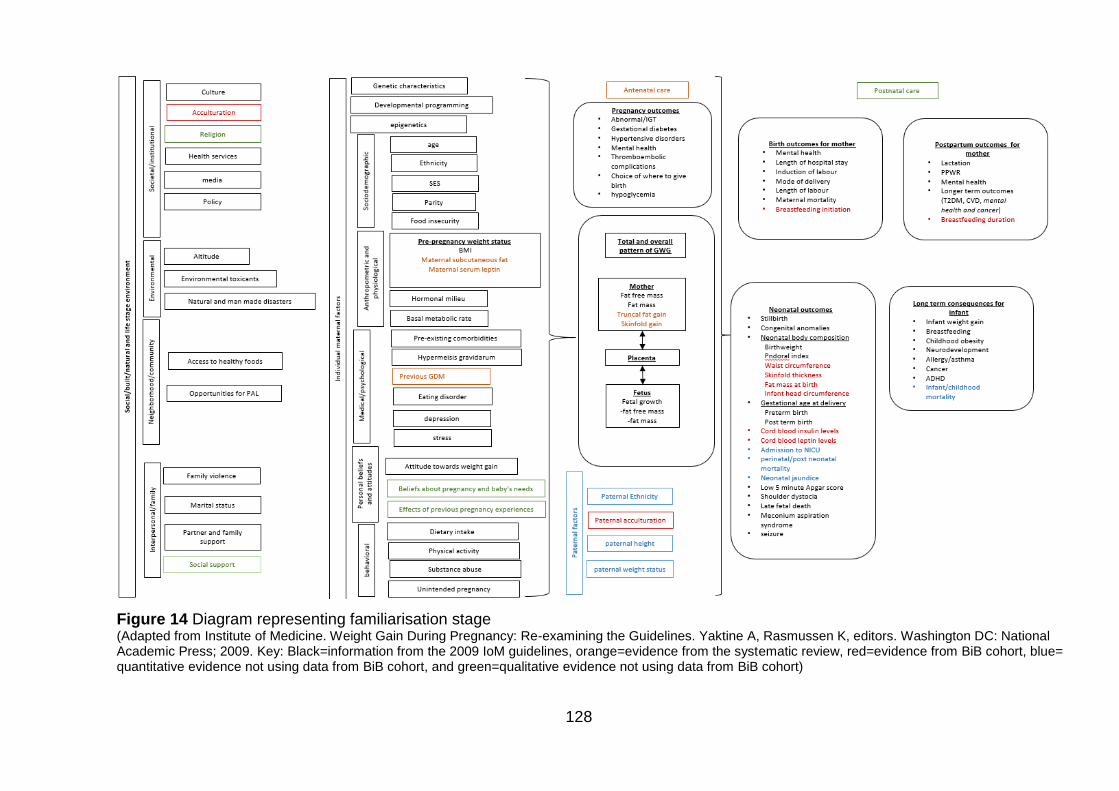
128
Figure 14 Diagram representing familiarisation stage (Adapted from Institute of Medicine. Weight Gain During Pregnancy: Re-examining the Guidelines. Yaktine A, Rasmussen K, editors. Washington DC: National Academic Press; 2009. Key: Black=information from the 2009 IoM guidelines, orange=evidence from the systematic review, red=evidence from BiB cohort, blue= quantitative evidence not using data from BiB cohort, and green=qualitative evidence not using data from BiB cohort)
129
Refining the inclusion criteria
In total, there were 75 studies (out of the 92 referred to in the Familiarization section
4.5.1, pg.127) 19 of the studies used for initial familiarization step did not meet the
inclusion criteria for this systematic review (i.e. did not have evidence of variables
which may affect the associations between MA, GAC and pregnancy outcomes))
relevant for inclusion in this mixed methods review (Figure 15): all 19 from the
systematic review13 described in Chapter 3 (161, 171, 200-216) (two using data from
the BiB cohort (171, 200)); 18 new14 studies which used data from the BiB cohort
(168, 229-245); 29 quantitative studies not using BiB data (246-274); eight qualitative
studies (275-282); and one study that reported data for Pakistani and White British
women from both the BiB cohort and another UK cohort study (283) (the Millennium
cohort study) (Figure 15). A summary table for these studies is included in Appendix
8 (pgs.349-354). Firstly, I will discuss all the variables that were identified by the
framework-based synthesis. I will then go on to describe further model development
using these variables.
13 These studies were included in my systematic review (Chapter 3), and also identified as relevant for inclusion in this framework based synthesis. 14 New studies are those which were identified as relevant for inclusion by the search for this framework based synthesis, and were not already included in my systematic review (Chapter 3).
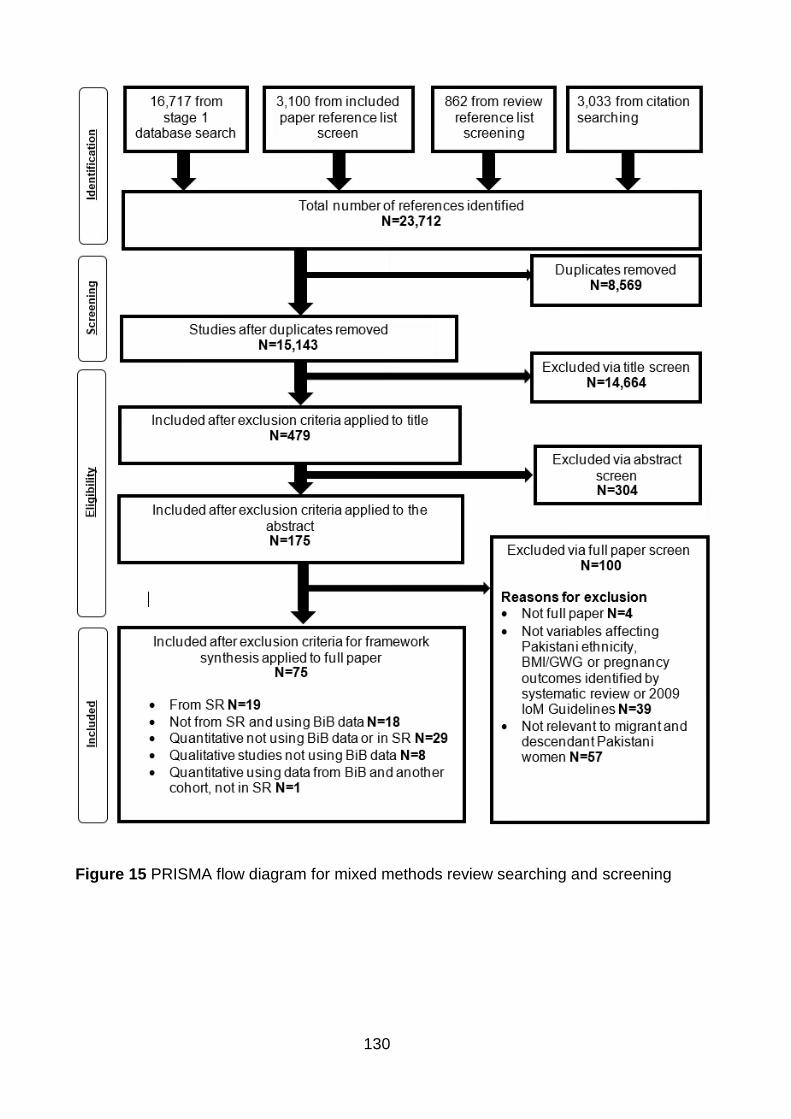
130
Figure 15 PRISMA flow diagram for mixed methods review searching and screening
131
Maternal anthropometric measurements
Maternal weight
Results for variables that could influence maternal weight are shown in Table 30.
Two studies provided evidence suggesting variables that may influence maternal
weight; neither study used data from the BiB cohort. One was quantitative and
included in my systematic review (209). This study adjusted for age, parity, smoking,
family history of diabetes and insulin when considering the association between
maternal weight and postnatal glucose tolerance (209).The other was a new
qualitative study (275). Evidence from this study suggested that both being married
and having a higher parity may be associated with higher maternal weight (275).
Maternal BMI
Results for variables that could influence maternal BMI are shown in Table 30. Nine
quantitative studies provided evidence of variables that might influence maternal BMI
(168, 204, 205, 207, 212, 216, 232, 240, 241). There were six included in my
systematic review; one using data from the BiB cohort (240), and five using other
sources of data (204, 205, 207, 212, 216). The other three studies were new and
used data from the BiB cohort (168, 232, 241). Significant positive associations were
identified between maternal age (232) and general health questionnaire score in
pregnancy (240) and maternal BMI. Positive associations (without significance
reported) were identified for maternal BMI and parity (212) and partners place of birth
being South Asia (168, 241). A negative association (without significance reported)
was identified between maternal BMI and food outlet availability (232). There was no
association identified between maternal BMI and deprivation (232).
The quantitative studies which investigated associations between maternal BMI and
pregnancy outcomes included the following variables in their adjusted analyses;
maternal age (204, 207, 216, 241), parity (204, 207, 216, 241), employment (241),
education (216, 241), receipt of means tested benefits (241) and housing tenure
(241), smoking (216), insurance status (216), family history of type 2 diabetes (216),
foreign born status (216) and deprivation (204).
132
Skinfold thickness
One quantitative study included in my systematic review, not using data from the BiB
cohort, provided evidence of variables that might be associated with maternal SFT
(212). A positive association was identified between parity and tricep, subscapular
and sum of skinfold thickness, although there were no indicators of significance (p
values or confidence intervals) reported (212). There was also no association
identified between parity and suprailliac SFT, although no p value was provided (212)
(Table 30).
Serum leptin
Results for variables that could influence serum leptin levels are shown in Table 30.
One quantitative study included in my systematic review, not using data from the BiB
cohort, provided evidence of variables that might be associated with maternal serum
leptin (212). This study suggested that there was a positive association between
parity and maternal serum leptin, although no p value or confidence interval was
available for the association (212).
Other anthropometric measures
There was no evidence available for variables that might influence either mid upper
arm circumference, total body fat or truncal fat.
133
Table 30 Evidence for variables which could influence MA in Pakistani women
Exposure Study Evidence available in study to support type of association with outcome (statistical significance)
Variables used in adjusted analysis for association between exposure of interest and an outcome in relevant ethnic group (or direction of association unclear a)
Qualitative evidence
Positive (S/NS/NP)* Negative (S/NS/NP)*
No association (S/NS/NP)*
Weight Sinha et al. 2003 (209) (Quant, SR)
- -
- Maternal age, parity, smoking, family history of diabetes and insulin
-
Bandyopadhyay et al. 2011 (275) (FS, Qual)
- -
- - Marriage and parity
BMI
Dornhorst et al. 1992 (207) (SR, Quant)
- -
- Maternal age and parity -
Makgoba et al. 2011 (205) (SR, Quant)
- -
- “all significant confounders”-unclear which these are
-
Oteng-Ntim 2013 (204) (SR, Quant)
- -
- Maternal age, parity and deprivation -
Pu et al. 2015 (216) (SR, Quant)
- -
- Maternal education, parity, smoking, insurance status, maternal age, family history of diabetes and foreign-born status (place of birth)
-
Sommer et al. 2015 (212) (SR, Quant)
Parity (NP) -
- - -
Fraser et al. 2012 (232) (FS, QuantB)
Maternal age (S) Food outlet availability (S)
-
Deprivation (IMD) (NS)
- -
Traviss et al. 2012 (240) (FS, QuantB)
GHQ score in pregnancy (S)
-
- - -
West et al. 2013 (168) (FS, QuantB)
Partners place of birth South Asian (NP)
- -
- - -
134
Exposure Study Evidence available in study to support type of association with outcome (statistical significance)
Variables used in adjusted analysis for association between exposure of interest and an outcome in relevant ethnic group (or direction of association unclear a)
Qualitative evidence
Positive (S/NS/NP)* Negative (S/NS/NP)*
No association (S/NS/NP)*
BMI West et al. 2014 (FS, QuantB) (241)
Partners place of birth South Asian (NP)
- -
- Maternal age; parity; maternal employment; maternal education, receipt of means tested benefits; housing tenure. Maternal place of birth
-
Tricep skinfold
Sommer et al. 2015 (212) (SR, Quant)
Parity (NP) - - - -
Subscapular skinfold
Sommer et al. 2015 (212) (SR, Quant)
Parity (NP) - - - -
Suprailiac skinfold
Sommer et al. 2015 (212) (SR, Quant)
- - Parity (NP) - -
Sum of skinfolds
Sommer et al. 2015 (212) (SR, Quant)
Parity (NP) - - - -
S-leptin Sommer et al. 2015 (212) (SR, Quant)
Parity (NP) - - - -
-No evidence identified SR= Evidence included in systematic review, FS= new study i.e. evidence identified through systematic search and not in the systematic review Qual= Qualitative study not BiB data, QualB= Qualitative study using BiB data, Quant=Quantitative study not using BiB data, QuantB= Quantitative study using BiB data and MMB= mixed methods study using BiB data. *S=statistically significant association, NS=association not statistically significant, NP=Evidence of statistical significance not available aText in italics means direction of the association unclear
135
Gestational anthropometric change
Results for variables that could influence GAC are shown in Table 31. Three studies
provided evidence of variables that might influence GAC (211, 275, 278). One was
quantitative, and included my systematic review (211), and two were new qualitative
studies (275, 278); no studies used data from the BiB cohort. The quantitative study
adjusted for gestational week at inclusion, age, parity, BMI and HOMA-IR (insulin
resistance) when considering the association between gain in weight, fat mass,
truncal fat and mean skinfold thickness and GDM (211). The two qualitative studies
reported that diet and physical activity may influence the amount of gestational
weight gain (275, 278) and one also reported that personal beliefs may play a role
(275). There was no evidence identified for variables that might influence gain in mid
upper arm circumference during pregnancy.
Table 31 Evidence for variables which could influence GAC in Pakistani women
Exposure Study Variables used in adjusted analysis Qualitative evidence
Weight gain Bandyopadhyay et al. 2011 (275) (FS, Qual)
- Marriage, parity, Beliefs (religious), weight issues and exercise
Greenhalgh et al. 2015 (278) (FS, Qual)
- Exercise, Diet
Fat mass gain Sommer et al. 2014 (211) (SR, Quant)
Gestational week at inclusion, maternal age, parity, BMI and Insulin resistance (HOMA-IR)
-
Truncal fat gain Sommer et al. 2014 (211) (SR, Quant)
Gestational week at inclusion, maternal age, parity, BMI and Insulin resistance (HOMA-IR)
-
Mean skinfold gain
Sommer et al. 2014 (211) (SR, Quant)
Gestational week at inclusion, maternal age, parity, BMI and Insulin resistance (HOMA-IR)
-
-No evidence identified SR=Evidence included in systematic review, FS=new study i.e. evidence identified through systematic search and not in the systematic review, BMI=body mass index, HOMA-IR=homeostatic model assessment-insulin resistance, Qual=Qualitative study not BiB data, Quant=Quantitative study not using BiB data
136
Antenatal outcomes
This section will discuss the following outcomes: GDM and HDP; both of which were
identified by my systematic review as relevant outcomes. Estimated fetal
measurements and cord blood leptin and insulin measurements were identified as
potential outcomes of interest in a Pakistani population by the framework-based
synthesis (through including maternal weight as a variable in statistical adjustment
(as a confounder), and therefore suggesting that it is associated with each outcome).
Gestational diabetes and impaired glucose tolerance during pregnancy
Results for variables that could influence gestational diabetes and glucose tolerance
are shown in Table 32. Fifteen studies provided evidence of variables that might
influence GDM (161, 171, 204, 205, 207, 211, 212, 214, 216, 233, 241, 275, 278).
There were 11 quantitative studies; nine were included in my systematic review (161,
171, 204, 205, 207, 211, 212, 214, 216) (one of which used data from the BiB cohort
(171)), there also were four new studies; two quantitative studies which used data
from the BiB cohort (233, 241), and two qualitative studies which did not use data
from the BiB cohort (275, 278).
Positive associations were identified between the following variables and GDM;
maternal BMI (161, 171, 204, 205, 207, 211, 212, 214, 216), maternal age (205, 214,
216), family history of diabetes (216), sum of skinfold thickness (212), serum leptin
(212), truncal fat gain (211), cord blood insulin and leptin (233), place of birth of the
mother and father (241) and generation status (246). There was no association
identified between foreign born status and GDM (216). Quantitative studies also
adjusted for the following variables when GDM was considered as a pregnancy
outcome; maternal age (161, 204, 207, 211, 214, 216, 241, 262), parity (161, 204,
207, 211, 216, 241, 262), maternal education (216, 241, 262), deprivation (IMD)
(204), smoking (216, 241, 262), health insurance (216, 262), family history of
diabetes (161, 216), foreign borne status (216), number of weeks gestation (161),
pre-/early pregnancy BMI (161, 211, 214, 241), weight gain in pregnancy (161),
history of GDM (161), glucose intolerance (161), gestational week at inclusion (211),
insulin resistance (211), age gap between GDM and type 2 diabetes (214),
employment (241), receipt of means tested benefits (241), housing tenure (241),
drinking habits (262), and timely initiation of prenatal care (262).
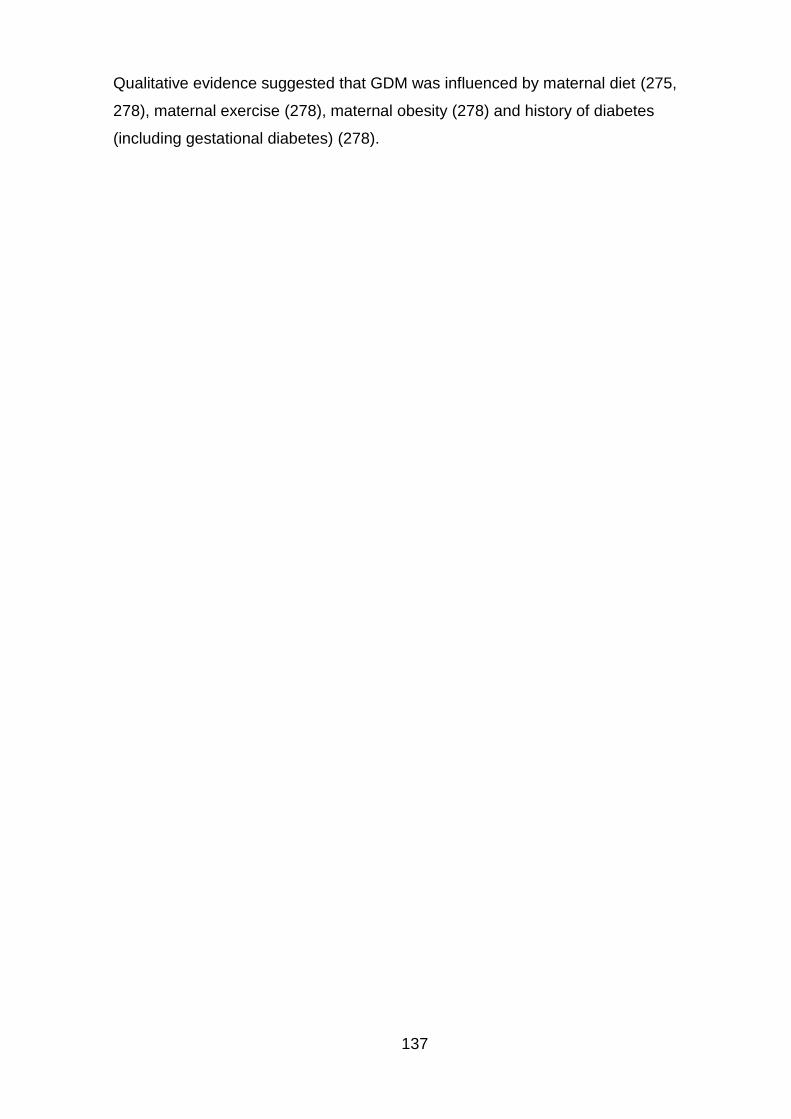
137
Qualitative evidence suggested that GDM was influenced by maternal diet (275,
278), maternal exercise (278), maternal obesity (278) and history of diabetes
(including gestational diabetes) (278).
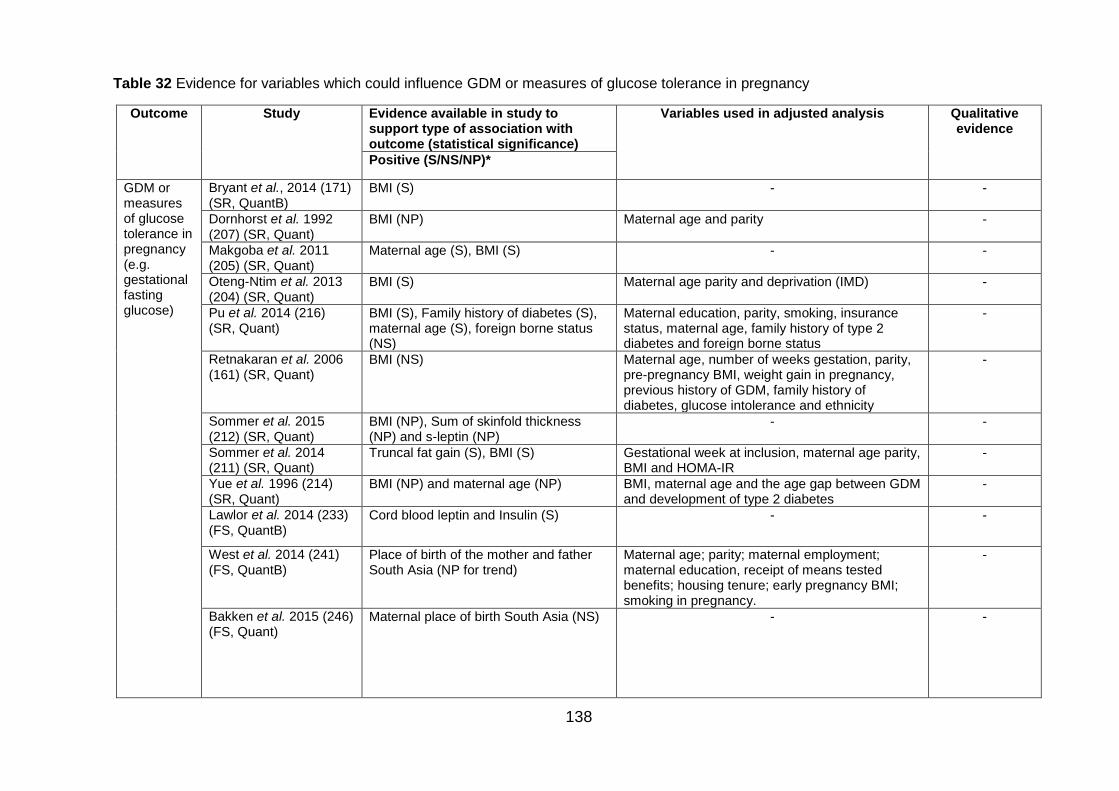
138
Table 32 Evidence for variables which could influence GDM or measures of glucose tolerance in pregnancy
Outcome Study Evidence available in study to support type of association with outcome (statistical significance)
Variables used in adjusted analysis Qualitative evidence
Positive (S/NS/NP)*
GDM or measures of glucose tolerance in pregnancy (e.g. gestational fasting glucose)
Bryant et al., 2014 (171) (SR, QuantB)
BMI (S) - -
Dornhorst et al. 1992 (207) (SR, Quant)
BMI (NP) Maternal age and parity -
Makgoba et al. 2011 (205) (SR, Quant)
Maternal age (S), BMI (S) - -
Oteng-Ntim et al. 2013 (204) (SR, Quant)
BMI (S) Maternal age parity and deprivation (IMD) -
Pu et al. 2014 (216) (SR, Quant)
BMI (S), Family history of diabetes (S), maternal age (S), foreign borne status (NS)
Maternal education, parity, smoking, insurance status, maternal age, family history of type 2 diabetes and foreign borne status
-
Retnakaran et al. 2006 (161) (SR, Quant)
BMI (NS) Maternal age, number of weeks gestation, parity, pre-pregnancy BMI, weight gain in pregnancy, previous history of GDM, family history of diabetes, glucose intolerance and ethnicity
-
Sommer et al. 2015 (212) (SR, Quant)
BMI (NP), Sum of skinfold thickness (NP) and s-leptin (NP)
- -
Sommer et al. 2014 (211) (SR, Quant)
Truncal fat gain (S), BMI (S) Gestational week at inclusion, maternal age parity, BMI and HOMA-IR
-
Yue et al. 1996 (214) (SR, Quant)
BMI (NP) and maternal age (NP) BMI, maternal age and the age gap between GDM and development of type 2 diabetes
-
Lawlor et al. 2014 (233) (FS, QuantB)
Cord blood leptin and Insulin (S) - -
West et al. 2014 (241) (FS, QuantB)
Place of birth of the mother and father South Asia (NP for trend)
Maternal age; parity; maternal employment; maternal education, receipt of means tested benefits; housing tenure; early pregnancy BMI; smoking in pregnancy.
-
Bakken et al. 2015 (246) (FS, Quant)
Maternal place of birth South Asia (NS) - -
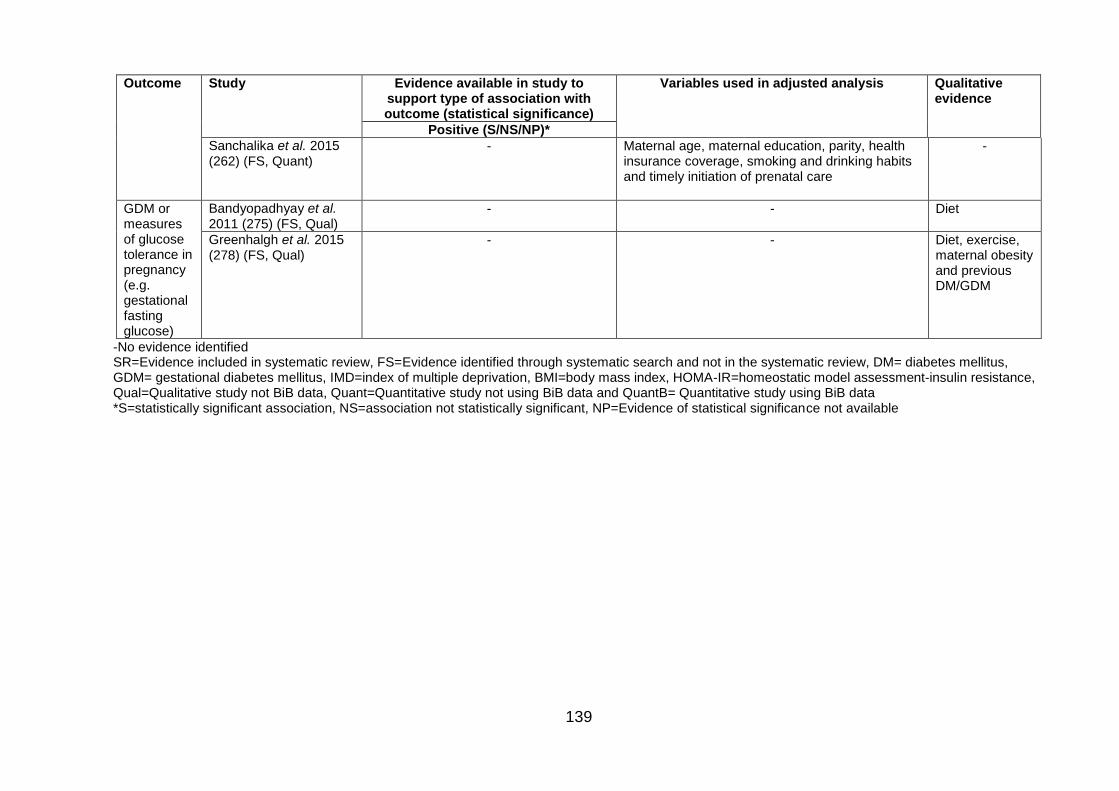
139
Outcome Study Evidence available in study to support type of association with outcome (statistical significance)
Variables used in adjusted analysis Qualitative evidence
Positive (S/NS/NP)*
Sanchalika et al. 2015 (262) (FS, Quant)
- Maternal age, maternal education, parity, health insurance coverage, smoking and drinking habits and timely initiation of prenatal care
-
GDM or measures of glucose tolerance in pregnancy (e.g. gestational fasting glucose)
Bandyopadhyay et al. 2011 (275) (FS, Qual)
- - Diet
Greenhalgh et al. 2015 (278) (FS, Qual)
- - Diet, exercise, maternal obesity and previous DM/GDM
-No evidence identified SR=Evidence included in systematic review, FS=Evidence identified through systematic search and not in the systematic review, DM= diabetes mellitus, GDM= gestational diabetes mellitus, IMD=index of multiple deprivation, BMI=body mass index, HOMA-IR=homeostatic model assessment-insulin resistance, Qual=Qualitative study not BiB data, Quant=Quantitative study not using BiB data and QuantB= Quantitative study using BiB data *S=statistically significant association, NS=association not statistically significant, NP=Evidence of statistical significance not available
140
Hypertensive disorders of pregnancy
Results for variables that could influence HDP are shown in Table 33. Two studies
provided evidence of variables that might influence HDP (171, 241). Both were
quantitative studies using data from the BiB cohort; one was in my systematic review
(171), and the other was a new study (241). A significant positive association was
identified between maternal BMI and HDP (171). There was also a positive
association between maternal and paternal place of birth and HDP; the risk of HDP
was also found to be highest when both the mother and father were south Asian
born, and lowest when both were UK born (241). Statistical adjustments were also
carried out for the following variables when HDP was considered as a pregnancy
outcome: maternal age, parity, employment, education, receipt of means tested
benefits, housing tenure, maternal BMI and smoking in pregnancy (241).
Table 33 Evidence for variables which could influence HDP
Outcome Study Evidence available in study to support type of association with outcome (statistical significance)
Variables used in adjusted analysis
Positive (S/NS/NP)*
HDP Bryant et al., 2014 (171) (SR, QuantB)
BMI (S) -
West et al. 2014 (241) (FS, QuantB)
Place of birth of the mother and father South Asia (NS)
Maternal age; parity; maternal employment; maternal education, receipt of means tested benefits; housing tenure; BMI; smoking in pregnancy.
-No evidence identified SR=Evidence included in systematic review, FS=Evidence identified through systematic search and not in the systematic review, BMI=body mass index, QuantB=Quantitative study using BiB data *S=statistically significant association, NS=association not statistically significant
Mental health during pregnancy
Results for variables that could influence mental health during pregnancy are shown
in Table 34. Two new studies provided evidence of variables that might influence
mental health during pregnancy (240, 283). Both were quantitative and used data
from the BiB cohort (240, 283); one of these studies also presented evidence using
data from the Millennium cohort study, in addition to the evidence using data from the
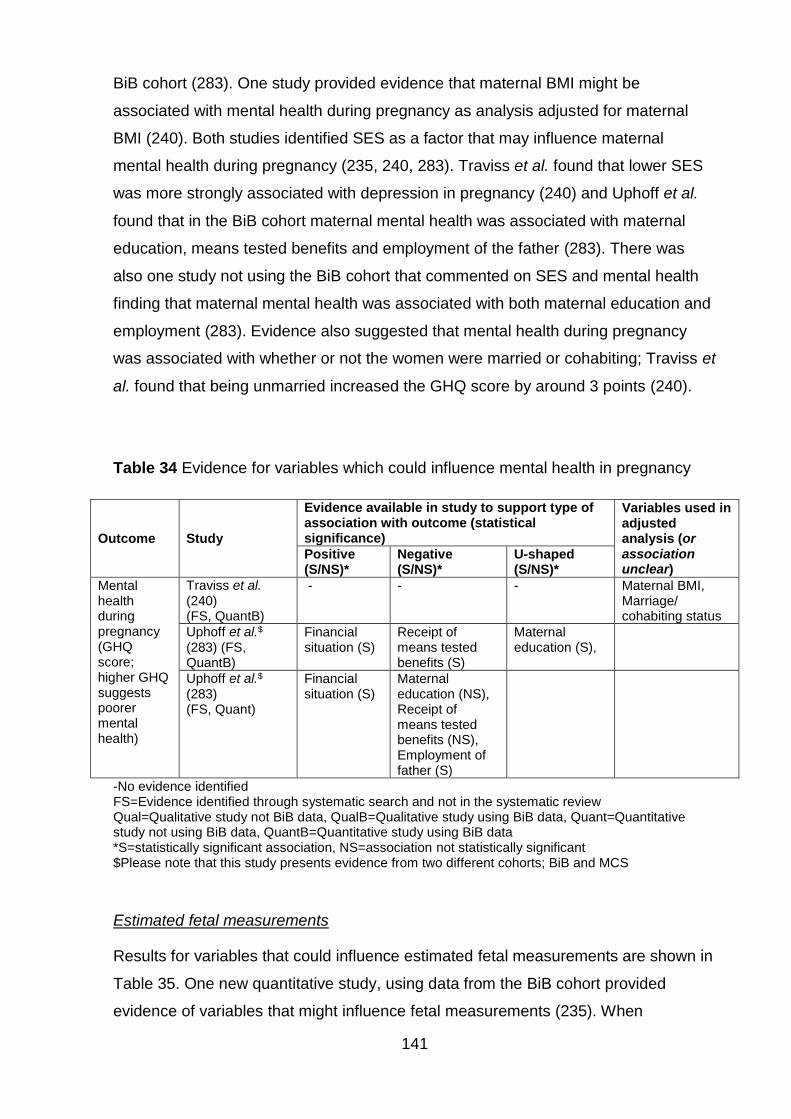
141
BiB cohort (283). One study provided evidence that maternal BMI might be
associated with mental health during pregnancy as analysis adjusted for maternal
BMI (240). Both studies identified SES as a factor that may influence maternal
mental health during pregnancy (235, 240, 283). Traviss et al. found that lower SES
was more strongly associated with depression in pregnancy (240) and Uphoff et al.
found that in the BiB cohort maternal mental health was associated with maternal
education, means tested benefits and employment of the father (283). There was
also one study not using the BiB cohort that commented on SES and mental health
finding that maternal mental health was associated with both maternal education and
employment (283). Evidence also suggested that mental health during pregnancy
was associated with whether or not the women were married or cohabiting; Traviss et
al. found that being unmarried increased the GHQ score by around 3 points (240).
Table 34 Evidence for variables which could influence mental health in pregnancy
Outcome Study
Evidence available in study to support type of association with outcome (statistical significance)
Variables used in adjusted analysis (or association unclear)
Positive (S/NS)*
Negative (S/NS)*
U-shaped (S/NS)*
Mental health during pregnancy (GHQ score; higher GHQ suggests poorer mental health)
Traviss et al. (240) (FS, QuantB)
- - - Maternal BMI, Marriage/ cohabiting status
Uphoff et al.$
(283) (FS, QuantB)
Financial situation (S)
Receipt of means tested benefits (S)
Maternal education (S),
Uphoff et al.$ (283) (FS, Quant)
Financial situation (S)
Maternal education (NS), Receipt of means tested benefits (NS), Employment of father (S)
-No evidence identified FS=Evidence identified through systematic search and not in the systematic review Qual=Qualitative study not BiB data, QualB=Qualitative study using BiB data, Quant=Quantitative study not using BiB data, QuantB=Quantitative study using BiB data *S=statistically significant association, NS=association not statistically significant $Please note that this study presents evidence from two different cohorts; BiB and MCS
Estimated fetal measurements
Results for variables that could influence estimated fetal measurements are shown in
Table 35. One new quantitative study, using data from the BiB cohort provided
evidence of variables that might influence fetal measurements (235). When
142
considering fetal adiposity as an outcome associated with maternal ethnicity, this
study adjusted for maternal weight, maternal height, maternal age, parity, smoking
during pregnancy and IMD, which is a measure of SES (235). When considering fetal
weight as a pregnancy outcome associated with maternal ethnicity, the study
adjusted for maternal weight, maternal height, maternal age, maternal education,
parity, smoking during pregnancy and IMD (235). Finally, when considering fetal
head circumference as a pregnancy outcome associated with maternal ethnicity, the
study adjusted for maternal weight, maternal height, maternal age, maternal
education and smoking during pregnancy (235). This suggests that the estimated
fetal measurements of weight, adiposity and head circumference may be associated
with all these variables, including maternal weight. Estimated fetal measurements
have been included as an outcome in the updated conceptual model for further
investigation.
Cord blood insulin and leptin
Results for variables that could influence cord blood insulin and leptin are shown in
Table 35. One new quantitative study, using evidence from the BiB cohort presented
evidence of variables that may influence cord blood insulin and leptin; the
associations between ethnicity and cord blood insulin and leptin were adjusted for
maternal height, maternal weight, maternal age, maternal education, gestational age
and infant sex (233).
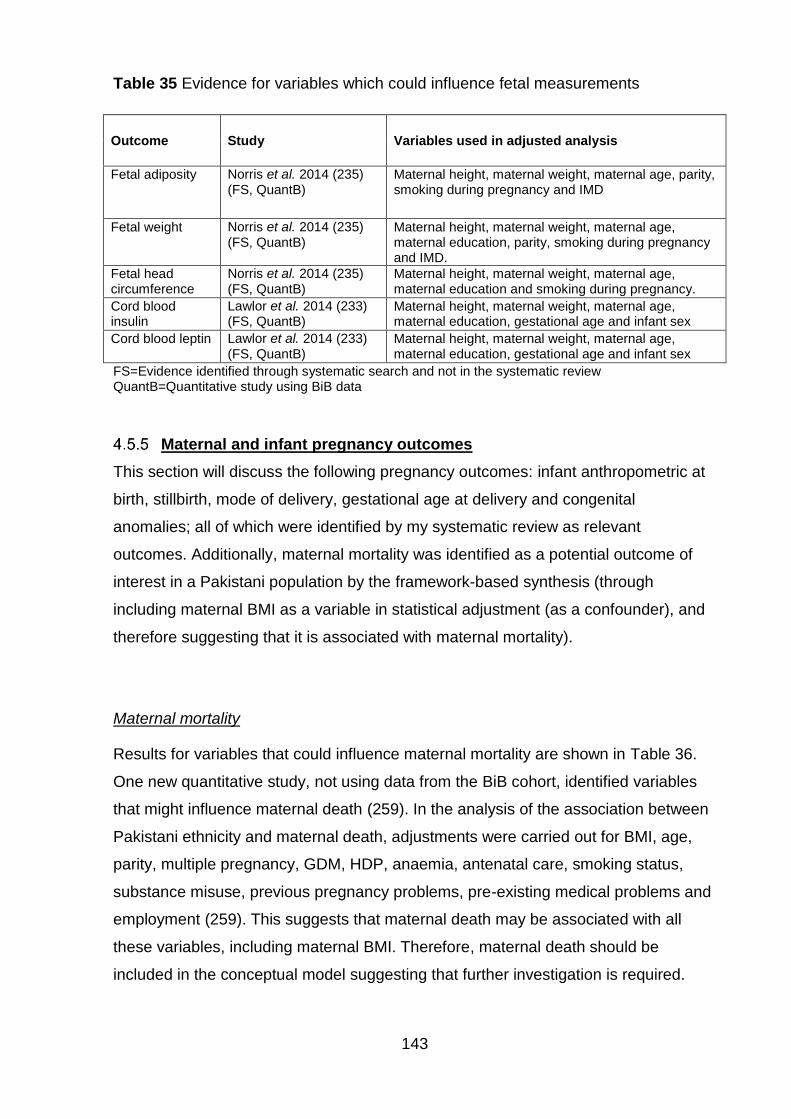
143
Table 35 Evidence for variables which could influence fetal measurements
Outcome Study Variables used in adjusted analysis
Fetal adiposity
Norris et al. 2014 (235) (FS, QuantB)
Maternal height, maternal weight, maternal age, parity, smoking during pregnancy and IMD
Fetal weight Norris et al. 2014 (235) (FS, QuantB)
Maternal height, maternal weight, maternal age, maternal education, parity, smoking during pregnancy and IMD.
Fetal head circumference
Norris et al. 2014 (235) (FS, QuantB)
Maternal height, maternal weight, maternal age, maternal education and smoking during pregnancy.
Cord blood insulin
Lawlor et al. 2014 (233) (FS, QuantB)
Maternal height, maternal weight, maternal age, maternal education, gestational age and infant sex
Cord blood leptin Lawlor et al. 2014 (233) (FS, QuantB)
Maternal height, maternal weight, maternal age, maternal education, gestational age and infant sex
FS=Evidence identified through systematic search and not in the systematic review QuantB=Quantitative study using BiB data
Maternal and infant pregnancy outcomes
This section will discuss the following pregnancy outcomes: infant anthropometric at
birth, stillbirth, mode of delivery, gestational age at delivery and congenital
anomalies; all of which were identified by my systematic review as relevant
outcomes. Additionally, maternal mortality was identified as a potential outcome of
interest in a Pakistani population by the framework-based synthesis (through
including maternal BMI as a variable in statistical adjustment (as a confounder), and
therefore suggesting that it is associated with maternal mortality).
Maternal mortality
Results for variables that could influence maternal mortality are shown in Table 36.
One new quantitative study, not using data from the BiB cohort, identified variables
that might influence maternal death (259). In the analysis of the association between
Pakistani ethnicity and maternal death, adjustments were carried out for BMI, age,
parity, multiple pregnancy, GDM, HDP, anaemia, antenatal care, smoking status,
substance misuse, previous pregnancy problems, pre-existing medical problems and
employment (259). This suggests that maternal death may be associated with all
these variables, including maternal BMI. Therefore, maternal death should be
included in the conceptual model suggesting that further investigation is required.
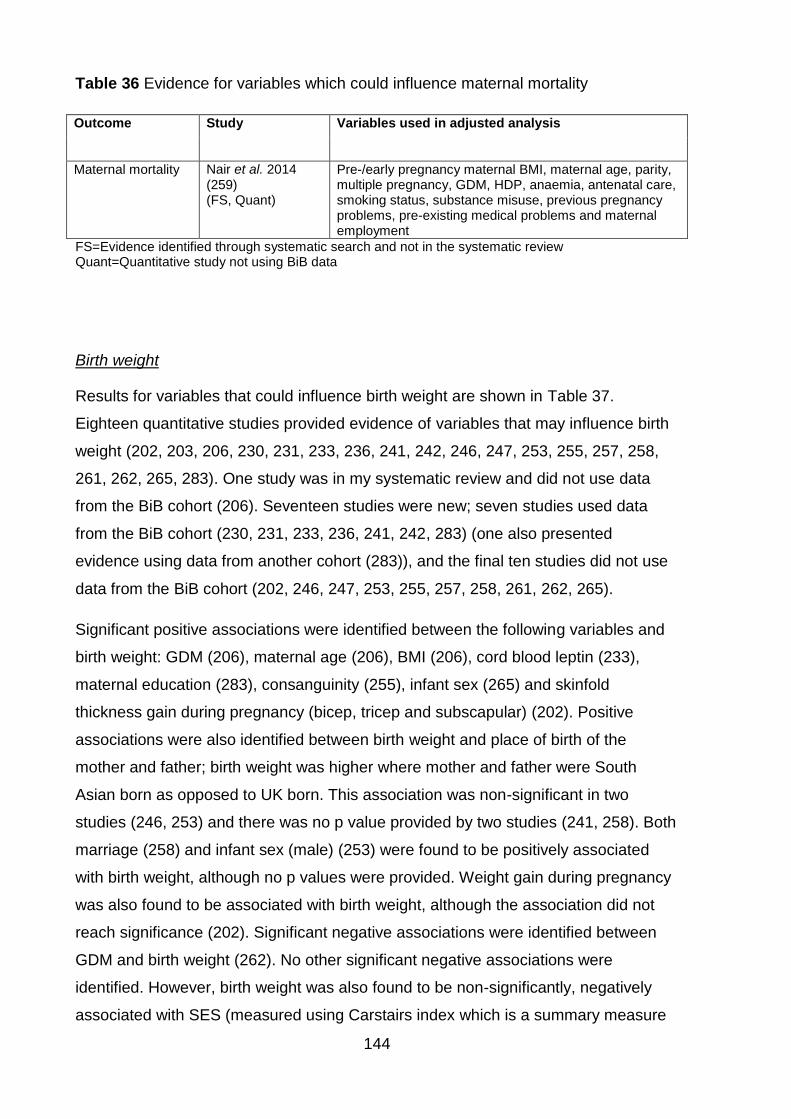
144
Table 36 Evidence for variables which could influence maternal mortality
Outcome Study Variables used in adjusted analysis
Maternal mortality Nair et al. 2014 (259) (FS, Quant)
Pre-/early pregnancy maternal BMI, maternal age, parity, multiple pregnancy, GDM, HDP, anaemia, antenatal care, smoking status, substance misuse, previous pregnancy problems, pre-existing medical problems and maternal employment
FS=Evidence identified through systematic search and not in the systematic review Quant=Quantitative study not using BiB data
Birth weight
Results for variables that could influence birth weight are shown in Table 37.
Eighteen quantitative studies provided evidence of variables that may influence birth
weight (202, 203, 206, 230, 231, 233, 236, 241, 242, 246, 247, 253, 255, 257, 258,
261, 262, 265, 283). One study was in my systematic review and did not use data
from the BiB cohort (206). Seventeen studies were new; seven studies used data
from the BiB cohort (230, 231, 233, 236, 241, 242, 283) (one also presented
evidence using data from another cohort (283)), and the final ten studies did not use
data from the BiB cohort (202, 246, 247, 253, 255, 257, 258, 261, 262, 265).
Significant positive associations were identified between the following variables and
birth weight: GDM (206), maternal age (206), BMI (206), cord blood leptin (233),
maternal education (283), consanguinity (255), infant sex (265) and skinfold
thickness gain during pregnancy (bicep, tricep and subscapular) (202). Positive
associations were also identified between birth weight and place of birth of the
mother and father; birth weight was higher where mother and father were South
Asian born as opposed to UK born. This association was non-significant in two
studies (246, 253) and there was no p value provided by two studies (241, 258). Both
marriage (258) and infant sex (male) (253) were found to be positively associated
with birth weight, although no p values were provided. Weight gain during pregnancy
was also found to be associated with birth weight, although the association did not
reach significance (202). Significant negative associations were identified between
GDM and birth weight (262). No other significant negative associations were
identified. However, birth weight was also found to be non-significantly, negatively
associated with SES (measured using Carstairs index which is a summary measure
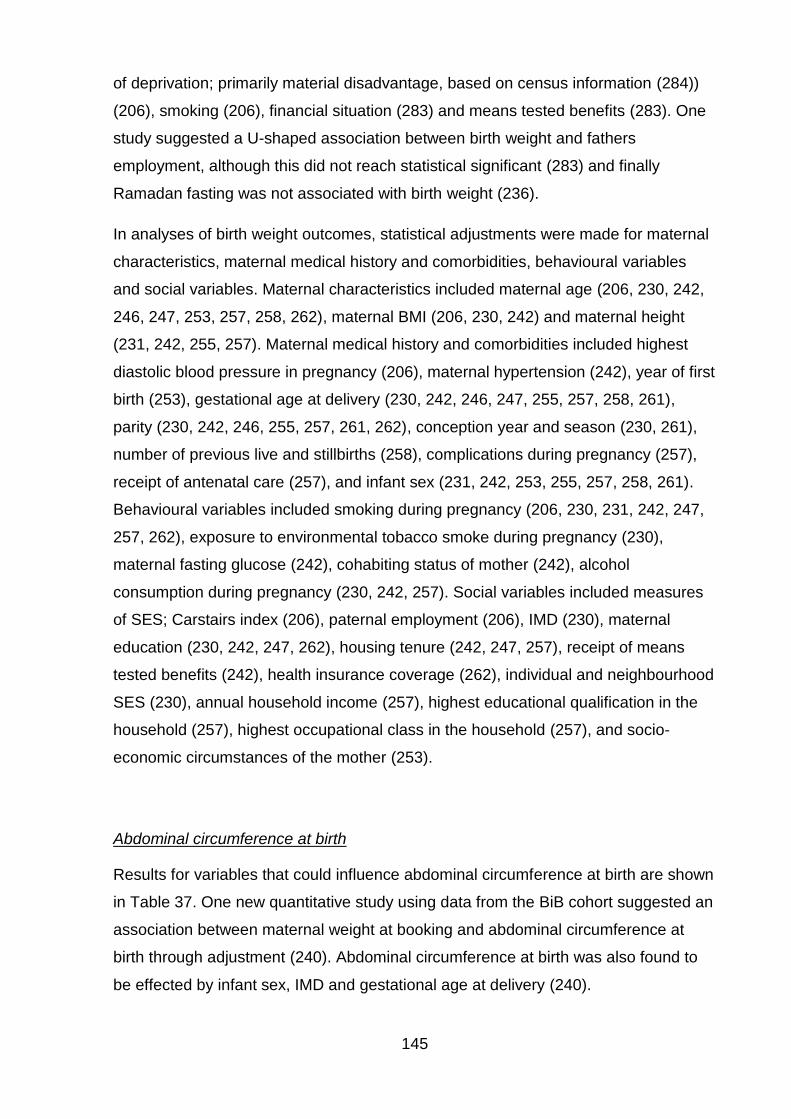
145
of deprivation; primarily material disadvantage, based on census information (284))
(206), smoking (206), financial situation (283) and means tested benefits (283). One
study suggested a U-shaped association between birth weight and fathers
employment, although this did not reach statistical significant (283) and finally
Ramadan fasting was not associated with birth weight (236).
In analyses of birth weight outcomes, statistical adjustments were made for maternal
characteristics, maternal medical history and comorbidities, behavioural variables
and social variables. Maternal characteristics included maternal age (206, 230, 242,
246, 247, 253, 257, 258, 262), maternal BMI (206, 230, 242) and maternal height
(231, 242, 255, 257). Maternal medical history and comorbidities included highest
diastolic blood pressure in pregnancy (206), maternal hypertension (242), year of first
birth (253), gestational age at delivery (230, 242, 246, 247, 255, 257, 258, 261),
parity (230, 242, 246, 255, 257, 261, 262), conception year and season (230, 261),
number of previous live and stillbirths (258), complications during pregnancy (257),
receipt of antenatal care (257), and infant sex (231, 242, 253, 255, 257, 258, 261).
Behavioural variables included smoking during pregnancy (206, 230, 231, 242, 247,
257, 262), exposure to environmental tobacco smoke during pregnancy (230),
maternal fasting glucose (242), cohabiting status of mother (242), alcohol
consumption during pregnancy (230, 242, 257). Social variables included measures
of SES; Carstairs index (206), paternal employment (206), IMD (230), maternal
education (230, 242, 247, 262), housing tenure (242, 247, 257), receipt of means
tested benefits (242), health insurance coverage (262), individual and neighbourhood
SES (230), annual household income (257), highest educational qualification in the
household (257), highest occupational class in the household (257), and socio-
economic circumstances of the mother (253).
Abdominal circumference at birth
Results for variables that could influence abdominal circumference at birth are shown
in Table 37. One new quantitative study using data from the BiB cohort suggested an
association between maternal weight at booking and abdominal circumference at
birth through adjustment (240). Abdominal circumference at birth was also found to
be effected by infant sex, IMD and gestational age at delivery (240).
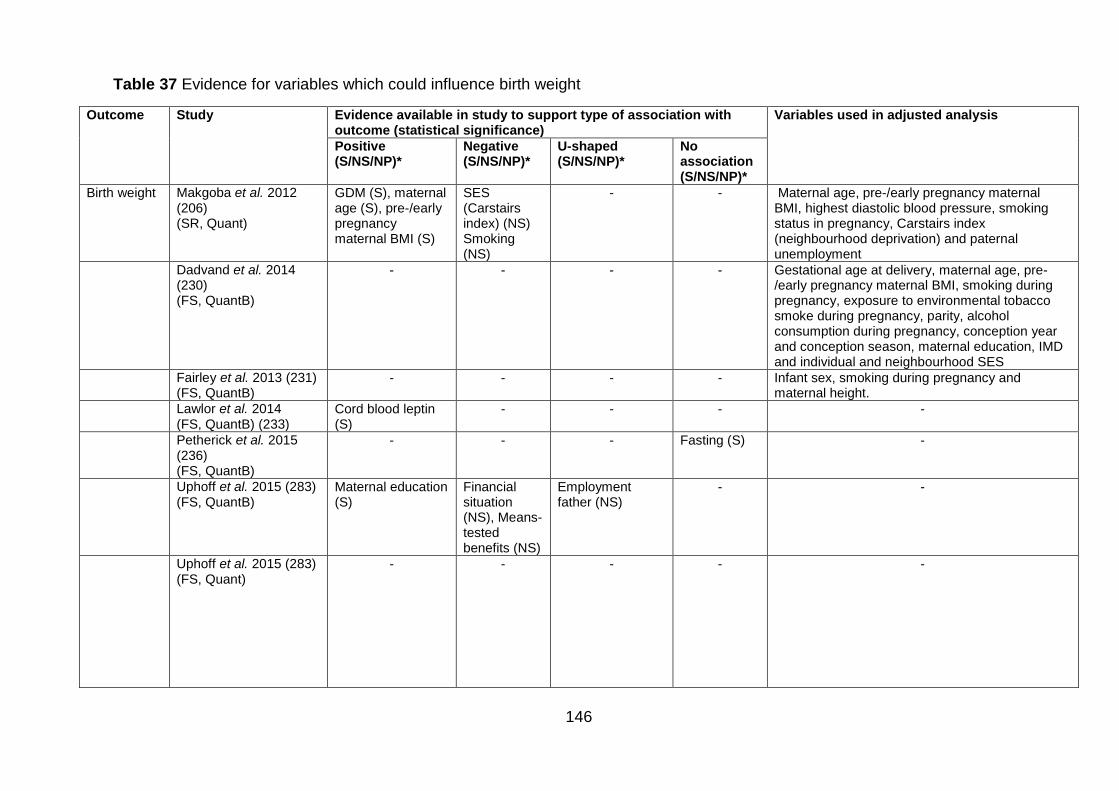
146
Table 37 Evidence for variables which could influence birth weight
Outcome Study Evidence available in study to support type of association with outcome (statistical significance)
Variables used in adjusted analysis
Positive (S/NS/NP)*
Negative (S/NS/NP)*
U-shaped (S/NS/NP)*
No association (S/NS/NP)*
Birth weight
Makgoba et al. 2012 (206) (SR, Quant)
GDM (S), maternal age (S), pre-/early pregnancy maternal BMI (S)
SES (Carstairs index) (NS) Smoking (NS)
- - Maternal age, pre-/early pregnancy maternal BMI, highest diastolic blood pressure, smoking status in pregnancy, Carstairs index (neighbourhood deprivation) and paternal unemployment
Dadvand et al. 2014 (230) (FS, QuantB)
- - - - Gestational age at delivery, maternal age, pre-/early pregnancy maternal BMI, smoking during pregnancy, exposure to environmental tobacco smoke during pregnancy, parity, alcohol consumption during pregnancy, conception year and conception season, maternal education, IMD and individual and neighbourhood SES
Fairley et al. 2013 (231) (FS, QuantB)
- - - - Infant sex, smoking during pregnancy and maternal height.
Lawlor et al. 2014 (FS, QuantB) (233)
Cord blood leptin (S)
- - - -
Petherick et al. 2015 (236) (FS, QuantB)
- - - Fasting (S) -
Uphoff et al. 2015 (283) (FS, QuantB)
Maternal education (S)
Financial situation (NS), Means-tested benefits (NS)
Employment father (NS)
- -
Uphoff et al. 2015 (283) (FS, Quant)
- - - - -
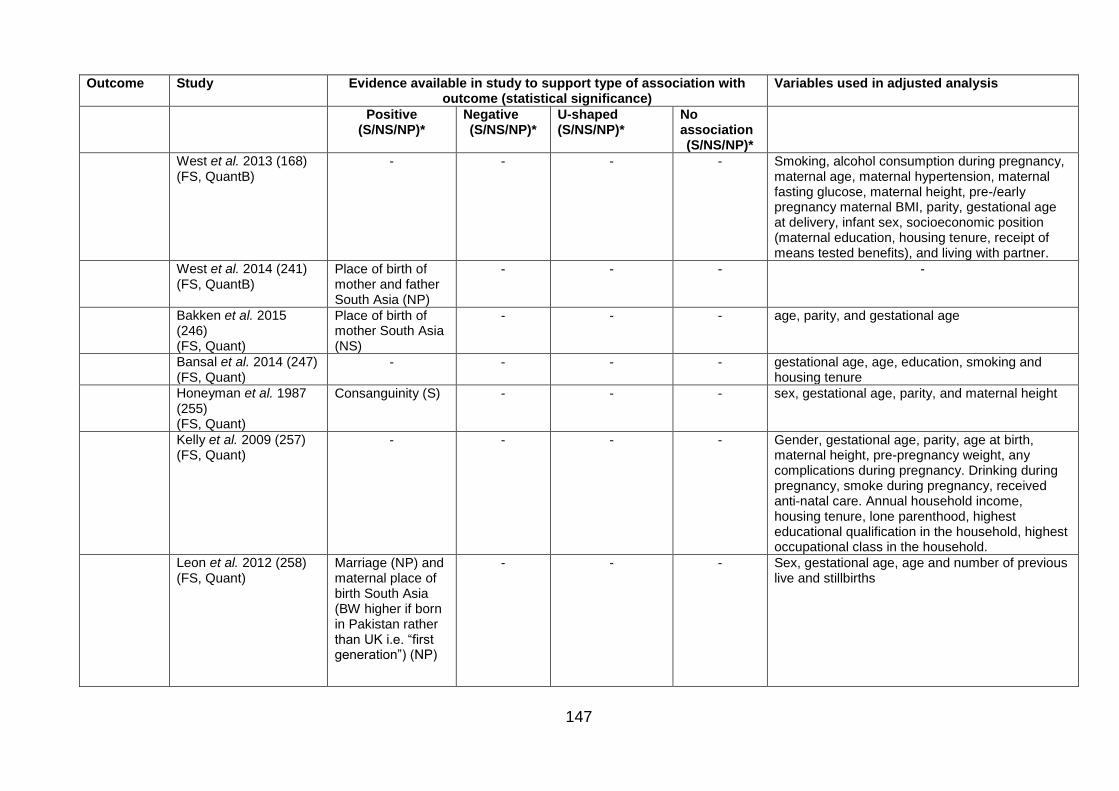
147
Outcome Study Evidence available in study to support type of association with outcome (statistical significance)
Variables used in adjusted analysis
Positive (S/NS/NP)*
Negative (S/NS/NP)*
U-shaped (S/NS/NP)*
No association (S/NS/NP)*
West et al. 2013 (168) (FS, QuantB)
- - - - Smoking, alcohol consumption during pregnancy, maternal age, maternal hypertension, maternal fasting glucose, maternal height, pre-/early pregnancy maternal BMI, parity, gestational age at delivery, infant sex, socioeconomic position (maternal education, housing tenure, receipt of means tested benefits), and living with partner.
West et al. 2014 (241) (FS, QuantB)
Place of birth of mother and father South Asia (NP)
- - - -
Bakken et al. 2015 (246) (FS, Quant)
Place of birth of mother South Asia (NS)
- - - age, parity, and gestational age
Bansal et al. 2014 (247) (FS, Quant)
- - - - gestational age, age, education, smoking and housing tenure
Honeyman et al. 1987 (255) (FS, Quant)
Consanguinity (S) - - - sex, gestational age, parity, and maternal height
Kelly et al. 2009 (257) (FS, Quant)
- - - - Gender, gestational age, parity, age at birth, maternal height, pre-pregnancy weight, any complications during pregnancy. Drinking during pregnancy, smoke during pregnancy, received anti-natal care. Annual household income, housing tenure, lone parenthood, highest educational qualification in the household, highest occupational class in the household.
Leon et al. 2012 (258) (FS, Quant)
Marriage (NP) and maternal place of birth South Asia (BW higher if born in Pakistan rather than UK i.e. “first generation”) (NP)
- - - Sex, gestational age, age and number of previous live and stillbirths
148
Outcome Study Evidence available in study to support type of association with outcome (statistical significance)
Variables used in adjusted analysis
Positive (S/NS/NP)*
Negative (S/NS/NP)*
U-shaped (S/NS/NP)*
No association (S/NS/NP)*
Birth weight
Harding et al. 2004 (253) (FS, Quant)
Place of birth South Asia (NS), infant sex (NP)
- - - age at birth registration and socio-, economic circumstances of mother, year of first birth, and gender of infant
Sanchalika et al. 2015 (262) (FS, Quant)
- GDM (S) - - age, education, health insurance coverage, parity, and smoking and drinking habits
Pedersen et al. 2012 (261) (FS, Quant)
- - Length of residence in the country (S)
- year of delivery, gestational age, infant sex and parity
Terry et al. 1980 (265) (FS, Quant)
Infant sex (S) - - - -
Bissenden et al. 1981 (202) (SR, Quant)
Weight gain (NS), bicep (S), tricep (S) and subscapular (NS) skinfold thickness gain
- - - -
Abdominal circum- ference at birth
Traviss et al. 2012 (240) (FS, QuantB)
Baby is male (S) IMD (S), gestational age at delivery (S)
- - Mother’s weight at booking
-No evidence identified SR=Evidence included in systematic review, FS=Evidence identified through systematic search and not in the systematic review Quant=Quantitative study not using BiB data, QuantB=Quantitative study using BiB data *S=Statistically significant association, NS=association not statistically significant, NP=Evidence of statistical significance not available
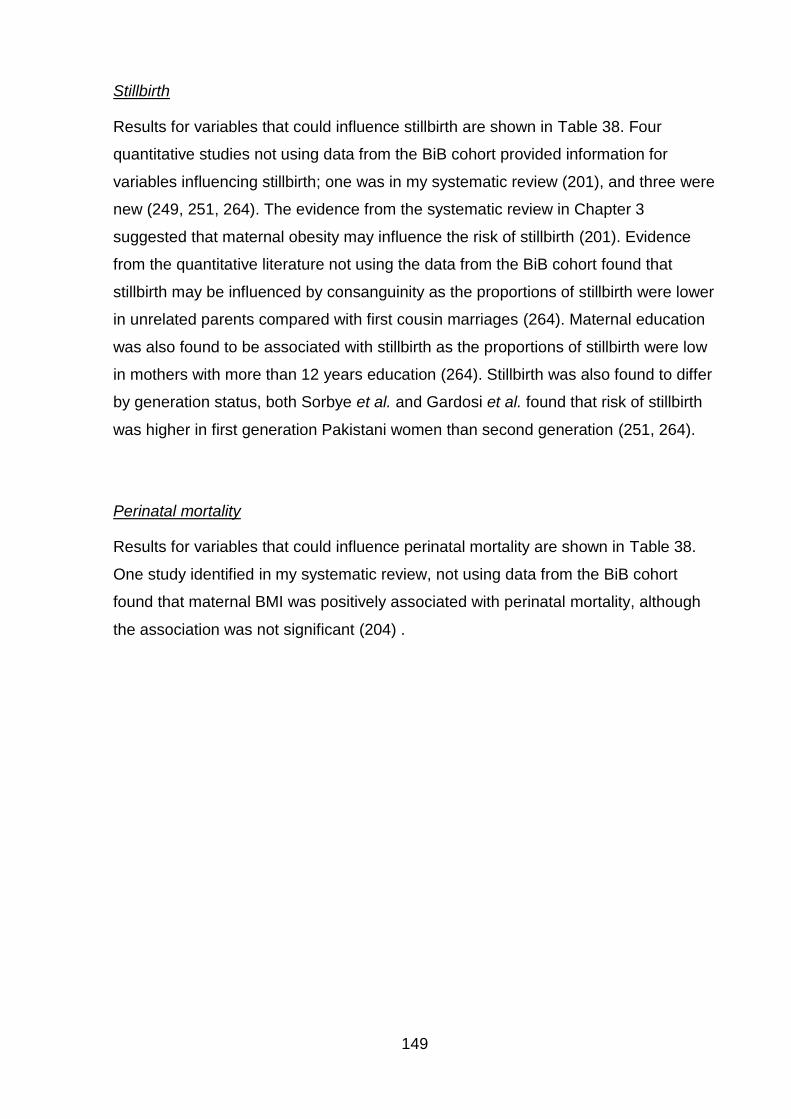
149
Stillbirth
Results for variables that could influence stillbirth are shown in Table 38. Four
quantitative studies not using data from the BiB cohort provided information for
variables influencing stillbirth; one was in my systematic review (201), and three were
new (249, 251, 264). The evidence from the systematic review in Chapter 3
suggested that maternal obesity may influence the risk of stillbirth (201). Evidence
from the quantitative literature not using the data from the BiB cohort found that
stillbirth may be influenced by consanguinity as the proportions of stillbirth were lower
in unrelated parents compared with first cousin marriages (264). Maternal education
was also found to be associated with stillbirth as the proportions of stillbirth were low
in mothers with more than 12 years education (264). Stillbirth was also found to differ
by generation status, both Sorbye et al. and Gardosi et al. found that risk of stillbirth
was higher in first generation Pakistani women than second generation (251, 264).
Perinatal mortality
Results for variables that could influence perinatal mortality are shown in Table 38.
One study identified in my systematic review, not using data from the BiB cohort
found that maternal BMI was positively associated with perinatal mortality, although
the association was not significant (204) .
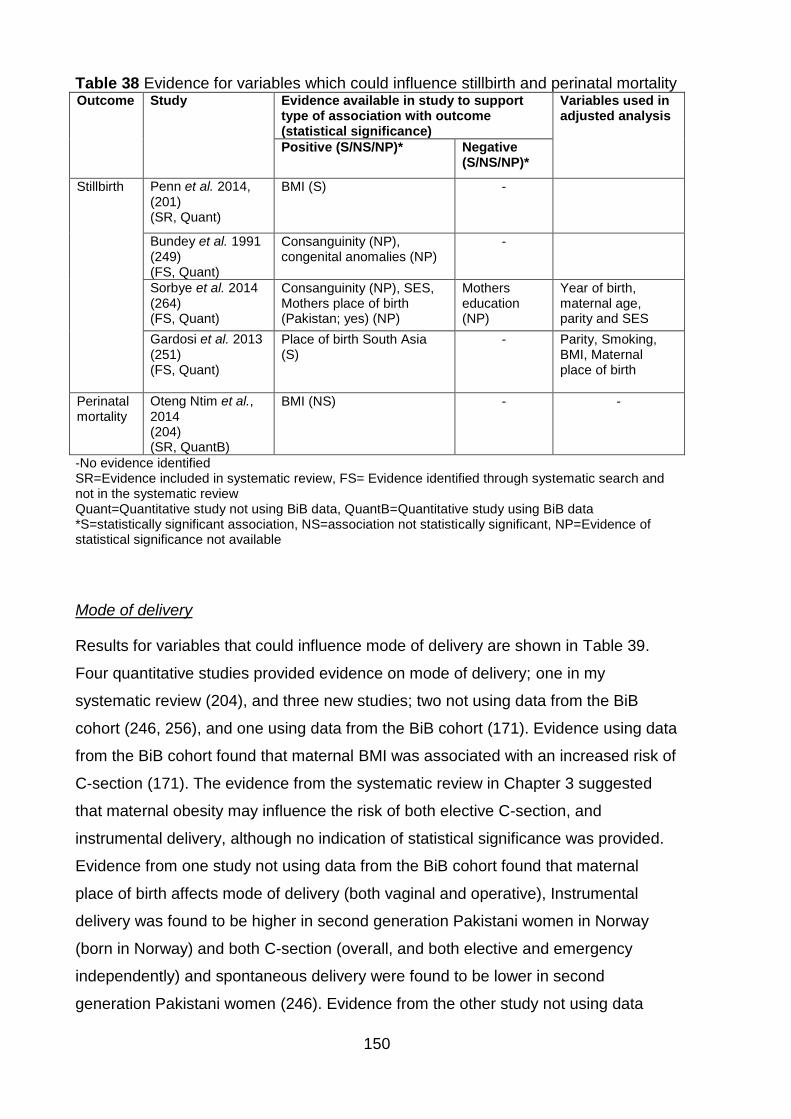
150
Table 38 Evidence for variables which could influence stillbirth and perinatal mortality Outcome Study Evidence available in study to support
type of association with outcome (statistical significance)
Variables used in adjusted analysis
Positive (S/NS/NP)* Negative (S/NS/NP)*
Stillbirth
Penn et al. 2014, (201) (SR, Quant)
BMI (S) -
Bundey et al. 1991 (249) (FS, Quant)
Consanguinity (NP), congenital anomalies (NP)
-
Sorbye et al. 2014 (264) (FS, Quant)
Consanguinity (NP), SES, Mothers place of birth (Pakistan; yes) (NP)
Mothers education (NP)
Year of birth, maternal age, parity and SES
Gardosi et al. 2013 (251) (FS, Quant)
Place of birth South Asia (S)
- Parity, Smoking, BMI, Maternal place of birth
Perinatal mortality
Oteng Ntim et al., 2014 (204) (SR, QuantB)
BMI (NS) - -
-No evidence identified SR=Evidence included in systematic review, FS= Evidence identified through systematic search and not in the systematic review Quant=Quantitative study not using BiB data, QuantB=Quantitative study using BiB data *S=statistically significant association, NS=association not statistically significant, NP=Evidence of statistical significance not available
Mode of delivery
Results for variables that could influence mode of delivery are shown in Table 39.
Four quantitative studies provided evidence on mode of delivery; one in my
systematic review (204), and three new studies; two not using data from the BiB
cohort (246, 256), and one using data from the BiB cohort (171). Evidence using data
from the BiB cohort found that maternal BMI was associated with an increased risk of
C-section (171). The evidence from the systematic review in Chapter 3 suggested
that maternal obesity may influence the risk of both elective C-section, and
instrumental delivery, although no indication of statistical significance was provided.
Evidence from one study not using data from the BiB cohort found that maternal
place of birth affects mode of delivery (both vaginal and operative), Instrumental
delivery was found to be higher in second generation Pakistani women in Norway
(born in Norway) and both C-section (overall, and both elective and emergency
independently) and spontaneous delivery were found to be lower in second
generation Pakistani women (246). Evidence from the other study not using data
151
from the BiB cohort suggested that odds of C-section might be affected by age,
attendance to antenatal classes, booking >20 weeks, birth weight, fetal sex, IUGR,
year of birth and hospital of birth and that odds of delivery by forceps or ventouse
(instrumental delivery) might be affected by age, ethnic group, birth weight, hospital
of birth, induction, year of birth, baby's sex and augmentation by including these
variables in adjustments for the association between maternal BMI and the mode of
delivery (256).
152
Table 39 Evidence for variables which could influence mode of delivery Outcome Study Evidence available in study to support
type of association with outcome (statistical significance)
Variables used in adjusted analysis
Positive (S/NS/NP)*
Negative (S/NS/NP)*
Mode of delivery
Oteng-Ntim et al. 2013 (204) (SR, Quant)
Elective and emergency C-section and instrumental delivery: BMI (NP)
- -
Bryant et al. 2014 (171) (SR, QuantB)
C-section (S): BMI
- -
Bakken et al. 2015 (246) (FS, Quant)
Instrumental delivery: Maternal place of birth (second generation higher prevalence) (NP)
C-section (overall, and both elective and emergency independently) and spontaneous delivery: Maternal place of birth (second generation lower prevalence) (NP)
-
Ibison et al. 2005 (256) (FS, Quant)
- - Odds for C-section: age, attendance to antenatal classes, booking>20 weeks, birthweight, fetal sex, IUGR, year of birth and hospital of birth Odds for delivery by forceps or ventouse: age, ethnic group, birthweight, hospital of birth, induction, year of birth, baby's sex and augmentation.
-No evidence identified SR=Evidence included in systematic review, FS=Evidence identified through systematic search and not in the systematic review Quant=Quantitative study not using BiB data *S=statistically significant association, NS=association not statistically significant, NP=Evidence of statistical significance not available
Gestational age at delivery
Results for variables that could influence gestational age at delivery are shown in
Table 40. Twelve studies presented evidence of variables that might influence
gestational age at delivery; one was from my systematic review (204), and eleven
were new; five used data from the BiB cohort only (231, 236, 239-241), one study
used data from the BiB cohort in addition to data from the Millennium Cohort study
(283), and five used other quantitative data (246, 247, 258, 261, 262).
153
One study identified through the search for my systematic review adjusted for
maternal age, parity and deprivation in the association between maternal ethnicity
and gestational age at delivery suggesting that these three variables might be
associated with the outcome (204). Evidence using data from the BiB cohort
suggested that gestational age is associated with infant sex (231, 239). Mother’s
mental health during pregnancy was also found to be associated with gestational age
at delivery; a higher general heal questionnaire (GHQ) score was associated with an
earlier gestational age at delivery (240). Evidence also found that there was no
association between gestational age at delivery and fasting (236), air pollution (239)
and measures of SES; maternal education, financial situation, means tested benefits
and employment of the father (283). Three studies found that gestational age at
delivery was positively associated with generation status (241, 246, 258), one
additional study found that there was a U-shaped association between gestational
age at delivery (pre-term birth) and length of residence in the country (261). GDM
was found to be positively associated with gestational age at delivery; if GDM was
present, gestational age at delivery was later (262). Marital status was also found to
be positively associated with gestational age at delivery (258).
In analyses of the outcome gestational age at birth, statistical adjustments were
made for maternal age (204, 246, 247, 261, 262), parity (204, 246, 261, 262),
deprivation (204), housing tenure (247), individual education (247), health insurance
coverage (262), year of delivery (261), smoking (261, 262) and drinking habits (261).
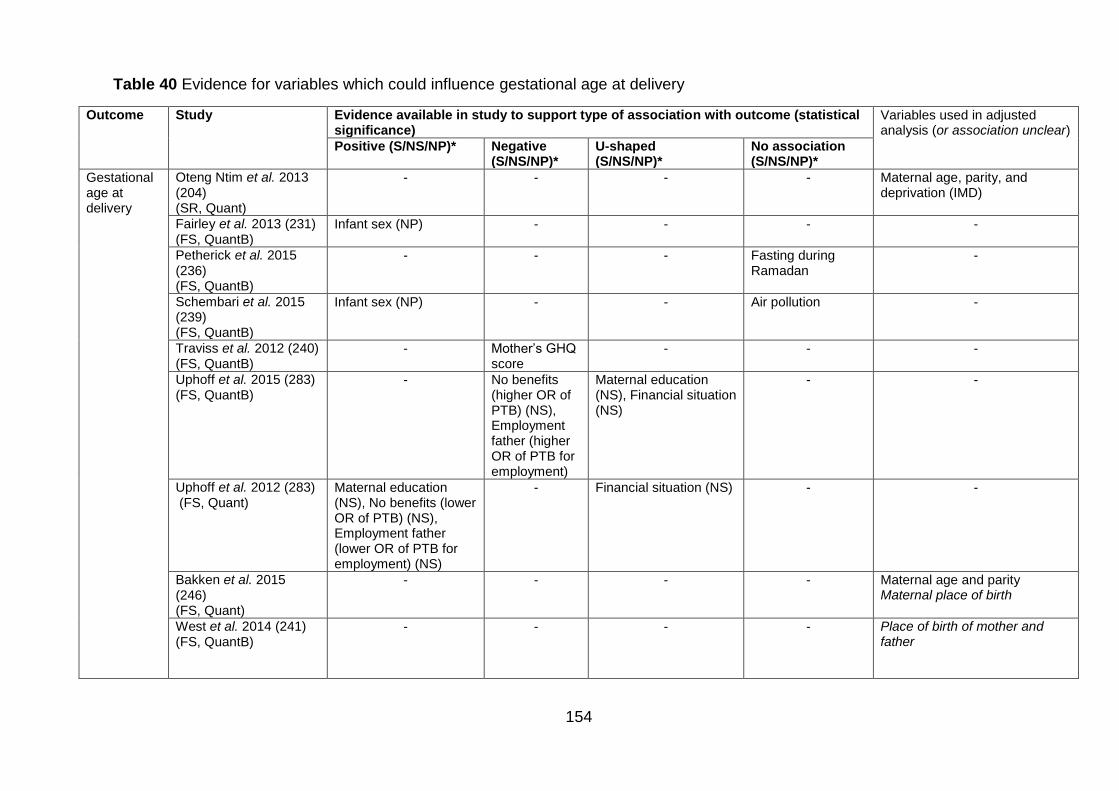
154
Table 40 Evidence for variables which could influence gestational age at delivery
Outcome Study Evidence available in study to support type of association with outcome (statistical significance)
Variables used in adjusted analysis (or association unclear)
Positive (S/NS/NP)* Negative (S/NS/NP)*
U-shaped (S/NS/NP)*
No association (S/NS/NP)*
Gestational age at delivery
Oteng Ntim et al. 2013 (204) (SR, Quant)
- - - - Maternal age, parity, and deprivation (IMD)
Fairley et al. 2013 (231) (FS, QuantB)
Infant sex (NP) - - - -
Petherick et al. 2015 (236) (FS, QuantB)
- - - Fasting during Ramadan
-
Schembari et al. 2015 (239) (FS, QuantB)
Infant sex (NP) - - Air pollution -
Traviss et al. 2012 (240) (FS, QuantB)
- Mother’s GHQ score
- - -
Uphoff et al. 2015 (283) (FS, QuantB)
- No benefits (higher OR of PTB) (NS), Employment father (higher OR of PTB for employment)
Maternal education (NS), Financial situation (NS)
- -
Uphoff et al. 2012 (283) (FS, Quant)
Maternal education (NS), No benefits (lower OR of PTB) (NS), Employment father (lower OR of PTB for employment) (NS)
- Financial situation (NS) - -
Bakken et al. 2015 (246) (FS, Quant)
- - - - Maternal age and parity Maternal place of birth
West et al. 2014 (241) (FS, QuantB)
- - - - Place of birth of mother and father
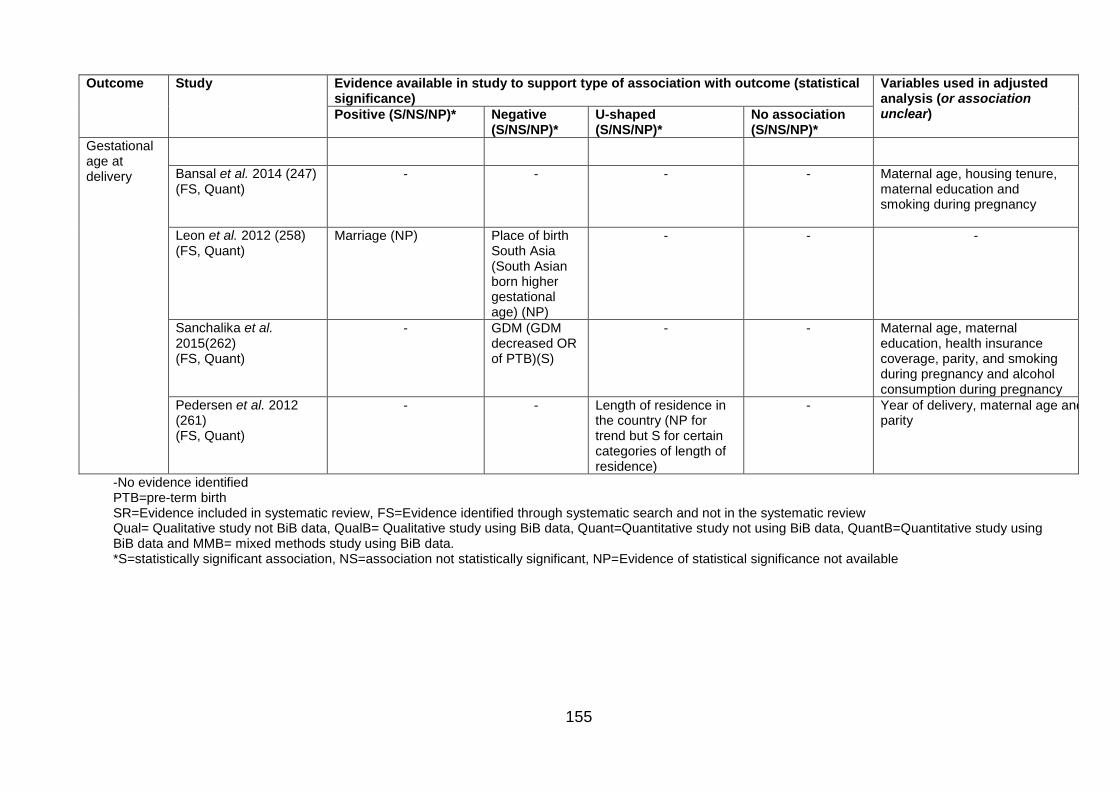
155
Outcome Study Evidence available in study to support type of association with outcome (statistical significance)
Variables used in adjusted analysis (or association unclear) Positive (S/NS/NP)* Negative
(S/NS/NP)* U-shaped (S/NS/NP)*
No association (S/NS/NP)*
Gestational age at delivery
Bansal et al. 2014 (247) (FS, Quant)
- - - - Maternal age, housing tenure, maternal education and smoking during pregnancy
Leon et al. 2012 (258) (FS, Quant)
Marriage (NP) Place of birth South Asia (South Asian born higher gestational age) (NP)
- - -
Sanchalika et al. 2015(262) (FS, Quant)
- GDM (GDM decreased OR of PTB)(S)
- - Maternal age, maternal education, health insurance coverage, parity, and smoking during pregnancy and alcohol consumption during pregnancy
Pedersen et al. 2012 (261) (FS, Quant)
- - Length of residence in the country (NP for trend but S for certain categories of length of residence)
- Year of delivery, maternal age and parity
-No evidence identified PTB=pre-term birth SR=Evidence included in systematic review, FS=Evidence identified through systematic search and not in the systematic review Qual= Qualitative study not BiB data, QualB= Qualitative study using BiB data, Quant=Quantitative study not using BiB data, QuantB=Quantitative study using BiB data and MMB= mixed methods study using BiB data. *S=statistically significant association, NS=association not statistically significant, NP=Evidence of statistical significance not available
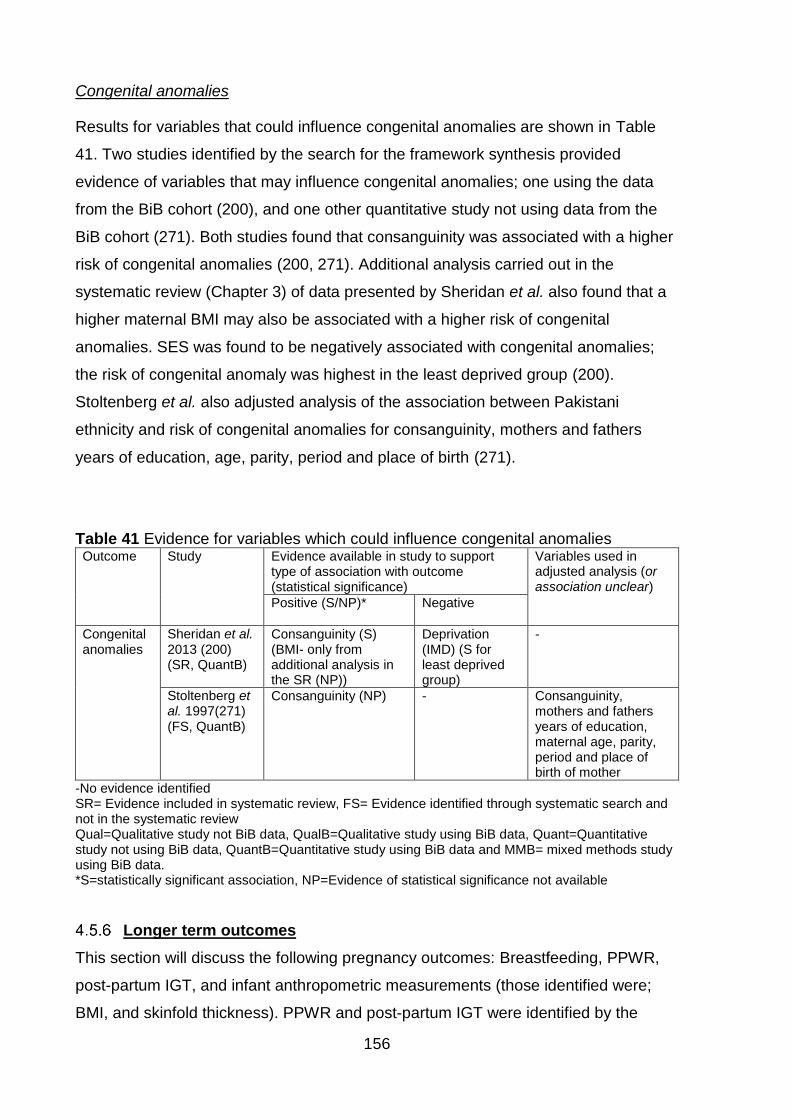
156
Congenital anomalies
Results for variables that could influence congenital anomalies are shown in Table
41. Two studies identified by the search for the framework synthesis provided
evidence of variables that may influence congenital anomalies; one using the data
from the BiB cohort (200), and one other quantitative study not using data from the
BiB cohort (271). Both studies found that consanguinity was associated with a higher
risk of congenital anomalies (200, 271). Additional analysis carried out in the
systematic review (Chapter 3) of data presented by Sheridan et al. also found that a
higher maternal BMI may also be associated with a higher risk of congenital
anomalies. SES was found to be negatively associated with congenital anomalies;
the risk of congenital anomaly was highest in the least deprived group (200).
Stoltenberg et al. also adjusted analysis of the association between Pakistani
ethnicity and risk of congenital anomalies for consanguinity, mothers and fathers
years of education, age, parity, period and place of birth (271).
Table 41 Evidence for variables which could influence congenital anomalies Outcome Study Evidence available in study to support
type of association with outcome (statistical significance)
Variables used in adjusted analysis (or association unclear)
Positive (S/NP)* Negative
Congenital anomalies
Sheridan et al. 2013 (200) (SR, QuantB)
Consanguinity (S) (BMI- only from additional analysis in the SR (NP))
Deprivation (IMD) (S for least deprived group)
-
Stoltenberg et al. 1997(271) (FS, QuantB)
Consanguinity (NP) - Consanguinity, mothers and fathers years of education, maternal age, parity, period and place of birth of mother
-No evidence identified SR= Evidence included in systematic review, FS= Evidence identified through systematic search and not in the systematic review Qual=Qualitative study not BiB data, QualB=Qualitative study using BiB data, Quant=Quantitative study not using BiB data, QuantB=Quantitative study using BiB data and MMB= mixed methods study using BiB data. *S=statistically significant association, NP=Evidence of statistical significance not available
Longer term outcomes
This section will discuss the following pregnancy outcomes: Breastfeeding, PPWR,
post-partum IGT, and infant anthropometric measurements (those identified were;
BMI, and skinfold thickness). PPWR and post-partum IGT were identified by the
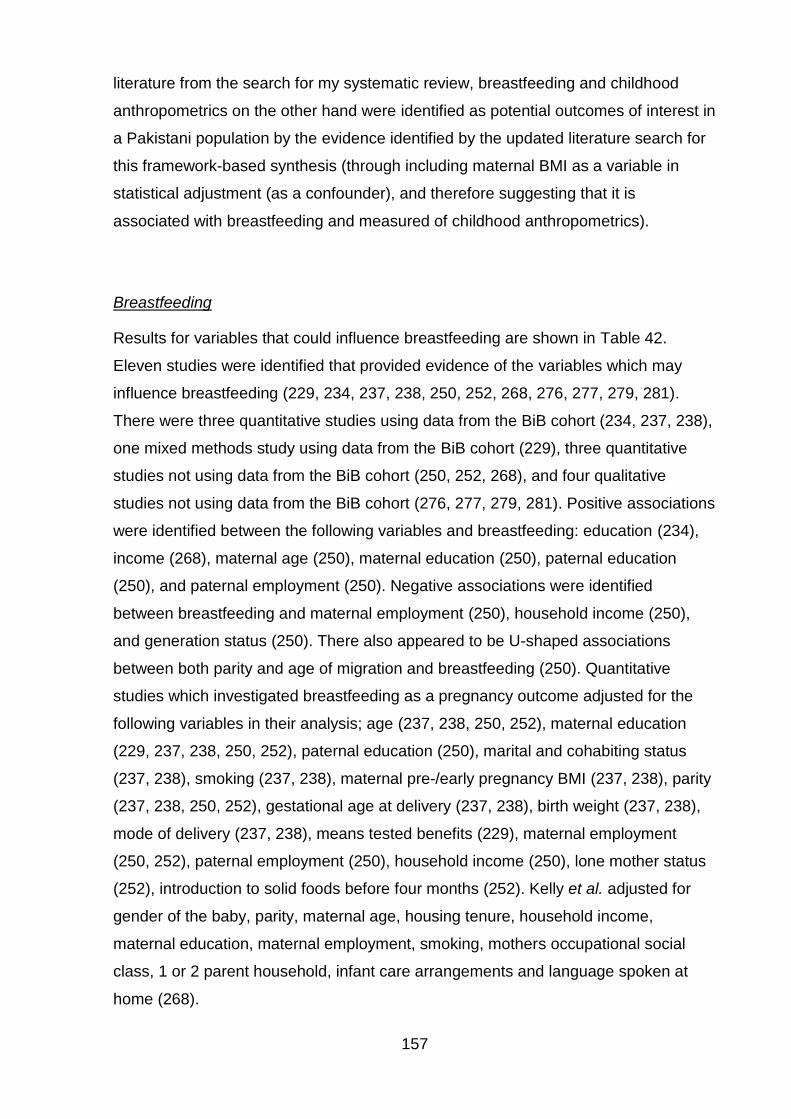
157
literature from the search for my systematic review, breastfeeding and childhood
anthropometrics on the other hand were identified as potential outcomes of interest in
a Pakistani population by the evidence identified by the updated literature search for
this framework-based synthesis (through including maternal BMI as a variable in
statistical adjustment (as a confounder), and therefore suggesting that it is
associated with breastfeeding and measured of childhood anthropometrics).
Breastfeeding
Results for variables that could influence breastfeeding are shown in Table 42.
Eleven studies were identified that provided evidence of the variables which may
influence breastfeeding (229, 234, 237, 238, 250, 252, 268, 276, 277, 279, 281).
There were three quantitative studies using data from the BiB cohort (234, 237, 238),
one mixed methods study using data from the BiB cohort (229), three quantitative
studies not using data from the BiB cohort (250, 252, 268), and four qualitative
studies not using data from the BiB cohort (276, 277, 279, 281). Positive associations
were identified between the following variables and breastfeeding: education (234),
income (268), maternal age (250), maternal education (250), paternal education
(250), and paternal employment (250). Negative associations were identified
between breastfeeding and maternal employment (250), household income (250),
and generation status (250). There also appeared to be U-shaped associations
between both parity and age of migration and breastfeeding (250). Quantitative
studies which investigated breastfeeding as a pregnancy outcome adjusted for the
following variables in their analysis; age (237, 238, 250, 252), maternal education
(229, 237, 238, 250, 252), paternal education (250), marital and cohabiting status
(237, 238), smoking (237, 238), maternal pre-/early pregnancy BMI (237, 238), parity
(237, 238, 250, 252), gestational age at delivery (237, 238), birth weight (237, 238),
mode of delivery (237, 238), means tested benefits (229), maternal employment
(250, 252), paternal employment (250), household income (250), lone mother status
(252), introduction to solid foods before four months (252). Kelly et al. adjusted for
gender of the baby, parity, maternal age, housing tenure, household income,
maternal education, maternal employment, smoking, mothers occupational social
class, 1 or 2 parent household, infant care arrangements and language spoken at
home (268).
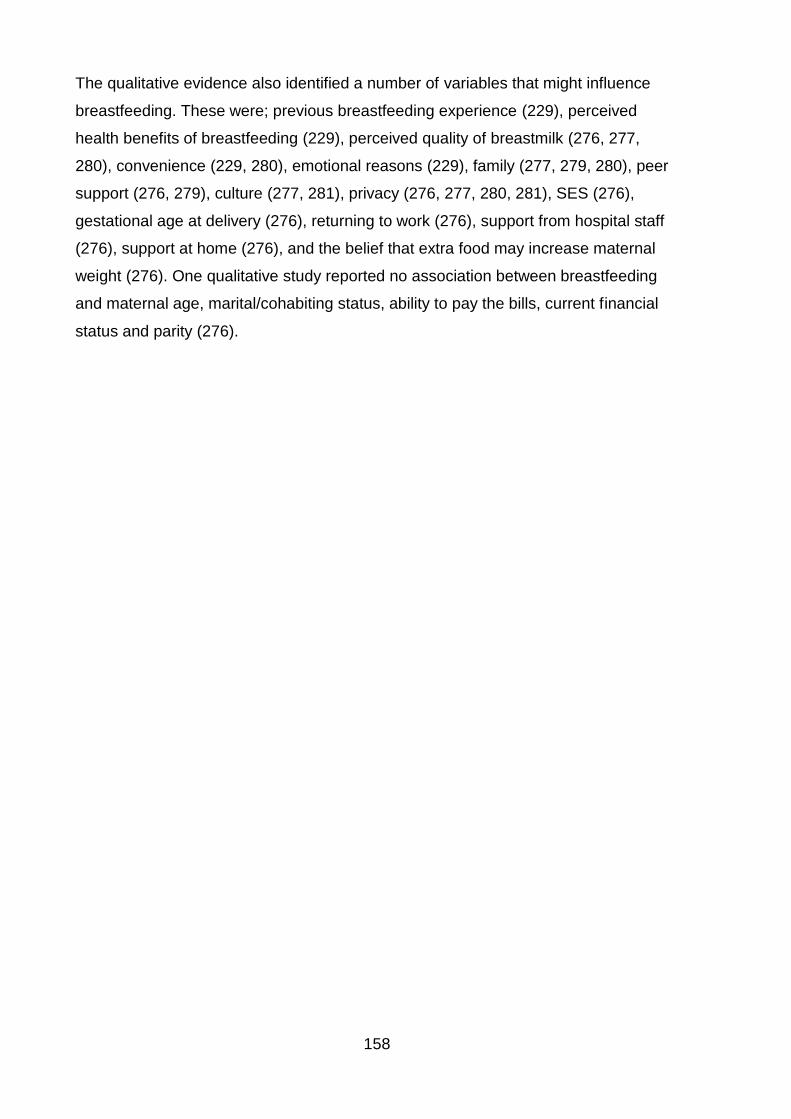
158
The qualitative evidence also identified a number of variables that might influence
breastfeeding. These were; previous breastfeeding experience (229), perceived
health benefits of breastfeeding (229), perceived quality of breastmilk (276, 277,
280), convenience (229, 280), emotional reasons (229), family (277, 279, 280), peer
support (276, 279), culture (277, 281), privacy (276, 277, 280, 281), SES (276),
gestational age at delivery (276), returning to work (276), support from hospital staff
(276), support at home (276), and the belief that extra food may increase maternal
weight (276). One qualitative study reported no association between breastfeeding
and maternal age, marital/cohabiting status, ability to pay the bills, current financial
status and parity (276).
159
Table 42 Evidence for variables which could influence breastfeeding
Outcome Study
Evidence available in study to support type of association with outcome (statistical significance) Variables used in adjusted
analysis (or association unclear)
Qualitative evidence
Positive (S/NS/NP)*
Negative (S/NS/NP)*
U-shaped (S/NS/NP)*
No association (S/NS/NP)*
Breast- feeding
Santoreli et al. 2014 (237) (FS, QuantB)
- - - - Maternal age, maternal education, marital status, smoking during pregnancy, pre-/early pregnancy maternal BMI, parity, pre-term birth (gestational age at delivery), low birth weight (birthweight) and mode of delivery.
-
Santoreli et al. 2013 (238) (FS, QuantB)
- - - - Maternal age, maternal education, marital status, smoking during pregnancy, pre-/early pregnancy maternal BMI, parity, gestational age at delivery, birthweight and mode of delivery.
-
Cabieses et al. 2014 (229) (FS, QuantB)
- - - - Maternal education and means testes benefits
Previous breastfeeding experience, health benefits, convenience, emotional reasons, and confidence
Lawton et al. 2012 (234) (FS, QuantB)
Education (S) - - - - -
160
Outcome Study
Evidence available in study to support type of association with outcome (statistical significance) Variables used in adjusted
analysis (or association unclear)
Qualitative evidence
Positive (S/NS/NP)*
Negative (S/NS/NP)*
U-shaped (S/NS/NP)*
No association (S/NS/NP)*
Breast- feeding
Griffiths et al. 2007 (252) (FS, Quant)
- - - - Age at first motherhood, maternal age at cohort baby's birth, parity, socio-economic status, maternal education, maternal employment, lone mother status, introduction of solids before 4 months if discontinuing breastfeeding before 4 months (and discontinuing breastfeeding before 4 months if introducing solids <4 months)
-
Kelly et al. 2006 (268) (FS, Quant)
Income (S) - - - Gender of the baby, parity, maternal age, housing tenure, household income, maternal education, maternal employment, smoking, mothers occupational social class, 1 or 2 parent household, infant care arrangements and language spoken at home
-
Busck-Rasmussen 2014 (250) (FS, Quant)
Suboptimal breastfeeding: Parental employment (NP), Length of residence (NP), age at migration to Denmark (NP).
Suboptimal breastfeeding: Place of birth South Asia (descendant of migrants had higher odds of suboptimal breastfeeding than migrants to Denmark) (NP), Maternal age (higher age, decreased odds of suboptimal breastfeeding) (NP), Maternal and paternal education (higher education, decreased odds of suboptimal breastfeeding) (NP).
Sub-optimal breastfeeding: Parity (NP) and household income (NP).
- Maternal age, parity, maternal and paternal education, maternal and paternal attachment to labour market and household income.
-
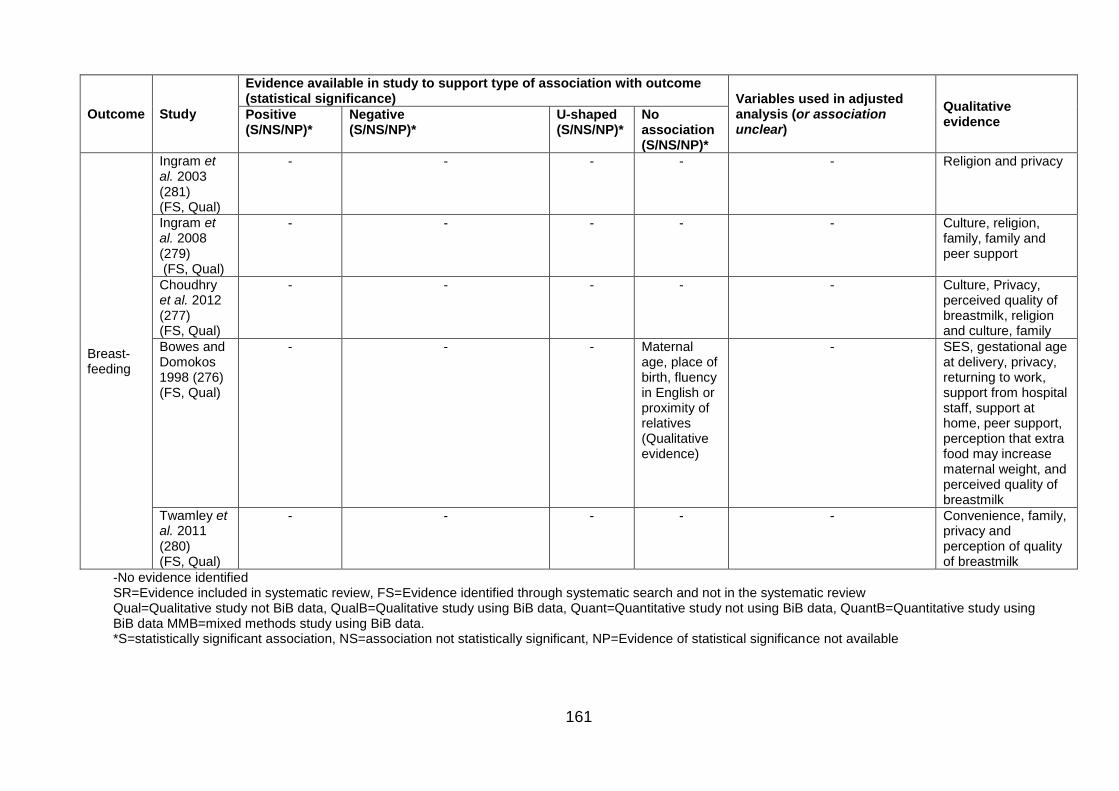
161
Outcome Study
Evidence available in study to support type of association with outcome (statistical significance) Variables used in adjusted
analysis (or association unclear)
Qualitative evidence
Positive (S/NS/NP)*
Negative (S/NS/NP)*
U-shaped (S/NS/NP)*
No association (S/NS/NP)*
Breast- feeding
Ingram et al. 2003 (281) (FS, Qual)
- - - - - Religion and privacy
Ingram et al. 2008 (279) (FS, Qual)
- - - - - Culture, religion, family, family and peer support
Choudhry et al. 2012 (277) (FS, Qual)
- - - - - Culture, Privacy, perceived quality of breastmilk, religion and culture, family
Bowes and Domokos 1998 (276) (FS, Qual)
- - - Maternal age, place of birth, fluency in English or proximity of relatives (Qualitative evidence)
- SES, gestational age at delivery, privacy, returning to work, support from hospital staff, support at home, peer support, perception that extra food may increase maternal weight, and perceived quality of breastmilk
Twamley et al. 2011 (280) (FS, Qual)
- - - - - Convenience, family, privacy and perception of quality of breastmilk
-No evidence identified SR=Evidence included in systematic review, FS=Evidence identified through systematic search and not in the systematic review Qual=Qualitative study not BiB data, QualB=Qualitative study using BiB data, Quant=Quantitative study not using BiB data, QuantB=Quantitative study using BiB data MMB=mixed methods study using BiB data. *S=statistically significant association, NS=association not statistically significant, NP=Evidence of statistical significance not available
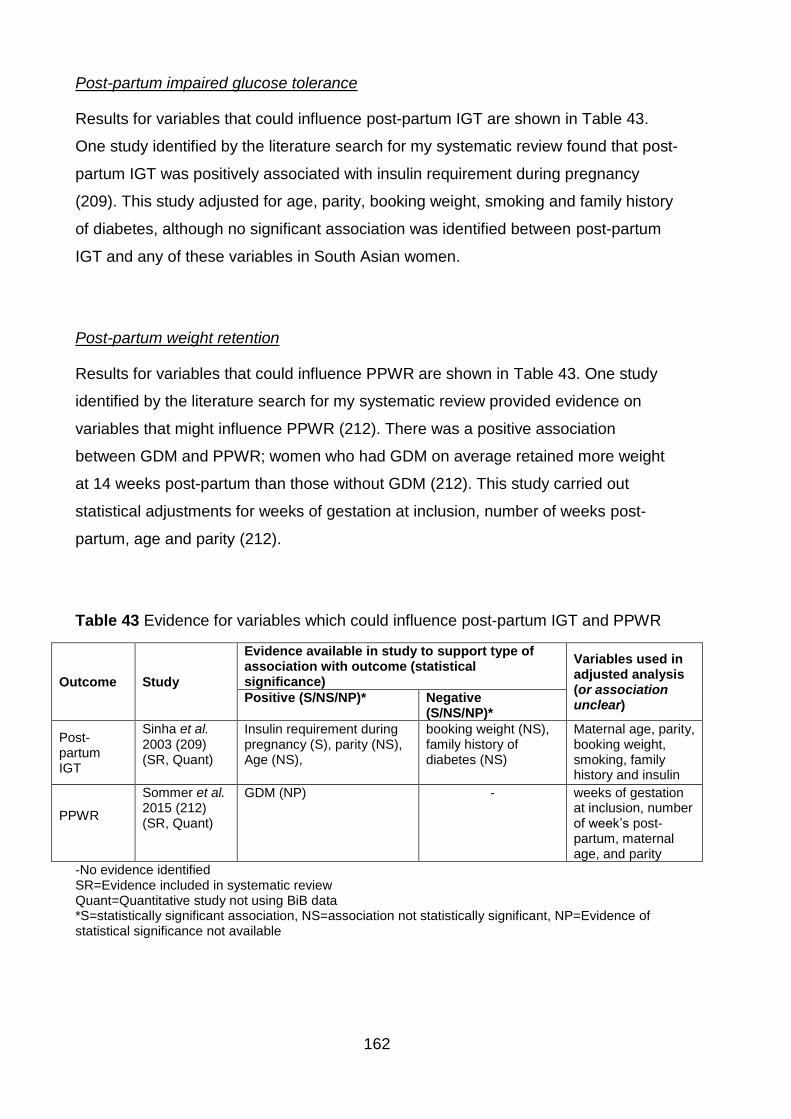
162
Post-partum impaired glucose tolerance
Results for variables that could influence post-partum IGT are shown in Table 43.
One study identified by the literature search for my systematic review found that post-
partum IGT was positively associated with insulin requirement during pregnancy
(209). This study adjusted for age, parity, booking weight, smoking and family history
of diabetes, although no significant association was identified between post-partum
IGT and any of these variables in South Asian women.
Post-partum weight retention
Results for variables that could influence PPWR are shown in Table 43. One study
identified by the literature search for my systematic review provided evidence on
variables that might influence PPWR (212). There was a positive association
between GDM and PPWR; women who had GDM on average retained more weight
at 14 weeks post-partum than those without GDM (212). This study carried out
statistical adjustments for weeks of gestation at inclusion, number of weeks post-
partum, age and parity (212).
Table 43 Evidence for variables which could influence post-partum IGT and PPWR
Outcome Study
Evidence available in study to support type of association with outcome (statistical significance)
Variables used in adjusted analysis (or association unclear)
Positive (S/NS/NP)* Negative (S/NS/NP)*
Post-partum IGT
Sinha et al. 2003 (209) (SR, Quant)
Insulin requirement during pregnancy (S), parity (NS), Age (NS),
booking weight (NS), family history of diabetes (NS)
Maternal age, parity, booking weight, smoking, family history and insulin
PPWR
Sommer et al. 2015 (212) (SR, Quant)
GDM (NP) - weeks of gestation at inclusion, number of week’s post-partum, maternal age, and parity
-No evidence identified SR=Evidence included in systematic review Quant=Quantitative study not using BiB data *S=statistically significant association, NS=association not statistically significant, NP=Evidence of statistical significance not available
163
Infant anthropometrics
Infant waist circumference
Results for variables that could influence Infant waist circumference are shown in
Table 44. Three studies identified by the updated search for this framework-based
synthesis were identified providing evidence of variables influencing infant waist
circumference; one using data from the BiB cohort (240) and two quantitative studies
not using data from the BiB cohort (254, 267). One found that there was a positive
association between maternal alcohol consumption since birth, mothers BMI at six
months post-partum and mothers self-reported smoking after pregnancy (240). This
study also reported a U-shaped association between infant waist circumference and
maternal mental health in pregnancy (Mothers GHQ subscale D score) (240). One
study found that maternal BMI was positively associated with infant obesity and also
adjusted for the following variables; age of the infant, survey year, mothers BMI,
fathers BMI mother's employment status, mother's social class, mothers highest
educational qualification, mothers immigration status, mothers current smoking
status, lone parent family indicator, and household income (254). One other study
adjusted for the following variables; mother’s highest academic qualification,
maternal SES and number of infants in household (267).
Infant skinfold thickness
Results for variables that could influence Infant SFT are shown in Table 44. One
study using data from the BiB cohort was identified that provided evidence of
variables that might influence infant SFT (168). This study found that both birth
weight and generation status (place of birth of babies parents) were positively
associated with infant skinfold thickness (168). This study adjusted for the following
variables; smoking; alcohol; maternal age; maternal hypertension; maternal fasting
glucose; maternal height; maternal BMI; parity; gestation; sex; socioeconomic
position (maternal education, housing tenure, receipt of means tested benefits); living
with partner and birth weight (168).
Infant BMI
Results for variables that could influence Infant BMI are shown in Table 44. Three
quantitative studies not using data from the BiB cohort (254, 263, 266), and one
164
qualitative study not using data from the BiB cohort (260) were identified that
provided evidence of variables that might influence infant BMI. The qualitative study
reported that diet and physical activity, parental BMI, cultural norms/traditions, SES
and genetics were associated with infant BMI (260). Higgins et al. found that
maternal BMI was positively associated with infant BMI in Pakistani infants (254).
Variables adjusted for in associations including infant BMI were; age of the infant
(254, 263, 266), survey year, mothers BMI, father’s BMI, mother's employment status
(254, 266), mother's social class, mother’s highest educational qualification (254,
266), mother’s immigration status (254, 266), mother’s current smoking status, lone
parent family indicator (254, 266), household income (254, 266), SES (263), infant
gender (266), language spoken at home (266), bedtime on weekdays (266), and how
many portions of fruit per day (266).
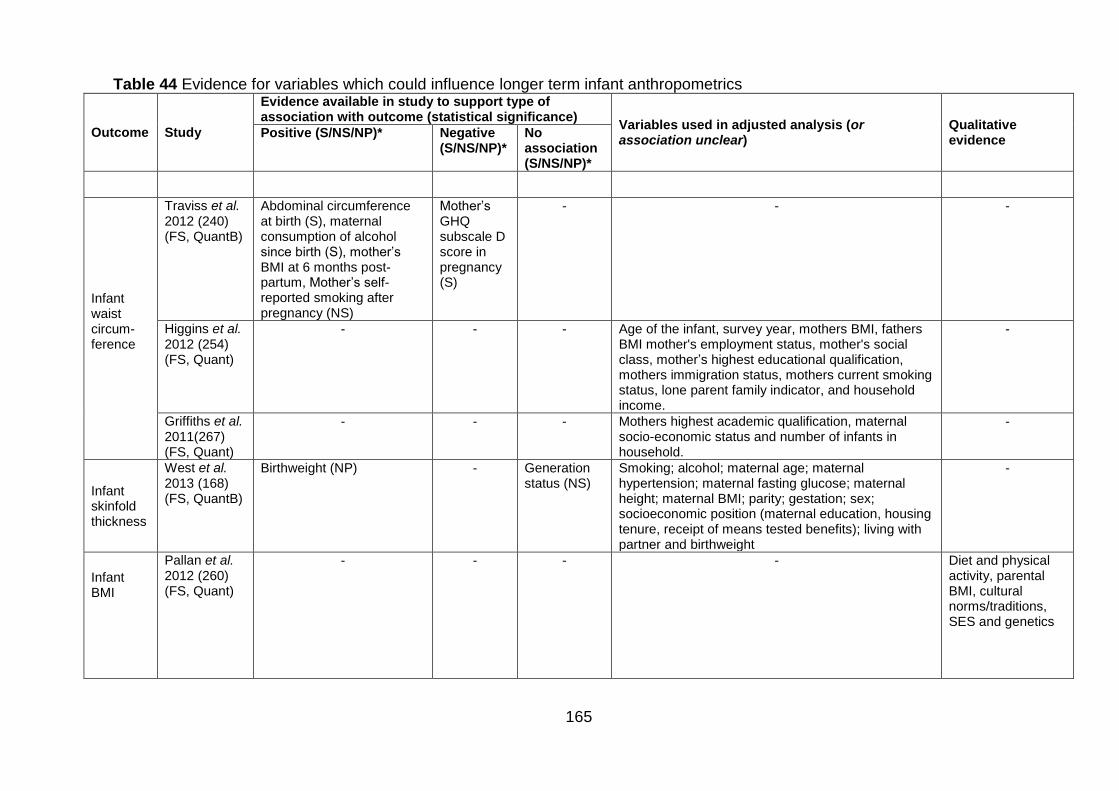
165
Table 44 Evidence for variables which could influence longer term infant anthropometrics
Outcome Study
Evidence available in study to support type of association with outcome (statistical significance)
Variables used in adjusted analysis (or association unclear)
Qualitative evidence
Positive (S/NS/NP)* Negative (S/NS/NP)*
No association (S/NS/NP)*
Infant waist circum-ference
Traviss et al. 2012 (240) (FS, QuantB)
Abdominal circumference at birth (S), maternal consumption of alcohol since birth (S), mother’s BMI at 6 months post-partum, Mother’s self-reported smoking after pregnancy (NS)
Mother’s GHQ subscale D score in pregnancy (S)
- - -
Higgins et al. 2012 (254) (FS, Quant)
- - - Age of the infant, survey year, mothers BMI, fathers BMI mother's employment status, mother's social class, mother’s highest educational qualification, mothers immigration status, mothers current smoking status, lone parent family indicator, and household income.
-
Griffiths et al. 2011(267) (FS, Quant)
- - - Mothers highest academic qualification, maternal socio-economic status and number of infants in household.
-
Infant skinfold thickness
West et al. 2013 (168) (FS, QuantB)
Birthweight (NP) - Generation status (NS)
Smoking; alcohol; maternal age; maternal hypertension; maternal fasting glucose; maternal height; maternal BMI; parity; gestation; sex; socioeconomic position (maternal education, housing tenure, receipt of means tested benefits); living with partner and birthweight
-
Infant BMI
Pallan et al. 2012 (260) (FS, Quant)
- - - - Diet and physical activity, parental BMI, cultural norms/traditions, SES and genetics
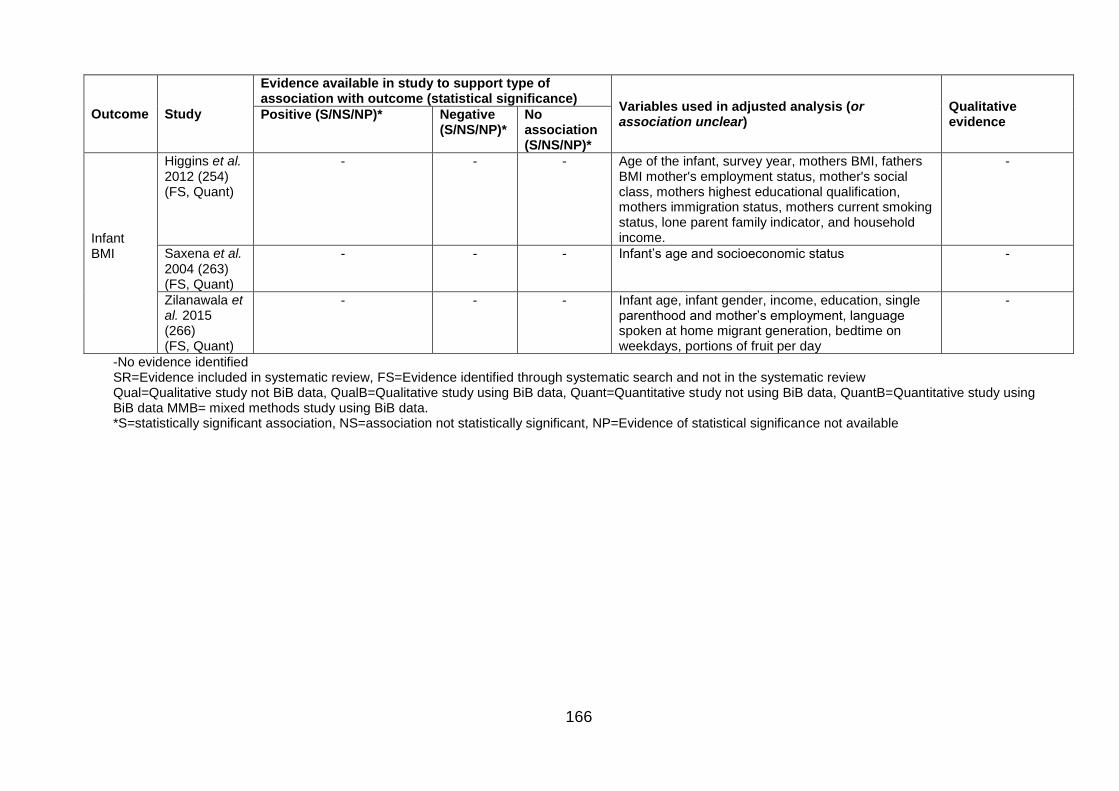
166
Outcome Study
Evidence available in study to support type of association with outcome (statistical significance)
Variables used in adjusted analysis (or association unclear)
Qualitative evidence
Positive (S/NS/NP)* Negative (S/NS/NP)*
No association (S/NS/NP)*
Infant BMI
Higgins et al. 2012 (254) (FS, Quant)
- - - Age of the infant, survey year, mothers BMI, fathers BMI mother's employment status, mother's social class, mothers highest educational qualification, mothers immigration status, mothers current smoking status, lone parent family indicator, and household income.
-
Saxena et al. 2004 (263) (FS, Quant)
- - - Infant’s age and socioeconomic status -
Zilanawala et al. 2015 (266) (FS, Quant)
- - - Infant age, infant gender, income, education, single parenthood and mother’s employment, language spoken at home migrant generation, bedtime on weekdays, portions of fruit per day
-
-No evidence identified SR=Evidence included in systematic review, FS=Evidence identified through systematic search and not in the systematic review Qual=Qualitative study not BiB data, QualB=Qualitative study using BiB data, Quant=Quantitative study not using BiB data, QuantB=Quantitative study using BiB data MMB= mixed methods study using BiB data. *S=statistically significant association, NS=association not statistically significant, NP=Evidence of statistical significance not available
167
Ethnic differences in mediating and confounding variables
This section will give a brief overview of findings relating to ethnic differences in
mediating and confounding variables, and how different mediating and confounding
variables interact.
Studies suggested that South Asian15 women were, on average shorter than White
women (203, 208, 211, 212, 235, 241, 242, 274), although maternal height may be
influenced by generation status (whether or not mother and father, and their
grandparents had been born in the UK) (241). Evidence was unclear regarding ethnic
differences in maternal age: some studies suggested South Asian women were older
compared with White (168, 171, 232, 233, 235, 237, 239, 241, 243, 244, 249, 265,
283); while others suggested they were younger (201, 211, 212, 215, 216, 246, 250,
257, 258, 270, 272, 276), or that there was no difference in age (161, 203, 207, 214).
Evidence suggested that maternal age in South Asian or Pakistani women could also
be affected by generation status (241, 273). Evidence also found that South Asian
women were more likely to be married and/or cohabiting compared with White
women (201, 237, 240-243, 246, 258, 270), and that marital/cohabiting status may be
affected by generation status (246). Studies showed that generally, South Asian
women had a higher parity than White women (201, 203, 207, 209, 211, 212, 215,
216, 249, 250, 257, 262, 265, 268, 272, 276, 282, 283), and it was suggested that
parity is also affected by generation status (241, 246).
Ethnic differences in SES were found to be dependent on the measure used. This
review identified ten different measures of SES: maternal employment, maternal
education, receipt of means tested benefits, housing tenure, measure of
neighbourhood deprivation, financial wellbeing, paternal employment, paternal
education, income quintile, and job type. Maternal employment was found to be lower
in South Asian women compared with White British women (168, 239, 241, 243, 250,
258, 266, 268, 276), and maternal employment was shown to be affected by
generation status (168, 241, 258). There were a higher percentage of Pakistani
women in receipt of means tested benefits (241, 268, 283), although one study found
that following adjustment for maternal age and parity, the association was no longer
significant (241). Receipt of means tested benefits was also found to be affected by
generation status (241). Generally, housing tenure was found to be higher in South
15 Here South Asian women refers to Pakistani or South Asian women identified by the 92 studies included in framework-based synthesis familiarisation stage.
168
Asian women compared with White women (239, 241). Housing tenure was found to
be affected by generation status (241). Measure of area of residence deprivation was
also found to differ between South Asian and White women; South Asian women
were found to reside in more deprived areas compared with White women (200, 201,
205, 230, 232, 240, 265). Pakistani women were found to be less likely to be
struggling financially compared with White British women (243, 283). Both father’s
employment and education also appeared to differ between South Asian and White
women; there was a higher percentage of Pakistani fathers in manual/routine
employment or self-employed compared with White British fathers, who were more
likely to be in non-manual or professional jobs (283). South Asian father’s education
also appeared to be lower compared with White father’s education (250, 272). South
Asian families were also more likely to be living in lower income quintiles compared
with White families (250, 257, 266, 268, 272).
Smoking was found to be less common in Pakistani women compared with White
women (200-202, 206, 209, 213, 216, 233, 235, 237, 239, 241, 242, 244, 283) (248,
257, 258, 262, 264, 268, 282, 283). However, smoking was affected by generation
status (242) and SES (283). Alcohol consumption was also found to be lower in
South Asian women (168, 200, 241, 244, 257, 262, 263).
Overall, more studies suggested that South Asian women had a higher prevalence of
a family history of diabetes compared with White women (209, 210, 212, 213, 216).
Studies also suggested that South Asian women had a higher prevalence of type 2
diabetes compared with White women (201, 210). South Asian women were found to
have lower blood pressure compared with White women (205). South Asian women
were also found to have higher levels of anaemia compared with White women (246),
although these levels differed with generation status (246). Consanguinity was found
to be higher in South Asian populations compared with White (200, 245, 246, 269,
271) and consanguinity was found to be affected by religion (which was shown to be
more likely to be Muslim for Pakistani women)(269), maternal education (271) and
generation status (246). South Asian women were also less likely to be only English
speaking, and more likely to speak English and another language or another
language only (268), they were also reported to be likely to be of Muslim religion
(249). Pakistani families were also more likely to have a higher number of people
living in their household compared with White British families (263, 265, 266).
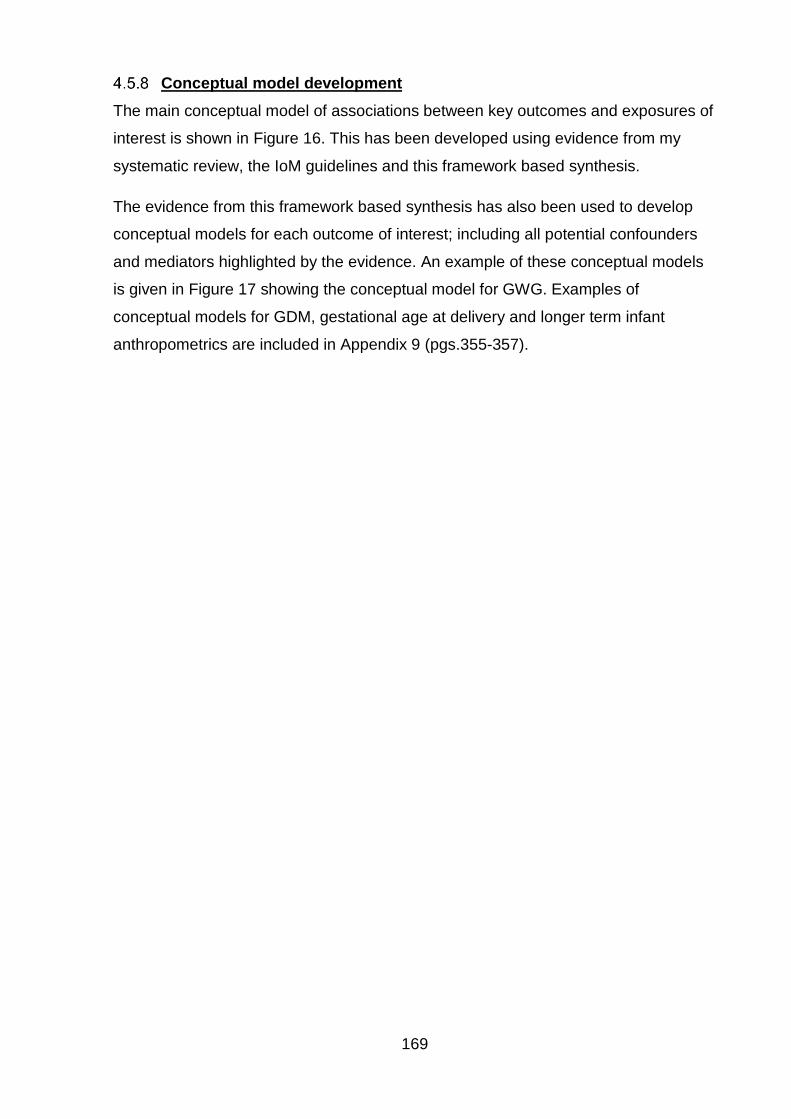
169
Conceptual model development
The main conceptual model of associations between key outcomes and exposures of
interest is shown in Figure 16. This has been developed using evidence from my
systematic review, the IoM guidelines and this framework based synthesis.
The evidence from this framework based synthesis has also been used to develop
conceptual models for each outcome of interest; including all potential confounders
and mediators highlighted by the evidence. An example of these conceptual models
is given in Figure 17 showing the conceptual model for GWG. Examples of
conceptual models for GDM, gestational age at delivery and longer term infant
anthropometrics are included in Appendix 9 (pgs.355-357).
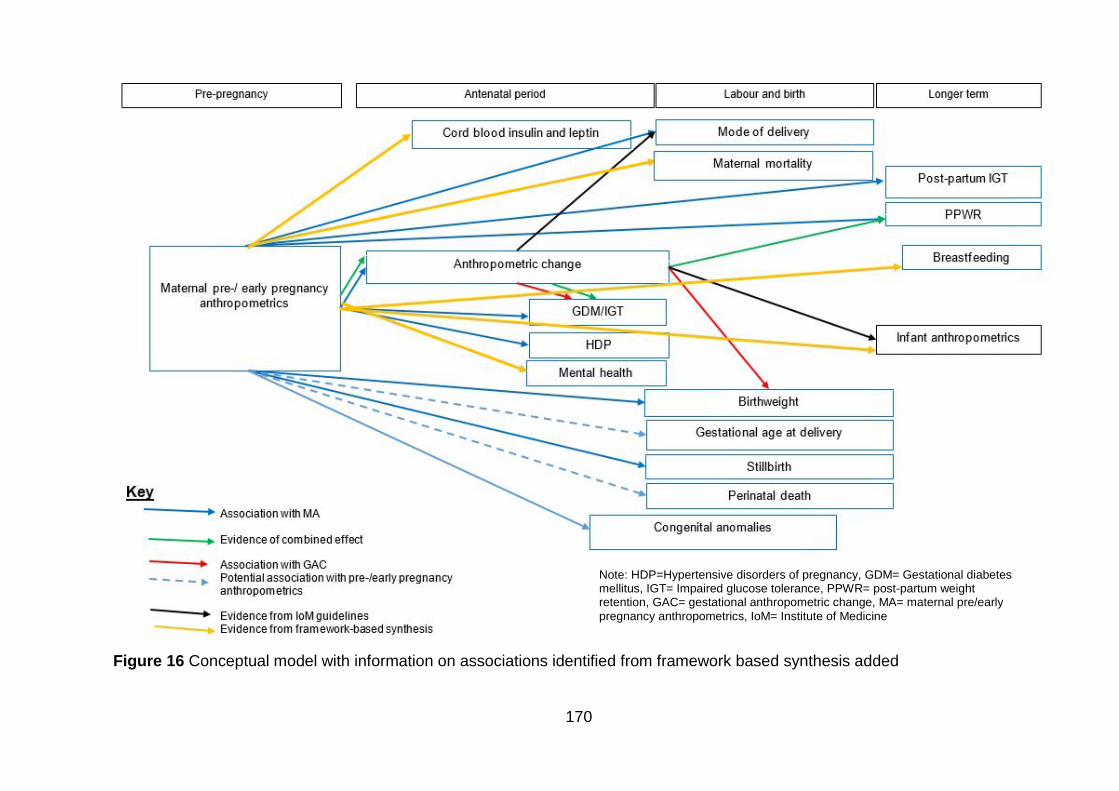
170
Figure 16 Conceptual model with information on associations identified from framework based synthesis added
Note: HDP=Hypertensive disorders of pregnancy, GDM= Gestational diabetes mellitus, IGT= Impaired glucose tolerance, PPWR= post-partum weight retention, GAC= gestational anthropometric change, MA= maternal pre/early
pregnancy anthropometrics, IoM= Institute of Medicine
171
Figure 17 Conceptual model for GWG as an outcome. Note: SES is represented as a composite variable representing variables such as IMD, employment, education, housing tenure etc. SES= socioeconomic status; BMI= Body mass index and GDM= Gestational diabetes mellitus
172
Discussion of the strengths and limitations of the framework-based
synthesis
This literature review and framework-based synthesis has integrated qualitative and
quantitative literature to identify variables (i.e. confounders and mediators) that may
influence the associations between maternal pre-/early pregnancy anthropometrics,
gestational anthropometric change and pregnancy outcomes in Pakistani women.
Results highlight that these associations are extremely complex and involve multiple
different variables. In terms of conceptual model development for this cohort, the
framework-based synthesis has provided me with the evidence to develop an evidence-
based conceptual model, including additional pregnancy outcomes (identified where MA
or GAC was included in a statistical adjustment in an association between ethnicity and
pregnancy outcome of interest), confounding and mediating variables.
This systematic review was rigorous, and followed suggested guidelines for reporting
mixed methods systematic reviews developed using a systematic review of mixed
methods systematic reviews (224). The search strategy for this literature review and
framework-based synthesis was extremely comprehensive. I worked with an information
scientist to develop the search strategy. I then then used this search strategy to conduct
a thorough search of 10 databases for any qualitative, quantitative, or mixed-methods
studies. I also re-screened the studies identified by the search strategy for the systematic
review (Chapter 3) to ensure that no relevant quantitative studies were overlooked.
Supplementary searches involved searching the reference lists of all studies included
and reviews that were related to the topic area, and citation searching, and had it been
required, authors would have been contacted for additional information, however this
was not necessary here. As with the previous systematic review in Chapter 3, despite
how rigorous the review process was, grey literature was not included in the searches,
this can lead to publication bias (221).
There are also limitations of this literature review and framework-based synthesis. One
critique of using a framework-based approach is that it can result in forcing data into
categories by applying a deductive approach to qualitative synthesis (285). However, I
used data driven themes, within an a priori framework which was based on evidence
from both my systematic review, and the 2009 IoM guidelines (94). This approach
allowed the evidence-base to shape the final framework thus minimising the deductive
173
nature of the evidence-synthesis (285). This method also enabled the results of the
synthesis to be expressed as a tables, these tables were then used to map the
associations for each outcome in the form of conceptual models. Due to the large
volume of studies identified, and the diversity in methodologies used in the included
literature, an a priori decision was made not to quality assess the evidence included in
this framework-based synthesis. While evidence would not have been included/excluded
from the synthesis based on quality score, not doing a quality assessment means that I
am unable to comment on the quality of the evidence included. As in Chapter 3, it may
have been beneficial to take into account study quality when deciding whether or not to
include an association in the conceptual model. It is possible that poor quality studies
may be biased (i.e. may not truly reflect what is happening in the population under
study) for example may not adjust for relevant confounders, or may only interview a
specific group rather than a sample relevant of the whole population. This means that
associations from biased studies may have been included in my conceptual model.
However, as this step was exploratory (i.e. to develop a conceptual (hypothetical) model
that I would then go on to test using data from the BiB Cohort), associations were
included independent of the amount and quality of evidence. In addition, if I had quality
assessed the evidence from this framework based synthesis, I would have had to use
quality assessment tools relevant for each of the included study designs. The quality
scores from different tools, although would give an overall idea of study quality, would
not have been comparable between studies. The main issue with including poor quality
evidence in terms of model development (which also applies to model development in
Chapter 3) is that it may not identify an association that does actually exist for example
due to a type II error (or beta error- when the results of a study suggest that there is no
association between outcome and exposure, when in fact there is one (220)). (The
Validation study in Chapter 5 aims to overcome this limitation).
The use of a framework-based synthesis provided me with a pragmatic way to integrate
qualitative and quantitative evidence in a way that was useful to the research question.
In this review, the integration of qualitative and quantitative evidence was essential as it
allowed me to consider different types of associations. Quantitative literature identified
statistical associations from populations of Pakistani women, and variables the
174
researcher or research teams thought to be confounders, and so associated with
variables of interest to this review. Qualitative literature provided me with evidence of
variables of interest though opinions of individual Pakistani women. One problem in
research investigating particular ethnic groups, or comparing outcomes in one ethnic
group in another, is ethnocentricity (286). Ethnocentricity is:
“the inherent tendency to view one’s own culture as the standard against which others
are judged” (286).
This is a complex issue, and one that is not easily overcome. However, by including
qualitative research in this review I have been able to include some evidence of the
experiences, thoughts and opinions of Pakistani women in conceptual model
development, a limitation of the methods here is that I was unable to include studies in
languages other than English. Another limitation here is that while the results of this
framework based synthesis directly informed conceptual model development which was
the aim of this review for this PhD project, the way the qualitative data was analysed was
very reductive. Due to the issue of ethnocentricity, and to account for the complexity of
the qualitative data it would have been interesting to also carry out a more depth
synthesis of the qualitative data alone (for example a thematic analysis). Another way of
reducing the influence of ethnocentricity on this research is to get input from experts who
are familiar with the Pakistani population; members of the BiB research team. This has
been carried out and is described in Chapter 5.
In conclusion, this review and framework-based synthesis has highlighted that the
associations between MA, GAC and pregnancy outcomes in Pakistani women are
complex, influenced by many confounders and mediators. Variables identified by this
review have be used to further development of my conceptual model which will be used
inform analysis of data from the BiB cohort (Chapter 6: Methods for analysis of data from
the Born in Bradford cohort, and Chapter 7: Results from analysis of data from the Born
in Bradford cohort).
175
Chapter 5. Validation study and discussion of conceptual
model development (Phase 3)
This chapter will describe the process of, and the results from, asking members of the
BiB research team to provide their expert opinion on the conceptual model developed
using findings from the systematic review in Chapter 3, and the mixed methods
systematic review and framework-based synthesis in Chapter 4. This chapter will
provide a discussion of the strengths and limitations of this expert opinion phase, and
also of using a three stage approach (systematic review, framework based synthesis,
and expert opinion) to develop a conceptual model to inform analysis of data from the
BiB project.
5.1 Validation study
The systematic review and framework-based synthesis stages have enabled me to
develop a list of variables from the existing evidence-base to inform the conceptual
model development. However, it is possible that due to the limited evidence-base
relating to MA, GAC and pregnancy outcomes in Pakistani women, and the potential for
type II errors leading to associations not being identified (as discussed in Chapter 4;
pg.173) the evidence-base may not have highlighted all variables or associations that
are relevant to this project. Further, the variables identified from international literature
may not be completely relevant or comprehensive relating to the Pakistani women in the
BiB cohort. Therefore, to explore the relevance of the findings of the systematic review
and framework-based synthesis to the study population that will be used for the next
stage of my PhD, I asked members of the BiB research team to provide their expert
opinion on my findings to date.
5.2 Aim
To validate conceptual model so far and identify any relevant variables (outcomes,
mediators or confounders not highlighted by phase 1 (Chapter 3) or phase 2 (Chapter 4).
176
5.3 Objectives
To present the conceptual model developed from phases 1 and 2 to experts at
BiB.
To invite the experts at BiB to comment on the conceptual model and identify
whether they agreed with the pregnancy outcomes that had been identified
through phases 1 and 2.
To invite the experts at BiB to comment on the conceptual model and identify
whether they agreed with the confounding and mediating variables that had been
identified through phases 1 and 2.
To invite the experts at BiB to comment on the conceptual model and highlight
any pregnancy outcomes that might be potentially relevant and should be
included in model, but had not been highlighted by phases 1 and 2 of model
development.
To invite the experts at BiB to comment on the conceptual model and highlight
any confounding or mediating variables that might be potentially relevant, but had
not been highlighted by phases 1 and 2 of model development.
5.4 Methods
An email invitation was sent to members of the BiB research team who had knowledge
of the cohort dataset (e.g. data managers, statisticians, those working with the dataset)
and those with relevant clinical knowledge relating to pregnancy in Pakistani women in
Bradford (e.g. midwives, obstetricians, gynaecologists). Potential participants were
identified using the BiB website, and additional potential participants were suggested by
my lead contact in the BiB team. The invitation asked if they would be able to give up an
hour of their time to attend a group meeting at the BiB office in Bradford to provide
feedback on the conceptual model development for this project; i.e. the findings from the
systematic review and framework-based synthesis. The agenda for the meeting is in
Appendix 10 (pgs.358-359).
The 1-hour meeting comprised of three stages:
177
1. I delivered a brief 10-minute presentation of the PhD project and the findings from
Phase 1 (systematic review) and Phase 2 (framework-based synthesis)
highlighting the process, key findings and development of the conceptual model
to date.
2. I facilitated a discussion on the conceptual model to get feedback on the
associations identified in the evidence-base between MA, GAC and pregnancy
outcomes. Examples of questions to prompt discussion for this stage were:
“Would you expect to see any interactions between outcomes identified?” and
“Are there any other pregnancy outcomes that you would also consider?”.
3. I facilitated a discussion on the conceptual model to get feedback on the factors
identified that might influence the associations between MA, GAC and the
pregnancy outcomes. Examples of questions to prompt discussion for this stage
were: “In your opinion, are the identified factors influencing relevant?” “Would you
add any and why?” and “Would you remove any and Why?” The information that
was given out at the meeting relating to this discussion is in Appendix 11
(pgs.360-364).
5.5 Results
Of the seven members of the BiB research team invited, five were able to attend the
meeting and provide feedback; these were a Research Midwife and Research Fellow
working at BiB, two statisticians at BiB, an obstetrics and genecology clinician, and
public health and clinical institute directors.
The participants of the meeting felt that the conceptual model of hypothesised
associations between MA, GAC and pregnancy outcomes in Pakistani women was
theoretically accurate. However, some further suggestions were made. These were that
of all the outcomes identified, PPWR was of most interest to the BiB research team as it
has not been explored before using the BiB data. It was also felt that it would be
interesting to explore maternal and infanthood blood pressure as long-term pregnancy
178
outcomes in relation to MA and GAC. Finally a suggestion was made that, whether or
not a mother had GDM might influence GWG as having GDM would mean antenatal
intervention with dietary advice.
The participants discussed the confounding and mediating variables I had proposed
from the evidence-base reviews. They felt that these data sources had identified
relevant confounding and mediating variables that could potentially influence the
associations between MA, GAC and pregnancy outcomes. Discussions did not identify
any additional confounders or mediators to add to the conceptual model.
The final conceptual model of exposures and outcomes identified by my systematic
review, framework-based synthesis and this expert opinion is shown in Figure 18.
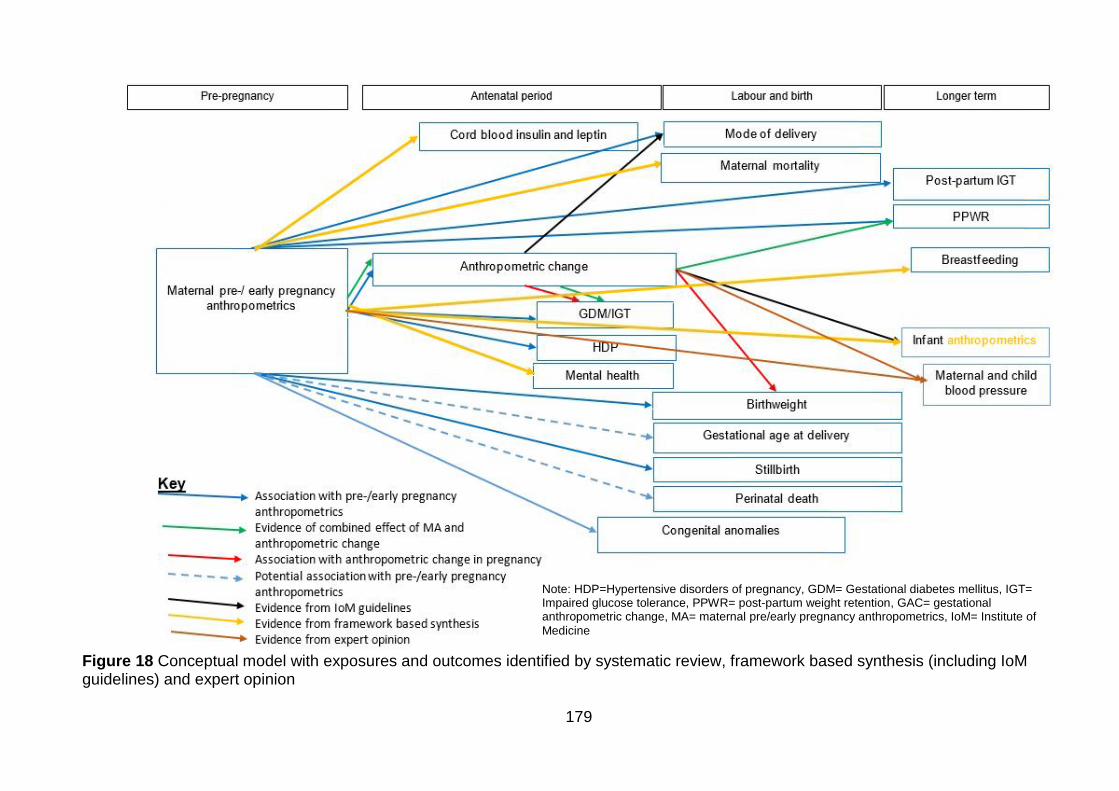
179
Note: HDP=Hypertensive disorders of pregnancy, GDM= Gestational diabetes mellitus, IGT= Impaired glucose tolerance, PPWR= post-partum weight retention, GAC= gestational anthropometric change, MA= maternal pre/early pregnancy anthropometrics, IoM= Institute of
Medicine
Figure 18 Conceptual model with exposures and outcomes identified by systematic review, framework based synthesis (including IoM guidelines) and expert opinion
180
5.6 Discussion of the strengths and limitations of the expert opinion phase
This phase of my PhD research was designed as a confirmatory step in conceptual
model development. It aimed to identify any associations or variables that may not
have been identified by my systematic review or framework-based synthesis due to
gaps in the published literature. The strength of this approach is that it added an
extra step of rigor to the model development, including the opinions from a range of
experts who were familiar with the topic area and the BiB population, and also the
data from the BiB cohort. One of the limitations was there could have been more
people on the panel; some of those invited were unable to attend. It would also have
been beneficial to include members of the BiB cohort on the panel. This would have
added an extra layer to model development through patient and public involvement
(PPI). However, the additional approvals required from BiB were not possible within
the timeframe of this PhD project. It might also have been beneficial to record this
discussion, as you might do with a focus group for qualitative research. However,
detailed meeting notes were taken of all key thoughts and suggestions made by the
experts on the panel and these were used to inform model development.
5.7 Discussion of conceptual model development
The final evidence-based conceptual model of associations between pregnancy
outcomes and exposures; MA and GAC is shown in Figure 18, pg.179. Evidence
from the systematic review identified associations between the following pregnancy
outcomes: GDM, HDP, GAC, mode of delivery, birth weight, stillbirth, congenital
anomalies, PPWR and post-partum IGT and MA. There were also potential
associations between gestational age at delivery, perinatal mortality and MA
(potential associations were those where the effect size was increased, but statistical
significance was not detected (e.g. p>0.050 or the 95%CI included 1.00) and Asian
specific BMI criteria were not applied). The systematic review also identified that
GDM and birth weight were associated with GAC. There was also evidence of a
combined effect of MA and GAC on GDM and PPWR. Additional associations with
GAC identified from evidence in the 2009 IoM GWG guidelines were mode of
delivery and infant weight. The framework-based synthesis identified further potential
associations between MA and maternal death, breastfeeding and infant
181
anthropometrics (rather than just infant weight which was identified by the IoM
guidelines).
A strength of this conceptual model development process is that it involved a
rigorous three stage, evidence-based approach: 1) systematic review, 2) framework-
based synthesis and 3) expert opinion. The systematic review was the most rigorous
methodology, but due to the availability of evidence, it was not possible to restrict to
Pakistani women only. This was addressed by the framework-based synthesis, which
used an equally rigorous search strategy to identify the evidence-base to thoroughly
explore all potential confounders and mediators for associations. However, due to the
variation in methodologies used and lack of relevant quality assessment tools for
these methodologies, I was unable to quality assess the evidence included in the
framework-based synthesis. The expert opinion further explored gaps in the
evidence-base and relevance of the published evidence to the Pakistani population in
Bradford, which also added rigor to the conceptual model development process.
An additional benefit of the model development process was that I incorporated both
quantitative and qualitative literature. This highlighted the complexity of the area of
research, and the importance of utilising qualitative and mixed-methods research,
particularly to identify more culturally specific mediators and confounders (e.g.
religious beliefs, culture, peer support, place of birth, previous experiences and
emotional reasons). Using a rigorous mixed methods approach to conceptual model
development also means that I have identified variables (including exposures,
outcomes, confounders and mediators) that are not available for analysis in the data
from the BiB cohort. Some variables are not easily quantifiable and therefore not part
of routine maternity data collection or the prospective cohort data collection. Others
are absent from the cohort, including GAC (while an indicator of GWG is available
(weight gain to the third trimester) and has been analysed in this PhD project, other
measures of anthropometric change in pregnancy are not), maternal death, perinatal
death, and childhood blood pressure. The absence of these variables of interest in
the dataset is a limitation to be expected of all research using existing datasets for
secondary analysis as the researcher has to work with the data available to them
rather than being able to go out and collect their own data, tailored to the research
question. Rather than limiting my conceptual model development to only include
exposures and outcomes available in the data from the BiB project, I have taken a
more exploratory approach, and included outcomes relevant to the research area

182
that will not only be able to guide my analysis of data from the BiB cohort, but also be
able to inform future research.
183
Chapter 6. Methods for analysis of data from the Born in
Bradford cohort
This chapter describes the methods used to test the conceptual model developed in
Chapters 3-5 using the data from the BiB cohort. Firstly, I discuss the evidence-
based conceptual model of all key exposures and outcomes. I then describe the final
model used for SEM using GWG as an outcome. The section will then go on to
describe the data analysis methods used to test the associations identified by
conceptual model development. It will also then define all variables used including
exposures, outcomes and confounding and mediating variables.
Not all variables identified when developing the conceptual model are available in the
data from the BiB cohort. However, knowledge of these variables gained through
developing an evidence-based conceptual model will inform the critical discussion of
results of this analysis, including limitations and recommendations for future
research.
Figure 19 shows the conceptual model highlighting exposures and outcomes that are
available in the data from the BiB cohort for inclusion in the analysis. Due to the
limited evidence for GWG as an exposure, all possible paths (associations) between
pregnancy outcomes and MA and GWG in the model have been investigated. In
Figure 19, variables that are crossed out indicate those which are not available for
analysis in the BiB cohort. It has also been used where I was only able to partially
investigate certain variables. I was only able to partially investigate the variables MA
and GAC. Although the data from the BiB cohort contains information on different
measures of MA (MUAC and tricep SFT at baseline (26-28 weeks) questionnaire), an
a priori decision was made that only BMI would be investigated to ensure the project
was completed within the specified timeframe. For GAC, while there was information
on GWG, the data from the BiB cohort did not contain variables to enable me to
investigate GAC in full (i.e. there was no information recorded on change in SFT and
limb circumference measures).
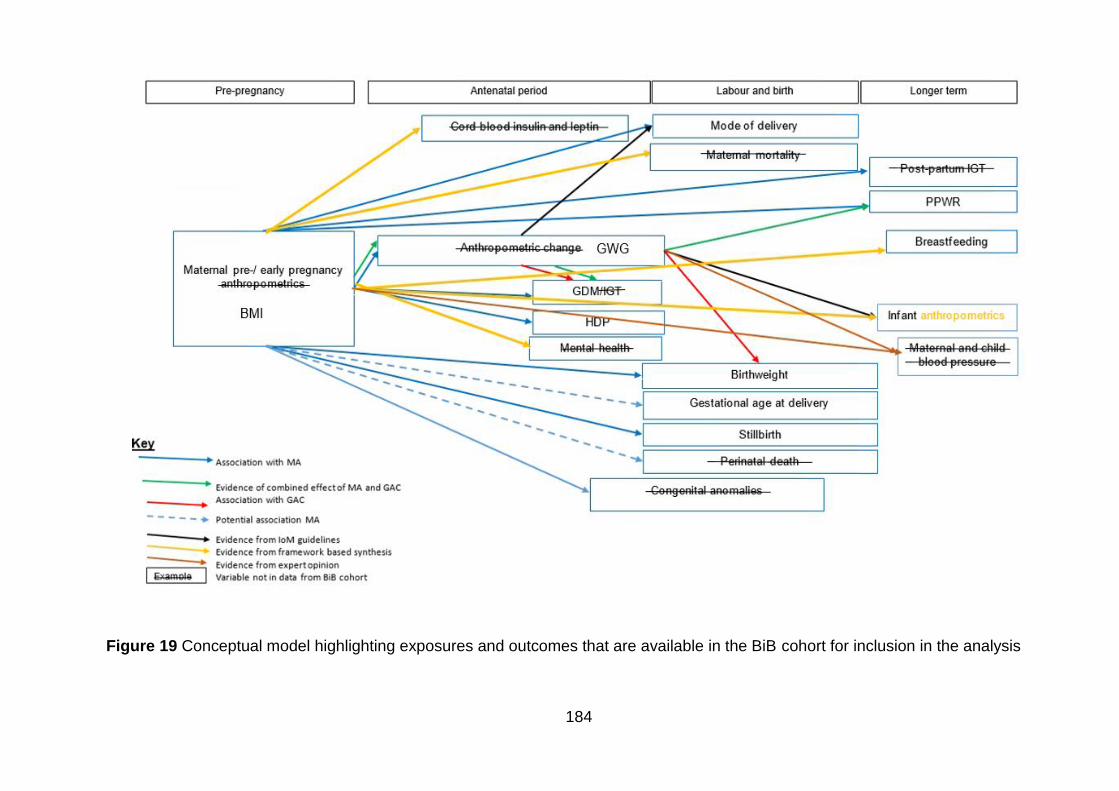
184
Figure 19 Conceptual model highlighting exposures and outcomes that are available in the BiB cohort for inclusion in the analysis
185
While conceptual models were developed from the evidence-base for all outcomes of
interest shown Figure 19 (conceptual model examples shown in Appendix 9 pgs.355-
357, and conceptual model for GWG shown in Chapter 4, Section 4.5.8, Figure 17,
pg.171), the complexity of these models meant that SEM was not possible for all
outcomes within the timeframe of this PhD research. These outcomes were instead
investigated using regression analysis, and SEM was carried out for GWG as an
outcome. GWG was chosen as the key outcome of interest due to the lack of
evidence available for the association between GWG and MA in South Asian women
(186). This chapter will describe the data analysis methods used to test all
associations between MA and GAC and outcomes of interest identified through the
evidence base, including the conceptual model for GWG.
6.1 Conceptual model for gestational weight gain to be tested using
Born in Bradford data
In this section, the hypothesised conceptual model for GWG is described, including
all individual SES variables separately (i.e. education, employment and IMD). The
diagram for this model, with variables relating to SES condensed into one variable for
simplicity, is shown in Figure 17 (Chapter 4, Section 4.5.8, pg.171). This model was
developed based on evidence reported in Chapters 3-516 and is summarized in Table
45; in each column, the variables in row B are hypothesised to affect those in row A.
When creating conceptual models, all possible paths between variables must be
included (i.e. if one variable precedes another, it is hypothesised that the one that
occurs second is affected by the one that occurs first, and a path between the two
must be specified), even where there may not be an association. Paths should only
be removed when there is evidence to do so from testing the conceptual model with
real data. In Table 45, references have been provided where there is evidence of an
association between variable in row B and variable in row A. Where there is no
reference provided, this path has been drawn because there is evidence that the
variable in row B is associated with another row A variable in the model, and it
precedes the variable in row A. Only variables that were available to me in the data
from the BiB cohort have been included in the model in Table 45.
16 Please note that no changes to the conceptual model for GWG were made in Stage 3 (Chapter 5)
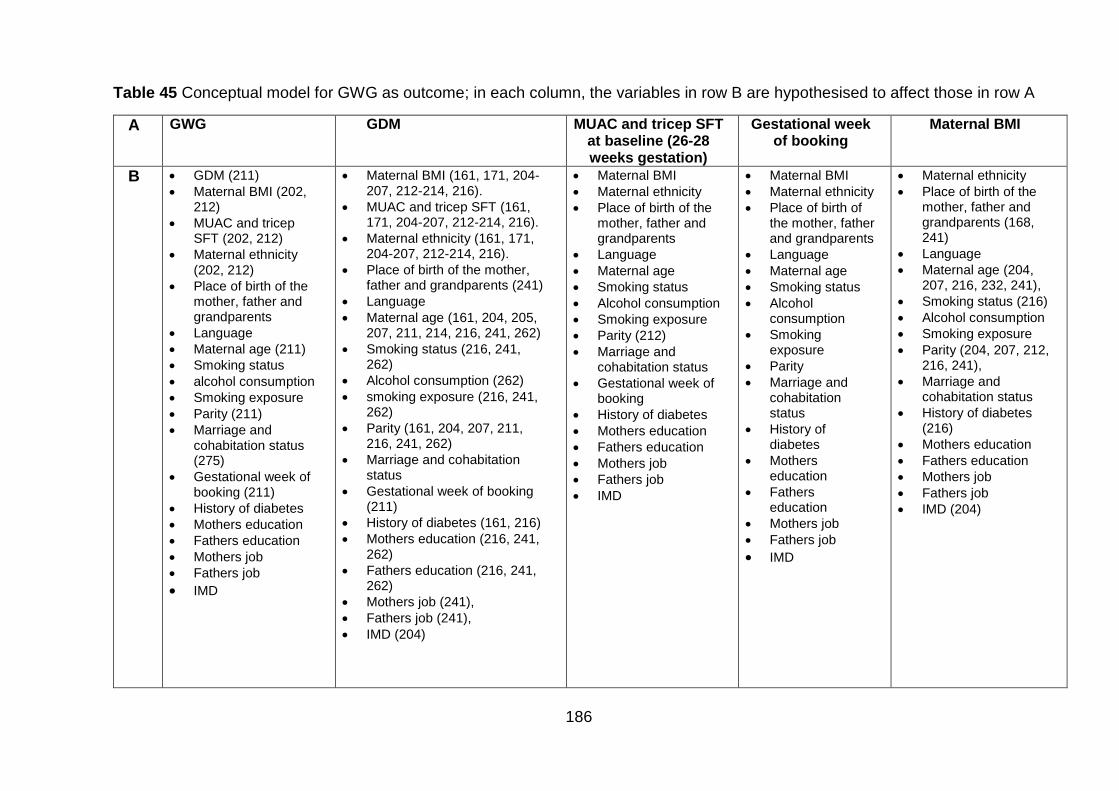
186
Table 45 Conceptual model for GWG as outcome; in each column, the variables in row B are hypothesised to affect those in row A
A GWG GDM MUAC and tricep SFT at baseline (26-28 weeks gestation)
Gestational week of booking
Maternal BMI
B GDM (211)
Maternal BMI (202, 212)
MUAC and tricep SFT (202, 212)
Maternal ethnicity (202, 212)
Place of birth of the mother, father and grandparents
Language
Maternal age (211)
Smoking status
alcohol consumption
Smoking exposure
Parity (211)
Marriage and cohabitation status (275)
Gestational week of booking (211)
History of diabetes
Mothers education
Fathers education
Mothers job
Fathers job
IMD
Maternal BMI (161, 171, 204-207, 212-214, 216).
MUAC and tricep SFT (161, 171, 204-207, 212-214, 216).
Maternal ethnicity (161, 171, 204-207, 212-214, 216).
Place of birth of the mother, father and grandparents (241)
Language
Maternal age (161, 204, 205, 207, 211, 214, 216, 241, 262)
Smoking status (216, 241, 262)
Alcohol consumption (262)
smoking exposure (216, 241, 262)
Parity (161, 204, 207, 211, 216, 241, 262)
Marriage and cohabitation status
Gestational week of booking (211)
History of diabetes (161, 216)
Mothers education (216, 241, 262)
Fathers education (216, 241, 262)
Mothers job (241),
Fathers job (241),
IMD (204)
Maternal BMI
Maternal ethnicity
Place of birth of the mother, father and grandparents
Language
Maternal age
Smoking status
Alcohol consumption
Smoking exposure
Parity (212)
Marriage and cohabitation status
Gestational week of booking
History of diabetes
Mothers education
Fathers education
Mothers job
Fathers job
IMD
Maternal BMI
Maternal ethnicity
Place of birth of the mother, father and grandparents
Language
Maternal age
Smoking status
Alcohol consumption
Smoking exposure
Parity
Marriage and cohabitation status
History of diabetes
Mothers education
Fathers education
Mothers job
Fathers job
IMD
Maternal ethnicity
Place of birth of the mother, father and grandparents (168, 241)
Language
Maternal age (204, 207, 216, 232, 241),
Smoking status (216)
Alcohol consumption
Smoking exposure
Parity (204, 207, 212, 216, 241),
Marriage and cohabitation status
History of diabetes (216)
Mothers education
Fathers education
Mothers job
Fathers job
IMD (204)
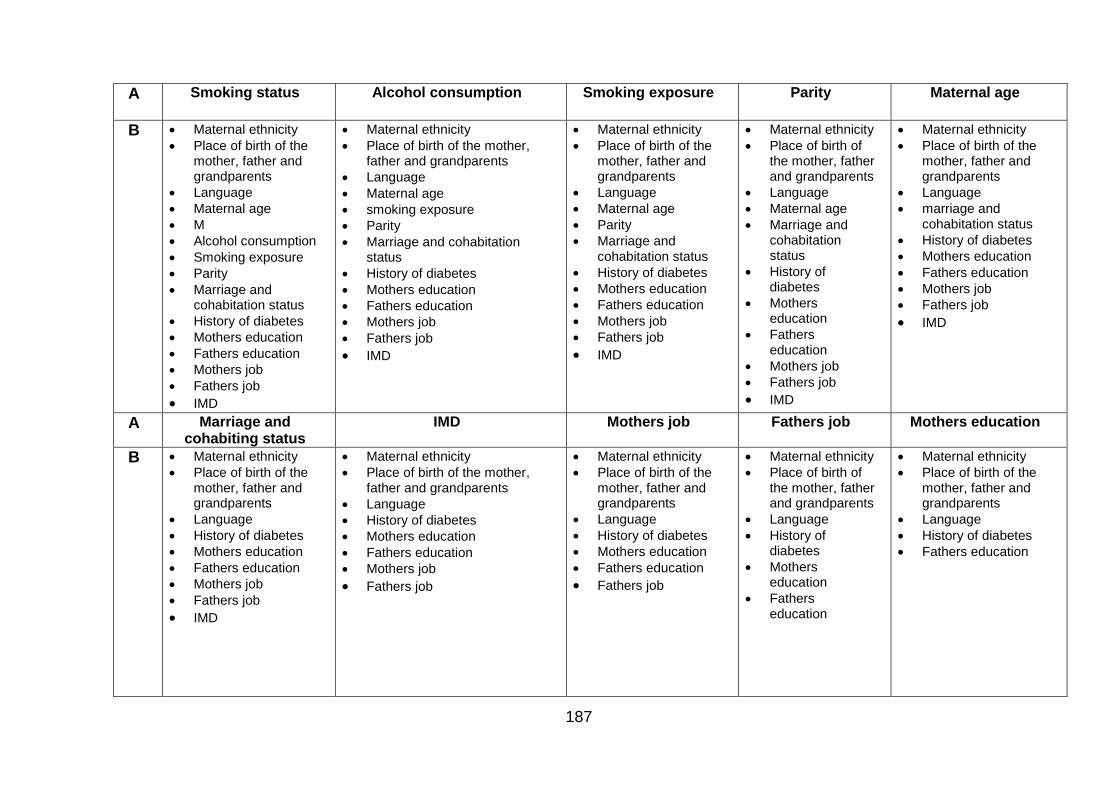
187
A Smoking status
Alcohol consumption
Smoking exposure
Parity
Maternal age
B Maternal ethnicity
Place of birth of the mother, father and grandparents
Language
Maternal age
M
Alcohol consumption
Smoking exposure
Parity
Marriage and cohabitation status
History of diabetes
Mothers education
Fathers education
Mothers job
Fathers job
IMD
Maternal ethnicity
Place of birth of the mother, father and grandparents
Language
Maternal age
smoking exposure
Parity
Marriage and cohabitation status
History of diabetes
Mothers education
Fathers education
Mothers job
Fathers job
IMD
Maternal ethnicity
Place of birth of the mother, father and grandparents
Language
Maternal age
Parity
Marriage and cohabitation status
History of diabetes
Mothers education
Fathers education
Mothers job
Fathers job
IMD
Maternal ethnicity
Place of birth of the mother, father and grandparents
Language
Maternal age
Marriage and cohabitation status
History of diabetes
Mothers education
Fathers education
Mothers job
Fathers job
IMD
Maternal ethnicity
Place of birth of the mother, father and grandparents
Language
marriage and cohabitation status
History of diabetes
Mothers education
Fathers education
Mothers job
Fathers job
IMD
A Marriage and cohabiting status
IMD Mothers job
Fathers job Mothers education
B Maternal ethnicity
Place of birth of the mother, father and grandparents
Language
History of diabetes
Mothers education
Fathers education
Mothers job
Fathers job
IMD
Maternal ethnicity
Place of birth of the mother, father and grandparents
Language
History of diabetes
Mothers education
Fathers education
Mothers job
Fathers job
Maternal ethnicity
Place of birth of the mother, father and grandparents
Language
History of diabetes
Mothers education
Fathers education
Fathers job
Maternal ethnicity
Place of birth of the mother, father and grandparents
Language
History of diabetes
Mothers education
Fathers education
Maternal ethnicity
Place of birth of the mother, father and grandparents
Language
History of diabetes
Fathers education
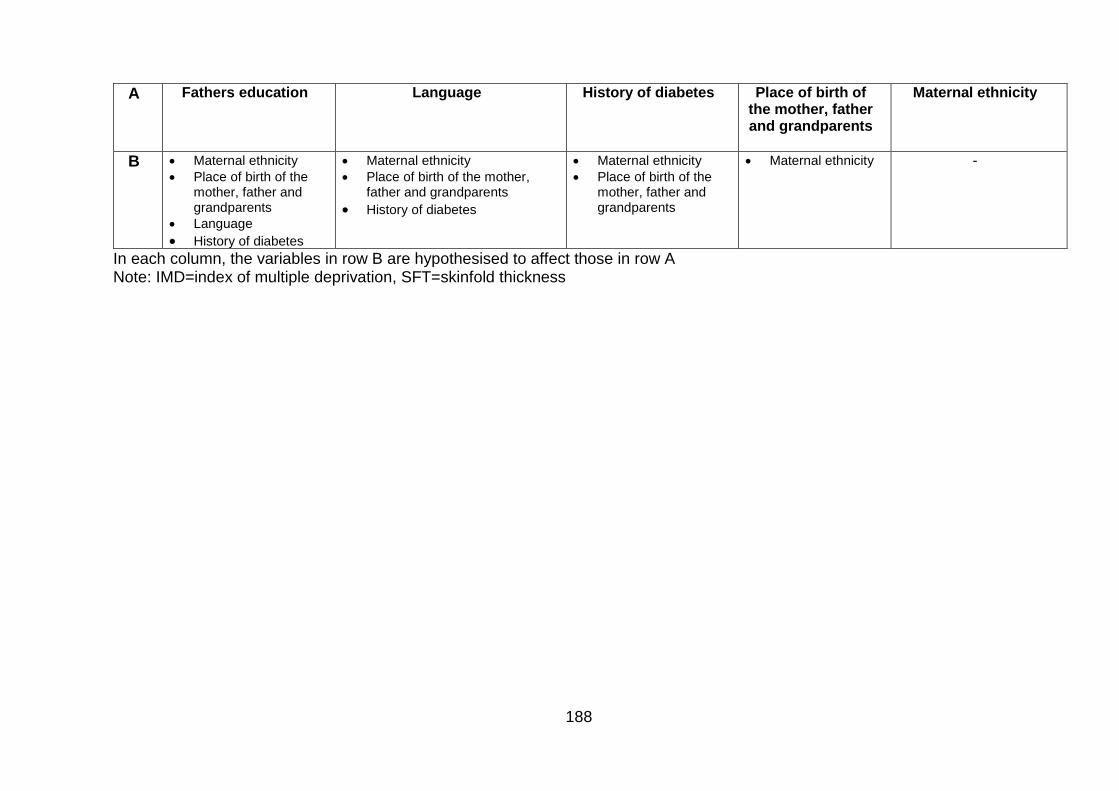
188
A Fathers education
Language History of diabetes Place of birth of the mother, father and grandparents
Maternal ethnicity
B Maternal ethnicity
Place of birth of the mother, father and grandparents
Language
History of diabetes
Maternal ethnicity
Place of birth of the mother, father and grandparents
History of diabetes
Maternal ethnicity
Place of birth of the mother, father and grandparents
Maternal ethnicity
-
In each column, the variables in row B are hypothesised to affect those in row A Note: IMD=index of multiple deprivation, SFT=skinfold thickness
189
6.2 Data analysis
As an essential first step to data analysis, the data were summarised (287) using
frequency distributions for categorical data, and histograms and dot plots for
continuous data. When continuous data were normally distributed, mean and
standard deviations have been reported. Where the data were not normally
distributed (skewed), median and interquartile ranges have been used.
Data analysis were restricted to Pakistani and White British women17. This was due
to the fact Asians are the second largest ethnic group in the UK (7.5% of the
population), and within the Asian population, the majority are South Asian (Indian
(2.5%), Pakistani (2.0%) and Bangladeshi (0.8%)) (169, 170); and also because
Pakistani women have been identified as having the highest incidence of first
trimester obesity compared to White women (147). All South Asian women were not
combined together in the analysis due to the high heterogeneity between the
populations; for example in relation to first trimester maternal obesity (147), blood
pressure (288), and risk factors for coronary heart disease (289). Combining these
subgroups together may have masked the level of risk in one particular South Asian
sub-population. Individual subgroup analysis of other South Asian ethnic groups was
not carried out due to the small available sample size in these groups within the BiB
cohort, which may have limited the reliability of the results.
Data analysis was restricted to singleton pregnancies as there are differences in risk
between multiple and singleton pregnancies; for example predominantly pre-term
birth (290) and low birth weight (190) which may affect the results. I have and also
restricted to include one pregnancy for each woman in the data collection time
period. Subsequent pregnancies in the same woman would be more similar to their
previous pregnancy than pregnancies in other women in the cohort; statistically these
two events are not independent. All women with a singleton pregnancy and more
than one pregnancy in the cohort were identified, and only data relating to the first
pregnancy in the cohort were retained for analysis (information on parity was
retained).
17 Data on ethnicity were collected by BiB and ethnicity has been self-defined by the mother.
190
6.2.1 Dealing with missing data
Missing data are unavoidable in epidemiological studies (291). If not dealt with
correctly, missing data have the potential to incur bias due to the systematic
differences between populations with and without data and undermine the validity of
the results (291). The way in which missing data should be dealt with depends on
how it is missing (291):
1. “Missing completely at random”: this is where a data item is missing due to
events that are independent of both observed and unobserved parameters
(292) (for example; data on weight is missing due to broken scales).
2. “Missing at random”: this occurs where missingness can be explained by
differences in observed data (292) (for example; missing data on weight would
be lower than recorded values if more Pakistani women refused to be weighed
than White British women, since Pakistani women tend to weigh less than
White British Women).
3. “Missing not at random”: this occurs where the value of the variable that is
missing is related to the reason it is missing (292) (for example; if data on
weight were only recorded because it was a concern to clinician (i.e. very high
or very low) and so data for women with a recommended weight are more
likely to be missing. Another example could be that data on weight are missing
because women were too heavy to be weighed on the scales).
When data are missing either completely at random, or at random, multiple
imputation (MI) can be used (293). MI was first proposed by Rubin in 1977 (294) and
is a Bayesian approach which creates several different, but plausible imputed
datasets (these datasets are sampled from their predictive distribution and are based
on other observed variables in the dataset) and combines the results from each of
them (291). This process aims to allow for uncertainty about the missing data (291).
As MI requires the modelling of the distribution of each variable with missing values
based on other observed variables, it is not suitable when data are missing not at
random. If MI is applied when data are missing not at random, results may be
misleading due to the bias incurred (291). It is thought that this incurred bias may be
as great, or greater, than that occurring in analysis which considers complete cases
only (291). Therefore, where data are not missing at random, MI should not be used
(291). It is likely that missing data from the BiB cohort are either “missing at random”
191
or “missing not at random”. Therefore, an a priori decision was made with guidance
from a statistical expert18 to use complete case analysis, alongside discussion of the
characteristics of the populations with and without missing data in order to avoid the
potential bias using MI on a dataset where data were missing not at random.
In order to explore how the missing data differs from the rest of the dataset, I first
considered the exposure variables and examined the differences in demographic
variables e.g. between the missing and non-missing data for each exposure. I then
inspected the differences between the missing and non-missing observations for
each variable using generalised linear modelling (GLM) (i.e. linear regression or
logistic regression). It is expected that due to the large number of observations and
variables in the dataset from the BiB cohort, a significant difference (a significant p
value) would be likely to be detected. With this in mind, I have additionally examined
how different the missing observations are from the non-missing observations by
including the co-efficient or ORs from the regression analysis (i.e. I have considered
the magnitude of the effect of being missing for each variable in turn on all other
variables).
6.2.2 Exploratory analysis
To investigate the association between MA and different pregnancy outcomes
(outcomes with a measurement at one time point only), a number of regression
models were generated. Primarily univariate regression models (unadjusted
generalised linear models (GLMs)) were carried out to estimate the unadjusted effect
size of the association between each maternal ethnicity, each anthropometric
exposure and outcome. Multivariable regression models (adjusted GLMs) were then
generated for each exposure and pregnancy outcome, to provide an estimate of the
effect size adjusting for variables that were hypothesised to be confounders of the
specific association to the data analysis a priori. Where the outcome was a
continuous variable, linear regression modelling was used, and where the outcome
was binary (i.e. yes/no or 0/1), logistic regression modelling was used. Interaction
terms were also then used to investigate whether or not there was a difference in the
shape of the association between exposure and outcome for the two ethnic groups.
18 Professor Steven Rushton
192
Model validity is a key aspect influencing the conclusions we can draw from statistical
models (i.e. for valid conclusions to be drawn, models statistical models must be
correctly specified and theoretically accurate). Statistical models are not direct
representations of populations under study, but rather an estimation; it is only
required that models represent the main features of the population without major
distortion (295). Therefore, it is important to examine the correspondence between
the data and the model to check for model failure. For generalised linear models,
failure can occur four areas:
1. Where the probability distribution for outcome variable (i.e. normal (Gaussian)
for linear regression, or binomial for logistic regression) is specified incorrectly
(295). This leads to inappropriate maximum likelihood estimation parameter
estimates through inappropriate use of likelihood function (295). For linear
regression, it is assumed that the residuals of the association between
outcome and exposure are normally distributed. The normality of the residuals
was checked by plotting them on a graph; normal distribution was represented
by a straight line (295). If a straight line was not observed, and the residuals
were not considered to be normally distributed, a statistical transformation e.g.
logarithm was applied to the y variable where y=a+bx (y=dependent variable
(outcome), x=independent variable (exposure) a=y intercept and b=slope of
the line) to ensure the residuals were normally distributed. Back
transformations were then carried out to enable interpretation of the results
e.g. antilog function (i.e. 10y) where logarithm had been used (this was not
required). For logistic regression, acceptability of model fit was checked by
considering whether or not the residuals were over distributed. This was done
by looking at the residual deviance (the deviance of the model with both
exposure and outcome fitted; deviance is a measure of model fit for GLMs
(292)) and the degrees of freedom. Ideally, the ratio of residual deviance to
degrees of freedom should be 1 (i.e. no difference), although a value <2 was
considered acceptable (295).
2. Where the link function, which specifies how the expected outcome value
relates to the linear predictor of the exposure variable is specified incorrectly
(295). The correct link functions will therefore be used, these are “identity” and
“logit” for linear regression and logistic regression, respectively.
193
3. The occurrence of abnormal observations (i.e. outliers) may also cause the
model to be incorrectly specified (295). Outliers in the dataset are scores
which are different to the rest of the data and must be dealt with so as not to
affect the results. If outliers are included in the dataset, they may skew the
results. This is due to the fact that outliers often have a significant effect on the
mean and standard deviation. Outliers can be univariate if they are extreme on
a single variable, such as being more than three standard deviations from the
mean (296), and were detected by inspecting frequency distributions. There
are also multivariate outliers where there are extreme scores on two or more
variables, or a pattern of scores is atypical. Where outliers are cases that were
considered to be mistakes in coding they have been removed and recoded as
“missing”. If they were thought to be true values, rather than mistakes in
coding, they have been retained. Decisions were made using realistic upper
and lower limits.
4. Incorrect specification of the systematic part of the model (for example
reliance on linear models where the association is not linear) (295). When
considering BMI as an exposure it is common to observe a “J-shaped curve”
between exposure and outcome (297). This occurs because risk of outcome
e.g. all-cause mortality, often increases with a BMI in the underweight range,
decreases slightly for women of recommended weight, and then starts to
increases again when BMI reaches overweight or obese values (297). To
account for this, women with an underweight BMI have been excluded from
analysis where maternal BMI is considered as a continuous exposure variable.
For multivariate modelling, ensuring correct specification of the systematic part of the
model (discussed above) also relates to the legitimacy of variables included. In order
to decide which variables would be included in the regression models, Table 46 was
used. This table was completed for all outcomes, but for the purposes of this thesis
has been populated with information for GWG as an example here, another example
of an outcome; gestational age at delivery, where both maternal BMI and GWG have
been considered as exposures is attached as Appendix 12 (pgs.365-366). To prevent
the bias caused by including mediators in regression analysis (sometimes known as
overadjustment bias) (298), only confounding variables were included in adjusted
regression models.
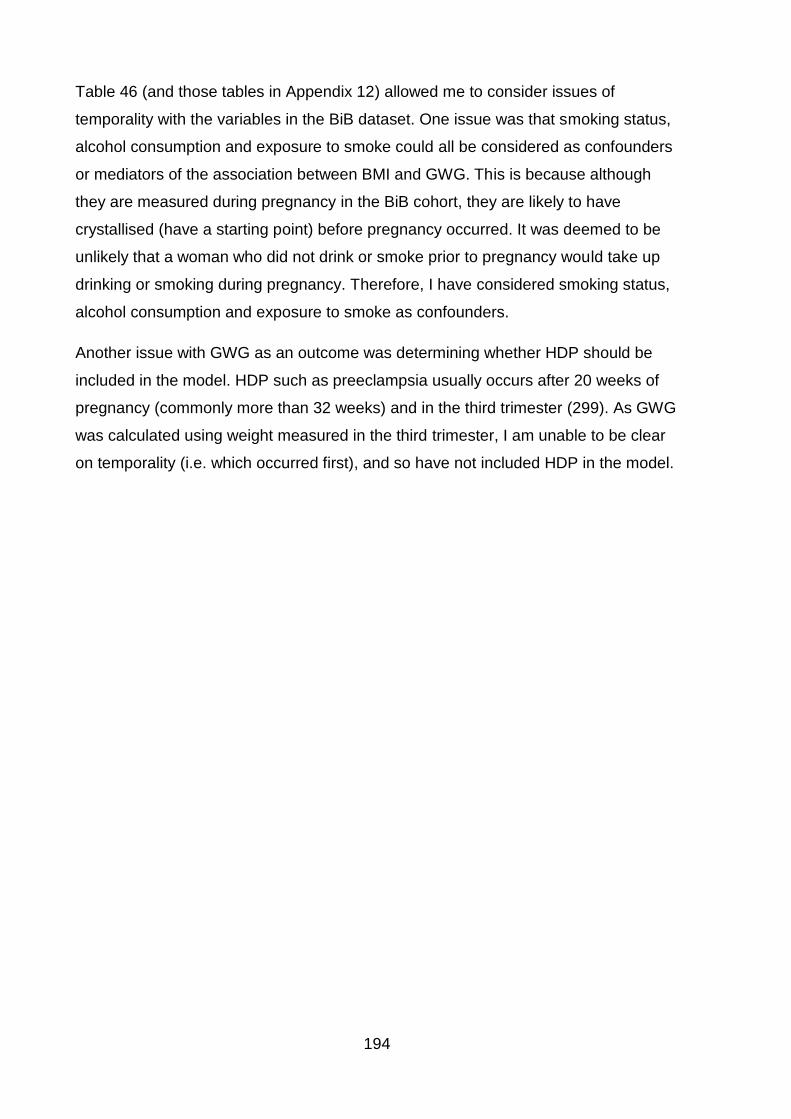
194
Table 46 (and those tables in Appendix 12) allowed me to consider issues of
temporality with the variables in the BiB dataset. One issue was that smoking status,
alcohol consumption and exposure to smoke could all be considered as confounders
or mediators of the association between BMI and GWG. This is because although
they are measured during pregnancy in the BiB cohort, they are likely to have
crystallised (have a starting point) before pregnancy occurred. It was deemed to be
unlikely that a woman who did not drink or smoke prior to pregnancy would take up
drinking or smoking during pregnancy. Therefore, I have considered smoking status,
alcohol consumption and exposure to smoke as confounders.
Another issue with GWG as an outcome was determining whether HDP should be
included in the model. HDP such as preeclampsia usually occurs after 20 weeks of
pregnancy (commonly more than 32 weeks) and in the third trimester (299). As GWG
was calculated using weight measured in the third trimester, I am unable to be clear
on temporality (i.e. which occurred first), and so have not included HDP in the model.
195
Table 46 Determining which variables are mediators, competing exposures and confounders for maternal BMI as an exposure and GWG as an outcome.
Variable Column A: Precedes exposure Maternal
BMI
Column B: Precedes outcome
GWG
Column C: Follows
exposure Maternal BMI
Mediator/ confounder/ competing exposure
Ethnicity X X - Confounder
Place of birth of mother, father and grandparents
X X - Confounder
Family history of diabetes
X X - Confounder
Maternal age X X - Confounder
Parity X X - Confounder
Marriage and cohabiting status
X X - Confounder
SES: Maternal education Maternal employment Paternal education Paternal employment IMD
X X X X X
X X X X X
- - - - -
Confounder Confounder Confounder Confounder Confounder
Maternal smoking status
X X - Confounder
Smoking exposure status
X X - Confounder
Alcohol consumption X X - Confounder
Gestational week at booking
- X X Mediator
MUAC at baseline - X X Mediator
Tricep SFT at baseline
- X X Mediator
GDM - X X Mediator
Note: Those variables that are in columns A and B are confounders, and those that are in columns B and C are mediators. If any variables had been only in column B then these would have been competing exposures.
Testing for multi-collinearity in generalised linear models
Multi-collinearity occurs in a multiple regression where one or more predictor
variables are highly correlated with another (300). Multi-collinearity should be
avoided, as where it occurs, coefficient estimates of the regression can change
erratically (300). This is because multi-collinearity exacerbates some of the pitfalls of
regression analysis (300).
196
These include:
The estimated regression coefficient depends on what variables are included in
the model (300).
The more predictor variables are added to the regression model, the lower the
precision of the estimated regression coefficient (300).
Conclusions that can be drawn about the null hypothesis (no effect between
exposure and outcome) are limited by what variables are included in the
regression model (300).
The contribution of each predictor included in the regression model to reducing
the error sum of squares19 is dependent on the other predictor variables
included in the regression model (300).
In order to test for multi-collinearity, the variance inflation factor (VIF) has been used.
A VIF of >10.0 indicates serious multicollinearity (301). If identified, serious
multicollinearity I planned to deal with this in one of two ways: either variable will be
eliminated from the model; or variables which measure the same thing will be
combined into a composite (this was not required).
6.2.3 Structural equation modelling (Path analysis where no latent
variables used)
SEM was used to investigate the direct and indirect risk factors for GWG as an
outcome. While the regression analysis allowed me to estimate the effect of the
exposure on each outcome, adjusting for confounders it did not give me an estimate
of the percentage each confounder explains of the variance in outcome, nor allow me
to consider the effect of mediators. SEM allows me to investigate this, so rather than
adjusting for confounders, it allowed me to consider their individual effect on the
association between the MA exposure and the outcome of interest. In addition, SEM
allows me to consider the contribution of mediators via analysis of indirect paths.
Referring to Table 46 in this chapter (pg.195) for GWG, SEM allowed me to look at
the influence of both confounders and mediators on the outcome of interest.
19 Sum of squares is the sum of the squared difference of each observation from the overall mean, for all observations (i.e. (observation1-mean1)2 + (observation2-mean2)2 + (observation3-mean3)2+…(observationX-meanX)2 =Sum of squares, where X= total number of observations) (297).
197
Variable types in SEM and path analysis
Observed variable: These represent the data itself and can be categorical, ordinal
or continuous (173).
Latent variables: In SEM, these variables correspond to factors or hypothetical
constructs which are explanatory variables presumed to reflect something that it is
not possible to directly observe, for example intelligence (173). Latent variables are
always continuous, and the observed variables used as indirect measure of a latent
variables are known as indicators (173). Where no latent variables are required; this
is a path analysis.
Error or Residual terms: These are associated with either latent variables or
observed variables specified as outcome variables. In the case of indicator
(exposure) latent variables, the residual term represents the variance that is
unexplained that the corresponding latent variable is supposed to measure (173).
Given that error or residual terms must be estimated as they are not directly
observable from the raw data, in SEM diagrams they are represented as latent
variables (173). Model diagrams are represented by using the symbols shown in
Figure 20 (174, 302).
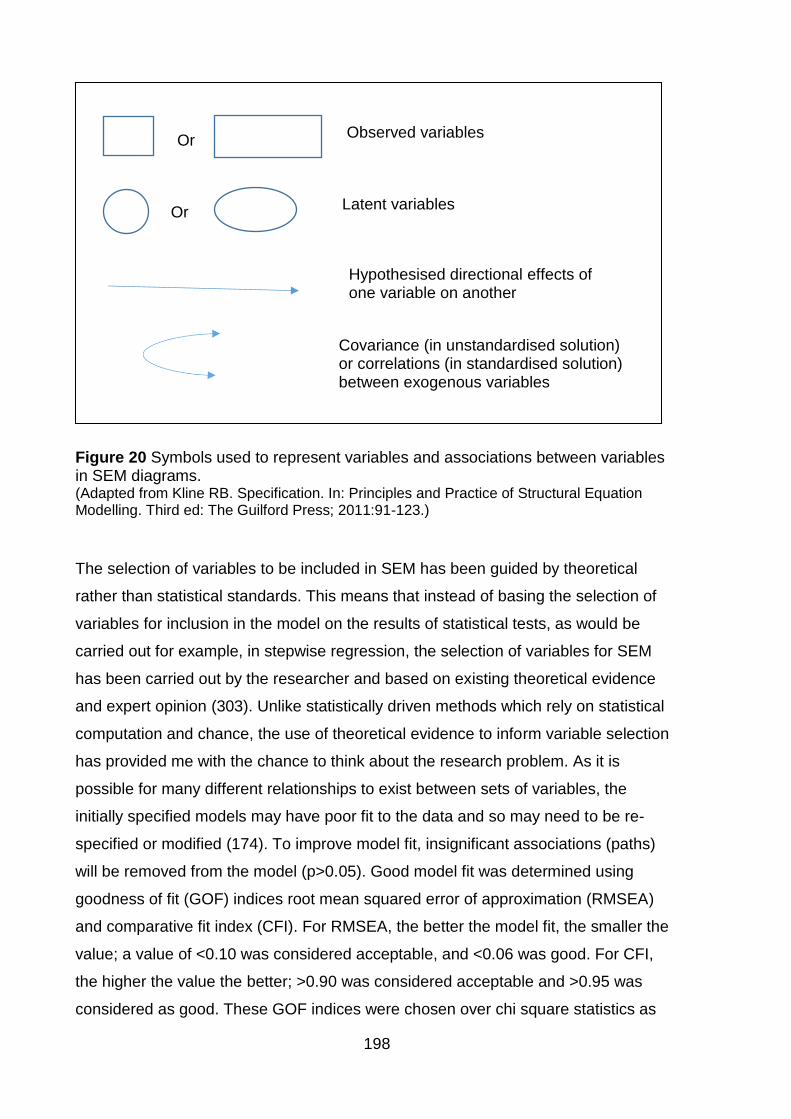
198
Figure 20 Symbols used to represent variables and associations between variables in SEM diagrams. (Adapted from Kline RB. Specification. In: Principles and Practice of Structural Equation Modelling. Third ed: The Guilford Press; 2011:91-123.)
The selection of variables to be included in SEM has been guided by theoretical
rather than statistical standards. This means that instead of basing the selection of
variables for inclusion in the model on the results of statistical tests, as would be
carried out for example, in stepwise regression, the selection of variables for SEM
has been carried out by the researcher and based on existing theoretical evidence
and expert opinion (303). Unlike statistically driven methods which rely on statistical
computation and chance, the use of theoretical evidence to inform variable selection
has provided me with the chance to think about the research problem. As it is
possible for many different relationships to exist between sets of variables, the
initially specified models may have poor fit to the data and so may need to be re-
specified or modified (174). To improve model fit, insignificant associations (paths)
will be removed from the model (p>0.05). Good model fit was determined using
goodness of fit (GOF) indices root mean squared error of approximation (RMSEA)
and comparative fit index (CFI). For RMSEA, the better the model fit, the smaller the
value; a value of <0.10 was considered acceptable, and <0.06 was good. For CFI,
the higher the value the better; >0.90 was considered acceptable and >0.95 was
considered as good. These GOF indices were chosen over chi square statistics as
Or Latent variables
Or Observed variables
Hypothesised directional effects of one variable on another
Covariance (in unstandardised solution) or correlations (in standardised solution) between exogenous variables
199
this is sensitive to sample size (it is likely that a chi square statistic will be significant,
indicating poor model fit with a large sample size such as in this study) and are also
sensitive to the complexity of the model (304). In initial exploratory analysis, all
variables were kept in the model where there are significant paths (p<0.050).
However, where the model is deemed too complex to interpret clearly, variables with
a total effect <0.100 were removed from the model. In the first instance, exceptions to
this were for key variables of interest: Ethnicity, BMI, GDM and the outcome GWG.
Then the most parsimonious20 model was identified. Reported model coefficients are
standardised (i.e. units are standard deviation).
6.3 Defining variables
This section will define all variables used in the analysis; exposures, outcomes, then
mediating and confounding variables (for full definitions of mediating and
confounding variables please see Chapter 4, Section 4.1.1, pgs.115-116).
6.3.1 Exposure variables:
Maternal anthropometrics
In the BiB cohort, maternal BMI at booking was calculated using height measured at
baseline (26-28 weeks gestation) and weight measured at first antenatal clinic visit
(booking appointment, approximately 10-12 weeks gestation) using Seca 2in1 scales
(Harlow Healthcare Ltd, London, UK). BMI was primarily considered as a continuous
variable. A lower BMI limit was set at 11kg/m2 as this has been found to be the
lowest BMI for survival in women (305) (when excluding underweight women from
analysis, this lower limit was set at 18.5kg/m2). An upper limit of a booking BMI
80kg/m2 was defined using both the frequency distribution in the data from the BiB
cohort, and upper BMI limits used in published literature relating to maternal BMI (58,
81).
20 The simplest model that is theoretically plausible
200
Maternal BMI was also categorised according to the WHO criteria; both the general
population criteria (3) (shown in detail in Table 1, Chapter 1, Section 1.1.1, pg.4) for
White and Pakistani women, and also the Asian-specific criteria (43) (shown in detail
in Table 8, Chapter 1, Section 1.7.2, pg.30) for Pakistani women only. Further
subdivision of BMI categories (i.e. consideration of maternal extreme obesity
≥50kg/m2) was not used due to small sample size (n=11).
Gestational weight gain (also an outcome when maternal anthropometrics at
booking/baseline considered as exposure)
GWG was calculated by subtracting weight in the third trimester from the weight at
the booking appointment. Weight in third trimester was not part of the original cohort
dataset but was retrospectively extracted from case notes for the whole BiB cohort,
where women had completed the baseline questionnaire and an OGTT, and had
pregnancy outcomes recorded. GWG was primarily considered as a continuous
variable. Secondary analysis was also carried out with GWG as a categorical variable
based on maternal booking BMI category. In order to define the upper and lower
realistic limits for GWG, published literature, published guidelines and frequency
distributions were considered. The IoM guidelines (94) do not provide realistic values
for upper or lower limits for GWG (94). However, they do provide weight gain during
pregnancy for singleton term births in the United States, 1990-2005; in 2005 around
20% of women gained >40lbs (18 kg) (94) (detail of 2009 IoM GWG guidelines given
in Table 7, Chapter 1, Section 1.3.5, pg.23).
Systematic review evidence was also considered. From a systematic review of 10
studies considering GWG in women with obesity and selected maternal or new born
outcomes (306), only one study provided a lower cut off for gestational weight loss
(GWL) of -13.6kg (-30.0lbs) (307) and two provided an upper limit of GWG; one of
11kg (25lbs) (136) and one of 14kg (30.9lbs) (308). Only one study considered GWG
above this and had an upper GWG category of ≥18.2kg (40.1lbs) (307). This study
did not define the highest GWG value included (307). This systematic review only
considered women with obesity, and as my project includes women with underweight
who may gain more weight in pregnancy than women with obesity, it is possible that
the upper limit required may be higher. In order to investigate this, evidence from
women who were underweight was considered. One study found that for women who
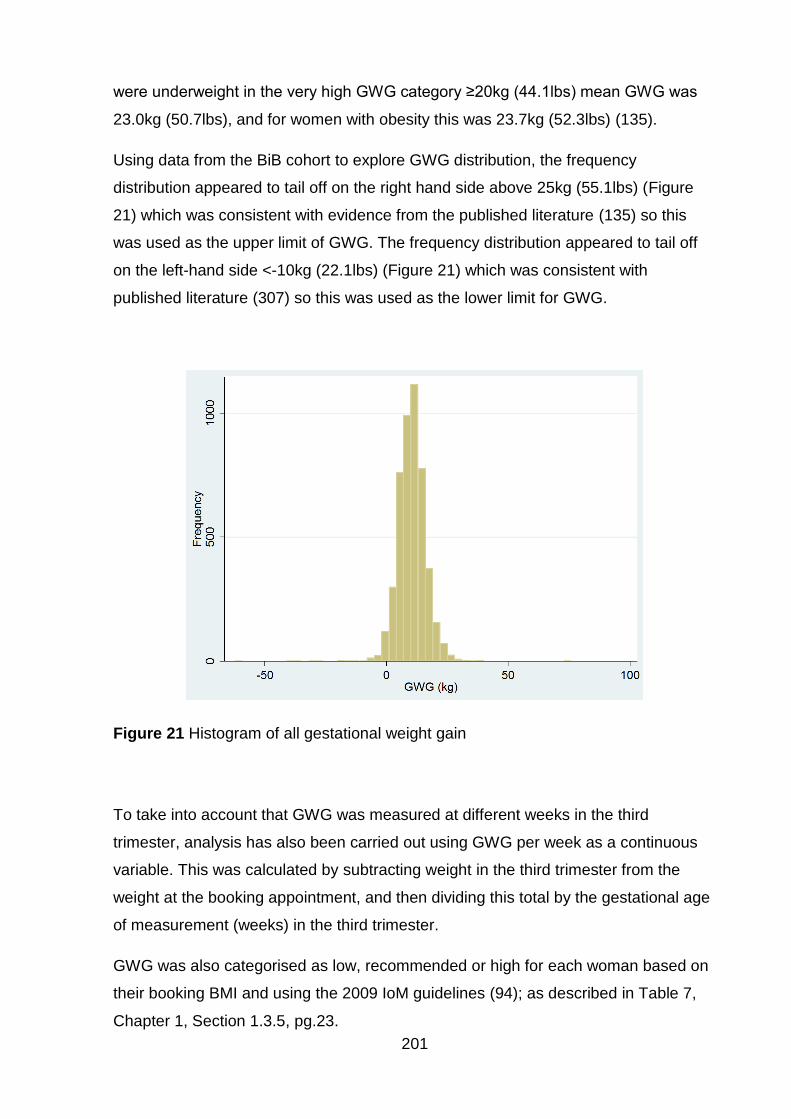
201
were underweight in the very high GWG category ≥20kg (44.1lbs) mean GWG was
23.0kg (50.7lbs), and for women with obesity this was 23.7kg (52.3lbs) (135).
Using data from the BiB cohort to explore GWG distribution, the frequency
distribution appeared to tail off on the right hand side above 25kg (55.1lbs) (Figure
21) which was consistent with evidence from the published literature (135) so this
was used as the upper limit of GWG. The frequency distribution appeared to tail off
on the left-hand side <-10kg (22.1lbs) (Figure 21) which was consistent with
published literature (307) so this was used as the lower limit for GWG.
Figure 21 Histogram of all gestational weight gain
To take into account that GWG was measured at different weeks in the third
trimester, analysis has also been carried out using GWG per week as a continuous
variable. This was calculated by subtracting weight in the third trimester from the
weight at the booking appointment, and then dividing this total by the gestational age
of measurement (weeks) in the third trimester.
GWG was also categorised as low, recommended or high for each woman based on
their booking BMI and using the 2009 IoM guidelines (94); as described in Table 7,
Chapter 1, Section 1.3.5, pg.23.

202
6.3.2 Outcome variables
Details of all outcome variables that were available for the BiB cohort are given in
Table 47, along with their definitions, whether they were categorical or continuous
variables, and if categorical then the categories are defined.
203
Table 47 Outcome variables
Variable Definition Type Categories
Gestational Weight Gain
Also considered as an exposure, only as an outcome when Maternal BMI an exposure
Continuous and categorical
Low
Recommended
High Gestational Diabetes Mellitus (GDM)
GDM was derived from the oral glucose tolerance test result and medical notes by BiB. It is defined as “Diabetes that only occurs in pregnancy, resolves during childbirth but may develop into frank diabetes in later life” (299)
Categorical Yes
No
Missing
Hypertensive disorders of pregnancy (HDP)
HDP was defined as “high blood pressure (hypertension) that develops due to pregnancy” (299)
Categorical Yes (women with mild to moderate hypertension (blood pressure record of > 140/90 on two or more occasions in the antenatal period), severe hypertension (blood pressure record of > 150/105 on two or more occasions in the antenatal period) and those who had hypertension but the severity was not classified.)
No
Missing Child anthro-pometrics at birth
Birth weight (g)
Child abdominal circumference at birth (cm)
Child head circumference at birth (cm)
Child mid-arm circumference at birth (cm)
Child subscapular SFT at birth (mm)
Child tricep SFT at birth (mm)
Continuous N/A
Mode of delivery
Caesarean section
Spontaneous delivery (reference)
Induction
Categorical For each mode of delivery:
Yes
No
Missing
204
Variable Definition Type Categories
Gestational age at delivery
Pre-term birth: Pre-term birth has been defined as a birth occurring at <37 weeks gestation.
Term birth (Reference): Term birth was
defined as a birth occurring ≥37 to <42
weeks gestation.
Post-term birth: Post-term birth has been
defined as ≥42 weeks gestation
All defined according to the 2013 ACOG committee opinion on the definition of term birth (309, 310)
Categorical Yes
No
Missing
Stillbirth
“The complete expulsion of a baby > 24 weeks which does not breathe, cry or show any other signs of life”(311)
Categorical Yes
No
Missing
ACOG= American College of Obstetricians and Gynaecologists, BiB= Born in Bradford, SFT= skinfold thickness
205
6.3.3 Confounding and mediating variables
Details of confounding/mediating variables21 are given in Table 48, along with details
on whether they were categorical or continuous variables, and if categorical then the
categories are defined.
21 Whether the variables are confounders of mediators will depend on the association of interest, and which variable is considered as exposure. Please note that for some outcomes, other outcome variables may also act as mediators e.g. for the association between BMI and GWG, GDM acts as a mediator.
206
Table 48 Confounding and mediating variables
Confounding/mediating variable Type Categories
Maternal age Continuous N/A
Gestational age at booking Continuous N/A
Parity Categorical 0 (nulliparous), 1, 2, 3, ≥4
Maternal arm circumference (cm) at baseline questionnaire (26-28 weeks)
Continuous
Maternal tricep SFT (mm) at baseline questionnaire (26-28 weeks)
Continuous
Maternal education Categorical <5 GCSEs, 5 GCSEs, A Level equivalent, Higher than A level, Missing Paternal education Categorical <5 GCSEs, 5 GCSEs, A Level equivalent, Higher than A level, Missing Maternal employment Categorical Currently employed, Previously employed, Never employed, Missing Paternal employment Categorical Employed- non-manual, Employed-manual, Self-employed, Student,
Unemployed, Missing Index of multiple deprivation Categorical 2010 IMD quintiles were considered as a categorical variable with five
categories (Note: The IMD 2010 updates the IMD 2007 and will be used in this analysis): 1 (least deprived), 2, 3, 4, 5 (most deprived)
Place of birth (generation status) Categorical Mother, her partner and all four of their parents UK born; Mother and her partner UK born and all four of their parents South Asian born; Mother UK born, partner and all four of their parents South Asian born; Partner UK born, mother and all four parents South Asian born; Mother, her partner and four parents all South Asian born; Missing
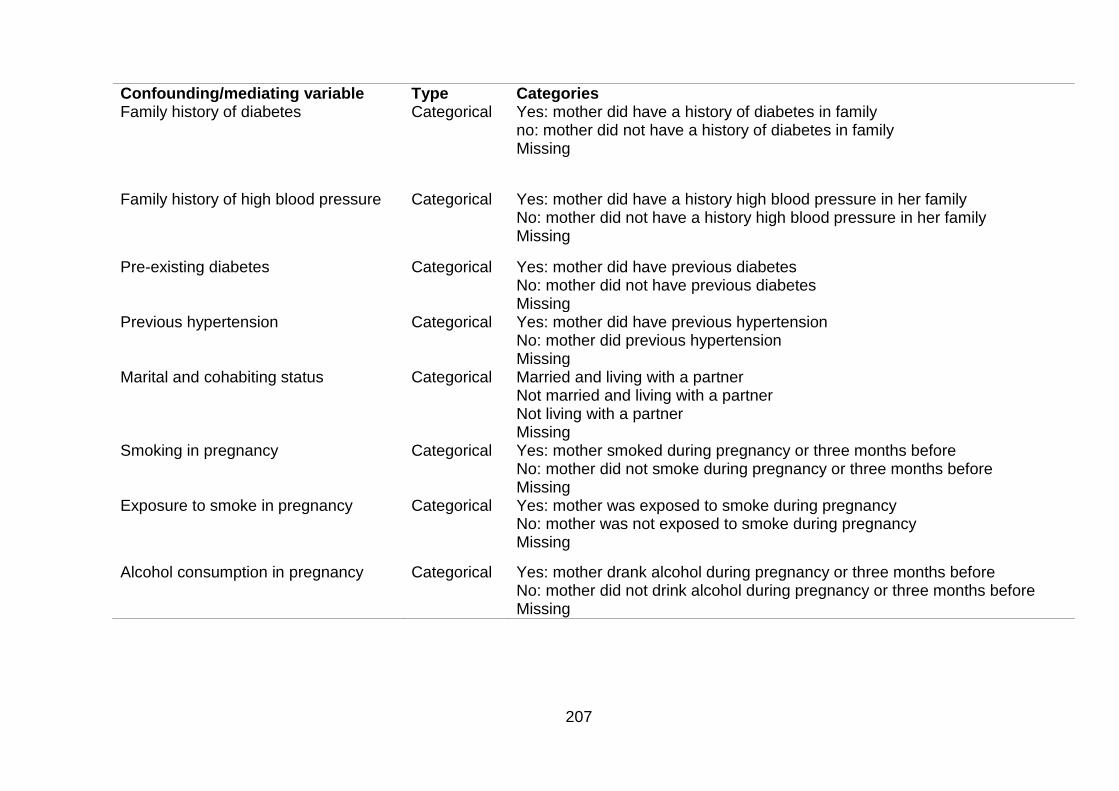
207
Confounding/mediating variable Type Categories Family history of diabetes
Categorical Yes: mother did have a history of diabetes in family no: mother did not have a history of diabetes in family Missing
Family history of high blood pressure
Categorical Yes: mother did have a history high blood pressure in her family No: mother did not have a history high blood pressure in her family Missing
Pre-existing diabetes Categorical Yes: mother did have previous diabetes No: mother did not have previous diabetes Missing
Previous hypertension Categorical Yes: mother did have previous hypertension No: mother did previous hypertension Missing
Marital and cohabiting status Categorical Married and living with a partner Not married and living with a partner Not living with a partner Missing
Smoking in pregnancy
Categorical Yes: mother smoked during pregnancy or three months before No: mother did not smoke during pregnancy or three months before Missing
Exposure to smoke in pregnancy Categorical Yes: mother was exposed to smoke during pregnancy No: mother was not exposed to smoke during pregnancy Missing
Alcohol consumption in pregnancy Categorical Yes: mother drank alcohol during pregnancy or three months before No: mother did not drink alcohol during pregnancy or three months before Missing

208
6.3.4 Ethical considerations
This dataset contained previously collected, fully anonymised data from the BiB and
BiB 1000 cohorts. The data request was approved by the BiB executive team on the
13/12/16 and use of the BiB data for this project was covered by ethical approval
from the Bradford Research Ethics committee given on the 14/08/06 (please see
Appendix 13, pgs.367-370).
Ethical approval for this project was given on 5/10/15 by Newcastle University Faculty
of Medical Sciences Ethics Committee (please see Appendix 14, pgs.371-372).
209
Chapter 7. Results from analysis of data from the Born in
Bradford cohort
In this chapter, I will discuss differences between the two ethnic groups; White British
and Pakistani, in terms of exposures (maternal BMI and GWG), demographic
characteristics (e.g. maternal age, parity, etc.) and outcomes. Outcomes for the
mother are HDP, GDM, mode of delivery (C-section and induction), breastfeeding at
6 months, and PPWR. Outcomes for the infant are outcome of birth i.e. stillbirth or
livebirth, gestational age at delivery (pre-term birth <37 weeks, and post-term birth
≥42 weeks), infant anthropometrics at birth (birth weight, abdominal circumference,
head circumference, mid-arm circumference, subscapular SFT and tricep SFT), and
infant anthropometrics at 3 years of age (weight, abdominal circumference,
subscapular SFT, tricep SFT, and thigh circumference). I will describe the
associations between each outcome and exposure, first without adjusting for
confounders, and then considering them using regression analysis. Following this, I
will describe the association between GWG and BMI considering both confounders
and mediators using SEM. Finally, I will describe the differences in missing data for
BMI and GWG. This chapter addresses objectives 3-6 set out in Chapter 1, Section
1.10, pgs.34-35.
7.1 Born in Bradford population included in the analysis
There were n=11,066 women in the BiB project prior to exclusions. Following
exclusions of subsequent pregnancies (n=858), and women not of either White
British or Pakistani ethnicity (n=1,617; n=1,595 were of another ethnic group and
n=22 had missing data on ethnicity), n=8,613 women remained. Of these women,
n=4,088 were of White British ethnicity (47.46%) and n=4,525 were of Pakistani
ethnicity (52.54%).
7.1.1 Ethnic differences in maternal anthropometrics
Ethnic differences in anthropometric measures are shown in Table 49.
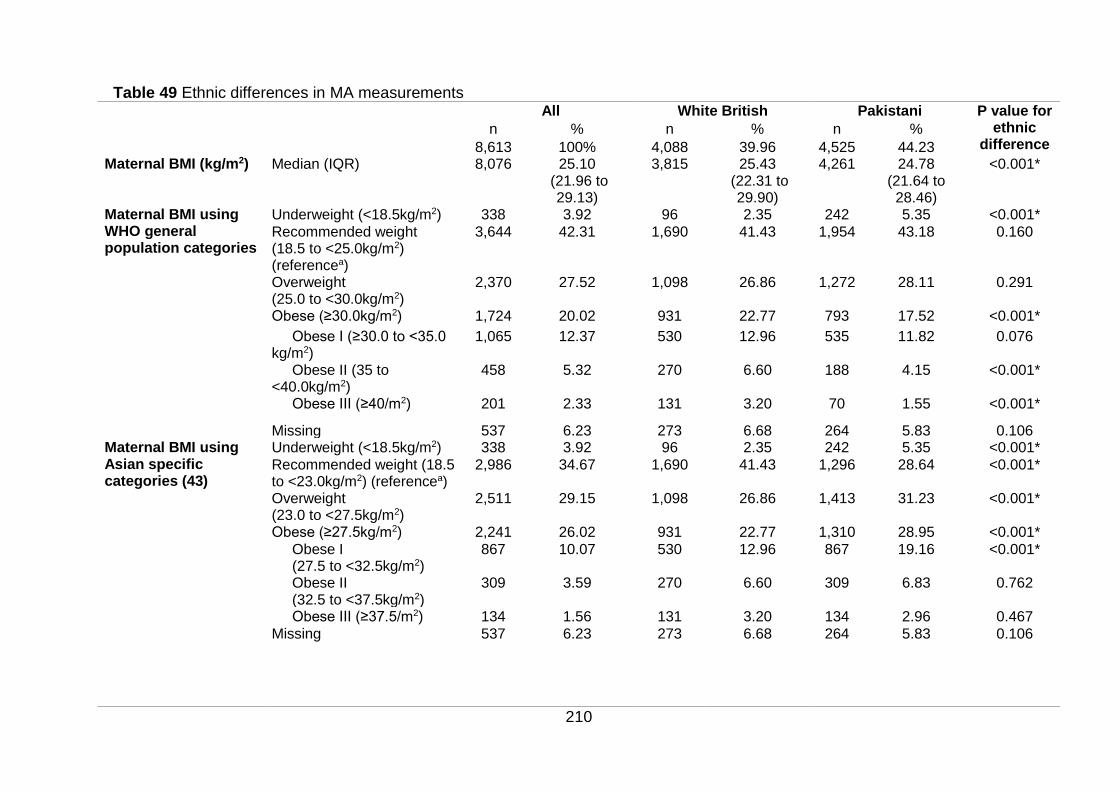
210
Table 49 Ethnic differences in MA measurements All White British Pakistani P value for
ethnic difference
n % n % n %
8,613 100% 4,088 39.96 4,525 44.23 Maternal BMI (kg/m2) Median (IQR) 8,076 25.10
(21.96 to 29.13)
3,815 25.43 (22.31 to
29.90)
4,261 24.78 (21.64 to 28.46)
<0.001*
Maternal BMI using WHO general population categories
Underweight (<18.5kg/m2) 338 3.92 96 2.35 242 5.35 <0.001*
Recommended weight (18.5 to <25.0kg/m2) (referencea)
3,644 42.31 1,690 41.43 1,954 43.18 0.160
Overweight (25.0 to <30.0kg/m2)
2,370 27.52 1,098 26.86 1,272 28.11 0.291
Obese (≥30.0kg/m2) 1,724 20.02 931 22.77 793 17.52 <0.001*
Obese I (≥30.0 to <35.0 kg/m2)
1,065 12.37 530 12.96 535 11.82 0.076
Obese II (35 to <40.0kg/m2)
458 5.32 270 6.60 188 4.15 <0.001*
Obese III (≥40/m2) 201 2.33 131 3.20 70 1.55 <0.001*
Missing 537 6.23 273 6.68 264 5.83 0.106 Maternal BMI using Asian specific categories (43)
Underweight (<18.5kg/m2) 338 3.92 96 2.35 242 5.35 <0.001*
Recommended weight (18.5 to <23.0kg/m2) (referencea)
2,986 34.67 1,690 41.43 1,296 28.64 <0.001*
Overweight (23.0 to <27.5kg/m2)
2,511 29.15 1,098 26.86 1,413 31.23 <0.001*
Obese (≥27.5kg/m2) 2,241 26.02 931 22.77 1,310 28.95 <0.001*
Obese I (27.5 to <32.5kg/m2)
867 10.07 530 12.96 867 19.16 <0.001*
Obese II (32.5 to <37.5kg/m2)
309 3.59 270 6.60 309 6.83 0.762
Obese III (≥37.5/m2) 134 1.56 131 3.20 134 2.96 0.467
Missing 537 6.23 273 6.68 264 5.83 0.106
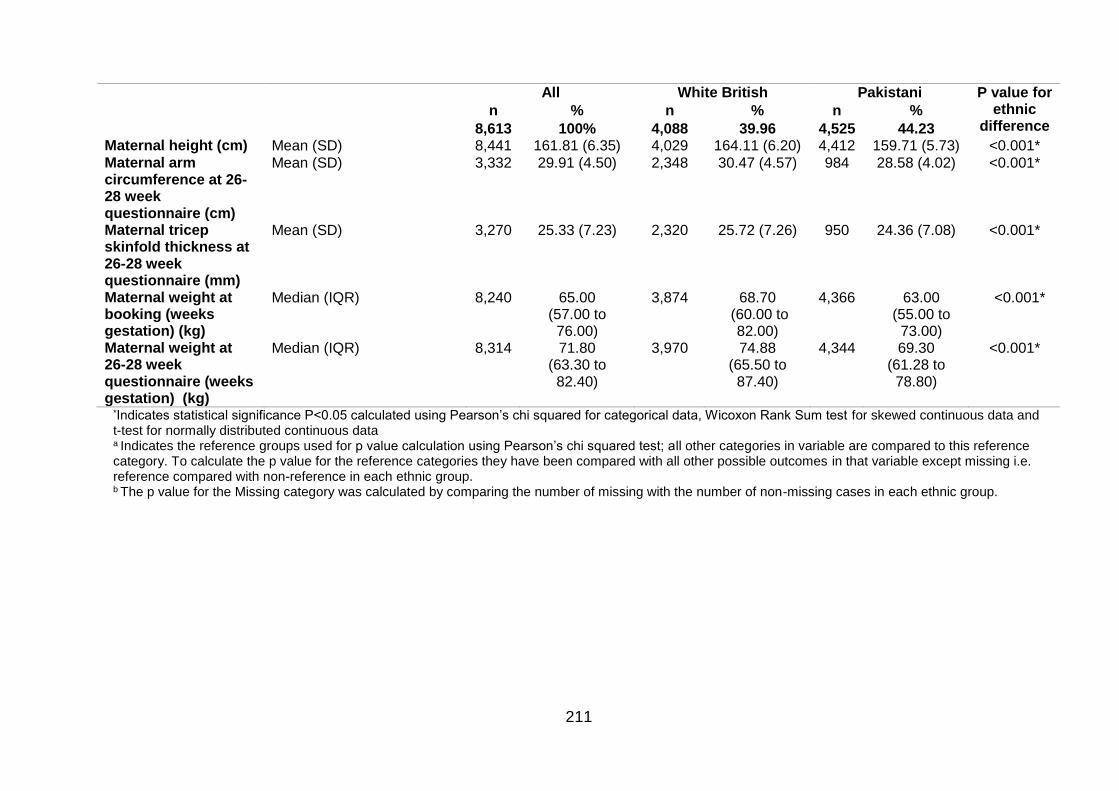
211
All White British Pakistani P value for ethnic
difference n % n % n %
8,613 100% 4,088 39.96 4,525 44.23 Maternal height (cm) Mean (SD) 8,441 161.81 (6.35) 4,029 164.11 (6.20) 4,412 159.71 (5.73) <0.001* Maternal arm circumference at 26-28 week questionnaire (cm)
Mean (SD) 3,332 29.91 (4.50) 2,348 30.47 (4.57) 984 28.58 (4.02) <0.001*
Maternal tricep skinfold thickness at 26-28 week questionnaire (mm)
Mean (SD) 3,270 25.33 (7.23) 2,320 25.72 (7.26) 950 24.36 (7.08) <0.001*
Maternal weight at booking (weeks gestation) (kg)
Median (IQR) 8,240 65.00 (57.00 to 76.00)
3,874 68.70 (60.00 to
82.00)
4,366 63.00 (55.00 to 73.00)
<0.001*
Maternal weight at 26-28 week questionnaire (weeks gestation) (kg)
Median (IQR) 8,314 71.80 (63.30 to 82.40)
3,970 74.88 (65.50 to 87.40)
4,344
69.30 (61.28 to 78.80)
<0.001*
*Indicates statistical significance P<0.05 calculated using Pearson’s chi squared for categorical data, Wicoxon Rank Sum test for skewed continuous data and t-test for normally distributed continuous data a Indicates the reference groups used for p value calculation using Pearson’s chi squared test; all other categories in variable are compared to this reference category. To calculate the p value for the reference categories they have been compared with all other possible outcomes in that variable except missing i.e. reference compared with non-reference in each ethnic group.
b The p value for the Missing category was calculated by comparing the number of missing with the number of non-missing cases in each ethnic group.
212
Mean maternal height was 161.51cm (SD 6.35cm). The mean height was
significantly lower in Pakistani women than it was in White British women (159.71cm
SD 5.73cm and 164.11cm SD 6.20cm, respectively p<0.001). Median maternal
weight at booking was 65.00kg (interquartile range (IQR) 57.00kg to 76.00kg); this
was significantly lower in Pakistani women (Median: 63.00kg IQR 55.00kg to
73.00kg) compared with White British women (Median: 68.70kg IQR 60.00kg to
82.00kg, p<0.001). Maternal weight was measured again at baseline (26-28 weeks
gestation); the median value had increased from weight at booking to 71.80kg (IQR
63.30kg to 82.40kg), and was still significantly lower in Pakistani women (median:
69.30kg IQR 61.28kg to 78.80kg) compared with White British women (median:
74.88kg IQR 65.50kg to 87.40kg, p<0.001). In addition to maternal weight and height,
two other anthropometric measures were recorded at baseline (26-28 weeks
gestation): maternal MUAC and tricep SFT. The mean MUAC was 29.91cm (SD
4.50); this was significantly lower in Pakistani women compared with White British
women (28.58cm SD 4.02 and 30.47cm SD 4.57, respectively p<0.001). The mean
tricep SFT was 25.33mm (SD 7.23); this was also significantly lower in Pakistani
women compared with White British women (mean 24.36mm SD 7.08 and 25.72mm
SD 7.26 respectively p<0.001).
Ethnic differences in BMI when using the general population BMI criteria22 for White
British and Pakistani women
When using the WHO BMI categories for the general population, 42.31% of women
had a recommended BMI. The percentage of women with recommended BMI was
not significantly different for the two ethnic groups; 43.18% in Pakistani women and
41.43% in White British women (p=0.160). There were 3.92% of all included women
who had an underweight BMI; this was significantly higher in Pakistani women
(5.35%) compared with White British women (2.35%; p<0.001). Percentages of
women with a BMI in the overweight range did not differ significantly by ethnicity;
27.52% for the whole population had a BMI in the overweight range, this was 28.11%
in Pakistani women, and 26.86% in White British women (p=0.261). Percentages of
22Underweight BMI <18.5kg/m2; recommended BMI ≥18.5 to <25kg/m2; overweight BMI 25.0 to <30.0kg/m2; obese BMI ≥30kg/m2; Obese I BMI ≥30.0 to <35.0kg/m2; Obese II BMI ≥35 to <40.0kg/m2; obese III BMI ≥40/m2
213
those with obesity differed significantly by ethnicity; 20.02% of all women had
obesity; 17.52% in Pakistani women and 22.77% in White British women (p<0.001).
Of those women who had a BMI in the obese range, 12.37% had class I obesity this
was not significantly different between the two ethnic groups (11.82% in Pakistani
women and 12.96% in White British women, p=0.076). There were 5.32% women
with class II obesity; this was significantly lower for Pakistani women at 4.15%
compared with White British women at 6.60% (p<0.001). Finally, 2.33% of women
had class III obesity this was also significantly lower for Pakistani women at 1.55%
compared with White British women at 3.20% (p<0.001).
Effect of applying Asian specific BMI criteria23 in the Pakistani population
When applying the WHO BMI criteria for Asian populations to women of Pakistani
ethnicity, there was no change to the underweight category as the cut offs are the
same for both general population, and Asian specific BMI cut offs. The percentage of
Pakistani women with a recommended BMI decreased from 43.18% when using
general population BMI criteria to 28.64% when using BMI criteria specific to the
Asian population. The percentage of Pakistani women with a BMI in the overweight
range increased from 28.11% to 31.23%. The percentage of Pakistani women with a
BMI in the obese range increased from 17.52% to 28.95%: class I obesity increased
from 11.82% to 19.16%; class II obesity increased from 4.15% to 6.83% and class III
obesity increased from 1.55% to 2.96%.
Ethnic differences in BMI when using the general population BMI criteria for White
British population, and the Asian specific BMI criteria for Pakistani women
I also compared the percentages of women with a BMI in each BMI category using
general population BMI criteria for White British women, and BMI criteria specific to
the Asian population for Pakistani women. There were a significantly lower
percentage of Pakistani women with a BMI in the recommended range compared
with White British women when using the BMI criteria for Asian population (28.64% in
23 Underweight BMI <18.5kg/m2; Recommended weight BMI 18.5 to <23.0kg/m2; Overweight BMI 23.0 to <27.5kg/m2; Obese ≥27.5kg/m2; Obese I BMI 27.5 to <32.5kg/m2; Obese II BMI 32.5 to <37.5kg/m2; Obese III BMI ≥37.5kg/m2
214
Pakistani, 41.43% in White British; p<0.001). When using the BMI criteria for the
general population, there had been no significant difference between the
percentages of women with recommended BMI between the two ethnic groups
(p=0.160). There was a significantly higher percentage of Pakistani women with an
overweight BMI compared with White British women (31.23% in Pakistani women
and 26.86% in White British women; p<0.001). When using BMI for the general
population, the percentage of Pakistani women with an overweight BMI had been
lower, but did not reach statistical significance (p=0.291). There was also a
significantly higher percentage of Pakistani women with an obese BMI compared with
White British women (28.95% in Pakistani women and 22.77% in White British
women; p<0.001); when using BMI for the general population, the percentage of
Pakistani women with an obese BMI had been significantly lower (p<0.001).
When considering the subgroups of obesity; there were a significantly higher
percentage of Pakistani women with a BMI in the obese class I range compared with
White British women (19.16% in Pakistani women and 12.96% in White British
women; p<0.001). When using BMI for the general population, the percentage of
Pakistani women with a BMI in the obese class I range had been lower, but this
difference did not reach statistical significance (p=0.076). There were also now
higher percentages of Pakistani women with class II obesity (6.83% compared to
4.15% in White British women, p=0.762) and class III obesity (2.96% compared to
1.55 in White British women, p=0.467). Although this was not statistically significantly
higher for Pakistani women, when using the BMI criteria for the general population for
both ethnic groups, the percentage in Pakistani women had been significantly lower
for both obesity classes (p<0.001 for both).
7.1.2 Ethnic differences in gestational weight gain
Ethnic differences in GWG are shown in Table 50.
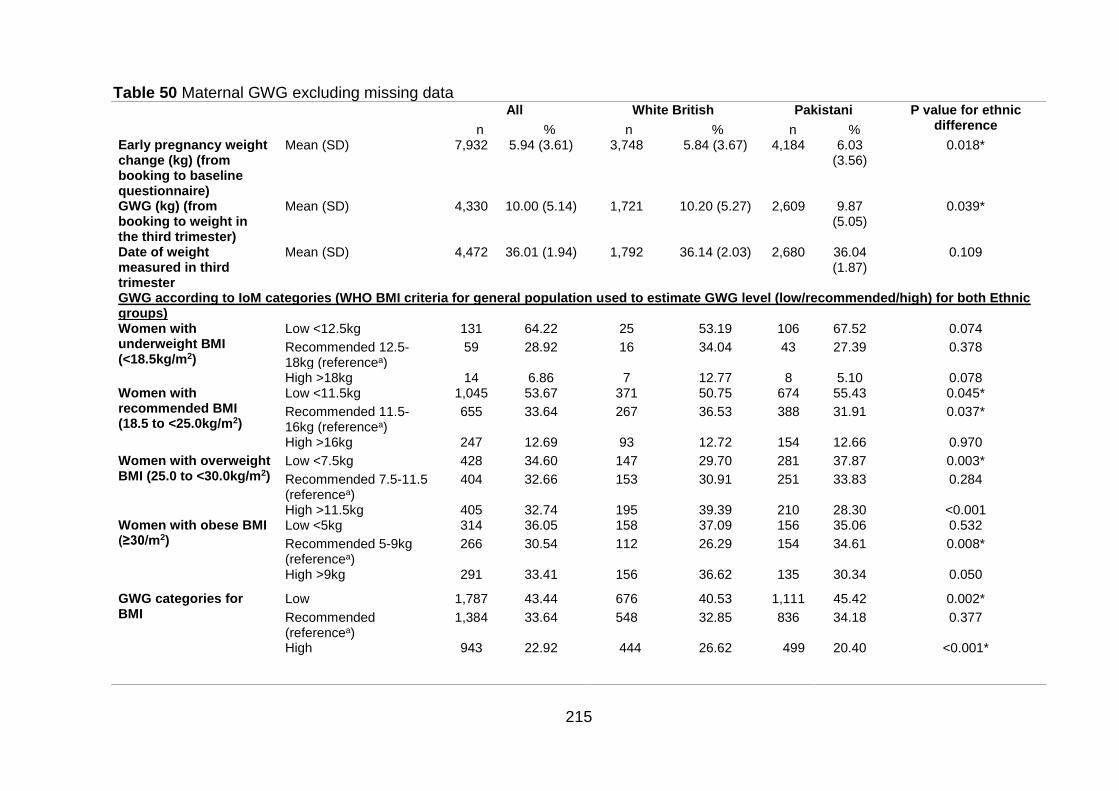
215
Table 50 Maternal GWG excluding missing data All White British Pakistani P value for ethnic
difference n % n % n % Early pregnancy weight change (kg) (from booking to baseline questionnaire)
Mean (SD) 7,932 5.94 (3.61) 3,748 5.84 (3.67) 4,184 6.03 (3.56)
0.018*
GWG (kg) (from booking to weight in the third trimester)
Mean (SD) 4,330 10.00 (5.14) 1,721 10.20 (5.27) 2,609 9.87 (5.05)
0.039*
Date of weight measured in third trimester
Mean (SD) 4,472 36.01 (1.94) 1,792 36.14 (2.03) 2,680 36.04 (1.87)
0.109
GWG according to IoM categories (WHO BMI criteria for general population used to estimate GWG level (low/recommended/high) for both Ethnic groups) Women with underweight BMI (<18.5kg/m2)
Low <12.5kg 131 64.22 25 53.19 106 67.52 0.074
Recommended 12.5-18kg (referencea)
59 28.92 16 34.04 43 27.39 0.378
High >18kg 14 6.86 7 12.77 8 5.10 0.078 Women with recommended BMI (18.5 to <25.0kg/m2)
Low <11.5kg 1,045 53.67 371 50.75 674 55.43 0.045*
Recommended 11.5-16kg (referencea)
655 33.64 267 36.53 388 31.91 0.037*
High >16kg 247 12.69 93 12.72 154 12.66 0.970
Women with overweight BMI (25.0 to <30.0kg/m2)
Low <7.5kg 428 34.60 147 29.70 281 37.87 0.003*
Recommended 7.5-11.5 (referencea)
404 32.66 153 30.91 251 33.83 0.284
High >11.5kg 405 32.74 195 39.39 210 28.30 <0.001 Women with obese BMI (≥30/m2)
Low <5kg 314 36.05 158 37.09 156 35.06 0.532
Recommended 5-9kg (referencea)
266 30.54 112 26.29 154 34.61 0.008*
High >9kg 291 33.41 156 36.62 135 30.34 0.050
GWG categories for BMI
Low 1,787 43.44 676 40.53 1,111 45.42 0.002*
Recommended (referencea)
1,384 33.64 548 32.85 836 34.18 0.377
High 943 22.92 444 26.62 499 20.40 <0.001*
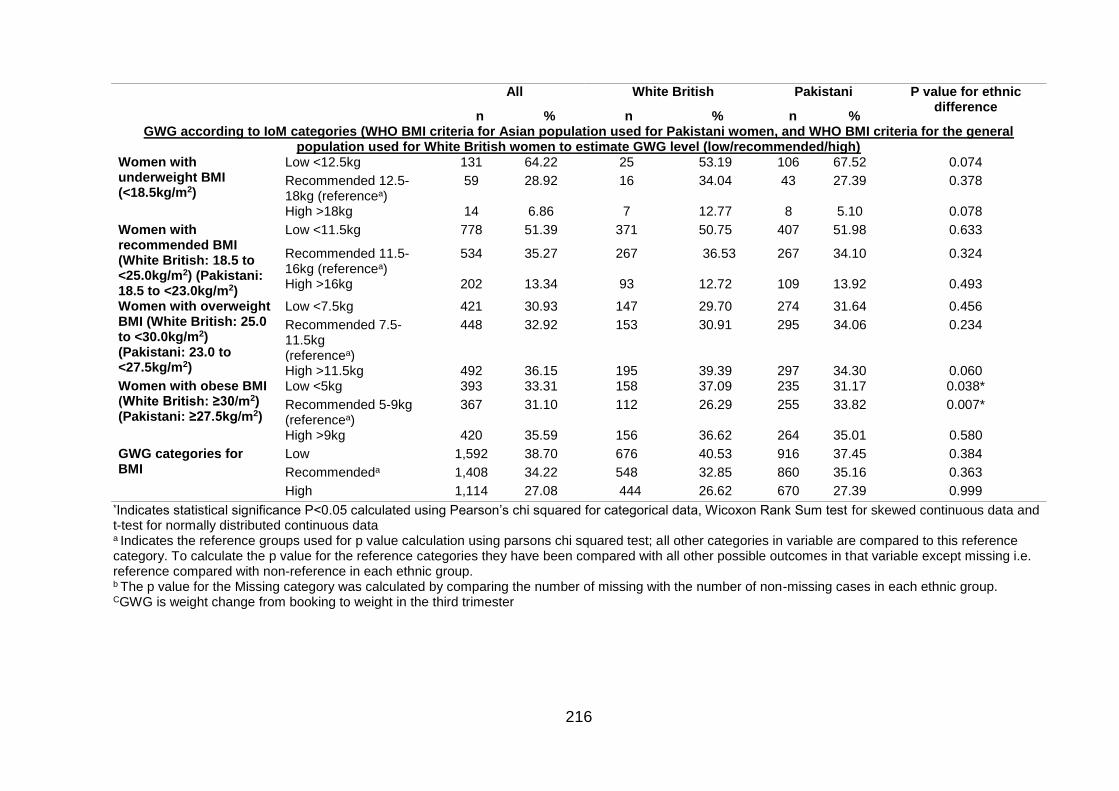
216
All White British Pakistani P value for ethnic difference
n % n % n % GWG according to IoM categories (WHO BMI criteria for Asian population used for Pakistani women, and WHO BMI criteria for the general
population used for White British women to estimate GWG level (low/recommended/high) Women with underweight BMI (<18.5kg/m2)
Low <12.5kg 131 64.22 25 53.19 106 67.52 0.074
Recommended 12.5-18kg (referencea)
59 28.92 16 34.04 43 27.39 0.378
High >18kg 14 6.86 7 12.77 8 5.10 0.078
Women with recommended BMI (White British: 18.5 to <25.0kg/m2) (Pakistani: 18.5 to <23.0kg/m2)
Low <11.5kg 778 51.39 371 50.75 407 51.98 0.633
Recommended 11.5-16kg (referencea)
534 35.27 267 36.53 267 34.10 0.324
High >16kg 202 13.34 93 12.72 109 13.92 0.493
Women with overweight BMI (White British: 25.0 to <30.0kg/m2) (Pakistani: 23.0 to <27.5kg/m2)
Low <7.5kg 421 30.93 147 29.70 274 31.64 0.456
Recommended 7.5-11.5kg (referencea)
448 32.92 153 30.91 295 34.06 0.234
High >11.5kg 492 36.15 195 39.39 297 34.30 0.060 Women with obese BMI (White British: ≥30/m2) (Pakistani: ≥27.5kg/m2)
Low <5kg 393 33.31 158 37.09 235 31.17 0.038*
Recommended 5-9kg (referencea)
367 31.10 112 26.29 255 33.82 0.007*
High >9kg 420 35.59 156 36.62 264 35.01 0.580
GWG categories for BMI
Low 1,592 38.70 676 40.53 916 37.45 0.384
Recommendeda 1,408 34.22 548 32.85 860 35.16 0.363
High 1,114 27.08 444 26.62 670 27.39 0.999 *Indicates statistical significance P<0.05 calculated using Pearson’s chi squared for categorical data, Wicoxon Rank Sum test for skewed continuous data and t-test for normally distributed continuous data a Indicates the reference groups used for p value calculation using parsons chi squared test; all other categories in variable are compared to this reference category. To calculate the p value for the reference categories they have been compared with all other possible outcomes in that variable except missing i.e. reference compared with non-reference in each ethnic group. b The p value for the Missing category was calculated by comparing the number of missing with the number of non-missing cases in each ethnic group. CGWG is weight change from booking to weight in the third trimester
217
GWG was calculated based on maternal weight measurements at three time points;
booking (approximately 10-12 weeks gestation), baseline questionnaire (26-28
weeks gestation) and in the third trimester for a subsample of women. On average,
the early GWG between booking and 26-28 weeks was 5.9kg (SD 3.61kg). Mean
early weight change was significantly higher in Pakistani women 6.03kg (SD 3.56kg),
compared to White British 5.84kg (SD 3.67kg) (p=0.018). Mean GWG (between
booking and the third trimester) was 10.00kg (SD 5.14kg); this was significantly lower
in the Pakistani women 9.87kg (SD 5.05kg) compared with White British women
10.20kg (SD 5.27kg) (p=0.039).
Due to the large proportion of missing data for GWG (52.23% in whole population;
59.20% in White British and 45.94% Pakistani women), and the effect this missing
data has on the percentages in each GWG group when included in descriptive
analysis, the proportions of GWG will be discussed excluding missing data to avoid
confusion. A table reporting the missing data is in Appendix 15 (pgs.373-374). For
more information on missing data for GWG, and how it relates to demographic
variables, please see Section 7.3, pgs.277-285 in this chapter.
Comparing ethnic differences in overall gestational weight gain
Low GWG
When using the general population BMI criteria to calculate GWG using the 2009 IoM
recommendations, 43.44% of women had low GWG for their BMI category. The
proportion with low GWG was significantly higher in Pakistani women compared with
White British women (45.42%, 40.53% respectively, p=0.002). When the Asian
specific BMI cut offs were applied for Pakistani women, the proportion with low GWG
for BMI fell from 45.42% to 37.45%, and the ethnic difference was no longer
significant (p=0.384).
Recommended GWG
There were 33.64% of women who had recommended GWG for their BMI category.
There was no significant difference in the proportion of women with recommended
GWG between the two ethnic groups (32.85% in White British women and 34.18% in
Pakistani women, p=0.377). When the Asian specific BMI cut offs were applied for
218
the Pakistani women, the proportion with recommended GWG for their BMI rose
slightly from 34.18% to 35.16% and the ethnic difference remained non-significant
(p=0.363).
High GWG
There were 22.92% of women who had high GWG for their BMI category. This was
significantly lower in Pakistani women compared with White British women (20.40%
in Pakistani women and 26.62% in White British women, p<0.001). However, when
the Asian specific BMI cut offs were applied for the Pakistani women, the proportion
of women with a high level of GWG for their BMI rose to from 20.42% to 27.39%;
higher than that in White British women, although there was no significant difference
(p=0.999).
Comparing ethnic differences in gestational weight gain specific to BMI group
Underweight
When considering only women with an underweight BMI, 64.22% of the population
had low GWG (<12kg) for their BMI. This was higher in Pakistani women (67.52%)
compared with White British women (53.19%), although the difference did not reach
significance (p=0.074). 28.92% of the population with an underweight BMI had
recommended GWG (12.5-18kg). This was lower in Pakistani women (27.39%)
compared with White British women (34.04%), although the difference was not
significant (p=0.378). 6.86% of women with an underweight BMI had high GWG
(>18kg). This was lower in Pakistani women (5.10%) compared with White British
women (12.77%), although the difference did not reach significance (p=0.078).
Recommended weight
When the general population BMI criteria were used to calculate GWG, 53.67% of
women with a recommended BMI had low GWG; this was significantly higher in
Pakistani women compared with White British women (55.43% and 50.75%
respectively, p=0.045). However, when the Asian specific BMI criteria were applied
for the Pakistani population, the difference between the two ethnic groups was no
longer significant (p=0.633). Using general population BMI criteria, Pakistani women
219
with a recommended BMI were significantly less likely to gain weight in the
recommended range compared with White women. However, the difference was no
longer significant when applying the Asian BMI criteria (p=0.324). Using general
population BMI criteria for recommended BMI, there was no difference between
Pakistani and White British women and high GWG; the proportion of Pakistani
women with high GWG increased when applying Asian BMI criteria but there was no
significant difference (p=0.493).
Overweight
When the general population criteria were used to calculate GWG, 34.60% of women
with an overweight BMI had low GWG. This was significantly higher in Pakistani
women compared with White British women (37.87% and 29.70% respectively,
p=0.003). However, when the Asian specific BMI criteria were applied for the
Pakistani population, the difference between the two ethnic groups was no longer
significant (p=0.456). Using the general population BMI criteria, there was no
significant ethnic difference in those gaining weight in the recommended range
(p=0.284). This remained true when applying the Asian specific BMI criteria
(p=0.234). Using general population BMI criteria for recommended BMI, Pakistani
women with an overweight BMI were significantly less likely to gain high GWG
compared with White British women (p<0.001); the proportion of Pakistani women
with high GWG increased when applying Asian BMI criteria but there was no
significant difference (p=0.060).
Obese
When the general population criteria were used to calculate GWG and only women
with a BMI in the obese range were considered, 36.05% of women with an obese
BMI had low GWG. This was not significantly different between the two ethnic groups
(p=0.532). However, when the Asian specific BMI criteria were applied for the
Pakistani population, the percentage with low GWG fell, and there was now a
significant difference between the two ethnic groups (p=0.038). When the general
population criteria were used to calculate GWG, 30.54% of women with an obese
BMI had recommended GWG; this was significantly higher in Pakistani women
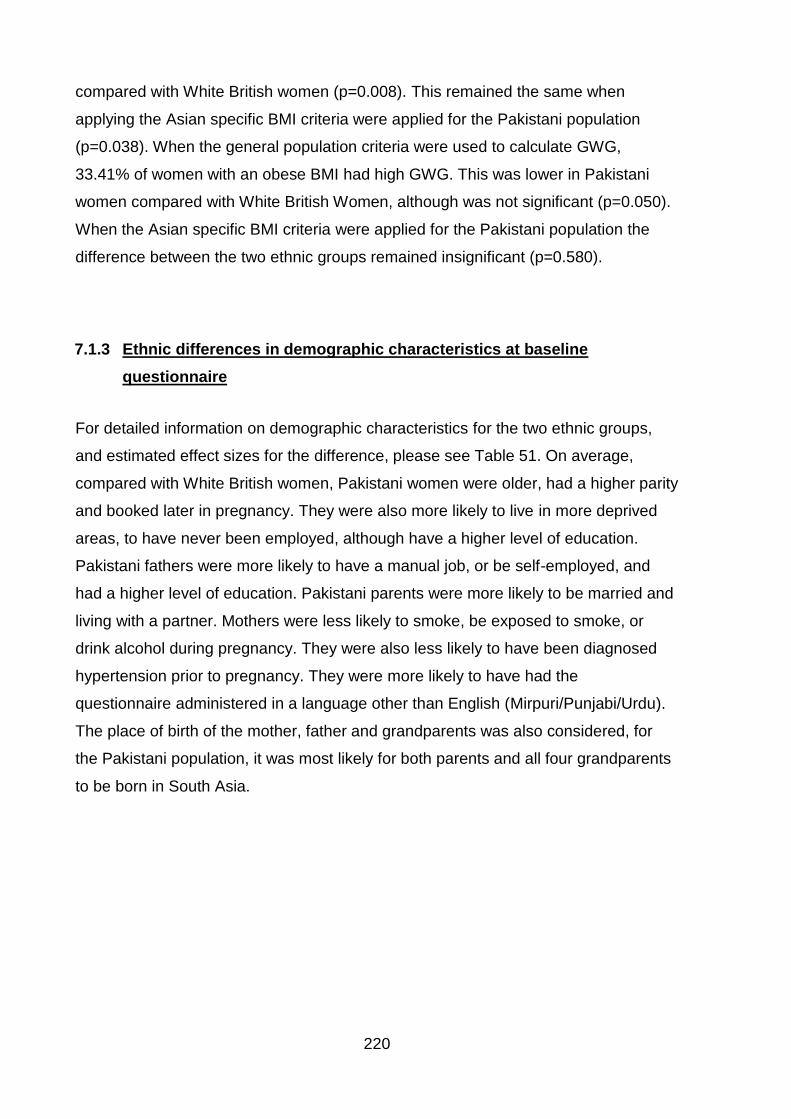
220
compared with White British women (p=0.008). This remained the same when
applying the Asian specific BMI criteria were applied for the Pakistani population
(p=0.038). When the general population criteria were used to calculate GWG,
33.41% of women with an obese BMI had high GWG. This was lower in Pakistani
women compared with White British Women, although was not significant (p=0.050).
When the Asian specific BMI criteria were applied for the Pakistani population the
difference between the two ethnic groups remained insignificant (p=0.580).
7.1.3 Ethnic differences in demographic characteristics at baseline
questionnaire
For detailed information on demographic characteristics for the two ethnic groups,
and estimated effect sizes for the difference, please see Table 51. On average,
compared with White British women, Pakistani women were older, had a higher parity
and booked later in pregnancy. They were also more likely to live in more deprived
areas, to have never been employed, although have a higher level of education.
Pakistani fathers were more likely to have a manual job, or be self-employed, and
had a higher level of education. Pakistani parents were more likely to be married and
living with a partner. Mothers were less likely to smoke, be exposed to smoke, or
drink alcohol during pregnancy. They were also less likely to have been diagnosed
hypertension prior to pregnancy. They were more likely to have had the
questionnaire administered in a language other than English (Mirpuri/Punjabi/Urdu).
The place of birth of the mother, father and grandparents was also considered, for
the Pakistani population, it was most likely for both parents and all four grandparents
to be born in South Asia.
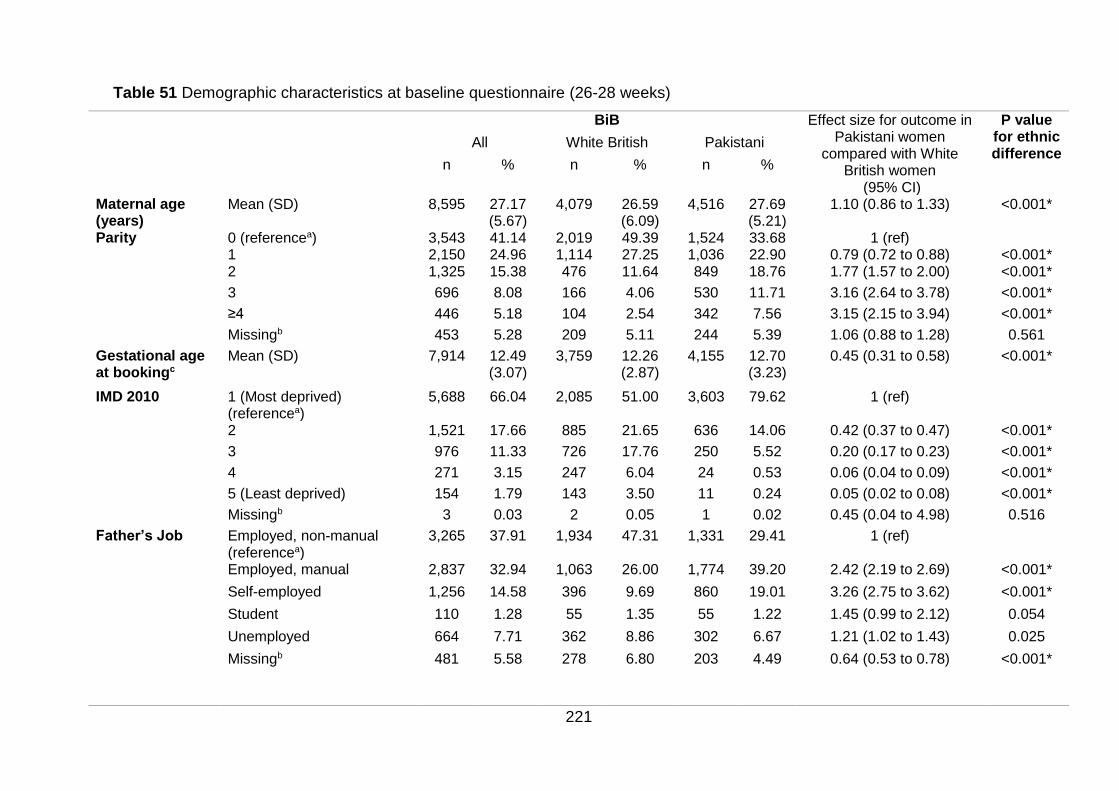
221
Table 51 Demographic characteristics at baseline questionnaire (26-28 weeks)
BiB Effect size for outcome in Pakistani women
compared with White British women
(95% CI)
P value for ethnic difference
All White British Pakistani
n % n % n %
Maternal age (years)
Mean (SD) 8,595 27.17 (5.67)
4,079 26.59 (6.09)
4,516 27.69 (5.21)
1.10 (0.86 to 1.33) <0.001*
Parity 0 (referencea) 3,543 41.14 2,019 49.39 1,524 33.68 1 (ref) 1 2,150 24.96 1,114 27.25 1,036 22.90 0.79 (0.72 to 0.88) <0.001* 2 1,325 15.38 476 11.64 849 18.76 1.77 (1.57 to 2.00) <0.001*
3 696 8.08 166 4.06 530 11.71 3.16 (2.64 to 3.78) <0.001*
≥4 446 5.18 104 2.54 342 7.56 3.15 (2.15 to 3.94) <0.001*
Missingb 453 5.28 209 5.11 244 5.39 1.06 (0.88 to 1.28) 0.561
Gestational age at bookingc
Mean (SD) 7,914 12.49 (3.07)
3,759 12.26 (2.87)
4,155 12.70 (3.23)
0.45 (0.31 to 0.58)
<0.001*
IMD 2010 1 (Most deprived) (referencea)
5,688 66.04 2,085 51.00 3,603 79.62 1 (ref)
2 1,521 17.66 885 21.65 636 14.06 0.42 (0.37 to 0.47) <0.001*
3 976 11.33 726 17.76 250 5.52 0.20 (0.17 to 0.23) <0.001*
4 271 3.15 247 6.04 24 0.53 0.06 (0.04 to 0.09) <0.001*
5 (Least deprived) 154 1.79 143 3.50 11 0.24 0.05 (0.02 to 0.08) <0.001*
Missingb 3 0.03 2 0.05 1 0.02 0.45 (0.04 to 4.98) 0.516
Father’s Job Employed, non-manual (referencea)
3,265 37.91 1,934 47.31 1,331 29.41 1 (ref)
Employed, manual 2,837 32.94 1,063 26.00 1,774 39.20 2.42 (2.19 to 2.69) <0.001*
Self-employed 1,256 14.58 396 9.69 860 19.01 3.26 (2.75 to 3.62) <0.001*
Student 110 1.28 55 1.35 55 1.22 1.45 (0.99 to 2.12) 0.054
Unemployed 664 7.71 362 8.86 302 6.67 1.21 (1.02 to 1.43) 0.025
Missingb 481 5.58 278 6.80 203 4.49 0.64 (0.53 to 0.78) <0.001*
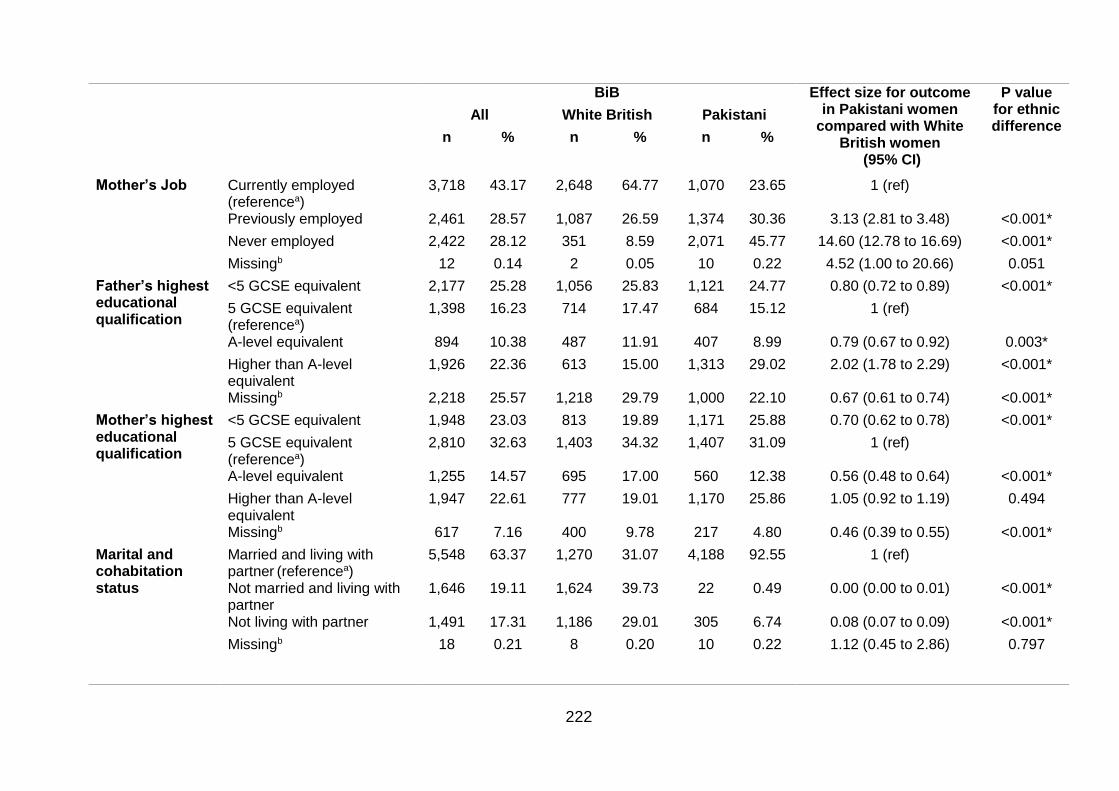
222
BiB Effect size for outcome in Pakistani women
compared with White British women
(95% CI)
P value for ethnic difference
All White British Pakistani
n % n % n %
Mother’s Job Currently employed (referencea)
3,718 43.17 2,648 64.77 1,070 23.65 1 (ref)
Previously employed 2,461 28.57 1,087 26.59 1,374 30.36 3.13 (2.81 to 3.48) <0.001*
Never employed 2,422 28.12 351 8.59 2,071 45.77 14.60 (12.78 to 16.69) <0.001*
Missingb 12 0.14 2 0.05 10 0.22 4.52 (1.00 to 20.66) 0.051
Father’s highest educational qualification
<5 GCSE equivalent 2,177 25.28 1,056 25.83 1,121 24.77 0.80 (0.72 to 0.89) <0.001*
5 GCSE equivalent
(referencea) 1,398 16.23 714 17.47 684 15.12 1 (ref)
A-level equivalent 894 10.38 487 11.91 407 8.99 0.79 (0.67 to 0.92) 0.003*
Higher than A-level equivalent
1,926 22.36 613 15.00 1,313 29.02 2.02 (1.78 to 2.29) <0.001*
Missingb 2,218 25.57 1,218 29.79 1,000 22.10 0.67 (0.61 to 0.74) <0.001*
Mother’s highest educational qualification
<5 GCSE equivalent 1,948 23.03 813 19.89 1,171 25.88 0.70 (0.62 to 0.78) <0.001*
5 GCSE equivalent (referencea)
2,810 32.63 1,403 34.32 1,407 31.09 1 (ref)
A-level equivalent 1,255 14.57 695 17.00 560 12.38 0.56 (0.48 to 0.64) <0.001*
Higher than A-level equivalent
1,947 22.61 777 19.01 1,170 25.86 1.05 (0.92 to 1.19) 0.494
Missingb 617 7.16 400 9.78 217 4.80 0.46 (0.39 to 0.55) <0.001*
Marital and cohabitation status
Married and living with partner (referencea)
5,548 63.37 1,270 31.07 4,188 92.55 1 (ref)
Not married and living with partner
1,646 19.11 1,624 39.73 22 0.49 0.00 (0.00 to 0.01) <0.001*
Not living with partner 1,491 17.31 1,186 29.01 305 6.74 0.08 (0.07 to 0.09) <0.001*
Missingb
18 0.21 8 0.20 10 0.22 1.12 (0.45 to 2.86) 0.797
223
BiB Effect size for outcome in Pakistani women
compared with White British women
(95% CI)
P value for ethnic difference
All White British Pakistani
n % n % n %
Mother drank alcohol during pregnancy
No (referencea) 5,782 67.13 1,285 31.43 4,497 99.38 1 (ref)
Yes 2,811 32.64 2,796 68.40 15 0.33 0.00 (0.00 to 0.00) <0.001*
Missingb 20 0.23 7 0.17 13 0.29 1.68 (0.67 to 4.21) 0.269
Mother smoked during pregnancy
No (referencea) 7,054 81.90 2,699 66.02 4,355 96.24 1 (ref)
Yes 1,545 17.94 1,386 33.90 159 3.51 0.07 (0.06 to 0.08) <0.001*
Missingb 14 0.16 3 0.07 11 0.24 3.32 (0.93 to 11.90) 0.066
Mother exposed to smoke during pregnancy
No (referencea) 5,683 65.98 2,304 56.36 3,378 74.67 1 (ref) Yes 2,881 33.45 1,769 43.27 1,112 24.57 0.43 (0.39 to 0.47) <0.001*
Missingb 49 0.57 15 0.37 34 0.75 2.05 (1.12 to 3.78) 0.020*
Diabetes prior to pregnancy (Type I or II)
No (referencea) 8,118 94.26 3,840 93.93 4,278 94.54 1 (ref)
Yes 27 0.31 15 0.37 12 0.27 0.72 (0.34 to 1.54) 0.393
Missingb 468 5.43 233 5.70 235 5.19 0.91 (0.75 to 1.09) 0.301
Pre-existing hypertension
No (referencea) 8,056 93.53 3,804 93.05 4,252 93.97 1.63 (1.04 to 2.54) 0.032
Yes 81 0.94 48 1.17 33 0.73 0.62 (0.39 to 0.96) 0.032
Missingb 476 5.53 236 5.77 240 5.30 0.91 (0.76 to 1.10) 0.342 Language used to administer questionnaire
English (referencea) 6,910 80.23 4,077 99.73 2,833 62.61 1 (ref)
Mirpuri/Punjabi/Urdu 1,673 19.42 2 0.05 1,671 36.93 1202.37 (300.21 to 4815.60)
<0.001*
Missingb 30 0.35 9 0.22 21 0.46 2.11 (0.97 to 4.61) 0.061
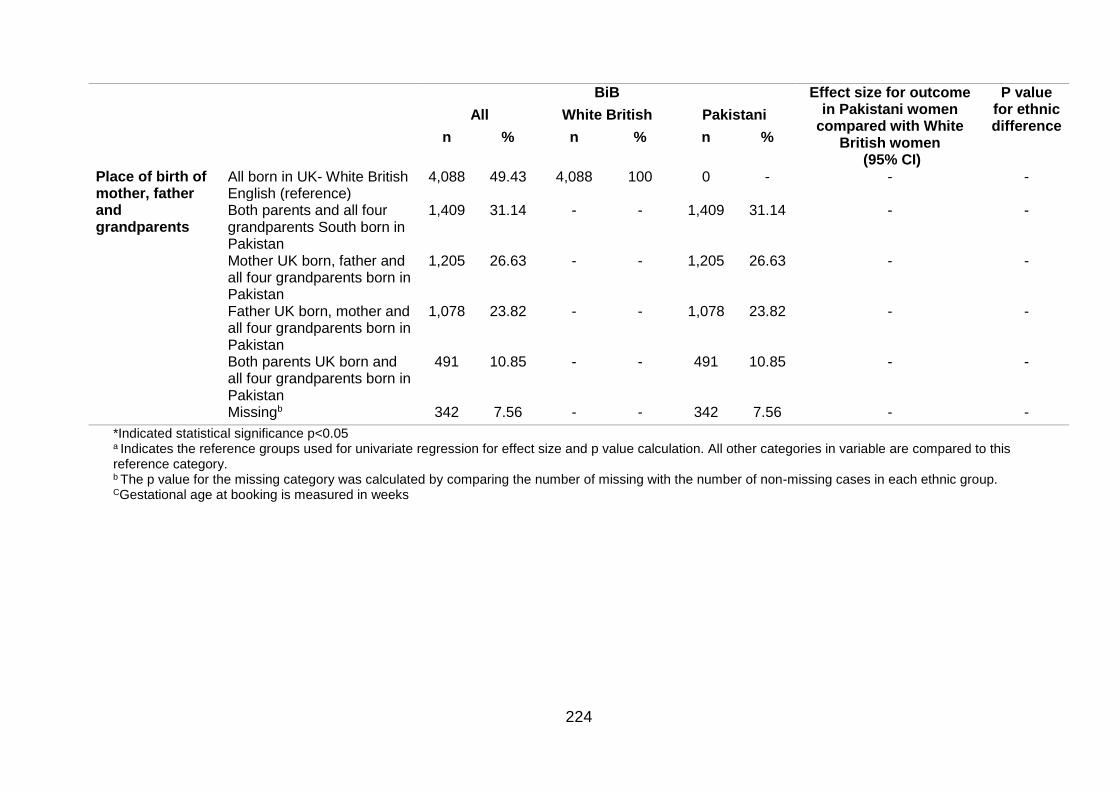
224
BiB Effect size for outcome in Pakistani women
compared with White British women
(95% CI)
P value for ethnic difference
All White British Pakistani
n % n % n %
Place of birth of mother, father and grandparents
All born in UK- White British English (reference)
4,088 49.43 4,088 100 0 - - -
Both parents and all four grandparents South born in Pakistan
1,409 31.14 - - 1,409 31.14 - -
Mother UK born, father and all four grandparents born in Pakistan
1,205 26.63 - - 1,205 26.63 - -
Father UK born, mother and all four grandparents born in Pakistan
1,078 23.82 - - 1,078 23.82 - -
Both parents UK born and all four grandparents born in Pakistan
491 10.85 - - 491 10.85 - -
Missingb 342 7.56 - - 342 7.56 - -
*Indicated statistical significance p<0.05 a Indicates the reference groups used for univariate regression for effect size and p value calculation. All other categories in variable are compared to this reference category. b The p value for the missing category was calculated by comparing the number of missing with the number of non-missing cases in each ethnic group. CGestational age at booking is measured in weeks
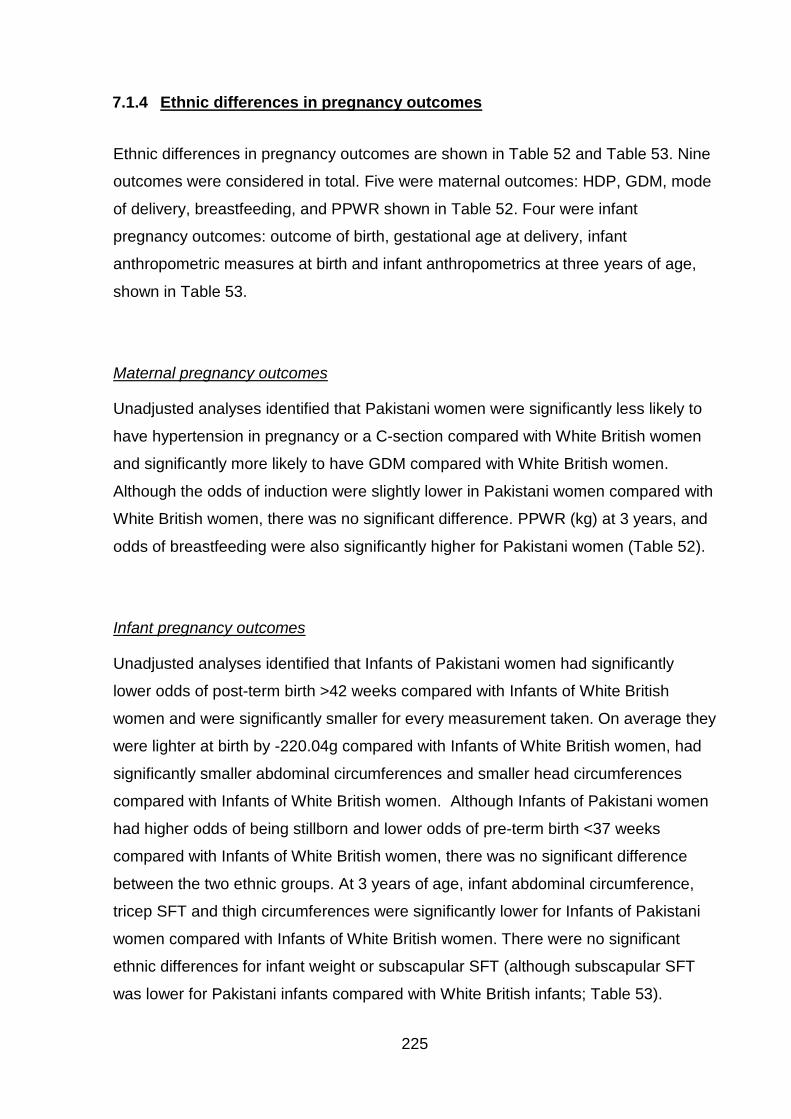
225
7.1.4 Ethnic differences in pregnancy outcomes
Ethnic differences in pregnancy outcomes are shown in Table 52 and Table 53. Nine
outcomes were considered in total. Five were maternal outcomes: HDP, GDM, mode
of delivery, breastfeeding, and PPWR shown in Table 52. Four were infant
pregnancy outcomes: outcome of birth, gestational age at delivery, infant
anthropometric measures at birth and infant anthropometrics at three years of age,
shown in Table 53.
Maternal pregnancy outcomes
Unadjusted analyses identified that Pakistani women were significantly less likely to
have hypertension in pregnancy or a C-section compared with White British women
and significantly more likely to have GDM compared with White British women.
Although the odds of induction were slightly lower in Pakistani women compared with
White British women, there was no significant difference. PPWR (kg) at 3 years, and
odds of breastfeeding were also significantly higher for Pakistani women (Table 52).
Infant pregnancy outcomes
Unadjusted analyses identified that Infants of Pakistani women had significantly
lower odds of post-term birth >42 weeks compared with Infants of White British
women and were significantly smaller for every measurement taken. On average they
were lighter at birth by -220.04g compared with Infants of White British women, had
significantly smaller abdominal circumferences and smaller head circumferences
compared with Infants of White British women. Although Infants of Pakistani women
had higher odds of being stillborn and lower odds of pre-term birth <37 weeks
compared with Infants of White British women, there was no significant difference
between the two ethnic groups. At 3 years of age, infant abdominal circumference,
tricep SFT and thigh circumferences were significantly lower for Infants of Pakistani
women compared with Infants of White British women. There were no significant
ethnic differences for infant weight or subscapular SFT (although subscapular SFT
was lower for Pakistani infants compared with White British infants; Table 53).
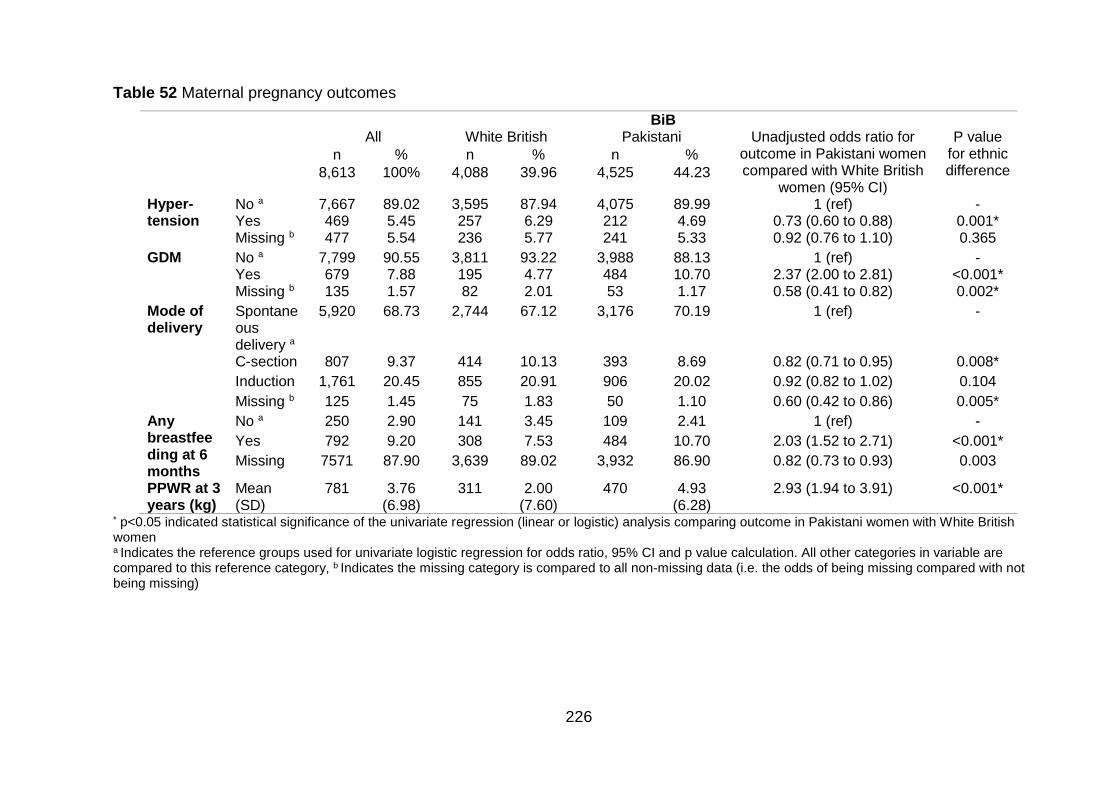
226
Table 52 Maternal pregnancy outcomes
BiB All White British Pakistani Unadjusted odds ratio for
outcome in Pakistani women compared with White British
women (95% CI)
P value for ethnic difference
n % n % n %
8,613 100% 4,088 39.96 4,525 44.23
Hyper-tension
No a 7,667 89.02 3,595 87.94 4,075 89.99 1 (ref) - Yes 469 5.45 257 6.29 212 4.69 0.73 (0.60 to 0.88) 0.001* Missing b 477 5.54 236 5.77 241 5.33 0.92 (0.76 to 1.10) 0.365
GDM No a 7,799 90.55 3,811 93.22 3,988 88.13 1 (ref) - Yes 679 7.88 195 4.77 484 10.70 2.37 (2.00 to 2.81) <0.001* Missing b 135 1.57 82 2.01 53 1.17 0.58 (0.41 to 0.82) 0.002*
Mode of delivery
Spontaneous delivery a
5,920 68.73 2,744 67.12 3,176 70.19 1 (ref) -
C-section 807 9.37 414 10.13 393 8.69 0.82 (0.71 to 0.95) 0.008*
Induction 1,761 20.45 855 20.91 906 20.02 0.92 (0.82 to 1.02) 0.104
Missing b 125 1.45 75 1.83 50 1.10 0.60 (0.42 to 0.86) 0.005*
Any breastfeeding at 6 months
No a 250 2.90 141 3.45 109 2.41 1 (ref) -
Yes 792 9.20 308 7.53 484 10.70 2.03 (1.52 to 2.71) <0.001*
Missing 7571 87.90 3,639 89.02 3,932 86.90 0.82 (0.73 to 0.93) 0.003
PPWR at 3 years (kg)
Mean (SD)
781 3.76 (6.98)
311 2.00 (7.60)
470 4.93 (6.28)
2.93 (1.94 to 3.91) <0.001*
* p<0.05 indicated statistical significance of the univariate regression (linear or logistic) analysis comparing outcome in Pakistani women with White British women a Indicates the reference groups used for univariate logistic regression for odds ratio, 95% CI and p value calculation. All other categories in variable are compared to this reference category, b Indicates the missing category is compared to all non-missing data (i.e. the odds of being missing compared with not being missing)
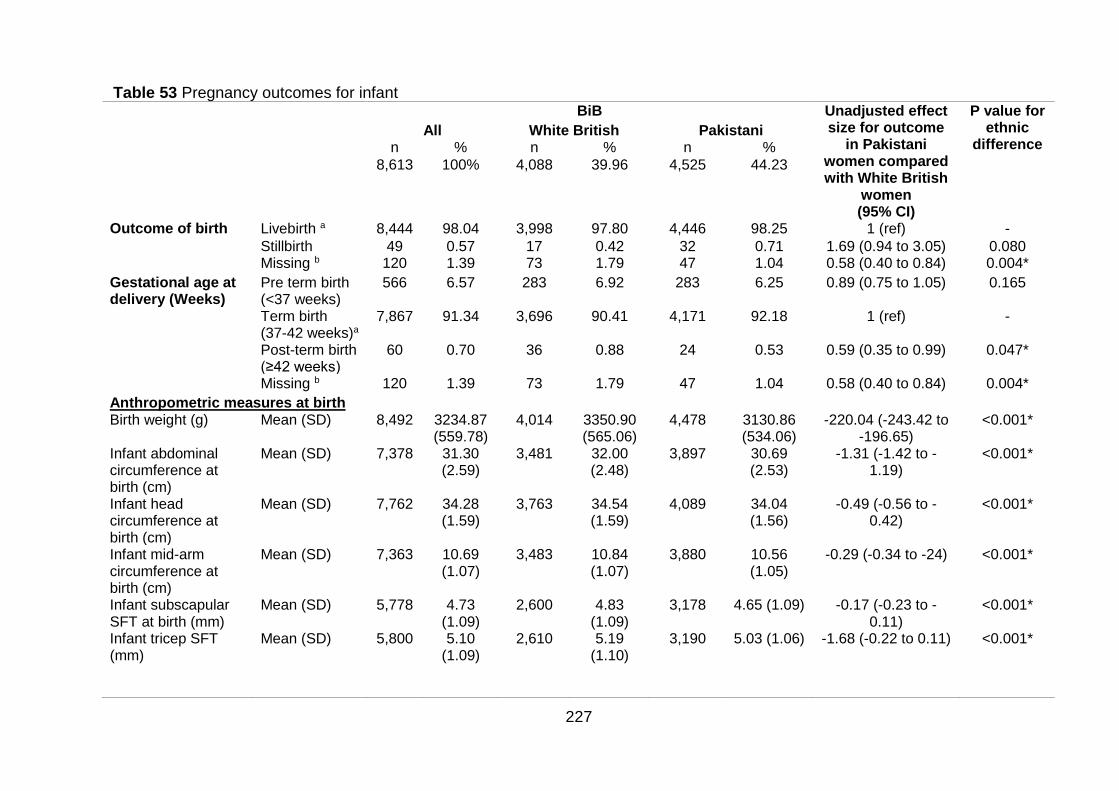
227
Table 53 Pregnancy outcomes for infant BiB Unadjusted effect
size for outcome in Pakistani
women compared with White British
women (95% CI)
P value for ethnic
difference All White British Pakistani
n % n % n %
8,613 100% 4,088 39.96 4,525 44.23
Outcome of birth Livebirth a 8,444 98.04 3,998 97.80 4,446 98.25 1 (ref) -
Stillbirth 49 0.57 17 0.42 32 0.71 1.69 (0.94 to 3.05) 0.080 Missing b 120 1.39 73 1.79 47 1.04 0.58 (0.40 to 0.84) 0.004*
Gestational age at delivery (Weeks)
Pre term birth (<37 weeks)
566 6.57 283 6.92 283 6.25 0.89 (0.75 to 1.05) 0.165
Term birth (37-42 weeks)a
7,867 91.34 3,696 90.41 4,171 92.18 1 (ref) -
Post-term birth (≥42 weeks)
60 0.70 36 0.88 24 0.53 0.59 (0.35 to 0.99) 0.047*
Missing b 120 1.39 73 1.79 47 1.04 0.58 (0.40 to 0.84) 0.004*
Anthropometric measures at birth Birth weight (g) Mean (SD) 8,492 3234.87
(559.78) 4,014 3350.90
(565.06) 4,478 3130.86
(534.06) -220.04 (-243.42 to
-196.65) <0.001*
Infant abdominal circumference at birth (cm)
Mean (SD) 7,378 31.30 (2.59)
3,481 32.00 (2.48)
3,897 30.69 (2.53)
-1.31 (-1.42 to -1.19)
<0.001*
Infant head circumference at birth (cm)
Mean (SD) 7,762 34.28 (1.59)
3,763 34.54 (1.59)
4,089 34.04 (1.56)
-0.49 (-0.56 to -0.42)
<0.001*
Infant mid-arm circumference at birth (cm)
Mean (SD) 7,363 10.69 (1.07)
3,483 10.84 (1.07)
3,880 10.56 (1.05)
-0.29 (-0.34 to -24) <0.001*
Infant subscapular SFT at birth (mm)
Mean (SD) 5,778 4.73 (1.09)
2,600 4.83 (1.09)
3,178 4.65 (1.09) -0.17 (-0.23 to -0.11)
<0.001*
Infant tricep SFT (mm)
Mean (SD) 5,800 5.10 (1.09)
2,610 5.19 (1.10)
3,190 5.03 (1.06) -1.68 (-0.22 to 0.11) <0.001*
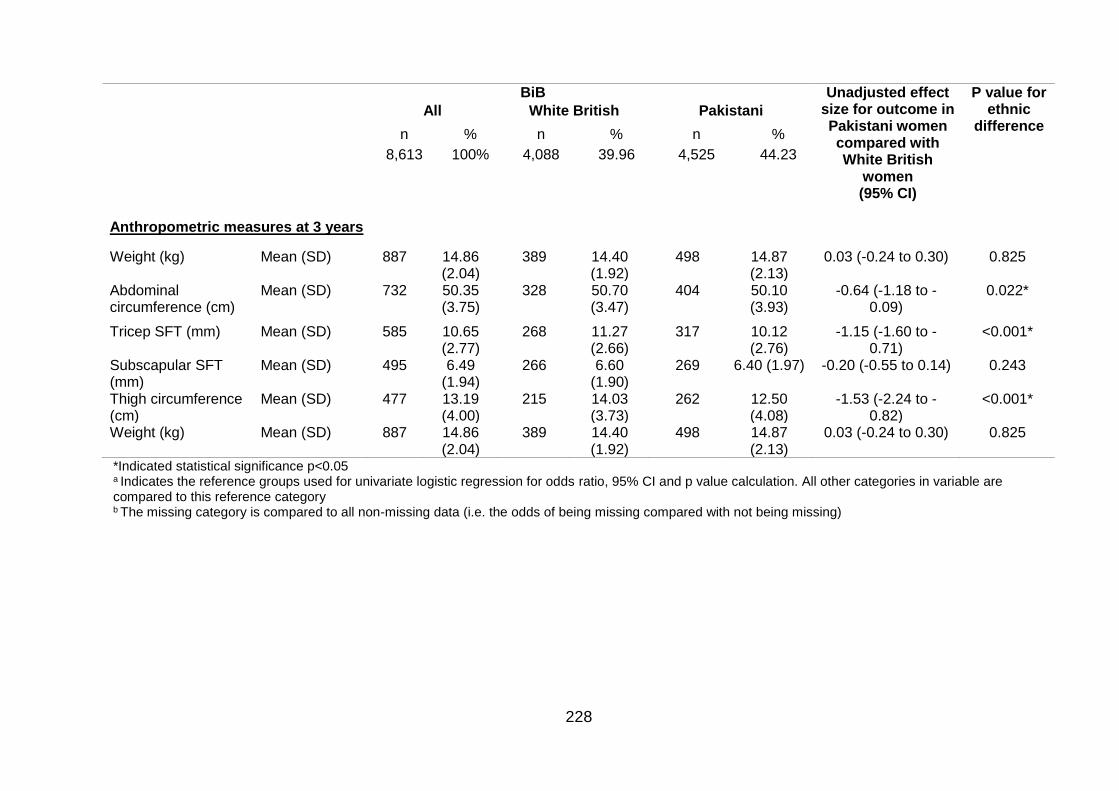
228
BiB Unadjusted effect size for outcome in Pakistani women compared with White British
women (95% CI)
P value for ethnic
difference All White British Pakistani
n % n % n %
8,613 100% 4,088 39.96 4,525 44.23
Anthropometric measures at 3 years
Weight (kg) Mean (SD) 887 14.86 (2.04)
389 14.40 (1.92)
498 14.87 (2.13)
0.03 (-0.24 to 0.30) 0.825
Abdominal circumference (cm)
Mean (SD) 732
50.35 (3.75)
328 50.70 (3.47)
404 50.10 (3.93)
-0.64 (-1.18 to -0.09)
0.022*
Tricep SFT (mm) Mean (SD) 585 10.65 (2.77)
268 11.27 (2.66)
317 10.12 (2.76)
-1.15 (-1.60 to -0.71)
<0.001*
Subscapular SFT (mm)
Mean (SD) 495 6.49 (1.94)
266 6.60 (1.90)
269 6.40 (1.97) -0.20 (-0.55 to 0.14) 0.243
Thigh circumference (cm)
Mean (SD) 477 13.19 (4.00)
215
14.03 (3.73)
262
12.50 (4.08)
-1.53 (-2.24 to -0.82)
<0.001*
Weight (kg) Mean (SD) 887 14.86 (2.04)
389 14.40 (1.92)
498 14.87 (2.13)
0.03 (-0.24 to 0.30) 0.825
*Indicated statistical significance p<0.05 a Indicates the reference groups used for univariate logistic regression for odds ratio, 95% CI and p value calculation. All other categories in variable are compared to this reference category b The missing category is compared to all non-missing data (i.e. the odds of being missing compared with not being missing)
229
7.1.5 Exploring the association between maternal body mass index,
gestational weight gain and antenatal pregnancy outcomes in Pakistani
and White women
Table 54 shows results for maternal BMI as the exposure, and Table 55 shows
results for early GWG as the exposure (weight at booking to weight at baseline
questionnaire)
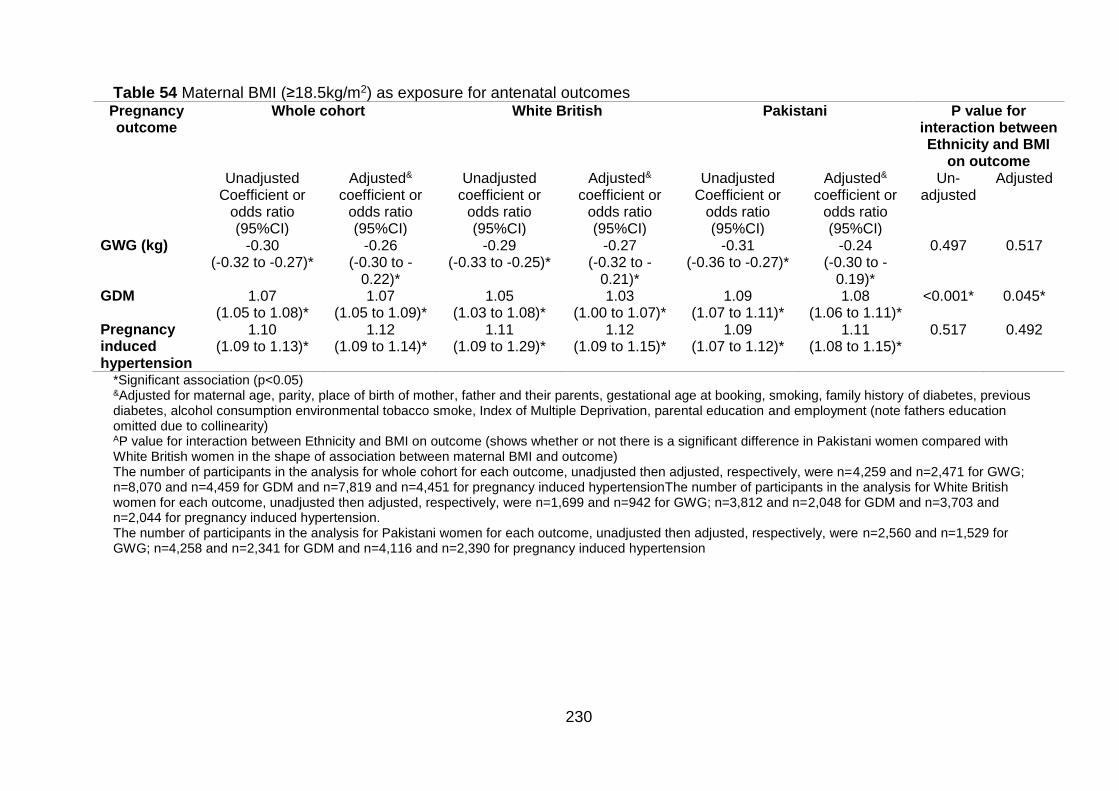
230
Table 54 Maternal BMI (≥18.5kg/m2) as exposure for antenatal outcomes Pregnancy outcome
Whole cohort White British Pakistani P value for interaction between Ethnicity and BMI
on outcome Unadjusted
Coefficient or odds ratio (95%CI)
Adjusted& coefficient or
odds ratio (95%CI)
Unadjusted coefficient or
odds ratio (95%CI)
Adjusted& coefficient or
odds ratio (95%CI)
Unadjusted Coefficient or
odds ratio (95%CI)
Adjusted&
coefficient or odds ratio (95%CI)
Un-adjusted
Adjusted
GWG (kg) -0.30 (-0.32 to -0.27)*
-0.26 (-0.30 to -
0.22)*
-0.29 (-0.33 to -0.25)*
-0.27 (-0.32 to -
0.21)*
-0.31 (-0.36 to -0.27)*
-0.24 (-0.30 to -
0.19)*
0.497 0.517
GDM
1.07 (1.05 to 1.08)*
1.07 (1.05 to 1.09)*
1.05 (1.03 to 1.08)*
1.03 (1.00 to 1.07)*
1.09 (1.07 to 1.11)*
1.08 (1.06 to 1.11)*
<0.001* 0.045*
Pregnancy induced hypertension
1.10 (1.09 to 1.13)*
1.12 (1.09 to 1.14)*
1.11 (1.09 to 1.29)*
1.12 (1.09 to 1.15)*
1.09 (1.07 to 1.12)*
1.11 (1.08 to 1.15)*
0.517 0.492
*Significant association (p<0.05) &Adjusted for maternal age, parity, place of birth of mother, father and their parents, gestational age at booking, smoking, family history of diabetes, previous diabetes, alcohol consumption environmental tobacco smoke, Index of Multiple Deprivation, parental education and employment (note fathers education omitted due to collinearity) AP value for interaction between Ethnicity and BMI on outcome (shows whether or not there is a significant difference in Pakistani women compared with White British women in the shape of association between maternal BMI and outcome) The number of participants in the analysis for whole cohort for each outcome, unadjusted then adjusted, respectively, were n=4,259 and n=2,471 for GWG; n=8,070 and n=4,459 for GDM and n=7,819 and n=4,451 for pregnancy induced hypertensionThe number of participants in the analysis for White British women for each outcome, unadjusted then adjusted, respectively, were n=1,699 and n=942 for GWG; n=3,812 and n=2,048 for GDM and n=3,703 and n=2,044 for pregnancy induced hypertension. The number of participants in the analysis for Pakistani women for each outcome, unadjusted then adjusted, respectively, were n=2,560 and n=1,529 for GWG; n=4,258 and n=2,341 for GDM and n=4,116 and n=2,390 for pregnancy induced hypertension
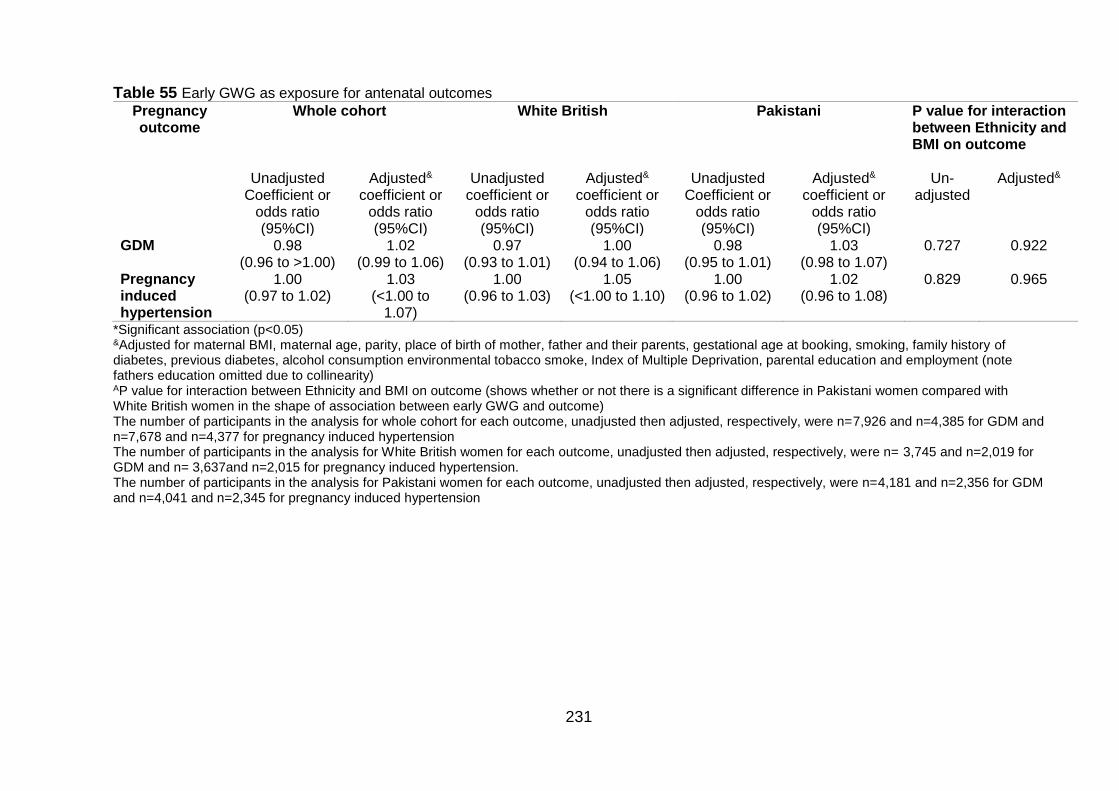
231
Table 55 Early GWG as exposure for antenatal outcomes
Pregnancy outcome
Whole cohort White British Pakistani P value for interaction between Ethnicity and BMI on outcome
Unadjusted
Coefficient or odds ratio (95%CI)
Adjusted& coefficient or
odds ratio (95%CI)
Unadjusted coefficient or
odds ratio (95%CI)
Adjusted& coefficient or
odds ratio (95%CI)
Unadjusted Coefficient or
odds ratio (95%CI)
Adjusted& coefficient or
odds ratio (95%CI)
Un-adjusted
Adjusted&
GDM 0.98 (0.96 to >1.00)
1.02 (0.99 to 1.06)
0.97 (0.93 to 1.01)
1.00 (0.94 to 1.06)
0.98 (0.95 to 1.01)
1.03 (0.98 to 1.07)
0.727 0.922
Pregnancy induced hypertension
1.00 (0.97 to 1.02)
1.03 (<1.00 to
1.07)
1.00 (0.96 to 1.03)
1.05 (<1.00 to 1.10)
1.00 (0.96 to 1.02)
1.02 (0.96 to 1.08)
0.829 0.965
*Significant association (p<0.05) &Adjusted for maternal BMI, maternal age, parity, place of birth of mother, father and their parents, gestational age at booking, smoking, family history of diabetes, previous diabetes, alcohol consumption environmental tobacco smoke, Index of Multiple Deprivation, parental education and employment (note fathers education omitted due to collinearity) AP value for interaction between Ethnicity and BMI on outcome (shows whether or not there is a significant difference in Pakistani women compared with White British women in the shape of association between early GWG and outcome) The number of participants in the analysis for whole cohort for each outcome, unadjusted then adjusted, respectively, were n=7,926 and n=4,385 for GDM and n=7,678 and n=4,377 for pregnancy induced hypertension The number of participants in the analysis for White British women for each outcome, unadjusted then adjusted, respectively, were n= 3,745 and n=2,019 for GDM and n= 3,637and n=2,015 for pregnancy induced hypertension. The number of participants in the analysis for Pakistani women for each outcome, unadjusted then adjusted, respectively, were n=4,181 and n=2,356 for GDM and n=4,041 and n=2,345 for pregnancy induced hypertension
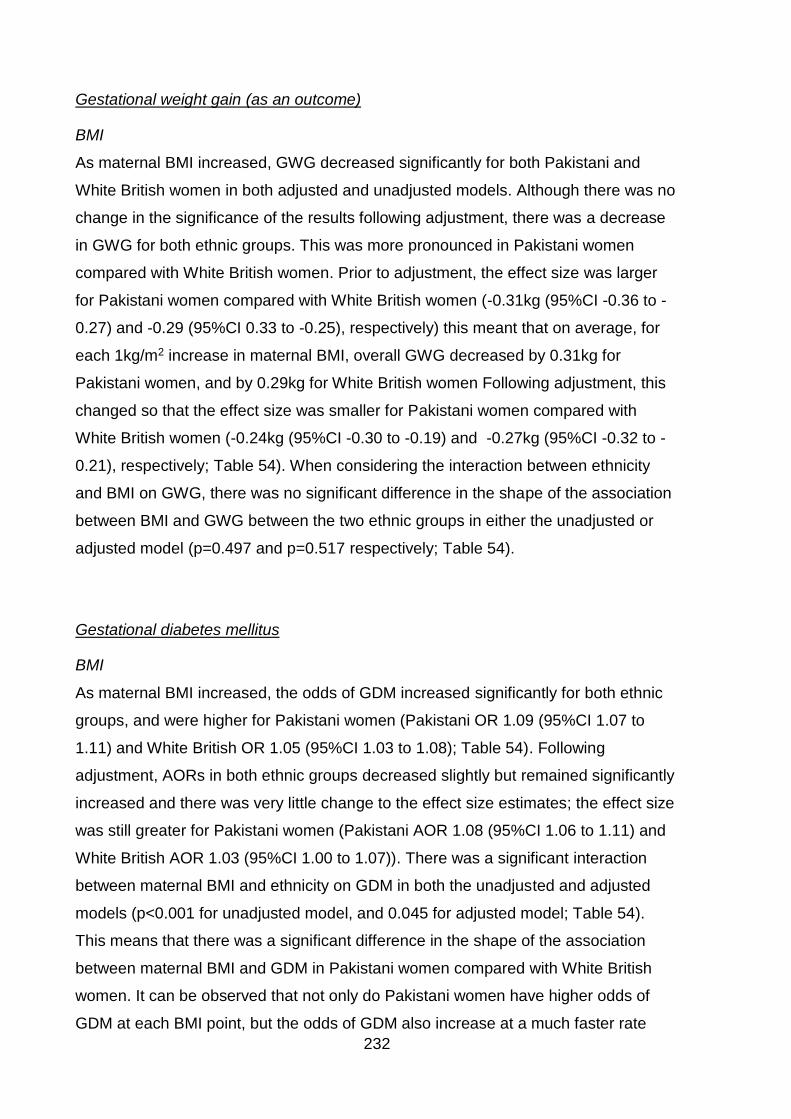
232
Gestational weight gain (as an outcome)
BMI
As maternal BMI increased, GWG decreased significantly for both Pakistani and
White British women in both adjusted and unadjusted models. Although there was no
change in the significance of the results following adjustment, there was a decrease
in GWG for both ethnic groups. This was more pronounced in Pakistani women
compared with White British women. Prior to adjustment, the effect size was larger
for Pakistani women compared with White British women (-0.31kg (95%CI -0.36 to -
0.27) and -0.29 (95%CI 0.33 to -0.25), respectively) this meant that on average, for
each 1kg/m2 increase in maternal BMI, overall GWG decreased by 0.31kg for
Pakistani women, and by 0.29kg for White British women Following adjustment, this
changed so that the effect size was smaller for Pakistani women compared with
White British women (-0.24kg (95%CI -0.30 to -0.19) and -0.27kg (95%CI -0.32 to -
0.21), respectively; Table 54). When considering the interaction between ethnicity
and BMI on GWG, there was no significant difference in the shape of the association
between BMI and GWG between the two ethnic groups in either the unadjusted or
adjusted model (p=0.497 and p=0.517 respectively; Table 54).
Gestational diabetes mellitus
BMI
As maternal BMI increased, the odds of GDM increased significantly for both ethnic
groups, and were higher for Pakistani women (Pakistani OR 1.09 (95%CI 1.07 to
1.11) and White British OR 1.05 (95%CI 1.03 to 1.08); Table 54). Following
adjustment, AORs in both ethnic groups decreased slightly but remained significantly
increased and there was very little change to the effect size estimates; the effect size
was still greater for Pakistani women (Pakistani AOR 1.08 (95%CI 1.06 to 1.11) and
White British AOR 1.03 (95%CI 1.00 to 1.07)). There was a significant interaction
between maternal BMI and ethnicity on GDM in both the unadjusted and adjusted
models (p<0.001 for unadjusted model, and 0.045 for adjusted model; Table 54).
This means that there was a significant difference in the shape of the association
between maternal BMI and GDM in Pakistani women compared with White British
women. It can be observed that not only do Pakistani women have higher odds of
GDM at each BMI point, but the odds of GDM also increase at a much faster rate
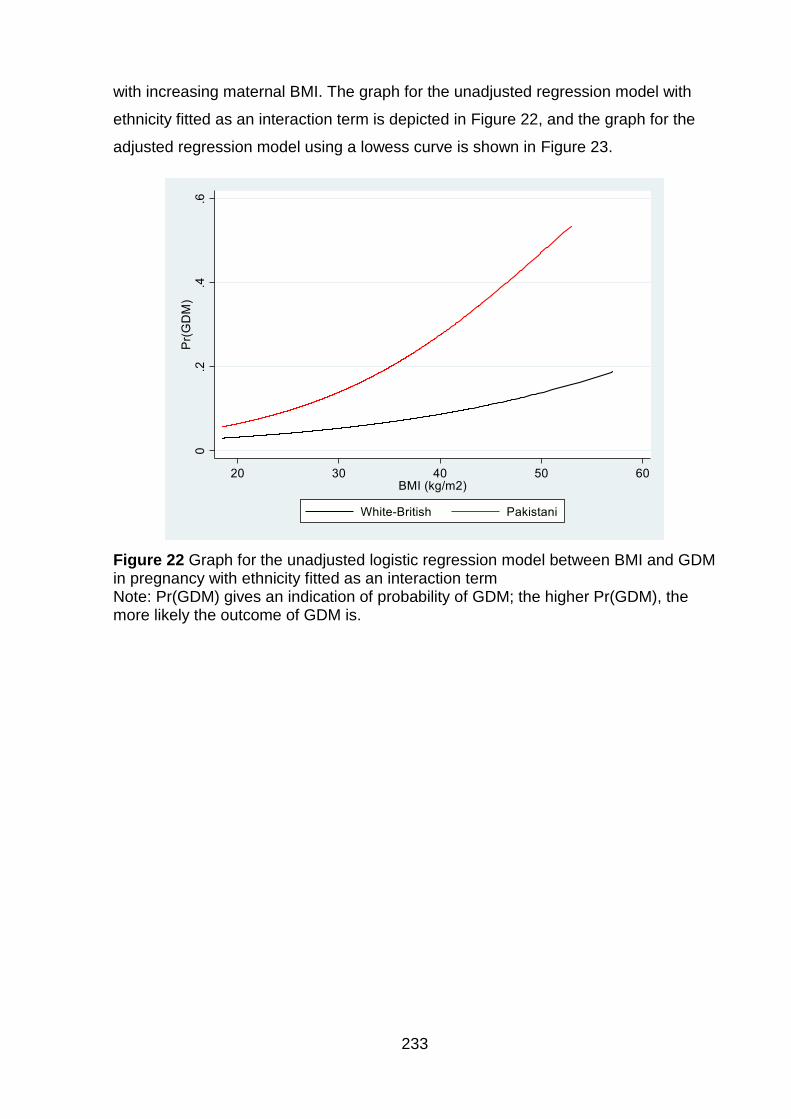
233
with increasing maternal BMI. The graph for the unadjusted regression model with
ethnicity fitted as an interaction term is depicted in Figure 22, and the graph for the
adjusted regression model using a lowess curve is shown in Figure 23.
Figure 22 Graph for the unadjusted logistic regression model between BMI and GDM in pregnancy with ethnicity fitted as an interaction term Note: Pr(GDM) gives an indication of probability of GDM; the higher Pr(GDM), the more likely the outcome of GDM is.
234
Figure 23 Two-way lowess smoother plot for the adjusted regression model between BMI and GDM with ethnicity fitted as an interaction term Note: Pr(GDM) gives an indication of probability of GDM; the higher Pr(GDM), the more likely the outcome of GDM is.
Early GWG
Early GWG was not significantly associated with GDM in either ethnic group, and
there were very little difference in effect sizes between the two groups (OR 0.98
(95%CI 0.95 to 1.01) for Pakistani women and OR 0.97 (95%CI 0.93 to 1.01)).
Following adjustment, odds increased slightly for both ethnic groups but remained
non-significant, and effect sizes remained similar for the two ethnic groups (AOR
1.03 (95%CI 0.98 to 1.07) for Pakistani women and AOR 1.00 (95%CI 0.94 to 1.06)
for White British women). For both unadjusted and adjusted results, although not
significant, the effect size was very slightly greater for Pakistani women, but the
difference in odds was very small. When considering the interaction between
ethnicity and early GWG on GDM, there was no significant difference between the
shape of the association between GWG on GDM in the two ethnic groups in either
the unadjusted or adjusted model (p=0.727 and p=0.922, respectively; Table 55).
235
Pregnancy induced hypertension
BMI
With an increase in maternal BMI, odds of pregnancy induced hypertension
increased significantly for both ethnic groups (OR 1.09 (95%CI 1.07 to 1.12) for
Pakistani women and OR 1.11 (95%CI 1.09 to 1.29) for White British women).
Although these odds increased slightly following adjustment (AOR 1.11 (95%CI 1.0
to 1.15) for Pakistani women and OR 1.12 (95%CI 1.09 to 1.15) for White British
women), the significance and direction of the associations remained the same.
Overall, in both unadjusted and adjusted analysis, odds of pregnancy induced
hypertension associated with a 1kg/m2 increase in maternal BMI were very slightly
lower for Pakistani women than White British women, but the difference in odds was
very small. When considering the interaction between ethnicity and BMI on
pregnancy induced hypertension, there was no significant difference between the
shape of the association between BMI and pregnancy induced hypertension in the
two ethnic groups in either the unadjusted or adjusted model (p=0.517 and p=0.492,
respectively; Table 54).
Early GWG
Early GWG was not significantly associated with pregnancy induced hypertension in
either ethnic group in either the unadjusted (OR 1.00 (95%CI 0.96 to 1.02) for
Pakistani women and OR 1.00 (95%CI 0.96 to 1.03) for White British women) or
adjusted models (AOR 1.02 (95%CI 0.96 to 1.08) for Pakistani women and AOR 1.05
(95%CI <1.00 to 1.10) for White British women). Overall, the effect size was slightly
smaller for Pakistani women meaning that the odds of hypertensive disorders of
pregnancy associated with a 1kg increase in early GWG were lower for Pakistani
than for White British women. However, when considering the interaction between
ethnicity and early GWG on pregnancy induced hypertension, there was no
significant difference between the shape of the association between GWG on GDM
in the two ethnic groups in either the unadjusted or adjusted model (p=0.829 and
p=0.965, respectively; Table 55).
236
7.1.6 Exploring the association between maternal body mass index, gestational
weight gain and pregnancy outcomes for mother and infant in Pakistani
and White women: Maternal outcomes
Table 56 shows results for maternal BMI as the exposure, and Table 57 shows
results for GWG as the exposure.
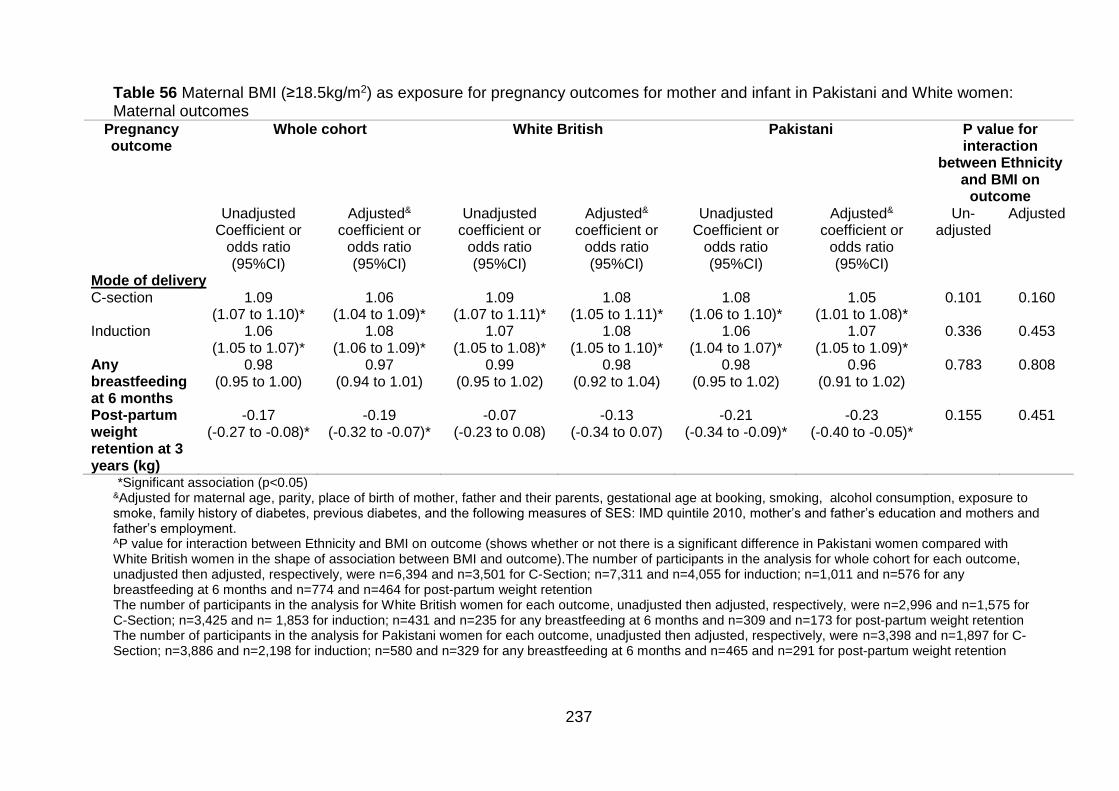
237
Table 56 Maternal BMI (≥18.5kg/m2) as exposure for pregnancy outcomes for mother and infant in Pakistani and White women: Maternal outcomes
Pregnancy outcome
Whole cohort White British Pakistani P value for interaction
between Ethnicity and BMI on
outcome Unadjusted
Coefficient or odds ratio (95%CI)
Adjusted& coefficient or
odds ratio (95%CI)
Unadjusted coefficient or
odds ratio (95%CI)
Adjusted& coefficient or
odds ratio (95%CI)
Unadjusted Coefficient or
odds ratio (95%CI)
Adjusted&
coefficient or odds ratio (95%CI)
Un-adjusted
Adjusted
Mode of delivery C-section 1.09
(1.07 to 1.10)* 1.06
(1.04 to 1.09)* 1.09
(1.07 to 1.11)* 1.08
(1.05 to 1.11)* 1.08
(1.06 to 1.10)* 1.05
(1.01 to 1.08)* 0.101 0.160
Induction 1.06 (1.05 to 1.07)*
1.08 (1.06 to 1.09)*
1.07 (1.05 to 1.08)*
1.08 (1.05 to 1.10)*
1.06 (1.04 to 1.07)*
1.07 (1.05 to 1.09)*
0.336 0.453
Any breastfeeding at 6 months
0.98 (0.95 to 1.00)
0.97 (0.94 to 1.01)
0.99 (0.95 to 1.02)
0.98 (0.92 to 1.04)
0.98 (0.95 to 1.02)
0.96 (0.91 to 1.02)
0.783 0.808
Post-partum weight retention at 3 years (kg)
-0.17 (-0.27 to -0.08)*
-0.19 (-0.32 to -0.07)*
-0.07 (-0.23 to 0.08)
-0.13 (-0.34 to 0.07)
-0.21 (-0.34 to -0.09)*
-0.23 (-0.40 to -0.05)*
0.155 0.451
*Significant association (p<0.05) &Adjusted for maternal age, parity, place of birth of mother, father and their parents, gestational age at booking, smoking, alcohol consumption, exposure to smoke, family history of diabetes, previous diabetes, and the following measures of SES: IMD quintile 2010, mother’s and father’s education and mothers and father’s employment. AP value for interaction between Ethnicity and BMI on outcome (shows whether or not there is a significant difference in Pakistani women compared with White British women in the shape of association between BMI and outcome).The number of participants in the analysis for whole cohort for each outcome, unadjusted then adjusted, respectively, were n=6,394 and n=3,501 for C-Section; n=7,311 and n=4,055 for induction; n=1,011 and n=576 for any breastfeeding at 6 months and n=774 and n=464 for post-partum weight retention The number of participants in the analysis for White British women for each outcome, unadjusted then adjusted, respectively, were n=2,996 and n=1,575 for C-Section; n=3,425 and n= 1,853 for induction; n=431 and n=235 for any breastfeeding at 6 months and n=309 and n=173 for post-partum weight retention The number of participants in the analysis for Pakistani women for each outcome, unadjusted then adjusted, respectively, were n=3,398 and n=1,897 for C-Section; n=3,886 and n=2,198 for induction; n=580 and n=329 for any breastfeeding at 6 months and n=465 and n=291 for post-partum weight retention
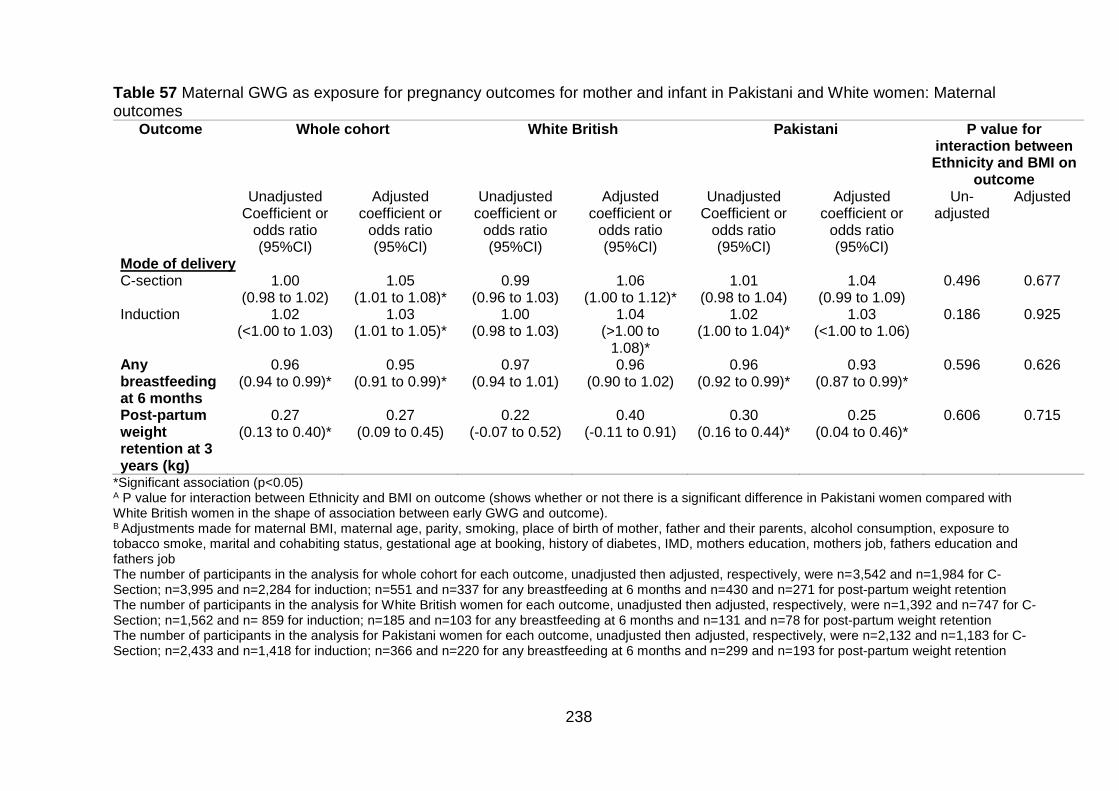
238
Table 57 Maternal GWG as exposure for pregnancy outcomes for mother and infant in Pakistani and White women: Maternal outcomes
Outcome Whole cohort White British Pakistani P value for interaction between Ethnicity and BMI on
outcome Unadjusted
Coefficient or odds ratio (95%CI)
Adjusted coefficient or
odds ratio (95%CI)
Unadjusted coefficient or
odds ratio (95%CI)
Adjusted coefficient or
odds ratio (95%CI)
Unadjusted Coefficient or
odds ratio (95%CI)
Adjusted coefficient or
odds ratio (95%CI)
Un-adjusted
Adjusted
Mode of delivery C-section 1.00
(0.98 to 1.02) 1.05
(1.01 to 1.08)* 0.99
(0.96 to 1.03) 1.06
(1.00 to 1.12)* 1.01
(0.98 to 1.04) 1.04
(0.99 to 1.09) 0.496 0.677
Induction 1.02 (<1.00 to 1.03)
1.03 (1.01 to 1.05)*
1.00 (0.98 to 1.03)
1.04 (>1.00 to
1.08)*
1.02 (1.00 to 1.04)*
1.03 (<1.00 to 1.06)
0.186 0.925
Any breastfeeding at 6 months
0.96 (0.94 to 0.99)*
0.95 (0.91 to 0.99)*
0.97 (0.94 to 1.01)
0.96 (0.90 to 1.02)
0.96 (0.92 to 0.99)*
0.93 (0.87 to 0.99)*
0.596 0.626
Post-partum weight retention at 3 years (kg)
0.27 (0.13 to 0.40)*
0.27 (0.09 to 0.45)
0.22 (-0.07 to 0.52)
0.40 (-0.11 to 0.91)
0.30 (0.16 to 0.44)*
0.25 (0.04 to 0.46)*
0.606 0.715
*Significant association (p<0.05) A P value for interaction between Ethnicity and BMI on outcome (shows whether or not there is a significant difference in Pakistani women compared with White British women in the shape of association between early GWG and outcome). B Adjustments made for maternal BMI, maternal age, parity, smoking, place of birth of mother, father and their parents, alcohol consumption, exposure to tobacco smoke, marital and cohabiting status, gestational age at booking, history of diabetes, IMD, mothers education, mothers job, fathers education and fathers job The number of participants in the analysis for whole cohort for each outcome, unadjusted then adjusted, respectively, were n=3,542 and n=1,984 for C-Section; n=3,995 and n=2,284 for induction; n=551 and n=337 for any breastfeeding at 6 months and n=430 and n=271 for post-partum weight retention The number of participants in the analysis for White British women for each outcome, unadjusted then adjusted, respectively, were n=1,392 and n=747 for C-Section; n=1,562 and n= 859 for induction; n=185 and n=103 for any breastfeeding at 6 months and n=131 and n=78 for post-partum weight retention The number of participants in the analysis for Pakistani women for each outcome, unadjusted then adjusted, respectively, were n=2,132 and n=1,183 for C-Section; n=2,433 and n=1,418 for induction; n=366 and n=220 for any breastfeeding at 6 months and n=299 and n=193 for post-partum weight retention
239
Mode of delivery
C-section
BMI
In the unadjusted models, odds of C-section increased significantly with increasing
BMI for both ethnic groups. The increase was smaller in Pakistani women compared
with White British women (OR 1.08 (95%CI 1.06 to 1.10) for Pakistani women and
OR 1.09 (95%CI 1.07 to 1.11) for White British women; Table 56). Following
adjustment, the odds decreased for both ethnic groups although the direction and
significance of the association remained the same; Pakistani women still had lower
odds C-section compared with White British women (AOR 1.05 (95%CI 1.01 to 1.08)
for Pakistani women and AOR 1.08 (95%CI 1.05 to 1.11) for White British women).
When considering the interaction between ethnicity and BMI on C-section, there was
no significant difference between the shape of the association between BMI and C-
section in the two ethnic groups in either the unadjusted model or adjusted model
(p=0.549 and 0.160; Table 56).
GWG
GWG was not associated with C-section in unadjusted models for either ethnic group
but the estimated effect sizes were slightly higher for Pakistani women compared
with White British women (OR 1.01 (95%CI 0.98 to 1.14) for Pakistani women and
OR 0.99 (95%CI 0.98 to 1.03) for White British women; Table 57).Following
adjustment, AORs increased for both ethnic groups but were now lower for Pakistani
women compared with White British women (AOR 1.04 (95%CI 0.99 to 1.09) for
Pakistani women and AOR 1.06 (95%CI 1.00 to 1.12) for White British women).
When considering the interaction between ethnicity and GWG on C-section, there
was no significant difference between the shape of the association between GWG on
C-section in the two ethnic groups in either the unadjusted or adjusted model
(p=0.496 and p=0.677, respectively; Table 57).
240
Induction
BMI
In the unadjusted models, odds of induction increased significantly with increasing
BMI for both ethnic groups in both unadjusted (OR 1.06 (95%CI 1.04 to 1.07) for
Pakistani women and OR 1.07 (95%CI 1.05 to 1.08) for White British women; Table
56) and adjusted models (AOR 1.05 (95%CI 1.01 to 1.08) for Pakistani women and
AOR 1.08 (95%CI 1.05 to 1.10) for White British women; Table 56), the increase in
odds of induction associated with a 1kg/m2 increase in maternal BMI was smaller in
Pakistani women compared with White British women. When considering the
interaction between ethnicity and BMI on induction, there was no significant
difference between the shape of the association between BMI and induction in the
two ethnic groups in either the unadjusted or adjusted model (p=0.336 and p=0.435,
respectively; Table 56).
GWG
Odds of induction associated with a 1kg increase in GWG were higher for Pakistani
women compared with White British women in unadjusted models (OR 1.02 (95%CI
1.00 to 1.04) for Pakistani women and OR 1.00 (95%CI 0.98 to 1.03) for White British
women; Table 57). . Following adjustment, although ORs increased for both ethnic
groups, Pakistani women now had lower odds of induction associated with a 1kg
increase in GWG compared with White British women (AOR 1.03 (95%CI <1.00 to
1.06) for Pakistani women and AOR 1.04 (95%CI <1.00 to 1.08) for White British
women; Table 57). When considering the interaction between ethnicity and GWG on
induction, there was no significant difference between the shape of the association
between GWG on induction in the two ethnic groups in either the unadjusted or
adjusted model (p=0.186 and p=0.925, respectively; Table 57).
Breastfeeding at 6 months
BMI
There was a general trend of decreased odds of breastfeeding at 6 months with
increasing maternal BMI. However, this was not significant for either ethnic group
either prior to, or following adjustment. Unadjusted odds of breastfeeding at 6 months
241
were not significantly associated with a 1kg/m2 increase in maternal BMI for either
ethnic group (OR 0.98 (95%CI 0.98 to 1.02) for Pakistani women and OR 0.99
(95%CI 0.95 to 1.02) for White British women; Table 56). Following adjustment for
confounders, odds decreased slightly for both ethnic groups but the results remained
insignificant (AOR 0.96 (95%CI 0.91 to 1.02) for Pakistani women and OR 0.98
(95%CI 0.92 to 1.04) for White British women; Table 56). When considering the
interaction between ethnicity and BMI on breastfeeding at 6 months, there was no
significant difference between the shape of the association in the two ethnic groups
in either the unadjusted or adjusted model (p=0.783 and p=0.808, respectively; Table
56).
GWG
There was a general trend of decreased odds of breastfeeding at 6 months with
increasing maternal GWG for both ethnic groups. However, the effect was more
pronounced for Pakistani women. Breastfeeding at 6 months was significantly
negatively associated with GWG for Pakistani women in both unadjusted and
adjusted models (OR 0.96 (95%CI 0.92 to 0.99) and AOR 0.93 (95%CI 0.87 to 0.99);
Table 57, while the direction of the effect was the same for White British women,
there was no significant association (OR 0.97 (95%CI 0.94 to 1.01) and AOR 0.96
(95%CI 0.90 to 1.02); Table 57). When considering the interaction between ethnicity
and GWG on breastfeeding at 6 months, there was no significant difference between
the shape of the association in the two ethnic groups in either the unadjusted or
adjusted model (p=0.596 and p=0.626, respectively; Table 57).
Post-partum weight retention at 3 years
BMI
For both ethnic groups, increasing maternal BMI was associated with lower PPWR,
although the estimated effect size was larger (i.e. lower PPWR), and only reaches
significance for Pakistani women. In unadjusted analysis, PPWR at 3 years was
significantly negatively associated with increasing maternal BMI for Pakistani women
but not White British women (-0.21kg (95%CI -0.34 to -0.09) for Pakistani women and
-0.07kg (95%CI -0.23 to 0.08) for White British women; Table 56). Following
242
adjustment, although effect sizes increased, this remained true (i.e. lower PPWR
associated with increasing maternal BMI than in unadjusted analysis; -0.23kg (95%CI
-0.40 to -0.05) for Pakistani women and -0.13kg (95%CI -0.34 to 0.07) for White
British women; Table 56). When considering the interaction between ethnicity and
BMI on PPWR at 3 years, there was no significant difference between the shape of
the association in the two ethnic groups in either the unadjusted or adjusted model
(p=0.155 and p=0.051, respectively; Table 56).
GWG
For both ethnic groups, estimated effect sizes showed that there was a general trend
of increasing PPWR with increasing GWG. In unadjusted analysis, the positive
association between PPWR at 3 years and GWG reached significance for Pakistani
women but not for White British women (0.30kg (95%CI 0.16 to 0.44) for Pakistani
women and 0.22kg (95%CI -0.07 to 0.52) for White British women; Table 57).
Following adjustment, the strength of the association24 decreased for Pakistani
women and there was now less PPWR associated with a 1kg increase in GWG, but it
remained significant (0.25kg (95%CI 0.04 to 0.46); Table 57). In white British women,
the strength increased (i.e. there was now more PPWR associated with a 1kg
increase in GWG) but still did not reach significance (0.40kg (95%CI -0.11 to 0.92);
Table 57). When considering the interaction between ethnicity and GWG on PPWR
at 3 years, there was no significant difference between the shape of the association
in the two ethnic groups in either the unadjusted or adjusted model (p=0.606 and
p=0.715, respectively; Table 57).
24 The strength of the association refers to the effect size, giving an indication of the magnitude of the association, i.e. the larger the effect size the stronger the association between outcome and exposure. An increased strength implies that there is a larger increase or decrease in outcome with increasing exposure. Please note that the strength of the association does not refer to direction of effect.
243
7.1.7 Exploring the association between maternal body mass index,
gestational weight gain and pregnancy outcomes for mother and infant
in Pakistani and White women: Infant outcomes
Results for maternal BMI as exposure are shown in Table 58 and results for GWG as
an exposure are shown in Table 59.
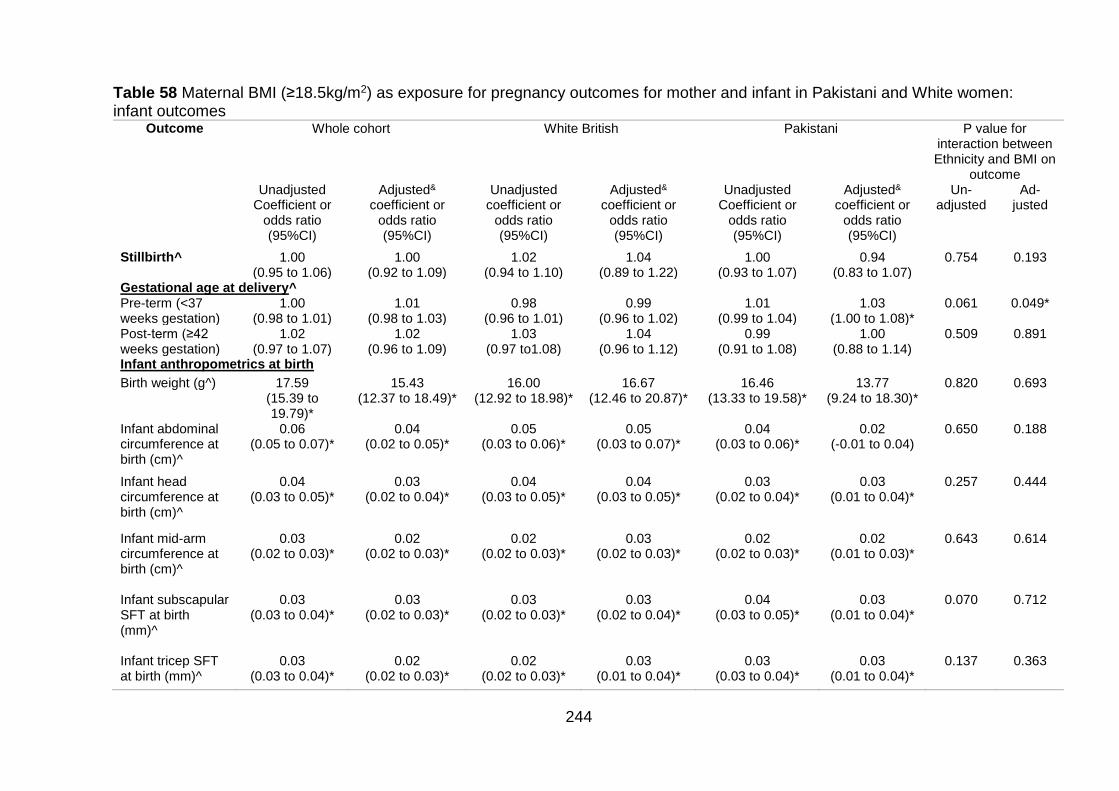
244
Table 58 Maternal BMI (≥18.5kg/m2) as exposure for pregnancy outcomes for mother and infant in Pakistani and White women: infant outcomes
Outcome Whole cohort White British Pakistani P value for interaction between Ethnicity and BMI on
outcome Unadjusted
Coefficient or odds ratio (95%CI)
Adjusted& coefficient or
odds ratio (95%CI)
Unadjusted coefficient or
odds ratio (95%CI)
Adjusted& coefficient or
odds ratio (95%CI)
Unadjusted Coefficient or
odds ratio (95%CI)
Adjusted&
coefficient or odds ratio (95%CI)
Un-adjusted
Ad-justed
Stillbirth^ 1.00 (0.95 to 1.06)
1.00 (0.92 to 1.09)
1.02 (0.94 to 1.10)
1.04 (0.89 to 1.22)
1.00 (0.93 to 1.07)
0.94 (0.83 to 1.07)
0.754 0.193
Gestational age at delivery^ Pre-term (<37 weeks gestation)
1.00 (0.98 to 1.01)
1.01 (0.98 to 1.03)
0.98 (0.96 to 1.01)
0.99 (0.96 to 1.02)
1.01 (0.99 to 1.04)
1.03 (1.00 to 1.08)*
0.061 0.049*
Post-term (≥42 weeks gestation)
1.02 (0.97 to 1.07)
1.02 (0.96 to 1.09)
1.03 (0.97 to1.08)
1.04 (0.96 to 1.12)
0.99 (0.91 to 1.08)
1.00 (0.88 to 1.14)
0.509 0.891
Infant anthropometrics at birth
Birth weight (g^) 17.59 (15.39 to 19.79)*
15.43 (12.37 to 18.49)*
16.00 (12.92 to 18.98)*
16.67 (12.46 to 20.87)*
16.46 (13.33 to 19.58)*
13.77 (9.24 to 18.30)*
0.820 0.693
Infant abdominal circumference at birth (cm)^
0.06 (0.05 to 0.07)*
0.04 (0.02 to 0.05)*
0.05 (0.03 to 0.06)*
0.05 (0.03 to 0.07)*
0.04 (0.03 to 0.06)*
0.02 (-0.01 to 0.04)
0.650 0.188
Infant head circumference at birth (cm)^
0.04 (0.03 to 0.05)*
0.03 (0.02 to 0.04)*
0.04 (0.03 to 0.05)*
0.04 (0.03 to 0.05)*
0.03 (0.02 to 0.04)*
0.03 (0.01 to 0.04)*
0.257 0.444
Infant mid-arm circumference at birth (cm)^
0.03 (0.02 to 0.03)*
0.02 (0.02 to 0.03)*
0.02 (0.02 to 0.03)*
0.03 (0.02 to 0.03)*
0.02 (0.02 to 0.03)*
0.02 (0.01 to 0.03)*
0.643 0.614
Infant subscapular SFT at birth (mm)^
0.03 (0.03 to 0.04)*
0.03 (0.02 to 0.03)*
0.03 (0.02 to 0.03)*
0.03 (0.02 to 0.04)*
0.04 (0.03 to 0.05)*
0.03 (0.01 to 0.04)*
0.070 0.712
Infant tricep SFT at birth (mm)^
0.03 (0.03 to 0.04)*
0.02 (0.02 to 0.03)*
0.02 (0.02 to 0.03)*
0.03 (0.01 to 0.04)*
0.03 (0.03 to 0.04)*
0.03 (0.01 to 0.04)*
0.137 0.363
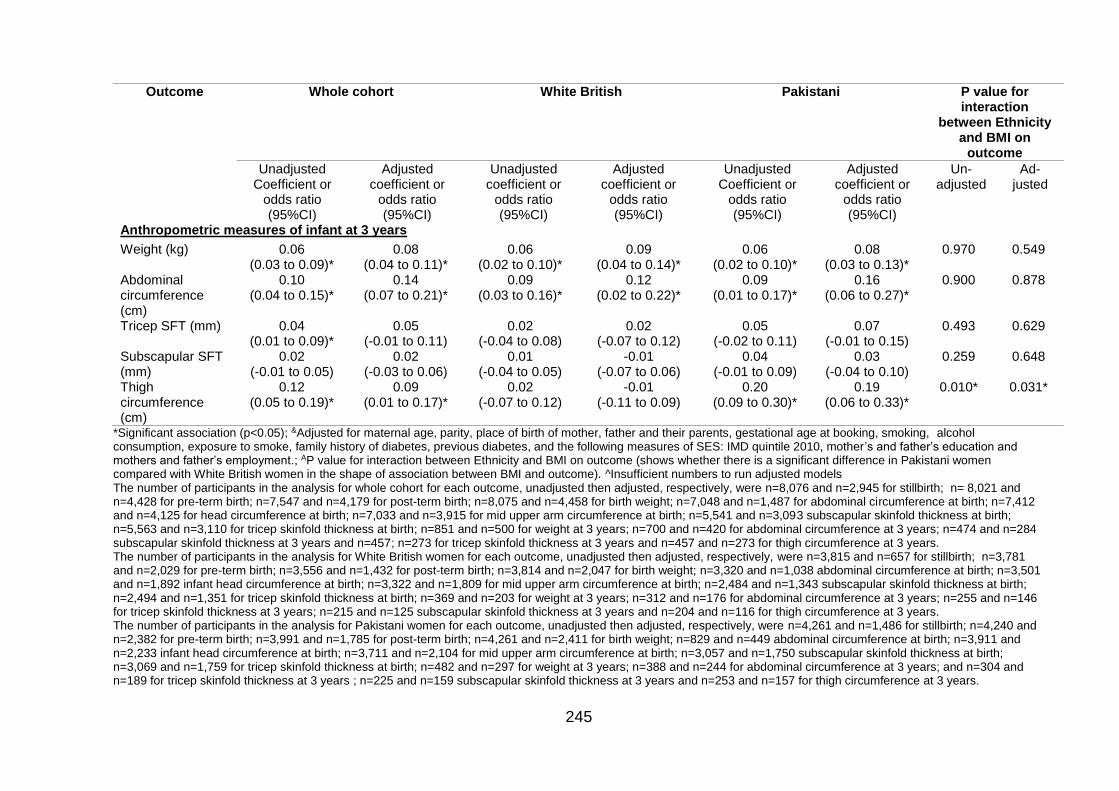
245
Outcome Whole cohort White British Pakistani P value for interaction
between Ethnicity and BMI on
outcome
Unadjusted Coefficient or
odds ratio (95%CI)
Adjusted coefficient or
odds ratio (95%CI)
Unadjusted coefficient or
odds ratio (95%CI)
Adjusted coefficient or
odds ratio (95%CI)
Unadjusted Coefficient or
odds ratio (95%CI)
Adjusted coefficient or
odds ratio (95%CI)
Un-adjusted
Ad-justed
Anthropometric measures of infant at 3 years
Weight (kg) 0.06 (0.03 to 0.09)*
0.08 (0.04 to 0.11)*
0.06 (0.02 to 0.10)*
0.09 (0.04 to 0.14)*
0.06 (0.02 to 0.10)*
0.08 (0.03 to 0.13)*
0.970 0.549
Abdominal circumference (cm)
0.10 (0.04 to 0.15)*
0.14 (0.07 to 0.21)*
0.09 (0.03 to 0.16)*
0.12 (0.02 to 0.22)*
0.09 (0.01 to 0.17)*
0.16 (0.06 to 0.27)*
0.900 0.878
Tricep SFT (mm) 0.04 (0.01 to 0.09)*
0.05 (-0.01 to 0.11)
0.02 (-0.04 to 0.08)
0.02 (-0.07 to 0.12)
0.05 (-0.02 to 0.11)
0.07 (-0.01 to 0.15)
0.493 0.629
Subscapular SFT (mm)
0.02 (-0.01 to 0.05)
0.02 (-0.03 to 0.06)
0.01 (-0.04 to 0.05)
-0.01 (-0.07 to 0.06)
0.04 (-0.01 to 0.09)
0.03 (-0.04 to 0.10)
0.259 0.648
Thigh circumference (cm)
0.12 (0.05 to 0.19)*
0.09 (0.01 to 0.17)*
0.02 (-0.07 to 0.12)
-0.01 (-0.11 to 0.09)
0.20 (0.09 to 0.30)*
0.19 (0.06 to 0.33)*
0.010* 0.031*
*Significant association (p<0.05); &Adjusted for maternal age, parity, place of birth of mother, father and their parents, gestational age at booking, smoking, alcohol consumption, exposure to smoke, family history of diabetes, previous diabetes, and the following measures of SES: IMD quintile 2010, mother’s and father’s education and mothers and father’s employment.; AP value for interaction between Ethnicity and BMI on outcome (shows whether there is a significant difference in Pakistani women compared with White British women in the shape of association between BMI and outcome). ^Insufficient numbers to run adjusted models The number of participants in the analysis for whole cohort for each outcome, unadjusted then adjusted, respectively, were n=8,076 and n=2,945 for stillbirth; n= 8,021 and n=4,428 for pre-term birth; n=7,547 and n=4,179 for post-term birth; n=8,075 and n=4,458 for birth weight; n=7,048 and n=1,487 for abdominal circumference at birth; n=7,412 and n=4,125 for head circumference at birth; n=7,033 and n=3,915 for mid upper arm circumference at birth; n=5,541 and n=3,093 subscapular skinfold thickness at birth; n=5,563 and n=3,110 for tricep skinfold thickness at birth; n=851 and n=500 for weight at 3 years; n=700 and n=420 for abdominal circumference at 3 years; n=474 and n=284 subscapular skinfold thickness at 3 years and n=457; n=273 for tricep skinfold thickness at 3 years and n=457 and n=273 for thigh circumference at 3 years. The number of participants in the analysis for White British women for each outcome, unadjusted then adjusted, respectively, were n=3,815 and n=657 for stillbirth; n=3,781 and n=2,029 for pre-term birth; n=3,556 and n=1,432 for post-term birth; n=3,814 and n=2,047 for birth weight; n=3,320 and n=1,038 abdominal circumference at birth; n=3,501 and n=1,892 infant head circumference at birth; n=3,322 and n=1,809 for mid upper arm circumference at birth; n=2,484 and n=1,343 subscapular skinfold thickness at birth; n=2,494 and n=1,351 for tricep skinfold thickness at birth; n=369 and n=203 for weight at 3 years; n=312 and n=176 for abdominal circumference at 3 years; n=255 and n=146 for tricep skinfold thickness at 3 years; n=215 and n=125 subscapular skinfold thickness at 3 years and n=204 and n=116 for thigh circumference at 3 years. The number of participants in the analysis for Pakistani women for each outcome, unadjusted then adjusted, respectively, were n=4,261 and n=1,486 for stillbirth; n=4,240 and n=2,382 for pre-term birth; n=3,991 and n=1,785 for post-term birth; n=4,261 and n=2,411 for birth weight; n=829 and n=449 abdominal circumference at birth; n=3,911 and n=2,233 infant head circumference at birth; n=3,711 and n=2,104 for mid upper arm circumference at birth; n=3,057 and n=1,750 subscapular skinfold thickness at birth; n=3,069 and n=1,759 for tricep skinfold thickness at birth; n=482 and n=297 for weight at 3 years; n=388 and n=244 for abdominal circumference at 3 years; and n=304 and n=189 for tricep skinfold thickness at 3 years ; n=225 and n=159 subscapular skinfold thickness at 3 years and n=253 and n=157 for thigh circumference at 3 years.
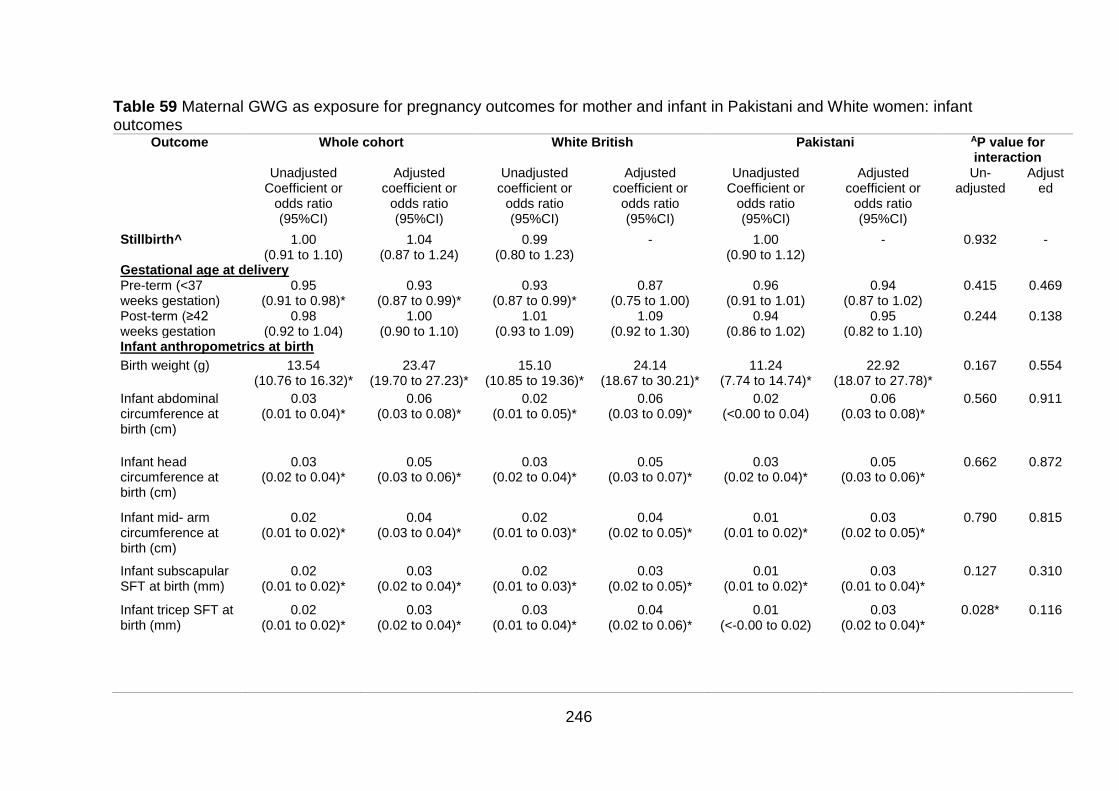
246
Table 59 Maternal GWG as exposure for pregnancy outcomes for mother and infant in Pakistani and White women: infant outcomes
Outcome Whole cohort White British Pakistani AP value for interaction
Unadjusted Coefficient or
odds ratio (95%CI)
Adjusted coefficient or
odds ratio (95%CI)
Unadjusted coefficient or
odds ratio (95%CI)
Adjusted coefficient or
odds ratio (95%CI)
Unadjusted Coefficient or
odds ratio (95%CI)
Adjusted coefficient or
odds ratio (95%CI)
Un-adjusted
Adjusted
Stillbirth^ 1.00 (0.91 to 1.10)
1.04 (0.87 to 1.24)
0.99 (0.80 to 1.23)
- 1.00 (0.90 to 1.12)
- 0.932 -
Gestational age at delivery Pre-term (<37 weeks gestation)
0.95 (0.91 to 0.98)*
0.93 (0.87 to 0.99)*
0.93 (0.87 to 0.99)*
0.87 (0.75 to 1.00)
0.96 (0.91 to 1.01)
0.94 (0.87 to 1.02)
0.415 0.469
Post-term (≥42 weeks gestation
0.98 (0.92 to 1.04)
1.00 (0.90 to 1.10)
1.01 (0.93 to 1.09)
1.09 (0.92 to 1.30)
0.94 (0.86 to 1.02)
0.95 (0.82 to 1.10)
0.244 0.138
Infant anthropometrics at birth
Birth weight (g) 13.54 (10.76 to 16.32)*
23.47 (19.70 to 27.23)*
15.10 (10.85 to 19.36)*
24.14 (18.67 to 30.21)*
11.24 (7.74 to 14.74)*
22.92 (18.07 to 27.78)*
0.167 0.554
Infant abdominal circumference at birth (cm)
0.03 (0.01 to 0.04)*
0.06 (0.03 to 0.08)*
0.02 (0.01 to 0.05)*
0.06 (0.03 to 0.09)*
0.02 (<0.00 to 0.04)
0.06 (0.03 to 0.08)*
0.560 0.911
Infant head circumference at birth (cm)
0.03 (0.02 to 0.04)*
0.05 (0.03 to 0.06)*
0.03 (0.02 to 0.04)*
0.05 (0.03 to 0.07)*
0.03 (0.02 to 0.04)*
0.05 (0.03 to 0.06)*
0.662 0.872
Infant mid- arm circumference at birth (cm)
0.02 (0.01 to 0.02)*
0.04 (0.03 to 0.04)*
0.02 (0.01 to 0.03)*
0.04 (0.02 to 0.05)*
0.01 (0.01 to 0.02)*
0.03 (0.02 to 0.05)*
0.790 0.815
Infant subscapular SFT at birth (mm)
0.02 (0.01 to 0.02)*
0.03 (0.02 to 0.04)*
0.02 (0.01 to 0.03)*
0.03 (0.02 to 0.05)*
0.01 (0.01 to 0.02)*
0.03 (0.01 to 0.04)*
0.127 0.310
Infant tricep SFT at birth (mm)
0.02 (0.01 to 0.02)*
0.03 (0.02 to 0.04)*
0.03 (0.01 to 0.04)*
0.04 (0.02 to 0.06)*
0.01 (<-0.00 to 0.02)
0.03 (0.02 to 0.04)*
0.028* 0.116
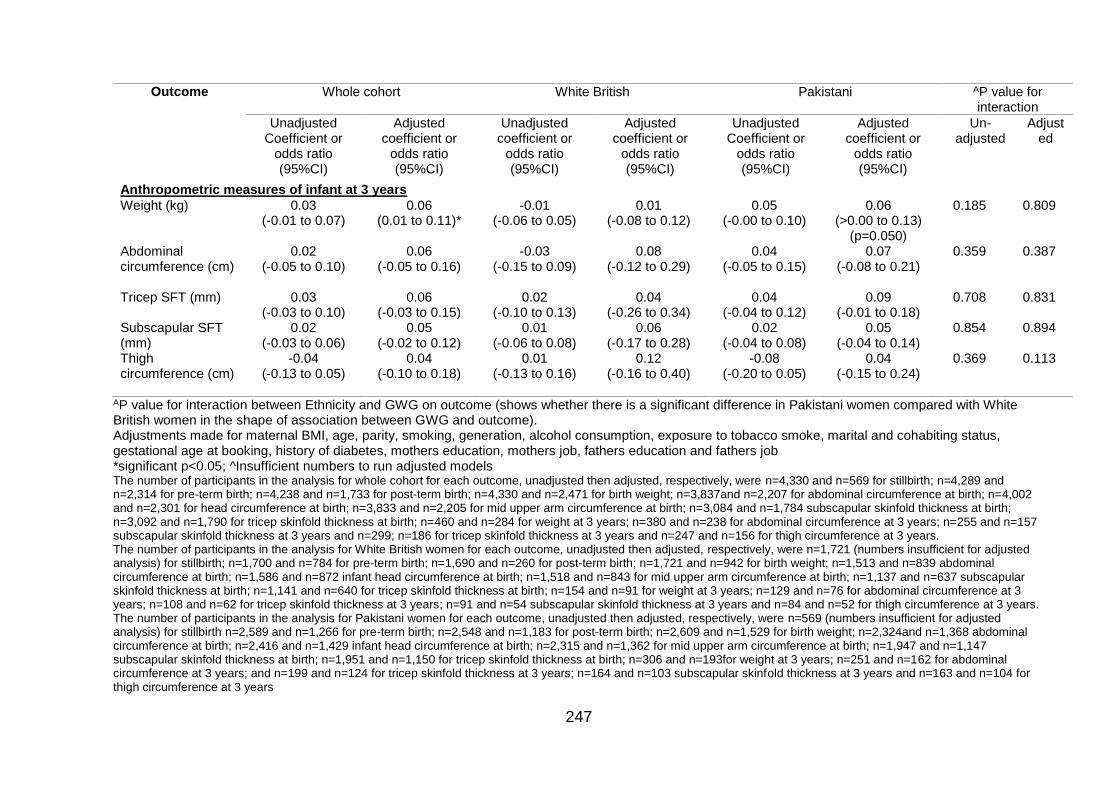
247
Outcome Whole cohort White British Pakistani AP value for interaction
Unadjusted Coefficient or
odds ratio (95%CI)
Adjusted coefficient or
odds ratio (95%CI)
Unadjusted coefficient or
odds ratio (95%CI)
Adjusted coefficient or
odds ratio (95%CI)
Unadjusted Coefficient or
odds ratio (95%CI)
Adjusted coefficient or
odds ratio (95%CI)
Un-adjusted
Adjusted
Anthropometric measures of infant at 3 years
Weight (kg) 0.03 (-0.01 to 0.07)
0.06 (0.01 to 0.11)*
-0.01 (-0.06 to 0.05)
0.01 (-0.08 to 0.12)
0.05 (-0.00 to 0.10)
0.06 (>0.00 to 0.13)
(p=0.050)
0.185 0.809
Abdominal circumference (cm)
0.02 (-0.05 to 0.10)
0.06 (-0.05 to 0.16)
-0.03 (-0.15 to 0.09)
0.08 (-0.12 to 0.29)
0.04 (-0.05 to 0.15)
0.07 (-0.08 to 0.21)
0.359 0.387
Tricep SFT (mm) 0.03 (-0.03 to 0.10)
0.06 (-0.03 to 0.15)
0.02 (-0.10 to 0.13)
0.04 (-0.26 to 0.34)
0.04 (-0.04 to 0.12)
0.09 (-0.01 to 0.18)
0.708 0.831
Subscapular SFT (mm)
0.02 (-0.03 to 0.06)
0.05 (-0.02 to 0.12)
0.01 (-0.06 to 0.08)
0.06 (-0.17 to 0.28)
0.02 (-0.04 to 0.08)
0.05 (-0.04 to 0.14)
0.854 0.894
Thigh circumference (cm)
-0.04 (-0.13 to 0.05)
0.04 (-0.10 to 0.18)
0.01 (-0.13 to 0.16)
0.12 (-0.16 to 0.40)
-0.08 (-0.20 to 0.05)
0.04 (-0.15 to 0.24)
0.369
0.113
AP value for interaction between Ethnicity and GWG on outcome (shows whether there is a significant difference in Pakistani women compared with White British women in the shape of association between GWG and outcome). Adjustments made for maternal BMI, age, parity, smoking, generation, alcohol consumption, exposure to tobacco smoke, marital and cohabiting status, gestational age at booking, history of diabetes, mothers education, mothers job, fathers education and fathers job *significant p<0.05; ^Insufficient numbers to run adjusted models The number of participants in the analysis for whole cohort for each outcome, unadjusted then adjusted, respectively, were n=4,330 and n=569 for stillbirth; n=4,289 and n=2,314 for pre-term birth; n=4,238 and n=1,733 for post-term birth; n=4,330 and n=2,471 for birth weight; n=3,837and n=2,207 for abdominal circumference at birth; n=4,002 and n=2,301 for head circumference at birth; n=3,833 and n=2,205 for mid upper arm circumference at birth; n=3,084 and n=1,784 subscapular skinfold thickness at birth; n=3,092 and n=1,790 for tricep skinfold thickness at birth; n=460 and n=284 for weight at 3 years; n=380 and n=238 for abdominal circumference at 3 years; n=255 and n=157 subscapular skinfold thickness at 3 years and n=299; n=186 for tricep skinfold thickness at 3 years and n=247 and n=156 for thigh circumference at 3 years. The number of participants in the analysis for White British women for each outcome, unadjusted then adjusted, respectively, were n=1,721 (numbers insufficient for adjusted analysis) for stillbirth; n=1,700 and n=784 for pre-term birth; n=1,690 and n=260 for post-term birth; n=1,721 and n=942 for birth weight; n=1,513 and n=839 abdominal circumference at birth; n=1,586 and n=872 infant head circumference at birth; n=1,518 and n=843 for mid upper arm circumference at birth; n=1,137 and n=637 subscapular skinfold thickness at birth; n=1,141 and n=640 for tricep skinfold thickness at birth; n=154 and n=91 for weight at 3 years; n=129 and n=76 for abdominal circumference at 3 years; n=108 and n=62 for tricep skinfold thickness at 3 years; n=91 and n=54 subscapular skinfold thickness at 3 years and n=84 and n=52 for thigh circumference at 3 years. The number of participants in the analysis for Pakistani women for each outcome, unadjusted then adjusted, respectively, were n=569 (numbers insufficient for adjusted analysis) for stillbirth n=2,589 and n=1,266 for pre-term birth; n=2,548 and n=1,183 for post-term birth; n=2,609 and n=1,529 for birth weight; n=2,324and n=1,368 abdominal circumference at birth; n=2,416 and n=1,429 infant head circumference at birth; n=2,315 and n=1,362 for mid upper arm circumference at birth; n=1,947 and n=1,147 subscapular skinfold thickness at birth; n=1,951 and n=1,150 for tricep skinfold thickness at birth; n=306 and n=193for weight at 3 years; n=251 and n=162 for abdominal circumference at 3 years; and n=199 and n=124 for tricep skinfold thickness at 3 years; n=164 and n=103 subscapular skinfold thickness at 3 years and n=163 and n=104 for thigh circumference at 3 years
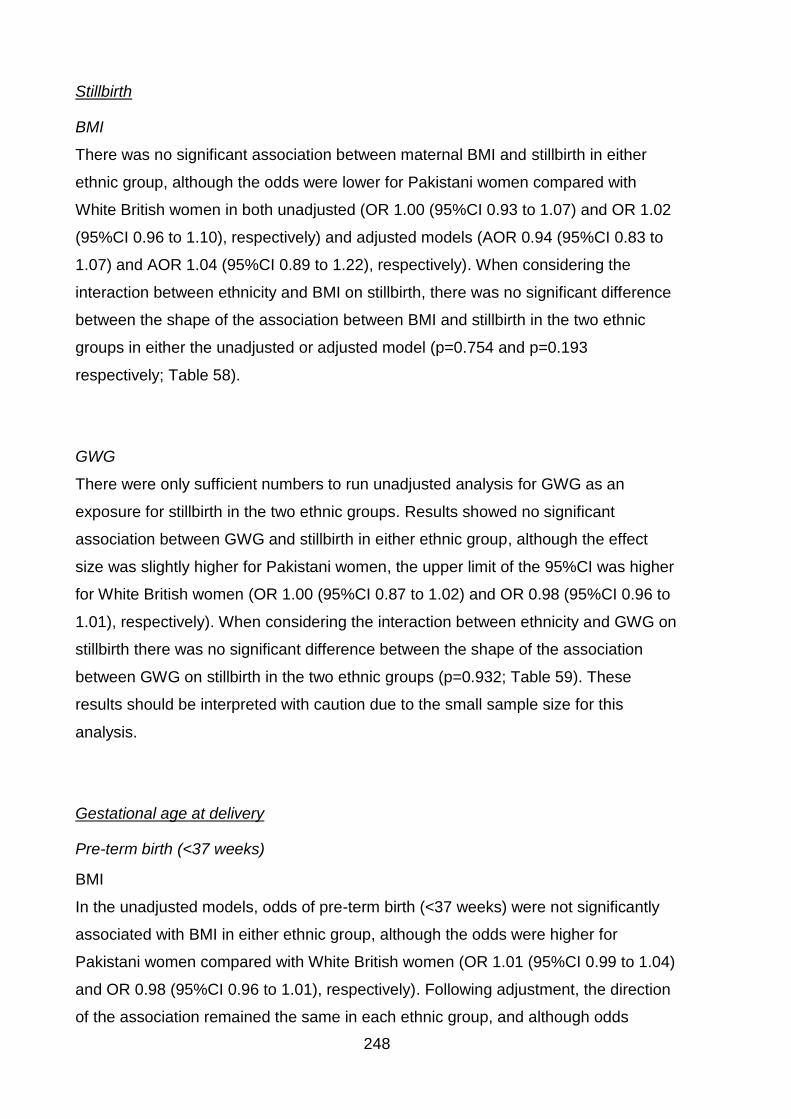
248
Stillbirth
BMI
There was no significant association between maternal BMI and stillbirth in either
ethnic group, although the odds were lower for Pakistani women compared with
White British women in both unadjusted (OR 1.00 (95%CI 0.93 to 1.07) and OR 1.02
(95%CI 0.96 to 1.10), respectively) and adjusted models (AOR 0.94 (95%CI 0.83 to
1.07) and AOR 1.04 (95%CI 0.89 to 1.22), respectively). When considering the
interaction between ethnicity and BMI on stillbirth, there was no significant difference
between the shape of the association between BMI and stillbirth in the two ethnic
groups in either the unadjusted or adjusted model (p=0.754 and p=0.193
respectively; Table 58).
GWG
There were only sufficient numbers to run unadjusted analysis for GWG as an
exposure for stillbirth in the two ethnic groups. Results showed no significant
association between GWG and stillbirth in either ethnic group, although the effect
size was slightly higher for Pakistani women, the upper limit of the 95%CI was higher
for White British women (OR 1.00 (95%CI 0.87 to 1.02) and OR 0.98 (95%CI 0.96 to
1.01), respectively). When considering the interaction between ethnicity and GWG on
stillbirth there was no significant difference between the shape of the association
between GWG on stillbirth in the two ethnic groups (p=0.932; Table 59). These
results should be interpreted with caution due to the small sample size for this
analysis.
Gestational age at delivery
Pre-term birth (<37 weeks)
BMI
In the unadjusted models, odds of pre-term birth (<37 weeks) were not significantly
associated with BMI in either ethnic group, although the odds were higher for
Pakistani women compared with White British women (OR 1.01 (95%CI 0.99 to 1.04)
and OR 0.98 (95%CI 0.96 to 1.01), respectively). Following adjustment, the direction
of the association remained the same in each ethnic group, and although odds
249
increased slightly, the association only reached significance for infants of Pakistani
women (AOR 1.03 (95%CI 1.00 to 1.08) and AOR 0.99 (95%CI 0.96 to 1.02),
respectively). There was no significance ethnic difference in the shape of the
association between BMI and pre-term birth for the unadjusted model (p=0.061;
Table 58). However, considering the interaction between ethnicity and BMI on
induction, there was a significant difference in the shape of the association between
BMI and induction in the two ethnic groups in the adjusted model with odds of pre-
term birth increasing for infants born to Pakistani women, and decreasing with
increasing BMI in infants born to White British women (p=0.049; Table 58). The
graph for the adjusted regression model with ethnicity fitted as an interaction term is
depicted in Figure 24. For Pakistani women, as BMI increases the adjusted odds of
pre-term birth increase, while for White British women adjusted odds of pre-term birth
appear to decrease with increasing BMI.
Figure 24 Two-way lowess smoother plot for the adjusted regression model between pre-term birth (<37 weeks) and BMI with ethnicity fitted as an interaction term Note: Pr(Pre-term birth) gives an indication of probability of pre-term birth; the higher Pr(Pre-term birth), the more likely the outcome of pre-term birth is.
250
GWG
GWG was negatively associated with the odds of pre-term birth in unadjusted models
for both ethnic groups; odds were slightly higher for infants born to Pakistani women
compared with infants born to White British women (for whom odds of pre-term birth
were significantly decreased with increasing GWG; OR 0.96 (95% 0.91 to 1.01) for
infants born to Pakistani women and OR 0.93 (95%CI 0.87 to 0.99) for infants born to
White British women).. Following adjustment, odds of pre-term birth decreased for
both ethnic groups, remaining slightly higher for infants born to Pakistani women
compared with infants born to White British women (AOR 0.94 (95%CI 0.87 to 1.02)
for infants born to Pakistani women and AOR 0.87 (95%CI 0.75 to 1.00) for infants
born to White British women) . When considering the interaction between ethnicity
and GWG on pre-term birth, there was no significant difference between the shape of
the association between GWG on pre-term birth in the two ethnic groups in either the
unadjusted or adjusted model (p=0.415 and p=0.469, respectively; Table 59).
Post-term birth (>42 weeks gestation)
BMI
Unadjusted odds of post-term birth (>42 weeks) were not significant for either ethnic
group with a 1kg/m2 increase in maternal BMI. However, odds were lower for infants
of Pakistani women compared with infants of White British women (OR 0.99 (95%CI
0.91 to 1.08) for infants born to Pakistani women and OR 1.03 (95%CI 0.97 to 1.08)
for infants born to White British women). Following adjustment, odds increased
slightly but the results for both ethnic groups remained insignificant, staying lower for
infants born to Pakistani women compared with infants born to White British women
(AOR 1.00 (95%CI 0.88 to 1.14) and AOR 1.04 (95%CI 0.96 to 1.12); respectively).
When considering the interaction between ethnicity and BMI on post-term birth, there
was no significant difference between the shape of the association between BMI and
post-term birth in the two ethnic groups in either the unadjusted or adjusted model
(p=0.509 and p=0.891, respectively; Table 58).
251
GWG
GWG was not significantly associated with post-term birth in either ethnic group.
Despite this, odds were lower in infants of Pakistani women compared with infants of
White British women (OR 0.94 (95%CI 0.86 to 1.02) and OR 1.01 (95%CI 0.93 to
1.09); respectively). Following adjustment, odds increased for both ethnic groups, but
remained lower in infants of Pakistani women compared with infants of White British
women (AOR 0.95 (0.82 to 1.10) and AOR 1.09 (0.92 to 1.30), respectively). When
considering the interaction between ethnicity and GWG on post-term birth, there was
no significant difference between the shape of the association between GWG on
post-term birth in the two ethnic groups in either the unadjusted or adjusted model
(p=0.244 and p=0.138, respectively; Table 59).
Infant anthropometrics at birth
Birth weight
BMI
Birth weight significantly increased with increasing BMI in both ethnic groups. In the
unadjusted models, infants of Pakistani women a higher increase in birthweight
associated with a 1kg/m2 increase in maternal BMI compared with infants of White
British women (16.46g (95%CI 13.33 to 19.58) and 16.00g (95%CI 12.92 to 18.98),
respectively). Following adjustment, although the association was still significant, the
association reduced for infants of Pakistani women, whereas the effect size estimate
increased slightly for infants of White British women so that the overall effect was
smaller for infants of Pakistani women compared with infants of White British women
(13.77g (95%CI 9.24 to 18.30) and 16.67g (95%CI 12.46 to 20.87), respectively).
When considering the interaction between ethnicity and BMI on birth weight, there
was no significant difference between the shape of the association between BMI and
birth weight in the two ethnic groups in either the unadjusted or adjusted models
(P=0.820 and p=0.693, respectively; Table 58).
GWG
GWG was significantly positively associated with birth weight in both ethnic groups.
Infants of Pakistani women had lower birth weight associated with a 1kg increase in
GWG compared with infants of White British women (11.24g (95%CI 7.74 to 14.74)
252
and 15.10g (95%CI 10.85 to 19.36), respectively). Following adjustment, the strength
of the association increased for both ethnic groups (i.e. there was now a larger
increase in birth weight associated with a 1kg increase in GWG); although it was still
a lower association in infants of Pakistani women compared with infants of White
British women (22.92g (95%CI 18.07 to 27.78) and 24.14 (95%CI 18.67 to 30.21),
respectively). When considering the interaction between ethnicity and GWG on birth
weight, there was no significant difference between the shape of the association
between GWG on birth weight in the two ethnic groups in either the unadjusted or
adjusted model (p=0.167 and p=0.554, respectively; Table 59).
Infant abdominal circumference at birth
BMI
Unadjusted results showed that as maternal BMI increased, infant abdominal
circumference at birth significantly increased for both ethnic groups, although the
effect size for both was small (0.04cm (95%CI 0.03 to 0.06) for infants of Pakistani
women and 0.05cm (95%CI 0.03 to 0.06) for infants of White British women).
However, following adjustment, the association between maternal BMI and infant
abdominal circumference in infants of Pakistani was lower, and no longer significant,
while in infants of White British women, the association remained the same (0.02cm
(95%CI -0.01 to 0.04) and 0.05cm (95%CI 0.03 to 0.07); respectively). When
considering the interaction between ethnicity and BMI on infant abdominal
circumference at birth, there was no significant difference between the shape of the
association between BMI and infant abdominal circumference at birth in the two
ethnic groups in either the unadjusted or adjusted model (p=0.650 and 0.188,
respectively; Table 58).
GWG
GWG was positively associated with infant abdominal circumference at birth in both
ethnic groups. However, although the effect sizes were similar, in the unadjusted
models this only reached significance for infants of White British women (0.02cm
(95%CI <0.01 to 0.04) for infants of Pakistani women and 0.02cm (95%CI 0.01 to
0.05) for infants of White British women). Following adjustment, the direction of the
253
association remained the same, but the strength increased (there was now a larger
increase in abdominal circumference associated with a 1kg increase in GWG) and
now reached significance for both ethnic groups, and the effect size was very similar
for each, but the upper limit for the 95%CI was slightly higher for infants of White
British women (0.06cm (95%CI 0.03 to 0.09)) than for infants of Pakistani women
(0.06cm (95%CI 0.03 to 0.08)). When considering the interaction between ethnicity
and GWG on infant abdominal circumference at birth, there was no significant
difference between the shape of the association between GWG on infant abdominal
circumference at birth in the two ethnic groups in either the unadjusted or adjusted
model (p=0.560 and p=0.911, respectively; Table 59)
Infant head circumference at birth (cm)
BMI
In both the unadjusted and adjusted models, infant head circumference increased
significantly with increasing maternal BMI for both ethnic groups, although the effect
size was slightly smaller in infants born to Pakistani women (unadjusted 0.03cm
(95%CI 0.02 to 0.04) and adjusted 0.03cm (95%CI 0.01 to 0.04)) compared with
infants born to White British women (unadjusted and adjusted 0.04cm (95%CI 0.03 to
0.05)).When considering the interaction between ethnicity and BMI on infant head
circumference at birth, there was no significant difference between the shape of the
association between BMI and infant head circumference at birth in the two ethnic
groups in either the unadjusted or adjusted model (p=0.257 and 0.444, respectively;
Table 58).
GWG
GWG was significantly positively associated with infant head circumference at birth in
both the unadjusted and adjusted models for both ethnic groups. In the unadjusted
models there was no difference between the two ethnic groups (0.03cm (95%CI 0.02
to 0.04) for both). Following adjustment, the association strengthened in both ethnic
groups, and although both had the same coefficient, the confidence interval was
slightly wider for infants of Pakistani women compared with White British (0.05cm
(95%CI 0.03 to 0.06) for infants of Pakistani women and 0.05cm (95%CI 0.03 to
254
0.07) for infants of White British women). When considering the interaction between
ethnicity and GWG on infant head circumference at birth, there was no significant
difference between the shape of the association between GWG on infant head
circumference at birth in the two ethnic groups in either the unadjusted or adjusted
model (p=0.662 and p=0.872, respectively; Table 59).
Infant mid-arm circumference at birth (cm)
BMI
In the unadjusted models, infant mid-arm circumference at birth increased
significantly with increasing maternal BMI. This was true for both ethnic groups, and
the effect size was the same for each (0.02cm increase in infant mid arm
circumference per 1kg/m2 increase in maternal BMI (95% 0.02 to 0.03). The direction
and significance of the association did not alter for either ethnic groups following
adjustment, although the effect size was now smaller for infants of Pakistani women
compared with infants of White British women (0.02cm (95%CI 0.01 to 0.02) and
0.03cm (95%CI 0.02 to 0.03), respectively). When considering the interaction
between ethnicity and BMI on infant head circumference at birth, there was no
significant difference between the shape of the association between BMI and infant
head circumference at birth in the two ethnic groups in either the unadjusted or
adjusted model (p=0.643 and p=0.614 respectively; Table 58).
GWG
GWG was significantly positively associated with infant mid-arm circumference at
birth in both the unadjusted and adjusted models for both ethnic groups. In the
unadjusted models, there was a slightly weaker association for infants of Pakistani
women compared with infants of White British women (0.01cm per 1kg increase in
GWG (95%CI 0.01 to 0.02) and 0.02cm (95%CI 0.01 to 0.03), respectively).
Following adjustment, the association strengthened in both ethnic groups, but
remained weaker for infants of Pakistani women compared with infants of White
British women (0.03cm (95%CI 0.02 to 0.05) and 0.04cm (95%CI 0.02 to 0.05),
respectively) meaning that there was less mid arm circumference associated with a
1kg increase in GWG for infants of Pakistani women compared with infants of White
255
British women). When considering the interaction between ethnicity and GWG on
infant mid-arm circumference at birth, there was no significant difference between the
shape of the association between GWG on infant mid-arm circumference at birth in
the two ethnic groups in either the unadjusted or adjusted model (p=0.790 and
p=0.815, respectively; Table 59).
Infant subscapular SFT at birth
BMI
In unadjusted analysis, with increasing maternal BMI, infant SFT at birth significantly
increased for both ethnic groups, and was slightly higher for infants of Pakistani
women compared with infants of White British women, although the effect size was
very small for both ethnic groups (0.04mm (95%CI 0.03 to 0.05) and 0.03mm (95%CI
0.02 to 0.03), respectively). This remained the same following adjustment for infants
of Pakistani women, and decreased slightly in infants of White British women
(0.03mm (95%CI 0.02 to 0.04) and 0.03mm (0.01 to 0.04), respectively. When
considering the interaction between ethnicity and BMI on infant subscapular SFT at
birth, there was no significant difference between the shape of the association
between BMI and infant head circumference at birth in the two ethnic groups in either
the unadjusted or adjusted model (p=0.070 and p=0.712 respectively; Table 58).
GWG
GWG was positively associated with infant subscapular SFT at birth in both ethnic
groups.. Despite this, the effect size for both ethnic groups was very small (0.01mm
(95%CI 0.01 to 0.02) for infants of Pakistani women and 0.02mm (95%CI 0.01 to
0.03) for infants of White British women). Following adjustment, the direction of the
association remained the same, but the effect sizes increased slightly (meaning that
there was a larger increase in infant subscapular SFT associated with a 1kg increase
in GWG, but the effect sizes were still very small) for both infants of Pakistani women
and for infants of White British women (0.03mm (95%CI 0.01 to 0.04) for infants of
Pakistani women and 0.03 (95%CI 0.02 to 0.05) for infants of White British women). .
When considering the interaction between ethnicity and GWG on subscapular SFT at
birth, there was no significant difference between the shape of the association
256
between GWG on infant subscapular SFT at birth in the two ethnic groups in either
the unadjusted or adjusted model (p=0.127 and p=0.310, respectively; Table 59).
Infant tricep SFT at birth
BMI
Infant tricep SFT increased significantly with increasing maternal BMI, this was true
for both ethnic groups although was slightly higher for infants of Pakistani women
compared with infants of White British women prior to adjustment; despite this, the
effect sizes were small for both ethnic groups (0.03mm (95%CI 0.03 to 0.04) for
infants of Pakistani women and 0.02mm (95%CI 0.02 to 0.03) for infants of White
British women). Following adjustment, these values increased slightly for infants of
White British women and the effect size was now the same for both ethnic groups
(0.03mm increase in infant tricep SFT at birth per 1kg GWG (95%CI 0.01 to 0.04)).
Again, although significantly increased, it is worth noting that the effect sizes were
small. When considering the interaction between ethnicity and BMI on infant tricep
SFT, there was no significant difference between the shape of the association
between BMI and infant tricep SFT in the two ethnic groups in either the unadjusted
or adjusted model (p=0.137 and p=0.363, respectively; Table 58).
GWG
GWG was positively associated with infant tricep SFT at birth in both ethnic groups.
However, in the unadjusted models this only reached significance for infants of White
British women, and the effect sizes were small (0.01mm (<0.00 to 0.02) for infants of
Pakistani women and 0.03mm (95%CI 0.01 to 0.04) for infants of White British
women). Following adjustment, the direction of the association remained the same,
but the strength increased (meaning there was now a larger increase in infant tricep
SFT associated with a 1kg increase in GWG) and now reached significance for both
infants of Pakistani women, and for infants of White British women, although again,
the effect sizes remained small (0.03mm (95%CI 0.02 to 0.04) for infants of Pakistani
women and 0.04mm (95%CI 0.02 to 0.06) for infants of White British women). When
considering the interaction between ethnicity and GWG on subscapular SFT at birth,
there was a significant difference between the shape of the association between
257
GWG on infant subscapular SFT at birth in the two ethnic groups in the unadjusted
model (p=0.028; Table 59). However, following adjustment this difference was no
longer significant (p=0.116; Table 59).
Infant anthropometrics at 3 years of age
Infant weight at 3 years
BMI
In unadjusted analysis, infant weight at 3 years was significantly positively associated
with maternal BMI at booking for both ethnic groups, although the effect size was
small; for both ethnic groups, a 1kg/m2 increase in maternal BMI was associated with
0.06kg increase in infant weight at three years (95%CI 0.02 to 0.10). Following
adjustment, the effect size increased for both ethnic groups and was now slightly
weaker for infants of Pakistani women (i.e. had a smaller amount of weight at 3 years
associated with a 1kg/m2 increase in maternal BMI) compared with infants of White
British women, and effect sizes were still relatively small (0.08kg (95%CI 0.03 to
0.13) for Pakistani women and 0.09kg (95%CI 0.04 to 0.14) for White British women).
When considering the interaction between ethnicity and BMI on infant weight at 3
years, there was no significant difference between the shape of the association in the
two ethnic groups in either the unadjusted or adjusted model (p=0.970 and p=0.549,
respectively; Table 58).
GWG
In unadjusted analysis, although neither association was significant and the effect
sizes were small, infants of Pakistani women had an increase in weight for 1kg GWG
(0.05kg (95%CI -0.00 to 0.10) compared with infants of White British women, who
had a slight decrease in weight at 3 years of age (-0.01kg (95%CI -0.06 to 0.05). In
adjusted analysis, the association increased slightly for both ethnic groups, and
remained higher in infants of Pakistani women compared with infants of White British
women, (0.06kg (95%CI >0.00 to 0.13) for infants of Pakistani women and 0.01kg
(95%CI -0.08 to 0.12) for infants of White British women. When considering the
interaction between ethnicity and GWG on infant weight at 3 years, there was no
258
significant difference between the shape of the association in the two ethnic groups
in either the unadjusted or adjusted model (p=0.185 and p=0.809, respectively; Table
59).
Infant abdominal circumference at 3 years
BMI
In unadjusted analysis, infant abdominal circumference at 3 years was significantly
associated with maternal BMI at booking, and the effect size was the same in infants
of both ethnic groups (0.09cm (95%CI 0.01 to 0.17) for infants of Pakistani women
and 0.09cm (95%CI 0.03 to 0.16) for infants of White British women). The direction of
the association remained the same following adjustment, although the coefficient
increased for both ethnic groups and the effect size was now greater for infants of
Pakistani women compared with infants of White British women (0.16cm (95%CI 0.06
to 0.27) for infants of Pakistani women and 0.12cm (95%CI 0.02 to 0.22) for infants
of White British women). When considering the interaction between ethnicity and BMI
on infant abdominal circumference at 3 years, there was no significant difference
between the shape of the association in the two ethnic groups in either the
unadjusted or adjusted model (p=0.900 and p=0.878, respectively; Table 58).
GWG
There was no significant association between infant abdominal circumference at 3
years and GWG for either ethnic group in either unadjusted or adjusted analysis.
Despite this, in unadjusted analysis, the direction of the association was positive for
infants of Pakistani women and negative for infants of White British women (0.04cm
(95%CI -0.05 to 0.15) for infants of Pakistani women and -0.03 (95%CI -0.15 to 0.09)
for infants of White British women). Following adjustment, the effect size increased
for both ethnic groups, meaning that it was now positive for infants of White British
women, although still not significant. The overall effect size was also now lower for
infants of Pakistani women, but only very slightly (0.07cm (95%CI -0.08 to 0.21) for
infants of Pakistani women and 0.08 (-0.12 to 0.29) and for infants of White British
women). When considering the interaction between ethnicity and GWG on infant
abdominal circumference at 3 years, there was no significant difference between the
259
shape of the association in the two ethnic groups in either the unadjusted or adjusted
model (p=0.359 and p=0.387, respectively; Table 59).
Infant tricep SFT at 3 years
BMI
There was no significant association between infant tricep SFT at 3 years and
maternal BMI at booking for either ethnic group in either unadjusted or adjusted
analysis. However, the effect size was greater for infants of Pakistani women
compared with infants of White British women in both unadjusted (0.05mm (95%CI -
0.02 to 0.11) and 0.02mm (95%CI -0.04 to 0.08), respectively) and adjusted (0.07mm
(95%CI -0.01 to 0.15) and 0.02 (95%CO -0.07 to 0.12), respectively), although the
effect size was small. When considering the interaction between ethnicity and BMI on
infant tricep SFT at 3 years, there was no significant difference between the shape of
the association in the two ethnic groups in either the unadjusted or adjusted model
(p=0.493 and p=0.629, respectively; Table 58).
GWG
There was no significant association between infant tricep SFT at 3 years and GWG
for either ethnic group in either unadjusted or adjusted analysis. In unadjusted
analysis, the effect size was larger for infants of Pakistani women compared with
infants of White British women (0.04mm (95%CI -0.04 to 0.12) and 0.02mm (95%CI -
0.10 to 0.13), respectively). Following adjustment, although the effect size increased
for both ethnic groups, it was still larger for infants of Pakistani women compared with
White British infants (0.09mm (95%CI -0.01 to 0.18) and 0.04 (95%CI -0.26 to 0.34),
respectively. When considering the interaction between ethnicity and GWG on infant
tricep SFT at 3 years, there was no significant difference between the shape of the
association in the two ethnic groups in either the unadjusted or adjusted model
(p=0.708 and p=0.813, respectively; Table 59).
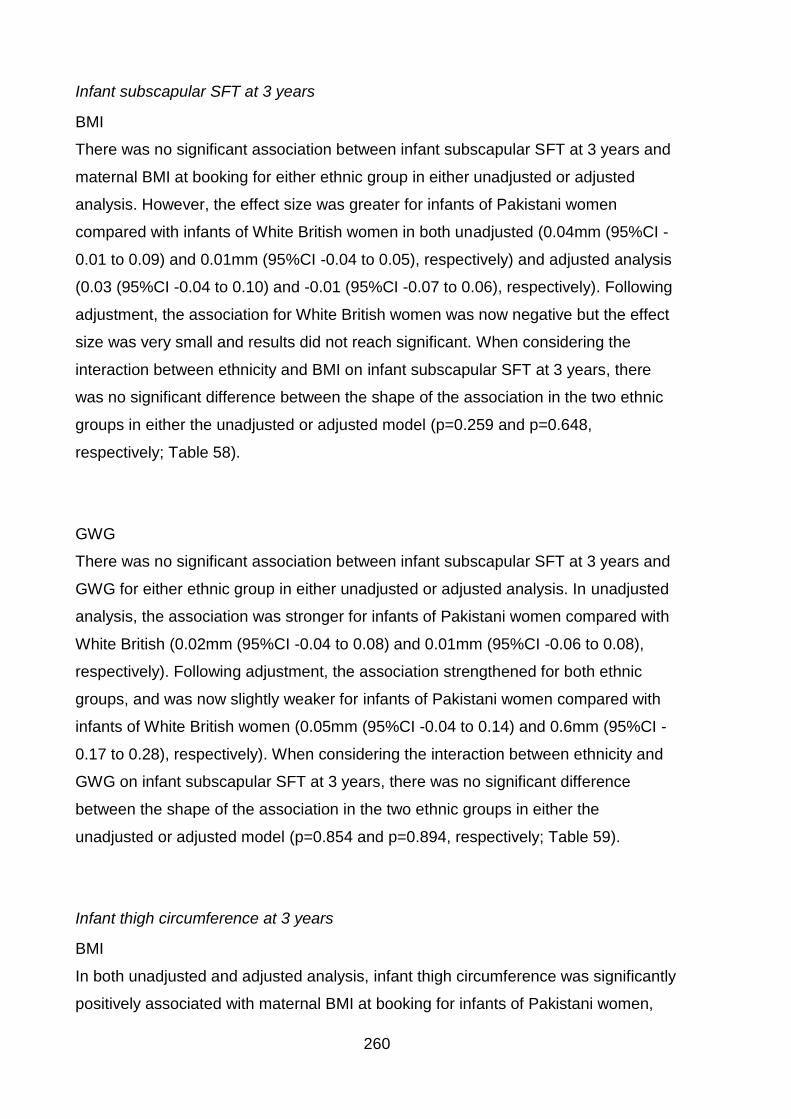
260
Infant subscapular SFT at 3 years
BMI
There was no significant association between infant subscapular SFT at 3 years and
maternal BMI at booking for either ethnic group in either unadjusted or adjusted
analysis. However, the effect size was greater for infants of Pakistani women
compared with infants of White British women in both unadjusted (0.04mm (95%CI -
0.01 to 0.09) and 0.01mm (95%CI -0.04 to 0.05), respectively) and adjusted analysis
(0.03 (95%CI -0.04 to 0.10) and -0.01 (95%CI -0.07 to 0.06), respectively). Following
adjustment, the association for White British women was now negative but the effect
size was very small and results did not reach significant. When considering the
interaction between ethnicity and BMI on infant subscapular SFT at 3 years, there
was no significant difference between the shape of the association in the two ethnic
groups in either the unadjusted or adjusted model (p=0.259 and p=0.648,
respectively; Table 58).
GWG
There was no significant association between infant subscapular SFT at 3 years and
GWG for either ethnic group in either unadjusted or adjusted analysis. In unadjusted
analysis, the association was stronger for infants of Pakistani women compared with
White British (0.02mm (95%CI -0.04 to 0.08) and 0.01mm (95%CI -0.06 to 0.08),
respectively). Following adjustment, the association strengthened for both ethnic
groups, and was now slightly weaker for infants of Pakistani women compared with
infants of White British women (0.05mm (95%CI -0.04 to 0.14) and 0.6mm (95%CI -
0.17 to 0.28), respectively). When considering the interaction between ethnicity and
GWG on infant subscapular SFT at 3 years, there was no significant difference
between the shape of the association in the two ethnic groups in either the
unadjusted or adjusted model (p=0.854 and p=0.894, respectively; Table 59).
Infant thigh circumference at 3 years
BMI
In both unadjusted and adjusted analysis, infant thigh circumference was significantly
positively associated with maternal BMI at booking for infants of Pakistani women,
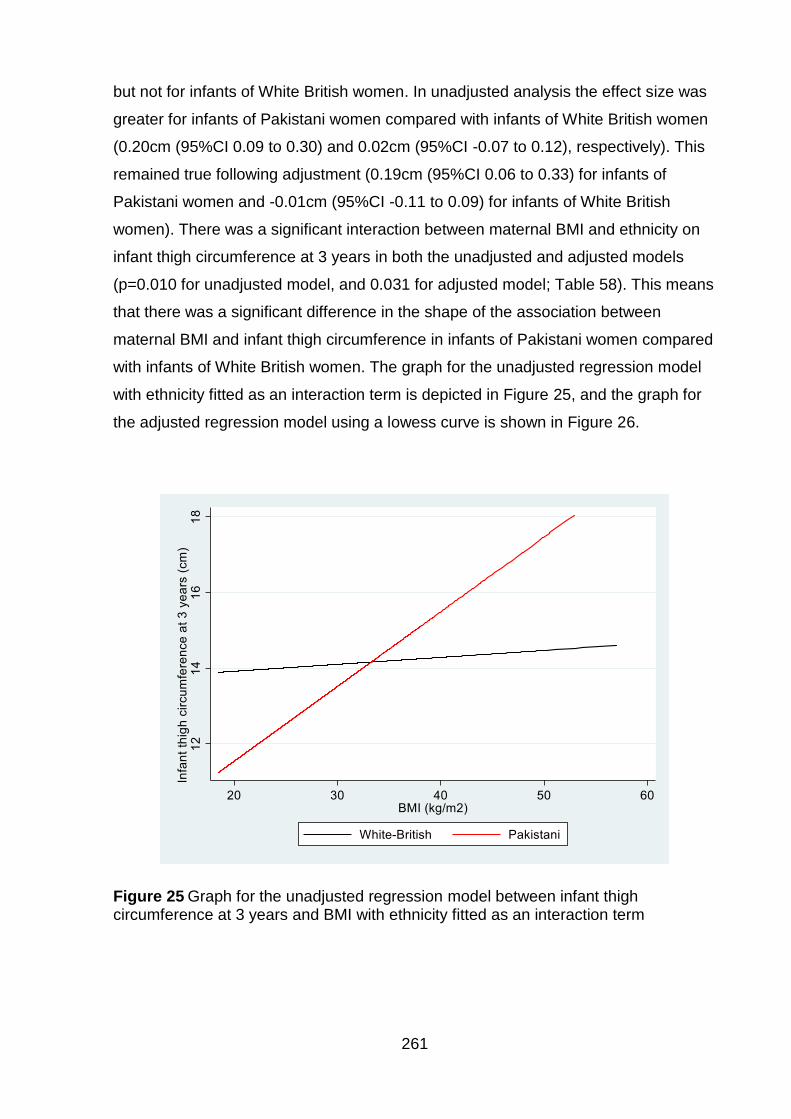
261
but not for infants of White British women. In unadjusted analysis the effect size was
greater for infants of Pakistani women compared with infants of White British women
(0.20cm (95%CI 0.09 to 0.30) and 0.02cm (95%CI -0.07 to 0.12), respectively). This
remained true following adjustment (0.19cm (95%CI 0.06 to 0.33) for infants of
Pakistani women and -0.01cm (95%CI -0.11 to 0.09) for infants of White British
women). There was a significant interaction between maternal BMI and ethnicity on
infant thigh circumference at 3 years in both the unadjusted and adjusted models
(p=0.010 for unadjusted model, and 0.031 for adjusted model; Table 58). This means
that there was a significant difference in the shape of the association between
maternal BMI and infant thigh circumference in infants of Pakistani women compared
with infants of White British women. The graph for the unadjusted regression model
with ethnicity fitted as an interaction term is depicted in Figure 25, and the graph for
the adjusted regression model using a lowess curve is shown in Figure 26.
Figure 25 Graph for the unadjusted regression model between infant thigh circumference at 3 years and BMI with ethnicity fitted as an interaction term
262
Figure 26 Two-way lowess smoother plot of the adjusted regression model between infant thigh circumference at 3 years and BMI with ethnicity fitted as an interaction term
GWG
There was no significant association between infant thigh circumference at 3 years
and GWG for either ethnic group in either unadjusted or adjusted analysis. In
unadjusted analysis, the association was negative for infants of Pakistani women and
positive for infants of White British women (-0.08cm (95%CI -0.20 to 0.05) and 0.01
(95%CI -0.13 to 0.16), respectively). Following adjustment, the association was now
positive for both ethnic groups, although was weaker for infants of Pakistani women
compared with infants of White British women (0.04cm (95%CI -0.15 to 0.24) and
0.12cm (95%CI -0.16 to 0.40), respectively). When considering the interaction
between ethnicity and GWG on infant thigh circumference at 3 years, there was no
significant difference between the shape of the association in the two ethnic groups
in either the unadjusted or adjusted model (p=0.369 and p=0.113, respectively; Table
59).
263
7.1.8 Gestational weight gain per week
When divided by the number of weeks gestation, there were very few changes to the
direction, and significance of the associations overall (although the actual effect sizes
were altered by using GWG per week rather than overall GWG; tables of results for
maternal and infant outcomes are attached in Appendix 16, pgs.375-377). Please
note that some of the confidence intervals were very wide in analysis using GWG per
week as an exposure and so results should be interpreted with caution.
When using GWG per week, there were now significant interactions between
ethnicity and GWG per week on pre-term birth, in both unadjusted (p=0.030) and
adjusted models (p=0.008). Results showed that in adjusted models infants born to
Pakistani women had higher odds of pre-term birth compared with infants born to
White British women with increasing GWG per week (AOR 2.44 (95%CI 0.25 to
24.00), and AOR 0.10 (95%CI <0.01 to 0.24), respectively). There were also changes
to the results for infant tricep SFT at birth, and at three years. In the analysis of
overall GWG, the only significant interaction had been for infant tricep SFT at birth in
the unadjusted analysis. Using GWG per week, significant interactions were
identified in both the unadjusted (p=0.022) and adjusted models (p=0.016). In
addition, there had been no significant interactions between ethnicity and GWG on
infant thigh SFT at three years. However, when GWG per week was used, there was
a significant interaction for infant thigh SFT in the adjusted model (p=0.030).
7.1.9 Gestational weight gain categorised according to maternal body mass
index; comparing use of general population body mass index criteria with
Asian specific body mass index criteria
GWG was also considered as a categorical exposure, based on maternal BMI group
using both the general population BMI cut offs, and the Asian specific BMI cut offs,
results are shown in Tables 60 and 61; Table 60 for maternal outcomes, and Table
61 for infant outcomes.
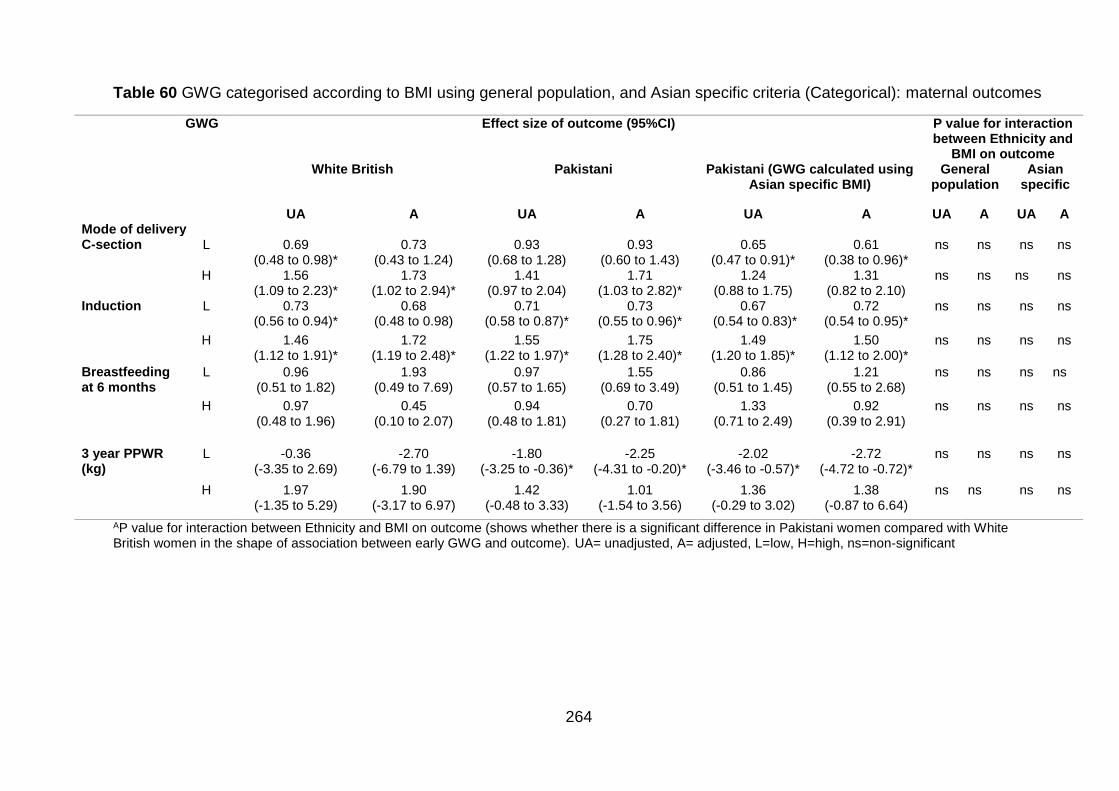
264
Table 60 GWG categorised according to BMI using general population, and Asian specific criteria (Categorical): maternal outcomes
GWG Effect size of outcome (95%CI) P value for interaction between Ethnicity and
BMI on outcome White British Pakistani Pakistani (GWG calculated using
Asian specific BMI) General
population Asian
specific
UA A UA A UA A UA A UA A Mode of delivery C-section L 0.69
(0.48 to 0.98)* 0.73
(0.43 to 1.24) 0.93
(0.68 to 1.28) 0.93
(0.60 to 1.43) 0.65
(0.47 to 0.91)* 0.61
(0.38 to 0.96)* ns ns ns ns
H 1.56 (1.09 to 2.23)*
1.73 (1.02 to 2.94)*
1.41 (0.97 to 2.04)
1.71 (1.03 to 2.82)*
1.24 (0.88 to 1.75)
1.31 (0.82 to 2.10)
ns ns ns ns
Induction L 0.73 (0.56 to 0.94)*
0.68 (0.48 to 0.98)
0.71 (0.58 to 0.87)*
0.73 (0.55 to 0.96)*
0.67 (0.54 to 0.83)*
0.72 (0.54 to 0.95)*
ns ns ns ns
H 1.46 (1.12 to 1.91)*
1.72 (1.19 to 2.48)*
1.55 (1.22 to 1.97)*
1.75 (1.28 to 2.40)*
1.49 (1.20 to 1.85)*
1.50 (1.12 to 2.00)*
ns ns ns ns
Breastfeeding at 6 months
L 0.96 (0.51 to 1.82)
1.93 (0.49 to 7.69)
0.97 (0.57 to 1.65)
1.55 (0.69 to 3.49)
0.86 (0.51 to 1.45)
1.21 (0.55 to 2.68)
ns ns ns ns
H 0.97 (0.48 to 1.96)
0.45 (0.10 to 2.07)
0.94 (0.48 to 1.81)
0.70 (0.27 to 1.81)
1.33 (0.71 to 2.49)
0.92 (0.39 to 2.91)
ns ns ns ns
3 year PPWR (kg)
L -0.36 (-3.35 to 2.69)
-2.70 (-6.79 to 1.39)
-1.80 (-3.25 to -0.36)*
-2.25 (-4.31 to -0.20)*
-2.02 (-3.46 to -0.57)*
-2.72 (-4.72 to -0.72)*
ns ns ns ns
H 1.97 (-1.35 to 5.29)
1.90 (-3.17 to 6.97)
1.42 (-0.48 to 3.33)
1.01 (-1.54 to 3.56)
1.36 (-0.29 to 3.02)
1.38 (-0.87 to 6.64)
ns ns ns ns
AP value for interaction between Ethnicity and BMI on outcome (shows whether there is a significant difference in Pakistani women compared with White British women in the shape of association between early GWG and outcome). UA= unadjusted, A= adjusted, L=low, H=high, ns=non-significant
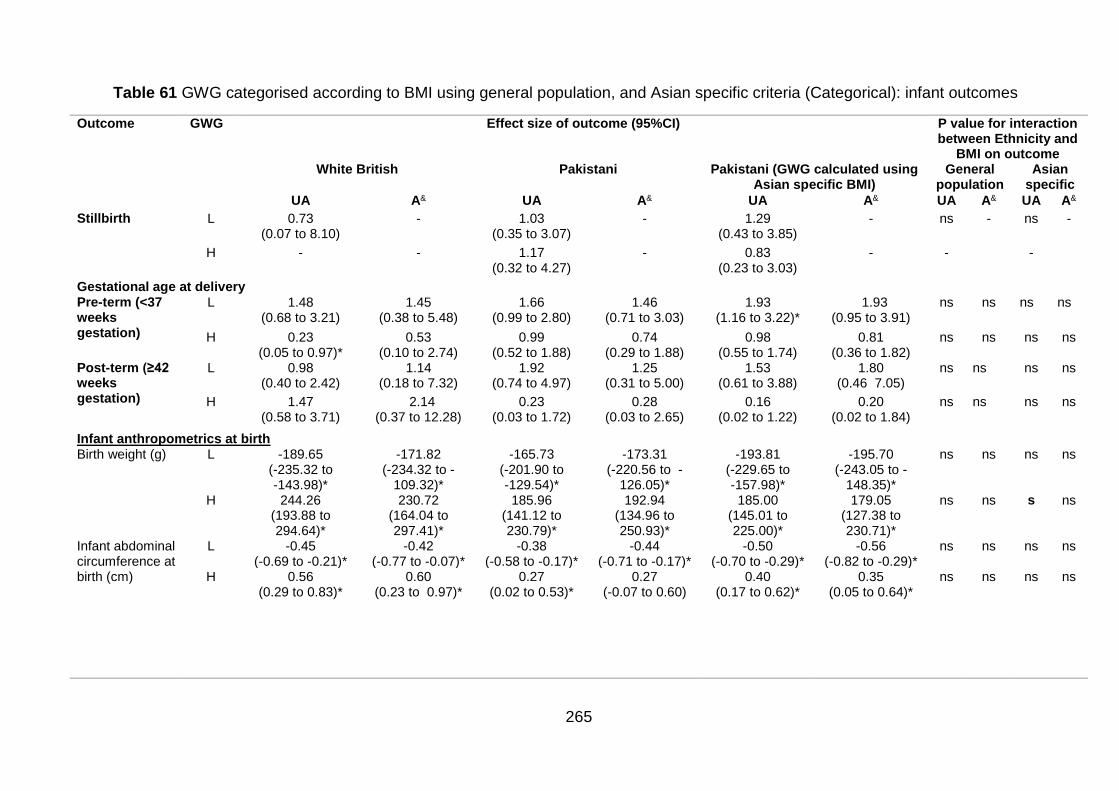
265
Table 61 GWG categorised according to BMI using general population, and Asian specific criteria (Categorical): infant outcomes
Outcome GWG Effect size of outcome (95%CI) P value for interaction between Ethnicity and
BMI on outcome White British Pakistani Pakistani (GWG calculated using
Asian specific BMI) General
population Asian
specific
UA A& UA A& UA A& UA A& UA A&
Stillbirth L 0.73 (0.07 to 8.10)
- 1.03 (0.35 to 3.07)
- 1.29 (0.43 to 3.85)
- ns - ns -
H - - 1.17 (0.32 to 4.27)
- 0.83 (0.23 to 3.03)
- - -
Gestational age at delivery Pre-term (<37 weeks gestation)
L 1.48 (0.68 to 3.21)
1.45 (0.38 to 5.48)
1.66 (0.99 to 2.80)
1.46 (0.71 to 3.03)
1.93 (1.16 to 3.22)*
1.93 (0.95 to 3.91)
ns ns ns ns
H 0.23 (0.05 to 0.97)*
0.53 (0.10 to 2.74)
0.99 (0.52 to 1.88)
0.74 (0.29 to 1.88)
0.98 (0.55 to 1.74)
0.81 (0.36 to 1.82)
ns ns ns ns
Post-term (≥42 weeks gestation)
L 0.98 (0.40 to 2.42)
1.14 (0.18 to 7.32)
1.92 (0.74 to 4.97)
1.25 (0.31 to 5.00)
1.53 (0.61 to 3.88)
1.80 (0.46 7.05)
ns ns ns ns
H 1.47 (0.58 to 3.71)
2.14 (0.37 to 12.28)
0.23 (0.03 to 1.72)
0.28 (0.03 to 2.65)
0.16 (0.02 to 1.22)
0.20 (0.02 to 1.84)
ns ns ns ns
Infant anthropometrics at birth Birth weight (g) L -189.65
(-235.32 to -143.98)*
-171.82 (-234.32 to -
109.32)*
-165.73 (-201.90 to -129.54)*
-173.31 (-220.56 to -
126.05)*
-193.81 (-229.65 to -157.98)*
-195.70 (-243.05 to -
148.35)*
ns ns ns ns
H 244.26 (193.88 to 294.64)*
230.72 (164.04 to 297.41)*
185.96 (141.12 to 230.79)*
192.94 (134.96 to 250.93)*
185.00 (145.01 to 225.00)*
179.05 (127.38 to 230.71)*
ns ns s ns
Infant abdominal circumference at birth (cm)
L -0.45 (-0.69 to -0.21)*
-0.42 (-0.77 to -0.07)*
-0.38 (-0.58 to -0.17)*
-0.44 (-0.71 to -0.17)*
-0.50 (-0.70 to -0.29)*
-0.56 (-0.82 to -0.29)*
ns ns ns ns
H 0.56 (0.29 to 0.83)*
0.60 (0.23 to 0.97)*
0.27 (0.02 to 0.53)*
0.27 (-0.07 to 0.60)
0.40 (0.17 to 0.62)*
0.35 (0.05 to 0.64)*
ns ns ns ns
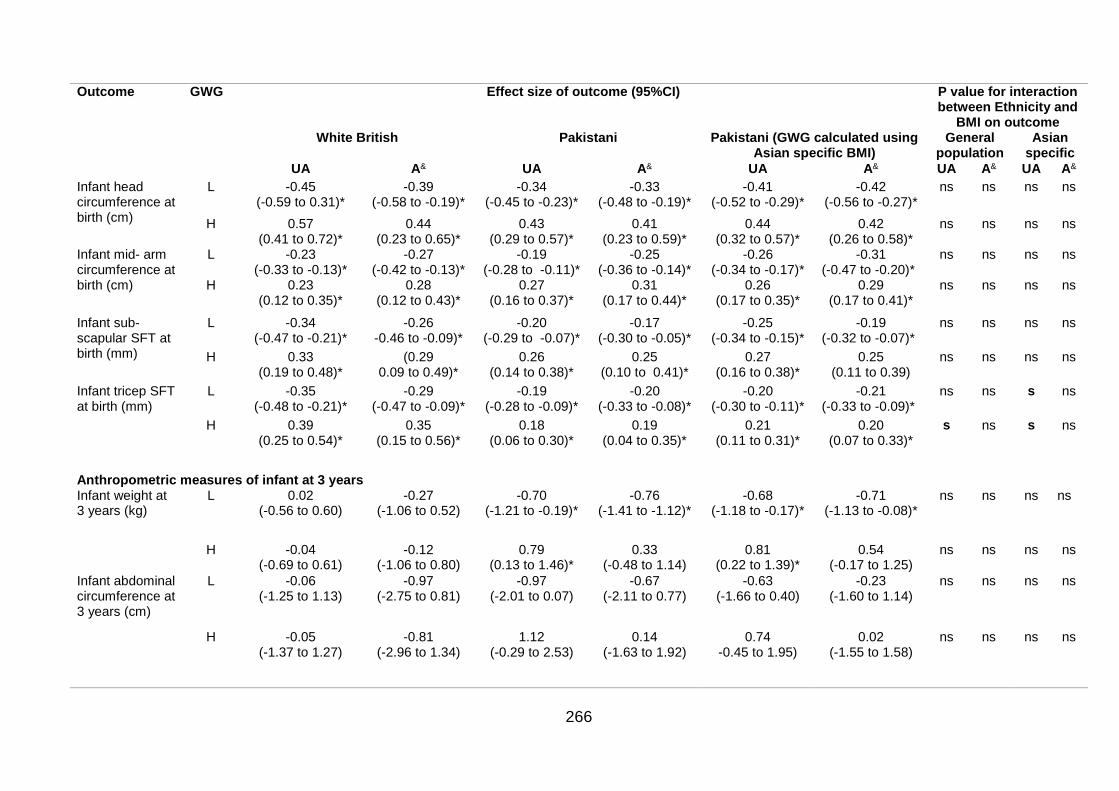
266
Outcome GWG Effect size of outcome (95%CI) P value for interaction between Ethnicity and
BMI on outcome White British Pakistani Pakistani (GWG calculated using
Asian specific BMI) General
population Asian
specific
UA A& UA A& UA A& UA A& UA A&
Infant head circumference at birth (cm)
L -0.45 (-0.59 to 0.31)*
-0.39 (-0.58 to -0.19)*
-0.34 (-0.45 to -0.23)*
-0.33 (-0.48 to -0.19)*
-0.41 (-0.52 to -0.29)*
-0.42 (-0.56 to -0.27)*
ns ns ns ns
H 0.57 (0.41 to 0.72)*
0.44 (0.23 to 0.65)*
0.43 (0.29 to 0.57)*
0.41 (0.23 to 0.59)*
0.44 (0.32 to 0.57)*
0.42 (0.26 to 0.58)*
ns ns ns ns
Infant mid- arm circumference at birth (cm)
L -0.23 (-0.33 to -0.13)*
-0.27 (-0.42 to -0.13)*
-0.19 (-0.28 to -0.11)*
-0.25 (-0.36 to -0.14)*
-0.26 (-0.34 to -0.17)*
-0.31 (-0.47 to -0.20)*
ns ns ns ns
H 0.23 (0.12 to 0.35)*
0.28 (0.12 to 0.43)*
0.27 (0.16 to 0.37)*
0.31 (0.17 to 0.44)*
0.26 (0.17 to 0.35)*
0.29 (0.17 to 0.41)*
ns ns ns ns
Infant sub-scapular SFT at birth (mm)
L -0.34 (-0.47 to -0.21)*
-0.26 -0.46 to -0.09)*
-0.20 (-0.29 to -0.07)*
-0.17 (-0.30 to -0.05)*
-0.25 (-0.34 to -0.15)*
-0.19 (-0.32 to -0.07)*
ns ns ns ns
H 0.33 (0.19 to 0.48)*
(0.29 0.09 to 0.49)*
0.26 (0.14 to 0.38)*
0.25 (0.10 to 0.41)*
0.27 (0.16 to 0.38)*
0.25 (0.11 to 0.39)
ns ns ns ns
Infant tricep SFT at birth (mm)
L -0.35 (-0.48 to -0.21)*
-0.29 (-0.47 to -0.09)*
-0.19 (-0.28 to -0.09)*
-0.20 (-0.33 to -0.08)*
-0.20 (-0.30 to -0.11)*
-0.21 (-0.33 to -0.09)*
ns ns s ns
H 0.39 (0.25 to 0.54)*
0.35 (0.15 to 0.56)*
0.18 (0.06 to 0.30)*
0.19 (0.04 to 0.35)*
0.21 (0.11 to 0.31)*
0.20 (0.07 to 0.33)*
s ns s ns
Anthropometric measures of infant at 3 years Infant weight at 3 years (kg)
L 0.02 (-0.56 to 0.60)
-0.27 (-1.06 to 0.52)
-0.70 (-1.21 to -0.19)*
-0.76 (-1.41 to -1.12)*
-0.68 (-1.18 to -0.17)*
-0.71 (-1.13 to -0.08)*
ns ns ns ns
H -0.04 (-0.69 to 0.61)
-0.12 (-1.06 to 0.80)
0.79 (0.13 to 1.46)*
0.33 (-0.48 to 1.14)
0.81 (0.22 to 1.39)*
0.54 (-0.17 to 1.25)
ns ns ns ns
Infant abdominal circumference at 3 years (cm)
L -0.06 (-1.25 to 1.13)
-0.97 (-2.75 to 0.81)
-0.97 (-2.01 to 0.07)
-0.67 (-2.11 to 0.77)
-0.63 (-1.66 to 0.40)
-0.23 (-1.60 to 1.14)
ns ns ns ns
H -0.05 (-1.37 to 1.27)
-0.81 (-2.96 to 1.34)
1.12 (-0.29 to 2.53)
0.14 (-1.63 to 1.92)
0.74 -0.45 to 1.95)
0.02 (-1.55 to 1.58)
ns ns ns ns
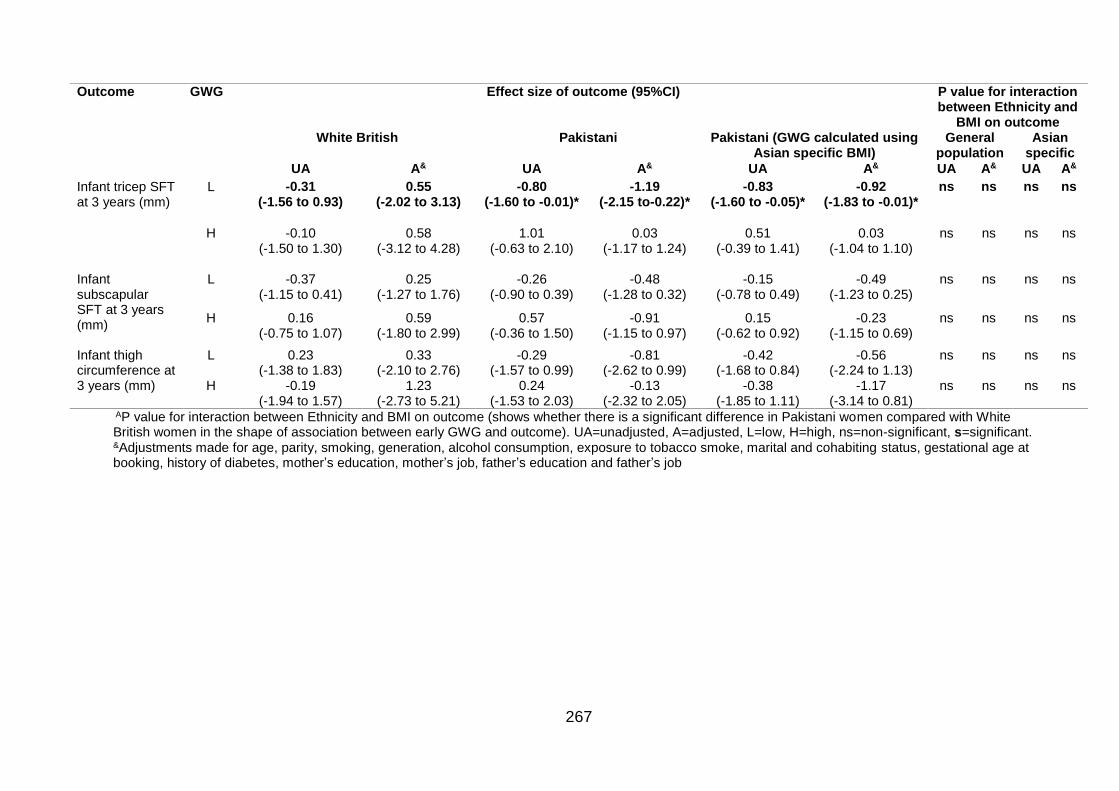
267
Outcome GWG Effect size of outcome (95%CI) P value for interaction between Ethnicity and
BMI on outcome White British Pakistani Pakistani (GWG calculated using
Asian specific BMI) General
population Asian
specific
UA A& UA A& UA A& UA A& UA A&
Infant tricep SFT at 3 years (mm)
L -0.31 (-1.56 to 0.93)
0.55 (-2.02 to 3.13)
-0.80 (-1.60 to -0.01)*
-1.19 (-2.15 to-0.22)*
-0.83 (-1.60 to -0.05)*
-0.92 (-1.83 to -0.01)*
ns ns ns ns
H -0.10 (-1.50 to 1.30)
0.58 (-3.12 to 4.28)
1.01 (-0.63 to 2.10)
0.03 (-1.17 to 1.24)
0.51 (-0.39 to 1.41)
0.03 (-1.04 to 1.10)
ns ns ns ns
Infant subscapular SFT at 3 years (mm)
L -0.37 (-1.15 to 0.41)
0.25 (-1.27 to 1.76)
-0.26 (-0.90 to 0.39)
-0.48 (-1.28 to 0.32)
-0.15 (-0.78 to 0.49)
-0.49 (-1.23 to 0.25)
ns ns ns ns
H 0.16 (-0.75 to 1.07)
0.59 (-1.80 to 2.99)
0.57 (-0.36 to 1.50)
-0.91 (-1.15 to 0.97)
0.15 (-0.62 to 0.92)
-0.23 (-1.15 to 0.69)
ns ns ns ns
Infant thigh circumference at 3 years (mm)
L 0.23 (-1.38 to 1.83)
0.33 (-2.10 to 2.76)
-0.29 (-1.57 to 0.99)
-0.81 (-2.62 to 0.99)
-0.42 (-1.68 to 0.84)
-0.56 (-2.24 to 1.13)
ns ns ns ns
H -0.19 (-1.94 to 1.57)
1.23 (-2.73 to 5.21)
0.24 (-1.53 to 2.03)
-0.13 (-2.32 to 2.05)
-0.38 (-1.85 to 1.11)
-1.17 (-3.14 to 0.81)
ns ns ns ns
AP value for interaction between Ethnicity and BMI on outcome (shows whether there is a significant difference in Pakistani women compared with White British women in the shape of association between early GWG and outcome). UA=unadjusted, A=adjusted, L=low, H=high, ns=non-significant, s=significant. &Adjustments made for age, parity, smoking, generation, alcohol consumption, exposure to tobacco smoke, marital and cohabiting status, gestational age at booking, history of diabetes, mother’s education, mother’s job, father’s education and father’s job
268
Significant associations within the ethnic groups were identified for some pregnancy
outcomes; for the mother these were; C-section, induction and PPWR, and for the
infant these were anthropometric measures at birth (birth weight, abdominal
circumference, MUAC and tricep SFT), and infant anthropometrics at three years of
age (weight and tricep SFT). Despite the significant associations within the ethnic
groups, there were no significant interactions between ethnicity and GWG on any of
the outcomes following adjustment. Although application of the Asian specific BMI
criteria to calculate level of GWG altered the strength of the association with the
pregnancy outcomes of interest, there were still no significant interactions between
ethnicity and GWG on pregnancy outcomes following adjustment. This suggests that
there is no significant ethnic difference in the shape of the association between each
pregnancy outcome and GWG according to maternal BMI category, independent of
whether BMI criteria for the general population or the Asian population are used.
When interpreting the results in Tables 60 and 61, caution should be applied where
the sample size is small. Sample size effects this analysis more because GWG is
categorised; it is a particular issue for binary outcomes, or where the analysis uses a
subsample of the BiB cohort (BIB1000, at a later stage of follow up and therefore is
subject to loss to follow up), particularly for adjusted analysis. The effect of a smaller
sample size is reflected in the width of the 95%CI estimates.
7.2 Structural equation modelling for gestational weight gain
This section will present the results from SEM analysis investigating indirect and
direct predictors of GWG using data from the BiB cohort. Figure 27 illustrates path
analysis (SEM without the use of latent variables) for GWG as an outcome, following
removal of insignificant paths (p>0.05), and variables with a standardized total effect
β coefficient on GWG <0.100 for clarity. Removal of variables from the model was
irrespective of direction of effect, but for this model, excluded key variables of interest
ethnicity and GDM, which were retained. The sample size for this analysis was
n=1,312. In Figure 27, significant effects are included and represented by arrows.
These arrows are labelled with β coefficients, which give an indication of effect size
and direction (+ is a positive association i.e. outcome increases with one unit
increase of explanatory variables, - is a negative association i.e. outcome decreases
with a one unit increase in explanatory variable). The direction of the arrows
269
represents direction of hypothesised causal flow; solid arrows indicate direct effects
(i.e. exposure → outcome) and dashed arrows indicate indirect effects (i.e.
exposure→ mediator → outcome). In Figure 27, numbers in brackets within the
boxes show the variance unexplained by the model for each variable. A full
breakdown of direct, indirect and total effects for the model depicted in Figure 27 is
given in Table 62.
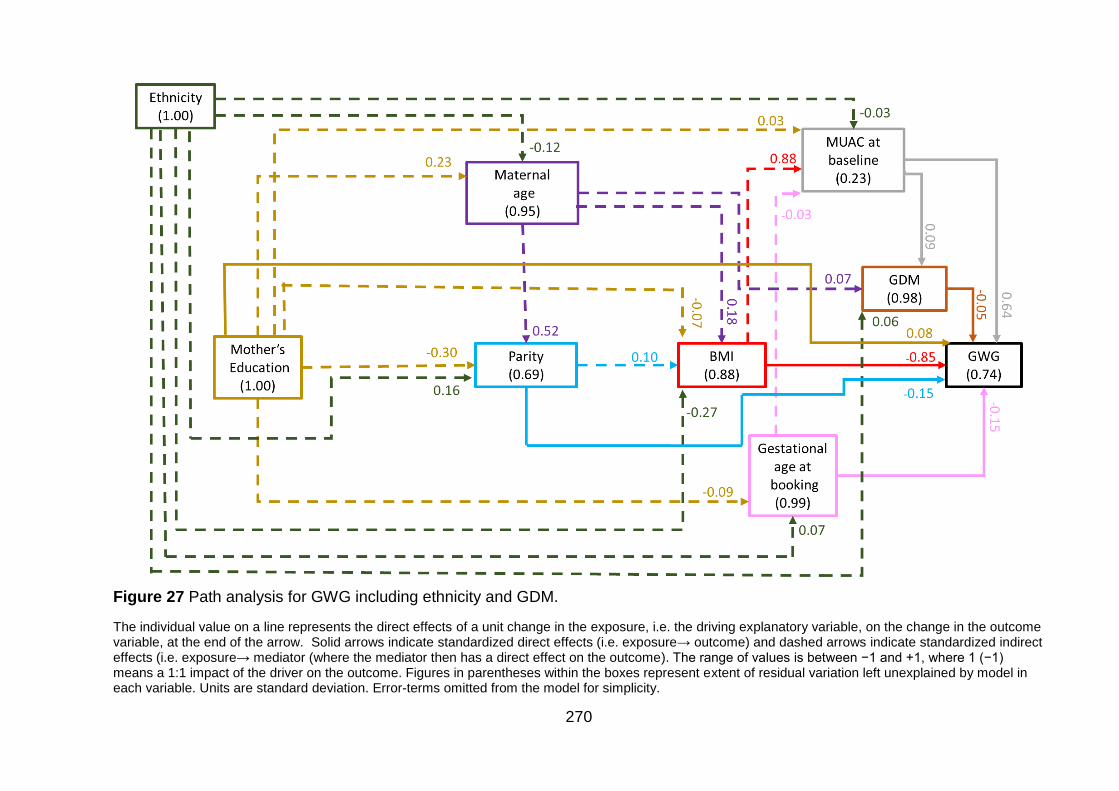
270
Figure 27 Path analysis for GWG including ethnicity and GDM.
The individual value on a line represents the direct effects of a unit change in the exposure, i.e. the driving explanatory variable, on the change in the outcome variable, at the end of the arrow. Solid arrows indicate standardized direct effects (i.e. exposure→ outcome) and dashed arrows indicate standardized indirect effects (i.e. exposure→ mediator (where the mediator then has a direct effect on the outcome). The range of values is between −1 and +1, where 1 (−1) means a 1:1 impact of the driver on the outcome. Figures in parentheses within the boxes represent extent of residual variation left unexplained by model in each variable. Units are standard deviation. Error-terms omitted from the model for simplicity.
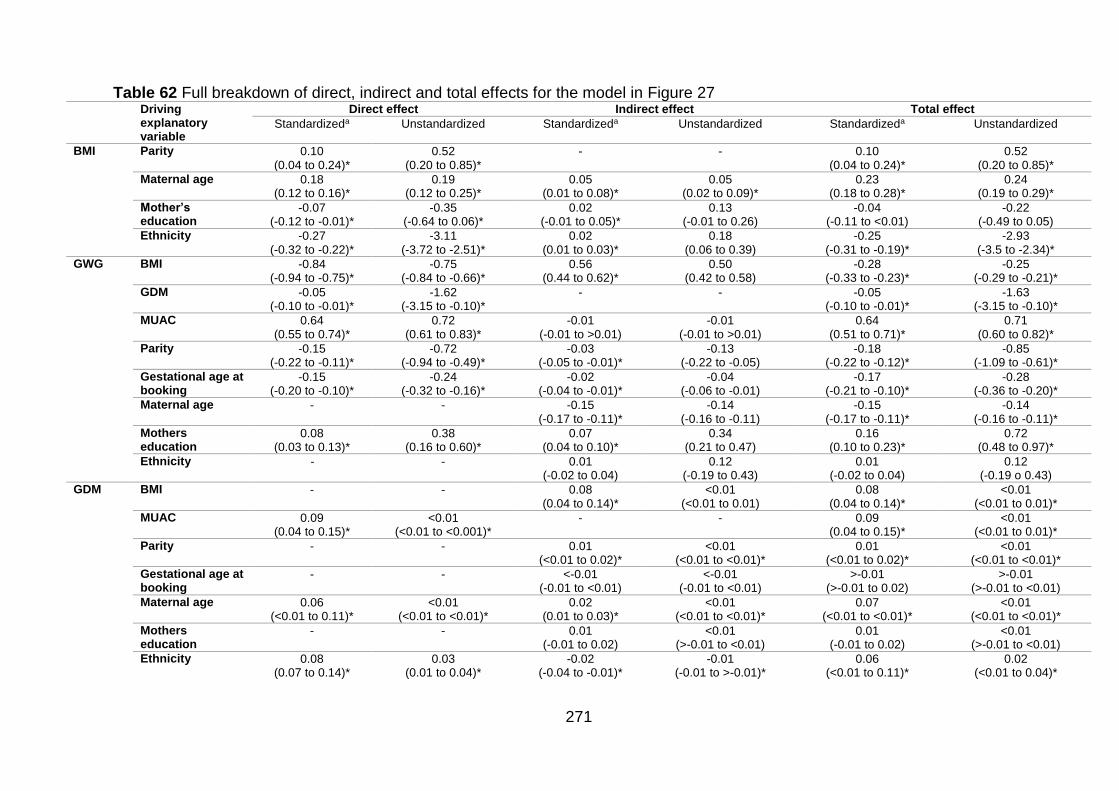
271
Table 62 Full breakdown of direct, indirect and total effects for the model in Figure 27 Driving
explanatory variable
Direct effect Indirect effect Total effect
Standardizeda Unstandardized Standardizeda Unstandardized Standardizeda Unstandardized
BMI Parity 0.10 (0.04 to 0.24)*
0.52 (0.20 to 0.85)*
- - 0.10 (0.04 to 0.24)*
0.52 (0.20 to 0.85)*
Maternal age 0.18 (0.12 to 0.16)*
0.19 (0.12 to 0.25)*
0.05 (0.01 to 0.08)*
0.05 (0.02 to 0.09)*
0.23 (0.18 to 0.28)*
0.24 (0.19 to 0.29)*
Mother’s education
-0.07 (-0.12 to -0.01)*
-0.35 (-0.64 to 0.06)*
0.02 (-0.01 to 0.05)*
0.13 (-0.01 to 0.26)
-0.04 (-0.11 to <0.01)
-0.22 (-0.49 to 0.05)
Ethnicity -0.27 (-0.32 to -0.22)*
-3.11 (-3.72 to -2.51)*
0.02 (0.01 to 0.03)*
0.18 (0.06 to 0.39)
-0.25 (-0.31 to -0.19)*
-2.93 (-3.5 to -2.34)*
GWG BMI -0.84 (-0.94 to -0.75)*
-0.75 (-0.84 to -0.66)*
0.56 (0.44 to 0.62)*
0.50 (0.42 to 0.58)
-0.28 (-0.33 to -0.23)*
-0.25 (-0.29 to -0.21)*
GDM -0.05 (-0.10 to -0.01)*
-1.62 (-3.15 to -0.10)*
- - -0.05 (-0.10 to -0.01)*
-1.63 (-3.15 to -0.10)*
MUAC 0.64 (0.55 to 0.74)*
0.72 (0.61 to 0.83)*
-0.01 (-0.01 to >0.01)
-0.01 (-0.01 to >0.01)
0.64 (0.51 to 0.71)*
0.71 (0.60 to 0.82)*
Parity -0.15 (-0.22 to -0.11)*
-0.72 (-0.94 to -0.49)*
-0.03 (-0.05 to -0.01)*
-0.13 (-0.22 to -0.05)
-0.18 (-0.22 to -0.12)*
-0.85 (-1.09 to -0.61)*
Gestational age at booking
-0.15 (-0.20 to -0.10)*
-0.24 (-0.32 to -0.16)*
-0.02 (-0.04 to -0.01)*
-0.04 (-0.06 to -0.01)
-0.17 (-0.21 to -0.10)*
-0.28 (-0.36 to -0.20)*
Maternal age - - -0.15 (-0.17 to -0.11)*
-0.14 (-0.16 to -0.11)
-0.15 (-0.17 to -0.11)*
-0.14 (-0.16 to -0.11)*
Mothers education
0.08 (0.03 to 0.13)*
0.38 (0.16 to 0.60)*
0.07 (0.04 to 0.10)*
0.34 (0.21 to 0.47)
0.16 (0.10 to 0.23)*
0.72 (0.48 to 0.97)*
Ethnicity - - 0.01 (-0.02 to 0.04)
0.12 (-0.19 to 0.43)
0.01 (-0.02 to 0.04)
0.12 (-0.19 o 0.43)
GDM BMI - - 0.08 (0.04 to 0.14)*
<0.01 (<0.01 to 0.01)
0.08 (0.04 to 0.14)*
<0.01 (<0.01 to 0.01)*
MUAC 0.09 (0.04 to 0.15)*
<0.01 (<0.01 to <0.001)*
- - 0.09 (0.04 to 0.15)*
<0.01 (<0.01 to 0.01)*
Parity - - 0.01 (<0.01 to 0.02)*
<0.01 (<0.01 to <0.01)*
0.01 (<0.01 to 0.02)*
<0.01 (<0.01 to <0.01)*
Gestational age at booking
- - <-0.01 (-0.01 to <0.01)
<-0.01 (-0.01 to <0.01)
>-0.01 (>-0.01 to 0.02)
>-0.01 (>-0.01 to <0.01)
Maternal age 0.06 (<0.01 to 0.11)*
<0.01 (<0.01 to <0.01)*
0.02 (0.01 to 0.03)*
<0.01 (<0.01 to <0.01)*
0.07 (<0.01 to <0.01)*
<0.01 (<0.01 to <0.01)*
Mothers education
- - 0.01 (-0.01 to 0.02)
<0.01 (>-0.01 to <0.01)
0.01 (-0.01 to 0.02)
<0.01 (>-0.01 to <0.01)
Ethnicity 0.08 (0.07 to 0.14)*
0.03 (0.01 to 0.04)*
-0.02 (-0.04 to -0.01)*
-0.01 (-0.01 to >-0.01)*
0.06 (<0.01 to 0.11)*
0.02 (<0.01 to 0.04)*
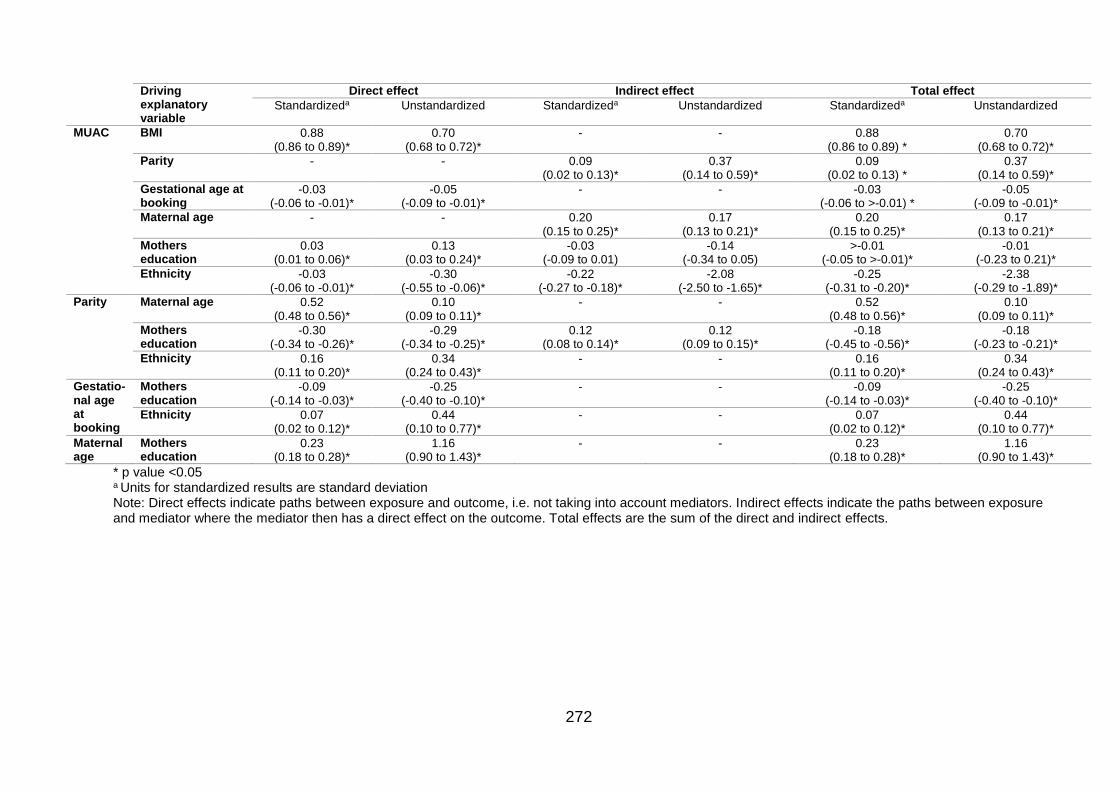
272
Driving explanatory variable
Direct effect Indirect effect Total effect
Standardizeda Unstandardized Standardizeda Unstandardized Standardizeda Unstandardized
MUAC BMI 0.88 (0.86 to 0.89)*
0.70 (0.68 to 0.72)*
- - 0.88 (0.86 to 0.89) *
0.70 (0.68 to 0.72)*
Parity - - 0.09 (0.02 to 0.13)*
0.37 (0.14 to 0.59)*
0.09 (0.02 to 0.13) *
0.37 (0.14 to 0.59)*
Gestational age at booking
-0.03 (-0.06 to -0.01)*
-0.05 (-0.09 to -0.01)*
- - -0.03 (-0.06 to >-0.01) *
-0.05 (-0.09 to -0.01)*
Maternal age - - 0.20 (0.15 to 0.25)*
0.17 (0.13 to 0.21)*
0.20 (0.15 to 0.25)*
0.17 (0.13 to 0.21)*
Mothers education
0.03 (0.01 to 0.06)*
0.13 (0.03 to 0.24)*
-0.03 (-0.09 to 0.01)
-0.14 (-0.34 to 0.05)
>-0.01 (-0.05 to >-0.01)*
-0.01 (-0.23 to 0.21)*
Ethnicity -0.03 (-0.06 to -0.01)*
-0.30 (-0.55 to -0.06)*
-0.22 (-0.27 to -0.18)*
-2.08 (-2.50 to -1.65)*
-0.25 (-0.31 to -0.20)*
-2.38 (-0.29 to -1.89)*
Parity Maternal age 0.52 (0.48 to 0.56)*
0.10 (0.09 to 0.11)*
- - 0.52 (0.48 to 0.56)*
0.10 (0.09 to 0.11)*
Mothers education
-0.30 (-0.34 to -0.26)*
-0.29 (-0.34 to -0.25)*
0.12 (0.08 to 0.14)*
0.12 (0.09 to 0.15)*
-0.18 (-0.45 to -0.56)*
-0.18 (-0.23 to -0.21)*
Ethnicity 0.16 (0.11 to 0.20)*
0.34 (0.24 to 0.43)*
- - 0.16 (0.11 to 0.20)*
0.34 (0.24 to 0.43)*
Gestatio-nal age at booking
Mothers education
-0.09 (-0.14 to -0.03)*
-0.25 (-0.40 to -0.10)*
- - -0.09 (-0.14 to -0.03)*
-0.25 (-0.40 to -0.10)*
Ethnicity 0.07 (0.02 to 0.12)*
0.44 (0.10 to 0.77)*
- - 0.07 (0.02 to 0.12)*
0.44 (0.10 to 0.77)*
Maternal age
Mothers education
0.23 (0.18 to 0.28)*
1.16 (0.90 to 1.43)*
- - 0.23 (0.18 to 0.28)*
1.16 (0.90 to 1.43)*
* p value <0.05 a Units for standardized results are standard deviation Note: Direct effects indicate paths between exposure and outcome, i.e. not taking into account mediators. Indirect effects indicate the paths between exposure and mediator where the mediator then has a direct effect on the outcome. Total effects are the sum of the direct and indirect effects.
273
The model fit for the SEM in Figure 28 was good; RMSEA <0.001; 95%CI 0.000 to
0.022, CFI of 0.998. The variance in GWG explained by the variables included in this
path model is 26% (R2=0.257).
Below, total, direct and indirect effects shown in Table 62 for the model Figure 27 are
discussed. Standardized effects are presented in units of standard deviation (SD);
this allows a direct comparison of the effect sizes of each driving explanatory variable
on GWG as the units are the same. Unstandardized effect sizes cannot be compared
between variables, but do give an indication of the actual effect size between each
explanatory variable on GWG (i.e. the kg change in GWG per one unit change in
explanatory variable e.g.1kg/m2 BMI or 1cm of MUAC).
Total effects are the sum of the indirect and direct effects of driving explanatory
variables on the outcome. Significant total effects of driving explanatory variables on
GWG, in descending order of standardized effect size (independent to the direction
of effect), were; MUAC, BMI, parity, gestational age at booking, mothers education,
maternal age and GDM. Results showed that ethnicity did not significantly predict
GWG; ethnicity had a standardized total effect of 0.01SD (95%CI -0.02 to 0.04) and
unstandardized effect of 0.12kg (95%CI -0.19 to 0.43; p=0.438). This suggests that in
this model, Pakistani women gained, on average 0.12kg more than White British
women did, but that this difference was not significant.
MUAC at baseline has the largest standardized total effect on GWG (β 0.64 (,
P<0.001; Table 62). This suggested that with a 1SD increase in MUAC, GWG
increased by 0.64SD or, as indicated by unstandardized effects; a 1cm increase in
MUAC, leads to a 0.71kg increase in GWG (Table 62). The next largest predictor of
GWG was maternal BMI; a 1SD increase in maternal BMI lead to a 0.28SD decrease
in GWG (95%CI -0.33 to -0.23; p<0.001), or as indicated by unstandardized effects; a
1kg/m2 increase in maternal BMI led to a 0.25kg decrease in GWG (95%CI -0.29 to -
0.21) . Parity was the next; with a 1SD increase in parity, GWG decreased by 0.18SD
(95%CI -0.22 to -0.12; p<0.001), or as indicated by unstandardized effects; an
increase in parity of one led to a 0.85kg decrease in GWG (95%CI -1.09 to -0.61).
Gestational age at booking had the next largest effect size; a 1SD increase in
gestational age at booking let to a 0.17SD increase in GWG (95%CI -0.21 to -0.10;
p<0.001), or a 1 day increase in gestational age a booking led to a 0.28kg decrease
in GWG (95%CI -0.36 to -0.20). Mothers education was next; a 1SD increase in
274
mothers education led to a 0.16SD increase in GWG (95%CI 0.10 to 0.23), or a one
unit increase in maternal education (i.e. <5 GCSEs, ≥5GCSEs, A level equivalent,
higher education) led to, on average, a 0.72kg (95%CI 0.48 to 0.97) increase in
GWG (so as maternal education increased, so did GWG). Maternal age also had a
significant total effect on GWG; a 1SD increase in maternal age led to a 0.15SD
decrease in GWG (95%CI -0.17 to -0.11; p<0.001), or a one year increase in
maternal age led to a 0.14kg (95%CI -0.16 to -0.11) decrease in GWG according to
unstandardized total effects (Table 62). Finally, GDM also had a significant total
effect on GWG; a 1SD increase in GDM led to a 0.05SD decrease in GWG (95%CI -
0.10 to -0.01; p=0.037), or as shown by unstandardized total effects for GDM; women
with GDM had on average, a 1.63kg (95%CI -3.15 to -0.10) decrease in GWG
compared with women without GDM (Table 62).
Variables that had a direct effect on GWG in descending order of standardized effect
size (independent to direction of effect) were: BMI, MUAC, parity, gestational age at
booking, mother’s education and GDM. This means that these variables have a
significant effect on GWG that was not mediated by any other variables in the model.
A one SD increase in maternal BMI led to a 0.84 SD decrease in GWG (95%CI -0.94
to -0.75); or as shown by the indirect effects in Table 62, a 1kg/m2 increase in BMI
led to on average, a 0.75kg decrease in GWG (95%CI -0.84 to -0.66). A one SD
increase in MUAC led to a 0.64 SD increase in GWG (95%CI (0.55 to 0.74); or as
shown in Table 62, a 1cm increase in MUAC led to, on average, a 0.72kg increase in
GWG (95%CI 0.61 to 0.83). A one SD increase in parity led to a 0.15 SD decrease in
GWG (95%CI -0.22 to -0.11; p<0.001); or as shown by unstandardized direct effects
in Table 62, an increase in parity of one led to, on average, a 0.72kg decrease in
GWG (95%CI (-0.94 to -0.49). A one SD increase in gestational age at booking led to
a 0.15 SD decrease in GWG (95%CI -0.20 to -0.10; p<0.001); or as shown by
unstandardized direct effects in Table 62, a one day increase in gestational age at
booking led to, on average, a 0.24kg decrease in GWG (95%CI -0.32 to -0.16). A one
SD increase in mothers education led to a 0.08 SD increase in GWG (95%CI 0.03 to
0.13; p<0.001); or as shown by unstandardized direct effects in Table 62, a one unit
increase in mothers education led to, on average, a 0.38kg increase in GWG (95%CI
0.16 to 0.60) . GDM also had a significant direct effect on GWG; a one SD increase
in GDM led to a 0.05 SD decrease in GWG (95%CI -0.10 to -0.01; p=0.037); or as
shown by unstandardized direct effects in Table 62, mothers with GDM had, on
275
average, a 1.62kg decrease in GWG, although the 95% confidence intervals were
wide, and ranged from a decrease of 3.1kg to a decrease of only 0.10kg (95%CI -
3.15 to -0.10). Neither maternal age nor ethnicity had direct effects on GWG.
Some driving explanatory variables also had indirect effects on GDM, i.e. they were
associated with another explanatory variable (a mediator), which then, in turn was
associated with GWG. The variables with significant indirect effects in order of effect
size (independent of direction of effect) were; BMI (standardized: 0.56 (95%CI 0.44
to 0.62), unstandardized: 0.50kg (95%CI 0.42 to 0.58)), maternal age (standardized:
-0.15 (95%CI -0.17 to -0.11), unstandardized: -0.14kg (95%CI -0.16 to -0.11)),
mothers education (standardized: 0.07 (95%CI 0.04 to 0.10), unstandardized: 0.34kg
(95%CI 0.21 to 0.47)), parity (standardized: -0.03 (95%CI -0.05 to -0.01),
unstandardized: -0.13kg (-0.22 to -0.05)) and gestational age at booking; although
the effect size for gestational age at booking was very small (standardized: -0.02
(95%CI -0.04 to -0.01), unstandardized: -0.04kg (95%CI -0.06 to -0.01); Table 62).
MUAC and ethnicity also had indirect effects on GWG, but these were not significant
and effect sizes were very small (Table 62).
Figure 29 shows the most parsimonious model. Results show that ethnicity can be
removed from the model while retaining good model fit (RMSEA=<0.001; 95%CI
0.000 to 0.026, CFI of 0.999). The variance in GWG explained by the variables
included in this path model is still 26% (R2=0.257). This indicated that in this
population, ethnicity is not a significant predictor of GWG.
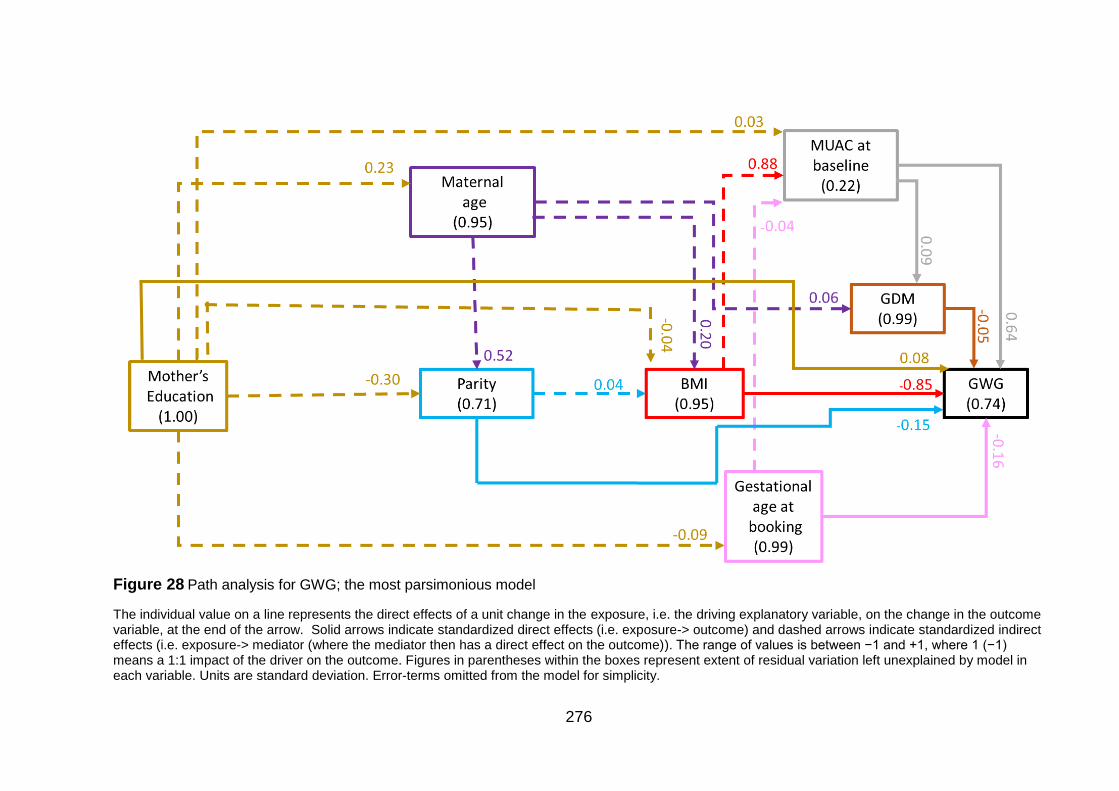
276
Figure 28 Path analysis for GWG; the most parsimonious model
The individual value on a line represents the direct effects of a unit change in the exposure, i.e. the driving explanatory variable, on the change in the outcome variable, at the end of the arrow. Solid arrows indicate standardized direct effects (i.e. exposure-> outcome) and dashed arrows indicate standardized indirect effects (i.e. exposure-> mediator (where the mediator then has a direct effect on the outcome)). The range of values is between −1 and +1, where 1 (−1) means a 1:1 impact of the driver on the outcome. Figures in parentheses within the boxes represent extent of residual variation left unexplained by model in each variable. Units are standard deviation. Error-terms omitted from the model for simplicity.
277
7.3 Exploring missing data
For each of the exposure variables (maternal BMI and GWG) it is important to
consider whether and how women with missing data for the exposure vary from
women with data for the exposure. This section will explore the differences between
the two groups (missing and non-missing) for each of the exposures. Table 63 shows
results for missing BMI and Table 64 shows results for missing GWG. R squared
value gives the variation in variable of interest that is explained by whether or not
BMI or GWG is missing (multiply by 100 to give the percentage variance explained).
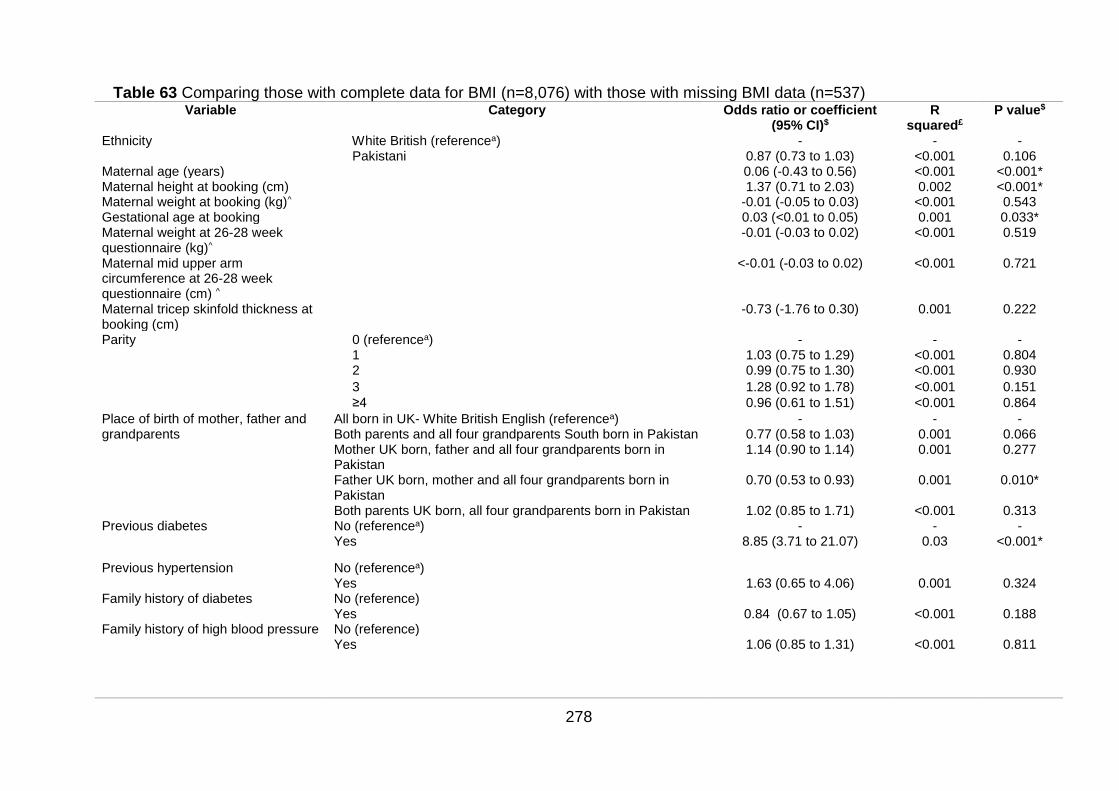
278
Table 63 Comparing those with complete data for BMI (n=8,076) with those with missing BMI data (n=537) Variable Category Odds ratio or coefficient
(95% CI)$ R
squared£ P value$
Ethnicity White British (referencea) - - - Pakistani 0.87 (0.73 to 1.03) <0.001 0.106
Maternal age (years) 0.06 (-0.43 to 0.56) <0.001 <0.001* Maternal height at booking (cm) 1.37 (0.71 to 2.03) 0.002 <0.001* Maternal weight at booking (kg)^ -0.01 (-0.05 to 0.03) <0.001 0.543 Gestational age at booking 0.03 (<0.01 to 0.05) 0.001 0.033* Maternal weight at 26-28 week questionnaire (kg)^
-0.01 (-0.03 to 0.02) <0.001 0.519
Maternal mid upper arm circumference at 26-28 week questionnaire (cm) ^
<-0.01 (-0.03 to 0.02) <0.001 0.721
Maternal tricep skinfold thickness at booking (cm)
-0.73 (-1.76 to 0.30) 0.001 0.222
Parity 0 (referencea) - - - 1 1.03 (0.75 to 1.29) <0.001 0.804 2 0.99 (0.75 to 1.30) <0.001 0.930
3 1.28 (0.92 to 1.78) <0.001 0.151
≥4 0.96 (0.61 to 1.51) <0.001 0.864
Place of birth of mother, father and grandparents
All born in UK- White British English (referencea) - - - Both parents and all four grandparents South born in Pakistan 0.77 (0.58 to 1.03) 0.001 0.066 Mother UK born, father and all four grandparents born in Pakistan
1.14 (0.90 to 1.14) 0.001 0.277
Father UK born, mother and all four grandparents born in Pakistan
0.70 (0.53 to 0.93) 0.001 0.010*
Both parents UK born, all four grandparents born in Pakistan 1.02 (0.85 to 1.71) <0.001 0.313 Previous diabetes No (referencea) - - -
Yes 8.85 (3.71 to 21.07) 0.03 <0.001*
Previous hypertension No (referencea) Yes 1.63 (0.65 to 4.06) 0.001 0.324 Family history of diabetes No (reference)
Yes 0.84 (0.67 to 1.05) <0.001 0.188 Family history of high blood pressure No (reference)
Yes
1.06 (0.85 to 1.31) <0.001 0.811
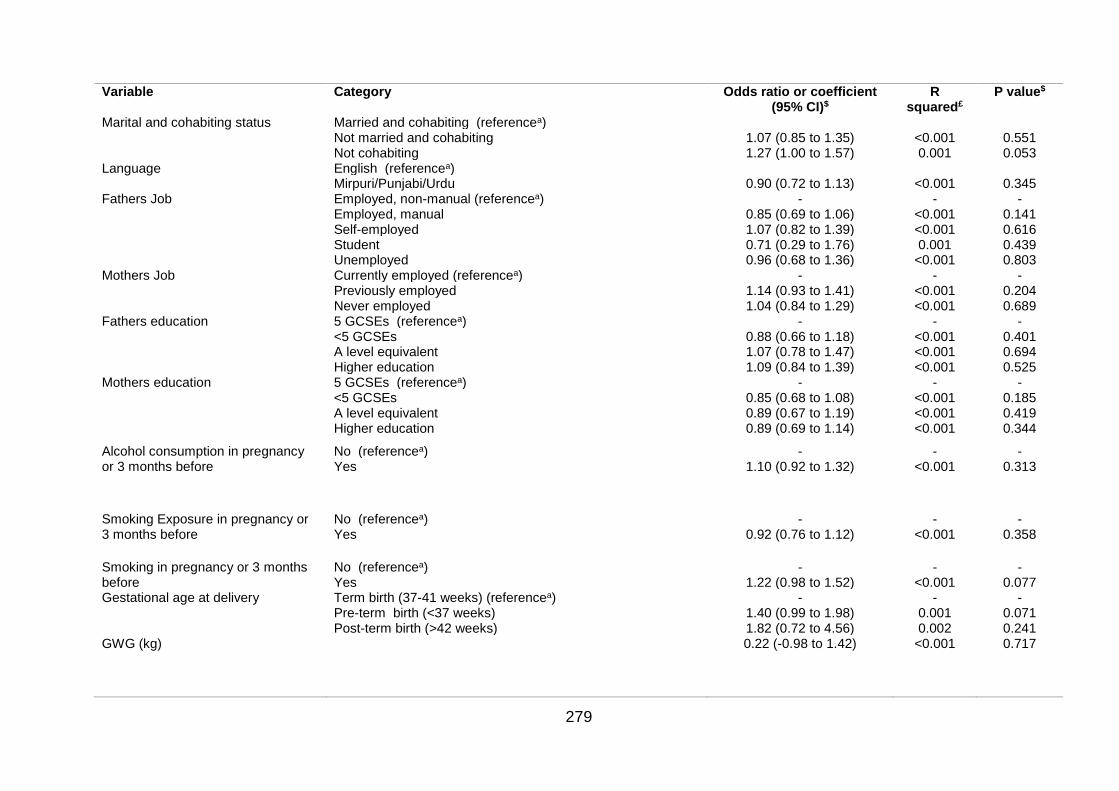
279
Variable Category Odds ratio or coefficient (95% CI)$
R squared£
P value$
Marital and cohabiting status Married and cohabiting (referencea) Not married and cohabiting 1.07 (0.85 to 1.35) <0.001 0.551 Not cohabiting 1.27 (1.00 to 1.57) 0.001 0.053
Language English (referencea) Mirpuri/Punjabi/Urdu 0.90 (0.72 to 1.13) <0.001 0.345
Fathers Job Employed, non-manual (referencea) - - - Employed, manual 0.85 (0.69 to 1.06) <0.001 0.141 Self-employed 1.07 (0.82 to 1.39) <0.001 0.616 Student 0.71 (0.29 to 1.76) 0.001 0.439 Unemployed 0.96 (0.68 to 1.36) <0.001 0.803
Mothers Job Currently employed (referencea) - - - Previously employed 1.14 (0.93 to 1.41) <0.001 0.204 Never employed 1.04 (0.84 to 1.29) <0.001 0.689
Fathers education 5 GCSEs (referencea) - - - <5 GCSEs 0.88 (0.66 to 1.18) <0.001 0.401 A level equivalent 1.07 (0.78 to 1.47) <0.001 0.694 Higher education 1.09 (0.84 to 1.39) <0.001 0.525
Mothers education 5 GCSEs (referencea) - - - <5 GCSEs 0.85 (0.68 to 1.08) <0.001 0.185 A level equivalent 0.89 (0.67 to 1.19) <0.001 0.419 Higher education 0.89 (0.69 to 1.14) <0.001 0.344
Alcohol consumption in pregnancy or 3 months before
No (referencea) - - - Yes 1.10 (0.92 to 1.32) <0.001 0.313
Smoking Exposure in pregnancy or 3 months before
No (referencea) - - - Yes 0.92 (0.76 to 1.12) <0.001 0.358
Smoking in pregnancy or 3 months before
No (referencea) - - - Yes 1.22 (0.98 to 1.52) <0.001 0.077
Gestational age at delivery Term birth (37-41 weeks) (referencea) - - - Pre-term birth (<37 weeks) 1.40 (0.99 to 1.98) 0.001 0.071 Post-term birth (>42 weeks) 1.82 (0.72 to 4.56) 0.002 0.241
GWG (kg)
0.22 (-0.98 to 1.42) <0.001 0.717
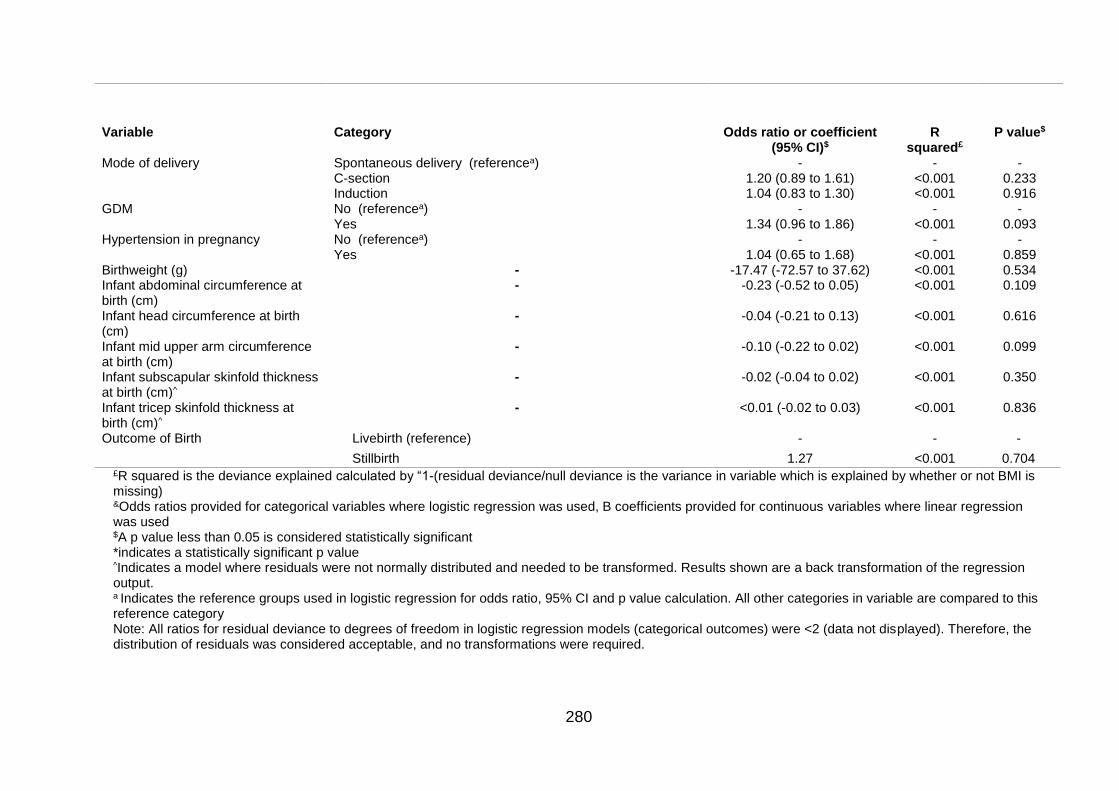
280
Variable Category Odds ratio or coefficient (95% CI)$
R squared£
P value$
Mode of delivery Spontaneous delivery (referencea) - - - C-section 1.20 (0.89 to 1.61) <0.001 0.233 Induction 1.04 (0.83 to 1.30) <0.001 0.916
GDM No (referencea) - - - Yes 1.34 (0.96 to 1.86) <0.001 0.093 Hypertension in pregnancy No (referencea) - - -
Yes 1.04 (0.65 to 1.68) <0.001 0.859 Birthweight (g) - -17.47 (-72.57 to 37.62) <0.001 0.534 Infant abdominal circumference at birth (cm)
- -0.23 (-0.52 to 0.05) <0.001 0.109
Infant head circumference at birth (cm)
- -0.04 (-0.21 to 0.13) <0.001 0.616
Infant mid upper arm circumference at birth (cm)
- -0.10 (-0.22 to 0.02) <0.001 0.099
Infant subscapular skinfold thickness at birth (cm)^
- -0.02 (-0.04 to 0.02) <0.001 0.350
Infant tricep skinfold thickness at birth (cm)^
- <0.01 (-0.02 to 0.03) <0.001 0.836
Outcome of Birth Livebirth (reference) - - -
Stillbirth 1.27 <0.001 0.704 £R squared is the deviance explained calculated by “1-(residual deviance/null deviance is the variance in variable which is explained by whether or not BMI is missing) &Odds ratios provided for categorical variables where logistic regression was used, B coefficients provided for continuous variables where linear regression was used $A p value less than 0.05 is considered statistically significant *indicates a statistically significant p value ^Indicates a model where residuals were not normally distributed and needed to be transformed. Results shown are a back transformation of the regression output. a Indicates the reference groups used in logistic regression for odds ratio, 95% CI and p value calculation. All other categories in variable are compared to this reference category Note: All ratios for residual deviance to degrees of freedom in logistic regression models (categorical outcomes) were <2 (data not displayed). Therefore, the distribution of residuals was considered acceptable, and no transformations were required.
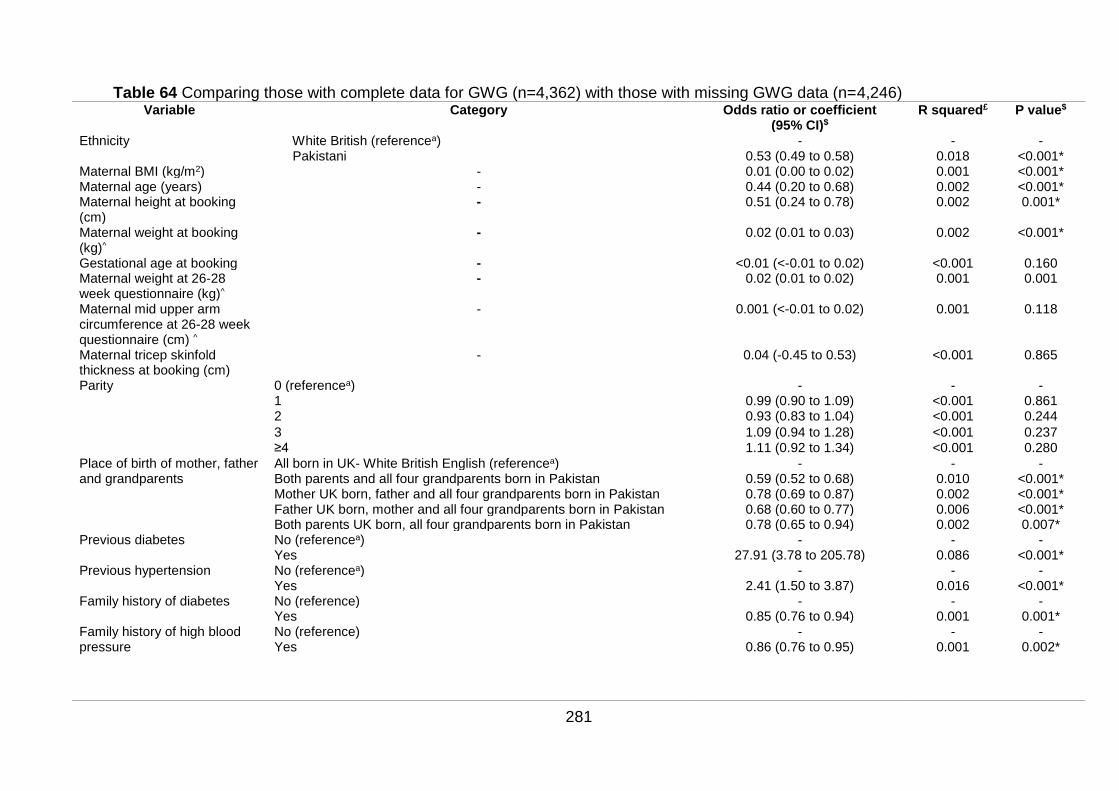
281
Table 64 Comparing those with complete data for GWG (n=4,362) with those with missing GWG data (n=4,246) Variable Category Odds ratio or coefficient
(95% CI)$ R squared£ P value$
Ethnicity White British (referencea) - - - Pakistani 0.53 (0.49 to 0.58) 0.018 <0.001*
Maternal BMI (kg/m2) - 0.01 (0.00 to 0.02) 0.001 <0.001* Maternal age (years) - 0.44 (0.20 to 0.68) 0.002 <0.001* Maternal height at booking (cm)
- 0.51 (0.24 to 0.78) 0.002 0.001*
Maternal weight at booking (kg)^
- 0.02 (0.01 to 0.03) 0.002 <0.001*
Gestational age at booking - <0.01 (<-0.01 to 0.02) <0.001 0.160 Maternal weight at 26-28 week questionnaire (kg)^
- 0.02 (0.01 to 0.02) 0.001 0.001
Maternal mid upper arm circumference at 26-28 week questionnaire (cm) ^
- 0.001 (<-0.01 to 0.02) 0.001 0.118
Maternal tricep skinfold thickness at booking (cm)
- 0.04 (-0.45 to 0.53) <0.001 0.865
Parity 0 (referencea) - - - 1 0.99 (0.90 to 1.09) <0.001 0.861 2 0.93 (0.83 to 1.04) <0.001 0.244
3 1.09 (0.94 to 1.28) <0.001 0.237 ≥4 1.11 (0.92 to 1.34) <0.001 0.280
Place of birth of mother, father and grandparents
All born in UK- White British English (referencea) - - - Both parents and all four grandparents born in Pakistan 0.59 (0.52 to 0.68) 0.010 <0.001* Mother UK born, father and all four grandparents born in Pakistan 0.78 (0.69 to 0.87) 0.002 <0.001* Father UK born, mother and all four grandparents born in Pakistan 0.68 (0.60 to 0.77) 0.006 <0.001* Both parents UK born, all four grandparents born in Pakistan 0.78 (0.65 to 0.94) 0.002 0.007*
Previous diabetes No (referencea) - - - Yes 27.91 (3.78 to 205.78) 0.086 <0.001*
Previous hypertension No (referencea) - - - Yes 2.41 (1.50 to 3.87) 0.016 <0.001*
Family history of diabetes No (reference) - - - Yes 0.85 (0.76 to 0.94) 0.001 0.001*
Family history of high blood pressure
No (reference) - - - Yes
0.86 (0.76 to 0.95) 0.001 0.002*
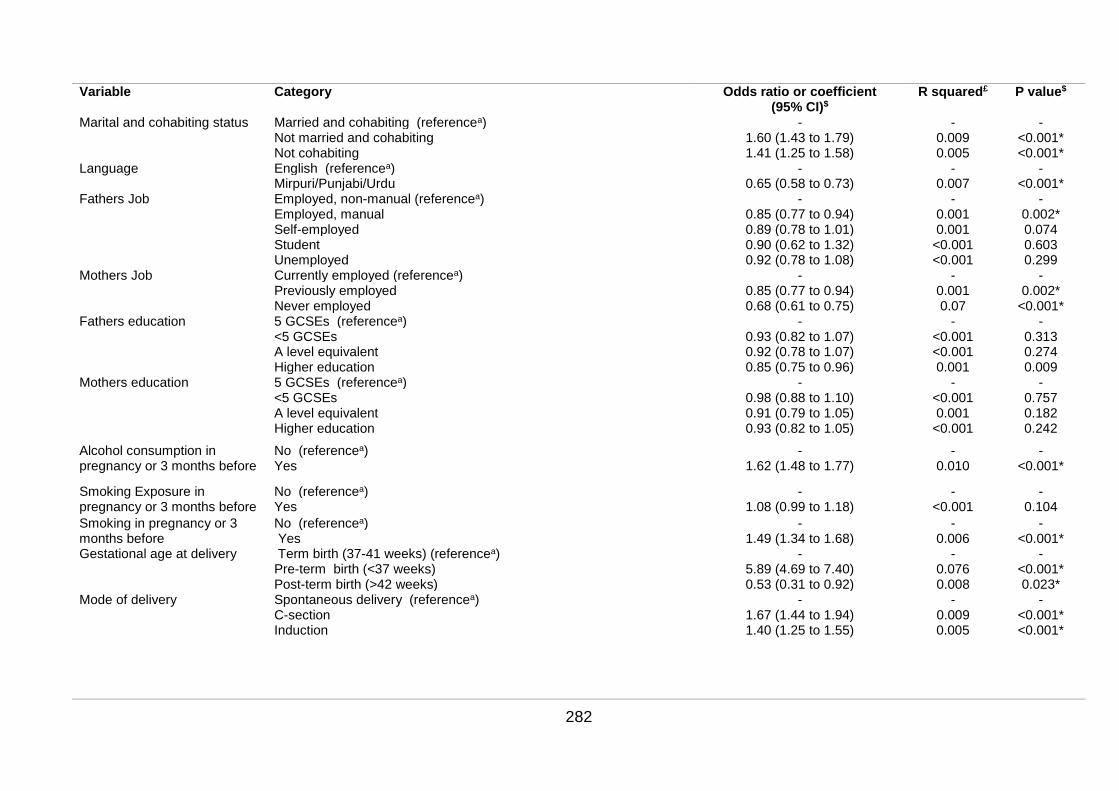
282
Variable Category Odds ratio or coefficient (95% CI)$
R squared£ P value$
Marital and cohabiting status Married and cohabiting (referencea) - - - Not married and cohabiting 1.60 (1.43 to 1.79) 0.009 <0.001* Not cohabiting 1.41 (1.25 to 1.58) 0.005 <0.001*
Language English (referencea) - - - Mirpuri/Punjabi/Urdu 0.65 (0.58 to 0.73) 0.007 <0.001*
Fathers Job Employed, non-manual (referencea) - - - Employed, manual 0.85 (0.77 to 0.94) 0.001 0.002* Self-employed 0.89 (0.78 to 1.01) 0.001 0.074 Student 0.90 (0.62 to 1.32) <0.001 0.603 Unemployed 0.92 (0.78 to 1.08) <0.001 0.299
Mothers Job Currently employed (referencea) - - - Previously employed 0.85 (0.77 to 0.94) 0.001 0.002* Never employed 0.68 (0.61 to 0.75) 0.07 <0.001*
Fathers education 5 GCSEs (referencea) - - - <5 GCSEs 0.93 (0.82 to 1.07) <0.001 0.313 A level equivalent 0.92 (0.78 to 1.07) <0.001 0.274 Higher education 0.85 (0.75 to 0.96) 0.001 0.009
Mothers education 5 GCSEs (referencea) - - - <5 GCSEs 0.98 (0.88 to 1.10) <0.001 0.757 A level equivalent 0.91 (0.79 to 1.05) 0.001 0.182 Higher education 0.93 (0.82 to 1.05) <0.001 0.242
Alcohol consumption in pregnancy or 3 months before
No (referencea) - - - Yes 1.62 (1.48 to 1.77) 0.010 <0.001*
Smoking Exposure in pregnancy or 3 months before
No (referencea) - - - Yes 1.08 (0.99 to 1.18) <0.001 0.104
Smoking in pregnancy or 3 months before
No (referencea) - - - Yes 1.49 (1.34 to 1.68) 0.006 <0.001*
Gestational age at delivery Term birth (37-41 weeks) (referencea) - - - Pre-term birth (<37 weeks) 5.89 (4.69 to 7.40) 0.076 <0.001* Post-term birth (>42 weeks) 0.53 (0.31 to 0.92) 0.008 0.023*
Mode of delivery Spontaneous delivery (referencea) - - - C-section 1.67 (1.44 to 1.94) 0.009 <0.001* Induction
1.40 (1.25 to 1.55) 0.005 <0.001*
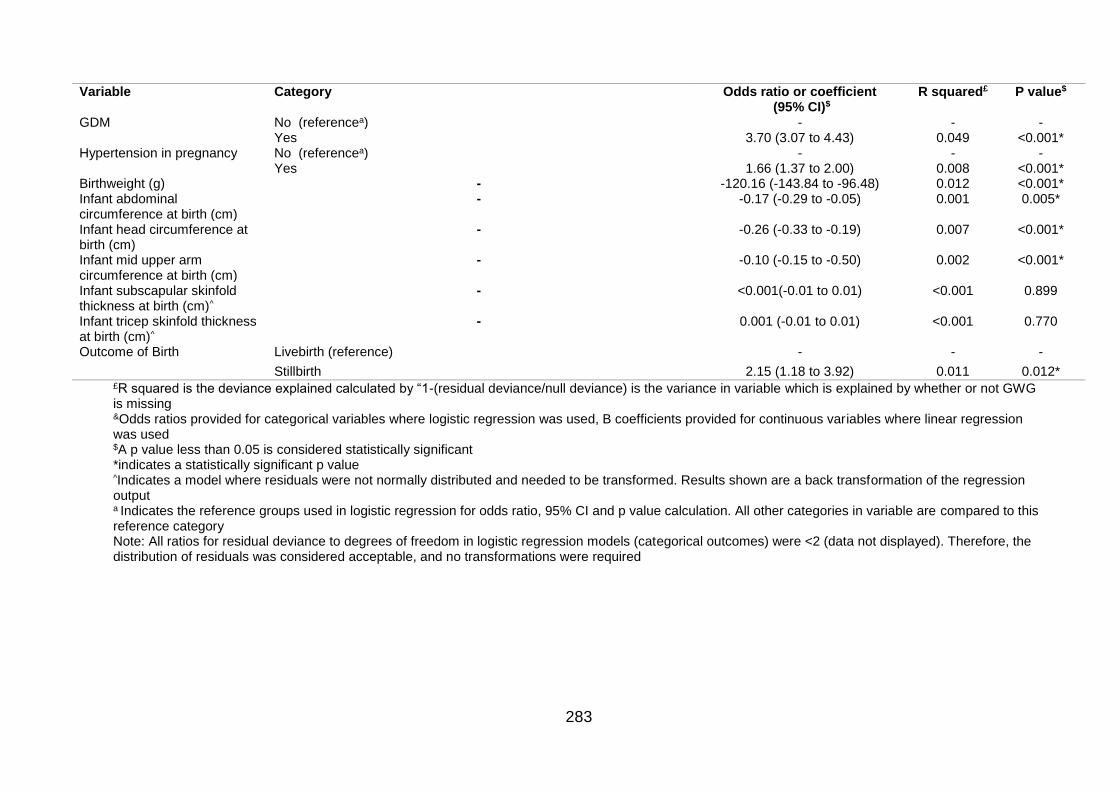
283
Variable Category Odds ratio or coefficient (95% CI)$
R squared£ P value$
GDM No (referencea) - - - Yes 3.70 (3.07 to 4.43) 0.049 <0.001*
Hypertension in pregnancy No (referencea) - - - Yes 1.66 (1.37 to 2.00) 0.008 <0.001*
Birthweight (g) - -120.16 (-143.84 to -96.48) 0.012 <0.001* Infant abdominal circumference at birth (cm)
- -0.17 (-0.29 to -0.05) 0.001 0.005*
Infant head circumference at birth (cm)
- -0.26 (-0.33 to -0.19) 0.007 <0.001*
Infant mid upper arm circumference at birth (cm)
- -0.10 (-0.15 to -0.50) 0.002 <0.001*
Infant subscapular skinfold thickness at birth (cm)^
- <0.001(-0.01 to 0.01) <0.001 0.899
Infant tricep skinfold thickness at birth (cm)^
- 0.001 (-0.01 to 0.01) <0.001 0.770
Outcome of Birth Livebirth (reference) - - -
Stillbirth 2.15 (1.18 to 3.92) 0.011 0.012* £R squared is the deviance explained calculated by “1-(residual deviance/null deviance) is the variance in variable which is explained by whether or not GWG is missing &Odds ratios provided for categorical variables where logistic regression was used, B coefficients provided for continuous variables where linear regression was used $A p value less than 0.05 is considered statistically significant *indicates a statistically significant p value ^Indicates a model where residuals were not normally distributed and needed to be transformed. Results shown are a back transformation of the regression output a Indicates the reference groups used in logistic regression for odds ratio, 95% CI and p value calculation. All other categories in variable are compared to this reference category Note: All ratios for residual deviance to degrees of freedom in logistic regression models (categorical outcomes) were <2 (data not displayed). Therefore, the distribution of residuals was considered acceptable, and no transformations were required
284
7.3.1 Maternal body mass index at booking
Table 63 compares differences in variables from the BiB Cohort according to whether
or not BMI is missing. There is 6.23% of data for BMI missing; n=8,076 with BMI data
and n=537 without BMI data. When comparing the demographic characteristics of
women with data on BMI with those women with missing BMI data, women with
missing BMI were significantly taller and weighed significantly more at booking
appointment. Mothers with missing BMI were also significantly more likely to have a
partner (father of child) born in the UK, while mother and all four grandparents born in
Pakistan compared to all being born in the UK. Those with missing data on BMI were
also significantly more likely to have previous diabetes. Although other characteristics
differed, no differences reached statistical significance.
7.3.2 Gestational weight gain
Table 64 compares differences in variables from the BiB Cohort according to whether
or not GWG is missing. There is 49.32% of the population in the BiB cohort with no
data for GWG (complete data for GWG n=4,362, and those with missing GWG data
n=4,246).
Compared with women with data on GWG, women with missing GWG were
significantly less likely to be Pakistani, had a significantly higher BMI pre-pregnancy
BMI, weighed significantly more at booking, and were significantly taller and older.
Those with missing GWG were significantly less likely to speak Mirpuri, Punjabi or
Urdu compared with English, and women with missing GWG, and their families, were
significantly more likely to be born in the UK compared to outside the UK. Women
with missing GWG were more likely to have previous diabetes or previous
hypertension, and less likely to have a family history of diabetes or a family history of
high blood pressure.
Women with missing GWG were more likely to be not married and cohabiting or not
cohabiting compared with married or cohabiting. Fathers of infants whose mothers
had missing GWG were less likely to be employed in a manual job compared with a
non-manual job, and less likely to have higher education than have 5 GCSEs.
285
Mothers with missing GWG were less likely to be previously employed or never
compared with currently employed. Mothers with missing GWG data were
significantly more likely to have consumed alcohol in pregnancy, or three months
before, and were significantly more likely to have smoked in pregnancy or the three
months before.
Compared to term birth, mothers with missing GWG were significantly more likely to
have an infant born pre-term, and significantly less likely to have an infant born post-
term. Mode of delivery also differed significantly for those with and without GWG
data; compared to a spontaneous birth, women with missing GWG data were
significantly more likely to have either a C-section or an induction. Women with
missing GWG were significantly more likely to have GDM and HDP, and infants born
to mothers who had missing GWG weighed significantly less at birth, had significantly
smaller abdominal circumference, smaller head circumference and smaller MUAC.
However, there were no significant differences in infant subscapular or tricep SFT.
Infants born to mothers without GWG data were also significantly more likely to be
stillborn.
7.4 Discussion of Chapter 7
This chapter aimed to consider differences between the two ethnic groups in terms of
exposures (maternal BMI and GWG), demographic characteristics (e.g. maternal
age, parity, etc.) and outcomes. It then aimed to consider unadjusted and adjusted
associations between each outcome and exposure. Finally, it aimed to look at the
association between GWG and BMI considering both confounders and mediators
using SEM. In this discussion section, I will consider how the BiB cohort compares to
the UK in terms of ethnicity, maternal BMI and GWG. I will then go on to discuss key
findings and the strengths and limitations of the chapter.
Significant interactions were identified between maternal BMI and ethnicity on the
following pregnancy outcomes: GDM, pre-term birth, and infant thigh circumference
at 3 years of age. This means that the shape of the association between outcome
and maternal BMI was significantly different in the two ethnic groups. Compared with
White British women and their infants, Pakistani women had significantly higher odds
286
if GDM, and infants of Pakistani women had significantly higher odds of pre-term
birth (following adjustment), and significantly higher amount of thigh circumference
associated with increasing BMI. There were no significant associations between
either GDM or HDP and early GWG and in either ethnic group. Significant
interactions were identified between GWG and ethnicity on infant tricep SFT at birth
prior to adjustment only; results shows that infants of Pakistani women had a smaller
increase in tricep SFT associated with a 1kg increase in GWG compared with infants
of White British women. When GWG per week gestation was considered as the
exposure, a significant interaction was identified between GWG and ethnicity for pre-
term birth (Appendix 16, Table 1). Results showed that with increasing GWG per
week infants of White British women had significantly reduced chances of being born
pre-term, infants of Pakistani women appeared to have an increased chance,
although results did not reach significance and confidence intervals were wide.
Results of the path analysis (SEM without any latent variables) showed that ethnicity
was not found to be a significant predictor of GWG. Maternal MUAC and BMI had the
largest total effect on GWG. This suggests that maternal body composition may play
a larger role in determining GWG, independent of ethnicity. Importantly, decreasing
GWG was associated with BMI, and increasing GWG was associated with increasing
MUAC. This suggests that where body fat is stored at individual level is important for
predicting GWG.
7.4.1 Comparison of the Born in Bradford cohort and UK population
In the data from the BiB cohort used for this analysis, 52.5% of women were
Pakistani, and 47.5% were White British. This compares with 3.0% Pakistani and
97.0% White British in England and Wales excluding all other ethnic groups (2.0%
and 80.5%, respectively, when other ethnic groups considered) (312). Compared
with the 2016 Health Survey for England (HSE) data (313), in the BiB cohort, 1.8%
fewer women had a BMI in the recommended range using the general population
BMI criteria. There were also 2.2% fewer women with a BMI in the underweight
range, 1.6% more women with a BMI in the overweight range, and 1.2% fewer
women with a BMI in the obese range. Compared to the HSE data, when applying
the Asian-specific BMI criteria, those with an underweight BMI remained the same.
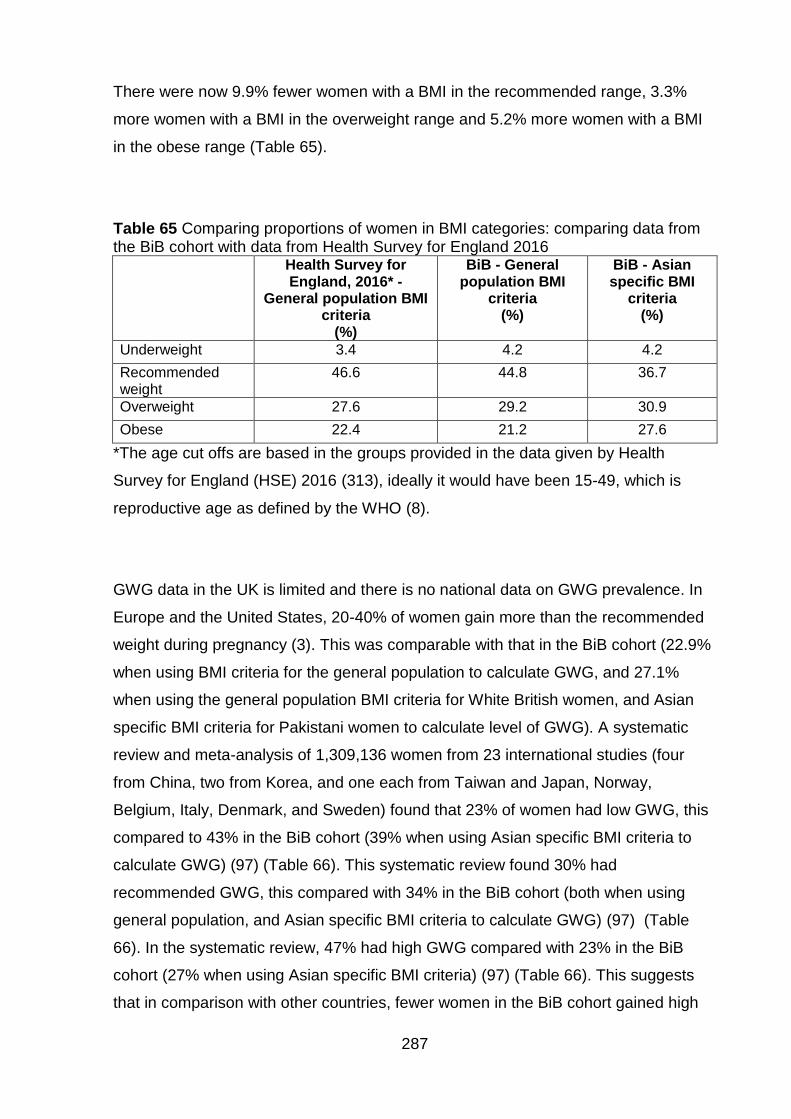
287
There were now 9.9% fewer women with a BMI in the recommended range, 3.3%
more women with a BMI in the overweight range and 5.2% more women with a BMI
in the obese range (Table 65).
Table 65 Comparing proportions of women in BMI categories: comparing data from the BiB cohort with data from Health Survey for England 2016 Health Survey for
England, 2016* - General population BMI
criteria (%)
BiB - General population BMI
criteria (%)
BiB - Asian specific BMI
criteria (%)
Underweight 3.4 4.2 4.2
Recommended weight
46.6 44.8 36.7
Overweight 27.6 29.2 30.9
Obese 22.4 21.2 27.6
*The age cut offs are based in the groups provided in the data given by Health
Survey for England (HSE) 2016 (313), ideally it would have been 15-49, which is
reproductive age as defined by the WHO (8).
GWG data in the UK is limited and there is no national data on GWG prevalence. In
Europe and the United States, 20-40% of women gain more than the recommended
weight during pregnancy (3). This was comparable with that in the BiB cohort (22.9%
when using BMI criteria for the general population to calculate GWG, and 27.1%
when using the general population BMI criteria for White British women, and Asian
specific BMI criteria for Pakistani women to calculate level of GWG). A systematic
review and meta-analysis of 1,309,136 women from 23 international studies (four
from China, two from Korea, and one each from Taiwan and Japan, Norway,
Belgium, Italy, Denmark, and Sweden) found that 23% of women had low GWG, this
compared to 43% in the BiB cohort (39% when using Asian specific BMI criteria to
calculate GWG) (97) (Table 66). This systematic review found 30% had
recommended GWG, this compared with 34% in the BiB cohort (both when using
general population, and Asian specific BMI criteria to calculate GWG) (97) (Table
66). In the systematic review, 47% had high GWG compared with 23% in the BiB
cohort (27% when using Asian specific BMI criteria) (97) (Table 66). This suggests
that in comparison with other countries, fewer women in the BiB cohort gained high
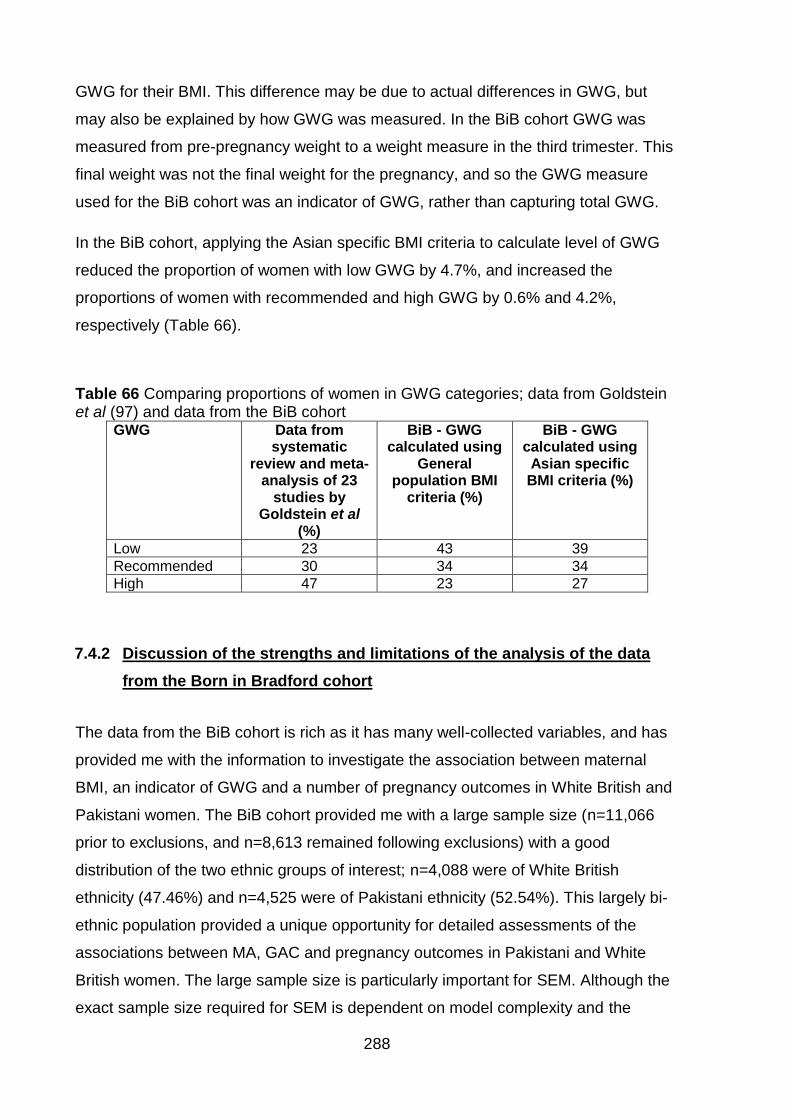
288
GWG for their BMI. This difference may be due to actual differences in GWG, but
may also be explained by how GWG was measured. In the BiB cohort GWG was
measured from pre-pregnancy weight to a weight measure in the third trimester. This
final weight was not the final weight for the pregnancy, and so the GWG measure
used for the BiB cohort was an indicator of GWG, rather than capturing total GWG.
In the BiB cohort, applying the Asian specific BMI criteria to calculate level of GWG
reduced the proportion of women with low GWG by 4.7%, and increased the
proportions of women with recommended and high GWG by 0.6% and 4.2%,
respectively (Table 66).
Table 66 Comparing proportions of women in GWG categories; data from Goldstein et al (97) and data from the BiB cohort
GWG Data from systematic
review and meta-analysis of 23
studies by Goldstein et al
(%)
BiB - GWG calculated using
General population BMI
criteria (%)
BiB - GWG calculated using Asian specific BMI criteria (%)
Low 23 43 39
Recommended 30 34 34
High 47 23 27
7.4.2 Discussion of the strengths and limitations of the analysis of the data
from the Born in Bradford cohort
The data from the BiB cohort is rich as it has many well-collected variables, and has
provided me with the information to investigate the association between maternal
BMI, an indicator of GWG and a number of pregnancy outcomes in White British and
Pakistani women. The BiB cohort provided me with a large sample size (n=11,066
prior to exclusions, and n=8,613 remained following exclusions) with a good
distribution of the two ethnic groups of interest; n=4,088 were of White British
ethnicity (47.46%) and n=4,525 were of Pakistani ethnicity (52.54%). This largely bi-
ethnic population provided a unique opportunity for detailed assessments of the
associations between MA, GAC and pregnancy outcomes in Pakistani and White
British women. The large sample size is particularly important for SEM. Although the
exact sample size required for SEM is dependent on model complexity and the
289
number of parameters in the model, which require statistical estimation. A typical
sample for SEM research is around 200 cases (314). One of the limitations is that
despite this large sample size, there was insufficient data for stillbirth, which is a rare
outcome, and when looking at GWG as a categorical exposure (low/high compared
with recommended) there were very small numbers of other outcomes in these
groups. This lead to wide confidence intervals, and caution should be applied when
interpreting these results. Missing data for exposure variables was also an issue, in
particular GWG. For maternal BMI there was very little missing data (6.23%), and
there were very few significant differences in demographic characteristics between
populations with and without BMI data (i.e. women with missing BMI were
significantly taller, weighed significantly more at booking, were significantly more
likely to have a partner born in the UK, significantly more likely that mother and all
four grandparents were born in Pakistan compared to all being born in the UK, and
significantly more likely to have previous diabetes). Unlike maternal BMI, there was a
large proportion of missing data for GWG; 49.32% of the population in the BiB cohort
had no data for GWG. This meant that there were many significant differences in
between those with and without missing GWG data in terms of demographic
characteristics (Chapter 7, Section 7.3, pgs.277-285). One possible way of dealing
with missing data is MI. MI is known generally as a relatively flexible method of
dealing with unavoidable missing data in epidemiological research (291). However,
MI requires that the data is either missing completely at random, or missing at
random (as discussed in section 6.2.2, Chapter 6). This means that either the data
on the variable of interest is missing randomly (for example because the scales were
broken and so the women could not be weighed) or that the missing data on one
variable is sufficiently explained by other variables in the dataset. An example given
for this by Sterne et al is that individuals with high SES are more likely to have their
blood pressure measured and less likely to have high blood pressure compared with
individuals with low SES (291). In this PhD project, an a-priori decision was made not
to use MI with the advice from a statistical expert. This was done as I could not be
sure that this missing data meets the assumptions for MI (data missing completely at
random or at random) and therefore to minimise the bias caused when MI is used
where data is missing not at random.
For the BiB cohort, weight in the third trimester was retrospectively extracted from
case notes and as it is not a routinely collected measure (NICE advise against
290
routine monitoring (45)), it is expected to have higher level of missing data than other
variables. It is likely some of the data is missing at random; the clinicians just didn't
record it because there are no guidelines requiring its measurement. It is also
possible that there is a reason the measurement was not taken. It is possible that the
data is missing at random; for example, GWG in the missing population might be
higher as significantly more White British women were missing data compared with
Pakistani women and White British women on average have higher GWG. However,
there is no way of knowing this for sure. It is also possible that the data is missing not
at random, and there is a difference in the observed and unobserved values of GWG
based on either itself (for example women with high GWG refused to be weighed
because they had high GWG, or differences are caused by a variable not recorded in
this dataset). It may be that clinicians did not always take the weight measurement,
or that they only did it for women where they had time. Data from the BiB cohort has
shown that GDM was more prevalent in women with missing GWG data, so it is also
possible that women with GDM or other complications in pregnancy were referred to
specialists and so did not have the measurement taken like the rest of the cohort.
This reasoning as to why the data might be missing is all hypothetical. In future,
where possible recording reasons why data is not recorded would be useful to gain a
better understanding of the study population, and to ease decisions regarding how to
deal with missing data.
Missing data may lead to loss of precision and bias but are unavoidable in
epidemiological research (315). Ideally, where there is uncertainty about how the
data is missing, and a possibility that MI might be appropriate, both complete case
analysis and MI should be done. Results from both MI and complete case analysis
should then be presented and discussed. However, to complete this project within
the specified timeframe, it was not possible for me to do both. As mentioned
previously, I only carried out a complete case analysis. As there was so much data
missing for GWG, this may have limited the results found. Independent of why the
data were missing, compared to women with GWG data, women with missing GWG
data appeared to be higher risk women. By this I mean that they were more likely to
have previous diabetes or previous hypertension, they were significantly more likely
to have consumed alcohol in pregnancy, or three months before, and were
significantly more likely to have smoked in pregnancy or the three months before.
They also had higher risk of some pregnancy outcomes; compared to a spontaneous
291
birth, women with missing GWG data were significantly more likely to have either a
C-section or an induction. Women with missing GWG were significantly more likely to
have GDM and HDP. Having higher risk women missing from the analysis means
that the results for GWG may have been underestimated (i.e. the risk I found may be
lower than if the higher risk women had been included in the analysis), and this
should be taken into consideration when interpreting the results for GWG as an
exposure.
There are also strengths and limitations relating to the data collected. As the BiB
cohort is embedded within clinical routine it relies on the support from clinical staff to
take and record some of the measurements (316) and it has been previously
demonstrated that the measurements taken by the clinical staff are valid and reliable
(317, 318). However, as this dataset was not collected for the purposes of this project
analysis was limited to the variables available. For example, I was also not able to
look at all outcomes of interest, as they were not available either in the dataset, or to
me, such as congenital anomalies. In addition there are limitations relating to the
measure of GWG available to me. I was only able to calculate GWG by subtracting
the weight at the booking appointment from the weight in the third trimester, this
measure does not quite reflect the total GWG (i.e. subtracting measured
preconception weight from final pregnancy weight). Using this measure of GWG may
have underestimated the results as it is likely to be slightly lower than true total GWG.
While I was able to consider GWG per week which allowed me to account for length
of gestation (but not the rate of weight gain). In future, it is recommended that the
most accurate way to measure GWG is to calculate total GWG, subtracting final
weight from pre-conception weight, using measured weight rather than self-reported,
and adjust for the length of gestation (319). If also considering GWG per week
gestation, it is important to take into account the rate of weight gain.
A strength of the analysis itself, is the extra detail provided by the SEM analysis.
SEM adds to the regression analysis by showing the detail of the direct and indirect
predictors of GWG in the BiB cohort. This information may be useful for informing
targeted interventions to reduce GWG in this population. This is important because,
although regression analysis showed that there was no significant ethnic difference in
the shape of the association between GWG and the majority of pregnancy outcomes,
there were significant associations within the ethnic groups. For example; GWG was
292
significantly associated with higher PPWR at 3 years for Pakistani women, meaning
that these women are at a higher weight after pregnancy, and may then enter the
next pregnancy at a higher BMI. Increased maternal BMI was found to be
significantly associated with a number of adverse pregnancy outcomes, for example;
GDM and pre-term birth. So although reducing GWG may not impact on the
outcomes for this pregnancy, it may mean that the mother enters the next pregnancy
at a BMI in the recommended range.
Another point for discussion is how representative the population is, and how
generalisable the results are. While the population in the BiB cohort is representative
of the population in Bradford when the data was collected (3), Bradford is not
representative of the rest of the UK due to the high levels of poverty (67.8% of the
population are in the most deprived IMD quintile) (3).This means also that the White
population in Bradford is a high risk group compared with the rest of the UK. This
may have diluted the effect size observed as both ethnic groups in Bradford are
higher risk populations. This means that the difference between the two groups may
be smaller than that where there is an ethnic difference in SES. This limits the
generalisability of the findings as in other areas of the UK White British populations
tend to be lower risk. While there are similarities between Bradford and other cities
with high levels of ethnic minority and immigration both in the UK and worldwide (3),
caution must be applied when interpreting these results, and applying them to other
populations. This data was also collected between 2007 and 2011, and although is
still being followed up; the baseline data may be slightly outdated. Therefore, while
these results are applicable to those participants from the BiB cohort who were
included in my analysis, they may not be applicable to other populations. In
conclusion, while there are significant ethnic differences in the shape of the
association between pregnancy outcomes: GDM, pre-term birth, and infant thigh
circumference at 3 years of age and maternal BMI there were no significant ethnic
differences identified for GWG as an exposure following adjustment for confounders.
This this was still true when using the Asian specific BMI criteria to calculate level of
GWG. SEM analysis suggested that ethnicity was not a significant predictor of GWG,
and that maternal body composition may play a larger role in determining GWG,
independent of ethnicity.
293
Chapter 8. Discussion
This PhD project aimed to investigate the relationship between UK ethnic groups
(White and South Asian), MA, GAC, and short- and long-term pregnancy outcomes
for both mother and child. In the discussion below, I have briefly summarised the
main findings from each of the thesis chapters and placed them in context with the
most relevant literature. I have also discussed the overall strengths and limitations of
the methodology used; the strengths and limitations of each chapter have been
discussed within the respective chapters. I then provide recommendations for future
research, and for policy and practice in the UK.
8.1 Summary of findings
In Chapter 1, I highlighted that obesity is a growing global health problem for both
adults and children (1), and is linked to a number of chronic health conditions such as
type II diabetes, cancer, and cardiovascular disease (1, 2). Obesity is also a concern
in pregnancy, and is linked to a number of adverse health outcomes for both the
mother (for example; GDM) and infant (for example; pre- and post-term birth) (62-64).
My introduction also considered GWG, and how outcomes for the mother (for
example; PPWR) and the infant (for example; birth weight) are associated with GWG.
In the USA, the IoM have developed guidelines for recommended GWG for BMI
(underweight, recommended weight, overweight, and obese) based on a review of
evidence from a number of ethnic groups (Non-Hispanic White, Black, Hispanic, and
Asian where the Asian population reflected a more eastern Asian population i.e.
Chinese, Japanese, Phillipino etc.) (94). Evidence shows that a number of other
countries also have guidelines for GWG, and that in about half of these countries, the
guidelines are the same as, or similar to, the 2009 IoM GWG guidelines (320).
Currently, the UK does not have GWG guidelines. Although guidelines for weight
management during pregnancy have recently been reviewed, NICE in the UK have
decided not to adopt the IoM GWG guidelines due to the lack of evidence relevant to
UK populations, in particular for UK ethnic groups (47, 51).
In the UK, the second largest ethnic group is South Asian (Pakistani, Indian,
Bangladeshi) (169, 170). Evidence shows that South Asian women have a higher risk
of obesity related outcomes, for example type II diabetes, at a lower BMI than the
294
White population and that this difference in risk is predominantly due to differences in
body composition, including body fat distribution (321). This has led to the
development of BMI criteria for Asian populations (5, 43). Evidence also suggests
that this difference in risk may extend to pregnancy; for example, South Asian
women have been found to have a higher risk of GDM at a lower pre-pregnancy BMI
compared with the White women (322). This may also be the case for weight gained
in pregnancy (i.e. GWG); there may be a higher risk of adverse outcomes for mother
and infant at a lower weight gain in South Asian women compared with White
women. This PhD research, therefore, aimed to investigate the relationship between
UK ethnic groups (White and South Asian), MA, GAC, and short- and long-term
pregnancy outcomes for both mother and child.
In Chapter 2, I highlighted the methodology I used for this PhD project which is based
on SEM methodology (using existing theory and evidence to generate a conceptual
model which is then tested using data), and used a mixed-methods study design.
This methodology allowed me to use existing evidence and theory to develop an
evidence-based conceptual model of associations between MA, GAC and pregnancy
outcomes. The model was developed in three stages; stage 1: systematic review,
stage 2: framework based synthesis and stage 3: expert opinion. This model was
then used to guide all data analysis. Although full SEM analysis was only carried out
for GWG as an outcome, the SEM methodology used in this thesis provided a robust
skeleton for the development of an analysis plan using existing data. This allowed me
to immerse myself in the published literature, and use this literature to develop the
evidence-based conceptual model.
In Chapter 3, I carried out a systematic review of the association between pregnancy
outcomes, MA and GAC in South Asian and White women. Results showed that in
South Asian women, GAC, HDP, GDM, mode of delivery, birth weight, stillbirth,
congenital anomalies, weight retention and postnatal IGT were all associated with
MA. GDM was associated with GAC, and both MA and GAC appeared to have a
combined effect on GDM and PPWR. The evidence also suggests that there was no
significant association between GAC, gestational age at delivery, PPH, admission to
the NICU and perinatal death and MA. Since this systematic review was carried out,
a review with an updated search (searching finished July 2017) has been published
(186). This updated search identified three more studies that were relevant for
295
inclusion (322-324); one each from Canada (324), Australia (323) and the UK (322).
These three studies considered the following; the first study considered maternal
weight (kg) and maternal BMI (kg/m2) as exposures and GWG (kg) as an outcome
(324).
Findings showed that there was no significant difference in GWG relative to pre-
pregnancy weight for South Asian compared with White women (324). The second
study considered maternal BMI (kg/m2) as an exposure and the presence or absence
of diabetes during pregnancy, with the risk equivalent BMI thresholds for each ethnic
group (322). Findings showed that, for South Asian women, a BMI of 21kg/m2 was
the risk equivalent to that of a BMI of 30kg/m2 for White women, again suggesting
that South Asian women have a higher risk of GDM at a lower BMI than White
women (322). Finally, the third study considered maternal BMI (kg/m2) as the
exposure and the following outcomes; gestational hypertension, pre-term birth,
shoulder dystocia, PPH, mode of delivery, birth weight, fetal compromise, admission
to NICU, any perinatal morbidity and stillbirth (323). Findings showed that the odds of
gestational hypertension, GDM, shoulder dystocia, unplanned C-section,
macrosomia (>4kg) fetal distress, admission to NICU and any perinatal morbidity
were all positively associated with maternal obesity in South Asian women, and SGA
was negatively associated with maternal obesity (323). Of all outcomes considered,
there were only significant interactions between ethnicity and maternal obesity on
gestational hypertension, GDM and shoulder dystocia (323). The addition of the
results of these three studies did not change the overall findings of my systematic
review: there is limited evidence for GAC as an exposure, and in South Asian
women, and limited evidence for longer-term outcomes associated with both MA and
GAC. However, these new results did highlight shoulder dystocia, fetal distress,
admission to NICU and any perinatal morbidity as other potential outcomes of
interest associated with MA in South Asian women.
In Chapter 4, I carried out a mixed methods systematic review to identify confounding
and mediating variables for the associations between pregnancy outcomes MA and
GAC identified in Pakistani women. This chapter provided me with evidence of which
confounders I should include in adjustments made in the statistical analysis. It also
provided me with evidence of any mediators I could explore using SEM (for example
evidence showed that GDM is a mediator of the association between MA and GAC).
296
This chapter also provided me with additional pregnancy outcomes of interest that
were identified through statistical adjustments in papers included in the framework
based synthesis. These additional outcomes were; cord blood insulin and leptin
levels, maternal mental health in pregnancy, maternal mortality, breastfeeding and
longer term infant anthropometric measurements in addition to infant BMI (obesity in
infants was identified as an outcome of interest by the evidence in the IoM guidelines
(94)).
Chapter 5 describes the methods and results from the expert opinion stage, which
provided an additional confirmatory step to model development allowing me to get
opinions from experts in the field. This final stage of model development highlighted
that the experts felt that that the conceptual model of hypothesised associations
between MA, GAC and pregnancy outcomes in Pakistani women was theoretically
accurate. An additional outcome was also identified: maternal and infant blood
pressure in the longer term (i.e. post-partum blood pressure). Chapter 5 also
described the final conceptual model used to guide data analysis of data from the BiB
Cohort.
Chapter 6 described the statistical methods used to analyse the data from the BiB
cohort. In brief, this involved descriptive statistics, generalised linear model
regression analysis (logistic for categorical outcomes and linear for continuous
outcomes) with interaction terms added to investigate the ethnic difference in the
shape of the association between each exposure and each outcome, and SEM for
GWG as an outcome. As I did not use any latent variables in the SEM analysis, this
can also be described as a path model.
In Chapter 7, I presented the results of the analysis of the data from the BiB cohort.
Findings showed that, on average, Pakistani women had a lower BMI and lower
GWG compared with White British women. In unadjusted analysis, Pakistani women
were also less likely to have HDP or C-section, and more likely to have GDM and
breastfeed. Pakistani women also had higher PPWR at three years compared with
White British women. Infants of Pakistani women were less likely to be born post-
term, and were smaller at birth compared with infants of White British women for all
anthropometric measures considered (birth weight, abdominal circumference, head
circumference, mid-arm circumference, subscapular SFT and tricep SFT). At three
years of age, infant abdominal circumference, tricep SFT and thigh circumference
297
were significantly lower for infants of Pakistani women compared with infants of
White British women but there were no significant differences in weight or
subscapular SFT. Regression analysis considering the association between
pregnancy outcomes and exposures BMI and GWG found that there were ethnic
differences in the shape of the association pregnancy outcomes: GDM, pre-term
birth, and infant thigh circumference at three years of age, and maternal BMI.
However, there were no significant ethnic differences in the association between any
pregnancy outcome and GWG following adjustment for confounders. SEM identified
that although ethnicity was a significant predictor of maternal BMI, it was not a
significant predictor of GWG. Maternal MUAC and BMI had the largest total effect on
GWG.
8.2 Strengths and limitations
SEM methodology is more than just a statistical analysis method; prior to carrying out
any statistical analysis, it ensures that the researcher immerses themselves in the
topic, and familiarises themselves with the existing evidence base. This knowledge is
then used to develop a conceptual model of the evidence-based associations
between variables of interest. This approach uses the existing evidence and theory to
shape the data analysis. In this PhD project, not only has existing literature been
used, but an existing dataset also. The SEM methodology used in this PhD project
maximises the use of existing data, is financially efficient and meets the MRC
strategic aims of furthering science and understanding, in particular the aim to
encourage greater use of existing data (325).
The approach used to develop the conceptual model was rigorous and thorough.
Each stage of model development built on the last and tried to overcome any
limitations. The systematic review identified associations between exposures and
outcomes in the published literature. This review lacked evidence of potentially
confounding mediating variables, and there was the potential for associations that
had not been published. The framework based synthesis, therefore, identified
confounding and mediating variables, and also any other potential outcomes through
adjustments (for example, where researchers had adjusted for maternal BMI in a
regression between physical activity and mental health in pregnancy, suggesting that
maternal BMI is associated with mental health in pregnancy). Despite this, using
298
existing evidence and theory to guide conceptual model development meant that
there may have been limitations relating to gaps in the literature (by which I mean
that not all possible outcomes have been investigated by existing published
literature). I used an expert panel to try to combat this. Ideally, I would also have
included BiB participants on the expert panel but due to time limitations, it was not
possible. Despite the steps taken to combat missing any associations of interest, the
updated systematic review identified three outcomes of interest in South Asian
women; shoulder dystocia, fetal distress, admission to NICU and any perinatal
morbidity.
The model development process was rigorous. I identified both outcomes of interest,
and also confounding and mediating variables. This involved two systematic reviews
and a validation study. This findings from these studies were then used to develop
conceptual models for each outcome. This produced complex conceptual models for
each outcome. The complexity of the conceptual models developed also meant there
were outcomes identified (GDM, HDP, birth weight, gestational age at delivery,
stillbirth, mode of delivery, PPWR, breastfeeding and infant anthropometrics) in the
model development process that have not yet been explored using SEM. This was
due to the complexity of conceptual models developed, availability and quality of data
for confounding and mediating variables, and the time required to complete this
complex analysis. However, the evidence-based models developed can now be used
to guide future research, and could also form the basis for future causal analysis.
These evidence-based models also provided me with a form of causal diagram for
each outcome of interest. I found that causal diagrams were a useful way of
determining which variables to adjust for in regression analysis, and can also be
used to determine which variables are confounders and mediators for SEM analysis
(303). Taking the time to consider whether variables were mediators or confounders
of associations was an important step in model development, both for SEM, which
considers direct and indirect effects, and regression analysis which, considered total
effects. For regression analysis, including a mediator in adjustments can increase
bias (298). This is sometimes known as “overadjustment”, although this term is poorly
defined (298). Including a mediator or a variable on the causal path between
exposure and outcome, in an adjustment for the total effect of an exposure on an
outcome may increase bias. An example of this is the association between maternal
299
smoking and neonatal morality, where adjusting for birth weight decreases the risk
ratio, rather than raising it as you would expect (298). This is thought to be because
smoking is likely to affect an unmeasured factor that effects both neonatal mortality
and birth weight separately (298). Unlike in the analysis of total effects,
overadjustment bias is not induced where there is a decomposition of effects (i.e.
looking at indirect and direct effects), for example in SEM where the correct statistical
methods are applied (298). I was, therefore, able to ensure that bias was minimised
in regression analysis by not including mediators in my adjustments, and then was
able to go on to consider both confounders and mediators of GWG through direct
and indirect paths using SEM.
Another strength of this PhD research is the BiB dataset itself. It is a unique dataset.
As discussed in Chapter 7, the BiB dataset has many well-collected variables, a large
sample size and a good distribution of Pakistani and White British women. The
dataset is also unique in that both ethnic groups live in a deprived area. The
association between ethnicity and maternal obesity is complicated by the
interrelationship between ethnicity and socio-economic group (58, 59). Investigations
into whether disparities in health status are due to either “ethnicity and social class”,
or “ethnicity or social class” are complicated by this overlap between ethnicity and
socioeconomic status (162). However, for this PhD project, this overlap is minimised
by the fact that both ethnic groups live in the same area, and any small differences in
SES have been accounted for by adjustments carried out in the statistical analysis.
Another strength of using the data from the BiB cohort was that it enabled
communication and collaboration with the BiB team, enriching my PhD work,
particularly in terms of the expert opinion stage of model development.
8.3 Policy and practice
My findings suggest that there is little ethnic difference in the association between
GWG and pregnancy outcomes investigated for Pakistani and White British women
living in Bradford, in both continuous and categorical analysis. This was also true
when calculating level of GWG using the BMI criteria for South Asian women. Due to
the lack of ethnic difference, these findings suggest that the IoM guidelines could be
relevant for this Pakistani population in the UK. However, due to data availability, the
measure of GWG used may have underestimated the results, and I cannot be sure
300
that the association will remain the same if final weight in pregnancy was used to
calculate GWG rather than weigh in the third trimester. Therefore, before I can make
clear recommendations for policy and practice, and we can say whether the IoM
guidelines for GWG should be implemented in the UK, or whether there should be
routine monitoring of, and support for weight change during pregnancy, more
research is needed. In particular, we need to examine the association between
pregnancy outcomes and GWG for other UK ethnic groups, including other South
Asian groups (Indian, Bangladeshi etc.). We must also consider how pregnancy
outcomes are affected by other measures of GAC to reflect differences in body
composition. The association between childhood anthropometrics, and measures of
post-partum anthropometric retention (in addition to PPWR) and MA and GAC should
also be explored further in ethnic groups relevant to the UK population.
8.4 Future research
Outcomes were identified (GDM, HDP, birth weight, gestational age at delivery,
stillbirth, mode of delivery, PPWR, breastfeeding and infant anthropometrics) in the
conceptual model development that have not yet been explored using SEM. This was
due to the complexity of conceptual models developed, availability and quality of data
for confounding and mediating variables, and the time required to complete this
complex analysis. Conceptual models developed for these (both short-, and long-
term) pregnancy outcomes (Appendix 9 pgs.355-357) should be used to inform future
research; they could be investigated using SEM and could also be used as a basis
for causal analysis for example using directed acyclic graphs (DAGs) and Daggity
software. There were also some additional pregnancy outcomes identified as
relevant by model development. However, due to availability25 of data from the BiB
cohort, I was not able to explore the associations between MA, GAC and some
pregnancy outcomes. In particular, congenital anomalies, maternal mental health in
pregnancy, maternal mortality, and long term maternal and child blood pressure.
Congenital anomalies were highlighted as an outcome of interest by my systematic
review. Pakistani women have a higher risk of congenital anomalies compared with
White women (200). The increased risk in Pakistani women is partly due to higher
25 This was both due to the availability of variables in the dataset, and due to permissions accessing some of the variables.
301
rates of consanguinity in this population (200). However, it is important to investigate
other possible risk factors including MA measures and GAC. It is also important to
investigate how congenital anomalies might act as a mediator between MA measures
and other pregnancy outcomes. There is a temporal issue with investigating the
association between congenital anomalies and GAC, i.e. which occurred first. It might
be that it is only possible to look at the association between early GAC and
congenital anomalies, rather than the total GAC.
Mental health in pregnancy was highlighted as an outcome of interest by my
framework based synthesis. Mental health in pregnancy has been found to be
associated with maternal BMI (although mental health prior to pregnancy may affect
this association, and in turn may influence maternal BMI)(240), and mental health in
pregnancy may affect GAC. The association between mental health in pregnancy
and both MA and GAC, and whether or not maternal mental health acts as a
mediator of the association between MA and GAC, along with other pregnancy
outcomes should be investigated. Maternal mortality was also highlighted as an
outcome of interest by my framework based synthesis. The risk of maternal mortality
has been found to be increased in ethnic minority women in the UK (326), whether
this risk if affected by MA and GAC should be explored further. Maternal and child
blood pressure after pregnancy were identified as outcomes of interest by the expert
opinion phase of model development. Whether or not these are associated with MA
and GAC should be considered.
Although I was able to do some analysis for stillbirth as an outcome, it was limited
due to the small sample size (stillbirth n=49; n=17 for White British, n=32 for
Pakistani). Future research requires larger samples to enable sufficient power to
detect an effect size. This is also the case for other rare outcomes such as congenital
anomalies, and when considering gestational age at delivery in subgroups; e.g.
extreme pre-term birth; very pre-term birth, pre-term birth, early term, term, late term,
prolonged pregnancy and post-term birth, as increasing the number of categories,
decreases the sample size in each. There is also an issue around determining how
data are missing, particularly for variables that are poorly recorded. In future, where
possible, a reason for why data is missing should be recorded. This information
would allow researchers to make an informed decision on how data is missing, rather
than to make assumptions which potentially incur bias (for example, assuming their
302
data is missing completely at random, when in fact it is not). It may also be beneficial
to run both a complete case analysis (with discussion of how the populations with
and without missing data differ) and MI, and report clear methodology and results for
both methods comparing findings and discussing the strengths and limitations of
each.
This PhD research investigates GWG as an exposure and an outcome. Evidence
suggests that there is little success in altering the risk of adverse pregnancy
outcomes by reducing GWG through lifestyle and dietary interventions in pregnancy
(143). Individual patient data meta-analysis of 12,526 women from randomised trials
suggests that reduction of maternal and infant composite outcomes (maternal
included pre-eclampsia/pregnancy induced hypertension, GDM, pre-term birth,
elective and emergency C-section, and infant included intrauterine death, SGA, LGA
and admission to NICU) (327). Despite this, risk of C-section and amount of GWG
significantly reduced for women receiving the interventions (327). While GWG may
not be a significant factor in predicting adverse pregnancy outcomes, this period
between pre-conception and conception through to the child’s early years is an
important window in terms of behaviour change (319, 328). Evidence shows that
women who enter pregnancy healthy are more likely to have a pregnancy with
positive outcomes for mother and infant(328). These interventions provide a key
window of opportunity for providing health education to the mother and, in the longer
term, infant. More research is needed looking at interventions improving women’s
health prior to conception, and also at how we can support involvement of the
women’s partner in behaviour change from pre-conception.
It is also important to note that existing research does not consider the effects of
these interventions on measures of GAC other than GWG, and how these other
measures of GAC effect pregnancy outcomes. Future research also needs to explore
other measures of GAC (i.e. change in SFT and MUAC), whether these measures
differ between ethnic groups, how these measures affect pregnancy outcomes, and
whether the association between different measures of GAC and pregnancy
outcomes are different between ethnic groups. Overall, GWG may not be significantly
associated with risk of adverse pregnancy outcomes. However, GWG isn’t just made
up of maternal fat mass; it is also fetal factors (the fetus and amniotic fluid) and other
maternal factors (total body water). These other anthropometric measures are better
303
indicators of body fat, and fat distribution than GWG itself. Therefore, it is important
that these measures are investigated further; particularly how they are associated
with pregnancy outcomes.
There is a need for research to investigate maternal anthropometric measures and
pregnancy outcomes in other South Asian populations, for example; Bangladeshi and
Indian populations. Within the South Asian population there is heterogeneity between
the populations (i.e. Bangladeshi, Pakistani, Indian); for example in relation to first
trimester maternal obesity (18), blood pressure (19), and risk factors for coronary
heart disease (20). While my findings represent a UK Pakistani population living in
Bradford, the findings cannot be applied to other South Asian women in the UK.
There is also a need to investigate the influence of the place of birth of the mother
and father, and grandparents and also the length of time spent in the country of
settlement (length of time may only apply to those who were born in another country
and have moved to country of settlement).
There are also issues around terminology in this area of research. For example;
place of birth of parents and grandparents is sometimes referred to as “generation
status” i.e. first generation migrants are those who have migrated from e.g. Pakistan
and now reside in e.g. UK; second generation migrants are those who are born to
first generation migrants; third generation migrants are born to second generation
migrants and so on. “Generation status” will not be used here as second and third
generation “migrants” are in fact not migrants at all as they are born in country of
settlement. This is not the only issue with terminology in research involving ethnicity;
there are also issues in the use of individual words, and definitions used to define
populations (e.g. White, Caucasian or Anglo-Celtic, South Asian, Asian, Pakistani)
(329). Going forward, it is important to use the correct terminology, and definitions, to
enable better comparisons to be made. Until these terms are clarified, it is best to
think about the terminology used, clearly define any terms used, and ensure they are
based on ethnicity and not race.
It is also important that future research developing causal or theoretical models
includes patient and public involvement (and engagement (PPI(E)), and uses more
rigorous and systematic methods for collating thoughts and opinions from experts.
Engaging the public in model development would be a useful stage in addition to
expert opinion, especially where there are cultural differences between the
304
researchers and the study population. One way of incorporating PPIE into study
design could be to provide a validation step in model development, For example, a
systematic review could be carried out to identify associations, and confounders and
mediators of associations of interest. PPIE could then be used to get feedback and
thoughts on the model developed from the systematic review from, including advice
on any missing variables and associations between variables. A model validation
step could then be to use a Delphi survey of experts in the field to come to
agreement about the final causal diagram to be tested in the data, which could then
be further validated by a secondary survey with a different panel of experts. A Delphi
survey is a structured communication method useful for theory building, which relies
on a rigorously selected panel of experts familiar to the field of research (330). The
challenge of achieving attendance of all members in the expert panel limits this
method (331). However, the method provides a structured and rigorous approach to
recording the decision making process (332).
8.5 Conclusions
Systematic review evidence highlighted nine outcomes of interest when considering
MA and GAC as exposures in Pakistani and White British women. Outcomes for the
mother were HDP, GDM, mode of delivery (C-section and induction), breastfeeding
at 6 months, and PPWR. Outcomes for the infant were outcome of birth (i.e. stillbirth
or livebirth), gestational age at delivery (pre-term birth <37 weeks, and post-term birth
≥42 weeks), infant anthropometrics at birth (birth weight, abdominal circumference,
head circumference, mid-arm circumference, subscapular SFT and tricep SFT), and
infant anthropometrics at 3 years of age (weight, abdominal circumference,
subscapular SFT, tricep SFT, and thigh circumference). Analysis of data from the BiB
cohort found significant ethnic differences in the shape of the association between
GDM, pre-term birth, and infant thigh circumference at 3 years of age, and maternal
BMI. There was little ethnic difference in the shape of the association between any
pregnancy outcomes and GWG. Ethnicity was not found to be a significant predictor
of GWG in the BiB cohort. More research is needed to consider different measures of
MA, and measures of GAC, and considering other South Asian ethnic groups.

305
Appendices
Appendix 1. The Born in Bradford multi-ethnic pregnancy
cohort study
This PhD project will involve analysis of data from the Born in Bradford (BiB) cohort.
This section will describe Bradford and the BiB cohort, discuss some of the strengths
and limitations of the data from the BiB cohort and explain why the BiB cohort is
suitable for this PhD project.
About Bradford
Bradford District is in West Yorkshire in the north of England. It is the fourth largest
metropolitan district in England in terms of population, after Birmingham, Sheffield
and Leeds although the District’s population growth is lower than other major cities
(333). In June 2017 an estimated 534,300 people live in Bradford district (334). This
was an increase of 3,100 people (0.6%) from the previous year; the rate of increase
was similar to the previous year (334).
The population increase between 2016 and 2017 was due to what the Bradford
metropolitan district council term “natural change”; there were 3,600 more births than
deaths in the time, and a large number of people leaving Bradford to live in other
parts of the UK (334). Data shows that in 2015/16, the net international migration (i.e.
to and from outside the UK) was 2,600, and the net internal migration (i.e. inside the
UK) was -2,300 (334).
The population in Bradford is ethnically diverse; the district has the largest proportion
of people who identify themselves as Pakistani in England at 20.3% and 63.9% of the
population identify as White British (334). Nearly a quarter of the population are
Muslim (24.7%), just under half are Christian (45.9%) and just over a fifth describe
themselves as having no religion (20.7%) (334).
Bradford’s urban areas are amongst the most deprived in the UK (316, 335). In
Bradford in 2016, 67.3% of 16-64 year olds were in employment (334). This was
significantly lower than the national rate at 74.3% and meant that one in three adults
were not in employment (334). Evidence shows that deprivation in Bradford in 2014
using IMD 2010 was higher than the rest of England (336). Evidence also shows that
that were a higher proportion of residents in the most deprived IMD quintile than the
306
rest of England (336) and that the most deprived residents are found in the more
urban areas clustering around Bradford city centre (336).
Deprivation in Bradford is associated with a wide range of public health problems.
Bradford’s infant mortality rate (IMR) is one of the highest in England and Wales, with
between 60 and 70 babies dying every year (337). Childhood obesity is also higher in
Bradford, in 2012 20.6% of year six children were classified as obese (336)
compared to the national average which was 19.1% in 2013/14 (338). Within
Bradford, a third of children with obesity live in the most deprived quintile compared
to 10% who live in the least deprived quintile. Obesity is also a significant public
health problem in Bradford, in 2012 in 26.7% of adults were classified as obese, this
was higher than the 2013 measurement of 24.9% for the rest of England (339). In
addition, estimated levels of adult smoking, physical activity, GCSE attainment,
breastfeeding and smoking at time of delivery are worse than the average for
England (336). Life expectancy in Bradford is lower than the average for England; in
the most deprived areas it is 9.6 years lower than the national average for men and
for women it is 8.7 years lower (336)
Between 2007 and 2011 when the BiB data was collected; around 20% of the
population in Bradford was South Asian26, 90% of whom were of Pakistani origin (2,
6), almost all being from the Mirpur region of Pakistan (335). Among those of
Pakistani origin there was a three-generation community which maintains close links
with Pakistan (340). Despite the fact that around 20% of the population were
Pakistani, just under half of the babies born in the city had parents of Pakistani origin;
50% of babies born were White, 44% Pakistani, 4% Bangladeshi and 2% other (316).
The high proportion of babies of Pakistani origin is thought to be due to the relatively
young age of the population of Pakistani origin and their higher fertility rates
compared to the White British population (316). Sixty percent of the babies born in
Bradford were born into the poorest 20% of the population in England and Wales,
based on the IMD (316). Infant mortality in Bradford has consistently been above the
national average of 5.5 deaths per 1000 live births at 9.5 deaths per 1000 live births,
with babies of Pakistani origin having an even higher infant mortality rate of 12.9
26 South Asian is referring to people from Pakistani, Bangladeshi, Indian or other South Asian origin
307
deaths per 1000 live births. In addition, the levels of congenital anomalies and
childhood disability are among the highest in the UK (200, 341-347).
BiB cohort
BiB was established in 2007 due to the rising concerns relating to increased rates of
childhood morbidity and mortality in Bradford (316). BiB is a multi-ethnic birth cohort
study which aims to examine the genetic, nutritional, environmental and social factors
that impact on health and development during childhood, and the long-term effects
into adult life (316). The main goal of BiB is to develop hypotheses that can be tested
for health and social interventions to improve both childhood and adult health (316).
Broad aims of the BiB project include describing the health and ill health within a
multi-ethnic and economically deprived population (316). Identifying modifiable or
causal pathways that lead to ill health or promote well-being (316). Designing,
developing and evaluating interventions which promote health (316). Providing a
model for integrating epidemiological, operational and evaluative research into health
related systems including the National Health Service (316), and also to build and
strengthen local research capacity in Bradford (316).
BiB Methods
Women were eligible for recruitment if they planned to give birth at Bradford Royal
Infirmary (335), all babies born from March 2007 were eligible to participate (335)
and fathers of babies who were recruited into the cohort were also eligible for
inclusion (335). The recruitment phase of this cohort ended in December 2010 (335).
The majority of women were recruited at their 26-28 weeks gestation oral glucose
tolerance test (OGTT), a minority did not attend for OGTT and were recruited by
other means (e.g. hospital contacts) (316). Babies were recruited at birth and fathers
were recruited whenever possible during the antenatal period or soon after birth. The
aim was to recruit 10,000 women, their babies and the babies’ fathers (335).
308
Between 2007 and 2011, detailed information on lifestyle factors, environmental risk
factors, socio-economic factors, family trees and ethnicity27, and physical and mental
health was collected from 12,453 women with 13,776 pregnancies and 3448 of their
partners (316). At recruitment, women had blood samples taken, completed an
administrator completed semi-structured questionnaire, and had height, weight, arm
circumference and tricep thickness measured, and fathers had saliva samples taken
and self-completed a questionnaire (335). At birth, the babies had umbilical cord
blood samples taken, then within two weeks of birth they had head, arm and
abdominal circumference measured in addition to subscapular and tricep skinfold
thickness measurements (335). Participants were allocated unique identification
numbers and NHS numbers have been used to access routine data and also for data
linkage (335).
BiB Cohort profile summary
Table 1 summarises the characteristics of the BiB cohort at baseline (at the first
stage of data collection following recruitment). The majority of the population are
Pakistani (45.0%), aged between 25-29 years of age (32.6%), are nulliparous
(38.4%) and living in the most deprived quintile of the Index of multiple deprivation
(67.8%) (316).
27 Ethnicity is a socially constructed phenomenon and the definition differs across different studies. In
the context of this PhD project data on ethnicity were collected by BiB and ethnicity has been self-
defined by the mother.
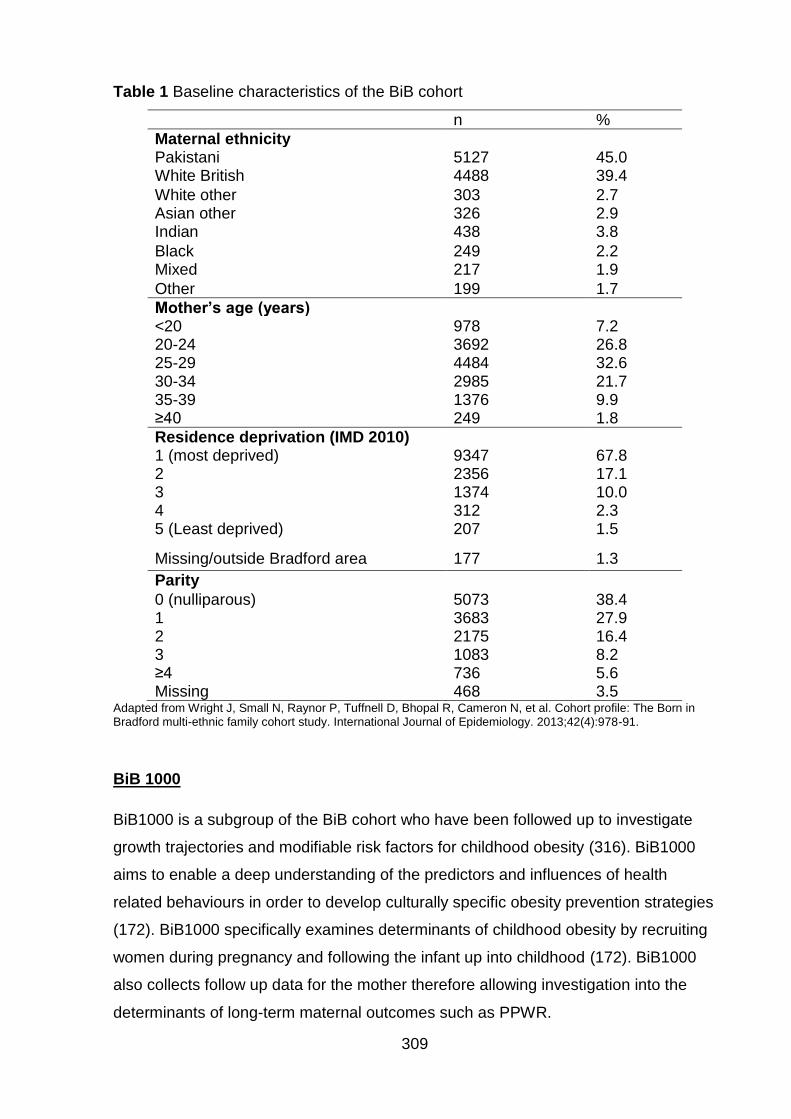
309
Table 1 Baseline characteristics of the BiB cohort
n %
Maternal ethnicity Pakistani 5127 45.0 White British 4488 39.4
White other 303 2.7 Asian other 326 2.9 Indian 438 3.8
Black 249 2.2 Mixed 217 1.9
Other 199 1.7
Mother’s age (years) <20 978 7.2 20-24 3692 26.8 25-29 4484 32.6 30-34 2985 21.7 35-39 1376 9.9 ≥40 249 1.8
Residence deprivation (IMD 2010) 1 (most deprived) 9347 67.8 2 2356 17.1 3 1374 10.0 4 312 2.3 5 (Least deprived) 207 1.5
Missing/outside Bradford area 177 1.3
Parity
0 (nulliparous) 5073 38.4 1 3683 27.9 2 2175 16.4 3 1083 8.2 ≥4 736 5.6 Missing 468 3.5
Adapted from Wright J, Small N, Raynor P, Tuffnell D, Bhopal R, Cameron N, et al. Cohort profile: The Born in Bradford multi-ethnic family cohort study. International Journal of Epidemiology. 2013;42(4):978-91.
BiB 1000
BiB1000 is a subgroup of the BiB cohort who have been followed up to investigate
growth trajectories and modifiable risk factors for childhood obesity (316). BiB1000
aims to enable a deep understanding of the predictors and influences of health
related behaviours in order to develop culturally specific obesity prevention strategies
(172). BiB1000 specifically examines determinants of childhood obesity by recruiting
women during pregnancy and following the infant up into childhood (172). BiB1000
also collects follow up data for the mother therefore allowing investigation into the
determinants of long-term maternal outcomes such as PPWR.
310
All mothers recruited to the full BiB study between August 2008 and March 2009 who
had completed the baseline questionnaire were approached to take part in BiB1000
during their 26-28 week glucose tolerance test (172). In order to detect a difference in
infant growth of a one centile band (or 0.67 z-scores) in weight at age over one year,
allowing for a 5% annual attrition, it was calculated that a sample size of 1080 was
required (172). However once recruitment begun it was found to be highly
successful, it was therefore in order to optimise the amount of data that were
available, it was decided that oversampling by up to 70% would be carried out (172).
Of the 1,916 women who were eligible to participate, 1735 women agreed to take
part (172). Of these 1,735 women 1,707 had singleton births between October 2008
and May 2009 (172). Follow up data were collected when the children were aged 6,
12 and 18 months and 2, 3 and 4 years (316).
Information was collected by trained bilingual study administrators from the mother in
her home, local Children’s Centres or hospital-based clinics (172). Structured
questionnaires were self-completed, anthropometric measurements were taken
routinely collected data were extracted from the maternity IT system which is known
as eClipse and the Child Health system in Bradford and Airedale Primary Care Trust
(172). BiB1000 has been found to have similar distributions of age, marital status and
parity as of the full BiB cohort (316). Table 2 shows that maternal ethnicity was also
similar across BiB and BiB 1000.
311
Table 2 Maternal ethnicity across BiB and BiB1000
BiB BiB1000
Maternal ethnicity
N % n %
Pakistani 5127 45.0 808 47.3
White British 4488 39.4 652 38.2
White other 303 2.7 30 1.8
Asian other 326 2.9 52 3.0
Indian 438 3.8 73 4.3
Black 249 2.2 34 2.0
Mixed 217 1.9 22 1.3
Other 199 1.7 28 1.6
BiB and BiB1000 data collection
A full list of the data collection forms for both BiB and BiB 1000 are available at
http://www.borninbradford.nhs.uk/research-scientific/general-study-documentation-
and-questionaires/. Tables 3-5 summarise the data collected for mother, child and
father at each stage of the BiB study.
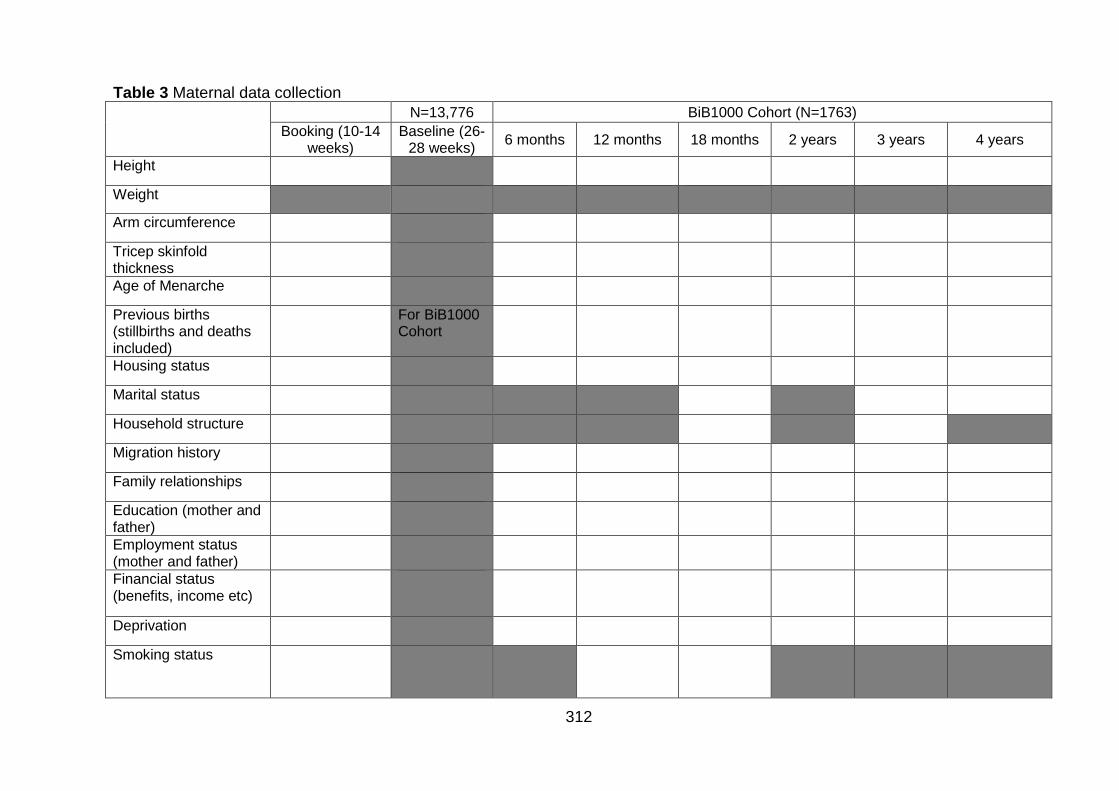
312
Table 3 Maternal data collection N=13,776 BiB1000 Cohort (N=1763)
Booking (10-14 weeks)
Baseline (26-28 weeks)
6 months 12 months 18 months 2 years 3 years 4 years
Height
Weight
Arm circumference
Tricep skinfold thickness
Age of Menarche
Previous births (stillbirths and deaths included)
For BiB1000 Cohort
Housing status
Marital status
Household structure
Migration history
Family relationships
Education (mother and father)
Employment status (mother and father)
Financial status (benefits, income etc)
Deprivation
Smoking status
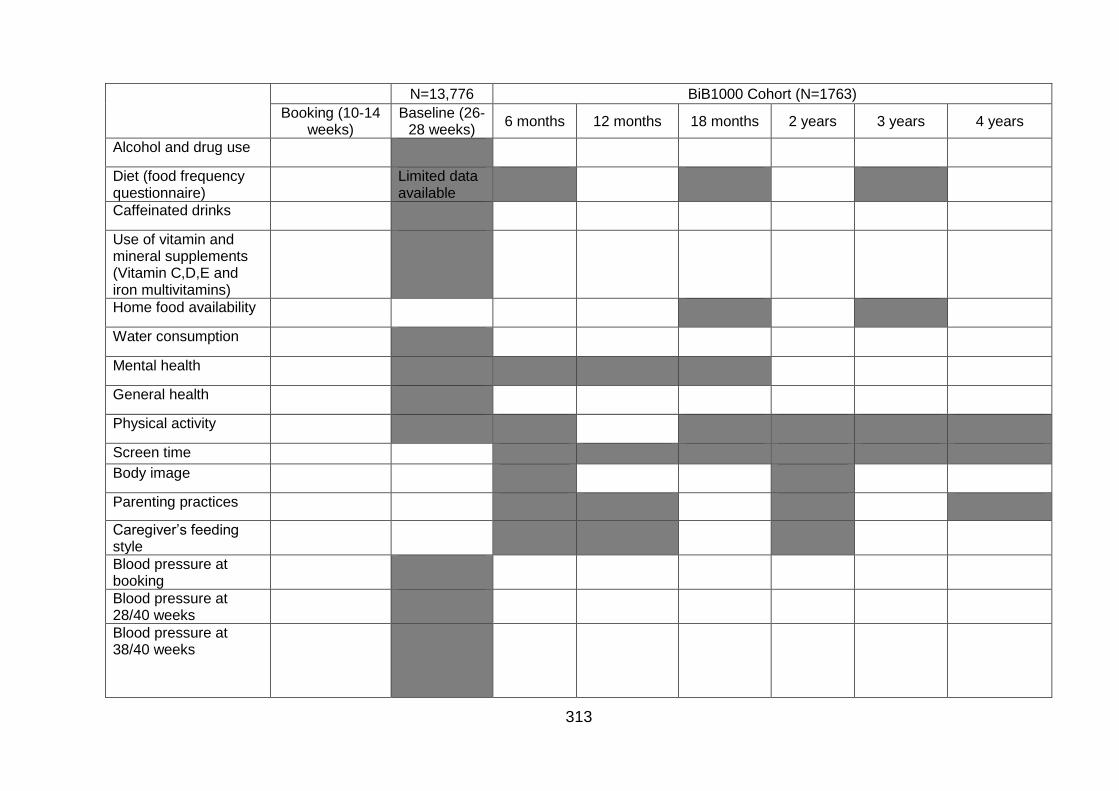
313
N=13,776 BiB1000 Cohort (N=1763)
Booking (10-14 weeks)
Baseline (26-28 weeks)
6 months 12 months 18 months 2 years 3 years 4 years
Alcohol and drug use
Diet (food frequency questionnaire)
Limited data available
Caffeinated drinks
Use of vitamin and mineral supplements (Vitamin C,D,E and iron multivitamins)
Home food availability
Water consumption
Mental health
General health
Physical activity
Screen time
Body image
Parenting practices
Caregiver’s feeding style
Blood pressure at booking
Blood pressure at 28/40 weeks
Blood pressure at 38/40 weeks
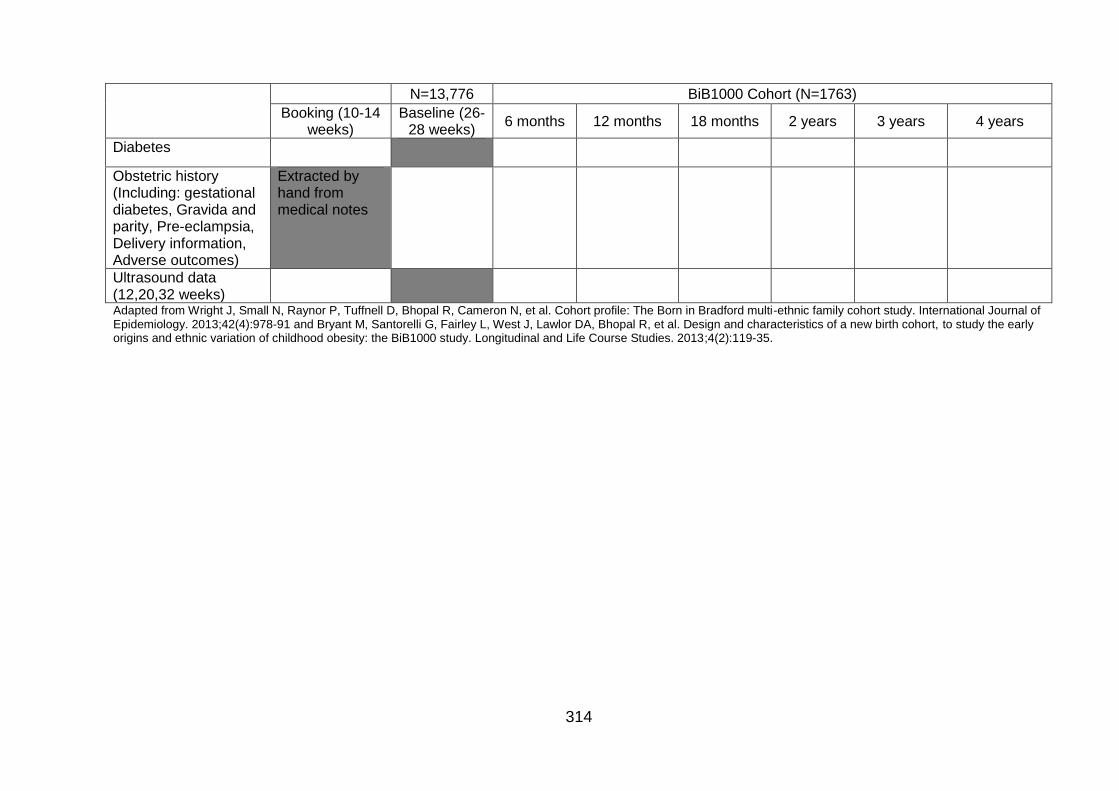
314
N=13,776 BiB1000 Cohort (N=1763)
Booking (10-14 weeks)
Baseline (26-28 weeks)
6 months 12 months 18 months 2 years 3 years 4 years
Diabetes
Obstetric history (Including: gestational diabetes, Gravida and parity, Pre-eclampsia, Delivery information, Adverse outcomes)
Extracted by hand from medical notes
Ultrasound data (12,20,32 weeks)
Adapted from Wright J, Small N, Raynor P, Tuffnell D, Bhopal R, Cameron N, et al. Cohort profile: The Born in Bradford multi-ethnic family cohort study. International Journal of Epidemiology. 2013;42(4):978-91 and Bryant M, Santorelli G, Fairley L, West J, Lawlor DA, Bhopal R, et al. Design and characteristics of a new birth cohort, to study the early origins and ethnic variation of childhood obesity: the BiB1000 study. Longitudinal and Life Course Studies. 2013;4(2):119-35.
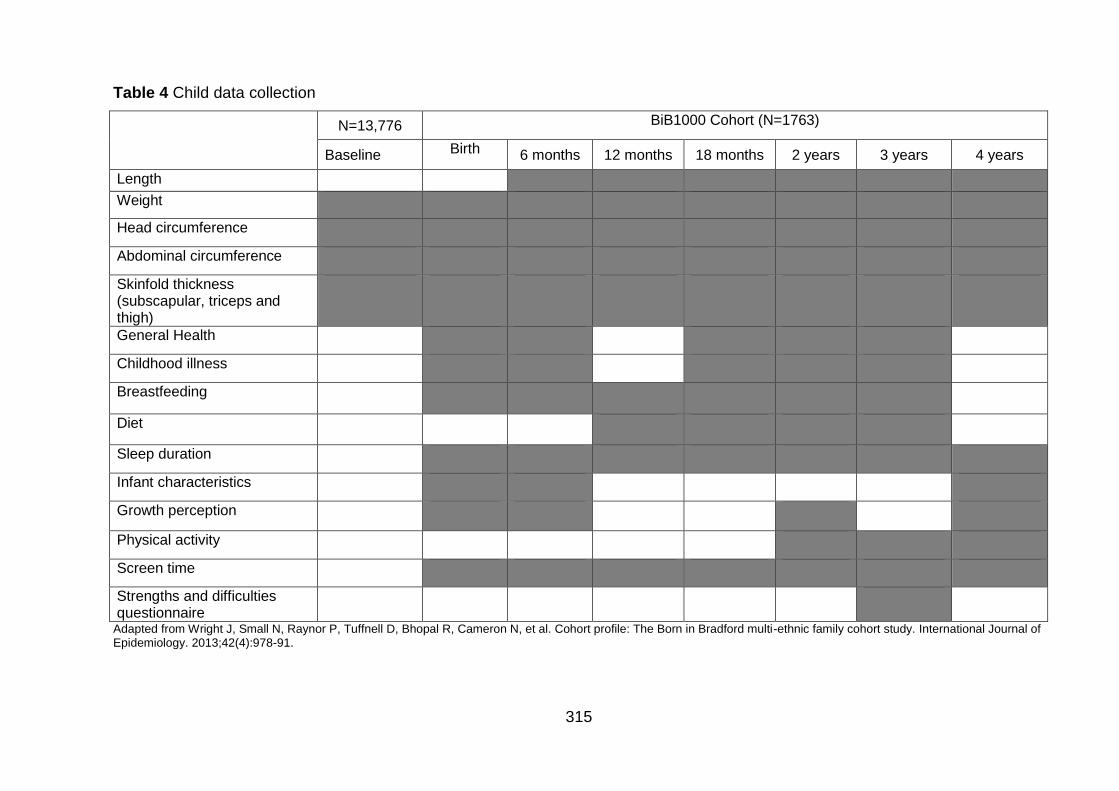
315
Table 4 Child data collection
N=13,776 BiB1000 Cohort (N=1763)
Baseline Birth 6 months 12 months 18 months 2 years 3 years 4 years
Length
Weight
Head circumference
Abdominal circumference
Skinfold thickness (subscapular, triceps and thigh)
General Health
Childhood illness
Breastfeeding
Diet
Sleep duration
Infant characteristics
Growth perception
Physical activity
Screen time
Strengths and difficulties questionnaire
Adapted from Wright J, Small N, Raynor P, Tuffnell D, Bhopal R, Cameron N, et al. Cohort profile: The Born in Bradford multi-ethnic family cohort study. International Journal of Epidemiology. 2013;42(4):978-91.
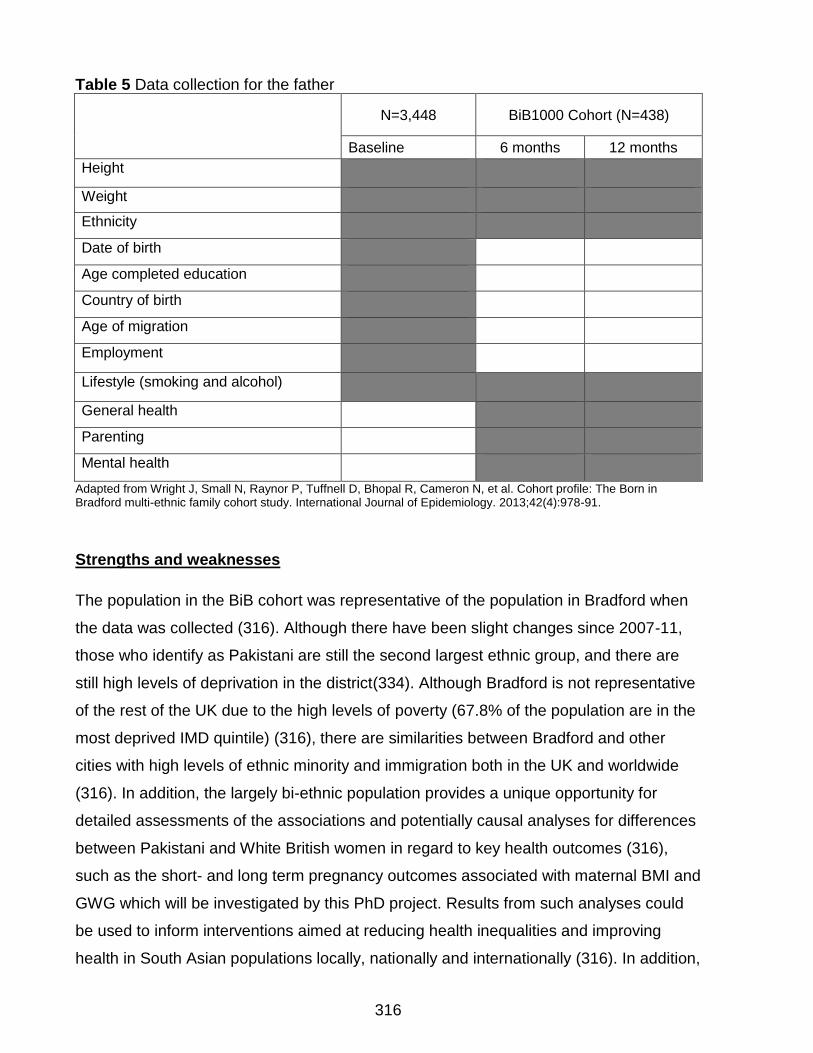
316
Table 5 Data collection for the father
N=3,448 BiB1000 Cohort (N=438)
Baseline 6 months 12 months
Height
Weight
Ethnicity
Date of birth
Age completed education
Country of birth
Age of migration
Employment
Lifestyle (smoking and alcohol)
General health
Parenting
Mental health
Adapted from Wright J, Small N, Raynor P, Tuffnell D, Bhopal R, Cameron N, et al. Cohort profile: The Born in Bradford multi-ethnic family cohort study. International Journal of Epidemiology. 2013;42(4):978-91.
Strengths and weaknesses
The population in the BiB cohort was representative of the population in Bradford when
the data was collected (316). Although there have been slight changes since 2007-11,
those who identify as Pakistani are still the second largest ethnic group, and there are
still high levels of deprivation in the district(334). Although Bradford is not representative
of the rest of the UK due to the high levels of poverty (67.8% of the population are in the
most deprived IMD quintile) (316), there are similarities between Bradford and other
cities with high levels of ethnic minority and immigration both in the UK and worldwide
(316). In addition, the largely bi-ethnic population provides a unique opportunity for
detailed assessments of the associations and potentially causal analyses for differences
between Pakistani and White British women in regard to key health outcomes (316),
such as the short- and long term pregnancy outcomes associated with maternal BMI and
GWG which will be investigated by this PhD project. Results from such analyses could
be used to inform interventions aimed at reducing health inequalities and improving
health in South Asian populations locally, nationally and internationally (316). In addition,
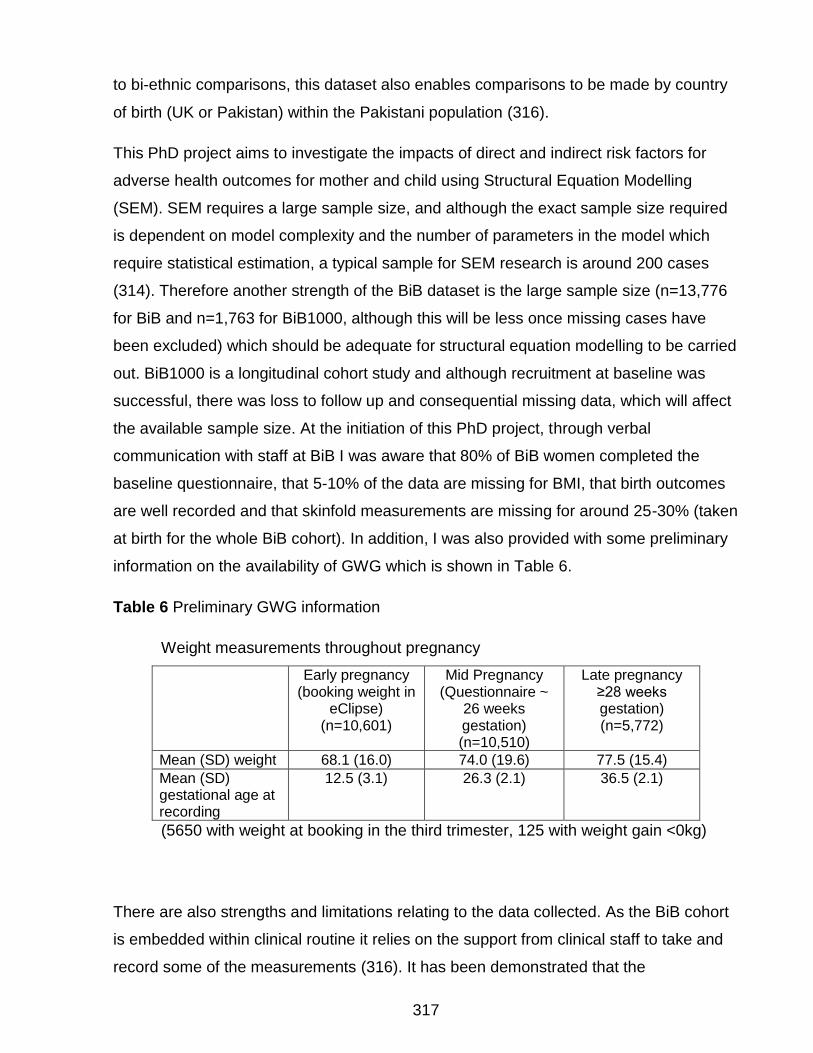
317
to bi-ethnic comparisons, this dataset also enables comparisons to be made by country
of birth (UK or Pakistan) within the Pakistani population (316).
This PhD project aims to investigate the impacts of direct and indirect risk factors for
adverse health outcomes for mother and child using Structural Equation Modelling
(SEM). SEM requires a large sample size, and although the exact sample size required
is dependent on model complexity and the number of parameters in the model which
require statistical estimation, a typical sample for SEM research is around 200 cases
(314). Therefore another strength of the BiB dataset is the large sample size (n=13,776
for BiB and n=1,763 for BiB1000, although this will be less once missing cases have
been excluded) which should be adequate for structural equation modelling to be carried
out. BiB1000 is a longitudinal cohort study and although recruitment at baseline was
successful, there was loss to follow up and consequential missing data, which will affect
the available sample size. At the initiation of this PhD project, through verbal
communication with staff at BiB I was aware that 80% of BiB women completed the
baseline questionnaire, that 5-10% of the data are missing for BMI, that birth outcomes
are well recorded and that skinfold measurements are missing for around 25-30% (taken
at birth for the whole BiB cohort). In addition, I was also provided with some preliminary
information on the availability of GWG which is shown in Table 6.
Table 6 Preliminary GWG information
Weight measurements throughout pregnancy
Early pregnancy (booking weight in
eClipse) (n=10,601)
Mid Pregnancy (Questionnaire ~
26 weeks gestation) (n=10,510)
Late pregnancy ≥28 weeks gestation) (n=5,772)
Mean (SD) weight 68.1 (16.0) 74.0 (19.6) 77.5 (15.4)
Mean (SD) gestational age at recording
12.5 (3.1) 26.3 (2.1) 36.5 (2.1)
(5650 with weight at booking in the third trimester, 125 with weight gain <0kg)
There are also strengths and limitations relating to the data collected. As the BiB cohort
is embedded within clinical routine it relies on the support from clinical staff to take and
record some of the measurements (316). It has been demonstrated that the
318
measurements taken by the clinical staff are valid and reliable (317, 318). As this
dataset was not collected for the purposes of this PhD project, analysis may be limited to
the variables available. For example, pregnancy outcomes of interest may not be
available for analysis, or there may be certain confounding or mediation variables that I
am not able to consider.
Why the BiB dataset
Although there are some limitations associated with the dataset, it is clear that due to its
largely bi-ethnic population, Bradford is an ideal setting for research that investigates the
differences in health outcomes between people of White and Pakistani origin. The data
collected for the BiB and BiB1000 cohorts provides a unique opportunity to consider the
effect of pregnancy weight on both short- and long-term pregnancy outcomes for the
mother and infant taking into account lifestyle factors, environmental risk factors, socio-
economic factors, family trees and ethnicity, and physical and mental health. This PhD
project will therefore utilise the BiB data to investigate the relationship between UK
ethnic groups (White and Pakistani), maternal booking BMI, GWG, and both short-and
long-term pregnancy outcomes for both mother and infant.
Notes on ethics
Permission has been obtained to use the non-patient identifiable BiB data. Where this
project involves the analysis of existing, non-patient identifiable data, BiB ethical
approval will operate for use of both the BiB and BiB1000 data. Favourable ethical
approval was granted by the Bradford Research Ethics Committee Ref 07/H1302/112.
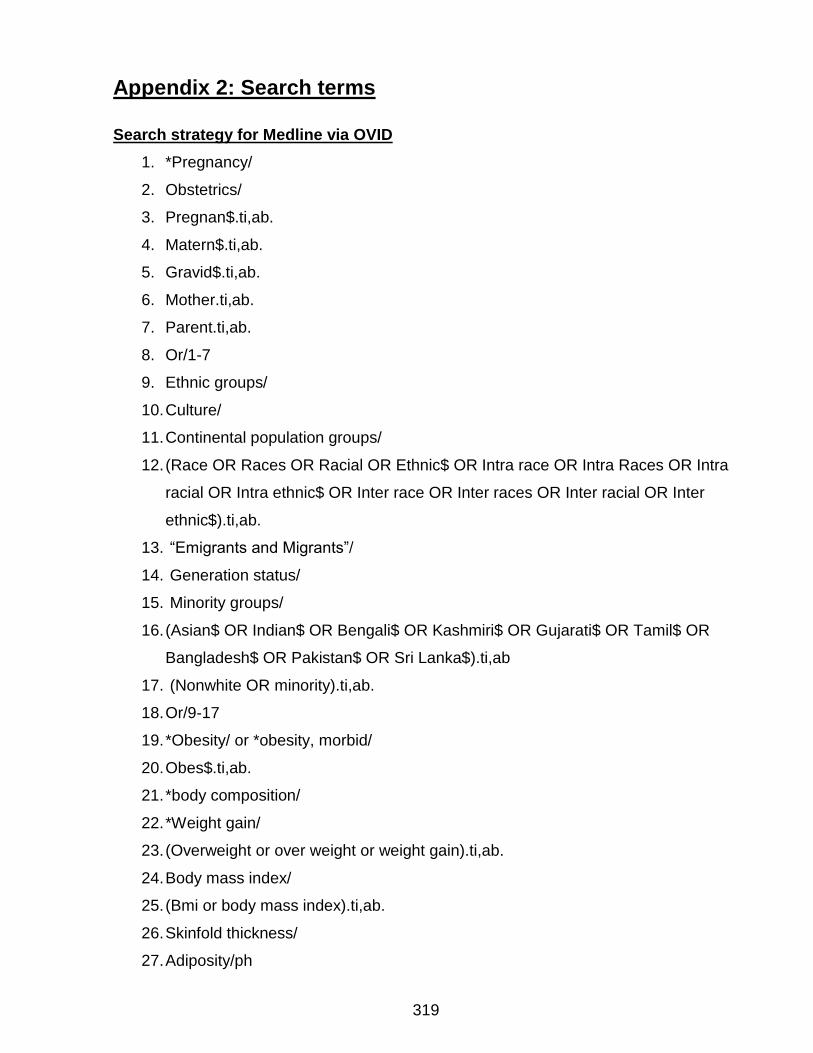
319
Appendix 2: Search terms
Search strategy for Medline via OVID
1. *Pregnancy/
2. Obstetrics/
3. Pregnan$.ti,ab.
4. Matern$.ti,ab.
5. Gravid$.ti,ab.
6. Mother.ti,ab.
7. Parent.ti,ab.
8. Or/1-7
9. Ethnic groups/
10. Culture/
11. Continental population groups/
12. (Race OR Races OR Racial OR Ethnic$ OR Intra race OR Intra Races OR Intra
racial OR Intra ethnic$ OR Inter race OR Inter races OR Inter racial OR Inter
ethnic$).ti,ab.
13. “Emigrants and Migrants”/
14. Generation status/
15. Minority groups/
16. (Asian$ OR Indian$ OR Bengali$ OR Kashmiri$ OR Gujarati$ OR Tamil$ OR
Bangladesh$ OR Pakistan$ OR Sri Lanka$).ti,ab
17. (Nonwhite OR minority).ti,ab.
18. Or/9-17
19. *Obesity/ or *obesity, morbid/
20. Obes$.ti,ab.
21. *body composition/
22. *Weight gain/
23. (Overweight or over weight or weight gain).ti,ab.
24. Body mass index/
25. (Bmi or body mass index).ti,ab.
26. Skinfold thickness/
27. Adiposity/ph

320
28. *adipose tissue/
29. Waist circumference/ph
30. Waist-hip ratio/
31. Body fat percentage.mp.
32. or/19-31
33. 8 and 18 and 32
34. Fertile$.ti,ab.
35. (IVF or in vitro fertili?ation).ti.
36. (PCOS or polycystic ovary syndrome)
37. Or/34-36
38. 33 not 37
39. Limit 38 to Human
40. Limit 39 to English
Search strategy for EMBASE via OVID
1. *Pregnancy/
2. Obstetrics/
3. Pregnan$.ti,ab.
4. Matern$.ti,ab.
5. Gravid$.ti,ab.
6. Mother.ti,ab.
7. Parent.ti,ab.
8. Or/1-7
9. Ethnic group/
10. Ethnicity.ti,ab
11. Race/
12. Cultural anthropology/
13. Ancestry group/
14. (Race OR Racial OR Ethnic$ OR Intra race OR Intra Races OR Intra racial OR Intra
ethnic$ OR Inter race OR Inter races OR Inter racial OR Inter ethnic$).ti,ab.
15. Emigrant/
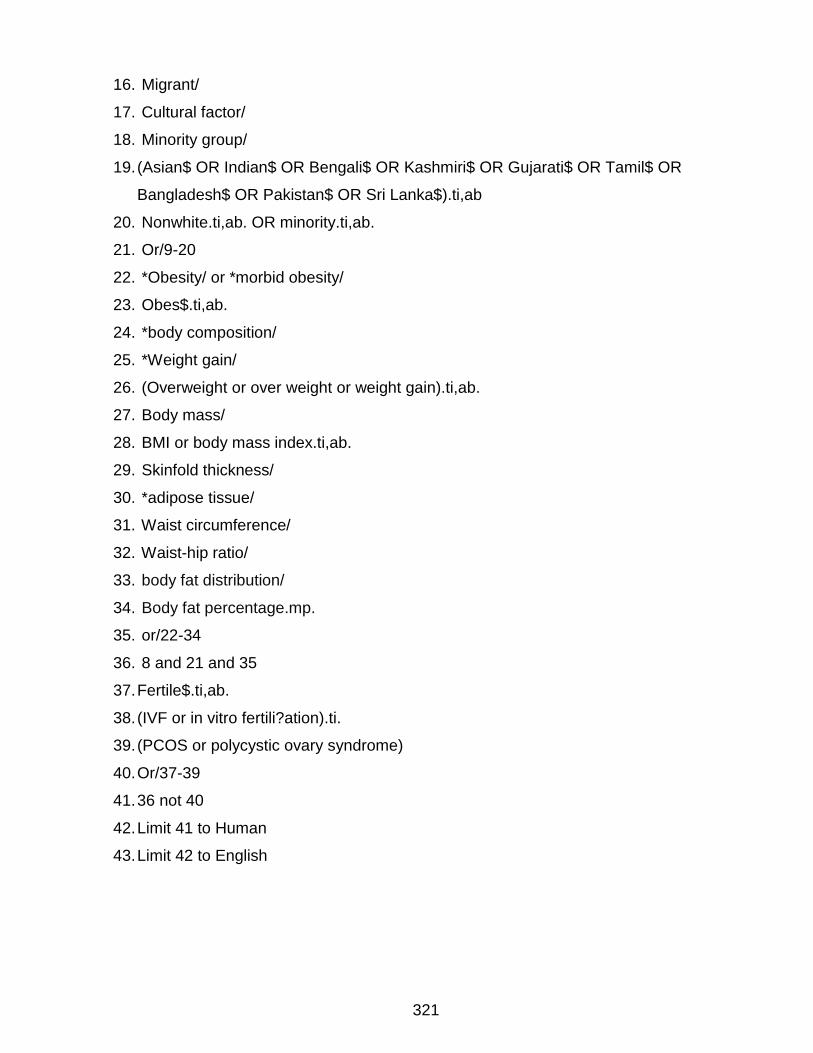
321
16. Migrant/
17. Cultural factor/
18. Minority group/
19. (Asian$ OR Indian$ OR Bengali$ OR Kashmiri$ OR Gujarati$ OR Tamil$ OR
Bangladesh$ OR Pakistan$ OR Sri Lanka$).ti,ab
20. Nonwhite.ti,ab. OR minority.ti,ab.
21. Or/9-20
22. *Obesity/ or *morbid obesity/
23. Obes$.ti,ab.
24. *body composition/
25. *Weight gain/
26. (Overweight or over weight or weight gain).ti,ab.
27. Body mass/
28. BMI or body mass index.ti,ab.
29. Skinfold thickness/
30. *adipose tissue/
31. Waist circumference/
32. Waist-hip ratio/
33. body fat distribution/
34. Body fat percentage.mp.
35. or/22-34
36. 8 and 21 and 35
37. Fertile$.ti,ab.
38. (IVF or in vitro fertili?ation).ti.
39. (PCOS or polycystic ovary syndrome)
40. Or/37-39
41. 36 not 40
42. Limit 41 to Human
43. Limit 42 to English
322
Search terms for PsychINFO via OVID
1. *Pregnancy/
2. Exp Obstetrics/
3. Pregnan$.ti,ab.
4. Matern$.ti,ab.
5. Gravid$.ti,ab.
6. Mother.ti,ab.
7. Parent.ti,ab.
8. Or/1-7
9. exp "Racial and Ethnic Groups"/
10. ethnic identity/
11. exp "Racial and Ethnic Differences"/
12. exp “Race (Anthropological)"/
13. exp Minority Groups/
14. exp Immigration/
15. (Race OR Racial OR Ethnic$ OR Intra race OR Intra Races OR Intra racial OR
Intra ethnic$ OR Inter race OR Inter races OR Inter racial OR Inter ethnic$).ti,ab.
16. (Asian$ OR Indian$ OR Bengali$ OR Kashmiri$ OR Gujarati$ OR Tamil$ OR
Bangladesh$ OR Pakistan$ OR Sri Lanka$).ti,ab
17. Nonwhite.ti,ab. OR minority.ti,ab.
18. Or/ 9-17
19. *Obesity/
20. Obes$.ti,ab.
21. Weight gain/
22. Body weight/
23. exp Body Size/
24. exp Body Mass Index/
25. exp Body Weight/
26. exp Body Fat/
27. Or/ 19-26
28. 8 and 18 and 27
29. Fertile$.ti,ab.
30. (IVF or in vitro fertili?ation).ti.
323
31. (PCOS or polycystic ovary syndrome)
32. Or/29-31
33. 28 not 32
34. Limit 33 to Human
35. Limit 34 to English
Search terms for CINAHL via EbescoHost
(MM "Pregnancy") OR (MH "Delivery, Obstetric+") OR (TI "pregnan*" OR AB
"pregnan*") OR (TI “Matern*” OR AB “Matern*”) OR *(TI “Gravid*” OR AB “Gravid”) OR
(TI “Mother” OR AB “Mother”) OR (TI “Parent” OR AB “Parent”)
AND
(MH "Ethnic Groups+") OR (TI “Ethnicity” OR AB “Ethnicity”) OR (MH "Race
Relations+") OR (MH "Culture+") OR (TI “Race” OR AB “Race”) OR (TI “Racial” OR AB
“Racial”) or (TI “Ethnic*” OR AB “Ethnic*) OR (TI “Intra race” OR AB “Intra race”) OR (TI
“Intra Races” or AB “Intra races”) OR (TI “Intra Racial” OR AB “Intra racial”) OR (TI “Intra
ethnic*” OR AB “Intra ethnic*”) OR (TI “Inter race” OR AB “Inter race”) OR (TI “Inter
races” OR AB “Inter Races”) OR (TI “Inter Racial” OR AB “Inter Racial”) OR (TI “Inter
ethnic*” OR AB “Inter ethnic”) OR (MH "Emigration and Immigration") OR (MH
"Migrants") OR (MH "Generation status") OR (MH "Minority Groups") OR (TI “Asian*”
OR AB “Asian”) OR (TI “Indian*” OR AB “Indian*”) OR (TI “Bengali*” OR AB “Bangali*”)
OR (TI “Kashmiri*” OR AB “Kashmiri*”) OR (TI “Gujarati*” OR AB “Gujarati*”) OR (TI
“Tamil*” OR AB “Tamil*”) OR (TI “Bangladesh*” OR AB “Bangladesh*”) OR (TI
“Pakistan*” OR AB “Pakistan*”) OR (TI “Sri Lanka* OR AB “Sri Lanka*”) OR (TI
“Nonwhite minority” OR AB “Nonwhite minority”)
AND
(MM "Obesity") OR (MM "Obesity, Morbid") OR (TI “obes*” OR AB “obes*”) OR (MH
"Body Weight Changes") OR (MH "Weight Gain") OR (TI “Overweight” OR AB
“Overweight”) OR (TI “over weight” OR AB “over weight”) OR (TI “weight gain” OR AB
“weight gain”) OR (MH "Body Mass Index") OR (TI “BMI” OR AB “BMI”) OR (TI “body
mass index” OR AB “body mass index”) OR (MH "Skinfold Thickness") OR (MH
"Adipose Tissue") OR (MH "Waist Circumference") OR (MH "Waist-Hip Ratio") OR (MH
"Adipose Tissue Distribution") OR "body fat percentage"
324
NOT
(TI “fertile* OR AB “fertile*”) OR (TI “IVF” OR TI “In vitro fertili*ation”) OR “PCOS” or
“polycystic ovary syndrome”
Search for the JBI database
Pregnan* OR and Ethnicity or "South Asian" and Obesity OR Overweight OR "weight
gain" OR weight
Search for Scopus, CRD database (DARE), PROSPERO
Pregnancy OR Pregnant OR Maternal
AND
Ethnicity OR ethnic OR Minority OR race OR OR “South Asian” OR Indian OR India OR
Pakistani OR Pakistan OR Bangladesh OR Bangladeshi OR “Sri Lankan” OR “Sri
Lanka”
AND
Obesity OR Overweight OR “weight " OR “body mass” OR "Body Weight Changes" OR
“BMI” OR “Waist circumference” OR "Waist-Hip Ratio" or “Body Fat percentage”
Search for Cochrane database of systematic reviews
1. Pregnan*.mp
2. Maternal.mp
3. Mother.mp
4. parent.mp
5. Gravid.mp
6. Gravida.mp
7. Or/1-6
8. Ethnicity.mp
9. ethnic.mp
10. Minority.mp
11. Culture.mp
325
12. Race.mp
13. racial.mp
14. South Asian.mp
15. India*.mp
16. Pakistan*.mp
17. Bangladesh*.mp
18. Sri Lanka*.mp
19. Or/8-18
20. Obesity.mp
21. Overweight.mp
22. adiposity.mp
23. weight.mp
24. body mass index.mp
25. Body Weight Changes.mp
26. BMI.mp
27. Waist circumference.mp
28. Waist-Hip Ratio.mp
29. Body Fat percentage.mp
30. Or/20-29
31. 7 and 19 and 30
Search for federated search engine Epistemonikos
Pregnancy OR Pregnant OR Maternal or Mother OR parent OR Gravid or Gravida AND
Ethnicity OR ethnic OR “ethnic group” OR Minority OR culture OR race OR racial OR
migrant OR migrant OR “South Asian” OR Indian OR India OR Pakistani OR Pakistan
OR Bangladesh OR Bangladeshi OR “Sri Lankan” OR “Sri Lanka”
AND
obesity OR Overweight OR “over weight” OR adiposity OR “adipose tissue” OR “weight
gain” OR weight OR "body mass index" OR “body mass” OR "Body Weight Changes"
OR “BMI” OR “Waist circumference” OR "Waist-Hip Ratio" or “Body Fat percentage”
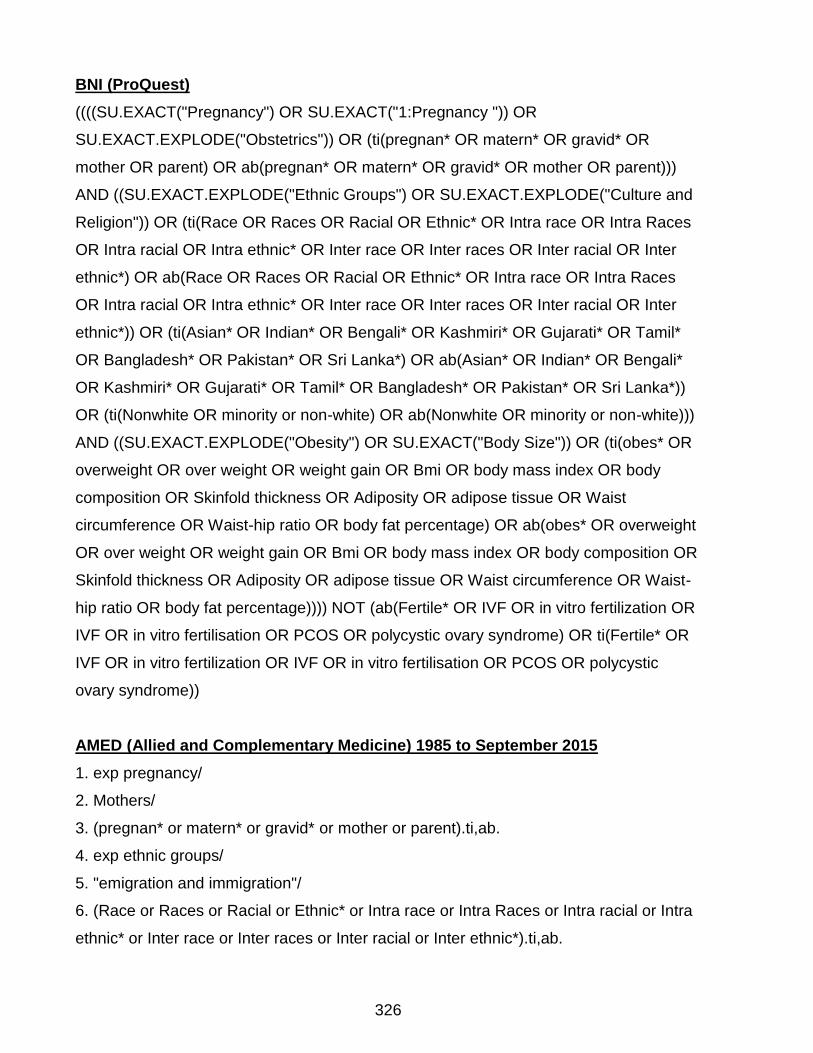
326
BNI (ProQuest)
((((SU.EXACT("Pregnancy") OR SU.EXACT("1:Pregnancy ")) OR
SU.EXACT.EXPLODE("Obstetrics")) OR (ti(pregnan* OR matern* OR gravid* OR
mother OR parent) OR ab(pregnan* OR matern* OR gravid* OR mother OR parent)))
AND ((SU.EXACT.EXPLODE("Ethnic Groups") OR SU.EXACT.EXPLODE("Culture and
Religion")) OR (ti(Race OR Races OR Racial OR Ethnic* OR Intra race OR Intra Races
OR Intra racial OR Intra ethnic* OR Inter race OR Inter races OR Inter racial OR Inter
ethnic*) OR ab(Race OR Races OR Racial OR Ethnic* OR Intra race OR Intra Races
OR Intra racial OR Intra ethnic* OR Inter race OR Inter races OR Inter racial OR Inter
ethnic*)) OR (ti(Asian* OR Indian* OR Bengali* OR Kashmiri* OR Gujarati* OR Tamil*
OR Bangladesh* OR Pakistan* OR Sri Lanka*) OR ab(Asian* OR Indian* OR Bengali*
OR Kashmiri* OR Gujarati* OR Tamil* OR Bangladesh* OR Pakistan* OR Sri Lanka*))
OR (ti(Nonwhite OR minority or non-white) OR ab(Nonwhite OR minority or non-white)))
AND ((SU.EXACT.EXPLODE("Obesity") OR SU.EXACT("Body Size")) OR (ti(obes* OR
overweight OR over weight OR weight gain OR Bmi OR body mass index OR body
composition OR Skinfold thickness OR Adiposity OR adipose tissue OR Waist
circumference OR Waist-hip ratio OR body fat percentage) OR ab(obes* OR overweight
OR over weight OR weight gain OR Bmi OR body mass index OR body composition OR
Skinfold thickness OR Adiposity OR adipose tissue OR Waist circumference OR Waist-
hip ratio OR body fat percentage)))) NOT (ab(Fertile* OR IVF OR in vitro fertilization OR
IVF OR in vitro fertilisation OR PCOS OR polycystic ovary syndrome) OR ti(Fertile* OR
IVF OR in vitro fertilization OR IVF OR in vitro fertilisation OR PCOS OR polycystic
ovary syndrome))
AMED (Allied and Complementary Medicine) 1985 to September 2015
1. exp pregnancy/
2. Mothers/
3. (pregnan* or matern* or gravid* or mother or parent).ti,ab.
4. exp ethnic groups/
5. "emigration and immigration"/
6. (Race or Races or Racial or Ethnic* or Intra race or Intra Races or Intra racial or Intra
ethnic* or Inter race or Inter races or Inter racial or Inter ethnic*).ti,ab.

327
7. (Asian* or Indian* or Bengali* or Kashmiri* or Gujarati* or Tamil* or Bangladesh* or
Pakistan* or Sri Lanka* or minority group*).ti,ab.
8. (Nonwhite or minority or non-white).ti,ab.
9. culture/
10. (Generation status or culture or cultural or cultural characteristics or cross-cultural
comparision or socio-cultural).mp.
11. or/1-3
12. or/4-9
13. obesity/
14. Body composition/
15. body mass index/
16. Adipose tissue/
17. (obes* or overweight or over weight or weight gain or Bmi or body mass index or
body composition or Skinfold thickness or Adiposity or adipose tissue or Waist
circumference or Waist-hip ratio or body fat percentage).ti,ab.
18. or/13-17
19. 11 and 12 and 18

328
Appendix 3: Data extraction form
ADAPTED COCHRANE COHORT STUDY DATA EXTRACTION TEMPLATE
Reviewer
Title of paper
Author and Year
Setting Location (region/city, country): Study name or dataset:
Data collection time period (Day, Month, Year if available)
Methodology (please check relevant box)
Prospective Cohort Retrospective Cohort Case Control Cross sectional
All ethnic groups studied (Please use terminology from the paper)
Subgroups included
How was ethnicity assigned? (Please check relevant box)
Self-report Country of birth Parent’s country of birth Investigator assigned Medical records, unspecified Unspecified Other
If “Other” please specify……………………………………….......
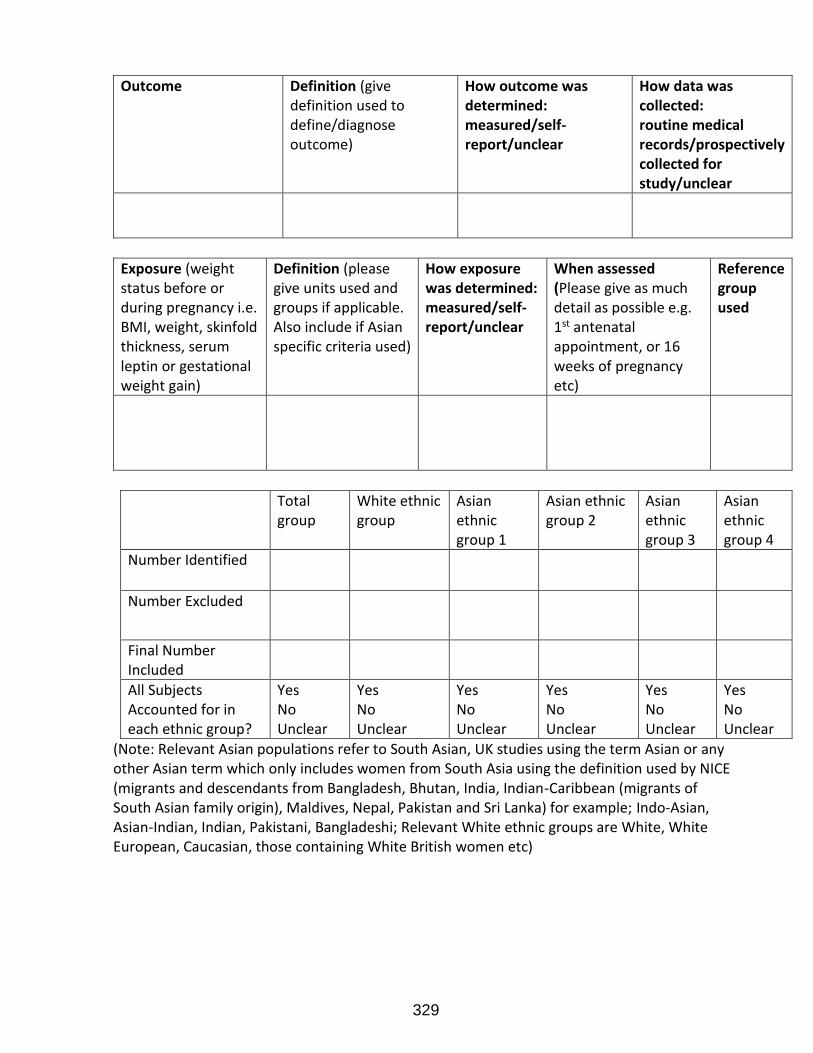
329
Outcome Definition (give definition used to define/diagnose outcome)
How outcome was determined: measured/self-report/unclear
How data was collected: routine medical records/prospectively collected for study/unclear
Exposure (weight status before or during pregnancy i.e. BMI, weight, skinfold thickness, serum leptin or gestational weight gain)
Definition (please give units used and groups if applicable. Also include if Asian specific criteria used)
How exposure was determined: measured/self-report/unclear
When assessed (Please give as much detail as possible e.g. 1st antenatal appointment, or 16 weeks of pregnancy etc)
Reference group used
Total group
White ethnic group
Asian ethnic group 1
Asian ethnic group 2
Asian ethnic group 3
Asian ethnic group 4
Number Identified
Number Excluded
Final Number Included
All Subjects Accounted for in each ethnic group?
Yes No Unclear
Yes No Unclear
Yes No Unclear
Yes No Unclear
Yes No Unclear
Yes No Unclear
(Note: Relevant Asian populations refer to South Asian, UK studies using the term Asian or any other Asian term which only includes women from South Asia using the definition used by NICE (migrants and descendants from Bangladesh, Bhutan, India, Indian-Caribbean (migrants of South Asian family origin), Maldives, Nepal, Pakistan and Sri Lanka) for example; Indo-Asian, Asian-Indian, Indian, Pakistani, Bangladeshi; Relevant White ethnic groups are White, White European, Caucasian, those containing White British women etc)
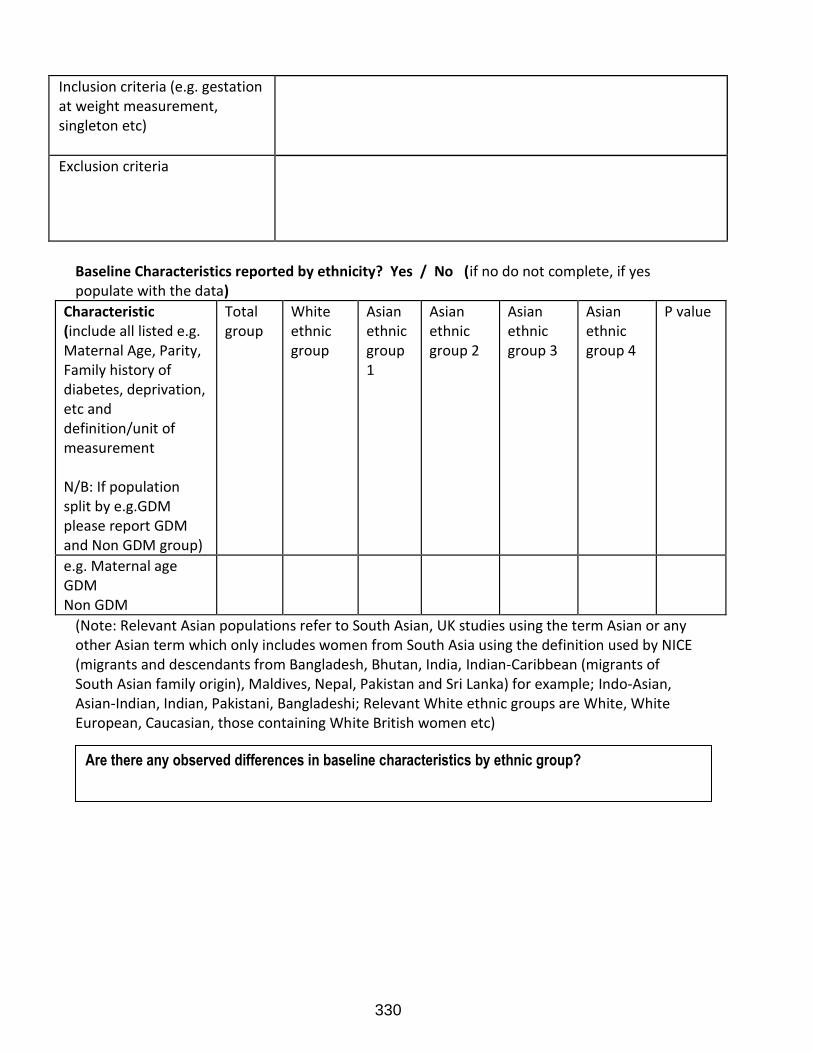
330
Inclusion criteria (e.g. gestation at weight measurement, singleton etc)
Exclusion criteria
Baseline Characteristics reported by ethnicity? Yes / No (if no do not complete, if yes populate with the data)
Characteristic (include all listed e.g. Maternal Age, Parity, Family history of diabetes, deprivation, etc and definition/unit of measurement N/B: If population split by e.g.GDM please report GDM and Non GDM group)
Total group
White ethnic group
Asian ethnic group 1
Asian ethnic group 2
Asian ethnic group 3
Asian ethnic group 4
P value
e.g. Maternal age GDM Non GDM
(Note: Relevant Asian populations refer to South Asian, UK studies using the term Asian or any other Asian term which only includes women from South Asia using the definition used by NICE (migrants and descendants from Bangladesh, Bhutan, India, Indian-Caribbean (migrants of South Asian family origin), Maldives, Nepal, Pakistan and Sri Lanka) for example; Indo-Asian, Asian-Indian, Indian, Pakistani, Bangladeshi; Relevant White ethnic groups are White, White European, Caucasian, those containing White British women etc)
Are there any observed differences in baseline characteristics by ethnic group?
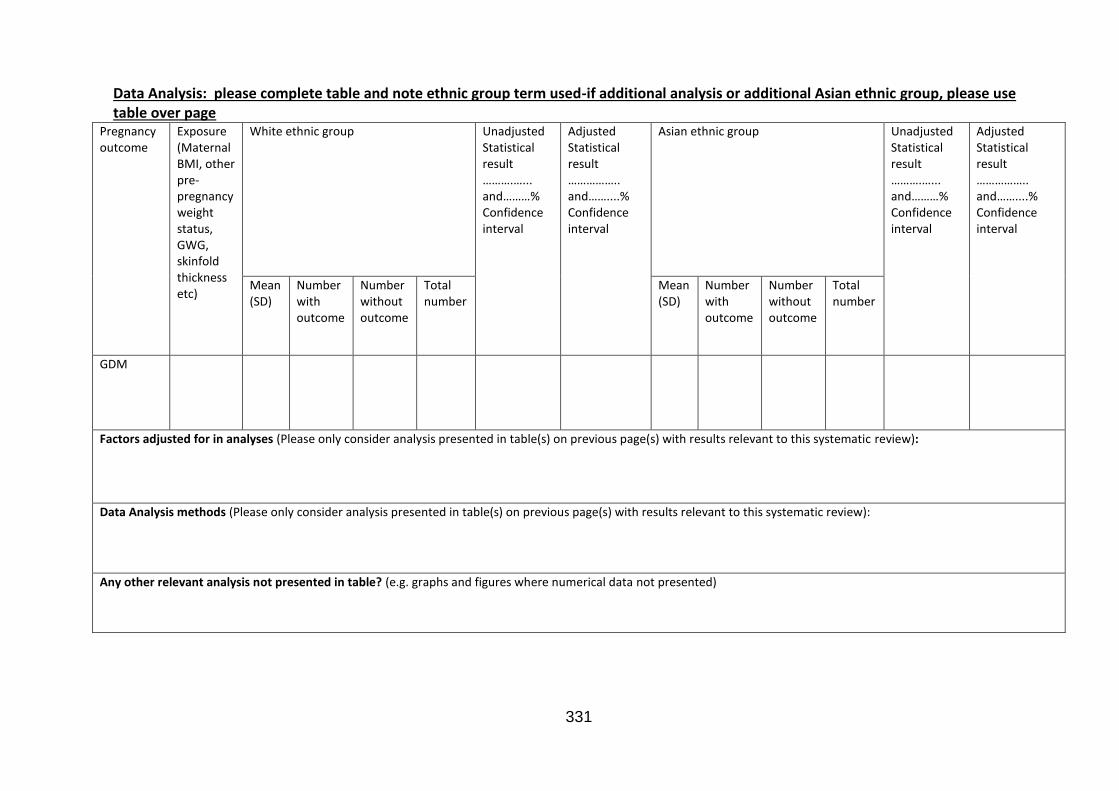
331
Data Analysis: please complete table and note ethnic group term used-if additional analysis or additional Asian ethnic group, please use table over page
Pregnancy outcome
Exposure (Maternal BMI, other pre-pregnancy weight status, GWG, skinfold thickness etc)
White ethnic group
Unadjusted Statistical result ……….…... and………% Confidence interval
Adjusted Statistical result …………….. and……....% Confidence interval
Asian ethnic group
Unadjusted Statistical result ……….…... and………% Confidence interval
Adjusted Statistical result …………….. and……....% Confidence interval
Mean (SD)
Number with outcome
Number without outcome
Total number
Mean (SD)
Number with outcome
Number without outcome
Total number
GDM
Factors adjusted for in analyses (Please only consider analysis presented in table(s) on previous page(s) with results relevant to this systematic review):
Data Analysis methods (Please only consider analysis presented in table(s) on previous page(s) with results relevant to this systematic review):
Any other relevant analysis not presented in table? (e.g. graphs and figures where numerical data not presented)
332
Appendix 4: Quality assessment
ADAPTED NEWCASTLE - OTTAWA QUALITY ASSESSMENT SCALE COHORT1 STUDIES Study (author and year): Reviewer (initials): Section 1: Selection 1) Representativeness of the exposed cohort (exposure in this context is the maternal weight risk group used, e.g. obesity ≥30kg/m2 or the GWG risk group used e.g.>20lb for obese women)
a) truly representative of the average pregnant population in the community (Did they report how representative the study population BMI/GWG distribution
was to the general maternity population in their setting/location/region/country? If it was reported then was it comparable? Or did they include the entire population in the sample – e.g. all women delivering within a specific maternity unit etc)
b) somewhat representative of the average pregnant population in the community
(Did they report how representative the study population BMI/GWG distribution
was to the general maternity population in their setting/location/region/country? If it was reported then was it a similar enough pattern of distribution and not skewed in comparison?)
c) selected group of users eg nurses, volunteers
(E.g. only first time pregnancy, only teenage pregnancy, only those with GDM, only those requiring a certain procedure during pregnancy etc)
d) no description of the derivation of the cohort
(Not reported or unclear) 2) Selection of the non exposed cohort (non-exposure is the maternal weight group
used as reference e.g. recommended BMI (18.5-24.9kg/m2 or the GWG group used as reference e.g.11-20lbs for obese women) a) drawn from the same community as the exposed cohort
(Probably this option most of the time if using a general population of pregnancies and determining exposure status based on splitting the group by BMI)
b) drawn from a different source
(E.g. different maternity unit, different specialist clinic, different time range for recruitment between exposed and non-exposed groups)
c) no description of the derivation of the non exposed cohort
(Not reported or unclear)
3). Ascertainment of exposure (maternal BMI/GWG/ other pregnancy weight measurement e.g. skinfold thickness)
333
a) secure record (Explicitly stated that it was a measured weight used to inform BMI/GWG)
b) structured interview
(No structured interview method for measuring weight status exists. In our case this option could be if self-reported weight was used but it was subsequently validated by measured weight)
c) written self report
(Any self-report weight not validated with measured weight) d) no description
(Unclear or not explicitly reported how they derived the BMI measurement) 4) Demonstration that outcome of interest was not present at start of study 2
a) yes b) no
Section 2: Comparability
1) Comparability of cohorts on the basis of the design or analysis (can select more than one answer) please only consider analysis with results relevant to this systematic review
a) study controls for a measure of socioeconomic status (IMD, Carstairs Index, maternal education, maternal income etc)
(This could be either excluded or adjusted for in analysis) b) study controls for any additional factor
(Any other factors adjusted for in the analysis) c) no factors controlled for
2) Assessment of pregnancy outcome. (in studies where there are multiple pregnancy outcomes which would have different responses if considered separately, please complete this question to reflect the majority of outcomes)
a) independent blind assessment (prospectively collected and measured outcome data for the purposes of the research study)
b) record linkage
(Outcome data retrieved from medical records that had been informed by routine measured data)
c) self report
(Any self-reported outcome data regardless of method of data collection) d) no description
(not clear/not reported)
334
3) Was follow-up long enough for pregnancy outcomes to occur? (in studies where there are multiple pregnancy outcomes which would have different responses if considered separately, please complete this question to reflect the majority of outcomes)
a) Yes (or if retrospective analysis of routine medical records) (For example; -If GDM: follow up until diagnosis of GDM is made following relevant diagnostic test such as oral glucose tolerance test at 24-28 weeks gestation. -If birth weight: follow up until measurement of weight after birth at neonatal examination. -If gestational age at delivery: followed up until spontaneous onset of labour, or if there was early intervention of induction of labour or caesarean then this was after the gestational age specified as pregnancy outcome, or these factors accounted for in exclusion criteria or adjustments.)
b) No
(For example; -If GDM: Failure to follow up until assessment of GDM status during pregnancy. -If birth weight: failure to follow up until measurement of weight after birth at neonatal examination. -If gestational age at delivery: early intervention of induction of labour or caesarean before the gestational age specified as pregnancy outcome which was not accounted for in the exclusion criteria or adjustments.)
4) Adequacy of follow up of cohorts or management of missing data
a) Complete follow up – all subjects accounted for or multiple imputation of missing data (The total number of eligible participants/recruited participants are reported and the final number included are reported: no loss to follow up or exclusions of cases (e.g. missing data)
b) Subjects lost to follow up unlikely to introduce bias - small number lost to follow
up <20% (select an adequate %), or description provided of those lost i.e comparison of characteristics of included participants and those with missing data (The total number of eligible participants /recruited participants are reported and the final number included are reported and either: lost or excluded less than 20% so presumed unlikely to introduce bias, or lost or excluded more than 20% but compared groups and no systematic differences so presumed missing at random)
c) follow up rate < 80% (select an adequate %) and no description of those lost
(The total number of eligible participants/recruited participants are reported and the final number included are reported: excluded or lost more than 20% but no comparison of included or excluded groups reported)
d) No statement
(The total number of eligible participants/recruited participants are not reported and only the final number included are reported. No mention of any exclusions or loss to follow up)
335
Total number of stars (out of a possible 83): Notes: 1 All the non-cohort studies were cross sectional and all had groups defined by the exposure variable rather than the outcome variables, therefore cohort design template fits best with these study 2 Item 4 in Section 1: Selection “Demonstration that outcome of interest was not present at start of study” is not applicable to gestational age at delivery outcomes as women are identified in early pregnancy using their pre/early pregnancy BMI and their pregnancy outcomes are not known at the start of the study. Therefore this item has been removed from the scale 3 A study can be awarded a maximum of one star for each numbered item within the Selection and Outcome categories. A maximum of two stars can be given for Comparability. The denominator value for the possible number of stars using the template Newcastle Ottawa Scale has been reduced from 9 to 8 due to the removal of item 4 in Section 1 (as there was potential for additional star to be awarded based on this item). Red text: Detail added to the Newcastle-Ottawa scale to make it fit with the context of my research; this is part of the guidelines for using this quality assessment tool.
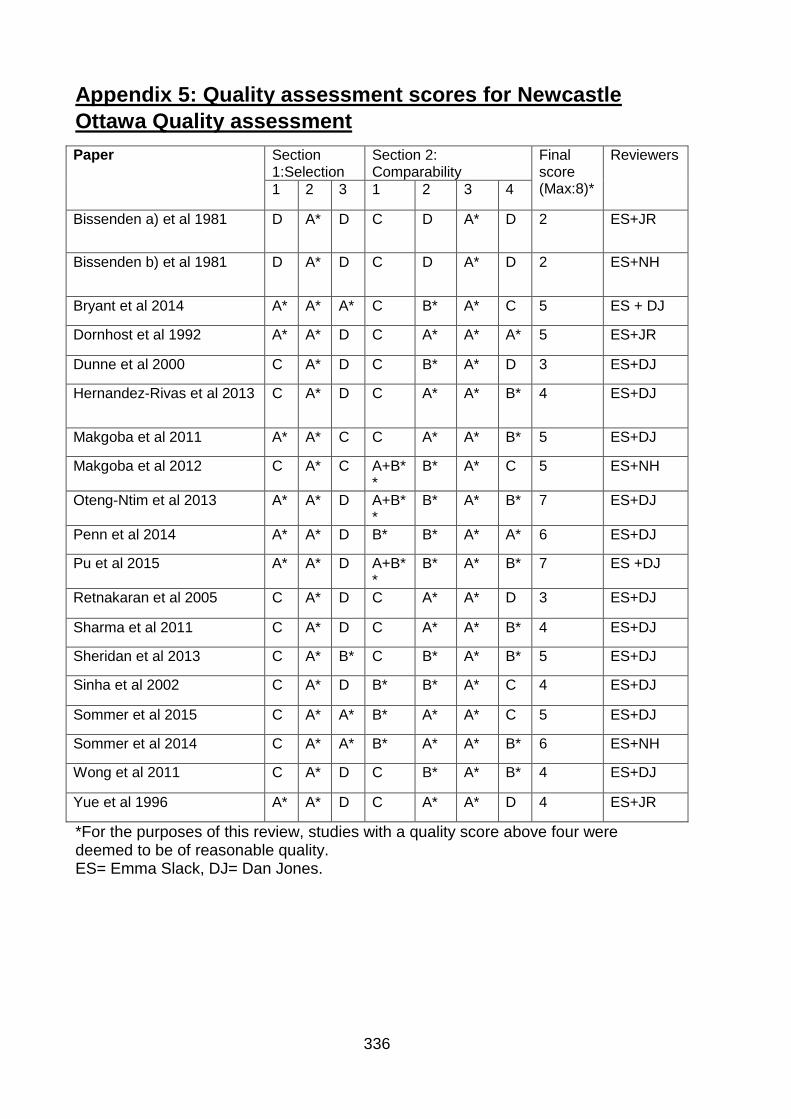
336
Appendix 5: Quality assessment scores for Newcastle
Ottawa Quality assessment
Paper Section 1:Selection
Section 2: Comparability
Final score (Max:8)*
Reviewers
1 2 3 1 2 3 4
Bissenden a) et al 1981 D A* D C D A* D 2 ES+JR
Bissenden b) et al 1981 D A* D C D A* D 2 ES+NH
Bryant et al 2014 A* A* A* C B* A* C 5 ES + DJ
Dornhost et al 1992 A* A* D C A* A* A* 5 ES+JR
Dunne et al 2000 C A* D C B* A* D 3 ES+DJ
Hernandez-Rivas et al 2013 C A* D C A* A* B* 4 ES+DJ
Makgoba et al 2011 A* A* C C A* A* B* 5 ES+DJ
Makgoba et al 2012 C A* C A+B**
B* A* C 5 ES+NH
Oteng-Ntim et al 2013 A* A* D A+B**
B* A* B* 7 ES+DJ
Penn et al 2014 A* A* D B* B* A* A* 6 ES+DJ
Pu et al 2015 A* A* D A+B**
B* A* B* 7 ES +DJ
Retnakaran et al 2005 C A* D C A* A* D 3 ES+DJ
Sharma et al 2011 C A* D C A* A* B* 4 ES+DJ
Sheridan et al 2013 C A* B* C B* A* B* 5 ES+DJ
Sinha et al 2002 C A* D B* B* A* C 4 ES+DJ
Sommer et al 2015 C A* A* B* A* A* C 5 ES+DJ
Sommer et al 2014 C A* A* B* A* A* B* 6 ES+NH
Wong et al 2011 C A* D C B* A* B* 4 ES+DJ
Yue et al 1996 A* A* D C A* A* D 4 ES+JR
*For the purposes of this review, studies with a quality score above four were deemed to be of reasonable quality. ES= Emma Slack, DJ= Dan Jones.
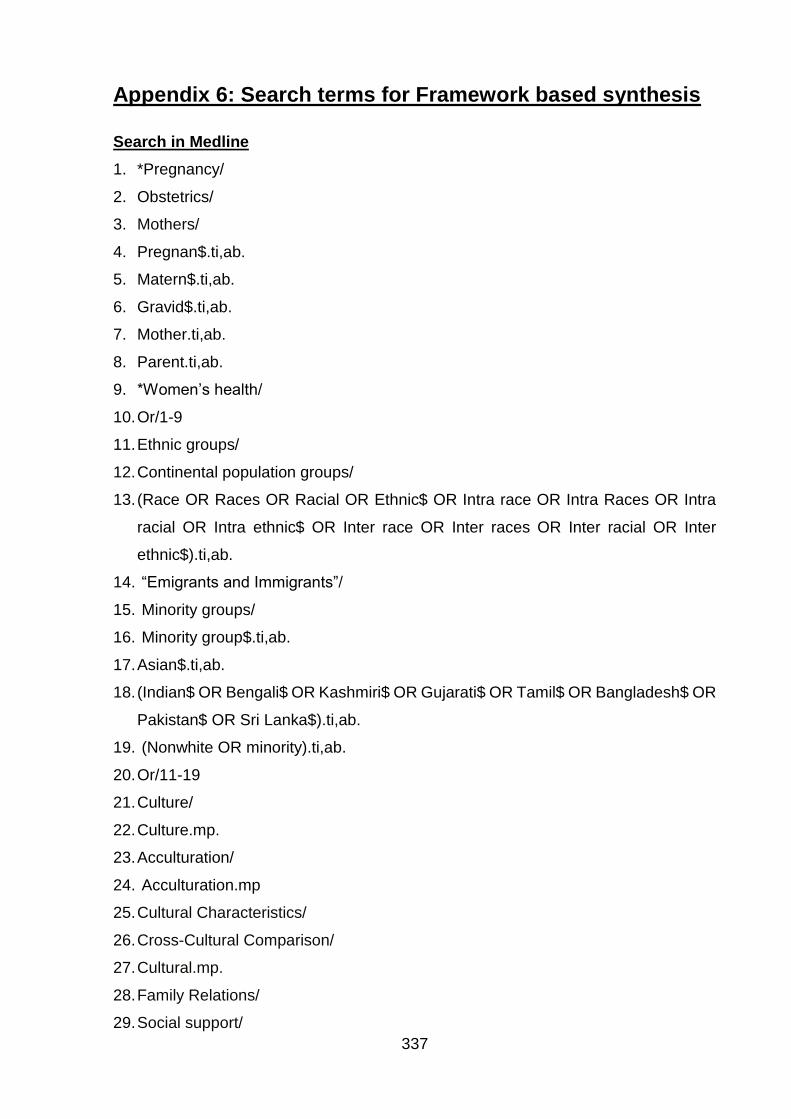
337
Appendix 6: Search terms for Framework based synthesis
Search in Medline
1. *Pregnancy/
2. Obstetrics/
3. Mothers/
4. Pregnan$.ti,ab.
5. Matern$.ti,ab.
6. Gravid$.ti,ab.
7. Mother.ti,ab.
8. Parent.ti,ab.
9. *Women’s health/
10. Or/1-9
11. Ethnic groups/
12. Continental population groups/
13. (Race OR Races OR Racial OR Ethnic$ OR Intra race OR Intra Races OR Intra
racial OR Intra ethnic$ OR Inter race OR Inter races OR Inter racial OR Inter
ethnic$).ti,ab.
14. “Emigrants and Immigrants”/
15. Minority groups/
16. Minority group$.ti,ab.
17. Asian$.ti,ab.
18. (Indian$ OR Bengali$ OR Kashmiri$ OR Gujarati$ OR Tamil$ OR Bangladesh$ OR
Pakistan$ OR Sri Lanka$).ti,ab.
19. (Nonwhite OR minority).ti,ab.
20. Or/11-19
21. Culture/
22. Culture.mp.
23. Acculturation/
24. Acculturation.mp
25. Cultural Characteristics/
26. Cross-Cultural Comparison/
27. Cultural.mp.
28. Family Relations/
29. Social support/
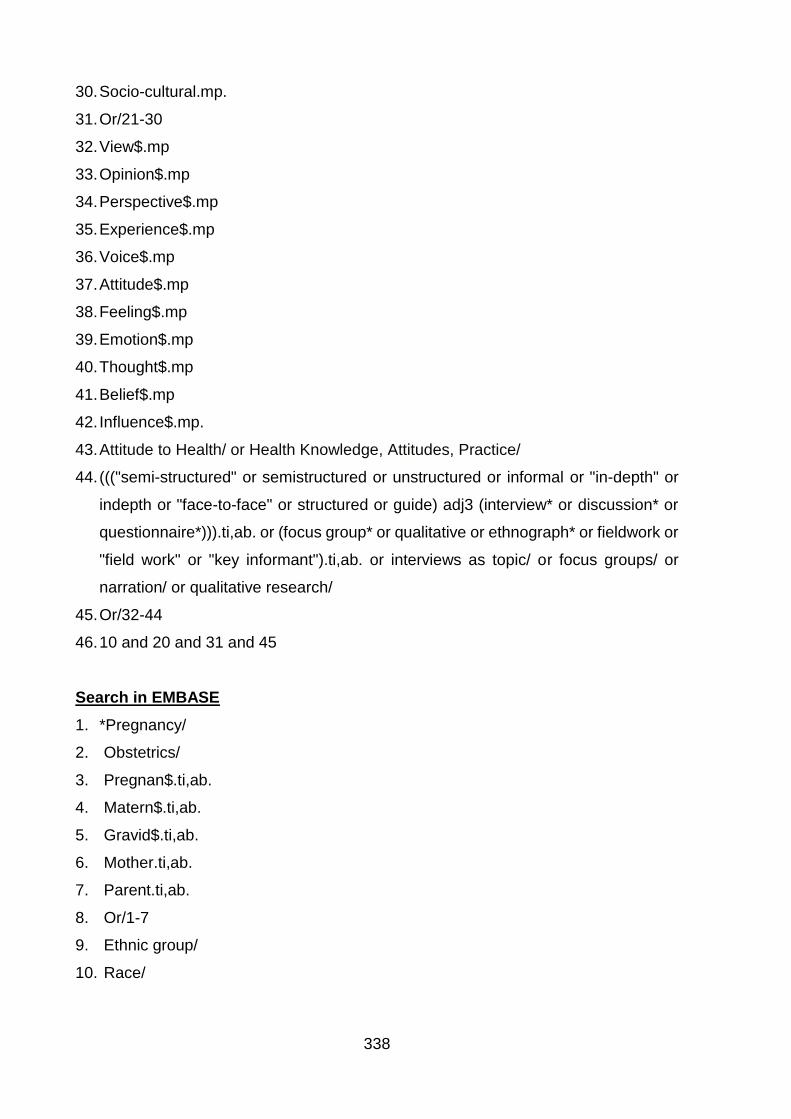
338
30. Socio-cultural.mp.
31. Or/21-30
32. View$.mp
33. Opinion$.mp
34. Perspective$.mp
35. Experience$.mp
36. Voice$.mp
37. Attitude$.mp
38. Feeling$.mp
39. Emotion$.mp
40. Thought$.mp
41. Belief$.mp
42. Influence$.mp.
43. Attitude to Health/ or Health Knowledge, Attitudes, Practice/
44. ((("semi-structured" or semistructured or unstructured or informal or "in-depth" or
indepth or "face-to-face" or structured or guide) adj3 (interview* or discussion* or
questionnaire*))).ti,ab. or (focus group* or qualitative or ethnograph* or fieldwork or
"field work" or "key informant").ti,ab. or interviews as topic/ or focus groups/ or
narration/ or qualitative research/
45. Or/32-44
46. 10 and 20 and 31 and 45
Search in EMBASE
1. *Pregnancy/
2. Obstetrics/
3. Pregnan$.ti,ab.
4. Matern$.ti,ab.
5. Gravid$.ti,ab.
6. Mother.ti,ab.
7. Parent.ti,ab.
8. Or/1-7
9. Ethnic group/
10. Race/
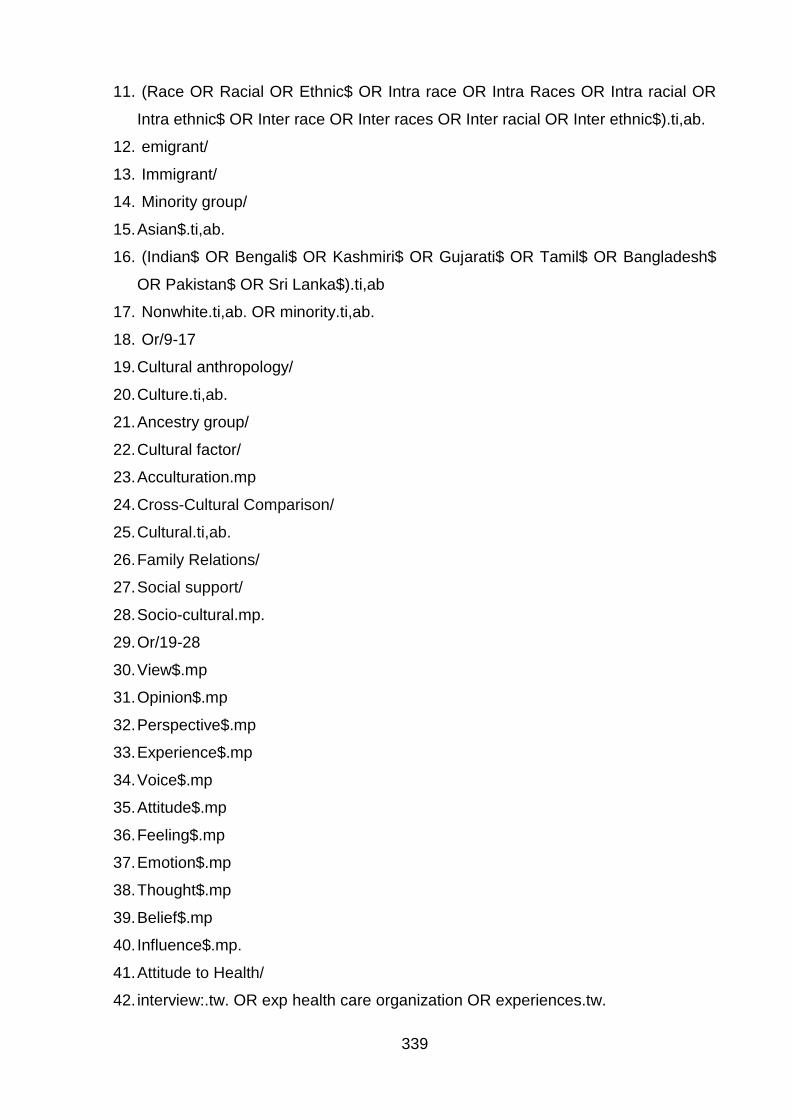
339
11. (Race OR Racial OR Ethnic$ OR Intra race OR Intra Races OR Intra racial OR
Intra ethnic$ OR Inter race OR Inter races OR Inter racial OR Inter ethnic$).ti,ab.
12. emigrant/
13. Immigrant/
14. Minority group/
15. Asian$.ti,ab.
16. (Indian$ OR Bengali$ OR Kashmiri$ OR Gujarati$ OR Tamil$ OR Bangladesh$
OR Pakistan$ OR Sri Lanka$).ti,ab
17. Nonwhite.ti,ab. OR minority.ti,ab.
18. Or/9-17
19. Cultural anthropology/
20. Culture.ti,ab.
21. Ancestry group/
22. Cultural factor/
23. Acculturation.mp
24. Cross-Cultural Comparison/
25. Cultural.ti,ab.
26. Family Relations/
27. Social support/
28. Socio-cultural.mp.
29. Or/19-28
30. View$.mp
31. Opinion$.mp
32. Perspective$.mp
33. Experience$.mp
34. Voice$.mp
35. Attitude$.mp
36. Feeling$.mp
37. Emotion$.mp
38. Thought$.mp
39. Belief$.mp
40. Influence$.mp.
41. Attitude to Health/
42. interview:.tw. OR exp health care organization OR experiences.tw.
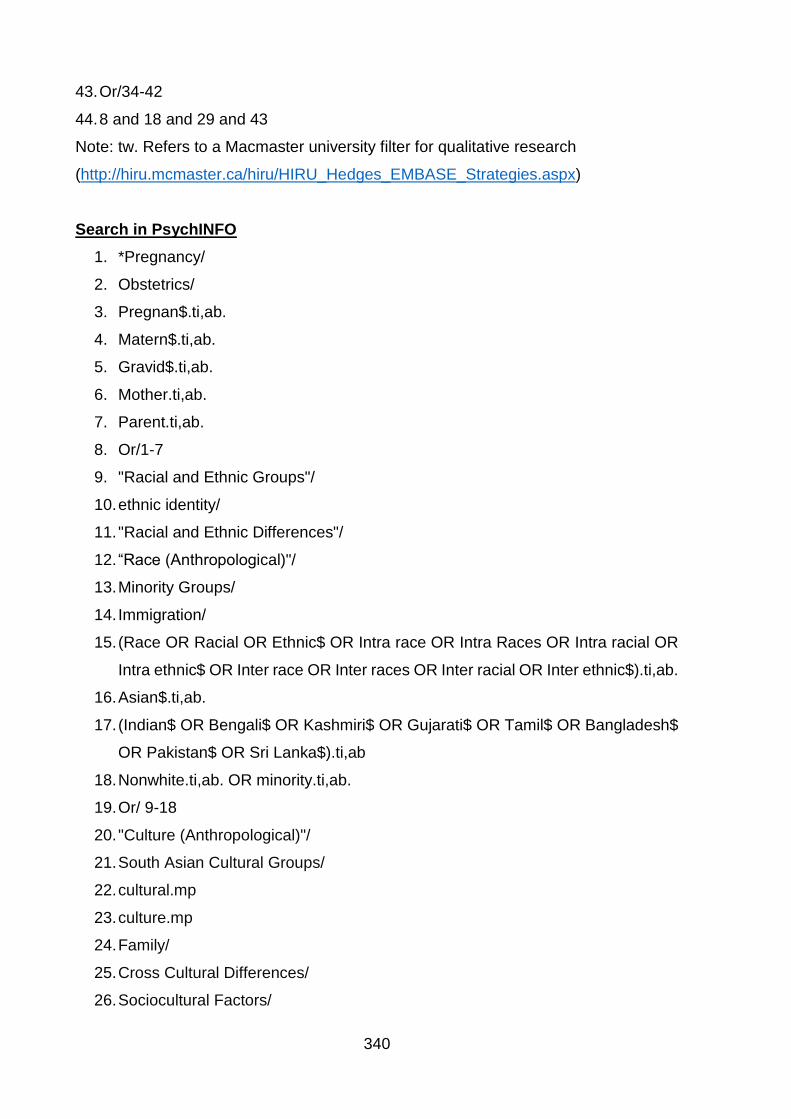
340
43. Or/34-42
44. 8 and 18 and 29 and 43
Note: tw. Refers to a Macmaster university filter for qualitative research
(http://hiru.mcmaster.ca/hiru/HIRU_Hedges_EMBASE_Strategies.aspx)
Search in PsychINFO
1. *Pregnancy/
2. Obstetrics/
3. Pregnan$.ti,ab.
4. Matern$.ti,ab.
5. Gravid$.ti,ab.
6. Mother.ti,ab.
7. Parent.ti,ab.
8. Or/1-7
9. "Racial and Ethnic Groups"/
10. ethnic identity/
11. "Racial and Ethnic Differences"/
12. “Race (Anthropological)"/
13. Minority Groups/
14. Immigration/
15. (Race OR Racial OR Ethnic$ OR Intra race OR Intra Races OR Intra racial OR
Intra ethnic$ OR Inter race OR Inter races OR Inter racial OR Inter ethnic$).ti,ab.
16. Asian$.ti,ab.
17. (Indian$ OR Bengali$ OR Kashmiri$ OR Gujarati$ OR Tamil$ OR Bangladesh$
OR Pakistan$ OR Sri Lanka$).ti,ab
18. Nonwhite.ti,ab. OR minority.ti,ab.
19. Or/ 9-18
20. "Culture (Anthropological)"/
21. South Asian Cultural Groups/
22. cultural.mp
23. culture.mp
24. Family/
25. Cross Cultural Differences/
26. Sociocultural Factors/
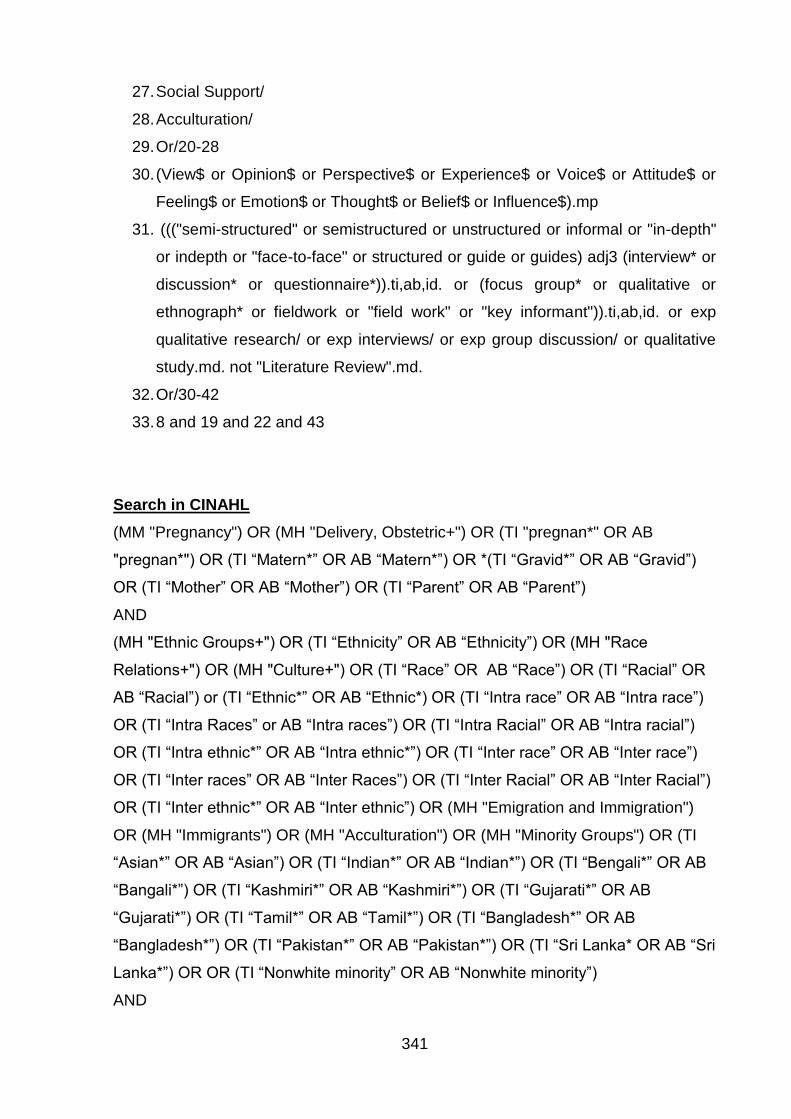
341
27. Social Support/
28. Acculturation/
29. Or/20-28
30. (View$ or Opinion$ or Perspective$ or Experience$ or Voice$ or Attitude$ or
Feeling$ or Emotion$ or Thought$ or Belief$ or Influence$).mp
31. ((("semi-structured" or semistructured or unstructured or informal or "in-depth"
or indepth or "face-to-face" or structured or guide or guides) adj3 (interview* or
discussion* or questionnaire*)).ti,ab,id. or (focus group* or qualitative or
ethnograph* or fieldwork or "field work" or "key informant")).ti,ab,id. or exp
qualitative research/ or exp interviews/ or exp group discussion/ or qualitative
study.md. not "Literature Review".md.
32. Or/30-42
33. 8 and 19 and 22 and 43
Search in CINAHL
(MM "Pregnancy") OR (MH "Delivery, Obstetric+") OR (TI "pregnan*" OR AB
"pregnan*") OR (TI “Matern*” OR AB “Matern*”) OR *(TI “Gravid*” OR AB “Gravid”)
OR (TI “Mother” OR AB “Mother”) OR (TI “Parent” OR AB “Parent”)
AND
(MH "Ethnic Groups+") OR (TI “Ethnicity” OR AB “Ethnicity”) OR (MH "Race
Relations+") OR (MH "Culture+") OR (TI “Race” OR AB “Race”) OR (TI “Racial” OR
AB “Racial”) or (TI “Ethnic*” OR AB “Ethnic*) OR (TI “Intra race” OR AB “Intra race”)
OR (TI “Intra Races” or AB “Intra races”) OR (TI “Intra Racial” OR AB “Intra racial”)
OR (TI “Intra ethnic*” OR AB “Intra ethnic*”) OR (TI “Inter race” OR AB “Inter race”)
OR (TI “Inter races” OR AB “Inter Races”) OR (TI “Inter Racial” OR AB “Inter Racial”)
OR (TI “Inter ethnic*” OR AB “Inter ethnic”) OR (MH "Emigration and Immigration")
OR (MH "Immigrants") OR (MH "Acculturation") OR (MH "Minority Groups") OR (TI
“Asian*” OR AB “Asian”) OR (TI “Indian*” OR AB “Indian*”) OR (TI “Bengali*” OR AB
“Bangali*”) OR (TI “Kashmiri*” OR AB “Kashmiri*”) OR (TI “Gujarati*” OR AB
“Gujarati*”) OR (TI “Tamil*” OR AB “Tamil*”) OR (TI “Bangladesh*” OR AB
“Bangladesh*”) OR (TI “Pakistan*” OR AB “Pakistan*”) OR (TI “Sri Lanka* OR AB “Sri
Lanka*”) OR OR (TI “Nonwhite minority” OR AB “Nonwhite minority”)
AND
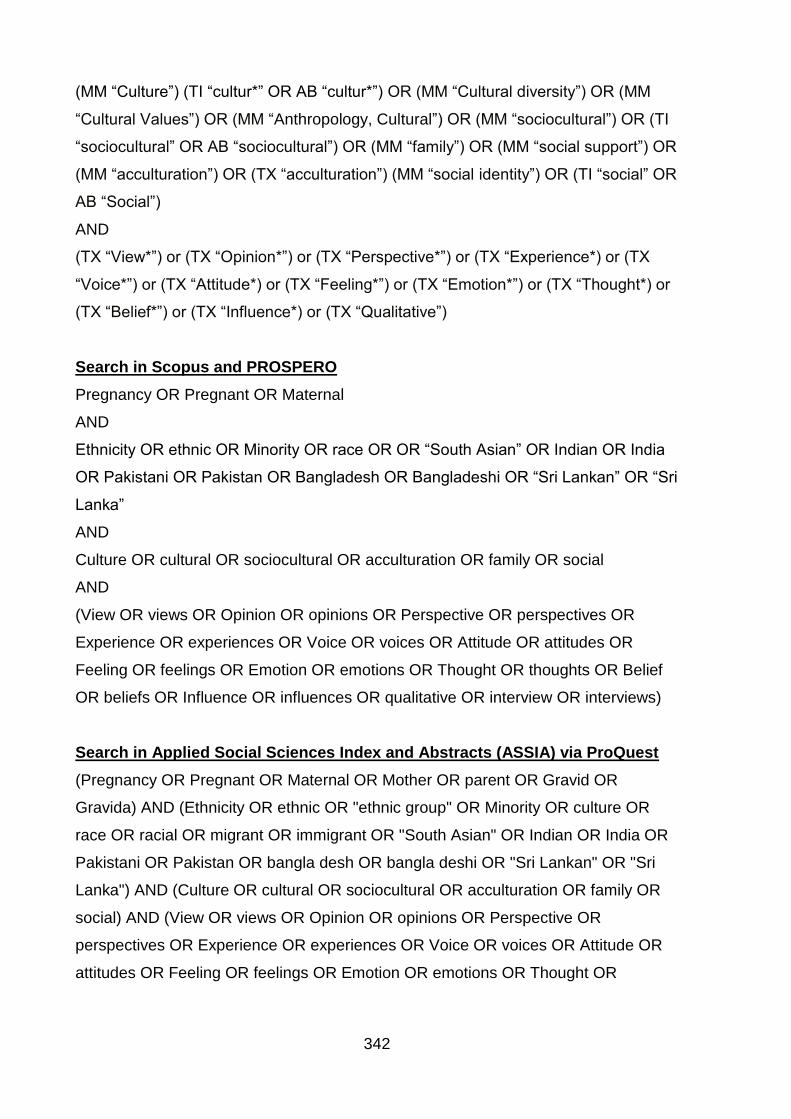
342
(MM “Culture”) (TI “cultur*” OR AB “cultur*”) OR (MM “Cultural diversity”) OR (MM
“Cultural Values”) OR (MM “Anthropology, Cultural”) OR (MM “sociocultural”) OR (TI
“sociocultural” OR AB “sociocultural”) OR (MM “family”) OR (MM “social support”) OR
(MM “acculturation”) OR (TX “acculturation”) (MM “social identity”) OR (TI “social” OR
AB “Social”)
AND
(TX “View*”) or (TX “Opinion*”) or (TX “Perspective*”) or (TX “Experience*) or (TX
“Voice*”) or (TX “Attitude*) or (TX “Feeling*”) or (TX “Emotion*”) or (TX “Thought*) or
(TX “Belief*”) or (TX “Influence*) or (TX “Qualitative”)
Search in Scopus and PROSPERO
Pregnancy OR Pregnant OR Maternal
AND
Ethnicity OR ethnic OR Minority OR race OR OR “South Asian” OR Indian OR India
OR Pakistani OR Pakistan OR Bangladesh OR Bangladeshi OR “Sri Lankan” OR “Sri
Lanka”
AND
Culture OR cultural OR sociocultural OR acculturation OR family OR social
AND
(View OR views OR Opinion OR opinions OR Perspective OR perspectives OR
Experience OR experiences OR Voice OR voices OR Attitude OR attitudes OR
Feeling OR feelings OR Emotion OR emotions OR Thought OR thoughts OR Belief
OR beliefs OR Influence OR influences OR qualitative OR interview OR interviews)
Search in Applied Social Sciences Index and Abstracts (ASSIA) via ProQuest
(Pregnancy OR Pregnant OR Maternal OR Mother OR parent OR Gravid OR
Gravida) AND (Ethnicity OR ethnic OR "ethnic group" OR Minority OR culture OR
race OR racial OR migrant OR immigrant OR "South Asian" OR Indian OR India OR
Pakistani OR Pakistan OR bangla desh OR bangla deshi OR "Sri Lankan" OR "Sri
Lanka") AND (Culture OR cultural OR sociocultural OR acculturation OR family OR
social) AND (View OR views OR Opinion OR opinions OR Perspective OR
perspectives OR Experience OR experiences OR Voice OR voices OR Attitude OR
attitudes OR Feeling OR feelings OR Emotion OR emotions OR Thought OR
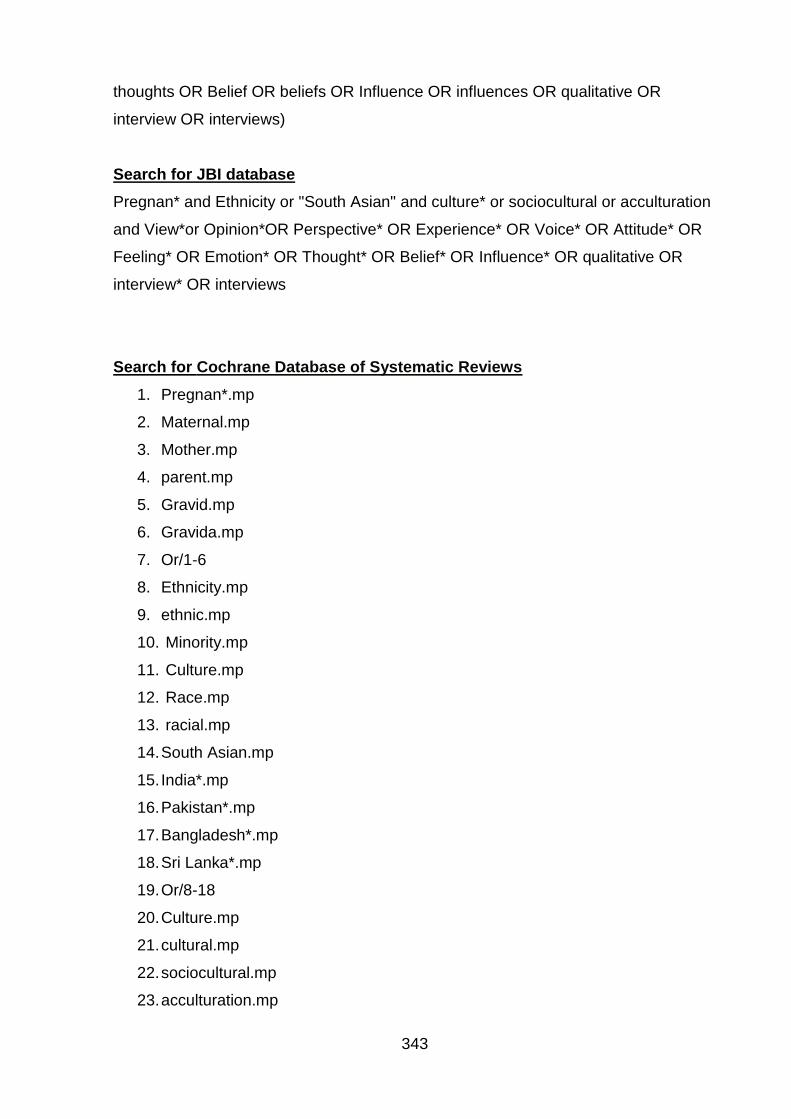
343
thoughts OR Belief OR beliefs OR Influence OR influences OR qualitative OR
interview OR interviews)
Search for JBI database
Pregnan* and Ethnicity or "South Asian" and culture* or sociocultural or acculturation
and View*or Opinion*OR Perspective* OR Experience* OR Voice* OR Attitude* OR
Feeling* OR Emotion* OR Thought* OR Belief* OR Influence* OR qualitative OR
interview* OR interviews
Search for Cochrane Database of Systematic Reviews
1. Pregnan*.mp
2. Maternal.mp
3. Mother.mp
4. parent.mp
5. Gravid.mp
6. Gravida.mp
7. Or/1-6
8. Ethnicity.mp
9. ethnic.mp
10. Minority.mp
11. Culture.mp
12. Race.mp
13. racial.mp
14. South Asian.mp
15. India*.mp
16. Pakistan*.mp
17. Bangladesh*.mp
18. Sri Lanka*.mp
19. Or/8-18
20. Culture.mp
21. cultural.mp
22. sociocultural.mp
23. acculturation.mp
344
24. family.mp
25. social.mp
26. or/20-25
27. View*.mp
28. Opinion*.mp
29. Perspective*.mp
30. Experience*.mp
31. Voice*.mp
32. Attitude*.mp
33. Feeling*.mp
34. Emotion*.mp
35. Thought*.mp
36. Belief*.mp
37. Influence*.mp
38. Qualitative.mp
39. Interview*.mp
40. Or/27-39
41. 7 and 19 and 26 and 40
Search for federated search engine Epistemonikos
Pregnancy OR Pregnant OR Maternal or Mother OR parent OR Gravid or Gravida
AND
Ethnicity OR ethnic OR “ethnic group” OR Minority OR culture OR race OR racial OR
migrant OR immigrant OR “South Asian” OR Indian OR India OR Pakistani OR
Pakistan OR Bangladesh OR Bangladeshi OR “Sri Lankan” OR “Sri Lanka”
AND
Culture OR cultural OR sociocultural OR acculturation OR family OR social
AND
(View OR views OR Opinion OR opinions OR Perspective OR perspectives OR
Experience OR experiences OR Voice OR voices OR Attitude OR attitudes OR
Feeling OR feelings OR Emotion OR emotions OR Thought OR thoughts OR Belief
OR beliefs OR Influence OR influences OR qualitative OR interview OR interviews
345
AMED (Allied and Complementary Medicine) 1985 to September 2015
1. exp pregnancy/
2. Mothers/
3. womens health/
4. (pregnan* or matern* or gravid* or mother or parent).ti,ab.
5. or/1-4
6. exp ethnic groups/
7. "emigration and immigration"/
8. (Race or Races or Racial or Ethnic* or Intra race or Intra Races or Intra racial or
Intra ethnic* or Inter race or Inter races or Inter racial or Inter ethnic*).ti,ab.
9. (Asian* or Indian* or Bengali* or Kashmiri* or Gujarati* or Tamil* or Bangladesh* or
Pakistan* or Sri Lanka* or minority group*).ti,ab.
10. (Nonwhite or minority or non-white).ti,ab.
11. or/6-10
12. culture/
13. Cross cultural comparison/
14. Family relations/
15. Social support/
16. (Acculturation or culture or cultural or cultural characteristics or cross-cultural
comparision or socio-cultural).mp.
17. or/12-16
18. attitude to health/
19. (view* or opinion* or perspective* or experience* or voice* or attitude* or feeling*
or emotion* or thought* or belief* or influence* or qualitative or interview or
interviews).ti,ab.
20. or/18-19
21. 5 and 11 and 17 and 20
Search in British Nursing Index (BNI)
((ti(pregnan* OR matern* OR gravid* OR mother OR parent) OR ab(pregnan* OR
matern* OR gravid* OR mother OR parent)) OR ((SU.EXACT("Pregnancy") OR
SU.EXACT("1:Pregnancy ") OR SU.EXACT.EXPLODE("Women's Health") OR
SU.EXACT("Motherhood")) OR SU.EXACT.EXPLODE("Obstetrics"))) AND
(SU.EXACT.EXPLODE("Ethnic Groups") OR (ti(Race OR Races OR Racial OR
346
Ethnic* OR Intra race OR Intra Races OR Intra racial OR Intra ethnic* OR Inter race
OR Inter races OR Inter racial OR Inter ethnic*) OR ab(Race OR Races OR Racial
OR Ethnic* OR Intra race OR Intra Races OR Intra racial OR Intra ethnic* OR Inter
race OR Inter races OR Inter racial OR Inter ethnic*)) OR (ti(Asian* OR Indian* OR
Bengali* OR Kashmiri* OR Gujarati* OR Tamil* OR Bangladesh* OR Pakistan* OR
Sri Lanka*) OR ab(Asian* OR Indian* OR Bengali* OR Kashmiri* OR Gujarati* OR
Tamil* OR Bangladesh* OR Pakistan* OR Sri Lanka*)) OR (ti(Nonwhite OR minority
or non-white) OR ab(Nonwhite OR minority or non-white))) AND
(SU.EXACT.EXPLODE("Culture and Religion") OR (Acculturation or culture or
cultural or cultural characteristics or cross-cultural comparision or socio-cultural) OR
(family relations or social support or social network*)) AND (SU.EXACT("Health
Attitudes") OR (view* OR opinion* OR perspective* OR experience* OR voice* OR
attitude* OR feeling* OR emotion* OR thought* OR belief* OR influence* or
qualitative OR interview OR interviews))
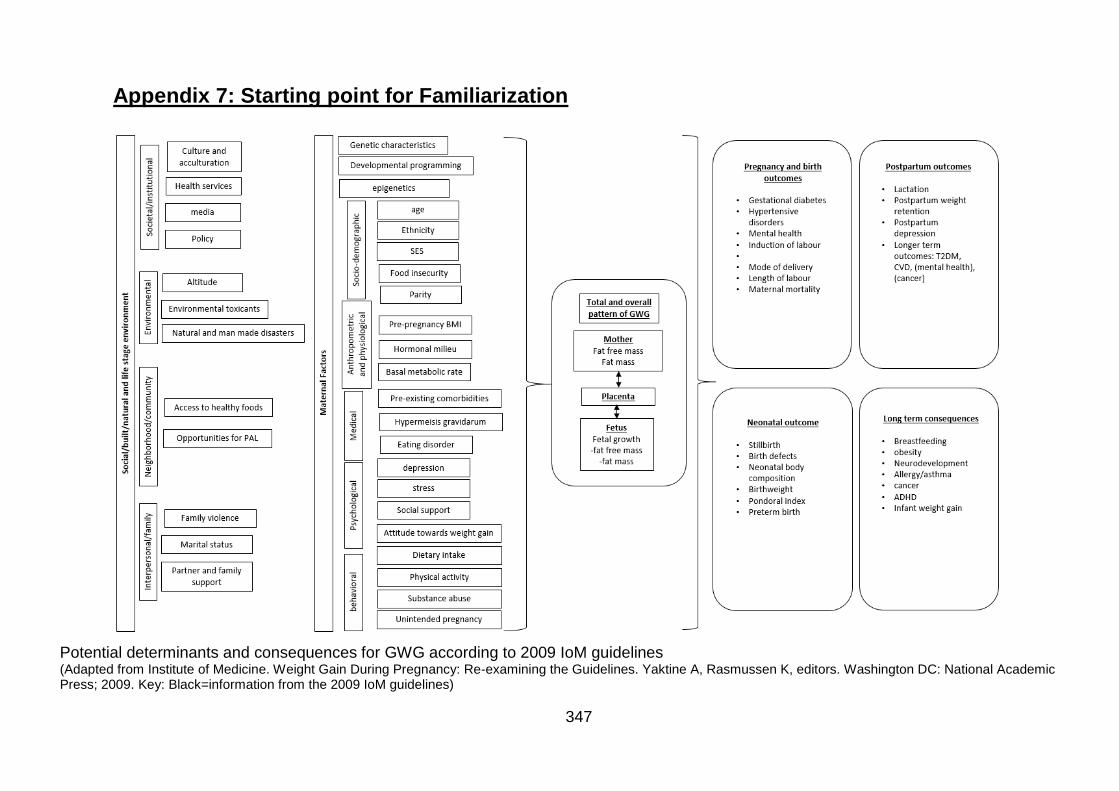
347
Appendix 7: Starting point for Familiarization
Potential determinants and consequences for GWG according to 2009 IoM guidelines (Adapted from Institute of Medicine. Weight Gain During Pregnancy: Re-examining the Guidelines. Yaktine A, Rasmussen K, editors. Washington DC: National Academic Press; 2009. Key: Black=information from the 2009 IoM guidelines)
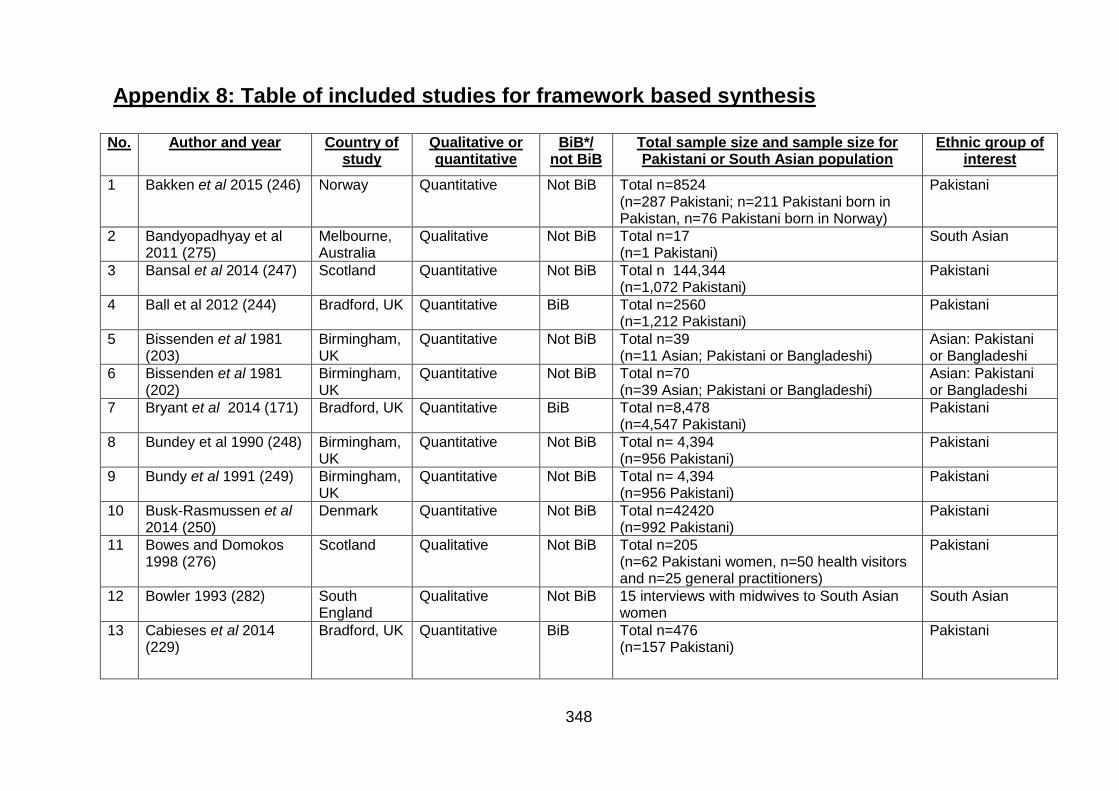
348
Appendix 8: Table of included studies for framework based synthesis
No. Author and year Country of study
Qualitative or quantitative
BiB*/ not BiB
Total sample size and sample size for Pakistani or South Asian population
Ethnic group of interest
1 Bakken et al 2015 (246) Norway Quantitative Not BiB Total n=8524 (n=287 Pakistani; n=211 Pakistani born in Pakistan, n=76 Pakistani born in Norway)
Pakistani
2 Bandyopadhyay et al 2011 (275)
Melbourne, Australia
Qualitative Not BiB Total n=17 (n=1 Pakistani)
South Asian
3 Bansal et al 2014 (247) Scotland Quantitative Not BiB Total n 144,344 (n=1,072 Pakistani)
Pakistani
4 Ball et al 2012 (244)
Bradford, UK Quantitative BiB Total n=2560 (n=1,212 Pakistani)
Pakistani
5 Bissenden et al 1981 (203)
Birmingham, UK
Quantitative Not BiB Total n=39 (n=11 Asian; Pakistani or Bangladeshi)
Asian: Pakistani or Bangladeshi
6 Bissenden et al 1981 (202)
Birmingham, UK
Quantitative Not BiB Total n=70 (n=39 Asian; Pakistani or Bangladeshi)
Asian: Pakistani or Bangladeshi
7 Bryant et al 2014 (171) Bradford, UK Quantitative BiB Total n=8,478 (n=4,547 Pakistani)
Pakistani
8 Bundey et al 1990 (248) Birmingham, UK
Quantitative Not BiB Total n= 4,394 (n=956 Pakistani)
Pakistani
9 Bundy et al 1991 (249) Birmingham, UK
Quantitative Not BiB Total n= 4,394 (n=956 Pakistani)
Pakistani
10 Busk-Rasmussen et al 2014 (250)
Denmark Quantitative Not BiB Total n=42420 (n=992 Pakistani)
Pakistani
11 Bowes and Domokos 1998 (276)
Scotland Qualitative Not BiB Total n=205 (n=62 Pakistani women, n=50 health visitors and n=25 general practitioners)
Pakistani
12 Bowler 1993 (282) South England
Qualitative Not BiB 15 interviews with midwives to South Asian women
South Asian
13 Cabieses et al 2014 (229)
Bradford, UK Quantitative BiB Total n=476 (n=157 Pakistani)
Pakistani
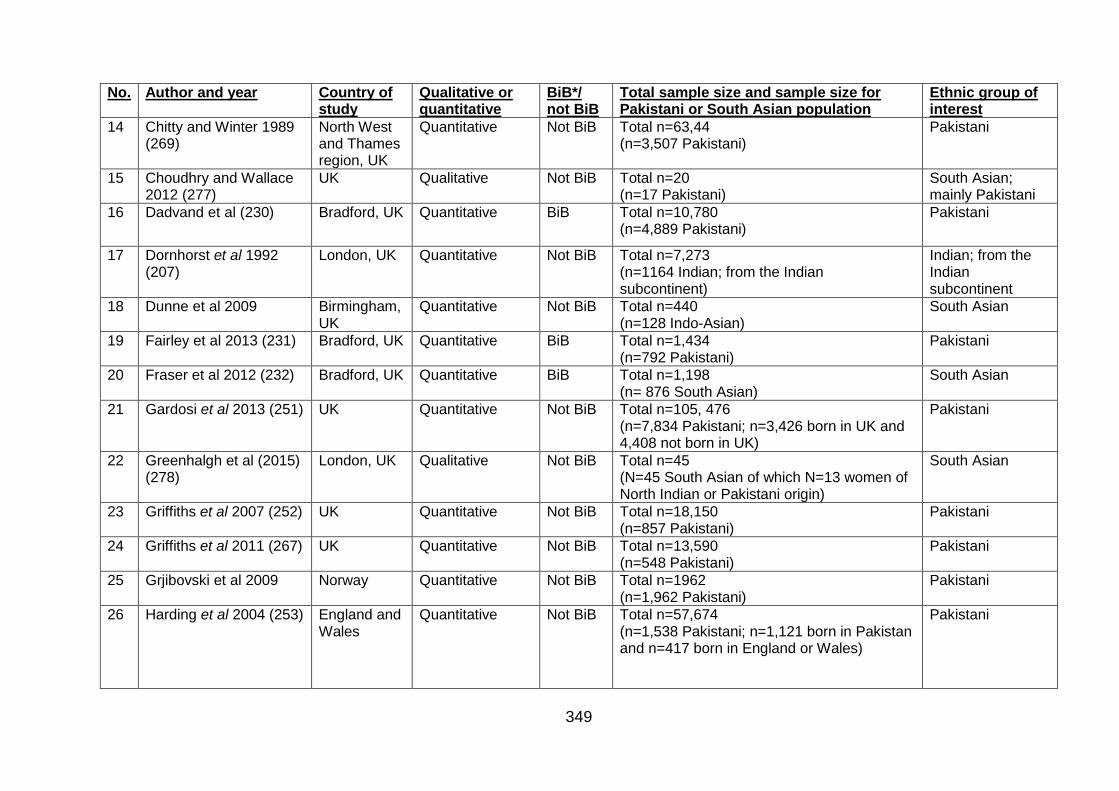
349
No. Author and year Country of study
Qualitative or quantitative
BiB*/ not BiB
Total sample size and sample size for Pakistani or South Asian population
Ethnic group of interest
14 Chitty and Winter 1989 (269)
North West and Thames region, UK
Quantitative Not BiB Total n=63,44 (n=3,507 Pakistani)
Pakistani
15 Choudhry and Wallace 2012 (277)
UK Qualitative Not BiB Total n=20 (n=17 Pakistani)
South Asian; mainly Pakistani
16 Dadvand et al (230) Bradford, UK Quantitative BiB Total n=10,780 (n=4,889 Pakistani)
Pakistani
17 Dornhorst et al 1992 (207)
London, UK Quantitative Not BiB Total n=7,273 (n=1164 Indian; from the Indian subcontinent)
Indian; from the Indian subcontinent
18 Dunne et al 2009
Birmingham, UK
Quantitative Not BiB Total n=440 (n=128 Indo-Asian)
South Asian
19 Fairley et al 2013 (231) Bradford, UK Quantitative BiB Total n=1,434 (n=792 Pakistani)
Pakistani
20 Fraser et al 2012 (232) Bradford, UK Quantitative BiB Total n=1,198 (n= 876 South Asian)
South Asian
21 Gardosi et al 2013 (251) UK Quantitative Not BiB Total n=105, 476 (n=7,834 Pakistani; n=3,426 born in UK and 4,408 not born in UK)
Pakistani
22 Greenhalgh et al (2015) (278)
London, UK Qualitative Not BiB Total n=45 (N=45 South Asian of which N=13 women of North Indian or Pakistani origin)
South Asian
23 Griffiths et al 2007 (252) UK Quantitative Not BiB Total n=18,150 (n=857 Pakistani)
Pakistani
24 Griffiths et al 2011 (267) UK Quantitative Not BiB Total n=13,590 (n=548 Pakistani)
Pakistani
25 Grjibovski et al 2009 Norway Quantitative Not BiB Total n=1962 (n=1,962 Pakistani)
Pakistani
26 Harding et al 2004 (253) England and Wales
Quantitative Not BiB Total n=57,674 (n=1,538 Pakistani; n=1,121 born in Pakistan and n=417 born in England or Wales)
Pakistani
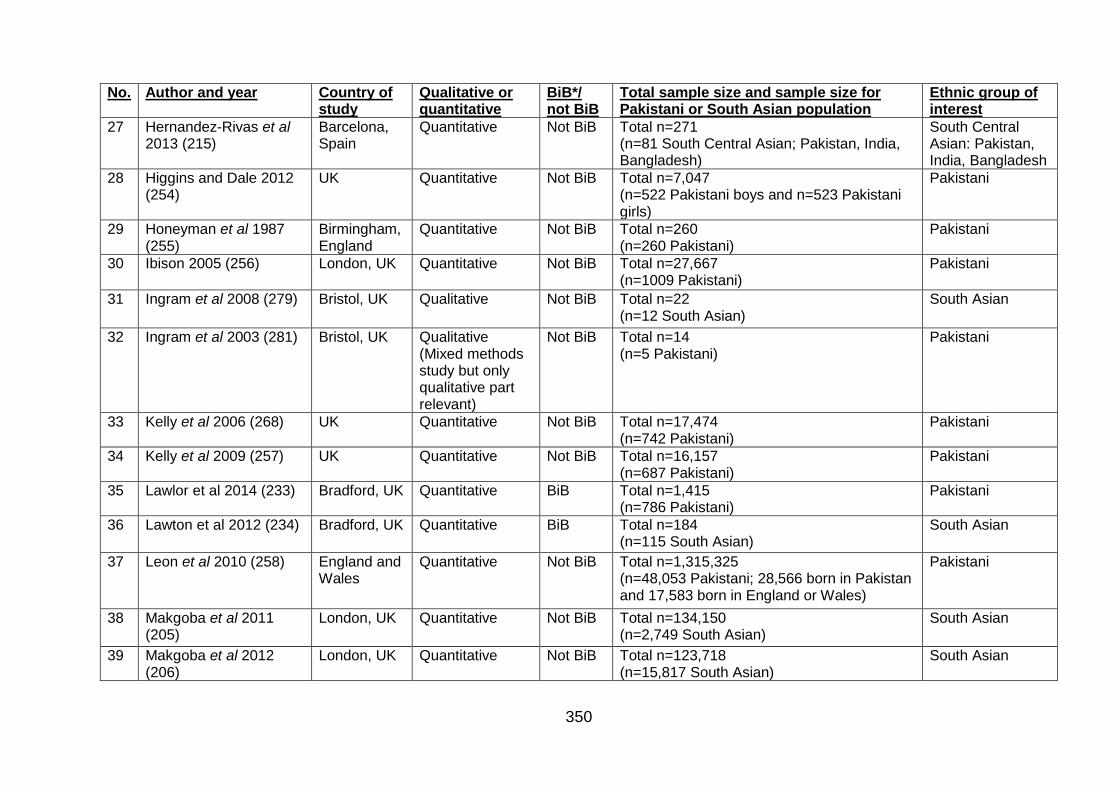
350
No. Author and year Country of study
Qualitative or quantitative
BiB*/ not BiB
Total sample size and sample size for Pakistani or South Asian population
Ethnic group of interest
27 Hernandez-Rivas et al 2013 (215)
Barcelona, Spain
Quantitative Not BiB Total n=271 (n=81 South Central Asian; Pakistan, India, Bangladesh)
South Central Asian: Pakistan, India, Bangladesh
28 Higgins and Dale 2012 (254)
UK Quantitative Not BiB Total n=7,047 (n=522 Pakistani boys and n=523 Pakistani girls)
Pakistani
29 Honeyman et al 1987 (255)
Birmingham, England
Quantitative Not BiB Total n=260 (n=260 Pakistani)
Pakistani
30 Ibison 2005 (256) London, UK Quantitative Not BiB Total n=27,667 (n=1009 Pakistani)
Pakistani
31 Ingram et al 2008 (279) Bristol, UK Qualitative Not BiB Total n=22 (n=12 South Asian)
South Asian
32 Ingram et al 2003 (281) Bristol, UK Qualitative (Mixed methods study but only qualitative part relevant)
Not BiB Total n=14 (n=5 Pakistani)
Pakistani
33 Kelly et al 2006 (268) UK Quantitative Not BiB Total n=17,474 (n=742 Pakistani)
Pakistani
34 Kelly et al 2009 (257) UK Quantitative Not BiB Total n=16,157 (n=687 Pakistani)
Pakistani
35 Lawlor et al 2014 (233) Bradford, UK Quantitative BiB Total n=1,415 (n=786 Pakistani)
Pakistani
36 Lawton et al 2012 (234) Bradford, UK Quantitative BiB Total n=184 (n=115 South Asian)
South Asian
37 Leon et al 2010 (258) England and Wales
Quantitative Not BiB Total n=1,315,325 (n=48,053 Pakistani; 28,566 born in Pakistan and 17,583 born in England or Wales)
Pakistani
38 Makgoba et al 2011 (205)
London, UK Quantitative Not BiB Total n=134,150 (n=2,749 South Asian)
South Asian
39 Makgoba et al 2012 (206)
London, UK Quantitative Not BiB Total n=123,718 (n=15,817 South Asian)
South Asian
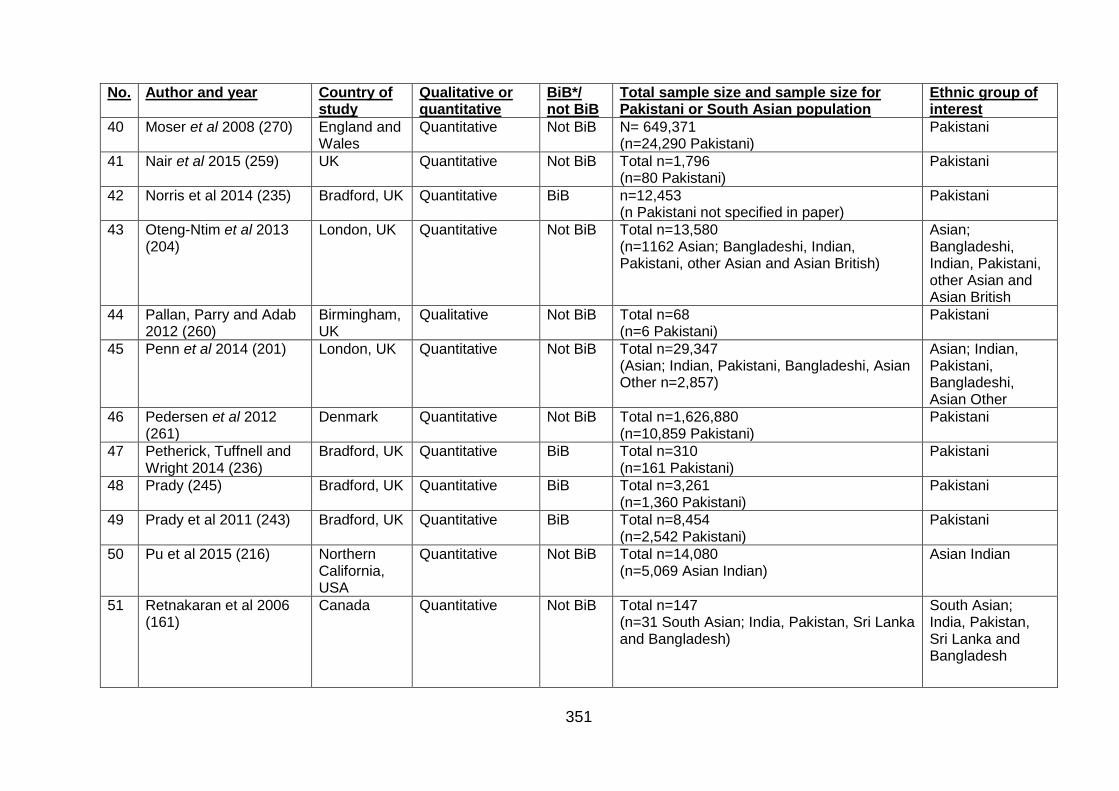
351
No. Author and year Country of study
Qualitative or quantitative
BiB*/ not BiB
Total sample size and sample size for Pakistani or South Asian population
Ethnic group of interest
40 Moser et al 2008 (270) England and Wales
Quantitative Not BiB N= 649,371 (n=24,290 Pakistani)
Pakistani
41 Nair et al 2015 (259) UK Quantitative Not BiB Total n=1,796 (n=80 Pakistani)
Pakistani
42 Norris et al 2014 (235) Bradford, UK Quantitative BiB n=12,453 (n Pakistani not specified in paper)
Pakistani
43 Oteng-Ntim et al 2013 (204)
London, UK Quantitative Not BiB Total n=13,580 (n=1162 Asian; Bangladeshi, Indian, Pakistani, other Asian and Asian British)
Asian; Bangladeshi, Indian, Pakistani, other Asian and Asian British
44 Pallan, Parry and Adab 2012 (260)
Birmingham, UK
Qualitative Not BiB Total n=68 (n=6 Pakistani)
Pakistani
45 Penn et al 2014 (201) London, UK Quantitative Not BiB Total n=29,347 (Asian; Indian, Pakistani, Bangladeshi, Asian Other n=2,857)
Asian; Indian, Pakistani, Bangladeshi, Asian Other
46 Pedersen et al 2012 (261)
Denmark Quantitative Not BiB Total n=1,626,880 (n=10,859 Pakistani)
Pakistani
47 Petherick, Tuffnell and Wright 2014 (236)
Bradford, UK Quantitative BiB Total n=310 (n=161 Pakistani)
Pakistani
48 Prady (245) Bradford, UK Quantitative BiB Total n=3,261 (n=1,360 Pakistani)
Pakistani
49 Prady et al 2011 (243) Bradford, UK Quantitative BiB Total n=8,454 (n=2,542 Pakistani)
Pakistani
50 Pu et al 2015 (216) Northern California, USA
Quantitative Not BiB Total n=14,080 (n=5,069 Asian Indian)
Asian Indian
51 Retnakaran et al 2006 (161)
Canada Quantitative Not BiB Total n=147 (n=31 South Asian; India, Pakistan, Sri Lanka and Bangladesh)
South Asian; India, Pakistan, Sri Lanka and Bangladesh
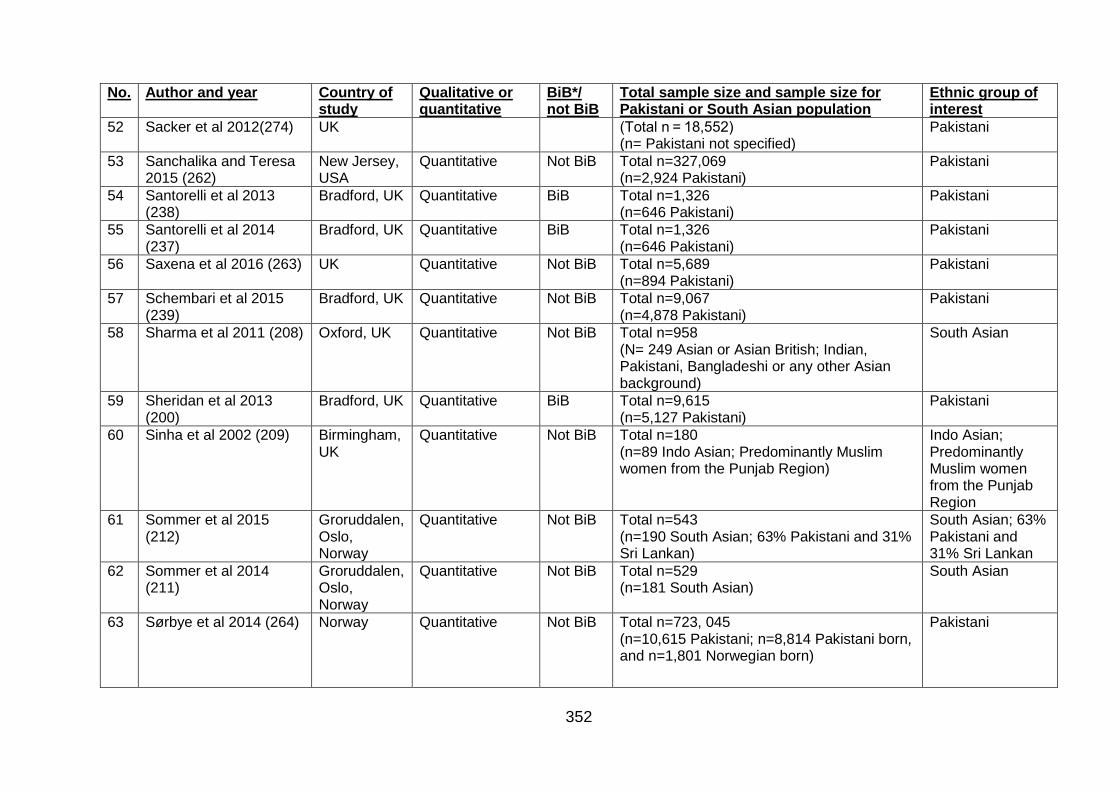
352
No. Author and year Country of study
Qualitative or quantitative
BiB*/ not BiB
Total sample size and sample size for Pakistani or South Asian population
Ethnic group of interest
52 Sacker et al 2012(274) UK (Total n = 18,552) (n= Pakistani not specified)
Pakistani
53 Sanchalika and Teresa 2015 (262)
New Jersey, USA
Quantitative Not BiB Total n=327,069 (n=2,924 Pakistani)
Pakistani
54 Santorelli et al 2013 (238)
Bradford, UK Quantitative BiB Total n=1,326 (n=646 Pakistani)
Pakistani
55 Santorelli et al 2014 (237)
Bradford, UK Quantitative BiB Total n=1,326 (n=646 Pakistani)
Pakistani
56 Saxena et al 2016 (263) UK Quantitative Not BiB Total n=5,689 (n=894 Pakistani)
Pakistani
57 Schembari et al 2015 (239)
Bradford, UK Quantitative Not BiB Total n=9,067 (n=4,878 Pakistani)
Pakistani
58 Sharma et al 2011 (208) Oxford, UK
Quantitative Not BiB Total n=958 (N= 249 Asian or Asian British; Indian, Pakistani, Bangladeshi or any other Asian background)
South Asian
59 Sheridan et al 2013 (200)
Bradford, UK Quantitative BiB Total n=9,615 (n=5,127 Pakistani)
Pakistani
60 Sinha et al 2002 (209) Birmingham, UK
Quantitative Not BiB Total n=180 (n=89 Indo Asian; Predominantly Muslim women from the Punjab Region)
Indo Asian; Predominantly Muslim women from the Punjab Region
61 Sommer et al 2015 (212)
Groruddalen, Oslo, Norway
Quantitative Not BiB Total n=543 (n=190 South Asian; 63% Pakistani and 31% Sri Lankan)
South Asian; 63% Pakistani and 31% Sri Lankan
62 Sommer et al 2014 (211)
Groruddalen, Oslo, Norway
Quantitative Not BiB Total n=529 (n=181 South Asian)
South Asian
63 Sørbye et al 2014 (264) Norway Quantitative Not BiB Total n=723, 045 (n=10,615 Pakistani; n=8,814 Pakistani born, and n=1,801 Norwegian born)
Pakistani
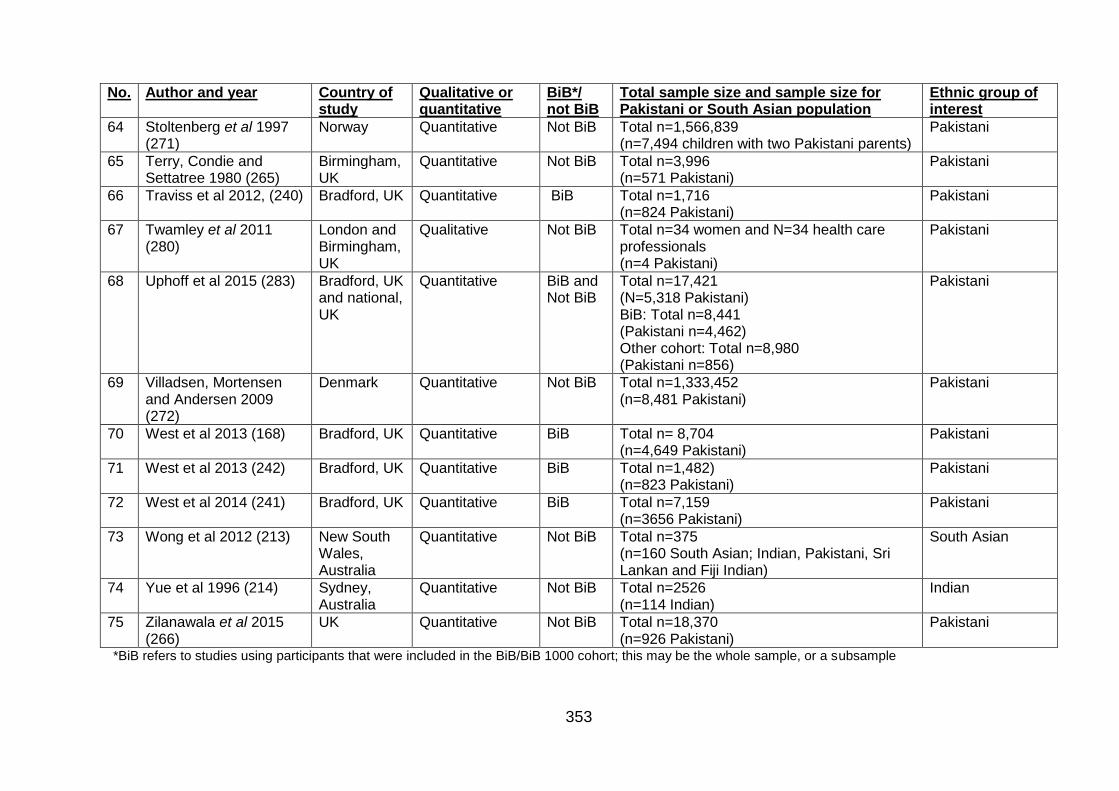
353
No. Author and year Country of study
Qualitative or quantitative
BiB*/ not BiB
Total sample size and sample size for Pakistani or South Asian population
Ethnic group of interest
64 Stoltenberg et al 1997 (271)
Norway Quantitative Not BiB Total n=1,566,839 (n=7,494 children with two Pakistani parents)
Pakistani
65 Terry, Condie and Settatree 1980 (265)
Birmingham, UK
Quantitative Not BiB Total n=3,996 (n=571 Pakistani)
Pakistani
66 Traviss et al 2012, (240) Bradford, UK Quantitative BiB Total n=1,716 (n=824 Pakistani)
Pakistani
67 Twamley et al 2011 (280)
London and Birmingham, UK
Qualitative Not BiB Total n=34 women and N=34 health care professionals (n=4 Pakistani)
Pakistani
68 Uphoff et al 2015 (283) Bradford, UK and national, UK
Quantitative BiB and Not BiB
Total n=17,421 (N=5,318 Pakistani) BiB: Total n=8,441 (Pakistani n=4,462) Other cohort: Total n=8,980 (Pakistani n=856)
Pakistani
69 Villadsen, Mortensen and Andersen 2009 (272)
Denmark Quantitative Not BiB Total n=1,333,452 (n=8,481 Pakistani)
Pakistani
70 West et al 2013 (168) Bradford, UK Quantitative BiB Total n= 8,704 (n=4,649 Pakistani)
Pakistani
71 West et al 2013 (242) Bradford, UK Quantitative BiB Total n=1,482) (n=823 Pakistani)
Pakistani
72 West et al 2014 (241) Bradford, UK Quantitative BiB Total n=7,159 (n=3656 Pakistani)
Pakistani
73 Wong et al 2012 (213)
New South Wales, Australia
Quantitative Not BiB Total n=375 (n=160 South Asian; Indian, Pakistani, Sri Lankan and Fiji Indian)
South Asian
74 Yue et al 1996 (214) Sydney, Australia
Quantitative Not BiB Total n=2526 (n=114 Indian)
Indian
75 Zilanawala et al 2015 (266)
UK Quantitative Not BiB Total n=18,370 (n=926 Pakistani)
Pakistani
*BiB refers to studies using participants that were included in the BiB/BiB 1000 cohort; this may be the whole sample, or a subsample
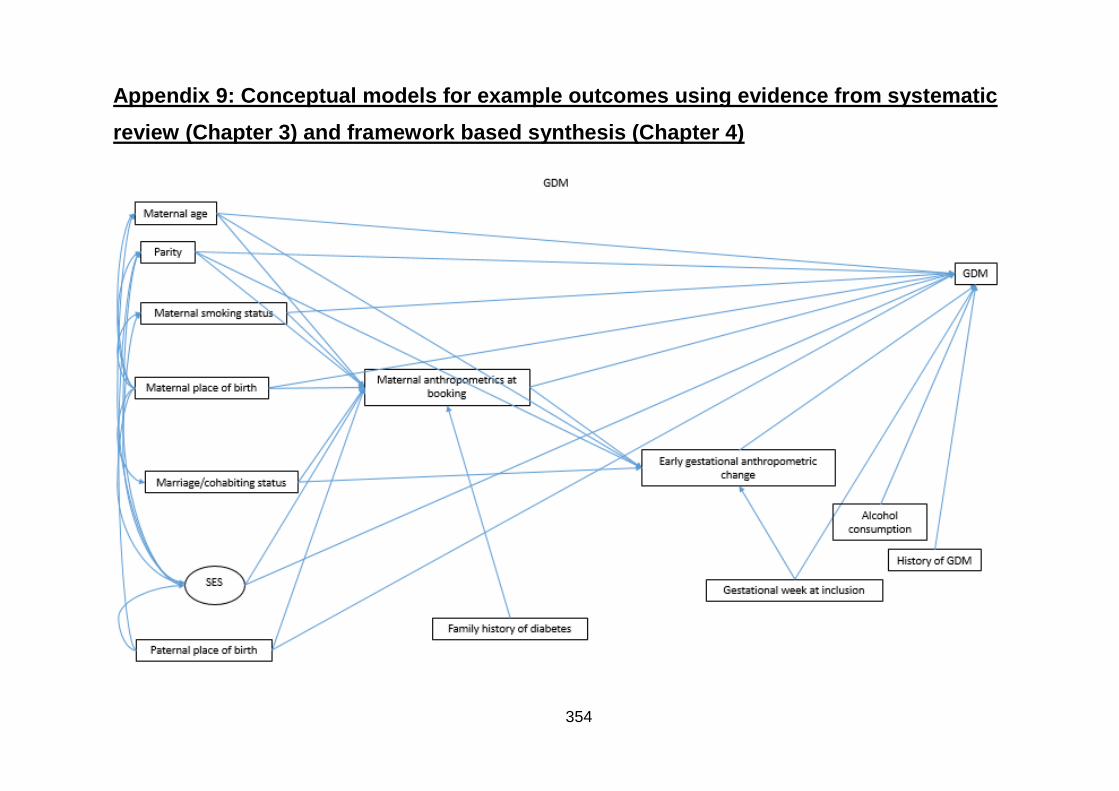
354
Appendix 9: Conceptual models for example outcomes using evidence from systematic
review (Chapter 3) and framework based synthesis (Chapter 4)
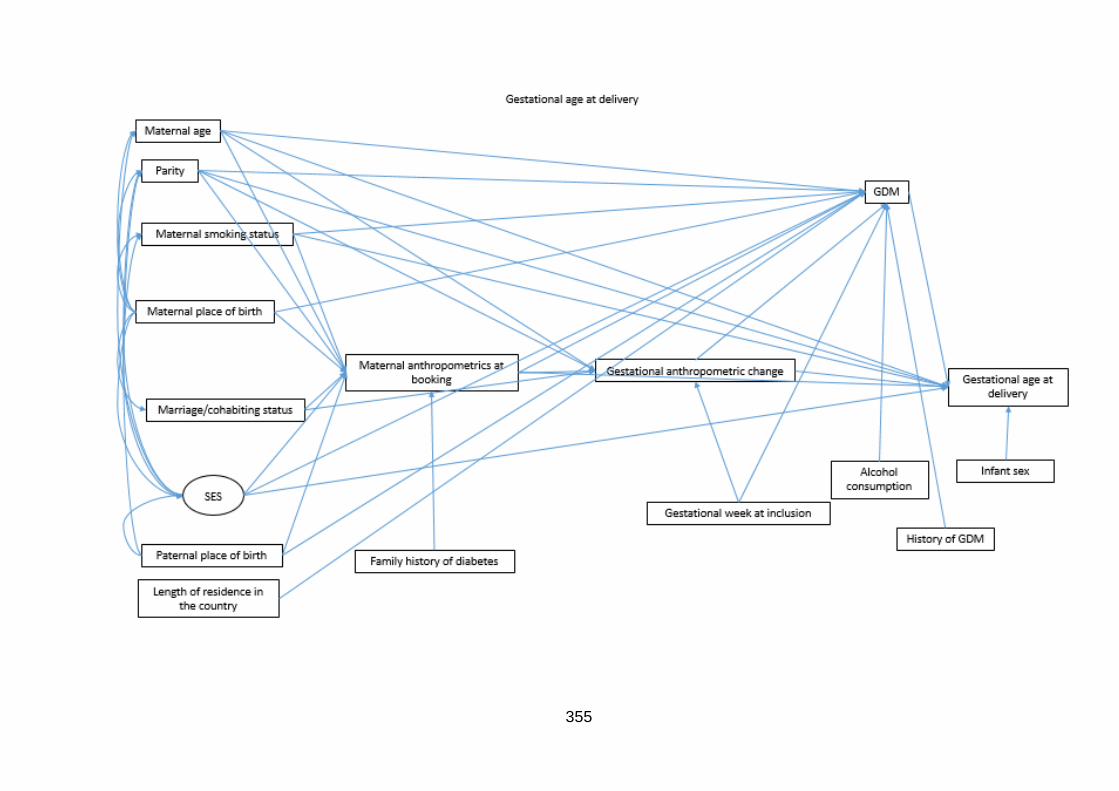
355
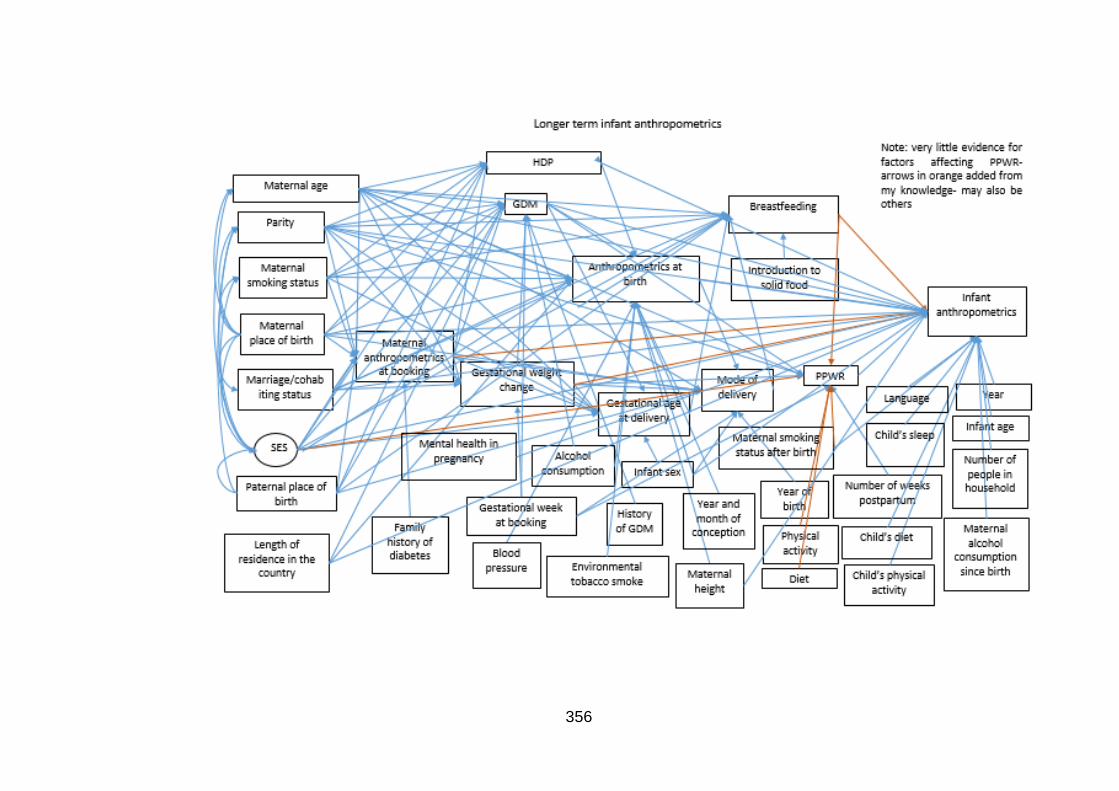
356

357
Appendix 10: Agenda for expert opinion meeting
Agenda Conceptual model feedback meeting
Tuesday 4th October 2016, 12-1pm Gallery room
Welcome and introductions
PhD project o This PhD project is part of a 1+3 MRC funded studentship and aims to
investigate the association between ethnic groups (White and South Asian), maternal pre-/early pregnancy anthropometrics, change in anthropometrics during pregnancy, and short- and long-term pregnancy outcomes for both mother and infant
o The project consists of a number of stages: Development of hypothetical conceptual model
o Systematic review o Framework based synthesis o Expert opinion
Data analysis to test hypothetical conceptual model using BiB Data and structural equation modelling.
Purpose of meeting o To ask for your feedback on a hypothetical conceptual model of the
associations between maternal pre-/early pregnancy anthropometrics, change in anthropometrics during pregnancy and pregnancy outcomes in South Asian women developed using a systematic review and framework based synthesis
o To ask for your feedback on a list of variables which may influence the associations in the conceptual model
Brief presentation (10 minutes): Description of conceptual model development process
o Systematic review o Framework based synthesis o Expert opinion
Discussion of exposures and outcomes o Missing associations? o Missing outcomes? o Missing interactions between outcomes?
Discussion of list of factors influencing associations in the conceptual model
o Are there any missing factors? o Interactions between factors?
Next steps and timeline

358
Oct Nov Dec Jan Feb March April May June July Aug Sept
Selection of final variables
Data request and arrival of data
Write up systematic review for publication
Data cleaning and coding
Data analysis and structural equation modelling
Write up thesis
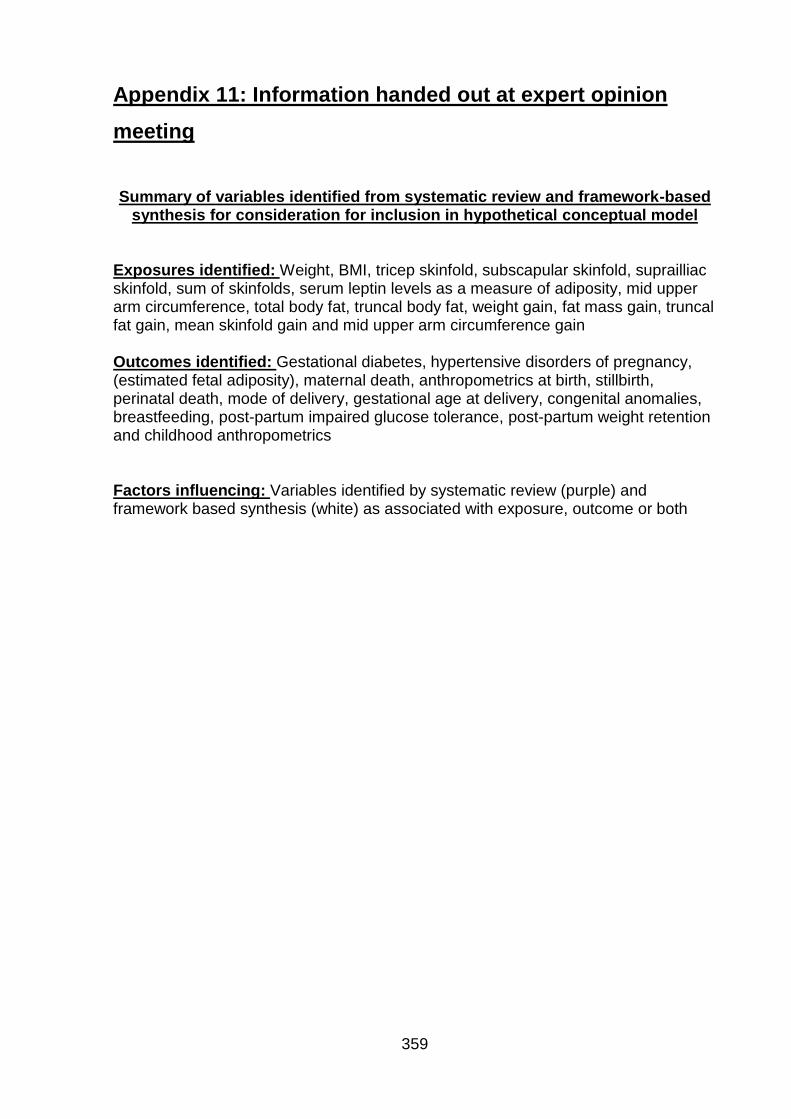
359
Appendix 11: Information handed out at expert opinion
meeting
Summary of variables identified from systematic review and framework-based
synthesis for consideration for inclusion in hypothetical conceptual model Exposures identified: Weight, BMI, tricep skinfold, subscapular skinfold, suprailliac skinfold, sum of skinfolds, serum leptin levels as a measure of adiposity, mid upper arm circumference, total body fat, truncal body fat, weight gain, fat mass gain, truncal fat gain, mean skinfold gain and mid upper arm circumference gain Outcomes identified: Gestational diabetes, hypertensive disorders of pregnancy, (estimated fetal adiposity), maternal death, anthropometrics at birth, stillbirth, perinatal death, mode of delivery, gestational age at delivery, congenital anomalies, breastfeeding, post-partum impaired glucose tolerance, post-partum weight retention and childhood anthropometrics Factors influencing: Variables identified by systematic review (purple) and framework based synthesis (white) as associated with exposure, outcome or both
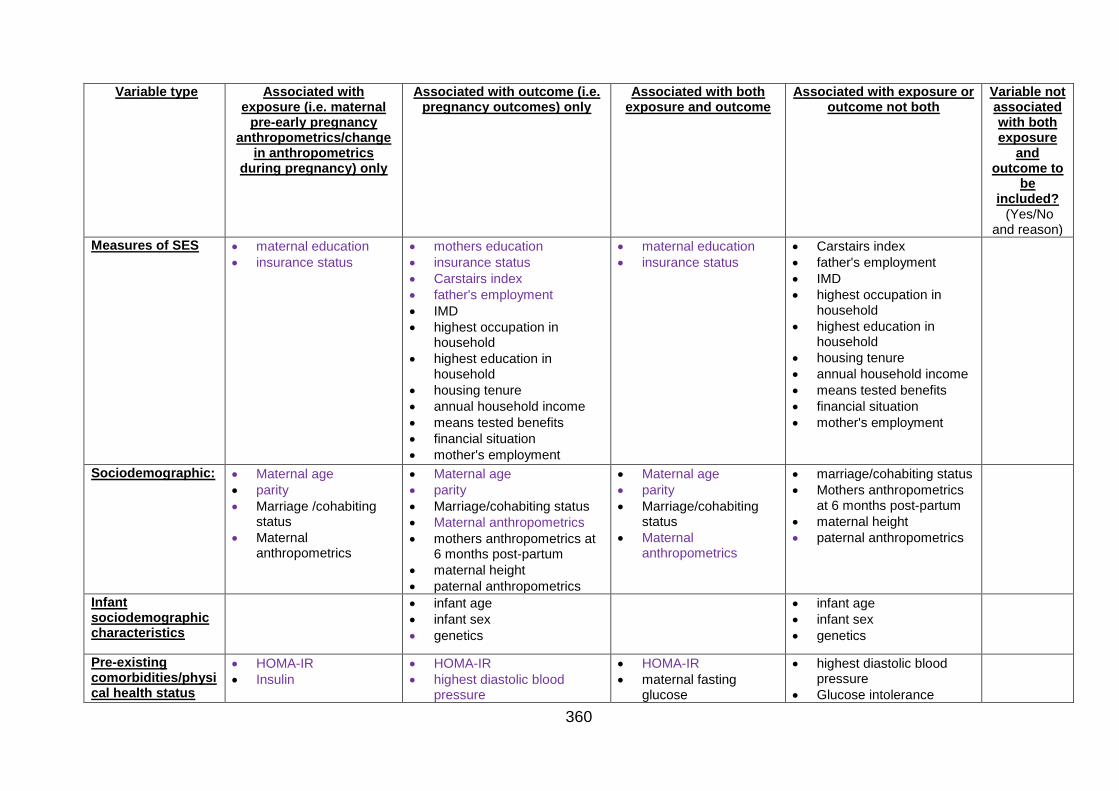
360
Variable type Associated with exposure (i.e. maternal
pre-early pregnancy anthropometrics/change
in anthropometrics during pregnancy) only
Associated with outcome (i.e. pregnancy outcomes) only
Associated with both exposure and outcome
Associated with exposure or outcome not both
Variable not associated with both exposure
and outcome to
be included? (Yes/No
and reason)
Measures of SES maternal education
insurance status
mothers education
insurance status
Carstairs index
father's employment
IMD
highest occupation in household
highest education in household
housing tenure
annual household income
means tested benefits
financial situation
mother's employment
maternal education
insurance status
Carstairs index
father's employment
IMD
highest occupation in household
highest education in household
housing tenure
annual household income
means tested benefits
financial situation
mother's employment
Sociodemographic: Maternal age
parity
Marriage /cohabiting status
Maternal anthropometrics
Maternal age
parity
Marriage/cohabiting status
Maternal anthropometrics
mothers anthropometrics at 6 months post-partum
maternal height
paternal anthropometrics
Maternal age
parity
Marriage/cohabiting status
Maternal anthropometrics
marriage/cohabiting status
Mothers anthropometrics at 6 months post-partum
maternal height
paternal anthropometrics
Infant sociodemographic characteristics
infant age
infant sex
genetics
infant age
infant sex
genetics
Pre-existing comorbidities/physical health status
HOMA-IR
Insulin
HOMA-IR
highest diastolic blood pressure
HOMA-IR
maternal fasting glucose
highest diastolic blood pressure
Glucose intolerance
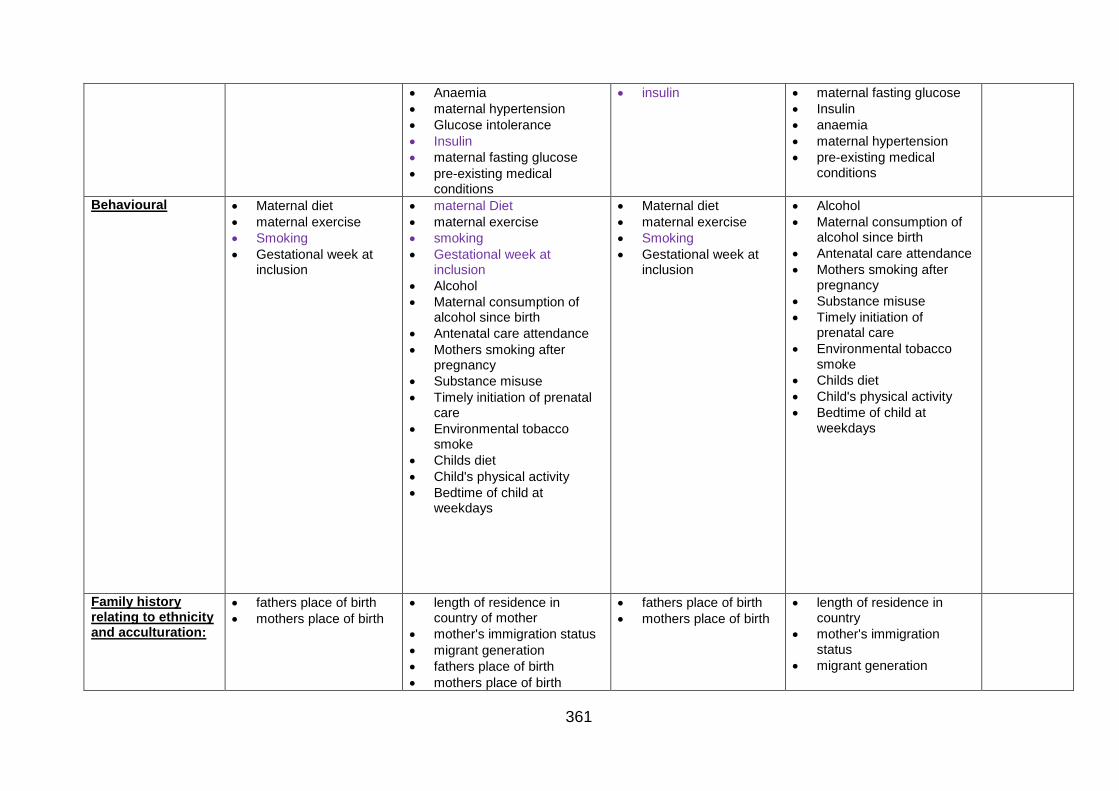
361
Anaemia
maternal hypertension
Glucose intolerance
Insulin
maternal fasting glucose
pre-existing medical conditions
insulin
maternal fasting glucose
Insulin
anaemia
maternal hypertension
pre-existing medical conditions
Behavioural
Maternal diet
maternal exercise
Smoking
Gestational week at inclusion
maternal Diet
maternal exercise
smoking
Gestational week at inclusion
Alcohol
Maternal consumption of alcohol since birth
Antenatal care attendance
Mothers smoking after pregnancy
Substance misuse
Timely initiation of prenatal care
Environmental tobacco smoke
Childs diet
Child's physical activity
Bedtime of child at weekdays
Maternal diet
maternal exercise
Smoking
Gestational week at inclusion
Alcohol
Maternal consumption of alcohol since birth
Antenatal care attendance
Mothers smoking after pregnancy
Substance misuse
Timely initiation of prenatal care
Environmental tobacco smoke
Childs diet
Child's physical activity
Bedtime of child at weekdays
Family history relating to ethnicity and acculturation:
fathers place of birth
mothers place of birth
length of residence in country of mother
mother's immigration status
migrant generation
fathers place of birth
mothers place of birth
fathers place of birth
mothers place of birth
length of residence in country
mother's immigration status
migrant generation
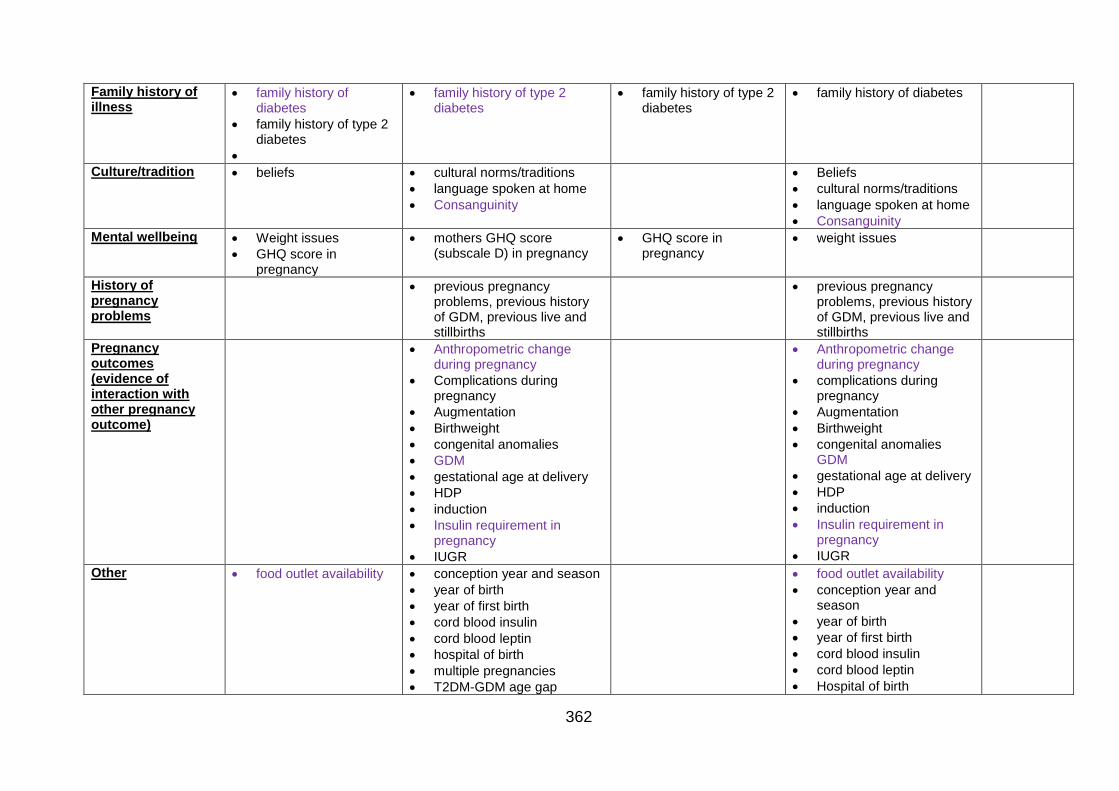
362
Family history of illness
family history of diabetes
family history of type 2 diabetes
family history of type 2 diabetes
family history of type 2 diabetes
family history of diabetes
Culture/tradition
beliefs cultural norms/traditions
language spoken at home
Consanguinity
Beliefs
cultural norms/traditions
language spoken at home
Consanguinity
Mental wellbeing
Weight issues
GHQ score in pregnancy
mothers GHQ score (subscale D) in pregnancy
GHQ score in pregnancy
weight issues
History of pregnancy problems
previous pregnancy problems, previous history of GDM, previous live and stillbirths
previous pregnancy problems, previous history of GDM, previous live and stillbirths
Pregnancy outcomes (evidence of interaction with other pregnancy outcome)
Anthropometric change
during pregnancy
Complications during pregnancy
Augmentation
Birthweight
congenital anomalies
GDM
gestational age at delivery
HDP
induction
Insulin requirement in pregnancy
IUGR
Anthropometric change
during pregnancy
complications during pregnancy
Augmentation
Birthweight
congenital anomalies GDM
gestational age at delivery
HDP
induction
Insulin requirement in pregnancy
IUGR
Other food outlet availability
conception year and season
year of birth
year of first birth
cord blood insulin
cord blood leptin
hospital of birth
multiple pregnancies
T2DM-GDM age gap
food outlet availability
conception year and season
year of birth
year of first birth
cord blood insulin
cord blood leptin
Hospital of birth
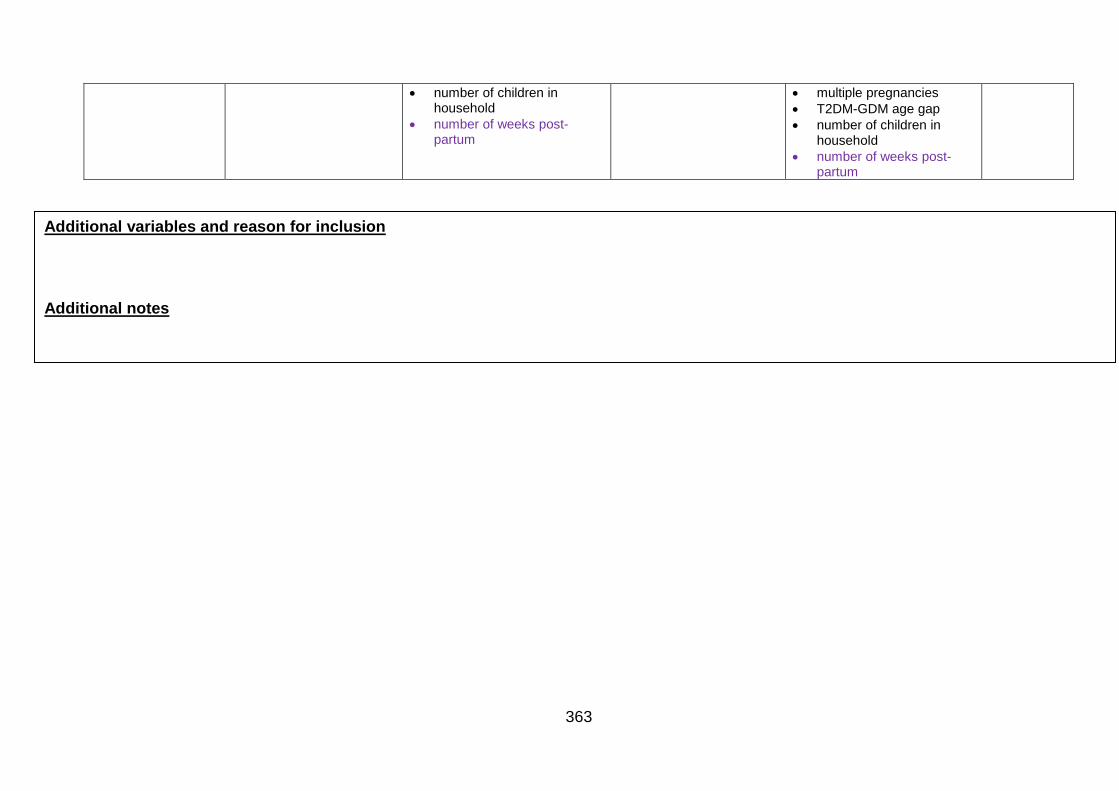
363
number of children in household
number of weeks post-partum
multiple pregnancies
T2DM-GDM age gap
number of children in household
number of weeks post-partum
Additional variables and reason for inclusion
Additional notes
364
Appendix 12: Determining which variables are mediators, competing exposures and confounders- additional example where gestational weight gain is also considered an exposure
Determining which variables are mediators, competing exposures and confounders for maternal anthropometrics at booking as an exposure and gestational age at delivery as an outcome.
Variable Column A: Precedes exposure maternal
anthropometrics at
booking
Column B: Precedes outcome
gestational age at
delivery
Column C: Follows
exposure maternal
anthropometrics at booking
Mediator/ confounder/ competing exposure
Place of birth X X - Confounder
Family history of diabetes
X X - Confounder
Maternal age X X - Confounder
Parity X X - Confounder
Marriage/cohabiting status
X X - Confounder
SES: Maternal education Maternal employment Paternal education Paternal employment IMD Housing tenure
X X X X X X
X X X X X X
- Confounder Confounder Confounder Confounder Confounder Confounder
Gestational week at booking
- X X Mediator
Maternal smoking status X X - Confounder
Length of residence in the country
X X - Confounder
Maternal alcohol consumption
X X - Confounder
Infant sex - X X Mediator
Environmental tobacco smoke
X X - Confounder
Maternal height X X - Confounder
GDM - X X Mediator
GWG - X X Mediator
History of GDM X X - Confounder
Note: Those variables that are in columns A and B are confounders, variables that are only in column B are competing exposures, and those that are in columns B and C are mediators
365
Determining which variables are mediators, competing exposures and confounders for GWG as an exposure and mode of delivery as an outcome.
Variable Column A: Precedes GWG
Column B: Precedes outcome
gestational age at
delivery
Column C: Follows
exposure GWG
Mediator/ confounder/ competing exposure
Place of birth X X - Confounder
Family history of diabetes
X X - Confounder
Maternal age X X - Confounder
Parity X X - Confounder
Marriage/cohabiting status
X X - Confounder
SES: Maternal education Maternal employment Paternal education Paternal employment IMD Housing tenure
X X X X X X
X X X X X X
- Confounder Confounder Confounder Confounder Confounder Confounder
Gestational week at booking
X X - Confounder
Maternal smoking status
X X - Confounder
Length of residence in the country
X X - Confounder
Maternal alcohol consumption
X X - Confounder
Infant sex - X X Mediator
Environmental tobacco smoke
X X - Confounder
Maternal anthropometrics at booking
X X - Confounder
Maternal height X X - Confounder
GDM - X X Mediator
History of GDM X X - Confounder
Note: Those variables that are in columns A and B are confounders, variables that are only in column B are competing exposures, and those that are in columns B and C are mediators The majority of GWG follows GDM diagnosis, therefore GDM has been considered as mediator
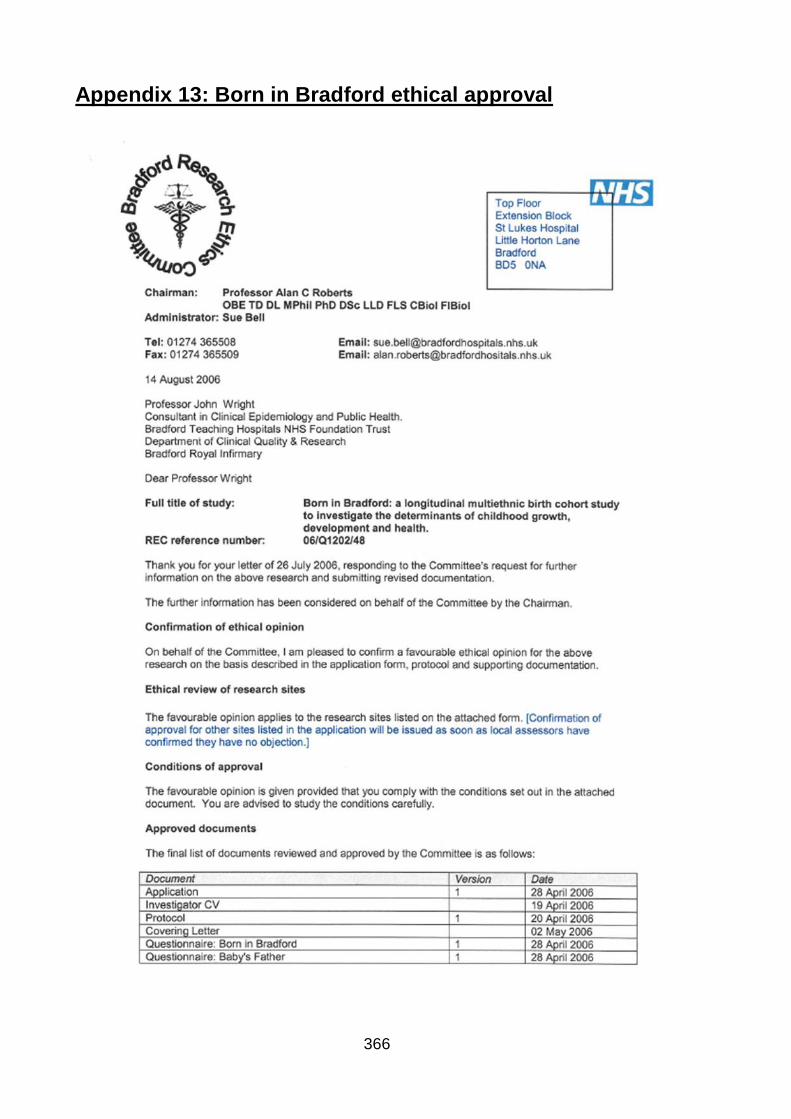
366
Appendix 13: Born in Bradford ethical approval
367
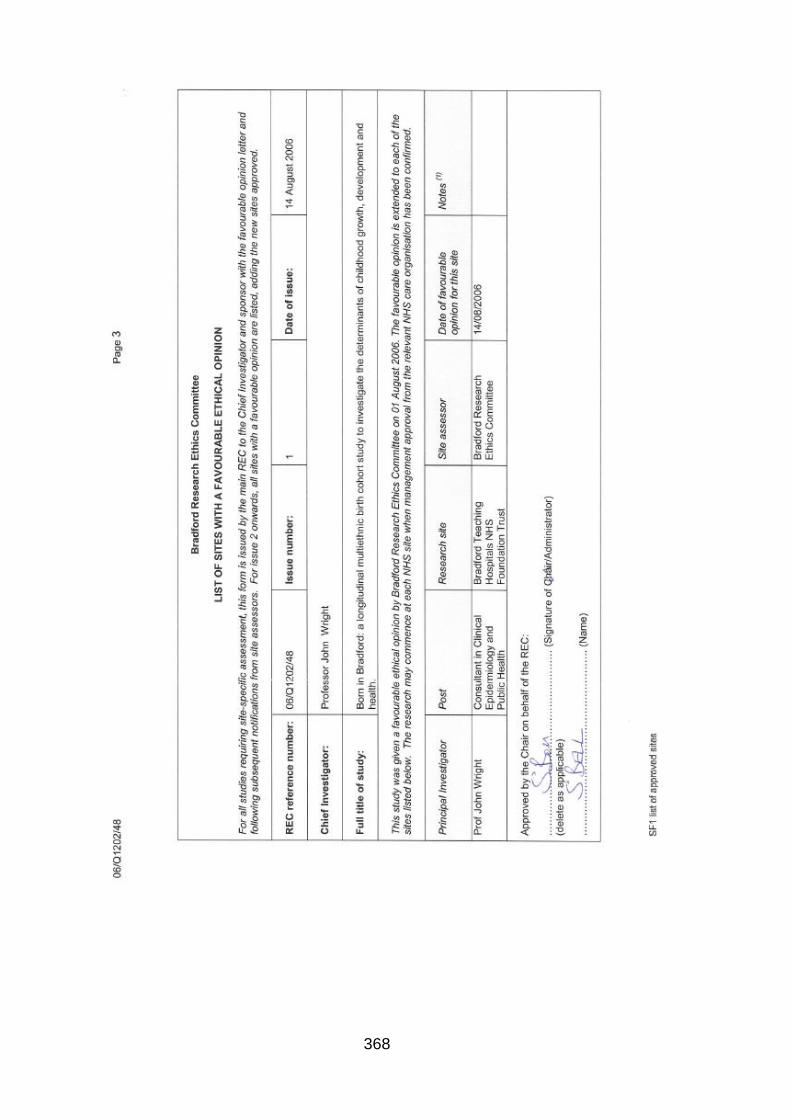
368
369
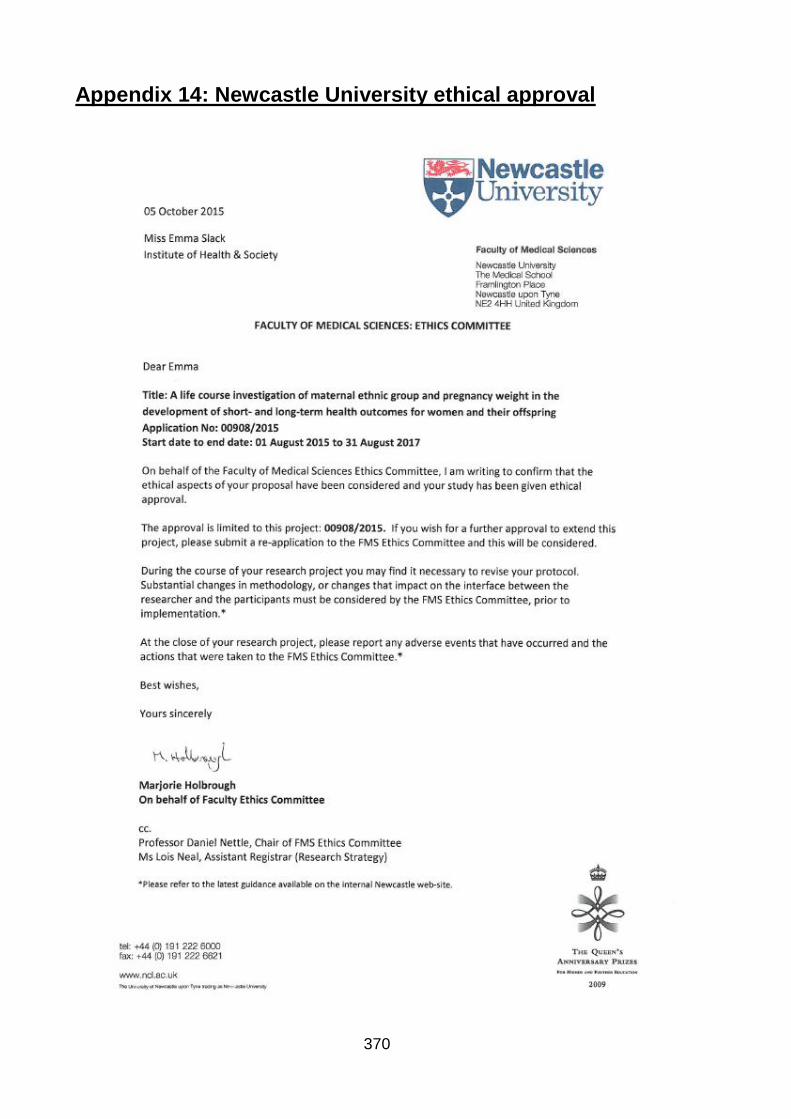
370
Appendix 14: Newcastle University ethical approval

371
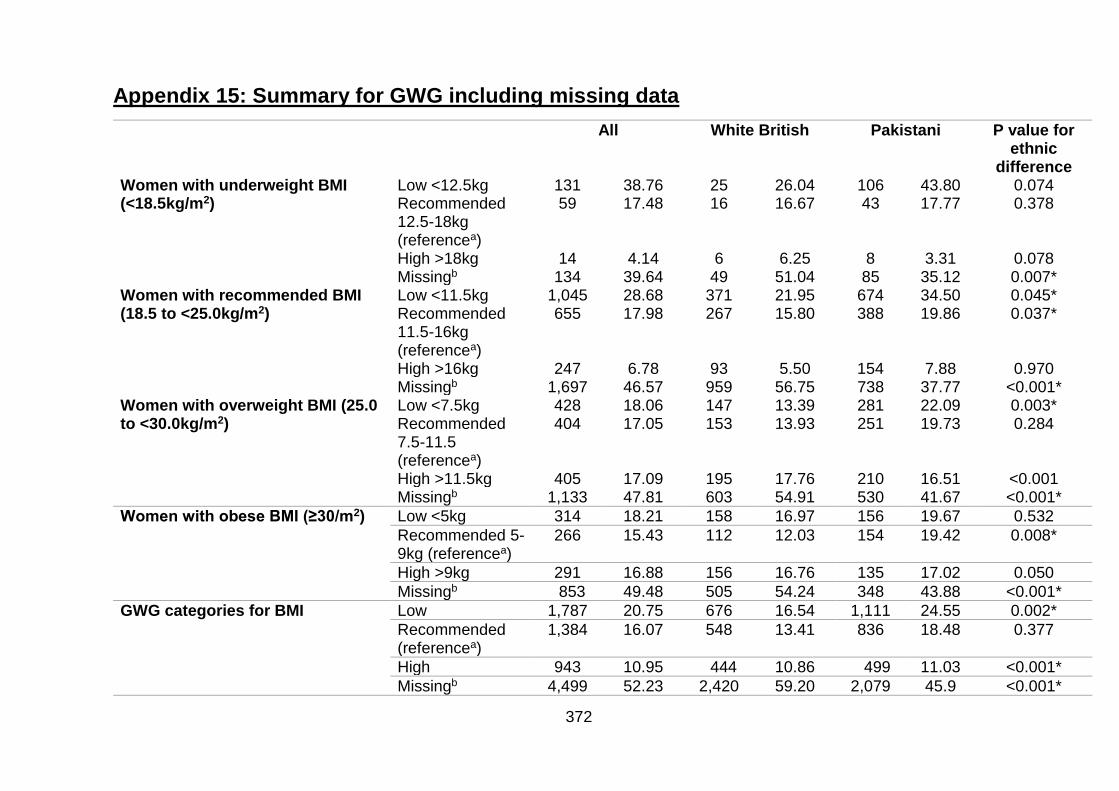
372
Appendix 15: Summary for GWG including missing data
All White British Pakistani P value for ethnic
difference Women with underweight BMI (<18.5kg/m2)
Low <12.5kg 131 38.76 25 26.04 106 43.80 0.074 Recommended 12.5-18kg (referencea)
59 17.48 16 16.67 43 17.77 0.378
High >18kg 14 4.14 6 6.25 8 3.31 0.078 Missingb 134 39.64 49 51.04 85 35.12 0.007*
Women with recommended BMI (18.5 to <25.0kg/m2)
Low <11.5kg 1,045 28.68 371 21.95 674 34.50 0.045* Recommended 11.5-16kg (referencea)
655 17.98 267 15.80 388 19.86 0.037*
High >16kg 247 6.78 93 5.50 154 7.88 0.970 Missingb 1,697 46.57 959 56.75 738 37.77 <0.001*
Women with overweight BMI (25.0 to <30.0kg/m2)
Low <7.5kg 428 18.06 147 13.39 281 22.09 0.003* Recommended 7.5-11.5 (referencea)
404 17.05 153 13.93 251 19.73 0.284
High >11.5kg 405 17.09 195 17.76 210 16.51 <0.001 Missingb 1,133 47.81 603 54.91 530 41.67 <0.001*
Women with obese BMI (≥30/m2) Low <5kg 314 18.21 158 16.97 156 19.67 0.532
Recommended 5-9kg (referencea)
266 15.43 112 12.03 154 19.42 0.008*
High >9kg 291 16.88 156 16.76 135 17.02 0.050
Missingb 853 49.48 505 54.24 348 43.88 <0.001*
GWG categories for BMI Low 1,787 20.75 676 16.54 1,111 24.55 0.002*
Recommended (referencea)
1,384 16.07 548 13.41 836 18.48 0.377
High 943 10.95 444 10.86 499 11.03 <0.001*
Missingb 4,499 52.23 2,420 59.20 2,079 45.9 <0.001*
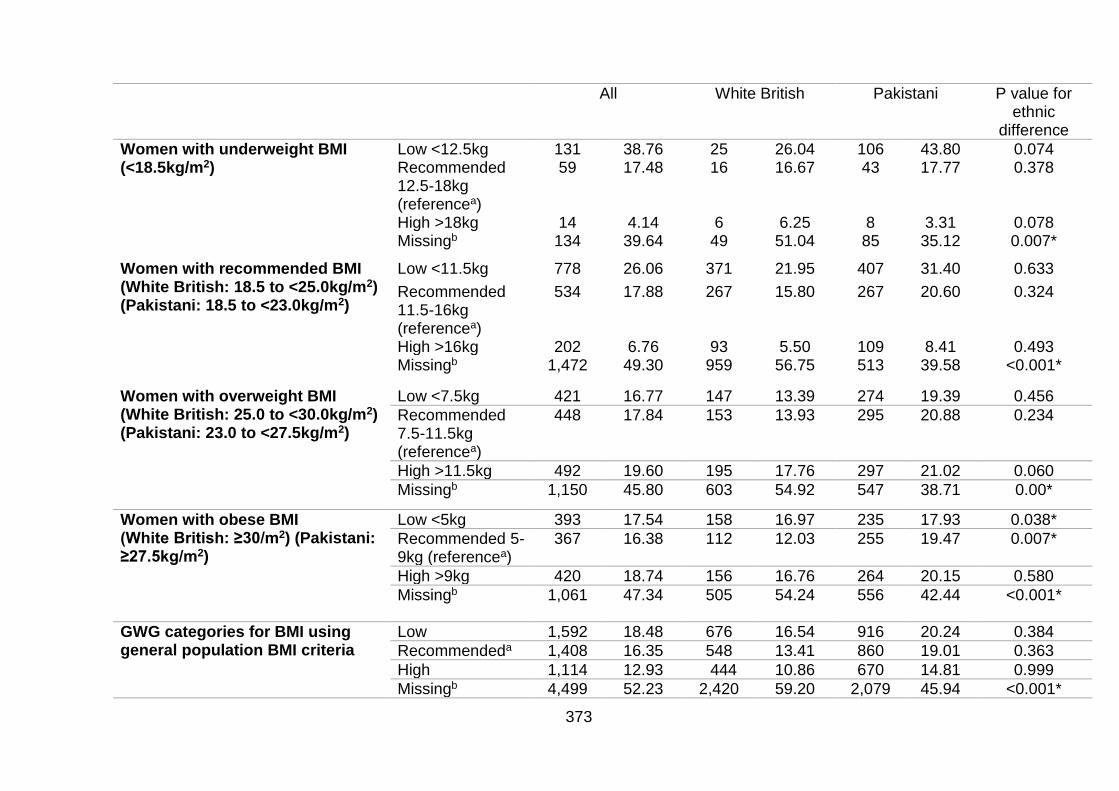
373
All White British Pakistani P value for ethnic
difference
Women with underweight BMI (<18.5kg/m2)
Low <12.5kg 131 38.76 25 26.04 106 43.80 0.074 Recommended 12.5-18kg (referencea)
59 17.48 16 16.67 43 17.77 0.378
High >18kg 14 4.14 6 6.25 8 3.31 0.078 Missingb 134 39.64 49 51.04 85 35.12 0.007*
Women with recommended BMI (White British: 18.5 to <25.0kg/m2) (Pakistani: 18.5 to <23.0kg/m2)
Low <11.5kg 778 26.06 371 21.95 407 31.40 0.633
Recommended 11.5-16kg (referencea)
534 17.88 267 15.80 267 20.60 0.324
High >16kg 202 6.76 93 5.50 109 8.41 0.493 Missingb 1,472 49.30 959 56.75 513 39.58 <0.001*
Women with overweight BMI (White British: 25.0 to <30.0kg/m2) (Pakistani: 23.0 to <27.5kg/m2)
Low <7.5kg 421 16.77 147 13.39 274 19.39 0.456
Recommended 7.5-11.5kg (referencea)
448 17.84 153 13.93 295 20.88 0.234
High >11.5kg 492 19.60 195 17.76 297 21.02 0.060
Missingb 1,150 45.80 603 54.92 547 38.71 0.00*
Women with obese BMI (White British: ≥30/m2) (Pakistani: ≥27.5kg/m2)
Low <5kg 393 17.54 158 16.97 235 17.93 0.038*
Recommended 5-9kg (referencea)
367 16.38 112 12.03 255 19.47 0.007*
High >9kg 420 18.74 156 16.76 264 20.15 0.580
Missingb 1,061 47.34 505 54.24 556 42.44 <0.001*
GWG categories for BMI using general population BMI criteria
Low 1,592 18.48 676 16.54 916 20.24 0.384
Recommendeda 1,408 16.35 548 13.41 860 19.01 0.363
High 1,114 12.93 444 10.86 670 14.81 0.999
Missingb 4,499 52.23 2,420 59.20 2,079 45.94 <0.001*
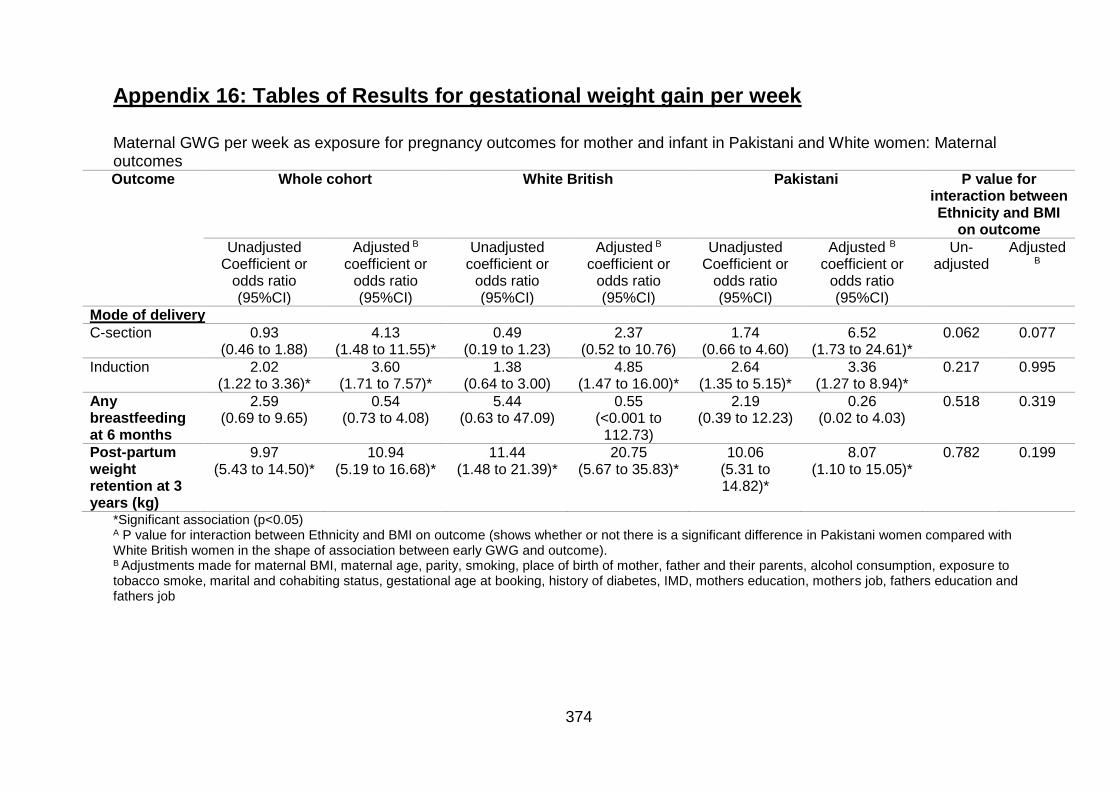
374
Appendix 16: Tables of Results for gestational weight gain per week
Maternal GWG per week as exposure for pregnancy outcomes for mother and infant in Pakistani and White women: Maternal outcomes Outcome Whole cohort White British Pakistani P value for
interaction between Ethnicity and BMI
on outcome
Unadjusted Coefficient or
odds ratio (95%CI)
Adjusted B coefficient or
odds ratio (95%CI)
Unadjusted coefficient or
odds ratio (95%CI)
Adjusted B coefficient or
odds ratio (95%CI)
Unadjusted Coefficient or
odds ratio (95%CI)
Adjusted B
coefficient or odds ratio (95%CI)
Un-adjusted
Adjusted
B
Mode of delivery
C-section 0.93 (0.46 to 1.88)
4.13 (1.48 to 11.55)*
0.49 (0.19 to 1.23)
2.37 (0.52 to 10.76)
1.74 (0.66 to 4.60)
6.52 (1.73 to 24.61)*
0.062 0.077
Induction 2.02 (1.22 to 3.36)*
3.60 (1.71 to 7.57)*
1.38 (0.64 to 3.00)
4.85 (1.47 to 16.00)*
2.64 (1.35 to 5.15)*
3.36 (1.27 to 8.94)*
0.217 0.995
Any breastfeeding at 6 months
2.59 (0.69 to 9.65)
0.54 (0.73 to 4.08)
5.44 (0.63 to 47.09)
0.55 (<0.001 to
112.73)
2.19 (0.39 to 12.23)
0.26 (0.02 to 4.03)
0.518 0.319
Post-partum weight retention at 3 years (kg)
9.97 (5.43 to 14.50)*
10.94 (5.19 to 16.68)*
11.44 (1.48 to 21.39)*
20.75 (5.67 to 35.83)*
10.06 (5.31 to 14.82)*
8.07 (1.10 to 15.05)*
0.782 0.199
*Significant association (p<0.05) A P value for interaction between Ethnicity and BMI on outcome (shows whether or not there is a significant difference in Pakistani women compared with White British women in the shape of association between early GWG and outcome). B Adjustments made for maternal BMI, maternal age, parity, smoking, place of birth of mother, father and their parents, alcohol consumption, exposure to tobacco smoke, marital and cohabiting status, gestational age at booking, history of diabetes, IMD, mothers education, mothers job, fathers education and fathers job
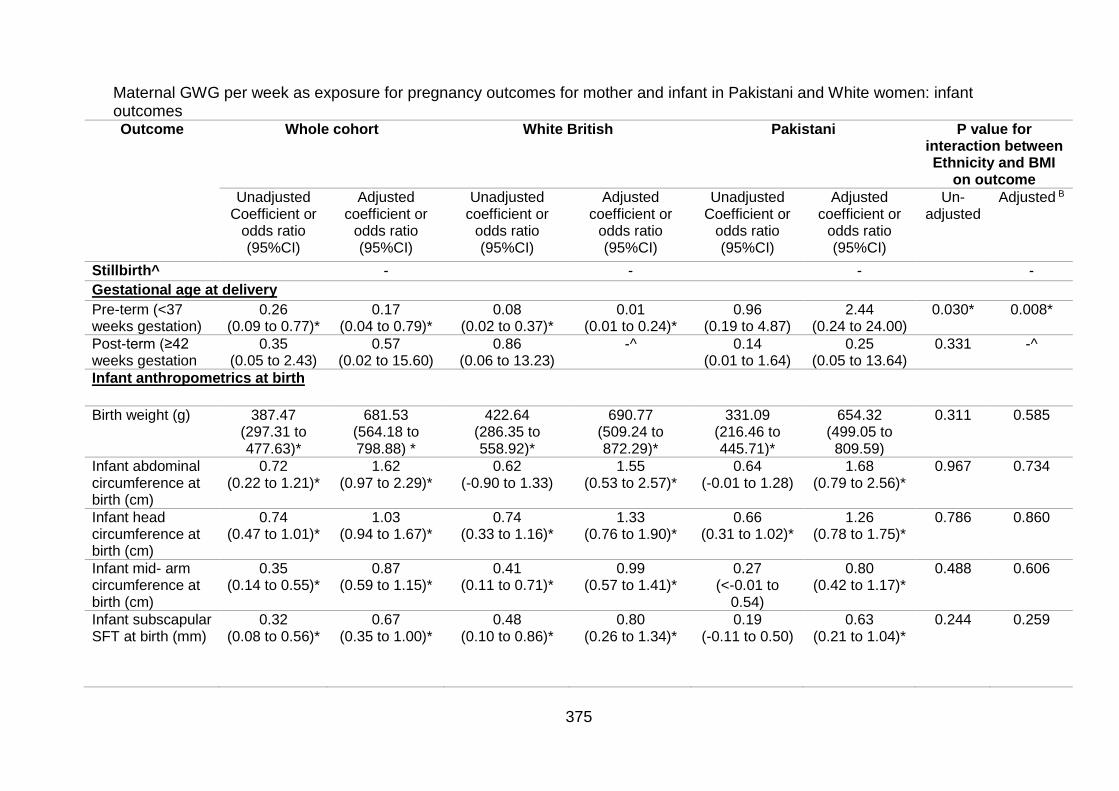
375
Maternal GWG per week as exposure for pregnancy outcomes for mother and infant in Pakistani and White women: infant outcomes Outcome Whole cohort White British Pakistani P value for
interaction between Ethnicity and BMI
on outcome
Unadjusted Coefficient or
odds ratio (95%CI)
Adjusted coefficient or
odds ratio (95%CI)
Unadjusted coefficient or
odds ratio (95%CI)
Adjusted coefficient or
odds ratio (95%CI)
Unadjusted Coefficient or
odds ratio (95%CI)
Adjusted coefficient or
odds ratio (95%CI)
Un-adjusted
Adjusted B
Stillbirth^ - - - -
Gestational age at delivery
Pre-term (<37 weeks gestation)
0.26 (0.09 to 0.77)*
0.17 (0.04 to 0.79)*
0.08 (0.02 to 0.37)*
0.01 (0.01 to 0.24)*
0.96 (0.19 to 4.87)
2.44 (0.24 to 24.00)
0.030* 0.008*
Post-term (≥42 weeks gestation
0.35 (0.05 to 2.43)
0.57 (0.02 to 15.60)
0.86 (0.06 to 13.23)
-^
0.14 (0.01 to 1.64)
0.25 (0.05 to 13.64)
0.331 -^
Infant anthropometrics at birth
Birth weight (g) 387.47 (297.31 to 477.63)*
681.53 (564.18 to 798.88) *
422.64 (286.35 to 558.92)*
690.77 (509.24 to 872.29)*
331.09 (216.46 to 445.71)*
654.32 (499.05 to 809.59)
0.311 0.585
Infant abdominal circumference at birth (cm)
0.72 (0.22 to 1.21)*
1.62 (0.97 to 2.29)*
0.62 (-0.90 to 1.33)
1.55 (0.53 to 2.57)*
0.64 (-0.01 to 1.28)
1.68 (0.79 to 2.56)*
0.967 0.734
Infant head circumference at birth (cm)
0.74 (0.47 to 1.01)*
1.03 (0.94 to 1.67)*
0.74 (0.33 to 1.16)*
1.33 (0.76 to 1.90)*
0.66 (0.31 to 1.02)*
1.26 (0.78 to 1.75)*
0.786 0.860
Infant mid- arm circumference at birth (cm)
0.35 (0.14 to 0.55)*
0.87 (0.59 to 1.15)*
0.41 (0.11 to 0.71)*
0.99 (0.57 to 1.41)*
0.27 (<-0.01 to
0.54)
0.80 (0.42 to 1.17)*
0.488 0.606
Infant subscapular SFT at birth (mm)
0.32 (0.08 to 0.56)*
0.67 (0.35 to 1.00)*
0.48 (0.10 to 0.86)*
0.80 (0.26 to 1.34)*
0.19 (-0.11 to 0.50)
0.63 (0.21 to 1.04)*
0.244 0.259
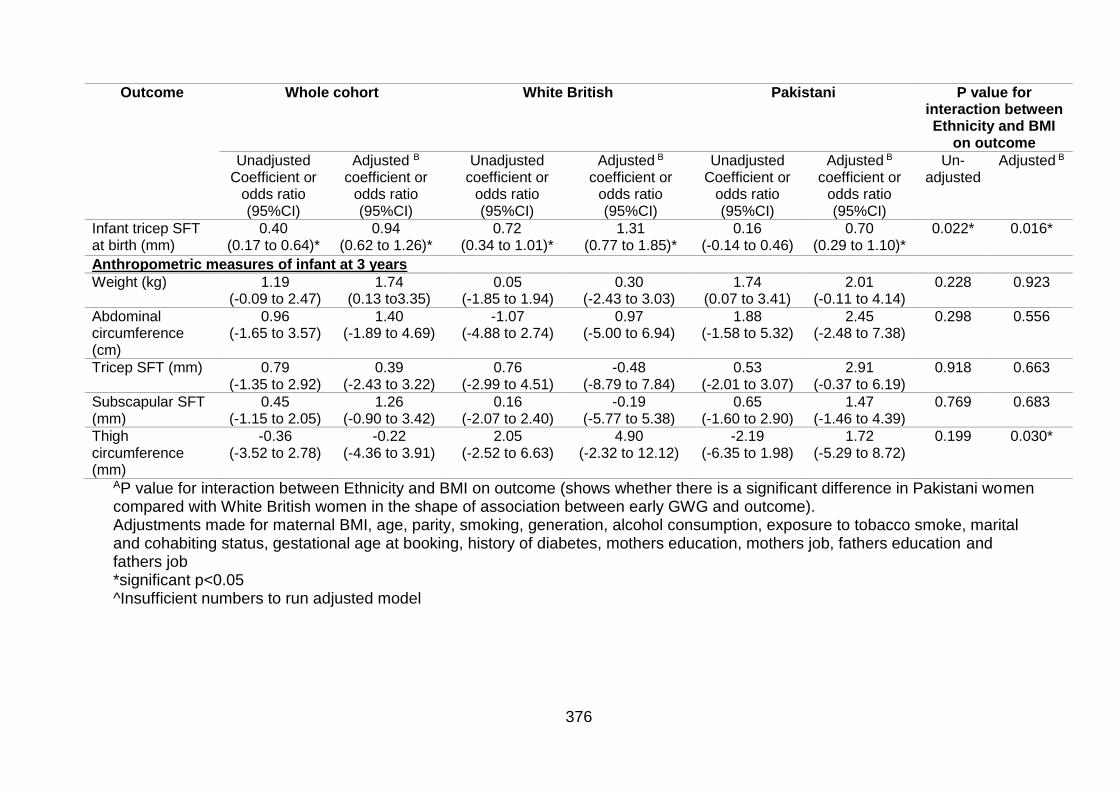
376
Outcome Whole cohort White British Pakistani P value for interaction between Ethnicity and BMI
on outcome
Unadjusted Coefficient or
odds ratio (95%CI)
Adjusted B
coefficient or odds ratio (95%CI)
Unadjusted coefficient or
odds ratio (95%CI)
Adjusted B coefficient or
odds ratio (95%CI)
Unadjusted Coefficient or
odds ratio (95%CI)
Adjusted B coefficient or
odds ratio (95%CI)
Un-adjusted
Adjusted B
Infant tricep SFT at birth (mm)
0.40 (0.17 to 0.64)*
0.94 (0.62 to 1.26)*
0.72 (0.34 to 1.01)*
1.31 (0.77 to 1.85)*
0.16 (-0.14 to 0.46)
0.70 (0.29 to 1.10)*
0.022* 0.016*
Anthropometric measures of infant at 3 years
Weight (kg) 1.19 (-0.09 to 2.47)
1.74 (0.13 to3.35)
0.05 (-1.85 to 1.94)
0.30 (-2.43 to 3.03)
1.74 (0.07 to 3.41)
2.01 (-0.11 to 4.14)
0.228 0.923
Abdominal circumference (cm)
0.96 (-1.65 to 3.57)
1.40 (-1.89 to 4.69)
-1.07 (-4.88 to 2.74)
0.97 (-5.00 to 6.94)
1.88 (-1.58 to 5.32)
2.45 (-2.48 to 7.38)
0.298 0.556
Tricep SFT (mm) 0.79 (-1.35 to 2.92)
0.39 (-2.43 to 3.22)
0.76 (-2.99 to 4.51)
-0.48 (-8.79 to 7.84)
0.53 (-2.01 to 3.07)
2.91 (-0.37 to 6.19)
0.918 0.663
Subscapular SFT (mm)
0.45 (-1.15 to 2.05)
1.26 (-0.90 to 3.42)
0.16 (-2.07 to 2.40)
-0.19 (-5.77 to 5.38)
0.65 (-1.60 to 2.90)
1.47 (-1.46 to 4.39)
0.769 0.683
Thigh circumference (mm)
-0.36 (-3.52 to 2.78)
-0.22 (-4.36 to 3.91)
2.05 (-2.52 to 6.63)
4.90 (-2.32 to 12.12)
-2.19 (-6.35 to 1.98)
1.72 (-5.29 to 8.72)
0.199 0.030*
AP value for interaction between Ethnicity and BMI on outcome (shows whether there is a significant difference in Pakistani women compared with White British women in the shape of association between early GWG and outcome). Adjustments made for maternal BMI, age, parity, smoking, generation, alcohol consumption, exposure to tobacco smoke, marital and cohabiting status, gestational age at booking, history of diabetes, mothers education, mothers job, fathers education and fathers job *significant p<0.05 ^Insufficient numbers to run adjusted model
377
References
1. World Health Organisation. Obesity and overweight 2018 [updated 16th February 2018. Available from: http://www.who.int/news-room/fact-sheets/detail/obesity-and-overweight]. 2. Guh DP, Zhang W, Bansback N, Amarsi Z, Birmingham CL, Anis AH. The incidence of co-morbidities related to obesity and overweight: a systematic review and meta-analysis. BMC Public Health. 2009;9(1):88. 3. World Health Organisation. Obesity: Preventing and Managing the Global Epidemic. Geneva 2000. 4. Taylor PD, Poston L. Developmental programming of obesity in mammals. Experimental Physiology. 2007;92(2):287-98. 5. National Institute for Health and Care Excellence. Obesity: identification, assessment and management of overweight and obesity in children, young people and adults: National Institute for Health and Care Excellence; 2014 [Available from: http://www.nice.org.uk/guidance/cg189/resources/guidance-obesity-identification-assessment-and-management-of-overweight-and-obesity-in-children-young-people-and-adults-pdf]. 6. National Institute for Health and Care Excellence. Weight management: lifestyle services for overweight or obese children and young people 2013 [updated October 2013]. 7. National Obesity Observatory. A simple guide to classifying body mass index in children. 2011. 8. World Health Organization. Infertility definitions and terminology 2018 [updated 2018. Available from: http://www.who.int/reproductivehealth/topics/infertility/definitions/en/]. 9. Finucane MM, Stevens GA, Cowan MJ, Danaei G, Lin JK, Paciorek CJ, et al. National, regional, and global trends in body-mass index since 1980: systematic analysis of health examination surveys and epidemiological studies with 960 country-years and 9· 1 million participants. The Lancet. 2011;377(9765):557-67. 10. Cancer Research UK. Overweight and obesity statistics 2016 [Available from: https://www.cancerresearchuk.org/health-professional/cancer-statistics/risk/overweight-and-obesity#heading-Two]. 11. Reilly JJ, Kelly J. Long-term impact of overweight and obesity in childhood and adolescence on morbidity and premature mortality in adulthood: systematic review. International Journal of Obesity. 2011;35(7):891. 12. Health and Social Care Information Centre Lifestyle Statistics. Statistics on Obesity, Physical Activity and Diet: England, 2014 2013 [Available from: https://catalogue.ic.nhs.uk/publications/public-health/obesity/obes-phys-acti-diet-eng-2013/obes-phys-acti-diet-eng-2013-rep.pdf. 13. NHS Digital. Statistics on Obesity, Physical Activity and Diet In: Digital N, editor. 2018. 14. NHS Digital. National Child Measurement Programme - England, 2016-17 2018 [Available from: https://digital.nhs.uk/data-and-information/publications/statistical/national-child-measurement-programme/2016-17-school-year]. 15. NHS Digital. National Child Measurement Programme, Results from the 2006-2007 school year 2008 [Available from: https://digital.nhs.uk/data-and-information/publications/statistical/national-child-measurement-programme/2006-07-school-year].
378
16. Butland B, Jebb S, Kopelman P, McPherson K, Thomas S, Mardell J, et al. Foresight. Tackling obesities: future choices. Project report. London: Government Office for Science 2007. 17. Tremmel M, Gerdtham U-G, Nilsson PM, Saha S. Economic burden of obesity: a systematic literature review. International Journal of Environmental Research and Public Health. 2017;14(4):435. 18. Su W, Huang J, Chen F, Iacobucci W, Mocarski M, Dall TM, et al. Modeling the clinical and economic implications of obesity using microsimulation. Journal of Medical Economics. 2015;18(11):886-97. 19. Wang YC, McPherson K, Marsh T, Gortmaker SL, Brown M. Health and economic burden of the projected obesity trends in the USA and the UK. The Lancet. 2011;378(9793):815-25. 20. World Health Organisation. Glossary of terms used 2018 [Available from: https://www.who.int/hia/about/glos/en/index1.html]. 21. Law C, Power C, Graham H, Merrick D. Obesity and health inequalities. Obesity Reviews. 2007;8(s1):19-22. 22. Public Health England. Patterns and trends in adult obesity 2017 [Available from: https://app.box.com/s/og3q86aqejc99okxe9xyvpfvo21xai21/file/256370456621]. 23. Public Health England. Patterns and trends in child obesity 2018 [Available from: https://app.box.com/s/og3q86aqejc99okxe9xyvpfvo21xai21/file/311350142247]. 24. Public Health England. Overweight Children 2018 [Available from: https://www.ethnicity-facts-figures.service.gov.uk/health/preventing-illness/overweight-children/latest#]. 25. Wells JCK. Ethnic variability in adiposity, thrifty phenotypes and cardiometabolic risk: addressing the full range of ethnicity, including those of mixed ethnicity. Obesity Reviews. 2012;13(S2):14-29. 26. Public Health England. Health inequalities 2014 [updated 2014. Available from: http://www.noo.org.uk/NOO_about_obesity/inequalities]. 27. Health and Social Care Information Centre. Health Survey for England 2004: The Health of Minority Ethnic Groups– headline tables. 2005. 28. Power C, Manor O, Matthews S. Child to adult socioeconomic conditions and obesity in a national cohort. International Journal of Obesity. 2003;27(9):1081-6. 29. Stamatakis E, Primatesta P, Chinn S, Rona R, Falascheti E. Overweight and obesity trends from 1974 to 2003 in English children: what is the role of socioeconomic factors? Archives of Disease in Childhood. 2005;90(10):999-1004. 30. Baker C. Obesity Statistics. House of Commons Library; 2018. 31. Rimmer JH, Wang E, Yamaki K, Davis B. Documenting disparities in obesity and disability. Focus: A Publication of the National Center for the Dissemination of Disability Research (NCDDR). 2010;24:1-16. 32. Child and Maternal Health Observatory. Disability and obesity: the prevalence of obesity in disabled children. 2011. 33. Chen AY, Kim SE, Houtrow AJ, Newacheck PW. Prevalence of obesity among children with chronic conditions. Obesity. 2010;18(1):210-3. 34. Dahlgren G, Whitehead M. Policies and strategies to promote social equity in health. Stockholm: Institute for Future Studies. 1991. 35. Public Health England. Causes of Obesity 2014 [updated 2014. Available from: http://www.noo.org.uk/NOO_about_obesity/causes].
379
36. Forsdahl A. Are poor living conditions in childhood and adolescence an important risk factor for arteriosclerotic heart disease? British Journal of Preventive & Social Medicine. 1977;31(2):91-5. 37. Barker DJP, Osmond C. Infant mortality, childhood nutrition, and ischaemic heart disease in England and Wales. The Lancet. 1986;327(8489):1077-81. 38. Barker DJ, Bull AR, Osmond C, Simmonds SJ. Fetal and placental size and risk of hypertension in adult life. BMJ. 1990;301(6746):259-62. 39. Barker DJP, Godfrey KM, Gluckman PD, Harding JE, Owens JA, Robinson JS. Fetal nutrition and cardiovascular disease in adult life. The Lancet. 1993;341(8850):938-41. 40. Barker DJP. Fetal origins of coronary heart disease. BMJ. 1995;311(6998):171-4. 41. Curhan GC, Chertow GM, Willett WC, Spiegelman D, Colditz GA, Manson JE, et al. Birth weight and adult hypertension and obesity in women. Circulation. 1996;94(6):1310-5. 42. Rogers I. Birth weight and obesity and fat distribution in later life. Birth Defects Research Part A: Clinical and Molecular Teratology. 2005;73(7):485-6. 43. World Health Organisation. WHO Expert Consultation: Appropriate body-mass index for Asian populations and its implications for policy and intervention strategies. The Lancet. 2004;363:157-63. 44. Heslehurst N. Symposium I: Consequences of obesity and overweight during pregnancy identifying ‘at risk’ women and the impact of maternal obesity on National Health Service maternity services. Proceedings of the Nutrition Society. 2011;70(4):439-49. 45. National Institute for Health and Clinical Excellence. Weight Management Before, During and After Pregnancy. London Department of Health; 2010. 46. Centre for Maternal and Child Enquiries, Royal College of Obstetricians and Gynaecologists. CMACE/RCOG Joint Guideline: Management of Women With Obesity in Pregnancy. Jointly published by the Centre for Maternal and Child Enquiries and the Royal College of Obstetricians and Gynaecologists; 2010. 47. National Institute for Health and Clinical Excellence. Weight Management Before, During and After Pregnancy. Department of Health; 2010 48. Society of Obstetricians and Gynaecologists of Canada (SOGC). Clinical Practice Guideline No. 239: Obesity in Pregnancy. Journal of Obstetrics and Gynaecology Canada. 2010;239:165-73. 49. Maternity & Newborn Clinical Network. Statewide Clinical Guideline: Care of the Obese Pregnant Woman and Weight Management in Pregnancy. Victoria, Australia, 2011. 50. Institute of Obstetricians and Gynaecologists, Health Service Executive. Obesity and Pregnancy Clinical Practice Guideline. Ireland, ; 2011. 51. National Institute for Health and Care Excellence. Considering an update of the public health guidance on "Weight management before, during and after pregnancy" (PH27): National Institute for Health and Care Excellence; 2013 [Available from: https://www.nice.org.uk/guidance/ph27/documents/weight-management-before-during-and-after-pregnancy-review-proposal-consultation-document2]. 52. Bhattacharya S, Campbell DM, Liston WA, Bhattacharya S. Effect of Body Mass Index on pregnancy outcomes in nulliparous women delivering singleton babies. BMC Public Health. 2007;7(1):168. 53. Scholz R, Voigt M, Schneider KTM, Rochow N, Hagenah HP, Hesse V, et al. Analysis of the German perinatal survey of the years 2007–2011 and comparison
380
with data from 1995–1997: maternal characteristics. Geburtshilfe und Frauenheilkunde. 2013;73(12):1247-51. 54. Brynhildsen J, Sydsjö A, Ekholm-Selling K, Josefsson A. The importance of maternal BMI on infant's birth weight in four BMI groups for the period 1978–2001. Acta Obstetricia et Gynecologica Scandinavica. 2009;88(4):391-6. 55. Kanagalingam MG, Forouhi NG, Greer IA, Sattar N. Changes in booking body mass index over a decade: retrospective analysis from a Glasgow Maternity Hospital. BJOG: An International Journal of Obstetrics & Gynaecology. 2005;112(10):1431-3. 56. Fisher SC, Kim SY, Sharma AJ, Rochat R, Morrow B. Is obesity still increasing among pregnant women? Prepregnancy obesity trends in 20 states, 2003–2009. Preventive Medicine. 2013;56(6):372-8. 57. Hinkle SN, Sharma AJ, Kim SY, Park S, Dalenius K, Brindley PL, et al. Prepregnancy obesity trends among low-income women, United States, 1999–2008. Maternal and Child Health Journal. 2012;16(7):1339-48. 58. Centre for Maternal and Child Enquiries. Maternal obesity in the UK: Findings from a national project. London: Centre for Maternal and Child Enquiries; 2010. 59. Heslehurst N, Rankin J, Wilkinson JR, Summerbell CD. A nationally representative study of maternal obesity in England, UK: trends in incidence and demographic inequalities in 619 323 births, 1989–2007. International Journal of Obesity. 2010;34(3):420-8. 60. Usha Kiran TS, Hemmadi S, Bethel J, Evans J. Outcome of pregnancy in a woman with an increased body mass index. BJOG: an International Journal of Obstetrics & Gynaecology. 2005;112(6):768-72. 61. National Maternity and Perinatal Audit Project Team. National Maternity and Perinatal Audit: Clinical Report 2017. London: Royal College of Obstetricians and Gynaecologists 2018. 62. Andreasen KR, Andersen ML, Schantz AL. Obesity and pregnancy. Acta Obstetricia et Gynecologica Scandinavica. 2004;83(11):1022-9. 63. Morin KH. Perinatal outcomes of obese women: a review of the literature. Journal of Obstetric, Gynecologic, & Neonatal Nursing. 1998;27(4):431-40. 64. Guelinckx I, Devlieger R, Beckers K, Vansant G. Maternal obesity: pregnancy complications, gestational weight gain and nutrition. Obesity Reviews. 2008;9(2):140-50. 65. Centre for Maternal and Child Enquiries (CMACE). Saving Mothers’ Lives: reviewing maternal deaths to make motherhood safer: 2006–08. The Eighth Report on Confidential Enquiries into Maternal Deaths in the United Kingdom. BJOG: an International Journal of Obstetrics & Gynaecology 2011;118(Supplement 1):1-203 66. Norman JE, Reynolds R. The consequences of obesity and excess weight gain in pregnancy. Proceedings of the Nutrition Society. 2011;70(04):450-6. 67. Frederick IO, Williams MA, Sales AE, Martin DP, Killien M. Pre-pregnancy body mass index, gestational weight gain, and other maternal characteristics in relation to infant birth weight. Maternal and Child Health Journal. 2008;12(5):557-67. 68. The Confidential Enquiry into Maternal and Child Health. The Confidential Enquiry into Maternal and Child Health (CEMACH) Saving mothers' lives: reviewing maternal deaths to make motherhood safer-2003-2005 In: CEMACH, editor. London: The Confidential Enquiry into Maternal and Child Health; 2007. 69. Poobalan AS, Aucott LS, Gurung T, Smith WCS, Bhattacharya S. Obesity as an independent risk factor for elective and emergency caesarean delivery in
nulliparous women–systematic review and meta‐analysis of cohort studies.
Obesity Reviews. 2009;10(1):28-35.
381
70. Heslehurst N, Simpson H, Ells LJ, Rankin J, Wilkinson J, Lang R, et al. The
impact of maternal BMI status on pregnancy outcomes with immediate short‐term
obstetric resource implications: a meta‐analysis. Obesity Reviews. 2008;9(6):635-
83. 71. National Institute for Health and Clinical Excellence. Diabetes in Pregnancy: management of diabetes and its complications from preconception to the postnatal period. London: RCOG Press; 2008. 72. Torloni MR, Betrán AP, Horta BL, Nakamura MU, Atallah AN, Moron AF, et al. Prepregnancy BMI and the risk of gestational diabetes: a systematic review of the literature with meta-analysis. Obesity Reviews. 2009;10(2):194-203. 73. Bellamy L, Casas J-P, Hingorani AD, Williams D. Type 2 diabetes mellitus after gestational diabetes: a systematic review and meta-analysis. The Lancet. 2009;373(9677):1773-9. 74. Aune D, Saugstad OD, Henriksen T, Tonstad S. Maternal Body Mass Index and the Risk of Fetal Death, Stillbirth, and Infant Death: A Systematic Review and Meta-analysis. JAMA. 2014;311(15):1536-46. 75. Arrowsmith S, Wray S, Quenby S. Maternal obesity and labour complications following induction of labour in prolonged pregnancy. BJOG: An International Journal of Obstetrics and Gynaecology. 2011;118(5):578-88. 76. Bogaerts A, Witters I, Van den Bergh BR, Jans G, Devlieger R. Obesity in pregnancy: altered onset and progression of labour. Midwifery. 2013;29(12):1303-13. 77. Caughey AB, Stotland NE, Washington AE, Escobar GJ. Who is at risk for prolonged and postterm pregnancy? American Journal of Obstetrics and Gynecology. 2009;200(6):683.e1-.e5. 78. Denison FC, Price J, Graham C, Wild S, Liston WA. Maternal obesity, length of gestation, risk of postdates pregnancy and spontaneous onset of labour at term. BJOG: An International Journal of Obstetrics & Gynaecology. 2008;115(6):720-5. 79. Heslehurst N, Simpson H, Ells LJ, Rankin J, Wilkinson J, Lang R, et al. The impact of maternal BMI status on pregnancy outcomes with immediate short-term obstetric resource implications: a meta-analysis. Obesity Reviews. 2008;9(6):635-83. 80. Khashan AS, Kenny LC. The effects of maternal body mass index on pregnancy outcome. European Journal of Epidemiology. 2009;24(11):697-705. 81. Knight M, Kurinczuk JJ, Spark P, Brocklehurst P. Extreme obesity in pregnancy in the United Kingdom. Obstetrics & Gynecology. 2010;115(5):989-97. 82. Nohr EA, Timpson NJ, Andersen CS, Smith GD, Olsen J, Sorensen TIA. Severe obesity in young women and reproductive health: The Danish National Birth Cohort. PLoS ONE. 2009;4(12). 83. Siozos C, Stanley KP. Prolonged pregnancy. Current Obstetrics & Gynaecology. 2005;15(2):73-9. 84. Heslehurst N, Vieira R, Hayes L, Crowe L, Jones D, Robalino S, et al. Maternal body mass index and post-term birth: a systematic review and meta-analysis. Obesity Reviews. 2016. 85. Stothard KJ, Tennant PWG, Bell R, Rankin J. Maternal overweight and obesity and the risk of congenital anomalies: a systematic review and meta-analysis. JAMA. 2009;301(6):636-50. 86. Rankin J, Tennant PWG, Stothard KJ, Bythell M, Summerbell CD, Bell R. Maternal body mass index and congenital anomaly risk: a cohort study. International Journal of Obesity. 2010;34(9):1371-80. 87. Yazdani S, Yosofniyapasha Y, Nasab BH, Mojaveri MH, Bouzari Z. Effect of maternal body mass index on pregnancy outcome and newborn weight. BMC Research Notes. 2012;5:34.
382
88. McDonald SD, Han Z, Mulla S, Beyene J, Knowledge Synth G. Overweight and obesity in mothers and risk of preterm birth and low birth weight infants: systematic review and meta-analyses. BMJ. 2010;341. 89. Ramachenderan J, Bradford J, McLean M. Maternal obesity and pregnancy complications: a review. Australian and New Zealand Journal of Obstetrics and Gynaecology. 2008;48(3):228-35. 90. Heslehurst N, Lang R, Rankin J, Wilkinson JR, Summerbell CD. Obesity in pregnancy: a study of the impact of maternal obesity on NHS maternity services. BJOG: An International Journal of Obstetrics & Gynaecology. 2007;114(3):334-42. 91. Molyneaux E, Poston L, Ashurst-Williams S, Howard LM. Obesity and mental disorders during pregnancy and postpartum: a systematic review and meta-analysis. Obstetrics and Gynecology. 2014;123(4):857. 92. Cnattingius S, Bergström R, Lipworth L, Kramer MS. Prepregnancy weight and the risk of adverse pregnancy outcomes. New England Journal of Medicine. 1998;338(3):147-52. 93. Viswanathan M, Siega-Riz AM, Moos M-K, Deierlein A, Mumford S, Knaack J, et al. Outcomes of maternal weight gain. Evidence Report/Technology Assessment. 2008. 94. Institute of Medicine. Weight Gain During Pregnancy: Reexamining the Guidelines. Yaktine A, Rasmussen K, editors. Washington DC: National Academic Press; 2009. 95. Kominiarek MA, Peaceman AM. Gestational weight gain. American journal of obstetrics and gynecology. 2017. 96. Thangaratinam S, Jolly K. Obesity in pregnancy: a review of reviews on the effectiveness of interventions. BJOG: An International Journal of Obstetrics & Gynaecology. 2010;117(11):1309-12. 97. Goldstein RF, Abell SK, Ranasinha S, et al. Association of gestational weight gain with maternal and infant outcomes: A systematic review and meta-analysis. JAMA. 2017;317(21):2207-25. 98. Deputy NP, Sharma AJ, Kim SY. Gestational weight gain—United States, 2012 and 2013. MMWR Morbidity and mortality weekly report. 2015;64(43):1215. 99. Tovar A, Must A, Bermudez OI, Hyatt RR, Chasan-Taber L. The impact of gestational weight gain and diet on abnormal glucose tolerance during pregnancy in Hispanic women. Maternal and Child Health Journal. 2009;13(4):520-30. 100. Herring SJ, Oken E, Rifas-Shiman SL, Rich-Edwards JW, Stuebe AM, Kleinman KP, et al. Weight gain in pregnancy and risk of maternal hyperglycemia. American Journal of Obstetrics and Gynecology. 2009;201(1):61. e1-. e7. 101. Swank ML, Marshall NE, Caughey AB, Main EK, Gilbert WM, Melsop KA, et al. Pregnancy Outcomes in the Super Obese, Stratified by Weight Gain Above and Below Institute of Medicine Guidelines. Obstetrics & Gynecology. 2014. 102. Li N, Liu E, Guo J, Pan L, Li B, Wang P, et al. Maternal prepregnancy body mass index and gestational weight gain on pregnancy outcomes. PloS One. 2013;8(12):e82310. 103. Margerison Zilko CE, Rehkopf D, Abrams B. Association of maternal gestational weight gain with short-and long-term maternal and child health outcomes. American Journal of Obstetrics and Gynecology. 2010;202(6):574. e1-. e8. 104. Mamun AA, Callaway LK, O'Callaghan MJ, Williams GM, Najman JM, Alati R, et al. Associations of maternal pre-pregnancy obesity and excess pregnancy weight gains with adverse pregnancy outcomes and length of hospital stay. BMC Pregnancy and Childbirth. 2011;11(1):62.
383
105. Siega-Riz AM, Viswanathan M, Moos M-K, Deierlein A, Mumford S, Knaack J, et al. A systematic review of outcomes of maternal weight gain according to the Institute of Medicine recommendations: birthweight, fetal growth, and postpartum weight retention. American Journal of Obstetrics and Gynecology. 2009;201(4):339. e1-. e14. 106. Dietz PM, Callaghan WM, Sharma AJ. High pregnancy weight gain and risk of excessive fetal growth. American Journal of Obstetrics and Gynecology. 2009;201(1):51. e1-. e6.
107. Stamnes Koepp UM, Frost Andersen L, Dahl‐Joergensen K, Stigum H, Nass
O, Nystad W. Maternal pre‐pregnant body mass index, maternal weight change and
offspring birthweight. Acta Obstetricia et Gynecologica Scandinavica. 2012;91(2):243-9. 108. Moreira P, Padez C, Mourao-Carvalhal I, Rosado V. Maternal weight gain during pregnancy and overweight in Portuguese children. International Journal of Obesity. 2007;31(4):608-14. 109. Ogunyemi D, Hullett S, Leeper J, Risk A. Prepregnancy body mass index, weight gain during pregnancy, and perinatal outcome in a rural black population. Journal of Maternal-Fetal and Neonatal Medicine. 1998;7(4):190-3. 110. Ludwig DS, Currie J. The association between pregnancy weight gain and birthweight: a within-family comparison. The Lancet. 2010;376(9745):984-90. 111. Oken E, Taveras EM, Kleinman KP, Rich-Edwards JW, Gillman MW. Gestational weight gain and child adiposity at age 3 years. American Journal of Obstetrics and Gynecology. 2007;196(4):322. e1-. e8. 112. Hedderson MM, Weiss NS, Sacks DA, Pettitt DJ, Selby JV, Quesenberry CP, et al. Pregnancy weight gain and risk of neonatal complications: macrosomia, hypoglycemia, and hyperbilirubinemia. Obstetrics & Gynecology. 2006;108(5):1153-61. 113. Kabali C, Werler MM. Pre-pregnant body mass index, weight gain and the risk of delivering large babies among non-diabetic mothers. International Journal of Gynecology & Obstetrics. 2007;97(2):100-4. 114. Dietz PM, Callaghan WM, Cogswell ME, Morrow B, Ferre C, Schieve LA. Combined effects of prepregnancy body mass index and weight gain during pregnancy on the risk of preterm delivery. Epidemiology. 2006;17(2):170-7. 115. Stotland NE, Cheng YW, Hopkins LM, Caughey AB. Gestational weight gain and adverse neonatal outcome among term infants. Obstetrics & Gynecology. 2006;108(3, Part 1):635-43. 116. Amorim AR, Rössner S, Neovius M, Lourenço PM, Linné Y. Does Excess
Pregnancy Weight Gain Constitute a Major Risk for Increasing Long‐term BMI?
Obesity. 2007;15(5):1278-86. 117. Scholl TO, Hediger ML, Schall JI, Ances IG, Smith WK. Gestational weight gain, pregnancy outcome, and postpartum weight retention. Obstetrics & Gynecology. 1995;86(3):423-7. 118. Gore SA, Brown DM, West DS. The role of postpartum weight retention in obesity among women: a review of the evidence. Annals of Behavioral Medicine. 2003;26(2):149-59. 119. Nehring I, Schmoll S, Beyerlein A, Hauner H, von Kries R. Gestational weight gain and long-term postpartum weight retention: a meta-analysis. The American Journal of Clinical Nutrition. 2011;94(5):1225-31. 120. Gunderson EP, Abrams B, Selvin S. The relative importance of gestational gain and maternal characteristics associated with the risk of becoming overweight
384
after pregnancy. International Journal of Obesity and Related Metabolic Disorders: Journal of the International Association for the Study of Obesity. 2000;24(12):1660-8. 121. Oken E, Kleinman KP, Belfort MB, Hammitt JK, Gillman MW. Associations of gestational weight gain with short-and longer-term maternal and child health outcomes. American Journal of Epidemiology. 2009;170(2):173-80. 122. Diesel JC, Eckhardt CL, Day NL, Brooks MM, Arslanian SA, Bodnar LM. Is gestational weight gain associated with offspring obesity at 36 months? Pediatric Obesity. 2014. 123. Lau EY, Liu J, Archer E, McDonald SM, Liu J. Maternal Weight Gain in Pregnancy and Risk of Obesity among Offspring: A Systematic Review. Journal of Obesity. 2014;2014. 124. Lawlor DA, Lichtenstein P, Fraser A, Långström N. Does maternal weight gain in pregnancy have long-term effects on offspring adiposity? A sibling study in a prospective cohort of 146,894 men from 136,050 families. The American Journal of Clinical Nutrition. 2011;94(1):142-8. 125. Araujo CL, Hallal PC, Nader GA, Neutzling MB, deFátima Vieira M, Menezes AMB, et al. Effect of birth size and proportionality on BMI and skinfold thickness in early adolescence: prospective birth cohort study. European Journal of Clinical Nutrition. 2008;63(5):634-9. 126. Parsons TJ, Power C, Logan S, Summerbelt CD. Childhood predictors of adult obesity: a systematic review. International Journal of Obesity. 1999;23. 127. Eriksson M, Wedel H, Wallander MA, Krakau I, Hugosson J, Carlsson S, et al. The impact of birth weight on prostate cancer incidence and mortality in a
population‐based study of men born in 1913 and followed up from 50 to 85 years of
age. The Prostate. 2007;67(11):1247-54.
128. Leong NM, Mignone LI, Newcomb PA, Titus‐Ernstoff L, Baron JA,
Trentham‐Dietz A, et al. Early life risk factors in cancer: the relation of birth weight
to adult obesity. International Journal of Cancer. 2003;103(6):789-91. 129. May R. Prepregnancy weight, inappropriate gestational weight gain, and smoking: relationships to birth weight. American Journal of Human Biology. 2007;19(3):305-10. 130. The American College of Obstetricians and Gynecologists. Committee Opinion: Weight Gain During Pregnancy: The American College of Obstetricians and Gynecologists,; 2013 [Available from: http://www.acog.org/Resources-And-Publications/Committee-Opinions/Committee-on-Obstetric-Practice/Weight-Gain-During-Pregnancy. 131. Reilly JJ, Methven E, McDowell ZC, Hacking B, Alexander D, Stewart L, et al. Health consequences of obesity. Archives of Disease in Childhood. 2003;88(9):748-52. 132. Kapadia MZ, Park CK, Beyene J, Giglia L, Maxwell C, McDonald SD. Can we safely recommend gestational weight gain below the 2009 guidelines in obese women? A systematic review and meta-analysis. Obesity Reviews. 2015. 133. Zhou W, Olsen J. Gestational weight gain as a predictor of birth and placenta
weight according to pre‐pregnancy body mass index. Acta Obstetricia et
Gynecologica Scandinavica. 1997;76(4):300-7. 134. Cedergren M. Effects of gestational weight gain and body mass index on obstetric outcome in Sweden. International Journal of Gynecology & Obstetrics. 2006;93(3):269-74. 135. Nohr EA, Vaeth M, Baker JL, Sørensen TIA, Olsen J, Rasmussen KM. Combined associations of prepregnancy body mass index and gestational weight
385
gain with the outcome of pregnancy. The American Journal of Clinical Nutrition. 2008;87(6):1750-9. 136. Kiel DW, Dodson EA, Artal R, Boehmer TK, Leet TL. Gestational weight gain and pregnancy outcomes in obese women: how much is enough? Obstetrics & Gynecology. 2007;110(4):752-8. 137. Ryan EA. Hormones and insulin resistance during pregnancy. The Lancet. 2003;362(9398):1777-8. 138. National Institute for Health and Care Excellence. Antenatal Care: Routine care for the pregnant woman. London: Department of Health; 2008. 139. Oken E, Gillman MW. Fetal origins of obesity. Obesity Research. 2003;11(4):496-506.
140. Wu Q, Suzuki M. Parental obesity and overweight affect the body‐fat
accumulation in the offspring: the possible effect of a high‐fat diet through
epigenetic inheritance. Obesity Reviews. 2006;7(2):201-8. 141. Phelan S. Pregnancy: a “teachable moment” for weight control and obesity prevention. American Journal of Obstetrics and Gynecology. 2010;202(2):135. e1-. e8. 142. Catalano P. Maternal obesity and metabolic risk to the offspring: why lifestyle interventions may have not achieved the desired outcomes. International Journal of Obesity. 2015;39(4):642. 143. Shieh C, Cullen DL, Pike C, Pressler SJ. Intervention strategies for preventing
excessive gestational weight gain: systematic review and meta‐analysis. Obesity
Reviews. 2018. 144. The World Bank. Fertility rate, total (births per woman) 2019 [Available from: https://data.worldbank.org/indicator/SP.DYN.TFRT.IN. 145. Martin JA, Hamilton BE, Osterman MJ, Driscoll AK, Drake P. Births: Final Data for 2017. National Vital Statistics Reports. 2018;67(8):1-50. 146. Office for National Statistics. Birth characteristics in England and Wales: 2017. 2019. 147. Heslehurst N, Sattar N, Rajasingam D, Wilkinson J, Summerbell CD, Rankin J. Existing maternal obesity guidelines may increase inequalities between ethnic groups: a national epidemiological study of 502,474 births in England. BMC Pregnancy and Childbirth. 2012;12(1):156. 148. Liu J, Gallagher AE, Carta CM, Torres ME, Moran R, Wilcox S. Racial differences in gestational weight gain and pregnancy-related hypertension. Annals of Epidemiology. 2014;24(6):441-7. 149. Krukowski RA, Bursac Z, McGehee MA, West D. Exploring potential health disparities in excessive gestational weight gain. Journal of women's health. 2013;22(6):494-500. 150. Hunt KJ, Alanis MC, Johnson ER, Mayorga ME, Korte JE. Maternal pre-pregnancy weight and gestational weight gain and their association with birthweight with a focus on racial differences. Maternal and child health journal. 2013;17(1):85-94. 151. Chu SY, Callaghan WM, Bish CL, D'angelo D. Gestational weight gain by body mass index among US women delivering live births, 2004-2005: fueling future obesity. American Journal of Obstetrics and Gynecology. 2009;200(3):271. e1-. e7. 152. Kinnunen TI, Waage CW, Sommer C, Sletner L, Raitanen J, Jenum AK. Ethnic Differences in Gestational Weight Gain: A Population-Based Cohort Study in Norway. Maternal and Child Health Journal. 2016;20(7):1485-96.
386
153. Headen I, Mujahid M, Cohen A, Rehkopf D, Abrams B. Racial/Ethnic Disparities in Inadequate Gestational Weight Gain Differ by Pre-pregnancy Weight. Maternal and Child Health Journal. 2015:1-15. 154. Shen JJ, Tymkow C, MacMullen N. Disparities in maternal outcomes among four ethnic populations. Ethnicity & Disease. 2005;15(3):492-7. 155. Steinfeld JD, Valentine S, Lerer T, Ingardia CJ, Wax JR, Curry SL. Obesity-related complications of pregnancy vary by race. Journal of Maternal-Fetal and Neonatal Medicine. 2000;9(4):238-41. 156. Ramos GA, Caughey AB. The interrelationship between ethnicity and obesity on obstetric outcomes. American Journal of Obstetrics and Gynecology. 2005;193(3):1089-93. 157. Bryant AS, Washington S, Kuppermann M, Cheng YW, Caughey AB. Quality and equality in obstetric care: racial and ethnic differences in caesarean section delivery rates. Paediatric and Perinatal Epidemiology. 2009;23(5):454-62. 158. Low S, Chin MC, Ma S, Heng D, Deurenberg-Yap M. Rationale for redefining obesity in Asians. Annals Academy of Medicine Singapore. 2009;38(1):66. 159. Hall LML, Moran CN, Milne GR, Wilson J, MacFarlane NG, Forouhi NG, et al. Fat oxidation, fitness and skeletal muscle expression of oxidative/lipid metabolism genes in South Asians: implications for insulin resistance? PloS One. 2010;5(12):e14197. 160. Chu SY, Abe K, Hall LR, Kim SY, Njoroge T, Qin C. Gestational diabetes mellitus: all Asians are not alike. Preventive Medicine. 2009;49(2):265-8. 161. Retnakaran R, Hanley AJG, Connelly PW, Sermer M, Zinman B. Ethnicity modifies the effect of obesity on insulin resistance in pregnancy: a comparison of Asian, South Asian, and Caucasian women. The Journal of Clinical Endocrinology & Metabolism. 2006;91(1):93-7. 162. LaVeist TA. Disentangling race and socioeconomic status: a key to understanding health inequalities. Journal of Urban Health. 2005;82:iii26-iii34. 163. Sniderman AD, Bhopal R, Prabhakaran D, Sarrafzadegan N, Tchernof A. Why might South Asians be so susceptible to central obesity and its atherogenic consequences? The adipose tissue overflow hypothesis. International Journal of Epidemiology. 2007;36(1):220-5. 164. Shuster A, Patlas M, Pinthus J, Mourtzakis M. The clinical importance of visceral adiposity: a critical review of methods for visceral adipose tissue analysis. The British Journal of Radiology. 2012;85(1009):1-10. 165. Rhee E-J. Diabetes in Asians. Endocrinology and Metabolism. 2015;30(3):263-9. 166. Wulan S, Westerterp K, Plasqui G. Ethnic differences in body composition and the associated metabolic profile: a comparative study between Asians and Caucasians. Maturitas. 2010;65(4):315-9. 167. Yajnik CS, Lubree HG, Rege SS, Naik SS, Deshpande JA, Deshpande SS, et al. Adiposity and hyperinsulinemia in Indians are present at birth. The Journal of Clinical Endocrinology & Metabolism. 2002;87(12):5575-80. 168. West J, Lawlor DA, Fairley L, Bhopal R, Cameron N, McKinney PA, et al. UK-born Pakistani-origin infants are relatively more adipose than white British infants: findings from 8704 mother-offspring pairs in the Born-in-Bradford prospective birth cohort. Journal of Epidemiology and Community Health. 2013;67(7):544-51. 169. Office for National Statistics. Ethnicity and National Identity in England and Wales 2011 2012 [updated 11th December 2012. Available from: http://www.ons.gov.uk/ons/dcp171776_290558.pdf].
387
170. Office for National Statistics. 2011 Census: Key Statistics for England and Wales, March 2011 2011 [Available from: http://www.ons.gov.uk/ons/dcp171778_290685.pdf]. 171. Bryant M, Santorelli G, Lawlor DA, Farrar D, Tuffnell D, Bhopal R, et al. A comparison of South Asian specific and established BMI thresholds for determining obesity prevalence in pregnancy and predicting pregnancy complications: findings from the Born in Bradford cohort. International Journal of Obesity. 2014;38(3):444-50. 172. Bryant M, Santorelli G, Fairley L, West J, Lawlor DA, Bhopal R, et al. Design and characteristics of a new birth cohort, to study the early origins and ethnic variation of childhood obesity: the BiB1000 study. Longitudinal and Life Course Studies. 2013;4(2):119-35. 173. Kline RB. Introduction. Principles and Practice of Structural Equation Modelling. Methodology in Social Science. Third ed: The Guilford Press; 2011. p. 3-18. 174. Kline RB. Specification. Principles and Practice of Structural Equation Modelling. Methodology in Social Science. Third ed: The Guilford Press; 2011. p. 91-123. 175. Kline RB. Identification. Principles and Practice of Structural Equation Modelling. Methodology in Social Science. third ed. New York: The Guilford Press; 2011. p. 124-50. 176. Brannen J. Mixed methods research: A discussion paper. ESRC National Centre for Research Methods; 2005. 177. Stange KC, Crabtree BF, Miller WL. Publishing multimethod research. The Annals of Family Medicine. 2006;4(4):292-4. 178. Greene JC, Caracelli VJ, Graham WF. Toward a conceptual framework for mixed-method evaluation designs. Educational Evaluation and Policy Analysis. 1989;11(3):255-74. 179. Bryman A. Integrating quantitative and qualitative research: how is it done? Qualitative Research. 2006;6(1):97-113. 180. The Cochrane Collaboration. Cochrane Handbook for Systematic Reviews of Interventions 2011 [updated March 2011. Available from: http://handbook.cochrane.org/. 181. Centre for Reviews and Dissemination. Systematic Reviews: CDR's guidance for undertaking systematic reviews in health care. York: University of York; 2009. 182. Harden A. Mixed-Methods Systematic Reviews: Integrating Quantitative and Qualitative Findings Focus. 2010(Technical Brief No.25). 183. Dixon-Woods M, Agarwal S, Jones D, Young B, Sutton A. Synthesising qualitative and quantitative evidence: a review of possible methods. Journal of Health Services Research & Policy. 2005;10(1):45-53B. 184. Sandelowski M, Voils CI, Leeman J, Crandell JL. Mapping the mixed methods–mixed research synthesis terrain. Journal of Mixed Methods Research. 2012;6(4):317-31. 185. Sandelowski M, Voils CI, Barroso J. Defining and designing mixed research synthesis studies. Social Science Research. 2006;13(1):29. 186. Slack E, Rankin J, Jones D, Heslehurst N. Effects of maternal anthropometrics on pregnancy outcomes in South Asian women: a systematic review. Obesity Reviews. 2018;19(4):485-500. 187. Marchi J, Berg M, Dencker A, Olander EK, Begley C. Risks associated with obesity in pregnancy, for the mother and baby: a systematic review of reviews. Obesity Reviews. 2015;16(8):621-38.
388
188. Bhopal RS. Terminology and classifications for migrant, ethnic and racial groups: the centrality of census and population registers. In: Second, editor. Migration, Ethnicity, Race and Health in Multicultural Societies. United States of America: Oxford University Press; 2014. p. 33-61. 189. Guideline JSC. Pregnancy outcomes after assisted reproductive technology. Journal of Obstetrics and Gynaecology Canada. 2006;28(3):220-33. 190. Luke B, Keith LG. The contribution of singletons, twins and triplets to low birth weight, infant mortality and handicap in the United States. The Journal of Reproductive Medicine. 1992;37(8):661-6. 191. National Institute for Health and Care Excellence. BMI: preventing ill health and premature death in black, Asian and other minority ethnic groups: National Institute for Health and Care Excellence; 2013 [updated July 2013]. 192. South Asian Public Health Association. FAQ: Who is considered South Asian? 2011 [Available from: http://www.sapha.org/pages.php?id=7. 193. Moher D, Liberati A, Tetzlaff J, Altman DG. Preferred reporting items for systematic reviews and meta-analyses: the PRISMA statement. International Journal of Surgery. 2010;8(5):336-41. 194. Chalmers I, Dickersin K, Chalmers TC. Getting to grips with Archie Cochrane's agenda. BMJ. 1992;305(6857):786. 195. National Institute for Health and Care Excellence. The guidelines manual: appendices B–I 2012 [updated 30 November 2012 cited 2016. Available from: http://publications.nice.org.uk/the-guidelines-manual-appendices-bi-pmg6b/appendix-d-methodology-checklist-cohort-studies]. 196. National Heart Lung and Blood Institute. Quality Assessment Tool for Observational Cohort and Cross-Sectional Studies 2014 [updated March 2014. Available from: https://www.nhlbi.nih.gov/health-pro/guidelines/in-develop/cardiovascular-risk-reduction/tools/cohort. 197. Wells GA, Shea B, O’connell D, Peterson JEA, Welch V, Losos M, et al. The Newcastle-Ottawa Scale (NOS) for assessing the quality of nonrandomised studies in meta-analyses. 2000. 198. Kirkwood BR, Sterne, J. A.C. Systematic reviews and meta-analysis. Essential Medical Statistics. USA: Blackwell Science Ltd; 2003. p. 371-87. 199. Valentine JC, Pigott TD, Rothstein HR. How Many Studies Do You Need?:A Primer on Statistical Power for Meta-Analysis. Journal of Educational and Behavioral Statistics. 2010;35(2):215-47. 200. Sheridan E, Wright J, Small N, Corry PC, Oddie S, Whibley C, et al. Risk factors for congenital anomaly in a multiethnic birth cohort: an analysis of the Born in Bradford study. The Lancet. 2013;382(9901):1350-9. 201. Penn N, Oteng-Ntim E, Oakley LL, Doyle P. Ethnic variation in stillbirth risk and the role of maternal obesity: analysis of routine data from a London maternity unit. BMC Pregnancy and Childbirth. 2014;14(1):404. 202. Bissenden JG, Scott PH, King J, Hallum J, Mansfield HN, Wharton BA. Anthropometric and biochemical changes during pregnancy in Asian and European mothers having light for gestational age babies. BJOG: An International Journal of Obstetrics & Gynaecology. 1981;88(10):999-1008. 203. Bissenden JG, Scott PH, Hallum J, Mansfield HN, Scott P, Wharton BA. Anthropometric and biochemical changes during pregnancy in Asian and European mothers having well grown babies. BJOG: An International Journal of Obstetrics & Gynaecology. 1981;88(10):992-8.
389
204. Oteng-Ntim E, Kopeika J, Seed P, Wandiembe S, Doyle P. Impact of obesity on pregnancy outcome in different ethnic groups: calculating population attributable fractions. PLoS One. 2013;8(1):e53749. 205. Makgoba M, Savvidou MD, Steer PJ. An analysis of the interrelationship between maternal age, body mass index and racial origin in the development of gestational diabetes mellitus. BJOG: An International Journal of Obstetrics & Gynaecology. 2011;119(3):276-82. 206. Makgoba M, Savvidou MD, Steer PJ. The effect of maternal characteristics and gestational diabetes on birthweight. BJOG: An International Journal of Obstetrics & Gynaecology. 2012;119(9):1091-7. 207. Dornhorst A, Paterson CM, Nicholls JSD, Wadsworth J, Chiu DC, Elkeles RS, et al. High prevalence of gestational diabetes in women from ethnic minority groups. Diabetic Medicine. 1992;9(9):820-5. 208. Sharma V, Swinson AK, Hughes C, Mokashi S, Russell R. Effect of ethnicity and body mass index on the distance from skin to lumbar epidural space in parturients. Anaesthesia. 2011;66(10):907-12. 209. Sinha B, Brydon P, Taylor RS, Hollins A, Munro A, Jenkins D, et al. Maternal
ante‐natal parameters as predictors of persistent postnatal glucose intolerance: a
comparative study between Afro‐Caribbeans, Asians and Caucasians. Diabetic
Medicine. 2003;20(5):382-6. 210. Dunne FP, Brydon PA, Proffitt M, Smith T, Gee H, Holder RL. Fetal and
maternal outcomes in Indo‐Asian compared to Caucasian women with diabetes in
pregnancy. QJM: An International Journal of Medicine. 2000;93(12):813-8. 211. Sommer C, Mørkrid K, Jenum AK, Sletner L, Mosdøl A, Birkeland KI. Weight gain, total fat gain and regional fat gain during pregnancy and the association with gestational diabetes: a population-based cohort study. International Journal of Obesity. 2014;38(1):76-81. 212. Sommer C, Jenum AK, Waage CW, Mørkrid K, Sletner L, Birkeland KI. Ethnic differences in BMI, subcutaneous fat, and serum leptin levels during and after pregnancy and risk of gestational diabetes. European Journal of Endocrinology. 2015;172(6):649-56. 213. Wong VW. Gestational diabetes mellitus in five ethnic groups: a comparison of their clinical characteristics. Diabetic Medicine. 2012;29(3):366-71. 214. Yue DK, Molyneaux LM, Ross GP, Constantino MI, Child AG, Turtle JR. Why does ethnicity affect prevalence of gestational diabetes? The underwater volcano theory. Diabetic Medicine. 1996;13(8):748-52. 215. Hernandez-Rivas E, Flores-Le Roux JA, Benaiges D, Sagarra E, Chillaron JJ, Paya A, et al. Gestational diabetes in a multiethnic population of Spain: clinical characteristics and perinatal outcomes. Diabetes Research and Clinical Practice. 2013;100(2):215-21. 216. Pu J, Zhao B, Wang EJ, Nimbal V, Osmundson S, Kunz L, et al. Racial/Ethnic Differences in Gestational Diabetes Prevalence and Contribution of Common Risk Factors. Paediatric and Perinatal Epidemiology. 2015;29(5):436-43. 217. World Health Organisation. Metrics: Population Attributable Fraction (PAF) 2016 [Available from: http://www.who.int/healthinfo/global_burden_disease/metrics_paf/en/]. 218. Rockhill B, Newman B, Weinberg C. Use and misuse of population attributable fractions. American Journal of Public Health. 1998;88(1):15-9. 219. Thomson AM, Billewicz WZ, Hytten FE. The assessment of fetal growth. BJOG: An International Journal of Obstetrics & Gynaecology. 1968;75(9):903-16.
390
220. Webb P, Bain C. Glossary Essential Epidemiology New York: Cambridge University Press; 2011. p. 419-35. 221. Rothstein HR, Sutton AJ, Borenstein M. Publication bias in meta-analysis. Publication bias in meta-analysis: Prevention, assessment and adjustments. 2005:1-7. 222. Webb P, Bain C. Muddied waters: the challenges of confounding. Essential Epidemiology: An Introduction for Students and Health Professionals. Cambridge: Cambridge University Press; 2011. p. 197-220. 223. Pearl J, Glymour M, Jewell N. Mediation. Causal Inference in Statistics. West Sussex: Wiley; 2016. p. 75-8. 224. Hong QN, Pluye P, Bujold M, Wassef M. Convergent and sequential synthesis designs: implications for conducting and reporting systematic reviews of qualitative and quantitative evidence. Systematic reviews. 2017;6(1):61. 225. Dixon-Woods M. Using framework-based synthesis for conducting reviews of qualitative studies. BMC medicine. 2011;9(1):1.
226. Oliver SR, Rees RW, Clarke‐Jones L, Milne R, Oakley AR, Gabbay J, et al.
A multidimensional conceptual framework for analysing public involvement in health services research. Health Expectations. 2008;11(1):72-84. 227. Ritchie J, Spencer L. Qualitative data analysis for applied policy research In: Bryman A, Burgess R, editors. Analyzing Qualitative Data. London: Routledge; 1994. p. 173-94. 228. Booth A. Clear and present questions: formulating questions for evidence based practice. Library Hi Tech. 2006;24(3):355-68. 229. Cabieses B, Waiblinger D, Santorelli G, McEachan RRC. What factors explain pregnant women’s feeding intentions in Bradford, England: A multi-methods, multi-ethnic study. BMC Pregnancy and Childbirth. 2014;14(1):1. 230. Dadvand P, Wright J, Martinez D, Basagaña X, McEachan RRC, Cirach M, et al. Inequality, green spaces, and pregnant women: roles of ethnicity and individual and neighbourhood socioeconomic status. Environment International. 2014;71:101-8. 231. Fairley L, Petherick ES, Howe LD, Tilling K, Cameron N, Lawlor DA, et al. Describing differences in weight and length growth trajectories between white and Pakistani infants in the UK: analysis of the Born in Bradford birth cohort study using multilevel linear spline models. Archives of Disease in Childhood. 2013:archdischild-2012-302778. 232. Fraser LK, Edwards KL, Tominitz M, Clarke GP, Hill AJ. Food outlet availability, deprivation and obesity in a multi-ethnic sample of pregnant women in Bradford, UK. Social Science & Medicine. 2012;75(6):1048-56. 233. Lawlor DA, West J, Fairley L, Nelson SM, Bhopal RS, Tuffnell D, et al. Pregnancy glycaemia and cord-blood levels of insulin and leptin in Pakistani and white British mother–offspring pairs: findings from a prospective pregnancy cohort. Diabetologia. 2014;57(12):2492-500. 234. Lawton R, Ashley L, Dawson S, Waiblinger D, Conner M. Employing an extended Theory of Planned Behaviour to predict breastfeeding intention, initiation,
and maintenance in White British and South‐Asian mothers living in Bradford.
British Journal of Health Psychology. 2012;17(4):854-71. 235. Norris T, Tuffnell D, Wright J, Cameron N. Modelling foetal growth in a bi-ethnic sample: results from the Born in Bradford (BiB) birth cohort. Annals of Human Biology. 2014;41(6):481-7. 236. Petherick ES, Tuffnell D, Wright J. Experiences and outcomes of maternal Ramadan fasting during pregnancy: results from a sub-cohort of the Born in Bradford birth cohort study. BMC Pregnancy and Childbirth. 2014;14(1):335.
391
237. Santorelli G, Fairley L, Petherick ES, Cabieses B, Sahota P. Ethnic differences in infant feeding practices and their relationship with BMI at 3 years of age–results from the Born in Bradford birth cohort study. British Journal of Nutrition. 2014;111(10):1891-7. 238. Santorelli G, Petherick E, Waiblinger D, Cabieses B, Fairley L. Ethnic differences in the initiation and duration of breast feeding–results from the born in Bradford Birth Cohort Study. Paediatric and Perinatal Epidemiology. 2013;27(4):388-92. 239. Schembari A, de Hoogh K, Pedersen M, Dadvand P, Martinez D, Hoek G, et al. Ambient Air Pollution and Newborn Size and Adiposity at Birth: Differences by Maternal Ethnicity (the Born in Bradford Study Cohort). Environmental Health Perspectives. 2015;123(11):1208. 240. Traviss GD, West RM, House AO. Maternal mental health and its association with infant growth at 6 months in ethnic groups: results from the Born-in-Bradford birth cohort study. PloS One. 2012;7(2):e30707. 241. West J, Lawlor DA, Fairley L, Wright J. Differences in socioeconomic position, lifestyle and health-related pregnancy characteristics between Pakistani and White British women in the Born in Bradford prospective cohort study: the influence of the woman's, her partner's and their parents’ place of birth. BMJ Open. 2014;4(6):e004805. 242. West J, Wright J, Fairley L, Sattar N, Whincup P, Lawlor DA. Do ethnic differences in cord blood leptin levels differ by birthweight category? Findings from the Born in Bradford cohort study. International Journal of Epidemiology. 2013:225. 243. Prady SL, Pickett KE, Croudace T, Fairley L, Bloor K, Gilbody S, et al. Psychological distress during pregnancy in a multi-ethnic community: findings from the born in Bradford cohort study. PloS One. 2013;8(4):e60693. 244. Ball HL, Moya E, Fairley L, Westman J, Oddie S, Wright J. Infant care practices related to sudden infant death syndrome in South Asian and White British families in the UK. Paediatric and Perinatal Epidemiology. 2012;26(1):3-12. 245. Prady S, Fairley L, Bloor K, Gilbody S, Kiernan K, Pickett K, et al. Risk factors for poor mental health during pregnancy from the born in Bradford cohort: early results from a bi-ethnic sample. Journal of Epidemiology and Community Health. 2011;65(Suppl 1):A148-A. 246. Bakken KS, Skjeldal OH, Stray-Pedersen B. Obstetric Outcomes of First-and Second-Generation Pakistani Immigrants: A Comparison Study at a Low-Risk Maternity Ward in Norway. Journal of Immigrant and Minority Health. 2015:1-8. 247. Bansal N, Chalmers JWT, Fischbacher CM, Steiner MFC, Bhopal RS. Ethnicity and first birth: age, smoking, delivery, gestation, weight and feeding: Scottish health and ethnicity linkage study. The European Journal of Public Health. 2014;24(6):911-6. 248. Bundey S, Alam H, Kaur A, Mir S, Lancashire RJ. Race, consanguinity and social features in Birmingham babies: a basis for prospective study. Journal of Epidemiology and Community Health. 1990;44(2):130-5.
249. Bundey S, Alam H, Kaur A, Mir S, Lancashire R. Why do UK‐born Pakistani
babies have high perinatal and neonatal mortality rates? Paediatric and Perinatal Epidemiology. 1991;5(1):101-14. 250. Busck-Rasmussen M, Villadsen SF, Norsker FN, Mortensen L, Andersen A-MN. Breastfeeding practices in relation to country of origin among women living in Denmark: a population-based study. Maternal and Child Health Journal. 2014;18(10):2479-88.
392
251. Gardosi J, Madurasinghe V, Williams M, Malik A, Francis A. Maternal and fetal risk factors for stillbirth: population based study. BMJ. 2013;346. 252. Griffiths LJ, Tate AR. Do early infant feeding practices vary by maternal ethnic group? Public Health Nutrition. 2007;10(09):957-64. 253. Harding S, Rosato MG, Cruickshank JK. Lack of change in birthweights of infants by generational status among Indian, Pakistani, Bangladeshi, Black Caribbean, and Black African mothers in a British cohort study. International Journal of Epidemiology. 2004;33(6):1279-85. 254. Higgins V, Dale A. Ethnicity and childhood overweight/obesity in England. Pediatric Obesity. 2012;7(3):e22-e6. 255. Honeyman MM, Bahl L, Marshall T, Wharton BA. Consanguinity and fetal growth in Pakistani Moslems. Archives of Disease in Childhood. 1987;62(3):231-5. 256. Ibison JM. Ethnicity and mode of delivery in ‘low-risk’first-time mothers, East London, 1988–1997. European Journal of Obstetrics & Gynecology and Reproductive Biology. 2005;118(2):199-205. 257. Kelly Y, Panico L, Bartley M, Marmot M, Nazroo J, Sacker A. Why does birthweight vary among ethnic groups in the UK? Findings from the Millennium Cohort Study. Journal of Public Health. 2009;31(1):131-7. 258. Leon DA, Moser KA. Low birth weight persists in South Asian babies born in England and Wales regardless of maternal country of birth. Slow pace of acculturation, physiological constraint or both? Analysis of routine data. Journal of epidemiology and community health. 2010:jech. 2010.112516. 259. Nair M, Kurinczuk JJ, Brocklehurst P, Sellers S, Lewis G, Knight M. Factors associated with maternal death from direct pregnancy complications: a UK national case–control study. BJOG: An International Journal of Obstetrics & Gynaecology. 2015;122(5):653-62. 260. Pallan M, Parry J, Adab P. Contextual influences on the development of obesity in children: a case study of UK South Asian communities. Preventive Medicine. 2012;54(3):205-11.
261. Pedersen GS, Mortensen LH, Gerster M, Rich‐Edwards J, Andersen AMN.
Preterm Birth and Birthweight‐for‐Gestational Age among Immigrant Women in
Denmark 1978–2007: A Nationwide Registry Study. Paediatric and Perinatal Epidemiology. 2012;26(6):534-42. 262. Sanchalika A, Teresa J. Risk of Gestational Diabetes Among South Asian Immigrants Living in New Jersey—a Retrospective Data Review. Journal of Racial and Ethnic Health Disparities. 2015;2(4):510-6. 263. Saxena S, Ambler G, Cole TJ, Majeed A. Ethnic group differences in overweight and obese children and young people in England: cross sectional survey. Archives of Disease in Childhood. 2004;89(1):30-6. 264. Sørbye IK, Stoltenberg C, Sundby J, Daltveit AK, Vangen S. Stillbirth and
infant death among generations of Pakistani immigrant descent: a population‐based
study. Acta Obstetricia et Gynecologica Scandinavica. 2014;93(2):168-74. 265. Terry PB, Condie RG, Settatree RS. Analysis of ethnic differences in perinatal statistics. BMJ. 1980;281(6251):1307-8. 266. Zilanawala A, Davis-Kean P, Nazroo J, Sacker A, Simonton S, Kelly Y. Race/ethnic disparities in early childhood BMI, obesity and overweight in the United Kingdom and United States. International Journal of Obesity. 2015;39(3):520-9. 267. Griffiths LJ, Dezateux C, Cole TJ. Sex and ethnic differences in the waist circumference of 5-year-old children: findings from the Millennium Cohort Study. International Journal of Pediatric Obesity. 2011;6(sup3):e196-8.
393
268. Kelly YJ, Watt RG, Nazroo JY. Racial/ethnic differences in breastfeeding initiation and continuation in the United Kingdom and comparison with findings in the United States. Pediatrics. 2006;118(5):e1428-e35. 269. Chitty LS, Winter RM. Perinatal mortality in different ethnic groups. Archives of Disease in Childhood. 1989;64(7):1036-41. 270. Moser K, Stanfield KM, Leon DA. Birthweight and gestational age by ethnic group, England and Wales 2005: introducing new data on births. Health Statistics Quarterly. 2008(39):22. 271. Stoltenberg C, Magnus P, Lie RT, Daltveit AK, Irgens LM. Birth defects and parental consanguinity in Norway. American Journal of Epidemiology. 1997;145(5):439-48. 272. Villadsen SF, Mortensen LH, Andersen AMN. Ethnic disparity in stillbirth and infant mortality in Denmark 1981–2003. Journal of Epidemiology and Community Health. 2009;63(2):106-12. 273. Grjibovski AM, Magnus P, Stoltenberg C. Decrease in consanguinity among parents of children born in Norway to women of Pakistani origin: a registry-based study. Scandinavian Journal of Public Health. 2009;37(3):232-8. 274. Sacker A, Kelly YJ. Ethnic differences in growth in early childhood: an investigation of two potential mechanisms. The European Journal of Public Health. 2012;22(2):197-203. 275. Bandyopadhyay M, Small R, Davey MA, Oats JJN, Forster DA, Aylward A. Lived experience of gestational diabetes mellitus among immigrant South Asian women in Australia. Australian and New Zealand Journal of Obstetrics and Gynaecology. 2011;51(4):360-4. 276. Bowes A, Domokos TM. Negotiating breast-feeding: Pakistani women, white women and their experiences in hospital and at home. Social Research Online. 1998;3(3). 277. Choudhry K, Wallace LM. ‘Breast is not always best’: South Asian women's experiences of infant feeding in the UK within an acculturation framework. Maternal & Child Nutrition. 2012;8(1):72-87. 278. Greenhalgh T, Clinch M, Afsar N, Choudhury Y, Sudra R, Campbell-Richards D, et al. Socio-cultural influences on the behaviour of South Asian women with diabetes in pregnancy: qualitative study using a multi-level theoretical approach. BMC Medicine. 2015;13(1):1. 279. Ingram J, Cann K, Peacock J, Potter B. Exploring the barriers to exclusive breastfeeding in black and minority ethnic groups and young mothers in the UK. Maternal & Child Nutrition. 2008;4(3):171-80. 280. Twamley K, Puthussery S, Harding S, Baron M, Macfarlane A. UK-born ethnic minority women and their experiences of feeding their newborn infant. Midwifery. 2011;27(5):595-602. 281. Ingram J, Johnson D, Hamid N. South Asian grandmothers’ influence on breast feeding in Bristol. Midwifery. 2003;19(4):318-27. 282. Bowler I. ‘They're not the same as us’: midwives' stereotypes of South Asian descent maternity patients. Sociology of Health & Illness. 1993;15(2):157-78. 283. Uphoff EP, Pickett KE, Wright J. Social gradients in health for Pakistani and White British women and infants in two UK birth cohorts. Ethnicity & Health. 2015:1-16. 284. Morgan O, Baker A. Measuring deprivation in England and Wales using 2001 Carstairs scores. National Statistics. 2006;Health Statistics Quarterly:28-33. 285. Barnett-Page E, Thomas J. Methods for the synthesis of qualitative research: a critical review. BMC medical research methodology. 2009;9(1):59.
394
286. Bhopal R. Introduction: the concepts of ethnicity and race in health and their implications in the context of international migration. In: Second, editor. Migration, Ethnicity, Race and Health in Multicultural Societies. Oxford: Oxford University Press; 2014. p. 1-32. 287. Kirkwood BR, Sterne AC. Displaying the data. Essential Medical Statistics. Oxford: Blackwell Science Ltd; 2003. p. 15-30. 288. Barnett AH, Dixon AN, Bellary S, Hanif MW, O’Hare JP, Raymond NT, et al. Type 2 diabetes and cardiovascular risk in the UK south Asian community. Diabetologia. 2006;49(10):2234-46. 289. Bhopal R, Unwin N, White M, Yallop J, Walker L, Alberti K, et al. Heterogeneity of coronary heart disease risk factors in Indian, Pakistani, Bangladeshi, and European origin populations: cross sectional study. BMJ. 1999;319(7204):215-20. 290. Malinowski W. Preterm birth in multiple pregnancy. Medycyna wieku rozwojowego. 2003;7(3 Suppl 1):85-96. 291. Sterne JAC, White IR, Carlin JB, Spratt M, Royston P, Kenward MG, et al. Multiple imputation for missing data in epidemiological and clinical research: potential and pitfalls. BMJ. 2009;338:b2393. 292. Peacock J, Peacock P. Chapter 12 Analysisng multiple variables per subject. Oxford Handbook of Medical Statistics. Oxford: Oxford University Press; 2011. p. 393-445. 293. White IR, Carlin JB. Bias and efficiency of multiple imputation compared with
complete‐case analysis for missing covariate values. Statistics in Medicine.
2010;29(28):2920-31. 294. Rubin DB. Formalizing subjective notions about the effect of nonrespondents in sample surveys. Journal of the American Statistical Association. 1977;72(359):538-43. 295. Aitkin M, Anderson D, Francis B, Hinde J. Model criticism. Statistical Modelling in GLIM. Oxford New York, Toronto: Oxford University Press; 1989. p. 97-103. 296. Kline RB. Data Preparation. Principles and Practice of Structural Equation Modelling. Methodology in Social Science. Third ed: The Guilford Press; 2011. p. 46-74. 297. Chokshi DA, El-Sayed AM, Stine NW. J-Shaped Curves and Public HealthJ-Shaped Curves and Public HealthJ-Shaped Curves and Public Health. JAMA. 2015;314(13):1339-40. 298. Schisterman EF, Cole SR, Platt RW. Overadjustment bias and unnecessary adjustment in epidemiologic studies. Epidemiology (Cambridge, Mass). 2009;20(4):488. 299. McKay-Moffat S, Lee P. Section 2 Quick reference topics. A Pocket Guide for Student Midwives Second Edition ed. West Sussex: John Wiley & Sons Ltd; 2010. p. 26-317. 300. PennState Eberley College of Science. Lesson 12: Multicolinearity & Other Regression Pitfalls: The Pennsylvania State University; 2018 [Available from: https://newonlinecourses.science.psu.edu/stat501/node/343/]. 301. PennState Eberley College of Science. 12.4 - Detecting Multicollinearity Using Variance Inflation Factors 2018 [Available from: https://onlinecourses.science.psu.edu/stat501/node/347/]. 302. Schumacker RE, Lomax RG. Path Models. In: Riegert D, editor. A Beginners Guide to Structural Equation Modelling. New Jersey: Lawrence Erlbaum Associates, Inc; 2004. p. 149-66.
395
303. Kline RB. Fundamental Concepts. Principles and Practice of Structural Equation Modelling. Methodology in Social Science. Third ed: The Guilford Press; 2011. p. 19-45. 304. Kline RB. Hypothesis Testing. Principles and Practice of Structural Equation Modelling. Methodology in Social Science. third ed. New York: The Guilford Press; 2011. p. 189-230. 305. Henry CJK. Body mass index and the limits of human survival. European Journal of Clinical Nutrition. 1990;44(4):329-35. 306. Faucher MA, Barger MK. Gestational weight gain in obese women by class of obesity and select maternal/newborn outcomes: A systematic review. Women and Birth. 2015;28(3):e70-e9. 307. Hinkle SN, Sharma AJ, Dietz PM. Gestational weight gain in obese mothers and associations with fetal growth. The American Journal of Clinical Nutrition. 2010;92(3):644-51. 308. Park S, Sappenfield WM, Bish C, Salihu H, Goodman D, Bensyl DM. Assessment of the Institute of Medicine recommendations for weight gain during pregnancy: Florida, 2004–2007. Maternal and Child Health Journal. 2011;15(3):289-301. 309. Spong CY. Defining “term” pregnancy: recommendations from the Defining “Term” Pregnancy Workgroup. JAMA. 2013;309(23):2445-6. 310. Committee Opinion No 579: Definition of Term Pregnancy. Obstetrics & Gynecology. 2013;122(5):1139-40. 311. McKay-Moffat S, Lee P. Section 1- The Language of Midwifery. A Pocket Guide for Student Midwives. Second Edition ed2010. p. 23. 312. Office for National Statistics. Population of England and Wales 2018 [updated 3rd August 2018. Available from: https://www.ethnicity-facts-figures.service.gov.uk/british-population/national-and-regional-populations/population-of-england-and-wales/latest]. 313. NHS Digital. Health Survey for England, 2016: Adult overweight and obesity-Tables 2016. 314. Kline RB. Introduction. Third Edition ed. Principles and Practice of Structural Equation Modelling2011. p. 3-18. 315. Hughes RA, Heron J, Sterne JA, Tilling K. Accounting for missing data in statistical analyses: multiple imputation is not always the answer. International journal of epidemiology. 2019;1:11. 316. Wright J, Small N, Raynor P, Tuffnell D, Bhopal R, Cameron N, et al. Cohort profile: The Born in Bradford multi-ethnic family cohort study. International Journal of Epidemiology. 2013;42(4):978-91. 317. West J, Manchester B, Wright J, Lawlor DA, Waiblinger D. Reliability of routine clinical measurements of neonatal circumferences and research measurements of neonatal skinfold thicknesses: findings from the Born in Bradford study. Paediatric and Perinatal Epidemiology. 2011;25(2):164-71. 318. Johnson W, Cameron N, Dickson P, Emsley S, Raynor P, Seymour C, et al. The reliability of routine anthropometric data collected by health workers: a cross-sectional study. International Journal of Nursing Studies. 2009;46(3):310-6. 319. Gilmore LA, Redman LM. Weight gain in pregnancy and application of the 2009 IOM guidelines: toward a uniform approach. Obesity. 2015;23(3):507-11. 320. Alavi N, Haley S, Chow K, McDonald SD. Comparison of national gestational weight gain guidelines and energy intake recommendations. Obesity Reviews. 2013;14(1):68-85.
396
321. Misra A, Khurana L. Obesity-related non-communicable diseases: South Asians vs White Caucasians. International Journal Of Obesity. 2010;35:167. 322. Nishikawa E, Oakley L, Seed PT, Doyle P, Oteng-Ntim E. Maternal BMI and diabetes in pregnancy: Investigating variations between ethnic groups using routine maternity data from London, UK. PLoS ONE. 2017;12 (6) (e0179332). 323. Davies-Tuck M, Mockler JC, Stewart L, Knight M, Wallace EM. Obesity and pregnancy outcomes: Do the relationships differ by maternal region of birth? A retrospective cohort study. BMC Pregnancy and Childbirth. 2016;16 (1) (no pagination)(288). 324. Anand SS, Gupta MK, Schulze KM, Desai D, Abdalla N, Wahi G, et al. What accounts for ethnic differences in newborn skinfold thickness comparing South Asians and White Caucasians? Findings from the START and FAMILY Birth Cohorts. International Journal of Obesity. 2016;40(2):239-44. 325. Medical Research Council. Strategic Aim One: Picking research that delivers 2018 [Available from: https://mrc.ukri.org/research/strategy/aim-1/theme-2/objective-6/]. 326. Ameh CA, Van Den Broek N. Increased risk of maternal death among ethnic minority women in the UK. The Obstetrician & Gynaecologist. 2008;10(3):177-82. 327. Rogozinska E, Marlin N, Dodds J, Kerry S, Khan K, Thangaratinam S, et al. Effect of diet and physical activity based interventions in pregnancy on gestational weight gain and pregnancy outcomes: Individual participant data (IPD) meta-analysis of randomised trials. BMJ. 2017. 328. Stephenson J, Heslehurst N, Hall J, Schoenaker DA, Hutchinson J, Cade JE, et al. Before the beginning: nutrition and lifestyle in the preconception period and its importance for future health. The Lancet. 2018. 329. Bhopal R. Research on and with minority migrant, racial, and ethnic groups: past, present and future. Migration, Ethnicity, Race, and Health in Multicultural Societies. Oxford: Oxford University Press; 2014. p. 269-316. 330. Verschuren O, Ketelaar M, Keefer D, Wright V, Butler J, Ada L, et al. Identification of a core set of exercise tests for children and adolescents with cerebral palsy: a Delphi survey of researchers and clinicians. Developmental Medicine & Child Neurology. 2011;53(5):449-56. 331. Rogozinska E, D'amico M, Khan KS, Cecatti JG, Teede H, Yeo S, et al.
Development of composite outcomes for individual patient data (IPD) meta‐analysis
on the effects of diet and lifestyle in pregnancy: a Delphi survey. BJOG: An International Journal of Obstetrics & Gynaecology. 2016;123(2):190-8. 332. Hasson F, Keeney S, McKenna H. Research guidelines for the Delphi survey technique. Journal of Advanced Nursing. 2000;32(4):1008-15. 333. Bradford Metropolitan District Council. Population 2015 [updated 2015. Available from: http://www.bradford.gov.uk/bmdc/community_and_living/population]. 334. City of Bradford Metropolitan District Council. Population 2018 [Available from: https://www.bradford.gov.uk/open-data/our-datasets/population/]. 335. Raynor P. Born in Bradford, a cohort study of babies born in Bradford, and their parents: protocol for the recruitment phase. BMC Public Health. 2008;8(1):327. 336. Public Health England. Bradford: Health Profile 2014. 2014 [Available from: http://www.apho.org.uk/resource/item.aspx?RID=142150]. 337. Bradford Observatory. Infant Mortality [Available from: http://www.observatory.bradford.nhs.uk/Pages/InfantMortality.aspx]. 338. Public Health England. Child Obesity 2015 [updated 2015. Available from: http://www.noo.org.uk/NOO_about_obesity/child_obesity].
397
339. Public Health England. UK and Ireland prevalence and trends 2015 [updated 2015. Available from: http://www.noo.org.uk/NOO_about_obesity/adult_obesity/UK_prevalence_and_trends]. 340. Small N. Infant mortality and migrant health in babies of Pakistani origin born in Bradford, UK. Journal of Intercultural Studies. 2012;33(5):549-64. 341. Morton R, Sharma V, Nicholson J, Broderick M, Poyser J. Disability in children from different ethnic populations. Child: Care, Health and Development. 2002;28(1):87-93. 342. Parry G. Aetiology and prevalence of childhood hearing impairment in Bradford. Audiens. 1995;20:25-9. 343. Sinha G, Corry P, Subesinghe D, Wild J, Levene MI. Prevalence and type of cerebral palsy in a British ethnic community: the role of consanguinity. Developmental Medicine & Child Neurology. 1997;39(4):259-62. 344. Schwarz K, Yeung S, Symons N, Bradbury J. Survey of school children with visual impairment in Bradford. Eye. 2002;16(5):530-4. 345. Corry PC. Intellectual disability and cerebral palsy in a UK community. Public Health Genomics. 2002;5(3):201-4. 346. Braude D, Webb E. The epidemiology of childhood hearing impairment in a multi-ethnic health district. Ambulatory Child Health. 1999;5:237-. 347. Devereux G, Stellitano L, Verity CM, Nicoll A, Will RG, Rogers P. Variations in neurodegenerative disease across the UK: findings from the national study of Progressive Intellectual and Neurological Deterioration (PIND). Archives of Disease in Childhood. 2004;89(1):8-12.
Related Documents