Matanuska-Susitna Borough Tourism Infrastructure Needs Study Prepared for: Matanuska-Susitna Borough June 2008

Welcome message from author
This document is posted to help you gain knowledge. Please leave a comment to let me know what you think about it! Share it to your friends and learn new things together.
Transcript
Matanuska-Susitna Borough Tourism Infrastructure Needs Study
Prepared for:
Matanuska-Susitna Borough
June 2008
Matanuska-Susitna Borough Tourism Infrastructure Needs Study
Prepared for:
Matanuska-Susitna Borough
PREPARED BY:
Juneau Anchorage
In association with:
The Boutet Company Klugherz & Associates
MRV Architects
June 2008
Table of Contents
Executive Summary.........................................................................................................ES-1 Introduction and Methodology..................................................................................... IM-1 Geographic Overview ................................................................................................... GO-1
A: Base Case Tourism Infrastructure Description Introduction ..................................................................................................................... A-1 Accommodations ............................................................................................................. A-2 Meeting Facilities ............................................................................................................. A-6 Sports Facilities .............................................................................................................. A-13 Other Public Venues ...................................................................................................... A-16 Parks, Campgrounds, Boat Launches and Trails ........................................................... A-20 Transportation ............................................................................................................... A-25 Public Restroom Facilities .............................................................................................. A-29
B: Mat-Su Visitor Markets Introduction ..................................................................................................................... B-1 Out-of-State Market Analysis........................................................................................... B-3 In-State Visitors.............................................................................................................. B-12 Market Outlook.............................................................................................................. B-14
C: Assessment of Tourism Industry Value Assessment of Tourism Industry Value ........................................................................... C-1
D: Needed Tourism Infrastructure Improvements Introduction .....................................................................................................................D-1 Meeting Facilities .............................................................................................................D-4 Road System Enhancements..........................................................................................D-11 Trail System Enhancements...........................................................................................D-17 Visitor Support Services.................................................................................................D-22 Determining Tourism Infrastructure Investment Priorities..........................................D-24 Potential Large Scale Destination and Attraction Developments................................D-31 Funding Approaches......................................................................................................D-36
E: Focus Areas for Tourism Improvement Focus Areas for Tourism Improvement ............................................................................E-1
F: Tourism Partnering Opportunities Introduction ......................................................................................................................F-1 Partnering Opportunities for Mat-Su Borough ...............................................................F-6
Appendices Appendix A: Tourism Infrastructure Description........................................................ APP-1 Appendix B: Mat-Su Visitor Markets ......................................................................... APP-30 Appendix C: Needed Tourism Infrastructure Improvements ................................... APP-52 Appendix D: Contacts and Information Sources ...................................................... APP-74 Appendix E: Montana Tourism Infrastructure Investment Program Guidelines................................................................................................................... APP-77
Executive Summary
Tourism Infrastructure Needs Study: Executive Summary McDowell Group, Inc. • Page ES-1
Introduction
The Matanuska-Susitna Borough is interested in understanding what tourism infrastructure investments are
needed to enhance visitors’ experience, increase overnight stays (thereby increasing bed tax revenue), and
maximize the overall economic return. The Borough contracted with McDowell Group, Inc. an Alaska
research and consulting firm with offices in Anchorage and Juneau, to take the lead role in the Tourism
Infrastructure Needs Study. Other members of the study team include The Boutet Company (an engineering
and planning firm based in Anchorage), Klugherz & Associates (a strategic planning and market development
firm based in Seattle), and MRV Architects (an architectural design firm based in Juneau).
The study includes six areas of analysis regarding borough tourism including: an inventory of existing tourism
infrastructure, an overview of visitor markets, the value of tourism to the borough, tourism infrastructure
needs, focus area questions and responses, and partnering opportunities.
• The study team compiled a detailed inventory of the Mat-Su Borough’s existing tourism
infrastructure, including accommodations, meeting facilities, sports facilities, parks, campgrounds,
boat launches, trails and other transportation infrastructure.
• The region’s current in-state and out-of-state visitor markets were analyzed, utilizing comprehensive
McDowell Group tourism research databases. The project also includes a discussion of the outlook for
several visitor markets and analyzes market implications for regional tourism infrastructure.
• The study team examined measures of tourism industry value, such as bed tax receipts and
employment. In addition, McDowell Group utilized modeling to estimate the direct, indirect and
induced economic benefits of the tourism sector in the Mat-Su region.
• The study team then examined how potential infrastructure improvements could enhance the
regional tourism industry and visitor experience. The team forecasted the increased number of
overnight stays likely to result and the overall economic return for four major categories of
infrastructure investment—meeting facilities, road system enhancements, trail system enhancements,
and visitor support services. Additionally, the study team examined development priorities, the
importance of large-scale destination and attraction development, and potential funding approaches.
• The study team responded to a series of questions specifically posed by the Borough at the beginning
of the study (entitled Focus Areas for Tourism Improvement).
• The project concluded with analysis of national trends in partnering that included ways in which
tourism entities, government, private land owners and others can work together to increase the
effectiveness of public dollars spent on tourism development. This section of the report includes
specific partnering recommendations for future tourism infrastructure developments in the region.
• Lastly, appendices provide detailed information supporting the assumptions and findings of the
study.
Key findings from the study are presented on the following pages.
Tourism Infrastructure Needs Study: Executive Summary McDowell Group, Inc. • Page ES-2
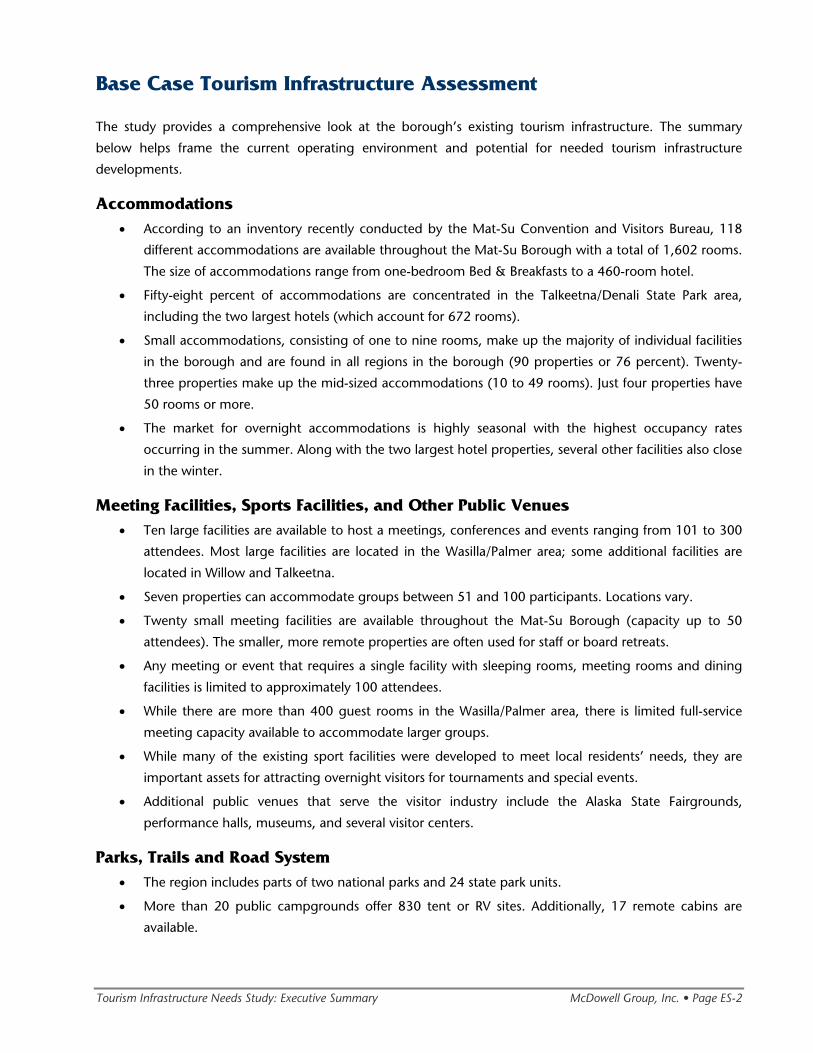
Base Case Tourism Infrastructure Assessment
The study provides a comprehensive look at the borough’s existing tourism infrastructure. The summary
below helps frame the current operating environment and potential for needed tourism infrastructure
developments.
Accommodations • According to an inventory recently conducted by the Mat-Su Convention and Visitors Bureau, 118
different accommodations are available throughout the Mat-Su Borough with a total of 1,602 rooms.
The size of accommodations range from one-bedroom Bed & Breakfasts to a 460-room hotel.
• Fifty-eight percent of accommodations are concentrated in the Talkeetna/Denali State Park area,
including the two largest hotels (which account for 672 rooms).
• Small accommodations, consisting of one to nine rooms, make up the majority of individual facilities
in the borough and are found in all regions in the borough (90 properties or 76 percent). Twenty-
three properties make up the mid-sized accommodations (10 to 49 rooms). Just four properties have
50 rooms or more.
• The market for overnight accommodations is highly seasonal with the highest occupancy rates
occurring in the summer. Along with the two largest hotel properties, several other facilities also close
in the winter.
Meeting Facilities, Sports Facilities, and Other Public Venues • Ten large facilities are available to host a meetings, conferences and events ranging from 101 to 300
attendees. Most large facilities are located in the Wasilla/Palmer area; some additional facilities are
located in Willow and Talkeetna.
• Seven properties can accommodate groups between 51 and 100 participants. Locations vary.
• Twenty small meeting facilities are available throughout the Mat-Su Borough (capacity up to 50
attendees). The smaller, more remote properties are often used for staff or board retreats.
• Any meeting or event that requires a single facility with sleeping rooms, meeting rooms and dining
facilities is limited to approximately 100 attendees.
• While there are more than 400 guest rooms in the Wasilla/Palmer area, there is limited full-service
meeting capacity available to accommodate larger groups.
• While many of the existing sport facilities were developed to meet local residents’ needs, they are
important assets for attracting overnight visitors for tournaments and special events.
• Additional public venues that serve the visitor industry include the Alaska State Fairgrounds,
performance halls, museums, and several visitor centers.
Parks, Trails and Road System • The region includes parts of two national parks and 24 state park units.
• More than 20 public campgrounds offer 830 tent or RV sites. Additionally, 17 remote cabins are
available.
Tourism Infrastructure Needs Study: Executive Summary McDowell Group, Inc. • Page ES-3
• Over 60 boat launches provide access to waterways, including four prominent launches: Talkeetna
River Boat Launch, Susitna Landing, Deshka Landing, and the Little Susitna River Boat Launch.
• More than 2,000 miles of trails are located within the borough.
• Fewer parks and campgrounds are located along the Glenn Highway than the Parks Highway.
• The region includes 173 miles of the Parks Highway, 110 miles of the Glenn Highway, and
approximately 70 miles of the Denali Highway.
• Additional transportation infrastructure includes the Alaska Railroad, 10 public airports, and 200
private airports and air strips.
• The Parks and Glenn Highways have long stretches of roadway with no restroom facilities. Similarly,
the number of restrooms at trailheads, parks, and boat launches is insufficient.
Mat-Su Visitor Market Assessment
The study team examined both out-of-state and in-state visitor market to the Mat-Su Borough.
Visitor Volume • The approximate annual volume of all visitors to the Mat-Su Borough was estimated to be nearly
780,000 visitors in 2006/2007.
o An estimated 332,000 out-of-state visitors traveled to the Mat-Su Borough. Summer visitation
represented nearly 90 percent of the out-of-state visitor activity.
o The study team estimated that 446,000 Alaskans visited the Mat-Su Borough, with the largest
market being Anchorage residents. Summer visitors represented nearly 60 percent or
262,800 visitors; the number of fall/winter visitors totaled 183,400 Alaskans.
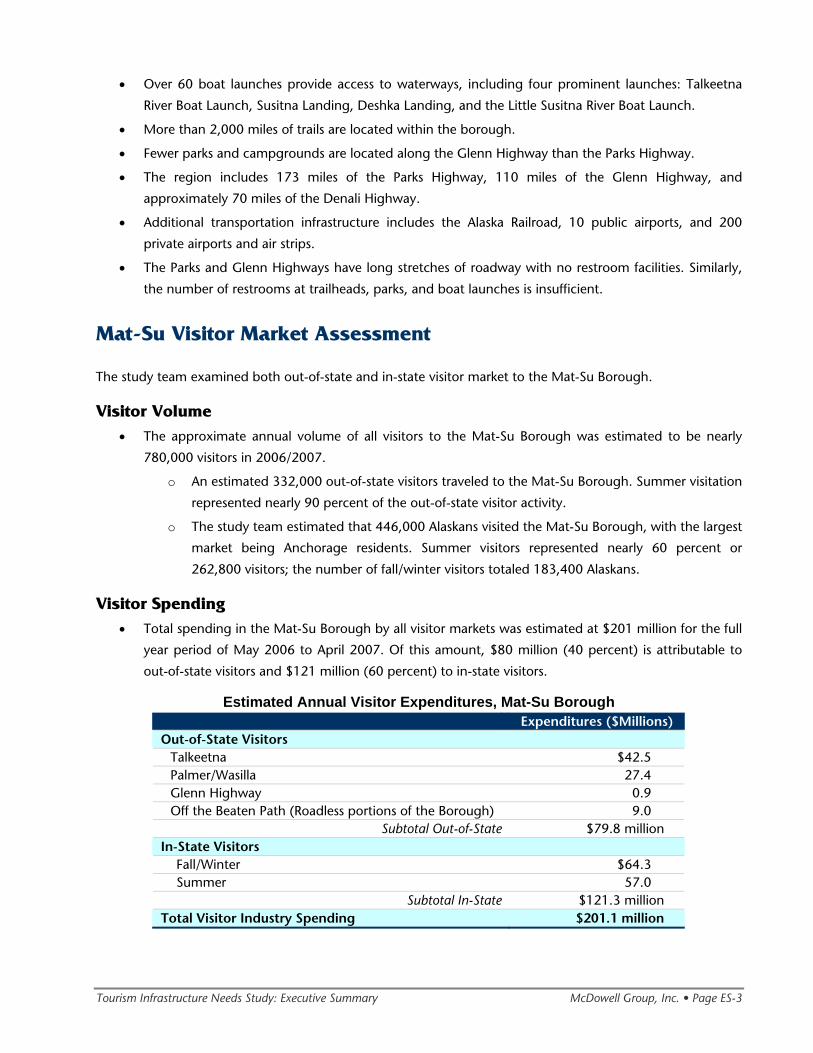
Visitor Spending • Total spending in the Mat-Su Borough by all visitor markets was estimated at $201 million for the full
year period of May 2006 to April 2007. Of this amount, $80 million (40 percent) is attributable to
out-of-state visitors and $121 million (60 percent) to in-state visitors.
Estimated Annual Visitor Expenditures, Mat-Su Borough Expenditures ($Millions)
Out-of-State Visitors Talkeetna $42.5 Palmer/Wasilla 27.4 Glenn Highway 0.9 Off the Beaten Path (Roadless portions of the Borough) 9.0
Subtotal Out-of-State $79.8 million In-State Visitors
Fall/Winter $64.3 Summer 57.0
Subtotal In-State $121.3 million Total Visitor Industry Spending $201.1 million
Tourism Infrastructure Needs Study: Executive Summary McDowell Group, Inc. • Page ES-4
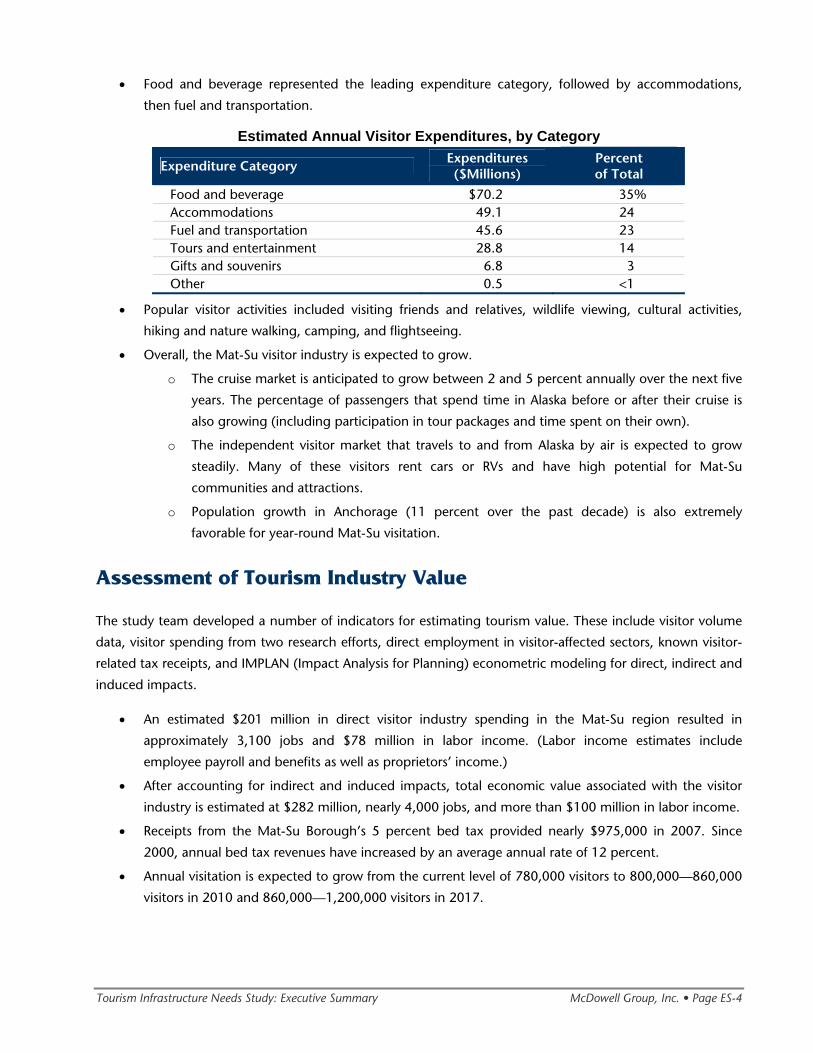
• Food and beverage represented the leading expenditure category, followed by accommodations,
then fuel and transportation.
Estimated Annual Visitor Expenditures, by Category
Expenditure Category Expenditures ($Millions)
Percent of Total
Food and beverage $70.2 35% Accommodations 49.1 24 Fuel and transportation 45.6 23 Tours and entertainment 28.8 14 Gifts and souvenirs 6.8 3 Other 0.5 <1
• Popular visitor activities included visiting friends and relatives, wildlife viewing, cultural activities,
hiking and nature walking, camping, and flightseeing.
• Overall, the Mat-Su visitor industry is expected to grow.
o The cruise market is anticipated to grow between 2 and 5 percent annually over the next five
years. The percentage of passengers that spend time in Alaska before or after their cruise is
also growing (including participation in tour packages and time spent on their own).
o The independent visitor market that travels to and from Alaska by air is expected to grow
steadily. Many of these visitors rent cars or RVs and have high potential for Mat-Su
communities and attractions.
o Population growth in Anchorage (11 percent over the past decade) is also extremely
favorable for year-round Mat-Su visitation.
Assessment of Tourism Industry Value
The study team developed a number of indicators for estimating tourism value. These include visitor volume
data, visitor spending from two research efforts, direct employment in visitor-affected sectors, known visitor-
related tax receipts, and IMPLAN (Impact Analysis for Planning) econometric modeling for direct, indirect and
induced impacts.
• An estimated $201 million in direct visitor industry spending in the Mat-Su region resulted in
approximately 3,100 jobs and $78 million in labor income. (Labor income estimates include
employee payroll and benefits as well as proprietors’ income.)
• After accounting for indirect and induced impacts, total economic value associated with the visitor
industry is estimated at $282 million, nearly 4,000 jobs, and more than $100 million in labor income.
• Receipts from the Mat-Su Borough’s 5 percent bed tax provided nearly $975,000 in 2007. Since
2000, annual bed tax revenues have increased by an average annual rate of 12 percent.
• Annual visitation is expected to grow from the current level of 780,000 visitors to 800,000—860,000
visitors in 2010 and 860,000—1,200,000 visitors in 2017.
Tourism Infrastructure Needs Study: Executive Summary McDowell Group, Inc. • Page ES-5
Needed Tourism Infrastructure Improvements
The study team identified four major categories of potential tourism infrastructure developments.
Development costs were estimated for each category as well as their potential effects on visitor volume,
overnight stays, and contribution to the regional economy. The likely impact of each category on the visitor
experience was also evaluated. A summary of findings for each of the recommended tourism infrastructure
development areas is provided below.
MEETING FACILITIES
The Mat-Su region is not competitive in the conference and convention market due to the lack of meeting
facilities that can accommodate meeting and banquet functions in the same building. Two proposed meeting
facility sizes were analyzed in this study.
• Conference facility. At approximately 8,400 sq. ft., the facility could accommodate conferences of
125 attendees (or two concurrent events of 125 people.) Estimated construction costs would be $4.5
million. Based on comparable facilities, the financial gap between operating costs and revenues is
likely to be approximately $200,000. (This estimate includes routine operations and maintenance,
but does not include periodic capital costs or convention marketing.)
o Estimated annual meeting related market potential ranged from nearly 4,000 additional
room nights and $700,000 in new spending to nearly 5,300 room nights and $930,000 in
new spending.
• Convention facility. At approximately 20,300 sq. ft., the larger facility is intended to accommodate
conventions of up to 400 attendees, including meetings, banquets, and three small conference
rooms that could be used for break-out sessions. Two concurrent events of 400 people could also
occur at the facility. Estimated construction cost is $10.8 million. The operating gap is estimated at
$300,000, based on comparable facilities. (This estimate does include routine operations and
maintenance, but does not include periodic capital costs or convention marketing.)
o Annual room nights associated with the convention and meeting market is estimated
between 6,200 and 9,000. New visitor spending associated with these conventions and
meetings is estimated between $1.1 and $1.5 million annually.
• While the initial capital costs are greater, Mat-Su would generate the largest return on investment
from annual operating costs from the larger convention facility.
• The optimal location for a new meeting facility is near Palmer and Wasilla, which offer the closest
proximity to Anchorage, year-round accommodations, and related services like catering,
entertainment, and lighting and sound technicians.
ROAD SYSTEM ENHANCEMENTS
The primary need in the region is restrooms, which are ideally placed every 40 to 50 miles along the road
system. The study also recommends improvements to a number of scenic viewpoints along the Glenn
Highway and upgrading the Denali Highway (which will promote a circular travel pattern and prolong visitor
stays in the region).
Tourism Infrastructure Needs Study: Executive Summary McDowell Group, Inc. • Page ES-6
• Priority wayside and restroom areas include the following:
o Glenn Highway/Parks Highway intersection, mile 32-34
o Glenn Highway, mile 129.3
o Glenn Highway, mile 78.1
o Parks Highway, mile 195.5
o Parks Highway, mile 60-65.
• The study team estimated $500,000 to $1 million in annual investment, which could wholly fund
one or two waysides each year or support an accelerated program with partners.
o Development costs for individual wayside improvements, complete with restrooms and other
amenities can range from $350,000 to $1 million depending on the site, size, enhancements,
and current condition. Ongoing maintenance can be $30,000 to $75,000 per location.
o The amount invested by the Borough could be much more modest, depending on grants
and partners.
o Costs for the Denali Highway upgrade were not explored, as this longer-term consideration
would need to be explored with the State of Alaska, Denali Borough, and other parties.
• Assuming a systematic approach to road system enhancements, the region has potential for
considerable market growth.
o New annual room nights associated with road system enhancements are estimated between
13,000 and nearly 24,000. New visitor spending is estimated between $2.2 and $3.8 million
annually.
o Denali Highway improvements could result in another 2,000 to 4,000 overnights from tour
packages and $600,000 to $1.2 million annually.
TRAIL SYSTEM ENHANCEMENTS
While the region boasts a trail system of more than 2,000 miles and many outstanding attributes, the study
revealed a number of urgent needs. Priority areas included improved trailheads, restrooms, and signage.
• The following list is roughly prioritized, based on current condition and estimated usage:
o Point MacKenzie – Existing trailhead will eventually be consumed by port development.
Relocate trailhead/parking area approximately one mile north on Point MacKenzie Road and
install restrooms. Provides access to Figure Eight Lake, Flathorn Lake, Susitna River and
beyond.
o Ayrshire Road – Existing trailhead provides access to Figure Eight Lake, Flathorn Lake trail
system, Susitna River and beyond. Restrooms need to be installed.
o West Papoose Twins Road – Construct new trailhead during upgrade of road. Install
restrooms. Provides access to Crooked Lake Trail, Iron Dog Trail, Susitna River and beyond.
o North Crystal Lake Road – Expand existing trailhead. Install restrooms. Provides access to
Willow area trails.
o Willer Kash Road – Expand existing trailhead. Install restrooms. Provides access to Hatcher
Pass trail system, Kashwitna area trails.
Tourism Infrastructure Needs Study: Executive Summary McDowell Group, Inc. • Page ES-7
o Parks Highway MP 105 – Expand existing trailhead/parking area (possibly relocate short
distance to the north to get off the road). Install restrooms. Provides access to Trapper Lake-
Amber Lake trail system, Trapper Creek trail system.
o Petersville Road MP 4 – Construct new trailhead/parking area. Install restrooms. Provides
access to Petersville-Trapper Creek trail system, Denali State Park trails.
o Butte Pavilion Parking Area – Grade to level out. Install restrooms. Provides access to Jim
Creek, Knik River and Knik Glacier.
o Wendt Road – Expand existing parking area. Install restrooms. Provides access to Matanuska
Moose Range trail system.
o Sutton/Coyote Lake – Expand parking area. Replace damaged restroom. Provides access to
Sutton area trails.
o Kings River – Expand existing parking area. Install restrooms. Provides access to Kings River,
Young Creek and Red Mountain.
o Purinton Creek – Install restrooms. Provides access to Purinton Creek and Boulder Creek area
trails.
o France Road (CMT) – Develop future trailhead to coincide with trailhead move in case the
CMT unit is not moveable. Install single restroom.
o Matanuska Peak Trailhead – Install single restroom.
o Pioneer Ridge Trailhead – Replace outhouse with single restroom.
o Matanuska River Park – Install one restroom on back parking lot.
• The study also recommends an update to the trail plan to inventory and map all the trails in the
region and designate usage, design standards, and responsibility for maintenance. The planning
process will facilitate partnerships and potential funding.
• Continued trail system development is also important, as the region has untapped potential for new
or enhanced trail systems for hikers, equestrians, snow machine riders, and cross-country skiers.
• The study team estimated $300,000 to $500,000 in annual investment, which could wholly fund one
to three trailheads each year or support an accelerated program with partners.
o Development costs for trailheads and related improvements, complete with restrooms and
other amenities, can range from $150,000 to $750,000 depending on the site, size,
enhancements, and current condition. Ongoing maintenance can be $10,000 to $50,000
per location.
o The trail plan update could range from $150,000 to $300,000, depending on the scope of
work and ability to partner.
o The Borough may wish to dedicate $50,000 to $150,000 for a grant program to support
planning, construction, and maintenance efforts that enhance the trail system.
• Considering the importance of outdoor recreation to in-state and out-of-state visitors, significant
market growth could result from an ongoing and systematic approach to the trail system.
o New room nights are estimated between 12,000 and nearly 24,000 annually. New visitor
spending is estimated between $2 and $3.9 million annually.
Tourism Infrastructure Needs Study: Executive Summary McDowell Group, Inc. • Page ES-8
VISITOR SUPPORT SERVICES
Visitor center kiosks and signage should be found at major access points into the region. Past research shows
that this type of infrastructure can significantly enhance satisfaction. The study team also believes that length
of stay and spending can be influenced as well.
• Priority areas include the following:
o Glenn Highway is identified as the highest priority area and should be incorporated into any
new wayside development.
o Regional information should be made available at the new interpretive center and kiosks
developed through the South Denali Implementation Plan.
o Major airport and rail arrival points should be reviewed to ensure that information meets the
needs of the respective markets.
• A one-time expenditure of $75,000 to $180,000 should be sufficient to cover development of one or
two kiosks and signage upgrades.
• Increased visitor overnights are estimated between 7,000 and 12,500. New visitor spending estimates
range from $2.4 to $4 million annually.
Evaluation Criteria
The study team utilized eight evaluation criteria for recommending tourism infrastructure development
priorities. Ultimately, public policy makers may choose these or other criteria depending on the desired end
result of the borough’s tourism infrastructure investments.
1. Overall development costs
2. Potential economic returns on development costs
3. Distribution of economic benefits in the borough
4. Length of time to achieve market potential
5. Operating and maintenance costs
6. Impact on Mat-Su Borough revenues
7. Funding sources
8. Partnership opportunities
Tourism Infrastructure Priorities
Successful tourism growth is a synergistic result of a complex web of all the enhancements analyzed in this
report. For example, only focusing on trail system enhancements would not result in near the same benefits
as simultaneous development of road, trail and visitor support service enhancements. This makes forecasting
specific economic returns on each category very difficult. Even the relatively stand alone
conference/convention facility – provided it is centrally located and easily accessible – might have some long
term synergistic benefits by exposing meeting attendees to the more widely distributed road, trail and visitor
support services in the region.
Tourism Infrastructure Needs Study: Executive Summary McDowell Group, Inc. • Page ES-9
The Mat-Su Borough must first strategically decide the desired end result from their visitor industry
investment. Then investments can be chosen that yield those results. Fortunately, the substantial visitor base
that exists, the increased revenue from investments, and a potential increase in bed tax rates makes possible
investments in multiple priorities. The following are the study team’s recommendations based on the
apparent overall best interests of the Mat-Su Borough.
HIGHEST PRIORITY
The tourism investment priority that yields the highest positive return is visitor support services. The
investment required is relatively small and can be implemented quickly. Positive returns for the investment
should be realized in three to five years and the benefits from this investment will be spread throughout the
borough and throughout the year. Additionally, partnering opportunities exist with the Mat-Su Convention
and Visitors Bureau, private companies, and the State Department of Transportation & Public Facilities.
SECOND PRIORITIES
The second investment priorities are both road and trail system enhancements. As the immediate needs are
addressed, the study team recommends funding a more detailed enhancement plan for each program area. It
is assumed that enhancements can be implemented over a period of years allowing benefits to spread
throughout the borough and impact both summer and winter visitor seasons. There are good opportunities
to partner and leverage dollars with the National Scenic Byways Program, other federal and state programs,
as well as user groups and businesses.
THIRD PRIORITY
Development of a conference/convention center is considered a lower investment priority relative to the
positive investment returns on visitor support services, and road and trail system enhancements. Further,
most benefits will be localized around the center. However, a new meeting facility would provide new
spending in the non-summer months, and may provide increased room nights and spending earlier than
some other projects. Development of a conference/convention center offers some opportunities for
partnering.
The comparison table on the following page provides a summary of estimated room nights, new visitor
spending, development costs, and timeframe needed to achieve projections. Operating and maintenance
costs are not expected to affect the outcome of this comparative analysis. They are minor when compared to
development costs and may be offset by grants and partnering.
Tourism Infrastructure Needs Study: Executive Summary McDowell Group, Inc. • Page ES-10
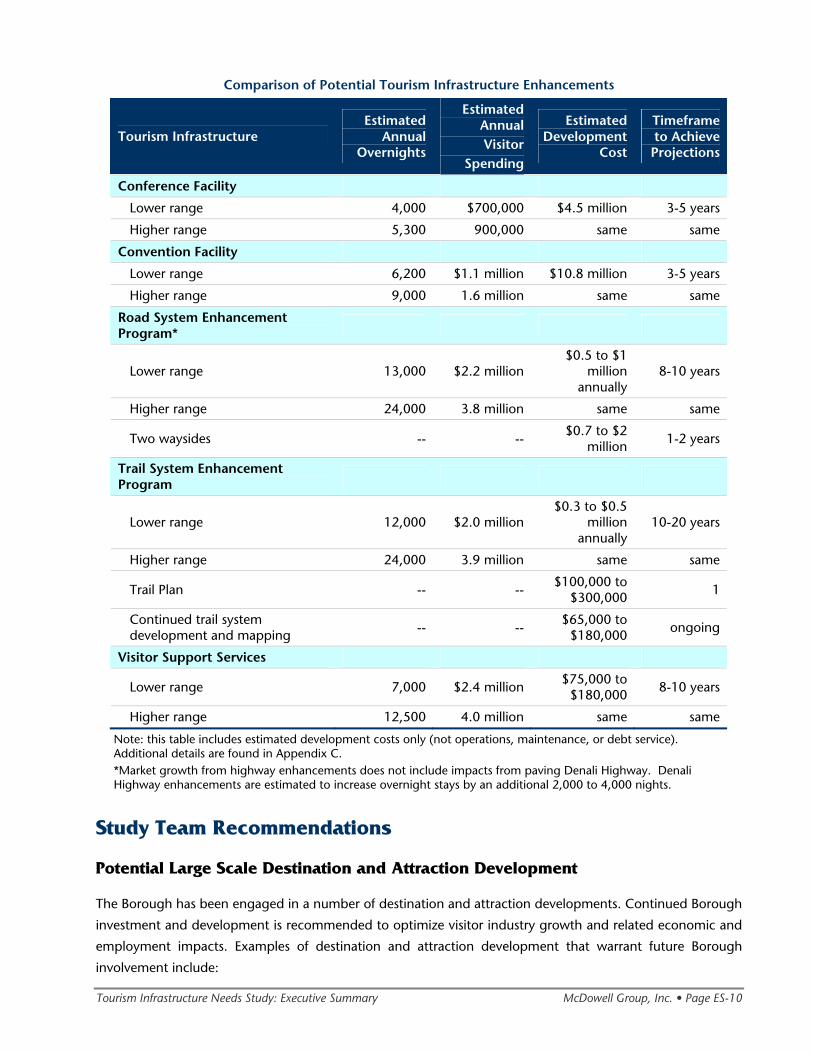
Comparison of Potential Tourism Infrastructure Enhancements
Tourism Infrastructure Estimated
AnnualOvernights
Estimated AnnualVisitor
Spending
Estimated Development
Cost
Timeframe to Achieve Projections
Conference Facility
Lower range 4,000 $700,000 $4.5 million 3-5 years
Higher range 5,300 900,000 same same
Convention Facility
Lower range 6,200 $1.1 million $10.8 million 3-5 years
Higher range 9,000 1.6 million same same
Road System Enhancement Program*
Lower range 13,000 $2.2 million$0.5 to $1
million annually
8-10 years
Higher range 24,000 3.8 million same same
Two waysides -- --$0.7 to $2
million 1-2 years
Trail System Enhancement Program
Lower range 12,000 $2.0 million$0.3 to $0.5
million annually
10-20 years
Higher range 24,000 3.9 million same same
Trail Plan -- --$100,000 to
$300,000 1
Continued trail system development and mapping -- --
$65,000 to $180,000 ongoing
Visitor Support Services
Lower range 7,000 $2.4 million$75,000 to
$180,000 8-10 years
Higher range 12,500 4.0 million same same
Note: this table includes estimated development costs only (not operations, maintenance, or debt service). Additional details are found in Appendix C. *Market growth from highway enhancements does not include impacts from paving Denali Highway. Denali Highway enhancements are estimated to increase overnight stays by an additional 2,000 to 4,000 nights.
Study Team Recommendations
Potential Large Scale Destination and Attraction Development
The Borough has been engaged in a number of destination and attraction developments. Continued Borough
investment and development is recommended to optimize visitor industry growth and related economic and
employment impacts. Examples of destination and attraction development that warrant future Borough
involvement include:
Tourism Infrastructure Needs Study: Executive Summary McDowell Group, Inc. • Page ES-11
• South Denali area. This area is expected to grow significantly as the South Denali Implementation Plan
unfolds. The Borough should remain involved in planning and infrastructure development.
• Hatcher Pass. The Borough should continue to develop this area as a visitor destination, as it has
significant long-term potential for virtually all visitor markets.
• Other examples include Independence Mine Tour, Glenn Highway Raptor Center, Palmer Hay Flats
Natural Science and Education/Community Center, and ongoing Trail Destination development.
Bed Tax Rate Analysis • Each community collects and allocates bed tax collections differently, based on their unique
economies and their usage of other funding mechanisms, such as property and sales taxes. At 5
percent, the Mat-Su Borough bed tax rate is considerably lower than Anchorage (12 percent) and
Fairbanks (8 percent).
• The study team developed scenarios for future bed tax collections for 3-, 5-, and 10-year periods with
increased bed tax rates. For each of the scenarios, the study team assumed a 5 percent annual
growth rate in taxable accommodation sales.
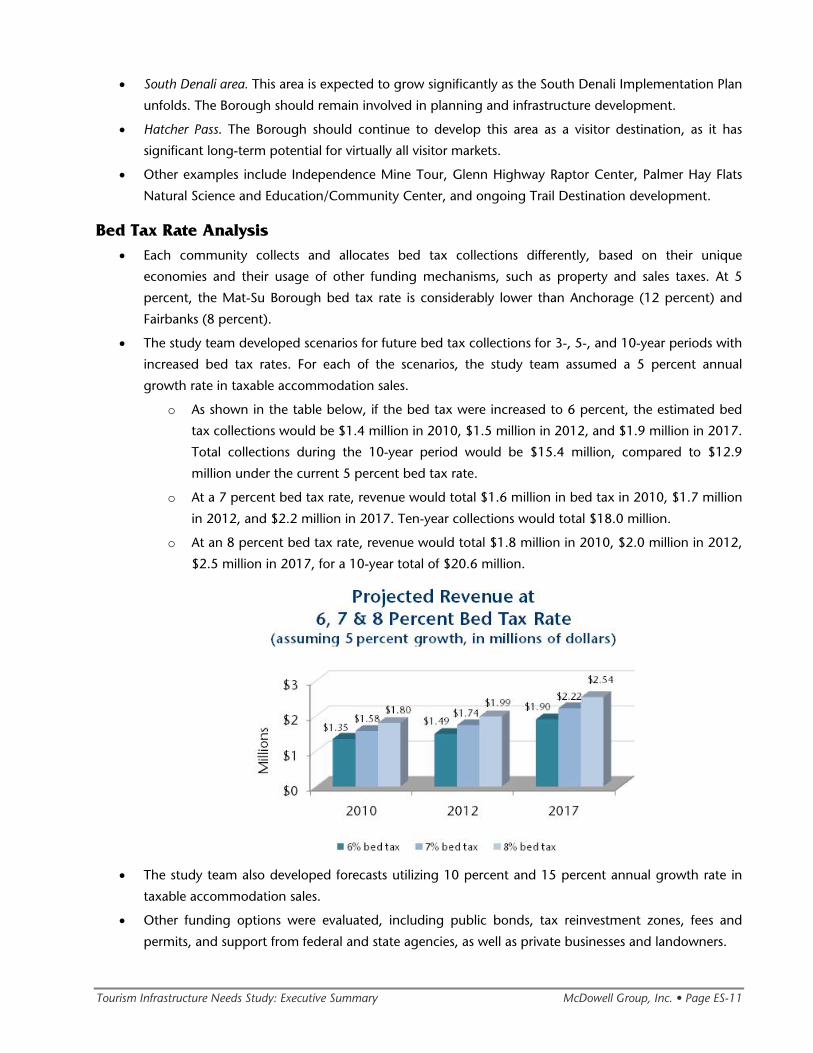
o As shown in the table below, if the bed tax were increased to 6 percent, the estimated bed
tax collections would be $1.4 million in 2010, $1.5 million in 2012, and $1.9 million in 2017.
Total collections during the 10-year period would be $15.4 million, compared to $12.9
million under the current 5 percent bed tax rate.
o At a 7 percent bed tax rate, revenue would total $1.6 million in bed tax in 2010, $1.7 million
in 2012, and $2.2 million in 2017. Ten-year collections would total $18.0 million.
o At an 8 percent bed tax rate, revenue would total $1.8 million in 2010, $2.0 million in 2012,
$2.5 million in 2017, for a 10-year total of $20.6 million.
• The study team also developed forecasts utilizing 10 percent and 15 percent annual growth rate in
taxable accommodation sales.
• Other funding options were evaluated, including public bonds, tax reinvestment zones, fees and
permits, and support from federal and state agencies, as well as private businesses and landowners.
Tourism Infrastructure Needs Study: Executive Summary McDowell Group, Inc. • Page ES-12
Focus Areas
Following is a summary of responses to the seven specific questions posed at the onset of the study.
• Yes, a convention center can contribute significantly to the economy, as it allows the region to attract
a market that it does not serve now. As summarized in the Needed Improvements section, a smaller
conference facility could attract between $700,000 and $900,000 annually in meeting-related
business. A larger convention facility could attract $1.1 to $1.6 million annually.
• The study team recommends construction of one larger facility rather than several small facilities if
this concept is pursued.
• Convention facilities will bring people to the valley for both overnight and day trips. The nature of
the meeting and number of attendees from outside the Anchorage area will influence travel patterns.
• All the tourism investment developments recommended in this study will contribute to overnight
stays. As shown in the Comparison of Tourism Investment table, road and trail system enhancements
have the greatest potential.
• It is economically better to locate a convention facility along the road system, as access to
accommodations, catering, and technical support are critical factors for success.
• Improved signage and restroom facilities greatly contribute to the tourism experience and economy.
• Compared to other areas, it makes sense to increase the bed tax. The study team believes that an
increase to 6 or 7 percent would be readily accepted by residents and the tourism industry. Is it
possible to increase the tax higher, but this should be approached with an educational campaign to
show what the additional funding will be designated for.
Tourism Partnering Opportunities • The study team provides a discussion of partnering trends as they relate to tourism infrastructure
development. Public/private partnerships and various incentive programs have emerged as
mechanisms to support the development of tourism infrastructure.
• There is no single model that works for public/private partnerships. Rather, partnerships are
structured in a variety of ways and can be as varied as the projects and organizations involved.
Usually these partnerships are created through contractual agreements between a public agency or
agencies, for-profit corporations and/or non-profit corporations or user groups. More often than not,
various investment incentives are included in the partnership, such as:
o Financial incentives in the form of government grants or loans from its own resources such as
special taxes, sale of revenue bonds, legislative appropriations (local, state or federal), etc.;
o Quasi-financial incentives in the form of loan guarantees, subsidies, or differential grants that
bridge the gap between official and commercial lending rates;
o Fiscal incentives, such as tax credits, enterprise zones, special districts, workforce incentive
programs, etc.; and
o Other incentives such as planning, management assistance, business development support,
or other technical assistance.
• The study team assessed each tourism infrastructure enhancement priority and then suggested
avenues for public and private partnering.
Tourism Infrastructure Needs Study: Executive Summary McDowell Group, Inc. • Page ES-13
Conclusions for Tourism Infrastructure Development
INVESTMENT DOLLARS
The Mat-Su Borough has significant opportunity, through increasing bed tax rates and market growth, to
generate substantial investment dollars for tourism infrastructure enhancements.
INFRASTRUCTURE SYNERGY
While visitor support service enhancements may have the best prospect for return on investment, the most
substantial tourism growth will occur through the synergistic effects of simultaneous development of visitor
support services, and highway and trail enhancements.
ECONOMIC ENHANCEMENT
Since a significant portion of Mat-Su’s visitor volume is short-stay through-traffic, infrastructure
enhancements should be successful in extending visitor’s time in the borough and creating economic benefits
as a result.
CAREFUL PLANNING
Conference and convention facilities rarely are profitable in their own right, so the location, sizing, and
operating efficiency of such facilities must be carefully planned.
PARTNERING LEVERAGE
Through partnering, the Mat-Su Borough’s investment dollars can be leveraged for much greater return.
A PROMISING FUTURE
Overall, the Mat-Su Borough has a promising future for tourism development, due to three major
contributing factors. First, the Mat-Su Borough has significant potential to increase its investment dollars.
Second, most infrastructure enhancements evaluated in this study will yield positive returns. Third, market
growth in both in-state and out-of-state markets has a positive outlook and the Mat-Su Borough is in a prime
position to capitalize.
Introduction and Methodology
Introduction and Methodology McDowell Group, Inc. • Page IM-1
Introduction and Methodology
The Matanuska-Susitna Borough contracted with the McDowell Group project team to develop an
independent study of the regional visitor industry. The primary purpose of the study was to identify
infrastructure development opportunities that would increase overnight stays in the Mat-Su region, enhance
economic and employment opportunities for residents, and improve the experience for in-state and out-of-
state visitors.
Study Team Overview
The study was led by McDowell Group, drawing on project management and staff support from the
company’s Anchorage and Juneau offices. Anchorage-based Boutet Company contributed to the Assessment
of Existing Infrastructure and final analysis and recommendations—particularly in the area of transportation
and trail system enhancements. Seattle-based Klugherz & Associates participated in the initial site visit and
identification of infrastructure needs at each stage of the study. Klugherz & Associates also led the project
team’s efforts in exploring partnering opportunities for each development recommendation. Juneau-based
MRV Architects supported the project team by developing estimates of construction and other capital cost for
the conference facilities.
Methodology
Shortly after the commencement of the project, the study team met with the Borough’s Economic
Development Director to refine the scope of the project and identify key contacts. Study team members from
McDowell Group and Klugherz & Associates also conducted a three-day site visit, which provided an
opportunity to personally experience key infrastructure in the borough, and conduct interviews with visitor
industry representatives, business owners, and other government officials.
Concurrently, the study team began compilation of information needed to develop an assessment of the
region’s existing tourism infrastructure. To supplement publicly available data and facility information, the
study team conducted interviews with industry experts, property and land managers, and Borough and
community government officials. (A list of project contacts, data sources, and other resources can be found in
the Appendix.) The team also reviewed available State, Borough and community comprehensive plans, land
use plans, transportation plans, and other documents referencing the need or goals to improve any
component that affects tourism infrastructure in the borough. Finally, the study team used its own industry
expertise to further assess the adequacy of current infrastructure.
Report Organization
GEOGRAPHIC OVERVIEW
This section provides a brief description of the geographic, scenic and recreational attributes in the region. It
also provides a short description of the five unique regions within the borough as defined by the Mat-Su
Convention and Visitors Bureau.
Introduction and Methodology McDowell Group, Inc. • Page IM-2
BASE CASE TOURISM INFRASTRUCTURE DESCRIPTION
This section includes detailed information regarding existing infrastructure and gaps including
accommodations, meeting facilities, sports facilities, other public venues, parks, campgrounds, boat launches,
trails and transportation.
MAT-SU VISITOR MARKETS
The study includes an analysis of the region’s current in-state and out-of-state visitor markets including visitor
volume, spending, locations visited, and activities within the borough. The section also includes a market
outlook discussion and implications for regional tourism infrastructure.
ASSESSMENT OF TOURISM INDUSTRY VALUE
The study team examined different measures of tourism industry value, such as bed tax receipts, state
employment income figures, number of tourism businesses, etc. This section also includes an estimate of
direct, indirect and induced economic benefits and a discussion of the intrinsic value of tourism.
NEEDED TOURISM INFRASTRUCTURE IMPROVEMENTS
This portion of the study examines how potential infrastructure improvements could enhance the regional
tourism industry by enhancing the visitor experience, increasing the number of overnight stays, and
contribute the most to overall economic return. This chapter also includes a discussion of large destination
and attraction projects in the region and funding approaches.
FOCUS AREAS FOR TOURISM IMPROVEMENT
This portion of the study addresses specific questions provided by the Borough related to infrastructure value
and need.
TOURISM PARTNERING OPPORTUNITIES
The study team provides a summary of national trends in partnering, including ways in which tourism
entities, government, private land owners and others can partner to increase the effectiveness of public
dollars spent on tourism development.
APPENDICES
There are four Appendix sections included at the back of the report.
APPENDIX A
Appendix A contains information that supports the Base Case Tourism Infrastructure Description section. This
appendix provides tables and text describing current tourism-related infrastructure in the borough.
Information on accommodations, sports facilities, Alaska State fairground facilities, museums, campgrounds,
parks, recreational areas, trails and transportation infrastructure in the region can be found in Appendix A.
Introduction and Methodology McDowell Group, Inc. • Page IM-3
APPENDIX B
Supplemental information from the Mat-Su Visitor Markets section of the report can be found in Appendix B.
This appendix includes more detailed information about special events and two significant attractions: the
Alaska State Fair and Hatcher Pass.
APPENDIX C
Appendix C includes details regarding size, construction cost, and other information that supports the
Needed Tourism Infrastructure Improvements section. For example, supplemental information is provided on
potential market increases from meeting facilities, road system enhancements and trail system enhancements,
as well as development costs.
APPENDIX D
Appendix D includes a list of project contacts and data and information sources. A number of individuals
were contacted and provided information that contributed to the development of the project. Additionally, a
number of sources were used to obtain visitor volume estimates, expenditure estimates and information
about visitors’ activities within the Mat-Su region.
APPENDIX E
Appendix E includes Montana Tourism Infrastructure Investment Program Guidelines 2007.

Geographic Overview
Tourism Infrastructure Needs Study: Geographic Overview McDowell Group, Inc. • Page GO-1
Geographic Overview
The Matanuska-Susitna Borough (commonly referred to as the Mat-Su Borough) is the fastest growing area of
Alaska and the nation’s third-fastest growing county/borough. It is bordered by Denali Borough to the north
and Anchorage to the south. The majority of the borough’s 80,000 residents live in (or near) the cities of
Palmer and Wasilla. The balance of the population is distributed within approximately 20 unincorporated
communities throughout the borough. The larger population centers of Houston, Big Lake, Willow, Sutton,
Trapper Creek and Talkeetna are located close to the state highways that transect the region.
Areas of the Mat-Su Borough can be reached by road, railway and air; this high level of accessibility is critical
to the success of the borough’s tourism industry. The George Parks Highway provides access to state and
national parks, and other destinations to the north. The Glenn Highway provides access to the southeastern
section of the borough, including the Matanuska Glacier and the Chugach Mountains. The Alaska Railroad
provides service between Anchorage and Fairbanks, with regularly scheduled stops in Wasilla and Talkeetna.
In addition to the airports in Palmer, Talkeetna and Wasilla, the region also offers several public and private
airfields and floatplane bases.
The Mat-Su Borough encompasses approximately 25,000 square miles of mountains, lakes, rivers, streams,
rolling lowlands and valleys. There are 24 state parks and recreation areas, including Independence Mine
State Historic Park at Hatcher Pass, which attracts visitors year-round. Denali State Park is located on the
borough's northern edge. Denali National Park, home to North America’s highest mountain, is one of Alaska’s
most popular attractions. The borough shares this National Park with the Denali Borough, with about 30
percent of the National Park located in the Mat-Su Borough. These parks provide a variety of year-round
recreational activities for local residents, in-state residents and out-of-state visitors.
Popular summer activities for local residents and visitors include salmon, trout and grayling fishing, hunting,
boating, golfing, mountain climbing, kayaking, rafting, flightseeing, gold panning and horseback riding.
During the winter, recreational activities include skiing, snowshoeing, skating, dog sledding, ice fishing and
snowmobiling. Denali National Park, Denali State Park, Independence Mine State Historical Park and the areas
around Matanuska and Knik Glaciers are especially popular areas for hiking, skiing and camping.
The borough hosts the Iron Dog Snow Machine Race and the Alaska State Fair. Additionally, the famous
Iditarod Trail Sled Dog Race winds through the Valley each March. Thousands of visitors attend these events
each year. There are a number of heritage sites and museums in the region, including the Iditarod Park,
Independence Mine State Historical Park, Dorothy Page Museum, Sutton Alpine Historical Park and many
others.
The Mat-Su Convention and Visitors Bureau promotes the region’s scenic, historic and recreational attributes
to Alaska residents and a wide array of non-resident visitors. Additional marketing and visitor information
support is provided by several local chambers of commerce.
Tourism Infrastructure Needs Study: Geographic Overview McDowell Group, Inc. • Page GO-2
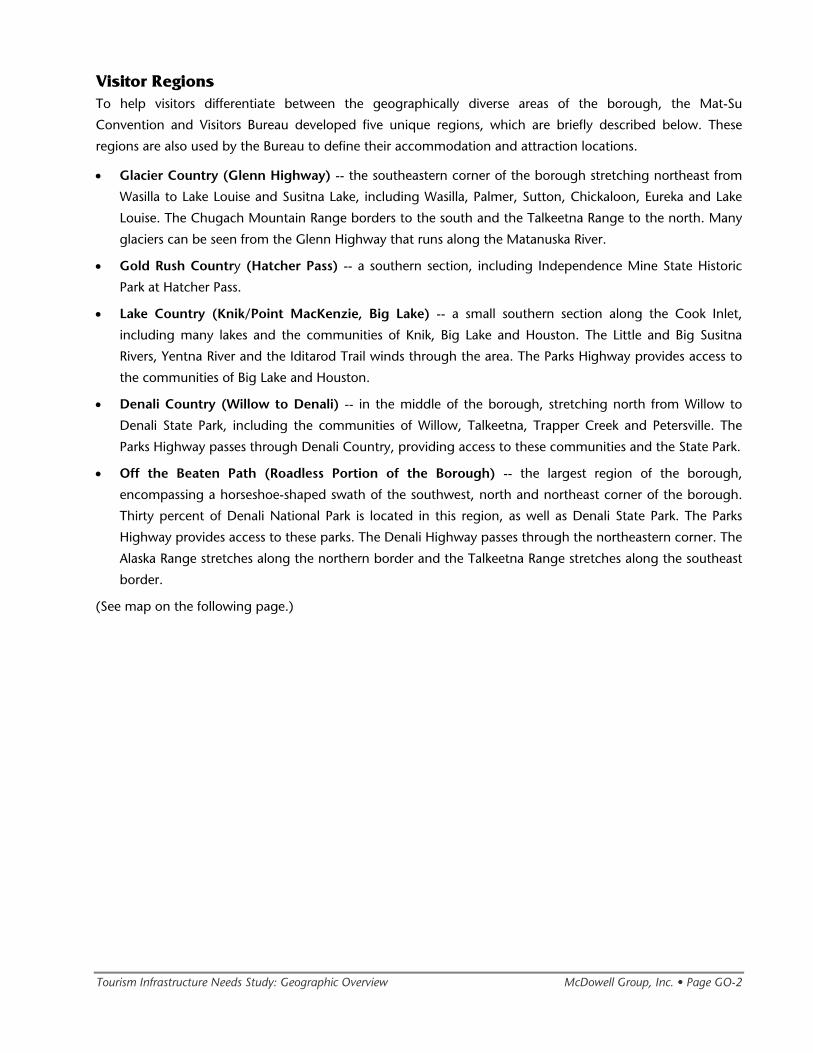
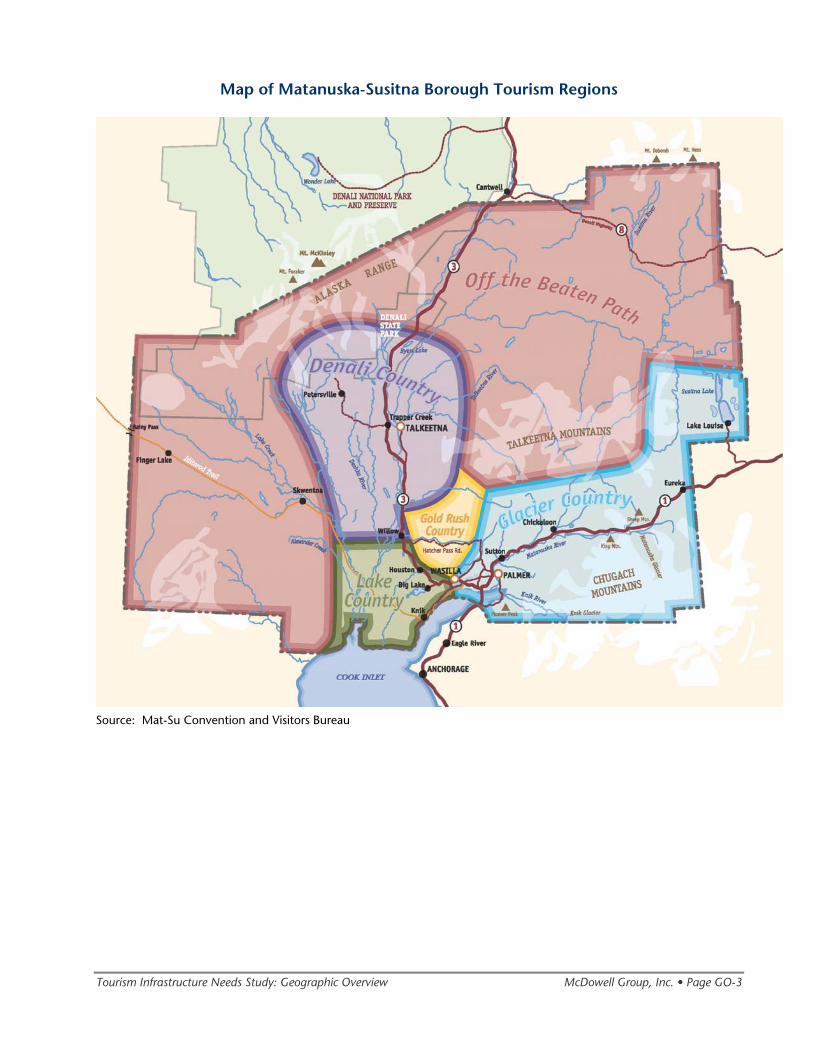
Visitor Regions To help visitors differentiate between the geographically diverse areas of the borough, the Mat-Su
Convention and Visitors Bureau developed five unique regions, which are briefly described below. These
regions are also used by the Bureau to define their accommodation and attraction locations.
• Glacier Country (Glenn Highway) -- the southeastern corner of the borough stretching northeast from
Wasilla to Lake Louise and Susitna Lake, including Wasilla, Palmer, Sutton, Chickaloon, Eureka and Lake
Louise. The Chugach Mountain Range borders to the south and the Talkeetna Range to the north. Many
glaciers can be seen from the Glenn Highway that runs along the Matanuska River.
• Gold Rush Country (Hatcher Pass) -- a southern section, including Independence Mine State Historic
Park at Hatcher Pass.
• Lake Country (Knik/Point MacKenzie, Big Lake) -- a small southern section along the Cook Inlet,
including many lakes and the communities of Knik, Big Lake and Houston. The Little and Big Susitna
Rivers, Yentna River and the Iditarod Trail winds through the area. The Parks Highway provides access to
the communities of Big Lake and Houston.
• Denali Country (Willow to Denali) -- in the middle of the borough, stretching north from Willow to
Denali State Park, including the communities of Willow, Talkeetna, Trapper Creek and Petersville. The
Parks Highway passes through Denali Country, providing access to these communities and the State Park.
• Off the Beaten Path (Roadless Portion of the Borough) -- the largest region of the borough,
encompassing a horseshoe-shaped swath of the southwest, north and northeast corner of the borough.
Thirty percent of Denali National Park is located in this region, as well as Denali State Park. The Parks
Highway provides access to these parks. The Denali Highway passes through the northeastern corner. The
Alaska Range stretches along the northern border and the Talkeetna Range stretches along the southeast
border.
(See map on the following page.)
Tourism Infrastructure Needs Study: Geographic Overview McDowell Group, Inc. • Page GO-3
Map of Matanuska-Susitna Borough Tourism Regions
Source: Mat-Su Convention and Visitors Bureau
Base Case Tourism Infrastructure
Description
Base Case Tourism Infrastructure Description McDowell Group, Inc. • Page A-1
Introduction
The Base-Case Tourism Infrastructure Description provides a description of the existing tourism
infrastructure in the Borough. For the purpose of this study, tourism infrastructure refers to developed
facilities that are used by visitors when they are traveling through and visiting the Mat-Su Borough.
The tourism infrastructure examined in this report is grouped into the following categories:
accommodations, meeting facilities used for conventions or conferences; sports facilities, such as ice
arenas, soccer or baseball fields; other public venues, such as the Alaska State Fair Grounds, performance
halls, museums, and visitor’s centers; parks campgrounds, boat launches and trails; transportation, such
as roads, railroads and airports; and public restroom facilities.
The following sections provide an analysis of each infrastructure category, assessing the types of facilities
available, quantity, condition, and challenges.
Base Case Tourism Infrastructure Description McDowell Group, Inc. • Page A-2
Accommodations
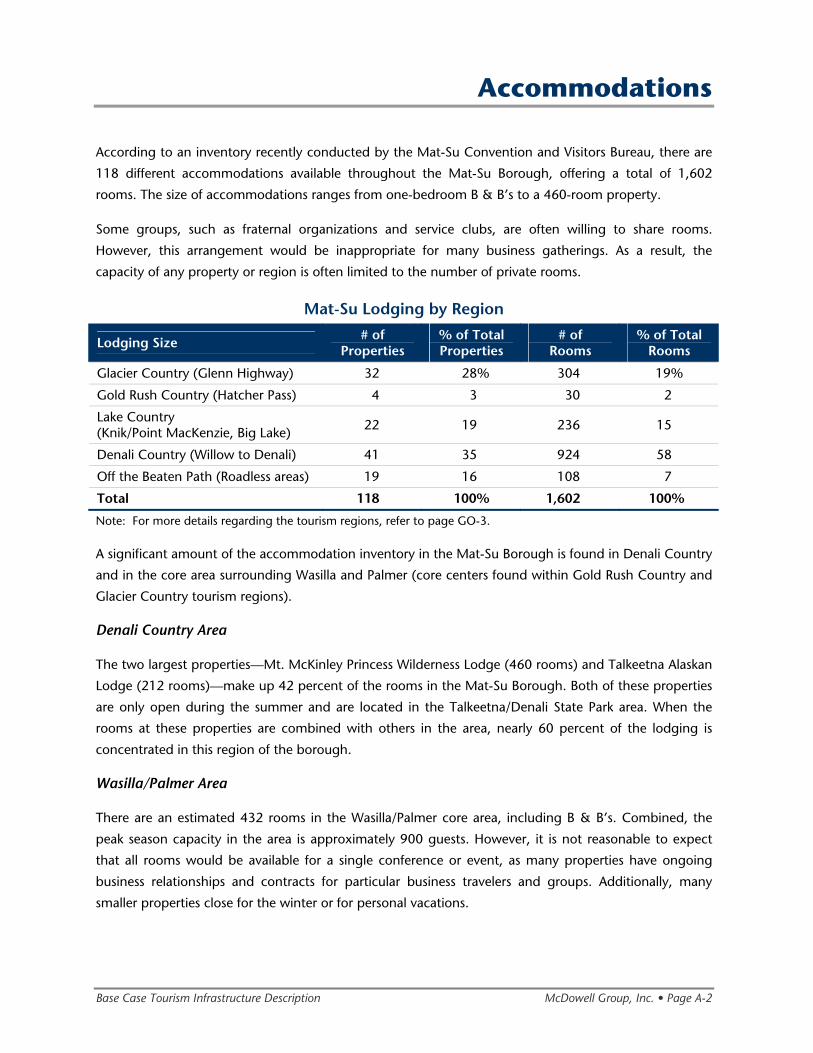
According to an inventory recently conducted by the Mat-Su Convention and Visitors Bureau, there are
118 different accommodations available throughout the Mat-Su Borough, offering a total of 1,602
rooms. The size of accommodations ranges from one-bedroom B & B’s to a 460-room property.
Some groups, such as fraternal organizations and service clubs, are often willing to share rooms.
However, this arrangement would be inappropriate for many business gatherings. As a result, the
capacity of any property or region is often limited to the number of private rooms.
Mat-Su Lodging by Region
Lodging Size # of Properties
% of Total Properties
# of Rooms
% of Total Rooms
Glacier Country (Glenn Highway) 32 28% 304 19%
Gold Rush Country (Hatcher Pass) 4 3 30 2
Lake Country (Knik/Point MacKenzie, Big Lake) 22 19 236 15
Denali Country (Willow to Denali) 41 35 924 58
Off the Beaten Path (Roadless areas) 19 16 108 7
Total 118 100% 1,602 100%
Note: For more details regarding the tourism regions, refer to page GO-3.
A significant amount of the accommodation inventory in the Mat-Su Borough is found in Denali Country
and in the core area surrounding Wasilla and Palmer (core centers found within Gold Rush Country and
Glacier Country tourism regions).
Denali Country Area
The two largest properties—Mt. McKinley Princess Wilderness Lodge (460 rooms) and Talkeetna Alaskan
Lodge (212 rooms)—make up 42 percent of the rooms in the Mat-Su Borough. Both of these properties
are only open during the summer and are located in the Talkeetna/Denali State Park area. When the
rooms at these properties are combined with others in the area, nearly 60 percent of the lodging is
concentrated in this region of the borough.
Wasilla/Palmer Area
There are an estimated 432 rooms in the Wasilla/Palmer core area, including B & B’s. Combined, the
peak season capacity in the area is approximately 900 guests. However, it is not reasonable to expect
that all rooms would be available for a single conference or event, as many properties have ongoing
business relationships and contracts for particular business travelers and groups. Additionally, many
smaller properties close for the winter or for personal vacations.
Base Case Tourism Infrastructure Description McDowell Group, Inc. • Page A-3
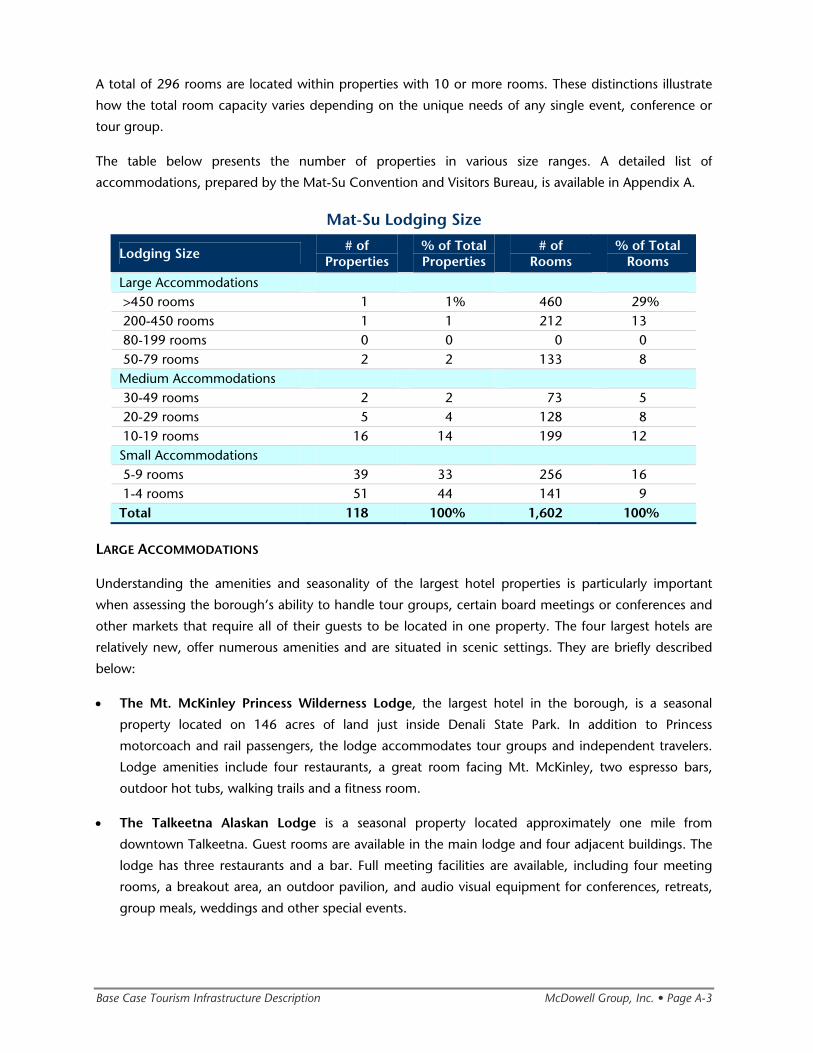
A total of 296 rooms are located within properties with 10 or more rooms. These distinctions illustrate
how the total room capacity varies depending on the unique needs of any single event, conference or
tour group.
The table below presents the number of properties in various size ranges. A detailed list of
accommodations, prepared by the Mat-Su Convention and Visitors Bureau, is available in Appendix A.
Mat-Su Lodging Size
Lodging Size # of Properties
% of Total Properties
# of Rooms
% of Total Rooms
Large Accommodations >450 rooms 1 1% 460 29% 200-450 rooms 1 1 212 13 80-199 rooms 0 0 0 0 50-79 rooms 2 2 133 8 Medium Accommodations 30-49 rooms 2 2 73 5 20-29 rooms 5 4 128 8 10-19 rooms 16 14 199 12 Small Accommodations 5-9 rooms 39 33 256 16 1-4 rooms 51 44 141 9 Total 118 100% 1,602 100%
LARGE ACCOMMODATIONS
Understanding the amenities and seasonality of the largest hotel properties is particularly important
when assessing the borough’s ability to handle tour groups, certain board meetings or conferences and
other markets that require all of their guests to be located in one property. The four largest hotels are
relatively new, offer numerous amenities and are situated in scenic settings. They are briefly described
below:
• The Mt. McKinley Princess Wilderness Lodge, the largest hotel in the borough, is a seasonal
property located on 146 acres of land just inside Denali State Park. In addition to Princess
motorcoach and rail passengers, the lodge accommodates tour groups and independent travelers.
Lodge amenities include four restaurants, a great room facing Mt. McKinley, two espresso bars,
outdoor hot tubs, walking trails and a fitness room.
• The Talkeetna Alaskan Lodge is a seasonal property located approximately one mile from
downtown Talkeetna. Guest rooms are available in the main lodge and four adjacent buildings. The
lodge has three restaurants and a bar. Full meeting facilities are available, including four meeting
rooms, a breakout area, an outdoor pavilion, and audio visual equipment for conferences, retreats,
group meals, weddings and other special events.
Base Case Tourism Infrastructure Description McDowell Group, Inc. • Page A-4
• Grand View Inn and Suites is located in Wasilla. Each unit has a kitchen equipped with full-sized
appliances. Hotel amenities include banquet and convention rooms, a restaurant and bar, a
swimming pool and fitness center.
• The Best Western Lake Lucille Inn is located in Wasilla. Hotel amenities include a restaurant,
lounge, lakeside gazebo, fitness club and meeting facilities. The onsite banquet facilities can
accommodate up to 350 people; however, the onsite banquet facilities have recently been closed.
MEDIUM ACCOMMODATIONS
Medium-size accommodations in the borough range from 10 to 50 rooms, and make up 20 percent of
total properties. On their own, each of the medium-sized properties can accommodate a small tour
group, meeting or retreat. The market for overnight accommodation in the borough is highly seasonal,
with the highest occupancy rates occurring in the summer. Several of the accommodations in this size
range close in the winter.
SMALL ACCOMMODATIONS
Small accommodations, ranging from one to nine rooms, make up the majority of properties in the
borough (76 percent). Many of the small accommodations in the borough are B & B’s, of which most
are spread along the Glenn and Parks Highways. These B & B’s range from high-end accommodations
with many amenities like jacuzzis, fireplaces, etc., to casual accommodations consisting of simple
bedrooms in family homes. Several smaller properties close for the winter. Those that remain open for
the winter attract visitors for skiing, snowmobiling and snowshoeing. For example, visitors to the Sheep
Mountain Lodge and the Matanuska Glacier Lodge along the Glenn Highway have access to groomed
cross country ski trails and opportunities to snowmobile and snowshoe in the Talkeetna mountain range.
Additionally, visitors to the Motherlode Lodge and Hatcher Pass Lodge in the Independence Mine State
Historic Park also have access to snowmobiling and cross country skiing.
Base Case Tourism Infrastructure Description McDowell Group, Inc. • Page A-5
Summary of Accommodations Observations
• The market for overnight accommodation is highly seasonal, with the highest occupancy rates
occurring in the summer. Along with the two largest hotel properties, several medium and small
properties also close in the winter.
• Three out of five rooms are located in Denali Country (see map, page GO-3). This concentration is
reflective of the high demand for viewing Mt. McKinley among Alaska residents and visitors.
Increased South Denali access, coupled with continued visitor industry growth, is very likely to spur
additional demand and hotel growth in this area.
• In the summer months, Talkeetna’s accommodations are typically booked. Currently, Talkeetna lacks
an adequate number of accommodation facilities to support current and future market demand.
• The total number of rooms in the Wasilla/Palmer area ranges from nearly 300 to 432, depending on
the criteria for size, location and seasonality. The number of rooms concentrated in a specific area is
an important guideline to consider when contemplating current and future needs for event,
conference and performance venues.
• Small accommodations, consisting of one to nine rooms, make up the majority of accommodations
in the borough (76 percent). Usually B & B’s or small lodges, these types of accommodations are
found in all regions of the borough, both on and off the road system.
Base Case Tourism Infrastructure Description McDowell Group, Inc. • Page A-6
Meeting Facilities
Rapid business and population growth in the Wasilla/Palmer area has resulted in a higher profile for Mat-
Su and greater opportunities for conferences and events. The region’s inherent appeal as a destination is
enhanced by fairly quick access for meeting attendees making travel connections via Anchorage.
Small and mid-sized meeting facilities are available throughout the Mat-Su Borough. The smaller, more
remote properties are often used for staff or board retreats. The larger facilities host a variety of
meetings, conferences and events. However, there are a number of limitations that preclude the region
from competing on a larger scale for this market.
From a meeting planner perspective, ideal convention and conference facilities offer the flexibility to
reconfigure rooms as needed for trade shows and large meeting areas for plenary sessions, receptions,
breakout rooms and onsite dining. The facility should be large enough that a group can efficiently move
between meeting and banquet functions throughout the course of a day. Although in-state conferences
and conventions are typically more willing to meet in a facility that is separate from guest rooms, it is a
competitive disadvantage as the meeting planner has to factor in the added time and expense for
transferring meeting attendees between venues.
This section discusses the meeting facilities available in the Borough and provides details regarding their
capacity and availability of banquet facilities and lodging. The meeting facility section is divided into
“Trade Shows/Large Event Gathering Space,” “Large Meeting Spaces,“ “Medium Meeting Spaces” and
“Small Meeting Spaces.” There is also a short assessment of meeting facilities.
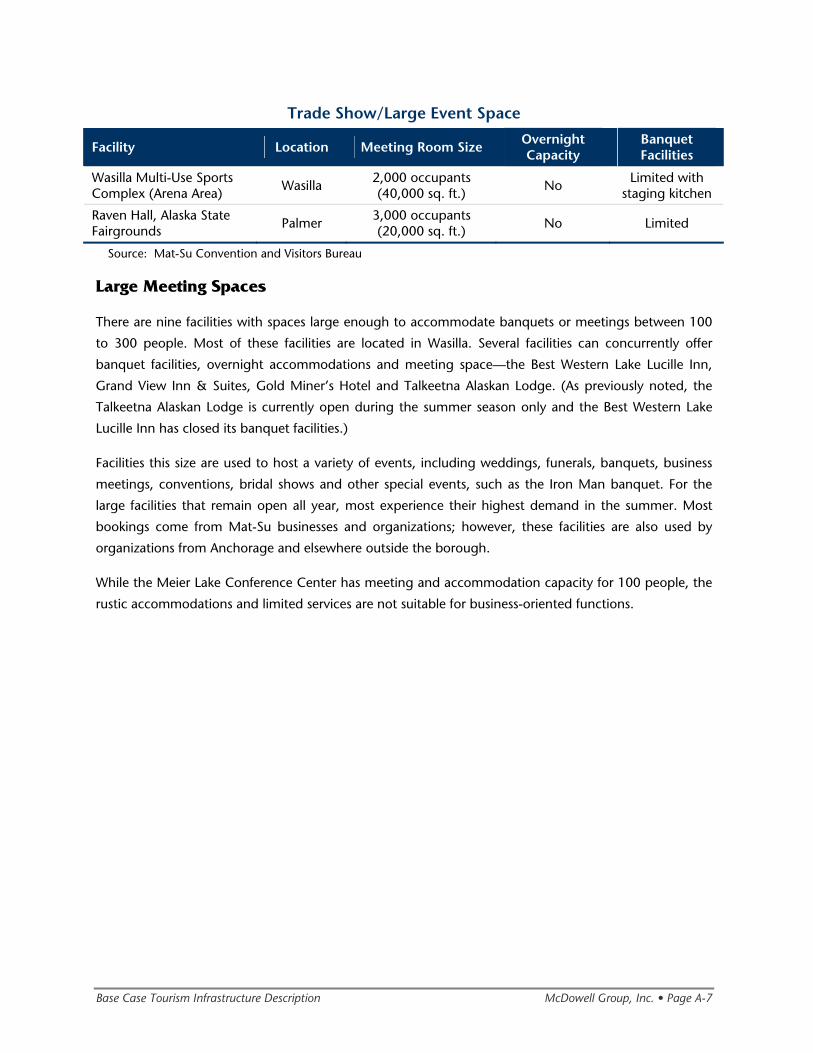
Trade Show/Large Event Gathering Space
Two facilities can accommodate large trade shows or indoor events, the Wasilla Multi-Use Sports
Complex and Raven Hall on the Alaska State Fairgrounds. While these facilities offer adequate size, they
lack the comprehensive services and flexibility needed to make them ideal conference or convention
locations. Both facilities are located in the core Wasilla/Palmer area.
The Wasilla Multi-Use Sports Complex offers meeting space that can be divided into three smaller rooms
or opened to seat up to 90 people. While it is possible to use the ice area and associated seating for
trade shows, concerts or other special events, the Complex has seasonal commitments for the ice rink
that preclude most non-skating events between fall and spring. While limited kitchen facilities will be
installed soon, lack of full-service banquet facilities further limits the type of events held at the Complex.
The 20,000 sq. ft. Raven Hall is the newest structure on the Alaska State Fairgrounds. The hall has
overhead doors, high ceilings, restrooms, a developing kitchen area, electrical power and phone lines.
The hall has been used for small conventions, trade/consumer shows, exhibitions, the Governor’s
Inaugural Ball and large meetings. The facility does not offer the ability to breakout into smaller meeting
spaces, banquet services or the other amenities required for multi-day events.
Base Case Tourism Infrastructure Description McDowell Group, Inc. • Page A-7
Trade Show/Large Event Space
Facility Location Meeting Room Size Overnight Capacity
Banquet Facilities
Wasilla Multi-Use Sports Complex (Arena Area) Wasilla
2,000 occupants (40,000 sq. ft.) No
Limited with staging kitchen
Raven Hall, Alaska State Fairgrounds Palmer
3,000 occupants (20,000 sq. ft.) No Limited
Source: Mat-Su Convention and Visitors Bureau
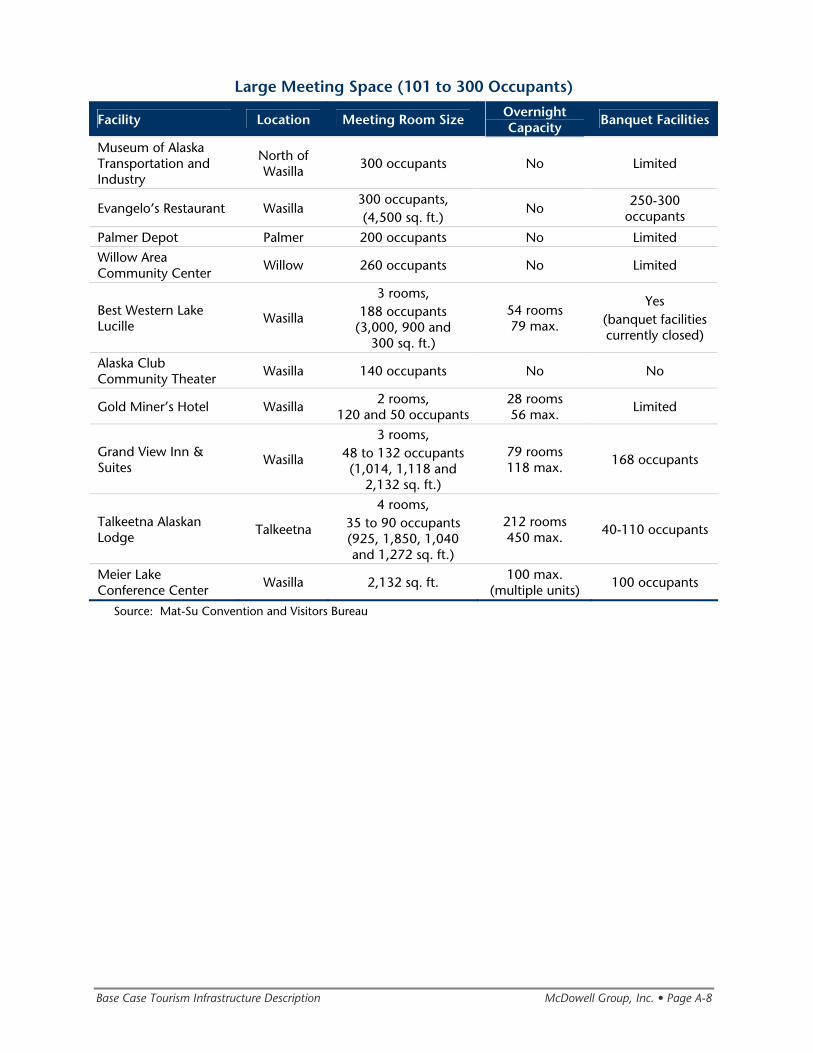
Large Meeting Spaces
There are nine facilities with spaces large enough to accommodate banquets or meetings between 100
to 300 people. Most of these facilities are located in Wasilla. Several facilities can concurrently offer
banquet facilities, overnight accommodations and meeting space—the Best Western Lake Lucille Inn,
Grand View Inn & Suites, Gold Miner’s Hotel and Talkeetna Alaskan Lodge. (As previously noted, the
Talkeetna Alaskan Lodge is currently open during the summer season only and the Best Western Lake
Lucille Inn has closed its banquet facilities.)
Facilities this size are used to host a variety of events, including weddings, funerals, banquets, business
meetings, conventions, bridal shows and other special events, such as the Iron Man banquet. For the
large facilities that remain open all year, most experience their highest demand in the summer. Most
bookings come from Mat-Su businesses and organizations; however, these facilities are also used by
organizations from Anchorage and elsewhere outside the borough.
While the Meier Lake Conference Center has meeting and accommodation capacity for 100 people, the
rustic accommodations and limited services are not suitable for business-oriented functions.
Base Case Tourism Infrastructure Description McDowell Group, Inc. • Page A-8
Large Meeting Space (101 to 300 Occupants)
Facility Location Meeting Room Size Overnight Capacity Banquet Facilities
Museum of Alaska Transportation and Industry
North of Wasilla 300 occupants No Limited
Evangelo’s Restaurant Wasilla 300 occupants, (4,500 sq. ft.)
No 250-300 occupants
Palmer Depot Palmer 200 occupants No Limited Willow Area Community Center
Willow 260 occupants No Limited
Best Western Lake Lucille
Wasilla
3 rooms, 188 occupants
(3,000, 900 and 300 sq. ft.)
54 rooms 79 max.
Yes (banquet facilities currently closed)
Alaska Club Community Theater
Wasilla 140 occupants No No
Gold Miner’s Hotel Wasilla 2 rooms, 120 and 50 occupants
28 rooms 56 max.
Limited
Grand View Inn & Suites
Wasilla
3 rooms, 48 to 132 occupants (1,014, 1,118 and
2,132 sq. ft.)
79 rooms 118 max.
168 occupants
Talkeetna Alaskan Lodge
Talkeetna
4 rooms, 35 to 90 occupants (925, 1,850, 1,040 and 1,272 sq. ft.)
212 rooms 450 max.
40-110 occupants
Meier Lake Conference Center
Wasilla 2,132 sq. ft. 100 max. (multiple units)
100 occupants
Source: Mat-Su Convention and Visitors Bureau
Base Case Tourism Infrastructure Description McDowell Group, Inc. • Page A-9
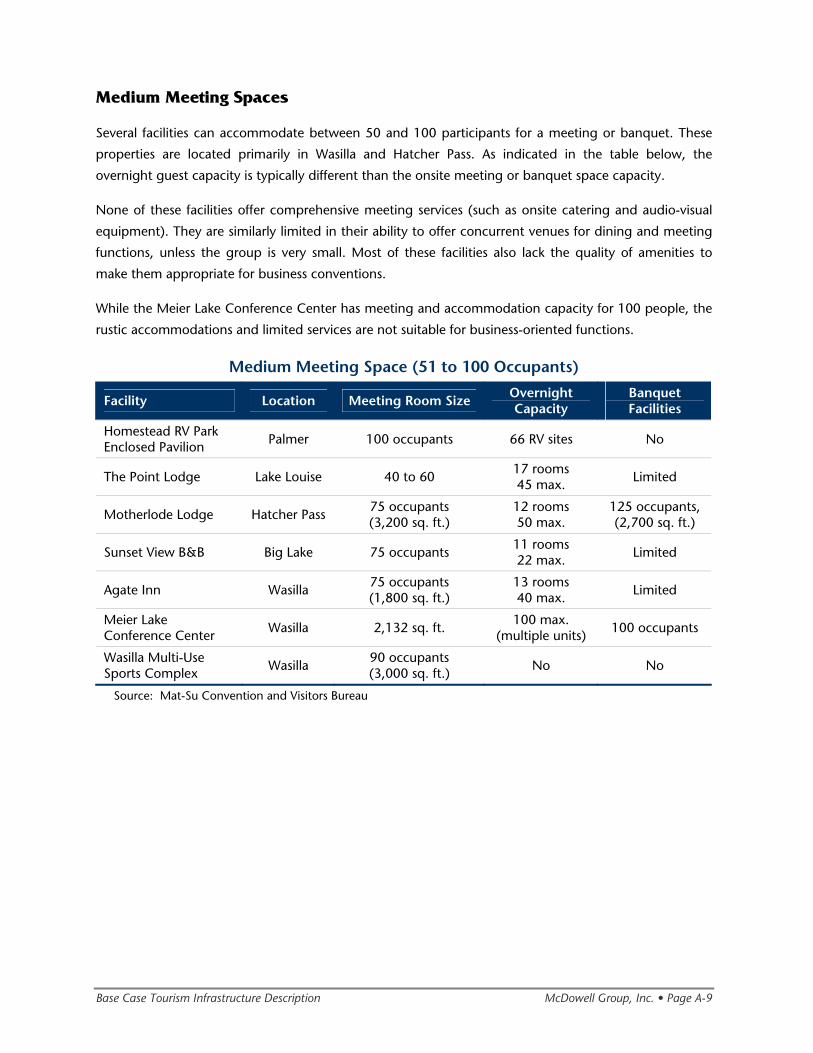
Medium Meeting Spaces
Several facilities can accommodate between 50 and 100 participants for a meeting or banquet. These
properties are located primarily in Wasilla and Hatcher Pass. As indicated in the table below, the
overnight guest capacity is typically different than the onsite meeting or banquet space capacity.
None of these facilities offer comprehensive meeting services (such as onsite catering and audio-visual
equipment). They are similarly limited in their ability to offer concurrent venues for dining and meeting
functions, unless the group is very small. Most of these facilities also lack the quality of amenities to
make them appropriate for business conventions.
While the Meier Lake Conference Center has meeting and accommodation capacity for 100 people, the
rustic accommodations and limited services are not suitable for business-oriented functions.
Medium Meeting Space (51 to 100 Occupants)
Facility Location Meeting Room Size Overnight Capacity
Banquet Facilities
Homestead RV Park Enclosed Pavilion Palmer 100 occupants 66 RV sites No
The Point Lodge Lake Louise 40 to 60 17 rooms 45 max. Limited
Motherlode Lodge Hatcher Pass 75 occupants (3,200 sq. ft.)
12 rooms 50 max.
125 occupants, (2,700 sq. ft.)
Sunset View B&B Big Lake 75 occupants 11 rooms 22 max. Limited
Agate Inn Wasilla 75 occupants (1,800 sq. ft.)
13 rooms 40 max. Limited
Meier Lake Conference Center Wasilla 2,132 sq. ft.
100 max. (multiple units) 100 occupants
Wasilla Multi-Use Sports Complex Wasilla
90 occupants (3,000 sq. ft.) No No
Source: Mat-Su Convention and Visitors Bureau
Base Case Tourism Infrastructure Description McDowell Group, Inc. • Page A-10
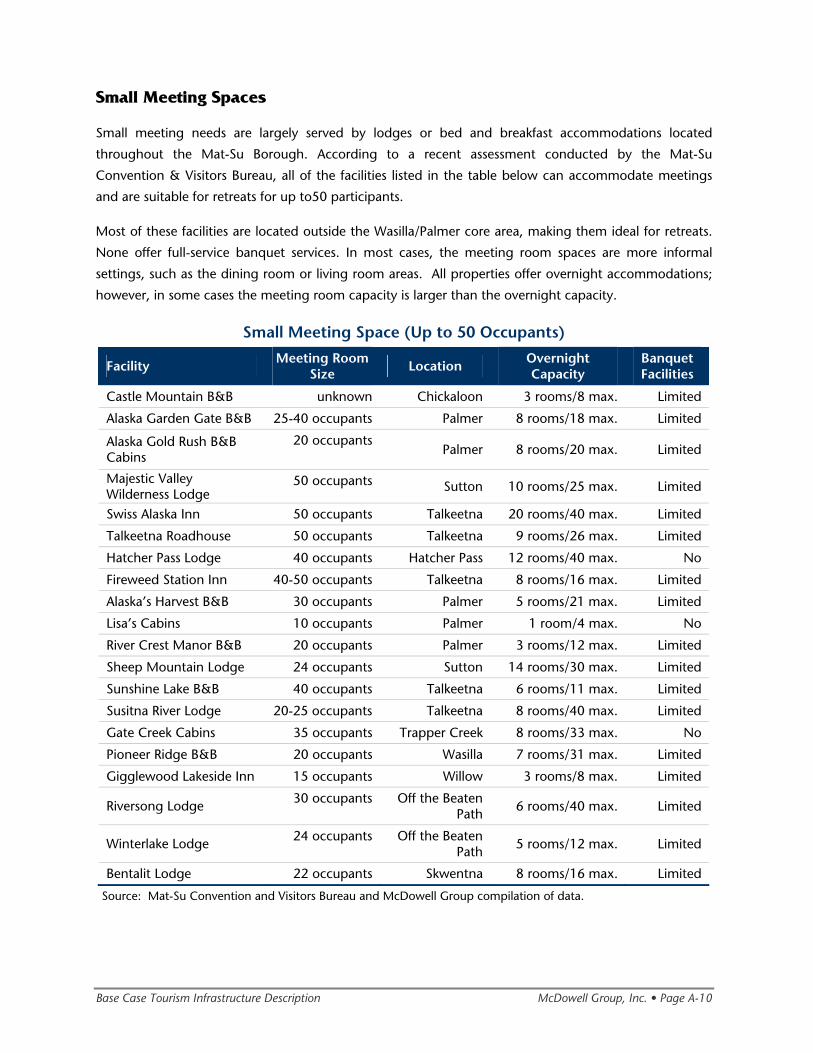
Small Meeting Spaces
Small meeting needs are largely served by lodges or bed and breakfast accommodations located
throughout the Mat-Su Borough. According to a recent assessment conducted by the Mat-Su
Convention & Visitors Bureau, all of the facilities listed in the table below can accommodate meetings
and are suitable for retreats for up to50 participants.
Most of these facilities are located outside the Wasilla/Palmer core area, making them ideal for retreats.
None offer full-service banquet services. In most cases, the meeting room spaces are more informal
settings, such as the dining room or living room areas. All properties offer overnight accommodations;
however, in some cases the meeting room capacity is larger than the overnight capacity.
Small Meeting Space (Up to 50 Occupants)
Facility Meeting Room Size Location Overnight
Capacity Banquet Facilities
Castle Mountain B&B unknown Chickaloon 3 rooms/8 max. Limited
Alaska Garden Gate B&B 25-40 occupants Palmer 8 rooms/18 max. Limited
Alaska Gold Rush B&B Cabins
20 occupants
Palmer 8 rooms/20 max. Limited
Majestic Valley Wilderness Lodge
50 occupants Sutton 10 rooms/25 max. Limited
Swiss Alaska Inn 50 occupants Talkeetna 20 rooms/40 max. Limited
Talkeetna Roadhouse 50 occupants Talkeetna 9 rooms/26 max. Limited
Hatcher Pass Lodge 40 occupants Hatcher Pass 12 rooms/40 max. No
Fireweed Station Inn 40-50 occupants Talkeetna 8 rooms/16 max. Limited
Alaska’s Harvest B&B 30 occupants Palmer 5 rooms/21 max. Limited
Lisa’s Cabins 10 occupants Palmer 1 room/4 max. No
River Crest Manor B&B 20 occupants Palmer 3 rooms/12 max. Limited
Sheep Mountain Lodge 24 occupants Sutton 14 rooms/30 max. Limited
Sunshine Lake B&B 40 occupants Talkeetna 6 rooms/11 max. Limited
Susitna River Lodge 20-25 occupants Talkeetna 8 rooms/40 max. Limited
Gate Creek Cabins 35 occupants Trapper Creek 8 rooms/33 max. No
Pioneer Ridge B&B 20 occupants Wasilla 7 rooms/31 max. Limited
Gigglewood Lakeside Inn 15 occupants Willow 3 rooms/8 max. Limited
Riversong Lodge 30 occupants Off the Beaten Path 6 rooms/40 max. Limited
Winterlake Lodge 24 occupants Off the Beaten Path 5 rooms/12 max. Limited
Bentalit Lodge 22 occupants Skwentna 8 rooms/16 max. Limited
Source: Mat-Su Convention and Visitors Bureau and McDowell Group compilation of data.
Base Case Tourism Infrastructure Description McDowell Group, Inc. • Page A-11
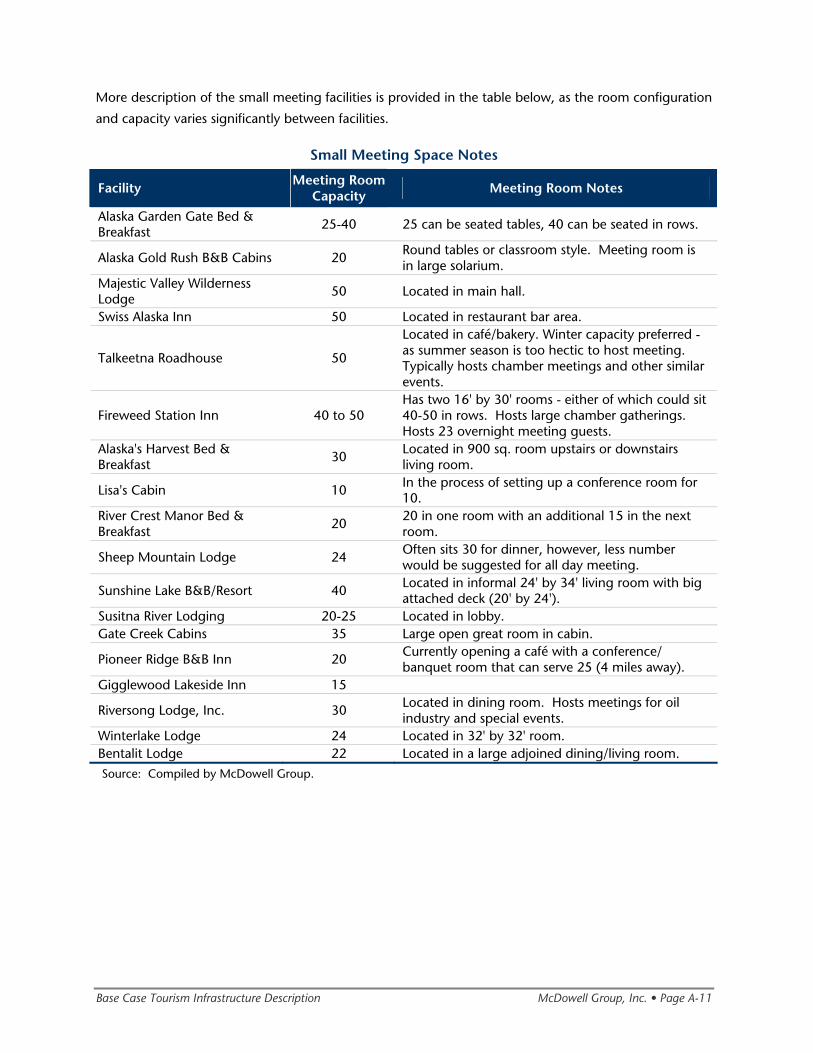
More description of the small meeting facilities is provided in the table below, as the room configuration
and capacity varies significantly between facilities.
Small Meeting Space Notes
Facility Meeting Room Capacity Meeting Room Notes
Alaska Garden Gate Bed & Breakfast 25-40 25 can be seated tables, 40 can be seated in rows.
Alaska Gold Rush B&B Cabins 20 Round tables or classroom style. Meeting room is in large solarium.
Majestic Valley Wilderness Lodge 50 Located in main hall.
Swiss Alaska Inn 50 Located in restaurant bar area.
Talkeetna Roadhouse 50
Located in café/bakery. Winter capacity preferred - as summer season is too hectic to host meeting. Typically hosts chamber meetings and other similar events.
Fireweed Station Inn 40 to 50 Has two 16' by 30' rooms - either of which could sit 40-50 in rows. Hosts large chamber gatherings. Hosts 23 overnight meeting guests.
Alaska's Harvest Bed & Breakfast 30 Located in 900 sq. room upstairs or downstairs
living room.
Lisa's Cabin 10 In the process of setting up a conference room for 10.
River Crest Manor Bed & Breakfast
20 20 in one room with an additional 15 in the next room.
Sheep Mountain Lodge 24 Often sits 30 for dinner, however, less number would be suggested for all day meeting.
Sunshine Lake B&B/Resort 40 Located in informal 24' by 34' living room with big attached deck (20' by 24').
Susitna River Lodging 20-25 Located in lobby. Gate Creek Cabins 35 Large open great room in cabin.
Pioneer Ridge B&B Inn 20 Currently opening a café with a conference/ banquet room that can serve 25 (4 miles away).
Gigglewood Lakeside Inn 15
Riversong Lodge, Inc. 30 Located in dining room. Hosts meetings for oil industry and special events.
Winterlake Lodge 24 Located in 32' by 32' room. Bentalit Lodge 22 Located in a large adjoined dining/living room. Source: Compiled by McDowell Group.
Base Case Tourism Infrastructure Description McDowell Group, Inc. • Page A-12
Summary of Meeting Facilities Observations
• The borough has a disadvantage as it competes with other destinations that have full-service
conference facilities with accommodations either located onsite or in close proximity.
• Any meeting or event that requires a single facility for sleeping rooms, meeting rooms and dining
facilities is limited to approximately 100 attendees. Because of ongoing commitments for guest
rooms and banquet rooms, the practical limit at any given time is likely between 50 and 80
attendees.
• The meeting facilities located within the Talkeetna Alaskan Lodge are an asset for attracting groups
and events—especially in the fall and spring. Other lodges and businesses in the surrounding area
are likely to benefit from increased marketing of this asset.
• While there are more than 400 guest rooms in the Wasilla/Palmer area, there is little full-service
meeting capacity available to accommodate groups that large.
Base Case Tourism Infrastructure Description McDowell Group, Inc. • Page A-13
Sports Facilities
Currently, the sports facilities in the Mat-Su Borough are largely designed for local residents. However,
these facilities offer the potential to draw visitors from outside the borough who may stay overnight to
participate in hockey, ice skating, soccer, baseball or other sport tournaments or competitions. This
section provides an overview of sports facilities that draw visitors from outside the Borough. Detailed
tables showing current sports facilities available in the Mat-Su Borough can be found in Appendix A.
Wasilla Multi-Use Sports Complex
The Wasilla Multi-Use Sports Complex offers the highest quality and broadest sports usage in the Mat-Su
Borough. Opened in 2004, the 102,000 sq. ft. facility offers four primary activity areas: a National
Hockey League-size ice arena, an indoor artificial turf court, a running/walking track and three
community meeting rooms. These primary activities comprise the first phase elements of the 60-acre
master plan for the complex.
The running track is elevated above and encircles the bleachers in the ice arena. Large windows allow
natural lighting and an outdoor view for walkers, joggers and runners.
OTHER SERVICES
A new trailhead facility was constructed to provide access to nearby Iditarod and Tesoro Iron Dog trail
systems. A paved road and utility corridor linking to the Parks Highway was recently constructed. A new
bike trail also provides access to a new area of the city. By October 2008, the complex hopes to have a
staging kitchen completed. While the primary purpose of this kitchen is to provide support should the
complex need to be used as an emergency evacuation shelter, the kitchen can also be used to cater
events at the facility.
PLANNED PHASE II ADDITIONS
Outdoor amenities make up the bulk of the planned phase II additions. These amenities include an
outdoor skating pond with covered warm-up and seating area, a football/track and field/speed-skating
oval with stadium seating, a soccer field, a high school/college-sized baseball/softball field with spectator
seating and onsite cross-country ski and running trails. There are also plans for limited campground
facilities and an RV Park. Phase II is expected to be completed between 2010 and 2012.
Adjacent to the complex grounds is land owned by five private owners. The owners are currently
planning to construct non-motorized trails that would link the complex to Lake Lucille Park. The
intention is that these trails would be open for public use at no charge. At some future point, the
owners may seek to develop the land for housing.
Base Case Tourism Infrastructure Description McDowell Group, Inc. • Page A-14
Ice Arenas
There are three indoor ice rinks in the Mat-Su Borough. All three are National Hockey League-size at 200
feet long by 85 feet wide. All arenas are of good quality, relatively new (within the past five years) or
recently renovated. The facilities are used largely by local residents from the Mat-Su and Anchorage
areas. Larger hockey tournaments and ice skating competitions may draw more Alaska residents from
outside of the Mat-Su/Anchorage region, but would probably require scheduling coordination between
the three facilities.
The largest ice arena is the Wasilla Multi-Use Sports Complex, accommodating 1,500 spectators for
games and skating competitions. Additional seating can be added for concerts and shows,
accommodating a total of 3,000 spectators. The fixed bleachers have heated seats. There are large
windows for natural lighting.
There are eight outdoor skating rinks throughout the borough.
Turf Court The Wasilla Multi-Use Sports Complex has the only turf court available in the Mat-Su Borough. The turf
court is 175 feet long by 75 feet wide. Divider curtains are available to separate the turf court into thirds
for rental of a smaller area. A safety net around the court prevents stray balls. There is an elevated
viewing area and large windows for natural lighting. Pullout bleachers accommodate up to 450
spectators.
Pools
There are two indoor swimming pools in the Mat-Su Borough. One pool is located at the Palmer High
School. The other is located at the Wasilla High School.
Gymnasiums
The Mat-Su Borough owns and manages a 6,000 sq. ft. gymnasium located in Palmer. Other public
gymnasiums are available at various schools throughout the Mat-Su Borough School District.
A new AT&T Sports Center was completed in January of 2008 on the Palmer-Wasilla Highway. This large
Sports Center is over 60,000 sq. ft. and houses amenities such as basketball courts, a running track and
fitness area. This facility seats 650 people and is already drawing visitors for tournaments.
Shooting Ranges
An indoor pistol shooting facility, Matanuska Valley Sportsmen Range, is located in Palmer. A shotgun
shooting club, Grouse Ridge Shooting Range, is located on Palmer-Fishhook Road in Wasilla. The Upper
Susitna Shooting Association’s range if located at mile 95 of the Parks Highway. Facilities are primarily
used by local residents from the Mat-Su and Anchorage areas.
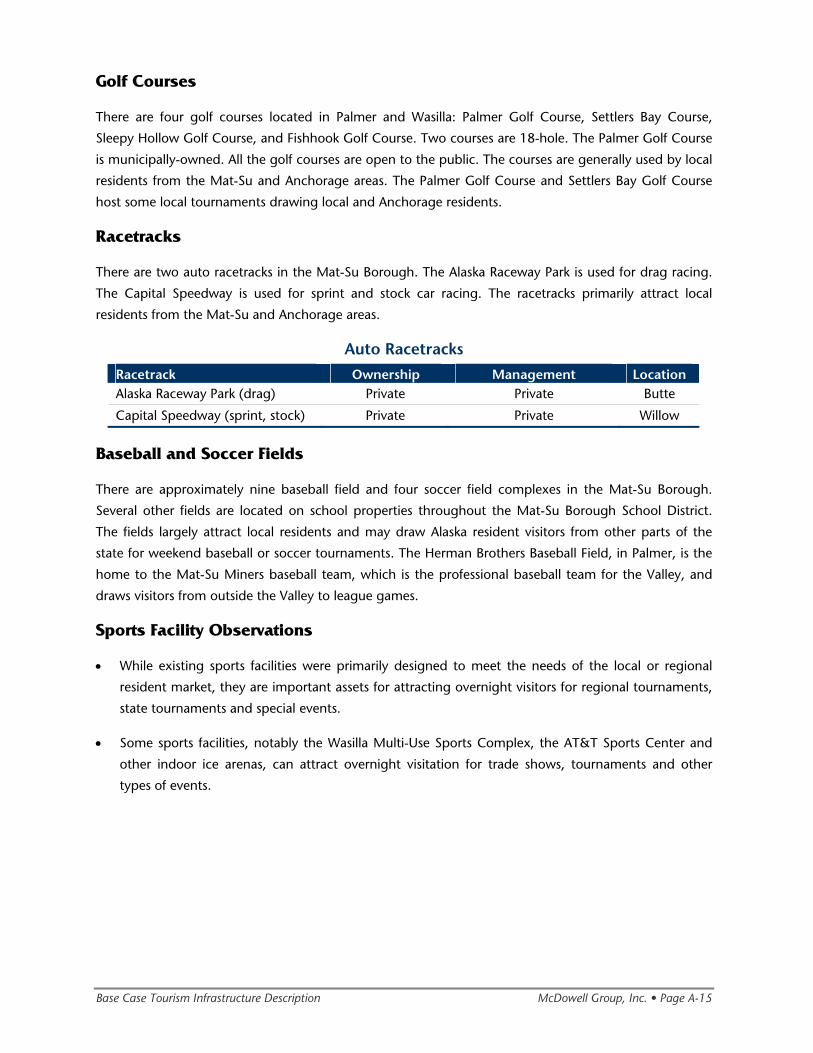
Base Case Tourism Infrastructure Description McDowell Group, Inc. • Page A-15
Golf Courses
There are four golf courses located in Palmer and Wasilla: Palmer Golf Course, Settlers Bay Course,
Sleepy Hollow Golf Course, and Fishhook Golf Course. Two courses are 18-hole. The Palmer Golf Course
is municipally-owned. All the golf courses are open to the public. The courses are generally used by local
residents from the Mat-Su and Anchorage areas. The Palmer Golf Course and Settlers Bay Golf Course
host some local tournaments drawing local and Anchorage residents.
Racetracks
There are two auto racetracks in the Mat-Su Borough. The Alaska Raceway Park is used for drag racing.
The Capital Speedway is used for sprint and stock car racing. The racetracks primarily attract local
residents from the Mat-Su and Anchorage areas.
Auto Racetracks
Racetrack Ownership Management Location Alaska Raceway Park (drag) Private Private Butte
Capital Speedway (sprint, stock) Private Private Willow
Baseball and Soccer Fields
There are approximately nine baseball field and four soccer field complexes in the Mat-Su Borough.
Several other fields are located on school properties throughout the Mat-Su Borough School District.
The fields largely attract local residents and may draw Alaska resident visitors from other parts of the
state for weekend baseball or soccer tournaments. The Herman Brothers Baseball Field, in Palmer, is the
home to the Mat-Su Miners baseball team, which is the professional baseball team for the Valley, and
draws visitors from outside the Valley to league games.
Sports Facility Observations
• While existing sports facilities were primarily designed to meet the needs of the local or regional
resident market, they are important assets for attracting overnight visitors for regional tournaments,
state tournaments and special events.
• Some sports facilities, notably the Wasilla Multi-Use Sports Complex, the AT&T Sports Center and
other indoor ice arenas, can attract overnight visitation for trade shows, tournaments and other
types of events.
Base Case Tourism Infrastructure Description McDowell Group, Inc. • Page A-16
Other Public Venues
The Other Public Venues section addresses non-sports types of facilities that serve as visitor attractions in
the Borough.
Alaska State Fairgrounds
In addition to the 12-day State Fair in late August, the Alaska State Fairgrounds hosts more than 50
events throughout the year. The events range from sports car rallies to religious events to 4-H and
livestock shows. Some events, such as the Girl Scouts Encampment, Camp Fire Alaska and the
Songwriters Camp, are multi-day events, while others are simply evening activities. There are no
overnight accommodations available on the fairgrounds. If hosting multi-day events, participants are
expected to sleep in their RVs, tents or in nearby offsite accommodations. While the Alaska State Fair
attracts visitors from all over the country, the events throughout the rest of year largely attract local or
regional residents. During the fall and winter months, Raven Hall, Colony Theatre and the Hoskins
Exhibits are the most often used facilities for a wide variety of events, such as concerts, gun shows,
classes, banquets, fundraisers and weddings. At least one of the permanent buildings is booked weekly
for events during the off-season months.
Several structures and facilities sit on the Alaska State Fair’s 299 acres. Some of these facilities are only
available during the summer season. A description of these facilities can be found in Appendix A.
Performance Halls
Mat-Su Borough’s performance halls are primarily located in Palmer and Wasilla. These halls can
accommodate small intimate audiences of 70 to larger audiences up to 260. Generally, the facilities are
older, relatively small, lack the ideal electrical lighting and sound technology (or space); have inadequate
back stage, wing and storage space; and require constant setup and takedown efforts because the
facilities have multiple uses. None of these facilities offer onsite banquet facilities or adjacent overnight
accommodations.
Colony High School has the largest hall and includes computerized lighting and sound systems. The
stage is large, but backstage facilities for theater productions are lacking. The Palmer High School has a
small intimate stage used for high school productions and includes a lighting and sound booth. The
Palmer Depot can seat up to 200. The Colony Theatre on the Alaska State Fairgrounds seats about 70
people and has a tech booth area, a lobby with restrooms and two changing rooms upstairs.
The Palmer Arts Council has recently hired an architect student to design a new arts building for a small
plot of land (105 by 150 feet) they recently purchased in downtown Palmer. The Council is seeking
funding support for its new building.
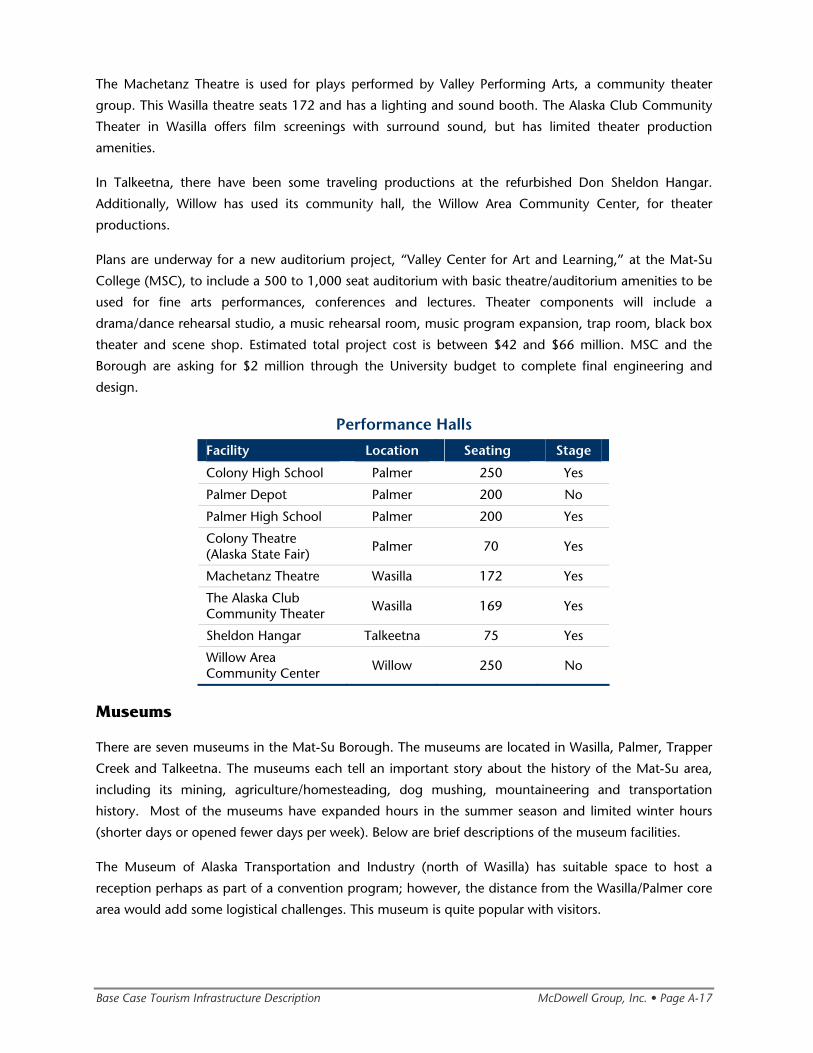
Base Case Tourism Infrastructure Description McDowell Group, Inc. • Page A-17
The Machetanz Theatre is used for plays performed by Valley Performing Arts, a community theater
group. This Wasilla theatre seats 172 and has a lighting and sound booth. The Alaska Club Community
Theater in Wasilla offers film screenings with surround sound, but has limited theater production
amenities.
In Talkeetna, there have been some traveling productions at the refurbished Don Sheldon Hangar.
Additionally, Willow has used its community hall, the Willow Area Community Center, for theater
productions.
Plans are underway for a new auditorium project, “Valley Center for Art and Learning,” at the Mat-Su
College (MSC), to include a 500 to 1,000 seat auditorium with basic theatre/auditorium amenities to be
used for fine arts performances, conferences and lectures. Theater components will include a
drama/dance rehearsal studio, a music rehearsal room, music program expansion, trap room, black box
theater and scene shop. Estimated total project cost is between $42 and $66 million. MSC and the
Borough are asking for $2 million through the University budget to complete final engineering and
design.
Performance Halls
Facility Location Seating Stage Colony High School Palmer 250 Yes
Palmer Depot Palmer 200 No
Palmer High School Palmer 200 Yes
Colony Theatre (Alaska State Fair) Palmer 70 Yes
Machetanz Theatre Wasilla 172 Yes
The Alaska Club Community Theater Wasilla 169 Yes
Sheldon Hangar Talkeetna 75 Yes
Willow Area Community Center Willow 250 No
Museums
There are seven museums in the Mat-Su Borough. The museums are located in Wasilla, Palmer, Trapper
Creek and Talkeetna. The museums each tell an important story about the history of the Mat-Su area,
including its mining, agriculture/homesteading, dog mushing, mountaineering and transportation
history. Most of the museums have expanded hours in the summer season and limited winter hours
(shorter days or opened fewer days per week). Below are brief descriptions of the museum facilities.
The Museum of Alaska Transportation and Industry (north of Wasilla) has suitable space to host a
reception perhaps as part of a convention program; however, the distance from the Wasilla/Palmer core
area would add some logistical challenges. This museum is quite popular with visitors.
Base Case Tourism Infrastructure Description McDowell Group, Inc. • Page A-18
The Palmer Museum of Art and History is co-located with the Palmer Visitor Center is planning to move
into its own building. The museum is run by the City of Palmer and is open year-round. In Wasilla, the
Dorothy Page Museum has high-quality exhibits. These and other museums in Wasilla and Palmer
organize numerous community and children’s programs to bring in local residents as well as visitors. A
description of museums in the Mat-Su Borough can be found in Appendix A.
Visitor Centers
BOROUGH AND COMMUNITY VISITOR CENTERS
The Mat-Su Convention and Visitors Bureau (MSCVB) is a non-profit organization established to
promote the Mat-Su visitor industry. The MSCVB is housed in the Mat-Su Visitor Center at Mile 35.5 of
the Parks Highway on 4.26 acres. The center was built in 1989, comprising 4,000 sq. ft. on two levels.
The center is open to the public mid-May through mid-September. In 2003 and 2004, a new Parks-
Glenn Highway interchange was developed, re-routing access to the center. This re-routing has lead to a
decrease in visitors due to increased high speed traffic and limited access. In October 2007, the MSCVB
adopted a resolution (Mat-Su CVB Resolution FY08-01) to “support exploration of a partner-driven
destination visitor center to showcase the recreational opportunities in the Mat-Su Valley and increase
the visitor experience and length of stay.”
Other community visitor centers in the borough are co-located and operated by local Chambers of
Commerce in Palmer, Big Lake, Houston, Willow and Talkeetna.
NATIONAL AND STATE PARK SERVICES
The National Park Service also operates the Talkeetna Ranger Station in Talkeetna. The facility is open
year-round. The center is the base of operations for the Denali National Park and Preserve’s
mountaineering rangers, offering climbing information for the Alaska Range, other general information
and interpretive programs, films and a bookstore. During the spring and early summer, the station’s
primary function is to serve the almost 2,000 mountaineers who travel from all over the world to climb
Mt. McKinley and other peaks in the Alaska Range. As the summer progresses, rangers shift their
attention to the other visitors that pass through Talkeetna.
The State has also started the planning and design of a South Denali Park visitor center complex with
trails and amenities on Curry Ridge in Denali State Park. The visitor center is expected to offer a
spectacular view of Denali, and include visitor contact, interpretation, food service, theater, power
generation and restrooms.
Other Public Venues Observations
• The venues that currently attract overnight visitors, including the Alaska State Fairgrounds,
performance halls and museums, have seen little capital investment. It is important to maintain
assets like furnishings, lighting and sound systems when reaching outside the community or region
for clientele.
Base Case Tourism Infrastructure Description McDowell Group, Inc. • Page A-19
• Many of the other facilities are older, require more costly maintenance, and are not a size or stature
to lure more visitors to the Mat-Su Borough.
• The Alaska State Fair is a large enough attraction to establish some year-round infrastructure.
Facilities are used during the fall and winter months for a variety of events such as concerts, gun
shows, classes, banquets, fundraisers and weddings. At least one of the permanent buildings is
booked weekly for events during the fall and winter months.
• The Mat-Su Borough lacks a stand-alone performance hall, or multi-use facility, that offers the
flexibility to conduct performances and conferences. The proposed auditorium at the Mat-Su
College will significantly increase performance and rehearsal capacity. It may also be possible for
future conferences and events to use performance and college classroom space concurrently.
• Once built, the South Denali Park visitor center will provide a new gathering place for visitors to
receive information about the borough, including interpretation of what the area offers for wildlife
viewing, activities and scenic areas and other visitor amenities, such as restrooms.
Base Case Tourism Infrastructure Description McDowell Group, Inc. • Page A-20
Parks, Campgrounds, Boat Launches and Trails
Parks
The Mat-Su Borough has numerous state and city parks, recreational areas, campgrounds and hundreds
of lakes, streams and rivers that provide recreational opportunities for local residents and visitors.
Additionally, the borough shares Denali National Park with the Denali Borough to the north and small
portions of Lake Clark National Park to the southwest and Chugach National Forest to the southeast.
THE KEY ALASKA STATE PARK UNITS
Twenty-four Alaska State Park units are located in the Mat-Su Borough. A broad range of activities are
available, from small picnic areas, trailhead areas, historical parks, canoe trails, boating, to campgrounds
and remote cabins. Three of the key State Park units and developments are discussed below.
DENALI STATE PARK
It is located adjacent to the east side of Denali National Park and Preserve, along the Parks Highway,
about 100 air miles north of Anchorage. The park’s 325,240 acres are largely undeveloped wilderness
with the exception of the two day-use areas, three campgrounds (Byers Lake, Denali Viewpoint North,
and Lower Troublesome Creek), two trailheads (Upper Troublesome Creek and Little Coal Creek), two
public use cabins (on Byers Lake), two scenic lookouts (Veteran’s Memorial and Denali Viewpoint South
(mile 135.2 Parks Highway, including interpretative bulletin board which names the mountains and
other terrain features of the Alaska Range), and three picnic areas accessible from the Parks Highway.
INDEPENDENCE MINE STATE HISTORIC PARK (HATCHER PASS)
The Independence Mine State Historic Park is currently the most visited park unit in the Mat-Su
Borough. The Park is located at Hatcher Pass, northwest of Palmer, and includes a museum and park
staff and volunteers provide guided tours of the historic mine areas. Features include abandoned
buildings and machinery of a 200-worker camp and 1930s hardrock gold mining operation. The mine
manager's house and Assay building have been restored and offer interpretive displays and visitor
information.
NANCY LAKE STATE RECREATION AREA
The Nancy Lake Canoe trails stands out as a one of the state’s most accessible areas for canoe tripping.
In the Nancy Lake State Recreation Area there are 13 remote public use cabins. The biggest attraction of
this area is canoeing through the eight-mile chain of lakes in the Lynx Lake Loop. Portages are well-
marked with orange, diamond-shaped signs marked with a "P". Wet sections are covered with
boardwalk.
Base Case Tourism Infrastructure Description McDowell Group, Inc. • Page A-21
There are two maintained campgrounds with road access, water and toilets. South Rolly Lake
Campground, with 99 sites, is located at the end of Nancy Lake Parkway, 6.5 miles off the Parks
Highway. Nancy Lake State Recreation Site, on the northeast shore of Nancy Lake, has 30 sites and can
be reached from mile 66.5 of the Parks Highway. There are nearly 40 miles of maintained trails through
the Nancy Lake State Recreation Area, including 10 miles used only for skiers.
Day-Use Parks and Pavilions
The day-use parks in the Mat-Su Borough are primarily used by the local residents for weddings and
other social gatherings. The facilities in the parks usually consist of a covered pavilion, picnic tables,
barbeque pits and playgrounds.
The City of Wasilla has three pavilions available for public use; two in the Iditapark (the Red and Blue
pavilions) and the McEvoy Pavilion in Newcomb Park. Iditapark includes: basketball, tennis, sand
volleyball courts, Wonderland (a children's playground), a skateboard facility, BMX trails, an
amphitheater, an Armed Forces honor garden and a Garden of Reflection with a waterfall and trellis.
Newcomb Park on Wasilla Lake is popular for swimming in the summer and outdoor ice skating in
winter.
There are five park pavilions at the Matanuska River Park Campground, three pavilions at the Lake Lucille
Park Campground and the Little Susitna River Campground near Houston has a large pavilion available
for reservations. The rental capacity of the pavillions is approximately 65. These parks are generally well
maintained and in good to excellent condition.
A table of day use parks in the borough, including ownership and management is found in Appendix A.
Campgrounds and Public-Use Cabins
There are just over 20 public campgrounds in the Mat-Su Borough with a capacity of 832 tent and/or
RV sites per night. Borough-wide, the number of spaces suggests there is adequate capacity for the near-
term; however, some of the campgrounds, particularly those located near popular fishing rivers, face
high pressure during intense periods associated with fish runs. Maintaining the campgrounds during this
high pressure season is a challenge and can often deter more utilization by visitors to the area. Sixty
percent of the publicly owned campgrounds are located in the Palmer-Willow corridor. A list of public
use campgrounds showing number of campsites, ownership, management and location is found in
Appendix A.
There are 17 public remote cabins in the Mat-Su Borough, of which 13 are located in the Nancy Lake
State Recreation Area, three at Byers Lake in Denali State Park and one at Matanuska Glacier. The State
owns and operates all of these cabins and reports that some are in need of simple routine maintenance
while others are in need of substantial refurbishment.
Base Case Tourism Infrastructure Description McDowell Group, Inc. • Page A-22
Access to the remote cabins is varied. The cabins at Nancy Lake are accessible with only a short hike. The
three cabins located on Red Shirt Lake are accessible by ski, plane or foot in the winter, or by plane or
hiking then canoeing in the summer. The hike or ski into Red Shirt is approximately three to four miles.
The Lynx and James Lake cabins require a minimum of a half-day trip, and are only accessible through
the canoe trail system with several portages. The Byers Lake cabins are all easily accessible with only a
half-mile to one-mile trip to all of the cabins.
Remote cabins are in high demand, and the demand is well above the number of cabins available in the
Matanuska Susitna Borough. Many of these cabins are booked months in advance during the high
season, and around popular vacation times year-round.
Boat Launches
There are over 60 boat launches, providing access to waterways in the borough. Most launches are
found on lakes, but at least ten provide access to rivers and creeks. Of the river boat launches, only a few
offer adequate parking and staging areas, improved ramps, sanitation facilities and other amenities such
as picnic and overnight camping areas. Government entities own six of the river launches and the
remaining 54 boat launches are privately owned or run. Snowmobilers use the launch parking areas
during the winter months.
Four boat launches handle the majority of the borough’s river traffic—Little Susitna River Boat Launch,
Talkeetna River Boat Launch, Deshka Landing and Susitna River Landing. Recently, improvements to the
Little Susitna River, Susitna Landing and Talkeetna boat launches were made, funded though the Alaska
Department of Fish and Game (ADF&G) using Federal Aid in Sport Fish Act (SFR) allocations.
TALKEETNA RIVER BOAT LAUNCH
The Talkeetna River and its tributaries provide access to numerous wildlife viewing, private cabin access
and sport fishing opportunities. The boat launch is located northeast of Talkeetna, just upstream of the
confluence of the Talkeetna River with the Susitna River and the Chulitna River. The boat launch was
originally constructed by the City of Talkeetna. The Alaska Railroad now owns the only public boat
launch.
In 1996, upgrades were constructed, including pre-cast concrete planks in the launch, improvements to
the parking area with 60 additional parking spaces, a vault toilet, dumpster pad, handicap accessible
toilet and new road signage. These improvements provided better traffic flow, improved sanitation and
are easier to maintain.
Base Case Tourism Infrastructure Description McDowell Group, Inc. • Page A-23
SUSITNA LANDING
Susitna Landing is located near the confluence of the Kashwitna and Susitna Rivers and provides access
to a multitude of tributaries in the Susitna River drainage. The landing was originally constructed in the
1970s. In 1986, the ADF&G purchased the 59-acre site. A state-contracted private concessionaire
provides day-to-day operation and maintenance of the site. Since the late 1980s, numerous
improvements have been made, including new buildings, sanitation facilities, ADA accessibility, parking,
hardening of the boat launch ramp and a boarding dock. Currently, the landing provides a double-lane
boat launch ramp, RV and tent camping sites, fish-cleaning tables, a small convenience store, access to
trails and boat trailer and vehicle parking. The landing is also a popular launch for snowmobiling on
winter trails and for private cabin access.
DESHKA LANDING
Deshka Landing is located on the Susitna River, providing access to numerous tributaries in the Susitna
River drainage. The Deshka Landing Outdoors Association LLC (DLOA) privately owns Deshka Landing.
As well as the boat launch, DOLA provides parking, fuel services and boat and snowmobile storage. In
2007, DLOA made substantial improvements to the surrounding retaining walls and parking area
lighting.
LITTLE SUSITNA RIVER BOAT LAUNCH
Sport fishing is popular on the Little Susitna River as well as for float trips, camping, wildlife viewing and
hunting. The Little Susitna Public Use Facility is owned by the ADF&G and managed by the Department
of Natural Resources (State Parks) through a cooperative agreement. Located 30 miles off the Parks
Highway south of Wasilla, the facility includes a double-lane boat launch ramp, a 40-site campground,
RV dump station and angler trails and fishing platforms. The State also developed seven boat-accessible
camp sites within the first four river miles upstream of this facility.
Trails
The Mat-Su Borough reports more than 2,000 miles of trails throughout the borough. The trails offer a
wide variety of motorized and non-motorized recreational use opportunities. Trails also provide year-
round access to off-road areas, lakes and waterways. Many of the trails are only accessible during the
winter, as they cross waterways, wetlands and bogs. As the population grows in the area, and interest in
enjoying the borough’s natural beauty increases, demand for quality trails will undoubtedly increase.
The ownership and management of the trail assets in the Mat-Su Borough is shared by the Alaska
Department of Natural Resources, Alaska Railroad Corporation, Alaska Department of Transportation and
Public Facilities, Matanuska-Susitna Borough and the cities of Palmer and Wasilla.
There are three types of trails in the borough; separated paved trails, multi-use soft surface trails and
single-use soft surface trails.
Base Case Tourism Infrastructure Description McDowell Group, Inc. • Page A-24
Most (and perhaps all) of the 86 separated paved pathways are adjacent to the State-managed roads.
The longest trail runs 26 miles, west of Wasilla to Willow. The State Transportation Plan calls for the
development of an additional 26 miles throughout the borough.
Within the 24 management units of Alaska State Parks in the Mat-Su Borough, 15 units have developed
trails. The State does not have a system in place that can characterize the usage, condition or
development standards for all of these trails. As an example, there are 36 miles of trails in the Kesugi
Ridge Trail System that are not included in either the Mat-Su Borough or the State data sets.
SKI TRAILS
Many dedicated ski trails are located in the borough; however, it is difficult to assess the trails in terms of
condition, distance or usage because data is not available. Ski trails are known to exist in the following
locations: Talkeetna Ski Hill, Talkeetna Lake Park and XY Lakes; Trapper Creek; high schools, including
Susitna Valley, Palmer and Wasilla High Schools; Nancy Lakes; Lazy Mountain; Sheep Mountain; Majestic
Valley; Hatcher Pass; and Government Peak.
DOG MUSHING TRAILS AND EQUESTRIAN TRAILS
Anecdotally, there are hundreds of miles of dog mushing trails in the Talkeetna, Willow and Houston
area. There are also trails known for horseback riding; however, there is no GIS data on these trails in
the State or Borough databases.
A list of trails and their seasonal use, ownership and management is found in Appendix A.
Parks, Campgrounds, Boat Launches and Trails Observations
• Well-maintained and accessible recreation areas are attracting both more visitors and more
residents. As the population grows, recreational space will become even more pressing.
• Existing parks and campgrounds require ongoing upkeep and improvements to handle the pressure
of intensive use during the summer tourism season. Currently, the Alaska Department of Natural
Resources estimates the state park units within the Mat-Su Borough have a $20 million deferred
maintenance schedule. Providing ongoing renovation and maintenance of parks, campgrounds,
recreational areas and associated facilities will enhance safety, maximize equipment and facility
lifespan and increase utilization by visitors.
• There are fewer parks and campgrounds along the Glenn Highway compared to the Parks Highway
corridor.
• Trails in the borough lack adequate mapping, directional and trailhead signage, maintenance and
connectivity.
• There are few waterway access points for guided and non-guided sport fishers, motorized and non-
motorized boaters and hunters. Additionally, the condition and availability of adequate parking,
toilets, overnight camping areas, boat launches, fishing platforms and day-use picnic areas is limited.
Base Case Tourism Infrastructure Description McDowell Group, Inc. • Page A-25
Transportation
Roads
HIGHWAYS
The Denali, Parks and the Glenn Highways are part of the Federal Highway System, owned and
maintained by the Alaska Department of Transportation and Public Facilities. There is approximately 173
miles of the Parks Highway within the Mat-Su Borough, beginning at the junction with the Glenn
Highway east of Wasilla. The Parks Highway provides direct access to Fairbanks and Denali National Park.
Recent improvements (completed in 2006) include a four-lane limited access highway from the Glenn
Highway intersection to the Seward Meridian Road and a five-lane highway into Wasilla.
There is approximately 110 miles of the Glenn Highway within the Matanuska Borough. The highway
begins in Anchorage, intersects the Parks Highway approximately 35 miles north of Anchorage and
travels northeast through the Matanuska River Valley. There are numerous undeveloped gravel pull-outs
along the highway and three scenic viewpoint pull-outs (mile 67, 74 and 85, completed in 1995) near
the Matanuska Glacier.
Alaska established a scenic byways program in 1993, administered by the Alaska Department of
Transportation and Public Facilities. The Glenn Highway was designated as an Alaska State Scenic Byway
in June of 2000. The Glenn Highway then became eligible to apply for national designations by the U.S.
Secretary of Transportation and received designation as a National Scenic Byway in June of 2002. A
portion of the Parks Highway, beginning at Trapper Creek and extending north to Healy, is being
considered for possible National Scenic Byway designation.
One of the key benefits of the state and national scenic byways program is the economic opportunities
that are created. Promotion of the byway through maps and other literature by the state and national
programs can increase the number of visitors to the area. Other potential benefits include improved
eligibility for federal grant funds, and national and international marketing conducted by the National
Scenic Byway program for nationally designated byways.
Approximately 70 miles of the Denali Highway is located in the Mat-Su Borough. The Denali Highway is
a two-lane road, 136 miles long between Cantwell (on the Parks Highway) and Paxson (on the
Richardson Highway). All but the last 24 miles into Paxson is gravel road. The Denali Highway is only
open in the snow-free months, approximately mid-May to early October. Along the Denali Highway,
visitors will find great scenic views, hiking, canoeing, wildlife viewing and fishing in the many high
alpine lakes. Due to the condition of the road and limited number of communities served, the Denali
Highway generally only serves recreational and tourist traffic. While the Alaska Department of
Transportation is considering some new re-surfacing methods, there are no improvements planned for
the Denali Highway.
A description of other major roads can be found in Appendix A.
Base Case Tourism Infrastructure Description McDowell Group, Inc. • Page A-26
ROAD SIGNAGE
Road signage for trailheads, campgrounds and other attractions is provided along the Parks and Glenn
Highway. The State Parks and Alaska Department of Transportation work together to standardize a plan
for roadway and state park signage. Signs need to be regularly maintained or replaced due to vandalism
or other damage.
Railroad
During the winter, there is weekly passenger train service between Anchorage and Fairbanks with a
scheduled stop in Talkeetna. During the summer, the service is daily. Stops in Wasilla and other “whistle
stops” are made at the passenger’s request. During the Alaska State Fair, the railroad delivers fairgoers
from Anchorage to the South Palmer Station. In the future, the station may also become part of a
commuter system transporting workers between the Mat-Su Borough and Anchorage.
The Alaska Railroad Corporation has three depots: Wasilla, Talkeetna and Palmer (primarily serving
fairgoers). The historic depot in Wasilla is not staffed by the Alaska Railroad. The building is leased to the
Wasilla Chamber of Commerce, and is often closed and locked at train arrival/departure times. The train
depot is open during the summer tourist season and closed during the rest of the year. In 2004, the
new South Palmer Railroad Station opened adjacent to the fairgrounds. The $2.3 million project features
restrooms, covered areas, electronic signage and Glenn Highway Scenic Byway interpretive wayside
panels. It was funded by the Federal Highways Administration, Federal Transit Administration, Alaska
Department of Transportation and Public Facilities and Alaska State Fair.
The Alaska Railroad recently completed track realignments between Anchorage and Wasilla. The project
eliminated or reduced the curvature of 70 sharp curves on the main line. The improvements will reduce
the running time between Anchorage and Wasilla from 95 minutes to less than an hour.
In the future, the Alaska Railroad is planning to straighten curves along four miles of mainline track in
south Wasilla to enhance safety, reduce horn noise, improve train travel time, improve operating
efficiencies and reduce costs. The Alaska Railroad, Alaska Department of Transportation and City of
Wasilla have also been discussing ways to alleviate the rail and highway congestion in downtown
Wasilla.
Additionally, the Mat-Su Borough and the Alaska Railroad are studying proposals to develop a rail
extension connecting Port MacKenzie to the existing mainline between Wasilla and Willow. The Port
Mackenzie Rail Extension would be developed to move freight from the port into Interior Alaska. At this
time, this extension would have no anticipated impact on tourism or tourism-related transportation.
Water Transportation
Work was completed on Port MacKenzie in 2000. The port is about two nautical miles northwest of
Anchorage, across the Knik Arm. Port MacKenzie extends 800 feet from shore with 500 feet of docking
space.
Base Case Tourism Infrastructure Description McDowell Group, Inc. • Page A-27
Currently, there are no visitor-related water transportation services connected with Port MacKenzie. The
Borough plans to establish ferry service between the Port of Anchorage and Port MacKenzie. The service
includes ferries with open car decks for quick drive-on capability, a hull designed for ice, and powerful
engines to handle strong currents during the two-mile, 10-minute crossing.
As part of the feasibility analysis for the ferry, the study specifically analyzed six potential markets for the
ferry, including the visitor market. The study concluded that there would be a demand for ferry service
by visitors who wanted to travel via an interesting and alternative route between Anchorage and Point
Mackenzie.
Currently, the ferry is under construction with an anticipated delivery date in the spring of 2009. Port
MacKenzie is to start offering ferry service in the fall of 2009. The new ferry will not have the capacity to
handle more than two tour buses per trip. Based on interview research with large bus tour operators, the
capacity needs to handle at least four buses for them to consider the travel option, as they often travel in
convoys.
Airports
The Borough has a high concentration of public and private airports. Within the Mat-Su Borough there
are ten public airports and over 200 private airports and air strips. Most of these airports are
concentrated along the road system.
Eight of these public airports are owned and operated by the Alaska Department of Transportation and
Public Facilities; the other two are owned and operated by the Cities of Palmer and Wasilla. These
airports all have dozens of based aircraft and services such as fuel and/or maintenance. Several of these
airports have air taxi services, although none of them have regularly scheduled air service. A table
providing more infrastructure detail of the ten public airports can be found in Appendix A.
Visitors are most likely to use chartered air services out of Talkeetna and Willow (float and runway)
airports for sightseeing, drop-offs at lodges or cabins and support for Denali mountaineering
expeditions. In Talkeetna, Talkeetna Aero Services, Inc. and Talkeetna Air Taxi provide flightseeing tours
of Mt. McKinley and Denali National Park. In Willow, Willow Air offers flightseeing tours of Hatcher Pass
and Denali National Park, as well as float trips, bear viewing and moose hunts. CPA Air Services also
operates out of Willow and offers flightseeing tours over Whittier, the Knik Glacier, McKinley Basin and
Iditarod flights.
The majority of the private airports and airstrips have small gravel runways, and are used for personal
travel, sightseeing and recreation.
The Mat-Su Borough also contains hundreds of lakes that are suitable for use by small floatplanes.
Currently, only 27 floatplane bases are registered with the Federal Aviation Administration in the
borough. These lakes represent most of the major lakes near the road system, but a few busy lakes,
including Big Lake, are currently not registered. A table providing more detail of the 27 registered bases
can be found in Appendix A.
Base Case Tourism Infrastructure Description McDowell Group, Inc. • Page A-28
Public Transportation Services
Mat-Su Community Transit (MASCOT) is a private, non-profit transportation system, which operates a
fixed route, para-transit, and coordinated transportation service – the only public transportation system
in the Mat-Su Borough. Established in August 1999, MASCOT routes are open to the public and cover
the communities of Wasilla, Palmer, Big Lake, Houston and Knik/Fairview, while also running a
commuter route into the Anchorage area five times a day. In addition, MASCOT contracts for provision
of a “24/7” transportation service to the elderly and people with disabilities. Currently, MASCOT
services are geared completely toward local resident use and are rarely used by visitors.
Transportation Observations
• Developing South Denali access, as well as a visitor center, campgrounds and trails, has important
implications for tourism industry growth in the area. Providing new access to Denali National Park
will increase the number of visitors that seek the recreational opportunities in South Denali.
• Potential future development of infrastructure, including development of the Knik Arm Bridge, if
completed, and ferry service between the Port of Anchorage and Port McKenzie, will affect traffic
patterns and traffic volume in the borough.
• Effective signage off the state roadways and in smaller communities is lacking. In addition, there are
few up-to-date maps or materials that help direct visitors to venues, attractions, trails and
recreational areas.
• Maintaining the Glenn Highway as a state and national scenic byway will generate economic growth
and increase tourism in the communities along the highway.
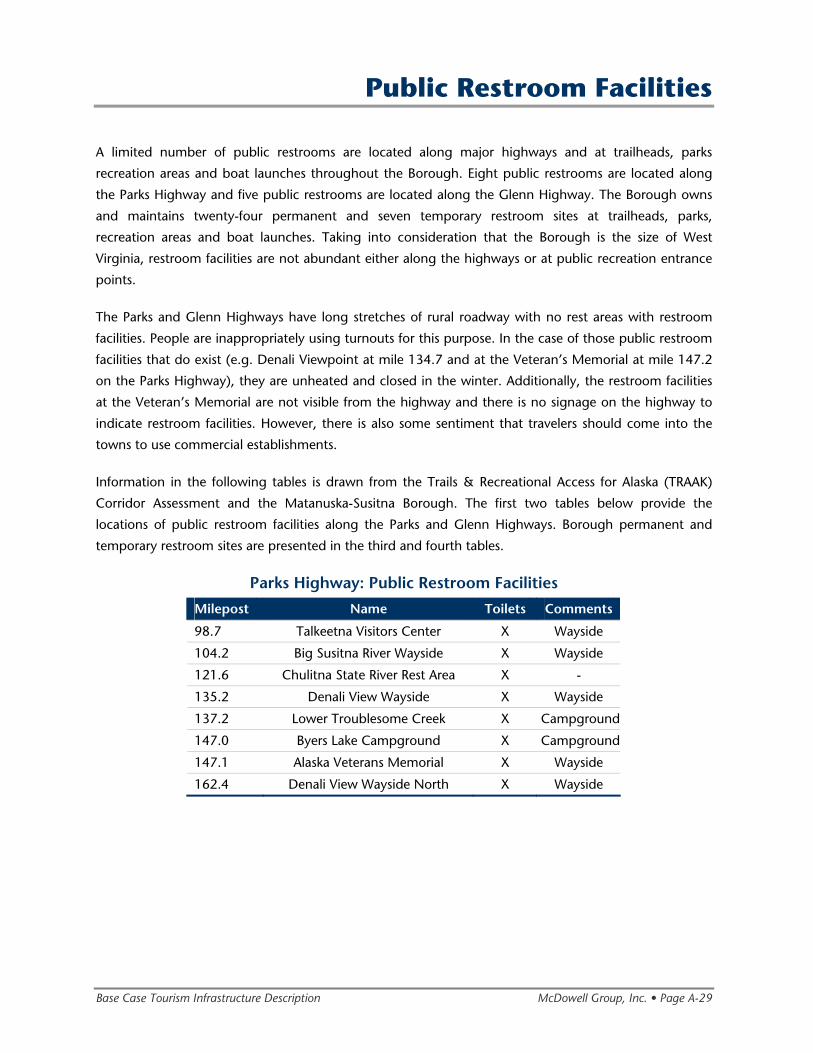
Base Case Tourism Infrastructure Description McDowell Group, Inc. • Page A-29
Public Restroom Facilities
A limited number of public restrooms are located along major highways and at trailheads, parks
recreation areas and boat launches throughout the Borough. Eight public restrooms are located along
the Parks Highway and five public restrooms are located along the Glenn Highway. The Borough owns
and maintains twenty-four permanent and seven temporary restroom sites at trailheads, parks,
recreation areas and boat launches. Taking into consideration that the Borough is the size of West
Virginia, restroom facilities are not abundant either along the highways or at public recreation entrance
points.
The Parks and Glenn Highways have long stretches of rural roadway with no rest areas with restroom
facilities. People are inappropriately using turnouts for this purpose. In the case of those public restroom
facilities that do exist (e.g. Denali Viewpoint at mile 134.7 and at the Veteran’s Memorial at mile 147.2
on the Parks Highway), they are unheated and closed in the winter. Additionally, the restroom facilities
at the Veteran’s Memorial are not visible from the highway and there is no signage on the highway to
indicate restroom facilities. However, there is also some sentiment that travelers should come into the
towns to use commercial establishments.
Information in the following tables is drawn from the Trails & Recreational Access for Alaska (TRAAK)
Corridor Assessment and the Matanuska-Susitna Borough. The first two tables below provide the
locations of public restroom facilities along the Parks and Glenn Highways. Borough permanent and
temporary restroom sites are presented in the third and fourth tables.
Parks Highway: Public Restroom Facilities
Milepost Name Toilets Comments
98.7 Talkeetna Visitors Center X Wayside
104.2 Big Susitna River Wayside X Wayside
121.6 Chulitna State River Rest Area X -
135.2 Denali View Wayside X Wayside
137.2 Lower Troublesome Creek X Campground
147.0 Byers Lake Campground X Campground
147.1 Alaska Veterans Memorial X Wayside
162.4 Denali View Wayside North X Wayside
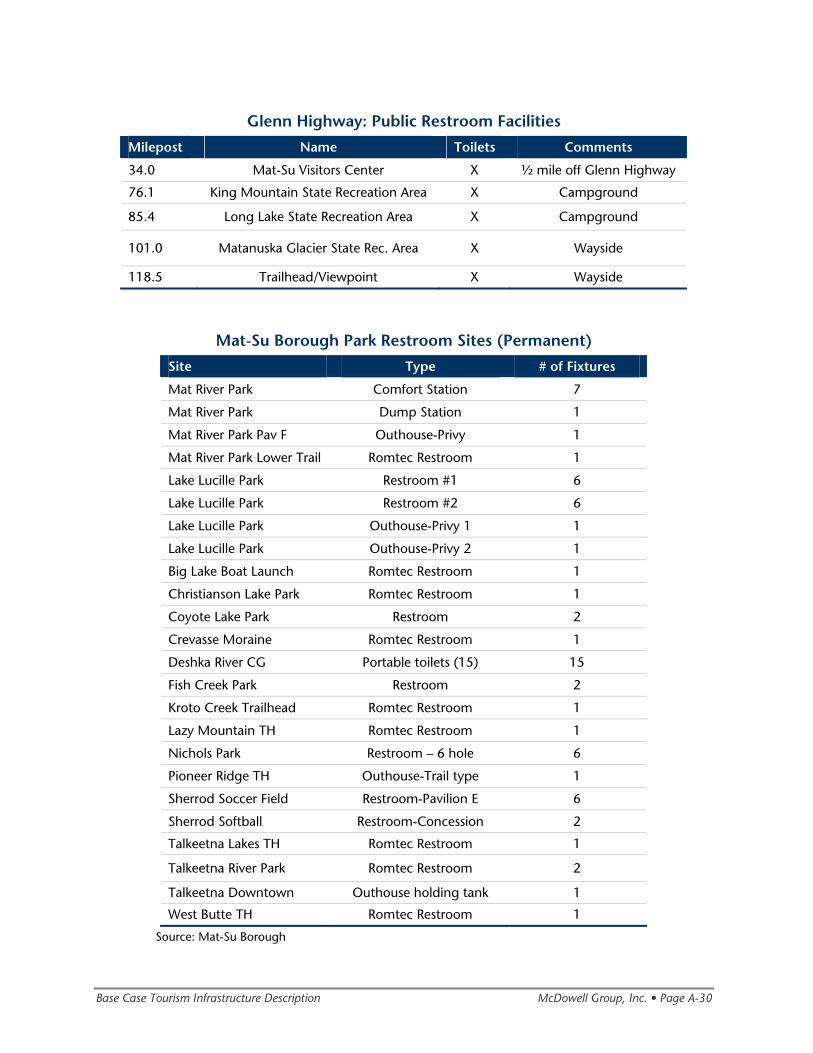
Base Case Tourism Infrastructure Description McDowell Group, Inc. • Page A-30
Glenn Highway: Public Restroom Facilities
Milepost Name Toilets Comments
34.0 Mat-Su Visitors Center X ½ mile off Glenn Highway
76.1 King Mountain State Recreation Area X Campground
85.4 Long Lake State Recreation Area X Campground
101.0 Matanuska Glacier State Rec. Area X Wayside
118.5 Trailhead/Viewpoint X Wayside
Mat-Su Borough Park Restroom Sites (Permanent)
Site Type # of Fixtures
Mat River Park Comfort Station 7
Mat River Park Dump Station 1
Mat River Park Pav F Outhouse-Privy 1
Mat River Park Lower Trail Romtec Restroom 1
Lake Lucille Park Restroom #1 6
Lake Lucille Park Restroom #2 6
Lake Lucille Park Outhouse-Privy 1 1
Lake Lucille Park Outhouse-Privy 2 1
Big Lake Boat Launch Romtec Restroom 1
Christianson Lake Park Romtec Restroom 1
Coyote Lake Park Restroom 2
Crevasse Moraine Romtec Restroom 1
Deshka River CG Portable toilets (15) 15
Fish Creek Park Restroom 2
Kroto Creek Trailhead Romtec Restroom 1
Lazy Mountain TH Romtec Restroom 1
Nichols Park Restroom – 6 hole 6
Pioneer Ridge TH Outhouse-Trail type 1
Sherrod Soccer Field Restroom-Pavilion E 6
Sherrod Softball Restroom-Concession 2
Talkeetna Lakes TH Romtec Restroom 1
Talkeetna River Park Romtec Restroom 2
Talkeetna Downtown Outhouse holding tank 1
West Butte TH Romtec Restroom 1
Source: Mat-Su Borough
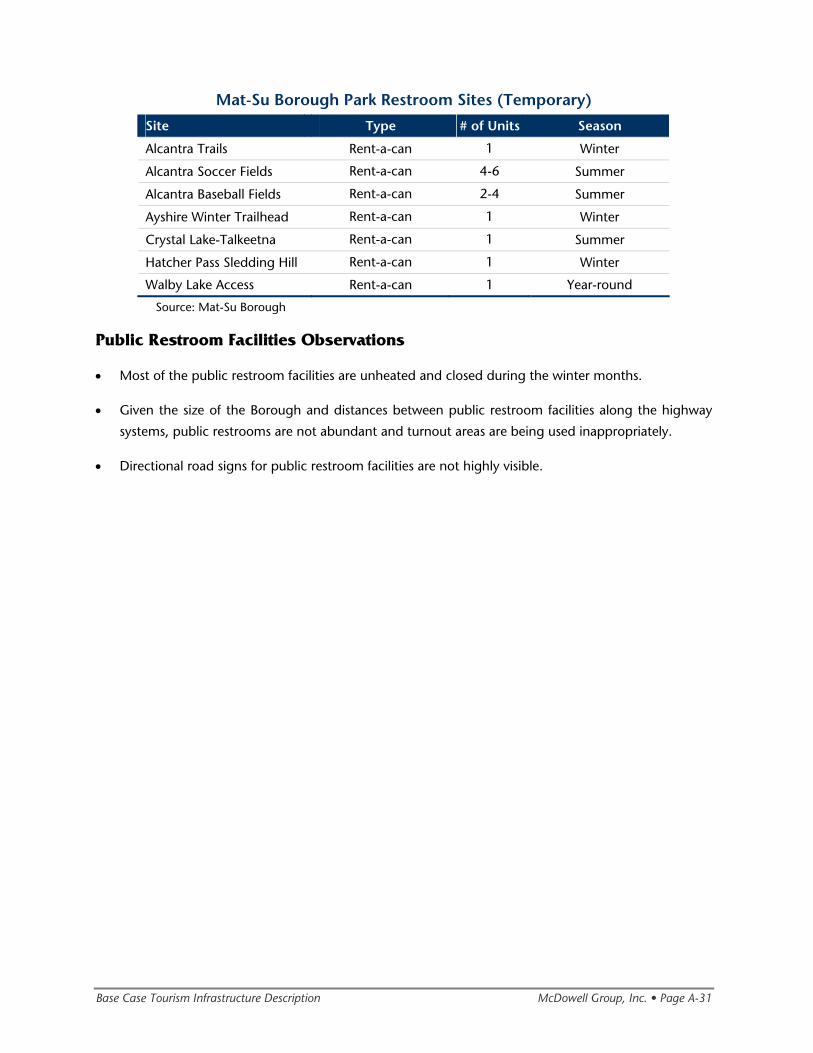
Base Case Tourism Infrastructure Description McDowell Group, Inc. • Page A-31
Mat-Su Borough Park Restroom Sites (Temporary)
Site Type # of Units Season
Alcantra Trails Rent-a-can 1 Winter
Alcantra Soccer Fields Rent-a-can 4-6 Summer
Alcantra Baseball Fields Rent-a-can 2-4 Summer
Ayshire Winter Trailhead Rent-a-can 1 Winter
Crystal Lake-Talkeetna Rent-a-can 1 Summer
Hatcher Pass Sledding Hill Rent-a-can 1 Winter
Walby Lake Access Rent-a-can 1 Year-round
Source: Mat-Su Borough
Public Restroom Facilities Observations
• Most of the public restroom facilities are unheated and closed during the winter months.
• Given the size of the Borough and distances between public restroom facilities along the highway
systems, public restrooms are not abundant and turnout areas are being used inappropriately.
• Directional road signs for public restroom facilities are not highly visible.

Mat-Su Visitor Markets
Mat-Su Visitor Markets McDowell Group, Inc. • B-1
Introduction
This chapter provides baseline information about current visitor markets, activities and local spending. The
information is presented in two segments: out-of-state visitors and in-state visitors. The chapter concludes
with a brief discussion of market trends that could affect visitation to Mat-Su communities and businesses.
Organization of Information in this Chapter
The information in this section of the report was based on multiple data sources. The following discussion is
intended to help the reader understand the organization of information in this chapter, as each data source
collected and presented information in its own unique manner.
OUT-OF-STATE VISITORS
Information about the out-of-state market was primarily drawn from the Alaska Visitors Statistics Program V
(AVSP V). In this recently conducted study, visitor survey data was aggregated into Summer and Fall/Winter
data sets. Two locations in the Mat-Su region had sufficient visitation for community-level analysis of the
data: Talkeetna and Palmer/Wasilla. As a result, the majority of information in this section is presented for
three subgroups of visitors:
• Summer visitors to Talkeetna
• Summer visitors to Palmer/Wasilla
• Fall/Winter visitors to Palmer/Wasilla
To supplement this information, the study team developed estimates for visitation and spending for two
additional areas in the region. Data sources included AVSP, accommodation information from the Base Case
Tourism Infrastructure Description, and review of marketing materials for the region and private companies.
• Summer visitors to the Glacier Country (Glenn Highway) region
• Summer visitors to the Off the Beaten Path region
IN-STATE VISITORS
Estimates for Alaska resident visitation and spending were based on findings from the Alaska Resident In-State
Pleasure Travel Study Report and the Mat-Su Visitor Impact Study series. A summary of updated visitation and
spending estimates is presented in this chapter. (Supporting data can be found in Appendix B.)
Overview of Mat-Su Visitor Markets
The Mat-Su Valley attracts a wide array of in-state and out-of-state visitor market segments, including visitors
on motorcoach and rail package tours, independent travelers, adventure travelers, mountaineers, as well as
the meeting and retreat market. The year-round destination offers a wide array of activities for Alaska
residents and out-of-state visitors, such as scenic beauty, Alaska pioneer history, world-renowned special
Mat-Su Visitor Markets McDowell Group, Inc. • B-2
events, and outstanding recreational opportunities such as hiking, sightseeing, fishing, wildlife viewing,
Nordic skiing and snowmobiling.
Key findings are summarized below:
• Annually, approximately 780,000 visitors travel to the Mat-Su Borough, of which 332,000 are from out-
of-state.
• Most visitors come during the summer season; approximately 90 percent of out-of-state visitors and 59
percent of in-state visitors.
• Visitors spend at estimated $201 million in the borough annually, of which 40 percent is spent by out-of-
state visitors.
• Spending on food and beverages is the leading expenditure category (35 percent), followed by
accommodations (24 percent), fuel and transportation (22 percent) and entertainment (14 percent).
• The most popular visitor activities include visiting friends and relatives, viewing wildlife, cultural activities,
hiking and nature walking, camping, and flightseeing.
• The market outlook for the Mat-Su Borough is expected to grow.
o About 12 percent of cruise passengers spend additional time in Alaska (outside of their tour
package). This market segment is growing between 2 and 5 percent each year. It is
anticipated that more of these cruise passengers will spend time in the Mat-Su Borough due
to increased public and private investment in infrastructure and attractions.
o Additionally, the out-of-state independent travel market is also growing at a rate of 1 to 3
percent each year. The independent visitor will continue to be an important segment of the
Mat-Su visitor market, especially for adventure travel purposes.
o The Alaska resident population—especially in the Anchorage area—is also growing.
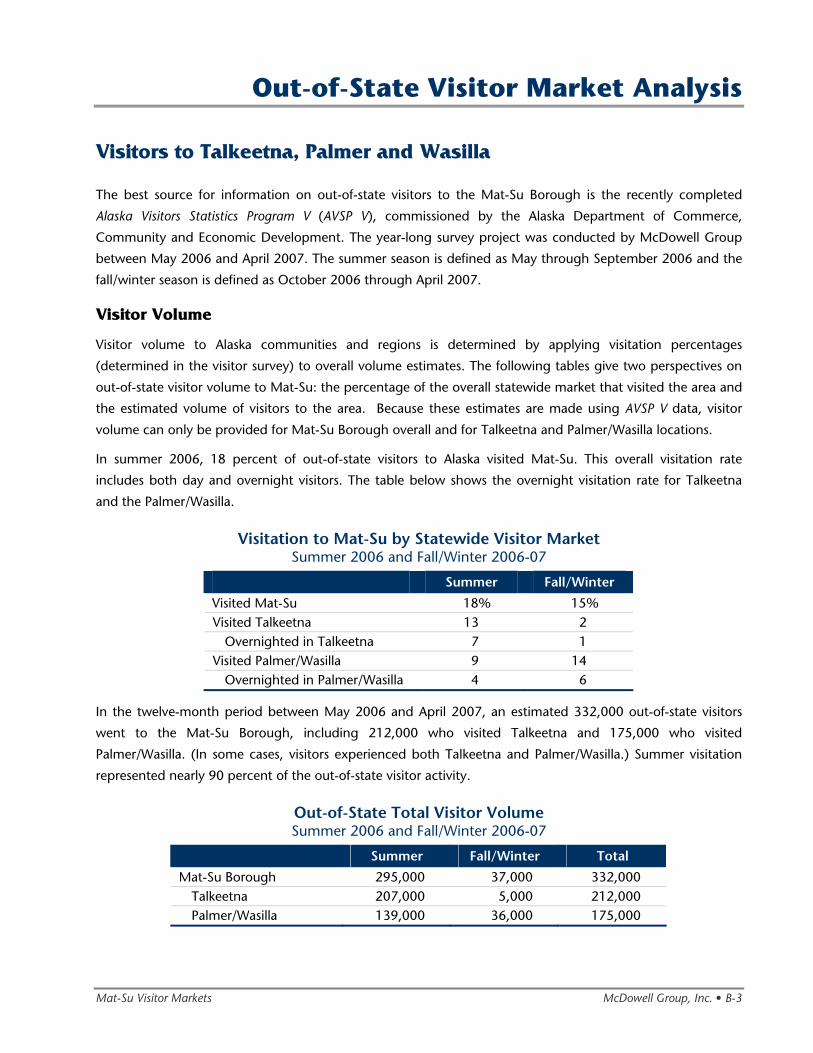
Mat-Su Visitor Markets McDowell Group, Inc. • B-3
Out-of-State Visitor Market Analysis
Visitors to Talkeetna, Palmer and Wasilla
The best source for information on out-of-state visitors to the Mat-Su Borough is the recently completed
Alaska Visitors Statistics Program V (AVSP V), commissioned by the Alaska Department of Commerce,
Community and Economic Development. The year-long survey project was conducted by McDowell Group
between May 2006 and April 2007. The summer season is defined as May through September 2006 and the
fall/winter season is defined as October 2006 through April 2007.
Visitor Volume
Visitor volume to Alaska communities and regions is determined by applying visitation percentages
(determined in the visitor survey) to overall volume estimates. The following tables give two perspectives on
out-of-state visitor volume to Mat-Su: the percentage of the overall statewide market that visited the area and
the estimated volume of visitors to the area. Because these estimates are made using AVSP V data, visitor
volume can only be provided for Mat-Su Borough overall and for Talkeetna and Palmer/Wasilla locations.
In summer 2006, 18 percent of out-of-state visitors to Alaska visited Mat-Su. This overall visitation rate
includes both day and overnight visitors. The table below shows the overnight visitation rate for Talkeetna
and the Palmer/Wasilla.
Visitation to Mat-Su by Statewide Visitor Market Summer 2006 and Fall/Winter 2006-07
Summer Fall/Winter
Visited Mat-Su 18% 15% Visited Talkeetna 13 2
Overnighted in Talkeetna 7 1 Visited Palmer/Wasilla 9 14
Overnighted in Palmer/Wasilla 4 6
In the twelve-month period between May 2006 and April 2007, an estimated 332,000 out-of-state visitors
went to the Mat-Su Borough, including 212,000 who visited Talkeetna and 175,000 who visited
Palmer/Wasilla. (In some cases, visitors experienced both Talkeetna and Palmer/Wasilla.) Summer visitation
represented nearly 90 percent of the out-of-state visitor activity.
Out-of-State Total Visitor Volume Summer 2006 and Fall/Winter 2006-07
Summer Fall/Winter Total
Mat-Su Borough 295,000 37,000 332,000 Talkeetna 207,000 5,000 212,000 Palmer/Wasilla 139,000 36,000 175,000
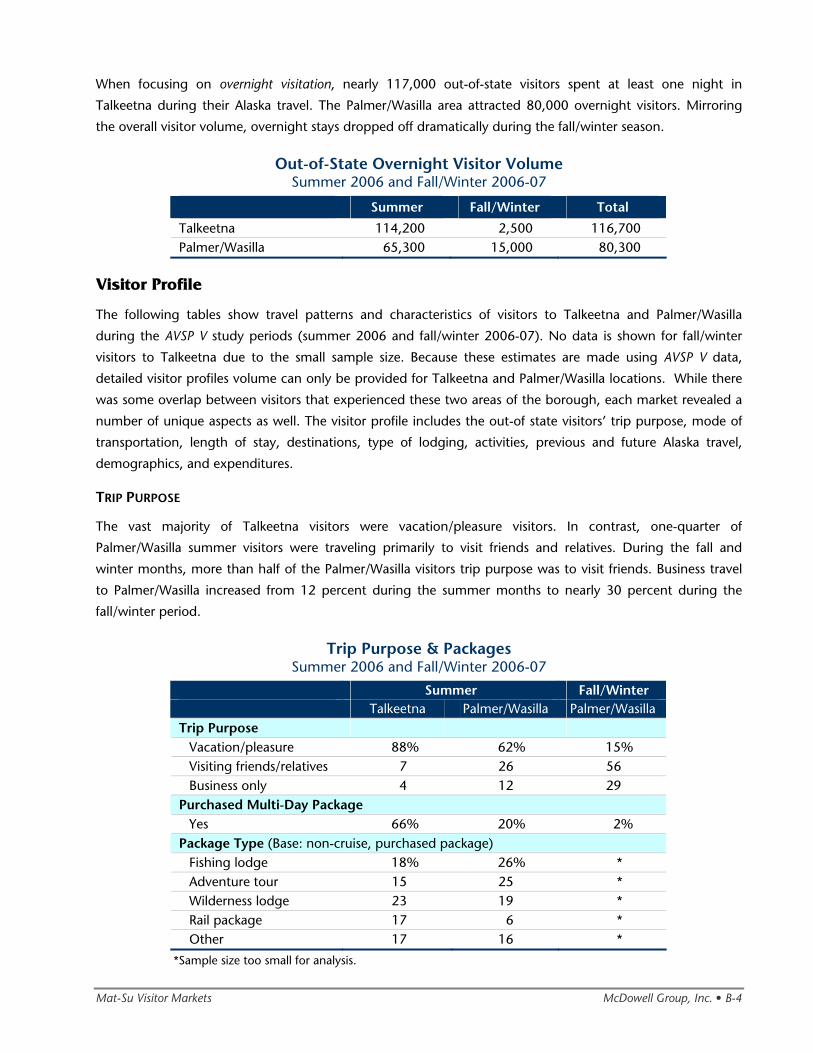
Mat-Su Visitor Markets McDowell Group, Inc. • B-4
When focusing on overnight visitation, nearly 117,000 out-of-state visitors spent at least one night in
Talkeetna during their Alaska travel. The Palmer/Wasilla area attracted 80,000 overnight visitors. Mirroring
the overall visitor volume, overnight stays dropped off dramatically during the fall/winter season.
Out-of-State Overnight Visitor Volume Summer 2006 and Fall/Winter 2006-07
Summer Fall/Winter Total
Talkeetna 114,200 2,500 116,700 Palmer/Wasilla 65,300 15,000 80,300
Visitor Profile
The following tables show travel patterns and characteristics of visitors to Talkeetna and Palmer/Wasilla
during the AVSP V study periods (summer 2006 and fall/winter 2006-07). No data is shown for fall/winter
visitors to Talkeetna due to the small sample size. Because these estimates are made using AVSP V data,
detailed visitor profiles volume can only be provided for Talkeetna and Palmer/Wasilla locations. While there
was some overlap between visitors that experienced these two areas of the borough, each market revealed a
number of unique aspects as well. The visitor profile includes the out-of state visitors’ trip purpose, mode of
transportation, length of stay, destinations, type of lodging, activities, previous and future Alaska travel,
demographics, and expenditures.
TRIP PURPOSE
The vast majority of Talkeetna visitors were vacation/pleasure visitors. In contrast, one-quarter of
Palmer/Wasilla summer visitors were traveling primarily to visit friends and relatives. During the fall and
winter months, more than half of the Palmer/Wasilla visitors trip purpose was to visit friends. Business travel
to Palmer/Wasilla increased from 12 percent during the summer months to nearly 30 percent during the
fall/winter period.
Trip Purpose & Packages Summer 2006 and Fall/Winter 2006-07
Summer Fall/Winter Talkeetna Palmer/Wasilla Palmer/Wasilla Trip Purpose
Vacation/pleasure 88% 62% 15% Visiting friends/relatives 7 26 56 Business only 4 12 29
Purchased Multi-Day Package Yes 66% 20% 2%
Package Type (Base: non-cruise, purchased package) Fishing lodge 18% 26% * Adventure tour 15 25 * Wilderness lodge 23 19 * Rail package 17 6 * Other 17 16 *
*Sample size too small for analysis.
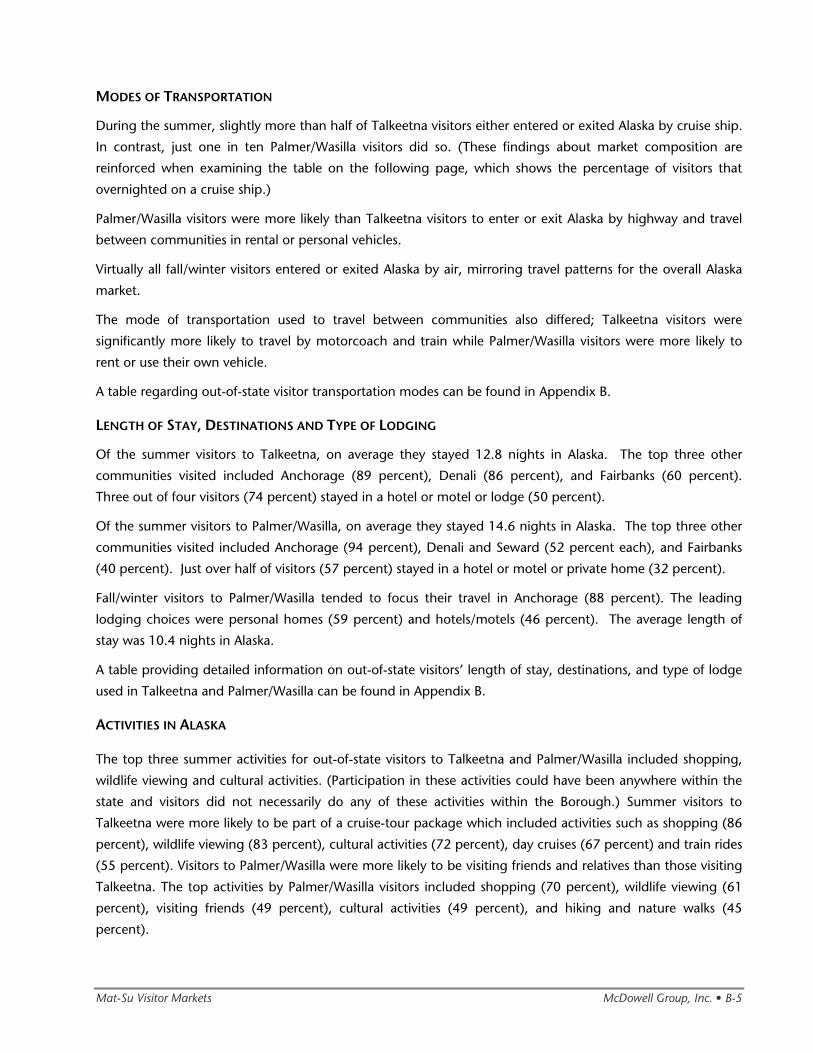
Mat-Su Visitor Markets McDowell Group, Inc. • B-5
MODES OF TRANSPORTATION
During the summer, slightly more than half of Talkeetna visitors either entered or exited Alaska by cruise ship.
In contrast, just one in ten Palmer/Wasilla visitors did so. (These findings about market composition are
reinforced when examining the table on the following page, which shows the percentage of visitors that
overnighted on a cruise ship.)
Palmer/Wasilla visitors were more likely than Talkeetna visitors to enter or exit Alaska by highway and travel
between communities in rental or personal vehicles.
Virtually all fall/winter visitors entered or exited Alaska by air, mirroring travel patterns for the overall Alaska
market.
The mode of transportation used to travel between communities also differed; Talkeetna visitors were
significantly more likely to travel by motorcoach and train while Palmer/Wasilla visitors were more likely to
rent or use their own vehicle.
A table regarding out-of-state visitor transportation modes can be found in Appendix B.
LENGTH OF STAY, DESTINATIONS AND TYPE OF LODGING
Of the summer visitors to Talkeetna, on average they stayed 12.8 nights in Alaska. The top three other
communities visited included Anchorage (89 percent), Denali (86 percent), and Fairbanks (60 percent).
Three out of four visitors (74 percent) stayed in a hotel or motel or lodge (50 percent).
Of the summer visitors to Palmer/Wasilla, on average they stayed 14.6 nights in Alaska. The top three other
communities visited included Anchorage (94 percent), Denali and Seward (52 percent each), and Fairbanks
(40 percent). Just over half of visitors (57 percent) stayed in a hotel or motel or private home (32 percent).
Fall/winter visitors to Palmer/Wasilla tended to focus their travel in Anchorage (88 percent). The leading
lodging choices were personal homes (59 percent) and hotels/motels (46 percent). The average length of
stay was 10.4 nights in Alaska.
A table providing detailed information on out-of-state visitors’ length of stay, destinations, and type of lodge
used in Talkeetna and Palmer/Wasilla can be found in Appendix B.
ACTIVITIES IN ALASKA
The top three summer activities for out-of-state visitors to Talkeetna and Palmer/Wasilla included shopping,
wildlife viewing and cultural activities. (Participation in these activities could have been anywhere within the
state and visitors did not necessarily do any of these activities within the Borough.) Summer visitors to
Talkeetna were more likely to be part of a cruise-tour package which included activities such as shopping (86
percent), wildlife viewing (83 percent), cultural activities (72 percent), day cruises (67 percent) and train rides
(55 percent). Visitors to Palmer/Wasilla were more likely to be visiting friends and relatives than those visiting
Talkeetna. The top activities by Palmer/Wasilla visitors included shopping (70 percent), wildlife viewing (61
percent), visiting friends (49 percent), cultural activities (49 percent), and hiking and nature walks (45
percent).
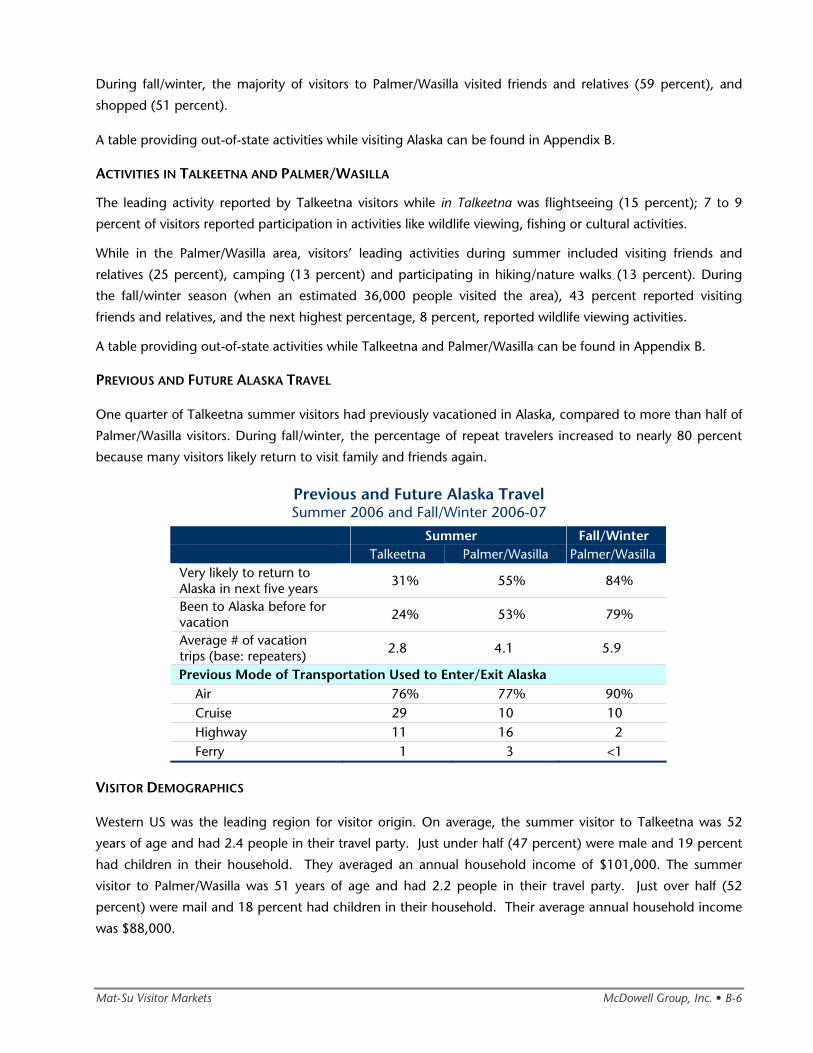
Mat-Su Visitor Markets McDowell Group, Inc. • B-6
During fall/winter, the majority of visitors to Palmer/Wasilla visited friends and relatives (59 percent), and
shopped (51 percent).
A table providing out-of-state activities while visiting Alaska can be found in Appendix B.
ACTIVITIES IN TALKEETNA AND PALMER/WASILLA
The leading activity reported by Talkeetna visitors while in Talkeetna was flightseeing (15 percent); 7 to 9
percent of visitors reported participation in activities like wildlife viewing, fishing or cultural activities.
While in the Palmer/Wasilla area, visitors’ leading activities during summer included visiting friends and
relatives (25 percent), camping (13 percent) and participating in hiking/nature walks (13 percent). During
the fall/winter season (when an estimated 36,000 people visited the area), 43 percent reported visiting
friends and relatives, and the next highest percentage, 8 percent, reported wildlife viewing activities.
A table providing out-of-state activities while Talkeetna and Palmer/Wasilla can be found in Appendix B.
PREVIOUS AND FUTURE ALASKA TRAVEL
One quarter of Talkeetna summer visitors had previously vacationed in Alaska, compared to more than half of
Palmer/Wasilla visitors. During fall/winter, the percentage of repeat travelers increased to nearly 80 percent
because many visitors likely return to visit family and friends again.
Previous and Future Alaska Travel Summer 2006 and Fall/Winter 2006-07
Summer Fall/Winter Talkeetna Palmer/Wasilla Palmer/Wasilla Very likely to return to Alaska in next five years 31% 55% 84%
Been to Alaska before for vacation 24% 53% 79%
Average # of vacation trips (base: repeaters) 2.8 4.1 5.9
Previous Mode of Transportation Used to Enter/Exit Alaska Air 76% 77% 90% Cruise 29 10 10 Highway 11 16 2 Ferry 1 3 <1
VISITOR DEMOGRAPHICS
Western US was the leading region for visitor origin. On average, the summer visitor to Talkeetna was 52
years of age and had 2.4 people in their travel party. Just under half (47 percent) were male and 19 percent
had children in their household. They averaged an annual household income of $101,000. The summer
visitor to Palmer/Wasilla was 51 years of age and had 2.2 people in their travel party. Just over half (52
percent) were mail and 18 percent had children in their household. Their average annual household income
was $88,000.
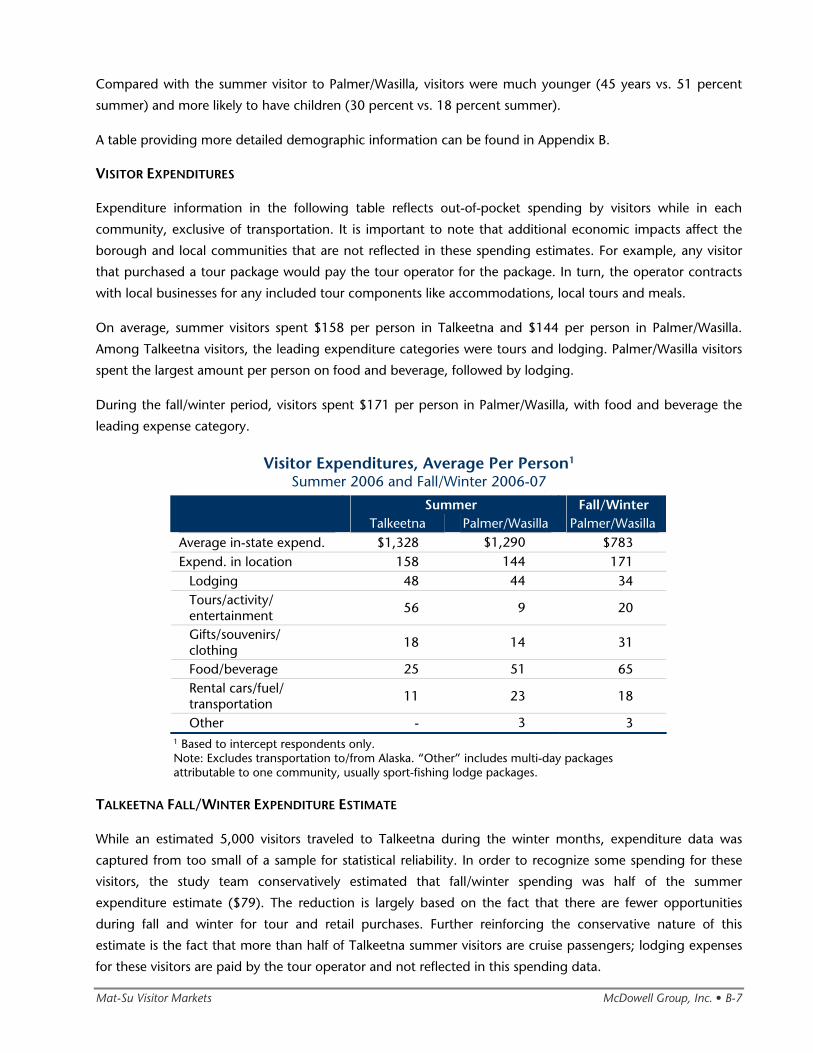
Mat-Su Visitor Markets McDowell Group, Inc. • B-7
Compared with the summer visitor to Palmer/Wasilla, visitors were much younger (45 years vs. 51 percent
summer) and more likely to have children (30 percent vs. 18 percent summer).
A table providing more detailed demographic information can be found in Appendix B.
VISITOR EXPENDITURES
Expenditure information in the following table reflects out-of-pocket spending by visitors while in each
community, exclusive of transportation. It is important to note that additional economic impacts affect the
borough and local communities that are not reflected in these spending estimates. For example, any visitor
that purchased a tour package would pay the tour operator for the package. In turn, the operator contracts
with local businesses for any included tour components like accommodations, local tours and meals.
On average, summer visitors spent $158 per person in Talkeetna and $144 per person in Palmer/Wasilla.
Among Talkeetna visitors, the leading expenditure categories were tours and lodging. Palmer/Wasilla visitors
spent the largest amount per person on food and beverage, followed by lodging.
During the fall/winter period, visitors spent $171 per person in Palmer/Wasilla, with food and beverage the
leading expense category.
Visitor Expenditures, Average Per Person1 Summer 2006 and Fall/Winter 2006-07
Summer Fall/Winter Talkeetna Palmer/Wasilla Palmer/Wasilla Average in-state expend. $1,328 $1,290 $783 Expend. in location 158 144 171
Lodging 48 44 34 Tours/activity/ entertainment
56 9 20
Gifts/souvenirs/ clothing
18 14 31
Food/beverage 25 51 65 Rental cars/fuel/ transportation
11 23 18
Other - 3 3 1 Based to intercept respondents only. Note: Excludes transportation to/from Alaska. “Other” includes multi-day packages attributable to one community, usually sport-fishing lodge packages.
TALKEETNA FALL/WINTER EXPENDITURE ESTIMATE
While an estimated 5,000 visitors traveled to Talkeetna during the winter months, expenditure data was
captured from too small of a sample for statistical reliability. In order to recognize some spending for these
visitors, the study team conservatively estimated that fall/winter spending was half of the summer
expenditure estimate ($79). The reduction is largely based on the fact that there are fewer opportunities
during fall and winter for tour and retail purchases. Further reinforcing the conservative nature of this
estimate is the fact that more than half of Talkeetna summer visitors are cruise passengers; lodging expenses
for these visitors are paid by the tour operator and not reflected in this spending data.
Mat-Su Visitor Markets McDowell Group, Inc. • B-8
Glacier Country (Glenn Highway) Region
While visitor travel on the Glenn Highway was not specifically measured in AVSP, the highway/ferry visitor
market is believed to be representative of Glenn Highway summer out-of-state visitors. A summary profile for
each of this market is provided in Appendix B.
Visitor Volume
During summer 2006, an estimated 85,000 visitors entered or exited Alaska by highway or ferry. It is also very
likely that a portion of the 139,000 Palmer/Wasilla visitors drove a portion of the Glenn Highway.
After evaluating visitor volume and travel patterns of the highway/ferry market and factoring in the
accessibility and scenic appeal of the Glenn Highway, the study team conservatively estimates that 90,000
visitors traveled a portion of Glenn Highway during the summer.
During the fall/winter period, about 1 percent of the entire market may have visited the Glenn Highway or
Glacier Country, representing about 2,500 visitors (the survey sample was too small for additional analysis).
Visitor Activities and Travel Patterns
The top activities in Alaska for highway/ferry summer visitors were shopping (60 percent), wildlife viewing
(47 percent) and camping (46 percent). Visitors who entered or exited Alaska by highway and ferry spent an
average of 19 nights in Alaska.
Total out-of-state Visitor Expenditures in the Borough
Summer highway/ferry visitors reported spending an average of $1,310 per person in Alaska. Based on an
average trip length of 18.8 days in Alaska, this market spent approximately $70 per person, per day while in
Alaska.
Recognizing that the largest spending occurred in the retail and service centers of the state, visitor spending
along the Glenn Highway corridor was likely very low on a per-person basis. The relatively small number of
accommodations and the high percentage of highway visitors that camp further reinforces this assumption.
The study team developed a conservative estimate of $10 per person in spending along the Glenn Highway,
for a total spending estimate of $900,000.
Off the Beaten Path Region
During the first phase of this project (Base Case Tourism Infrastructure Description), nearly 20 individual lodges
and remote properties were identified in the “Off the Beaten Path” area of the region. This large region
encompasses a horseshoe-shaped swath of the southwest, north and northeast corners of the borough. The
study team developed an estimate of visitor volume, activities and spending from an analysis of these
individual properties.
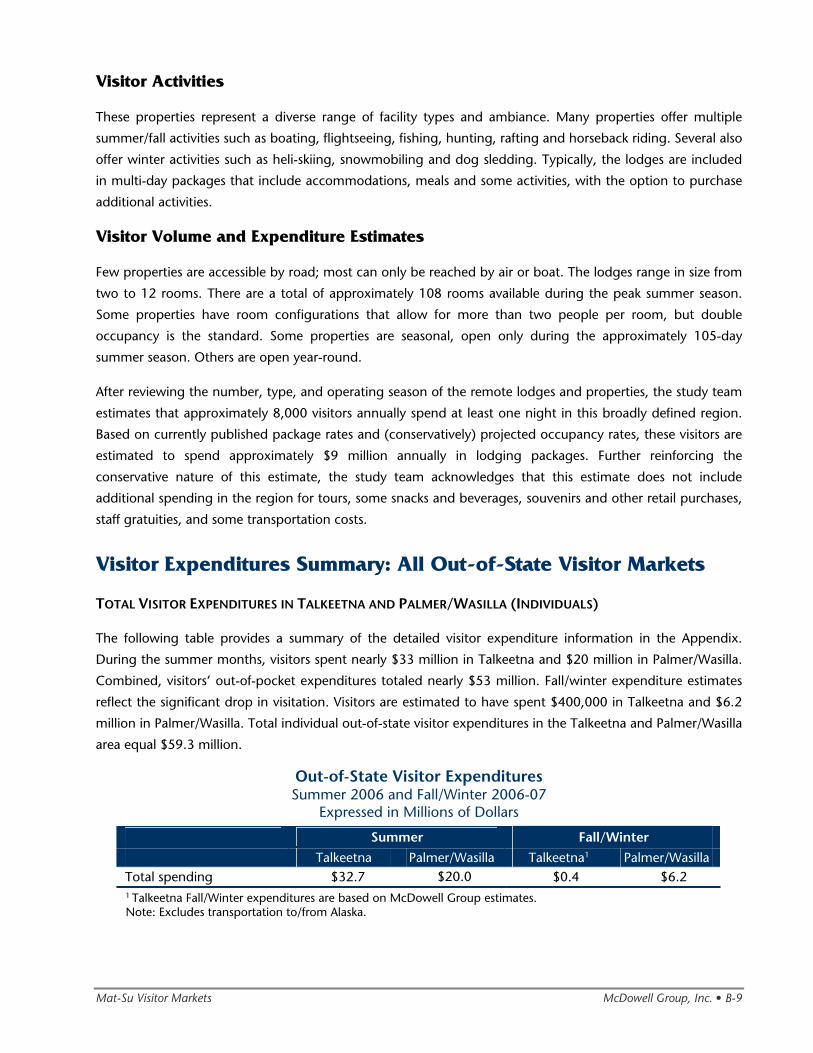
Mat-Su Visitor Markets McDowell Group, Inc. • B-9
Visitor Activities
These properties represent a diverse range of facility types and ambiance. Many properties offer multiple
summer/fall activities such as boating, flightseeing, fishing, hunting, rafting and horseback riding. Several also
offer winter activities such as heli-skiing, snowmobiling and dog sledding. Typically, the lodges are included
in multi-day packages that include accommodations, meals and some activities, with the option to purchase
additional activities.
Visitor Volume and Expenditure Estimates
Few properties are accessible by road; most can only be reached by air or boat. The lodges range in size from
two to 12 rooms. There are a total of approximately 108 rooms available during the peak summer season.
Some properties have room configurations that allow for more than two people per room, but double
occupancy is the standard. Some properties are seasonal, open only during the approximately 105-day
summer season. Others are open year-round.
After reviewing the number, type, and operating season of the remote lodges and properties, the study team
estimates that approximately 8,000 visitors annually spend at least one night in this broadly defined region.
Based on currently published package rates and (conservatively) projected occupancy rates, these visitors are
estimated to spend approximately $9 million annually in lodging packages. Further reinforcing the
conservative nature of this estimate, the study team acknowledges that this estimate does not include
additional spending in the region for tours, some snacks and beverages, souvenirs and other retail purchases,
staff gratuities, and some transportation costs.
Visitor Expenditures Summary: All Out-of-State Visitor Markets
TOTAL VISITOR EXPENDITURES IN TALKEETNA AND PALMER/WASILLA (INDIVIDUALS)
The following table provides a summary of the detailed visitor expenditure information in the Appendix.
During the summer months, visitors spent nearly $33 million in Talkeetna and $20 million in Palmer/Wasilla.
Combined, visitors’ out-of-pocket expenditures totaled nearly $53 million. Fall/winter expenditure estimates
reflect the significant drop in visitation. Visitors are estimated to have spent $400,000 in Talkeetna and $6.2
million in Palmer/Wasilla. Total individual out-of-state visitor expenditures in the Talkeetna and Palmer/Wasilla
area equal $59.3 million.
Out-of-State Visitor Expenditures Summer 2006 and Fall/Winter 2006-07
Expressed in Millions of Dollars
Summer Fall/Winter
Talkeetna Palmer/Wasilla Talkeetna1 Palmer/Wasilla Total spending $32.7 $20.0 $0.4 $6.2 1 Talkeetna Fall/Winter expenditures are based on McDowell Group estimates. Note: Excludes transportation to/from Alaska.
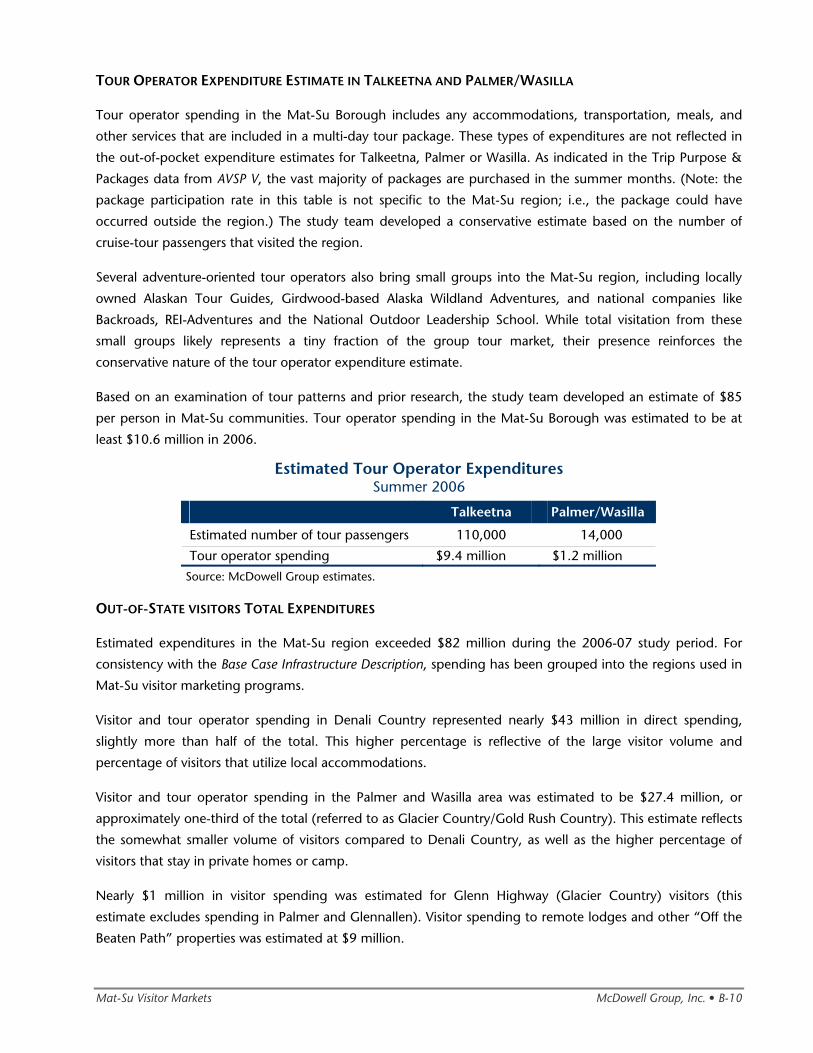
Mat-Su Visitor Markets McDowell Group, Inc. • B-10
TOUR OPERATOR EXPENDITURE ESTIMATE IN TALKEETNA AND PALMER/WASILLA
Tour operator spending in the Mat-Su Borough includes any accommodations, transportation, meals, and
other services that are included in a multi-day tour package. These types of expenditures are not reflected in
the out-of-pocket expenditure estimates for Talkeetna, Palmer or Wasilla. As indicated in the Trip Purpose &
Packages data from AVSP V, the vast majority of packages are purchased in the summer months. (Note: the
package participation rate in this table is not specific to the Mat-Su region; i.e., the package could have
occurred outside the region.) The study team developed a conservative estimate based on the number of
cruise-tour passengers that visited the region.
Several adventure-oriented tour operators also bring small groups into the Mat-Su region, including locally
owned Alaskan Tour Guides, Girdwood-based Alaska Wildland Adventures, and national companies like
Backroads, REI-Adventures and the National Outdoor Leadership School. While total visitation from these
small groups likely represents a tiny fraction of the group tour market, their presence reinforces the
conservative nature of the tour operator expenditure estimate.
Based on an examination of tour patterns and prior research, the study team developed an estimate of $85
per person in Mat-Su communities. Tour operator spending in the Mat-Su Borough was estimated to be at
least $10.6 million in 2006.
Estimated Tour Operator Expenditures Summer 2006
Talkeetna Palmer/Wasilla
Estimated number of tour passengers 110,000 14,000
Tour operator spending $9.4 million $1.2 million
Source: McDowell Group estimates.
OUT-OF-STATE VISITORS TOTAL EXPENDITURES
Estimated expenditures in the Mat-Su region exceeded $82 million during the 2006-07 study period. For
consistency with the Base Case Infrastructure Description, spending has been grouped into the regions used in
Mat-Su visitor marketing programs.
Visitor and tour operator spending in Denali Country represented nearly $43 million in direct spending,
slightly more than half of the total. This higher percentage is reflective of the large visitor volume and
percentage of visitors that utilize local accommodations.
Visitor and tour operator spending in the Palmer and Wasilla area was estimated to be $27.4 million, or
approximately one-third of the total (referred to as Glacier Country/Gold Rush Country). This estimate reflects
the somewhat smaller volume of visitors compared to Denali Country, as well as the higher percentage of
visitors that stay in private homes or camp.
Nearly $1 million in visitor spending was estimated for Glenn Highway (Glacier Country) visitors (this
estimate excludes spending in Palmer and Glennallen). Visitor spending to remote lodges and other “Off the
Beaten Path” properties was estimated at $9 million.
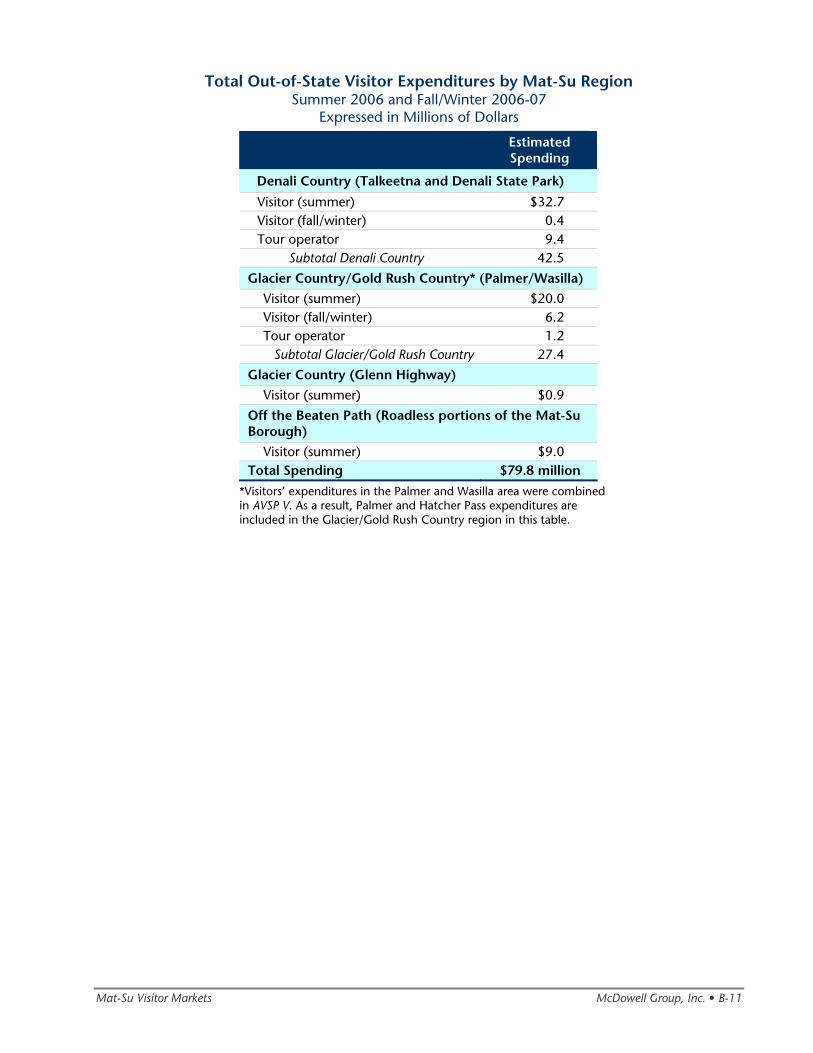
Mat-Su Visitor Markets McDowell Group, Inc. • B-11
Total Out-of-State Visitor Expenditures by Mat-Su Region Summer 2006 and Fall/Winter 2006-07
Expressed in Millions of Dollars
Estimated Spending
Denali Country (Talkeetna and Denali State Park)
Visitor (summer) $32.7 Visitor (fall/winter) 0.4 Tour operator 9.4
Subtotal Denali Country 42.5
Glacier Country/Gold Rush Country* (Palmer/Wasilla)
Visitor (summer) $20.0 Visitor (fall/winter) 6.2 Tour operator 1.2
Subtotal Glacier/Gold Rush Country 27.4
Glacier Country (Glenn Highway)
Visitor (summer) $0.9
Off the Beaten Path (Roadless portions of the Mat-Su Borough)
Visitor (summer) $9.0 Total Spending $79.8 million
*Visitors’ expenditures in the Palmer and Wasilla area were combined in AVSP V. As a result, Palmer and Hatcher Pass expenditures are included in the Glacier/Gold Rush Country region in this table.
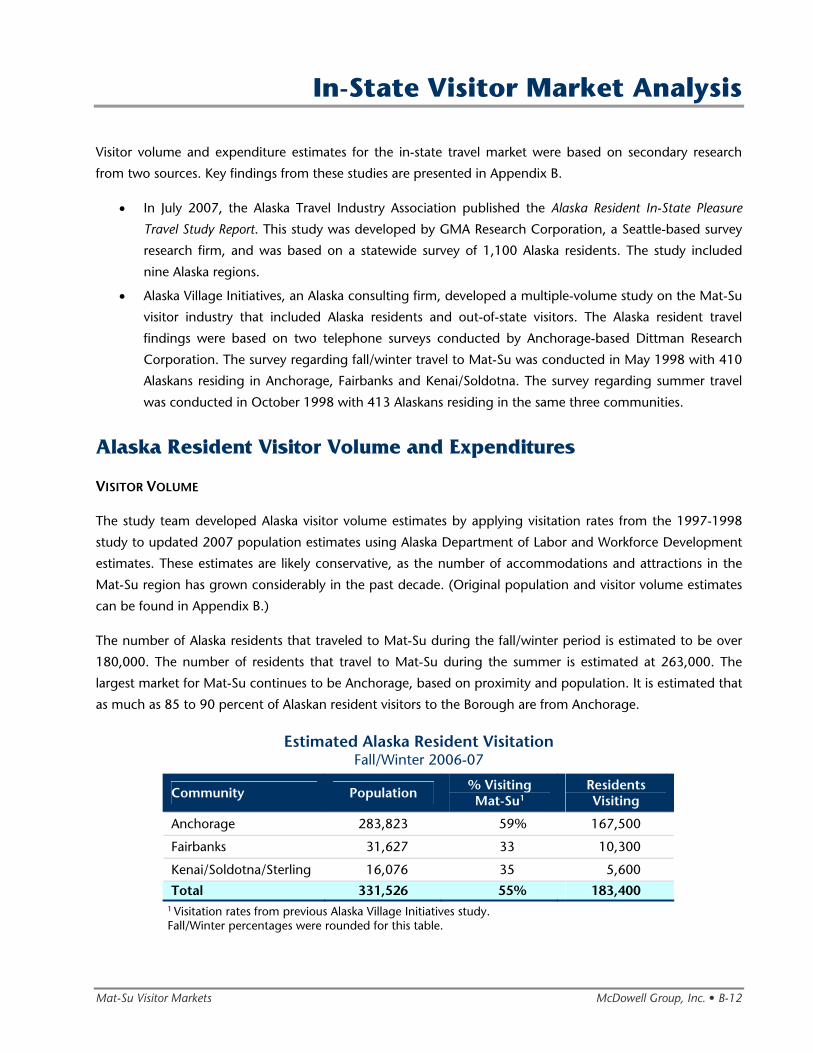
Mat-Su Visitor Markets McDowell Group, Inc. • B-12
In-State Visitor Market Analysis
Visitor volume and expenditure estimates for the in-state travel market were based on secondary research
from two sources. Key findings from these studies are presented in Appendix B.
• In July 2007, the Alaska Travel Industry Association published the Alaska Resident In-State Pleasure
Travel Study Report. This study was developed by GMA Research Corporation, a Seattle-based survey
research firm, and was based on a statewide survey of 1,100 Alaska residents. The study included
nine Alaska regions.
• Alaska Village Initiatives, an Alaska consulting firm, developed a multiple-volume study on the Mat-Su
visitor industry that included Alaska residents and out-of-state visitors. The Alaska resident travel
findings were based on two telephone surveys conducted by Anchorage-based Dittman Research
Corporation. The survey regarding fall/winter travel to Mat-Su was conducted in May 1998 with 410
Alaskans residing in Anchorage, Fairbanks and Kenai/Soldotna. The survey regarding summer travel
was conducted in October 1998 with 413 Alaskans residing in the same three communities.
Alaska Resident Visitor Volume and Expenditures
VISITOR VOLUME
The study team developed Alaska visitor volume estimates by applying visitation rates from the 1997-1998
study to updated 2007 population estimates using Alaska Department of Labor and Workforce Development
estimates. These estimates are likely conservative, as the number of accommodations and attractions in the
Mat-Su region has grown considerably in the past decade. (Original population and visitor volume estimates
can be found in Appendix B.)
The number of Alaska residents that traveled to Mat-Su during the fall/winter period is estimated to be over
180,000. The number of residents that travel to Mat-Su during the summer is estimated at 263,000. The
largest market for Mat-Su continues to be Anchorage, based on proximity and population. It is estimated that
as much as 85 to 90 percent of Alaskan resident visitors to the Borough are from Anchorage.
Estimated Alaska Resident Visitation Fall/Winter 2006-07
Community Population % Visiting Mat-Su1
Residents Visiting
Anchorage 283,823 59% 167,500
Fairbanks 31,627 33 10,300
Kenai/Soldotna/Sterling 16,076 35 5,600
Total 331,526 55% 183,400 1 Visitation rates from previous Alaska Village Initiatives study. Fall/Winter percentages were rounded for this table.
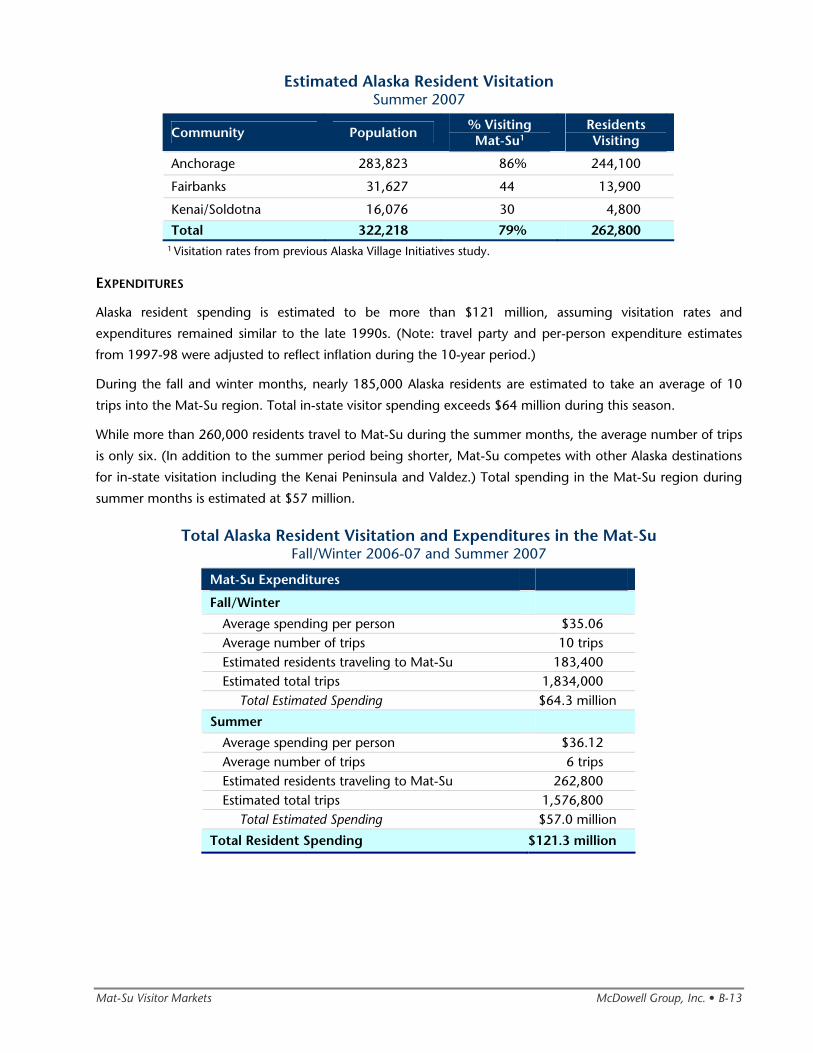
Mat-Su Visitor Markets McDowell Group, Inc. • B-13
Estimated Alaska Resident Visitation Summer 2007
Community Population % Visiting Mat-Su1
Residents Visiting
Anchorage 283,823 86% 244,100
Fairbanks 31,627 44 13,900
Kenai/Soldotna 16,076 30 4,800
Total 322,218 79% 262,800 1 Visitation rates from previous Alaska Village Initiatives study.
EXPENDITURES
Alaska resident spending is estimated to be more than $121 million, assuming visitation rates and
expenditures remained similar to the late 1990s. (Note: travel party and per-person expenditure estimates
from 1997-98 were adjusted to reflect inflation during the 10-year period.)
During the fall and winter months, nearly 185,000 Alaska residents are estimated to take an average of 10
trips into the Mat-Su region. Total in-state visitor spending exceeds $64 million during this season.
While more than 260,000 residents travel to Mat-Su during the summer months, the average number of trips
is only six. (In addition to the summer period being shorter, Mat-Su competes with other Alaska destinations
for in-state visitation including the Kenai Peninsula and Valdez.) Total spending in the Mat-Su region during
summer months is estimated at $57 million.
Total Alaska Resident Visitation and Expenditures in the Mat-Su Fall/Winter 2006-07 and Summer 2007
Mat-Su Expenditures
Fall/Winter
Average spending per person $35.06 Average number of trips 10 trips Estimated residents traveling to Mat-Su 183,400 Estimated total trips 1,834,000
Total Estimated Spending $64.3 million
Summer
Average spending per person $36.12 Average number of trips 6 trips Estimated residents traveling to Mat-Su 262,800 Estimated total trips 1,576,800
Total Estimated Spending $57.0 million
Total Resident Spending $121.3 million
Mat-Su Visitor Markets McDowell Group, Inc. • B-14
Market Outlook
This section includes a brief discussion of the statewide and regional trends for both in-state and out-of-state
visitors that are likely to affect the Mat-Su visitor industry in the near future.
Cruise and Cruise-Tour Market
On a statewide level, the cruise industry has shown remarkably consistent growth in the past several decades.
Total Alaska cruise volume increased steadily throughout the 1980s and 1990s, reaching a record 1 million
visitors in 2007. More relevant for the Mat-Su region, the number of cruise-tour passengers has likewise
increased, while tour patterns have expanded to bring more and more visitors to the area.
In 2006, 22 percent of cruise passengers participated in an Alaska cruise and overnight land tour package
(approximately 211,000 visitors). The number of cruise-tour passengers does not always rise in direct
correlation with the overall cruise market. For example, in 2002 and 2003 (post 9/11 years) the Alaska market
declined somewhat for these longer, more expensive package tours. The cruise-tour market has since
rebounded. The addition of Royal Celebrity Tours, whose clients overnight in Talkeetna, has also increased
the overall volume of cruise-tour offerings.
The Talkeetna area has become an increasingly popular element of cruise-tour packages. Many of the cruise-
tour package options include two nights in the area. Tour operators are also offering tours that feature
Southcentral and Denali without continuing north to Fairbanks. Increased access and product development in
the South Denali region—coupled with high visitor demand for Denali experiences—is likely to stimulate
disproportionate growth in comparison to other areas of the state.
Finally, a growing volume of cruise passengers spend time on their own in Alaska (separate from their pre-
paid package) before or after their cruise experience. In 2006, 12 percent of all cruise passengers spent
additional time in Alaska (approximately 115,000 visitors). The proximity of Mat-Su to the Anchorage airport
and southcentral ports bodes well for attracting these “disappearing cruisers.”
The cruise market to Alaska is anticipated to grow between 2 and 5 percent annually over the next five years.
This growth is slower than in the past, as Alaska ports are reaching capacity and port infrastructure
enhancement is occurring more slowly. However, major cruise lines own significant land assets in Alaska and
these assets generate important revenues to these companies. In particular, the Denali corridor, between
Anchorage and Fairbanks, is the highest demand area for land tours in the state; there is considerable focus
by the cruise lines and their tour companies to increase visitor volume through this area. Even if the cruise
market overall to Alaska is expected to grow more slowly in the future, cruise-tour volume is expected to
grow steadily.
Mat-Su Visitor Markets McDowell Group, Inc. • B-15
Independent Travel
While the independent market is not currently showing the strong growth of the cruise market, it is still an
important one for Mat-Su to pursue. The air market, in particular, represents a significant volume of visitors
(defined as visitors who enter and exit Alaska by air). During summer 2006, one-third of air visitors reported
using rental cars to travel between communities. Similarly, 22 percent reported traveling between
communities in a personal vehicle (likely owned by in-state friends or relatives). With Anchorage serving as
the largest transportation hub for air travelers, Mat-Su is well poised to increase its share of this highly mobile
market segment.
The number of visitors that travel to Alaska by highway or ferry has experienced a steady, gradual decline
since the early 1990s. Several marketing initiatives are underway to stem the decline, as these visitors travel
widely throughout Alaska’s highway system and are in Alaska twice as long, on average, as other markets.
This market could grow between 1 and 3 percent annually over the next several years. Despite a modest rate
of growth, this visitor segment is large, fairly reliable from year-to-year, and can be influenced by marketing;
it should represent a significant part of the Mat-Su’s promotional efforts.
Package Tours
Twenty-one percent of visitors that entered and exited Alaska by air reported purchasing a multi-day tour
package that included lodging, transportation and activities. Nearly half of these packages were fishing lodge
packages. Adventure tour packages and wilderness lodge packages were purchased by 15 percent and 14
percent of the market respectively. (Very few highway and ferry travelers purchase multi-day tour packages.)
A wide array of large and small tour operators currently include Mat-Su in their multi-day packages. These
operators range from small groups of 16 to 30 adventure travelers seeking unique lodges and inns, to
motorcoach groups of 40 to 50 passengers seeking sightseeing, dining, and lodging that can accommodate
the entire group simultaneously.
Additionally, a large percentage of the Mat-Su accommodations in the “Off the Beaten Path” region are
multi-day packages. These visitors tend to travel with their individual travel party members, rather than larger
groups.
The market trend for offering increasing variety and customization of package tours is positive for Mat-Su.
Improved transportation within the borough—especially in the Denali Highway and Hatcher Pass area—is
likely to spur new tour patterns and product development. However, small and mid-sized operators already
report accommodation constraints in Talkeetna and along the Glenn Highway.
Mat-Su Visitor Markets McDowell Group, Inc. • B-16
Adventure Travel
The adventure market is a small market that includes adventure package travelers and adventure-seeking
visitors that travel independently. The natural beauty and attractions in the Mat-Su region are a perfect match
for this niche market. At the extreme range, the National Park Service reports that an estimated 2,000 people
attempt to summit Mt. McKinley annually. Most of these attempts are based in Talkeetna. The region offers
many other opportunities for adventure seekers to experience mountaineering, rafting, hiking, camping,
skiing and other outdoor recreation.
Meetings and Conferences
While Mat-Su hosts a small number of conferences and retreats, the lack of meeting facilities currently
precludes any meaningful growth in this market. Statewide, the number of Alaskan associations is fairly stable
and the market is competitive. The in-state market includes groups like the Alaska Bar Association, Alaska
Municipal League, Alaska Travel Industry Association, and many state and regional associations. It is likely that
many of these groups have pent-up demand for Mat-Su region meetings, as they probably outgrew the
meeting facilities long ago.
Additionally, Mat-Su has the opportunity to tie into the increased national and international exposure
generated by Anchorage. The completion of The Dena’ina Center in fall 2008 will significantly increase both
meeting capacity and marketing efforts.
In-State Travel
Anchorage population growth, with an increase of 11 percent over the past decade, is extremely favorable for
continued year-round visitation from Mat-Su’s closest and largest neighbor. Additionally, Mat-Su itself has
experienced tremendous population growth. (While the focus of this study is to stimulate economic
development associated with visitor expenditures from outside the region, it is noteworthy that Mat-Su
residents travel widely within the borough as well.)
Alaska residents travel frequently to Mat-Su communities for sporting events, festivals and other special
events. Some special events create short-term needs for public restrooms and other services. The potential for
growth in this area is contingent on continued organization support, volunteer efforts and promotional
efforts to sustain the activities.
Several prior studies have indicated that Alaska residents would be motivated to travel to Mat-Su for
performances and concerts. The existing performing arts facilities have some limitations in terms of seating
capacity and availability.
Mat-Su Visitor Markets McDowell Group, Inc. • B-17
National Parks and Related Growth
Visiting national parks is a highly rated activity among current and potential Alaska travelers. Two areas of the
state are poised for growth: South Denali and Copper Basin/Wrangell-St. Elias National Park and Preserve.
Of the two regions, South Denali has significantly more momentum and market recognition, as visiting
Denali is a leading motive for many Alaska travelers. South Denali development will be a cornerstone of the
future development of tourism in the Mat-Su. (Pending infrastructure developments are discussed more fully
in the Needed Tourism Infrastructure Improvement chapter of the final report.)
The Copper Basin region is also well poised for growth. This area includes lands owned by Ahtna,
Incorporated (the regional ANCSA corporation), National Park Service, and other private landowners. Market
growth is most likely to come from cruise-tour operators and other package tour companies. Recent visitor
industry planning and development efforts should increase the profile of this accessible and beautiful region.
Mat-Su visitor industry businesses and communities should benefit from increased market awareness and
visitation to the National Parks and surrounding areas. However, it will be important for the accommodations
and attractions located directly within the Mat-Su region to remain competitive with any new developments
in terms of quality and price.
Assessment of Tourism Industry
Value
Assessment of Tourism Industry Value McDowell Group, Inc. • Page C-1
Assessment of Tourism Industry Value
Introduction
The visitor industry plays an important role in diversifying the Mat-Su Borough economy. In-state and out-of-
state visitors are visible throughout the year, using a wide variety of lodging establishments, traveling in RVs
and buses and enjoying recreational activities like hiking and boating.
While tourism can be a high-profile element of life in Mat-Su, it is difficult to measure impacts from this
industry because it does not fall neatly into standard economic categories. Instead, tourism directly and
indirectly affects a wide variety of sectors including accommodation and food service, transportation,
communication, construction and others.
Because of the unique challenges when trying to determine the value of the tourism industry, it is common to
compile several economic and socio-economic indicators including the information found in this section.
• The study team begins with a discussion of the direct and indirect impacts of visitor-related spending,
and how multiplier effects are applied to determine indirect impacts. To reinforce the employment
estimates attributable to the visitor industry, the study analyzed data from the Alaska Department of
Labor and Workforce Development.
• The study team then analyzes a number of additional indicators that help illustrate the impacts of the
visitor industry on the economy including employment in visitor-affected sectors of the economy,
Matanuska-Susitna Borough business licenses, bed tax revenues and sport fishing participation.
• The report includes scenarios for future visitation and bed tax collections, using information collected
during the baseline assessment.
• Finally, this section includes a discussion of the intrinsic value of tourism.
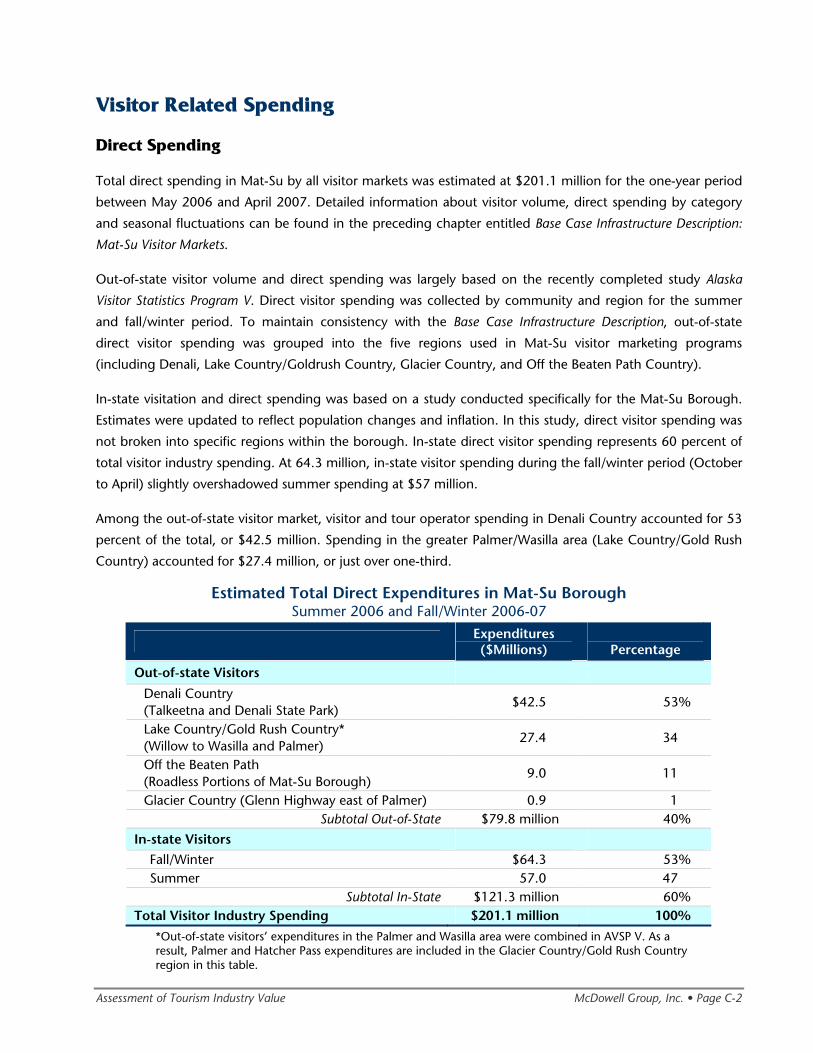
Assessment of Tourism Industry Value McDowell Group, Inc. • Page C-2
Visitor Related Spending
Direct Spending
Total direct spending in Mat-Su by all visitor markets was estimated at $201.1 million for the one-year period
between May 2006 and April 2007. Detailed information about visitor volume, direct spending by category
and seasonal fluctuations can be found in the preceding chapter entitled Base Case Infrastructure Description:
Mat-Su Visitor Markets.
Out-of-state visitor volume and direct spending was largely based on the recently completed study Alaska
Visitor Statistics Program V. Direct visitor spending was collected by community and region for the summer
and fall/winter period. To maintain consistency with the Base Case Infrastructure Description, out-of-state
direct visitor spending was grouped into the five regions used in Mat-Su visitor marketing programs
(including Denali, Lake Country/Goldrush Country, Glacier Country, and Off the Beaten Path Country).
In-state visitation and direct spending was based on a study conducted specifically for the Mat-Su Borough.
Estimates were updated to reflect population changes and inflation. In this study, direct visitor spending was
not broken into specific regions within the borough. In-state direct visitor spending represents 60 percent of
total visitor industry spending. At 64.3 million, in-state visitor spending during the fall/winter period (October
to April) slightly overshadowed summer spending at $57 million.
Among the out-of-state visitor market, visitor and tour operator spending in Denali Country accounted for 53
percent of the total, or $42.5 million. Spending in the greater Palmer/Wasilla area (Lake Country/Gold Rush
Country) accounted for $27.4 million, or just over one-third.
Estimated Total Direct Expenditures in Mat-Su Borough Summer 2006 and Fall/Winter 2006-07
Expenditures ($Millions)
Percentage
Out-of-state Visitors
Denali Country (Talkeetna and Denali State Park)
$42.5 53%
Lake Country/Gold Rush Country* (Willow to Wasilla and Palmer)
27.4 34
Off the Beaten Path (Roadless Portions of Mat-Su Borough)
9.0 11
Glacier Country (Glenn Highway east of Palmer) 0.9 1 Subtotal Out-of-State $79.8 million 40%
In-state Visitors
Fall/Winter $64.3 53% Summer 57.0 47
Subtotal In-State $121.3 million 60% Total Visitor Industry Spending $201.1 million 100%
*Out-of-state visitors’ expenditures in the Palmer and Wasilla area were combined in AVSP V. As a result, Palmer and Hatcher Pass expenditures are included in the Glacier Country/Gold Rush Country region in this table.
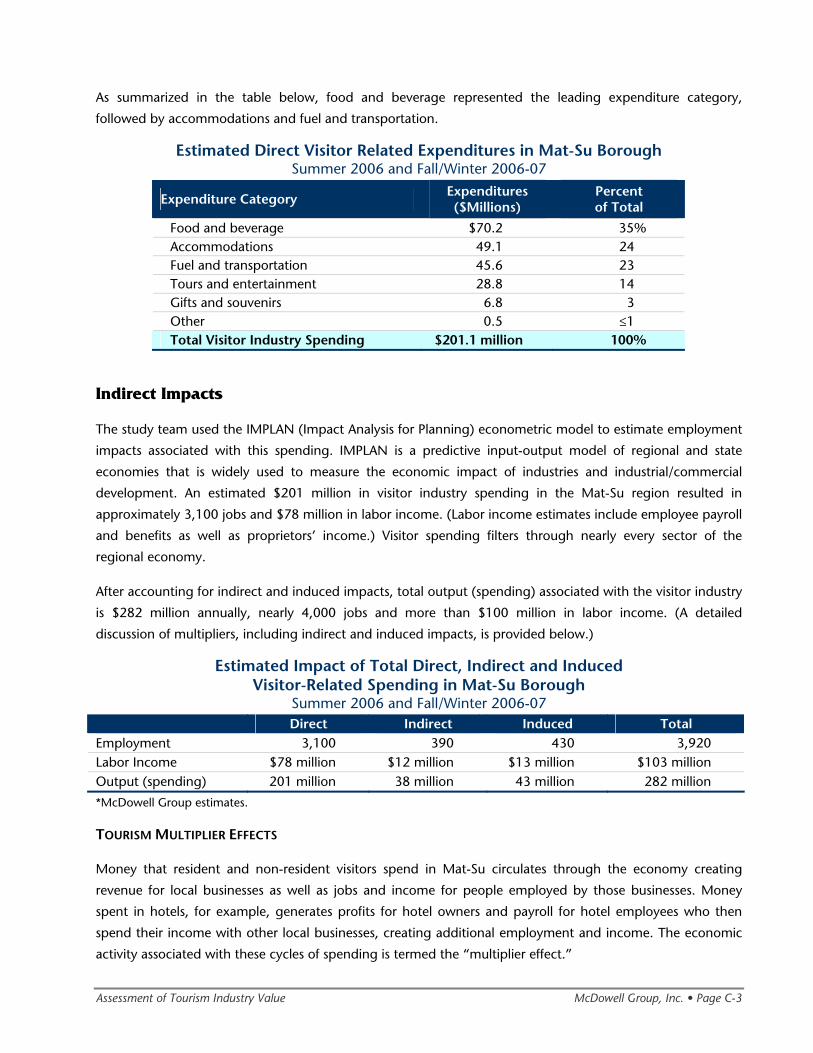
Assessment of Tourism Industry Value McDowell Group, Inc. • Page C-3
As summarized in the table below, food and beverage represented the leading expenditure category,
followed by accommodations and fuel and transportation.
Estimated Direct Visitor Related Expenditures in Mat-Su Borough Summer 2006 and Fall/Winter 2006-07
Expenditure Category Expenditures ($Millions)
Percent of Total
Food and beverage $70.2 35% Accommodations 49.1 24 Fuel and transportation 45.6 23 Tours and entertainment 28.8 14 Gifts and souvenirs 6.8 3 Other 0.5 ≤1 Total Visitor Industry Spending $201.1 million 100%
Indirect Impacts
The study team used the IMPLAN (Impact Analysis for Planning) econometric model to estimate employment
impacts associated with this spending. IMPLAN is a predictive input-output model of regional and state
economies that is widely used to measure the economic impact of industries and industrial/commercial
development. An estimated $201 million in visitor industry spending in the Mat-Su region resulted in
approximately 3,100 jobs and $78 million in labor income. (Labor income estimates include employee payroll
and benefits as well as proprietors’ income.) Visitor spending filters through nearly every sector of the
regional economy.
After accounting for indirect and induced impacts, total output (spending) associated with the visitor industry
is $282 million annually, nearly 4,000 jobs and more than $100 million in labor income. (A detailed
discussion of multipliers, including indirect and induced impacts, is provided below.)
Estimated Impact of Total Direct, Indirect and Induced Visitor-Related Spending in Mat-Su Borough
Summer 2006 and Fall/Winter 2006-07
Direct Indirect Induced Total Employment 3,100 390 430 3,920 Labor Income $78 million $12 million $13 million $103 million Output (spending) 201 million 38 million 43 million 282 million
*McDowell Group estimates.
TOURISM MULTIPLIER EFFECTS
Money that resident and non-resident visitors spend in Mat-Su circulates through the economy creating
revenue for local businesses as well as jobs and income for people employed by those businesses. Money
spent in hotels, for example, generates profits for hotel owners and payroll for hotel employees who then
spend their income with other local businesses, creating additional employment and income. The economic
activity associated with these cycles of spending is termed the “multiplier effect.”
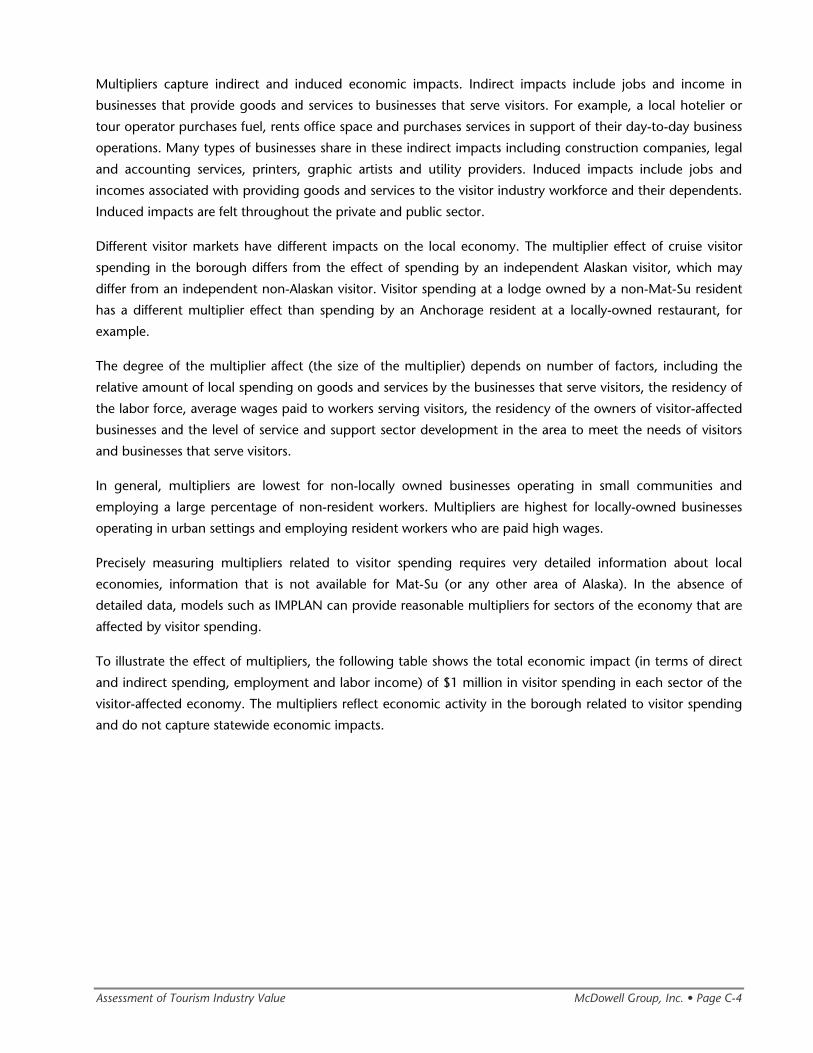
Assessment of Tourism Industry Value McDowell Group, Inc. • Page C-4
Multipliers capture indirect and induced economic impacts. Indirect impacts include jobs and income in
businesses that provide goods and services to businesses that serve visitors. For example, a local hotelier or
tour operator purchases fuel, rents office space and purchases services in support of their day-to-day business
operations. Many types of businesses share in these indirect impacts including construction companies, legal
and accounting services, printers, graphic artists and utility providers. Induced impacts include jobs and
incomes associated with providing goods and services to the visitor industry workforce and their dependents.
Induced impacts are felt throughout the private and public sector.
Different visitor markets have different impacts on the local economy. The multiplier effect of cruise visitor
spending in the borough differs from the effect of spending by an independent Alaskan visitor, which may
differ from an independent non-Alaskan visitor. Visitor spending at a lodge owned by a non-Mat-Su resident
has a different multiplier effect than spending by an Anchorage resident at a locally-owned restaurant, for
example.
The degree of the multiplier affect (the size of the multiplier) depends on number of factors, including the
relative amount of local spending on goods and services by the businesses that serve visitors, the residency of
the labor force, average wages paid to workers serving visitors, the residency of the owners of visitor-affected
businesses and the level of service and support sector development in the area to meet the needs of visitors
and businesses that serve visitors.
In general, multipliers are lowest for non-locally owned businesses operating in small communities and
employing a large percentage of non-resident workers. Multipliers are highest for locally-owned businesses
operating in urban settings and employing resident workers who are paid high wages.
Precisely measuring multipliers related to visitor spending requires very detailed information about local
economies, information that is not available for Mat-Su (or any other area of Alaska). In the absence of
detailed data, models such as IMPLAN can provide reasonable multipliers for sectors of the economy that are
affected by visitor spending.
To illustrate the effect of multipliers, the following table shows the total economic impact (in terms of direct
and indirect spending, employment and labor income) of $1 million in visitor spending in each sector of the
visitor-affected economy. The multipliers reflect economic activity in the borough related to visitor spending
and do not capture statewide economic impacts.
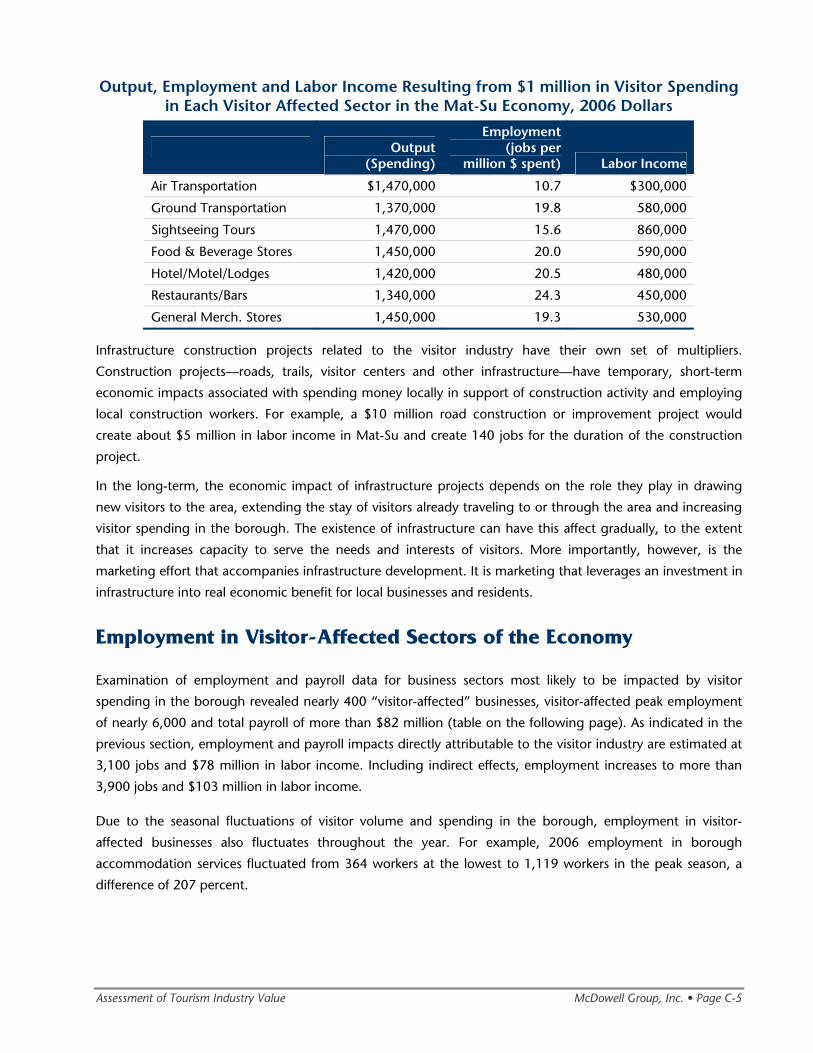
Assessment of Tourism Industry Value McDowell Group, Inc. • Page C-5
Output, Employment and Labor Income Resulting from $1 million in Visitor Spending in Each Visitor Affected Sector in the Mat-Su Economy, 2006 Dollars
Output (Spending)
Employment (jobs per
million $ spent) Labor Income
Air Transportation $1,470,000 10.7 $300,000
Ground Transportation 1,370,000 19.8 580,000
Sightseeing Tours 1,470,000 15.6 860,000
Food & Beverage Stores 1,450,000 20.0 590,000
Hotel/Motel/Lodges 1,420,000 20.5 480,000
Restaurants/Bars 1,340,000 24.3 450,000
General Merch. Stores 1,450,000 19.3 530,000
Infrastructure construction projects related to the visitor industry have their own set of multipliers.
Construction projects—roads, trails, visitor centers and other infrastructure—have temporary, short-term
economic impacts associated with spending money locally in support of construction activity and employing
local construction workers. For example, a $10 million road construction or improvement project would
create about $5 million in labor income in Mat-Su and create 140 jobs for the duration of the construction
project.
In the long-term, the economic impact of infrastructure projects depends on the role they play in drawing
new visitors to the area, extending the stay of visitors already traveling to or through the area and increasing
visitor spending in the borough. The existence of infrastructure can have this affect gradually, to the extent
that it increases capacity to serve the needs and interests of visitors. More importantly, however, is the
marketing effort that accompanies infrastructure development. It is marketing that leverages an investment in
infrastructure into real economic benefit for local businesses and residents.
Employment in Visitor-Affected Sectors of the Economy
Examination of employment and payroll data for business sectors most likely to be impacted by visitor
spending in the borough revealed nearly 400 “visitor-affected” businesses, visitor-affected peak employment
of nearly 6,000 and total payroll of more than $82 million (table on the following page). As indicated in the
previous section, employment and payroll impacts directly attributable to the visitor industry are estimated at
3,100 jobs and $78 million in labor income. Including indirect effects, employment increases to more than
3,900 jobs and $103 million in labor income.
Due to the seasonal fluctuations of visitor volume and spending in the borough, employment in visitor-
affected businesses also fluctuates throughout the year. For example, 2006 employment in borough
accommodation services fluctuated from 364 workers at the lowest to 1,119 workers in the peak season, a
difference of 207 percent.
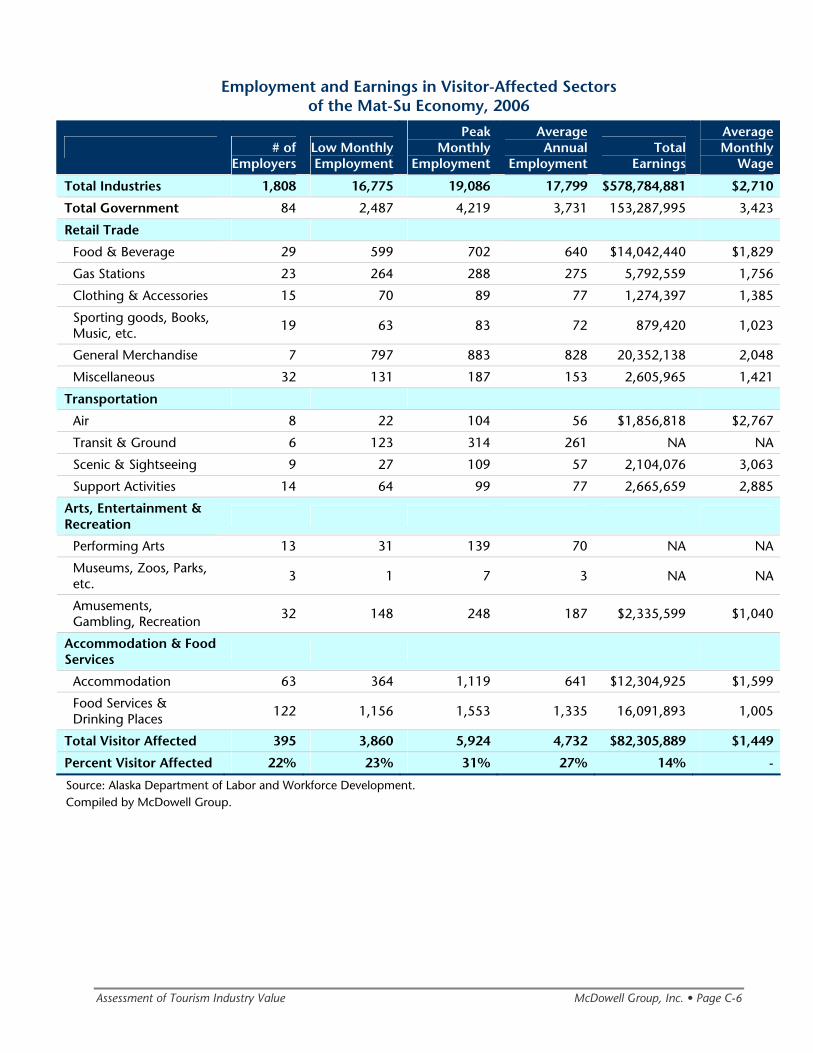
Assessment of Tourism Industry Value McDowell Group, Inc. • Page C-6
Employment and Earnings in Visitor-Affected Sectors of the Mat-Su Economy, 2006
# of Employers
Low MonthlyEmployment
Peak Monthly
Employment
Average Annual
Employment Total
Earnings
AverageMonthly
Wage
Total Industries 1,808 16,775 19,086 17,799 $578,784,881 $2,710
Total Government 84 2,487 4,219 3,731 153,287,995 3,423
Retail Trade
Food & Beverage 29 599 702 640 $14,042,440 $1,829
Gas Stations 23 264 288 275 5,792,559 1,756
Clothing & Accessories 15 70 89 77 1,274,397 1,385
Sporting goods, Books, Music, etc. 19 63 83 72 879,420 1,023
General Merchandise 7 797 883 828 20,352,138 2,048
Miscellaneous 32 131 187 153 2,605,965 1,421
Transportation
Air 8 22 104 56 $1,856,818 $2,767
Transit & Ground 6 123 314 261 NA NA
Scenic & Sightseeing 9 27 109 57 2,104,076 3,063
Support Activities 14 64 99 77 2,665,659 2,885
Arts, Entertainment & Recreation
Performing Arts 13 31 139 70 NA NA
Museums, Zoos, Parks, etc. 3 1 7 3 NA NA
Amusements, Gambling, Recreation 32 148 248 187 $2,335,599 $1,040
Accommodation & Food Services
Accommodation 63 364 1,119 641 $12,304,925 $1,599
Food Services & Drinking Places
122 1,156 1,553 1,335 16,091,893 1,005
Total Visitor Affected 395 3,860 5,924 4,732 $82,305,889 $1,449
Percent Visitor Affected 22% 23% 31% 27% 14% -
Source: Alaska Department of Labor and Workforce Development. Compiled by McDowell Group.
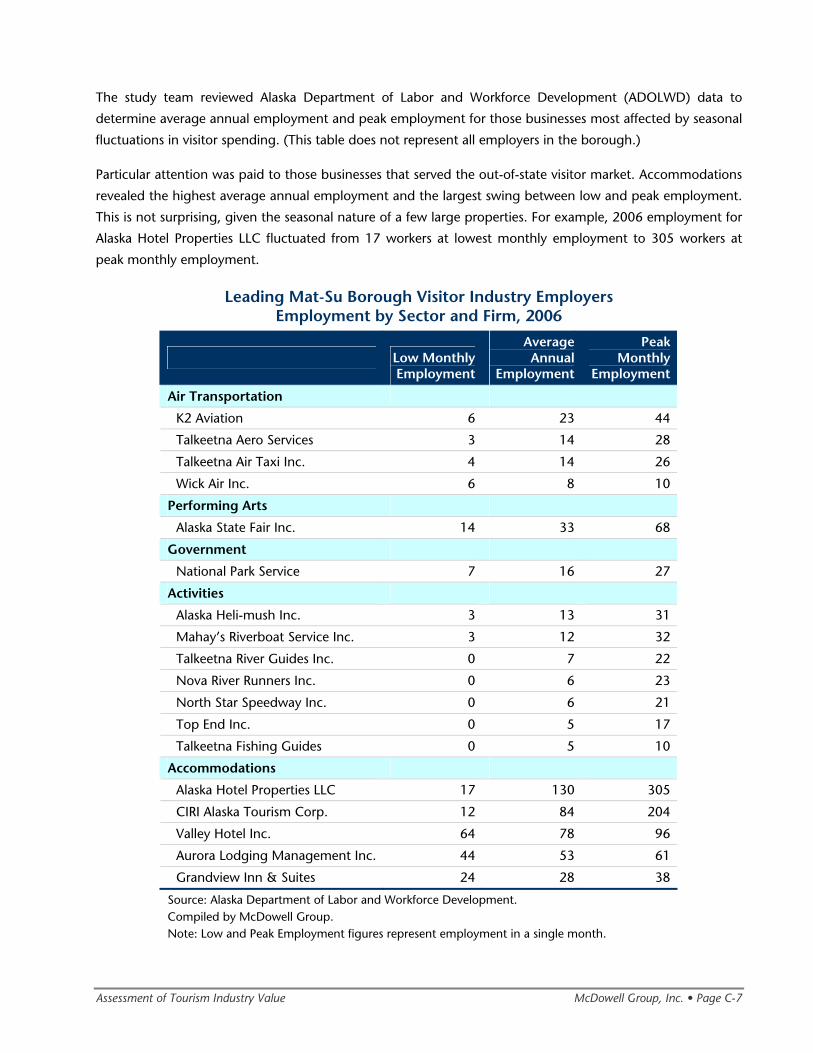
Assessment of Tourism Industry Value McDowell Group, Inc. • Page C-7
The study team reviewed Alaska Department of Labor and Workforce Development (ADOLWD) data to
determine average annual employment and peak employment for those businesses most affected by seasonal
fluctuations in visitor spending. (This table does not represent all employers in the borough.)
Particular attention was paid to those businesses that served the out-of-state visitor market. Accommodations
revealed the highest average annual employment and the largest swing between low and peak employment.
This is not surprising, given the seasonal nature of a few large properties. For example, 2006 employment for
Alaska Hotel Properties LLC fluctuated from 17 workers at lowest monthly employment to 305 workers at
peak monthly employment.
Leading Mat-Su Borough Visitor Industry Employers Employment by Sector and Firm, 2006
Low MonthlyEmployment
Average Annual
Employment
Peak Monthly
Employment
Air Transportation
K2 Aviation 6 23 44
Talkeetna Aero Services 3 14 28
Talkeetna Air Taxi Inc. 4 14 26
Wick Air Inc. 6 8 10
Performing Arts
Alaska State Fair Inc. 14 33 68
Government
National Park Service 7 16 27
Activities
Alaska Heli-mush Inc. 3 13 31
Mahay’s Riverboat Service Inc. 3 12 32
Talkeetna River Guides Inc. 0 7 22
Nova River Runners Inc. 0 6 23
North Star Speedway Inc. 0 6 21
Top End Inc. 0 5 17
Talkeetna Fishing Guides 0 5 10
Accommodations
Alaska Hotel Properties LLC 17 130 305
CIRI Alaska Tourism Corp. 12 84 204
Valley Hotel Inc. 64 78 96
Aurora Lodging Management Inc. 44 53 61
Grandview Inn & Suites 24 28 38
Source: Alaska Department of Labor and Workforce Development. Compiled by McDowell Group. Note: Low and Peak Employment figures represent employment in a single month.
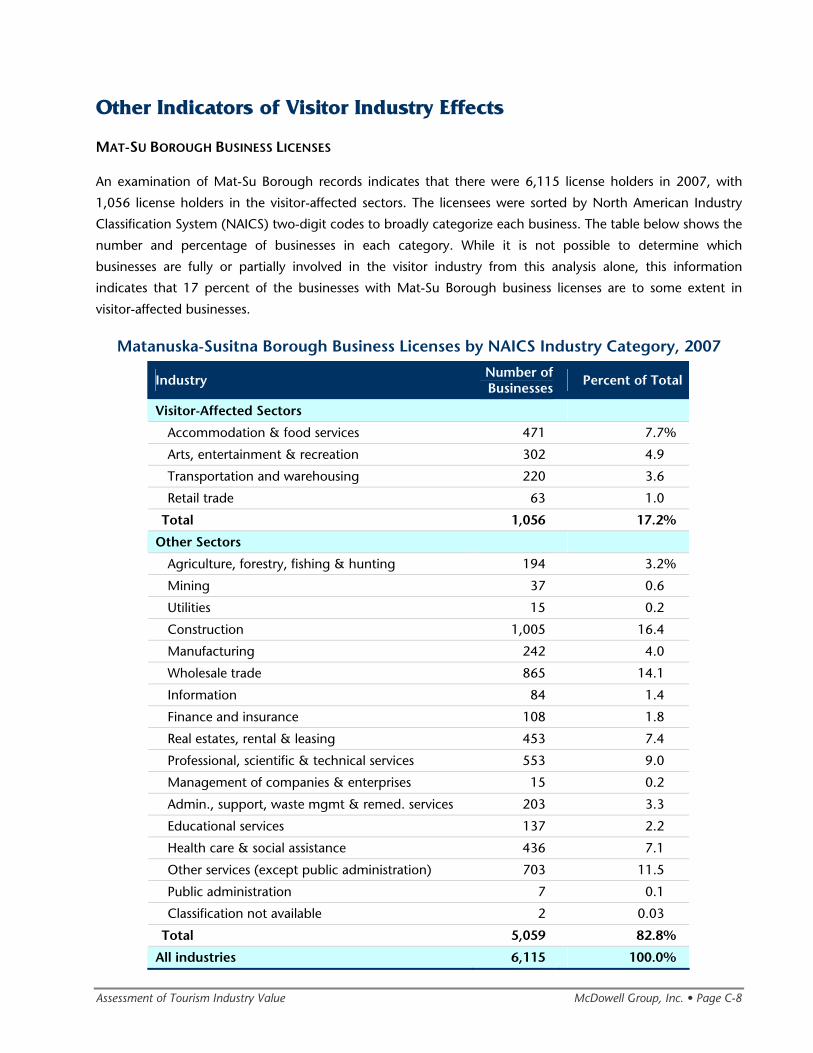
Assessment of Tourism Industry Value McDowell Group, Inc. • Page C-8
Other Indicators of Visitor Industry Effects
MAT-SU BOROUGH BUSINESS LICENSES
An examination of Mat-Su Borough records indicates that there were 6,115 license holders in 2007, with
1,056 license holders in the visitor-affected sectors. The licensees were sorted by North American Industry
Classification System (NAICS) two-digit codes to broadly categorize each business. The table below shows the
number and percentage of businesses in each category. While it is not possible to determine which
businesses are fully or partially involved in the visitor industry from this analysis alone, this information
indicates that 17 percent of the businesses with Mat-Su Borough business licenses are to some extent in
visitor-affected businesses.
Matanuska-Susitna Borough Business Licenses by NAICS Industry Category, 2007
Industry Number of Businesses Percent of Total
Visitor-Affected Sectors
Accommodation & food services 471 7.7%
Arts, entertainment & recreation 302 4.9
Transportation and warehousing 220 3.6
Retail trade 63 1.0
Total 1,056 17.2%
Other Sectors
Agriculture, forestry, fishing & hunting 194 3.2%
Mining 37 0.6
Utilities 15 0.2
Construction 1,005 16.4
Manufacturing 242 4.0
Wholesale trade 865 14.1
Information 84 1.4
Finance and insurance 108 1.8
Real estates, rental & leasing 453 7.4
Professional, scientific & technical services 553 9.0
Management of companies & enterprises 15 0.2
Admin., support, waste mgmt & remed. services 203 3.3
Educational services 137 2.2
Health care & social assistance 436 7.1
Other services (except public administration) 703 11.5
Public administration 7 0.1
Classification not available 2 0.03
Total 5,059 82.8%
All industries 6,115 100.0%
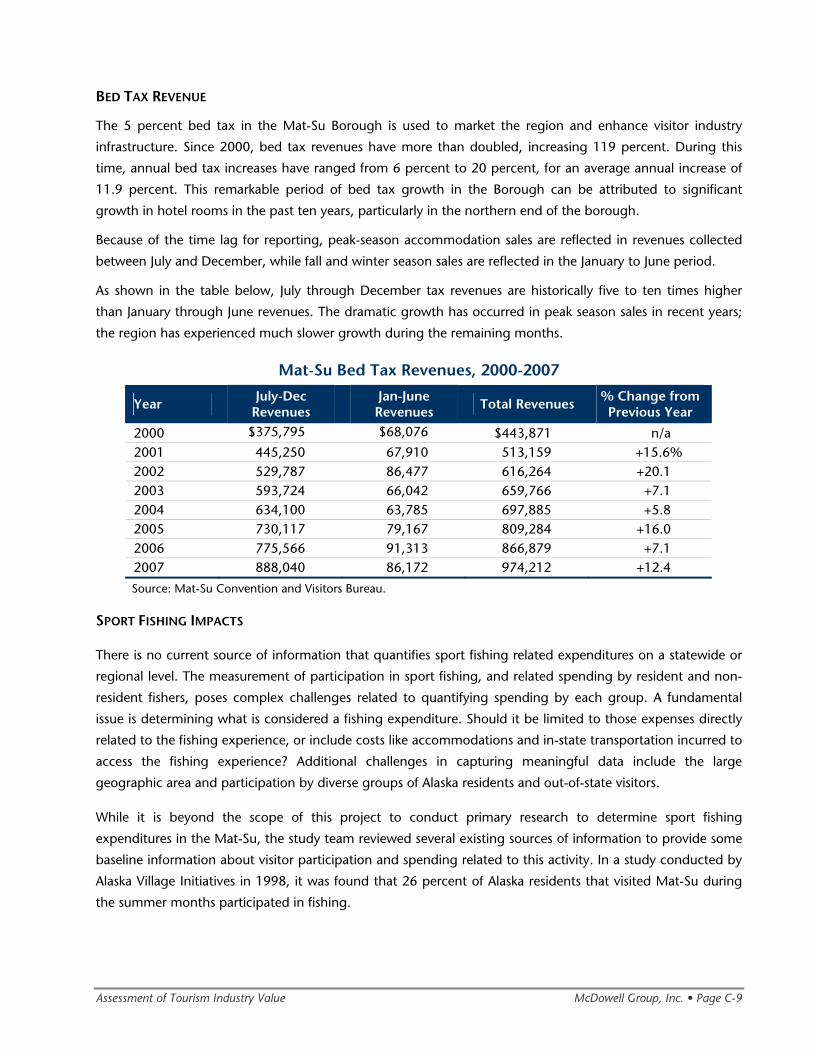
Assessment of Tourism Industry Value McDowell Group, Inc. • Page C-9
BED TAX REVENUE
The 5 percent bed tax in the Mat-Su Borough is used to market the region and enhance visitor industry
infrastructure. Since 2000, bed tax revenues have more than doubled, increasing 119 percent. During this
time, annual bed tax increases have ranged from 6 percent to 20 percent, for an average annual increase of
11.9 percent. This remarkable period of bed tax growth in the Borough can be attributed to significant
growth in hotel rooms in the past ten years, particularly in the northern end of the borough.
Because of the time lag for reporting, peak-season accommodation sales are reflected in revenues collected
between July and December, while fall and winter season sales are reflected in the January to June period.
As shown in the table below, July through December tax revenues are historically five to ten times higher
than January through June revenues. The dramatic growth has occurred in peak season sales in recent years;
the region has experienced much slower growth during the remaining months.
Mat-Su Bed Tax Revenues, 2000-2007
Year July-Dec Revenues
Jan-June Revenues Total Revenues % Change from
Previous Year
2000 $375,795 $68,076 $443,871 n/a 2001 445,250 67,910 513,159 +15.6% 2002 529,787 86,477 616,264 +20.1 2003 593,724 66,042 659,766 +7.1 2004 634,100 63,785 697,885 +5.8 2005 730,117 79,167 809,284 +16.0 2006 775,566 91,313 866,879 +7.1 2007 888,040 86,172 974,212 +12.4
Source: Mat-Su Convention and Visitors Bureau.
SPORT FISHING IMPACTS
There is no current source of information that quantifies sport fishing related expenditures on a statewide or
regional level. The measurement of participation in sport fishing, and related spending by resident and non-
resident fishers, poses complex challenges related to quantifying spending by each group. A fundamental
issue is determining what is considered a fishing expenditure. Should it be limited to those expenses directly
related to the fishing experience, or include costs like accommodations and in-state transportation incurred to
access the fishing experience? Additional challenges in capturing meaningful data include the large
geographic area and participation by diverse groups of Alaska residents and out-of-state visitors.
While it is beyond the scope of this project to conduct primary research to determine sport fishing
expenditures in the Mat-Su, the study team reviewed several existing sources of information to provide some
baseline information about visitor participation and spending related to this activity. In a study conducted by
Alaska Village Initiatives in 1998, it was found that 26 percent of Alaska residents that visited Mat-Su during
the summer months participated in fishing.
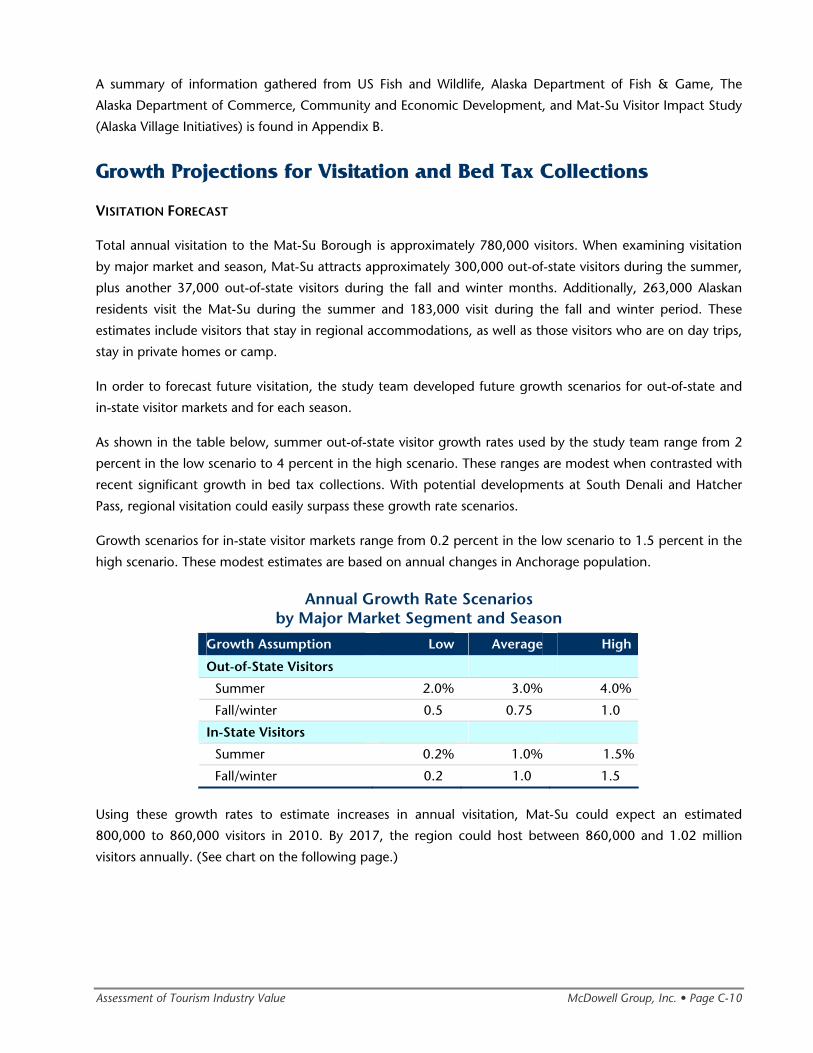
Assessment of Tourism Industry Value McDowell Group, Inc. • Page C-10
A summary of information gathered from US Fish and Wildlife, Alaska Department of Fish & Game, The
Alaska Department of Commerce, Community and Economic Development, and Mat-Su Visitor Impact Study
(Alaska Village Initiatives) is found in Appendix B.
Growth Projections for Visitation and Bed Tax Collections
VISITATION FORECAST
Total annual visitation to the Mat-Su Borough is approximately 780,000 visitors. When examining visitation
by major market and season, Mat-Su attracts approximately 300,000 out-of-state visitors during the summer,
plus another 37,000 out-of-state visitors during the fall and winter months. Additionally, 263,000 Alaskan
residents visit the Mat-Su during the summer and 183,000 visit during the fall and winter period. These
estimates include visitors that stay in regional accommodations, as well as those visitors who are on day trips,
stay in private homes or camp.
In order to forecast future visitation, the study team developed future growth scenarios for out-of-state and
in-state visitor markets and for each season.
As shown in the table below, summer out-of-state visitor growth rates used by the study team range from 2
percent in the low scenario to 4 percent in the high scenario. These ranges are modest when contrasted with
recent significant growth in bed tax collections. With potential developments at South Denali and Hatcher
Pass, regional visitation could easily surpass these growth rate scenarios.
Growth scenarios for in-state visitor markets range from 0.2 percent in the low scenario to 1.5 percent in the
high scenario. These modest estimates are based on annual changes in Anchorage population.
Annual Growth Rate Scenarios by Major Market Segment and Season
Growth Assumption Low Average High
Out-of-State Visitors
Summer 2.0% 3.0% 4.0%
Fall/winter 0.5 0.75 1.0
In-State Visitors
Summer 0.2% 1.0% 1.5%
Fall/winter 0.2 1.0 1.5
Using these growth rates to estimate increases in annual visitation, Mat-Su could expect an estimated
800,000 to 860,000 visitors in 2010. By 2017, the region could host between 860,000 and 1.02 million
visitors annually. (See chart on the following page.)
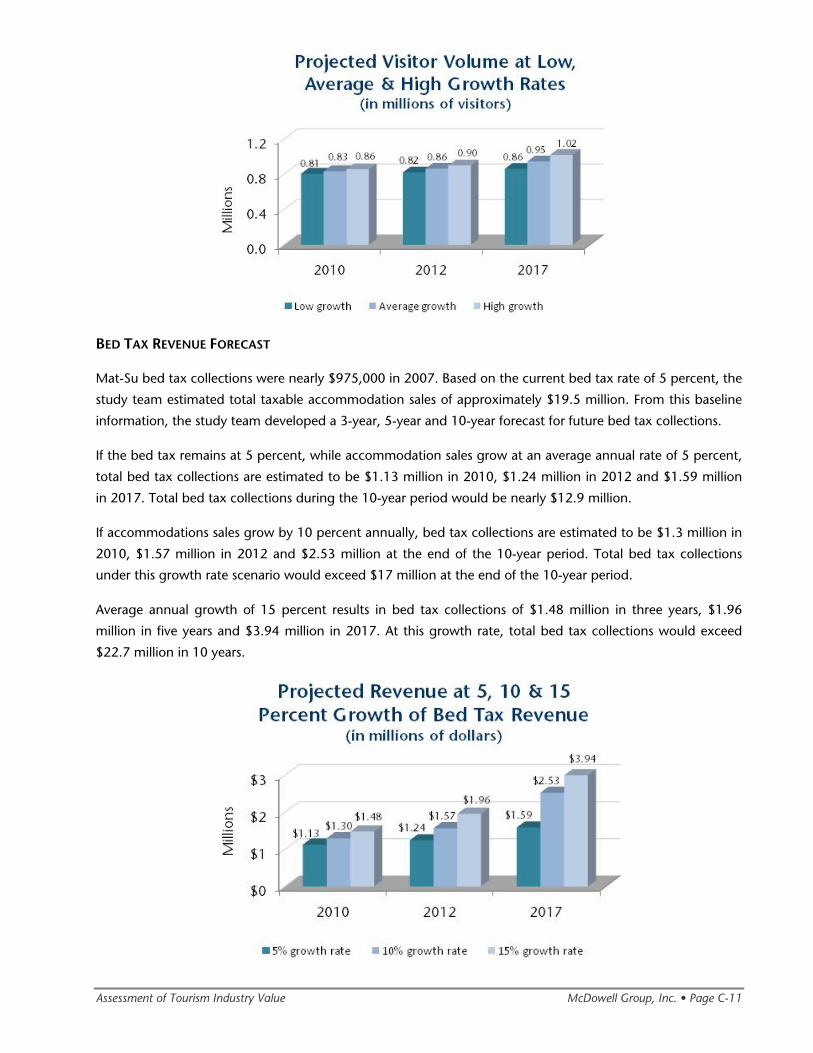
Assessment of Tourism Industry Value McDowell Group, Inc. • Page C-11
BED TAX REVENUE FORECAST
Mat-Su bed tax collections were nearly $975,000 in 2007. Based on the current bed tax rate of 5 percent, the
study team estimated total taxable accommodation sales of approximately $19.5 million. From this baseline
information, the study team developed a 3-year, 5-year and 10-year forecast for future bed tax collections.
If the bed tax remains at 5 percent, while accommodation sales grow at an average annual rate of 5 percent,
total bed tax collections are estimated to be $1.13 million in 2010, $1.24 million in 2012 and $1.59 million
in 2017. Total bed tax collections during the 10-year period would be nearly $12.9 million.
If accommodations sales grow by 10 percent annually, bed tax collections are estimated to be $1.3 million in
2010, $1.57 million in 2012 and $2.53 million at the end of the 10-year period. Total bed tax collections
under this growth rate scenario would exceed $17 million at the end of the 10-year period.
Average annual growth of 15 percent results in bed tax collections of $1.48 million in three years, $1.96
million in five years and $3.94 million in 2017. At this growth rate, total bed tax collections would exceed
$22.7 million in 10 years.
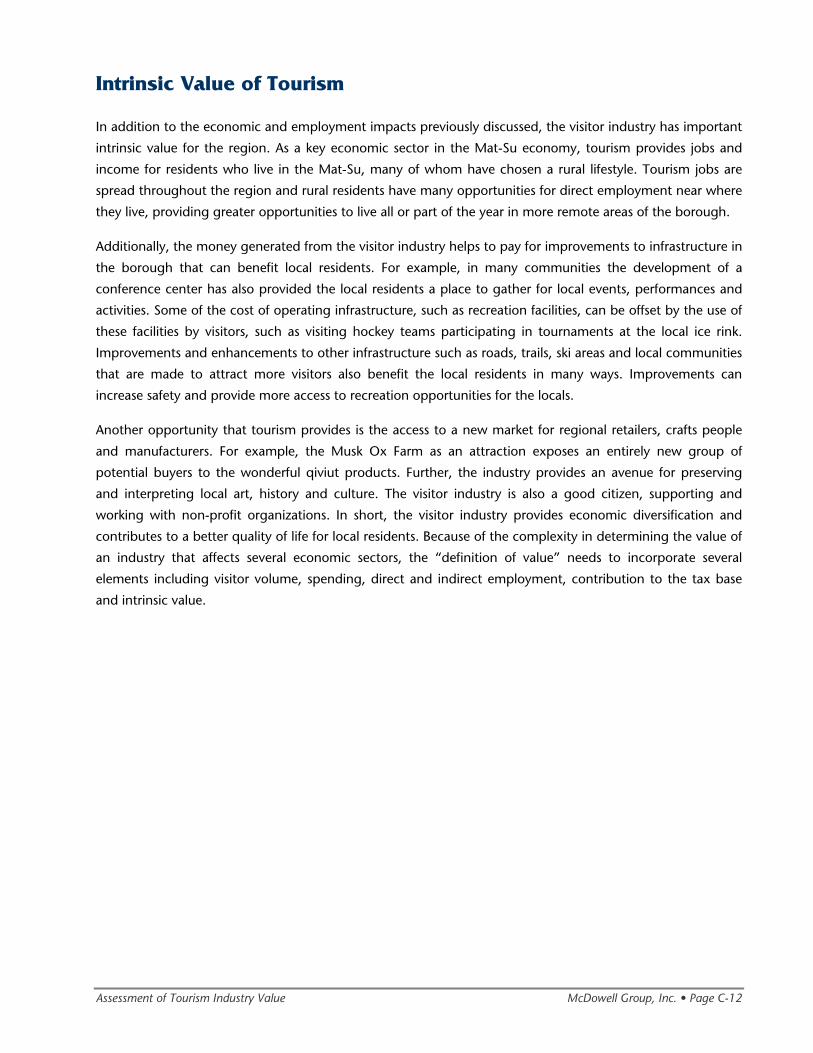
Assessment of Tourism Industry Value McDowell Group, Inc. • Page C-12
Intrinsic Value of Tourism
In addition to the economic and employment impacts previously discussed, the visitor industry has important
intrinsic value for the region. As a key economic sector in the Mat-Su economy, tourism provides jobs and
income for residents who live in the Mat-Su, many of whom have chosen a rural lifestyle. Tourism jobs are
spread throughout the region and rural residents have many opportunities for direct employment near where
they live, providing greater opportunities to live all or part of the year in more remote areas of the borough.
Additionally, the money generated from the visitor industry helps to pay for improvements to infrastructure in
the borough that can benefit local residents. For example, in many communities the development of a
conference center has also provided the local residents a place to gather for local events, performances and
activities. Some of the cost of operating infrastructure, such as recreation facilities, can be offset by the use of
these facilities by visitors, such as visiting hockey teams participating in tournaments at the local ice rink.
Improvements and enhancements to other infrastructure such as roads, trails, ski areas and local communities
that are made to attract more visitors also benefit the local residents in many ways. Improvements can
increase safety and provide more access to recreation opportunities for the locals.
Another opportunity that tourism provides is the access to a new market for regional retailers, crafts people
and manufacturers. For example, the Musk Ox Farm as an attraction exposes an entirely new group of
potential buyers to the wonderful qiviut products. Further, the industry provides an avenue for preserving
and interpreting local art, history and culture. The visitor industry is also a good citizen, supporting and
working with non-profit organizations. In short, the visitor industry provides economic diversification and
contributes to a better quality of life for local residents. Because of the complexity in determining the value of
an industry that affects several economic sectors, the “definition of value” needs to incorporate several
elements including visitor volume, spending, direct and indirect employment, contribution to the tax base
and intrinsic value.
Needed Tourism Infrastructure Improvements
Needed Tourism Infrastructure Improvements McDowell Group, Inc. • Page D-1
Introduction
A successful tourism industry is dependent on a number of factors, the cornerstone of which is product and
infrastructure developments. In order to realize the potential economic benefits, these investments need to be
strongly supported by consistent, effective marketing, work force training, and communication with local
populations.
In this section, the study team analyzes how the Mat-Su Borough can stimulate regional tourism
development through infrastructure development. The chapter includes the following:
• Potential tourism infrastructure improvements needed in four major areas: meeting facilities, road
system enhancements, trail system enhancements, and visitor support services. Each development
area is analyzed in terms of the development cost of infrastructure improvements and potential
effects on the visitor market.
• Following the discussion of each individual concept is a recommendation regarding the priority
actions. Factors used to prioritize the development opportunities included: potential for increases in
visitor volume, potential increases in overnight stays, enhancement of the visitor experience and
contribution to the regional economy.
• Additionally, the study team discusses potential large-scale destination and attraction developments
in the region. Two potentially significant regional developments are discussed terms of investment in
construction, other capital costs and estimated visitation (South Denali Implementation Plan and
Hatcher Pass). Several other potential destination and attraction developments are also briefly
addressed, highlighting the importance of continued attraction development in the region.
• Finally, this section includes a discussion of potential funding approaches to implement the priority
strategies. The study team provides a detailed analysis of bed taxes and the effect of increasing the
tax rate to be comparable with other Alaska communities.
Development Concepts Defined
A brief description of each concept is provided below, along with a summary of the principal reasons that it
warranted further exploration.
MEETING FACILITIES
This section analyzes the development costs and potential usage of new meeting facilities. While Mat-Su has a
number of small and mid-sized locations that can accommodate a meeting, the region cannot compete for
most in-state conferences and conventions. These events commonly have a requirement that the meeting
facility must be able to accommodate meeting and banquet functions in the same facility. (In contrast, most
mid-to-large sized groups meeting in Mat-Su would be forced to vacate their meeting room in order to set
up a banquet lunch or dinner.) Many conferences and conventions also require additional onsite space for
breakout sessions, receptions, registration tables, and trade show areas.
Needed Tourism Infrastructure Improvements McDowell Group, Inc. • Page D-2
Two facility sizes were explored: an 8,400 sq. ft. facility (which would accommodate a conference of 125
attendees or two concurrent events with up to 125 attendees apiece) and a 20,300 sq. ft. facility (which
would accommodate a convention of 400 attendees or two concurrent events with up to 400 attendees
apiece). These two representative sizes were selected to respond to the specific question: “Should the Borough
construct several small meeting or convention facilities or one large facility?” While the region may ultimately
pursue a different facility size or configuration, this approach provided valuable information about the relative
costs and market potential associated with facilities in these size ranges.
ROAD SYSTEM ENHANCEMENTS
Many areas of the borough are accessed by the regional highway system. The borough and its communities
have identified a number of highway improvements needed to enhance traffic mobility, safety, sanitation,
and the travel experience. This study examines needed road system enhancements, such as scenic
viewpoints, signage and restrooms, and their relationship to tourism and increased overnight stays.
The primary road system enhancement tourism infrastructure need is for more public restrooms.
Development of these facilities should be considered in conjunction with other desired enhancements like
scenic viewpoints and signage. These elements are addressed as a group for two reasons. First, a coordinated
approach will have a synergistic effect and the greatest impact on the traveling public. Second, it is a more
cost-effective approach when mobilizing construction equipment and supplies.
The study team also briefly addressed the potential impacts of paving the Denali Highway. Especially in light
of the pending South Denali Implementation Plan, enhancing this corridor could help to lengthen visitor
stays in the Mat-Su region by attracting more people to a circular itinerary through Southcentral and Interior
Alaska.
TRAIL SYSTEM ENHANCEMENTS
This section addresses the potential costs and impacts of enhancement to trails and public recreational sites
like parks, campgrounds, and boat launches. While the region has more than 2,000 miles of trails, many lack
adequate signage, trailheads, maintenance or mapping. Many parks and campgrounds suffer from deferred
maintenance, despite growing usage by residents and visitors.
The availability and condition of these recreational assets have important implications for attracting visitors,
their length of stay, and in-region spending. The current out-of-state visitor market reports far lower
participation in hikes and nature walks in Mat-Su than in other areas of Alaska. Visitor participation is similarly
low for other outdoor activities commonly associated with trails and recreational sites including fishing,
rafting and canoeing. Enhancements would improve visitor participation in these activities and length of stay
in the region.
VISITOR SUPPORT SERVICES
The study team examined the need and potential benefit of improved visitor support services, primarily
through informational kiosks and signage. Prior research shows that visitors who use information centers
report much higher satisfaction ratings. The intended result in Mat-Su would be increased awareness of
activities and attractions, thereby increasing the length of stay and accommodation usage. Optimally, visitor

Needed Tourism Infrastructure Improvements McDowell Group, Inc. • Page D-3
information services are available at all major entrance points. The existing regional visitor information center
serves visitors that arrive via Anchorage or have already spent considerable time in the region, having traveled
the Glenn or Parks Highways. The South Denali Implementation Plan includes a major Denali interpretive
center and a smaller kiosk at the Petersville Road/Parks Highway intersection. Additional locations to consider
include Glenn Highway and key airport and rail arrival locations.
Needed Tourism Infrastructure Improvements McDowell Group, Inc. • Page D-4
Meeting Facilities
There is a statewide market for general conference and meeting facilities, but the Mat-Su Borough is not
capturing its share of this market because of the lack of appropriate conference facilities. While the region
occasionally hosts small conferences and retreats, the major limitation is the inability for mid-size or large
groups to conduct meetings and banquet meals in the same facility.
Based on the infrastructure analysis, the practical size limit for meetings that require a single facility for guest
rooms, meeting rooms, and dining facilities is between 50 and 80 attendees. Additionally, while there are
more than 400 guest rooms in the Wasilla/Palmer area, there is little “full-service” meeting capacity available
to accommodate groups over 100 attendees.
To be competitive, meeting facilities should also be equipped with a professional kitchen, sound and lighting
equipment, and banquet supplies. Ideally, the facility would offer additional public spaces, as many
conferences and conventions also require sufficient onsite space for trade shows, break-out sessions and
receptions. Without these assets, a meeting planner has to factor in additional time and expense for renting
multiple meeting venues, leasing equipment and transferring attendees between facilities. Because the
market is extremely competitive, few organizations are compelled to convene in locations that do not meet
minimum facility requirements.
This section includes:
• An overview of competitive meeting destinations and publicly-owned facilities. Because of Mat-Su’s
proximity to Anchorage and the new Dena’ina Civic & Convention Center, the study team also
addresses the possibility of attracting meetings that cannot be accommodated in Anchorage
(overflow).
• A discussion of locations within the Mat-Su region in terms of their suitability for a larger meeting
facility.
• An overview of the two facility sizes and costs used in the study team’s analysis.
• A discussion of market potential for each respective facility size.
• Recommendations.
Competitive Meeting Locations
Outside of Anchorage, the communities that compete the most aggressively for the in-state convention
market include Fairbanks, Valdez, and Juneau. The smaller communities of Ketchikan, Sitka, and Wrangell
have also achieved success in attracting numerous regional and state conventions.
It is important to note that most communities competing for the meeting and convention market are
supported by publicly owned meeting facilities. In Alaska’s relatively small meeting market, public financial
participation is essential for construction and ongoing support of this type of infrastructure. Additionally,
most facilities are intended to accommodate local residents’ events and gatherings such as performances,
graduation ceremonies, trade shows, and various types of celebrations.
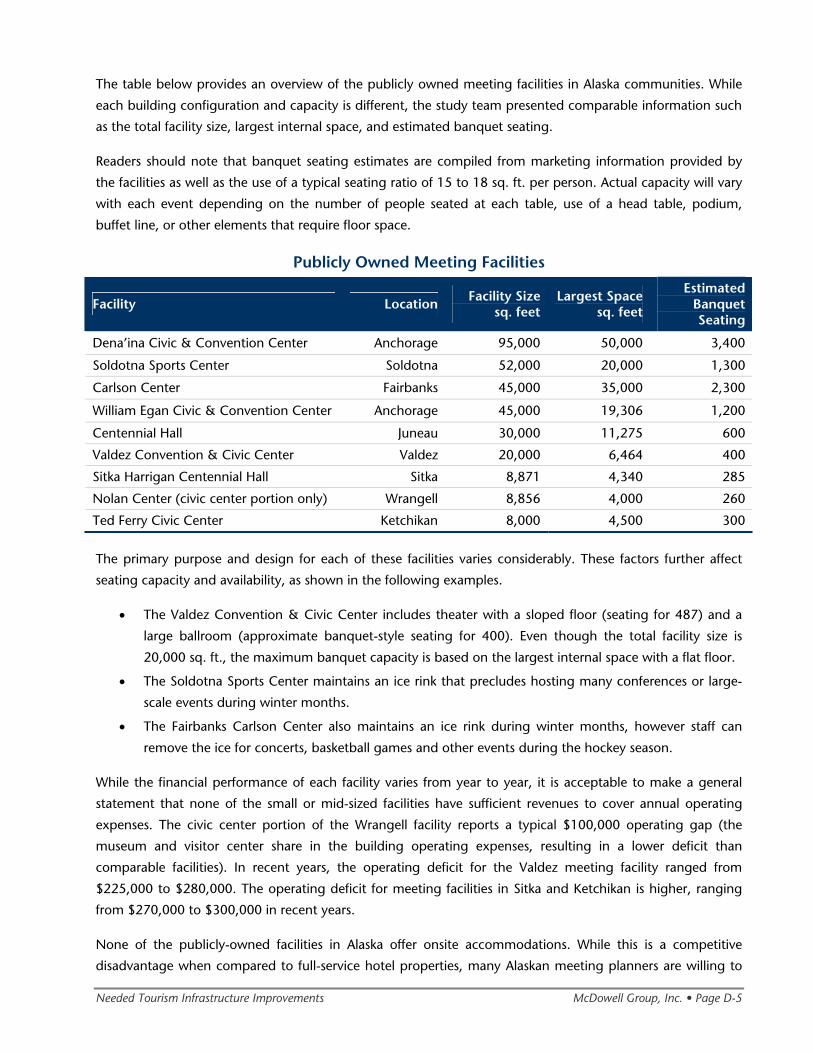
Needed Tourism Infrastructure Improvements McDowell Group, Inc. • Page D-5
The table below provides an overview of the publicly owned meeting facilities in Alaska communities. While
each building configuration and capacity is different, the study team presented comparable information such
as the total facility size, largest internal space, and estimated banquet seating.
Readers should note that banquet seating estimates are compiled from marketing information provided by
the facilities as well as the use of a typical seating ratio of 15 to 18 sq. ft. per person. Actual capacity will vary
with each event depending on the number of people seated at each table, use of a head table, podium,
buffet line, or other elements that require floor space.
Publicly Owned Meeting Facilities
Facility Location Facility Sizesq. feet
Largest Space sq. feet
Estimated Banquet Seating
Dena’ina Civic & Convention Center Anchorage 95,000 50,000 3,400
Soldotna Sports Center Soldotna 52,000 20,000 1,300
Carlson Center Fairbanks 45,000 35,000 2,300
William Egan Civic & Convention Center Anchorage 45,000 19,306 1,200
Centennial Hall Juneau 30,000 11,275 600
Valdez Convention & Civic Center Valdez 20,000 6,464 400
Sitka Harrigan Centennial Hall Sitka 8,871 4,340 285
Nolan Center (civic center portion only) Wrangell 8,856 4,000 260
Ted Ferry Civic Center Ketchikan 8,000 4,500 300
The primary purpose and design for each of these facilities varies considerably. These factors further affect
seating capacity and availability, as shown in the following examples.
• The Valdez Convention & Civic Center includes theater with a sloped floor (seating for 487) and a
large ballroom (approximate banquet-style seating for 400). Even though the total facility size is
20,000 sq. ft., the maximum banquet capacity is based on the largest internal space with a flat floor.
• The Soldotna Sports Center maintains an ice rink that precludes hosting many conferences or large-
scale events during winter months.
• The Fairbanks Carlson Center also maintains an ice rink during winter months, however staff can
remove the ice for concerts, basketball games and other events during the hockey season.
While the financial performance of each facility varies from year to year, it is acceptable to make a general
statement that none of the small or mid-sized facilities have sufficient revenues to cover annual operating
expenses. The civic center portion of the Wrangell facility reports a typical $100,000 operating gap (the
museum and visitor center share in the building operating expenses, resulting in a lower deficit than
comparable facilities). In recent years, the operating deficit for the Valdez meeting facility ranged from
$225,000 to $280,000. The operating deficit for meeting facilities in Sitka and Ketchikan is higher, ranging
from $270,000 to $300,000 in recent years.
None of the publicly-owned facilities in Alaska offer onsite accommodations. While this is a competitive
disadvantage when compared to full-service hotel properties, many Alaskan meeting planners are willing to
Needed Tourism Infrastructure Improvements McDowell Group, Inc. • Page D-6
accept this separation. The national and international market is typically less willing to compromise on facility
quality and configuration.
ANCHORAGE MARKET POSITION
With scheduled completion of Anchorage’s new Dena’ina Civic & Convention Center in fall 2008, the
community has significantly increased its marketing efforts to attract national and international conventions.
Development of this facility more than triples the municipally-owned meeting space. Expectations about the
Anchorage Convention & Visitors Bureau’s ability to fill the space are extremely high among municipal
leaders, Anchorage area accommodations, and other community members.
Currently, 14 of the 40 Anchorage Convention & Visitor Bureau staff members are employed in the
Convention Sales and Service department. While Anchorage will continue to compete for in-state meetings,
the organization’s emphasis on attracting national and international conventions has grown. Anchorage is
currently competing with internationally-recognized destinations like Las Vegas, Paris, Chicago, and
Helsinki—and frequently winning.
Unlike other markets that may visit multiple communities, the convention market selects a single location for
the meeting venue. A tactic that Anchorage and comparable convention destinations commonly utilize is
hosting a board meeting or regional meeting first before soliciting a national or international event. This
approach allows the organization to gain confidence and familiarity with the community and meeting-related
resources.
The implication for Mat-Su is that increased meeting space in Anchorage has stimulated an even more
aggressive competitive position for attracting large and small conventions to Anchorage. While it is possible
for Mat-Su to position itself as a smaller, more desire alternative than Anchorage, it will be difficult to insert
itself into the sales and negotiation efforts led by the Anchorage Convention & Visitor Bureau staff.
The Mat-Su region has significant potential as a destination for pre- and post-convention tours, spouse and
guest tours, and informal sightseeing by convention delegates. However, potential for attracting small
meetings and conferences as spill-over from Anchorage’s marketing efforts is minimal—even with a new
meeting facility. If a meeting facility is constructed, Mat-Su should adopt an aggressive marketing program
and focus on the in-state meeting and retreat market.
Location Considerations in the Mat-Su Region
It is important to evaluate potential locations for a meeting facility from a “market perspective.” In addition to
assessment of meeting facilities and overnight accommodations, many meeting planners will examine the
local community’s ability to provide professional catering services; technical support for sound, lighting, or
computer equipment; and entertainment for receptions and banquets. These additional amenities make the
destination more competitive and enhance the quality of the meeting experience. Other competitive factors
include the availability of alternative locations for receptions, logistical support during meeting planning and
hosting phases, and availability of ground transportation to shuttle attendees between venues.
Needed Tourism Infrastructure Improvements McDowell Group, Inc. • Page D-7
PALMER/WASILLA
The Palmer/Wasilla area offers the largest quantity of accommodations on a year-round basis. Year-round
availability of rooms is important, as many conferences and conventions are scheduled during the fall and
winter months. Additionally, the Palmer/Wasilla area offers many of the other professional services needed to
attract and support this market.
When attracting conventions, access between Mat-Su and the Anchorage Airport will be a competitive
advantage when compared to other locations in the region (the distance is similar to the popular meeting
destination of Alyeska/Girdwood). However, easy access to and from Anchorage can work against local
accommodations; any event is likely to include some attendees that commute rather than stay in local
accommodations.
It is important to note that Lake Lucille Lodge recently closed their banquet facilities. This closure underscores
the important relationship between the private sector (provider of critical services like accommodations and
catering), public sector (frequently the supplier for meeting facilities), and marketing. The private sector
simply cannot maintain year-round accommodations or banquet/catering services unless there is sufficient
market demand to warrant the investment in staff, facilities and supplies.
HATCHER PASS
Hatcher Pass is an appealing location for a conference facility due to its scenic beauty, proximity to many
Palmer and Wasilla accommodations, and nearby recreational activities. However, fall and winter access could
be a limitation if the facility is located at upper elevations. Most organizations (whether in-state or out-of-
state) will be far more concerned about efficiency for getting attendees, supplies and services to their
meeting location than recreational opportunities or scenic vistas. The Hatcher Pass location is better suited to
development of a small scale retreat center, but this approach does not optimize overnight stays or spending
in the Mat-Su region. (Because market demand for a small-scale retreat facility would be considerably smaller,
the logical approach to serving this market might be the development of a meeting room in conjunction with
future Hatcher Pass infrastructure developments rather than a stand-alone meeting facility.)
TALKEETNA
While Talkeetna has an extensive accommodation inventory during the summer months, less than one
quarter of the rooms are currently available during the winter months. Of these year-round properties, no
single accommodation is larger than 30 rooms. Small and widely-distributed accommodations pose logistical
challenges for meeting planners. While increased South Denali access is projected to increase the number of
accommodations, the heavy seasonality is not likely to change.
It is important to note that the community infrastructure includes meeting facilities that are under-utilized.
The Talkeetna Alaskan Lodge includes four meeting rooms ranging in size from 925 to 1,850 sq. ft.; the
facility is well-suited for small conferences up to 100 participants. While the property was opened with the
intention of attracting year-round business, low market demand has precluded the owners from remaining
open during the winter season in subsequent years. When considering the additional accommodations,
availability of catering services and attraction base in the community, the challenges are primarily access and
marketing—not meeting facility infrastructure.
Needed Tourism Infrastructure Improvements McDowell Group, Inc. • Page D-8
OTHER AREAS
Lodges located along the Glenn Highway or remote areas of the borough currently attract a small number of
retreats. However, the small number of accommodations in each lodge, as well as the distance between
properties, is a barrier to attracting larger conferences. Additionally, these more remote locations present
challenges when considering the support services associated with conferences including catering, technical
support, transportation and entertainment.
Summary of Facility Sizes and Costs
The study team selected two representative facility sizes to explore further in terms of development costs and
ability to attract visitors. A common element of both facilities is the ability to handle meetings and meals in
the same building, simplifying transitions for attendees and meeting planners during events. Appendix C
includes detailed information on facility size and programming, estimated development and operating costs,
and a discussion of the market potential associated with each facility.
• Conference facility. At approximately 8,400 sq. ft., the conference facility would have room for
banquet functions and meeting functions. While the maximum building capacity is 250, the facility is
intended to accommodate conferences of 125 attendees, transferring between meeting and dining
functions throughout their event. Estimated construction costs would be $4.5 million. Based on
comparable facilities, the financial gap between operating costs and revenues is likely to be
approximately $200,000. (This estimate does include routine operations and maintenance, but does
not include periodic capital costs or convention marketing.) Comparable facilities in terms of meeting
capacity include Alyeska Resort and the Talkeetna Alaskan Lodge.
• Convention facility. At approximately 20,300 sq. ft. the larger facility is intended to accommodate
conventions up to 400 attendees, including meetings, banquets, and three small conference rooms
that could be used for break-out sessions. Two concurrent events including 400 people could also
occur at the facility. Estimated construction cost is $10.8 million. The financial gap between
operating costs and revenues is estimated at $300,000, based on comparable facilities. (This estimate
does include routine operations and maintenance, but does not include periodic capital costs or
convention marketing.) The Valdez Convention & Civic Center is the closest comparable in the Alaska
market.
It is important to note that the capacity of each proposed facility can change considerably, depending on the
room configuration. Theater-style seating and receptions maximize capacity; conversely, seating capacity is
reduced by banquet-style seating or use of a head table, stage, podium, buffet, or other common use of floor
space.
Summary of Market Potential for Meeting Facilities
The primary visitor market served by this type of infrastructure enhancement is the conference or convention
market. A secondary visitor market would be special events, which commonly need spaces for registration
areas, receptions, meetings or banquets. (An important component of the latter clientele would be Mat-Su
residents. However, the study team focused on the potential for each facility to attract visitation and
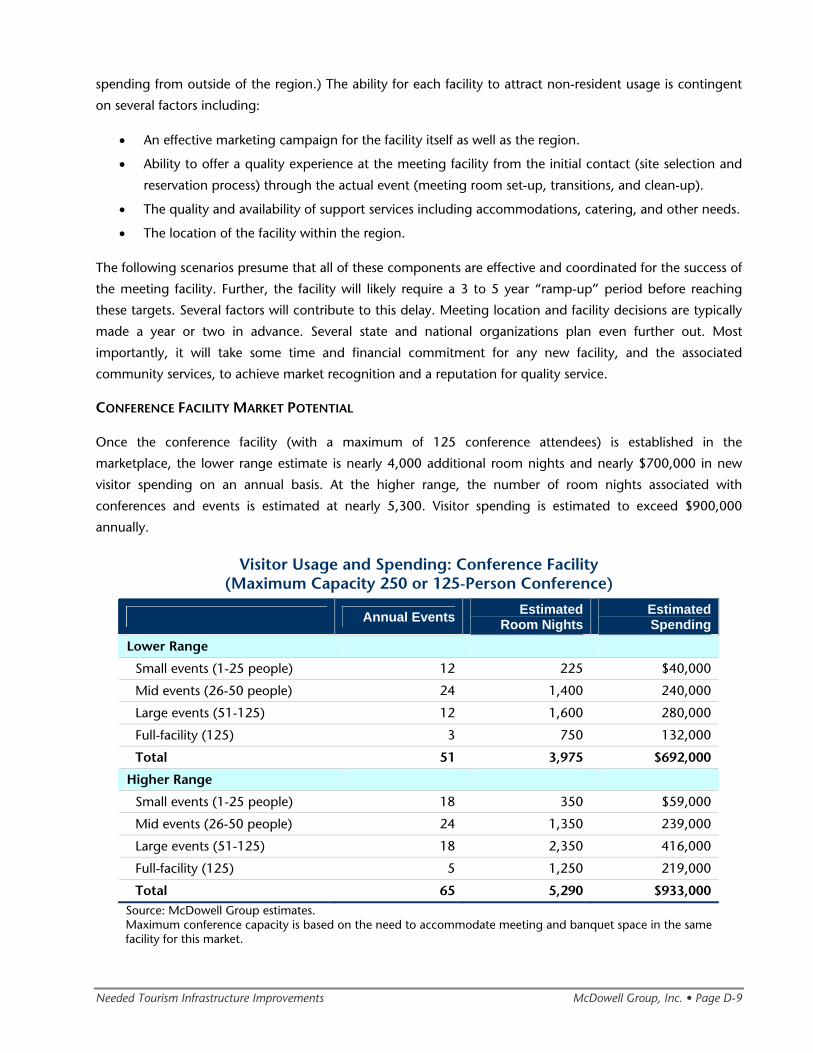
Needed Tourism Infrastructure Improvements McDowell Group, Inc. • Page D-9
spending from outside of the region.) The ability for each facility to attract non-resident usage is contingent
on several factors including:
• An effective marketing campaign for the facility itself as well as the region.
• Ability to offer a quality experience at the meeting facility from the initial contact (site selection and
reservation process) through the actual event (meeting room set-up, transitions, and clean-up).
• The quality and availability of support services including accommodations, catering, and other needs.
• The location of the facility within the region.
The following scenarios presume that all of these components are effective and coordinated for the success of
the meeting facility. Further, the facility will likely require a 3 to 5 year “ramp-up” period before reaching
these targets. Several factors will contribute to this delay. Meeting location and facility decisions are typically
made a year or two in advance. Several state and national organizations plan even further out. Most
importantly, it will take some time and financial commitment for any new facility, and the associated
community services, to achieve market recognition and a reputation for quality service.
CONFERENCE FACILITY MARKET POTENTIAL
Once the conference facility (with a maximum of 125 conference attendees) is established in the
marketplace, the lower range estimate is nearly 4,000 additional room nights and nearly $700,000 in new
visitor spending on an annual basis. At the higher range, the number of room nights associated with
conferences and events is estimated at nearly 5,300. Visitor spending is estimated to exceed $900,000
annually.
Visitor Usage and Spending: Conference Facility (Maximum Capacity 250 or 125-Person Conference)
Annual Events Estimated Room Nights
EstimatedSpending
Lower Range
Small events (1-25 people) 12 225 $40,000
Mid events (26-50 people) 24 1,400 240,000
Large events (51-125) 12 1,600 280,000
Full-facility (125) 3 750 132,000
Total 51 3,975 $692,000
Higher Range
Small events (1-25 people) 18 350 $59,000
Mid events (26-50 people) 24 1,350 239,000
Large events (51-125) 18 2,350 416,000
Full-facility (125) 5 1,250 219,000
Total 65 5,290 $933,000 Source: McDowell Group estimates. Maximum conference capacity is based on the need to accommodate meeting and banquet space in the same facility for this market.
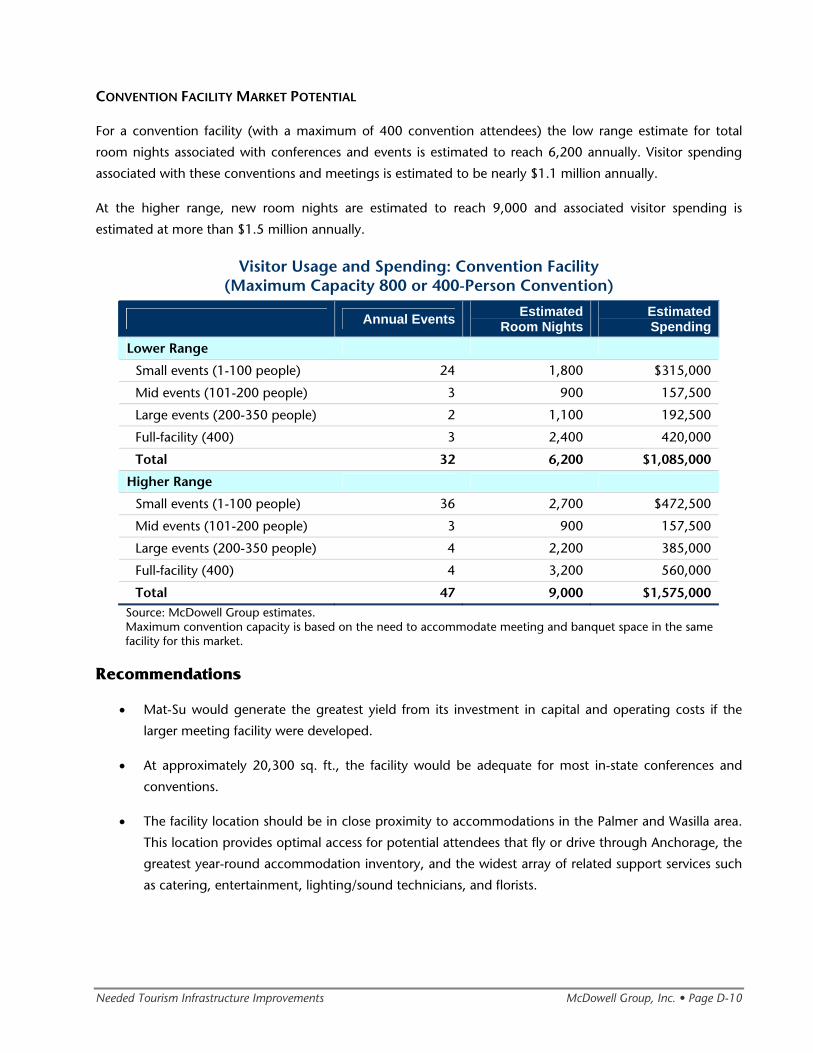
Needed Tourism Infrastructure Improvements McDowell Group, Inc. • Page D-10
CONVENTION FACILITY MARKET POTENTIAL
For a convention facility (with a maximum of 400 convention attendees) the low range estimate for total
room nights associated with conferences and events is estimated to reach 6,200 annually. Visitor spending
associated with these conventions and meetings is estimated to be nearly $1.1 million annually.
At the higher range, new room nights are estimated to reach 9,000 and associated visitor spending is
estimated at more than $1.5 million annually.
Visitor Usage and Spending: Convention Facility (Maximum Capacity 800 or 400-Person Convention)
Annual Events Estimated Room Nights
EstimatedSpending
Lower Range
Small events (1-100 people) 24 1,800 $315,000
Mid events (101-200 people) 3 900 157,500
Large events (200-350 people) 2 1,100 192,500
Full-facility (400) 3 2,400 420,000
Total 32 6,200 $1,085,000
Higher Range
Small events (1-100 people) 36 2,700 $472,500
Mid events (101-200 people) 3 900 157,500
Large events (200-350 people) 4 2,200 385,000
Full-facility (400) 4 3,200 560,000
Total 47 9,000 $1,575,000 Source: McDowell Group estimates. Maximum convention capacity is based on the need to accommodate meeting and banquet space in the same facility for this market.
Recommendations
• Mat-Su would generate the greatest yield from its investment in capital and operating costs if the
larger meeting facility were developed.
• At approximately 20,300 sq. ft., the facility would be adequate for most in-state conferences and
conventions.
• The facility location should be in close proximity to accommodations in the Palmer and Wasilla area.
This location provides optimal access for potential attendees that fly or drive through Anchorage, the
greatest year-round accommodation inventory, and the widest array of related support services such
as catering, entertainment, lighting/sound technicians, and florists.
Needed Tourism Infrastructure Improvements McDowell Group, Inc. • Page D-11
Road System Enhancements
This section discusses road system enhancements including scenic viewpoints, restrooms, signage and
waysides. The section is organized in the following manner:
• An overview of identified road construction projects and planning efforts associated with growing
residential and visitor traffic.
• Priority rest area and restroom needs.
• A discussion of costs associated with various road system enhancements.
• An overview of the increased market potential resulting from road system enhancements.
• Recommended actions.
Overview of Road System Needs
The Mat-Su Borough benefits from an extensive network of highways and roads, which allow travelers to
reach most areas of the borough by vehicle. In recent planning efforts, the Borough and its communities
have identified a number of roadside amenities that are needed to improve traffic mobility and safety. Desired
roadside amenities that have been identified by borough communities for the Glenn and Parks Highways
include rest and information stops, scenic viewpoints, slow-moving vehicle pullouts, passing lanes, bridge
walkways, trailhead parking enhancements and improved highway signage.
Other objectives identified by the Borough and communities include identifying ways to ensure safe vehicular
access onto and off of the highways, maintaining the existing scenic quality of the highways, highway
enhancement to existing trailheads and waysides, providing efficient and safe access to communities in the
borough while serving the needs of through traffic, maintaining the Glenn Highway corridor as an attractive
community entry, improving pedestrian and vehicular links between east and west sides of the Glenn
Highway, and maintaining and enhancing the Glenn Highway’s status as a National Scenic Byway.
Other improvements identified by communities along the Glenn Highway include adding information kiosks
at important locations (i.e., the raptor viewing site between mile 118 and 120) and installing trail marking
and signage to clearly identify public parking and access points to trails and recreational public land beyond
the private lots along the highway. This will assist in directing trail traffic onto the dedicated trail and away
from private property. Communities would like to see all public access points along the road system identified
with signage, including rules for responsible use of these sites. In addition to providing adequate trailheads
and trail identification, many communities have identified education of the trail users as an important
objective as it relates to respecting wildlife in the area. For example, the Sheep Mountain community would
like to provide educational information to trail users in the form of information kiosks or signs identifying the
wildlife that live in the area, and particularly the seasons in which their protection is most important.
Additionally, several tour operators are interested in providing service to Hatcher Pass and have identified the
need for improvements to the roads in the Hatcher Pass area in order to adequately accommodate tour buses
and vans. Archangel Road at Hatcher Pass has been identified as being in particularly poor condition and in
need of improvement.
Needed Tourism Infrastructure Improvements McDowell Group, Inc. • Page D-12
Rest Areas and Restrooms a Priority
Study team interviews revealed broad consensus that restroom facilities are a primary need on the major
transportation corridors. Unfortunately, there is no agency directly responsible for development of these
public services. The Alaska State Department of Transportation & Public Facilities typically does not build or
maintain roadside facilities unless they are associated with a State Park management area. The primary issue
for either agency in developing more facilities is funding for ongoing maintenance and operation.
Many of the facilities along the Parks and Glenn Highway do not have road signage to indicate restroom
facilities. In the case of those public restroom facilities that do exist (e.g. Denali Viewpoint at mile 134.7 and
at the Veteran’s Memorial at mile 147.2 on the Parks Highway), they are unheated and closed in the winter.
There is a clear need for more public restroom facilities, including facilities that are fully accessible according
to the Americans with Disabilities Act. Ideally, these facilities should be placed every 40 to 50 miles along the
Parks and Glenn Highways, with adequate signage.
Guidelines for rest area placement vary by state. For example, in Washington, rest areas are recommended
every 60 miles while in California, rest areas are recommended every 30 minutes. If using the 60-mile
guideline, the Glenn Highway would need two full service rest areas between the Parks Highway intersection
and the eastern border of the Borough. If using the 30-minute guideline, the same stretch of Glenn Highway
would require four full service rest areas. The Parks Highway would need approximately three rest areas to
meet the 60-mile guideline or six or more rest areas to meet the 30-minute guideline.
It is important to note that there is some sentiment among Mat-Su residents that travelers should come into
the towns to use commercial establishments. Even with this in mind, there is a clear need for more public
restroom facilities, including facilities that are fully accessible according to the Americans with Disabilities Act.
Given the travel speeds and the distance along the Glenn and Parks Highways, full service rest areas facilities
should be placed every 40 to 50 miles along the Parks and Glenn Highways with adequate signage.
The table on the following page reflects the study team’s recommendations. The two priority action items
include full-services waysides with public restrooms. Associated development costs for these first two priority
actions could range from $700,000 to $2 million, however numerous partnering opportunities exist—
especially through the Scenic Byway program.
Road System Enhancement Priorities
Road Milepost Priority Size
Glenn Highway/Parks Highway 32-34 1
Large wayside pull out/South of the Parks/Glenn Hwy. Junction
Glenn Highway 129.3 1 Eureka Summit
Glenn Highway 78.1 2 Medium wayside pull out/King
Mountain View Point
Parks Highway 195.5 2 Small wayside pull out
Parks Highway 60-65 3 Medium wayside Pull out/Nancy
Lake Area
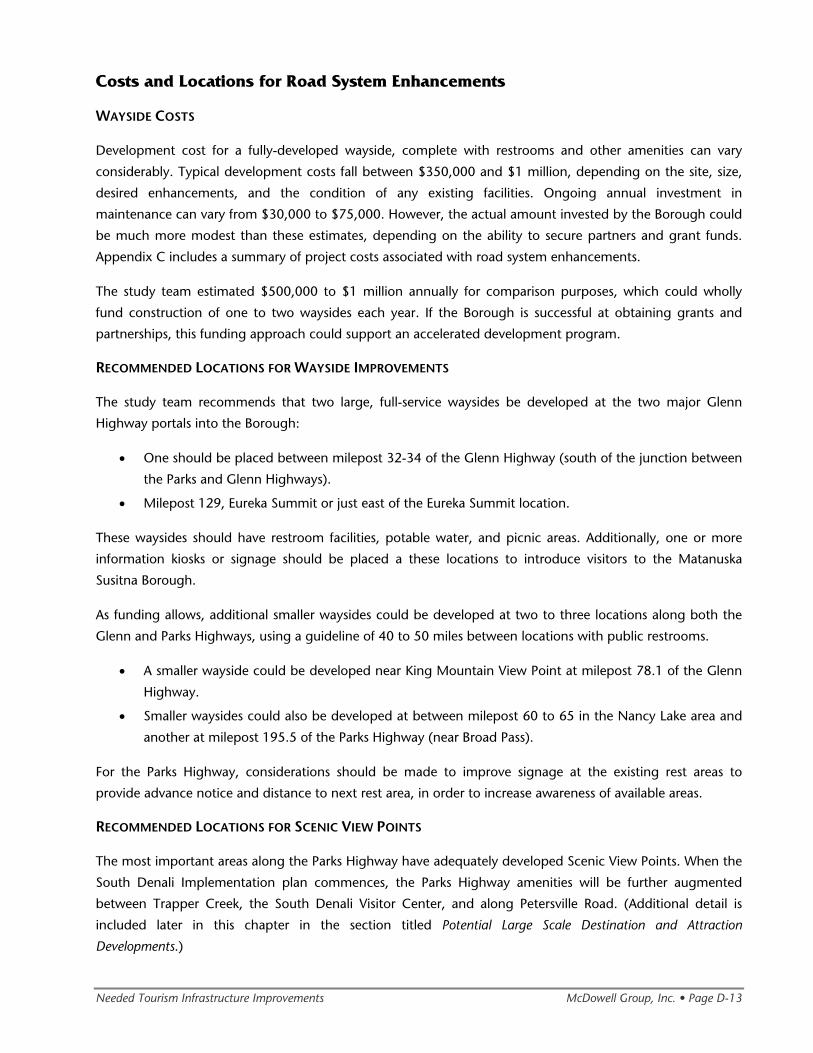
Needed Tourism Infrastructure Improvements McDowell Group, Inc. • Page D-13
Costs and Locations for Road System Enhancements
WAYSIDE COSTS
Development cost for a fully-developed wayside, complete with restrooms and other amenities can vary
considerably. Typical development costs fall between $350,000 and $1 million, depending on the site, size,
desired enhancements, and the condition of any existing facilities. Ongoing annual investment in
maintenance can vary from $30,000 to $75,000. However, the actual amount invested by the Borough could
be much more modest than these estimates, depending on the ability to secure partners and grant funds.
Appendix C includes a summary of project costs associated with road system enhancements.
The study team estimated $500,000 to $1 million annually for comparison purposes, which could wholly
fund construction of one to two waysides each year. If the Borough is successful at obtaining grants and
partnerships, this funding approach could support an accelerated development program.
RECOMMENDED LOCATIONS FOR WAYSIDE IMPROVEMENTS
The study team recommends that two large, full-service waysides be developed at the two major Glenn
Highway portals into the Borough:
• One should be placed between milepost 32-34 of the Glenn Highway (south of the junction between
the Parks and Glenn Highways).
• Milepost 129, Eureka Summit or just east of the Eureka Summit location.
These waysides should have restroom facilities, potable water, and picnic areas. Additionally, one or more
information kiosks or signage should be placed a these locations to introduce visitors to the Matanuska
Susitna Borough.
As funding allows, additional smaller waysides could be developed at two to three locations along both the
Glenn and Parks Highways, using a guideline of 40 to 50 miles between locations with public restrooms.
• A smaller wayside could be developed near King Mountain View Point at milepost 78.1 of the Glenn
Highway.
• Smaller waysides could also be developed at between milepost 60 to 65 in the Nancy Lake area and
another at milepost 195.5 of the Parks Highway (near Broad Pass).
For the Parks Highway, considerations should be made to improve signage at the existing rest areas to
provide advance notice and distance to next rest area, in order to increase awareness of available areas.
RECOMMENDED LOCATIONS FOR SCENIC VIEW POINTS
The most important areas along the Parks Highway have adequately developed Scenic View Points. When the
South Denali Implementation plan commences, the Parks Highway amenities will be further augmented
between Trapper Creek, the South Denali Visitor Center, and along Petersville Road. (Additional detail is
included later in this chapter in the section titled Potential Large Scale Destination and Attraction
Developments.)
Needed Tourism Infrastructure Improvements McDowell Group, Inc. • Page D-14
In contrast, the Glenn Highway is underdeveloped. The study team recommends improvements to two to
four scenic existing view points along this highway corridor. Needed enhancements include brush clearing,
interpretive signage, and fixing or installing safety railings. Suggested locations include pull outs and waysides
located at the following mileposts:
• 66 (near Matanuska River)
• 74 (near King Mountain State Recreation Site)
• 78 (near Chikaloon River with views of King Mountain and Matanuska River)
• 115 (near Lion Head viewpoint and access to Old Glenn Highway)
• 120 (near Trooper Bruce A. Heck monument and views of Leila Lake)
• 129.3 (Eureka Summit area).
The cost of improving these facilities will vary depending upon the desired services. The region is fortunate
that the Glenn Highway is designated as a National Scenic Byway, making the corridor eligible for planning
and infrastructure development grants and assistance. Numerous additional byway enhancements are
identified in the Glenn Highway National Scenic Byway Interpretive Plan and the Glenn Highway Partnership
Plan.1
DENALI HIGHWAY CONDITION
Paving the Denali HIghway has been determined cost-prohibitive in the past. The study team believes this
infrastructure enhancement, especially when coupled with South Denali Implementation Plan developments,
could increase visitors’ length of stay in the region. Independent visitors—whether they are traveling in rental
or private RVs and cars—would be significantly more likely to incorporate the Denali Highway into their
itinerary. Several tour operators have expressed interested in development of new tour patterns and
overnight destinations if this road were in better condition. This interest, combined with a paved Denali
Highway, could result in a popular circle trip developing, utilizing the Parks, Denali and Glenn Highways,
resulting in increased visitor volume in the Borough.
Summary of Market Potential for Road System Enhancements
The study team recommends that the region adopt a long-term strategy for improving the travelers’
experiences throughout the region. Beginning with the development of one or two restrooms in critical
areas, the Borough can develop a framework for prioritizing and constructing future waysides, restrooms,
scenic viewpoints, and other enhancements, such as interpretive signage. An impressive body of planning
work, as well as formation of cooperative relationships and goals, has already been accomplished through the
Scenic Byway program.
Readers are cautioned that the market effect of developing only one or two additional restroom facilities
along the Mat-Su road system will have little or no effect on the existing market in terms of length of stay or
expenditures. In contrast, an ongoing, systematic approach to improvements will provide the greatest impact
on increase on future visitation and overnight stays in the region.
1 Further information about the Alaska Scenic Byway program and copies of the existing planning documents can be found online at: http://www.dot.state.ak.us/stwdplng/scenic/organizer-info.shtml#resource.
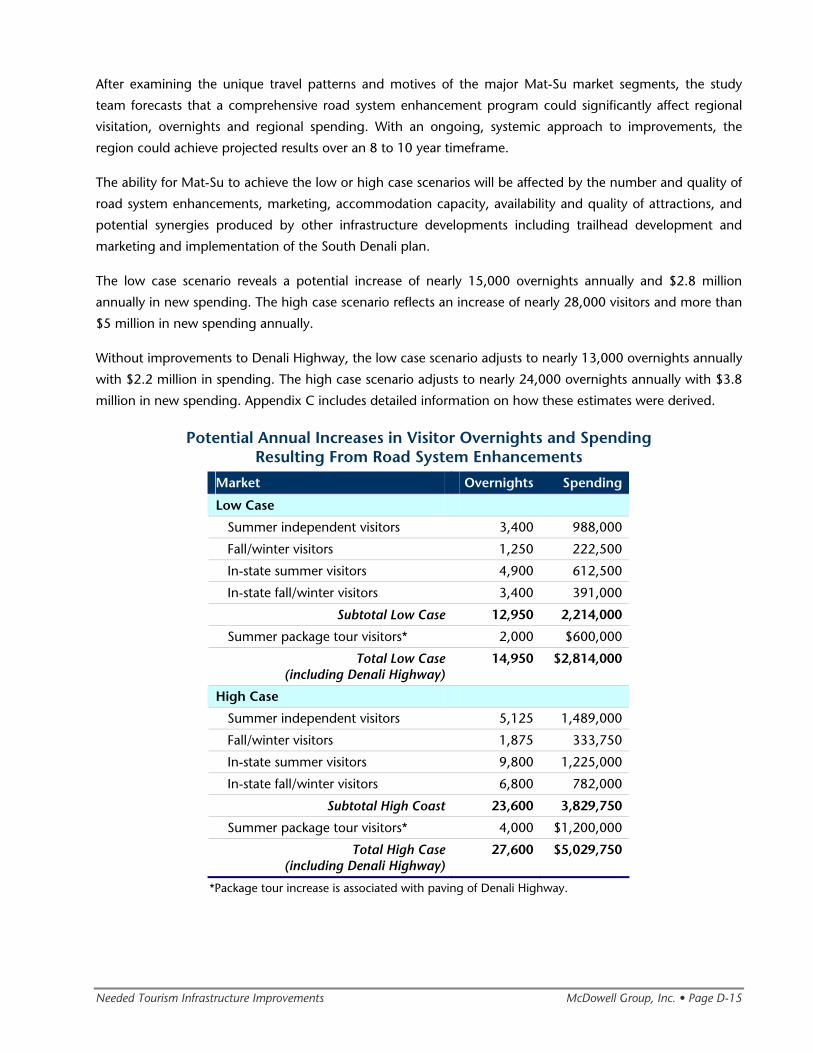
Needed Tourism Infrastructure Improvements McDowell Group, Inc. • Page D-15
After examining the unique travel patterns and motives of the major Mat-Su market segments, the study
team forecasts that a comprehensive road system enhancement program could significantly affect regional
visitation, overnights and regional spending. With an ongoing, systemic approach to improvements, the
region could achieve projected results over an 8 to 10 year timeframe.
The ability for Mat-Su to achieve the low or high case scenarios will be affected by the number and quality of
road system enhancements, marketing, accommodation capacity, availability and quality of attractions, and
potential synergies produced by other infrastructure developments including trailhead development and
marketing and implementation of the South Denali plan.
The low case scenario reveals a potential increase of nearly 15,000 overnights annually and $2.8 million
annually in new spending. The high case scenario reflects an increase of nearly 28,000 visitors and more than
$5 million in new spending annually.
Without improvements to Denali Highway, the low case scenario adjusts to nearly 13,000 overnights annually
with $2.2 million in spending. The high case scenario adjusts to nearly 24,000 overnights annually with $3.8
million in new spending. Appendix C includes detailed information on how these estimates were derived.
Potential Annual Increases in Visitor Overnights and Spending Resulting From Road System Enhancements
Market Overnights Spending
Low Case
Summer independent visitors 3,400 988,000
Fall/winter visitors 1,250 222,500
In-state summer visitors 4,900 612,500
In-state fall/winter visitors 3,400 391,000
Subtotal Low Case 12,950 2,214,000
Summer package tour visitors* 2,000 $600,000
Total Low Case (including Denali Highway)
14,950 $2,814,000
High Case
Summer independent visitors 5,125 1,489,000
Fall/winter visitors 1,875 333,750
In-state summer visitors 9,800 1,225,000
In-state fall/winter visitors 6,800 782,000
Subtotal High Coast 23,600 3,829,750
Summer package tour visitors* 4,000 $1,200,000
Total High Case (including Denali Highway)
27,600 $5,029,750
*Package tour increase is associated with paving of Denali Highway.
Needed Tourism Infrastructure Improvements McDowell Group, Inc. • Page D-16
Recommendations
• Address priority road system enhancements beginning with the recommended wayside near the
Glenn Highway/Parks Highway junction and the Eureka Summit areas, followed by second and third
priority locations.
• Seek partnerships to assist with planning, construction, and ongoing operations and maintenance
costs.
• Develop a larger-scale highway enhancement program for the region that incorporates the growing
needs from resident and visitor traffic.
Needed Tourism Infrastructure Improvements McDowell Group, Inc. • Page D-17
Trail System Enhancements
This section addresses needed trail system enhancement infrastructure improvements. It also discusses the
potential value of enhancing regional trails and public recreational sites like parks, campgrounds, and boat
launches, which are an important part of the visitor attraction base and character of the Mat-Su region.
This section includes the following:
• An overview of trail system needs identified in this study.
• A discussion of costs associated with trail system enhancements.
• An overview of the market potential resulting from trail system enhancements.
• Recommendations.
Overview of Regional Trail System
The ownership and management of the trail assets in the Mat-Su Borough is shared by the Alaska
Department of Natural Resources, Alaska Railroad Corporation, Alaska Department of Transportation and
Public Facilities, Matanuska-Susitna Borough and the cities of Palmer and Wasilla. Because of the multitude of
land status and other management issues, trails are not entirely well connected, marked, maintained or
mapped. In its current state, the regional system is under-developed, and in some areas, under-utilized by
various market segments.
The Matanuska Susitna Borough trail systems are located very close to the two main roads in the borough.
• The area along the Glenn Highway, east of Palmer, has many good trails that are used for hiking,
biking, and ATV activity in the summer, and snow machining, skiing and snowshoeing in the winter.
• The area west of the Parks Highway has hundreds of miles of trails stretching from the Little Susitna
area, north into the Peters Hills. Many of these trails are winter-only trails as they cross several river
major drainages and wetland areas.
• Denali State Park also offers many miles of scenic hiking trails.
• Hatcher Pass area has hiking trails for summer use and winter trails and routes for snow machining
and skiing.
• In addition there are many skiing, hiking and mountain biking trails in the Talkeetna, Palmer, Wasilla,
and Nancy Lake areas.
Trail System Needs
Study team interviews and research consistently found that existing trail systems have similar needs:
improved trailheads, restrooms, access, and signage to increase visibility and use.
Additionally, the regional trail system has repeatedly been identified as having the potential to become a focal
point in the tourism and recreation industry. Increased visitation can be stimulated by enhancing the trail
system in terms of trail infrastructure, access points, and promotion. Examples of this may be increased
Needed Tourism Infrastructure Improvements McDowell Group, Inc. • Page D-18
linkages between trails and back-country lodges and cabins, development of equestrian trails and an
equestrian center, or enhanced winter trail development for snow machine riders and cross-country skiers.
PRIORITY TRAIL SYSTEM ACTIONS
The following list of trail system needs was provided by the Borough. The list is roughly prioritized, based on
current condition and estimated usage:
• Point MacKenzie – Existing trailhead will eventually be consumed by port development. Relocate
trailhead/parking area approximately one mile north on Point MacKenzie Road and install restrooms.
Provides access to Figure Eight Lake, Flathorn Lake, Susitna River and beyond.
• Ayrshire Road – Existing trailhead provides access to Figure Eight Lake, Flathorn Lake trail system,
Susitna River and beyond. Restrooms need to be installed.
• West Papoose Twins Road – Construct new trailhead during upgrade of road. Install restrooms.
Provides access to Crooked Lake Trail, Iron Dog Trail, Susitna River and beyond.
• North Crystal Lake Road – Expand existing trailhead. Install restrooms. Provides access to Willow area
trails.
• Willer Kash Road – Expand existing trailhead. Install restrooms. Provides access to Hatcher Pass trail
system, Kashwitna area trails.
• Parks Highway MP 105 – Expand existing trailhead/parking area (possibly relocate short distance to
the north to get off the road). Install restrooms. Provides access to Trapper Lake-Amber Lake trail
system, Trapper Creek trail system.
• Petersville Road MP 4 – Construct new trailhead/parking area. Install restrooms. Provides access to
Petersville-Trapper Creek trail system, Denali State Park trails.
• Butte Pavilion Parking Area – Grade to level out. Install restrooms. Provides access to Jim Creek, Knik
River and Knik Glacier.
• Wendt Road – Expand existing parking area. Install restrooms. Provides access to Matanuska Moose
Range trail system.
• Sutton/Coyote Lake – Expand parking area. Replace damaged restroom. Provides access to Sutton
area trails.
• Kings River – Expand existing parking area. Install restrooms. Provides access to Kings River, Young
Creek and Red Mountain.
• Purinton Creek – Install restrooms. Provides access to Purinton Creek and Boulder Creek area trails.
• France Road (CMT) – Develop future trailhead to coincide with trailhead move in case the CMT unit
is not moveable. Install single restroom.
• Matanuska Peak Trailhead – Install single restroom.
• Pioneer Ridge Trailhead – Replace outhouse with single restroom.
• Matanuska River Park – Install one restroom on back parking lot.
Needed Tourism Infrastructure Improvements McDowell Group, Inc. • Page D-19
TRAIL PLAN UPDATE
The Borough has an existing trails plan that primarily addresses the significant trails in the region, the
importance of establishing legal trail right-of-ways and easements, and on a limited basis, the maintenance
and funding of trails. The study team recommends updating the trail plan, with a more broadly-defined
scope. Revisions to the plan should include an inventory and map of all trails in the borough, designated trail
usage, sustainable design standards, and a plan for trailheads and access points. A trail plan can facilitate
development of important partnerships with various local, state and federal agencies, in addition to the local
communities to establish future trail priorities. These planning efforts will provide guidance in the future
development and management of trails and investment in future priorities.
GPS MAPPING/MEMORIALIZED IN GIS SYSTEM
The study team also recommends further investment in GPS mapping and memorialization in a GIS system.
The GIS and mapping work plan should be coordinated between the Borough and the Alaska Department of
Natural Resources, Division of Alaska State Parks. Mapping and collecting GIS trail data could be effectively
completed with a work plan and direction from the two lead agencies and data collection done with the
cooperation of user groups. Once completed, development of maps will enhance marketing collateral and
information to increase trail usage and visitation to the Borough. Mapping should include an inventory of all
Mat-Su Borough trails with specific trail conditions and design standards cataloged. Other features should
include: location of trailhead(s); record of trail standards, widths and conditions; record of permitted uses;
record of distance, difficulty and terrain features; and location of any facilities, such as cabins, shelters, trail
junctions and landmarks.
CONTINUED TRAIL SYSTEM DEVELOPMENT
The study team also recommends further exploration regarding the feasibility of new or enhanced trail
systems for hikers, equestrians, snow machine riders and cross-country skiers.
Estimated Costs for Trail System Enhancements
ADDRESS PRIORITY TRAIL NEEDS
Development costs for trailheads can range from $150,000 to $750,000, depending on the scale of the
development and condition of current facilities. Annual maintenance costs range from $10,000 to $50,000,
depending on the size of the trailhead, number of toilets, location, and usage. Appendix C includes an
overview of costs associated with development and maintenance of trailheads, signage, campgrounds, and
other trail system enhancement amenities.
Ongoing annual investment will vary, depending on the number of priority areas addressed and the ability to
secure grants and partnerships. The study team estimated $300,000 to $500,000 annually for comparison
purposes. This amount could wholly fund development or refurbishment of between one and three trailheads
and/or restrooms annually, depending in the location and existing facilities. If grants and partnerships are
secured to offset the construction and operating costs, the development program could be accelerated.
Needed Tourism Infrastructure Improvements McDowell Group, Inc. • Page D-20
TRAILS PLAN UPDATE
The study team recommends that the Borough take the lead role in the development of a revised trails plan.
Development costs for the plan range from $100,000 to $300,000, depending on the scope of the project.
GPS MAPPING
The study team recommends that this effort be closely coordinated with public land agencies to reduce costs
and maximize efficiencies. The Borough may wish to allocate $15,000 to $30,000 annually to ensure that the
data collection is accurate and compatible with other agencies.
CONTINUED TRAIL SYSTEM DEVELOPMENT
The Borough should support planning, construction, and maintenance efforts that enhance the regional trail
system. This effort could become part of the existing tourism development grant program or a specific trail-
related initiative. The study team recommends that the grant application criteria include specific measures to
increase visitor usage of the trails. A suggested funding range for this program is $50,000 to $150,000
annually.
Summary of Market Potential for Trail System Enhancements
An ongoing, systemic approach to improvements is needed, beginning with development of a revised trail
plan. Once implemented, Mat-Su has the potential to become renowned for having outstanding trails and
recreational assets that appeal to numerous market segments.
Completion of sufficient enhancements to achieve the market potential identified by the study team is likely
to require a 10 to 20 year commitment. The region’s ability to achieve the low or high case scenarios will be
affected by the location and type of trail system enhancements, marketing, as well as synergies generated by
concurrent improvements in the regional transportation or accommodations sectors.
Baseline market research revealed that the out-of-state visitor market reports far lower participation in hikes
and nature walks in Mat-Su than in other areas of Alaska. Visitor participation is similarly low for other
outdoor activities commonly associated with trails and recreational sites including fishing, rafting, and
canoeing. Enhancements would improve visitor participation in these activities, stimulate regional spending,
and increase the length of stay in the region.
The primary emphasis in the analysis below is the role that trail system enhancements can play in increasing
the length of stay, overnights, and associated spending from Mat-Su’s existing markets. It is important to
note that significant enhancement of the trail system can attract new markets, thereby increasing Mat-Su’s
overall market share.
The low case scenario estimates nearly 12,000 overnights annually with nearly $2.0 million in new spending.
The high case scenario estimates nearly 24,000 overnights annually with $3.9 million in new spending.
Appendix C includes detailed information on how these estimates were derived.
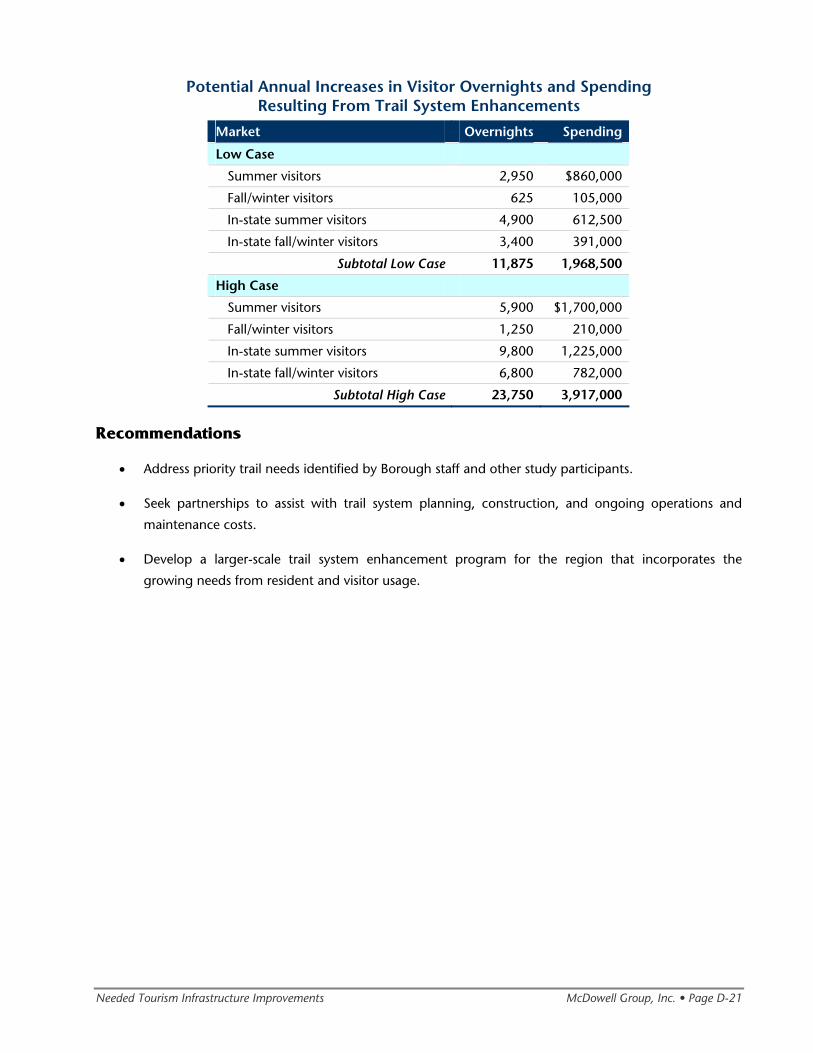
Needed Tourism Infrastructure Improvements McDowell Group, Inc. • Page D-21
Potential Annual Increases in Visitor Overnights and Spending Resulting From Trail System Enhancements
Market Overnights Spending
Low Case
Summer visitors 2,950 $860,000
Fall/winter visitors 625 105,000
In-state summer visitors 4,900 612,500
In-state fall/winter visitors 3,400 391,000
Subtotal Low Case 11,875 1,968,500
High Case
Summer visitors 5,900 $1,700,000
Fall/winter visitors 1,250 210,000
In-state summer visitors 9,800 1,225,000
In-state fall/winter visitors 6,800 782,000
Subtotal High Case 23,750 3,917,000
Recommendations
• Address priority trail needs identified by Borough staff and other study participants.
• Seek partnerships to assist with trail system planning, construction, and ongoing operations and
maintenance costs.
• Develop a larger-scale trail system enhancement program for the region that incorporates the
growing needs from resident and visitor usage.
Needed Tourism Infrastructure Improvements McDowell Group, Inc. • Page D-22
Visitor Support Services
For many successful destinations, visitor information centers and kiosks are found at several access points,
particularly at airports, rail/bus stations and roads. Past research shows that visitors who use visitor
information centers have a much higher satisfaction level with their visit.
This section includes the following:
• Priority locations for visitor support services.
• Estimated development costs.
• Market potential associated with visitor support service enhancements.
• Recommendations.
Priority Locations
Optimally, visitor information services are available at all major entrance points. The existing regional visitor
information center serves visitors that are just arriving via Anchorage or have already spent considerable time
in the region, having traveled the Glenn, Parks, or Denali Highways. (The study team notes that the location
for the existing information center is being reconsidered in a separate planning effort.) Additionally, visitor
information is supplemented by local chamber of commerce centers and railroad stations located in Talkeetna
and Wasilla.
The South Denali Implementation Plan includes a major Denali interpretive center and a smaller kiosk at the
Petersville Road/Parks Highway intersection. Development of one or both or these facilities can significantly
enhance the travel experience for visitors arriving from the north—assuming that regional and private sector
information can be distributed from the facilities.
To supplement these visitor support services, the study team recommends additional visitor information
kiosks or signage at the following locations:
• Glenn Highway, developed in conjunction with road system enhancements.
• Ensure that regional information is made available to visitors at the new interpretive center and kiosks
developed through the South Denali Implementation Plan.
• Review key airport and rail locations to ensure that presentation of information is adequate for the
markets using each area.
Kiosks can be simple or extensive, and may even include a staffed desk. As part of the visitor information
program, Mat-Su should develop a satellite kiosk and signage plan. Kiosks should be designed to be
consistent with other visitor information efforts and should reflect the Mat-Su brand. As the Mat-Su Borough
embarks on a tourism infrastructure development program, it is a good time to re-examine the regional
tourism branding strategy. It is often appropriate to incorporate the destination brand into the infrastructure
(i.e. signage, visitor information kiosks, etc.).
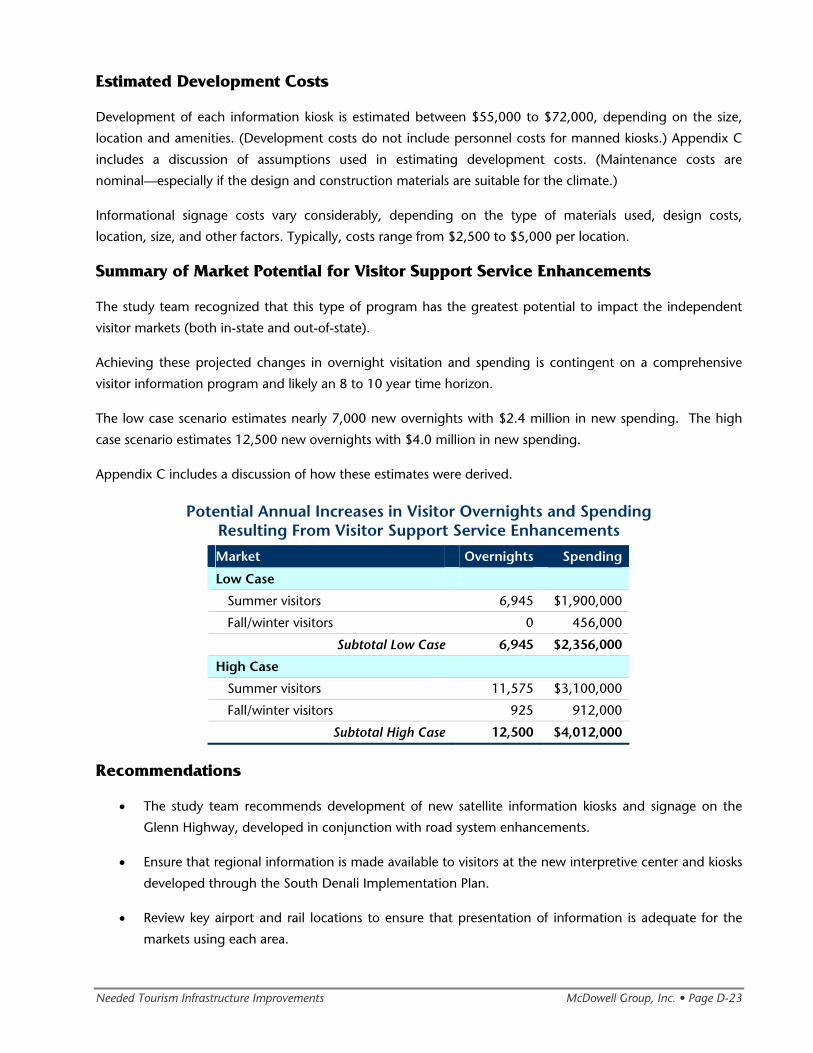
Needed Tourism Infrastructure Improvements McDowell Group, Inc. • Page D-23
Estimated Development Costs
Development of each information kiosk is estimated between $55,000 to $72,000, depending on the size,
location and amenities. (Development costs do not include personnel costs for manned kiosks.) Appendix C
includes a discussion of assumptions used in estimating development costs. (Maintenance costs are
nominal—especially if the design and construction materials are suitable for the climate.)
Informational signage costs vary considerably, depending on the type of materials used, design costs,
location, size, and other factors. Typically, costs range from $2,500 to $5,000 per location.
Summary of Market Potential for Visitor Support Service Enhancements
The study team recognized that this type of program has the greatest potential to impact the independent
visitor markets (both in-state and out-of-state).
Achieving these projected changes in overnight visitation and spending is contingent on a comprehensive
visitor information program and likely an 8 to 10 year time horizon.
The low case scenario estimates nearly 7,000 new overnights with $2.4 million in new spending. The high
case scenario estimates 12,500 new overnights with $4.0 million in new spending.
Appendix C includes a discussion of how these estimates were derived.
Potential Annual Increases in Visitor Overnights and Spending Resulting From Visitor Support Service Enhancements
Market Overnights Spending
Low Case
Summer visitors 6,945 $1,900,000
Fall/winter visitors 0 456,000
Subtotal Low Case 6,945 $2,356,000
High Case
Summer visitors 11,575 $3,100,000
Fall/winter visitors 925 912,000
Subtotal High Case 12,500 $4,012,000
Recommendations
• The study team recommends development of new satellite information kiosks and signage on the
Glenn Highway, developed in conjunction with road system enhancements.
• Ensure that regional information is made available to visitors at the new interpretive center and kiosks
developed through the South Denali Implementation Plan.
• Review key airport and rail locations to ensure that presentation of information is adequate for the
markets using each area.
Needed Tourism Infrastructure Improvements McDowell Group, Inc. • Page D-24
Determining Tourism Infrastructure Investment Priorities
Factors for Evaluating Priorities
Decisions for which new tourism infrastructure projects will be developed depend on the overall goals for
Borough policy makers. Prioritizing project choices will involve several considerations, including:
1. Overall development costs
2. Potential economic returns on development costs
3. Overall economic benefits to the borough
4. Length of time to achieve market potential
5. Operating and maintenance costs
6. Impact on Borough revenues
7. Funding sources
8. Partnership opportunities
While eight considerations guided analysis of the tourism infrastructure enhancements, financial
considerations and distribution of benefits are key measures for evaluating priorities.
Overview of Tourism Infrastructure Enhancements
Below is a summary of key tourism infrastructure developments. Extensive data and analytical detail
supporting the summaries presented below are included in the section of the report that precede this
prioritizing section as well as in Appendix C.
Conference/Convention Facility
The infrastructure opportunity offers the quickest economic return and potential to enhance the regional
economy during significantly slower fall and winter months. It also represents the highest initial development
cost. In the appropriate location (the Palmer/Wasilla area is recommended), this type of development could
be an important component of the regional infrastructure. Development for a small facility is estimated to
cost $4.5 million, and a larger facility $10.8 million. Estimated annual overnights to achieve a return are
projected to be realized within three to five years. The most likely funding scenario is a public bonding
process, with the bond repaid by bed taxes and/or other taxes. Based on comparable facilities, the financial
gap between annual operating costs and revenues is likely to be approximately $200,000 for the small facility
and $300,000 for the larger facility. (These estimates include routine maintenance and operations, but not
future capital costs for facility or equipment upgrades.) This facility has the opportunity for partnerships with
foundations (for example: Rasmuson Foundation and Foraker Group Pre-Development Program) and the
municipal governments of the facility’s location (see Partnership section).
Needed Tourism Infrastructure Improvements McDowell Group, Inc. • Page D-25
For the smaller facility, the potential return on the development investments over ten years is roughly
estimated to total 30,000 to 40,000 new room nights and $5.3 to $7.0 million in new spending. For the
larger facility, the potential return on investment over ten years is roughly estimated to total 48,000 to
69,000 in new room nights and $8.4 to $12.2 million in new spending. From a development cost
perspective, this represents about a 1:1 return on a $4.5 million conference center or $10.8 million
convention center.
Road System Enhancement Program
A comprehensive road system enhancement program, including waysides, involves a multi-year strategy for
development and implementation. Development costs for recommended road system enhancements will
range from $500,000 to $1 million annually. This funding level allows one or two waysides to be wholly
funded by the Borough or a significantly accelerated development program if grants and partners
supplement Borough funds. Estimated annual maintenance costs can range from $30,000 to $75,000,
depending on the number of new or enhanced facilities, location, and ability to secure partners (such as
public land agencies, area chamber of commerce, private businesses, and non-profit organizations). Road
projects have several natural partnering opportunities and funding structures already in place. Further, newer
programs, such as the National Scenic Byways Programs provide additional opportunities for partnering and
funding. Over a ten-year period, the potential return on development investments are estimated to be
81,000 to 162,000 new room nights and $13.7 to $25.8 in new spending. From a development cost
perspective, this represents about a 2:1 positive return on investment.
Trail System Enhancement Program
A longer time horizon is anticipated for a trail system enhancement program than for other projects
recommended in this plan – 10 to 20 years rather than five to 10 years. Development costs for individual
trailheads and restrooms can range from $150,000 to $750,000, depending on the scale of investment and
the condition of current facilities. Annual maintenance costs for each facility can range from $10,000 to
$50,000, depending on the location, usage, and number of toilets. As with the road system enhancements,
the Borough’s investment could be significantly reduced if grants or partners are secured for construction and
operating costs.
An accelerated trail system enhancement program could potentially be fully realized within 10 years or less.
Over 10 years, development costs for a trail system enhancement program, including the development of a
comprehensive trail plan, are estimated to be $3.1 million to $5.3 million. Potential new room nights
resulting from this spending are estimated at 45,000 to 90,000, with $7.5 to $11 million in new spending.
This represents roughly a 2:1 positive return on initial development costs. As with roads, several trail
partnership opportunities are already in place, including funding partnerships for trail development and
maintenance. In addition, trail user groups have historically been involved in the development and
maintenance of trails throughout the borough.
Visitor Support Services Enhancement Program
Visitor support services involve small infrastructure enhancements (kiosks, signage, information panels, etc.)
but with potential large returns. A one-time development cost investment of $75,000 to $180,000 can
Needed Tourism Infrastructure Improvements McDowell Group, Inc. • Page D-26
construct one to two kiosks and enhance information signage. This investment is estimated to yield 35,000 to
67,000 total new room nights over a ten year period, with $11.8 to $17.4 million estimated in new spending.
This represents a substantial return on initial development costs. Partnering and some funding opportunities
are available to develop and implement this program. The following tables provide a general summary of the
comparison of tourism infrastructure projects and their potential returns on development costs.
Comparison of Potential Tourism Infrastructure Enhancements
The tables on the following two pages provide a comparison between the proposed enhancements. The first
table compares the investments on the following basis:
• Estimated annual overnights.
• Estimated annual visitor spending.
• Estimated development cost.
• Timeframe to achieve projected visitation and spending.
The second table compares the cumulative impacts from the investments over a 10-year period. The table
includes the following:
• Estimated development cost.
• Estimated total room nights.
• Estimated total new visitor spending.
• Estimated return on the investment.
It is important to note that Borough cost throughout these scenarios could be considerably less, depending
on the ability to secure grant funds and partners.
Operating and maintenance costs are not expected to alter the outcome of the comparative analysis, as these
costs are minor in comparison to the development costs. Furthermore, grants and partnering can alter actual
costs to the Borough considerably.
• Routine operations and maintenance costs are included in the estimated operating deficit projections
for the conference and convention facilities ($200,000 to $300,000 respectively).
• Combined operations and maintenance costs for road system enhancements and trail system
enhancements can range from $10,000 to $125,000 annually, depending on the number of
enhancements, location, existing facilities, and ability to secure partners and grants.
• Operating and maintenance costs for visitor support services will be nominal.
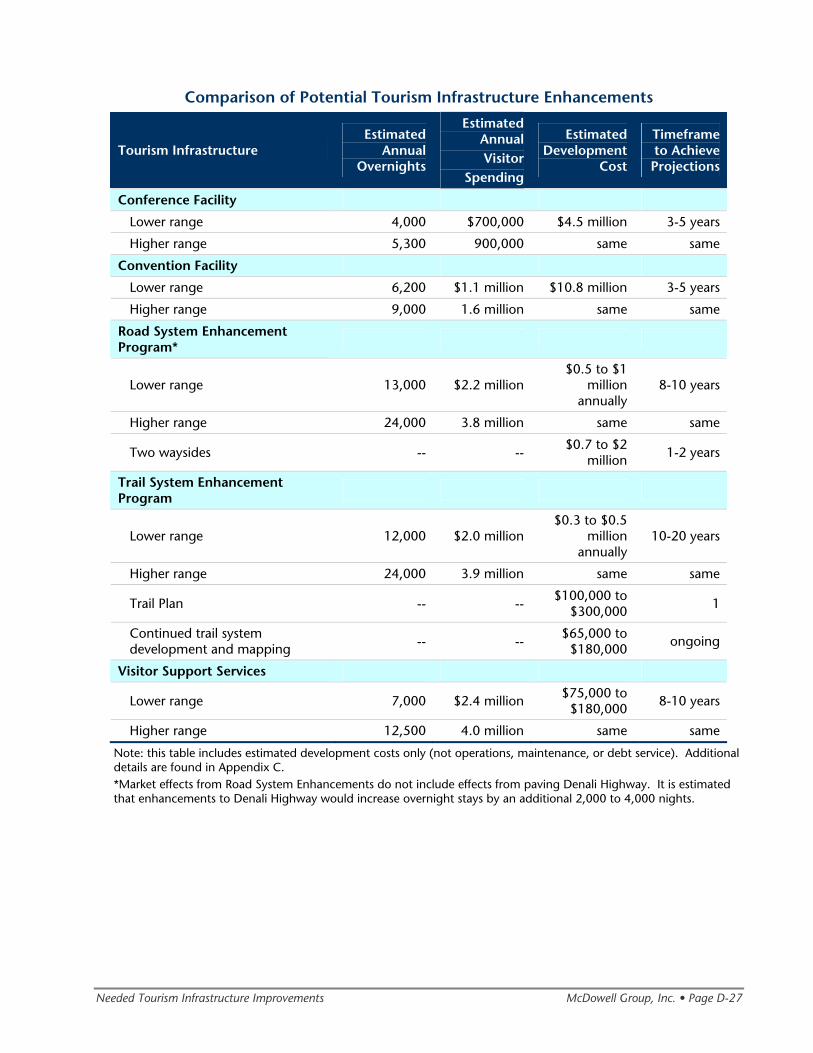
Needed Tourism Infrastructure Improvements McDowell Group, Inc. • Page D-27
Comparison of Potential Tourism Infrastructure Enhancements
Tourism Infrastructure Estimated
AnnualOvernights
Estimated AnnualVisitor
Spending
Estimated Development
Cost
Timeframe to Achieve Projections
Conference Facility
Lower range 4,000 $700,000 $4.5 million 3-5 years
Higher range 5,300 900,000 same same
Convention Facility
Lower range 6,200 $1.1 million $10.8 million 3-5 years
Higher range 9,000 1.6 million same same
Road System Enhancement Program*
Lower range 13,000 $2.2 million$0.5 to $1
million annually
8-10 years
Higher range 24,000 3.8 million same same
Two waysides -- --$0.7 to $2
million 1-2 years
Trail System Enhancement Program
Lower range 12,000 $2.0 million$0.3 to $0.5
million annually
10-20 years
Higher range 24,000 3.9 million same same
Trail Plan -- --$100,000 to
$300,000 1
Continued trail system development and mapping -- --
$65,000 to $180,000 ongoing
Visitor Support Services
Lower range 7,000 $2.4 million$75,000 to
$180,000 8-10 years
Higher range 12,500 4.0 million same same
Note: this table includes estimated development costs only (not operations, maintenance, or debt service). Additional details are found in Appendix C. *Market effects from Road System Enhancements do not include effects from paving Denali Highway. It is estimated that enhancements to Denali Highway would increase overnight stays by an additional 2,000 to 4,000 nights.
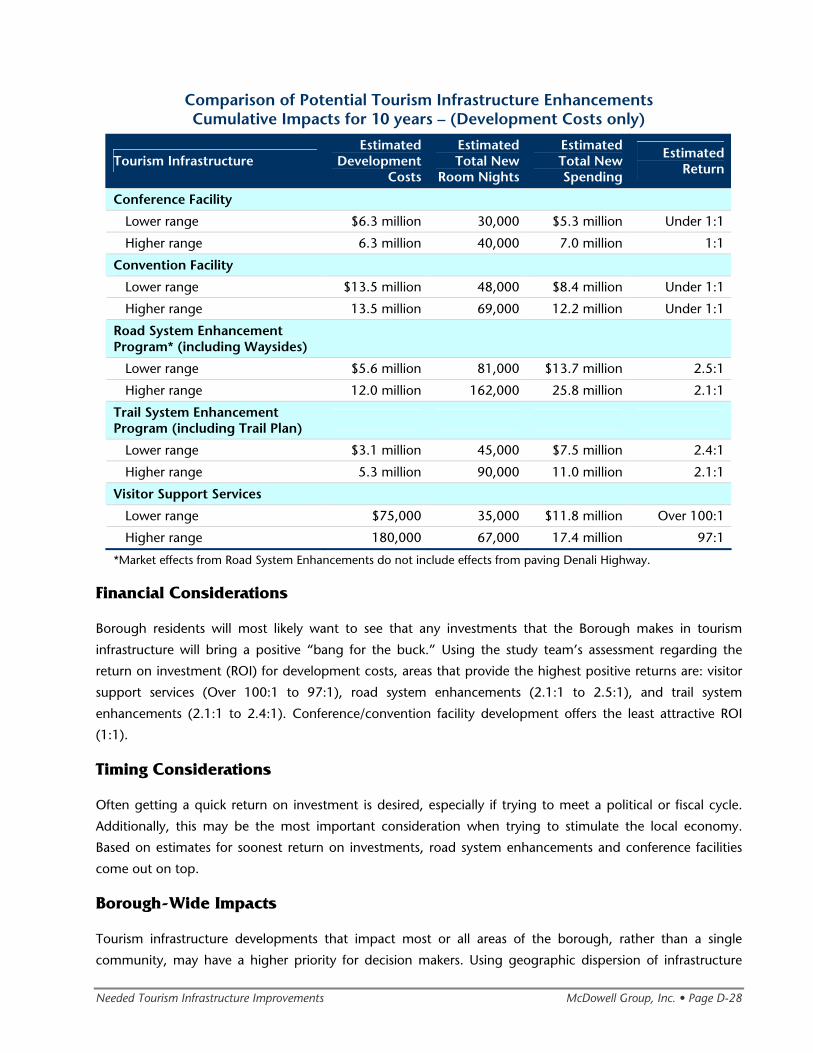
Needed Tourism Infrastructure Improvements McDowell Group, Inc. • Page D-28
Comparison of Potential Tourism Infrastructure Enhancements Cumulative Impacts for 10 years – (Development Costs only)
Tourism Infrastructure Estimated
Development Costs
Estimated Total New
Room Nights
Estimated Total New Spending
Estimated Return
Conference Facility
Lower range $6.3 million 30,000 $5.3 million Under 1:1
Higher range 6.3 million 40,000 7.0 million 1:1
Convention Facility
Lower range $13.5 million 48,000 $8.4 million Under 1:1
Higher range 13.5 million 69,000 12.2 million Under 1:1
Road System Enhancement Program* (including Waysides)
Lower range $5.6 million 81,000 $13.7 million 2.5:1
Higher range 12.0 million 162,000 25.8 million 2.1:1
Trail System Enhancement Program (including Trail Plan)
Lower range $3.1 million 45,000 $7.5 million 2.4:1
Higher range 5.3 million 90,000 11.0 million 2.1:1
Visitor Support Services
Lower range $75,000 35,000 $11.8 million Over 100:1
Higher range 180,000 67,000 17.4 million 97:1
*Market effects from Road System Enhancements do not include effects from paving Denali Highway.
Financial Considerations
Borough residents will most likely want to see that any investments that the Borough makes in tourism
infrastructure will bring a positive “bang for the buck.” Using the study team’s assessment regarding the
return on investment (ROI) for development costs, areas that provide the highest positive returns are: visitor
support services (Over 100:1 to 97:1), road system enhancements (2.1:1 to 2.5:1), and trail system
enhancements (2.1:1 to 2.4:1). Conference/convention facility development offers the least attractive ROI
(1:1).
Timing Considerations
Often getting a quick return on investment is desired, especially if trying to meet a political or fiscal cycle.
Additionally, this may be the most important consideration when trying to stimulate the local economy.
Based on estimates for soonest return on investments, road system enhancements and conference facilities
come out on top.
Borough-Wide Impacts
Tourism infrastructure developments that impact most or all areas of the borough, rather than a single
community, may have a higher priority for decision makers. Using geographic dispersion of infrastructure
Needed Tourism Infrastructure Improvements McDowell Group, Inc. • Page D-29
developments as a desirable criterion, the order of choices that would have the broader borough-wide impact
are trail system enhancements, road system enhancements, and visitor support services. A meeting facility
would logically be located in only one community.
Tourism Infrastructure Priorities
Public policy decisions are far more complex than business investment decisions which are generally limited
to the bottom line. While public policy decisions include financial consideration, many factors (including the
eight prioritizing considerations that guided this analysis) must be weighed.
Further, successful tourism growth is a synergistic result of a complex web of all the enhancements analyzed
in this report. For example, only focusing on trail system enhancements would not result in the same benefits
as simultaneous development of road, trail and visitor support service enhancements. This makes forecasting
specific economic returns on each category very difficult. For example, in the category of road system
enhancements, the economic addition of public toilets is not remotely quantifiable; however, the study team
has been able to estimate the economic benefits of a number of road system enhancements. Even the
relatively stand alone conference/convention facility – provided it is centrally located and easily accessible –
might have some long term synergistic benefits by exposing meeting attendees to the more widely
distributed road, trail and visitor support services in the region.
Therefore, a simplistic choice of a single priority is not practical and does not reflect the reality of how
successful tourism development is managed. Only if the Borough has a single criterion for priority selection,
such as return on investment (ROI), is it possible to rank order. The Borough must first strategically choose
their desired end result from their visitor industry investment. Then investments can be chosen that yield
those results. Fortunately, with the substantial visitor base that exists, the increased revenue from investments
and a potential increase in bed tax rates makes possible investments in multiple priorities.
The following are the study team’s recommendations based on the apparent overall best interests of the Mat-
Su Borough. All the evaluation criteria are considered and resulting in highest, second, and third priorities,
lead by the tourism support services, road and trail system enhancement, and lastly, the
conference/convention facility. Again, readers are reminded that the obvious synergistic benefits of the top
priorities – visitor support services, road and trail system enhancements – should boost the overall return of
public investment. The criteria weighing most heavily in these recommendations were ROI of public money,
scale of economic impact, and the geographic distribution of the economic impacts throughout the
borough. Ultimately, decision makers may choose other criteria to weigh more heavily, such as ROI or
borough-wide impacts.
However, given the study team’s excess of 100 years in tourism development expertise, the following
priorities are recommended to serve in the best overall interest of the people and businesses of the Mat-Su
Borough.
Needed Tourism Infrastructure Improvements McDowell Group, Inc. • Page D-30
Highest Priority
The tourism investment priority that rises to the top is visitor support services. The investment required is
relatively small and can be implemented quickly. Positive returns for the investment should be realized in
three to five years. Additionally, the benefits from this investment will be spread throughout the borough and
throughout the year. Bed tax receipts can be used to partner with organizations such as the Mat-Su
Convention and Visitors Bureau, private companies, and Alaska Railroad. Visitor support services are intimately
related to the second level priorities, road and trail system enhancements.
Second Priorities
The second investment priorities are both road and trail system enhancements. Once immediate priorities are
addressed, the study team recommends funding for a detailed road system enhancement plan. Similarly,
while immediate trail system needs are addressed, the study team recommends updating the regional trail
plan. Seed money from bed tax receipts can also be used to fund the planning efforts. However, it is assumed
that enhancements can be implemented over a period of years allowing benefits to spread throughout the
borough and seasons. There are good opportunities to partner and leverage dollars with the National Scenic
Byways program, and other federal and state programs, as well as user groups and other businesses.
Third Priority
Development of a conference/convention center is considered as the lowest priority relative to visitor support
services, and road and trail system enhancements. On the plus side, this type of facility will provide new
spending in the non-summer months and is likely to provide increased room nights and spending earlier than
other infrastructure projects. When compared to other potential developments, it is expected to have the
lowest ROI. Additionally, most benefits will be localized around the center; therefore, the location needs to be
in a central area where benefits have the opportunity to spread more widely. A investment of this size often
requires bonding for funding. This can create political complexities and may require a new source of taxes to
support the debt service (i.e. special district taxes, etc.). Development of a conference/convention center
offers some opportunities for partnering, but will require a partnership model designed to uniquely fit the
situation (i.e. center location, size, usages, etc.).
Needed Tourism Infrastructure Improvements McDowell Group, Inc. • Page D-31
Potential Large Scale Destination and Attraction Developments
This study focuses primarily on smaller-scale physical infrastructure developments, which are important to
ensure that the region optimizes the visitors’ travel experience as well as the economic and employment
impacts from tourism. While the Borough aggressively pursues these projects, it should also continue to work
on larger, destination and attraction development for the region.
The attraction base of any visitor destination is the most central element of tourism planning and
development. Attractions and destinations motivate the visitor to actually spend time and money in the
destination. Other infrastructure (such as accommodations, access, and services) are essential elements of the
visitor experience, but are not the focal point.
Continued Borough investment and development of regional destinations and attractions is important to
ensure long term growth in visitor-related spending and employment. Current and potential attraction and
destination developments include: South Denali, Hatcher Pass, Independence Mine Tour Development, Glenn
Highway Raptor Center, Palmer Hay Flats Natural Science Education/Community Center, and Trail
Destination development. Each of these development concepts is described below.
South Denali Implementation Plan
The National Park Service, the State of Alaska Department of Natural Resources, and the Borough are
collaborating on plans to significantly enhance visitor-related infrastructure and access in the South Denali
area. Mat-Su Borough is a strong advocate of this development, as it has potential to become a premier
tourism destination and recreational hub, thereby increasing the number of visitors and their length of stay in
the region.
The following information is summarized from the Draft South Denali Implementation Plan and Environmental
Impact Statement and the Draft Economic Impacts of the South Denali Implementation Plan.2 The development
plan includes two scenarios, one that provides for core elements of the development plan, valued at $21.8
million in construction costs, and a second element that provides for a full development scenario, which
would cost $46.1 million. The infrastructure provided by each of the two scenarios is set forth below:
SOUTH DENALI IMPLEMENTATION PLAN CORE ELEMENTS
• Curry Ridge Visitor Center (approximately 3.5 miles off the Parks Highway)
• Transportation Center
• Campground off the Parks Highway
• Visitor Center and 3.5-mile access road
• Thirteen miles of trail near new visitor center
2 Economic Impacts of the South Denali Implementation Plan, Draft Final Report, Institute of Social and Economic Research, UAA.
Needed Tourism Infrastructure Improvements McDowell Group, Inc. • Page D-32
The Implementation Plan Full-Development Scenario includes the previous components, plus the following
infrastructure enhancements, for a total of $46.1 million in public-sector spending.
• Previously identified core development plan elements
• Improved parking at mile 121.5 and new parking at mile 122
• Parking near Rabideux Creek (mile 104.6)
• Information kiosk at Parks Highway/Petersville Road intersection (mile 114.9)
• Non-motorized boat access near Troublesome Creek (mile 137)
• Several enhancements along the Petersville Road including campgrounds, bike paths, turnouts and
redesigned parking areas
The National Park Service anticipates project completion between 2013 and 2015. If state funding is
approved, the timeline could be accelerated. Once underway, the project will require four to six years of
construction.
SOUTH DENALI ISER ANALYSIS
A recent analysis conducted by the Institute of Social and Economic Research (ISER) for the National Park
Service and the Matanuska-Susitna Borough estimates that additional private investment associated with the
fully-developed scenario would total approximately $30 million. This investment could include 75 additional
hotel rooms associated with larger tour company needs, another 50-60 hotel rooms at smaller properties,
approximately four new dining establishments and one new gas station. ISER estimates that the fully-
developed plan will result in 403 construction jobs for three years and 669 annual on-going jobs from the
new non-resident and visitor spending.
Market changes associated with the fully-developed plan include a 20 percent increase in the number of
cruise-tour visitors that have a two-night, three-day stay in the region included in their land tour package.
Additionally, 20 percent of the current visitor market is project to spend an additional day in the vicinity of
the visitor center.
INCREASED VISITOR SPENDING FROM SOUTH DENALI PROJECT
Direct visitor spending in Mat-Su is projected to increase by $30.9 million from out-of-state visitors and $12.7
million from Alaska residents. This projected increase of nearly $44 million in new visitor spending represents
a nearly 22 percent increase over the current market estimate of $201.1 million in visitor spending. The
combined effects of enhancing access (roads, parking areas, trails and boat launches), accommodations
(campgrounds, hotels, restroom facilities) and attractions (visitor center, scenic viewpoints and trails) results
in far greater impacts than any single enhancement could on its own.
Hatcher Pass Development
Hatcher Pass has significant long-term potential for becoming a central element of the Alaska experience for
virtually all visitor markets. The area offers exceptional scenic beauty, history, outdoor recreation, and year-
round appeal. Significant road, trail, and wayside enhancements have taken place in recent years; these
Needed Tourism Infrastructure Improvements McDowell Group, Inc. • Page D-33
access and infrastructure improvements resulted in immediate increases in visitation and usage.
Improvements to the road over Hatcher Pass could result in significantly greater visitation and prolonged
visitor time in the region by nearly all visitor markets.
Further planning efforts are underway for downhill and Nordic ski area development. As currently envisioned,
the Hatcher Pass ski area will be a public project and primarily used as a day-use area. Recreational
infrastructure will be developed with the intention of turning it over to be private or non-profit management.
Elements of the development plan are still being refined, based on project feasibility.
In early March 2008, the Borough Assembly received presentations from consultants and advisors engaged
on the project. These consultants and advisors outlined the feasibility for a “New Beginning” model, which
included a full complement of Alpine and Nordic ski amenities, plus a snowboard terrain park, multi-use trails,
slopeside amenities and support infrastructure such as roads and parking. The consultant team also outlined a
scaled-back approach, referred to as the “Modified Approach.” Under this approach, additional amenities
envisioned in the “New Beginning” model would be developed later in the project, as market demand
dictates. Core elements under the “Modified Approach” are:
Northern/Alpine Area
• High-speed quad up to 1,300 vertical feet (6 minute ride) or Quad chairlift (15 minute ride)
• Chair lift for beginning area
• Snow making
• Some trail lighting on runs from the quad
• 8,000 sq. ft. day lodge
• Parking for 400 vehicles (3.5 acres)
• Maintenance building and explosives storage
Southern/Nordic Area
• 15 kilometers of trails as laid out by Bill Spencer (competition and recreation)
• Limited road access
• Limited parking for both Nordic and Alpine overflow
• Limited trailheads for multiple-purpose use (hiking, horse trail riding, mountain biking and
snowmobile)
HATCHER PASS COST ESTIMATES
Including general project costs, such as architectural and engineering costs, these components are currently
estimated to cost approximately $17.0 million. Additional amenities to completed the “New Beginning”
concept are currently estimated to add $23.8 million, for a total project cost of approximately $40.8 million.
Additional amenities outlined in the “New Beginning” model, which could be developed at a later time
include additional trails, lifts, chalets, sledding hills and road access.
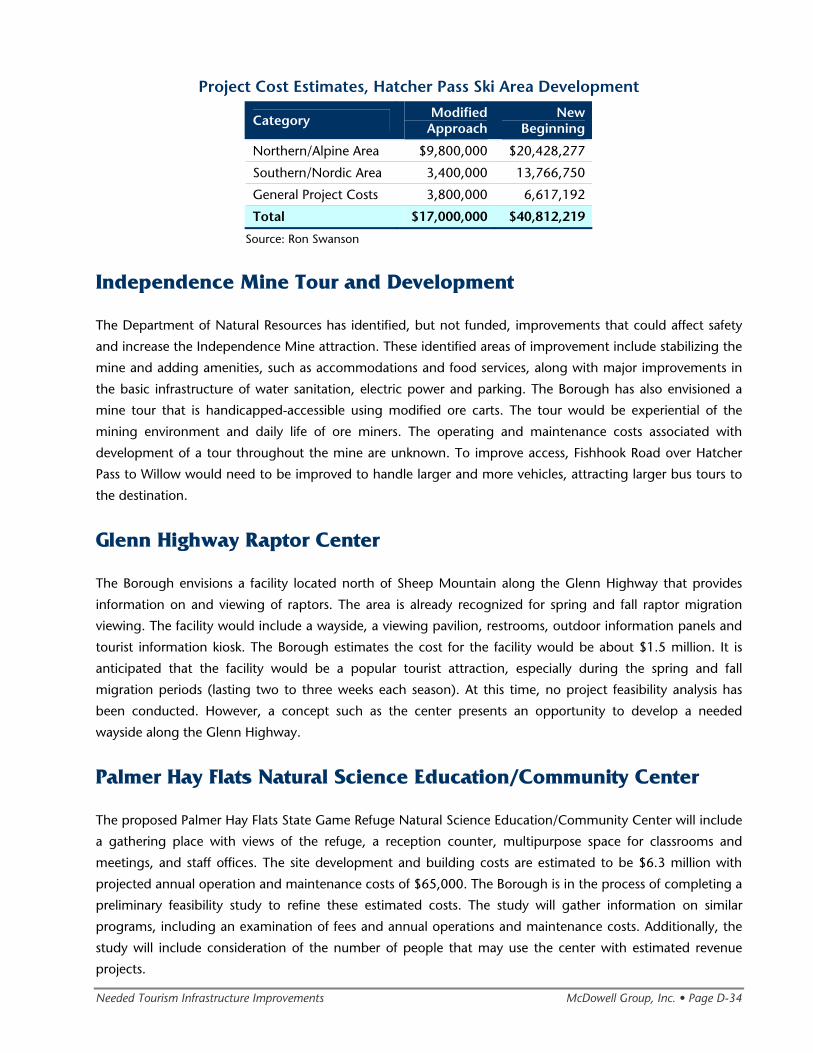
Needed Tourism Infrastructure Improvements McDowell Group, Inc. • Page D-34
Project Cost Estimates, Hatcher Pass Ski Area Development
Category Modified Approach
New Beginning
Northern/Alpine Area $9,800,000 $20,428,277
Southern/Nordic Area 3,400,000 13,766,750
General Project Costs 3,800,000 6,617,192
Total $17,000,000 $40,812,219
Source: Ron Swanson
Independence Mine Tour and Development
The Department of Natural Resources has identified, but not funded, improvements that could affect safety
and increase the Independence Mine attraction. These identified areas of improvement include stabilizing the
mine and adding amenities, such as accommodations and food services, along with major improvements in
the basic infrastructure of water sanitation, electric power and parking. The Borough has also envisioned a
mine tour that is handicapped-accessible using modified ore carts. The tour would be experiential of the
mining environment and daily life of ore miners. The operating and maintenance costs associated with
development of a tour throughout the mine are unknown. To improve access, Fishhook Road over Hatcher
Pass to Willow would need to be improved to handle larger and more vehicles, attracting larger bus tours to
the destination.
Glenn Highway Raptor Center
The Borough envisions a facility located north of Sheep Mountain along the Glenn Highway that provides
information on and viewing of raptors. The area is already recognized for spring and fall raptor migration
viewing. The facility would include a wayside, a viewing pavilion, restrooms, outdoor information panels and
tourist information kiosk. The Borough estimates the cost for the facility would be about $1.5 million. It is
anticipated that the facility would be a popular tourist attraction, especially during the spring and fall
migration periods (lasting two to three weeks each season). At this time, no project feasibility analysis has
been conducted. However, a concept such as the center presents an opportunity to develop a needed
wayside along the Glenn Highway.
Palmer Hay Flats Natural Science Education/Community Center
The proposed Palmer Hay Flats State Game Refuge Natural Science Education/Community Center will include
a gathering place with views of the refuge, a reception counter, multipurpose space for classrooms and
meetings, and staff offices. The site development and building costs are estimated to be $6.3 million with
projected annual operation and maintenance costs of $65,000. The Borough is in the process of completing a
preliminary feasibility study to refine these estimated costs. The study will gather information on similar
programs, including an examination of fees and annual operations and maintenance costs. Additionally, the
study will include consideration of the number of people that may use the center with estimated revenue
projects.
Needed Tourism Infrastructure Improvements McDowell Group, Inc. • Page D-35
The center is envisioned to provide year-round, hands-on learning, stewardship and recreational
opportunities. Public programs, special presentations, school programs and training courses are planned.
These programs are primarily geared for community and school use, however, there is a possibility to develop
programs that may attract tourists during the summer season.
Trail Destination Development
While the region currently offers visitors and residents an extensive trail system, there is significantly greater
potential to enhance the trail system in terms of infrastructure, access points and promotion. Examples might
include development of linkages between trails and back-country lodges and cabins, equestrian trails,
enhanced snow machine trails, or development of more extensive cross-country ski trail system. Each of these
trail concepts could be developed around a new or existing focal point such as an equestrian center or
warming huts for winter trail users. The result of a “trail destination” approach to trail system development
could attract new visitor markets, more repeat and year-round visitation, and a reputation among trail
enthusiasts that could rival the Pacific Crest Trail (Western US States), the Appalachian Trail (Eastern US
States), or the Milford Track (New Zealand).
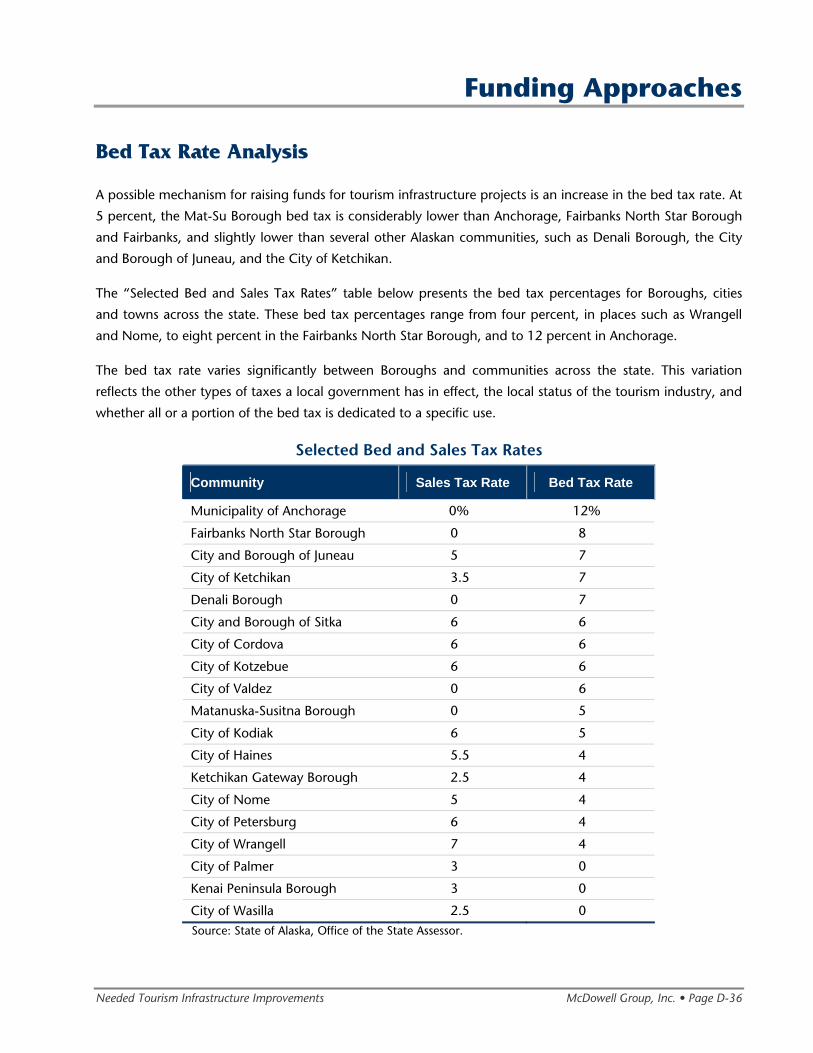
Needed Tourism Infrastructure Improvements McDowell Group, Inc. • Page D-36
Funding Approaches
Bed Tax Rate Analysis
A possible mechanism for raising funds for tourism infrastructure projects is an increase in the bed tax rate. At
5 percent, the Mat-Su Borough bed tax is considerably lower than Anchorage, Fairbanks North Star Borough
and Fairbanks, and slightly lower than several other Alaskan communities, such as Denali Borough, the City
and Borough of Juneau, and the City of Ketchikan.
The “Selected Bed and Sales Tax Rates” table below presents the bed tax percentages for Boroughs, cities
and towns across the state. These bed tax percentages range from four percent, in places such as Wrangell
and Nome, to eight percent in the Fairbanks North Star Borough, and to 12 percent in Anchorage.
The bed tax rate varies significantly between Boroughs and communities across the state. This variation
reflects the other types of taxes a local government has in effect, the local status of the tourism industry, and
whether all or a portion of the bed tax is dedicated to a specific use.
Selected Bed and Sales Tax Rates
Community Sales Tax Rate Bed Tax Rate
Municipality of Anchorage 0% 12%
Fairbanks North Star Borough 0 8
City and Borough of Juneau 5 7
City of Ketchikan 3.5 7
Denali Borough 0 7
City and Borough of Sitka 6 6
City of Cordova 6 6
City of Kotzebue 6 6
City of Valdez 0 6
Matanuska-Susitna Borough 0 5
City of Kodiak 6 5
City of Haines 5.5 4
Ketchikan Gateway Borough 2.5 4
City of Nome 5 4
City of Petersburg 6 4
City of Wrangell 7 4
City of Palmer 3 0
Kenai Peninsula Borough 3 0
City of Wasilla 2.5 0 Source: State of Alaska, Office of the State Assessor.
Needed Tourism Infrastructure Improvements McDowell Group, Inc. • Page D-37
It is also important to point out that each community allocates the use of bed tax collections differently,
based on their unique economy, local needs and usage of other funding mechanisms like property tax and
sales tax. Though, as the examples below indicate, a significant portion of the bed tax usually goes back into
tourism related projects.
• In Anchorage, the bed tax is 12 percent. Of the total bed tax receipts in 2007 ($19 million), one-third
of the bed tax ($6.3 million) each is dedicated to the Dena’ina Civic & Convention Center, the
General Fund, and the Anchorage Convention & Visitors Bureau.
• In Fairbanks, the bed tax is 8 percent. In 2007, total bed tax receipts were $2.6 million. The city
receives 22.5 percent ($585,000) and a fixed amount ($400,000 or 15 percent) is appropriated to
the following: Fairbanks Economic Development Corporation ($50,000), Golden Heart Plaza &
Barnette Landing ($30,000), Special Events ($50,000), and discretionary grants ($270,000). The
remaining 62.5 percent (or $1.6 million) is dedicated to the Fairbanks Convention & Visitor Bureau.
• In Juneau, the bed tax is 7 percent. Of the total bed tax receipts in 2007 ($1 million), 57 percent
($590,000) is dedicated to Juneau Convention & Visitor Bureau and 43 percent ($445,000) to the
municipally-owned convention and civic center (Centennial Hall). Centennial Hall then contracts with
Juneau Convention & Visitor Bureau for marketing services, effectively reducing the municipally-
managed percentage.
• In Ketchikan, the bed tax is 7 percent. In 2007, total bed tax receipts were $334,000. The City of
Ketchikan does not use a pre-determined formula to allocate their bed tax revenues. The Ketchikan
Visitors Bureau makes an annual budget request to the city. Once the amount is approved, 55
percent ($184,000 in 2007) of the requested amount is funded from the transient (bed) tax fund.
The other 45 percent ($150,000) comes from the port enterprise fund. Any remaining amount of the
transient tax fund is used to support civic center operations (Ted Ferry Civic and Convention Center).
• In Denali Borough, the bed tax is 7 percent. In 2007, total bed tax receipts were $2.3 million. These
receipts flow into the general fund. Because the Denali Borough does not have a sales or property
tax, bed tax and severance tax (from Usibelli Coal Mine operations) are the only sources of tax
revenue to the borough.
Looking forward, bed tax amounts will likely continue to grow, but not necessarily at the same pace
experienced in recent years. Over the next ten years, the Borough will experience additional accommodation
development, particularly in the South Denali area where ISER estimates another 135 rooms will be needed.
The Borough should be prepared for continued growth in accommodations inventory, accommodation-
related revenues, and bed tax collections, but it may occur in smaller increments than in the past ten years.
Conversely, the bed tax growth rate can be stimulated through infrastructure and marketing investments
designed to attract new overnight business to the region. For example, a conference or convention facility
could add between 3,500 and 9,000 room nights to the Borough’s bed tax base, depending on facility size.
The net result is an additional $17,500 to $45,000 in bed tax each year at the current bed tax rate of 5
percent (assuming an average of $100 per room per night). If the bed tax rate were increased, this return to
Borough coffers would be higher. Similarly, other infrastructure investments identified as priorities in this
report will serve to support and expand existing markets, increase overnight stays, and provide economic
return.
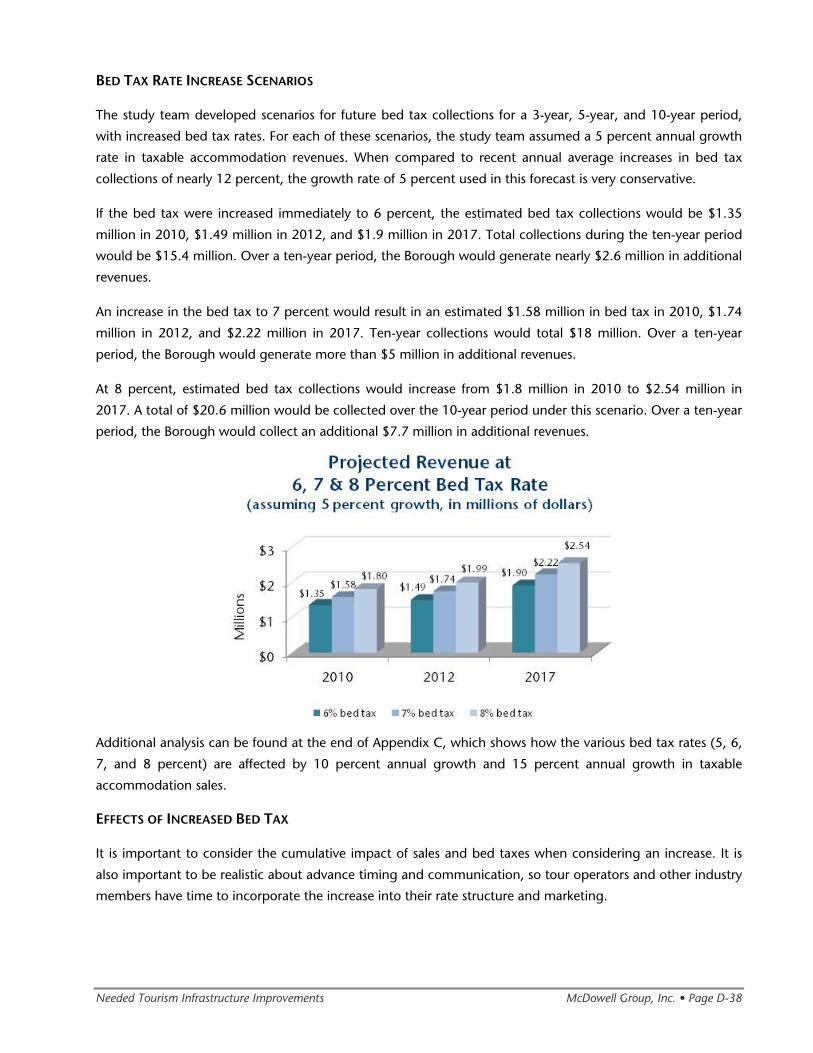
Needed Tourism Infrastructure Improvements McDowell Group, Inc. • Page D-38
BED TAX RATE INCREASE SCENARIOS
The study team developed scenarios for future bed tax collections for a 3-year, 5-year, and 10-year period,
with increased bed tax rates. For each of these scenarios, the study team assumed a 5 percent annual growth
rate in taxable accommodation revenues. When compared to recent annual average increases in bed tax
collections of nearly 12 percent, the growth rate of 5 percent used in this forecast is very conservative.
If the bed tax were increased immediately to 6 percent, the estimated bed tax collections would be $1.35
million in 2010, $1.49 million in 2012, and $1.9 million in 2017. Total collections during the ten-year period
would be $15.4 million. Over a ten-year period, the Borough would generate nearly $2.6 million in additional
revenues.
An increase in the bed tax to 7 percent would result in an estimated $1.58 million in bed tax in 2010, $1.74
million in 2012, and $2.22 million in 2017. Ten-year collections would total $18 million. Over a ten-year
period, the Borough would generate more than $5 million in additional revenues.
At 8 percent, estimated bed tax collections would increase from $1.8 million in 2010 to $2.54 million in
2017. A total of $20.6 million would be collected over the 10-year period under this scenario. Over a ten-year
period, the Borough would collect an additional $7.7 million in additional revenues.
Additional analysis can be found at the end of Appendix C, which shows how the various bed tax rates (5, 6,
7, and 8 percent) are affected by 10 percent annual growth and 15 percent annual growth in taxable
accommodation sales.
EFFECTS OF INCREASED BED TAX
It is important to consider the cumulative impact of sales and bed taxes when considering an increase. It is
also important to be realistic about advance timing and communication, so tour operators and other industry
members have time to incorporate the increase into their rate structure and marketing.
Needed Tourism Infrastructure Improvements McDowell Group, Inc. • Page D-39
Numerous Alaska communities have 6 percent and 7 percent bed taxes. While Anchorage and Fairbanks have
the highest bed tax rates at 12 percent and 8 percent respectively, neither of these communities charge sales
tax.
The study team believes that the market and residents would respond positively to a proposed increase to 6
or 7 percent—especially if the increased revenues were reinvested in infrastructure that enhanced residents’
quality of life, visitors’ experience, and local economic opportunities.
A bed tax increase to 8 percent should be approached more cautiously to ensure voter and market support.
With any rate increase, an educational campaign is recommended to communicate intended uses of the tax
collections and potential economic return to regional residents and businesses. Similarly, it will be
advantageous for local marketing organizations and businesses to be able to tie the rate increase to new
infrastructure developments that benefit various visitor markets.
PUBLIC BONDS
Funding for design and construction of convention facilities often comes from the issuance of some type of
bonds. Various bonding options may be available to the Borough, including general obligation bonds,
revenue bonds, special tax bonds, special assessment bonds, and others. These bonds are generally backed
by the issuing agency and repaid through the general fund, bed taxes, special district taxes, operating
revenue, or other fees and taxes.
While it is common for communities inside and outside of Alaska to fund the construction of the meeting
facilities through bonds, there are other approaches that may be more appropriate for Mat-Su. Additional
examples can be found in the Tourism Partnering Opportunities section.
• The Municipality of Anchorage increased its bed tax from 8 percent to 12 percent in support of the
Dena’ina Civic & Convention Center. The increased tax revenues are dedicated for debt service
associated with the bonds.
• The City of Ketchikan did not bond for the Ted Ferry Civic Center. Instead, the facility was developed
from grants and local revenues.
• Capital construction costs for the Nolan Center in Wrangell were paid for through a combination of
grants including a significant endowment from a private family, Rasmuson Foundation, USDA Rural
Development, Denali Commission, and municipal funds.
WAYS TO STRETCH BED TAX REVENUES
There are many ways to stretch bed tax dollars. These include accessing other sources of funding for
infrastructure developments, such as:
• Public Facilities District/Special Use District/Tax Reinvestment Zones, etc. – Many areas that are
contemplating the development of conference or convention facilities will implement a special zone
or district that includes the location of the proposed facility. This zone/district is generally defined as
the area that receives the most benefit from the facilities, and therefore, is taxed accordingly. These
Needed Tourism Infrastructure Improvements McDowell Group, Inc. • Page D-40
taxes are often used to service the debt on public bonds that were used to finance the construction
of the facility.
• Other Taxes – Some communities and areas will initiate other taxes to help finance construction and
maintenance of tourism and recreation facilities. These include taxes on activities, such as attractions,
ski lift tickets or tours.
• Fees and Permits – It is common practice in many states and countries to require users of
recreational facilities, such as trails and parking, to purchase use permits. These permits help defray
operating and maintenance costs of the facilities. Similarly, fees may be added to ticket prices or
concession sales to defray civic center operating costs.
• Local, State, and Federal Agencies – Government money is available for many of the infrastructure
improvements recommended in this report. Local bed tax dollars can be used to help fund the
planning work and/or provide the matching dollars needed to initiate and complete a project. A few
examples of non-bed tax funding opportunities include:
o Federal/State Departments of Transportation – Provides the majority of the funding for road
system enhancement projects.
o Alaska Department of Natural Resources – Provides funding for trail system enhancement,
State Parks, and other outdoor recreation.
o USDA Rural Development – Administers programs designed to develop essential community
facilities for public use in rural areas, some of which could be considered tourism-related
infrastructure;
o Economic Development Agency, U.S. Department of Commerce – Invests in essential public
infrastructure in distressed communities to promote long-term economic development.
o Alaska Department of Commerce, Community and Economic Development – Funds capital
projects in Alaskan communities under the Division of Community & Regional Affairs.
• Foundations/Organizations – Various foundations and organizations exist that are involved in
infrastructure development in Alaska. Examples of these include:
o Denali Commission – This federal-state partnership is designed to provide critical utilities and
infrastructure across the state, with a focus on remote communities. The Denali Commission
has provided funding for infrastructure development in many Mat-Su Borough communities and
for tourism-related infrastructure projects.
o Rasmuson Foundation – The Rasmuson Foundation strives to improve the quality of life for
Alaskans through its competitive grant-making programs. The organization funds community
projects through the Arts and Culture initiative and the Pre-Development Program, a capital
project technical assistance program in partnership with the Denali Commission, The Foraker
Group, and the Alaska Mental Health Trust Authority.
Needed Tourism Infrastructure Improvements McDowell Group, Inc. • Page D-41
o The Foraker Group, Pre-Development Program – This program provides guidance and technical
assistance for capital projects involving new construction or repair and renovation. Priority is
given to projects that have some funding in place and can demonstrate sustainability.
• Private Donors/Private Land Holders – Some infrastructure projects can and should involve private
donors or private land holders. For example, trail development projects may involve gaining
easements across private holdings, requiring the participation of the owner. The involvement of
these individuals or organizations is often a key to success for a particular project.
• Clubs/User Groups – Community clubs and user groups are also key elements to some infrastructure
development. For example, the Adopt-a-Road program, which is successful in many parts of the U.S.
and Alaska, can involve many local groups and help defer road clean-up costs. There are many trail
user groups in the Mat-Su already involved and experienced in trail development and maintenance.
Partnering with these resources will help the Borough stretch its bed tax dollars.
• Native Corporations – The Alaska Native corporation with lands in the Mat-Su Borough, Cook Inlet
Region, Inc., is already a player in the Mat-Su Borough’s tourism sector. They are investors in the
market and will continue to seek opportunities to expand or enhance their presence. Combining
their land ownership, industry knowledge and experience and ability to leverage capital funding may
provide some possibilities to enhance the Borough’s bed tax.
• Local College – The Mat-Su College has been a long-time partner with the Borough. The College
provides an opportunity to implement or expand training programs that support development of the
tourism industry workforce. In addition, as the Mat-Su College proceeds with its plans to develop a
new performance hall, the new facility could provide additional space for meetings and enhance the
cultural attractions with any new theater productions aimed at the visitor market.
The growing base of bed tax dollars allows the Mat-Su Borough new opportunities to stimulate tourism
infrastructure development. Through the above mentioned opportunities and various partnership programs,
the Borough can create unique partnerships to accomplish its goals using bed tax money as the incentive for
project and partnership development.
Focus Areas for Tourism
Improvement
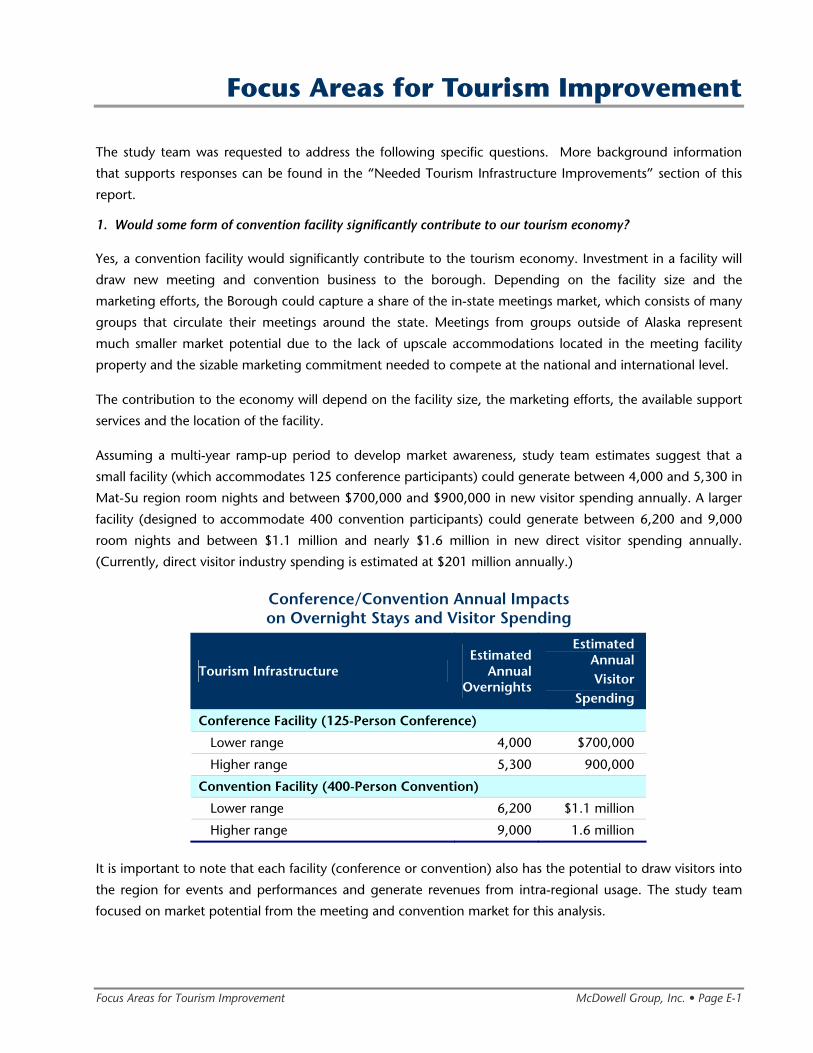
Focus Areas for Tourism Improvement McDowell Group, Inc. • Page E-1
Focus Areas for Tourism Improvement
The study team was requested to address the following specific questions. More background information
that supports responses can be found in the “Needed Tourism Infrastructure Improvements” section of this
report.
1. Would some form of convention facility significantly contribute to our tourism economy?
Yes, a convention facility would significantly contribute to the tourism economy. Investment in a facility will
draw new meeting and convention business to the borough. Depending on the facility size and the
marketing efforts, the Borough could capture a share of the in-state meetings market, which consists of many
groups that circulate their meetings around the state. Meetings from groups outside of Alaska represent
much smaller market potential due to the lack of upscale accommodations located in the meeting facility
property and the sizable marketing commitment needed to compete at the national and international level.
The contribution to the economy will depend on the facility size, the marketing efforts, the available support
services and the location of the facility.
Assuming a multi-year ramp-up period to develop market awareness, study team estimates suggest that a
small facility (which accommodates 125 conference participants) could generate between 4,000 and 5,300 in
Mat-Su region room nights and between $700,000 and $900,000 in new visitor spending annually. A larger
facility (designed to accommodate 400 convention participants) could generate between 6,200 and 9,000
room nights and between $1.1 million and nearly $1.6 million in new direct visitor spending annually.
(Currently, direct visitor industry spending is estimated at $201 million annually.)
Conference/Convention Annual Impacts on Overnight Stays and Visitor Spending
Tourism Infrastructure Estimated
AnnualOvernights
Estimated Annual Visitor
Spending
Conference Facility (125-Person Conference)
Lower range 4,000 $700,000
Higher range 5,300 900,000
Convention Facility (400-Person Convention)
Lower range 6,200 $1.1 million
Higher range 9,000 1.6 million
It is important to note that each facility (conference or convention) also has the potential to draw visitors into
the region for events and performances and generate revenues from intra-regional usage. The study team
focused on market potential from the meeting and convention market for this analysis.
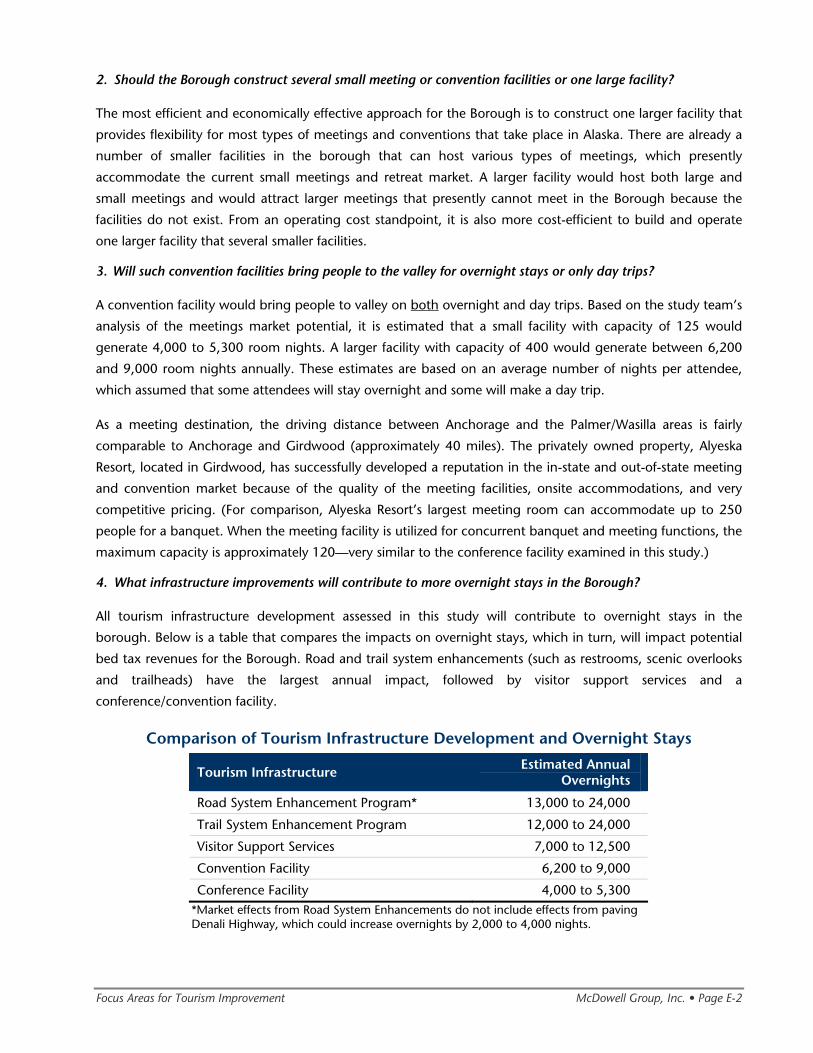
Focus Areas for Tourism Improvement McDowell Group, Inc. • Page E-2
2. Should the Borough construct several small meeting or convention facilities or one large facility?
The most efficient and economically effective approach for the Borough is to construct one larger facility that
provides flexibility for most types of meetings and conventions that take place in Alaska. There are already a
number of smaller facilities in the borough that can host various types of meetings, which presently
accommodate the current small meetings and retreat market. A larger facility would host both large and
small meetings and would attract larger meetings that presently cannot meet in the Borough because the
facilities do not exist. From an operating cost standpoint, it is also more cost-efficient to build and operate
one larger facility that several smaller facilities.
3. Will such convention facilities bring people to the valley for overnight stays or only day trips?
A convention facility would bring people to valley on both overnight and day trips. Based on the study team’s
analysis of the meetings market potential, it is estimated that a small facility with capacity of 125 would
generate 4,000 to 5,300 room nights. A larger facility with capacity of 400 would generate between 6,200
and 9,000 room nights annually. These estimates are based on an average number of nights per attendee,
which assumed that some attendees will stay overnight and some will make a day trip.
As a meeting destination, the driving distance between Anchorage and the Palmer/Wasilla areas is fairly
comparable to Anchorage and Girdwood (approximately 40 miles). The privately owned property, Alyeska
Resort, located in Girdwood, has successfully developed a reputation in the in-state and out-of-state meeting
and convention market because of the quality of the meeting facilities, onsite accommodations, and very
competitive pricing. (For comparison, Alyeska Resort’s largest meeting room can accommodate up to 250
people for a banquet. When the meeting facility is utilized for concurrent banquet and meeting functions, the
maximum capacity is approximately 120—very similar to the conference facility examined in this study.)
4. What infrastructure improvements will contribute to more overnight stays in the Borough?
All tourism infrastructure development assessed in this study will contribute to overnight stays in the
borough. Below is a table that compares the impacts on overnight stays, which in turn, will impact potential
bed tax revenues for the Borough. Road and trail system enhancements (such as restrooms, scenic overlooks
and trailheads) have the largest annual impact, followed by visitor support services and a
conference/convention facility.
Comparison of Tourism Infrastructure Development and Overnight Stays
Tourism Infrastructure Estimated Annual Overnights
Road System Enhancement Program* 13,000 to 24,000
Trail System Enhancement Program 12,000 to 24,000
Visitor Support Services 7,000 to 12,500
Convention Facility 6,200 to 9,000
Conference Facility 4,000 to 5,300 *Market effects from Road System Enhancements do not include effects from paving Denali Highway, which could increase overnights by 2,000 to 4,000 nights.
Focus Areas for Tourism Improvement McDowell Group, Inc. • Page E-3
It is also important to note that when infrastructure development concepts are examined in terms of potential
return on investment, visitor support services are elevated to the top priority due to the relatively low cost.
More discussion of prioritization is provided in Section D: Needed Tourism Infrastructure Improvements.
5. Is it economically better to locate a convention facility centrally along the road system or to attach it to some tourism/recreation attractions such as Hatcher Pass?
It is economically better to locate a convention facility centrally along the road system, preferably near the
population and service center of the borough. From a meeting planner’s perspective, the most important
considerations for location include year-round availability of rooms and professional services to attract and
support the market, such as catering, technical support, entertainment and shuttle services. It is a highly
competitive market and meeting planners desire a location that is easy to access, offers quality amenities and
services and a facility that has space for large meetings, break-out sessions, trade shows and receptions. The
primary purpose of a convention is generally to conduct business and seminars. Supplemental activities for
groups can be planned at Borough recreation areas and attractions, based on the interest of the organization.
But the facility does not need to be located in a tourism or recreation attraction area to be successful.
6. Do improved signage and restroom facilities significantly contribute to the tourism experience and economy?
Yes, both signage and restroom facilities contribute significantly to the tourism experience and economy.
Signage: General road signage includes way-finding (directional signage), gateways and entries, attractions,
amenities, billboards and marketing displays. Only a small portion of the traveling public stop at visitor
information centers; therefore, good signage is essential to help the public find their way and direct them to
places where they can spend time and money. To maximize effectiveness of the signage program, it should
be coordinated with the overall tourism marketing programs, as well as other road signage efforts, such as
the scenic byways and other state/federal programs, so as not to duplicate efforts. The signage design
concept should represent the Borough brand.
Restrooms: The number one reason people stop while traveling in the car is to use the restroom. In general,
public restrooms are in short supply for visitors, often few and far between and difficult to find. When visitors
stop to use the restroom, they will spend money if there is a place to do so and may decide to see or do
other activities, if they learn about them at the rest stop. To encourage this spending, public restroom
facilities should be located at or near areas where visitors can spend money, such as retail and activity centers.
The signage program will guide the visitors to these centers. A coordinated Borough-wide public restroom
plan, which identifies current and planned restroom facilities and future facility locations, is recommended.
This plan should address type of facilities, partnership opportunities and a timeline for completion. Such a
program should also be coordinated with signage and visitor information efforts.
7. Compared to other areas, does it make sense to increase our bed tax?
Yes, it does make sense to increase the Borough’s bed tax rate. Compared to other areas in Alaska, Mat-Su’s 5
percent bed tax rate is on the lower end, particularly when compared to Anchorage, Fairbanks, Juneau and
Ketchikan, all of which have bed tax rates of 7 percent or higher. All of these communities also have a
convention center.

Focus Areas for Tourism Improvement McDowell Group, Inc. • Page E-4
It is common practice both inside and outside of Alaska to use a portion of the bed tax to support debt
service and/or operational expenses associated with convention facilities. For example, Juneau allocates 57
percent of its 7 percent bed tax to destination marketing and 43 percent to the municipally owned
convention and civic center.
It is also common for a destination to raise the bed tax rates when contemplating new convention facilities
and to use this tax as part of the funding/financing package. Anchorage recently increased its bed tax from 8
percent to 12 percent to support the new Dena’ina Civic & Convention Center.
Tourism Partnering Opportunities
Tourism Partnering Opportunities McDowell Group, Inc. • Page F-1
Introduction
The purpose of this chapter is to examine ways that the Borough can leverage its infrastructure development
investments by partnering with other entities such as private land owners, government agencies, and non-
profit organizations.
• In the initial section, the study team discusses trends in partnering as they relate to infrastructure
development. To illustrate the extensive partnering potential for the types of projects considered in
this study (road system enhancements, trail system enhancements, visitor support services, and
convention facilities) the study team provided several partnering examples from inside and outside of
Alaska.
• In the following section, the study team identifies potential partners for each of the infrastructure
development concepts discussed in this study.
Partnering Trends
Infrastructure development for tourism is a multi-dimensional and complex task. Over the past few decades
public/private partnerships (PPPs) and various incentive programs have emerged as mechanisms to support
the development of tourism infrastructure around the world. Organizations such as the UN and the World
Bank have long worked in developing countries on tourism infrastructure projects that facilitate economic
development. In the U.S. and Canada, PPPs have become a key component in the successful development of
a variety of tourism-related infrastructure, including convention and conference facilities and public
recreation/tourism opportunities such as trails, by-ways, historic preservation, event development, etc.
Tourism development, by its nature, is a partnership between the public sector, which provides much of the
basic infrastructure and the private sector, which provides project development and enterprise. Additionally,
the public sector often initiates and stimulates private sector investment through loans, grants, incentive
programs or other support.
There is no single model that works for PPPs. Rather, partnerships between public and private entities are
structured in a variety of ways and can be as varied as the projects and organizations involved. Usually, these
partnerships are created through contractual agreements between a public agency or agencies, for-profit
corporations and/or non-profit corporations or user groups. More often than not, various investment
incentives are included in the partnership, such as:
• Financial incentives in the form of government grants or loans from its own resources, such as special
taxes, sale of revenue bonds, legislative appropriations (local, state or federal), etc.;
• Quasi-financial incentives in the form of loan guarantees, subsidies, or differential grants that bridge
the gap between official and commercial lending rates;
• Fiscal incentives, such as tax credits, enterprise zones, special districts, workforce incentive programs,
etc.;
Tourism Partnering Opportunities McDowell Group, Inc. • Page F-2
• Other incentives such as planning, management assistance, business development support or other
technical assistance.
Examples of Private/Public Partnerships
The purpose of this section is to provide examples of public and private partnerships for projects similar to the
tourism infrastructure projects identified in this paper. To the extent possible, most partnering examples are
connected to a particular type of tourism infrastructure project previously discussed.
The range for PPPs related to tourism infrastructure development and the partnership structures is extensive.
The following are just a few examples of programs or projects where the PPP concept has been used for
“brick and mortar” tourism infrastructure development, recreational enhancements, national scenic byway
development and marketing and conference/convention facilities.
Tourism Infrastructure Development Grants
Travel Montana – Tourism Infrastructure Investment Program (TIIP) – This program invests a portion of the
statewide tourism bed tax into “brick and mortar” projects through a competitive grant process. Non-profit
organizations are encouraged to apply for grant funds to assist with building, remodeling, or preserving
tourism and recreation attractions, historical sites, and artifacts. Examples of eligible organizations include
chambers of commerce, economic development corporations, community clubs, and historic preservation
organizations. The minimum grant amount that can be allocated to any one project in a fiscal year is
$20,000; the maximum amount varies with the program funding. A copy of the Montana program guidelines
is included in Appendix E.
Raleigh and Wake County, North Carolina – Occupancy and Prepared Food & Beverage Taxes – The funds
generated from these taxes provides matching grant monies for various tourism-related infrastructure
developments, including a convention center, art museum, whitewater park and aquatics facility.
Public Recreation Enhancement Projects
Massachusetts – Office of Public Private Partnerships (OPPP) – This office was created in the Executive
Office of Energy and Environmental Affairs in the State of Massachusetts. The mission of OPPP is the
following:
Our mission is to develop new models of stewardship in order to protect and sustain our natural,
cultural, historical and recreational pubic resources for future generations.
Partners may be community groups, friends groups, park advocacy groups, corporations, institutions and
dedicated individuals who work collaboratively towards the betterment of Massachusetts’ environmental,
historic and cultural resources. OPPP provides a dollar-for-dollar match for private funding partners for capital
projects on state-owned property.
National Recreational Trails Act Program (RTP) – Established in 1991, this act directs the US Secretary of
Transportation to allocate money to the states for providing and maintaining recreational trails. (The program
Tourism Partnering Opportunities McDowell Group, Inc. • Page F-3
funding comes through FHWA). At least 30 percent of the funds received by a state must be reserved for
motorized recreation projects and 30 percent reserved for non-motorized recreation. In Alaska, the
Recreational Trails Program (RTP) provides reimbursable, matching funds to develop and maintain
recreational trails and trail-related facilities for both non-motorized and motorized recreational trail uses.
(While funded through FHWA, the program is not limited to trails or trailheads located along the state
highway or right-of-ways.)
Alaska also offers the Snowmobile Trails Program, which provides reimbursable, matching grant funds for trail
easement acquisition, development and maintenance of trails and trail-related facilities for snowmobile use.
Snowmobile trail grooming activities are provided through the program’s Grooming Pool. Both the RTP and
snowmobile programs are housed in the Alaska Department of Natural Resources, Division of Parks and
Outdoor Recreation.
Alaska Trails Initiative – This Initiative is a separately funded program that provides competitive grants for
development and reconstruction of trails and related facilities in Alaska. This program is also housed in ADNR,
Division of Parks and Outdoor Recreation.
National Scenic Byways
The National Scenic Byways (NSB) program, administered by the FHWA, offers grants for the development
and marketing of designated scenic byways. The eight grant categories are briefly described below.
1. State and Tribal Programs: an activity related to the planning, design, or development of a State
scenic byway program.
2. Corridor Management Plan: development and implementation of a corridor management plan to
maintain the scenic, historical, recreational, cultural, natural, and archeological characteristics of the
byway, while providing for increased tourism and related amenities.
3. Safety Improvements: safety improvements needed to accommodate increased traffic and changes in
the types of traffic resulting from the byway designation.
4. Byway Facilities: construction of pedestrian and bicycle facilities, rest areas, turnouts, highway
shoulder improvements, overlooks, or interpretive facilities.
5. Access to Recreation: enhanced access to recreational resources such as trailheads.
6. Resource Protection: protection of scenic, historical, recreational, cultural, natural, and archeological
resources adjacent to a byway.
7. Interpretive Information: development of tourist information including interpretive information about
the byway.
8. Marketing Program: development and implementation of byway marketing programs.
The Glenn Highway National Scenic Byways Association has received grant money from the NSB program,
dispersed through Alaska DOT&PF, for an interpretive plan, a marketing plan and a public relations plan. The
Mat-Su Borough has provided some matching money to these grants through the MSB Tourism
Infrastructure Grant Program. There is significantly more potential for further byway enhancements.
Tourism Partnering Opportunities McDowell Group, Inc. • Page F-4
Convention/Conference Facilities
Convention and conference facilities are financially structured in many different ways. There is no single
model that fits all situations. Some facilities are developed through traditional methods, such as public bonds
and tax initiatives, while other developments are made possible through public/public and public/private
partnerships. The following is a sampling of a few different types of conference facilities and how they were
financially structured.
Midwest Airlines Center, Milwaukee, Wisconsin – This project was a three-way partnership between the
City, County and State. The Governor signed a bill creating a countywide special purpose district with powers
of taxation on rooms, restaurants and rental cars. This tax backed up the special district’s debt. The City of
Milwaukee turned over all room tax and gave property to the special district. In addition, the City built
companion developments, such as the $9.6 million, 10-block river-walk. The County, via the special district,
increased the county-wide room tax and implemented a new county-wide tax on restaurants and rental cars.
The special district built, owns and operates the new Center. In addition, naming rights were sold to Midwest
Airlines for 15 years, with a renewal option for another five years.
Meydenbauer Center, Bellevue, WA – This is good example of a fairly traditional model for building a
conference center. A total of $29.3 million in special obligation bonds backed by the City of Bellevue were
used to construct this center. The center is self-supporting through revenue generated by users for rent,
catering and other meeting services and the transient occupancy tax. The operating budget is approximately
$6 million, 80 percent of which is covered by revenue generated and 20 percent by transient occupancy
taxes (bed tax). The occupancy tax also covers the payment of the debt for facility construction and land
costs.
McIntyre Hall, Mt. Vernon, WA – This conference and performing arts center was developed through a
partnership between the public facilities district and the Skagit Valley College. The conference center and
grand lobby can be arranged for a variety of meeting and banquet configurations for groups as small as 75
and as large as 300. Free parking and break-out rooms are located in the adjacent Skagit Valley College. The
project is owned by the public facilities district and governed by a board of directors. Funding for the design
and construction of the $17.1 million facility was identified from various sources, with 75 percent of the
funding from public sources and 25 percent raised from the community. (Public funding came from the City
of Burlington, City of Mt. Vernon, and the Skagit Valley Public Facilities District. Private funding was donated
from local businesses including hotels, banks, and other businesses.) Earned revenues, bed taxes from
Burlington and Mt. Vernon, funding from the public facilities district and support from community businesses
and organizations support the operating budget.
Salem Conference Center, Salem, OR – The Salem Conference Center was developed through a partnership
between the City of Salem and a private developer. The Urban Renewal Agency (URA) in Salem built and
owns the $28 million conference center, parking and restaurant. The developer built and owns the adjacent
hotel. The developer operates the conference center under a management contract. The project was funded
through Urban Renewal bonds, repaid with tax increment funds generated within the renewal district, plus a
loan from US Housing and Urban Development, repaid with proceeds from previous loans from riverfront-
downtown urban renewal program and community development block grant program. The developer was
Tourism Partnering Opportunities McDowell Group, Inc. • Page F-5
paid a negotiated flat fee to oversee the construction of both the hotel and conference center. The developer
operates the center under a management agreement and the agreement between the developer and the
Urban Renewal Agency calls for allocation of any net profits between the two organizations.
City Conference Center, San Marcos, TX – Another public/private partnership example is the City
Conference Center in San Marcos, Texas. The City of San Marcos entered into a partnership with a developer
to develop the hotel and $23 million City Conference Center. They sold a combination of tax and revenue
certificates of obligation to finance construction, guaranteed by the city and repaid through tax revenues
generated through a Tax Increment Reinvestment Zone. These taxes cover 70 percent of the construction
cost. The developer leases and operates the conference center under a management contract. The lease
agreement from the developer covers the remaining 30 percent of the construction costs. The city also
funded various infrastructure improvements to the hotel and conference center site including road
improvements and expansion and the extension of electrical services.
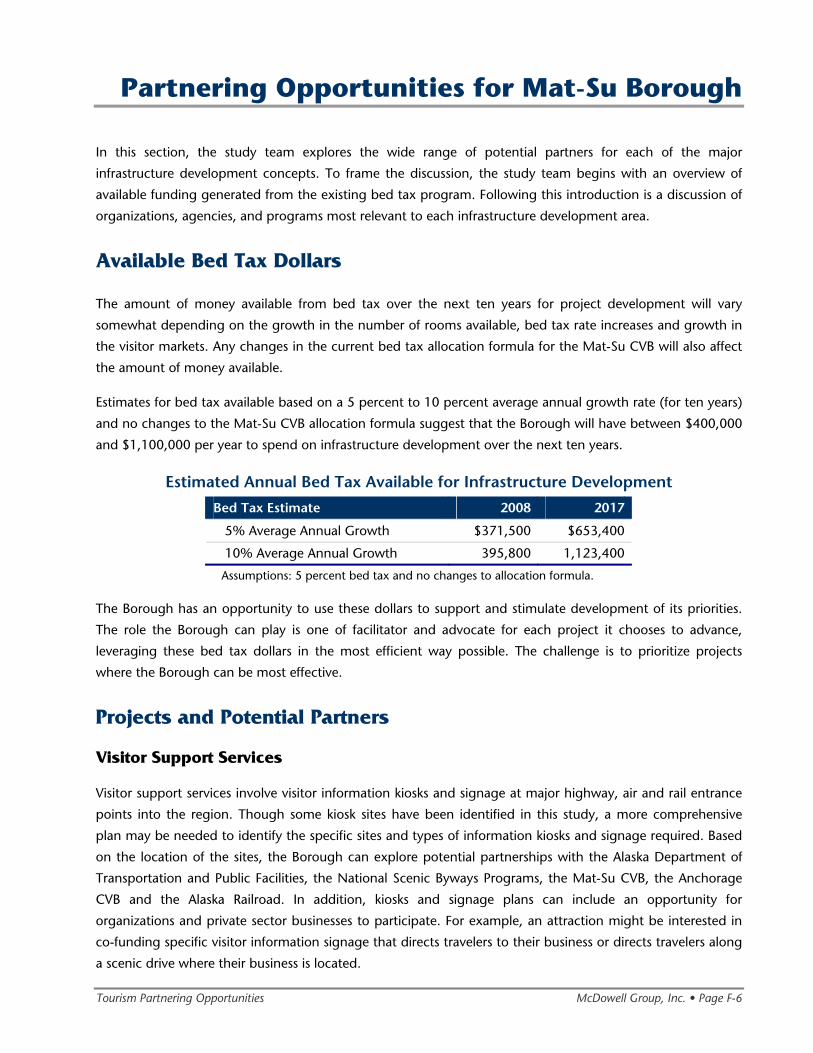
Tourism Partnering Opportunities McDowell Group, Inc. • Page F-6
Partnering Opportunities for Mat-Su Borough
In this section, the study team explores the wide range of potential partners for each of the major
infrastructure development concepts. To frame the discussion, the study team begins with an overview of
available funding generated from the existing bed tax program. Following this introduction is a discussion of
organizations, agencies, and programs most relevant to each infrastructure development area.
Available Bed Tax Dollars
The amount of money available from bed tax over the next ten years for project development will vary
somewhat depending on the growth in the number of rooms available, bed tax rate increases and growth in
the visitor markets. Any changes in the current bed tax allocation formula for the Mat-Su CVB will also affect
the amount of money available.
Estimates for bed tax available based on a 5 percent to 10 percent average annual growth rate (for ten years)
and no changes to the Mat-Su CVB allocation formula suggest that the Borough will have between $400,000
and $1,100,000 per year to spend on infrastructure development over the next ten years.
Estimated Annual Bed Tax Available for Infrastructure Development
Bed Tax Estimate 2008 2017
5% Average Annual Growth $371,500 $653,400
10% Average Annual Growth 395,800 1,123,400
Assumptions: 5 percent bed tax and no changes to allocation formula.
The Borough has an opportunity to use these dollars to support and stimulate development of its priorities.
The role the Borough can play is one of facilitator and advocate for each project it chooses to advance,
leveraging these bed tax dollars in the most efficient way possible. The challenge is to prioritize projects
where the Borough can be most effective.
Projects and Potential Partners
Visitor Support Services
Visitor support services involve visitor information kiosks and signage at major highway, air and rail entrance
points into the region. Though some kiosk sites have been identified in this study, a more comprehensive
plan may be needed to identify the specific sites and types of information kiosks and signage required. Based
on the location of the sites, the Borough can explore potential partnerships with the Alaska Department of
Transportation and Public Facilities, the National Scenic Byways Programs, the Mat-Su CVB, the Anchorage
CVB and the Alaska Railroad. In addition, kiosks and signage plans can include an opportunity for
organizations and private sector businesses to participate. For example, an attraction might be interested in
co-funding specific visitor information signage that directs travelers to their business or directs travelers along
a scenic drive where their business is located.
Tourism Partnering Opportunities McDowell Group, Inc. • Page F-7
Trail System Enhancements
Investment in the regional trail system can attract new visitor markets, increase visitors’ length of stay, and
increase regional spending. The study team identified a number of trail system enhancements (including
signage, trailheads, restrooms, and ongoing maintenance) as a priority tourism infrastructure need.
Partnerships for trail development and maintenance have been used for many years throughout the U.S. and
Alaska is no exception. The study team recommends that the Borough play a leadership role in the facilitation
of trail system enhancements and developments.
In addition to the specific trail system enhancements identified in the Needed Tourism Infrastructure
Improvements section, the study team also recommends that the Matanuska Susitna Borough Trails Plan be
updated to identify future needs such as construction, mapping, and system planning. The Borough is likely
to find support among the identified partners for financial support, staff support, and technical assistance. A
revised plan should inventory and map all trails, address individual trail system projects needs, (such as
mapping, parking, signage, trail building, maintenance), prioritize those projects and identify the potential
partners and funding sources specific to each project. (The existing Borough Trails Plan primarily addresses
significant trails in the region, the importance of establishing legal trail right-of-ways and easements, and on a
limited basis, the maintenance and funding of trails.)
POTENTIAL PARTNERS FOR TRAIL SYSTEM ENHANCEMENTS
Many partnership and funding opportunities exist to address current and future trail system enhancements in
the Borough. Partner groups for each project area may be composed of different entities, depending on the
area, the type of trail activity, landowners, and the nature of the requested support. Potential partners
include:
• Federal Agencies – Several federal agencies have been involved in trail development partnerships in
Alaska including:
o National Park Service
o Bureau of Land Management
o USDA
o USDA Forest Service
• State Agencies – The following State of Alaska agencies are often involved in trails projects as
partners:
o Alaska Department of Natural Resource, Division of State Parks
o Alaska Department of Fish and Game, Sport Fish Division
o Alaska Department of Natural Resources, Land Division
o Alaska Department of Transportation & Public Facilities
o Alaska Department of Community and Economic Development
• Local governments in Mat-Su – Local governments in the borough can and should participate in
trail projects that use their lands, through funding and maintenance partnerships.
• User Groups – Many different user groups can provide both technical assistance and sources of
funding or in-kind services for trail planning, development, and ongoing operations and
Tourism Partnering Opportunities McDowell Group, Inc. • Page F-8
maintenance. Some groups (such as the Mat-Su Trails Council, Inc.) are quite active, meeting
regularly and applying for grant funding for specific projects. Potential partnering organizations
include:
o Mat-Su Trails Council, Inc.
o Alaska State Snowmobile Association
o Curry Ridge Riders
o Mountain Bikers and Hikers
o Iditarod National Historic Trail, Inc.
o Denali Nordic Ski Club
o Mat-Su Ski Club
o Lake Louise Snowmobile Club
o Mat-Su Motor Mushers
o Alaska Sled Dog Racing Association
o Alaska Dog Mushers Association
o Alaska Mountain & Wilderness Huts Association
o Anchorage snowmobiling clubs
o Anchorage cross-country ski clubs
• Private Land Owners – Private land owners need to be involved in any partnerships that include
gaining easements across privately held land.
• Businesses – Business involvement can come from businesses that are near proposed trail areas and
can be in the form of funding or in-kind services. In some places in the borough, private lodge
owners who rely on the trail system for the client’s recreation will often set snowmobile trails and
provide signage on existing trail systems, or set cross-country ski track for skiers.
• Native Corporations – Native corporations can play a role in partnerships for trail development,
particularly if proposed trail easements cross Native landholdings. Native corporations within the
Mat-Su Borough include Ahtna Inc. (eastern and northeast portion of Borough) and Cook Inlet
Region, Inc.
In addition to the above potential partners and funding sources there are other opportunities for trail
partnerships that could be explored. These include examples from other regions such as:
• Agri-Tourism Trail – This project in Alabama is a partnership between the Alabama Cooperative
Extension, Alabama Bureau of Tourism and Travel, Alabama Department of Agriculture and Industries
and Alabama Farmers Federation. The concept is to provide a trail system of attractions related to
agriculture for visitors to experience the heritage and culture of the local area. In this case, the Agri-
Tourism Trail involves visiting areas in Alabama by car. With Mat-Su’s farming heritage, there is an
opportunity to create a Mat-Su Agri-Tourism Trail through some of the farming areas. Partners could
include Alaska Cooperative Extension, Alaska Farm Bureau – Mat-Su Chapter and other related
agencies, organizations and businesses.
• Sno-Park Permit Program – Sno-Park Permit programs are found in several states in the Lower 48.
Sno-Parks are trailhead areas for motorized and non-motorized recreation in the winter months. Sno-
Tourism Partnering Opportunities McDowell Group, Inc. • Page F-9
Park users purchase permits to park and use the trails. For example, in Washington there are Sno-Park
permits for areas with ungroomed and groomed trails for cross-country skiers. Snowmobilers can also
purchase Sno-Park permits for motorized trail areas. Washington has 50 Sno-Parks in the state. In
addition, Oregon and Idaho also have Sno-Park programs and accept Washington permits, and vice-
versa. Proceeds from Sno-Park permit sales are used to maintain and improve non-motorized Sno-
Park facilities. The proceeds pay for snow removal, sanitation facilities, trail grooming, trail signs,
mapping, parking lot construction, education, enforcement and Sno-Park program administration.
There has been some interest in Alaska in starting a similar program. The concept may be worth
pursuing in the borough, given the popularity of winter trail recreation.
POTENTIAL PARTNERS FOR TRAIL SYSTEM PLANNING
Future updates to the Mat-Su Borough Trail Plan will be an important component in the coordination of the
vast trail systems found within the borough. (It is important to note that some grants and partnerships may
require the enhancement to be identified in a current planning document.) Established funding and technical
assistance programs that can assist with the development and implementation of trail plans include:
• Rivers, Trails and Conservation Assistance Program – National Park Service - Through its Rivers,
Trails and Conservation Assistance Program (RTCA), the National Park Service provides technical
assistance to local, state and federal agencies and community groups for trail development,
preserving open space and conserving rivers.
• Alaska State Trails Program – This program is housed in the Alaska Department of Natural
Resources, Division of Parks and Outdoor Recreation. The program oversees the state and federal
funding assistance available for trail development programs. In the past, the Mat-Su Borough has
applied for grant funding in some of these programs.
o Recreational Trails Program (RTP) – This program administered by the Federal Highway
Administration, provides funding assistance to states to develop and maintain recreational trails
for both motorized and non-motorized uses. In FY 2008, Alaska received approximately $1.2
million from this program. Grants are submitted to the program and reviewed by the Outdoor
Recreation and Trails Advisory Board (ORTAB) who then makes recommendations for funding to
the State. The Mat-Su Trails Council was recently awarded $50,000 to purchase a mini-excavator
with boom attached flail mower to maintain and rehabilitate trails in the Borough.
o Snowmobile Trails Program – This program provides matching grant funds for trail easement
acquisition, development and maintenance of trails for trail-related facilities and snowmobile use.
The Snowmobile Trails Advisory Committee (SnowTRAC) is responsible for reviewing grant
applications and recommending funding for the program.
o Alaska Trails Initiative – This is a state grant program that was established to support the
development of trails but currently has no funding.
Road System Enhancements
The study team identified a number of specific locations that warrant development or upgrade of restrooms
as well as enhanced interpretive signage and other rest area amenities like picnic tables and telescopes.
Furthermore, the team recommended an ongoing and systemic approach to these enhancements, as this has
Tourism Partnering Opportunities McDowell Group, Inc. • Page F-10
greater potential to increase visitation than development of single or isolated facilities. Typical partners in
highway projects include the State of Alaska, Department of Transportation and Public Facilities (AKDOT) and
the Federal Highway Administration. To facilitate the future working relationship, the Borough should
develop a Memorandum of Understanding with local, state, and regional governments and agencies that
would be involved in road system enhancement projects.
Other partners that can be included in road system enhancement programs include other federal and state
agencies, municipalities, Native groups, historical societies, user groups or clubs, private businesses, shopping
districts, private land owners and other partners that receive some benefit from the projects.
GLENN HIGHWAY NATIONAL SCENIC BYWAY DEVELOPMENT
An interpretive plan has been completed for the proposed development of interpretive sites and services
along this National Scenic Byway. Each proposed project has been prioritized by phases and potential
partnerships have been identified.
Additionally, the Byway program is an ideal resource for planning, constructing, and maintaining road system
enhancements like trailheads, restrooms and rest areas, scenic overlooks, interpretive facilities and signage,
and safety enhancements.
The Byway program can fund up to 80 percent of a project cost. Additional partners may include:
• Federal agencies – Federal Highways Administration Scenic Byways, U.S. Army
• State agencies – Alaska State Parks, Alaska Department of Fish and Game, Alaska Department of
Transportation & Public Facilities, Alaska State Troopers
• Mat-Su Borough
• Municipality of Anchorage
• Native groups – Chickaloon Village Traditional Council
• Historical Societies – Alpine Historical Society, Palmer Historical Society
• User groups/clubs – Anchorage Ski Club, Alpenglow at Arctic Valley Ski Area, Audubon Society, Mat-
Su Birders, snowmobile and ATV groups
• Private businesses – King Mountain Lodge, Lifetime Adventures, Grand View Café and RV Park, Sheep
Mountain Lodge, Eureka Lodge, Slide Mountain Cabins and RV Park
• Private land owners
• Other – Glacier View Elementary School
In the future, the Mat-Su Borough can be instrumental in the development of the infrastructure projects
identified in the interpretive plan by working with the Glenn Highway committee to initiate site-specific
interpretive projects through the tourism infrastructure grant program.
PARKS HIGHWAY STATE SCENIC BYWAY DEVELOPMENT
This byway is in the early stages of development. The Parks Highway planning team is in the process of
developing a Corridor Partnership Plan for the section of highway between Mile 132 (southern boundary of
Denali State Park) and Mile 248 (Healy), which will allow public and non-profit entities to apply for grant
Tourism Partnering Opportunities McDowell Group, Inc. • Page F-11
funding for byway improvements. If successful, the process will lead to the designation as a National Scenic
Byway or All American Road.
As mentioned in the prior section, the Byway program is an ideal resource for planning, constructing, and
maintaining road system enhancements like trailheads, restrooms and rest areas, scenic overlooks, interpretive
facilities and signage, and safety enhancements. Based on other scenic byway projects, it is likely to be three
to five years before the completion of an interpretive plan, where specific projects and partners will be
identified. In the meantime, the Borough should continue active participation in the planning phases.
ROAD SYSTEM ENHANCEMENT PLANNING
After addressing the immediate needs, the Borough should develop a regional road system enhancement
plan. Waysides, public restrooms and road signage are inter-related and projects may overlap into each of
these areas. Through the development of an area-wide wayside, restroom and signage plan, partners specific
to each project can be identified. For example, some projects may be part of one of the Scenic Byways
projects. In other areas, the partnership may be between a state or federal agency and the Borough. Other
projects may involve a private sector business or Native corporation.
Meeting Facilities
The study team determined that development of a conference or convention facility has the potential to
increase visitation and spending—especially in the fall and winter months. The Borough can provide
important leadership in developing a comprehensive feasibility study to determine the optimal facility size,
location and funding package.
Additionally, the Borough can explore partnerships that can reduce the initial capital construction costs and
ongoing operating and maintenance costs associated with these types of facilities. For example, contributing
a parcel of land (or the proceeds from an alternative parcel) is often an important first step when meeting
local match requirements for grant funds.
A variety of partnerships have been used in other regions of Alaska and the U.S. to develop conference and
convention facilities. The following opportunities for a Mat-Su Conference/Convention Facility represent a
likely list of candidates for partnerships, depending on facility location and its component features:
• Municipal Governments – The participation in a conference or convention facility by a municipal
government will largely depend on facility location. This study recommends the facility be located
close to lodging facilities and other services; therefore, the facility may be in the Wasilla/Palmer area.
If this is the case, both these municipalities stand to reap the benefits of the business generated by
these facilities and; therefore, should be partners in its development. This partnership could take
various forms, including contributing direct funding, providing the site for development and/or other
contributions.
• USDA Rural Development – The Community Programs, a division of the Housing and Community
Facilities Programs of the U.S. Department of Agriculture’s Rural Development, focuses on essential
infrastructure. Some of this infrastructure can be considered tourism-related, including community
centers that also function as conference sites.
Tourism Partnering Opportunities McDowell Group, Inc. • Page F-12
• Denali Commission – This federal-state partnership is designed to provide critical utilities and
infrastructure across the state. Although the Denali Commission has a focus on remote communities,
it has funded tourism-related infrastructure in both rural and urban centers.
• Rasmuson Foundation – If the conference/convention center includes a component that supports
arts and cultural events, then the Rasmuson Foundation could be a natural partner through their Arts
and Culture Initiative. In addition, the Rasmuson Foundation is a partner in the Pre-Development
program, which provides technical assistance for capital project planning.
• The Foraker Group, Pre-Development Program – This program is a joint agreement between the
Denali Commission, the Foraker Group, Rasmuson Foundation and the Alaska Mental Health Trust
Authority to assist organizations to plan for successful capital projects.
Funding for design and construction for these types of facilities generally comes from the issuance of some
type of bonds. Various bonding options may be available to the Borough, including general obligation bonds,
revenue bonds, special tax bonds, special assessment bonds and others. These bonds are generally backed by
the issuing agency and repaid through taxes, fees and/or operating revenues. Depending on the location of
the facilities and structure of the funding package, the Borough may or may not be the agency involved in
the bonding process. Options for bond repayment include general fund, bed taxes, special district taxes,
operating revenue, or other fees and/or taxes. Further study is needed to determine the best funding and
repayment approach for the facility.

Appendices
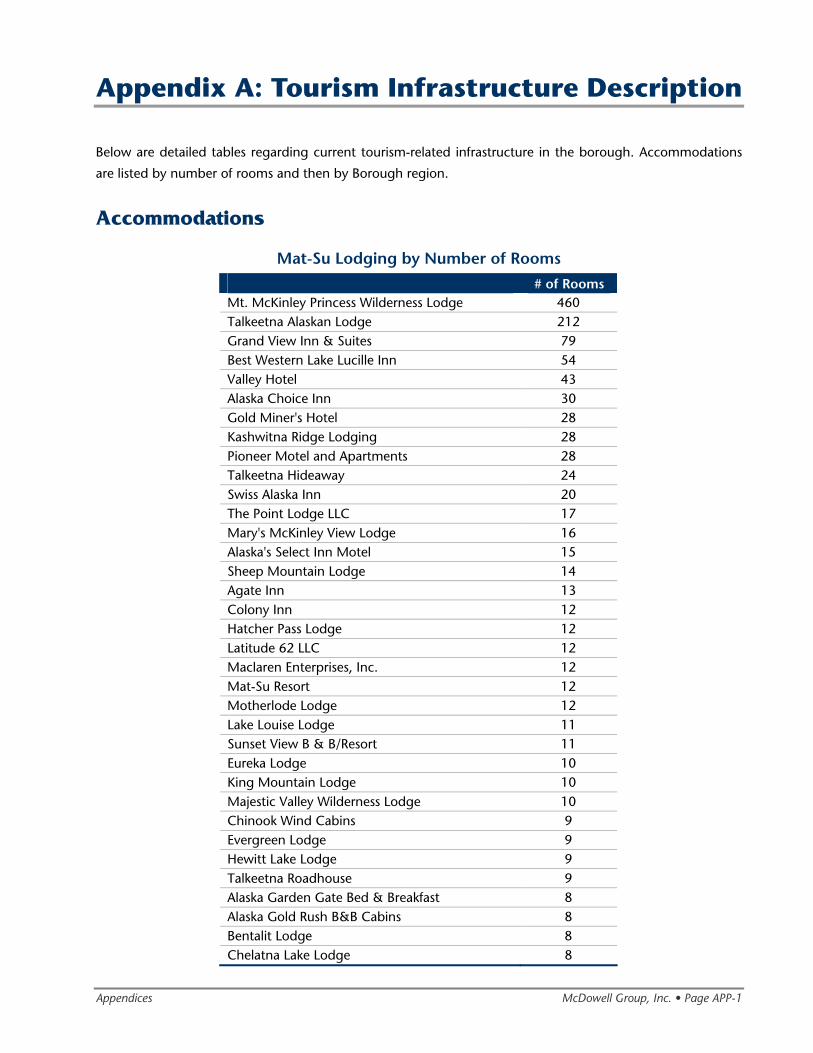
Appendices McDowell Group, Inc. • Page APP-1
Appendix A: Tourism Infrastructure Description
Below are detailed tables regarding current tourism-related infrastructure in the borough. Accommodations
are listed by number of rooms and then by Borough region.
Accommodations
Mat-Su Lodging by Number of Rooms
# of Rooms Mt. McKinley Princess Wilderness Lodge 460 Talkeetna Alaskan Lodge 212 Grand View Inn & Suites 79 Best Western Lake Lucille Inn 54 Valley Hotel 43 Alaska Choice Inn 30 Gold Miner's Hotel 28 Kashwitna Ridge Lodging 28 Pioneer Motel and Apartments 28 Talkeetna Hideaway 24 Swiss Alaska Inn 20 The Point Lodge LLC 17 Mary's McKinley View Lodge 16 Alaska's Select Inn Motel 15 Sheep Mountain Lodge 14 Agate Inn 13 Colony Inn 12 Hatcher Pass Lodge 12 Latitude 62 LLC 12 Maclaren Enterprises, Inc. 12 Mat-Su Resort 12 Motherlode Lodge 12 Lake Louise Lodge 11 Sunset View B & B/Resort 11 Eureka Lodge 10 King Mountain Lodge 10 Majestic Valley Wilderness Lodge 10 Chinook Wind Cabins 9 Evergreen Lodge 9 Hewitt Lake Lodge 9 Talkeetna Roadhouse 9 Alaska Garden Gate Bed & Breakfast 8 Alaska Gold Rush B&B Cabins 8 Bentalit Lodge 8 Chelatna Lake Lodge 8
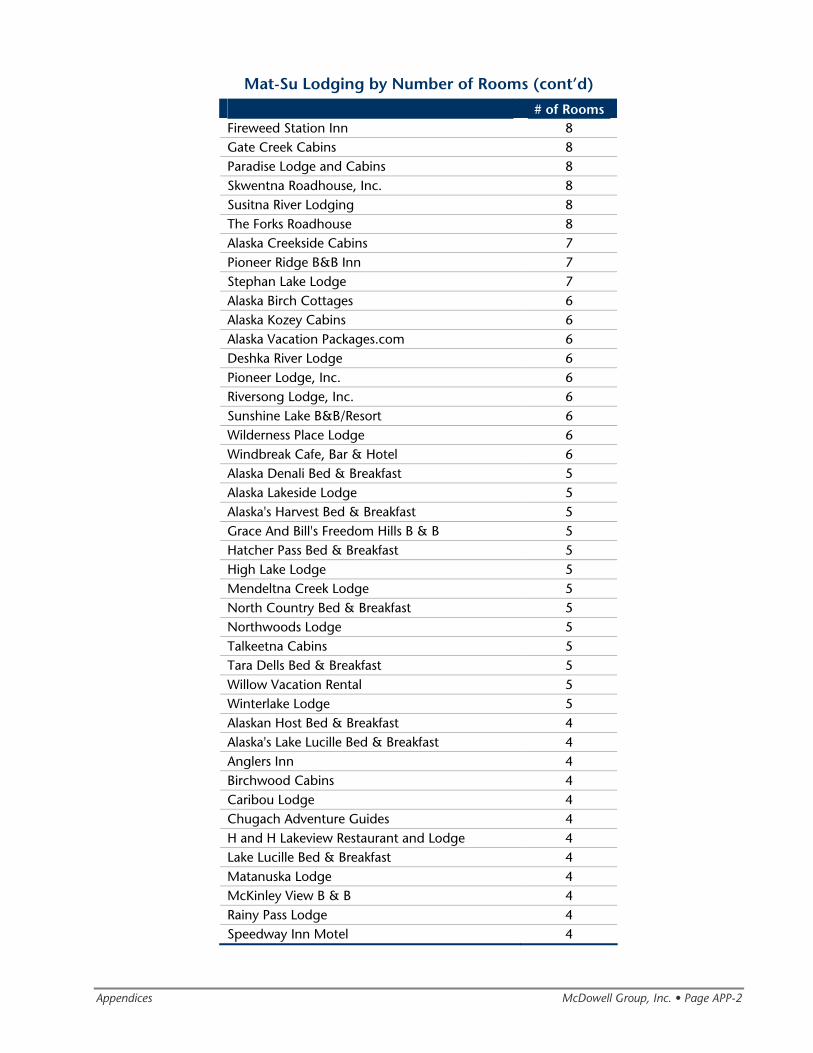
Appendices McDowell Group, Inc. • Page APP-2
Mat-Su Lodging by Number of Rooms (cont’d)
# of Rooms Fireweed Station Inn 8 Gate Creek Cabins 8 Paradise Lodge and Cabins 8 Skwentna Roadhouse, Inc. 8 Susitna River Lodging 8 The Forks Roadhouse 8 Alaska Creekside Cabins 7 Pioneer Ridge B&B Inn 7 Stephan Lake Lodge 7 Alaska Birch Cottages 6 Alaska Kozey Cabins 6 Alaska Vacation Packages.com 6 Deshka River Lodge 6 Pioneer Lodge, Inc. 6 Riversong Lodge, Inc. 6 Sunshine Lake B&B/Resort 6 Wilderness Place Lodge 6 Windbreak Cafe, Bar & Hotel 6 Alaska Denali Bed & Breakfast 5 Alaska Lakeside Lodge 5 Alaska's Harvest Bed & Breakfast 5 Grace And Bill's Freedom Hills B & B 5 Hatcher Pass Bed & Breakfast 5 High Lake Lodge 5 Mendeltna Creek Lodge 5 North Country Bed & Breakfast 5 Northwoods Lodge 5 Talkeetna Cabins 5 Tara Dells Bed & Breakfast 5 Willow Vacation Rental 5 Winterlake Lodge 5 Alaskan Host Bed & Breakfast 4 Alaska's Lake Lucille Bed & Breakfast 4 Anglers Inn 4 Birchwood Cabins 4 Caribou Lodge 4 Chugach Adventure Guides 4 H and H Lakeview Restaurant and Lodge 4 Lake Lucille Bed & Breakfast 4 Matanuska Lodge 4 McKinley View B & B 4 Rainy Pass Lodge 4 Speedway Inn Motel 4
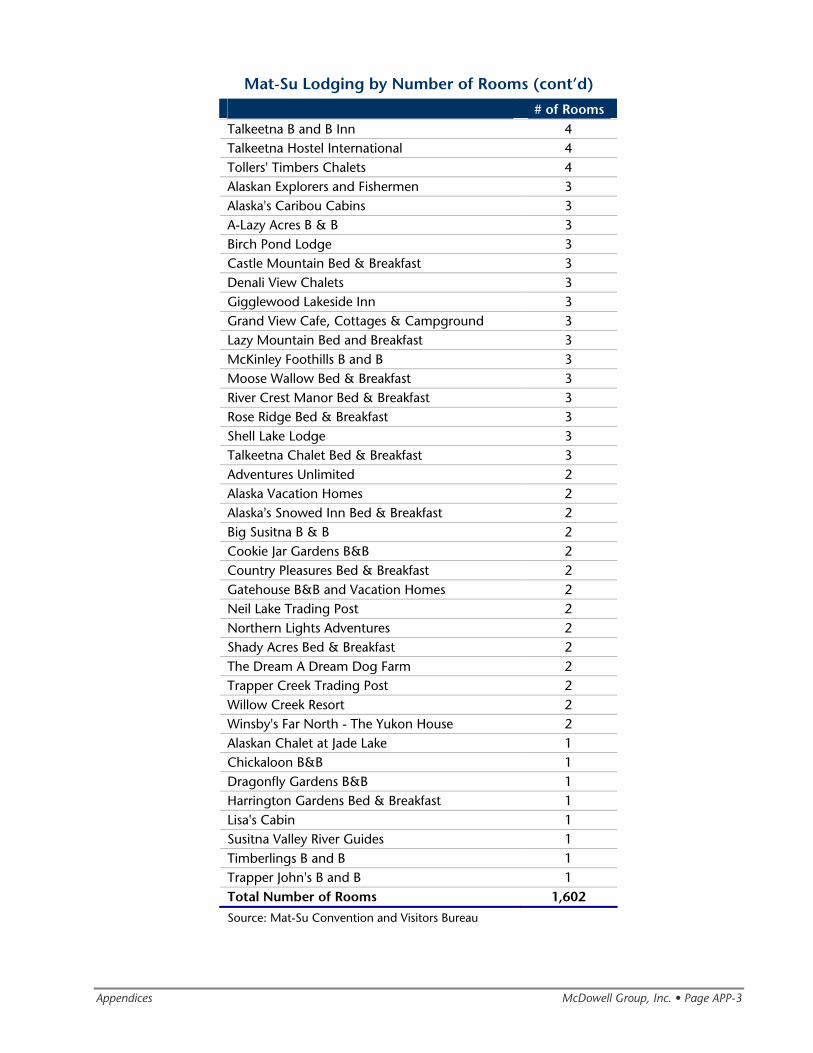
Appendices McDowell Group, Inc. • Page APP-3
Mat-Su Lodging by Number of Rooms (cont’d)
# of Rooms Talkeetna B and B Inn 4 Talkeetna Hostel International 4 Tollers' Timbers Chalets 4 Alaskan Explorers and Fishermen 3 Alaska's Caribou Cabins 3 A-Lazy Acres B & B 3 Birch Pond Lodge 3 Castle Mountain Bed & Breakfast 3 Denali View Chalets 3 Gigglewood Lakeside Inn 3 Grand View Cafe, Cottages & Campground 3 Lazy Mountain Bed and Breakfast 3 McKinley Foothills B and B 3 Moose Wallow Bed & Breakfast 3 River Crest Manor Bed & Breakfast 3 Rose Ridge Bed & Breakfast 3 Shell Lake Lodge 3 Talkeetna Chalet Bed & Breakfast 3 Adventures Unlimited 2 Alaska Vacation Homes 2 Alaska's Snowed Inn Bed & Breakfast 2 Big Susitna B & B 2 Cookie Jar Gardens B&B 2 Country Pleasures Bed & Breakfast 2 Gatehouse B&B and Vacation Homes 2 Neil Lake Trading Post 2 Northern Lights Adventures 2 Shady Acres Bed & Breakfast 2 The Dream A Dream Dog Farm 2 Trapper Creek Trading Post 2 Willow Creek Resort 2 Winsby's Far North - The Yukon House 2 Alaskan Chalet at Jade Lake 1 Chickaloon B&B 1 Dragonfly Gardens B&B 1 Harrington Gardens Bed & Breakfast 1 Lisa's Cabin 1 Susitna Valley River Guides 1 Timberlings B and B 1 Trapper John's B and B 1 Total Number of Rooms 1,602
Source: Mat-Su Convention and Visitors Bureau
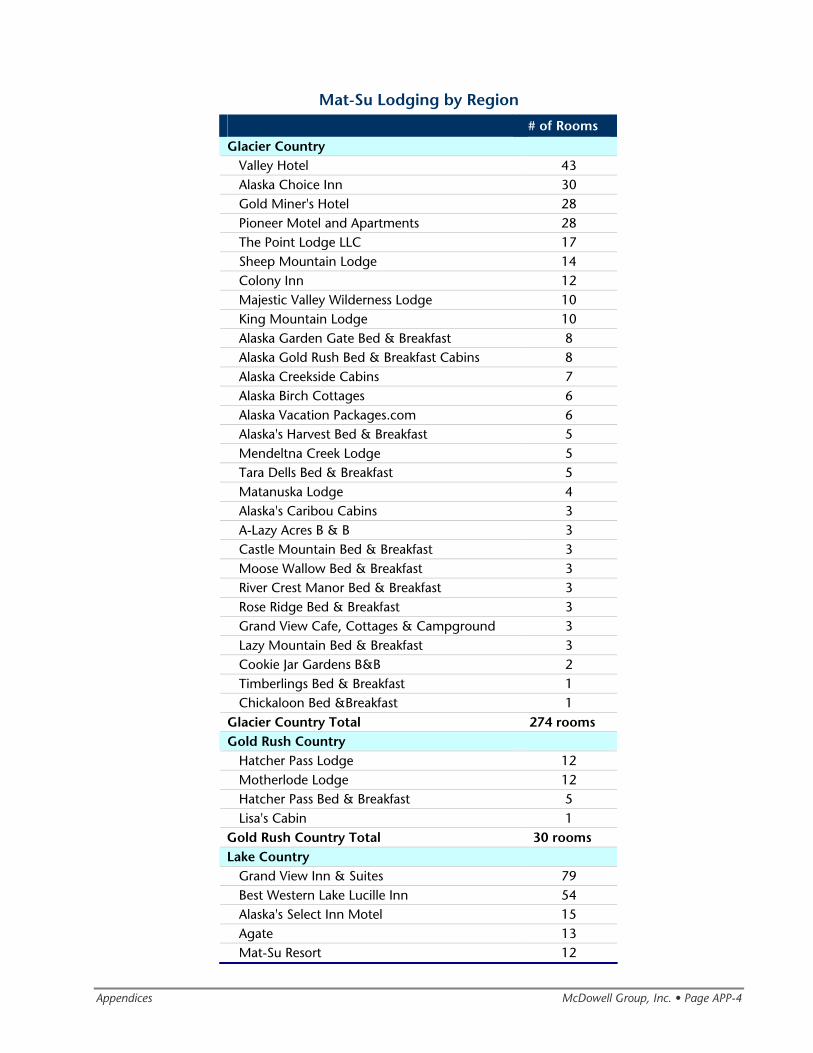
Appendices McDowell Group, Inc. • Page APP-4
Mat-Su Lodging by Region
# of Rooms
Glacier Country Valley Hotel 43 Alaska Choice Inn 30 Gold Miner's Hotel 28 Pioneer Motel and Apartments 28 The Point Lodge LLC 17 Sheep Mountain Lodge 14 Colony Inn 12 Majestic Valley Wilderness Lodge 10 King Mountain Lodge 10 Alaska Garden Gate Bed & Breakfast 8 Alaska Gold Rush Bed & Breakfast Cabins 8 Alaska Creekside Cabins 7 Alaska Birch Cottages 6 Alaska Vacation Packages.com 6 Alaska's Harvest Bed & Breakfast 5 Mendeltna Creek Lodge 5 Tara Dells Bed & Breakfast 5 Matanuska Lodge 4 Alaska's Caribou Cabins 3 A-Lazy Acres B & B 3 Castle Mountain Bed & Breakfast 3 Moose Wallow Bed & Breakfast 3 River Crest Manor Bed & Breakfast 3 Rose Ridge Bed & Breakfast 3 Grand View Cafe, Cottages & Campground 3 Lazy Mountain Bed & Breakfast 3 Cookie Jar Gardens B&B 2 Timberlings Bed & Breakfast 1 Chickaloon Bed &Breakfast 1
Glacier Country Total 274 rooms Gold Rush Country
Hatcher Pass Lodge 12 Motherlode Lodge 12 Hatcher Pass Bed & Breakfast 5 Lisa's Cabin 1
Gold Rush Country Total 30 rooms Lake Country
Grand View Inn & Suites 79 Best Western Lake Lucille Inn 54 Alaska's Select Inn Motel 15 Agate 13 Mat-Su Resort 12
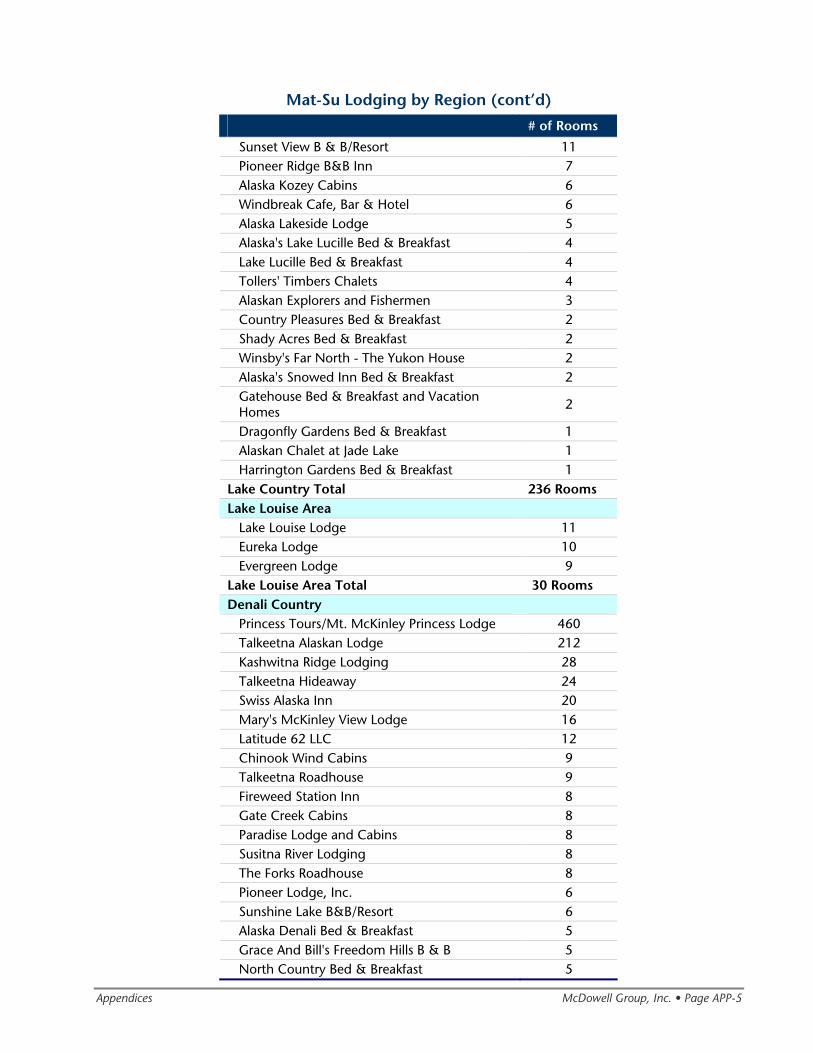
Appendices McDowell Group, Inc. • Page APP-5
Mat-Su Lodging by Region (cont’d)
# of Rooms
Sunset View B & B/Resort 11 Pioneer Ridge B&B Inn 7 Alaska Kozey Cabins 6 Windbreak Cafe, Bar & Hotel 6 Alaska Lakeside Lodge 5 Alaska's Lake Lucille Bed & Breakfast 4 Lake Lucille Bed & Breakfast 4 Tollers' Timbers Chalets 4 Alaskan Explorers and Fishermen 3 Country Pleasures Bed & Breakfast 2 Shady Acres Bed & Breakfast 2 Winsby's Far North - The Yukon House 2 Alaska's Snowed Inn Bed & Breakfast 2 Gatehouse Bed & Breakfast and Vacation Homes
2
Dragonfly Gardens Bed & Breakfast 1 Alaskan Chalet at Jade Lake 1 Harrington Gardens Bed & Breakfast 1
Lake Country Total 236 Rooms Lake Louise Area
Lake Louise Lodge 11 Eureka Lodge 10 Evergreen Lodge 9
Lake Louise Area Total 30 Rooms Denali Country
Princess Tours/Mt. McKinley Princess Lodge 460 Talkeetna Alaskan Lodge 212 Kashwitna Ridge Lodging 28 Talkeetna Hideaway 24 Swiss Alaska Inn 20 Mary's McKinley View Lodge 16 Latitude 62 LLC 12 Chinook Wind Cabins 9 Talkeetna Roadhouse 9 Fireweed Station Inn 8 Gate Creek Cabins 8 Paradise Lodge and Cabins 8 Susitna River Lodging 8 The Forks Roadhouse 8 Pioneer Lodge, Inc. 6 Sunshine Lake B&B/Resort 6 Alaska Denali Bed & Breakfast 5 Grace And Bill's Freedom Hills B & B 5 North Country Bed & Breakfast 5
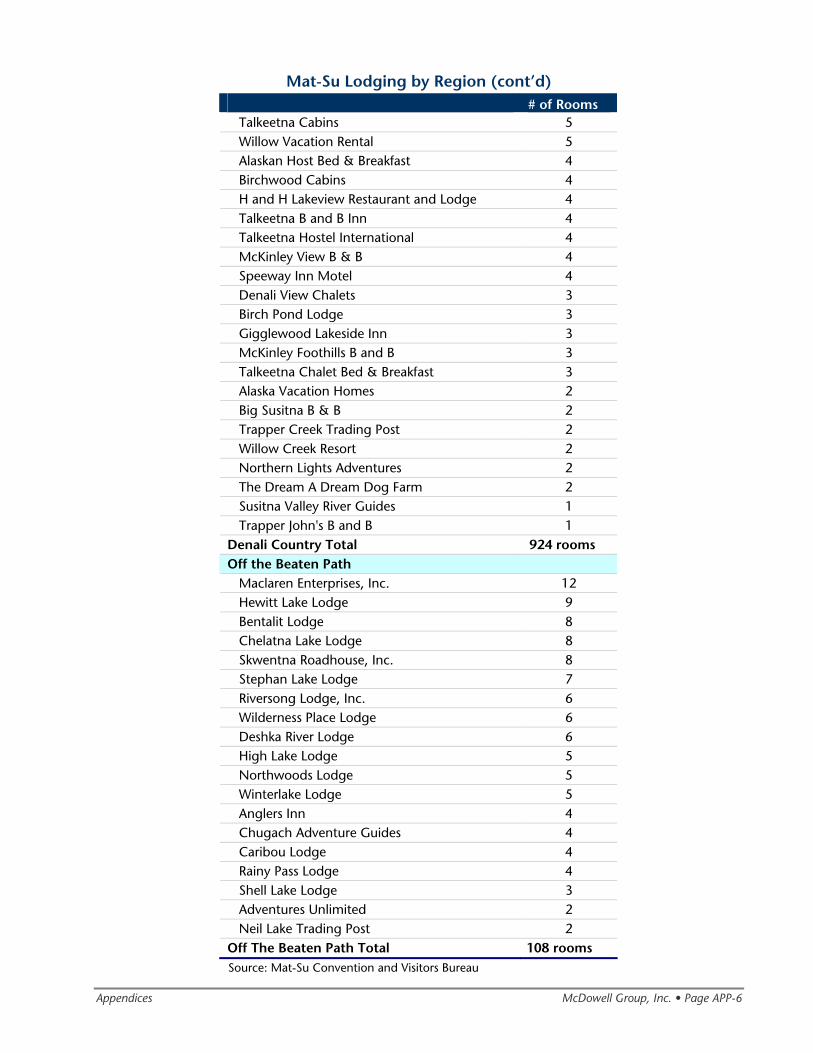
Appendices McDowell Group, Inc. • Page APP-6
Mat-Su Lodging by Region (cont’d) # of Rooms
Talkeetna Cabins 5 Willow Vacation Rental 5 Alaskan Host Bed & Breakfast 4 Birchwood Cabins 4 H and H Lakeview Restaurant and Lodge 4 Talkeetna B and B Inn 4 Talkeetna Hostel International 4 McKinley View B & B 4 Speeway Inn Motel 4 Denali View Chalets 3 Birch Pond Lodge 3 Gigglewood Lakeside Inn 3 McKinley Foothills B and B 3 Talkeetna Chalet Bed & Breakfast 3 Alaska Vacation Homes 2 Big Susitna B & B 2 Trapper Creek Trading Post 2 Willow Creek Resort 2 Northern Lights Adventures 2 The Dream A Dream Dog Farm 2 Susitna Valley River Guides 1 Trapper John's B and B 1
Denali Country Total 924 rooms Off the Beaten Path
Maclaren Enterprises, Inc. 12 Hewitt Lake Lodge 9 Bentalit Lodge 8 Chelatna Lake Lodge 8 Skwentna Roadhouse, Inc. 8 Stephan Lake Lodge 7 Riversong Lodge, Inc. 6 Wilderness Place Lodge 6 Deshka River Lodge 6 High Lake Lodge 5 Northwoods Lodge 5 Winterlake Lodge 5 Anglers Inn 4 Chugach Adventure Guides 4 Caribou Lodge 4 Rainy Pass Lodge 4 Shell Lake Lodge 3 Adventures Unlimited 2 Neil Lake Trading Post 2
Off The Beaten Path Total 108 rooms Source: Mat-Su Convention and Visitors Bureau
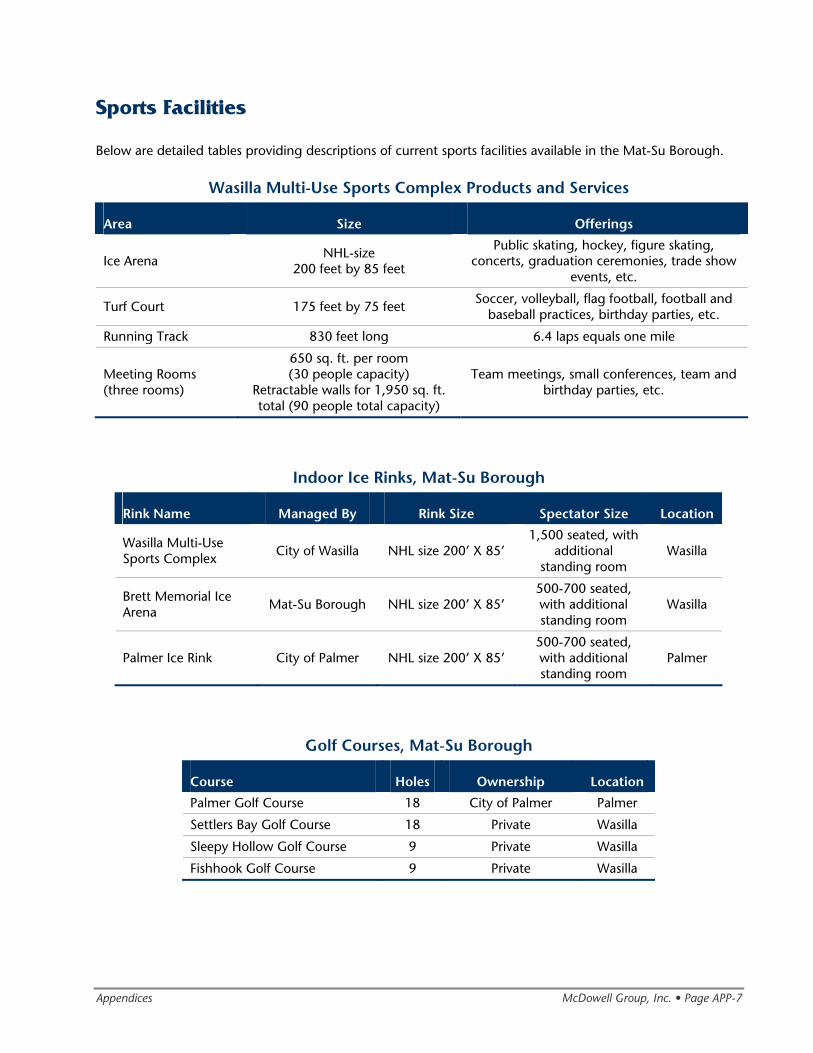
Appendices McDowell Group, Inc. • Page APP-7
Sports Facilities
Below are detailed tables providing descriptions of current sports facilities available in the Mat-Su Borough.
Wasilla Multi-Use Sports Complex Products and Services
Area Size Offerings
Ice Arena NHL-size
200 feet by 85 feet
Public skating, hockey, figure skating, concerts, graduation ceremonies, trade show
events, etc.
Turf Court 175 feet by 75 feet Soccer, volleyball, flag football, football and
baseball practices, birthday parties, etc.
Running Track 830 feet long 6.4 laps equals one mile
Meeting Rooms (three rooms)
650 sq. ft. per room (30 people capacity)
Retractable walls for 1,950 sq. ft. total (90 people total capacity)
Team meetings, small conferences, team and birthday parties, etc.
Indoor Ice Rinks, Mat-Su Borough
Rink Name Managed By Rink Size Spectator Size Location
Wasilla Multi-Use Sports Complex City of Wasilla NHL size 200’ X 85’
1,500 seated, with additional
standing room Wasilla
Brett Memorial Ice Arena Mat-Su Borough NHL size 200’ X 85’
500-700 seated, with additional standing room
Wasilla
Palmer Ice Rink City of Palmer NHL size 200’ X 85’ 500-700 seated, with additional standing room
Palmer
Golf Courses, Mat-Su Borough
Course Holes Ownership Location Palmer Golf Course 18 City of Palmer Palmer
Settlers Bay Golf Course 18 Private Wasilla
Sleepy Hollow Golf Course 9 Private Wasilla
Fishhook Golf Course 9 Private Wasilla
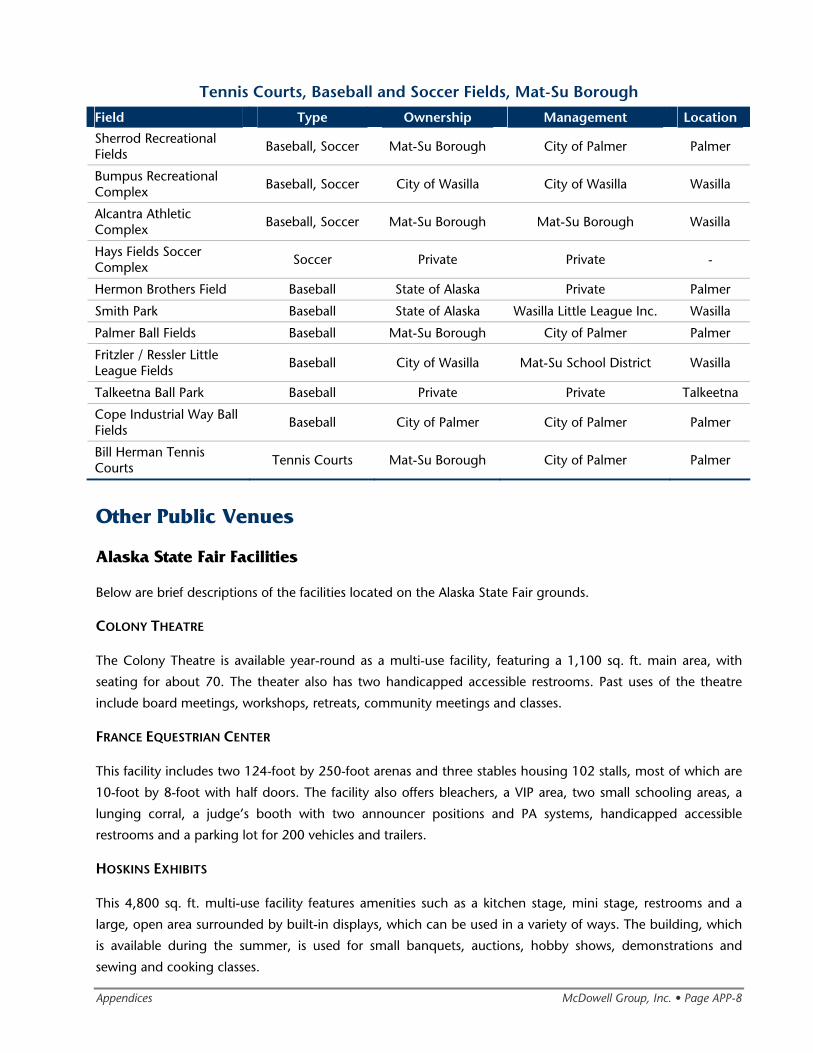
Appendices McDowell Group, Inc. • Page APP-8
Tennis Courts, Baseball and Soccer Fields, Mat-Su Borough
Field Type Ownership Management Location Sherrod Recreational Fields
Baseball, Soccer Mat-Su Borough City of Palmer Palmer
Bumpus Recreational Complex
Baseball, Soccer City of Wasilla City of Wasilla Wasilla
Alcantra Athletic Complex Baseball, Soccer Mat-Su Borough Mat-Su Borough Wasilla
Hays Fields Soccer Complex Soccer Private Private -
Hermon Brothers Field Baseball State of Alaska Private Palmer
Smith Park Baseball State of Alaska Wasilla Little League Inc. Wasilla
Palmer Ball Fields Baseball Mat-Su Borough City of Palmer Palmer
Fritzler / Ressler Little League Fields Baseball City of Wasilla Mat-Su School District Wasilla
Talkeetna Ball Park Baseball Private Private Talkeetna
Cope Industrial Way Ball Fields
Baseball City of Palmer City of Palmer Palmer
Bill Herman Tennis Courts Tennis Courts Mat-Su Borough City of Palmer Palmer
Other Public Venues
Alaska State Fair Facilities
Below are brief descriptions of the facilities located on the Alaska State Fair grounds.
COLONY THEATRE
The Colony Theatre is available year-round as a multi-use facility, featuring a 1,100 sq. ft. main area, with
seating for about 70. The theater also has two handicapped accessible restrooms. Past uses of the theatre
include board meetings, workshops, retreats, community meetings and classes.
FRANCE EQUESTRIAN CENTER
This facility includes two 124-foot by 250-foot arenas and three stables housing 102 stalls, most of which are
10-foot by 8-foot with half doors. The facility also offers bleachers, a VIP area, two small schooling areas, a
lunging corral, a judge’s booth with two announcer positions and PA systems, handicapped accessible
restrooms and a parking lot for 200 vehicles and trailers.
HOSKINS EXHIBITS
This 4,800 sq. ft. multi-use facility features amenities such as a kitchen stage, mini stage, restrooms and a
large, open area surrounded by built-in displays, which can be used in a variety of ways. The building, which
is available during the summer, is used for small banquets, auctions, hobby shows, demonstrations and
sewing and cooking classes.
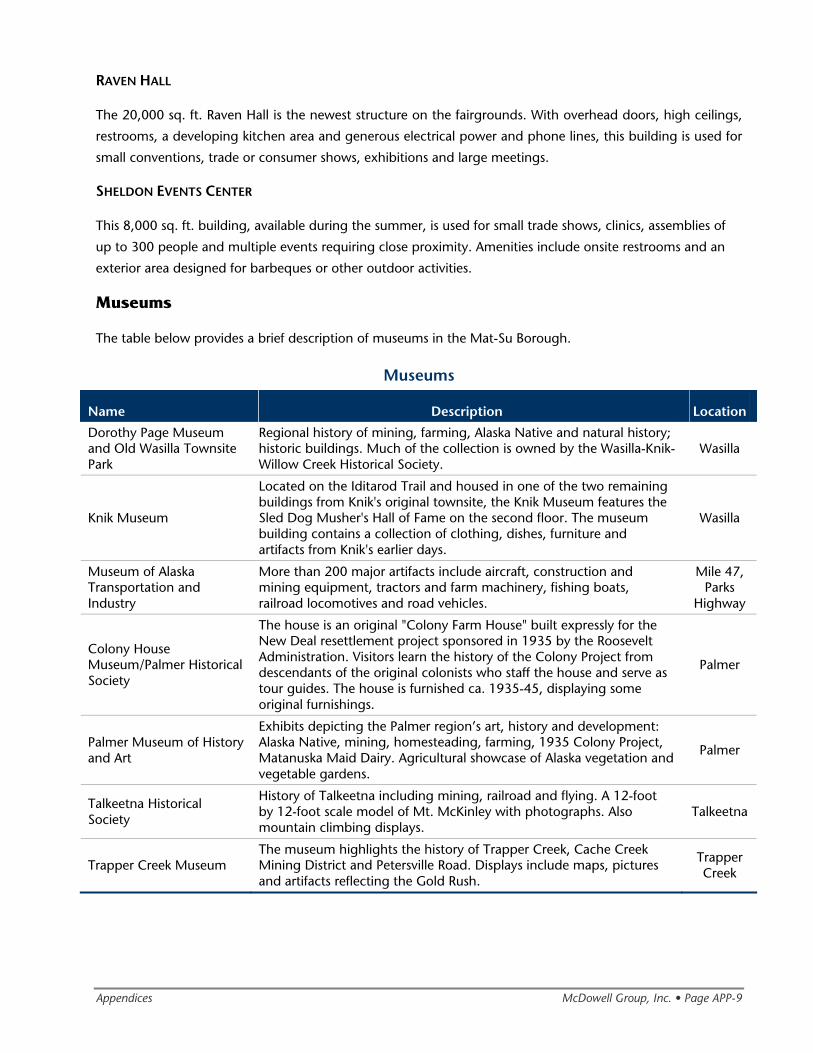
Appendices McDowell Group, Inc. • Page APP-9
RAVEN HALL
The 20,000 sq. ft. Raven Hall is the newest structure on the fairgrounds. With overhead doors, high ceilings,
restrooms, a developing kitchen area and generous electrical power and phone lines, this building is used for
small conventions, trade or consumer shows, exhibitions and large meetings.
SHELDON EVENTS CENTER
This 8,000 sq. ft. building, available during the summer, is used for small trade shows, clinics, assemblies of
up to 300 people and multiple events requiring close proximity. Amenities include onsite restrooms and an
exterior area designed for barbeques or other outdoor activities.
Museums
The table below provides a brief description of museums in the Mat-Su Borough.
Museums
Name Description Location Dorothy Page Museum and Old Wasilla Townsite Park
Regional history of mining, farming, Alaska Native and natural history; historic buildings. Much of the collection is owned by the Wasilla-Knik-Willow Creek Historical Society.
Wasilla
Knik Museum
Located on the Iditarod Trail and housed in one of the two remaining buildings from Knik's original townsite, the Knik Museum features the Sled Dog Musher's Hall of Fame on the second floor. The museum building contains a collection of clothing, dishes, furniture and artifacts from Knik's earlier days.
Wasilla
Museum of Alaska Transportation and Industry
More than 200 major artifacts include aircraft, construction and mining equipment, tractors and farm machinery, fishing boats, railroad locomotives and road vehicles.
Mile 47, Parks
Highway
Colony House Museum/Palmer Historical Society
The house is an original "Colony Farm House" built expressly for the New Deal resettlement project sponsored in 1935 by the Roosevelt Administration. Visitors learn the history of the Colony Project from descendants of the original colonists who staff the house and serve as tour guides. The house is furnished ca. 1935-45, displaying some original furnishings.
Palmer
Palmer Museum of History and Art
Exhibits depicting the Palmer region’s art, history and development: Alaska Native, mining, homesteading, farming, 1935 Colony Project, Matanuska Maid Dairy. Agricultural showcase of Alaska vegetation and vegetable gardens.
Palmer
Talkeetna Historical Society
History of Talkeetna including mining, railroad and flying. A 12-foot by 12-foot scale model of Mt. McKinley with photographs. Also mountain climbing displays.
Talkeetna
Trapper Creek Museum The museum highlights the history of Trapper Creek, Cache Creek Mining District and Petersville Road. Displays include maps, pictures and artifacts reflecting the Gold Rush.
Trapper Creek
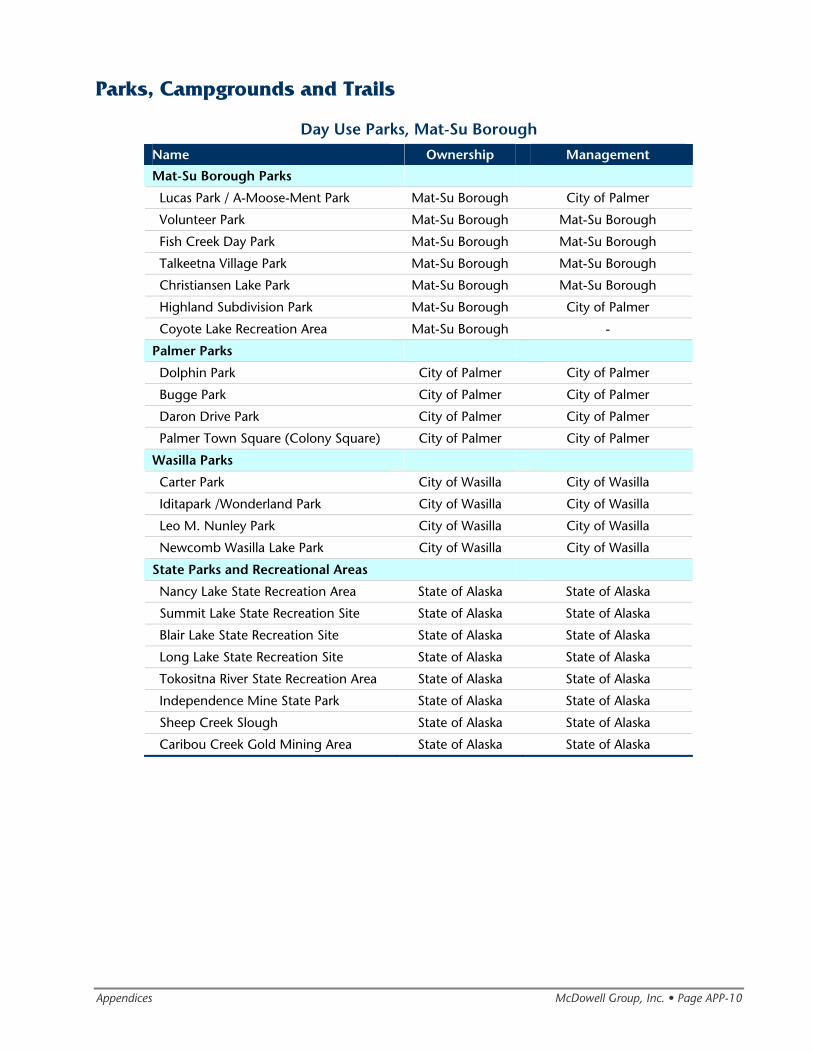
Appendices McDowell Group, Inc. • Page APP-10
Parks, Campgrounds and Trails
Day Use Parks, Mat-Su Borough
Name Ownership Management
Mat-Su Borough Parks
Lucas Park / A-Moose-Ment Park Mat-Su Borough City of Palmer
Volunteer Park Mat-Su Borough Mat-Su Borough
Fish Creek Day Park Mat-Su Borough Mat-Su Borough
Talkeetna Village Park Mat-Su Borough Mat-Su Borough
Christiansen Lake Park Mat-Su Borough Mat-Su Borough
Highland Subdivision Park Mat-Su Borough City of Palmer
Coyote Lake Recreation Area Mat-Su Borough -
Palmer Parks
Dolphin Park City of Palmer City of Palmer
Bugge Park City of Palmer City of Palmer
Daron Drive Park City of Palmer City of Palmer
Palmer Town Square (Colony Square) City of Palmer City of Palmer
Wasilla Parks
Carter Park City of Wasilla City of Wasilla
Iditapark /Wonderland Park City of Wasilla City of Wasilla
Leo M. Nunley Park City of Wasilla City of Wasilla
Newcomb Wasilla Lake Park City of Wasilla City of Wasilla
State Parks and Recreational Areas
Nancy Lake State Recreation Area State of Alaska State of Alaska
Summit Lake State Recreation Site State of Alaska State of Alaska
Blair Lake State Recreation Site State of Alaska State of Alaska
Long Lake State Recreation Site State of Alaska State of Alaska
Tokositna River State Recreation Area State of Alaska State of Alaska
Independence Mine State Park State of Alaska State of Alaska
Sheep Creek Slough State of Alaska State of Alaska
Caribou Creek Gold Mining Area State of Alaska State of Alaska
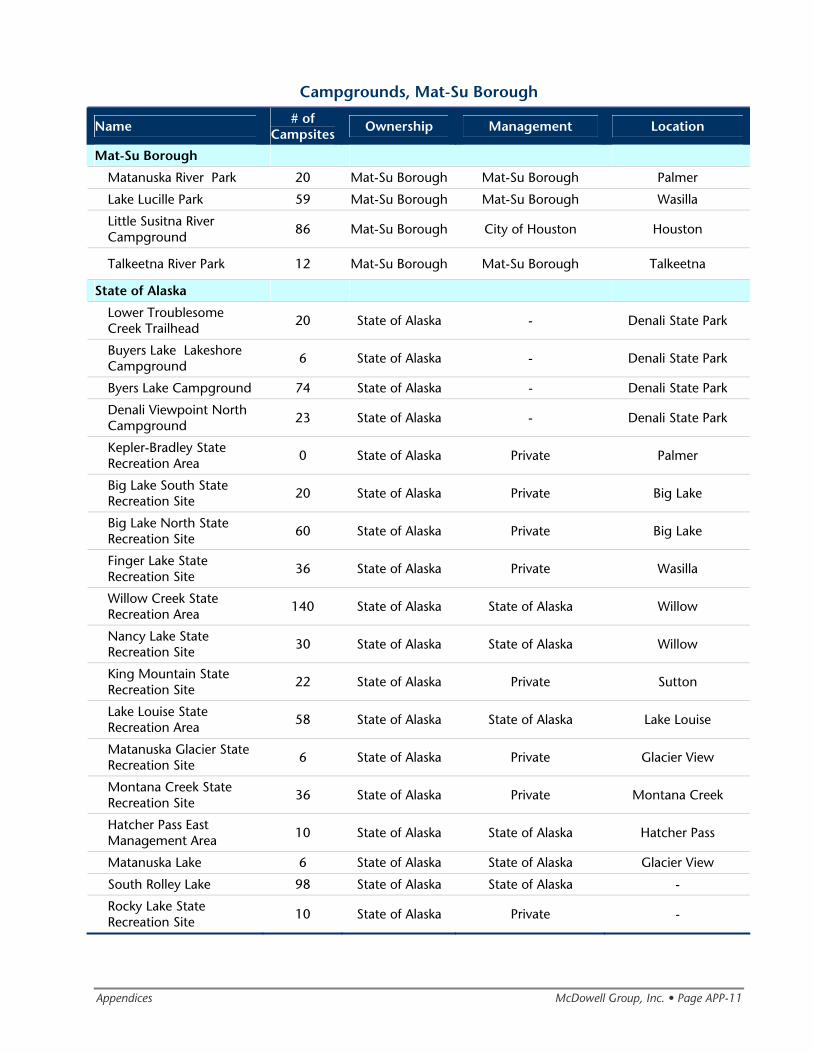
Appendices McDowell Group, Inc. • Page APP-11
Campgrounds, Mat-Su Borough
Name # of Campsites
Ownership Management Location
Mat-Su Borough
Matanuska River Park 20 Mat-Su Borough Mat-Su Borough Palmer
Lake Lucille Park 59 Mat-Su Borough Mat-Su Borough Wasilla
Little Susitna River Campground
86 Mat-Su Borough City of Houston Houston
Talkeetna River Park 12 Mat-Su Borough Mat-Su Borough Talkeetna
State of Alaska
Lower Troublesome Creek Trailhead 20 State of Alaska - Denali State Park
Buyers Lake Lakeshore Campground 6 State of Alaska - Denali State Park
Byers Lake Campground 74 State of Alaska - Denali State Park
Denali Viewpoint North Campground 23 State of Alaska - Denali State Park
Kepler-Bradley State Recreation Area
0 State of Alaska Private Palmer
Big Lake South State Recreation Site 20 State of Alaska Private Big Lake
Big Lake North State Recreation Site 60 State of Alaska Private Big Lake
Finger Lake State Recreation Site
36 State of Alaska Private Wasilla
Willow Creek State Recreation Area 140 State of Alaska State of Alaska Willow
Nancy Lake State Recreation Site 30 State of Alaska State of Alaska Willow
King Mountain State Recreation Site
22 State of Alaska Private Sutton
Lake Louise State Recreation Area 58 State of Alaska State of Alaska Lake Louise
Matanuska Glacier State Recreation Site 6 State of Alaska Private Glacier View
Montana Creek State Recreation Site
36 State of Alaska Private Montana Creek
Hatcher Pass East Management Area 10 State of Alaska State of Alaska Hatcher Pass
Matanuska Lake 6 State of Alaska State of Alaska Glacier View
South Rolley Lake 98 State of Alaska State of Alaska -
Rocky Lake State Recreation Site
10 State of Alaska Private -
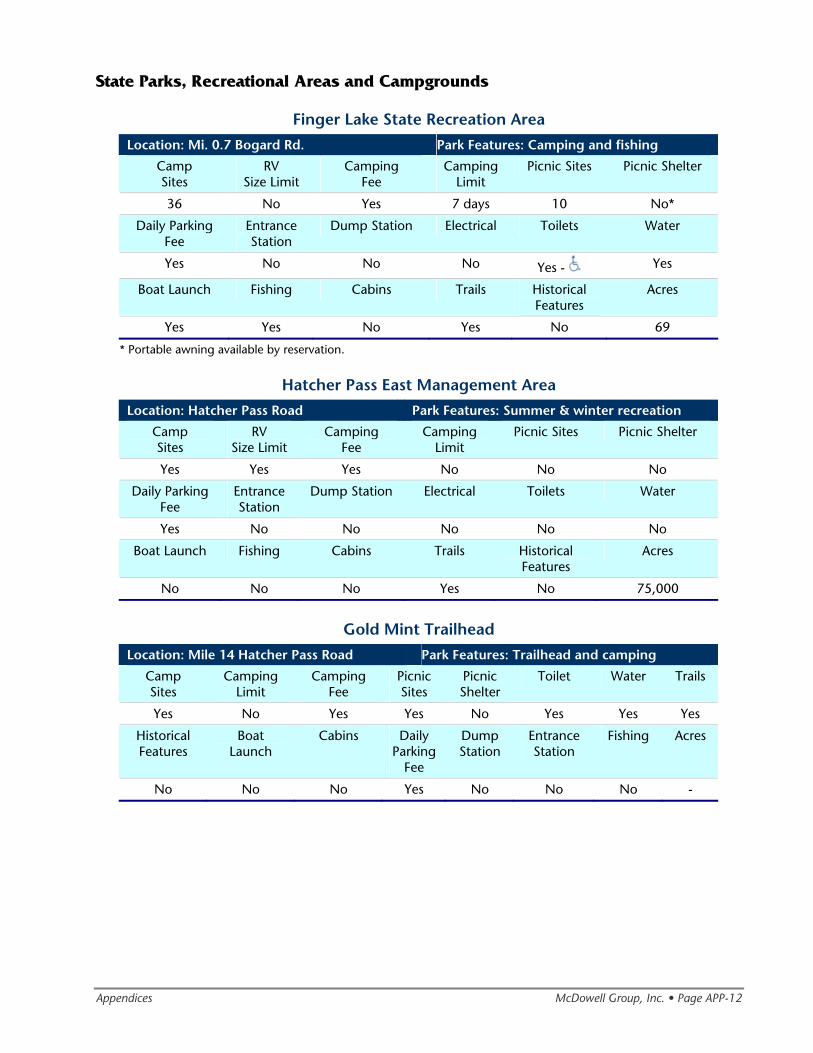
Appendices McDowell Group, Inc. • Page APP-12
State Parks, Recreational Areas and Campgrounds
Finger Lake State Recreation Area
Location: Mi. 0.7 Bogard Rd. Park Features: Camping and fishing Camp Sites
RV Size Limit
Camping Fee
Camping Limit
Picnic Sites Picnic Shelter
36 No Yes 7 days 10 No*
Daily Parking Fee
Entrance Station
Dump Station Electrical Toilets Water
Yes No No No Yes - Yes
Boat Launch Fishing Cabins Trails Historical Features
Acres
Yes Yes No Yes No 69
* Portable awning available by reservation.
Hatcher Pass East Management Area
Location: Hatcher Pass Road Park Features: Summer & winter recreation Camp Sites
RV Size Limit
Camping Fee
Camping Limit
Picnic Sites Picnic Shelter
Yes Yes Yes No No No
Daily Parking Fee
Entrance Station
Dump Station Electrical Toilets Water
Yes No No No No No
Boat Launch Fishing Cabins Trails Historical Features
Acres
No No No Yes No 75,000
Gold Mint Trailhead
Location: Mile 14 Hatcher Pass Road Park Features: Trailhead and camping Camp Sites
Camping Limit
Camping Fee
Picnic Sites
Picnic Shelter
Toilet Water Trails
Yes No Yes Yes No Yes Yes Yes
Historical Features
Boat Launch
Cabins Daily Parking
Fee
Dump Station
Entrance Station
Fishing Acres
No No No Yes No No No -
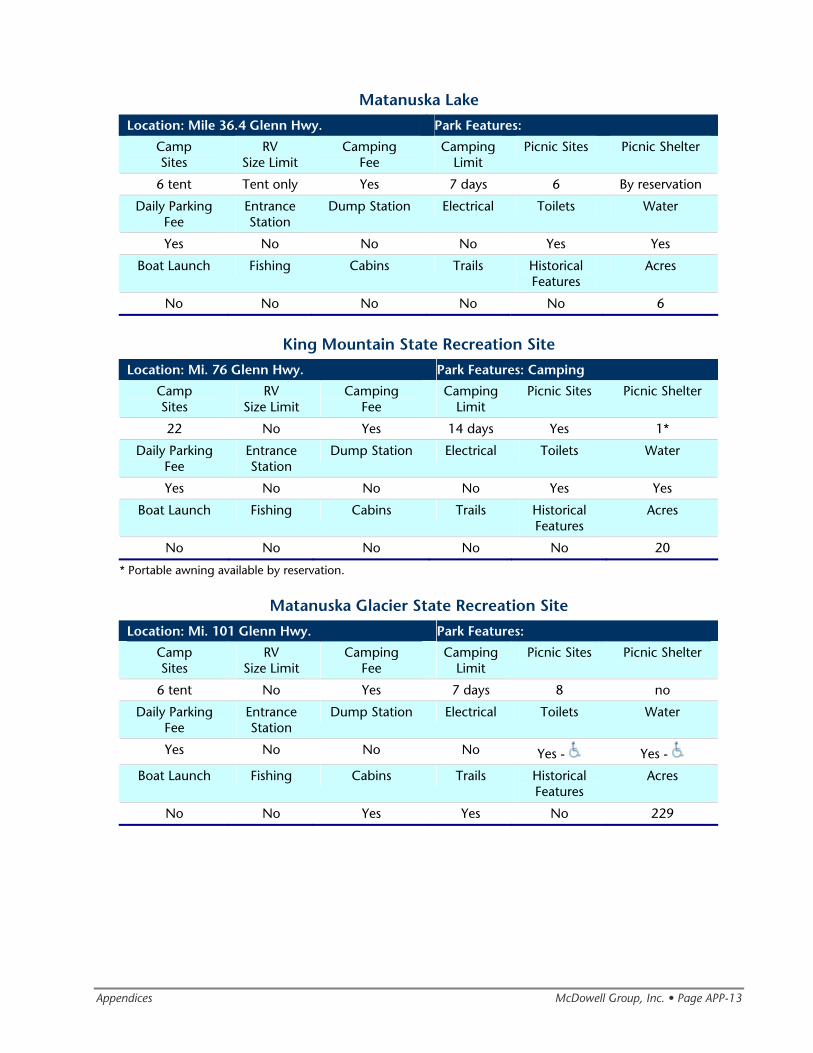
Appendices McDowell Group, Inc. • Page APP-13
Matanuska Lake
Location: Mile 36.4 Glenn Hwy. Park Features: Camp Sites
RV Size Limit
Camping Fee
Camping Limit
Picnic Sites Picnic Shelter
6 tent Tent only Yes 7 days 6 By reservation
Daily Parking Fee
Entrance Station
Dump Station Electrical Toilets Water
Yes No No No Yes Yes
Boat Launch Fishing Cabins Trails Historical Features
Acres
No No No No No 6
King Mountain State Recreation Site
Location: Mi. 76 Glenn Hwy. Park Features: Camping Camp Sites
RV Size Limit
Camping Fee
Camping Limit
Picnic Sites Picnic Shelter
22 No Yes 14 days Yes 1*
Daily Parking Fee
Entrance Station
Dump Station Electrical Toilets Water
Yes No No No Yes Yes
Boat Launch Fishing Cabins Trails Historical Features
Acres
No No No No No 20
* Portable awning available by reservation.
Matanuska Glacier State Recreation Site
Location: Mi. 101 Glenn Hwy. Park Features: Camp Sites
RV Size Limit
Camping Fee
Camping Limit
Picnic Sites Picnic Shelter
6 tent No Yes 7 days 8 no
Daily Parking Fee
Entrance Station
Dump Station Electrical Toilets Water
Yes No No No Yes - Yes -
Boat Launch Fishing Cabins Trails Historical Features
Acres
No No Yes Yes No 229
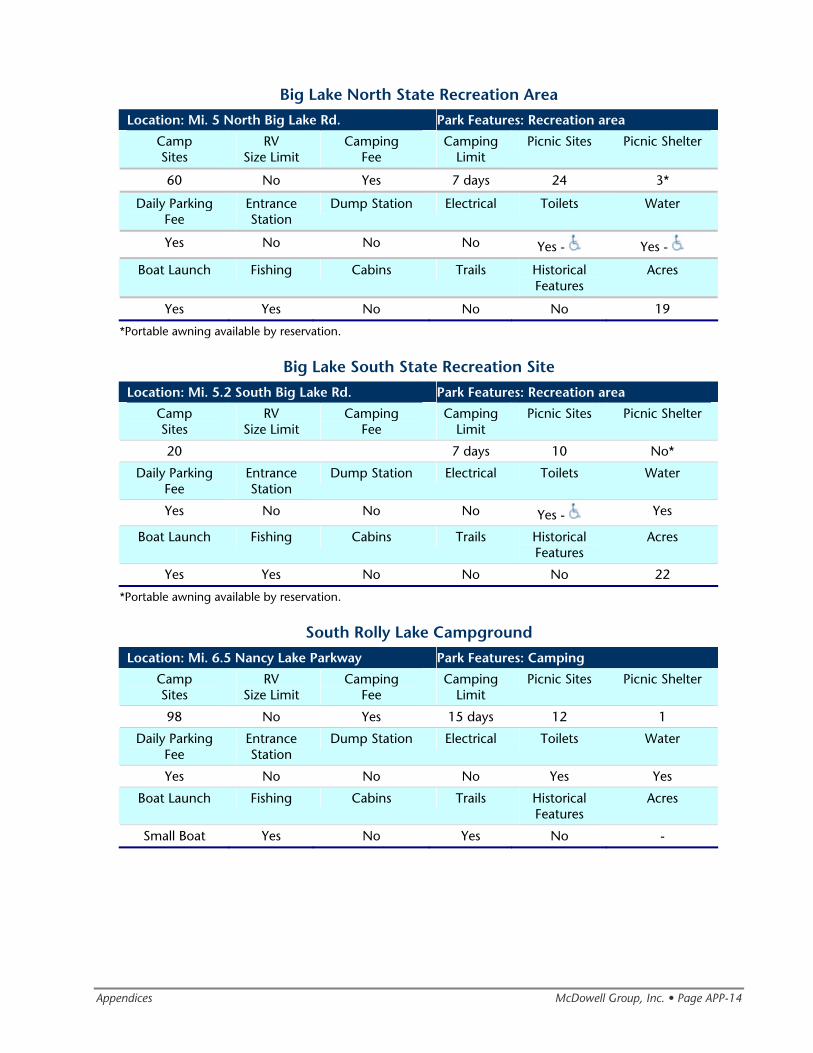
Appendices McDowell Group, Inc. • Page APP-14
Big Lake North State Recreation Area
Location: Mi. 5 North Big Lake Rd. Park Features: Recreation area Camp Sites
RV Size Limit
Camping Fee
Camping Limit
Picnic Sites Picnic Shelter
60 No Yes 7 days 24 3*
Daily Parking Fee
Entrance Station
Dump Station Electrical Toilets Water
Yes No No No Yes - Yes -
Boat Launch Fishing Cabins Trails Historical Features
Acres
Yes Yes No No No 19
*Portable awning available by reservation.
Big Lake South State Recreation Site
Location: Mi. 5.2 South Big Lake Rd. Park Features: Recreation area Camp Sites
RV Size Limit
Camping Fee
Camping Limit
Picnic Sites Picnic Shelter
20 7 days 10 No*
Daily Parking Fee
Entrance Station
Dump Station Electrical Toilets Water
Yes No No No Yes - Yes
Boat Launch Fishing Cabins Trails Historical Features
Acres
Yes Yes No No No 22
*Portable awning available by reservation.
South Rolly Lake Campground
Location: Mi. 6.5 Nancy Lake Parkway Park Features: Camping Camp Sites
RV Size Limit
Camping Fee
Camping Limit
Picnic Sites Picnic Shelter
98 No Yes 15 days 12 1
Daily Parking Fee
Entrance Station
Dump Station Electrical Toilets Water
Yes No No No Yes Yes
Boat Launch Fishing Cabins Trails Historical Features
Acres
Small Boat Yes No Yes No -
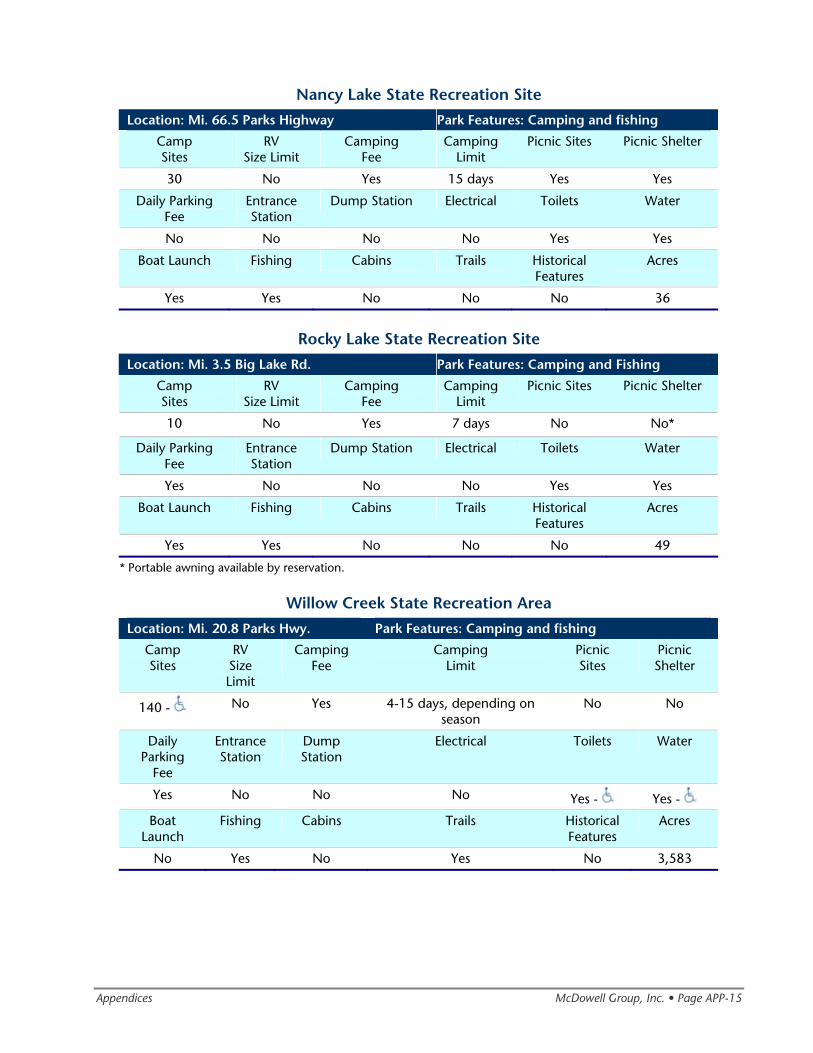
Appendices McDowell Group, Inc. • Page APP-15
Nancy Lake State Recreation Site
Location: Mi. 66.5 Parks Highway Park Features: Camping and fishing Camp Sites
RV Size Limit
Camping Fee
Camping Limit
Picnic Sites Picnic Shelter
30 No Yes 15 days Yes Yes
Daily Parking Fee
Entrance Station
Dump Station Electrical Toilets Water
No No No No Yes Yes
Boat Launch Fishing Cabins Trails Historical Features
Acres
Yes Yes No No No 36
Rocky Lake State Recreation Site
Location: Mi. 3.5 Big Lake Rd. Park Features: Camping and Fishing Camp Sites
RV Size Limit
Camping Fee
Camping Limit
Picnic Sites Picnic Shelter
10 No Yes 7 days No No*
Daily Parking Fee
Entrance Station
Dump Station Electrical Toilets Water
Yes No No No Yes Yes
Boat Launch Fishing Cabins Trails Historical Features
Acres
Yes Yes No No No 49
* Portable awning available by reservation.
Willow Creek State Recreation Area
Location: Mi. 20.8 Parks Hwy. Park Features: Camping and fishing Camp Sites
RV Size Limit
Camping Fee
Camping Limit
Picnic Sites
Picnic Shelter
140 - No Yes 4-15 days, depending on season
No No
Daily Parking
Fee
Entrance Station
Dump Station
Electrical Toilets Water
Yes No No No Yes - Yes -
Boat Launch
Fishing Cabins Trails Historical Features
Acres
No Yes No Yes No 3,583
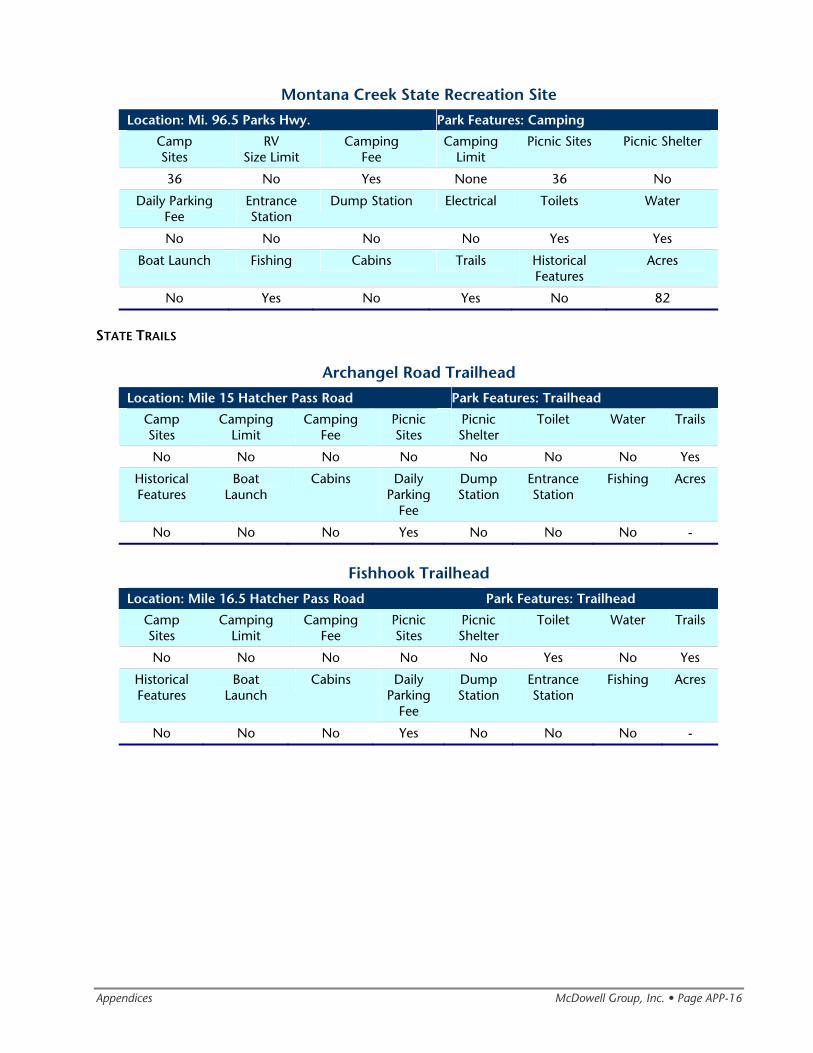
Appendices McDowell Group, Inc. • Page APP-16
Montana Creek State Recreation Site
Location: Mi. 96.5 Parks Hwy. Park Features: Camping Camp Sites
RV Size Limit
Camping Fee
Camping Limit
Picnic Sites Picnic Shelter
36 No Yes None 36 No
Daily Parking Fee
Entrance Station
Dump Station Electrical Toilets Water
No No No No Yes Yes
Boat Launch Fishing Cabins Trails Historical Features
Acres
No Yes No Yes No 82
STATE TRAILS
Archangel Road Trailhead
Location: Mile 15 Hatcher Pass Road Park Features: Trailhead Camp Sites
Camping Limit
Camping Fee
Picnic Sites
Picnic Shelter
Toilet Water Trails
No No No No No No No Yes
Historical Features
Boat Launch
Cabins Daily Parking
Fee
Dump Station
Entrance Station
Fishing Acres
No No No Yes No No No -
Fishhook Trailhead
Location: Mile 16.5 Hatcher Pass Road Park Features: Trailhead Camp Sites
Camping Limit
Camping Fee
Picnic Sites
Picnic Shelter
Toilet Water Trails
No No No No No Yes No Yes
Historical Features
Boat Launch
Cabins Daily Parking
Fee
Dump Station
Entrance Station
Fishing Acres
No No No Yes No No No -
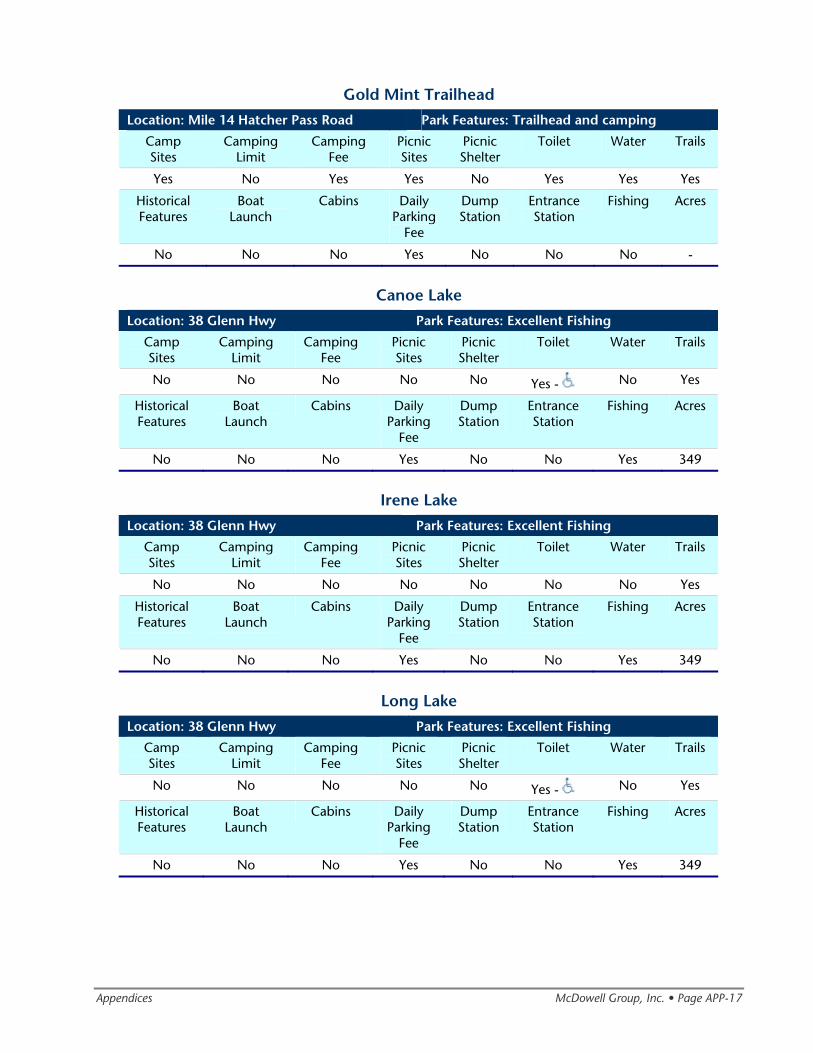
Appendices McDowell Group, Inc. • Page APP-17
Gold Mint Trailhead
Location: Mile 14 Hatcher Pass Road Park Features: Trailhead and camping Camp Sites
Camping Limit
Camping Fee
Picnic Sites
Picnic Shelter
Toilet Water Trails
Yes No Yes Yes No Yes Yes Yes
Historical Features
Boat Launch
Cabins Daily Parking
Fee
Dump Station
Entrance Station
Fishing Acres
No No No Yes No No No -
Canoe Lake
Location: 38 Glenn Hwy Park Features: Excellent Fishing Camp Sites
Camping Limit
Camping Fee
Picnic Sites
Picnic Shelter
Toilet Water Trails
No No No No No Yes - No Yes
Historical Features
Boat Launch
Cabins Daily Parking
Fee
Dump Station
Entrance Station
Fishing Acres
No No No Yes No No Yes 349
Irene Lake
Location: 38 Glenn Hwy Park Features: Excellent Fishing Camp Sites
Camping Limit
Camping Fee
Picnic Sites
Picnic Shelter
Toilet Water Trails
No No No No No No No Yes
Historical Features
Boat Launch
Cabins Daily Parking
Fee
Dump Station
Entrance Station
Fishing Acres
No No No Yes No No Yes 349
Long Lake
Location: 38 Glenn Hwy Park Features: Excellent Fishing Camp Sites
Camping Limit
Camping Fee
Picnic Sites
Picnic Shelter
Toilet Water Trails
No No No No No Yes - No Yes
Historical Features
Boat Launch
Cabins Daily Parking
Fee
Dump Station
Entrance Station
Fishing Acres
No No No Yes No No Yes 349
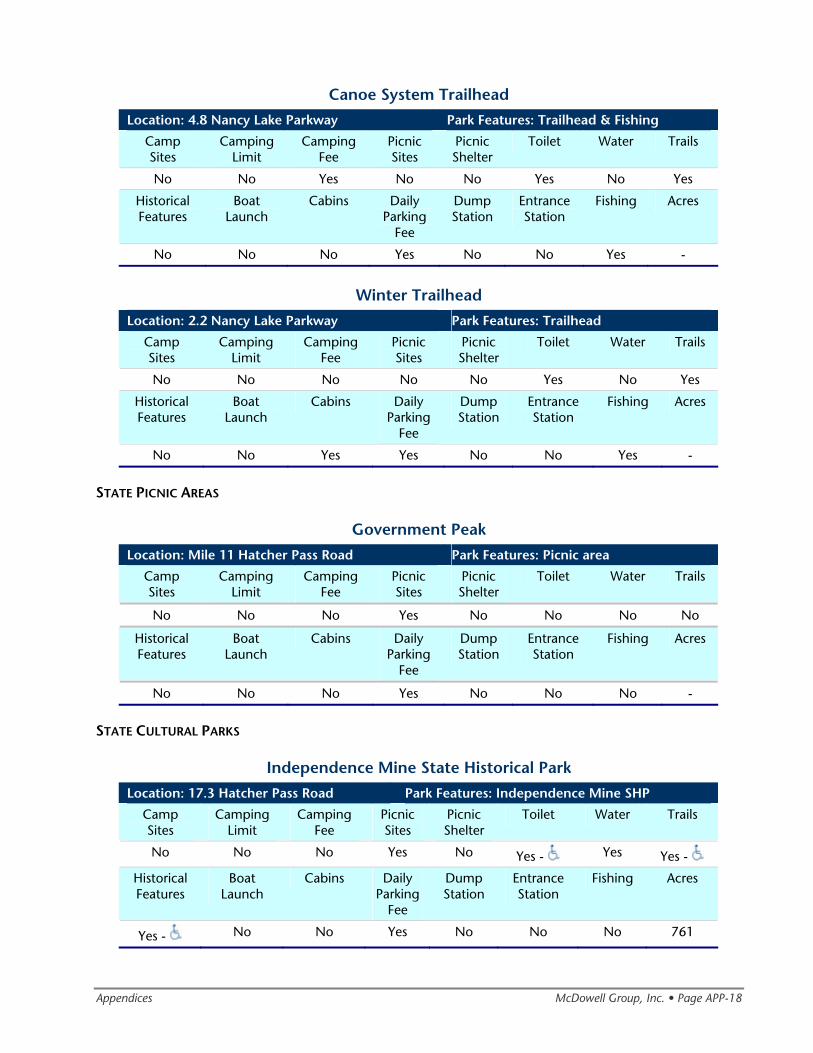
Appendices McDowell Group, Inc. • Page APP-18
Canoe System Trailhead
Location: 4.8 Nancy Lake Parkway Park Features: Trailhead & Fishing Camp Sites
Camping Limit
Camping Fee
Picnic Sites
Picnic Shelter
Toilet Water Trails
No No Yes No No Yes No Yes
Historical Features
Boat Launch
Cabins Daily Parking
Fee
Dump Station
Entrance Station
Fishing Acres
No No No Yes No No Yes -
Winter Trailhead
Location: 2.2 Nancy Lake Parkway Park Features: Trailhead Camp Sites
Camping Limit
Camping Fee
Picnic Sites
Picnic Shelter
Toilet Water Trails
No No No No No Yes No Yes
Historical Features
Boat Launch
Cabins Daily Parking
Fee
Dump Station
Entrance Station
Fishing Acres
No No Yes Yes No No Yes -
STATE PICNIC AREAS
Government Peak
Location: Mile 11 Hatcher Pass Road Park Features: Picnic area Camp Sites
Camping Limit
Camping Fee
Picnic Sites
Picnic Shelter
Toilet Water Trails
No No No Yes No No No No
Historical Features
Boat Launch
Cabins Daily Parking
Fee
Dump Station
Entrance Station
Fishing Acres
No No No Yes No No No -
STATE CULTURAL PARKS
Independence Mine State Historical Park
Location: 17.3 Hatcher Pass Road Park Features: Independence Mine SHP Camp Sites
Camping Limit
Camping Fee
Picnic Sites
Picnic Shelter
Toilet Water Trails
No No No Yes No Yes - Yes Yes -
Historical Features
Boat Launch
Cabins Daily Parking
Fee
Dump Station
Entrance Station
Fishing Acres
Yes - No No Yes No No No 761
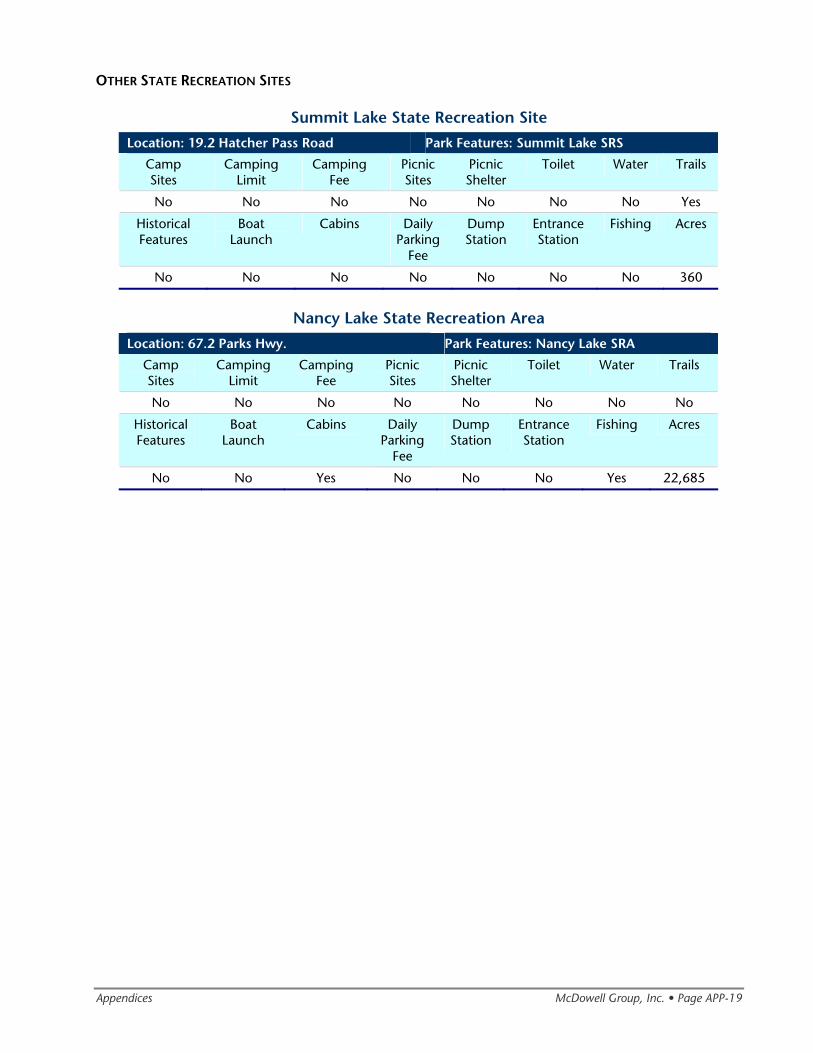
Appendices McDowell Group, Inc. • Page APP-19
OTHER STATE RECREATION SITES
Summit Lake State Recreation Site
Location: 19.2 Hatcher Pass Road Park Features: Summit Lake SRS Camp Sites
Camping Limit
Camping Fee
Picnic Sites
Picnic Shelter
Toilet Water Trails
No No No No No No No Yes
Historical Features
Boat Launch
Cabins Daily Parking
Fee
Dump Station
Entrance Station
Fishing Acres
No No No No No No No 360
Nancy Lake State Recreation Area
Location: 67.2 Parks Hwy. Park Features: Nancy Lake SRA Camp Sites
Camping Limit
Camping Fee
Picnic Sites
Picnic Shelter
Toilet Water Trails
No No No No No No No No
Historical Features
Boat Launch
Cabins Daily Parking
Fee
Dump Station
Entrance Station
Fishing Acres
No No Yes No No No Yes 22,685
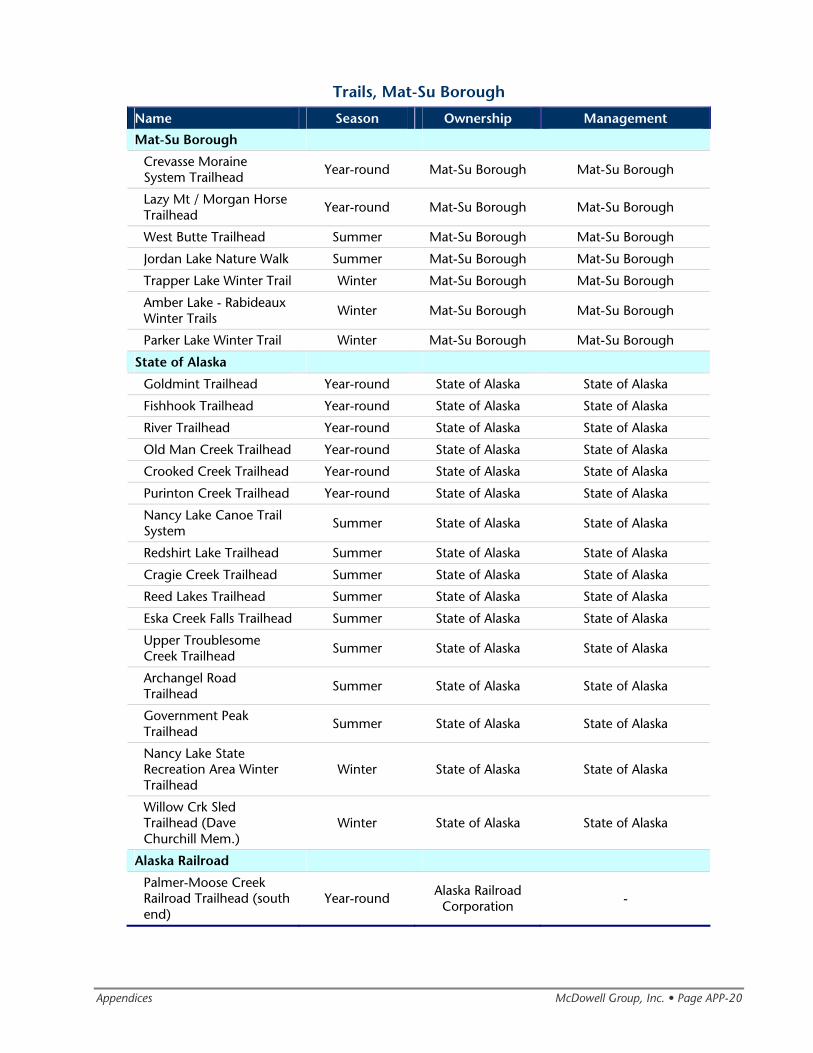
Appendices McDowell Group, Inc. • Page APP-20
Trails, Mat-Su Borough
Name Season Ownership Management Mat-Su Borough
Crevasse Moraine System Trailhead Year-round Mat-Su Borough Mat-Su Borough
Lazy Mt / Morgan Horse Trailhead
Year-round Mat-Su Borough Mat-Su Borough
West Butte Trailhead Summer Mat-Su Borough Mat-Su Borough
Jordan Lake Nature Walk Summer Mat-Su Borough Mat-Su Borough
Trapper Lake Winter Trail Winter Mat-Su Borough Mat-Su Borough
Amber Lake - Rabideaux Winter Trails Winter Mat-Su Borough Mat-Su Borough
Parker Lake Winter Trail Winter Mat-Su Borough Mat-Su Borough
State of Alaska
Goldmint Trailhead Year-round State of Alaska State of Alaska
Fishhook Trailhead Year-round State of Alaska State of Alaska
River Trailhead Year-round State of Alaska State of Alaska
Old Man Creek Trailhead Year-round State of Alaska State of Alaska
Crooked Creek Trailhead Year-round State of Alaska State of Alaska
Purinton Creek Trailhead Year-round State of Alaska State of Alaska
Nancy Lake Canoe Trail System Summer State of Alaska State of Alaska
Redshirt Lake Trailhead Summer State of Alaska State of Alaska
Cragie Creek Trailhead Summer State of Alaska State of Alaska
Reed Lakes Trailhead Summer State of Alaska State of Alaska
Eska Creek Falls Trailhead Summer State of Alaska State of Alaska Upper Troublesome Creek Trailhead Summer State of Alaska State of Alaska
Archangel Road Trailhead Summer State of Alaska State of Alaska
Government Peak Trailhead
Summer State of Alaska State of Alaska
Nancy Lake State Recreation Area Winter Trailhead
Winter State of Alaska State of Alaska
Willow Crk Sled Trailhead (Dave Churchill Mem.)
Winter State of Alaska State of Alaska
Alaska Railroad
Palmer-Moose Creek Railroad Trailhead (south end)
Year-round Alaska Railroad
Corporation -
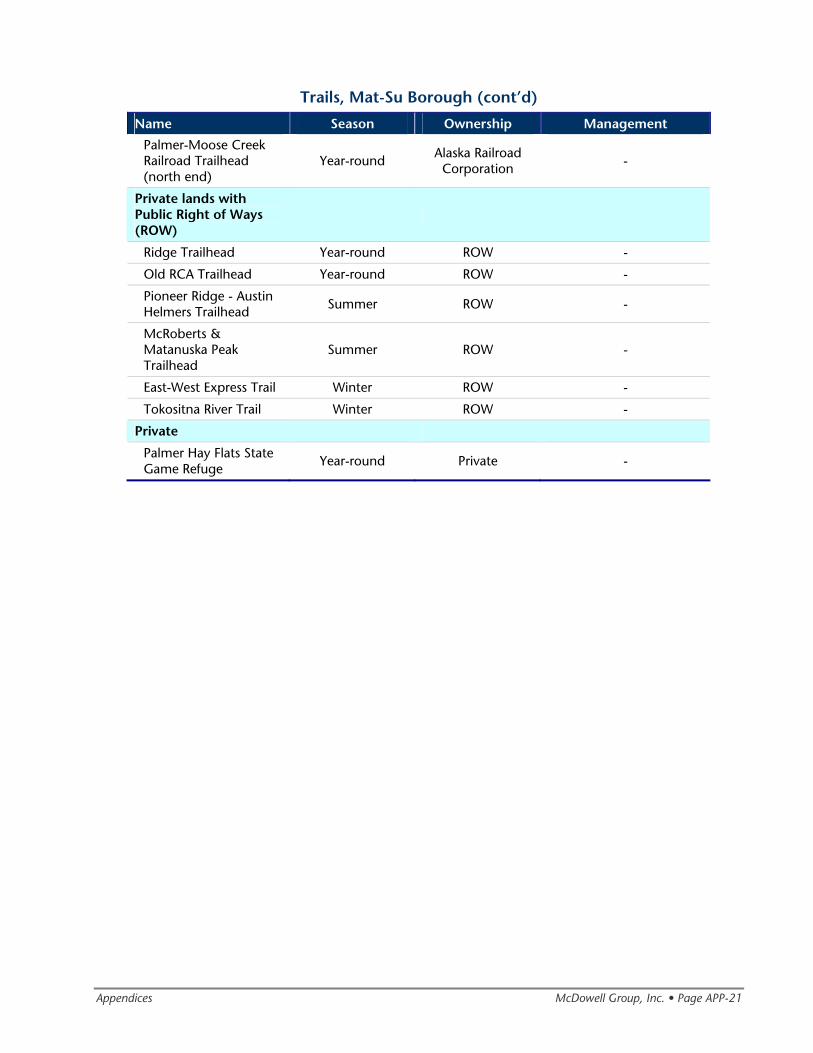
Appendices McDowell Group, Inc. • Page APP-21
Trails, Mat-Su Borough (cont’d)
Name Season Ownership Management Palmer-Moose Creek Railroad Trailhead (north end)
Year-round Alaska Railroad
Corporation -
Private lands with Public Right of Ways (ROW)
Ridge Trailhead Year-round ROW -
Old RCA Trailhead Year-round ROW -
Pioneer Ridge - Austin Helmers Trailhead Summer ROW -
McRoberts & Matanuska Peak Trailhead
Summer ROW -
East-West Express Trail Winter ROW -
Tokositna River Trail Winter ROW -
Private
Palmer Hay Flats State Game Refuge
Year-round Private -
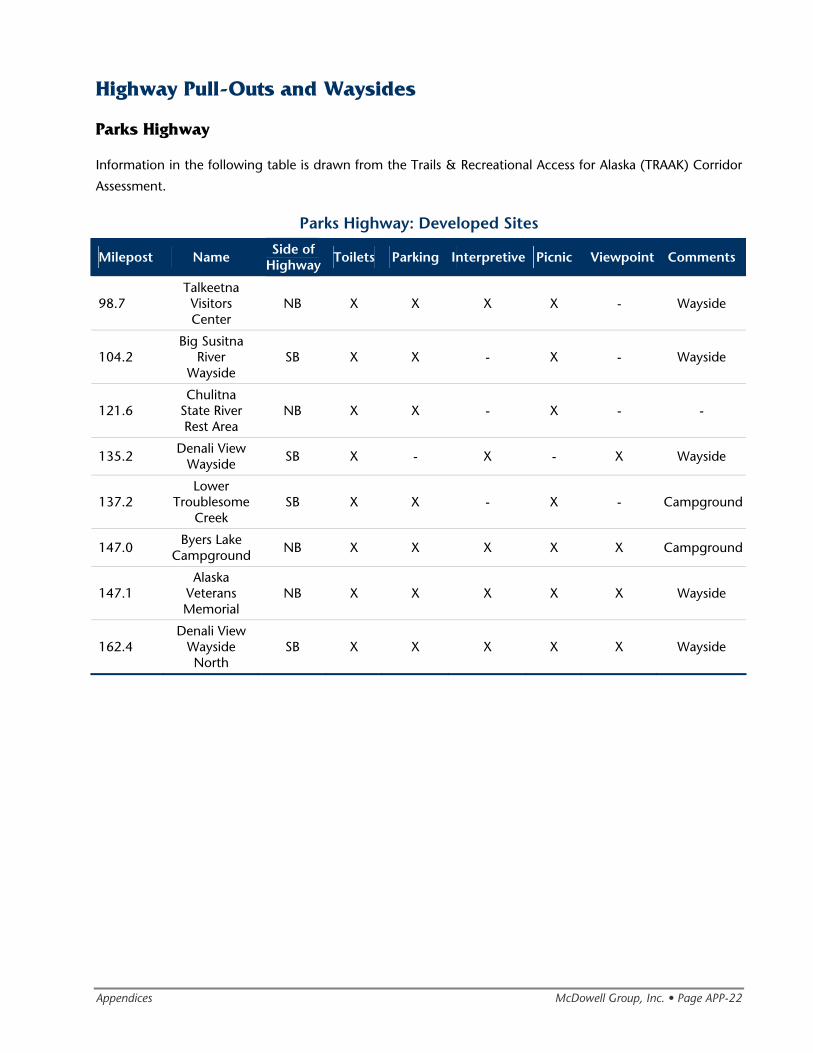
Appendices McDowell Group, Inc. • Page APP-22
Highway Pull-Outs and Waysides
Parks Highway
Information in the following table is drawn from the Trails & Recreational Access for Alaska (TRAAK) Corridor
Assessment.
Parks Highway: Developed Sites
Milepost Name Side of Highway Toilets Parking Interpretive Picnic Viewpoint Comments
98.7 Talkeetna Visitors Center
NB X X X X - Wayside
104.2 Big Susitna
River Wayside
SB X X - X - Wayside
121.6 Chulitna
State River Rest Area
NB X X - X - -
135.2 Denali View
Wayside SB X - X - X Wayside
137.2 Lower
Troublesome Creek
SB X X - X - Campground
147.0 Byers Lake
Campground NB X X X X X Campground
147.1 Alaska
Veterans Memorial
NB X X X X X Wayside
162.4 Denali View
Wayside North
SB X X X X X Wayside
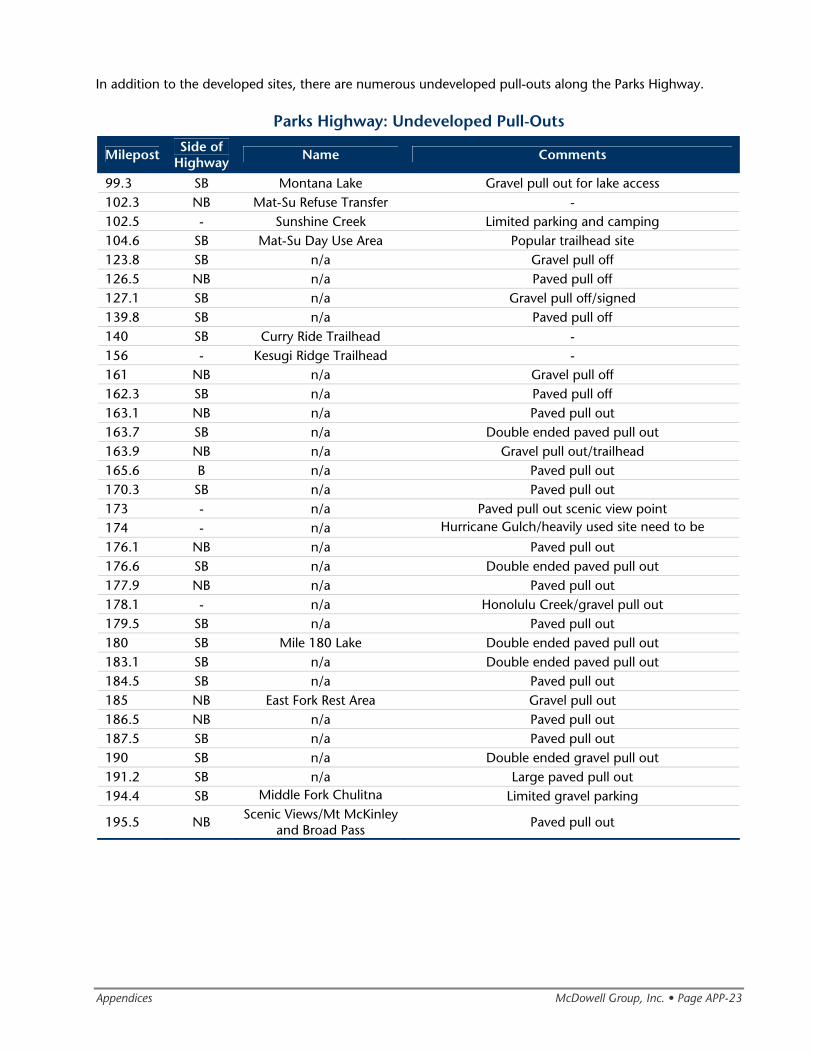
Appendices McDowell Group, Inc. • Page APP-23
In addition to the developed sites, there are numerous undeveloped pull-outs along the Parks Highway.
Parks Highway: Undeveloped Pull-Outs
Milepost Side of Highway Name Comments
99.3 SB Montana Lake Gravel pull out for lake access 102.3 NB Mat-Su Refuse Transfer - 102.5 - Sunshine Creek Limited parking and camping 104.6 SB Mat-Su Day Use Area Popular trailhead site 123.8 SB n/a Gravel pull off 126.5 NB n/a Paved pull off 127.1 SB n/a Gravel pull off/signed 139.8 SB n/a Paved pull off 140 SB Curry Ride Trailhead - 156 - Kesugi Ridge Trailhead - 161 NB n/a Gravel pull off 162.3 SB n/a Paved pull off 163.1 NB n/a Paved pull out 163.7 SB n/a Double ended paved pull out 163.9 NB n/a Gravel pull out/trailhead 165.6 B n/a Paved pull out 170.3 SB n/a Paved pull out 173 - n/a Paved pull out scenic view point 174 - n/a Hurricane Gulch/heavily used site need to be
176.1 NB n/a Paved pull out 176.6 SB n/a Double ended paved pull out 177.9 NB n/a Paved pull out 178.1 - n/a Honolulu Creek/gravel pull out 179.5 SB n/a Paved pull out 180 SB Mile 180 Lake Double ended paved pull out 183.1 SB n/a Double ended paved pull out 184.5 SB n/a Paved pull out 185 NB East Fork Rest Area Gravel pull out 186.5 NB n/a Paved pull out 187.5 SB n/a Paved pull out 190 SB n/a Double ended gravel pull out 191.2 SB n/a Large paved pull out 194.4 SB Middle Fork Chulitna Limited gravel parking
195.5 NB Scenic Views/Mt McKinley
and Broad Pass Paved pull out
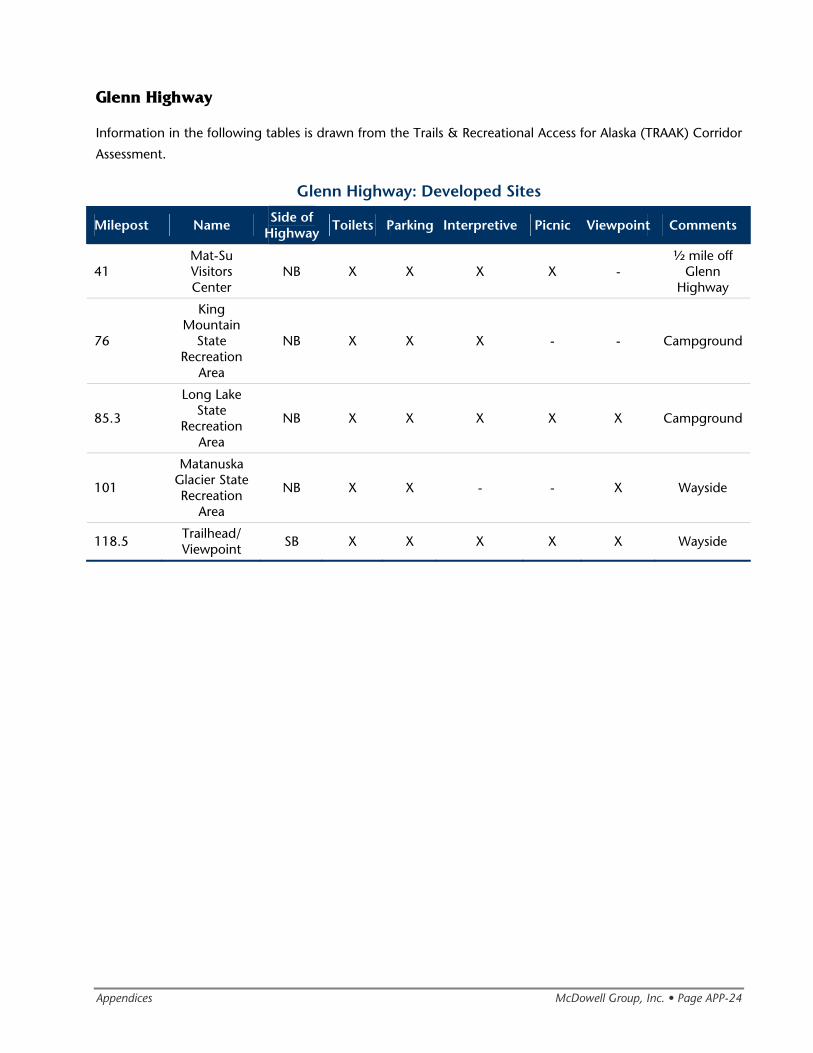
Appendices McDowell Group, Inc. • Page APP-24
Glenn Highway
Information in the following tables is drawn from the Trails & Recreational Access for Alaska (TRAAK) Corridor
Assessment.
Glenn Highway: Developed Sites
Milepost Name Side of Highway Toilets Parking Interpretive Picnic Viewpoint Comments
41 Mat-Su Visitors Center
NB X X X X - ½ mile off
Glenn Highway
76
King Mountain
State Recreation
Area
NB X X X - - Campground
85.3
Long Lake State
Recreation Area
NB X X X X X Campground
101
Matanuska Glacier State Recreation
Area
NB X X - - X Wayside
118.5 Trailhead/ Viewpoint SB X X X X X Wayside
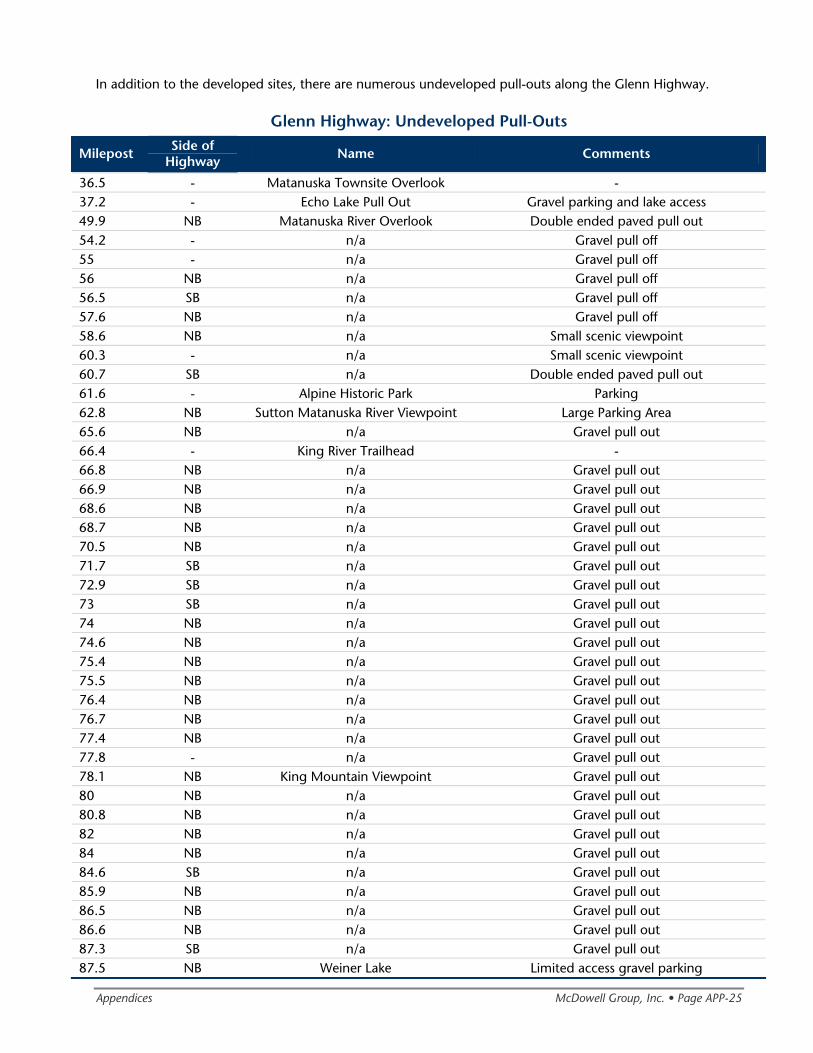
Appendices McDowell Group, Inc. • Page APP-25
In addition to the developed sites, there are numerous undeveloped pull-outs along the Glenn Highway.
Glenn Highway: Undeveloped Pull-Outs
Milepost Side of Highway Name Comments
36.5 - Matanuska Townsite Overlook - 37.2 - Echo Lake Pull Out Gravel parking and lake access 49.9 NB Matanuska River Overlook Double ended paved pull out 54.2 - n/a Gravel pull off 55 - n/a Gravel pull off 56 NB n/a Gravel pull off 56.5 SB n/a Gravel pull off 57.6 NB n/a Gravel pull off 58.6 NB n/a Small scenic viewpoint 60.3 - n/a Small scenic viewpoint 60.7 SB n/a Double ended paved pull out 61.6 - Alpine Historic Park Parking 62.8 NB Sutton Matanuska River Viewpoint Large Parking Area 65.6 NB n/a Gravel pull out 66.4 - King River Trailhead - 66.8 NB n/a Gravel pull out 66.9 NB n/a Gravel pull out 68.6 NB n/a Gravel pull out 68.7 NB n/a Gravel pull out 70.5 NB n/a Gravel pull out 71.7 SB n/a Gravel pull out 72.9 SB n/a Gravel pull out 73 SB n/a Gravel pull out 74 NB n/a Gravel pull out 74.6 NB n/a Gravel pull out 75.4 NB n/a Gravel pull out 75.5 NB n/a Gravel pull out 76.4 NB n/a Gravel pull out 76.7 NB n/a Gravel pull out 77.4 NB n/a Gravel pull out 77.8 - n/a Gravel pull out 78.1 NB King Mountain Viewpoint Gravel pull out 80 NB n/a Gravel pull out 80.8 NB n/a Gravel pull out 82 NB n/a Gravel pull out 84 NB n/a Gravel pull out 84.6 SB n/a Gravel pull out 85.9 NB n/a Gravel pull out 86.5 NB n/a Gravel pull out 86.6 NB n/a Gravel pull out 87.3 SB n/a Gravel pull out 87.5 NB Weiner Lake Limited access gravel parking
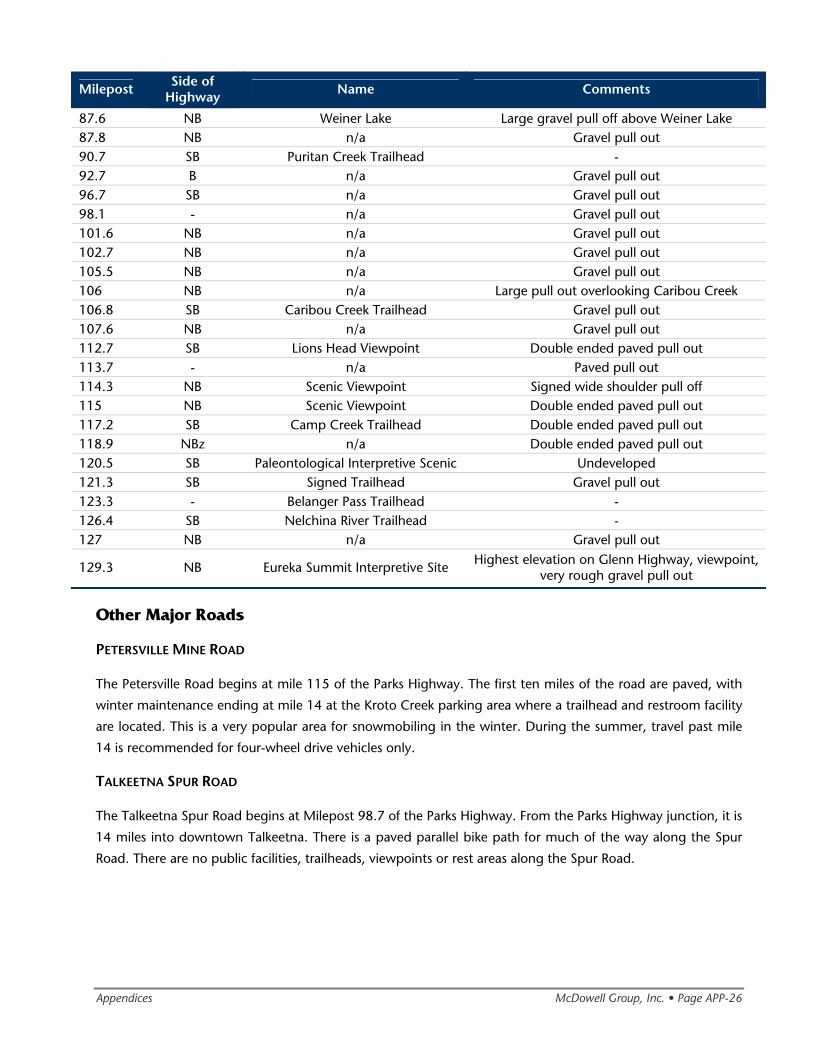
Appendices McDowell Group, Inc. • Page APP-26
Milepost Side of Highway Name Comments
87.6 NB Weiner Lake Large gravel pull off above Weiner Lake 87.8 NB n/a Gravel pull out 90.7 SB Puritan Creek Trailhead - 92.7 B n/a Gravel pull out 96.7 SB n/a Gravel pull out 98.1 - n/a Gravel pull out 101.6 NB n/a Gravel pull out 102.7 NB n/a Gravel pull out 105.5 NB n/a Gravel pull out 106 NB n/a Large pull out overlooking Caribou Creek 106.8 SB Caribou Creek Trailhead Gravel pull out 107.6 NB n/a Gravel pull out 112.7 SB Lions Head Viewpoint Double ended paved pull out 113.7 - n/a Paved pull out 114.3 NB Scenic Viewpoint Signed wide shoulder pull off 115 NB Scenic Viewpoint Double ended paved pull out 117.2 SB Camp Creek Trailhead Double ended paved pull out 118.9 NBz n/a Double ended paved pull out 120.5 SB Paleontological Interpretive Scenic Undeveloped 121.3 SB Signed Trailhead Gravel pull out 123.3 - Belanger Pass Trailhead - 126.4 SB Nelchina River Trailhead - 127 NB n/a Gravel pull out
129.3 NB Eureka Summit Interpretive Site Highest elevation on Glenn Highway, viewpoint,
very rough gravel pull out
Other Major Roads
PETERSVILLE MINE ROAD
The Petersville Road begins at mile 115 of the Parks Highway. The first ten miles of the road are paved, with
winter maintenance ending at mile 14 at the Kroto Creek parking area where a trailhead and restroom facility
are located. This is a very popular area for snowmobiling in the winter. During the summer, travel past mile
14 is recommended for four-wheel drive vehicles only.
TALKEETNA SPUR ROAD
The Talkeetna Spur Road begins at Milepost 98.7 of the Parks Highway. From the Parks Highway junction, it is
14 miles into downtown Talkeetna. There is a paved parallel bike path for much of the way along the Spur
Road. There are no public facilities, trailheads, viewpoints or rest areas along the Spur Road.
Appendices McDowell Group, Inc. • Page APP-27
PALMER/ WILLOW FISHHOOK ROAD
The Palmer/Willow Fishhook Road crosses the Talkeetna Mountains over Hatcher Pass. Fishhook Road starts at
the junction of the Glenn Highway just east of Palmer and ends 48 miles later at the junction of the Parks
Highway. The road is paved and well maintained up to the entrance of the Independence Mine State Historic
Site. The road is closed at mile 18 in the winter. In the summer the road continues over Hatcher Pass at mile
19 and then continues down to Willow for 29 more miles.
Along the Fishhook Road there are trailheads for Government Peak, Gold Mint Trail, Reed Lakes, Archangel
Trail, Fishhook Trail, Cragie Creek Trail and Willow Creek Trail. At the top of the pass is the Summit Lake
Recreation Area. There are trails and view points at Summit Lake, but no other visitor services.
KNIK ARM BRIDGE
The possibility of an 8,200 foot bridge over Knik Arm, connecting Anchorage and Port MacKenzie area, has
been evaluated over the past few years. In December 2007, the Federal Highway Administration signed a final
Environmental Impact Statement for the project. The final hurdle to start the project will be the approval of
the plan by the Federal Highway Administration. The preferred approach on the Mat-Su Borough side begins
at the intersection of the Burma Road and Point Mackenzie Road, traveling south to the Point Mackenzie
District, and following the northern alignment through the Point Mackenzie District.
If this bridge is developed, it could have implications for visitor traffic patterns; however, at this point, no tour
company is planning for any changes in their programs.
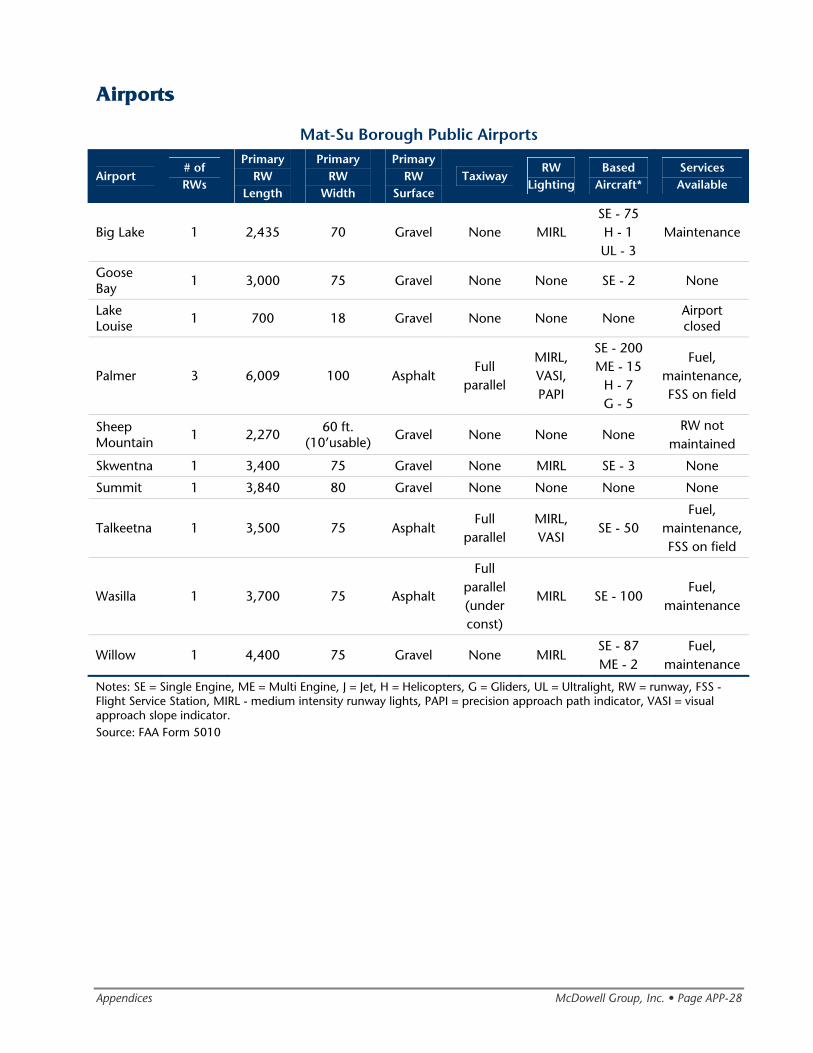
Appendices McDowell Group, Inc. • Page APP-28
Airports
Mat-Su Borough Public Airports
Airport # of RWs
Primary RW
Length
Primary RW
Width
Primary RW
Surface Taxiway
RW Lighting
Based Aircraft*
Services Available
Big Lake 1 2,435 70 Gravel None MIRL SE - 75 H - 1 UL - 3
Maintenance
Goose Bay 1 3,000 75 Gravel None None SE - 2 None
Lake Louise 1 700 18 Gravel None None None
Airport closed
Palmer 3 6,009 100 Asphalt Full
parallel
MIRL, VASI, PAPI
SE - 200 ME - 15
H - 7 G - 5
Fuel, maintenance, FSS on field
Sheep Mountain
1 2,270 60 ft. (10’usable)
Gravel None None None RW not
maintained
Skwentna 1 3,400 75 Gravel None MIRL SE - 3 None
Summit 1 3,840 80 Gravel None None None None
Talkeetna 1 3,500 75 Asphalt Full
parallel MIRL, VASI
SE - 50 Fuel,
maintenance, FSS on field
Wasilla 1 3,700 75 Asphalt
Full parallel (under const)
MIRL SE - 100 Fuel,
maintenance
Willow 1 4,400 75 Gravel None MIRL SE - 87 ME - 2
Fuel, maintenance
Notes: SE = Single Engine, ME = Multi Engine, J = Jet, H = Helicopters, G = Gliders, UL = Ultralight, RW = runway, FSS - Flight Service Station, MIRL - medium intensity runway lights, PAPI = precision approach path indicator, VASI = visual approach slope indicator. Source: FAA Form 5010
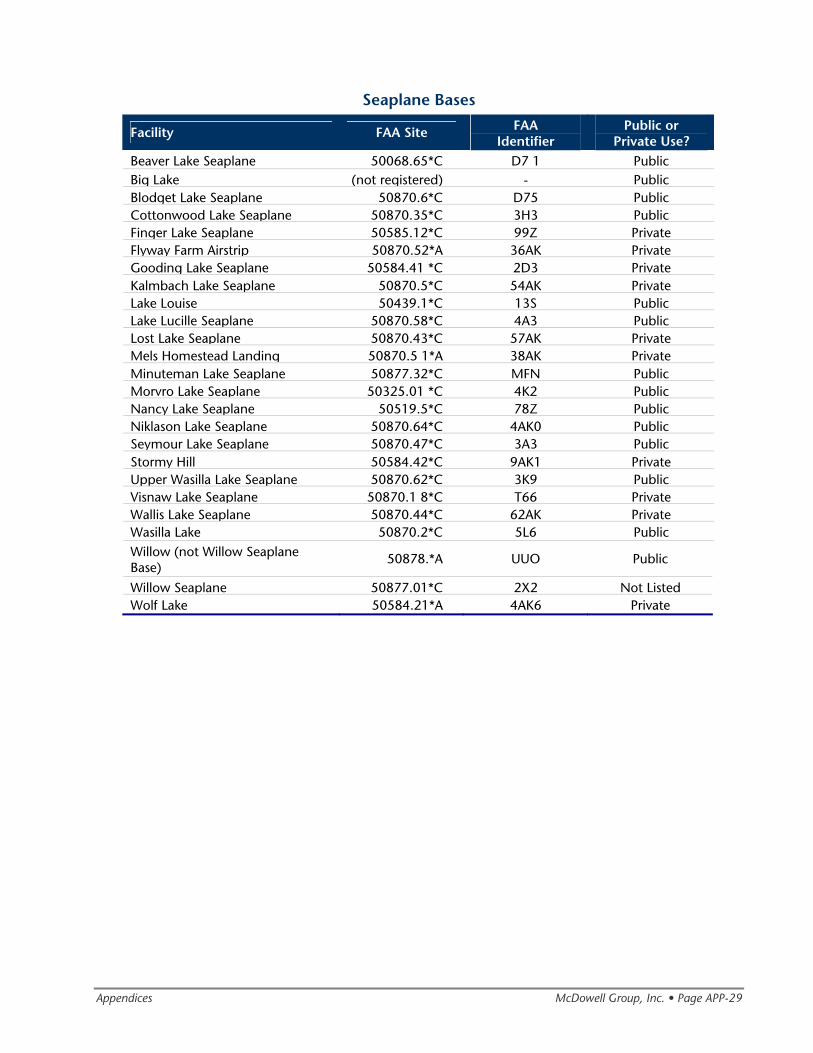
Appendices McDowell Group, Inc. • Page APP-29
Seaplane Bases
Facility FAA Site FAA Identifier
Public or Private Use?
Beaver Lake Seaplane 50068.65*C D7 1 PublicBig Lake (not registered) - PublicBlodget Lake Seaplane 50870.6*C D75 PublicCottonwood Lake Seaplane 50870.35*C 3H3 PublicFinger Lake Seaplane 50585.12*C 99Z PrivateFlyway Farm Airstrip 50870.52*A 36AK PrivateGooding Lake Seaplane 50584.41 *C 2D3 PrivateKalmbach Lake Seaplane 50870.5*C 54AK PrivateLake Louise 50439.1*C 13S PublicLake Lucille Seaplane 50870.58*C 4A3 PublicLost Lake Seaplane 50870.43*C 57AK PrivateMels Homestead Landing 50870.5 1*A 38AK PrivateMinuteman Lake Seaplane 50877.32*C MFN PublicMorvro Lake Seaplane 50325.01 *C 4K2 PublicNancy Lake Seaplane 50519.5*C 78Z PublicNiklason Lake Seaplane 50870.64*C 4AK0 PublicSeymour Lake Seaplane 50870.47*C 3A3 PublicStormy Hill 50584.42*C 9AK1 PrivateUpper Wasilla Lake Seaplane 50870.62*C 3K9 PublicVisnaw Lake Seaplane 50870.1 8*C T66 PrivateWallis Lake Seaplane 50870.44*C 62AK PrivateWasilla Lake 50870.2*C 5L6 Public Willow (not Willow Seaplane Base)
50878.*A UUO Public
Willow Seaplane 50877.01*C 2X2 Not ListedWolf Lake 50584.21*A 4AK6 Private
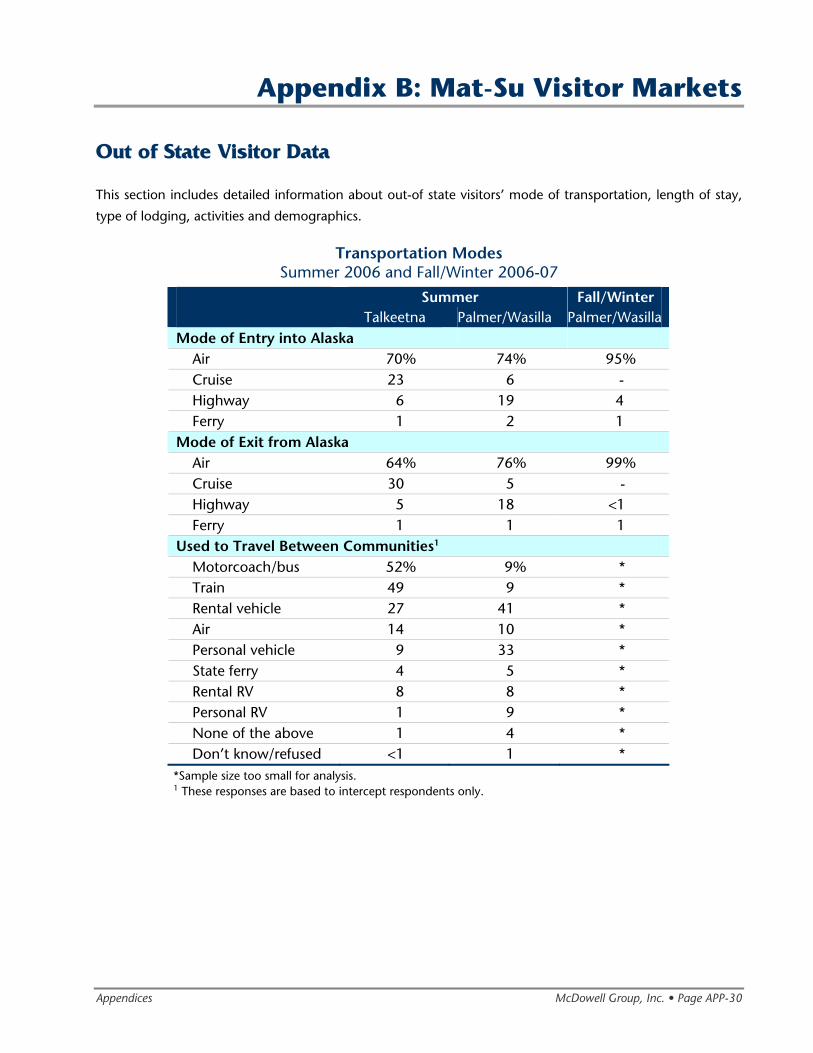
Appendices McDowell Group, Inc. • Page APP-30
Appendix B: Mat-Su Visitor Markets
Out of State Visitor Data
This section includes detailed information about out-of state visitors’ mode of transportation, length of stay,
type of lodging, activities and demographics.
Transportation Modes Summer 2006 and Fall/Winter 2006-07
Summer Fall/Winter Talkeetna Palmer/Wasilla Palmer/WasillaMode of Entry into Alaska
Air 70% 74% 95% Cruise 23 6 - Highway 6 19 4 Ferry 1 2 1
Mode of Exit from Alaska Air 64% 76% 99% Cruise 30 5 - Highway 5 18 <1 Ferry 1 1 1
Used to Travel Between Communities1 Motorcoach/bus 52% 9% * Train 49 9 * Rental vehicle 27 41 * Air 14 10 * Personal vehicle 9 33 * State ferry 4 5 * Rental RV 8 8 * Personal RV 1 9 * None of the above 1 4 * Don’t know/refused <1 1 *
*Sample size too small for analysis. 1 These responses are based to intercept respondents only.
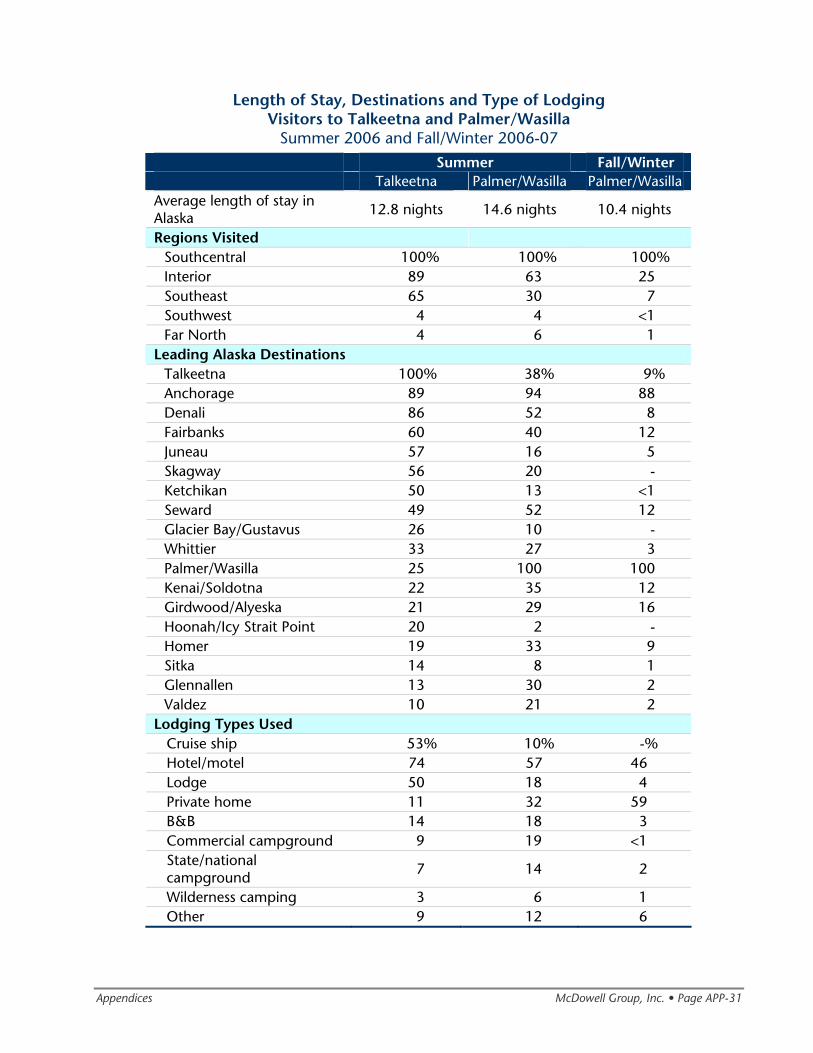
Appendices McDowell Group, Inc. • Page APP-31
Length of Stay, Destinations and Type of Lodging Visitors to Talkeetna and Palmer/Wasilla
Summer 2006 and Fall/Winter 2006-07
Summer Fall/Winter Talkeetna Palmer/Wasilla Palmer/Wasilla Average length of stay in Alaska
12.8 nights 14.6 nights 10.4 nights
Regions Visited Southcentral 100% 100% 100% Interior 89 63 25 Southeast 65 30 7 Southwest 4 4 <1 Far North 4 6 1
Leading Alaska Destinations Talkeetna 100% 38% 9% Anchorage 89 94 88 Denali 86 52 8 Fairbanks 60 40 12 Juneau 57 16 5 Skagway 56 20 - Ketchikan 50 13 <1 Seward 49 52 12 Glacier Bay/Gustavus 26 10 - Whittier 33 27 3 Palmer/Wasilla 25 100 100 Kenai/Soldotna 22 35 12 Girdwood/Alyeska 21 29 16 Hoonah/Icy Strait Point 20 2 - Homer 19 33 9 Sitka 14 8 1 Glennallen 13 30 2 Valdez 10 21 2
Lodging Types Used Cruise ship 53% 10% -% Hotel/motel 74 57 46 Lodge 50 18 4 Private home 11 32 59 B&B 14 18 3 Commercial campground 9 19 <1 State/national campground
7 14 2
Wilderness camping 3 6 1 Other 9 12 6
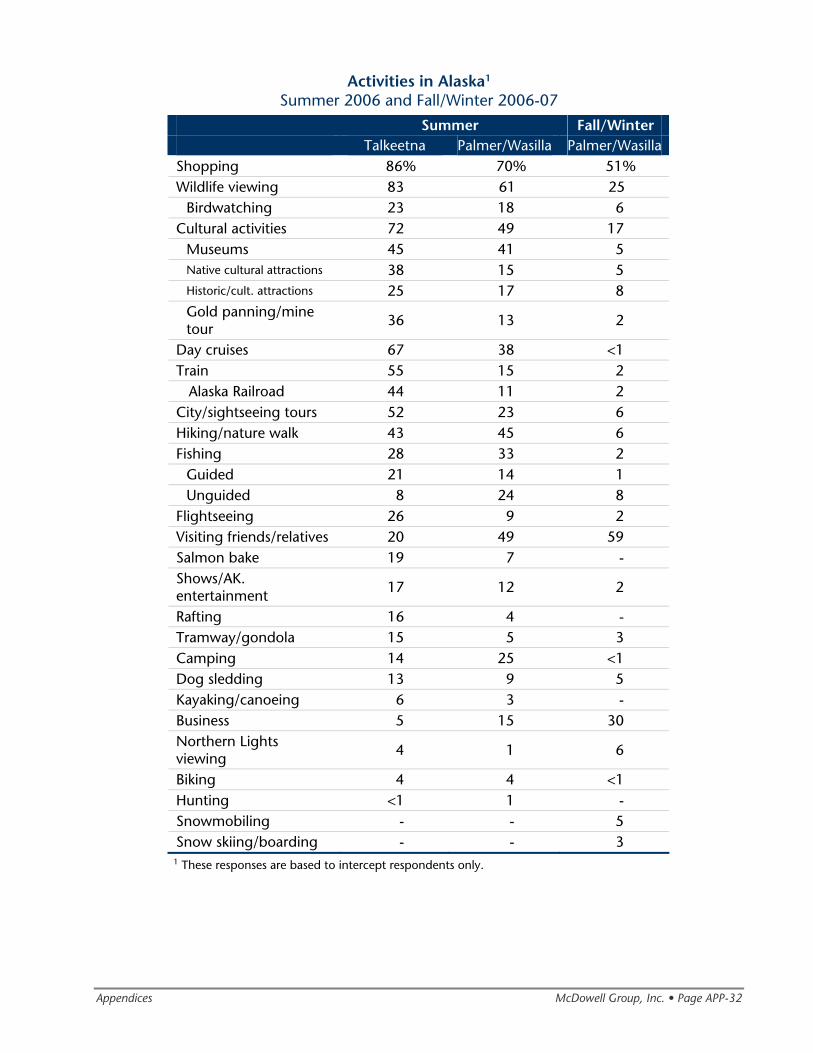
Appendices McDowell Group, Inc. • Page APP-32
Activities in Alaska1 Summer 2006 and Fall/Winter 2006-07
Summer Fall/Winter Talkeetna Palmer/Wasilla Palmer/WasillaShopping 86% 70% 51% Wildlife viewing 83 61 25
Birdwatching 23 18 6 Cultural activities 72 49 17
Museums 45 41 5 Native cultural attractions 38 15 5 Historic/cult. attractions 25 17 8 Gold panning/mine tour
36 13 2
Day cruises 67 38 <1 Train 55 15 2
Alaska Railroad 44 11 2 City/sightseeing tours 52 23 6 Hiking/nature walk 43 45 6 Fishing 28 33 2
Guided 21 14 1 Unguided 8 24 8
Flightseeing 26 9 2 Visiting friends/relatives 20 49 59 Salmon bake 19 7 - Shows/AK. entertainment 17 12 2
Rafting 16 4 - Tramway/gondola 15 5 3 Camping 14 25 <1 Dog sledding 13 9 5 Kayaking/canoeing 6 3 - Business 5 15 30 Northern Lights viewing 4 1 6
Biking 4 4 <1 Hunting <1 1 - Snowmobiling - - 5 Snow skiing/boarding - - 3
1 These responses are based to intercept respondents only.
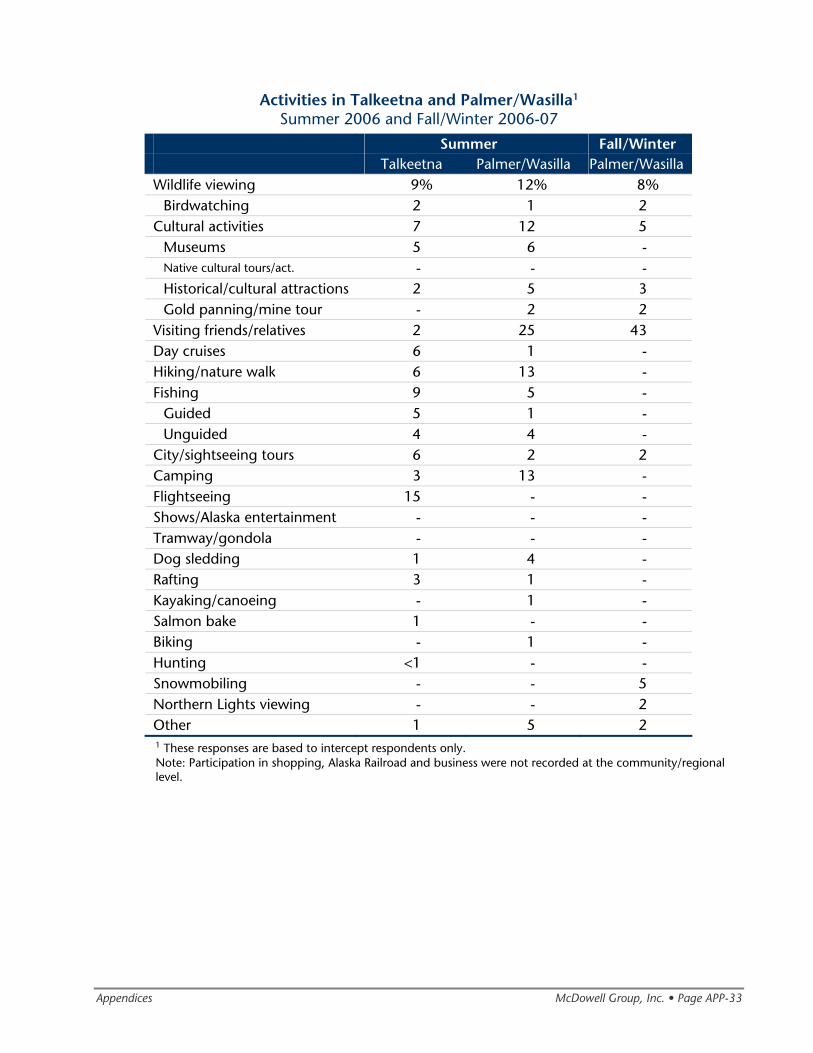
Appendices McDowell Group, Inc. • Page APP-33
Activities in Talkeetna and Palmer/Wasilla1 Summer 2006 and Fall/Winter 2006-07
Summer Fall/Winter Talkeetna Palmer/Wasilla Palmer/Wasilla Wildlife viewing 9% 12% 8%
Birdwatching 2 1 2 Cultural activities 7 12 5
Museums 5 6 - Native cultural tours/act. - - - Historical/cultural attractions 2 5 3 Gold panning/mine tour - 2 2
Visiting friends/relatives 2 25 43 Day cruises 6 1 - Hiking/nature walk 6 13 - Fishing 9 5 -
Guided 5 1 - Unguided 4 4 -
City/sightseeing tours 6 2 2 Camping 3 13 - Flightseeing 15 - - Shows/Alaska entertainment - - - Tramway/gondola - - - Dog sledding 1 4 - Rafting 3 1 - Kayaking/canoeing - 1 - Salmon bake 1 - - Biking - 1 - Hunting <1 - - Snowmobiling - - 5 Northern Lights viewing - - 2 Other 1 5 2 1 These responses are based to intercept respondents only. Note: Participation in shopping, Alaska Railroad and business were not recorded at the community/regional level.
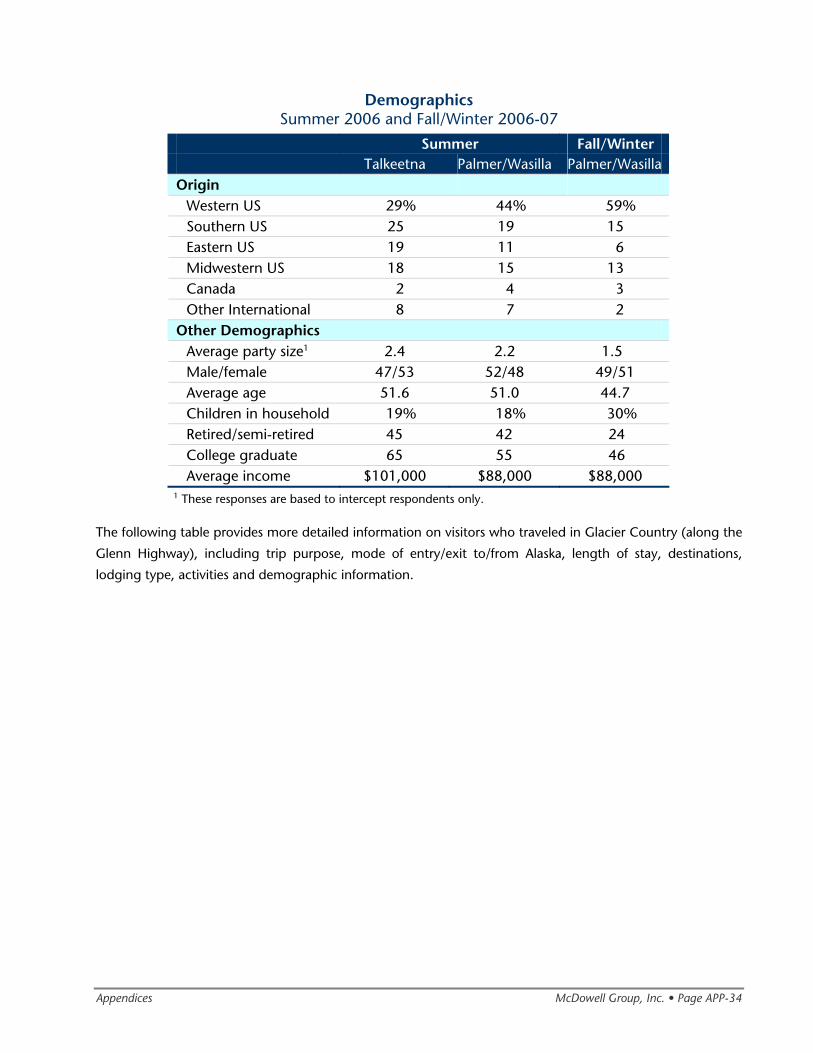
Appendices McDowell Group, Inc. • Page APP-34
Demographics Summer 2006 and Fall/Winter 2006-07
Summer Fall/Winter Talkeetna Palmer/Wasilla Palmer/WasillaOrigin
Western US 29% 44% 59% Southern US 25 19 15 Eastern US 19 11 6 Midwestern US 18 15 13 Canada 2 4 3 Other International 8 7 2
Other Demographics Average party size1 2.4 2.2 1.5 Male/female 47/53 52/48 49/51 Average age 51.6 51.0 44.7 Children in household 19% 18% 30% Retired/semi-retired 45 42 24 College graduate 65 55 46 Average income $101,000 $88,000 $88,000
1 These responses are based to intercept respondents only.
The following table provides more detailed information on visitors who traveled in Glacier Country (along the
Glenn Highway), including trip purpose, mode of entry/exit to/from Alaska, length of stay, destinations,
lodging type, activities and demographic information.
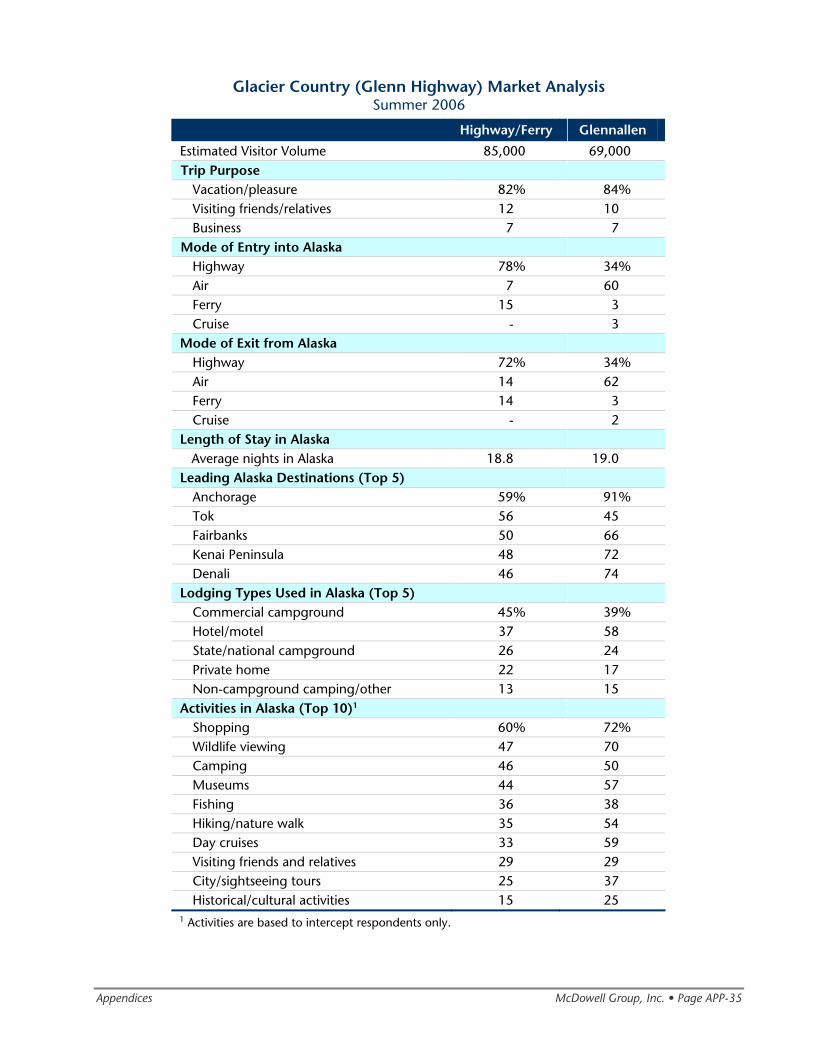
Appendices McDowell Group, Inc. • Page APP-35
Glacier Country (Glenn Highway) Market Analysis Summer 2006
Highway/Ferry Glennallen
Estimated Visitor Volume 85,000 69,000 Trip Purpose
Vacation/pleasure 82% 84% Visiting friends/relatives 12 10 Business 7 7
Mode of Entry into Alaska Highway 78% 34% Air 7 60 Ferry 15 3 Cruise - 3
Mode of Exit from Alaska Highway 72% 34% Air 14 62 Ferry 14 3 Cruise - 2
Length of Stay in Alaska Average nights in Alaska 18.8 19.0
Leading Alaska Destinations (Top 5) Anchorage 59% 91% Tok 56 45 Fairbanks 50 66 Kenai Peninsula 48 72 Denali 46 74
Lodging Types Used in Alaska (Top 5) Commercial campground 45% 39% Hotel/motel 37 58 State/national campground 26 24 Private home 22 17 Non-campground camping/other 13 15
Activities in Alaska (Top 10)1 Shopping 60% 72% Wildlife viewing 47 70 Camping 46 50 Museums 44 57 Fishing 36 38 Hiking/nature walk 35 54 Day cruises 33 59 Visiting friends and relatives 29 29 City/sightseeing tours 25 37 Historical/cultural activities 15 25
1 Activities are based to intercept respondents only.
Appendices McDowell Group, Inc. • Page APP-36
In-state Visitor Data
Alaska Resident Visitor Profile
The study team examined the two recently conducted studies that profiled Alaska residents’ travel patterns in
the Mat-Su region. The most recent study captured Mat-Su travel information at a more general level, as the
context of the study was to understand statewide patterns, motives and information sources. The research
conducted specifically for Mat-Su in 1997-98 probed for significantly more information about travel
frequency, spending and experiences in the region. Key findings from the two studies are summarized below.
ALASKA RESIDENT IN-STATE PLEASURE TRAVEL STUDY
The following information about the in-state pleasure travel market is summarized from the survey conducted
by GMA Research Corporation for the Alaska Travel Industry Association. In-state pleasure travel represents a
significant portion of the Alaska travel market—especially for Mat-Su communities and attractions located
along the highway system. The full study included surveys with residents located in nine Alaska regions:
Anchorage, Fairbanks, Kenai, Mat-Su, Urban Southeast, Rural Southeast, Interior Highways, Southwest and
Other Interior. Travel information most relevant to Mat-Su included the statewide sample and the three
largest and most accessible communities (Anchorage, Fairbanks and Kenai).
This research reinforces the study team’s assumptions about frequent travel by Anchorage residents to Mat-Su
destinations for both day and overnight trips. Additionally, Alaska residents transit the Mat-Su region when
traveling to other Alaska destinations like Denali, Fairbanks and destinations along the Richardson Highway.
Fairbanks and Kenai residents also travel to and through the Mat-Su borough with great frequency. While
their resident population is smaller than Anchorage, they are much more likely than Anchorage residents to
stay in hotels or other accommodations, while Anchorage residents are more likely to camp.
STATEWIDE SURVEY RESULTS
Statewide findings regarding day trips:
• Statewide, 62 percent of residents took one or more day trips 50 miles from home within the past
year.
• Residents living along the Southcentral road system participated in more frequent day trips than
residents in other areas. Kenai Peninsula residents reported the highest in-state pleasure travel rate
(87 percent), followed by Anchorage and Mat-Su residents (85 percent and 84 percent respectively).
• Alaska residents took an average of 10.9 day trips. The average party size was 3.1 people.
• The leading motives for day trips included visiting friends and family (40 percent), fishing (30
percent), shopping (26 percent) and sightseeing (24 percent).
• Peak travel months were June, July and August.
Appendices McDowell Group, Inc. • Page APP-37
Statewide findings regarding overnight trips:
• Eighty-eight percent of residents took at least one overnight trip in the past year. The average
number of overnight pleasure trips was 6.3 trips. The average party size was 2.9 people.
• Leading motives for in-state pleasure travel included visiting friends and family (50 percent),
fun/pleasure (24 percent), shopping (22 percent) and fishing (21 percent).
• As with day trips, the peak months for overnight pleasure travel were the mid-summer months.
ANCHORAGE SURVEY RESULTS
Anchorage findings regarding day trips:
• The vast majority of Anchorage residents (85 percent) took one or more day trips in the past year.
• Several Mat-Su communities were among the leading day-trip destinations including Wasilla (23
percent), Talkeetna (17 percent) and Palmer (14 percent).
• Leading travel motives included visiting friends and family, fishing, sightseeing and fun/pleasure.
Anchorage findings regarding overnight trips:
• Eighty-one percent of Anchorage residents took at least one overnight trip in the past year.
• Leading destinations included Seward (33 percent), Homer (31 percent), Fairbanks (19 percent),
Kenai (18 percent), Valdez (8 percent), Denali/Denali Park (8 percent) and Talkeetna (8 percent).
• The most frequently mentioned lodging choices included motel/hotel (41 percent), friend/relative
house (29 percent), motorhome/camper in campground (23 percent), tent camping (22 percent),
cabin (16 percent) and motorhome/camper not in campground (12 percent).
FAIRBANKS SURVEY RESULTS
Fairbanks findings regarding day trips:
• Nearly two-thirds (64 percent) of Fairbanks residents took one or more day trips 50 miles from home
within the past year.
• Top day-trip destinations included Delta (33 percent), Denali (28 percent), Anchorage (25 percent)
and Chena Hot Springs/Chena Lake (25 percent).
Fairbanks findings regarding overnight trips:
• Virtually all Fairbanks residents took at least one overnight pleasure trip in the past year (94 percent).
• The leading destinations included Anchorage (72 percent), Valdez (27 percent) and Wasilla (10
percent). Travel frequency for each of the three destination communities was similar, ranging from
2.5 trips to 2.9 trips.
Appendices McDowell Group, Inc. • Page APP-38
• Fairbanks residents utilized motels and hotels significantly more often than other choices. Sixty
percent utilized a motel/hotel while 27 percent stayed with friends or relatives. Various camping
options were mentioned by 15 percent or less.
KENAI SURVEY RESULTS
Kenai findings regarding day trips:
• While 87 percent of Kenai residents reported taking at least one day-trip, Mat-Su communities were
not among the leading destinations.
Kenai findings regarding overnight trips:
• Eighty-eight percent of Kenai residents took one or more overnight pleasure trips in the past year.
• Wasilla was the third most frequently mentioned destination at 13 percent. Kenai residents who had
traveled to Wasilla reported an average of 2.9 trips in the past year.
• It is also important to point out that 10 percent of Kenai residents visited Fairbanks during the past
year. The average number of trips was 2.6. These residents likely transited, and possibly overnighted,
in Mat-Su on their way to and from Fairbanks.
Kenai residents also demonstrate strong preferences for commercial lodging, with 65 percent staying in a
hotel or motel, followed by 48 percent that stayed with friends or relatives. Various camping alternatives were
mentioned by 8 percent or fewer residents.
MAT-SU VISITOR IMPACT STUDIES
The following information is drawn from the series of reports about the Mat-Su visitor markets conducted in
1997-98 by Alaska Village Initiatives. While this study is dated, it is one of the most comprehensive analyses of
the in-state travel market available.
Important conclusions drawn from this research include the fact that the Anchorage market, due to the large
population base and propensity to take frequent day and overnight trips, is the most important in-state
market for Mat-Su. While a significant portion of this market elects to make day trips or camp at various times
of the year, they also use Mat-Su accommodations with great frequency.
Detailed information on visitor volume, travel patterns and activities can be found in Appendix B.
VISITOR VOLUME
During fall/winter 1997-1998, an estimated 166,587 Alaska residents visited Mat-Su.1 The total number of
trips taken by Alaska residents was estimated at nearly 1.7 million trips. Spending in the region was estimated
at $45.3 million. Anchorage residents were nearly twice as likely to visit Mat-Su as residents from Fairbanks or
Kenai/Soldotna.
1 Mat-Su Visitor Impact Study, Fall/Winter 1997-1998, Alaska Village Initiatives
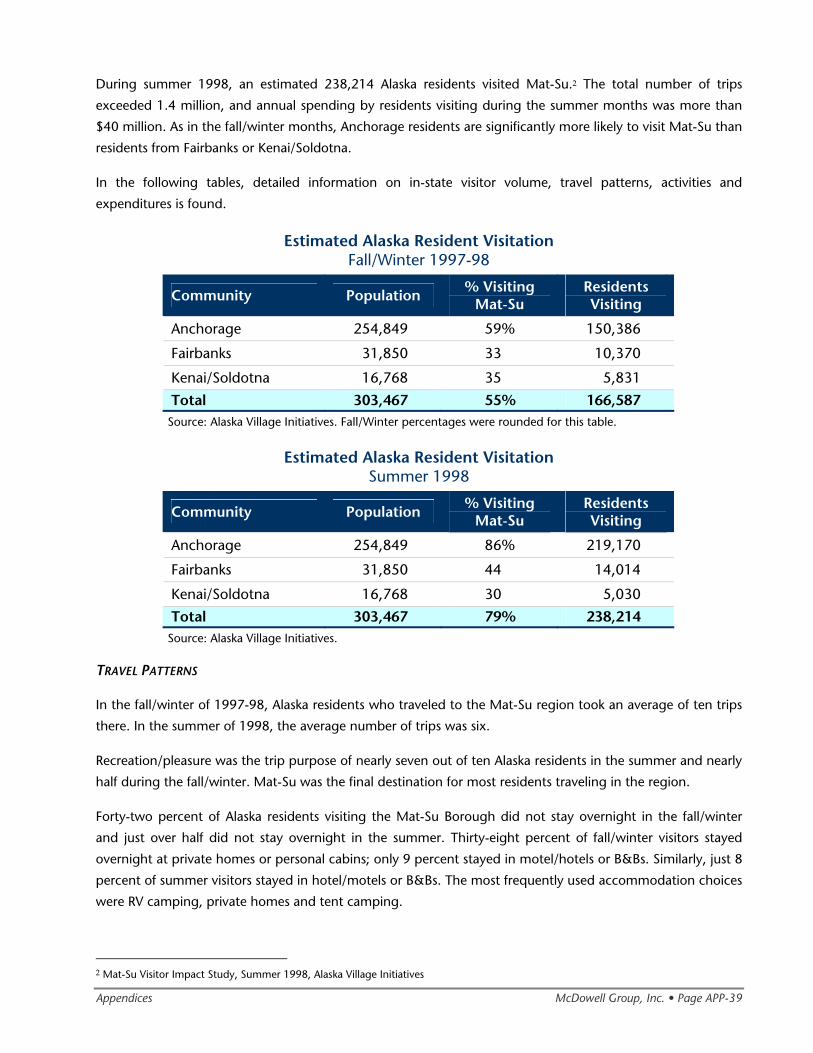
Appendices McDowell Group, Inc. • Page APP-39
During summer 1998, an estimated 238,214 Alaska residents visited Mat-Su.2 The total number of trips
exceeded 1.4 million, and annual spending by residents visiting during the summer months was more than
$40 million. As in the fall/winter months, Anchorage residents are significantly more likely to visit Mat-Su than
residents from Fairbanks or Kenai/Soldotna.
In the following tables, detailed information on in-state visitor volume, travel patterns, activities and
expenditures is found.
Estimated Alaska Resident Visitation Fall/Winter 1997-98
Community Population % Visiting
Mat-Su Residents Visiting
Anchorage 254,849 59% 150,386
Fairbanks 31,850 33 10,370
Kenai/Soldotna 16,768 35 5,831
Total 303,467 55% 166,587 Source: Alaska Village Initiatives. Fall/Winter percentages were rounded for this table.
Estimated Alaska Resident Visitation Summer 1998
Community Population % Visiting
Mat-Su Residents Visiting
Anchorage 254,849 86% 219,170
Fairbanks 31,850 44 14,014
Kenai/Soldotna 16,768 30 5,030
Total 303,467 79% 238,214 Source: Alaska Village Initiatives.
TRAVEL PATTERNS
In the fall/winter of 1997-98, Alaska residents who traveled to the Mat-Su region took an average of ten trips
there. In the summer of 1998, the average number of trips was six.
Recreation/pleasure was the trip purpose of nearly seven out of ten Alaska residents in the summer and nearly
half during the fall/winter. Mat-Su was the final destination for most residents traveling in the region.
Forty-two percent of Alaska residents visiting the Mat-Su Borough did not stay overnight in the fall/winter
and just over half did not stay overnight in the summer. Thirty-eight percent of fall/winter visitors stayed
overnight at private homes or personal cabins; only 9 percent stayed in motel/hotels or B&Bs. Similarly, just 8
percent of summer visitors stayed in hotel/motels or B&Bs. The most frequently used accommodation choices
were RV camping, private homes and tent camping.
2 Mat-Su Visitor Impact Study, Summer 1998, Alaska Village Initiatives
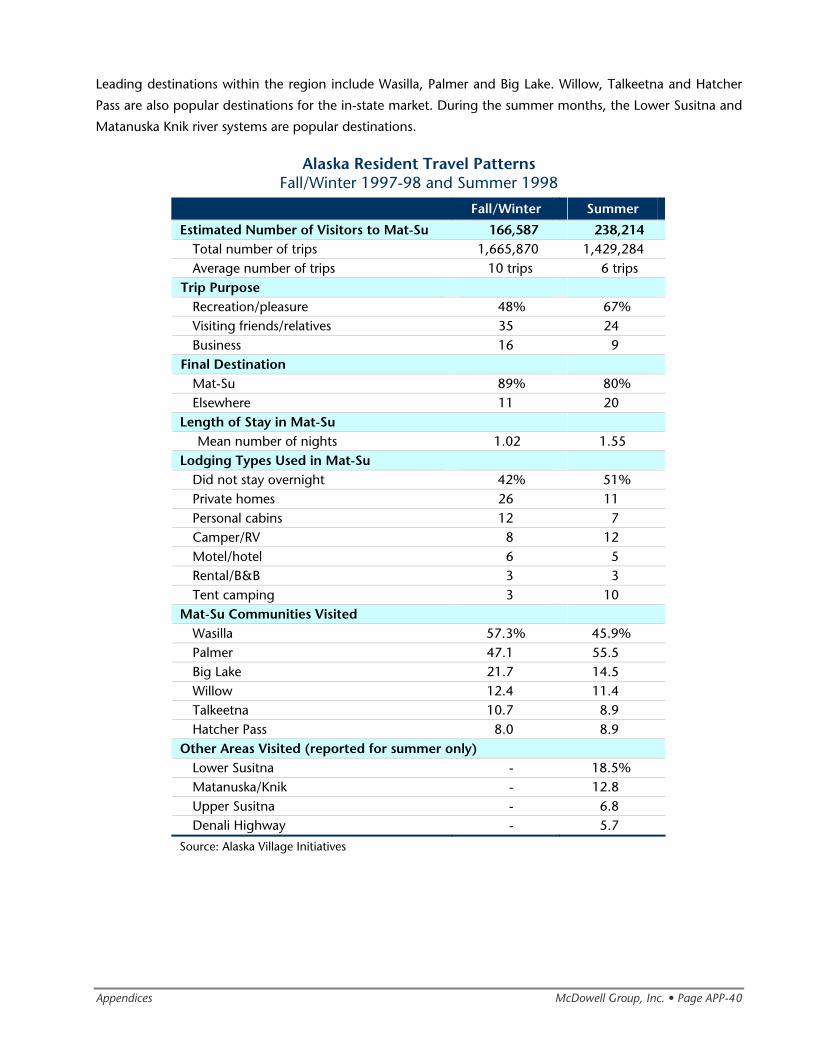
Appendices McDowell Group, Inc. • Page APP-40
Leading destinations within the region include Wasilla, Palmer and Big Lake. Willow, Talkeetna and Hatcher
Pass are also popular destinations for the in-state market. During the summer months, the Lower Susitna and
Matanuska Knik river systems are popular destinations.
Alaska Resident Travel Patterns Fall/Winter 1997-98 and Summer 1998
Fall/Winter Summer
Estimated Number of Visitors to Mat-Su 166,587 238,214 Total number of trips 1,665,870 1,429,284 Average number of trips 10 trips 6 trips
Trip Purpose Recreation/pleasure 48% 67% Visiting friends/relatives 35 24 Business 16 9
Final Destination Mat-Su 89% 80% Elsewhere 11 20
Length of Stay in Mat-Su Mean number of nights 1.02 1.55
Lodging Types Used in Mat-Su Did not stay overnight 42% 51% Private homes 26 11 Personal cabins 12 7 Camper/RV 8 12 Motel/hotel 6 5 Rental/B&B 3 3 Tent camping 3 10
Mat-Su Communities Visited Wasilla 57.3% 45.9% Palmer 47.1 55.5 Big Lake 21.7 14.5 Willow 12.4 11.4 Talkeetna 10.7 8.9 Hatcher Pass 8.0 8.9
Other Areas Visited (reported for summer only) Lower Susitna - 18.5% Matanuska/Knik - 12.8 Upper Susitna - 6.8 Denali Highway - 5.7
Source: Alaska Village Initiatives
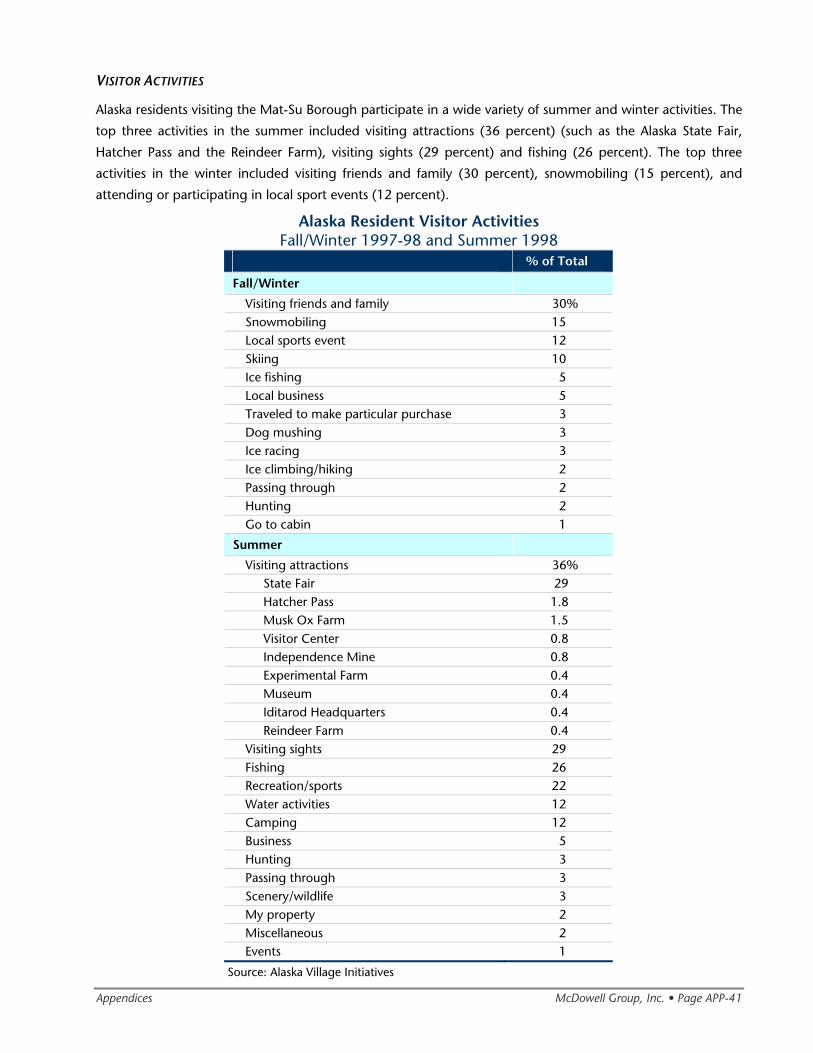
Appendices McDowell Group, Inc. • Page APP-41
VISITOR ACTIVITIES
Alaska residents visiting the Mat-Su Borough participate in a wide variety of summer and winter activities. The
top three activities in the summer included visiting attractions (36 percent) (such as the Alaska State Fair,
Hatcher Pass and the Reindeer Farm), visiting sights (29 percent) and fishing (26 percent). The top three
activities in the winter included visiting friends and family (30 percent), snowmobiling (15 percent), and
attending or participating in local sport events (12 percent).
Alaska Resident Visitor Activities Fall/Winter 1997-98 and Summer 1998
% of Total
Fall/Winter
Visiting friends and family 30% Snowmobiling 15 Local sports event 12 Skiing 10 Ice fishing 5 Local business 5 Traveled to make particular purchase 3 Dog mushing 3 Ice racing 3 Ice climbing/hiking 2 Passing through 2 Hunting 2 Go to cabin 1
Summer
Visiting attractions 36% State Fair 29 Hatcher Pass 1.8 Musk Ox Farm 1.5 Visitor Center 0.8 Independence Mine 0.8 Experimental Farm 0.4 Museum 0.4 Iditarod Headquarters 0.4 Reindeer Farm 0.4
Visiting sights 29 Fishing 26 Recreation/sports 22 Water activities 12 Camping 12 Business 5 Hunting 3 Passing through 3 Scenery/wildlife 3 My property 2 Miscellaneous 2 Events 1
Source: Alaska Village Initiatives
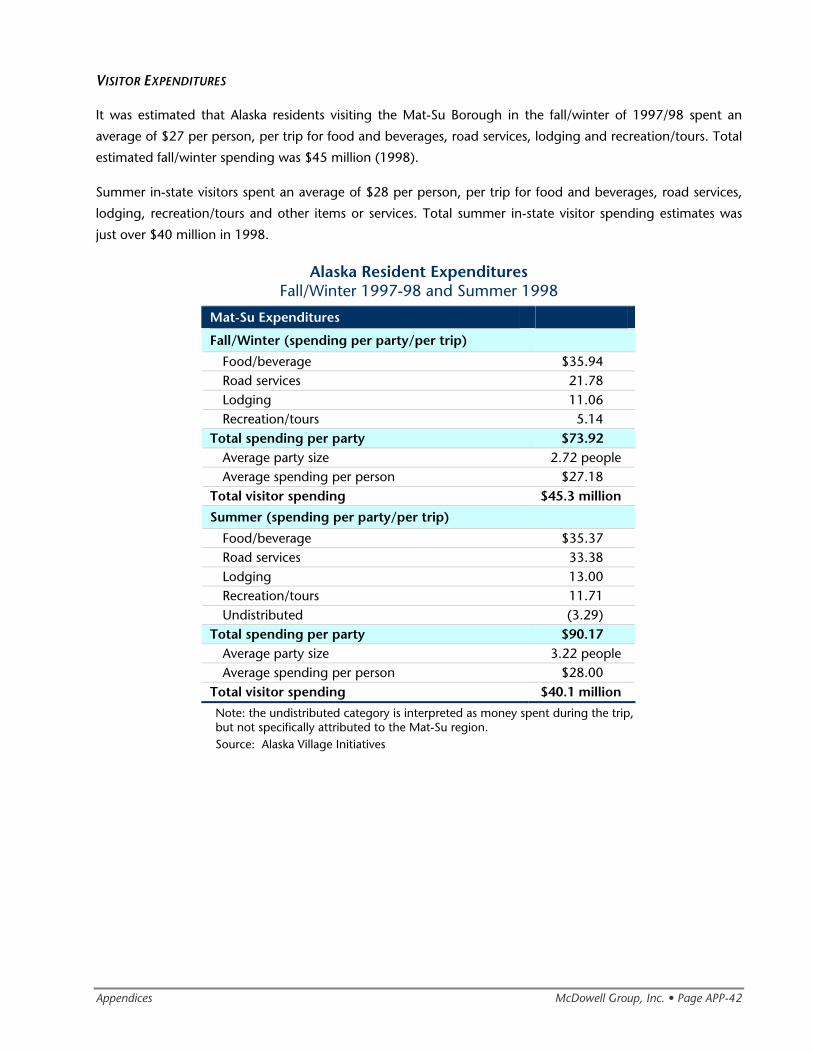
Appendices McDowell Group, Inc. • Page APP-42
VISITOR EXPENDITURES
It was estimated that Alaska residents visiting the Mat-Su Borough in the fall/winter of 1997/98 spent an
average of $27 per person, per trip for food and beverages, road services, lodging and recreation/tours. Total
estimated fall/winter spending was $45 million (1998).
Summer in-state visitors spent an average of $28 per person, per trip for food and beverages, road services,
lodging, recreation/tours and other items or services. Total summer in-state visitor spending estimates was
just over $40 million in 1998.
Alaska Resident Expenditures Fall/Winter 1997-98 and Summer 1998
Mat-Su Expenditures
Fall/Winter (spending per party/per trip)
Food/beverage $35.94 Road services 21.78 Lodging 11.06 Recreation/tours 5.14
Total spending per party $73.92 Average party size 2.72 people Average spending per person $27.18
Total visitor spending $45.3 million
Summer (spending per party/per trip)
Food/beverage $35.37 Road services 33.38 Lodging 13.00 Recreation/tours 11.71 Undistributed (3.29)
Total spending per party $90.17 Average party size 3.22 people Average spending per person $28.00
Total visitor spending $40.1 million
Note: the undistributed category is interpreted as money spent during the trip, but not specifically attributed to the Mat-Su region. Source: Alaska Village Initiatives
Appendices McDowell Group, Inc. • Page APP-43
Sport Fishing Market Information
This section profiles a summary of information gathered from US Fish and Wildlife, Alaska Department of Fish
& Game, The Alaska Department of Commerce, Community and Economic Development, and Mat-Su Visitor
Impact Study (Alaska Village Initiatives) related to sport fishing impacts on the Mat-Su Borough.
US FISH AND WILDLIFE RESEARCH
The 2006 National Survey of Fishing, Hunting and Wildlife-Associated Recreation was conducted by the U.S. Fish
and Wildlife Service. The purpose of this project (conducted every five years) is to measure the importance of
wildlife-based recreation to the public and the associated economic contributions of hunting, fishing and
other wildlife-based activities.
The survey covers wildlife-based activities in the United States by U.S. citizens. In addition to national
estimates of participation and expenditures on sport fishing, the report also provides tables on a state-by-
state basis. The project surveyed resident (Alaskan) and non-resident anglers and captured expenditures for a
wide variety of fishing related equipment and other items. The expenditures were grouped into three main
categories (trip related, equipment related and other fishing expenditures).
In 2006, 293,000 anglers (137,000 residents and 156,000 non-residents) had total sport fishing related
expenditures within the state of Alaska of slightly more than $517 million. When averaged, approximately
$1,766 was spent per angler. However, this crude method of estimating average expenditures includes
participation in half-day excursions and week-long resort experiences.
Resident anglers in Alaska represented in the survey participated in fishing a total of 1.31 million days or an
average of 9.5 days per angler in 2006. Non-resident anglers participated in fishing a total of 521,000 days or
3.3 per angler.
Data from this study was not available by geographic region in Alaska. Without additional information, it is
not possible to develop meaningful estimates of Alaska resident and non-resident anglers and their associated
spending in the Mat-Su.
However, these data suggest that sport fishing enthusiasts, whether Alaska resident or non-resident, spend a
significant amount of money related to this activity. Anecdotally, sport fishing is very popular on Mat-Su’s
lakes and rivers, and is a key attraction for the region. Many regional lodges—both on and off the road
system—cater to Alaska residents and non-residents. Some lodges charge several hundred dollars a night per
person. In addition, many visitors participate in half-day and full-day fishing excursions. Prices range from
approximately $100 to $180 per person.
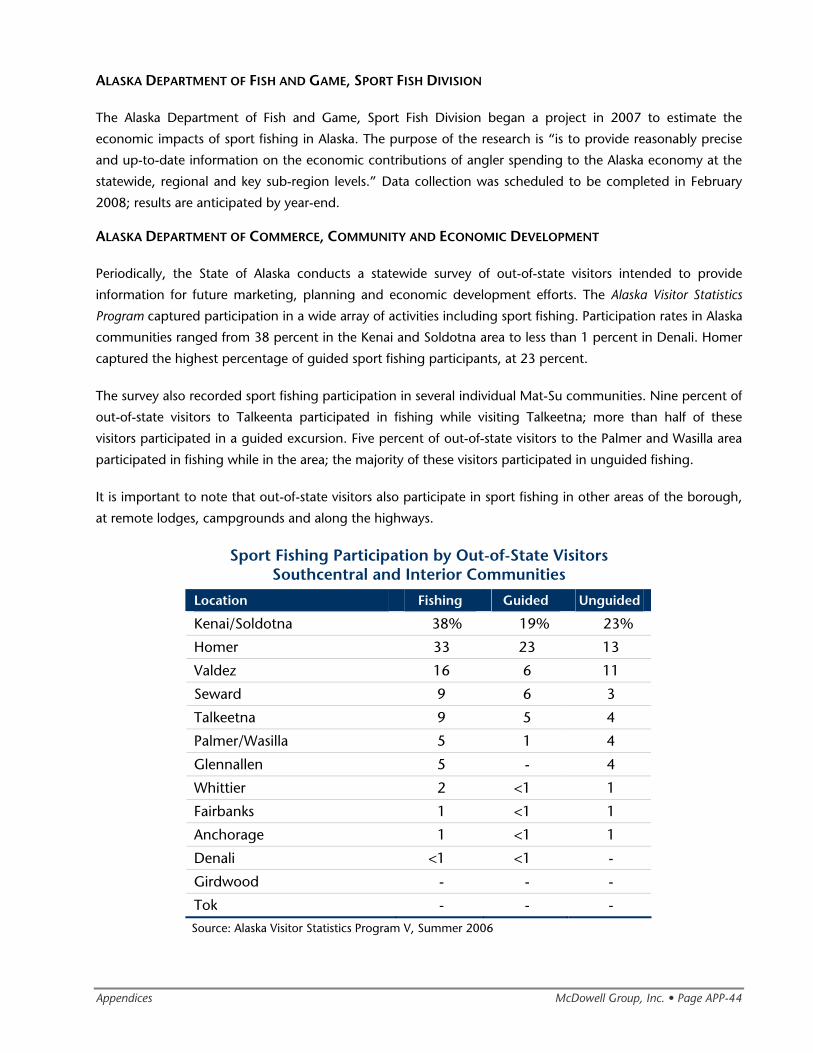
Appendices McDowell Group, Inc. • Page APP-44
ALASKA DEPARTMENT OF FISH AND GAME, SPORT FISH DIVISION
The Alaska Department of Fish and Game, Sport Fish Division began a project in 2007 to estimate the
economic impacts of sport fishing in Alaska. The purpose of the research is “is to provide reasonably precise
and up-to-date information on the economic contributions of angler spending to the Alaska economy at the
statewide, regional and key sub-region levels.” Data collection was scheduled to be completed in February
2008; results are anticipated by year-end.
ALASKA DEPARTMENT OF COMMERCE, COMMUNITY AND ECONOMIC DEVELOPMENT
Periodically, the State of Alaska conducts a statewide survey of out-of-state visitors intended to provide
information for future marketing, planning and economic development efforts. The Alaska Visitor Statistics
Program captured participation in a wide array of activities including sport fishing. Participation rates in Alaska
communities ranged from 38 percent in the Kenai and Soldotna area to less than 1 percent in Denali. Homer
captured the highest percentage of guided sport fishing participants, at 23 percent.
The survey also recorded sport fishing participation in several individual Mat-Su communities. Nine percent of
out-of-state visitors to Talkeenta participated in fishing while visiting Talkeetna; more than half of these
visitors participated in a guided excursion. Five percent of out-of-state visitors to the Palmer and Wasilla area
participated in fishing while in the area; the majority of these visitors participated in unguided fishing.
It is important to note that out-of-state visitors also participate in sport fishing in other areas of the borough,
at remote lodges, campgrounds and along the highways.
Sport Fishing Participation by Out-of-State Visitors Southcentral and Interior Communities
Location Fishing Guided Unguided
Kenai/Soldotna 38% 19% 23%
Homer 33 23 13
Valdez 16 6 11
Seward 9 6 3
Talkeetna 9 5 4
Palmer/Wasilla 5 1 4
Glennallen 5 - 4
Whittier 2 <1 1
Fairbanks 1 <1 1
Anchorage 1 <1 1
Denali <1 <1 -
Girdwood - - -
Tok - - -
Source: Alaska Visitor Statistics Program V, Summer 2006
Appendices McDowell Group, Inc. • Page APP-45
MAT-SU VISITOR IMPACT STUDY
Alaska Village Initiatives conducted a study specifically for the Mat-Su Convention & Visitors Bureau in 1998.
An important component of the study was a telephone survey of Alaska residents living in Anchorage,
Fairbanks and Kenai. The study found that 26 percent of Alaska residents that visited Mat-Su during the
summer months participated in fishing.
Special Events and Attractions
This section includes more detailed information about special events and two significant attractions: the
Alaska State Fair and Hatcher Pass. While out-of-state and in-state visitor volume and expenditures associated
with these events and attractions are already captured in prior chapters, they warrant a special discussion
because they draw visitors into the borough, provide unique national and international media opportunities
and contribute to the character of the Mat-Su region.
Special events such as the Iditarod Trail Sled Dog Race, Iditarod Days Festival and Tesoro Iron Dog attract an
important component of the Mat-Su Borough’s winter visitor market. Below is a description of the major
winter and summer events in the borough, including attendance numbers, where available.
WINTER EVENTS
Arctic Man
The Arctic Man is one of the world's most difficult downhill ski and snowmobile races; it takes place annually
in early April. The race takes place at Summit Lake (mile 196 of the Richardson Highway). The skier begins at
a summit elevation of 5,800 feet and drops 1,700 feet in less than two miles to the bottom of a narrow
canyon where they meet up with their snowmobiling partner. In 2007, approximately 13,000 spectators
(including in-state and out-of-state visitors) attended the event. This event does not take place in the Mat-Su
Borough; however, a majority of the participants travel the Glenn Highway, or other parts of the region, en
route to the event.
Colony Christmas Celebration
This annual event in Palmer features 200 craft vendors, horse-drawn and reindeer sleigh rides, train rides and
fireworks. The event takes place on the second Friday and Saturday of December. Over 5,000 people
attended this event in 2007. The majority of attendees were local, with approximately 300 to 500 coming
from Anchorage.
Appendices McDowell Group, Inc. • Page APP-46
Iditarod Days Festival
Wasilla's annual winter celebration of Alaska's Iditarod Sled Dog Race takes place in late February and early
March. The festival offers ten days of independent events. Approximately 3,200 people attended the Iditarod
Days Festival in 2007. Attendees are predominantly local; however, in-state and out-of-state visitors often
attend the Musher’s Ball. Of the 300 who attend the Musher’s Ball, approximately one-fifth are from outside
of Mat-Su.
Iditarod Trail Sled Dog Race Restart
The Iditarod Trail Sled Dog Race takes place annually in March with a ceremonial start in Anchorage and the
competitive start in Willow. Each team of 12 to 16 dogs and their musher cover over 1,100 miles in 10 to 17
days. In 2007, approximately 20,000 people attended the competitive race start in Willow. Approximately
one-third of attendees were in-state visitors from outside of southcentral Alaska. An additional 2,000 to 3,000
people were spread along the trail up to 42 miles outside of Willow. The competitive start brings a significant
influx of business to area restaurants, gas stations and hotels. Total spending associated with attendance at
the restart is $1.6 million, including residents and visitors. Local attendees are estimated to spend $341,000
and non-local attendees are estimated to spend $1.3 million.
Iditarod Trail Invitational
This sporting event, billed as “the world’s longest human powered winter race,” takes place in late February
and follows the Iditarod Trail from Knik Lake to McGrath (for the short race) or Nome (for the long race).
Participants may travel by snowshoe, bicycle or ski. The event has a limit of 50 racers. In 2008, 36 of the 49
finishers hailed from outside Alaska, including 23 from outside the US.
Talkeetna Moose Dropping Festival
This annual fundraiser of the Talkeetna Historical Society takes place the second weekend in July and includes
the Mountain Mother Contest, a parade, arts and crafts booths, food vendors, live music and an art auction.
Talkeetna Winterfest
This annual, month-long Talkeetna festival in December offers a number of activities including the Bachelor
Society Ball, Wilderness Woman Contest, Taste of Talkeetna and Broom Ball.
Tesoro Iron Dog Snowmobile Race
The Tesoro Iron Dog Race is a snowmobile race that takes place annually in February, beginning in Big Lake
and covering 1,971 miles following the Iditarod Trail to Nome and then backtracking on much of the same
course to the Yukon River, and eventually the Tenana River, for a finish in Fairbanks. Approximately 2,500 to
3,000 people attended the race start at Big Lake in 2008. Attendees are predominantly local.
Willow Winter Carnival
This carnival takes place the last weekend in January and the first weekend in February. Activities include
dogsled racing, cross-country skiing and a talent show.
Appendices McDowell Group, Inc. • Page APP-47
SUMMER EVENTS
Big Lake Fall Festival/Chili Cook-Off
This September event feature lives music, vendors, carnival games, sled dog rides and a chili cook-off.
Big Lake Triathlon
This triathlon, including a swim, bike and run, through Big Lake is open to all individuals or teams and takes
place in mid-June.
Farmers’ Markets
Alaska-grown produce, flowers and crafts are sold during the summer at the Valley’s weekly markets. Wasilla’s
Dorothy Page Museum & Historic Town Site hosts a market every Wednesday. Every Friday a market is held in
downtown Palmer across from the visitors center.
Houston Founder’s Day
This event takes place the third weekend in August and includes a live band, free BBQ and fireworks.
Nye Frontier Ford Mat-Su King Salmon Derby
The Mat-Su King Salmon Derby runs nearly eight weeks during May, June and early July. The derby begins at
12:01 a.m. on May 20 and closes at 9:00 p.m. on July 13. Participants can choose from hundreds of miles of
prime Mat-Su Valley king salmon rivers in the Susitna, Little Susitna and Knik Drainages. Roadside and remote
fisheries are also included. Prizes are awarded for the heaviest king salmon entered each week, as well as for
the heaviest entered for the entire Derby period. Annually, ticket holder numbers range from 2,100 to 2,500.
Palmer Colony Days
This festival takes place the second week in June and honors the 1935 colonists who started the Matauska
farming community. Festival events include a parade, live entertainment, a car rally, craft fairs, horse-drawn
wagon rides, a farmers’ market, kids’ games and carnival rides. In 2007, approximately 5,000 people
attended this event, including several hundred in-state and out-of-state visitors.
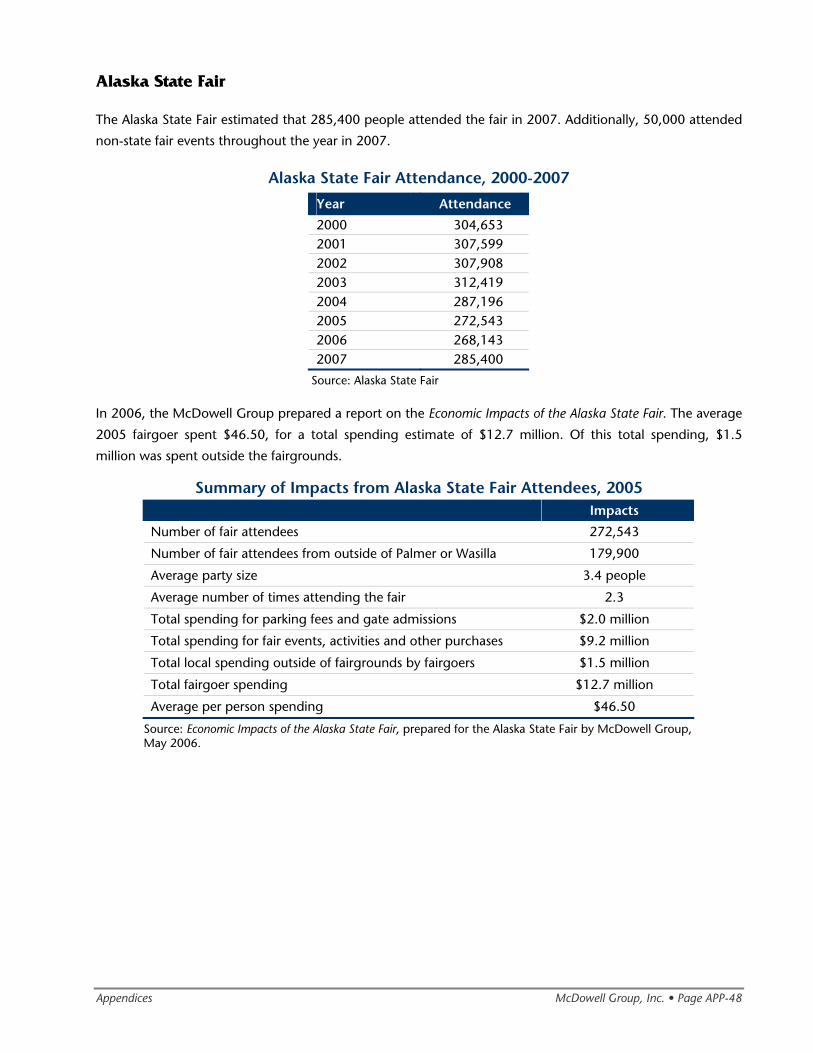
Appendices McDowell Group, Inc. • Page APP-48
Alaska State Fair
The Alaska State Fair estimated that 285,400 people attended the fair in 2007. Additionally, 50,000 attended
non-state fair events throughout the year in 2007.
Alaska State Fair Attendance, 2000-2007
Year Attendance
2000 304,653 2001 307,599 2002 307,908 2003 312,419 2004 287,196 2005 272,543 2006 268,143 2007 285,400
Source: Alaska State Fair
In 2006, the McDowell Group prepared a report on the Economic Impacts of the Alaska State Fair. The average
2005 fairgoer spent $46.50, for a total spending estimate of $12.7 million. Of this total spending, $1.5
million was spent outside the fairgrounds.
Summary of Impacts from Alaska State Fair Attendees, 2005 Impacts
Number of fair attendees 272,543
Number of fair attendees from outside of Palmer or Wasilla 179,900
Average party size 3.4 people
Average number of times attending the fair 2.3
Total spending for parking fees and gate admissions $2.0 million
Total spending for fair events, activities and other purchases $9.2 million
Total local spending outside of fairgrounds by fairgoers $1.5 million
Total fairgoer spending $12.7 million
Average per person spending $46.50
Source: Economic Impacts of the Alaska State Fair, prepared for the Alaska State Fair by McDowell Group, May 2006.
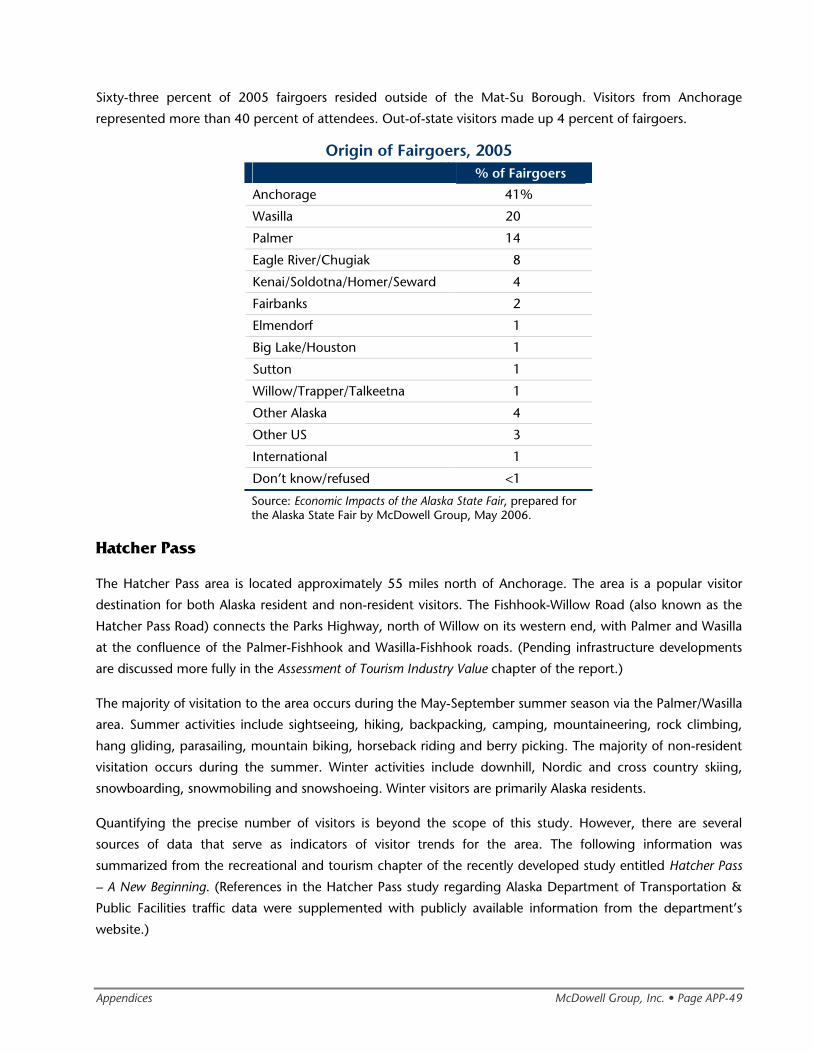
Appendices McDowell Group, Inc. • Page APP-49
Sixty-three percent of 2005 fairgoers resided outside of the Mat-Su Borough. Visitors from Anchorage
represented more than 40 percent of attendees. Out-of-state visitors made up 4 percent of fairgoers.
Origin of Fairgoers, 2005 % of Fairgoers Anchorage 41% Wasilla 20 Palmer 14 Eagle River/Chugiak 8 Kenai/Soldotna/Homer/Seward 4 Fairbanks 2 Elmendorf 1 Big Lake/Houston 1 Sutton 1 Willow/Trapper/Talkeetna 1 Other Alaska 4 Other US 3 International 1 Don’t know/refused <1 Source: Economic Impacts of the Alaska State Fair, prepared for the Alaska State Fair by McDowell Group, May 2006.
Hatcher Pass
The Hatcher Pass area is located approximately 55 miles north of Anchorage. The area is a popular visitor
destination for both Alaska resident and non-resident visitors. The Fishhook-Willow Road (also known as the
Hatcher Pass Road) connects the Parks Highway, north of Willow on its western end, with Palmer and Wasilla
at the confluence of the Palmer-Fishhook and Wasilla-Fishhook roads. (Pending infrastructure developments
are discussed more fully in the Assessment of Tourism Industry Value chapter of the report.)
The majority of visitation to the area occurs during the May-September summer season via the Palmer/Wasilla
area. Summer activities include sightseeing, hiking, backpacking, camping, mountaineering, rock climbing,
hang gliding, parasailing, mountain biking, horseback riding and berry picking. The majority of non-resident
visitation occurs during the summer. Winter activities include downhill, Nordic and cross country skiing,
snowboarding, snowmobiling and snowshoeing. Winter visitors are primarily Alaska residents.
Quantifying the precise number of visitors is beyond the scope of this study. However, there are several
sources of data that serve as indicators of visitor trends for the area. The following information was
summarized from the recreational and tourism chapter of the recently developed study entitled Hatcher Pass
– A New Beginning. (References in the Hatcher Pass study regarding Alaska Department of Transportation &
Public Facilities traffic data were supplemented with publicly available information from the department’s
website.)
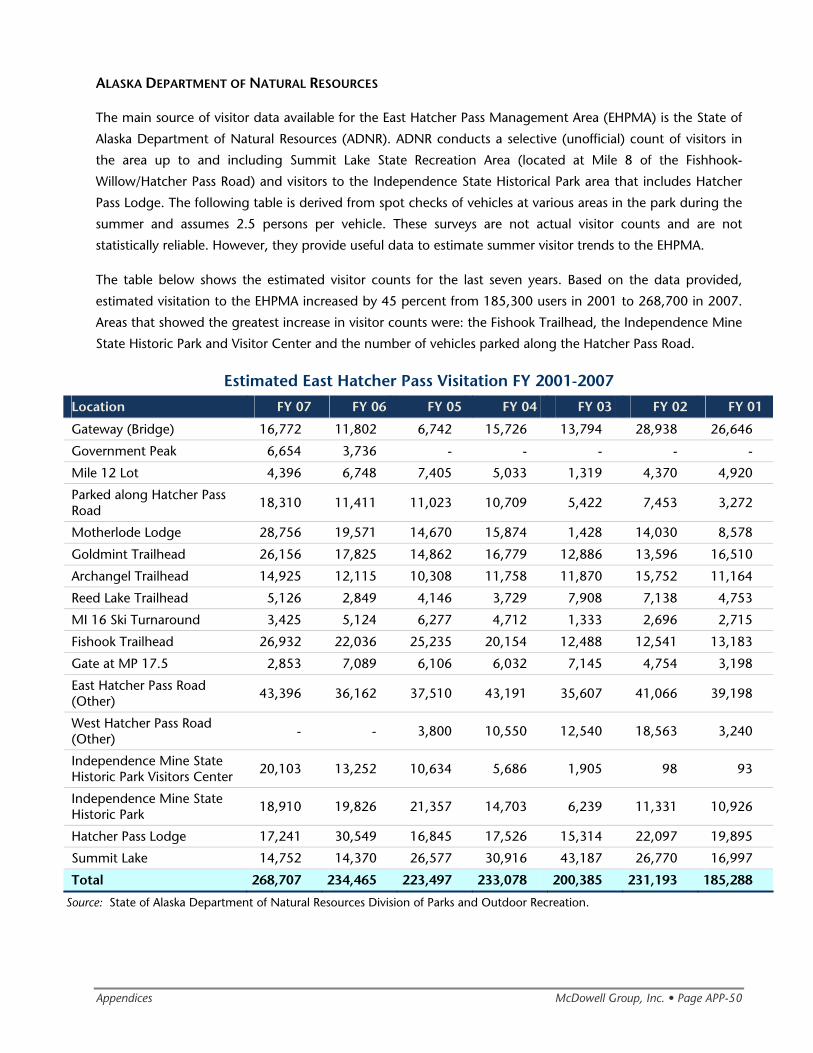
Appendices McDowell Group, Inc. • Page APP-50
ALASKA DEPARTMENT OF NATURAL RESOURCES
The main source of visitor data available for the East Hatcher Pass Management Area (EHPMA) is the State of
Alaska Department of Natural Resources (ADNR). ADNR conducts a selective (unofficial) count of visitors in
the area up to and including Summit Lake State Recreation Area (located at Mile 8 of the Fishhook-
Willow/Hatcher Pass Road) and visitors to the Independence State Historical Park area that includes Hatcher
Pass Lodge. The following table is derived from spot checks of vehicles at various areas in the park during the
summer and assumes 2.5 persons per vehicle. These surveys are not actual visitor counts and are not
statistically reliable. However, they provide useful data to estimate summer visitor trends to the EHPMA.
The table below shows the estimated visitor counts for the last seven years. Based on the data provided,
estimated visitation to the EHPMA increased by 45 percent from 185,300 users in 2001 to 268,700 in 2007.
Areas that showed the greatest increase in visitor counts were: the Fishook Trailhead, the Independence Mine
State Historic Park and Visitor Center and the number of vehicles parked along the Hatcher Pass Road.
Estimated East Hatcher Pass Visitation FY 2001-2007
Location FY 07 FY 06 FY 05 FY 04 FY 03 FY 02 FY 01
Gateway (Bridge) 16,772 11,802 6,742 15,726 13,794 28,938 26,646
Government Peak 6,654 3,736 - - - - -
Mile 12 Lot 4,396 6,748 7,405 5,033 1,319 4,370 4,920
Parked along Hatcher Pass Road
18,310 11,411 11,023 10,709 5,422 7,453 3,272
Motherlode Lodge 28,756 19,571 14,670 15,874 1,428 14,030 8,578
Goldmint Trailhead 26,156 17,825 14,862 16,779 12,886 13,596 16,510
Archangel Trailhead 14,925 12,115 10,308 11,758 11,870 15,752 11,164
Reed Lake Trailhead 5,126 2,849 4,146 3,729 7,908 7,138 4,753
MI 16 Ski Turnaround 3,425 5,124 6,277 4,712 1,333 2,696 2,715
Fishook Trailhead 26,932 22,036 25,235 20,154 12,488 12,541 13,183
Gate at MP 17.5 2,853 7,089 6,106 6,032 7,145 4,754 3,198
East Hatcher Pass Road (Other) 43,396 36,162 37,510 43,191 35,607 41,066 39,198
West Hatcher Pass Road (Other) - - 3,800 10,550 12,540 18,563 3,240
Independence Mine State Historic Park Visitors Center 20,103 13,252 10,634 5,686 1,905 98 93
Independence Mine State Historic Park 18,910 19,826 21,357 14,703 6,239 11,331 10,926
Hatcher Pass Lodge 17,241 30,549 16,845 17,526 15,314 22,097 19,895
Summit Lake 14,752 14,370 26,577 30,916 43,187 26,770 16,997
Total 268,707 234,465 223,497 233,078 200,385 231,193 185,288
Source: State of Alaska Department of Natural Resources Division of Parks and Outdoor Recreation.
Appendices McDowell Group, Inc. • Page APP-51
ALASKA DEPARTMENT OF TRANSPORTATION & PUBLIC FACILITIES
An additional indicator of visitation trends to the Hatcher Pass area is Alaska Department of Transportation &
Public Facilities (ADOT&PF) traffic data. ADOT&PF has monitored traffic counts at the Little Susitna Bridge
(approximately four miles north of the convergence of the Wasilla-Fishhook and the Palmer-Fishhook roads)
in July of each year from 2000-2006. This data shows that July traffic counts of vehicles crossing the Little
Susitna bridge has increased by 70 percent from 540 in 2000 to 915 in 2006. The majority of this increase
occurred between 2001 and 2002 and was related to better access after the Hatcher Pass Road was realigned
and paved, and improvements were made to the Independence State Historic Park.
Traffic counts are based on the number of vehicles traveling over a given segment of road. A vehicle could be
counted twice if it returned by the same route. This information will not allow the user to estimate the actual
number of visitors using a particular segment of road, but will provide a general sense for how vehicle
activity, over that road segment, has changed over time.
Monthly traffic counts (for the full year) at Little Susitna Bridge began in 2005. In the future, this data will
provide valuable insight into the trend of vehicle activity (both in summer and winter) on this important road
link between Palmer/Wasilla and the EHPMA.
The project team reviewed additional ADOT&PF annual traffic data to better understand trends within the
Hatcher Pass area. Annual Average Daily Traffic (AADT) counts are based on sampling and adjusted for
seasonality. Monthly variations within each year may be substantial. For the purpose of this study they are
useful for observing vehicle activity trends over time.
• AADT counts at the junction of Palmer-Fishhook Road and the Gold Mint Road were five times higher
in 2006 (502) than the 2000 count (100).
• AADT counts at the junction of Lucky Shot Mine Road (approximately 31 miles east of the junction of
the Parks Highway and the Fishhook-Willow/Hatcher Pass Road) increased by 53 percent from 2000
(90) to 2006 (138).
• AADT counts at the junction of Archangel Drive (approximately 10 miles east of the junction of the
Parks Highway and the Fishhook-Willow/Hatcher Pass Road) increased by 60 percent from 2000
(180) to 2006 (290).
• AADT counts at the junction of Old Willow Road (approximately one mile east of the junction of the
Parks Highway and the Fishhook-Willow/Hatcher Pass Road) increased slightly (2 percent) from 1998
(660) to 2006 (670).
Based on the Little Susitna Bridge counts and the Lucky Shot Mine Road AADT counts, it appears that the
volume of vehicles traveling from Palmer/Wasilla area into the EHPMA has increased substantially over the last
few years. While vehicle activity at the western entrance to the Hatcher Pass area has remained relatively
stable, activity slightly further into the area (Archangel Drive) has increased. It is unknown whether the
increased activity at Archangel is from eastbound or westbound traffic, but seems likely to be from vehicles
venturing farther into Hatcher Pass from the east (Palmer/Wasilla).
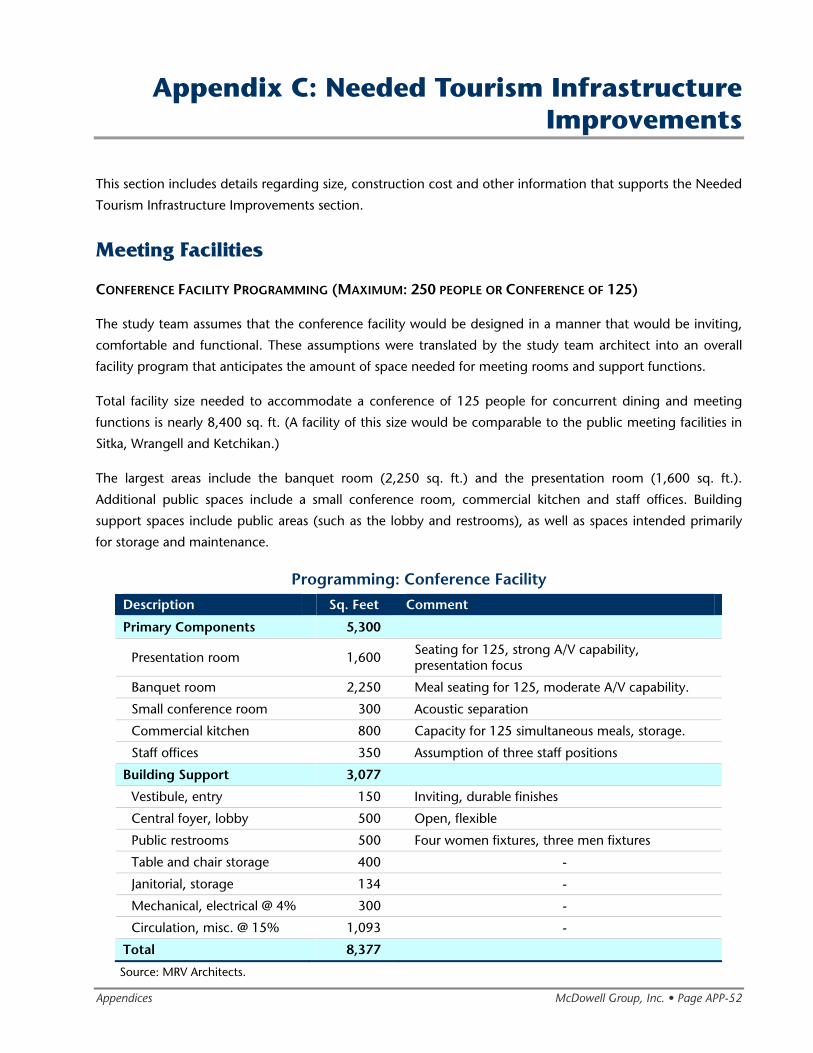
Appendices McDowell Group, Inc. • Page APP-52
Appendix C: Needed Tourism Infrastructure Improvements
This section includes details regarding size, construction cost and other information that supports the Needed
Tourism Infrastructure Improvements section.
Meeting Facilities
CONFERENCE FACILITY PROGRAMMING (MAXIMUM: 250 PEOPLE OR CONFERENCE OF 125)
The study team assumes that the conference facility would be designed in a manner that would be inviting,
comfortable and functional. These assumptions were translated by the study team architect into an overall
facility program that anticipates the amount of space needed for meeting rooms and support functions.
Total facility size needed to accommodate a conference of 125 people for concurrent dining and meeting
functions is nearly 8,400 sq. ft. (A facility of this size would be comparable to the public meeting facilities in
Sitka, Wrangell and Ketchikan.)
The largest areas include the banquet room (2,250 sq. ft.) and the presentation room (1,600 sq. ft.).
Additional public spaces include a small conference room, commercial kitchen and staff offices. Building
support spaces include public areas (such as the lobby and restrooms), as well as spaces intended primarily
for storage and maintenance.
Programming: Conference Facility
Description Sq. Feet Comment
Primary Components 5,300
Presentation room 1,600 Seating for 125, strong A/V capability, presentation focus
Banquet room 2,250 Meal seating for 125, moderate A/V capability.
Small conference room 300 Acoustic separation
Commercial kitchen 800 Capacity for 125 simultaneous meals, storage.
Staff offices 350 Assumption of three staff positions
Building Support 3,077
Vestibule, entry 150 Inviting, durable finishes
Central foyer, lobby 500 Open, flexible
Public restrooms 500 Four women fixtures, three men fixtures
Table and chair storage 400 -
Janitorial, storage 134 -
Mechanical, electrical @ 4% 300 -
Circulation, misc. @ 15% 1,093 -
Total 8,377
Source: MRV Architects.
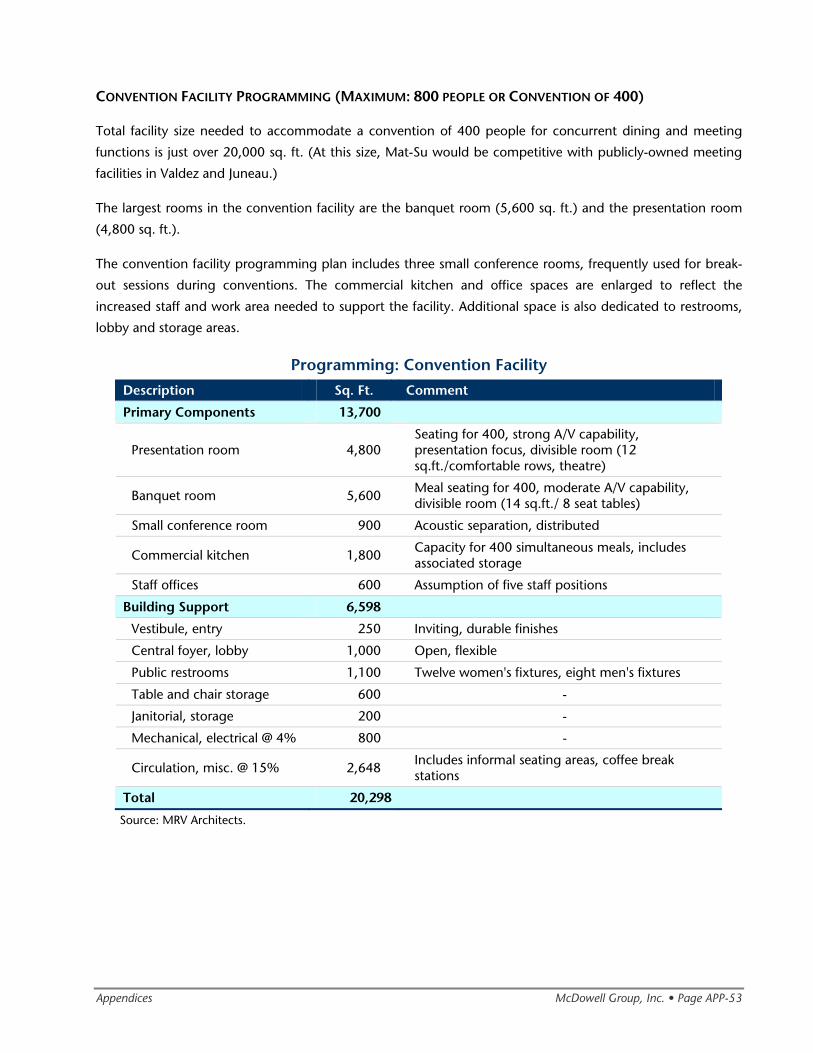
Appendices McDowell Group, Inc. • Page APP-53
CONVENTION FACILITY PROGRAMMING (MAXIMUM: 800 PEOPLE OR CONVENTION OF 400)
Total facility size needed to accommodate a convention of 400 people for concurrent dining and meeting
functions is just over 20,000 sq. ft. (At this size, Mat-Su would be competitive with publicly-owned meeting
facilities in Valdez and Juneau.)
The largest rooms in the convention facility are the banquet room (5,600 sq. ft.) and the presentation room
(4,800 sq. ft.).
The convention facility programming plan includes three small conference rooms, frequently used for break-
out sessions during conventions. The commercial kitchen and office spaces are enlarged to reflect the
increased staff and work area needed to support the facility. Additional space is also dedicated to restrooms,
lobby and storage areas.
Programming: Convention Facility
Description Sq. Ft. Comment
Primary Components 13,700
Presentation room 4,800 Seating for 400, strong A/V capability, presentation focus, divisible room (12 sq.ft./comfortable rows, theatre)
Banquet room 5,600 Meal seating for 400, moderate A/V capability, divisible room (14 sq.ft./ 8 seat tables)
Small conference room 900 Acoustic separation, distributed
Commercial kitchen 1,800 Capacity for 400 simultaneous meals, includes associated storage
Staff offices 600 Assumption of five staff positions
Building Support 6,598
Vestibule, entry 250 Inviting, durable finishes
Central foyer, lobby 1,000 Open, flexible
Public restrooms 1,100 Twelve women's fixtures, eight men's fixtures
Table and chair storage 600 -
Janitorial, storage 200 -
Mechanical, electrical @ 4% 800 -
Circulation, misc. @ 15% 2,648 Includes informal seating areas, coffee break stations
Total 20,298
Source: MRV Architects.
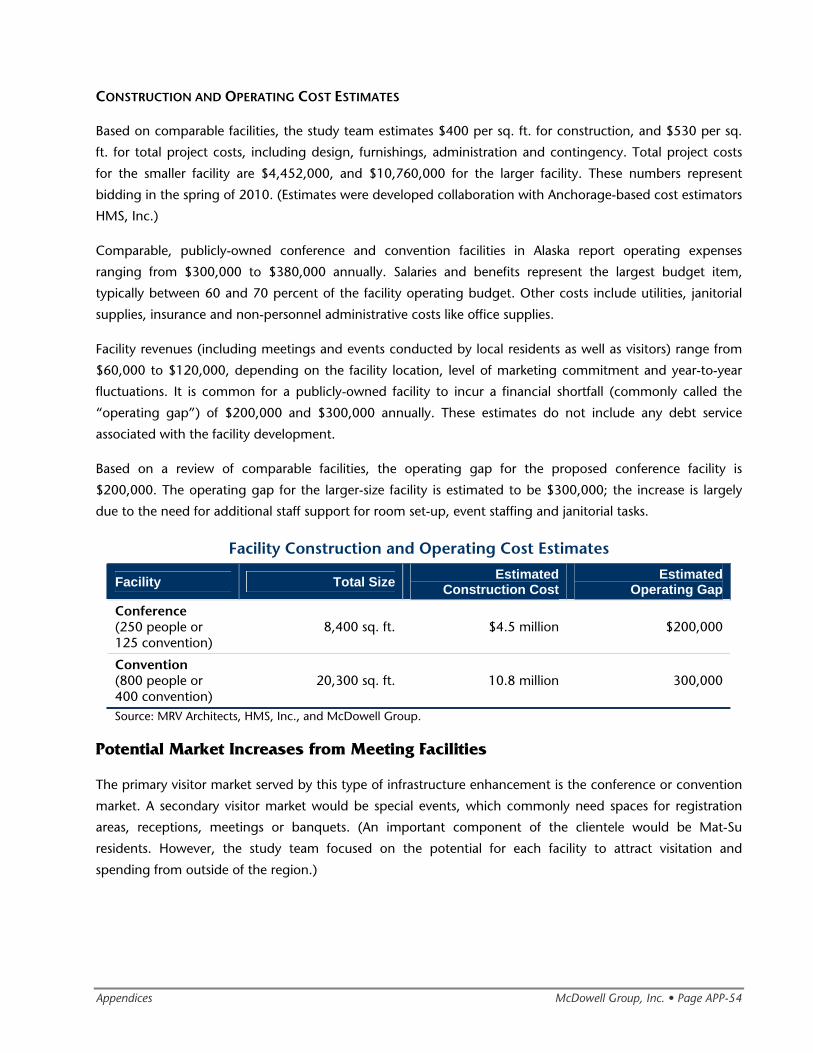
Appendices McDowell Group, Inc. • Page APP-54
CONSTRUCTION AND OPERATING COST ESTIMATES
Based on comparable facilities, the study team estimates $400 per sq. ft. for construction, and $530 per sq.
ft. for total project costs, including design, furnishings, administration and contingency. Total project costs
for the smaller facility are $4,452,000, and $10,760,000 for the larger facility. These numbers represent
bidding in the spring of 2010. (Estimates were developed collaboration with Anchorage-based cost estimators
HMS, Inc.)
Comparable, publicly-owned conference and convention facilities in Alaska report operating expenses
ranging from $300,000 to $380,000 annually. Salaries and benefits represent the largest budget item,
typically between 60 and 70 percent of the facility operating budget. Other costs include utilities, janitorial
supplies, insurance and non-personnel administrative costs like office supplies.
Facility revenues (including meetings and events conducted by local residents as well as visitors) range from
$60,000 to $120,000, depending on the facility location, level of marketing commitment and year-to-year
fluctuations. It is common for a publicly-owned facility to incur a financial shortfall (commonly called the
“operating gap”) of $200,000 and $300,000 annually. These estimates do not include any debt service
associated with the facility development.
Based on a review of comparable facilities, the operating gap for the proposed conference facility is
$200,000. The operating gap for the larger-size facility is estimated to be $300,000; the increase is largely
due to the need for additional staff support for room set-up, event staffing and janitorial tasks.
Facility Construction and Operating Cost Estimates
Facility Total Size Estimated Construction Cost
EstimatedOperating Gap
Conference (250 people or 125 convention)
8,400 sq. ft. $4.5 million $200,000
Convention (800 people or 400 convention)
20,300 sq. ft. 10.8 million 300,000
Source: MRV Architects, HMS, Inc., and McDowell Group.
Potential Market Increases from Meeting Facilities
The primary visitor market served by this type of infrastructure enhancement is the conference or convention
market. A secondary visitor market would be special events, which commonly need spaces for registration
areas, receptions, meetings or banquets. (An important component of the clientele would be Mat-Su
residents. However, the study team focused on the potential for each facility to attract visitation and
spending from outside of the region.)
Appendices McDowell Group, Inc. • Page APP-55
It is important to note that the ability for each facility to attract non-resident usage is contingent on several
factors including:
• An effective marketing campaign for the facility itself as well as the region.
• Ability to offer a quality experience at the meeting facility from the initial contact (site selection and
reservation process) through the actual event (meeting room set-up, transitions and clean-up).
• The quality and availability of support services including accommodations, catering and other needs.
• The location of the facility within the region.
The following scenarios presume that all of these components are effective and coordinated for the success of
the meeting facilities. Further, the facilities will likely require a three-to-five year “ramp-up” period before
reaching these targets. Several factors will contribute to this delay. Meeting location and facility decisions are
typically made a year or two in advance. Several state and national organizations plan even further out. Most
importantly, it will take some time and financial commitment for any new facility, and the associated
community services, to achieve market recognition and a reputation for quality service.
CONFERENCE FACILITY MARKET POTENTIAL (MAXIMUM: 250 PEOPLE OR CONFERENCE OF 125)
Lower Range Estimate: Total room nights associated with conferences and events is estimated at nearly
4,000. Visitor spending associated with the conferences and meetings is estimated to be nearly $700,000.
The following assumptions were used to develop these estimates.
• The conference facility would host an average of four smaller-scale events per month or 48 visitor
events per year.
o Visitor room nights associated with smaller events and conferences were estimated to have
an average length of stay of 1.5 nights.
o To estimate the event size, the study team used the mid-point for each range. This
conservative approach accounts for groups that require single rooms and those that are
double-occupancy.
• Additionally, the facility is estimated to attract three conferences that maximized facility capacity at
125. The average length of stay for conferences was increased to two nights.
• Meeting and conference spending was estimated at $175 per person, per day. (These expenditure
estimates are conservative when compared to the Juneau Convention & Visitors Bureau estimate of
$273 per person, per day for meeting and convention attendees or the Fairbanks Convention &
Visitors Bureau estimate of $240 per person, per day. However, the study team acknowledged that
accommodation costs in the region are lower. Further, car rental or other transportation costs would
likely accrue to Anchorage, not Mat-Su.)
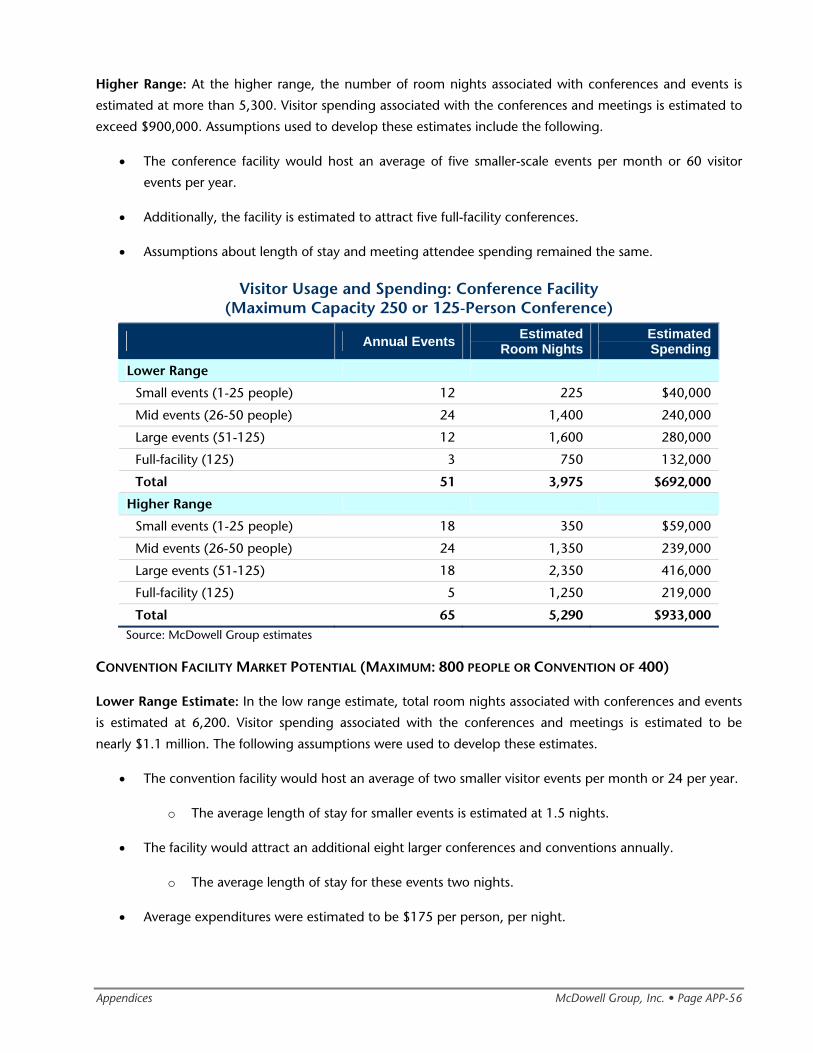
Appendices McDowell Group, Inc. • Page APP-56
Higher Range: At the higher range, the number of room nights associated with conferences and events is
estimated at more than 5,300. Visitor spending associated with the conferences and meetings is estimated to
exceed $900,000. Assumptions used to develop these estimates include the following.
• The conference facility would host an average of five smaller-scale events per month or 60 visitor
events per year.
• Additionally, the facility is estimated to attract five full-facility conferences.
• Assumptions about length of stay and meeting attendee spending remained the same.
Visitor Usage and Spending: Conference Facility (Maximum Capacity 250 or 125-Person Conference)
Annual Events Estimated Room Nights
EstimatedSpending
Lower Range Small events (1-25 people) 12 225 $40,000
Mid events (26-50 people) 24 1,400 240,000
Large events (51-125) 12 1,600 280,000
Full-facility (125) 3 750 132,000
Total 51 3,975 $692,000
Higher Range
Small events (1-25 people) 18 350 $59,000
Mid events (26-50 people) 24 1,350 239,000
Large events (51-125) 18 2,350 416,000
Full-facility (125) 5 1,250 219,000
Total 65 5,290 $933,000 Source: McDowell Group estimates
CONVENTION FACILITY MARKET POTENTIAL (MAXIMUM: 800 PEOPLE OR CONVENTION OF 400)
Lower Range Estimate: In the low range estimate, total room nights associated with conferences and events
is estimated at 6,200. Visitor spending associated with the conferences and meetings is estimated to be
nearly $1.1 million. The following assumptions were used to develop these estimates.
• The convention facility would host an average of two smaller visitor events per month or 24 per year.
o The average length of stay for smaller events is estimated at 1.5 nights.
• The facility would attract an additional eight larger conferences and conventions annually.
o The average length of stay for these events two nights.
• Average expenditures were estimated to be $175 per person, per night.
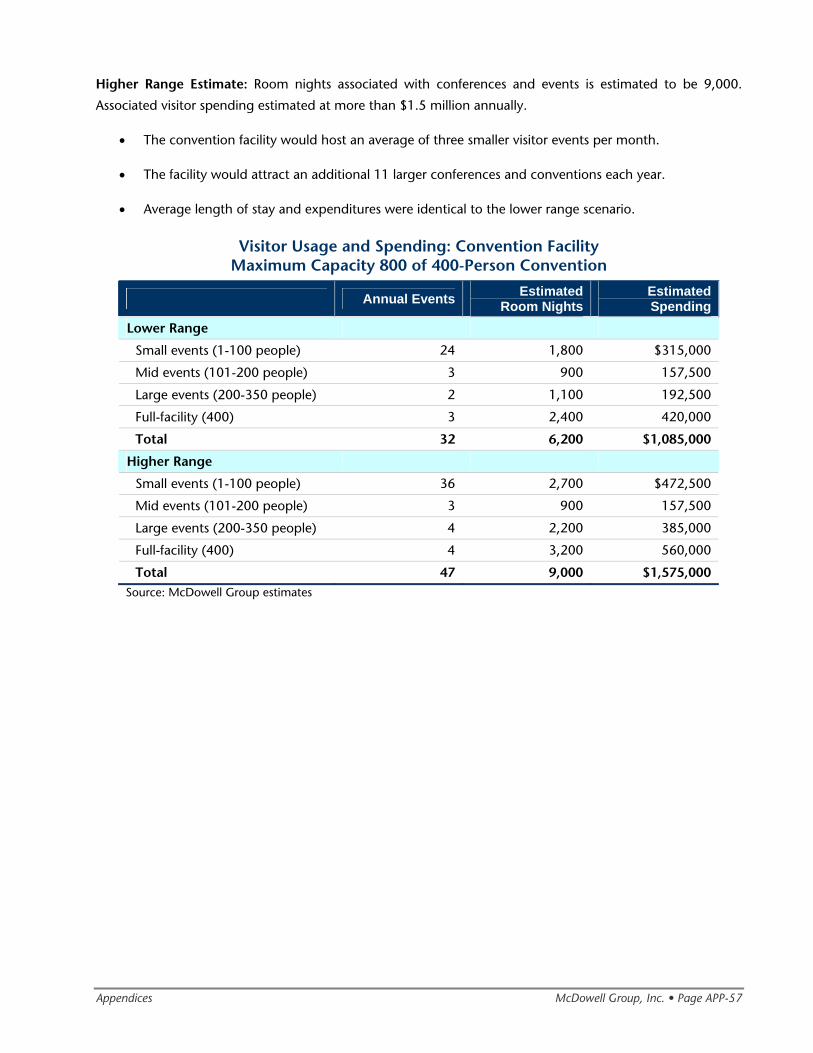
Appendices McDowell Group, Inc. • Page APP-57
Higher Range Estimate: Room nights associated with conferences and events is estimated to be 9,000.
Associated visitor spending estimated at more than $1.5 million annually.
• The convention facility would host an average of three smaller visitor events per month.
• The facility would attract an additional 11 larger conferences and conventions each year.
• Average length of stay and expenditures were identical to the lower range scenario.
Visitor Usage and Spending: Convention Facility Maximum Capacity 800 of 400-Person Convention
Annual Events Estimated Room Nights
EstimatedSpending
Lower Range Small events (1-100 people) 24 1,800 $315,000
Mid events (101-200 people) 3 900 157,500
Large events (200-350 people) 2 1,100 192,500
Full-facility (400) 3 2,400 420,000
Total 32 6,200 $1,085,000
Higher Range
Small events (1-100 people) 36 2,700 $472,500
Mid events (101-200 people) 3 900 157,500
Large events (200-350 people) 4 2,200 385,000
Full-facility (400) 4 3,200 560,000
Total 47 9,000 $1,575,000 Source: McDowell Group estimates
Appendices McDowell Group, Inc. • Page APP-58
Road System Enhancements
Potential Market Increases from Road System Enhancements
The following section discusses the potential effects of road sytem enhancements and their ability to help
Mat-Su increase the economic impacts from the visitor industry. Market potential is presented below by
major market segment:
• Summer out-of-state visitation
o Summer package tour visitors
o Summer independent visitors
• Fall/Winter out-of-state visitation
• Summer in-state visitation
• Fall/Winter in-state visitation
Each market is unique in its travel motives and patterns. Using the visitor market profiles and data sources
cited in the Base Case Infrastructure Description, the study team evaluated each major market segment to
determine likely changes in the following areas:
• An increase in Mat-Su’s share of the statewide market
• Potential for increasing overnight stays among the current market
• Potential for increasing spending among the current market
• A combination of these effects
Incremental changes in market share are significant—especially when extrapolated over the size of the
statewide market. To help put the projected Mat-Su visitation changes in perspective, the study team noted
how it compared to the current market size.
The ability for Mat-Su to achieve the low or high case scenarios will be affected by the number and quality of
highway enhancements, marketing, accommodation capacity, availability and quality of attractions and
potential synergies produced by other infrastructure developments, including trail development and
implementation of the South Denali plan.
An ongoing, systemic approach to improvements could achieve these projected results over an 8 to 10 year
timeframe.
Appendices McDowell Group, Inc. • Page APP-59
SUMMER OUT-OF-STATE VISITATION
During the summer months, nearly 300,000 out-of-state visitors traveled to Mat-Su in 2006. Approximately
half reported spending one or more nights in the region. The high percentage of vacation/pleasure travelers
in this market suggests that Mat-Su could affect future length of stay and spending (just 4 percent of
Talkeetna visitors reported that their primary purpose for their Alaska trip was business, while 12 percent of
Palmer/Wasilla visitors were traveling primarily for business). Because of the unique factors that affect these
markets, the study team’s discussion regarding visitors on tour packages are separated from independent
visitors.
SUMMER PACKAGE TOUR VISITORS
An estimated 110,000 to 120,000 Mat-Su visitors traveled on multi-day tour packages (including cruise-
tours). These visitors typically used multiple types of transportation to travel between communities including
train, motorcoach and passenger van. While smaller-scale highway enhancements such as signage, enhanced
scenic overlooks and public toilets can enhance visitors’ experience, these enhancements are not likely to
change the overall tour pattern or number of nights spent in the region by this market.
However, paving the Denali Highway (or other significant enhancements to improve road condition and
driving speed) is very likely to facilitate an increase in the number of tour operators that include this route in
their itineraries. In addition to scenic beauty, the highway is recognized for wildlife viewing opportunities,
which are highly sought out by tour companies and their clients. When coupled with the pending
infrastructure developments in South Denali, tour operators will be especially interested in maximizing
visitors’ time in the Mat-Su region.
While the size of the statewide package tour market is relatively large, the number of tour packages that
venture outside of the “rail-belt” corridor is considerably smaller. Very few tour packages are sold without
time in Denali. Therefore, adding new destinations increases the overall trip length and cost, and has a
diminishing effect on the market potential.
Low Case: The study team estimates that paving the Denali Highway could increase the number of package
tour visitors that overnight in the region by 4,000 people, or 2,000 room nights annually. Using a
conservative estimate of $150 per person (which accounts for tour operator spending on accommodations,
plus visitor spending on tours, dining and retail purchases), additional spending in the Mat-Su region is
estimated at $600,000. (This increase would represent a 3 percent increase in the current market size.)
High Case: Package tour visitors that spend a night in the region could increase by 8,000 people, or 4,000
room nights annually. Additional spending in the Mat-Su region is estimated at $1.2 million. It is important to
note that achieving this level of growth would likely require a concurrent increase in accommodations that
can handle small and mid-sized groups. (An increase of this size would be an 8 percent increase from the
current market volume.)
Appendices McDowell Group, Inc. • Page APP-60
SUMMER INDEPENDENT VISITORS
Nearly 200,000 summer visitors currently travel to Mat-Su as independent visitors. They utilize the highway
system extensively; leading transportation modes include rental cars, personal vehicles, rental RVs and
personal RVs.
For this broadly-defined market, experiencing Alaska’s highways represents much more than access between
communities. The highways themselves are part of the attraction that Alaska and Mat-Su offers—especially for
those travelers that learn about the unique attributes of state and national scenic byways. Highways offer the
ability to view scenery and wildlife at the visitors’ own pace. Waysides and scenic pull-outs enhance visitor
safety and comfort, which in turn can encourage visitors to venture farther. Interpretive signage can offer
important insights into the regional history, culture and current way of life. Highway pullouts serve as
informal campsites for some visitors.
It is important to note that a significant portion of the independent market passes through the region
without spending the night. An important potential benefit of roady system enhancements would be slowing
down visitors, stimulating additional spending and overnights in the area.
The study team examined Mat-Su’s share of the statewide market to forecast changes to future travel
patterns. AVSP data revealed that 7 percent of all summer visitors traveling by air spent at least one night in
Talkeetna and 7 percent spent at least one night in Palmer/Wasilla in 2006. Among the statewide
highway/ferry market, 21 percent spent one night or more in the Palmer/Wasilla area and 9 percent
overnighted in Talkeetna. A conservative estimate of the number of independent travelers that spent a night
in the region was approximately 80,000 visitors.
Low Case: The study team estimates that a roady system enhancement program could contribute to an
increase in overnight stays from the statewide air market of 1 percent and an increase in overnights from the
statewide highway/ferry market of 2 percent.
With a statewide summer air market of approximately 600,000 visitors, a 1 percent increase would yield an
additional 6,000 visitors (approximately 3,000 room nights). Based on the average per person, per night
expenditure of $146, spending associated with this market would total nearly $876,000.
Attracting a 2 percent increase in the statewide highway/ferry market would result in an additional 1,600
visitors and an estimated 400 room nights. (While these visitors likely represent an increase of 800 Mat-Su
overnights, AVSP research indicates that about half of the market used hotels, motels, or B&Bs during their
Alaska trip.) Based on an average visitor expenditure of $70 per person, per night, new spending in the Mat-
Su associated with this increase would be nearly $112,000.
Combined, this level of increased visitation and overnights represent an approximate 8 percent increase from
current levels.
Appendices McDowell Group, Inc. • Page APP-61
High Case: An increase of 1.5 percent in the statewide air market would yield an additional 9,000 visitors
(4,500 room nights); spending associated with this market would increase to $1.3 million. A 3 percent
increase in overnights from the highway/ferry market would yield approximately 2,500 new visitors, 625
room nights and $175,000 in spending. (Combined, the increase in these two markets would result in an
increase of 14 percent over current market estimates.)
FALL/WINTER OUT-OF-STATE VISITATION
An estimated 37,000 out-of-state visitors traveled to Mat-Su during the seven-month period between
October 2006 and April 2007. Approximately 17,000 visitors spent a night in the Mat-Su region. In contrast
to the summer market, the primary Alaska travel motive for fall/winter travelers much more likely to be
visiting friends and family, or business. (Over half of the fall/winter market was visiting friends and relatives,
29 percent were traveling primarily for business and 15 percent were traveling for vacation/pleasure.)
Reflecting these differences in market composition, participation rates in tours and activities was dramatically
lower than among summer visitors.
Just 15 percent of the statewide fall/winter market visited Mat-Su, despite the fact that Anchorage serves as
the leading fall/winter destination and statewide transportation hub. Road system enhancements could
enhance the appeal and comfort of driving to Mat-Su for day trips and overnight trips.
Low Case: An increase of 1 percent in overnight travel to the region would result in 2,500 visitors or
approximately 1,250 room nights. The availability of winter recreational activities and tour operators is a
factor in the projections. (When compared to the current overnight market of 17,000 visitors, these visitors
represent a nearly 15 percent increase.)
Based on the average visitor spending during the fall/winter period of $84 per person, per night, new
expenditures associated with these visitors would be $210,000.
Increasing the percentage of day visitors by 1 percent has the potential to increase sales for restaurants, gas
stations and retail shops. If Mat-Su businesses were able to capture $5 per person from 2,500 additional
travelers, the increased visitation would generate $12,500 in new spending.
High Case: Increasing overnight stays by 1.5 percent yields 3,750 new visitors, nearly 1,900 overnights and
$315,000 in new regional spending. A similar percentage increase in day-trips would generate 3,750 visitors
and $18,750 in new spending. (The high case reflects a 22 percent increase from current visitation levels.)
SUMMER IN-STATE VISITATION
During the summer months, an estimated 263,000 Alaska residents visit Mat-Su an average of 6 times.
Anchorage residents represent more than 90 percent of in-state market, however the proximity between
Anchorage and Mat-Su has important implications for regional lodging (prior research revealed that 51
percent of in-state summer travelers did not stay overnight in Mat-Su). When Alaska residents did overnight
in the region, they were most likely to camp, stay with friends, or stay in their own Mat-Su cabins. Just 8
percent stayed in a commercial accommodation. With an average travel party size of 3.22 people, the
number of room nights attributed to the in-state summer market is approximately 39,000 nights.
Appendices McDowell Group, Inc. • Page APP-62
For many in-state travelers, the experience of driving Alaska’s highways is both access to a destination and an
activity or attraction unto itself. Enhancement of the highway condition, pull-outs and interpretive signage
can influence in-state visitors to venture further into the region, travel to Mat-Su more frequently, or spend
more time and money during each trip.
Low Case: Increasing the percentage of commercial accommodation usage from 8 percent to 9 percent
would result in nearly 4,900 room nights. A similar increase in room nights could also be achieved by a
modest increase in the average length of stay. (In terms of room nights, the projected increase is
approximately 15 percent above current accommodation usage.)
Prior research shows that Alaska residents are less likely than out-of-state visitors to purchase tours and retail
items. To reflect this more conservative spending pattern, the study team estimated an average expenditure
of $125 per travel party to account for accommodation and dining expenditures. New spending associated
with increased visitation totals $612,500.
High Case: Increasing accommodation usage from 8 percent to 10 percent results in 9,800 room nights and
$1,225,000 in new spending. (The increase represents a 25 percent increase when compared to current
accommodation usage.)
FALL/WINTER IN-STATE VISITATION
In-state visitation during the 7-month fall/winter period is similar to the summer in-state travel market in
terms of relatively low usage of commercial accommodations. Forty-two percent of in-state visitors do not
overnight in the Mat-Su; just 9 percent of the market utilized hotels, motels or B&Bs. The estimated number
of room nights associated with this market is just over 60,000.
Leading winter travel motives include visiting friends and family, snowmobiling, viewing or participating in
sports events and skiing. Road system enhancements like scenic pullouts, parking areas and public restrooms
can facilitate safer, more comfortable trips. Roady system enhancements could also stimulate higher travel
frequency than the 10-trip average revealed in the last survey or an increased length of stay (previously 1.02
nights).
As with the summer in-state market, the study focused on the regional ability to increase overnight
accommodation usage rather than total visitation.
Low Case: An increase from 9 percent to 9.5 percent in accommodation usage could result in nearly 3,400
additional room nights. Reflecting lower accommodation rates during the fall/winter months, the study team
estimated an average expenditure of $115 per travel party. Spending generated from the additional
overnights totals $391,000. (The increase in room nights is nearly 6 percent higher than current levels.)
High Case: Increasing accommodation usage to from 9 percent to 10 percent would result in nearly 6,800
room nights and $782,000 in new spending. (The increase reflects 11 percent growth over current levels.)
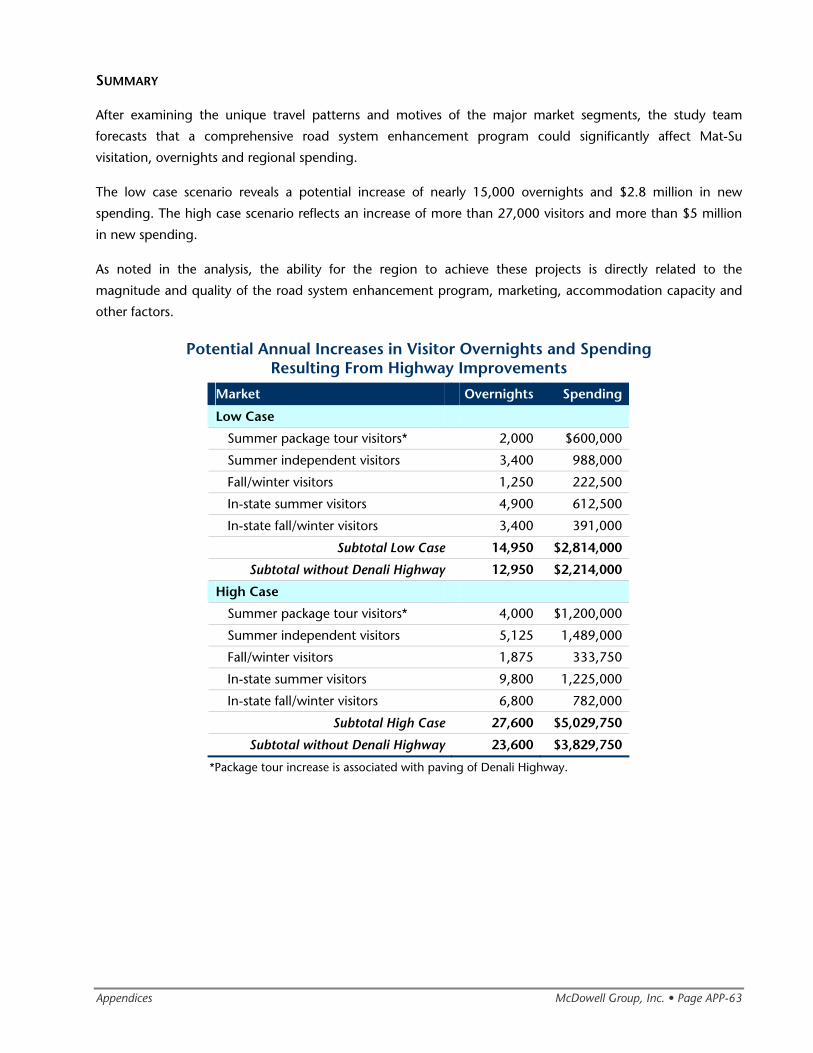
Appendices McDowell Group, Inc. • Page APP-63
SUMMARY
After examining the unique travel patterns and motives of the major market segments, the study team
forecasts that a comprehensive road system enhancement program could significantly affect Mat-Su
visitation, overnights and regional spending.
The low case scenario reveals a potential increase of nearly 15,000 overnights and $2.8 million in new
spending. The high case scenario reflects an increase of more than 27,000 visitors and more than $5 million
in new spending.
As noted in the analysis, the ability for the region to achieve these projects is directly related to the
magnitude and quality of the road system enhancement program, marketing, accommodation capacity and
other factors.
Potential Annual Increases in Visitor Overnights and Spending Resulting From Highway Improvements
Market Overnights Spending
Low Case
Summer package tour visitors* 2,000 $600,000
Summer independent visitors 3,400 988,000
Fall/winter visitors 1,250 222,500
In-state summer visitors 4,900 612,500
In-state fall/winter visitors 3,400 391,000
Subtotal Low Case 14,950 $2,814,000
Subtotal without Denali Highway 12,950 $2,214,000
High Case
Summer package tour visitors* 4,000 $1,200,000
Summer independent visitors 5,125 1,489,000
Fall/winter visitors 1,875 333,750
In-state summer visitors 9,800 1,225,000
In-state fall/winter visitors 6,800 782,000
Subtotal High Case 27,600 $5,029,750
Subtotal without Denali Highway 23,600 $3,829,750
*Package tour increase is associated with paving of Denali Highway.
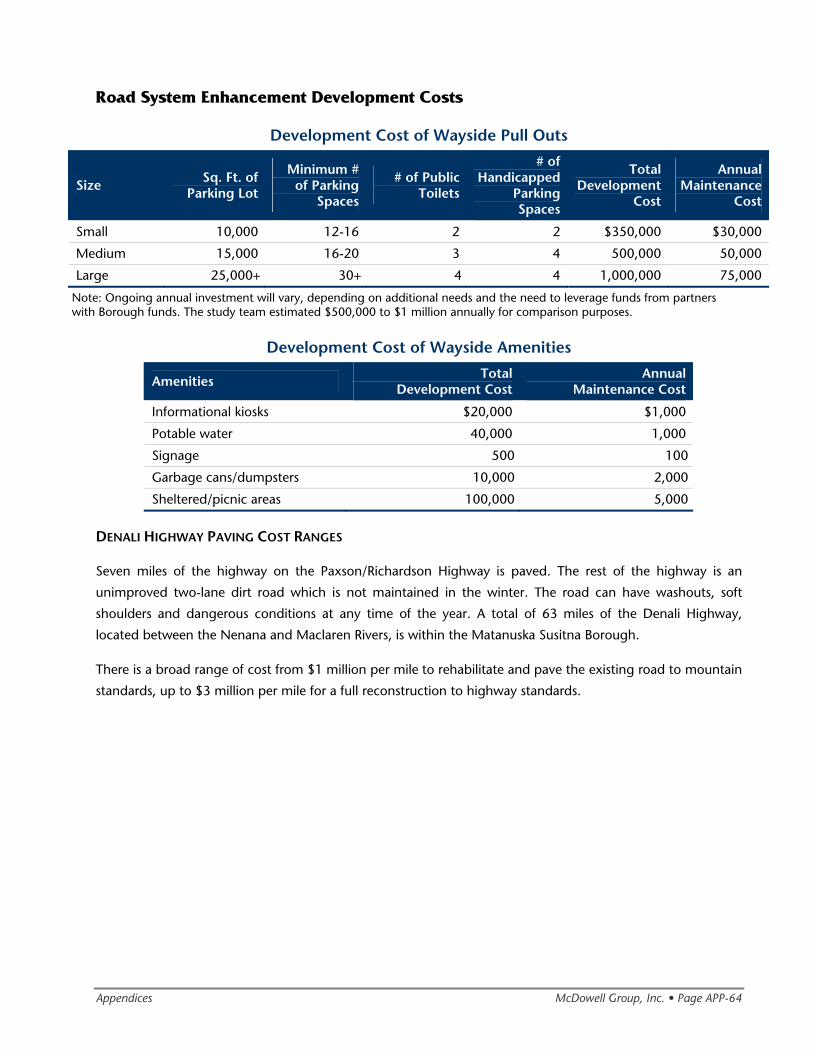
Appendices McDowell Group, Inc. • Page APP-64
Road System Enhancement Development Costs
Development Cost of Wayside Pull Outs
Size Sq. Ft. of Parking Lot
Minimum # of Parking
Spaces
# of Public Toilets
# of Handicapped
Parking Spaces
Total Development
Cost
Annual Maintenance
Cost
Small 10,000 12-16 2 2 $350,000 $30,000
Medium 15,000 16-20 3 4 500,000 50,000
Large 25,000+ 30+ 4 4 1,000,000 75,000
Note: Ongoing annual investment will vary, depending on additional needs and the need to leverage funds from partners with Borough funds. The study team estimated $500,000 to $1 million annually for comparison purposes.
Development Cost of Wayside Amenities
Amenities Total Development Cost
Annual Maintenance Cost
Informational kiosks $20,000 $1,000
Potable water 40,000 1,000
Signage 500 100
Garbage cans/dumpsters 10,000 2,000
Sheltered/picnic areas 100,000 5,000
DENALI HIGHWAY PAVING COST RANGES
Seven miles of the highway on the Paxson/Richardson Highway is paved. The rest of the highway is an
unimproved two-lane dirt road which is not maintained in the winter. The road can have washouts, soft
shoulders and dangerous conditions at any time of the year. A total of 63 miles of the Denali Highway,
located between the Nenana and Maclaren Rivers, is within the Matanuska Susitna Borough.
There is a broad range of cost from $1 million per mile to rehabilitate and pave the existing road to mountain
standards, up to $3 million per mile for a full reconstruction to highway standards.
Appendices McDowell Group, Inc. • Page APP-65
Trail System Enhancements
Potential Market Increases from Trail System Enhancements
The following section discusses the potential effects of trail system enhancements. The ability for Mat-Su to
achieve the low or high case scenarios will be affected by the location and type of trail system enhancements,
marketing, as well as synergies generated by concurrent improvements in the regional transportation
infrastructure or accommodations.
Market potential is presented below by major market segment:
• Summer out-of-state visitation
• Fall/Winter out-of-state visitation
• Summer in-state visitation
• Fall/Winter in-state visitation
The primary emphasis in the analysis below is the role that trail system enhancements can play in increasing
visitors’ length of stay, overnights and associated spending. It is important to note that significant
enhancement of the trail system can increase Mat-Su’s share of the statewide market.
As with the road system enhancements, an ongoing, systemic approach to improvements is recommended.
Mat-Su could achieve these projected results over an 8 to 10 year timeframe.
SUMMER OUT-OF-STATE VISITATION
While Mat-Su has an extensive trail system, summer out-of-state visitors utilize these assets far less frequently
than in other regions of the state. For example, 43 percent of Talkeetna summer visitors participated in a hike
or nature walk during their entire Alaska trip. While in Talkeetna, only 6 percent participated in this same
activity. The pattern holds true for Palmer/Wasilla visitors as well. Forty-five percent of Palmer/Wasilla visitors
experienced a hike or nature walk in Alaska, but only 13 percent did so while in this area of Mat-Su.
It is difficult to pinpoint the reasons that the same market’s participation in this activity was markedly lower in
Mat-Su than other parts of Alaska. Based on analysis of tour and activity participation in other Alaska
destinations, as well as input from regional visitor industry and trail system experts, the study team believes
that the potential participation for trail-related activities is largely untapped.
To enhance the potential for guided and unguided use of the trails, visitors need to be aware of the variety of
trails and their associated ratings for walking/hiking abilities and distance. Priorities should be placed on trail
systems in areas with wildlife viewing potential, mountain viewing potential, flora and fauna interest,
historical interest, etc. The trails also need to provide a sense of safety, which is implied through mapping,
trailheads and parking, interpretive signage and maintenance.
Trail system enhancements can also encourage participation in other outdoor activities and tours including
day cruises, wildlife viewing, fishing, rafting and canoeing. As with hiking and nature walks, visitors’
participation in these activities is lower in the Mat-Su region than in other Alaska destinations.
Appendices McDowell Group, Inc. • Page APP-66
The availability of tours and recreational activities are important factors when visitors make decisions about
where to go and how long to spend in each destination. Further, whether visitors participate in trail-oriented
activities independently—or with a local guide or tour company—their overall Mat-Su experience can be
enhanced and their length of stay increased.
Low Case: The study team estimates that enhancing the trail system could increase the percentage of the
market that overnights in the region from approximately 50 percent of the market to 52 percent. The
resulting increase of 5,900 visitors would generate approximately 2,950 room nights. Based on an average
expenditure of $146 per person, spending associated with these visitors would total approximately $860,000.
(These additional visitors represent an increase of 3 percent in estimated visitors that overnight in the region.)
High Case: An increase of 4 percent would result in 11,800 new visitors, an additional 5,900 room nights
and $1.7 million in new spending. (This represents a nearly 6 percent increase in visitors that overnight in the
region.)
FALL/WINTER OUT-OF-STATE VISITATION
The fall/winter out-of-state market, estimated at 250,000 visitors, is small in comparison to the summer
market. However, the vacation/pleasure visitors that come during this period are highly motivated to
experience uniquely Alaskan activities and destinations. Trails are particularly important for visitors and tour
operators that want to experience snowmobiling, cross-country skiing and dog sledding. Mat-Su is well-
poised to grow this market due to its proximity to Anchorage (the primary winter transportation hub and
destination), the assortment of lodges in the region and the virtually world-wide recognition of winter events
like the Iditarod.
An estimated 37,000 visitors traveled to Mat-Su during the fall/winter months; approximately half of these
visitors overnight in the region.
As with the summer market, tour and activity participation among Mat-Su’s fall/winter visitors was lower in
Mat-Su when compared to other Alaska destinations. Snowmobiling was among the leading fall/winter
activities in the Mat-Su region at 5 percent. Participation in this winter activity can be considerably enhanced
by trail maintenance and trailhead development. Skiing and snowboarding was mentioned by less than one
percent of fall/winter visitors.
Review of the statewide vacation/pleasure market’s participation in winter activities demonstrates Mat-Su’s
potential for increasing visitor participation in outdoor recreational activities. Top trail-oriented winter
activities included hiking/nature walks (15 percent), dog sledding (13 percent), skiing/snowboarding (9
percent) and snowmobiling (7 percent).
Low Case: Currently, just 7 percent of the statewide fall/winter market spends a night in a Mat-Su
community. An increase of 0.5 percent in overnight travel to the region would result in 1,250 visitors or 625
room nights. Based on the average visitor spending during the fall/winter period of $84 per person, per
night, new expenditures associated with these visitors would be $105,000. (This increase in overnight visitor
volume represents a nearly 7 percent increase from the current overnight market.)
Appendices McDowell Group, Inc. • Page APP-67
High Case: Increasing overnight stays by 1 percent would result in a gain of 2,500 visitors, 1,250 overnights
and $210,000 in spending. (This increase represents a nearly 14 percent increase when compared to the
current overnight market during this period.)
SUMMER IN-STATE VISITATION
During the summer months, an estimated 263,000 Alaska residents visit Mat-Su an average of six times. With
an average travel party size of 3.22 people, the number of room nights attributed to the in-state summer
market is approximately 39,000 nights.
The in-state summer market includes a number of frequent users of the Mat-Su trail system—especially boat
launches. Twenty-six percent of the market reported fishing in the region; 22 percent reported participation
in “recreation and sports” (which included activities like hiking and biking); 12 percent participated in water
activities such as boating, swimming and canoeing; and 12 percent reported camping.
However, this market also reports a high tendency to make day trips to Mat-Su and a low rate of
accommodation usage (8 percent). The study team focused its analysis on potential increases to overnight
stays, rather than an increase in total visitation.
Low Case: Increasing the percentage of commercial accommodation usage from 8 percent to 9 percent
would result in nearly 4,900 room nights. Estimated spending associated with these overnights (based on
average spending of $125 per party) is $612,500. (This increase represents a 13 percent increase over the
current estimate of in-state market overnights.)
High Case: Increasing accommodation usage from 8 percent to 10 percent results in 9,800 room nights and
$1,225,000 in new spending. (This increase is a 25 percent increase over the current overnighting market.)
FALL/WINTER IN-STATE VISITATION
As with the in-state summer market, fall/winter travelers report low usage of commercial accommodations in
the Mat-Su region (9 percent). The estimated number of room nights associated with this market is just over
60,000.
The study team estimated the role that trail system enhancements could play in drawing residents further
into the region, extending their stay and ultimately increasing their usage of overnight accommodations like
lodges and B&Bs. Interviews with regional lodge owners and tour operators reinforce the study team’s
assumptions about the potential for market growth.
Leading winter travel motives include several trail-oriented activities like snowmobiling (15 percent), skiing
(10 percent) and dog mushing (3 percent). Based on the popularity of these activities among Alaska
residents, trail system enhancements can stimulate increased travel frequency and overnights.
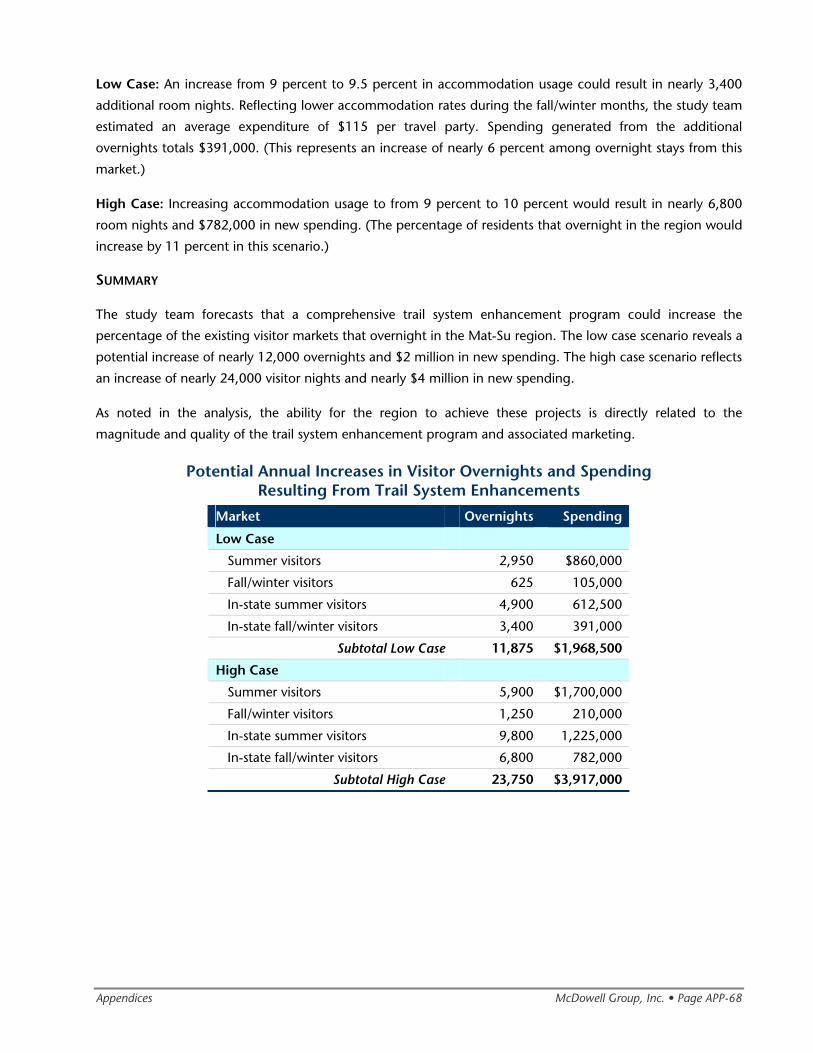
Appendices McDowell Group, Inc. • Page APP-68
Low Case: An increase from 9 percent to 9.5 percent in accommodation usage could result in nearly 3,400
additional room nights. Reflecting lower accommodation rates during the fall/winter months, the study team
estimated an average expenditure of $115 per travel party. Spending generated from the additional
overnights totals $391,000. (This represents an increase of nearly 6 percent among overnight stays from this
market.)
High Case: Increasing accommodation usage to from 9 percent to 10 percent would result in nearly 6,800
room nights and $782,000 in new spending. (The percentage of residents that overnight in the region would
increase by 11 percent in this scenario.)
SUMMARY
The study team forecasts that a comprehensive trail system enhancement program could increase the
percentage of the existing visitor markets that overnight in the Mat-Su region. The low case scenario reveals a
potential increase of nearly 12,000 overnights and $2 million in new spending. The high case scenario reflects
an increase of nearly 24,000 visitor nights and nearly $4 million in new spending.
As noted in the analysis, the ability for the region to achieve these projects is directly related to the
magnitude and quality of the trail system enhancement program and associated marketing.
Potential Annual Increases in Visitor Overnights and Spending Resulting From Trail System Enhancements
Market Overnights Spending
Low Case
Summer visitors 2,950 $860,000
Fall/winter visitors 625 105,000
In-state summer visitors 4,900 612,500
In-state fall/winter visitors 3,400 391,000
Subtotal Low Case 11,875 $1,968,500
High Case
Summer visitors 5,900 $1,700,000
Fall/winter visitors 1,250 210,000
In-state summer visitors 9,800 1,225,000
In-state fall/winter visitors 6,800 782,000
Subtotal High Case 23,750 $3,917,000
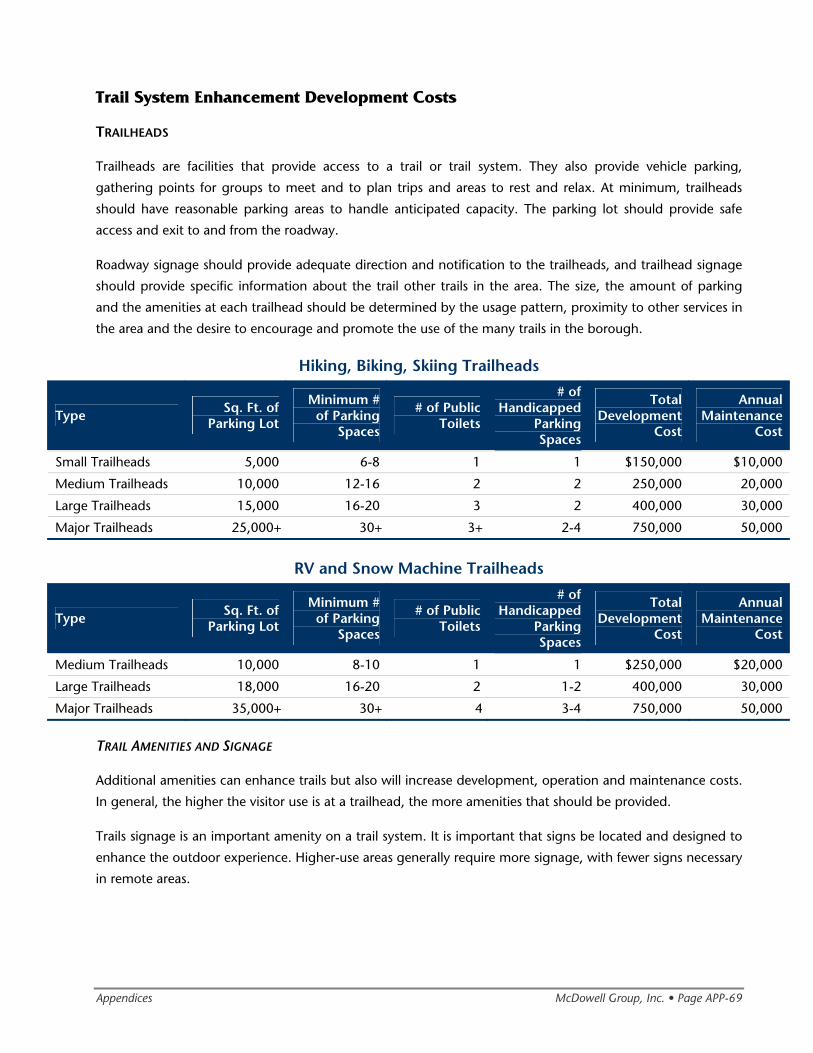
Appendices McDowell Group, Inc. • Page APP-69
Trail System Enhancement Development Costs
TRAILHEADS
Trailheads are facilities that provide access to a trail or trail system. They also provide vehicle parking,
gathering points for groups to meet and to plan trips and areas to rest and relax. At minimum, trailheads
should have reasonable parking areas to handle anticipated capacity. The parking lot should provide safe
access and exit to and from the roadway.
Roadway signage should provide adequate direction and notification to the trailheads, and trailhead signage
should provide specific information about the trail other trails in the area. The size, the amount of parking
and the amenities at each trailhead should be determined by the usage pattern, proximity to other services in
the area and the desire to encourage and promote the use of the many trails in the borough.
Hiking, Biking, Skiing Trailheads
Type Sq. Ft. of Parking Lot
Minimum # of Parking
Spaces
# of Public Toilets
# of Handicapped
Parking Spaces
Total Development
Cost
Annual Maintenance
Cost
Small Trailheads 5,000 6-8 1 1 $150,000 $10,000
Medium Trailheads 10,000 12-16 2 2 250,000 20,000
Large Trailheads 15,000 16-20 3 2 400,000 30,000
Major Trailheads 25,000+ 30+ 3+ 2-4 750,000 50,000
RV and Snow Machine Trailheads
Type Sq. Ft. of Parking Lot
Minimum # of Parking
Spaces
# of Public Toilets
# of Handicapped
Parking Spaces
Total Development
Cost
Annual Maintenance
Cost
Medium Trailheads 10,000 8-10 1 1 $250,000 $20,000
Large Trailheads 18,000 16-20 2 1-2 400,000 30,000
Major Trailheads 35,000+ 30+ 4 3-4 750,000 50,000
TRAIL AMENITIES AND SIGNAGE
Additional amenities can enhance trails but also will increase development, operation and maintenance costs.
In general, the higher the visitor use is at a trailhead, the more amenities that should be provided.
Trails signage is an important amenity on a trail system. It is important that signs be located and designed to
enhance the outdoor experience. Higher-use areas generally require more signage, with fewer signs necessary
in remote areas.
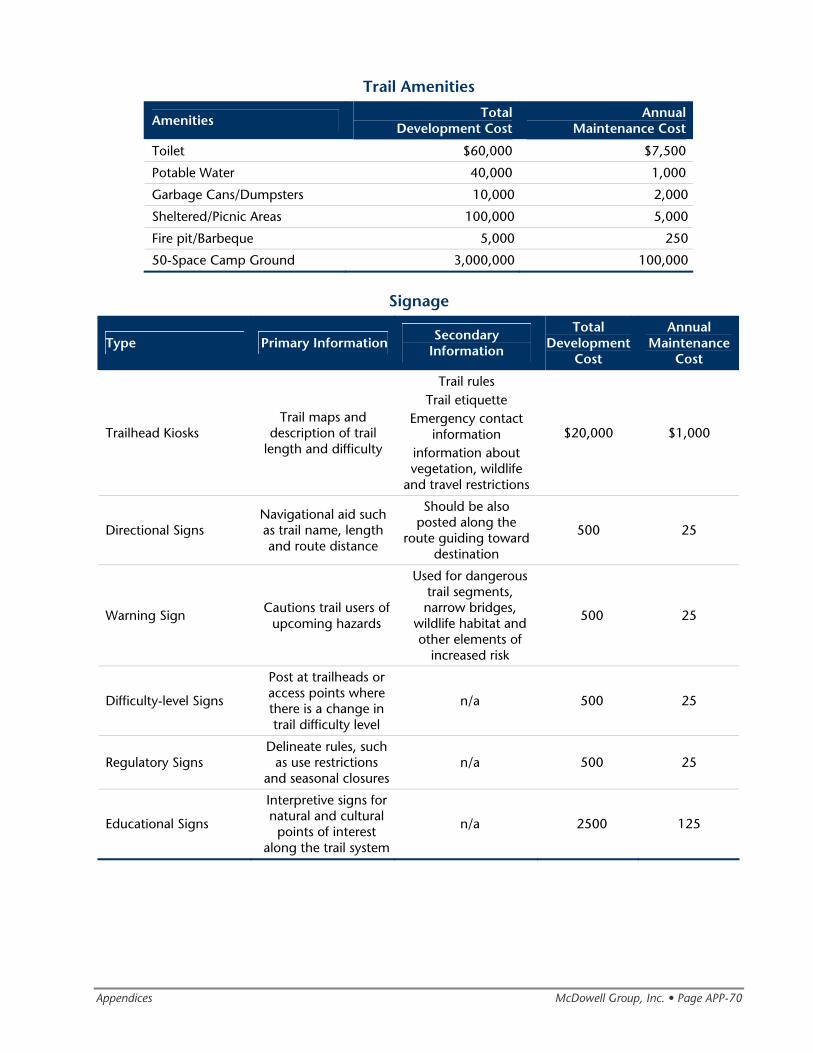
Appendices McDowell Group, Inc. • Page APP-70
Trail Amenities
Amenities Total Development Cost
Annual Maintenance Cost
Toilet $60,000 $7,500
Potable Water 40,000 1,000
Garbage Cans/Dumpsters 10,000 2,000
Sheltered/Picnic Areas 100,000 5,000
Fire pit/Barbeque 5,000 250
50-Space Camp Ground 3,000,000 100,000
Signage
Type Primary Information Secondary Information
Total Development
Cost
Annual Maintenance
Cost
Trailhead Kiosks Trail maps and
description of trail length and difficulty
Trail rules Trail etiquette
Emergency contact information
information about vegetation, wildlife
and travel restrictions
$20,000 $1,000
Directional Signs Navigational aid such as trail name, length and route distance
Should be also posted along the
route guiding toward destination
500 25
Warning Sign Cautions trail users of upcoming hazards
Used for dangerous trail segments, narrow bridges,
wildlife habitat and other elements of
increased risk
500 25
Difficulty-level Signs
Post at trailheads or access points where there is a change in trail difficulty level
n/a 500 25
Regulatory Signs Delineate rules, such
as use restrictions and seasonal closures
n/a 500 25
Educational Signs
Interpretive signs for natural and cultural
points of interest along the trail system
n/a 2500 125
Appendices McDowell Group, Inc. • Page APP-71
Sustainable Trail Standards
All trail users create an impact to the area the trail travels through. The purpose of the trail is to minimize the
impact to the natural environment by confining the activity in one corridor. The trail corridor is modified in
order to handle the traffic it receives. By definition sustainable trails protect the natural environment and are
constructed in a manner that requires minimal on-going maintenance. The following are key elements in
planning for sustainable trails:
• Establish maintenance and design standards for motorized and non-motorized trails.
• Design trails with consideration for grades and slopes. Trails should follow natural topography. Side-
hill slopes of greater than 15 percent should be avoided.
• Coordinate excavation with vegetation and drainage considerations. Minimize soil disturbance in
order to allow vegetation the best chance for survival; aesthetic appeal will be correspondingly high.
• Eliminate the potential for erosion.
• Use arboriculturally correct and aesthetic pruning or removal of tree limbs and shrubs.
• Minimize drainage problems by removing water at the first opportunity.
• Maintain existing drainage patterns; do not force nature.
• Out-slope the trail, 1-3 percent, to allow for sheet drainage; accurately shape backslope to prevent
erosion.
• Use select borrow or retaining walls to improve less than adequate trail surface areas.
• Attain proper slope and compaction through a detailed analysis of onsite conditions during wet and
dry periods.
• Consider the physical and visual relationship of vegetation to the trail.
Appendices McDowell Group, Inc. • Page APP-72
Visitor Support Services
Achieving projected changes discussed below in overnight visitation and spending is contingent on a
comprehensive visitor information program and a likely 5 to 10-year time horizon.
Potential Market Increases from Visitor Support Service Enhancements
Visitor information kiosks and informational signage play an important role in ensuring that the traveler
understands what there is to see and do in an area. The more the region has to offer, the longer visitors will
stay. Only a small portion of visitors stop at visitor information centers (less than 10 percent nationally),
therefore supporting signage is essential to help visitors find their way to the communities, activities and
attractions found in the region.
Additional visitor information kiosks and signage will have the most impact on independent visitors from both
non-resident and resident markets. In summer, this represents an estimated 200,000 non-resident
independent visitors and 263,000 Alaska residents. If these improvements influence just 3 percent of each
market to stay an additional night in the region, then the region would see $876,000 in additional spending
from non-resident visitors (6,000 visitors @ $146 per night; 3,000 room nights) and $986,250 from resident
visitors (7,890 visitors @ $125 per night; 3,945 room nights), for a total of nearly $1.9 million annually. If
these improvements influenced 5 percent of each market, then the new spending would be $1.46 million for
non-residents and $1.64 million for Alaska residents, for a total of over $3 million.
In fall/winter, visitor support service enhancements will also help influence longer stays from both markets.
Non-resident visitors are small in number and typically are visiting friends and family or traveling on business,
with only a small percentage (15 percent) on vacation. If 5 percent of this market were influenced to spend
just an extra one-half day in the region, then an additional $77,700 would be generated in new spending
(1,850 visitors @ $84; 925 room nights). If 5 percent of this market could be influenced to spend an
additional night in the region, then an additional $155,400 in new spending would be generated.
Alaska residents typically travel to the region during these months on the weekends. The increased spending
at first will come from doing more during their stay, rather than increasing the length of their stay. Additional
visitor information will stimulate travel frequency and longer stays on subsequent trips. If 5 percent of the
non-resident market spent an extra one-half day in the region, then an additional $378,100 in spending
would be generated. If 5 percent stayed an additional night in the region, then the spending would be
$756,200. In total, new spending in fall/winter could range from $456,000 to $912,000 annually from these
improvements.
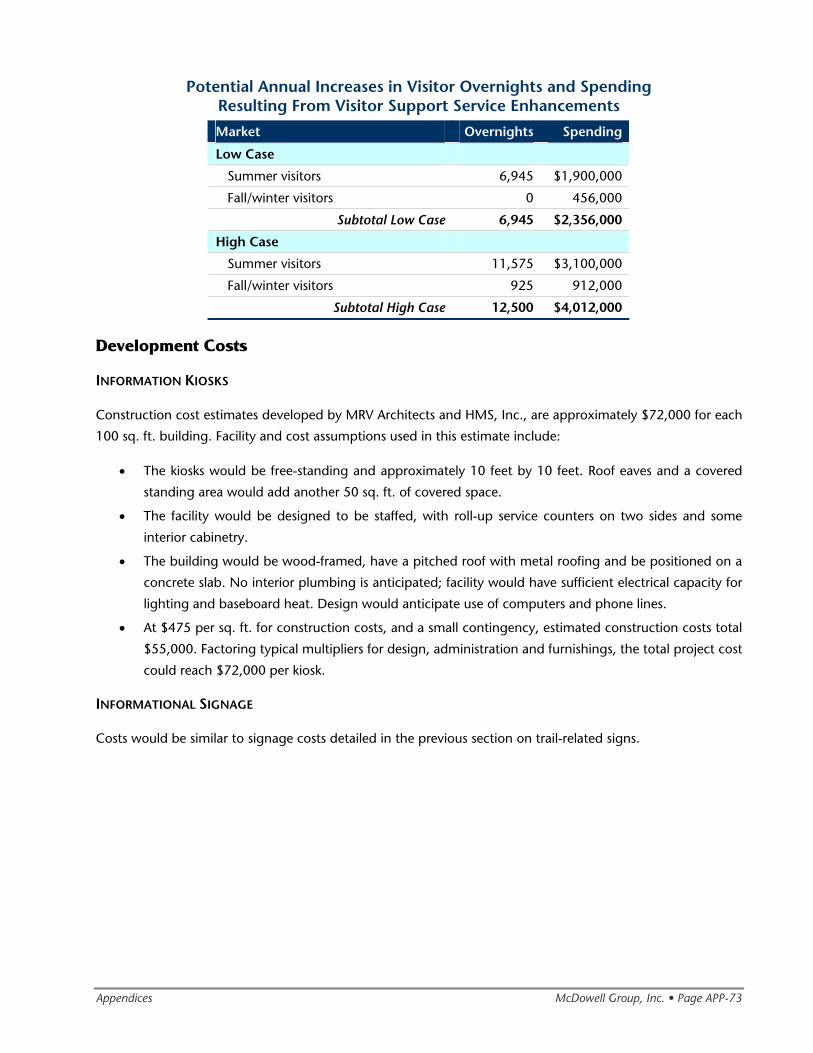
Appendices McDowell Group, Inc. • Page APP-73
Potential Annual Increases in Visitor Overnights and Spending Resulting From Visitor Support Service Enhancements
Market Overnights Spending
Low Case
Summer visitors 6,945 $1,900,000
Fall/winter visitors 0 456,000
Subtotal Low Case 6,945 $2,356,000
High Case
Summer visitors 11,575 $3,100,000
Fall/winter visitors 925 912,000
Subtotal High Case 12,500 $4,012,000
Development Costs
INFORMATION KIOSKS
Construction cost estimates developed by MRV Architects and HMS, Inc., are approximately $72,000 for each
100 sq. ft. building. Facility and cost assumptions used in this estimate include:
• The kiosks would be free-standing and approximately 10 feet by 10 feet. Roof eaves and a covered
standing area would add another 50 sq. ft. of covered space.
• The facility would be designed to be staffed, with roll-up service counters on two sides and some
interior cabinetry.
• The building would be wood-framed, have a pitched roof with metal roofing and be positioned on a
concrete slab. No interior plumbing is anticipated; facility would have sufficient electrical capacity for
lighting and baseboard heat. Design would anticipate use of computers and phone lines.
• At $475 per sq. ft. for construction costs, and a small contingency, estimated construction costs total
$55,000. Factoring typical multipliers for design, administration and furnishings, the total project cost
could reach $72,000 per kiosk.
INFORMATIONAL SIGNAGE
Costs would be similar to signage costs detailed in the previous section on trail-related signs.
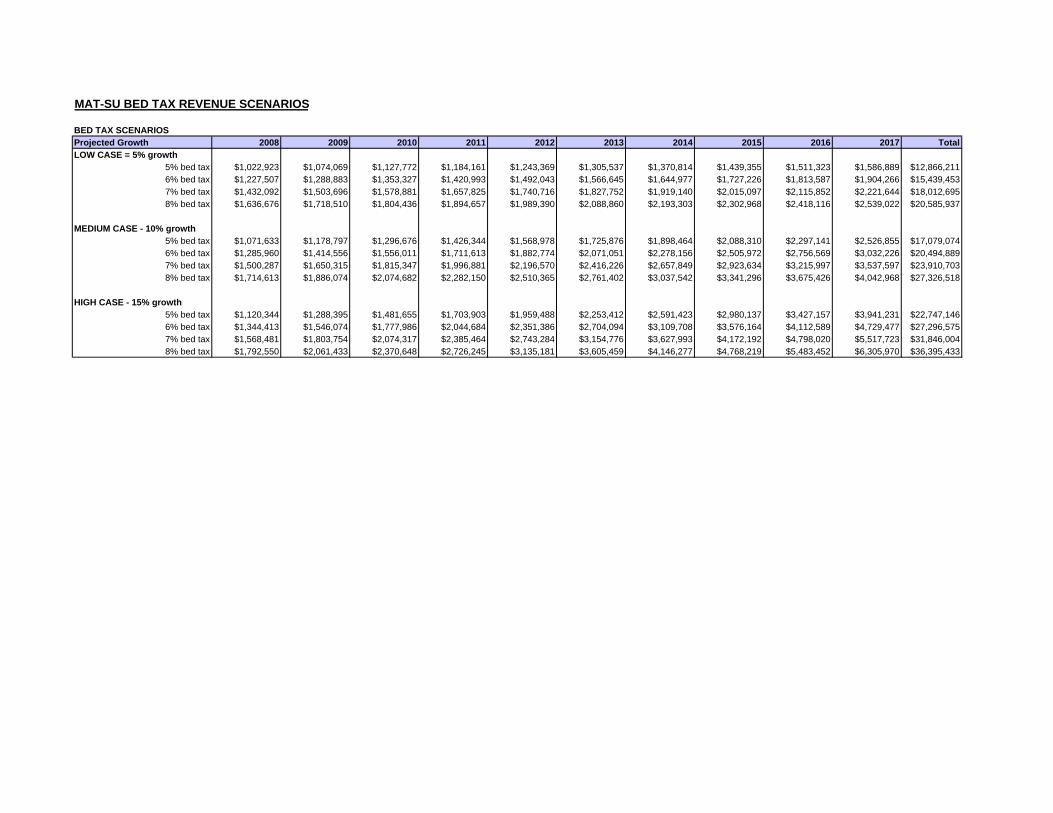
MAT-SU BED TAX REVENUE SCENARIOS
BED TAX SCENARIOSProjected Growth 2008 2009 2010 2011 2012 2013 2014 2015 2016 2017 TotalLOW CASE = 5% growth
5% bed tax $1,022,923 $1,074,069 $1,127,772 $1,184,161 $1,243,369 $1,305,537 $1,370,814 $1,439,355 $1,511,323 $1,586,889 $12,866,2116% bed tax $1,227,507 $1,288,883 $1,353,327 $1,420,993 $1,492,043 $1,566,645 $1,644,977 $1,727,226 $1,813,587 $1,904,266 $15,439,4537% bed tax $1,432,092 $1,503,696 $1,578,881 $1,657,825 $1,740,716 $1,827,752 $1,919,140 $2,015,097 $2,115,852 $2,221,644 $18,012,6958% bed tax $1,636,676 $1,718,510 $1,804,436 $1,894,657 $1,989,390 $2,088,860 $2,193,303 $2,302,968 $2,418,116 $2,539,022 $20,585,937
MEDIUM CASE - 10% growth5% bed tax $1,071,633 $1,178,797 $1,296,676 $1,426,344 $1,568,978 $1,725,876 $1,898,464 $2,088,310 $2,297,141 $2,526,855 $17,079,0746% bed tax $1,285,960 $1,414,556 $1,556,011 $1,711,613 $1,882,774 $2,071,051 $2,278,156 $2,505,972 $2,756,569 $3,032,226 $20,494,8897% bed tax $1,500,287 $1,650,315 $1,815,347 $1,996,881 $2,196,570 $2,416,226 $2,657,849 $2,923,634 $3,215,997 $3,537,597 $23,910,7038% bed tax $1,714,613 $1,886,074 $2,074,682 $2,282,150 $2,510,365 $2,761,402 $3,037,542 $3,341,296 $3,675,426 $4,042,968 $27,326,518
HIGH CASE - 15% growth5% bed tax $1,120,344 $1,288,395 $1,481,655 $1,703,903 $1,959,488 $2,253,412 $2,591,423 $2,980,137 $3,427,157 $3,941,231 $22,747,1466% bed tax $1,344,413 $1,546,074 $1,777,986 $2,044,684 $2,351,386 $2,704,094 $3,109,708 $3,576,164 $4,112,589 $4,729,477 $27,296,5757% bed tax $1,568,481 $1,803,754 $2,074,317 $2,385,464 $2,743,284 $3,154,776 $3,627,993 $4,172,192 $4,798,020 $5,517,723 $31,846,0048% bed tax $1,792,550 $2,061,433 $2,370,648 $2,726,245 $3,135,181 $3,605,459 $4,146,277 $4,768,219 $5,483,452 $6,305,970 $36,395,433
Appendices McDowell Group, Inc. • Page APP-74
Appendix D: Contacts and Information Sources
Project Contacts
The project team wishes to acknowledge the contributions of the following individuals during the
development of this project. Many other individuals also assisted the team with data clarification and other
questions.
• Laura Bedard, Executive Director, Iron Dog, Wasilla
• Wayne Beissel, Supervisor, Mat-Su Area State Parks, Palmer
• Scott Carrlee, Curator of Museum Services, Alaska State Museum, Juneau
• Stefanie Gorder, Premier Alaska Tours, Anchorage
• Steve Halloran, Vice President of Community, Member & Visitor Relations, Anchorage Convention &
Visitors Bureau
• Deb Hickok, President and CEO, Fairbanks Convention & Visitors Bureau
• Lisa Holzapfel, Director, Rivers and Trails Conservation, National Parks Service, Anchorage
• Jeff Jabush, Finance Director, City of Wrangell
• Maggie Kelly, Director of Alaska Operations, Royal Celebrity Tours, Anchorage
• James King, Director of State Parks, Department of Natural Resources, Anchorage
• Bill Luck, Trail Coordinator, Chugach State Park, Anchorage
• Chris Mannix, Director, Denali Nordic Ski Club, Talkeetna
• Cheryl Metiva, Executive Director, Greater Wasilla Chamber of Commerce, Wasilla
• Marty Metiva, Executive Director, Mat-Su RC&D, Wasilla
• Bob Noll, Finance Department, City of Ketchikan
• Bruce Paulson, Parks and Recreation Staff, Matanuska-Susitna Borough, Palmer
• Dean Phipps, Marketing Director, Alaska State Fair, Palmer
• Eileen Probasco, Director of Planning and Land Use, Matanuska-Susitna Borough, Palmer
• Bonnie Quill, Executive Director, Mat-Su Convention and Visitors Bureau, Palmer
• Ruby Rector, Borough Treasurer, Denali Borough
• Ross Risvold, Public Finance Director, Municipality of Anchorage
• Mike Schroeder, Planning, Department of Natural Resources, Anchorage
• Craig Seibert, Owner, Gate Creek Cabins, Petersville Road
• Steve Silversteen, Planning, Alaska Railroad Corporation, Anchorage
• Chas St. George, Director of Public Relations, Iditarod Trail Committee, Wasilla
• Ed Strabel, Groomer, Mat-Su Ski Club, Hatcher Pass
• Jim Stratton, Director, National Parks Conservation Association, Anchorage
• Ron Swanson, Consultant, RWS Consulting, Mat-Su Borough
• Brad Sworts, Transportation Department, Mat-Su Borough, Palmer
Appendices McDowell Group, Inc. • Page APP-75
• Warren Templan, Parks and Recreation Staff, Matanuska-Susitna Borough, Palmer
• Scott Torrison, Director of Tourism, CIRI, Talkeetna
• Bruce Urban, Recreation & Cultural Services Manager, City of Wasilla, Wasilla
• Miriam Valentine, Ranger, National Parks Service, Talkeetna
Data and Information Sources
Visitor volume estimates, expenditure estimates, and information about visitors’ activities within the Mat-Su
region are drawn from a number of sources, including:
• Alaska Visitor Statistics Program V, Fall/Winter, McDowell Group
• Alaska Visitor Statistics Program V, Summer, McDowell Group
• Alaska Resident In-State Pleasure Travel Study Report, GMA Research
• Alaska Taxable, Municipal Taxation Rates and Policies, State of Alaska, DCCED
• Demand Studies for Facilities Related to Hatcher Pass Ski Area, McDowell Group
• Draft South Denali Implementation Plan and Environmental Impact Statement, National Park Service
• Economic Development Plan, Matanuska-Susitna Borough, International Economic Development
Council
• Economic Impacts of the Alaska State Fair, McDowell Group
• Economic Impacts of the Cruise Industry in Alaska, McDowell Group
• Economic Impacts of the South Denali Implementation Plan, Institute of Social and Economic Research
• Glenn Highway National Scenic Byway Interpretive Plan, Alaska Division of Parks and Outdoor
Recreation, Interpretation and Education
• Glenn Highway Partnership Plan, HDR Alaska, Inc. and Land Design North
• Haines Convention Center Feasibility Study, McDowell Group
• Hatcher Pass—A New Beginning, Matanuska-Susitna Borough
• Iditarod Restart Financial Impact Study, Northern Economics
• Mat-Su Long Range Transportation Plan, HDR Alaska, Inc.
• Mat-Su Regional Aviation Plan, DOWL Engineers Inc.
• Mat-Su Visitor Impact Study, Fall/Winter, Alaska Village Initiatives
• Mat-Su Visitor Impact Study, Summer, Alaska Village Initiatives
• Mat-Su Visitor Profiles, McDowell Group
• Knik Arm Crossing, Final Environmental Impact Statement, KABTA
• Knik Arm Toll Bridge Traffic and Toll Review, Wilbur Smith Associates
• Denali National Park and Preserve Final South Denali Implementation Plan, National Park Service
• National Survey of Fishing, Hunting, and Wildlife-Associated Recreation, 2006, U.S. Fish & Wildlife
Service

Appendices McDowell Group, Inc. • Page APP-76
The study team also collected updated population data from the Alaska Department of Labor and Workforce
Development, analyzed cruise passenger data from Cruise Line Agencies of Alaska, compiled business license
and bed tax data for the Matanuska-Susitna Borough, and utilized the econometric model IMPLAN to identify
employment and labor income impacts of the industry.
Appendices McDowell Group, Inc. • Page APP-77
Appendix E: Montana Tourism Infrastructure Investment Program Guidelines
A copy of the 2007 guidelines follows this cover page.
TOURISM INFRASTRUCTURE INVESTMENT PROGRAM GUIDELINES
2007 Purpose - The purpose of the Tourism Infrastructure Investment Program (TIIP) is to provide grant funding to facilitate the development of new tourism-related products, and the enhancement of existing products to encourage visitors to stay in the state of Montana longer. Such developments and enhancements will strengthen Montana’s presence in the marketplace as a competitive tourism destination. Program Summary - Source of funds:
Travel Montana, a division of the Montana Department of Commerce, as part of its annual operating budget utilizing Montana Lodging Facility Use Tax revenues, will provide the funding for the TIIP.
Amount of funds available annually:
Travel Montana will set the TIIP Grant funding amount as part of its annual budgeting process. The amount will be identified as part of Travel Montana’s budget at the June Tourism Advisory Council meeting and announced through various public information sources.
Number and dollar amount of grant awards:
There is no set number of grant awards that may be made in any fiscal year. However, the total dollar amount of the grant award(s) to be made each year may not exceed the total amount of the TIIP funding set by Travel Montana for that specific year. The minimum grant funding that can be allocated to any one proposed project in any fiscal year will be $20,000. The maximum grant funding that can be allocated to any one proposed project will be the maximum of the TIIP funding set for that given fiscal year. A proposed project may receive all, or a portion of the grant funding requested in a specific grant proposal.
Program matching funds policy: The project sponsor must provide a match to the funds available through the TIIP. The required project sponsor match will be a minimum $1.00 for every $2.00 in TIIP monies allocated. The project match must be in the form of a monetary investment (hard match) or money invested in the project during the current fiscal year and the immediate previous fiscal year prior to the application deadline. Proposed matches will be reviewed on a specific project by project basis by
1
Travel Montana. The proof of the hard match or money invested in the project will have to be provided prior to the release of any TIIP funds.
Un-allocated grant funds:
Grant funds not allocated through the TIIP in any given fiscal year will revert back to Travel Montana’s general budget to be re-allocated to other Travel Montana programs.
Time period for spending grant funds:
The project must be completed within 18 months from the signing of the contract by the Department of Commerce.
Program Fund Usage - Only non-profit, tourism-related projects will be eligible for TIIP funding. The TIIP Scoring Committee will review projects submitted for consideration and determine specific project eligibility, rating and level of funding to be allocated. The following types of usage would be allowed and encouraged with funds as part of the TIIP (list is not all-inclusive):
* Project construction costs (brick & mortar) associated with building new and/or remodeling or preserving existing tourism and recreation attractions, historical sites and artifacts
* Costs associated with purchasing new and/or existing tourism and recreation
attractions, historical sites and artifacts * Equipment purchased for specific tourism project operation
The following types of usage would not be allowed with funds as part of the TIIP (list is not all-inclusive):
* Salaries and administrative costs such as rent, postage, utilities, taxes, etc.
* Entertainment, honoraria
* Travel, food or lodging
* Marketing, advertising, trade shows
* Infrastructure such as community roads, sewers, sidewalks, water systems, etc.
* Routine upkeep and maintenance expenses
* Market research/feasibility studies Program Application Process - Program Applicants:
2
TIIP Grant funds will only be allocated to applicant sponsors officially representing tourism-related, non-profit groups (such as chambers of commerce, economic development corporations, community clubs or organizations, historic preservation associations, etc.). Program applicants must be officially recognized by the IRS as having a non-profit status. Montana Indian tribes, cities and counties would be considered as qualifying tourism-related, non-profit groups for the purposes of applying for TIIP Grant funds. State and federal public-sector agencies may apply for grant funds as a part of this program, but may be considered lower in priority to qualified private-sector applicants.
Applicants may apply in successive years, regardless of receiving funding in previous TIIP project applications. Applicants awarded TIIP funds are eligible to re-apply for program funds only after they have successfully completed and closed out their TIIP project contract. Applicants and projects receiving TIIP funds within the previous 5 years may be considered lower in priority to other qualified applicants. Applications for the TIIP Grants are updated by March of each year. To access a current TIIP Application, contact Travel Montana’s Tourism Development Coordinator, 406-841-2795, or download the forms from the program’s website: http://travelmontana.mt.gov/forms/
Project Grant Proposal Review, Scoring & Selection Procedure: Grant proposals received by the established deadline set forth in the application will be reviewed and scored by the TIIP Scoring Committee. This committee will, at a minimum, be comprised of two representatives from the Montana Department of Commerce’s Travel Montana program and three representatives from the Tourism Advisory Council. Grant proposals will be scored on the strength and merit of the proposal as demonstrated in the responses to the TIIP Application’s questions and requests for information. Grant proposals must respond to all sections of the TIIP Grant Application in the manner requested by the application’s questions and requests for information. One grant proposal must be submitted for each project requesting funding consideration.
Following its review and scoring, the committee will present its TIIP Grant Funding recommendation list to the Tourism Advisory Council at their Fall meeting. The Council will act on these recommendations and develop a TIIP Grant funding recommendation list to be sent to the Montana Department of Commerce Director for final approval.
Disbursement of Funds - Following the Montana Department of Commerce Director’s approval of the TIIP Grant Funding recommendation list, Travel Montana will initiate
3
and coordinate the completion of necessary contractual agreements between the Department of Commerce and the appropriate project sponsor(s). Such contractual agreements will outline, among other pertinent details, a Project Implementation Schedule, Duties and Expectations of each party and penalties for non-performance. Upon finalization of the necessary contractual documentation, Travel Montana will facilitate the steps necessary to distribute the grant funds to the appropriate project sponsor(s). No TIIP funds may be obligated until the contract has been signed by both the project sponsor and the Department of Commerce. TIIP funds may only be used for the purpose approved in the application. Project Status Reports - Project sponsors receiving TIIP Grant fund awards will be required to submit quarterly project development and implementation update reports from the time the contract is finalized until such time as the proposed project is completed, and/or until such time as the 18-month time period has expired. These brief reports must follow a pre-determined format to include a short narrative describing the present status of the funded project and an accounting of grant funds invested to date in the development and implementation of the specific project. Project sponsors may also be invited to present project status reports to meetings of the Tourism Advisory Council.
4
Related Documents