I MASTER’S THESIS: ADSORPTION REMOVAL OF TERTIARY BUTYL ALCOHOL FROM WASTEWATER BY ZEOLITE A Thesis Submitted in Partial Fulfillment of the Requirements for the Degree of Master of Science in Chemical Engineering at Worcester Polytechnic Institute May 2008 Submitted By: _______________________________________ TRICIA D. BUTLAND WORCESTER POLYTECHNIC INSTITUTE WORCESTER, MA 01609 Date: 30 April 2008 Submitted To: _______________________________________ Dr. Robert Thompson, Advisor _______________________________________ Dr. John Bergendahl, Co-Advisor _______________________________________ Dr. David DiBiasio, Department Head Chemical Engineering

Welcome message from author
This document is posted to help you gain knowledge. Please leave a comment to let me know what you think about it! Share it to your friends and learn new things together.
Transcript

I
MASTER’S THESIS:
ADSORPTION REMOVAL OF TERTIARY BUTYL ALCOHOL
FROM WASTEWATER BY ZEOLITE
A Thesis Submitted in Partial Fulfillment of the Requirements
for the Degree of Master of Science in Chemical Engineering
at Worcester Polytechnic Institute
May 2008
Submitted By:
_______________________________________
TRICIA D. BUTLAND
WORCESTER POLYTECHNIC INSTITUTE
WORCESTER, MA 01609
Date: 30 April 2008
Submitted To:
_______________________________________
Dr. Robert Thompson, Advisor
_______________________________________
Dr. John Bergendahl, Co-Advisor
_______________________________________
Dr. David DiBiasio, Department Head
Chemical Engineering

II
ABSTRACT
Tertiary butyl alcohol (TBA) is used as a fuel oxygenate and is the main breakdown
component of methyl tert butyl ether (MTBE). As such, TBA is found in water systems
through storage leaks and spills, presence of MTBE in the water, and as an impure
byproduct of MTBE-blended fuels. It presents several health hazards and is a suspected
carcinogen. Studies involving aquatic life, mice and rats indicate that TBA is a concern at
low concentrations. Wastewater removal of tert butyl alcohol (TBA) has been limited to
methodology used by MTBE or by anaerobic or aerobic methods. Neither set of
techniques is applicable to TBA due to its long biological degradation period, its very
specific conditions for anerobic or aerobic treatment, and its low Henry’s law constant,
low transformation rate, and its high mobility.
The main goal of this project was to determine the adsorption capabilities of different
zeolites for TBA. A comparison to previous work done with powdered zeolites and
MTBE is shown in the following Chapters. Batch systems of TBA and several different
zeolites were examined to determine the best zeolites for TBA adsorption. As shown in
Chapter 3, the best zeolites for TBA adsorption over an equilibrium time of 48 hours
were silicalite and HiSiv 3000 pellets. Using the two chosen zeolites, silicalite and HiSiv
3000, adsorption isotherms were created and compared against MTBE data using the
same data.
The final portion of this project included a continuous system consisting of a zeolite
column and a steady flow rate of TBA. The zeolite columns consisted of sole silicalite,
sole HiSiv 3000, and different proportions of the two zeolites in the same column. All
column experiments were run at similar conditions with variation in the adsorbent bed
lengths for easy comparison between the resulting breakthrough curves. At the 3-cm bed
length, the zeolite columns outperformed the activated carbon column; however, there
was no distinct difference between the zeolite columns. In the 6-cm bed length
experiments, there were apparent differences between the two zeolite breakthrough
curves. The 9-cm column did not differentiate between the zeolites.

III
ACKNOWLEDGEMENTS
“Engineering is an activity other than purely manual and physical work which brings
about the utilization of the materials and laws of nature for the
good of humanity,” R.E. Hellmund (1929)
All batch experiments were conducted in the Environmental Laboratory in Kaven Hall,
Department of Civil Engineering at Worcester Polytechnic Institute. Thus, I must express
my gratitude to everyone in that department who has helped me in some way shape or
form, including my lab mates, the lab manager, Don Pellegrino, and all other office staff
and graduate students there, my second home on campus. The continuous experiments
were conducted between Kaven Hall and Goddard Hall, and to Professor Clark, I must
express my deepest thanks for the use of one of his old lab spaces in Goddard. I
appreciate not only the space, but also all the time you spent with me going over pumps
and trying to find what I needed for this part of the research. Thank you so very much.
Thanks and ultimate gratitude to Professor Thompson, whose interest in all aspects of
Chemical Engineering is truly an inspiration. His thoughts, ideas, questions, and guidance
on this project have been innumerable, and truly, without his faith in taking me on as a
graduate student, I would not have done a project of this magnitude, if at all. I would also
like to thank Professor Bergendahl for his advice and help on this project.
I also owe a thank you to the DuPont Office of Education, who funded part of this project
with their 2005-2006 Science and Engineering Grant. Thank you for your support!
I would also like to thank Laila Abu-Lail, my lab mate and huge support over the past
year and a half. With her help and experience, I was able to understand and work on this
project to this point of completion. Laila, I hope that you have enjoyed working with me
as much as I have enjoyed working with you. Please keep up your excitement and interest
as you pursue your Doctorate in this field; you are an inspiration to many new graduate
students.
I would also like to thank Christopher McCann, who as part of his MQP, worked with me
on the continuous system presented in this text. I appreciate all he has done to help with
this project, and I hope that he has enjoyed and learned from this project.
The Professors, Staff, and Graduate Students in the Chemical Engineering Department in
Goddard Hall also deserve a huge round of applause for all of their support, friendship,
and laughter during the past two years. Whether it was to bounce ideas, ask challenging
questions, share classes, or to simply hang around and laugh, I appreciate everything that
you all have done for me and with me. And, to Amanda, specifically, thank you for all of
IV
your support, both at school and personally. I hope you do so well in everything you do,
especially now that the GC is removed from your life!
Finally, to the important people in my life: Adriana, my roommate, friend, and co-
“Smithie.” Thank you for all your support, including listening to me blather on about a
project you knew little about and your presence at presentations in a department not your
own. Thank you also for knowing what it is like coming from an all-female school to,
technically, an all-male school. Brianna, my best friend, thank you for simply being there
(even far away in Florida) and letting me do my thing, as well as reminding me about life
outside of classes and the lab. To my father (Stephen), brothers (Kevin and Brian), and
sister Bethany, thank you so much for putting up with me. I have spent so much time
driving between home and Worcester that I could drive it blind-folded, but you four have
given me a chance to escape from working on this project, an impartial sounding-board
off which I could bounce ideas, and an opportunity to make you proud. I do hope you are
proud of me.
In the end, there is one person to whom this project should be dedicated, and that is to my
mother, Karen Butland, who passed away summer 2007. She is the one who encouraged
me to pursue Engineering in College, and the one who persuaded me to go to Graduate
School right after College. She loved the Worcester Polytechnic Institute campus and
Chemical Engineering Department, even though she herself had never progressed past
high school. She always sought to understand what exactly I was doing at school, in class
and in the lab, despite the subject being far outside her knowledge. She believed in me,
and so, her soul is contained in this text as much as mine is. Thank you, Mum.
“To the optimist, the glass is half full. To the pessimist, the glass is half empty.
To the engineer, the glass is twice as big as it needs to be,” unknown
V
TABLE OF CONTENTS
ABSTRACT .................................................................................................................................................. II
ACKNOWLEDGEMENTS ......................................................................................................................... III
LIST OF FIGURES .................................................................................................................................... VII
LIST OF TABLES ..................................................................................................................................... VIII
CHAPTER 1: INTRODUCTION AND BACKGROUND .......................................................................... 1
1.1 Fuel Oxygenates and Hazards ................................................................................................ 1
1.2 Established Treatment of Tert-butyl Alcohol ........................................................................ 3
1.3 Zeolites and Treatment .......................................................................................................... 4
CHAPTER 2: PRELIMINARY EXPERIMENTATION ............................................................................. 7
2.1 Materials and Methodology ................................................................................................... 7
2.2 Quantification of Tert Butyl Alcohol ..................................................................................... 9
2.3 Adsorption Isotherm of Zeolites and Activated Carbon ...................................................... 10
2.4 Results .................................................................................................................................. 10
2.5 Discussion ............................................................................................................................ 12
CHAPTER 3: GRANULE EQUILIBRIUM AND TIME TRIALS ........................................................... 15
3.1 Materials and Methodology ................................................................................................. 15
3.2 Concentration and Adsorption Efficiency ............................................................................ 18
3.3 Results and Discussion ........................................................................................................ 19
3.3.1 Time Trials .................................................................................................................... 19
3.3.2 Granule Equilibrium ..................................................................................................... 20
CHAPTER 4: ADSORPTION ISOTHERMS ............................................................................................ 23
4.1 Materials and Methodology ................................................................................................. 23
4.2 Concentration and Adsorption Efficiency ............................................................................ 25
4.3 Results and Discussion ........................................................................................................ 26
4.3.1 ZSM-5 Isotherm ............................................................................................................ 26
4.3.2 HiSiv 3000 Isotherm ..................................................................................................... 30
4.3.3 Combined Isotherms ..................................................................................................... 34
4.3.4 Comparison to MTBE Isotherms................................................................................... 35
CHAPTER 5: FIXED BED ADSORPTION .............................................................................................. 38
5.1 Introduction and Background .............................................................................................. 38

VI
5.2 Methodology and Materials ................................................................................................. 42
5.3 Laboratory-Specific Column Parameters ............................................................................. 45
5.4 3-cm Bed Breakthrough Curves ........................................................................................... 46
5.5 6-cm Bed Breakthrough Curves ........................................................................................... 50
5.6 9-cm Bed Breakthrough Curves ........................................................................................... 52
5.7 Discussion ............................................................................................................................ 54
CHAPTER 6: CONCLUSIONS ................................................................................................................. 56
CHAPTER 7: FUTURE WORK ................................................................................................................ 58
REFERENCES ........................................................................................................................................... 60

VII
LIST OF FIGURES
Figure 1: Initial transformation pathways of MTBE2 ...................................................................... 2
Figure 2: Alignment of MTBE (left) and TBA (right) in zeolite pores28 ......................................... 5
Figure 3: MTBE sorption from the aqueous phase on hydrophobic molecular sieves27 ............... 11
Figure 4: TBA adsorption from the aqueous phase on hydrophobic molecular sieves .................. 11
Figure 5: TBA adsorption from the aqueous phase at low concentrations .................................... 12
Figure 6: TBA and MTBE comparison by mole basis on hydrophobic zeolites ........................... 14
Figure 7: Time Trial Data .............................................................................................................. 20
Figure 8: TBA adsorption after 48 hours on seven zeolite types ................................................... 21
Figure 9: Adsorption of TBA using ZSM-5 and HiSiv 3000 at different concentrations .............. 22
Figure 10: TBA Adsorption Isotherm for ZSM-5 .......................................................................... 26
Figure 11: Low Concentration TBA Isotherm for ZSM-5 ............................................................. 27
Figure 12: TBA on ZSM-5 Langmuir Isotherm Regression .......................................................... 28
Figure 13: TBA on ZSM-5 BET Isotherm Regression .................................................................. 29
Figure 14: TBA on ZSM-5 Freundlich Isotherm Regression ........................................................ 30
Figure 15: TBA Adsorption Isotherm for HiSiv 3000 ................................................................... 30
Figure 16: Low Concentration TBA Isotherm for HiSiv 3000 ...................................................... 31
Figure 17: TBA on HiSiv 3000 Langmuir Isotherm Regression ................................................... 32
Figure 18: TBA on HiSiv 3000 BET Isotherm Regression ........................................................... 33
Figure 19: TBA on HiSiv 3000 Freundlich Isotherm Regression .................................................. 34
Figure 20: ZSM-5/HiSiv 3000 Isotherms ...................................................................................... 34
Figure 21: Low Concentration ZSM-5/HiSiv 3000 Isotherms ...................................................... 35
Figure 22: Mass Basis Isotherms for MTBE and TBA on ZSM-5 and HiSiv 3000. ..................... 36
Figure 23: Mole Basis Isotherms for MTBE and TBA on ZSM-5 and HiSiv 3000. ..................... 37
Figure 24: Adsorption Column Designs31 ...................................................................................... 38
Figure 25: Adsorption Column Depicting Mass Transfer Zone31 .................................................. 39
Figure 26: Idealized Breakthrough Curve31 ................................................................................... 40
Figure 27: Series and Parallel Adsorber Arrangements33 .............................................................. 41
Figure 28: Breakthrough Curves for Parallel Adsorbers33 ............................................................. 41
Figure 29: Column Experiment Set-up .......................................................................................... 44
Figure 30: Activated Carbon and HiSiv 3000 3-cm Bed Length Columns. .................................. 46
Figure 31: ZSM-5 and 50% 3-cm Bed Breakthrough Curves After 100 Hours at 10 mg/L Feed
Concentration. ................................................................................................................................ 47
Figure 32: All 3-cm Bed Breakthrough Curves After 24 Hours at 10 mg/L Feed Concentration.48
Figure 33: HiSiv 3000 and ZSM-5 6-cm Bed Columns. ............................................................... 50
Figure 34: ZSM-5 and HiSiv 3000 6-cm Bed Breakthrough Curves After 48 Hours at 10 mg/L
Feed Concentration. ....................................................................................................................... 51
Figure 35: ZSM-5 and HiSiv 3000 9-cm Bed Length Columns. ................................................... 52
Figure 36: ZSM-5 and HiSiv 3000 9-cm Bed Breakthrough Curves After 48 Hours at 10 mg/L
Feed Solution. ................................................................................................................................ 53
Figure 37: ZSM-5/HiSiv 3000 Column Adsorption Compared to Isotherms ................................ 54

VIII
LIST OF TABLES
Table 1: Chemical and physical properties of tertiary butyl alcohol ............................................... 2
Table 2: Adsorbents and Their Respective Characteristics .............................................................. 5
Table 3: List of materials and instruments for Chapter 2................................................................. 7
Table 4: Powdered Zeolite Properties and Sources ......................................................................... 8
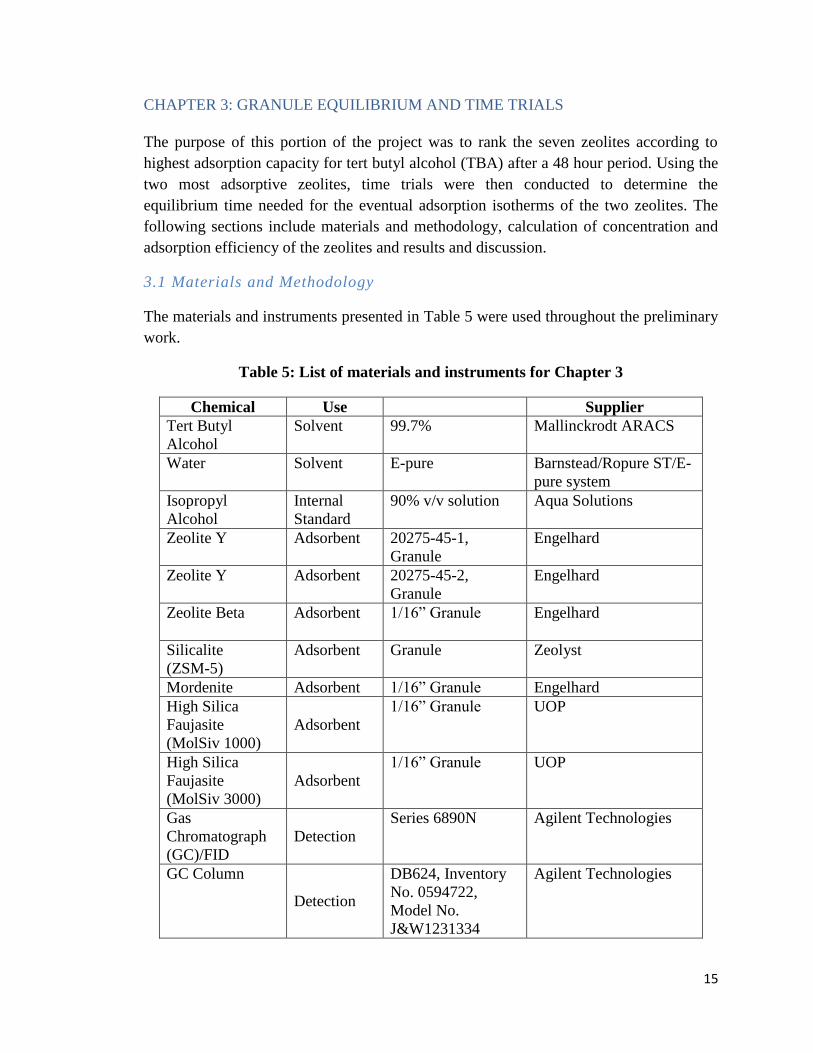
Table 5: List of materials and instruments for Chapter 3............................................................... 15
Table 6: Zeolite Properties and Sources ........................................................................................ 17
Table 7: List of materials and instruments for Chapter 4............................................................... 23
Table 8: General Adsorber Parameters .......................................................................................... 41
Table 9: List of materials and instruments for Chapter 5............................................................... 42
Table 10: Fixed-Bed Column Parameters ...................................................................................... 45
Table 11: 3-cm Bed Calculated Isotherm Equivalents ................................................................... 49
Table 12: 6-cm Bed Calculated Isotherm Equivalents ................................................................... 51
Table 13: 9-cm Bed Calculated Isotherm Equivalents ................................................................... 53

1
CHAPTER 1: INTRODUCTION AND BACKGROUND
1.1 Fuel Oxygenates and Hazards
Fuel oxygenates in the 1970s were designed to reduce the carbon monoxide emissions
from automobiles and to replace the use of tetraethyl and alkyl lead, especially in urban
areas in the late fall, winter, and early spring.1-5 A high oxygen containing substance used
as a blending component in the production of gasoline should increase the octane number
of the gasoline and thus reduce the impact of hydrocarbon combustion in the
atmosphere.1, 3, 6 In 1990, the Clean Air Act Amendments mandated the use of
reformulated and oxygenated gasoline, which resulted in the frequent use of methyl tert
butyl ether (MTBE), as well as other ethers and alcohols, as blending agents.7, 8
However, despite regulated oxygenate use, there are no restrictions on the fuel oxygenate
itself.4
Currently, fuel oxygenates, particularly MTBE, are added to 30 percent of all gasoline in
the United States5 since an addition of only 20 percent oxygenate by volume increases
the fuel volatility.7 In 1991, MTBE made up 15 percent of a gallon of gasoline, with
production totaling 4.35 billion kilograms,3 whereas in 1995, MTBE production doubled
to 8.0 billion kilograms purely for use as a fuel oxygenate.4 MTBE in gasoline has
several benefits, such as being inexpensive to make, blending easily with fuels, and can
be transported through existing pipelines.3 These characteristics of MTBE make it
beneficial for constant use.
Recently, there are more emerging studies on how to remove MTBE from spills and leaks
into the environment, as well as the degradation pathways of MTBE and its dissociated
forms.6, 9-12 Any treatment or biodegradation of MTBE results in the production of
tertiary butyl alcohol (TBA) as the primary intermediate after approximately 35 days of
MTBE breakdown.2, 11, 12 Stefan, et al.,2
describes the degradation of MTBE as shown in
Figure 1. As shown, the presence of MTBE in either water or air results in the presence
of TBA, for which there are no environmental regulations.

2
Figure 1: Initial transformation pathways of MTBE2
TBA also is found in the environment due to its use as a fuel oxygenate on its own,
gasoline spills, an impurity in MTBE-blended fuels, its formation in MTBE degradation,
and as a manufacturing byproduct of perfumes and cosmetics.5, 8 The two prominent
sources of TBA, however, are the breakdown of MTBE and gasoline spills or storage
leaks; approximately 10 million gallons of TBA are leaked per year.3
Treatment of tertiary butyl alcohol is restricted by the physical and chemical properties of
the substance, including the solubility, low transformation rate, and low Henry’s Law
constant, among others. Table 1 lists the physical and chemical characteristics of TBA, as
compiled by the different sources.
Table 1: Chemical and physical properties of tertiary butyl alcohol
Property Value Property Value
IUPAC name13-15 2-methyl-2-
propanol Vapor Pressure13 33 mmHg @
20oC
CAS No.13-17 75-65-0 Density13 0.78 g/cm3
Molecular
Formula13-17
C4H10O Boiling Point13 83oC
Molecular
Weight13-17
74.13 g/mol Freezing/Melting
Point13
25oC
Physical State13-17 Liquid Flash Point13 11oC
Appearance13-17 Clear/colorless Solubility
(in water)13-17
Highly soluble
Odor13 Camphor
@ 10 mg/L
Stability16 Stable under
normal conditions

3
The importance of research on fuel oxygenates, and tertiary butyl alcohol in particular, is
due to the impacts of hazardous substances in drinking water. Sixty percent of drinking
water in the United States is taken from surface water systems.5 The presence of fuel
oxygenates in surface water are due to atmospheric deposition, storm water runoff, direct
industrial release to local water sources, and use of fuel in recreational activities.5 In
particular, high concentrations of TBA and other oxygenates are due to leaks or spills
near underground storage facilities.3, 5 One example of the impact of storage leaks is
Beaufort, South Carolina, where the release to a nearby stream resulted in a concentration
of over 10,000 μg/L of TBA.5
Drinking water regulations have low standards across the country due to non-action in the
Clean Air Acts, Clean Water Act, and Safe Drinking Water Act regarding monitoring of
fuel oxygenates.4 Biologically-based treatment is not accepted,8
and waste water
treatment plants do not have treatments in place for oxygenates.18 In California, the only
known state with a drinking water action level for TBA, the action level is 12 μg/L, with
commentary that TBA is a substance of “current interest”.19
Due to the presence of TBA in surface waters, McGregor and Hard20 determined the
influence of TBA on human health. Male and female mice and rats were exposed to a
maximum of 20 mg/L contaminated drinking water over a two year period.20 After
exposure, renal tubule cell adenomas, which are directly related to the processing and
mutation of the alpha-globulin protein, were detected in male rats (the only ones to
process alpha-globulin in the liver). TBA was also discovered to affect kidney function in
female mice and male rats.20 The carcinogenic property of TBA is suspected, mainly due
to studies like McGregor and Hard, but has yet to be studied in humans. Additionally,
there are no regulations on the effect of TBA on aquatic life. Concentrations of 1000 to
8000 mg/L have affected fish and other aquatic life, resulting in death or mutations.13, 14, 16,
17
1.2 Established Treatment of Tert-butyl Alcohol
At low concentrations, TBA is difficult to measure in water,12 where it is predominantly
found, not in soil and biota.1, 4, 5 One of the main methods used in detecting MTBE, purge
and trap, is not available for TBA due to its low Henry’s Law constant, which results in
poor sparging efficiencies.12 Other standard remediation technologies, such as air
stripping, are very energy intensive, expensive, and unfavorable for application with TBA
in the field.10 Due to these problems with remediation, the cost of water treatment and
site remediation, as well as the effectiveness of such treatments, is the main concern of
treatment of TBA.
Several studies have looked at the treatment of TBA using bacteria indigenous to
streambed sediments.5, 9, 10, 18 The bacteria are a naturally occurring defense to degrade

4
both MTBE and TBA, using the two substances as an energy and carbon source for the
process.5 Bacterial digestion of TBA reduces the concentration of TBA by about 70
percent in 27 days, tapering off to a maximum reduction of 84 percent concentration.5
However, anaerobic conditions for the bacteria to flourish are difficult to maintain, since
there is difficulty injecting oxygen into the system.9 Additionally, the high solubility of
TBA indicates that the TBA will travel downstream with the water system before
bacterial digestion of the oxygenate can occur,5 resulting in the low removal of TBA
from the water system.
In an attempt to remove TBA without using a bacterial system, Deeb8 , et al., recounted
that the highly polar property of TBA makes the substance difficult to remove with
activated carbon. However, in other granular substances, the likelihood of sorption is
higher. Additionally, the presence of TBA in a water system can also be removed using
advanced oxidation and reverse osmosis technologies.8 However, it is difficult to use
oxidation or biological treatment due to little acceptance of biological treatments for
drinking water.8 Due to these difficulties in treating TBA, there may be potential in using
zeolites or other adsorbents for high TBA removal.
1.3 Zeolites and Treatment
Zeolites were originally discovered in the 18th
century by a Swedish mineralologist, Axel
Fredrik Cronstedt.21 Upon heating the natural mineral, he noticed that the stone danced as
the water evaporated and thus used the Greek words meaning “stone that boils” to
classify the material.21, 22 Development of synthetic zeolite minerals in the late 1940s and
early 1950s resulted in a search for natural zeolites, although natural zeolites are far less
pure and uniform in pore size and more likely to contain contaminants.23 Generally,
zeolites consist of silicon, aluminum, and oxygen frameworks with cations around which
molecules will orient.24 Approximately, 40 different natural zeolite species are known,
and the number of synthetic zeolites surpasses 130 different types, as classified by the
International Zeolite Association.22, 23
Due to their porous properties, applications for zeolites are numerous in many different
fields. Major uses consist of petrochemical cracking, detergents, water softening, and
purification, and in separation processes for gases and solvents.24 Zeolites are also used
in agriculture, animal husbandry and waste containment, and construction processes.22-24
Naturally occurring zeolites, as well as synthetic versions, such as zeolites A, X, Y, and
ZSM-5, are used in purification processes due to their unique adsorptive capacities,
molecular sieve and catalytic properties.25 Zeolites are molecular sieves that contain
different percentages of alumina and silica, which result in different adsorption
capabilities.25 Molecular sieves have a distinct property for selective separation of
molecules based on molecular size due to the unique and regular pore structure of each
5
molecular sieve.21 The maximum size of the molecule that can enter a pore is determined
by both the pore size itself and the size, or shape, of the pore cavity.21 Orientation of the
molecule in the pore cavity can also affect the selectivity of a zeolite and the diffusion
rate within the structure.25 Several well-known zeolites are described in Table 2 with
their pore characteristics.
Table 2: Adsorbents and Their Respective Characteristics
Adsorbent Pore Shape26 Pore Volume
(cm3/g)27
Pore
Dimension
(Å)27
Activated
Carbon Slit-shaped 0.51 7.8
Zeolite Y
(Faujasite) 3D cage 0.38 7.4
Silicalite 3D cylinder 0.21 5.5
Mordenite 1D cylinder 0.19 5.7
Zeolite Beta --- 0.26 6.7
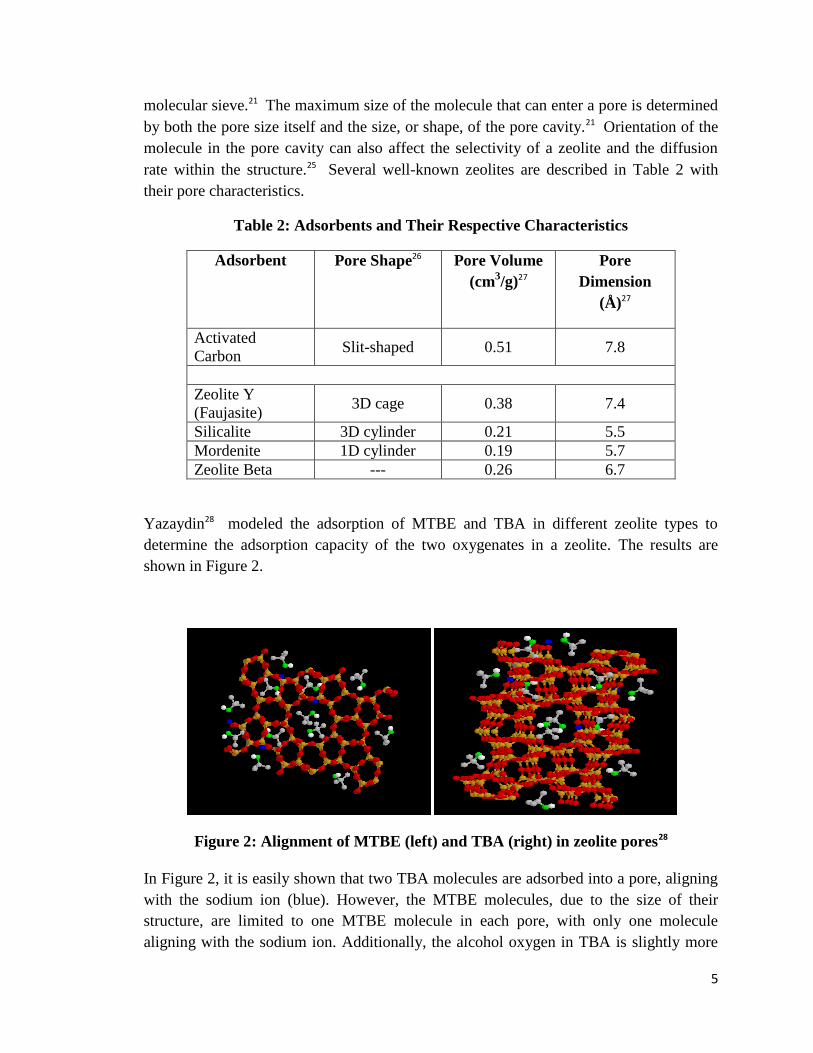
Yazaydin28 modeled the adsorption of MTBE and TBA in different zeolite types to
determine the adsorption capacity of the two oxygenates in a zeolite. The results are
shown in Figure 2.
Figure 2: Alignment of MTBE (left) and TBA (right) in zeolite pores28
In Figure 2, it is easily shown that two TBA molecules are adsorbed into a pore, aligning
with the sodium ion (blue). However, the MTBE molecules, due to the size of their
structure, are limited to one MTBE molecule in each pore, with only one molecule
aligning with the sodium ion. Additionally, the alcohol oxygen in TBA is slightly more

6
electronegative than the ether oxygen in MTBE, causing two TBA oxygens to align with
the sodium cation. Although it appears in Figure 2 that two MTBE molecules are
adsorbed into each pore, the image is showing a two-dimensional projection. In a three-
dimensional model, the MTBE molecules would not be linearly aligned with the sodium
ion; instead, the molecules would be staggered throughout the zeolite.
Based on the modeling, TBA can be assumed to adsorb twice as easily onto the zeolite
compared to MTBE. This should result in a higher uptake of TBA into the zeolite pores
and better removal efficiency for TBA.

7
CHAPTER 2: PRELIMINARY EXPERIMENTATION
The purpose of the preliminary experiments were to compare previous work done by
Ayse Erdem-Senatalar27 on the adsorption capacity of powdered zeolite adsorbents and
activated carbon with methyl tert butyl ether (MTBE) with the adsorption capacity of the
same zeolites and activated carbon with tert butyl alcohol (TBA). The following sections
include methodology and materials, calculation of concentration and adsorption
efficiency and results and discussion on the comparison between adsorption with MTBE
and TBA.
2.1 Materials and Methodology
The materials and instruments presented in Table 3 were used throughout the
preliminary work.
Table 3: List of materials and instruments for Chapter 2
Chemical Use Supplier
Tert Butyl
Alcohol
Solvent 99.7% Mallinckrodt
ARACS
Water Solvent E-pure Barnstead/Ropure
ST/E-pure system
Isopropyl
Alcohol
Internal Standard 90% v/v solution Aqua Solutions
Zeolite Y Adsorbent Powder, H+ Zeolyst
Zeolite Beta Adsorbent Powder, H+ Zeolyst
Silicalite
(ZSM-5)
Adsorbent Powder Grace Davison,
Zeochem
Mordenite Adsorbent Powder, H+ Zeolyst
Activated
Carbon
Adsorbent Granular activated
carbon
Centaur
Gas
Chromatograph
(GC)/FID
Detection Series 6890N Agilent
Technologies
GC Column Detection
DB624, Inventory
No. 0594722,
Model No.
J&W1231334
Agilent
Technologies
SPME Extraction 85μm polyacrylate
coating
Supelco
Air Igniting gas Ultra zero grade Airgas
Hydrogen Igniting gas Ultra high purity ABCO Welding
Supply
Nitrogen Carrier gas Ultra high purity ABCO Welding
Supply

8
Centrifuge Separation 5804 Eppendorf
Shaker Shaking WPI CEE Dept.
Microscale Mass and weight AB104 and
AB104-S
Mettler Toledo
Magnetic Stirrer Stirring
Cat. No. S-76490 Sargent Welch
Scientific Company
Magnetstir, Cat.
No. 58290
American Scientific
Products
Furnace Zeolite activation 6000 Furnace Thermolyne
Additionally, a dessicator was used for storage of the powdered zeolites and activated
carbon. Magnetic stir bars were used with the magnetic stirrer, and 10 mL, 5 mL, 1000
μL, 200 μL, and 5 μL pipettes and their respective tips were used. Glassware included
500 mL and 250 mL amber bottles, 42 mL vials, 18 mL GC vials, 500 mL, 1 L, and 2 L
flasks.
The tert butyl alcohol solution was prepared by combining 99% tert butyl alcohol with
water to create concentrations of 100, 50, and 20 mg/L in (15) 42 mL vials. Zeolites (Y,
Beta, Mordenite, ZSM-5) and activated carbon, whose properties are listed in Error!
eference source not found., were prepared by baking in oven at 300o for 12 hours and
then were added to each 42 mL vial. 42 mL vials were placed on a shaker table for 24
hours at 5 rpm. After 24 hours, vials were removed from the shaker table and placed in a
centrifuge for separation at 3000 rpm for 10 minutes.
Table 4: Powdered Zeolite Properties and Sources
Sample name SiO2
Al2O3 Nature
Company
Name Lot #
Cation
Form
Zeolite Beta
150 Powder Zeolyst 1822-75 H+
Zeolite Mordenite 90 Powder Zeolyst 1822-60-30 H+
Zeolite-Y
80 Powder Zeolyst 78001N00257 H+
ZSM-5/Silicalite >1000 Powder Grace
Davison 5-8888-0702 ---
GC vials were prepared using 100 μL of a 150 mg/L iso-propanol solution as an internal
standard. 17.9 mL of each vial sample was used per GC vial.
A manual SPME holder and fiber coated with polyacrylate (85 μm film thickness,
Supelco) was used to extract tert butyl alcohol. With each new fiber, conditioning
occurred by baking the fiber in the back injection port of the GC (Agilent Technologies,
Series 6890N) at 300oC for at least 1 hour (referring to guidelines accompanying product

9
package). Analysis of resulting chromatographs indicated that this produced a clean fiber,
ready for use. Along with conditioning, each new fiber required a new calibration
(standard) curve. Due to internal standard use, only two curves were needed per fiber.
Calibration curves for 1 mg/L through 10 mg/L consisted of three known concentrations
of tert butyl alcohol and water, 1 mg/L, 2 mg/L, and 10 mg/L, and a water sample. The
plotting of these four concentrations versus their peak area, as registered by the GC,
determined the calibration curve, which was demonstrated to be a straight line with a
linear regression of 0.9923. The second calibration curve consisted of a plot of four
known concentrations of tert butyl alcohol and water, 10 mg/L, 20 mg/L, 50 mg/L, and
100 mg/L versus their peak areas, which was also determined to be a straight line with an
r-squared value of 0.9706. The life of a fiber was found to be about 75-85 samples.
The GC was equipped with a flame ionization detector (FID) and a DB624 column. The
inlet and detector temperatures were both set at 250oC. Nitrogen was used as the carrier
gas at a constant flow of 45 mL/min. Hydrogen and air were used to maintain the detector
flame at flows of 40 and 450 mL/min, respectively. The GC oven was programmed as
follows: 4 minutes at 35°C, ramp at 20°C/min to 90°C and held for 3 minutes, ramp at
40oC/min to 200
oC and held for 10 minutes. SPME fiber was desorbed for 5 min in the
splitless mode at 250°C and was additionally heated for 5 min at the same temperature to
avoid contamination problems during the analysis of samples containing different
concentrations of tert butyl alcohol, therefore the total desorption time of the fiber was 10
min between consecutive injections.
2.2 Quantification of Tert Butyl Alcohol
Using isopropanol alcohol as an internal standard qualitatively demonstrated the accuracy
of the gas chromatographs with each sample. Added to each sample was 0.1 mL of 150
mg/L isopropanol solution.
The calibration curve for each fiber, as explained above, determined the concentration of
each sample after a 24 hour adsorption period. The concentration for each sample was
calculated using the following equation:
𝐶𝑖 = 𝑃𝐴 − 𝑏
𝑚
Where Ci is the concentration of the sample after adsorption, PA is the peak area of the
sample, b is the y-intercept of the calibration curve, and m is the slope of the calibration
curve. For peak areas, as registered by the GC, below the corresponding peak area for the
known 10 mg/L concentration, m is equal to 46.12 and b is 126.5. For peak areas higher
than the respective peak area for the 10 mg/L concentration, m is equal to 11.26 and b is
495.4.

10
2.3 Adsorption Isotherm of Zeolites and Activated Carbon
The adsorption experiments for comparing the removal efficiency of Zeolite Y, Beta,
Mordenite, and ZSM-5 were conducted in 42 mL glass vials at room temperature on a
shaker table for 24 hours, as compared to Erdem-Senatalar. All of the adsorbents had
exactly the same working conditions, as previously mentioned. After centrifugation, a
liquid sample from the top of the 42 mL vials was removed in 5 mL volumes into the 18
mL GC vials. After the GC returned chromatographs for each sample, the amount of tert
butyl alcohol adsorbed into each zeolite and the activated carbon was calculated using the
following equation:
𝐴𝑚𝑡 = 𝐶𝑖𝑜 − 𝐶𝑖 ∗ 𝑉
𝑚𝑧
where Amt is the amount of tert butyl alcohol adsorbed by each zeolite, Cio is the starting
known concentration of each sample, Ci is the calculated concentration of each sample
after 24 hours contact time (as calculated in Chapter 2.2), V is the volume of the contact
vial (for all samples, V was equal to 42 mL), and mz is the mass of each zeolite in each
sample vial.
2.4 Results
Erdem-Senatalar, et al.,27 used four different powdered zeolite types and one activated
carbon to demonstrate the adsorption capacity of MTBE on molecular sieves and carbon.
Their results indicated that at low concentrations of MTBE, silicalite adsorbed more of
the MTBE than the other sieves. However, at high concentrations of MTBE, DAY
adsorbed more than the other zeolites. These results are shown in Figure 3. Due to the
direct relationship between MTBE degradation and TBA, similar results were expected,
using the same powdered zeolites and activated carbon as Erdem-Senatalar, et al.27

11
Figure 3: MTBE sorption from the aqueous phase on
hydrophobic molecular sieves27
As shown in Figure 4, tert butyl alcohol did show a similar trend regarding high and low
concentrations of TBA. At high concentrations, both silicalite and mordenite
demonstrated more adsorption of TBA than any of the other zeolites or activated carbon.
In contrast to Erdem-Senatalar’s27 results, however, zeolite Y did not adsorb more TBA
at lower concentrations.
Figure 4: TBA adsorption from the aqueous phase on hydrophobic molecular sieves
0.0E+00
2.0E+03
4.0E+03
6.0E+03
8.0E+03
1.0E+04
1.2E+04
1.4E+04
1.6E+04
1.8E+04
2.0E+04
0.0E+00 2.0E+04 4.0E+04 6.0E+04 8.0E+04 1.0E+05
Ad
sorb
ed
Co
nce
ntr
atio
n (μ
g/g)
TBA Concentration (μg/L)
Y Beta Silicalite Mordenite Activated Carbon

12
A closer look at low concentration ranges is shown in Figure 5. These data clearly show
the trend of decreasing adsorption capacity at low concentrations. One interesting point to
note is the adsorption capacities of Activated Carbon and Zeolite Beta. At very low
concentrations, activated carbon is more capable of high adsorption than zeolite beta;
however, at a slightly higher concentration, the reverse is true. The adsorption isotherm
formed by silicalite and mordenite follow a remarkably similar pattern, although in this
experiment the mordenite adsorbs more of the adsorbate.
Figure 5: TBA adsorption from the aqueous phase at low concentrations
2.5 Discussion
Both sets of experimental data, those done by Erdem-Senatalar using MTBE and those
done using tert butyl alcohol, show similar trends at high and low concentrations of the
substance. Additionally, as shown in Figure 3 and Figure 4, the adsorption efficiency of
the powdered zeolites and the activated carbon are similar. In ranking the tested zeolites,
both the MTBE and the TBA experiments established the following trend: Silicalite,
Mordenite, Zeolite Beta, Activated Carbon, and Zeolite Y.
A comparison between the MTBE and TBA adsorption data on a mole basis is shown in
Figure 6, with each of the zeolite comparisons shown separately. In all but one of the
cases in Figure 6, the MTBE adsorption values are significantly higher than the shown
TBA adsorption values. This may be due to the powdered form of the zeolite, which may
have damaged or inaccessible pores due to crushing the zeolite. Alternatively, TBA is
0.0E+00
2.0E+03
4.0E+03
6.0E+03
8.0E+03
1.0E+04
1.2E+04
1.4E+04
1.6E+04
1.8E+04
2.0E+04
0.0E+00 5.0E+03 1.0E+04 1.5E+04 2.0E+04 2.5E+04 3.0E+04
Ad
sorb
ed
Co
nce
ntr
atio
n (μ
g/g)
TBA Concentration (μg/L)
Y Beta Silicalite Mordenite Activated Carbon

13
known to have a higher volatility than MTBE, and some of the TBA could be lost to the
atmosphere in lab. Precautions were taken to minimize these losses, such as minimizing
head space in the glass vials and refrigerating the samples while not in use or before
placement into the GC.
The adsorption isotherms shown in Figure 6 do not indicate the greater adsorption
potential for TBA than MTBE on the zeolites as suggested by Yazaydin,28 as shown in
Figure 2. Potentially, two TBA molecules should align with a single cation, giving the
impression that TBA adsorption should be twice as high as MTBE adsorption. However,
since the zeolites have very high silicon to aluminum ratios, as noted in Table 4, there are
fewer cations per unit cell of zeolite which indicates fewer locations for double TBA
alignment in a pore. This may be the cause of lower adsorption capacities using finely
powdered zeolites.
Due to the high silicon to aluminum ratio, the results shown in Figure 6 may be
misrepresentative of the adsorption capacity of these zeolites in a TBA adsorbate
compared to MTBE. Powdered form, additionally, is more difficult to work with and may
have fewer industrial applications than granular forms of the zeolites.
Ultimately, this phase of the research was successful in that it demonstrated that tert butyl
alcohol isotherms are similar to methyl tert butyl ether adsorption isotherms. Similar
isotherms were expected from the two substances because of the degradation relationship
between methyl tert butyl ether and tert butyl alcohol. Additionally, using finely
powdered zeolites showed that methyl tert butyl ether adsorption was greater at all
concentrations than tert butyl alcohol adsorption.

14
Figure 6: TBA and MTBE comparison by mole basis on hydrophobic zeolites
0.00001
0.0001
1 10 100 1000 10000A
dso
rbe
d (
mo
l/g)
Concentration (μg/L)
Mordenite MTBE TBA
0.00001
0.0001
1 10 100 1000 10000100000
Ad
sorb
ed
(m
ol/
g)
Concentration (μg/L)
Silicalite MTBE TBA
0.000001
0.00001
0.0001
1 10 100 1000 10000100000
Ad
sorb
ed
(m
ol/
g)
Concentration (μg/L)
Beta MTBE TBA
0.000001
0.00001
0.0001
1 10 100 1000 10000100000
Ad
sorb
ed
(m
ol/
g)
Concentration (μg/L)
Activated Carbon MTBE TBA
0.000001
0.00001
0.0001
1 10 100 1000 10000100000
Ad
sorb
ed
(m
ol/
g)
Concentration (μg/L)
Zeolite Y MTBE TBA
15
CHAPTER 3: GRANULE EQUILIBRIUM AND TIME TRIALS
The purpose of this portion of the project was to rank the seven zeolites according to
highest adsorption capacity for tert butyl alcohol (TBA) after a 48 hour period. Using the
two most adsorptive zeolites, time trials were then conducted to determine the
equilibrium time needed for the eventual adsorption isotherms of the two zeolites. The
following sections include materials and methodology, calculation of concentration and
adsorption efficiency of the zeolites and results and discussion.
3.1 Materials and Methodology
The materials and instruments presented in Table 5 were used throughout the preliminary
work.
Table 5: List of materials and instruments for Chapter 3
Chemical Use Supplier
Tert Butyl
Alcohol
Solvent 99.7% Mallinckrodt ARACS
Water Solvent E-pure Barnstead/Ropure ST/E-
pure system
Isopropyl
Alcohol
Internal
Standard
90% v/v solution Aqua Solutions
Zeolite Y Adsorbent 20275-45-1,
Granule
Engelhard
Zeolite Y Adsorbent 20275-45-2,
Granule
Engelhard
Zeolite Beta
Adsorbent 1/16” Granule Engelhard
Silicalite
(ZSM-5)
Adsorbent Granule Zeolyst
Mordenite Adsorbent 1/16” Granule Engelhard
High Silica
Faujasite
(MolSiv 1000)
Adsorbent
1/16” Granule UOP
High Silica
Faujasite
(MolSiv 3000)
Adsorbent
1/16” Granule UOP
Gas
Chromatograph
(GC)/FID
Detection
Series 6890N Agilent Technologies
GC Column
Detection
DB624, Inventory
No. 0594722,
Model No.
J&W1231334
Agilent Technologies

16
SPME Extraction 85μm polyacrylate
coating
Supelco
Air Igniting gas Ultra zero grade Airgas
Hydrogen Igniting gas Ultra high purity ABCO Welding Supply
Nitrogen Carrier gas Ultra high purity ABCO Welding Supply
Centrifuge Separation 5804 Eppendorf
Microscale Mass and
weight
AB104 and
AB104-S
Mettler Toledo
Shaker Shaking Worcester Polytechnic
Institute
Magnetic Stirrer Stirring
Cat. No. S-76490 Sargent Welch Scientific
Company
Magnetstir, Cat.
No. 58290
American Scientific
Products
Furnace Zeolite
Activation
6000 Furnace Thermolyne
Additionally, a dessicator was used for storage of the powdered zeolites and activated
carbon. Magnetic stir bars were used with the magnetic stirrer, and 10 mL, 5 mL, 1000
μL, 200 μL, and 5 μL pipettes and their respective tips were used. Glassware included
500 mL and 250 mL amber bottles, 42 mL vials, 18 mL GC vials, 500 mL, 1 L, and 2 L
flasks.
The seven zeolite types include ZSM-5, HiSiv 1000, HiSiv 3000, Zeolite Y (two
versions), Mordenite, and Zeolite Beta. Each zeolite’s properties are shown in Table 6.
For the time trials, samples were prepared using 99% tert butyl alcohol and water to
create 1 mg/L samples in (16) 42 mL vials. The ZSM-5 and HiSiv 3000 zeolites were
prepared by baking in the oven at 350 oC for 12 hours. Two sets of samples were
prepared, one with a lower mass of zeolite and one with a higher mass of the same
zeolite, for the two zeolites. The 42 mL vials were placed in the rotisserie for 48 hours at
15 rpm. At the designated times, 0, 6, 12, 24, and 48 hours, the vials were removed from
the rotisserie and placed in the centrifuge for separation at 3000 rpm for 10 minutes.
For pellet equilibrium samples, the tert butyl alcohol solution was prepared by combining
99% tert butyl alcohol with water to create concentrations of 0.1, 1, and 10 mg/L in (21)
42 mL vials. The zeolites were prepared by baking in oven at 300 oC for 12 hours. A
mass was chosen for each zeolite and recorded, then added to each 42 mL vial. The 42
mL vials were placed on shaker table for 48 hours at 5 rpm. After 48 hours, vials were
removed from shaker table and placed in the centrifuge for separation at 3000 rpm for 10
minutes.

17
Table 6: Zeolite Properties and Sources
Sample name
SiO2
Al2O3
Zeolite
%
Size
(in) Nature
Company
Name Lot #
Surface
Area
(m2/g)
Micropore
Area
(m2/g)
External
Area
(m2/g)
Fraction
Micropore
Zeolite Beta 35 80 1/16 Granular Engelhard L6598-48-1 533.7 266 267.6 0.5
Zeolite Mordenite 50 80 1/16 Granular Engelhard 05001C-
BWC2-06 472.6 304.3 168.3 0.64
Molsiv HISIV 1000
(High silica
faujasite)
< 6.5 --- 1/16 Granular UOP 2006003165 379.9 247.1 132.8 0.65
Molsiv HISIV 3000
(High silica
faujasite)
< 10 --- 1/16 Granular UOP 2002001440 321.9 230.5 91.4 0.72
Zeolite-Y --- 9 --- Granular Engelhard 20275-45-1 158.6 73.4 85.2 0.46
Zeolite-Y --- 14 --- Granular Engelhard 20275-45-2 158.3 58.7 99.6 0.37
ZSM-5 280 80 --- Granular Zeolyst CBV28014 390.8 141.8 249 0.36
18
GC vials were prepared using 100 μL of a 150 mg/L iso-propanol solution as an internal
standard. 17.9 mL of each 42 mL vial sample, for both the time trials and the pellet
equilibrium trials, was used per GC vial. The GC vials were then immediately used.
A manual SPME holder and fiber coated with polyacrylate (85 μm film thickness,
Supelco) was used to extract tert butyl alcohol. With each new fiber, conditioning
occurred by baking the fiber in the oven of the GC (Agilent Technologies, Series 6890N)
at 300 oC for at least 1 hour (referring to guidelines accompanying product package).
Analysis of resulting chromatographs indicated that a clean fiber was produced, ready for
use. Along with conditioning, each new fiber required a new calibration (standard) curve.
Due to internal standard use, only one curve was needed per fiber. The life of a fiber was
found to be about 75-85 samples.
The GC was equipped with a flame ionization detector (FID) and a DB624 column. The
inlet and detector temperatures were both set at 250oC. Nitrogen was used as the carrier
gas at a constant flow of 45 mL/min. Hydrogen and air were used to maintain the detector
flame at flows of 40 and 450 mL/min, respectively. The GC oven was programmed as
follows: 4 minutes at 35°C, ramp at 20°C/min to 90°C and held for 3 minutes, ramp at
40oC/min to 200
oC and held for 10 minutes. SPME fiber was desorbed for 5 min in the
splitless mode at 250°C and was additionally heated for 5 min at the same temperature to
avoid contamination problems during the analysis of samples containing different
concentrations of tert butyl alcohol, therefore the total desorption time of the fiber was 10
min between consecutive injections.
3.2 Concentration and Adsorption Efficiency
Using isopropanol alcohol as an internal standard qualitatively demonstrated the accuracy
of the gas chromatographs with each sample. Added to each sample was 0.1 mL of 150
mg/L isopropanol solution.
The calibration curve for each fiber, as explained in Chapter 3.1, determined the
concentration of each sample after a 48 hour adsorption period. The concentration for
each sample was calculated using the following equation:
𝐶𝑖 = 𝑃𝐴 − 𝑏
𝑚
where Ci is the concentration of the sample after adsorption, PA is the peak area of the
sample, b is the y-intercept of the calibration curve, and m is the slope of the calibration
curve. The calibration curve for the granule equilibrium used values of 0 for b and 509.61
for m. For the time trial experiments, a different fiber was used, corresponding to a b
value of -2.5277 and an m value of 163.7.
19
The adsorption experiments for comparing the removal efficiency of the seven zeolites
were conducted in 42 mL glass vials at room temperature on a shaker table for 48 hours.
All of the adsorbents had exactly the same working conditions, as previously mentioned
in Chapter 3.1. After centrifugation, sample liquid from the top of the 42 mL vials was
removed in 5 mL volumes into the 18 mL GC vials. After the GC returned
chromatographs for each sample, the amount of tert butyl alcohol adsorbed into each
zeolite was calculated using the following equation:
𝐴𝑚𝑡 = 𝐶𝑖𝑜 − 𝐶𝑖 ∗ 𝑉
𝑚𝑧
Where Amt is the amount of tert butyl alcohol adsorbed by each zeolite, Cio is the
starting known concentration of each sample, Ci is the calculated concentration of each
sample after 48 hours contact time (as calculated above), V is the volume of the contact
vial (for all samples, V is equal to 42 mL), and mz is the mass of each zeolite in each
sample vial.
3.3 Results and Discussion
3.3.1 Time Trials
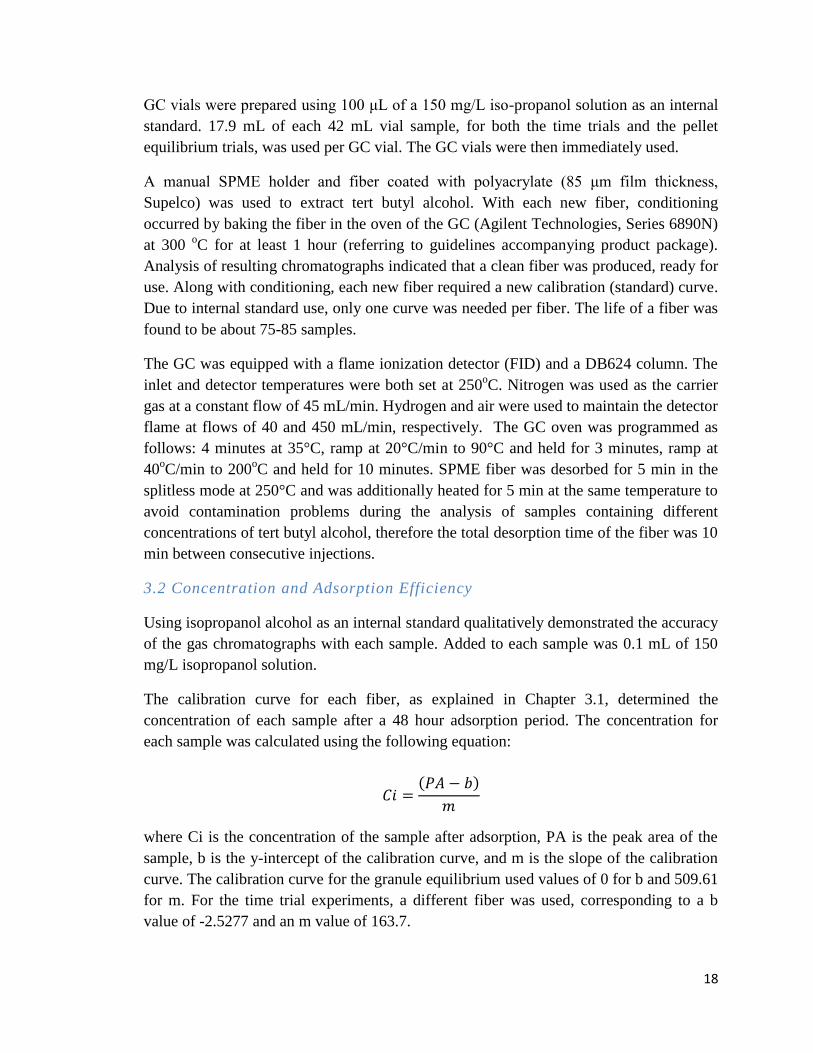
Time trials were conducted to determine the time at which equilibrium was reached with
two different zeolite types, ZSM-5 and HiSiv 3000. The results of the time trial
experiments are shown in Figure 7, with measurements taken at 0, 6, 12, 24, and 48
hours. As demonstrated in Figure 7, adsorption amount was constant between 24 and 48
hours for the zeolite samples.
20
Figure 7: Time Trial Data
Since all four samples reached equilibrium between 24 and 48 hours, the equilibrium
time for all the other tests was taken to be 48 hours, ensuring that all zeolites have the
same amount of contact with the TBA solution. For all remaining batch experiments, the
contact time was 48 hours between sample preparation and sampling for the gas
chromatograph.
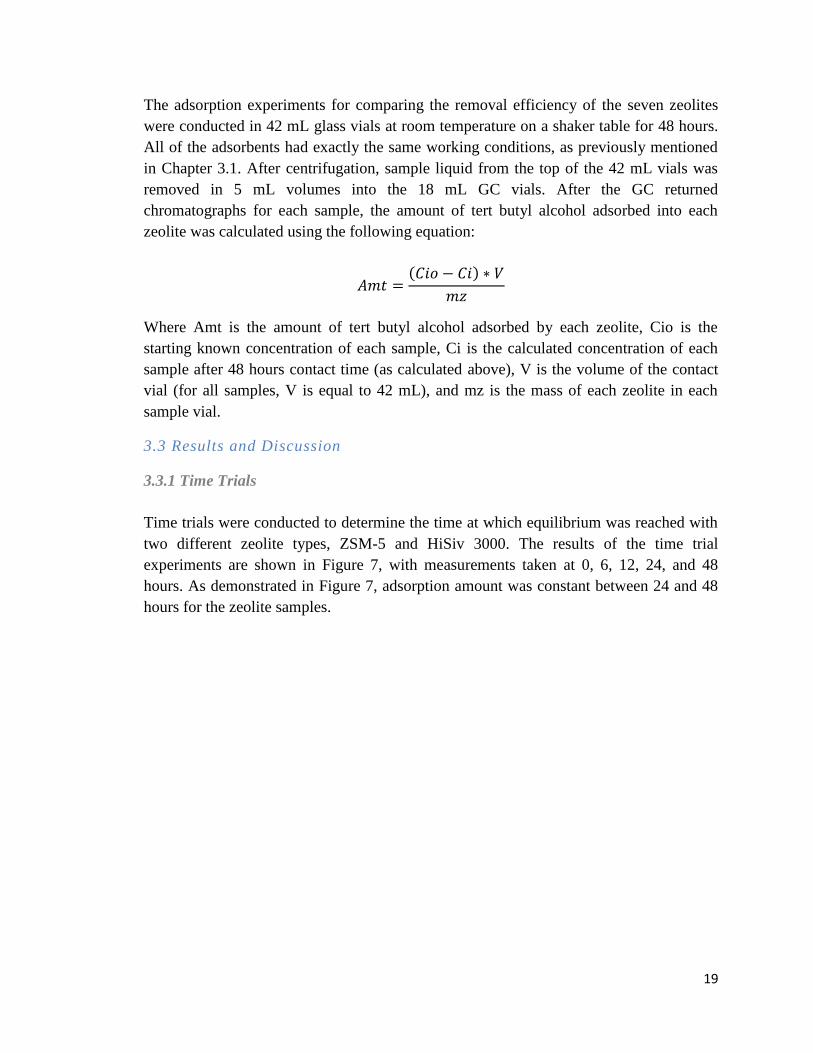
3.3.2 Granule Equilibrium
The granule equilibrium experiments were used to determine the ranking of the seven
zeolites according to their adsorption capacities. The results of the equilibrium
experiments are shown in Figure 8. The silicalite and HiSiv 3000 adsorb the most from
the TBA solution. In contrast, HiSiv 1000, zeolite Y-1, and zeolite Y-2 performed the
worst.
0
100
200
300
400
500
600
700
0 6 12 18 24 30 36 42 48 54
Ad
sorb
ed
Am
ou
nt
(μg/
g)
Time (hr)
ZSM-5 a
ZSM-5 b
HiSiv 3000 a
HiSiv 3000 b
21
Figure 8: TBA adsorption after 48 hours on seven zeolite types
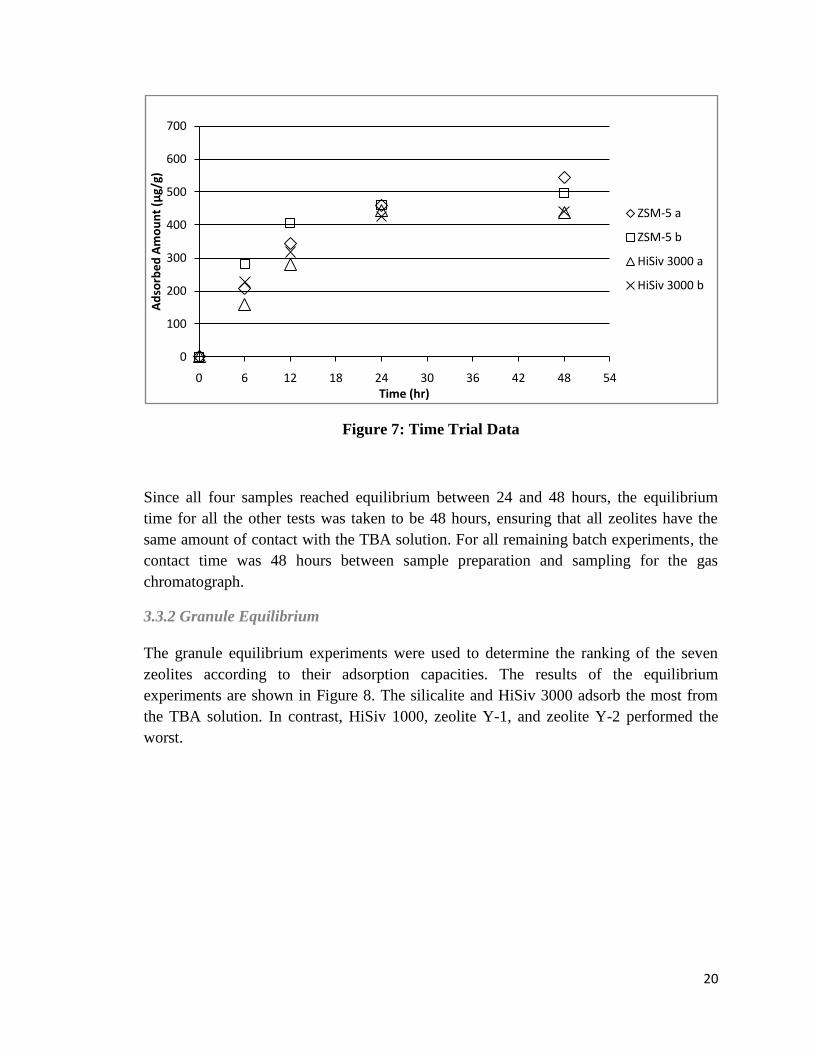
A closer look at the silicalite and HiSiv 3000 data revealed an interesting trend as the
concentration of the solution increases. As shown in Figure 9, the equilibrium data reveal
that at lower concentrations one zeolite is the better adsorbent, while at high
concentrations, the other zeolite is better. It is obvious in Figure 9 that although both
zeolites are comparatively similar as adsorbents, they do encourage specific behavior in
different concentration ranges. This type of behavior could be used in conjunction with
the continuous column experiments. The zeolite that adsorbs better at a lower
concentration, as further explored with the adsorption isotherms, would be useful at the
end of a column, as opposed to the beginning of the column, where the high
concentration is injected. Similarly, the high concentration zeolite would be better at the
beginning of the column.
0.000
200.000
400.000
600.000
800.000
1000.000
1200.000
1400.000
1600.000
1800.000
0.0E+00 2.0E+03 4.0E+03 6.0E+03 8.0E+03 1.0E+04
Ad
sorb
ed
Am
ou
nt
(μg/
g)
TBA Concentration (μg/L)
Y-1
Y-2
Beta
ZSM-5
Mordenite
HiSiv 1000
HiSiv 3000

22
Figure 9: Adsorption of TBA using ZSM-5 and HiSiv 3000 at different
concentrations
Based on the experimental data, silicalite and HiSiv 3000 were chosen over the other five
zeolites as the two zeolites for which time trials and adsorption isotherms were
developed. These two zeolites demonstrated the best adsorption over a 48 hour period in
different concentrations of TBA. Additionally, the two zeolites revealed a trend at high
and low concentrations that influenced the development of the continuous column
experiments.
0.000
200.000
400.000
600.000
800.000
1000.000
1200.000
1400.000
1600.000
1800.000
0.0E+00 1.0E+03 2.0E+03
Ad
sorb
ed
Am
ou
nt
(μg/
g)
TBA Concentration (μg/L)
ZSM-5
HiSiv 3000

23
CHAPTER 4: ADSORPTION ISOTHERMS
After determining the best zeolites for adsorption, which were ZSM-5 and HiSiv 3000,
adsorption isotherms were then created for each zeolite. Additionally, the tert butyl
alcohol (TBA) isotherms and the methyl tert butyl ether isotherms were compared on the
same figure.
4.1 Materials and Methodology
The materials and instruments presented in Table 7 were used throughout the preliminary
work.
Table 7: List of materials and instruments for Chapter 4
Chemical Use Supplier
Tert Butyl
Alcohol
Solvent 99.7% Mallinckrodt ARACS
Water Solvent E-pure Barnstead/Ropure ST/E-
pure system
Isopropyl
Alcohol
Internal
Standard
90% v/v solution Aqua Solutions
Zeolite Y Adsorbent 20275-45-1,
Granule
Engelhard
Zeolite Y Adsorbent 20275-45-2,
Granule
Engelhard
Zeolite Beta
Adsorbent 1/16” Granule Engelhard
Silicalite
(ZSM-5)
Adsorbent Granule Zeolyst
Mordenite Adsorbent 1/16” Granule Engelhard
High Silica
Faujasite
(MolSiv 1000)
Adsorbent
1/16” Granule UOP
High Silica
Faujasite
(MolSiv 3000)
Adsorbent
1/16” Granule UOP
Gas
Chromatograph
(GC)/FID
Detection
Series 6890N Agilent Technologies
GC Column
Detection
DB624, Inventory
No. 0594722,
Model No.
J&W1231334
Agilent Technologies
SPME Extraction 85μm polyacrylate
coating
Supelco
Air Igniting gas Ultra zero grade Airgas
24
Hydrogen Igniting gas Ultra high purity ABCO Welding Supply
Nitrogen Carrier gas Ultra high purity ABCO Welding Supply
Centrifuge Separation 5804 Eppendorf
Microscale Mass and
weight
AB104 and
AB104-S
Mettler Toledo
Shaker Shaking Worcester Polytechnic
Institute
Magnetic Stirrer Stirring
Cat. No. S-76490 Sargent Welch Scientific
Company
Magnetstir, Cat.
No. 58290
American Scientific
Products
Furance Zeolite
Activation
6000 Furnace Thermolyne
Additionally, a dessicator was used for storage of the powdered zeolites and activated
carbon. Magnetic stir bars were used with the magnetic stirrer, and 10 mL, 5 mL, 1000
μL, 200 μL, and 5 μL pipettes and their respective tips were used. Glassware included
500 mL and 250 mL amber bottles, 42 mL vials, 18 mL GC vials, 500 mL, 1 L, and 2 L
flasks.
For the isotherm samples, the tert butyl alcohol solution was prepared by combining 99%
tert butyl alcohol with water to create concentrations between 150 and 0.05 mg/L in (48)
42 mL vials. The zeolites (ZSM-5 and HiSiv 3000) were prepared by baking in the oven
at 300o for 12 hours. Three different masses were chosen for each zeolite, creating trials
a, b, and c for each zeolite and TBA concentration. A mass was chosen for each zeolite
and recorded, then added to each 42 mL vial. The 42 mL vials were placed on shaker
table for 48 hours at 5 rpm. After 48 hours, vials were removed from shaker table and
placed in the centrifuge for separation at 3000 rpm for 10 minutes.
GC vials were prepared using 100 μL of a 150 mg/L iso-propanol solution as an internal
standard. A small amount of each sample with a starting concentration higher than 1
mg/L was used in the GC. When the data were then recorded, a dilution factor was
calculated and the data was increased by the dilution factor.
A manual SPME holder and fiber coated with polyacrylate (85 μm film thickness,
Supelco) was used to extract tert butyl alcohol. With each new fiber, conditioning
occurred by baking the fiber in the oven of the GC (Agilent Technologies, Series 6890N)
at 300 oC for at least 1 hour (consistent with guidelines accompanying the product
package). Analysis of resulting chromatographs indicated a clean fiber, ready for use.
Along with conditioning, each new fiber required a new calibration (standard) curve. Due
to internal standard use, only one curve was needed per fiber. The life of a fiber was
found to be about 75-85 samples.

25
The GC was equipped with a flame ionization detector (FID) and a DB624 column. The
inlet and detector temperatures were both set at 250oC. Nitrogen was used as the carrier
gas at a constant flow of 45 mL/min. Hydrogen and air were used to maintain the detector
flame at flows of 40 and 450 mL/min, respectively. The GC oven was programmed as
follows: 4 minutes at 35°C, ramp at 20°C/min to 90°C and held for 3 minutes, ramp at
40oC/min to 200
oC and held for 10 minutes. SPME fiber was desorbed for 5 min in the
splitless mode at 250°C and was additionally heated for 5 min at the same temperature to
avoid contamination problems during the analysis of samples containing different
concentrations of tert butyl alcohol, therefore the total desorption time of the fiber was 10
min between consecutive injections.
4.2 Concentration and Adsorption Efficiency
Using isopropanol as an internal standard qualitatively demonstrated the accuracy of the
gas chromatographs with each sample. Added to each sample was 0.1 mL of 150 mg/L
isopropanol solution.
The calibration curve for each fiber, as explained in Chapter 4.1, determined the
concentration of each sample after a 48 hour adsorption period. The concentration for
each sample was calculated using the following equation:
𝐶𝑖 = 𝑃𝐴 − 𝑏
𝑚
Where Ci is the concentration of the sample after adsorption, PA is the peak area of the
sample, b is the y-intercept of the calibration curve, and m is the slope of the calibration
curve. Several different calibration curves were used for the isotherms, and the respective
b and m values for the curves were used.
The adsorption experiments for comparing the removal efficiency of the seven zeolites
were conducted in 42 mL glass vials at room temperature on a shaker table for 48 hours.
All of the adsorbents had exactly the same working conditions, as previously mentioned
in Chapter 4.1. After centrifugation, a liquid sample from the top of the 42 mL vials was
removed in 5 mL volumes into the 18 mL GC vials. After the GC returned
chromatographs for each sample, the amount of tert butyl alcohol adsorbed into each
zeolite was calculated using the following equation:
𝐴𝑚𝑡 = 𝐶𝑖𝑜 − 𝐶𝑖 ∗ 𝑉
𝑚𝑧
Where Amt is the amount of tert butyl alcohol adsorbed by each zeolite, Cio is the
starting known concentration of each sample, Ci is the calculated concentration of each
sample after 48 hours contact time (as calculated above), V is the volume of the contact
26
vial (for all samples, V is equal to 42 mL), and mz is the mass of each zeolite in each
sample vial.
4.3 Results and Discussion
4.3.1 ZSM-5 Isotherm
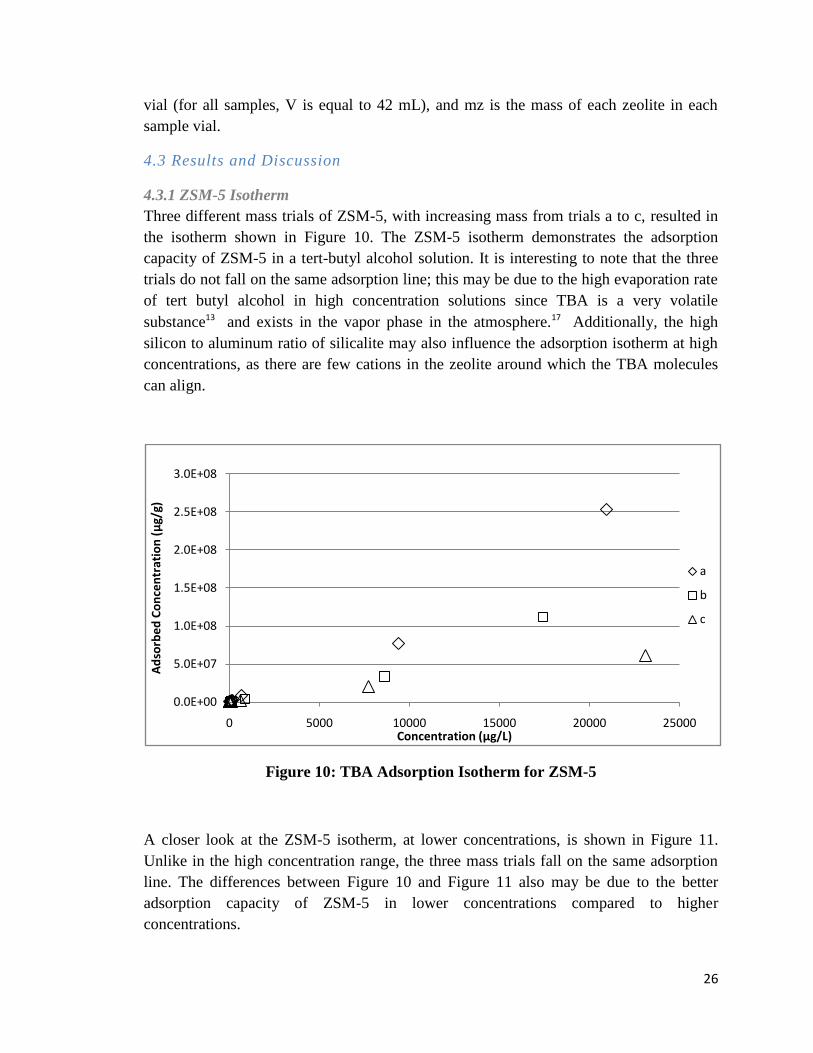
Three different mass trials of ZSM-5, with increasing mass from trials a to c, resulted in
the isotherm shown in Figure 10. The ZSM-5 isotherm demonstrates the adsorption
capacity of ZSM-5 in a tert-butyl alcohol solution. It is interesting to note that the three
trials do not fall on the same adsorption line; this may be due to the high evaporation rate
of tert butyl alcohol in high concentration solutions since TBA is a very volatile
substance13 and exists in the vapor phase in the atmosphere.17 Additionally, the high
silicon to aluminum ratio of silicalite may also influence the adsorption isotherm at high
concentrations, as there are few cations in the zeolite around which the TBA molecules
can align.
Figure 10: TBA Adsorption Isotherm for ZSM-5
A closer look at the ZSM-5 isotherm, at lower concentrations, is shown in Figure 11.
Unlike in the high concentration range, the three mass trials fall on the same adsorption
line. The differences between Figure 10 and Figure 11 also may be due to the better
adsorption capacity of ZSM-5 in lower concentrations compared to higher
concentrations.
0.0E+00
5.0E+07
1.0E+08
1.5E+08
2.0E+08
2.5E+08
3.0E+08
0 5000 10000 15000 20000 25000
Ad
sorb
ed
Co
nce
ntr
atio
n (μ
g/g)
Concentration (μg/L)
a
b
c

27
Figure 11: Low Concentration TBA Isotherm for ZSM-5
Further examination of the ZSM-5 isotherm compares the shape and linear regression of
Langmuir, BET, and Freundlich forms of isotherms. Langmuir isotherms are the most
general form of isotherms for middle and high concentration ranges of adsorption
systems. The Langmuir equation is shown below, where Γ is the amount adsorbed, Γmax is
the maximum amount adsorbed as the concentration increases, K is the Langmuir
equilibrium constant, and C is the aqueous concentration:
𝛤 =𝛤𝑚𝑎𝑥 ∗ 𝐾 ∗ 𝐶
1 + 𝐾 ∗ 𝐶
By linearizing the general Langmuir equation, as demonstrated below, the Langmuir
equilibrium constant, K, and Γmax can be found using linear regression. For the ZSM-5
data, K is equal to -0.0044 and Γmax is equal to -250000.
1
𝛤=
1
𝐾 ∗ 𝛤𝑚𝑎𝑥∗
1
𝐶+
1
𝛤𝑚𝑎𝑥
Figure 12 indicates that the Langmuir isotherm does not accurately represent the ZSM-5
data, as noticed by the low R2 value of the trendline. Additionally, the negative value for
Γmax indicates that the Langmuir isotherm does not accurately represent the data, since
maximum amount adsorbed cannot be a negative value in a real system.
0.00E+00
5.00E+07
1.00E+08
1.50E+08
2.00E+08
2.50E+08
3.00E+08
0 5000 10000 15000 20000 25000
Ad
sorb
ed
Co
nce
ntr
atio
n (μ
g/g)
Concentration (μg/L)
a
b
c

28
Figure 12: TBA on ZSM-5 Langmuir Isotherm Regression
The BET isotherm indicates whether adsorption occurs in multi-layers on the surface
rather than a monolayer, as indicated by Langmuir examination. The general form of the
BET equation is shown, where Γ is the amount adsorbed, Γmax is the maximum adsorbed
amount, K is the BET constant representing the energy of adsorption, Cs is the
concentration of the solute at the saturation of all layers and C is the aqueous
concentration:
𝛤 = 𝛤𝑚𝑎𝑥 ∗ 𝐾 ∗ 𝐶
𝐶𝑠 − 𝐶 ∗ [1 − 𝐾 − 1 ∗𝐶𝐶𝑠]
By linearizing the BET equation,
𝐶
𝐶𝑠 − 𝐶 ∗ 𝛤=
1
𝐾 ∗ 𝛤𝑚𝑎𝑥+
(𝐾 − 1)
𝐾 ∗ 𝛤𝑚𝑎𝑥∗
𝐶
𝐶𝑠
and using the Cs value of 20942 for the ZSM-5 isotherm, the values of the constants can
be calculated using linear regression. For the ZSM-5 data, K is equal to 2.5e15 and Γmax
is equal to 5e7. The linear fit of the BET isotherm to the data is shown in Figure 13.
The R2 value of the BET isotherm is very small, indicating that the BET isotherm does
not fit the data.
y = 0.0009x - 4E-06R² = 0.7294
-0.00001
0
0.00001
0.00002
0.00003
0.00004
0.00005
0.00006
0.00007
0.00008
0 0.01 0.02 0.03 0.04 0.05 0.06
1/Γ
1/C

29
Figure 13: TBA on ZSM-5 BET Isotherm Regression
The Freundlich isotherm has a general form of equation as shown, where Γ is the amount
adsorbed, K and n are Freundlich constants for a specific temperature, and C is the
aqueous concentration:
𝛤 = 𝐾 ∗ 𝐶𝑛
By linearizing the Freundlich equation,
log 𝛤 = 𝑛 ∗ log 𝐶 + log 𝐾
and determining the values of the constants, K is equal to 26.96 and n is equal is 1.126,
the ZSM-5 data can be examined for closeness of fit for the Freundlich isotherm.
Figure 14 shows that the Freundlich isotherm does closely fit the ZSM-5 data, as
indicated by the high R2 value. The resulting isotherm equation to predict ZSM-5
adsorption becomes:
log 𝛤 = 1.126 ∗ log 𝐶 + log 26.96
y = 2E-08x + 2E-08R² = 0.0697
0
1E-08
2E-08
3E-08
4E-08
5E-08
6E-08
7E-08
0 0.2 0.4 0.6 0.8 1
c/(c
s-c)
*Г
c/cs

30
Figure 14: TBA on ZSM-5 Freundlich Isotherm Regression
4.3.2 HiSiv 3000 Isotherm
Three different mass trials of HiSiv 3000, consisting of trials a through c, exposed to
varying TBA solutions are shown in the isotherm in Figure 15. The HiSiv 3000 isotherm
demonstrates the capacity of HiSiv 3000 zeolites in adsorbing TBA molecules from
water.
Figure 15: TBA Adsorption Isotherm for HiSiv 3000
y = 1.1264x + 3.2945R² = 0.9361
1
10
0 1 2 3 4 5
log(Γ)
log(c)
0.0E+00
5.0E+07
1.0E+08
1.5E+08
2.0E+08
2.5E+08
3.0E+08
3.5E+08
0 5000 10000 15000 20000
Ad
sorb
ed
Co
nce
ntr
atio
n (μ
g/g)
Concentration (μg/L)
a
b
c

31
A closer look at the low concentration range of the HiSiv 3000 adsorption isotherm is
shown in Figure 16.
Figure 16: Low Concentration TBA Isotherm for HiSiv 3000
An examination of the HiSiv 3000 data using a Langmuir isotherm shows a similar result
as to the ZSM-5 data. The same linear equation applies,
1
𝛤=
1
𝐾 ∗ 𝛤𝑚𝑎𝑥∗
1
𝐶+
1
𝛤𝑚𝑎𝑥
where K is equal to -4.17e-3 and Γmax is equal to -2e5. Figure 17 demonstrates the linear
regression and fit of the data to the Langmuir isotherm. The Langmuir isotherm fits the
HiSiv 3000 data moderately well, as evidenced by the R2 value given in Figure 17.
However, the negative values for Γmax and K indicate that the Langmiur plot does not
accurately represent the HiSiv 3000 data, as the maximum adsorbed concentration and
the Langmuir constant cannot be negative values.
0.00E+00
2.00E+05
4.00E+05
6.00E+05
8.00E+05
1.00E+06
1.20E+06
0 50 100 150 200
Ad
sorb
ed
Co
nce
ntr
atio
n (μ
g/g)
Concentration (μg/L)
a
b
c
32
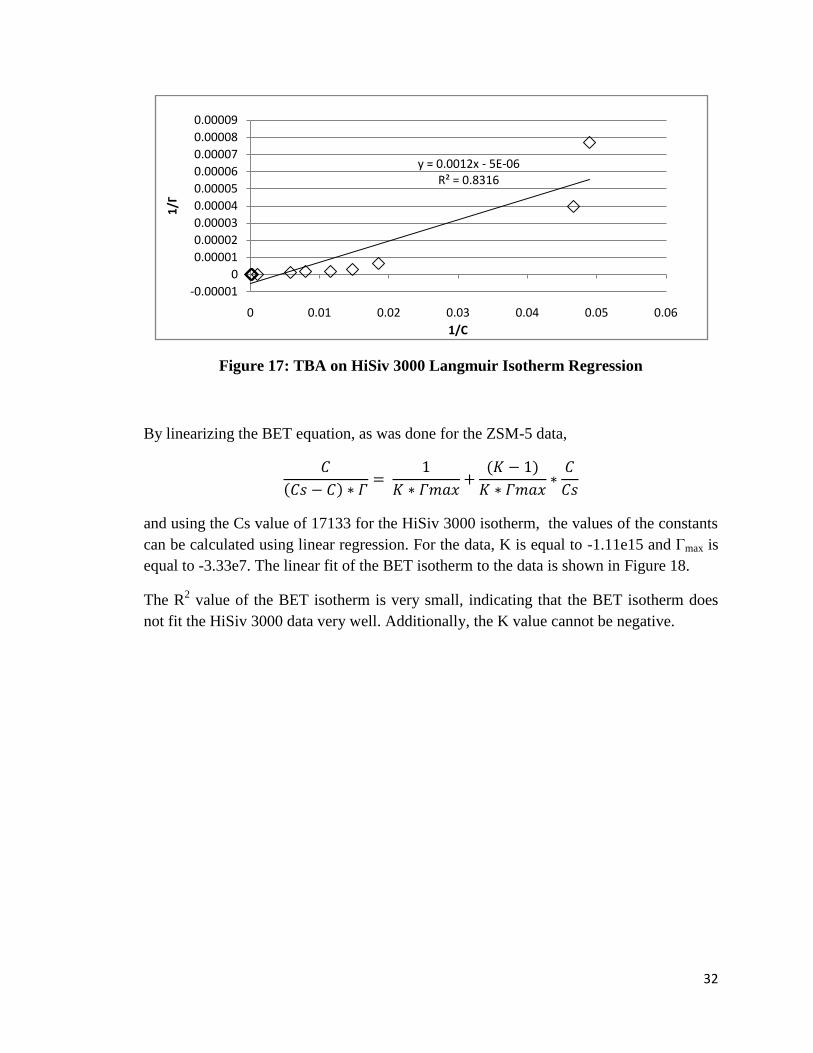
Figure 17: TBA on HiSiv 3000 Langmuir Isotherm Regression
By linearizing the BET equation, as was done for the ZSM-5 data,
𝐶
𝐶𝑠 − 𝐶 ∗ 𝛤=
1
𝐾 ∗ 𝛤𝑚𝑎𝑥+
(𝐾 − 1)
𝐾 ∗ 𝛤𝑚𝑎𝑥∗
𝐶
𝐶𝑠
and using the Cs value of 17133 for the HiSiv 3000 isotherm, the values of the constants
can be calculated using linear regression. For the data, K is equal to -1.11e15 and Γmax is
equal to -3.33e7. The linear fit of the BET isotherm to the data is shown in Figure 18.
The R2 value of the BET isotherm is very small, indicating that the BET isotherm does
not fit the HiSiv 3000 data very well. Additionally, the K value cannot be negative.
y = 0.0012x - 5E-06R² = 0.8316
-0.00001
0
0.00001
0.00002
0.00003
0.00004
0.00005
0.00006
0.00007
0.00008
0.00009
0 0.01 0.02 0.03 0.04 0.05 0.06
1/Γ
1/C

33
Figure 18: TBA on HiSiv 3000 BET Isotherm Regression
By linearizing the Freundlich equation to result in the following equation,
log 𝛤 = 𝑛 ∗ log 𝐶 + log 𝐾
and determining the values of the constants, K is equal to 16.38 and n is equal is 1.375,
the HiSiv 3000 data can be examined for closeness of fit for the Freundlich isotherm.
Figure 19 shows that the Freundlich isotherm fits the HiSiv 3000 data extremely well, as
indicated by the high R2 value. In comparison to the Langmuir isotherm fit, as shown in
Figure 17, the Freundlich isotherm is a much better fit to the HiSiv 3000 data.
The resulting Freundlich isotherm equation to predict HiSiv 3000 adsorption becomes:
log 𝛤 = 1.375 ∗ log 𝐶 + log 16.38
y = -3E-08x + 3E-08R² = 0.0639
0
1E-08
2E-08
3E-08
4E-08
5E-08
6E-08
7E-08
8E-08
9E-08
0.0000001
0 0.1 0.2 0.3 0.4 0.5 0.6 0.7
c/(c
s-c)
*Г
c/cs

34
Figure 19: TBA on HiSiv 3000 Freundlich Isotherm Regression
4.3.3 Combined Isotherms
A comparison between the two isotherms, depicted in Figure 20, demonstrate unique
adsorption capacities at high concentrations. At high concentrations, it is easy to
distinguish better adsorption using HiSiv 3000 zeolites compared to ZSM-5 zeolites.
Figure 20: ZSM-5/HiSiv 3000 Isotherms
y = 1.375x + 2.7962R² = 0.9686
1
10
0 0.5 1 1.5 2 2.5 3 3.5 4 4.5
log(Γ)
log(c)
0.00E+00
5.00E+07
1.00E+08
1.50E+08
2.00E+08
2.50E+08
3.00E+08
3.50E+08
0 5000 10000 15000 20000 25000
Ad
sorb
ed
Co
nce
ntr
atio
n (μ
g/g)
Concentration (μg/L)
ZSM-5
HiSiv 3000
35
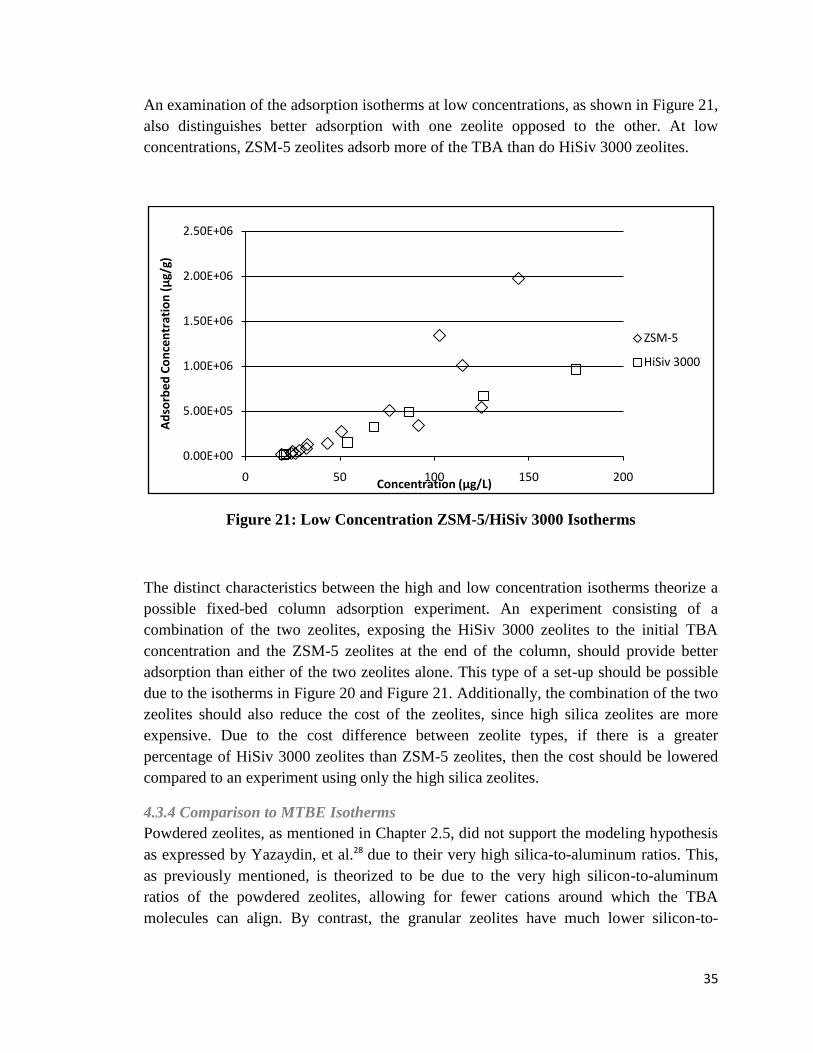
An examination of the adsorption isotherms at low concentrations, as shown in Figure 21,
also distinguishes better adsorption with one zeolite opposed to the other. At low
concentrations, ZSM-5 zeolites adsorb more of the TBA than do HiSiv 3000 zeolites.
Figure 21: Low Concentration ZSM-5/HiSiv 3000 Isotherms
The distinct characteristics between the high and low concentration isotherms theorize a
possible fixed-bed column adsorption experiment. An experiment consisting of a
combination of the two zeolites, exposing the HiSiv 3000 zeolites to the initial TBA
concentration and the ZSM-5 zeolites at the end of the column, should provide better
adsorption than either of the two zeolites alone. This type of a set-up should be possible
due to the isotherms in Figure 20 and Figure 21. Additionally, the combination of the two
zeolites should also reduce the cost of the zeolites, since high silica zeolites are more
expensive. Due to the cost difference between zeolite types, if there is a greater
percentage of HiSiv 3000 zeolites than ZSM-5 zeolites, then the cost should be lowered
compared to an experiment using only the high silica zeolites.
4.3.4 Comparison to MTBE Isotherms
Powdered zeolites, as mentioned in Chapter 2.5, did not support the modeling hypothesis
as expressed by Yazaydin, et al.28 due to their very high silica-to-aluminum ratios. This,
as previously mentioned, is theorized to be due to the very high silicon-to-aluminum
ratios of the powdered zeolites, allowing for fewer cations around which the TBA
molecules can align. By contrast, the granular zeolites have much lower silicon-to-
0.00E+00
5.00E+05
1.00E+06
1.50E+06
2.00E+06
2.50E+06
0 50 100 150 200
Ad
sorb
ed
Co
nce
ntr
atio
n (μ
g/g)
Concentration (μg/L)
ZSM-5
HiSiv 3000

36
aluminum ratios, as shown in Table 6, which should allow for a greater number of cations
in the zeolite structure, and thus, greater adsorption of TBA compared to MTBE.
Figure 22 shows the adsorption data for MTBE and TBA on the same granule forms of
HiSiv 3000 and ZSM-5 zeolites. As shown in Figure 22, TBA adsorption on a mass basis
is significantly higher (on the order of 100 to 10,000 times greater) than MTBE
adsorption, as recorded by Abu-Lail, et al.29
Figure 22: Mass Basis Isotherms for MTBE and TBA on ZSM-5 and HiSiv 3000.
(MTBE data (◊’s and □’s) collected by Laila Abu-Lail at WPI)
However, the modeling done by Yazaydin, et al.28 depicts the adsorption of TBA and
MTBE on a mole basis. By taking the data shown in Figure 22 and converting to moles of
each molecule adsorbed, similar isotherms for the two zeolites are found. Figure 23
illustrates the molar amounts of TBA and MTBE adsorbed on ZSM-5 and HiSiv 3000.
1.00E+00
1.00E+01
1.00E+02
1.00E+03
1.00E+04
1.00E+05
1.00E+06
1.00E+07
1.00E+08
1.00E+09
1 10 100 1000 10000 100000
Ad
sorb
ed
Am
ou
nt
(μg/
g)
Concentration (μg/L)
MTBE on ZSM5 MTBE on HS3000 TBA on ZSM5 TBA on HS3000
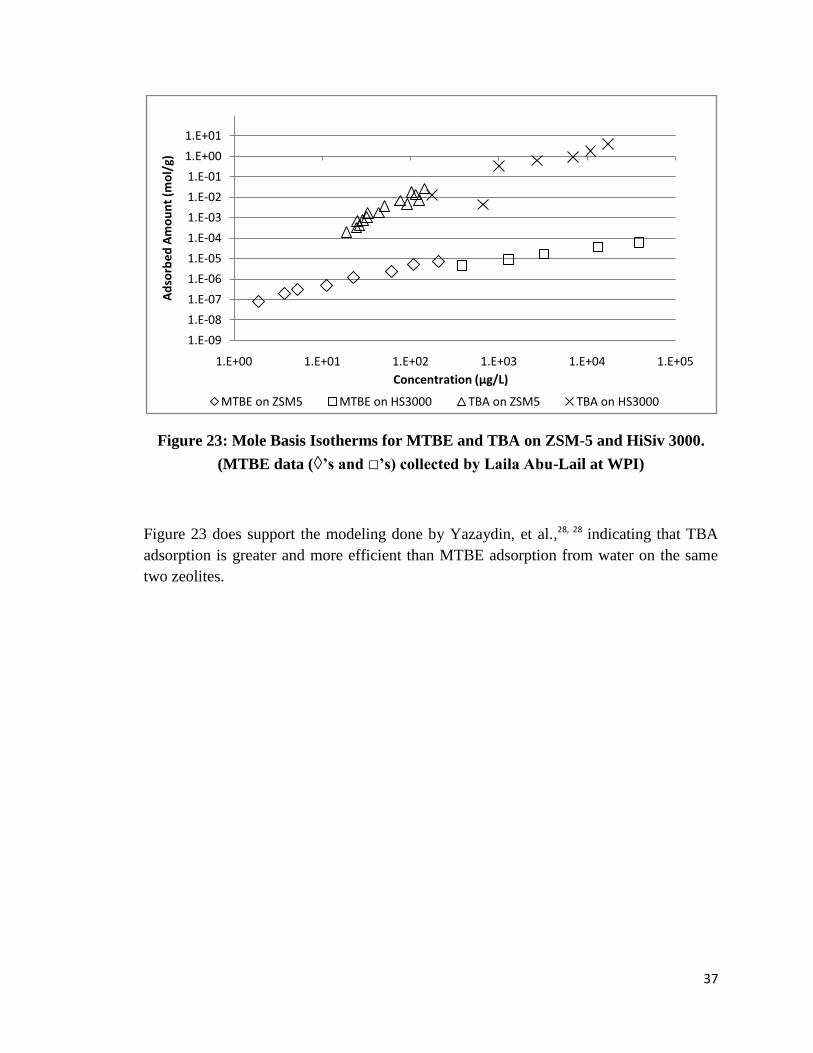
37
Figure 23: Mole Basis Isotherms for MTBE and TBA on ZSM-5 and HiSiv 3000.
(MTBE data (◊’s and □’s) collected by Laila Abu-Lail at WPI)
Figure 23 does support the modeling done by Yazaydin, et al.,28, 28 indicating that TBA
adsorption is greater and more efficient than MTBE adsorption from water on the same
two zeolites.
1.E-09
1.E-08
1.E-07
1.E-06
1.E-05
1.E-04
1.E-03
1.E-02
1.E-01
1.E+00
1.E+01
1.E+00 1.E+01 1.E+02 1.E+03 1.E+04 1.E+05
Ad
sorb
ed
Am
ou
nt
(mo
l/g)
Concentration (μg/L)
MTBE on ZSM5 MTBE on HS3000 TBA on ZSM5 TBA on HS3000

38
CHAPTER 5: FIXED BED ADSORPTION
The two prospective adsorbents, ZSM-5 and HiSiv 3000 zeolites, were compared in
continous fixed-bed columns, with varying parameters to adjust the breakthrough curves
of the columns. Ultimately, study of the breakthrough curves should aid in designing full-
scale models for industrial and waste water treatment purposes.
5.1 Introduction and Background
The specific mechanisms of adsorption in batch and continuous time systems rely on the
diffusive characteristics of the solution and the adsorbent. Although macrotransport is
responsible for movement through the bed length, microtransport actually controls
sorption by movement through the pores of the adsorbent.30 The proposed steps of
adsorption mechanisms30-35 is the diffusion through the liquid film or external boundary
layer, diffusion through the porous particle resulting in adsorption on the interior surface,
and a combination of the first two proposed steps. Of the listed steps, intraparticle
diffusion is the most common rate-limiting step.36
Although batch systems produce interesting information in the form of isotherms,
adsorption columns, whose designs are shown in Figure 24, more closely simulate
commercial and industrial adsorbers and real-world environmental situations.31 Of the
several designs, the moving bed is difficult to maintain in industrial settings and for large
flow.33 The two main bed choices are thus fixed bed and fluidized bed. The advantages of
a fixed bed system include little operator attention, few concentration fines, easy
inspection and cleaning for regeneration of adsorbent, and fewer instances of adsorbent
particles in the effluent.33 Disadvantages include the large physical area needed to
operate the fixed bed and the higher capital investment.33 For the purposes of this
research, the fixed bed column was the design chosen.
Figure 24: Adsorption Column Designs31

39
The adsorption column, or contactor, removes impurities in the feed stream provided
there is sufficient contact time between the impurity and the adsorbent.37, 38 Adsorbers
provide good quality effluents that are low in concentration of dissolved organics or other
impurities.38 However, the end of the adsorption process is determined by the degree of
high purification achieved and depends on the saturation of the adsorbent, the cost, and
the environmental evaluation of purity.34
Purity of a substance is monitored using a breakthrough curve, which estimates the time
required before the sorptive capacity of the sorbent bed is reached, i.e. the bed life of an
adsorbent.30 At the starting flow of a down-flow column, a mass transfer zone is shown
as depicted in Figure 25 at the top of the bed.
Figure 25: Adsorption Column Depicting Mass Transfer Zone31
As depicted in Figure 25, the mass transfer zone, or adsorption zone, moves through the
bed length as the solute adsorbs onto the adsorbent and the top adsorbent becomes
saturated.31, 32, 38 While the mass transfer zone moves through the column, the exit
concentration is very low compared to the feed concentration of the solution. When the
mass transfer zone reaches the bottom of the column, depicted as the breakpoint in a
breakthrough curve, the effluent concentration rapidly rises to the feed concentration
because all of the adsorbent is saturated.31

40
The actual breakthrough curve appears after the breakpoint has been reached and
monitors how quickly the exit concentration increases to the feed concentration,
indicating little adsorption because the adsorption bed is at equilibrium with the feed
concentration.30 An ideal breakthrough curve, the S-shape, is shown in Figure 26. The
most important aspect of the breakthrough curve, as idealized in Figure 26, is the shape
of the breakthrough because it determines the operating life-span of the adsorbent bed
and regeneration time needed for the bed length.38
Figure 26: Idealized Breakthrough Curve31
The shape of the breakthrough curve is dependent on several parameters, including the
feed concentration, the feed flow rate, the size, shape, and type of adsorbent, and the
temperature or pressure of the system.32, 38 For example, the curve, as referenced in
Figure 26, becomes less steep as the mass transfer rates are decreased31 or becomes
shorter with smaller surface areas.31, 32 According to Gupta, et al.,34 at a high feed flow
rate the adsorbate leaves the column before equilibrium can occur, which should
demonstrate a shorter time needed for breakthrough. Additionally, at a high feed
concentration, a steep breakthrough curve is expected because there is a lower mass flux
from the bulk to the particle surface.34
In judging the purity of the effluent, a choice of effluent concentration is normally chosen
around the breakpoint for a single adsorber.37 Industrial processes, however, normally
use multiple adsorbers aligned either in series or in parallel. Series and parallel adsorbers
are shown in Figure 27. Serial adsorbers tend to produce a greater degree of treatment
and maximum use of the adsorbent.33 Parallel adsorbers, in contrast, require blending the
effluent of several individual adsorbers to produce an acceptable effluent concentration.33
An example of the combined effluent from parallel adsorbers is shown in Figure 28.

41
Figure 27: Series and Parallel Adsorber Arrangements33
Figure 28: Breakthrough Curves for Parallel Adsorbers33
Adsorber features vary between industry uses. However, several sources31, 33, 37 describe
generalized systems for industry with the parameters expressed in Table 8.
Table 8: General Adsorber Parameters
Parameter Value
Bed Height/Length 3 – 9 m, 10 – 30 ft
Particle Size 8 – 40 mesh*
Velocity 1.4 – 6.8 L/m2s
Flow Rate 2 – 10 gpm/ft2
Residence Time 10 – 60 min
*for activated carbon

42
The most common and oldest adsorbents used in fixed-bed adsorbers are powdered and
granular activated carbon.38 In fact, the first use of activated carbon to treat municipal
water was in 1883 when 22 carbon filter plants were built in America.39 Activated
carbon, in either form, removes odors and flavors from water.39
Activated carbon in the original filter plants and in treatment nowadays has a dual
purpose, to adsorb odor- and flavor-causing molecules from the water and as a filter for
sediments and solids in the waste stream.31, 37 The dual purpose of activated carbon
allowed for a lower capital cost, since a separate filter was not needed unless there was a
high quantity of suspended solids in the waste stream.31, 33, 37 When used as a filter,
suspended solids would only gather at the top of the carbon bed at low feed rates.37
However, as the flow rate increased, the solids were able to penetrate the bed length
significantly.37 This resulted in lower efficiency for contaminant removal, mandatory
back-washing needed, and more frequent regeneration needed for the used activated
carbon.33, 37 After thermal regeneration, activated carbon showed significantly less
adsorptive capacity due to ash accumulating in the carbon pores or the carbon burning up
with the adsorbed impurities.37
Activated carbon also has difficulty removing large or highly polar molecules from waste
streams due to the uneven pore sizes in the carbon structure.31 The zeolites previously
studied should not have this same issue with small particles since their pore structure is
uniform21 through the depth of the zeolite. Additionally, zeolites can be thermally
regenerated without a significant decrease in adsorptive capacity, allowing for near-
infinite use of a single batch of zeolites.
Zeolites, however, will also have the same backwashing and suspended solids problems
as activated carbon in a fixed-bed adsorber. Previous treatment and removal of the solids
before adsorptive treatment should reduce the problems associated with solid penetration
of the bed length.
5.2 Methodology and Materials
The materials and instruments presented in Table 9 were used throughout the laboratory
work.
Table 9: List of materials and instruments for Chapter 5
Chemical Use Specifications Supplier
Tert Butyl Alcohol Solvent 99.7% Mallinckrodt ARACS
Water Solvent E-pure Barnstead/Ropure ST/E-
pure system
Isopropyl Alcohol Internal
Standard
90% v/v solution Aqua Solutions
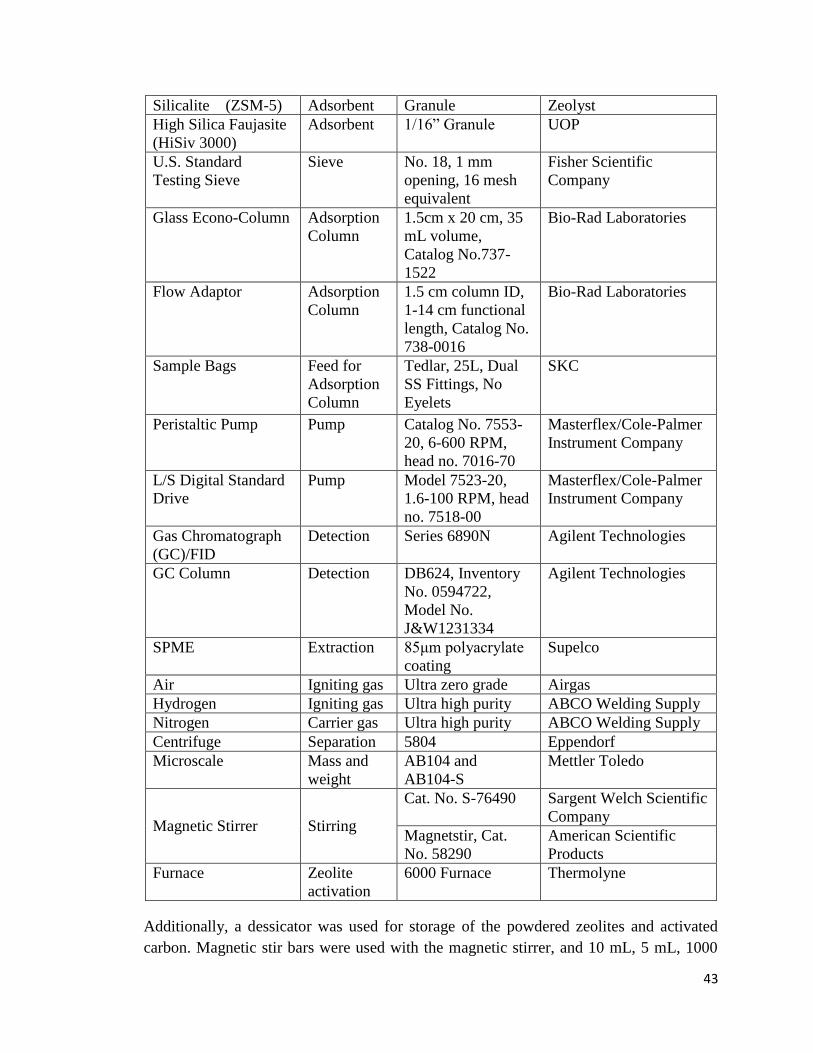
43
Silicalite (ZSM-5) Adsorbent Granule Zeolyst
High Silica Faujasite
(HiSiv 3000)
Adsorbent 1/16” Granule UOP
U.S. Standard
Testing Sieve
Sieve No. 18, 1 mm
opening, 16 mesh
equivalent
Fisher Scientific
Company
Glass Econo-Column Adsorption
Column
1.5cm x 20 cm, 35
mL volume,
Catalog No.737-
1522
Bio-Rad Laboratories
Flow Adaptor Adsorption
Column
1.5 cm column ID,
1-14 cm functional
length, Catalog No.
738-0016
Bio-Rad Laboratories
Sample Bags Feed for
Adsorption
Column
Tedlar, 25L, Dual
SS Fittings, No
Eyelets
SKC
Peristaltic Pump Pump Catalog No. 7553-
20, 6-600 RPM,
head no. 7016-70
Masterflex/Cole-Palmer
Instrument Company
L/S Digital Standard
Drive
Pump Model 7523-20,
1.6-100 RPM, head
no. 7518-00
Masterflex/Cole-Palmer
Instrument Company
Gas Chromatograph
(GC)/FID
Detection Series 6890N Agilent Technologies
GC Column Detection DB624, Inventory
No. 0594722,
Model No.
J&W1231334
Agilent Technologies
SPME Extraction 85μm polyacrylate
coating
Supelco
Air Igniting gas Ultra zero grade Airgas
Hydrogen Igniting gas Ultra high purity ABCO Welding Supply
Nitrogen Carrier gas Ultra high purity ABCO Welding Supply
Centrifuge Separation 5804 Eppendorf
Microscale Mass and
weight
AB104 and
AB104-S
Mettler Toledo
Magnetic Stirrer Stirring
Cat. No. S-76490 Sargent Welch Scientific
Company
Magnetstir, Cat.
No. 58290
American Scientific
Products
Furnace Zeolite
activation
6000 Furnace Thermolyne
Additionally, a dessicator was used for storage of the powdered zeolites and activated
carbon. Magnetic stir bars were used with the magnetic stirrer, and 10 mL, 5 mL, 1000

44
μL, 200 μL, and 5 μL pipettes and their respective tips were used. Glassware included
500 mL and 250 mL amber bottles, 18 mL GC vials, 500 mL, 1 L, and 2 L flasks.
The granule zeolites, both ZSM-5 and HiSiv 3000, were manually ground into particles
approximately 0.1 cm in diameter. After grinding, the small particles were placed on a
sieve to sort the particles. Particles with the appropriate diameter were kept in a sealed
glass container. Before use, the zeolites were baked in the oven at 350 degrees for 12-15
hours for activation and cleanliness. The zeolites were then directly added to the column
for experimentation.
The column was attached to a pump to induce the feed concentration. The feed
concentration flowed down the column through the flow adapter and into the packed bed.
After transversing through the bed length, the liquid left the column at the bottom into a
large waste container. Samples were taken at the end of the bed length, at the exit of the
column, at specific time intervals. The samples were taken in GC vials attached to the
tubing at the end of the column and took approximately two minutes to fill each GC vial.
An example of the entire column set-up is shown in Figure 29. The GC samples were
then sealed and refrigerated for 24-32 hours.
Figure 29: Column Experiment Set-up
The GC vials were prepared by removing 2.1 mL of the column sample and adding 100
μL of the 150 mg/L iso-propanol solution as an internal standard. The samples were then
placed in the GC.
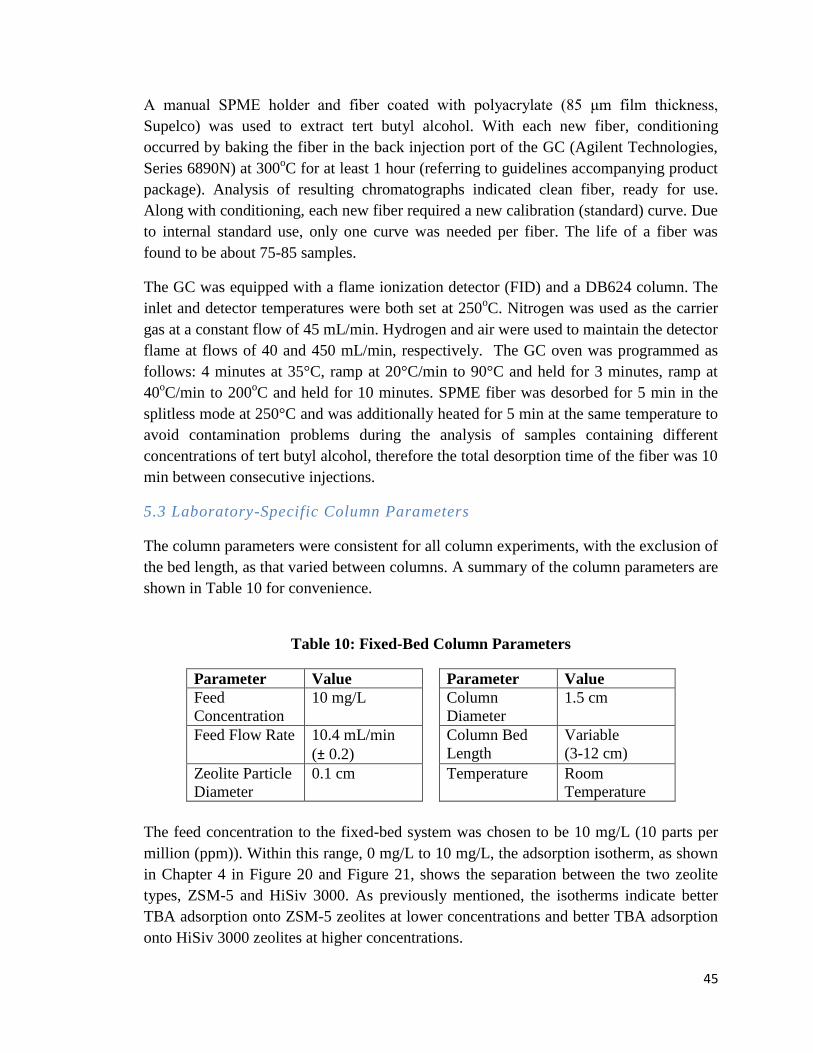
45
A manual SPME holder and fiber coated with polyacrylate (85 μm film thickness,
Supelco) was used to extract tert butyl alcohol. With each new fiber, conditioning
occurred by baking the fiber in the back injection port of the GC (Agilent Technologies,
Series 6890N) at 300oC for at least 1 hour (referring to guidelines accompanying product
package). Analysis of resulting chromatographs indicated clean fiber, ready for use.
Along with conditioning, each new fiber required a new calibration (standard) curve. Due
to internal standard use, only one curve was needed per fiber. The life of a fiber was
found to be about 75-85 samples.
The GC was equipped with a flame ionization detector (FID) and a DB624 column. The
inlet and detector temperatures were both set at 250oC. Nitrogen was used as the carrier
gas at a constant flow of 45 mL/min. Hydrogen and air were used to maintain the detector
flame at flows of 40 and 450 mL/min, respectively. The GC oven was programmed as
follows: 4 minutes at 35°C, ramp at 20°C/min to 90°C and held for 3 minutes, ramp at
40oC/min to 200
oC and held for 10 minutes. SPME fiber was desorbed for 5 min in the
splitless mode at 250°C and was additionally heated for 5 min at the same temperature to
avoid contamination problems during the analysis of samples containing different
concentrations of tert butyl alcohol, therefore the total desorption time of the fiber was 10
min between consecutive injections.
5.3 Laboratory-Specific Column Parameters
The column parameters were consistent for all column experiments, with the exclusion of
the bed length, as that varied between columns. A summary of the column parameters are
shown in Table 10 for convenience.
Table 10: Fixed-Bed Column Parameters
Parameter Value Parameter Value
Feed
Concentration
10 mg/L Column
Diameter
1.5 cm
Feed Flow Rate 10.4 mL/min
(± 0.2)
Column Bed
Length
Variable
(3-12 cm)
Zeolite Particle
Diameter
0.1 cm Temperature Room
Temperature
The feed concentration to the fixed-bed system was chosen to be 10 mg/L (10 parts per
million (ppm)). Within this range, 0 mg/L to 10 mg/L, the adsorption isotherm, as shown
in Chapter 4 in Figure 20 and Figure 21, shows the separation between the two zeolite
types, ZSM-5 and HiSiv 3000. As previously mentioned, the isotherms indicate better
TBA adsorption onto ZSM-5 zeolites at lower concentrations and better TBA adsorption
onto HiSiv 3000 zeolites at higher concentrations.
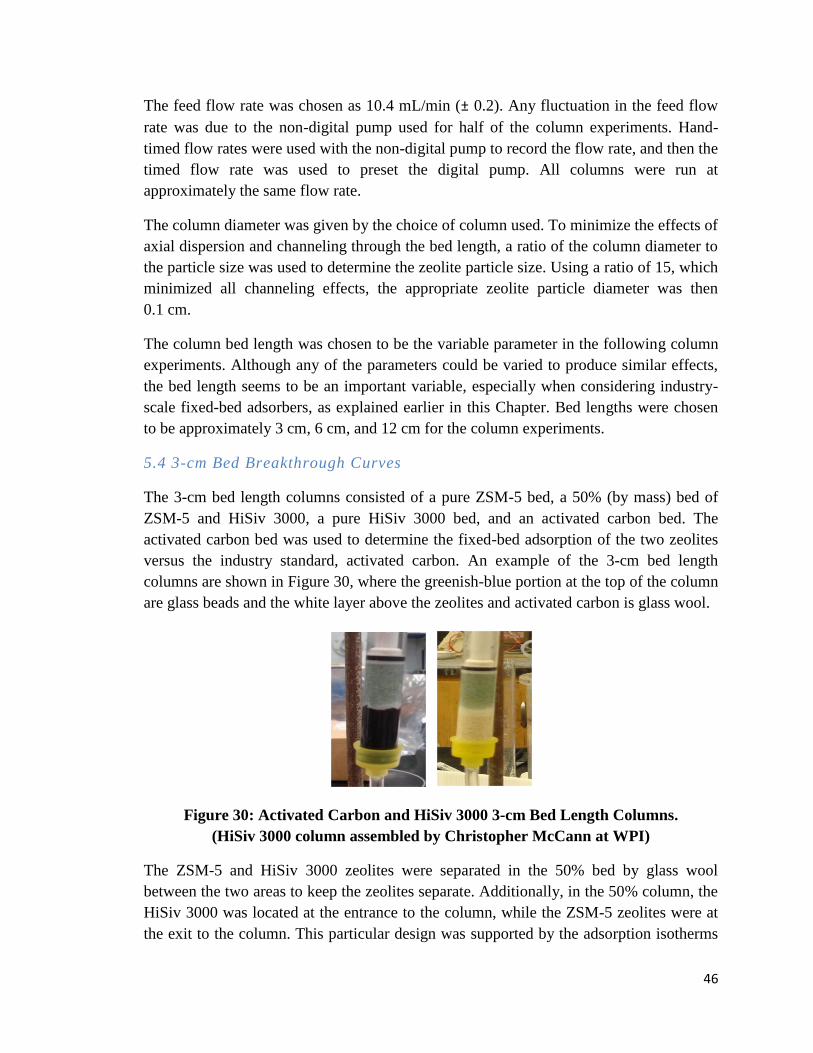
46
The feed flow rate was chosen as 10.4 mL/min (± 0.2). Any fluctuation in the feed flow
rate was due to the non-digital pump used for half of the column experiments. Hand-
timed flow rates were used with the non-digital pump to record the flow rate, and then the
timed flow rate was used to preset the digital pump. All columns were run at
approximately the same flow rate.
The column diameter was given by the choice of column used. To minimize the effects of
axial dispersion and channeling through the bed length, a ratio of the column diameter to
the particle size was used to determine the zeolite particle size. Using a ratio of 15, which
minimized all channeling effects, the appropriate zeolite particle diameter was then
0.1 cm.
The column bed length was chosen to be the variable parameter in the following column
experiments. Although any of the parameters could be varied to produce similar effects,
the bed length seems to be an important variable, especially when considering industry-
scale fixed-bed adsorbers, as explained earlier in this Chapter. Bed lengths were chosen
to be approximately 3 cm, 6 cm, and 12 cm for the column experiments.
5.4 3-cm Bed Breakthrough Curves
The 3-cm bed length columns consisted of a pure ZSM-5 bed, a 50% (by mass) bed of
ZSM-5 and HiSiv 3000, a pure HiSiv 3000 bed, and an activated carbon bed. The
activated carbon bed was used to determine the fixed-bed adsorption of the two zeolites
versus the industry standard, activated carbon. An example of the 3-cm bed length
columns are shown in Figure 30, where the greenish-blue portion at the top of the column
are glass beads and the white layer above the zeolites and activated carbon is glass wool.
Figure 30: Activated Carbon and HiSiv 3000 3-cm Bed Length Columns.
(HiSiv 3000 column assembled by Christopher McCann at WPI)
The ZSM-5 and HiSiv 3000 zeolites were separated in the 50% bed by glass wool
between the two areas to keep the zeolites separate. Additionally, in the 50% column, the
HiSiv 3000 was located at the entrance to the column, while the ZSM-5 zeolites were at
the exit to the column. This particular design was supported by the adsorption isotherms

47
shown in Figure 20 and Figure 21. As mentioned in Chapter 4, the HiSiv 3000 zeolites
appeared to adsorb more TBA from the solution at high concentrations, while ZSM-5
zeolites adsorbed more at lower concentrations. Thus, the 50% column was designed so
that the HiSiv 3000 zeolites were exposed to the initial feed concentration, where the
concentration is the highest, and the ZSM-5 zeolites were exposed to smaller
concentrations as the TBA solution moved through the bed length. This particular design
is of interest due to its theoretically purer exit concentration and its reduced cost since
there are fewer high-cost zeolites used.
Initially, only the 50% column and the ZSM-5 column were studied for the 3-cm bed
length columns so that the breakthrough curves could be established with respect to time.
The initial 3-cm bed length experiments were run over a 100 hour period, with samples of
the exit concentration taken every 2 hours. The 100 hour run is shown in Figure 31,
where it is important to note that the breakthrough curve is established after
approximately 10-15 hours. The fluctuations in Figure 31 may be due to the gas
chromatograph and its sampling fiber used to analyze the samples and adding feed
solution to the reservoir at 30 and 60 hours.
Figure 31: ZSM-5 and 50% 3-cm Bed Breakthrough Curves After 100 Hours
at 10 mg/L Feed Concentration.
(ZSM-5 data (∆’s) collected by Christopher McCann at WPI)
Since the 100 hour column experiments reached breakthrough in approximately 15 hours,
the remaining two columns, pure HiSiv 3000 and activated carbon, were run for 24 hours.
The data from all four columns are shown in Figure 32.
0
0.2
0.4
0.6
0.8
1
1.2
1.4
0 10 20 30 40 50 60 70 80 90 100
C/C
f
Hours
50%
ZSM

48
Figure 32: All 3-cm Bed Breakthrough Curves After 24 Hours
at 10 mg/L Feed Concentration.
(ZSM-5 data (∆’s) and HiSiv 3000 data (□’s) collected by Christopher McCann
at WPI)
Figure 32 indicates that all of the zeolite columns are more efficient for removal of TBA
from solution than the activated carbon column. This is shown by how quickly activated
carbon reaches its breakthrough curve, within approximately 2 – 4 hours. In an industrial
setting, this would require recharging or refreshing the activated carbon column every
1 – 3 hours, given these operating parameters, depending on the environmentally-safe
exit concentration needed. Even if the exit concentration was reduced to 80% of the feed
value, the activated carbon would need to be replaced every hour, which would incur a
high cost.
Additionally, Figure 32 compares the three zeolite columns (pure ZSM-5, pure
HiSiv 3000, and the 50% bed) over a 24 hour period. As shown, the breakthrough curves
for the three columns are remarkably similar. The pure ZSM-5 column might trail the
other two columns, but those details are obscured somewhat at this small-scale
examination. The similar behavior of the ZSM-5 and the HiSiv 3000 columns also
contradicts the information gathered from the adsorption isotherms. At a concentration of
10 mg/L, the adsorption isotherms (Figure 20) predict that HiSiv 3000 should have a
distinctively different breakthrough curve compared to the ZSM-5 breakthrough curve.
The breakthrough curve for HiSiv 3000, as shown in Figure 32, does not demonstrate
different breakthrough characteristics from the ZSM-5 data. This may be due to the 24
hour examination period for the fixed-bed adsorption experiments compared to the
necessary 48 hour contact time as established in Chapter 3 for batch experiments.
0
0.2
0.4
0.6
0.8
1
1.2
0 5 10 15 20 25
C/C
f
Hours
50%
ZSM-5
HS3000
AC

49
Another interesting conclusion to draw about these three columns is the behavior of the
50% bed column. The 50% bed column was theorized to have a unique breakthrough
curve, since the column used the advantage of the two zeolite’s high adsorption at the
inlet and the exit concentrations. However, as shown in Figure 32, there is no reliable
difference between the 50% bed breakthrough curve and the ZSM-5 or the HiSiv 3000
breakthrough curves. Because there is no significant difference between the pure zeolite
column and the 50% bed column, the 50% column is not examined in the rest of the bed
lengths. Instead, the focus is on the pure ZSM-5 and pure HiSiv 3000 columns. Further
examination of the 50% bed length may prove interesting and significant differences
between it and the pure columns may be obvious at large bed lengths, however, for the
purposes of this research, the 50% bed column was no longer studied.
The 3-cm column data also were examined with respect to isotherm data. Calculations
were found using the following equation:
𝐴𝑚𝑡 =𝑄 ∗ (1 − 𝐵)
𝑀𝑧
where Amt is the amount adsorbed by the zeolite over the total column operation time, B
is the area under the breakthrough curve as calculated using the trapezoidal rule for
integration, and Mz is the mass of the zeolite in the bed length.
The calculations for all four bed types (pure ZSM-5, pure HiSiv 3000, Activated Carbon,
and the 50% column) are shown in Table 11.
Table 11: 3-cm Bed Calculated Isotherm Equivalents
Bed Type Isotherm Equivalent
at 10 mg/L
Pure ZSM-5 1.832 mg/g
Pure HiSiv 3000 4.033 mg/g
50% ZSM-5/HiSiv 3000 10.18 mg/g
Activated Carbon 1.951 mg/g
Table 11 indicates the relative adsorption capacities of the zeolites in the 3-cm bed
columns. According to the calculations, the 50% column adsorbed the most TBA from
the feed solution, followed by the HiSiv 3000 column and the activated carbon column. It
was theorized that the 50% column should adsorb more than either the HiSiv 300 or the
ZSM-5 columns alone due to the placement of the two zeolites within the 50% column,
and the calculations support this theory. However, due to the little difference between the
50% column breakthrough curve and the pure zeolites breakthrough curves, the 50%
column is still not a feasible option for this small size bed.

50
Furthermore, Table 11 also supports the theory that zeolites adsorb more TBA from
solution than does activated carbon. In particular, the HiSiv 3000 zeolites out-performed
the activated carbon column in adsorption capacity as well as with the shape and timing
of the breakthrough curve. This data suggests that further study of zeolites as
replacements for activated carbon is worth following.
5.5 6-cm Bed Breakthrough Curves
The 6-cm bed length experiments consisted of a pure ZSM-5 column and a pure HiSiv
3000 column. The two columns are shown in Figure 33.
Figure 33: HiSiv 3000 and ZSM-5 6-cm Bed Columns.
(ZSM-5 column assembled by Christopher McCann at WPI)
The 6-cm bed length experiments were designed as continuations of the 3-cm bed length
experiments. Since the 3-cm bed length columns did not distinguish different
breakthrough curves for ZSM-5 and HiSiv 3000 zeolites as was expected by the
adsorption isotherms, the study of 6-cm bed lengths should determine different
breakthrough curves for the two zeolites. In particular, the 6-cm bed length will provide
longer contact time between the TBA solution and the zeolites, thus distinguishing the
breakthrough curves for ZSM-5 and HiSiv 3000 zeolites.
Theoretically, the breakthrough curves for the 6-cm bed lengths should be established in
approximately double the time of the 3-cm bed length breakthrough curves, or
approximately, 20-30 hours. As Figure 34 depicts, the two zeolites reach breakthrough at
different times. The HiSiv 3000 column reaches breakthrough within approximately 16
hours, and the ZSM-5 column reaches breakthrough at 25 hours.

51
Figure 34: ZSM-5 and HiSiv 3000 6-cm Bed Breakthrough Curves After 48 Hours
at 10 mg/L Feed Concentration.
(ZSM-5 data (∆’s) collected by Christopher McCann at WPI)
Figure 34 also shows a distinction between the two breakthrough curves, as was
theorized. Whereas the HiSiv 3000 data immediately returns a concentration in the
effluent, the ZSM-5 data does not, depicting the ideal S-shaped breakthrough curve.
For industry use, the ZSM-5 column demonstrates better results, since 30 hours are
required for saturation of the zeolites. The column would need to be taken off-line for
regeneration before 30 hours have elapsed, depending on the environmentally safe exit
concentration that is needed. The HiSiv 3000 column, however, would need to be
regenerated before approximately 15 hours has passed, again, depending on the
concentration of the effluent required.
The adsorption isotherm equivalents of the two 6-cm bed columns were calculated as
mentioned in the previous section (Section 5.4). The data is shown in Table 12 below.
Table 12: 6-cm Bed Calculated Isotherm Equivalents
Bed Type Isotherm Equivalent
at 10 mg/L
Pure ZSM-5 11.09 mg/g
Pure HiSiv 3000 3.063 mg/g
Table 12 indicates that ZSM-5 adsorption over the column bed is greater than the HiSiv
3000 adsorption. This is also the reverse of the calculated data from Table 11, where the
HiSiv 3000 zeolite adsorbed more TBA from solution in the shorter bed. As the bed
0
0.2
0.4
0.6
0.8
1
1.2
0 10 20 30 40 50
C/C
f
Time (hours)
ZSM-5
HS 3000
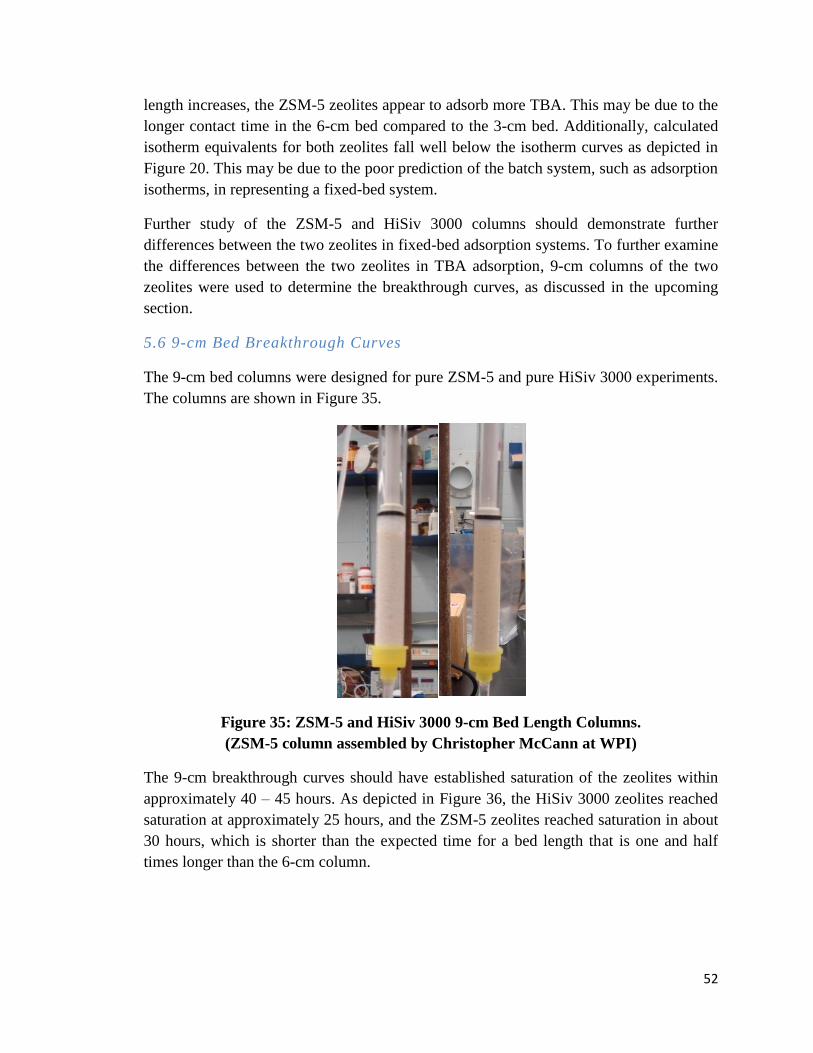
52
length increases, the ZSM-5 zeolites appear to adsorb more TBA. This may be due to the
longer contact time in the 6-cm bed compared to the 3-cm bed. Additionally, calculated
isotherm equivalents for both zeolites fall well below the isotherm curves as depicted in
Figure 20. This may be due to the poor prediction of the batch system, such as adsorption
isotherms, in representing a fixed-bed system.
Further study of the ZSM-5 and HiSiv 3000 columns should demonstrate further
differences between the two zeolites in fixed-bed adsorption systems. To further examine
the differences between the two zeolites in TBA adsorption, 9-cm columns of the two
zeolites were used to determine the breakthrough curves, as discussed in the upcoming
section.
5.6 9-cm Bed Breakthrough Curves
The 9-cm bed columns were designed for pure ZSM-5 and pure HiSiv 3000 experiments.
The columns are shown in Figure 35.
Figure 35: ZSM-5 and HiSiv 3000 9-cm Bed Length Columns.
(ZSM-5 column assembled by Christopher McCann at WPI)
The 9-cm breakthrough curves should have established saturation of the zeolites within
approximately 40 – 45 hours. As depicted in Figure 36, the HiSiv 3000 zeolites reached
saturation at approximately 25 hours, and the ZSM-5 zeolites reached saturation in about
30 hours, which is shorter than the expected time for a bed length that is one and half
times longer than the 6-cm column.

53
Figure 36: ZSM-5 and HiSiv 3000 9-cm Bed Breakthrough Curves After 48 Hours
at 10 mg/L Feed Solution.
(ZSM-5 data (∆’s) collected by Christopher McCann at WPI)
Figure 36 also indicates that a 9-cm bed length of ZSM-5 and HiSiv 3000 do not
demonstrate distinct fixed-bed adsorption, as is indicated by the 6-cm bed length. The
results from the two 9-cm bed lengths show there is no difference between the two
zeolites and their adsorption capacity. The only difference between the two columns is
the point at which they reach saturation, which is within five hours of each other.
For industrial use, either of the two 9-cm columns would be a good choice, since they
reach saturation within hours of each other. Due to this, the cost of the two zeolites may
play more of a part in choosing a zeolite for use.
The adsorption isotherm equivalents of the two 9-cm bed columns were calculated as
mentioned in the previous section (Section 5.4). The data is shown in Table 13 below.
Table 13: 9-cm Bed Calculated Isotherm Equivalents
Bed Type Isotherm Equivalent
at 10 mg/L
Pure ZSM-5 10.04 mg/g
Pure HiSiv 3000 6.560 mg/g
0
0.2
0.4
0.6
0.8
1
1.2
0 5 10 15 20 25 30 35 40 45 50
C/C
f
Time (hours)
HS
ZSM-5
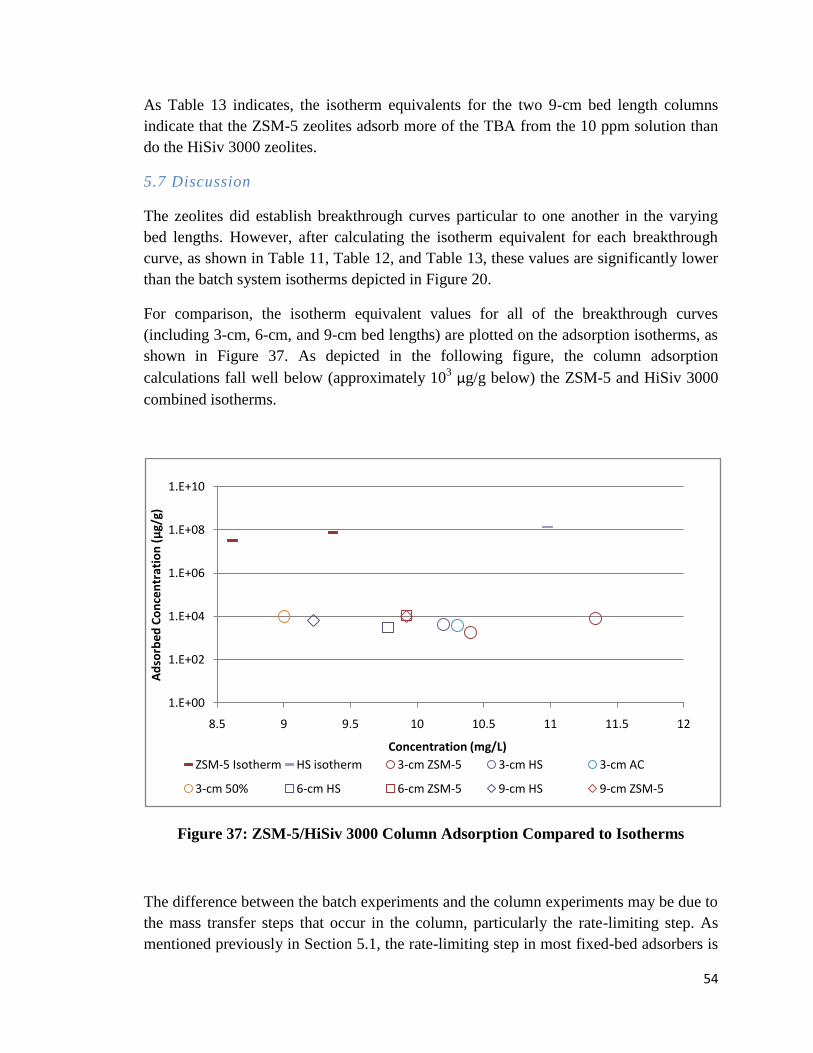
54
As Table 13 indicates, the isotherm equivalents for the two 9-cm bed length columns
indicate that the ZSM-5 zeolites adsorb more of the TBA from the 10 ppm solution than
do the HiSiv 3000 zeolites.
5.7 Discussion
The zeolites did establish breakthrough curves particular to one another in the varying
bed lengths. However, after calculating the isotherm equivalent for each breakthrough
curve, as shown in Table 11, Table 12, and Table 13, these values are significantly lower
than the batch system isotherms depicted in Figure 20.
For comparison, the isotherm equivalent values for all of the breakthrough curves
(including 3-cm, 6-cm, and 9-cm bed lengths) are plotted on the adsorption isotherms, as
shown in Figure 37. As depicted in the following figure, the column adsorption
calculations fall well below (approximately 103 μg/g below) the ZSM-5 and HiSiv 3000
combined isotherms.
Figure 37: ZSM-5/HiSiv 3000 Column Adsorption Compared to Isotherms
The difference between the batch experiments and the column experiments may be due to
the mass transfer steps that occur in the column, particularly the rate-limiting step. As
mentioned previously in Section 5.1, the rate-limiting step in most fixed-bed adsorbers is
1.E+00
1.E+02
1.E+04
1.E+06
1.E+08
1.E+10
8.5 9 9.5 10 10.5 11 11.5 12
Ad
sorb
ed
Co
nce
ntr
atio
n (μ
g/g)
Concentration (mg/L)
ZSM-5 Isotherm HS isotherm 3-cm ZSM-5 3-cm HS 3-cm AC
3-cm 50% 6-cm HS 6-cm ZSM-5 9-cm HS 9-cm ZSM-5
55
the intra-particle diffusion, or diffusion into the pores. Since diffusion into the zeolite
pores is much slower than diffusion around the zeolites or onto the surface of the zeolites,
the TBA molecules may not be adsorbing deep within the zeolites before the mass
transfer zone moves further down the column. This is equivalent to not exposing the
zeolites to the appropriate contact time (48 hours as determined by the equilibrium
experiments in Chapter 3.3) for adsorption. Due to this, the adsorption capacity of the
zeolites in a column should be less than batch adsorption at complete contact time, as is
shown in Figure 37.
Additionally, cracking or breaking of the zeolite’s crystalline structure while the zeolites
are ground into 1 millimeter particles may also affect the adsorption capacities of the
zeolites, resulting in non-uniform surface cracks that act as pores.

56
CHAPTER 6: CONCLUSIONS
Leaking storage tanks, recreational activities, and storm run-off from industrial sites are
common sources of fuel oxygenates in the environment. Research has focused on
reducing and remediating methyl tert butyl ether (MTBE) from groundwater and surface
systems, since MTBE is a popular, common fuel oxygenate. However, one of the main
problems associated with MTBE remediation is the production of tertiary butyl alcohol
(TBA), another fuel oxygenate and the main breakdown component of MTBE. Any
treatment of MTBE results in the production of TBA, which cannot be treated with the
same methods as MTBE due to its high solubility and volatility. Bacterial treatments have
been considered, but take more than 25 days to have significant reduction in TBA
concentration.
Granular activated carbon is often used to remove substances from water systems and is
the most common form of adsorbent for these applications. In addition to granular
activated carbon, zeolites provide another method for the removal of contaminants.
Zeolites have several advantages over granular activated carbon, including regenerative
properties without efficiency losses, uniform pore sizes that allow passage of different
size molecules into the pores, and silica and alumina sites for orientation of the
molecules. Using zeolites in place of granular activated carbon should provide better
contaminant removal efficiencies and cleaner water.
Batch experimentation with the zeolites determined that 48 hours is the necessary contact
time for complete adsorption. Of the seven original zeolites (Zeolite Y-1 and Y-2,
Silicalite, Mordenite, Zeolite Beta, HiSiv 1000 and 3000), the ZSM-5 and the HiSiv 3000
zeolites were shown to adsorb more in a 48 hour period than the other five zeolites.
Adsorption isotherms were created at high and low concentrations of TBA, indicating
better adsorption with one zeolite at low concentrations and the other at high
concentrations. Additionally, the adsorption isotherms for TBA were compared to
adsorption isotherms on the same two zeolites for MTBE, which supported theoretical
modeling that TBA adsorption into a zeolite pore should be approximately twice as much
as MTBE adsorption.
Column experiments henceforth were completed using ZSM-5 and HiSiv 3000 and
granular activated carbon for comparison.
Fixed-bed experiments with the two zeolites, activated carbon, and a column consisting
of fifty-percent mass of each zeolite were examined at the same parameters, including the
feed concentration, feed flow rate, column diameter, and zeolite particle diameter. Only
the bed length was varied between 3, 6, and 9-cm. Using the 3-cm bed length, there was
no difference in the breakthrough curves between the ZSM-5, the HiSiv 3000, and the
50% column. However, all three zeolite columns performed better than the activated

57
carbon column, supporting replacement of activated carbon treatment with these zeolites.
The 6-cm bed demonstrated more of a difference between the two zeolites and their
adsorption in a column. The 9-cm bed, surprisingly, did not show distinct curves between
the ZSM-5 and the HiSiv 3000 zeolites. Calculation of each column’s equivalent
isotherm adsorption value determined that zeolite adsorption in the columns was 1000
times less than in the batch adsorption case. This seems to be due to the amount of
contact time (48 hours) needed.
This research indicates the need for more study on TBA for industrial application.
Additionally, the research demonstrates the need to treat not only the fuel oxygenate, or
other main environmental contaminant, but also its breakdown components.
Unfortunately, the breakdown components for contaminants can be other potentially
hazardous substances, such as TBA, which go untreated since the focus is on the
contaminant and not the secondary compounds. The secondary, or break down,
compounds may play as large a part in the safety of the environment and human health as
the contaminant itself.

58
CHAPTER 7: FUTURE WORK
This study of the adsorption capacity of zeolites in a tertiary butyl alcohol (TBA) solution
is ground-breaking. However, more work needs to be done to further understand the
science behind the adsorption of these zeolites in a TBA solution.
Variance of the other parameters in fixed-bed column experiments (the feed
concentration, the feed flow rate, and the particle size of the zeolites) should be observed
for their influence on the breakthrough curves. The feed concentration and the feed flow
rate, in particular, should be varied due to the inconsistent concentration or flow rate
expected at water treatment sites. A change in either the concentration or the flow rate
should alter the breakthrough curve, and thus the bed life of the column and the purity of
the effluent.
Larger bed lengths should be studied to determine if the difference between the HiSiv
3000 and the ZSM-5 zeolites is greater with larger contact times. As more data are
generated on zeolite adsorption of TBA, a better understanding of the adsorption process
in the zeolite pores, as well as the nature of fixed-bed zeolite systems, will occur.
Additionally, experiments exposing the zeolites to a combined solution of TBA and
methyl tert butyl ether (MTBE) should be developed to determine if there is competition
between the two molecules within the zeolite pores. Since the TBA molecule is smaller,
competition may not occur. However, because MTBE and TBA often occur at the same
location, due to their use as oxygenates and since TBA is the major breakdown
component of MTBE, adsorption experiments that include both substances in solution
with a zeolite would be helpful in determining how to remove both substances at once,
rather than one versus another.
A pilot-scale experiment using the two zeolites, HiSiv 3000 and ZSM-5, should be
implemented, using more complete data about current industrial adsorbers. Since the
laboratory-scale study indicated the potential of the two zeolites, the pilot-scale study
may conclude that one zeolite is more efficient than the other in large-scale applications.
Additionally, a pilot-scale study would also provide accurate feed loads, breakthrough
point data for large-scale systems, and testing of the zeolite system for problems.
Although it was ruled out in the beginning of the column experiments in this study,
further study of a combination of zeolites in a single column should be examined.
Whereas the 50% zeolite column was calculated to have adsorbed more than either of the
single zeolite columns, the 50% zeolite column did not, at short bed lengths, show a
distinguishable breakthrough curve from the other two zeolite columns. Using the 50%
zeolite bed at larger bed lengths, such as 6-cm and 9-cm or larger, might provide a
different outlook on the breakthrough curve of the mixed bed system compared to the
59
single zeolite beds. Additionally, other percentage combinations of zeolites, such as
25%/75%, may result in better adsorption than either zeolite alone or the 50% bed.
Further studies may indicate that a mixed bed system does adsorb more, as calculated,
and that the breakthrough curve does show a better and more distinguishable curve from
the pure zeolite beds. By determining this with further study, applications of the mixed
bed column may result in industry use of the mixed bed.
Regeneration experiments were not performed on the zeolites in this study. A single
occurrence of re-use of the zeolites did occur, however, a comparison between before the
reuse and after thermal treatment were not done. Regeneration experiments with zeolites
that have adsorbed TBA solution need to be carried out in order to determine the best
way to regenerate the zeolites and remove TBA without affecting the adsorption capacity
of the zeolites. Recommended regeneration methods include thermal treatment and
advanced oxidation, among others. Since zeolites do have the capacity for regeneration
without decreasing the efficiency of removal, unlike activated carbon, zeolites have
potential multiple applications and in the replacement of activated carbon systems.
“The future is… a place that is created, created first in the mind and will,
created next in activity,” John Schaar
60
REFERENCES
References
(1) Schmidt, T. C.; Duong, H. A.; Berg, M.; Haderlein, S. B. Analyst 2001, 126, 405-413.
(2) Stefan, M. I.; Mack, J.; Bolton, J. R. Environ. Sci. Technol. 2000, 34, 650-658.
(3) Suflita, J. M.; Mormile, M. R. Environ. Sci. Technol. 1993, 27, 976-978.
(4) Zogorski, J. S.; Morduchowitz, A.; Baehr, A.; Bauman, B.; Conrad, D.; Drew, R.;
Korte, N.; Lapham, W.; Pankow, J.; Washington, E. Executive Office of the
President.[Also published by National Science and Technology Council, 1997,
Interagency assessment of oxygenated fuels, Chap.2, Fuel oxygenates and water
quality: Washington, DC, Office of Science and Technology Policy,
T(TRUNCATED) 1996.
(5) Bradley, P. M.; Landmeyer, J. E.; Chapelle, F. H. Environ. Sci. Technol. 1999, 33,
1877-1879.
(6) Piveteau, P.; Fayolle, F.; Vandecasteele, J. P.; Monot, F. Appl. Microbiol. Biotechnol.
2001, 55, 369-373.
(7) Wallington, T. J.; Dagaut, P.; Liu, R.; Kurylo, M. J. Environ. Sci. Technol. 1988, 22,
842-844.
(8) Deeb, R. A.; Chu, K. H.; Shih, T.; Linder, S.; Suffet, I. M.; Kavanaugh, M. C.;
Alvarez-Cohen, L. Environ. Eng. Sci. 2003, 20, 433-447.
(9) Finneran, K. T.; Lovley, D. R. Environ. Sci. Technol. 2001, 35, 1785-1790.
(10) Hanson, J. R.; Ackerman, C. E.; Scow, K. M. Appl. Environ. Microbiol. 1999, 65,
4788-4792.
(11) Fischer, A.; Oehm, C.; Selle, M.; Werner, P. Environ. Sci. Pollut. Res. Int. 2005, 12,
381-386.
(12) Church, C. D.; Isabelle, L. M.; Pankow, J. F.; Rose, D. L.; Tratnyek, P. G. Environ.
Sci. Technol. 1997, 31, 3723-3726.

61
(13) AnonymousFisher Scientific, Material Safety Data Sheet, tert. butanol 99.5%.
http://www.atmos.umd.edu/~russ/MSDS/tertbutanol.html (accessed February 21,
2007).
(14) AnonymousSafety Data for tert-butyl alcohol.
http://physchem.ox.ac.uk/MSDS/BU/tert-butyl_alcohol.html (accessed February 21,
2008).
(15) AnonymousButyl Alcohol-tert. http://www.jtbaker.com/msds/englishhtml/b6304.htm
(accessed February 21, 2008).
(16) AnonymousInternational Chemical Safety Card, tert-butanol.
http://hazard.com/msds/mf/cards/file/0114.html (accessed February 21, 2008).
(17) AnonymousScorecard, tert-butanol. http://www.scorecard.org/chemical-
profiles/html/terbutyl_alcohol.html (accessed February 21, 2008).
(18) Piveteau, P.; Fayolle, F.; Vandecasteele, J. P.; Monot, F. Appl. Microbiol.
Biotechnol. 2001, 55, 369-373.
(19) Oh, K. C.; Stringfellow, W. T. Determination of Methyl tert-Butyl Ether and tert-
Butyl Alcohol in Water by Solid-Phase Microextraction/Head Space Analysis in
Comparison to EPA Method 5030/8260B 2003.
(20) McGregor, D.; Hard, G. C. Toxicol. Sci. 2001, 61, 1-3.
(21) Wikipedia contributors Zeolite.
http://en.wikipedia.org/w/index.php?title=Zeolite&oldid=192698542 (accessed 24
February 2008, 2008).
(22) Campos, A. 2004, 14.
(23) Kennedy, B. A., Ed.; In Surface Mining; Society for Mining Metallurgy &
Exploration, Inc.: 1990; , pp 1206.
(24) Bell, R. G. What are Zeolites. http://www.bza.org/ (accessed February 24, 2008,
2008).
(25) Virta, R. L. ZEOLITES 2000, 85.1.
(26) Zhao, X.; Ma, Q.; Lu, G. Energy Fuels 1998, 12, 1051-1054.

62
(27) Erdem-Senatalar, A.; Bergendahl, J. A.; Giaya, A.; Thompson, R. W. Environ. Eng.
Sci. 2004, 21, 722-729.
(28) Yazaydin, A. O. 2006.
(29) Abu-Lail, L.; Thompson, R. W.; Bergendahl, J. A. .
(30) Weber Jr, W. J.; DiGiano, F. A. In Process Dynamics in Environmental Systems;
First Edition. John Wiley & Sons, Inc: 1996; .
(31) Sundstrom, D. W.; Klei, H. E. In Wastewater treatment; Prentice-Hall Englewood
Cliffs, NJ: 1979; .
(32) Garlick, R. N. Dynamic Adsorption of a Multicomponent System. Worcester
Polytechnic Institute., 1968.
(33) Cheremisinoff, P. N.; Ellerbusch, F. In Carbon Adsorption Handbook; Ann Arbor
Science Publishers: 1978; .
(34) Gupta, S.; Babu, B. V. Journal on Engineering & Technology 2005, 1, 60-66.
(35) Liao, H. T.; Shiau, C. Y. AICHE J. 2000, 46, 1168-1176.
(36) McGuire, M. J.; Suffet, I. H. In Treatment of water by granular activated carbon;
American Chemical Society: 1983; .
(37) Swindell-Dressler Company; Agency, E. P.; Office of Technology Transfer; United
States In Process Design Manual for Carbon Adsorption; US Govt. Print. Off: 1971;
(38) Walker, G.; Weatherley, L. Water Res. 1997, 31, 2093-2101.
(39) Mantell, C. L. In Adsorption; McGraw-Hill New York: 1945; .
Related Documents