Master Thesis in Geosciences COMPACTION, EVOLUTION OF ROCK PROPERTIES AND AVO MODELING Tornerose Prospect South West Barents Sea Rock property evolution and AVO modeling Abel Onana Ndingwan

Welcome message from author
This document is posted to help you gain knowledge. Please leave a comment to let me know what you think about it! Share it to your friends and learn new things together.
Transcript

Master Thesis in Geosciences
COMPACTION, EVOLUTION OF ROCK PROPERTIES
AND
AVO MODELING
Tornerose Prospect
South West Barents Sea
Rock property evolution and AVO modeling
Abel Onana Ndingwan

COMPACTION, EVOLUTION OF ROCK PROPERTIES
AND
AVO MODELING
Tornerose Prospect
South West Barents Sea
Rock property evolution and AVO modeling
Abel Onana Ndingwan
Master Thesis in Geosciences
Discipline: Petroleum Geology and Petroleum Geophysics
Department of Geosciences
Faculty of Mathematics and Natural Sciences
UNIVERSITY OF OSLO
01.06.2011

© Abel Onana Ndingwan, 2011
Tutor(s): Associate Professors Jens Jahren (UiO) and Nazmul Haque Mondol (UiO)
This work is published digitally through DUO – Digitale Utgivelser ved UiO
http://www.duo.uio.no
It is also catalogued in BIBSYS (http://www.bibsys.no/english)
All rights reserved. No part of this publication may be reproduced or transmitted, in any
form or by any means, without permission.

Preface
i
Preface
This research is part of the BarRock (Barents Sea Rock Properties) Project.
It is submitted to the Section of Petroleum Geology and Petroleum Geophysics,
Department of Geosciences, University of Oslo (UiO) in
candidacy of an MSc. Degree.
The research has been performed at the Department of Geosciences, UiO,
during the period of January to May 2011 under the supervision of
Associate Professors: Nazmul Haque Mondol and Jens Jahren,
Section of Petroleum Geology and Petroleum Geophysics,
University of Oslo, (UiO),
Norway

Dedication
ii
DEDICATION
This research is dedicated to my lovely mother, Epo Mary Isabelle, for the constant love,
patience, encouragements and prayers particularly during the writing of this thesis.

Acknowledgements
iii
Acknowledgements
I profoundly thank my supervisors: Associate Professors Nazmul Haque Mondol and Jens
Jahren for the valuable support, guidance, inspiring ideas and tutorship from the conception
to maturation of this thesis. All the long status meetings in your offices will be missed. I also
thank Manzar Fawad for his technical inputs during the practical sessions in the laboratory.
I owe special gratitude to my lecturers Johan Petter Nystuen and Roy Helge Gabrielsen for
their inspiration during a field course in Ainsa, Spain. Their academic inputs
encouragements, advice and had been constant.
To the following lecturers who have taught me all that they know to the best of their abilities,
I do hereby express my gratitude for the knowledge and confidence received: Knut
Bjørlykke, Jan I. Faleide, Leiv Gelius, Dag Karlsen, and Michael Heeremans. I further thank
the entire staff of the Geoscience department for the wonderful education and training.
Special gratitude to my parents who have always supported me from day one. I would like to
thank my family; Williams Chindo, the Mbata family, Jennifer, Toube, Grand soeur Doris,
Eugene and petit frère Danny for their support and patience during the writing of this thesis.
Thanks to my classmates Fai Honore, Agus Fitriyanto, Piratheeben k. and Tashi Tshering for
the interesting and long discussions.
Finally, I thank all my friends mentioned herein and to those whose names have not been
mentioned but have always supported me in one way or the other: Nana Afriyie Takyi,
Nkemtaji Moses, Olivier Pamen, Emesum family, Tizinbu Eric, and Toh Lih Raymond for
their assistance. To Ronny Rønning, the first Norwegian I ever met: thank you.
Thank you God.

Abstract
iv
Abstract
The Barents Sea is an active area for frontier petroleum exploration .This study focuses on an
area across the Tornerose prospect in the Hammerfest Basin, South West of the Barents Sea.
Cenozoic exhumation of the entire region resulted in dramatic changes in rock properties and
eventual petroleum systems therein. Analysis of this sedimentary basin as a normally subsiding
basin would yield misleading results. The focus of this thesis comprise of two phases which are
compaction analysis and evolution of rock properties as a function of depth coupled with
AVO/AVA (amplitude versus offset/angle) evaluation and modeling of the Stø and Snadd
reservoirs.
Petrophysical logs from 5 wells, published natural compaction curves and experimentally
compacted mudstone and sandstone curves have been used to investigate compaction and
evolution of rock properties of the area. Mechanical compaction dominates as a monotonic
function of vertical effective stress from the overburden to depths of about 1530m BSF (well
7123/4–1A). An abrupt velocity increase at this depth corresponding to present day temperatures
of 45.9⁰C is inferred to as resulting from grain framework stiffening related to precipitated micro-
quartz released from the transformation of the clay mineral smectite to illite via mixed layer
smectite – illite (SI). This marks the transition zone to chemical compaction. The high
velocity/depth ratio of these sediments compared to experimentally compacted synthetic
mudstones is related to the burial history and subsequent uplift. Correcting for exhumation yields
estimates in the range of 1200 to 1600m.Velocity and density inversion in the organic rich
Hekkingen Formation due to high pore pressures, among other factors, could possibly have
contributed to the good reservoir quality in the underlying Stø reservoir sandstones.
Lateral variation of the cap rock elastic properties greatly control the AVO character of the Stø
reservoir. Lithological heterogeneity within the Snadd reservoir reduces the impedance contrast
with the overlying Fruholmen Formation giving low AVO response. A systematic increase in
pore fluid compressibility in the Stø reservoir results in a corresponding decrease in reflection
coefficients. Substituting brine with an initial 10% gas as reservoir pore fluid results in
remarkable changes on seismic. However these changes are not evident for higher gas saturations
of 50 to 90%. AVO modeling effectively quantifies these fluid effects at all gas saturations. The
result presented herein establishes possible AVO variation trends for increasing gas saturation
within the Stø reservoir. The various models within the framework of this thesis give a quick
preliminary AVO evaluation of the Stø and Snadd reservoirs. With an expanding data base, more
constrains could be incorporated into these elementary models.

Table of Contents
v
Table of Contents
Preface........................................................................................................................................i
Acknowledgements...................................................................................................................iii
Abstract.....................................................................................................................................iv
Table of Contents.......................................................................................................................v
CHAPTER 1: INTRODUCTION
1.1 General.................................................................................................................................1
1.2 Motivation of Research........................................................................................................3
1.3 General Description of Thesis Outline.................................................................................4
1.4 Research Objectives.............................................................................................................4
1.4.1 Compaction and Evolution of Rock Properties.................................................................5
1.4.2 AVO (Amplitude versus Offset) Modeling.......................................................................5
1.5 Study Area............................................................................................................................6
1.6 Materials and Methods.........................................................................................................7
1.6.1 Database............................................................................................................................7
1.6.2 Software............................................................................................................................9
1.6.3 Methods...........................................................................................................................11
CHAPTER 2: REGIONAL GEOLOGIC FRAMEWORK
2.1 Structure and Tectonics......................................................................................................13
2.2 Stratigraphy........................................................................................................................14
2.2.1 Nordland Group...............................................................................................................14
2.2.2 Sotbakken Group.............................................................................................................14
2.2.3 Nygrunnen Group............................................................................................................15
2.2.4 Adventdalen Group.........................................................................................................16
2.2.5 Kapp Toscana Group.......................................................................................................16
2.3 Petroleum System...............................................................................................................17
2.3.1 Source Rocks...................................................................................................................17

Table of Contents
vi
2.3.2 Studied Reservoir Units..................................................................................................19
2.3.2.1 Stø Reservoir................................................................................................................19
2.3.2.2 Snadd Reservoir...........................................................................................................21
2.3.3 Trap.................................................................................................................................23
CHAPTER 3: COMPACTION AND EVOLUTION OF ROCK PROPERTIES
3.1 Introduction........................................................................................................................24
3.2 Theoretical Background.....................................................................................................26
3.2.1 Mechanical Compaction..................................................................................................26
3.2.2 Chemical Compaction.....................................................................................................28
3.2.3 Compaction of Clays, Mudstones and Shales.................................................................29
3.2.4 Compaction of Sandstones..............................................................................................32
3.3 Methodology......................................................................................................................34
3.3.1 Correlative Analysis of Petrophysical logs.....................................................................34
3.3.2 Cross plots.......................................................................................................................34
3.3.3 Correction for Exhumation and Comparative analysis...................................................35
3.4 Results................................................................................................................................36
3.4.1 Compaction Trends in the Study Area............................................................................36
3.4.2 Transition Zone from Mechanical to Chemical Compaction..........................................39
3.4.3 Rock Property Variations................................................................................................41
3.4.4 Correction for Exhumation and Comparative Analysis..................................................44
3.5 Discussion of Results.........................................................................................................49
3.5.1 Compaction as a Function of Rock Properties................................................................49
3.5.2 Exhumation.....................................................................................................................54
3.5.3 Compaction in Source Rocks..........................................................................................55
3.5.4 Uncertainties....................................................................................................................57
Table of Contents
vii
CHAPTER 4: AVO/AVA MODELING
4.1 Introduction........................................................................................................................59
4.2 Theoretical Background.....................................................................................................60
4.2.1 Reflectivity Series...........................................................................................................60
4.2.2 The convolutional Trace Model......................................................................................60
4.2.3 Zoeppritz Equation and Aki-Richard approximation......................................................61
4.2.4 AVO Reservoir sand Classification Scheme...................................................................64
4.2.5 Gassmann’s Theory and Fluid Substitutions...................................................................66
4.3 Methodology......................................................................................................................69
4.3.1 Shear Wave Velocity (Vs) Estimation ...........................................................................69
4.3.2 Water Saturation (Sw).....................................................................................................70
4.3.3 Density to Porosity Transform........................................................................................71
4.3.4 Wavelet............................................................................................................................71
4.3.5 Upscaling.........................................................................................................................72
4.3.6 AVO/ AVA Modeling.....................................................................................................73
4.4 Results................................................................................................................................75
4.4.1 Stø Reservoir...................................................................................................................75
4.4.2 Snadd Reservoir..............................................................................................................77
4.4.3 Sensitivity Analysis.........................................................................................................78
4.5 Discussion of Results.........................................................................................................80
4.5.1 Cap rock Properties.........................................................................................................80
4.5.2 Pore Fluid Property and Saturation Effects on AVO Response.....................................82
4.5.3 Facies Variations and Depth Dependent AVO Signature...............................................84
4.5.4 Models Uncertainties.......................................................................................................85
CHAPTER 5: SUMMARY AND CONCLUSIONS
5.1 Summary............................................................................................................................86
5.2 Conclusions........................................................................................................................88
REFERENCES.......................................................................................................................91
Appendix................................................................................................................................103
Chapter 1.Introduction
1
CHAPTER 1: INTRODUCTION
1.1 General
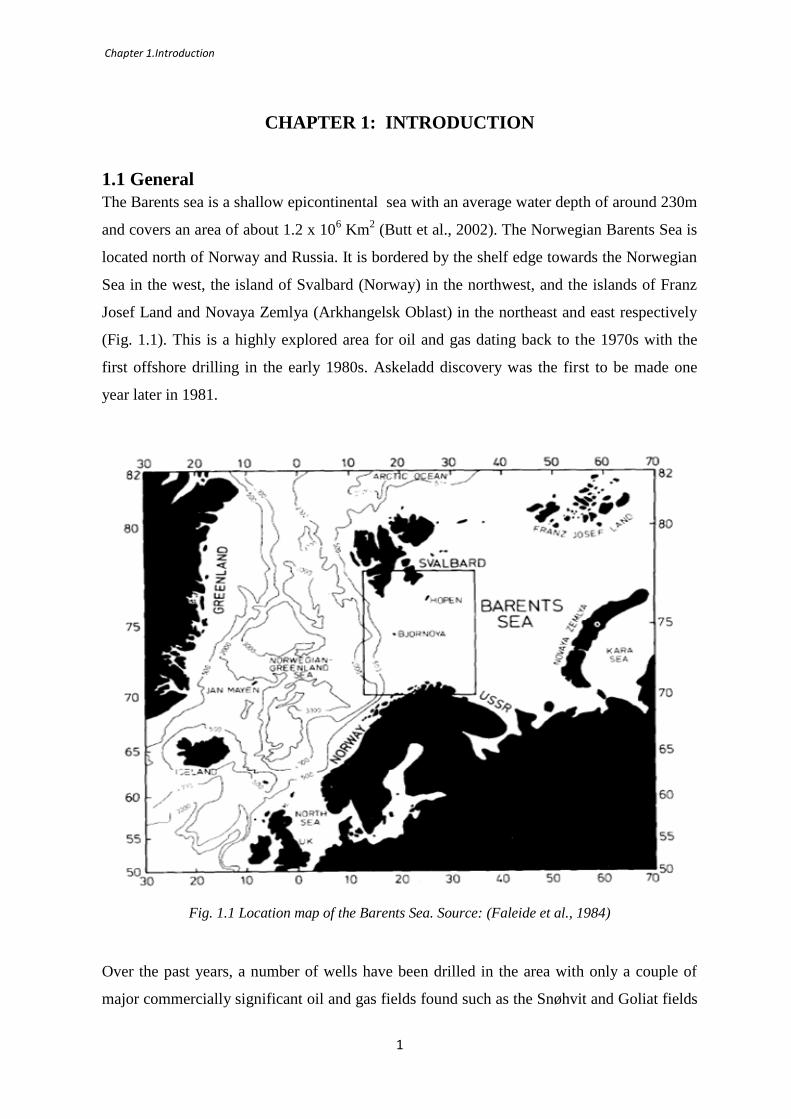
The Barents sea is a shallow epicontinental sea with an average water depth of around 230m
and covers an area of about 1.2 x 10⁶ Km
2 (Butt et al., 2002). The Norwegian Barents Sea is
located north of Norway and Russia. It is bordered by the shelf edge towards the Norwegian
Sea in the west, the island of Svalbard (Norway) in the northwest, and the islands of Franz
Josef Land and Novaya Zemlya (Arkhangelsk Oblast) in the northeast and east respectively
(Fig. 1.1). This is a highly explored area for oil and gas dating back to the 1970s with the
first offshore drilling in the early 1980s. Askeladd discovery was the first to be made one
year later in 1981.
Fig. 1.1 Location map of the Barents Sea. Source: (Faleide et al., 1984)
Over the past years, a number of wells have been drilled in the area with only a couple of
major commercially significant oil and gas fields found such as the Snøhvit and Goliat fields

Chapter 1.Introduction
2
(Fig.1.2). Most of the discoveries yielded gas such as the Snøhvit, Albatross and Askeladd
gas fields. The Snøhvit gas field, discovered in 1984, started development in 2005 as the first
offshore development project in the Barents Sea and a stepping stone for resource
exploitation in the Arctic. A latest discovery (Skrugard in 2011) has presented a significant
break-through for frontier exploration with the possibility of the area becoming a future oil
province. The Skrugard discovery, located approximately 150 Km northwest of the Goliat
field, was made through exploration well 7220/8 – 1 and was the first well to be drilled in
production license PL532 awarded in 2009 within the 20th
Norwegian licensing round.
However, further east in the Russian sector lies the giant Shtockmanovskoye and
Ludlovskoye gas fields.
Fig. 1.2. Location map of two major commercial hydrocarbon fields in the South West Barents Sea:
Snøhvit and Goliat Fields. Modified from NPD Factmaps (2011)
Following the 21st licensing round in April 2011, the Norwegian Government awarded 24
offshore oil and gas production licenses (PL), half of which were in the Barents Sea.
Exploration and development in this area is technologically complex and expensive given

Chapter 1.Introduction
3
the extremely low temperatures, sea ice, and long distances from existing infrastructures.
However, soaring oil prices and ground-breaking technologic advances have attracted
exploration activities.
According to the United States Geological survey (USGS) (Bird et al., 2008), in an unbiased
geology-based probabilistic methodology to estimate undiscovered oil and gas resources,
through a Circum-Arctic Resource Appraisal, approximated that in the Barents Sea region,
there are ≈ 326.106 m
3 of oil, ≈ 743.10
6 m
3 of natural gas and ≈ 44.10
6 m
3 of natural gas
liquids still undiscovered. Several phases of uplift and erosion have probably caused
depletion and redistribution of hydrocarbon accumulation in the Barents Sea region.
1.2 Motivation of Research
On a global scale, hydrocarbon resources are finite and the rate at which new hydrocarbon
discoveries are found is in a decline, particularly at a period when the demand for oil and gas
continuously increases. In many areas the rate of production supersedes that of reserves
replacement. On the other hand in several mature hydrocarbon provinces, the reserves are
there; but they need to be located or extracted more efficiently. A robust combination of
reservoir characterization techniques and the latest software packages yields top-notch
improvements to production in existing fields.
Characterization of virgin reservoir relies mainly on techniques such as; AVO, inversion,
seismic attributes, statistical modelling and simulation and, in certain cases, multicomponent
data. In the case of a reservoir under production, more emphasis is laid on the link between
seismic data and reservoir fluid, pressure and temperature. Seismic data analysis is therefore
one of the key technologies for characterizing reservoirs. However while there has been
mile-stone advances in 3D seismic data processing, the quantitative interpretation of the
seismic data for rock property determination still represents a challenge (Avseth, 2005).
The ultimate goal therefore of a petroleum geoscientist is to define reservoirs in terms of its
porosity, permeability, fluid content, lateral and vertical heterogeneity and net-to-gross
prior to drilling and during production. Much work is done to include as many sources of
information as possible into reservoir characterization. Information is required from well
logs, cores and cuttings, seismic and production data and geotechnical input. This has led to
an increasing need for reservoir characterization technology within the oil and gas industry.

Chapter 1.Introduction
4
The need is mostly driven by economic realities. That is if reservoirs can be defined
appropriately using available technology, then the end result is higher drilling success and
optimizing reservoir production over the life of the field.
1.3 General Description of Thesis Outline
A progressive and systematic integration of rock property evolution with depth and AVO
modeling approach is employed to investigate the main concerns within the framework of
this study. This description gives the general outline of
Chapter I, general aspects of the Barents Sea region, the Hammerfest basin and Tornerose
prospect will be addressed. The objectives of the entire study will be spelled out. The
materials and methodology of the entire thesis are introduced at this level.
Chapter II discusses the geologic framework which shall be divided into two parts: the
structural setting and stratigraphic successions encountered by the different wellbores.
Background on the petroleum system will be reviewed. The two reservoir units that shall be
the later focus of this study are also briefly discussed in this section.
Chapter III, a more detailed analysis of the evolution of dynamic rock properties of the
various stratigraphic successions is done in this section. Evaluation of implications of the
structural history (Cenozoic exhumation) and rock property changes is addressed both at
Group and Formation levels.
Chapter IV focuses on mainly on the Stø and Snadd reservoir units. Reflectivity as a
function of offset/ angle is evaluated at the top reflector of these reservoirs from different
perspectives. Several AVO models will be developed within this section for further analysis
of these reservoir units.
Chapter V summarizes and presents succinct conclusions of this study based on the analysis
of datasets, available literature and assumptions made throughout this study.
1.4 Research Objectives
Most petroleum reservoirs are heterogeneous. The pattern of heterogeneity in sandstone
reservoirs, which determines the volumes, flow rates and recovery of hydrocarbons, are
controlled by geometry and internal structures of sand bodies, grain size, sorting, degree of

Chapter 1.Introduction
5
bioturbation, provenance and by the types, volumes and distribution of diagenetic
alterations. (Morad et al., 2010). The presence of clays and shales in reservoir rocks add
even more complexity. Understanding the link between geologic processes and seismic
signatures is of prime importance in reservoir characterization. Rock physics can give a
more quantitative link between seismic, well logs and reservoir properties. Moreover,
understanding compaction mechanisms is important in sedimentary basins as this causes
changes in physical properties of sediments during burial. These physical parameters control
reservoir quality and available pore space for hydrocarbon accumulation.
The main objective of the thesis is to understand compaction behaviour, evolution of rock
properties and AVO (Amplitude Versus Offset) modeling of reservoir horizons of Tornerose
discovery in Block 7122, Barents Sea. These issues are highlighted in the research under two
major headings:
1.4.1 Compaction and Evolution of Rock Properties
Analysis of major compaction mechanisms as a function of rock properties and depth
across the study area.
Determine the transition between mechanical and chemical compactions and its
effect on dynamic rock properties.
Identify gross potential reservoir intervals and how they compact relative to shales.
Estimate the magnitude of Cenozoic exhumation undergone by sediments across the
study area and its impact on reservoir quality.
Comparative analysis of experimentally compacted synthetic mudstones to constrain
the naturally compacted sediments.
1.4.2 AVO (Amplitude versus Offset) Modeling
Evaluate reflectivity as a function of offset at the top of the Stø and Snadd reservoir
intervals. Further classify these reservoir sands both at in-situ condition and when
they are oil and gas filled. The classification is based on Rutherford and William’s
classification scheme.
Quantitatively model different pore fluid saturations and fluid property effects on
synthetic NMO corrected CDP gathers and on angle dependent reflectivity.
Chapter 1.Introduction
6
Evaluate the relationship between elastic rock properties and AVO/ AVA response.
Evaluate the variability in cap rock properties and depth dependent AVO/ AVA
response.
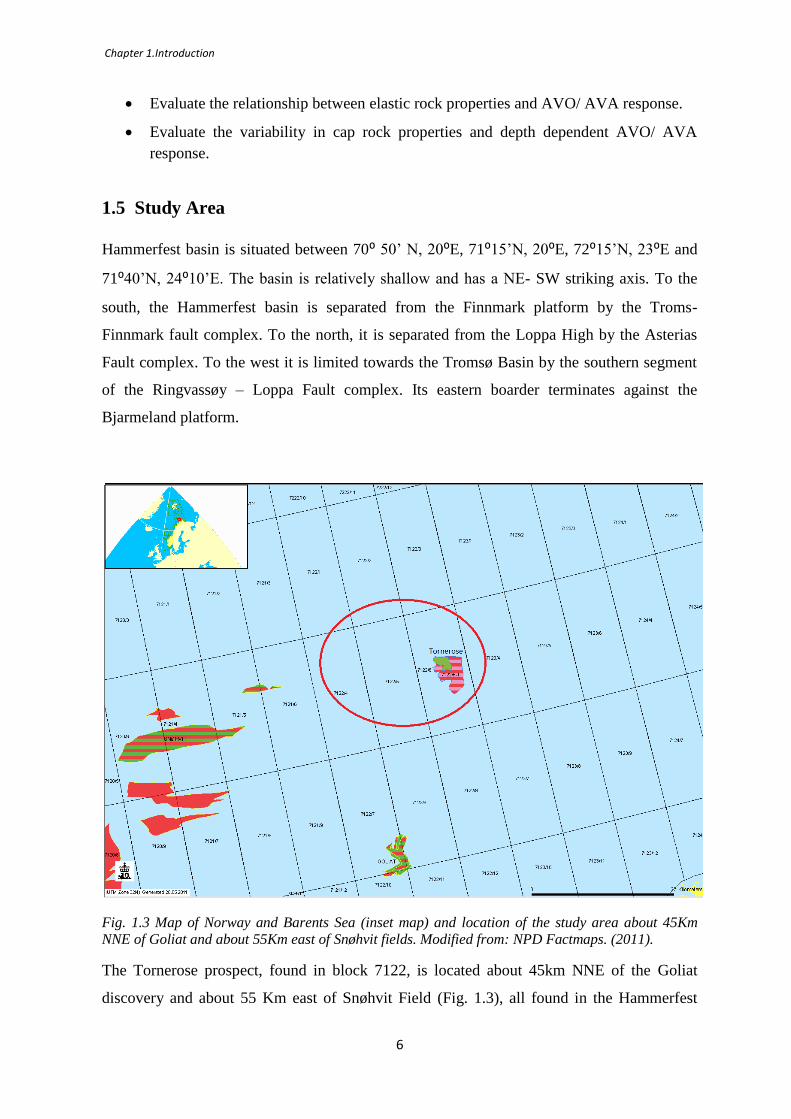
1.5 Study Area
Hammerfest basin is situated between 70⁰ 50’ N, 20⁰E, 71⁰15’N, 20⁰E, 72⁰15’N, 23⁰E and
71⁰40’N, 24⁰10’E. The basin is relatively shallow and has a NE- SW striking axis. To the
south, the Hammerfest basin is separated from the Finnmark platform by the Troms-
Finnmark fault complex. To the north, it is separated from the Loppa High by the Asterias
Fault complex. To the west it is limited towards the Tromsø Basin by the southern segment
of the Ringvassøy – Loppa Fault complex. Its eastern boarder terminates against the
Bjarmeland platform.
Fig. 1.3 Map of Norway and Barents Sea (inset map) and location of the study area about 45Km
NNE of Goliat and about 55Km east of Snøhvit fields. Modified from: NPD Factmaps. (2011).
The Tornerose prospect, found in block 7122, is located about 45km NNE of the Goliat
discovery and about 55 Km east of Snøhvit Field (Fig. 1.3), all found in the Hammerfest
Chapter 1.Introduction
7
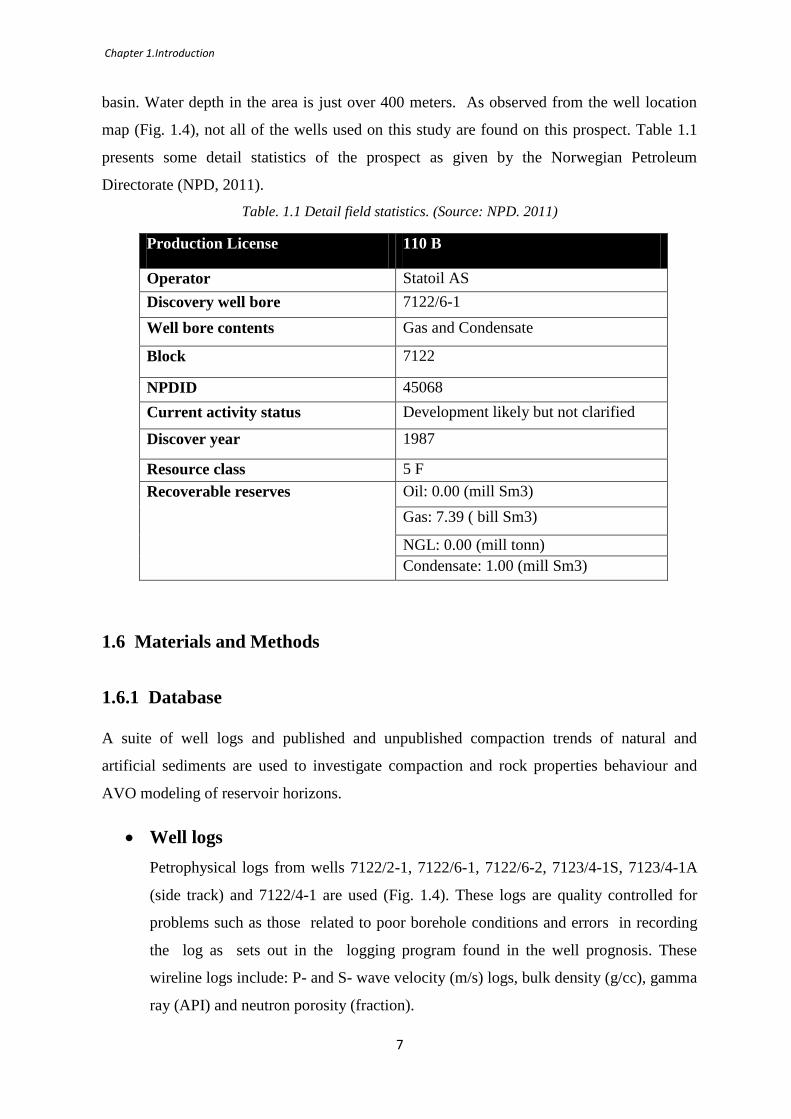
basin. Water depth in the area is just over 400 meters. As observed from the well location
map (Fig. 1.4), not all of the wells used on this study are found on this prospect. Table 1.1
presents some detail statistics of the prospect as given by the Norwegian Petroleum
Directorate (NPD, 2011).
Table. 1.1 Detail field statistics. (Source: NPD. 2011)
Production License 110 B
Operator Statoil AS
Discovery well bore 7122/6-1
Well bore contents Gas and Condensate
Block 7122
NPDID 45068
Current activity status Development likely but not clarified
Discover year 1987
Resource class 5 F
Recoverable reserves Oil: 0.00 (mill Sm3)
Gas: 7.39 ( bill Sm3)
NGL: 0.00 (mill tonn)
Condensate: 1.00 (mill Sm3)
1.6 Materials and Methods
1.6.1 Database
A suite of well logs and published and unpublished compaction trends of natural and
artificial sediments are used to investigate compaction and rock properties behaviour and
AVO modeling of reservoir horizons.
Well logs
Petrophysical logs from wells 7122/2-1, 7122/6-1, 7122/6-2, 7123/4-1S, 7123/4-1A
(side track) and 7122/4-1 are used (Fig. 1.4). These logs are quality controlled for
problems such as those related to poor borehole conditions and errors in recording
the log as sets out in the logging program found in the well prognosis. These
wireline logs include: P- and S- wave velocity (m/s) logs, bulk density (g/cc), gamma
ray (API) and neutron porosity (fraction).

Chapter 1.Introduction
8
Fig. 1.4 Well bore location map of the study area across the Tornerose prospect.
Wells 7122/2-1, 7122/6-1, 7122/6-2, 7123/4-1S, 7123/4-1A was drilled to prove the
presence of additional hydrocarbon reserves in the Tornerose prospect. However the
objective of well 7122/4-1 was to test the Åsgard prospect with the primary target being the
Middle – Lower Jurassic sandstones of the Stø Formation.
Published and Unpublished Experimental Compaction Curves of
Synthetic Samples
Mondol., (2011) ( Personal communication ): Vp/ Density/ Porosity versus stress/ depth
trend of a silt – clay. This data set is derived from an experimentally compacted mixture of
Kaolinite – Silt with a 50:50 percent proportion giving a credible mineralogical and textural
control such as the effects of grain size on effective packing, on the compacting sediment.

Chapter 1.Introduction
9
Mondol et al., (2007): Laboratory compaction trends of brine – saturated Kaolinite –
Smectite (80:20) and 100% Kaolinite mixtures. The synthetic mudstones are considered as a
non-uniform rock type having a specific clay mineralogical composition and grain size.
A constant conversion factor of 10 MPa vertical effective stress per kilometre of burial depth
is used to convert laboratory measurements of effective stress to its vertical depth
equivalents.
Marcussen et al., (2010): Velocity – depth trend obtained from sub-arkosic to quartzite
sandstones with moderate amounts of detrital clays from the Etive Formation in the Northern
North Sea.
Published Compaction Trends of Natural Sediments
The following published trends on naturally compacted sediments are also use for
comparative analysis:
Japsen (1999): linear velocity – depth trend as a function effective stress for marine shales
dominated by Smectite – illite and mainly sensitive to overpressures. Vp (m/s) is given by
the following equation:
(Eq. 1.1)
Where Z is the depth (m)
Storvoll et al., (2005): is a first order trend line representing a simplified linear velocity –
depth function obtained from velocity data representative of sediments from Loppa High,
Nordkapp, Hammerfest and Tromsø basins. It is expressed as:
(Eq. 1.2)
Where Z = Depth (m), Vp = P-wave velocity (m/s)
1.6.2 Software
The following applications within the Hampson – Russell software are used;

Chapter 1.Introduction
10
Geoview
It serves as a starting point of any Hampson – Russell program. Well log data are loaded into
Geoview well database through the Well Explorer. This application basically used for two
purposes:
(1) It acts as a well log database which can be accessed seamlessly by all other Hampson –
Russell applications that use well logs for analysis. Here, well logs are displayed, check shot
correction are made, synthetics are generated, wireline logs are also edited and manipulated
in Geoview through the elog application. Stratigraphic sections across sections across
multiple wells using a specific log type are equally done in Geoview.
(2) Secondly, it serves as a platform from which other Hampson – Russell applications
relevant to this study such as Elog and AVO can be launched and are automatically
connected to created well log database.
Elog
A well log editing and modeling tool embedded within the Hampson-Russel software suite
of applications. It is started from Geoview and used to edit and average logs. Cross plots are
also made here and zones of interest defined on the cross plots that can be projected back
onto the input logs to visualize its equivalent depth. Necessary log transforms are also done
using elog to create different non-existent logs from several empirical relationships with
other input logs.
AVO
It is also launched from Geoview. This application is made up of two components: AVO
modeling and AVO analysis. AVO modeling has the log editing and manipulating
capabilities as elog. This a comprehensive modeling tool used to analyze pre – stack seismic
data for evaluating AVO anomalies with input data such as a combination of different log
types and synthetic NMO (Normal Move Out) corrected CDP (Common Depth Point)
gathers. The pore fluid contents of both the Stø and Snadd reservoir sands are also evaluated
through a combination of visual, analytical and modeling processes. Fluid replacement
modeling (FRM) based on the Biot – Gassmann equations are also done using this
application.

Chapter 1.Introduction
11
1.6.3 Methods
An introduction to different approaches to achieving the objectives of this research is
presented in two folds. However, a more detail methodology with respect to each of the
major targets is clearly outlined within each chapter.
Compaction and Evolution of Rock Properties
A combination of techniques will be employed on entire well data to precisely evaluate how
dynamic rock properties vary across the field by determining the main compaction
mechanisms responsible for these changes with increasing burial depth. With this regard, all
the available well data will be analyzed on individual basis. These wireline logs will also be
cross plotted to further study some of the major controls on these compaction mechanisms.
The entire dataset will be corrected for Cenozoic exhumation and experimental synthetic
mudstone compaction curves will then be used to constrain the natural samples.
AVO (Amplitude versus Offset) Modeling
Reflectivity as a function of offset/ angle will be evaluated at the top of the two main
reservoir horizons. A wavelet is a key component in modeling. A zero phase Ricker wavelet
is used to create and analyze pre-stack synthetics. Generating NMO corrected synthetics is
based on the Zoeppritz equations. The main input log types used are upscaled density, P- and
S-wave velocity. That is, changes in reservoir pore fluid properties and saturations are
modeled. However the AVO modeling is first performed to determine what type of AVO
anomaly may be anticipated then a suite of different pore fluid scenarios is also modeled.
The effects of these pore fluids and their saturations on AVO response is then investigated
through a sensitivity analysis. The implications of cap rock geology, depth and lithology are
also investigated.

Chapter 2. Regional Geological Framework
12
CHAPTER 2: REGIONAL GEOLOGICAL FRAMEWORK
2.1 Structure and Tectonics
The Barents Sea region has an intracratonic setting with a complex mosaic of basins and
platforms. It has undergone several phases of tectonic deformation since the Caledonian
Orogenic movements ended in Early Devonian times (Gabrielsen et al., 1990). Structurally,
the Barents Sea continental shelf is dominated by NE - SW trending faults, with a few WNW
– ESE striking faults. In the southern parts, a zone dominated by ENE- WSW trends is
defined by the major fault complexes bordering the Hammerfest and Nordkapp Basin
(Fig. 2.1). The western parts of the Barents Sea have been the tectonically most active region
throughout the Cenozoic and Mesozoic times (Gabrielsen et al., 1990).
Fig. 2.1 Tectonic framework of the entire Barents Sea region. Source: Gabrielsen et al. (1990).
Chapter 2. Regional Geological Framework
13
The Barents Sea is divided into three main geological provinces bounded by major fault
zones; based on sedimentary infill, structural style and crustal structure (Gabrielsen et al.,
1990). These are; (1) the oceanic Lofoten Basin formed during the opening of the
Norwegian- Greenland sea and the Vestbakken Volcanic Provinces in the west; (2) the
south-western Barents Sea basin province which is made up of deep Cretaceous and early
Tertiary basins such as Harstad, Tromsø, Bjørnøya and Sorvestsnaget Basins; and (3) the
eastern region made up of Mesozoic Basins and Highs which remained relatively inactive
during the Cretaceous – Tertiary subsidence; these are: Finnmark Platform, Hammerfest
Basin, Loppa High and Fingerdjupet subbasin.(Faleide et al., 1993)
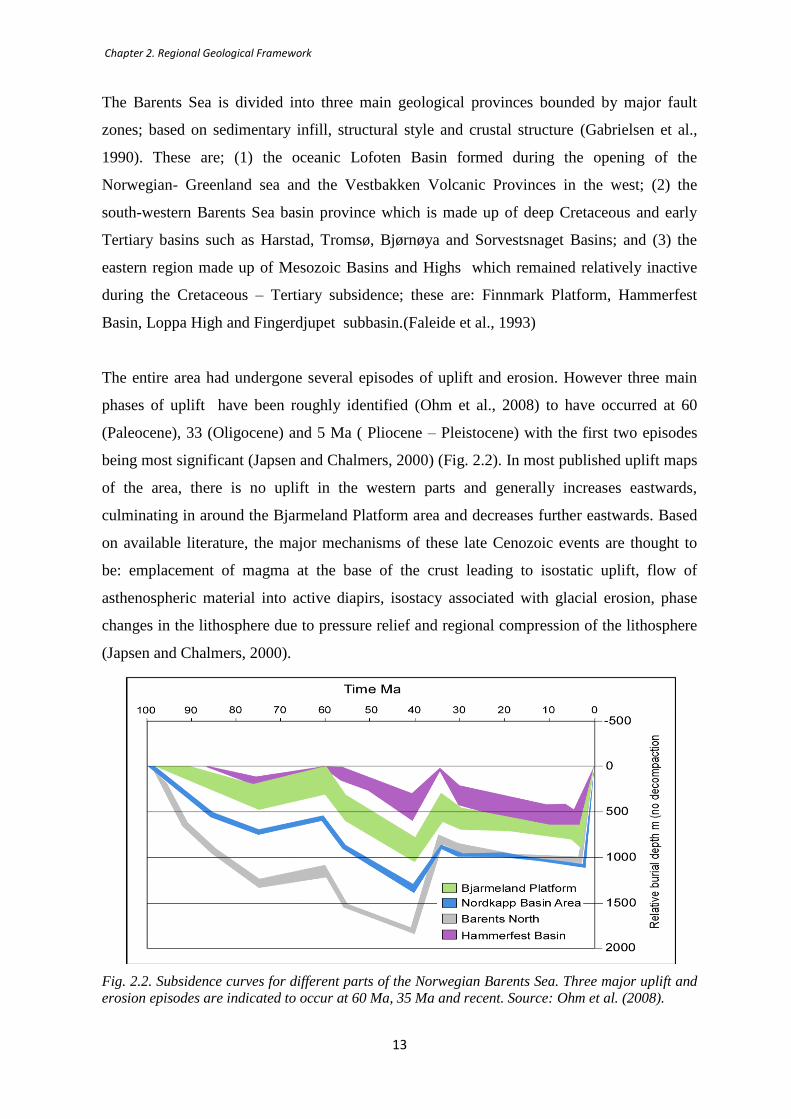
The entire area had undergone several episodes of uplift and erosion. However three main
phases of uplift have been roughly identified (Ohm et al., 2008) to have occurred at 60
(Paleocene), 33 (Oligocene) and 5 Ma ( Pliocene – Pleistocene) with the first two episodes
being most significant (Japsen and Chalmers, 2000) (Fig. 2.2). In most published uplift maps
of the area, there is no uplift in the western parts and generally increases eastwards,
culminating in around the Bjarmeland Platform area and decreases further eastwards. Based
on available literature, the major mechanisms of these late Cenozoic events are thought to
be: emplacement of magma at the base of the crust leading to isostatic uplift, flow of
asthenospheric material into active diapirs, isostacy associated with glacial erosion, phase
changes in the lithosphere due to pressure relief and regional compression of the lithosphere
(Japsen and Chalmers, 2000).
Fig. 2.2. Subsidence curves for different parts of the Norwegian Barents Sea. Three major uplift and
erosion episodes are indicated to occur at 60 Ma, 35 Ma and recent. Source: Ohm et al. (2008).

Chapter 2. Regional Geological Framework
14
2.2 Stratigraphy
A total of six wells were drilled across the study area and the deepest one is 7122/6-2 with a
depth of about 2639m below sea floor (BSF) (Table 2.1). The oldest penetrated formation is
the kobbe Formation of mid Triassic age (Fig. 2.3).
Table 2.1. Stratigraphic statistics of five wells across the study area. Source: (NPD, 2011)
Well bore Total Depth (m)
BSF
Oldest penetrated
Formation
Age
7123/4-1A 2419 Snadd FM Late Triassic
7122/6-1 2283 Snadd FM Middle Triassic
7122/6-2 2639 Kobbe FM Middle Triassic
7122/4-1 2647 Snadd FM Late Triassic
7122/2-1 1734 Stø FM Middle Jurassic
The main sources of sediment input in the area appeared to be the Baltic Shield in the South,
the Uralides and Novaya Zemlya to the east (Mørk, 1999). The following Groups are
encountered in the area: the Kapp Toscana, Adventdalen, Nygrunnen, Sotbakken and
Nordland Groups (Fig. 2.3).
2.2.1 Nordland Group
Only the youngest parts of the group are encountered in this area and across most parts of the
Hammerfest Basin. Sands and clays grade into sandstones and claystones. The sand content
increases upward. The group has the sea bed as the upper boundary. The sediments are of
Late Pliocene to Pleistocene/ Holocene. Depositional environment is characterized by
bathyal to glacial marine (Dallan et al., 1988).
2.2.2 Sotbakken Group
The Torsk Formation represents the only recognizable subdivision within this group. The
entire group shows a general increase in thickness from the southern margins of the
Hammerfest Basin to the south west across the study area. The group is dominated by
claystones, minor siltstones, tuffaceous and carbonate horizons. The younger sequences of
the group are less preserved due to erosion resulting from Mid Oligocene tectonic activity.
Preserved sequences suggest a Late Paleocene to Early / Mid Eocene age.

Chapter 2. Regional Geological Framework
15
(Dallan et al., 1988). The claystones were deposited in an outer sub littoral to deep shelf
environment following a regional transgression across the Barents Shelf.
Fig. 2.3 Schematic illustration of Barents Shelf and Spitsbergen lithostratigraphic column.
Formation definition is by Worsley et al.(1988). Source: Bugge et al. (2002)
2.2.3 Nygrunnen Group
Two subdivisions of this group are the Kviting and Kveite Formations. The age of the group
spans from Cenomanian to Maastrichtian. Lithologically, they consist of grey claystones
with thin limestones intervals. The entire sequence thins eastward across the Hammerfest
Basin where condensed calcareous sandy units reveal intermittent deposition principally
Chapter 2. Regional Geological Framework
16
during times of maximum transgression.(Worsley, 2008).The claystones are generally
attributed to the Kveite Formation while the condensed sequences to the Kviting Formation.
2.2.4 Adventdalen Group
This comprises; shales, siltstones and sandstones as well as condensed carbonate beds of late
Jurassic to Early Cretaceous period. During the Late Cretaceous uplift, this group was
eroded to varying extents leading to a hiatus comprising only the Cenomanian and Turonian.
Subdivisions include the Hekkingen, Knurr, Kolje, kolmule, and Fuglen Formations.
Regional transgressions led to cut-off of coarser clastic supply and favoured the deposition
of fine grain deep marine black paper shales of the Hekkingen Formation. They represent
excellent source rocks for oil and gas in the area with a total organic content of about 20%
(Worsley, 2008). The sandstones represent deltaic progradation and shelf environments
whereas the coeval condensed limestone interval grades into marls and calcareous
mudstones.
2.2.5 Kapp Toscana Group
This Group spans from the Ladinian to Bathonian age. The Stø and Snadd Formations
belong to this Group. Other subdivisions are Tubåen, Nordmela, and Fruholmen Formations.
These comprise of shales and siltstones and grades upward to the immature sandstones of the
Storfjorden subgroup (Dallmann., W. K (1999).
The Kapp Toscana Group has been deposited in a generally near shore deltaic environment.
Is it characterised by coastal and marine reworking (Mørk et al., 1982).
These channel and coastal sands were transported from mature provenance areas and their
primary reservoir qualities were enhanced during reworking over periods of high stand. The
Novaya Zemlya was a significant provenance area (Worsley, 2008). However it was
observed that sandstones throughout the region show a convergence of lithologies upward in
the sequence, probably reflecting increasing marine reworking and mixing of sediments
from multiple provenance area (Riis et al., 2008, Mørk, 1999).Triassic sedimentation was
characterised by transgressive\ regressive sequences that were regionally synchronous.
Nonetheless, increasing tectonic activity led to a disruption of these sequences
(Smelror et al., 2001).
Chapter 2. Regional Geological Framework
17
2.3 Petroleum System
A petroleum system describes an orderly sequence (Perrodon, 1992), of natural genetic
interplay between a pod of active source rock(s) and all the related oil and gas
accumulations. This encompasses all the required elements and processes necessary for
existence of these accumulations (Peters and Casa., 1994). The required elements are an
active source rock, a reservoir rock, adequate seal (cap rock) and an overburden rock. The
processes are summarized as; trap formation, generation of petroleum from kerogen found in
organic matter within the source rock(s), subsequent migration along defined pathways and
eventual accumulation in a reservoir rock. Petroleum can be re-migrated and accumulated in
a reservoir rock that was deposited after accumulation in a previous system practically due to
the singular or combined effects of folding, faulting, uplift and erosion. However the critical
moment will define the highest probability of entrapment and preservation of petroleum after
generation and migration. A play can thus be defined as a group of prospects (potential field
sites) and any known related fields having common petroleum sources, migration
relationships, reservoir Formations, seals and trap types (White, 1993). According to this
definition, in the absence of generated petroleum, there is no prospect.
2.3.1 Source Rocks
The Barents Sea has multiple source rocks, however that which is of particular interest is the
Hekkingen Formation of the Adventdalen Group. The Hekkingen Formation is an effective
source rock by virtue of its generation and expulsion of petroleum. It is often considered as
an equivalent of the Kimmeridge shales in the North Sea. The Hekkingen Formation has a
dual – member division consisting of the Lower Alge and the upper Krill member. The Alge
member shows extremely high gamma ray values in all five wells and consist of black paper
shales in an organic rich material (Fig. 2.4).
The regional Hekkingen Formation with a high Total Organic Content ( TOC) of 10 to 15%
and high Hydrogen Index of 280 to 350 mg HC/g (NPD Factpage. 2011), imply a very good
source rock. The organic matter is of mixed terestrial and marine origin with kerogen type II
and III (Ohm et al., 2008). This variation in kerogen type probably inidcates distance to the
paleocoastline and terrigeneous inputs coupled with variations in anoxia in the early
diagenetic environment (Ohm et al., 2008).

Chapter 2. Regional Geological Framework
18
Fig. 2.4. Core photograph of the Hekkingen Formation from well 7228/9-1S. Source: NPD Factpage
(2011).
Vitrinite reflectance (Ro ) of 0.6% and Tmax of 435⁰ C (NPD Factpage. 2011) indicates that
the well 7123/4-1A probably just enters the oil window at around 1650m BSF, around
where the best source rocks are found. However, these organic rich shales have not attained
their full hydrocarbon genereation potential due to maturity problems resulting from the
negetive consiquences of uplift (Ohm et al., 2008).
The presence of oil and gas shows in some of the wells is a good indication of an active
source rock. The occurance of multiple active source rock intervals (Fig. 2.5) from the
Triassic to Upper Jurassic with hydrocarbon generation having occured over long geologic
time scale has led to the Barents Sea area being described as an overfilled petroleum
system (Ohm et al., 2008) however the effects of uplift changes the story.

Chapter 2. Regional Geological Framework
19
Fig. 2.5. Tentative maturity map depicting oil maturity distribution of Permian, Triassic and Jurassic
source rocks. This map is based on maturity data from wells in the area, semi-regional maturity
trends of vitrinite reflectance (Ro) versus depth. . The study area is highlighted by the solid red circle
showing the occurrence of multiple source rock. Modified after: Ohm et al., (2008).
2.3.2 Studied Reservoir Units
The principal reservoirs of the field lie in the Stø Formation, which is of Pleinsbachian to
Bajocian stage and the much older Snadd formation, of Ladinian to Early Norian Stage. Both
reservoir units are part of the Kapp Toscana Group.
2.3.2.1 Stø Reservoir
This represents the upper/ shallower reservoir unit of the field. It was penetrated in all six
studied wells. A maximum thickness of about 59m was reached in the well 7122/4-1 at a
depth of about 2326m along the Hammerfest basin axis and generally thins out towards the
east with thicknesses of 40m in well 7123/4-1A and 23m in well 7122/6-1. An apparently
diachronous base is observed younging from east to west across the Hammerfest basin
(Dallan et al., 1988).

Chapter 2. Regional Geological Framework
20
Fig. 2.6 Wireline log character across the Stø Reservoir from well 7123/4-1A. P-wave, S-wave,
Neutron porosity, water saturation, resistivity and gamma ray logs respectively. Different
depositional facies are clearly identified using the gamma ray log.
The early basal sequence is only present in the western region of the Hammerfest basin. The
mid to late sequence represents a maximum transgressive pulse in the area. The upper-most
Bajocian sequence is variable due to syn-depositional uplift and differential erosion
(Dallan et al., 1988).
The Stø Formation consists dominantly of moderately to well-sorted mineralogically mature
sandstones (Fig. 2.7). The porosity and permeability in these sandstones ranges between
19 – 35% and 30 – 3000 mD respectively (NPD Fact page 2011). The entire unit can be
subdivided into three depositional sequences with each base defined by transgressive
episodes (Fig. 2.6).
Sands of the Stø Formation were deposited in a prograding coastal environment. The
depositional environment is interpreted as such on the basis of palynomorphs and trace
fossils, with deposition just below the fair weather wave base in a lower shoreface to
offshore transition zone (Smelror et al., 2001). Primary sedimentary structures such as
current ripple lamination, trough cross beddings and horizontal lamination are common
(Fig. 2.7).

Chapter 2. Regional Geological Framework
21
Fig. 2.7 Core photograph obtained around the top of Stø reservoir sandstones from well 7122/6-1
with a core start depth of 1595m BSF and end depth of 1599 m BSF. These sands are quite prolific
with excellent reservoir qualities. Source: NPD Factpage (2011).
2.3.2.2 Snadd Reservoir
This represents the deeper reservoir unit. It was penetrated by all studied wells except in the
well 7122/2-1. A Ladinian to Early Norian age is suggested (Dallan et al., 1988, Bugge et al.
2002). The considered sandstone unit for this study is found at the very top of the Formation
and is water wet (Fig. 2.8).
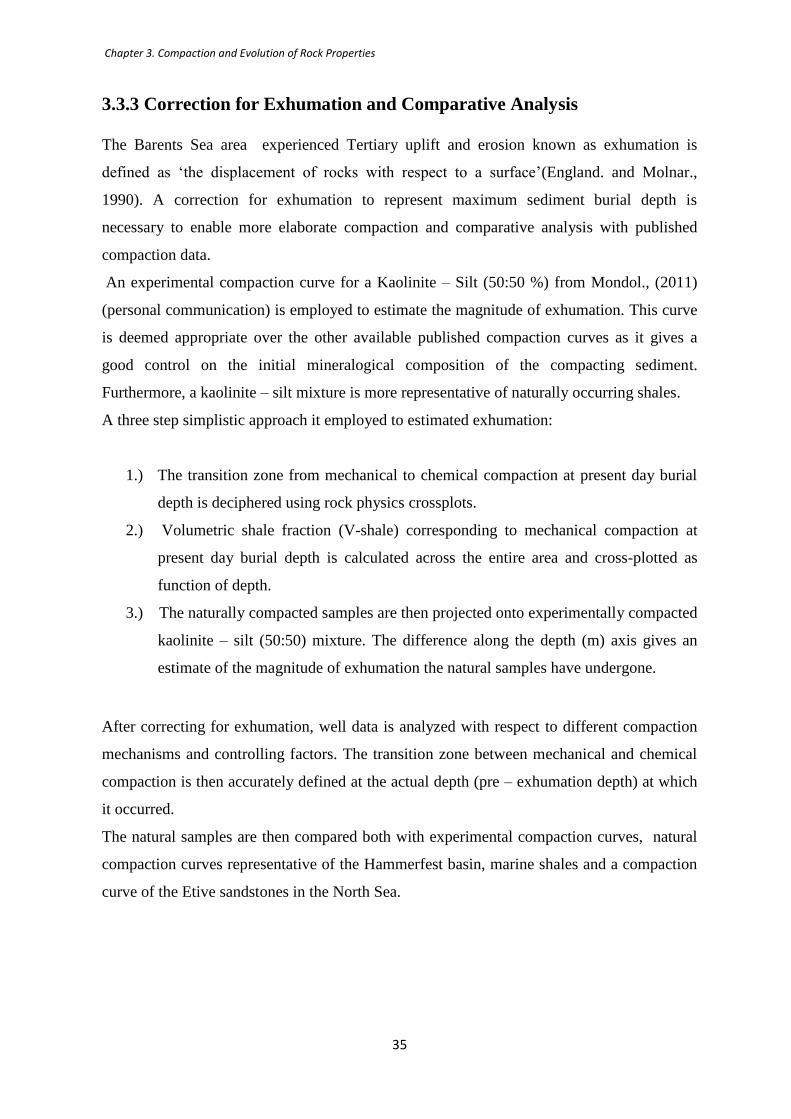
The Snadd Formation consists of basal grey shales which coarsen up to shales with inter-
beds of grey siltstones and sandstones at the top of the formation with laminations and
hummocky bedding in the fine grained turbiditic sandstones (Fig. 2.9) (Bugge et al. 2002).
Sparse but upward increasing bioturbation in both sequences as well as trace fossils are
indicative of open marine environments (Dallan et al., 1988). This is a result of a major
transgressive period which submerged most of the Structural Highs and Platforms in the
area. Storm derived silts and sands from southern sources such as the Baltic shield are
indicated. On the other hand the Carnian sequence represents large scale progradation of
deltaic systems over the entire Hammerfest basin given by the motif of two upward
coarsening sequences (Riis et al., 2008). This Formation distinguishes itself from overlying
Formations in terms of palaeogeographic controls on sedimentation patterns, probably
reflecting up doming of the northern shelf margins (Dallan et al., 1988)
Chapter 2. Regional Geological Framework
22
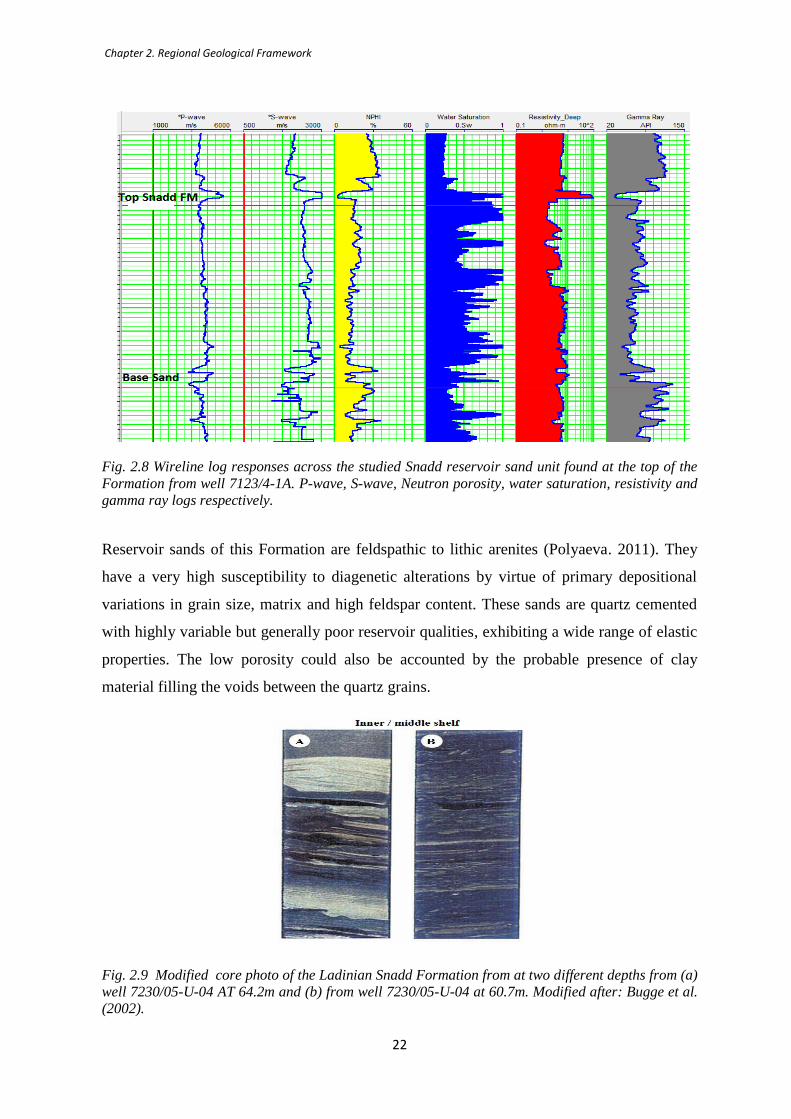
Fig. 2.8 Wireline log responses across the studied Snadd reservoir sand unit found at the top of the
Formation from well 7123/4-1A. P-wave, S-wave, Neutron porosity, water saturation, resistivity and
gamma ray logs respectively.
Reservoir sands of this Formation are feldspathic to lithic arenites (Polyaeva. 2011). They
have a very high susceptibility to diagenetic alterations by virtue of primary depositional
variations in grain size, matrix and high feldspar content. These sands are quartz cemented
with highly variable but generally poor reservoir qualities, exhibiting a wide range of elastic
properties. The low porosity could also be accounted by the probable presence of clay
material filling the voids between the quartz grains.
Fig. 2.9 Modified core photo of the Ladinian Snadd Formation from at two different depths from (a)
well 7230/05-U-04 AT 64.2m and (b) from well 7230/05-U-04 at 60.7m. Modified after: Bugge et al.
(2002).

Chapter 2. Regional Geological Framework
23
2.3.3 Trap
Not all well bores used in this study penetrates the Tornerose prospect (Fig. 2.10) though all
of them encountered both the Stø and Snadd reservoir units at different locations and depth
across the field. The Tornerose prospect is found on one of the relatively positive elements
along the Hammerfest basin. This structure is a southward dipping rotated fault block
forming a structural closure with the north-eastern side delineated by a major NW-SE
striking fault (Fig. 2.10). Hence the trap mechanism can be characterised as a structural trap
with a throw of about 280m estimated from displaced Formation tops between the wells
7122/4-1 and the well 7122/6-1. On the Åsgard prospect, the trap was formed by a large
tilted horst structure dipping towards the North – Northwest. Well 7122/4 – 1 was the first
well on prospect. The Stø reservoir is however water wet throughout the study area, across
different faulted segments, thereby casting doubt on the sealing capacity of the faults at this
depth level.
Fig. 2.10 Structural map of the study area illustrating the trap style of the Tornerose prospect on the
rotated fault block. Source: NPD Factmaps., (2011).

Chapter 3. Compaction and Evolution of Rock Properties
24
CHAPTER 3: COMPACTION AND EVOLUTION OF ROCK
PROPERTIES
3.1 Introduction
Sedimentary rocks continuously undergo physical and chemical changes as a function of
burial depth, temperature and geologic time (low strain rates), also important hydro-
mechanical parameters change during burial, erosion and uplift (Bjørlykke et al., 2004,
Walderhaug et al., 2001). In a well defined sediment composition, the velocity and density
increase with depth (decreasing porosity) in response to compaction processes. Compaction
in sedimentary basins involves both mechanical and chemical compaction (Fig. 3.1).
Fig. 3.1 Principal aspects of sediment compaction. With increasing burial depth, sediments are
subjected to changes in physical properties as a function of increasing stress and temperature.
Source: Bjørlykke (1998).
In some basins the transition from mechanical compaction domain to chemical compaction
domain can be gradual while in others it is more or less distinct (Fig. 3.2). Both domains are
fundamentally controlled by well defined compaction laws (Bjørkum et al., 1998, Bjørlykke

Chapter 3. Compaction and Evolution of Rock Properties
25
et al., 1989). Compaction will therefore ultimately lead to a more stable grain frame work
and a significant change in elastic properties.
Mechanical compaction follows a sequential processes (Waples and Couples, 1998) which
can broadly be separated into four steps: (a) applied load (sedimentation) to a system of
sediments and pores, (b) deformation of grain framework and slight porosity reduction (c)
increase in pore pressure due to reduction of pore space (d) slightly overpressured pore
fluids flow to sites of lower potential energy (if possible). The changes in rock properties as
a function of increasing burial depth are largely due to several diagenetic processes which
are very much dependent on the primary sediment composition which reflects the textural
and mineralogical composition pertaining to a particular sedimentary environment
(Bjørlykke et al., 2004).
Fig. 3.2 Sonic velocity measurements (every 0.5 – 0.7m with depth) from seventeen wells located in
the western region in of the Haltenbanken area- Norwegian North Sea after Storvoll et al. (2005).
The estimated trend line (dashed blue line) will be used for comparism with well data from this study
area
This chapter focuses on determining the different compaction mechanisms and the transition
between the different compaction domains. The major controlling parameters within each of
these domains will also be investigated as well as accurately defining good reservoir
intervals. Given the burial history of the area, the sediments will be corrected for Cenozoic
exhumation after which the experimental and published compaction curves will be used to
constrain sediment compaction in the area.

Chapter 3. Compaction and Evolution of Rock Properties
26
3.2 Theoretical Background
3.2.1 Mechanical Compaction
Mechanical compaction starts immediately after deposition and is mainly a function of the
vertical effective stress resulting in an increased stress at grain contacts and thus increased
rigidity. It predominates at shallow depth down to 2 – 4 Km depending on the geothermal
gradient of the area (Mondol et al., 2007) and involves rearrangement of the grain
framework by sliding, orientation and grain breakage. The weight of the sediments making
up the overburden including the weight of the fluids in the pore spaces produces a vertical
stress. For a given sedimentary basin with minimal lateral lithologic variations, the total
vertical stress (lithostatic stress) can be calculated as follows:
(Eq. 3.1)
Where: σv is the total vertical stress, ρs is the average bulk density of overburden sediments,
g is the gravitational force and h is thickness of the overburden sediments.
The effective vertical stress, denoted σv′, plays a very critical role in mechanical compaction
of sediments with minimal chemical compaction. It is also known as average inter-granular
stress by virtue of the fact that it is transmitted through the grain framework. Effective stress
is the difference between the total vertical stress and the pore pressure and it increases
linearly with depth (under hydrostatic pore pressure conditions):
(Eq. 3.2)
Where: σv′ is effective vertical stress, σv is total vertical stress and u is the pore pressure.
The effective vertical stress from the overburden is borne both by the pore pressure (fluid
phase) and mineral grain frame work (solid phase) (Fig. 3.3). An increase in the pore
pressures definitely reduces the vertical effective stress and hence mechanical compaction.

Chapter 3. Compaction and Evolution of Rock Properties
27
Fig. 3.3. Schematic illustration of the contributions of overburden stress, stress at grain contacts
and pore pressure to mechanical compaction.
However, in a sedimentary basin with minimal or no lateral compression, horizontal stresses
would be less than or equal to vertical stresses (Osborne and Swarbrick, 1999). As a result,
lateral compression is liable to yield high pore pressures in thesame manner as vertical stress
can cause overpressuring due to under-compaction.
Other controls on mechanical compaction are the mineralogical composition, grain size and
the rate of fluid expulsion from the compacting sediments (Waples and Couples, 1998,
Bjørlykke et al., 2004) (Fig. 3.4). The extent of mechanical compaction is important because,
as well as increasing the mechanical stability of the sediments, it determines the inter-
granular volume (IGV) which is the porosity at the onset of chemical compaction (Bjørlykke
and Jahren. 2010).
Fig. 3.4. Experimental mechanical compaction of brine-saturated kaolinite aggregates, sorted by
grain size after Mondol et al. (2008a). Samples containing less than 2µm sized kaolinite aggregates
retained higher porosity compared to all other mixtures. The maximum porosity reduction is
observed in the composite mixtures containing all grain sizes, demonstrating the importance of
grain size and sorting in determining rock properties.

Chapter 3. Compaction and Evolution of Rock Properties
28
3.2.2 Chemical Compaction
Chemical compaction usually occurs at deeper parts of sedimentary basins beyond the realm
of mechanical compaction, where the reaction kinetics for clay and silicate minerals are
extremely slow and therefore often negligible. In carbonate rocks, an important factor
controlling compaction is rather the primary content and distribution of aragonite, causing
early cementation at shallow depths and low temperature through complex interactions
between stress and thermodynamics (Bjørlykke and Jahren., 2010)
In siliciclastic sediments, the solubility of silica seems to be dependent on the degree of
entropy in the crystal lattice. At approximately 25⁰C (shallow depths), the solubility of
quartz is 3 – 6 ppm, cristobalite and tridymite (Opal CT) is 6 – 15 ppm and amorphous silica
(Opal A) is 150 ppm. Comparatively, silica has a low solubility and solubility gradient.
When Opal A and Opal CT dissolve, pore water becomes supersaturated with respect to
quartz and starts to crystallize at several nuclei forming authigenic quartz (with a much
darker coloration reflecting its biogenic origin) (Bjørlykke and Jahren., 2010)
Chemical compaction involves a further modification of rock properties by dissolution of
primary clastic minerals (or amorphous) material which is in disequilibrium and the
precipitation of thermodynamically more stable mineral assemblages. These processes
prevail at higher temperatures > 70⁰C – 80 ⁰C, in a normally compacted basin (no
overpressure) with a geothermal gradient of 35 – 40⁰C/Km ,which generally corresponds to
depth of about 2.0 - 2.5 Km overburden (Mondol et al., 2007) and 20 – 25 MPa vertical
effective stress. The rate of thermodynamic equilibrium is determined by the kinetics of
mineral reaction which increases as an exponential function of temperature. As such, time,
temperature, detrital mineralogy and texture constitute the major controls on chemical
compaction (Bjørkum et al., 1998, Lander and Walderhaug, 1999, Murphy et al., 1989).
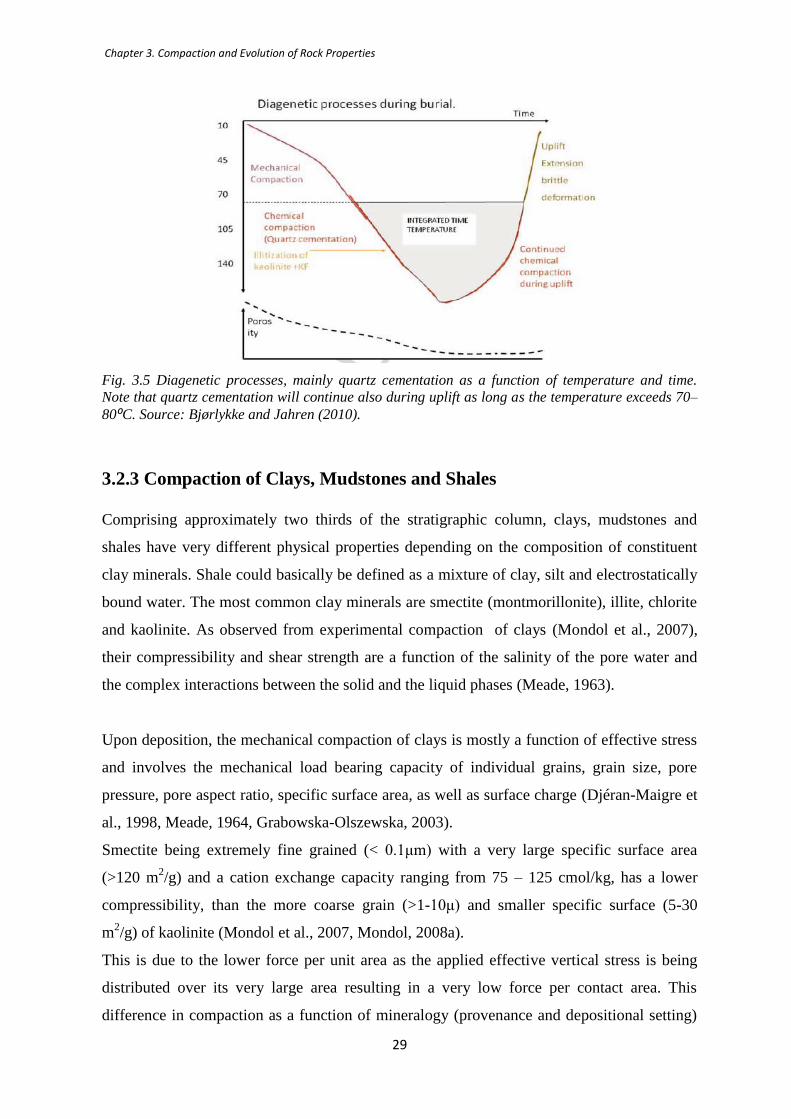
Chemical compaction will continue even during basin inversion so long as the temperature
remains above the maximum threshold for mechanical compaction (Bjørlykke and Jahren.,
2010) as illustrated by Figure 3.5.
Chapter 3. Compaction and Evolution of Rock Properties
29
Fig. 3.5 Diagenetic processes, mainly quartz cementation as a function of temperature and time.
Note that quartz cementation will continue also during uplift as long as the temperature exceeds 70–
80⁰C. Source: Bjørlykke and Jahren (2010).
3.2.3 Compaction of Clays, Mudstones and Shales
Comprising approximately two thirds of the stratigraphic column, clays, mudstones and
shales have very different physical properties depending on the composition of constituent
clay minerals. Shale could basically be defined as a mixture of clay, silt and electrostatically
bound water. The most common clay minerals are smectite (montmorillonite), illite, chlorite
and kaolinite. As observed from experimental compaction of clays (Mondol et al., 2007),
their compressibility and shear strength are a function of the salinity of the pore water and
the complex interactions between the solid and the liquid phases (Meade, 1963).
Upon deposition, the mechanical compaction of clays is mostly a function of effective stress
and involves the mechanical load bearing capacity of individual grains, grain size, pore
pressure, pore aspect ratio, specific surface area, as well as surface charge (Djéran-Maigre et
al., 1998, Meade, 1964, Grabowska-Olszewska, 2003).
Smectite being extremely fine grained (< 0.1μm) with a very large specific surface area
(>120 m2/g) and a cation exchange capacity ranging from 75 – 125 cmol/kg, has a lower
compressibility, than the more coarse grain (>1-10μ) and smaller specific surface (5-30
m2/g) of kaolinite (Mondol et al., 2007, Mondol, 2008a).
This is due to the lower force per unit area as the applied effective vertical stress is being
distributed over its very large area resulting in a very low force per contact area. This
difference in compaction as a function of mineralogy (provenance and depositional setting)
Chapter 3. Compaction and Evolution of Rock Properties
30
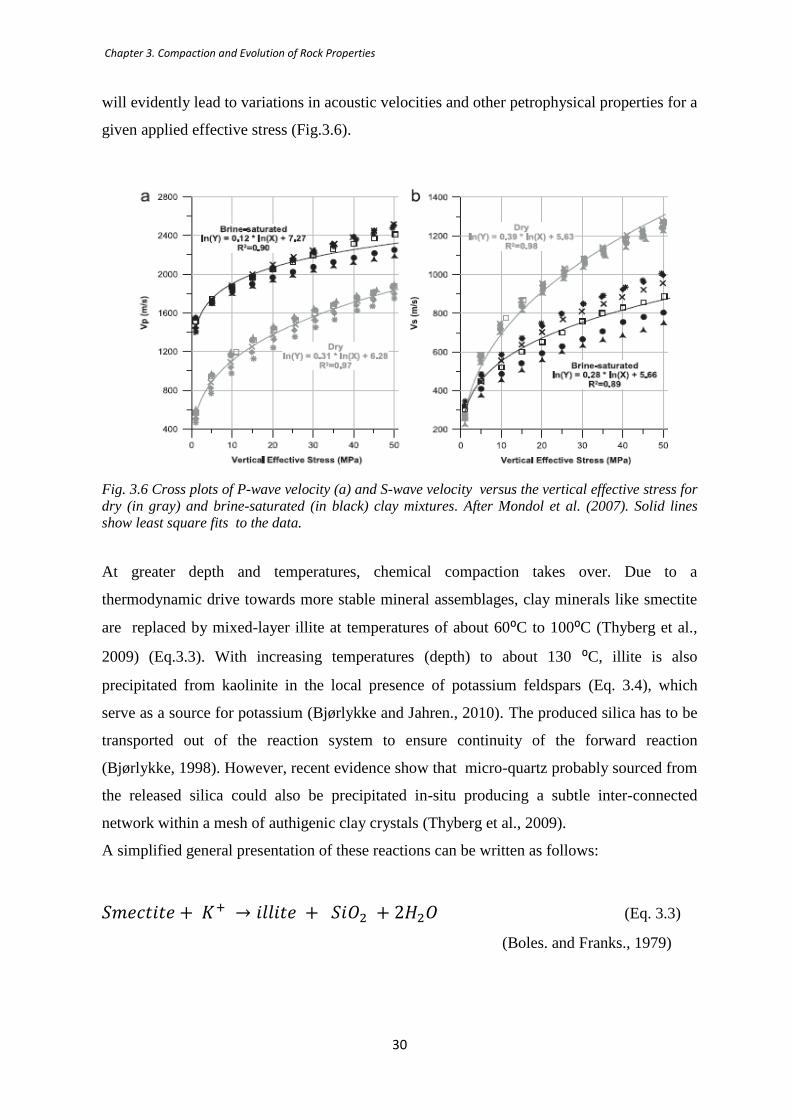
will evidently lead to variations in acoustic velocities and other petrophysical properties for a
given applied effective stress (Fig.3.6).
Fig. 3.6 Cross plots of P-wave velocity (a) and S-wave velocity versus the vertical effective stress for
dry (in gray) and brine-saturated (in black) clay mixtures. After Mondol et al. (2007). Solid lines
show least square fits to the data.
At greater depth and temperatures, chemical compaction takes over. Due to a
thermodynamic drive towards more stable mineral assemblages, clay minerals like smectite
are replaced by mixed-layer illite at temperatures of about 60⁰C to 100⁰C (Thyberg et al.,
2009) (Eq.3.3). With increasing temperatures (depth) to about 130 ⁰C, illite is also
precipitated from kaolinite in the local presence of potassium feldspars (Eq. 3.4), which
serve as a source for potassium (Bjørlykke and Jahren., 2010). The produced silica has to be
transported out of the reaction system to ensure continuity of the forward reaction
(Bjørlykke, 1998). However, recent evidence show that micro-quartz probably sourced from
the released silica could also be precipitated in-situ producing a subtle inter-connected
network within a mesh of authigenic clay crystals (Thyberg et al., 2009).
A simplified general presentation of these reactions can be written as follows:
(Eq. 3.3)
(Boles. and Franks., 1979)

Chapter 3. Compaction and Evolution of Rock Properties
31
K-feldspar Kaolinite Illite Quartz (Eq. 3.4)
(Bjørlykke, 1995)
Fig. 3.7. Formation of (A) authigenic micro quartz (mQtz) cement in mudstones from Northern
North Sea. Source: (Thyberg et al., 2009). (B) pore filling illite formed either by alteration
(dissolution and precipitation) of smectite and/ or from kaolinite and K-feldspars (Bjørlykke, 1995).
Break-down of the feldspar grains (Eq. 3.3 and Eq. 3.4) may lead to further compaction of
the grain frame work. The grain frame work is also stiffened due to the precipitation of silica
released during the above reaction. The released crystalline water will reduce the salinity of
pore water (Abercrombie et al., 1994), leading to a decrease in the electrolytic conductivity
and a slight increase in resistivity. However the resistivity generally decreases from the
release of crystal bound water.
The transformation from mudstones to shales involves not only an increase in stiffness,
acoustic velocity but also marked increase in anisotropy due the preferred orientation of clay
minerals. Several authors, (Ho et al., 1999, Bjørlykke, 1998, Fawad et al., 2010) have
proposed a link between smectite illitization and the development of preferred clay mineral
orientation in mudstones. Based on experimental observations of naturally compacted
samples and synthetic mixtures (Fawad et al., 2010, Mondol et al., 2007), P- and S-wave
velocities gradually increase with increasing clay content.
High velocities could also be observed at shallow depths due to early cementation from
biogenic carbonates and silica.

Chapter 3. Compaction and Evolution of Rock Properties
32
3.2.4 Compaction of Sandstones
It is necessary to understand the basic components of sandstones before carrying out
compaction analysis since both mechanical and chemical compaction processes are to a large
extent lithologically dependent.
Sandstones are basically composed of (a) detrital silicate framework grains essentially
consisting of quartz grains, with relatively higher mechanical and chemical stability,
feldspars (ranging from alkali to plagioclase feldspars), lithic framework grains or other
clasts, accessory minerals (such as olivine, pyroxenes), and heavy minerals. (b) a matrix
which is very fine material found between the framework grains (c) a cement, binding the
framework grains and (d) pores space. Texturally ‘clean’ sandstones (arenites) have very
little quantities (<15%) or no matrix, whereas texturally ‘dirty’ sandstones (wackes) have
>15% matrix (Dott, 1964).
The maximum threshold of mechanical stability of the constituent grains is of major
importance during mechanical compaction. Well sorted quartz rich sandstones have a higher
compressibility than the corresponding well sorted but fine grain quartz rich sand (Chuhan et
al., 2002, Fawad et al., 2010) (Fig. 3.8). However, coarse grain sand will readily fracture
than fine grain sand at a given stress level due to high stress at the smaller area of grain
contacts. The presence of clay coatings act as a ‘lubricant’ and cause the sand grains to
slide against each other and less likely to fracture and thereby reduce the compressibility
than in pure quartz rich sand (Chuhan et al., 2002).
Fig. 3.8. Experimental compaction of fine-grained and coarse-grained sand showing that well
sorted fine grained is less compressible than coarse grained sands. (Chuhan et al., 2003).

Chapter 3. Compaction and Evolution of Rock Properties
33
Chemical compaction results in porosity loss by dissolution and precipitation of minerals
(Houseknecht, 1987) and is controlled mainly by temperature hence effective stress plays a
very minor role.
The most commonly precipitated cement in sandstone is quartz cement starting between a
temperature range of 60⁰C - 100⁰C and 2 – 2.5 Km (Mondol et al., 2007, Thyberg et al.,
2009). Precipitation of quartz cement (compaction) is a continuous process even during
basin inversion and uplift as long as the temperature is above 80⁰C and there is available
porosity (Bjørlykke and Jahren., 2010). The principal precursor of the cement is from the
pressure solution of quartz clasts at contacts with illitic clays and micas.
The quantity of precipitated quartz cement is also a function of the grain surface available
(IGV from mechanical compaction) coupled with the time - temperature integral with an
increased rate by a factor of 1.7 for every 10⁰C temperature increase (Walderhaug, 1994).
This is a surface - controlled reaction by virtue of the fact that the rate limiting process
seems to be the rate of nucleation and precipitation in the pore space (Bjørkum et al., 1998).
Grain coatings on clastic quartz grains such as iron oxides, micro-crystalline quartz, detrital
clays, chlorite, illite and bitumen (Fig. 3.9A) prevent or slow down the rate of quartz
cementation (Ehrenberg and Boassen, 1993, Storvoll et al., 2002, Chuhan et al., 2002)
Fig. 3.9. (A) Schematic illustration of Pressure solution of quartz clasts at grain contacts with clays
(stylolite). Grain coatings prevent or slow down quartz cementation and preserve porosity at greater
depths. (b) Quartz cement with smooth crystal surfaces as overgrowth on clastic grains. Adapted
from Bjørlykke and Jahren., (2010).
Carbonate cement in sandstone is also common mostly due to dissolution and precipitation
of biogenic carbonates or early aragonite cement at relatively lower temperatures such as in
carbonate sands. However the transformation of amorphous silica (Opal A to Opal CT)

Chapter 3. Compaction and Evolution of Rock Properties
34
occurring at relatively lower temperatures (depth) could also result in porosity loss and high
P-wave velocities.
Mechanical compaction in sandstone by grain rearrangement is halted by the precipitation of
modest quantities of quartz cement (Bernabé et al., 1992, Vernik and Nur, 1992, Dvorkin
and Nur, 1996). This greatly increases the stiffness and reduces its compressibility resulting
in an abrupt increase in velocity. Under such conditions, the sandstone may compact along a
stress-strain profile for overconsolidated rocks. This behaviour, referred to as ‘pseudo-
overconsolidation’ could be misinterpreted as overconsolidation due to previously higher
effective stress (Bjørlykke et al., 2004). There for a priori knowledge of the sediment burial
history is essential during compaction analysis.
3.3 Methodology
3.3.1 Correlative Analysis of Petrophysical logs
Well logs contain enormous amount of information which can be utilised to identify
different facies, lithology, pore fluids and overpressured intervals. Entire log data is used for
compaction analysis rather than averaging as this allows for much more precise
interpretation of how rock properties actually vary with depth. A relatively large scale
approach is employed whereby investigations are carried out both at Group and Formation
levels. The general velocity depth trends for each well will be analysed with other
petrophysical logs with respect to the dominating compaction mechanisms and possible
controlling factors, after which it is then compared both with each other and with published
and unpublished (experimental) compaction curves in clastic rocks. At this level, all
available logs are studied in concert.
3.3.2 Crossplots
Several combinations of cross plots are generated for the different wells in order to further
ascertain the lateral and vertical distribution of rock properties and reservoir intervals with
good quality sandstones, compaction gradients, transition from one compaction domain to
the other. The effects of incipient chemical compaction (quartz cement) on dynamic rock
properties are also deciphered by these cross plots. These include Vp/ Vs/ Gamma ray/
Porosity/ versus depth, Shear modulus versus porosity and finally a cross plot of Vs versus
Vp to adequately define effective reservoir horizons.
Chapter 3. Compaction and Evolution of Rock Properties
35
3.3.3 Correction for Exhumation and Comparative Analysis
The Barents Sea area experienced Tertiary uplift and erosion known as exhumation is
defined as ‘the displacement of rocks with respect to a surface’(England. and Molnar.,
1990). A correction for exhumation to represent maximum sediment burial depth is
necessary to enable more elaborate compaction and comparative analysis with published
compaction data.
An experimental compaction curve for a Kaolinite – Silt (50:50 %) from Mondol., (2011)
(personal communication) is employed to estimate the magnitude of exhumation. This curve
is deemed appropriate over the other available published compaction curves as it gives a
good control on the initial mineralogical composition of the compacting sediment.
Furthermore, a kaolinite – silt mixture is more representative of naturally occurring shales.
A three step simplistic approach it employed to estimated exhumation:
1.) The transition zone from mechanical to chemical compaction at present day burial
depth is deciphered using rock physics crossplots.
2.) Volumetric shale fraction (V-shale) corresponding to mechanical compaction at
present day burial depth is calculated across the entire area and cross-plotted as
function of depth.
3.) The naturally compacted samples are then projected onto experimentally compacted
kaolinite – silt (50:50) mixture. The difference along the depth (m) axis gives an
estimate of the magnitude of exhumation the natural samples have undergone.
After correcting for exhumation, well data is analyzed with respect to different compaction
mechanisms and controlling factors. The transition zone between mechanical and chemical
compaction is then accurately defined at the actual depth (pre – exhumation depth) at which
it occurred.
The natural samples are then compared both with experimental compaction curves, natural
compaction curves representative of the Hammerfest basin, marine shales and a compaction
curve of the Etive sandstones in the North Sea.

Chapter 3. Compaction and Evolution of Rock Properties
36
3.4. Results
3.4.1 Compaction Trends in the Study Area
Analysis based on petrophysical well logs reveals the two distinct compaction regimes
across the entire study area. Mechanical compaction (MC) and chemical compaction (CC).
A zone of overpressures (OP) is also observed just below the transition form one compaction
domain to the other. Anomalous velocities are indicated by the red circle. Relationships
between P-wave velocity (Vp), gamma ray, bulk density, porosity as a function of depth for
all the wells are presented in Figure. 3.10.

Chapter 3. Compaction and Evolution of Rock Properties
37
Fig. 3.10. Cross plots of Vp/ Bulk density / Neutron porosity/Gamma ray versus depth for five wells
cross the entire study area. Generally two distinct compaction trends are identified on all cross plots.

Chapter 3. Compaction and Evolution of Rock Properties
38
Well 7123/4-1 is selected as the reference well for a relatively detail compaction analysis
because it contains both compressional and shear wave velocity information. Furthermore,
according to NPD (Norwegian Petroleum Directorate) it is classified as a dry well with
shows of residual hydrocarbons in different zones. This minimises the effects of pore fluids
on the acoustic properties. Analysis from this well is cross-referenced with the other well
data for correlation. Two compaction trends can be identified (Fig. 3.11) where the interval
A1 corresponds to mechanical compaction (MC) and A2 corresponds to chemical
compaction (CC).
Fig. 3.11. Vp (m/s) - Depth (m) plot for well 7123/4-1A at present burial depth below sea floor
(BSF). The various Formations have been separated in to different colours for better illustration. The
general trend line (in black) is not for a particular lithology but for the entire well data. The
highlighted area (black circle) represents anomalous velocity. The transition zone (TZ) separates
mechanical compaction (MC) from chemical compaction (CC)
Interval A1
It consists of velocities from the Adventdalen Group. A similar trend is observed in wells
7122/6-1, 7122/6-2 and 7122/2-1 (Fig. 3.10). The general trend line shows a linearly
increasing velocity with depth irrespective of minor variations within some Formations.
Chapter 3. Compaction and Evolution of Rock Properties
39
In well 7122/6-1, this interval starts with the Nordland Group followed by the Sotbakken
Group showing low velocities. In marked contrast to the overlying Torsk Formation, high a
velocity is observed in the Kviting Formation (Fig. 3.10) in wells 7122/6-1 and 7122/4-1 at
approximately 400m and 500m BSF respectively. This is results both from the early
carbonate cement at relatively low temperatures and from limestone interval. The bulk
density also increases accordingly. A similar trend is observed the upper parts of the
Kolmule Formation consisting of limestones and dolomite stringers.
The rest of the A1 interval (Fig. 3.11) shows a generally increasing velocity with depth (with
a small data spread). A corresponding increase in the S-wave log is observed for well
7123/4-1A (Fig.3.10), both resulting from a maximum mechanical compaction from a
1530m overburden corresponding to approximately 15 MPa (Mega Pascal) effective stress
from the overburden.
The highlighted area (black circle) on Figure 3.11 shows anomalous velocities from the
organic rich Hekkingen Formation. A density inversion is also observed.
Interval A2
This interval starts at about 1530 m (BSF). This comprises the Knurr, Stø, Tubåen,
Fruholmen and Snadd Formations. Stø and Tubåen Formations are mineralogically and
texturally mature sandstones (Dallan et al., 1988). Though the general trend line depicts a
general increase in velocity with depth as in the A1interval, the velocity is remarkably
higher.
The rest of the interval shows an increase in velocity with a very broad data spread. Minor
variations in compaction trend of the interval A2 coupled with the higher data spread across
the study area could be attributed to lateral facies variations and in pore fluids (gas and oil
shows without pressure communication) (NPD Factpages. 2011) in the Triassic Formations.
3.4.2 Transition Zone ( T Z ) from Mechanical to Chemical Compaction
This zone varies greatly across the study area partly due to structural evolution and
geometry of the basin given that the wells span from the axis of the Hammerfest basin,
close to Loppa High and finally, on a rotated fault block. Adequate identification of this zone
is of particular interest as it greatly influences rock properties.

Chapter 3. Compaction and Evolution of Rock Properties
40
Fig. 3.12. Shear modulus versus porosity (NPHI) for shales only in well 7123/4-1A. Colour coded
with depth to illustrate the transition zone (TZ) from mechanical compaction (MC) to chemical
compaction (CC) occurring at the ‘knee point’.
Figure 3.12 depicts a robust rock physics relationship of shear modulus and porosity for
shales only, in well 7123/4-1A. Shear modulus (μ), defined as the resistance to shear (strain)
of a rock when a seismic wave is propagated through (stress). It is the product of the density
and S- wave velocity squared (ρVs²). The shear modulus is not sensitive to pore fluids,
hence a good frame indicator. Total volumetric shale (Vshale) is calculated from the gamma
ray log. Pure shales (Vshale) are defined using values in the range of 0.8 – 1.0 using the
formula:
(Eq. 3.5)
The geothermal gradient is estimated as 27⁰C/ km from the bottom hole temperatures
(BHT = 94⁰C) while considering a surface temperature of about 4⁰C depending on the water
masses (Loeng, 1991).
At present burial depth, the transition zone (TZ) from mechanical to chemical compaction
domain in well 7123/4-1A can directly be identified on the cross plots as occurring at a
depth of 1530m BSF (‘’knee point’’), corresponding to temperatures of approximately
41.3⁰C. However, using geothermal gradients of 30⁰C (Laberg et al., 1998) rather gives a
transition temperature of 45.9⁰C. Considering the effects of uplift imply that this transition
actually occurred at greater depths. As such, after correcting for exhumation and using

Chapter 3. Compaction and Evolution of Rock Properties
41
temperature estimated from the BHT, the transition zone is at 3130m at a temperature of
84.5⁰C. Due to uncertainties related to borehole condition during recording of the BHT, a
geothermal gradient of 30⁰C (Laberg et al., 1998) is used and this sets the transition zone to
occur at a temperature of 93.9⁰C.The linear trends are indicated to emphasize the TZ from
MC to CC for better illustration.
3.4.3 Rock Property Variations
Velocity data for sands and shales are equally plotted as a function of depth in order to
investigate the how compaction mechanism varies for these different lithofacies. The results
are presented in Figure 3.13
Fig. 3.13 Crossplots of P-wave versus Depth for (a) entire well data, (b) clean sands and (c) shales
only, for well 7123/4-1A colour coded with V-shale. The highlighted area in red circle indicates a
zone of overpressure in the Hekkingen Formation. Sands compact along a higher gradient than
shales. A similar pattern is observed for wells 7122/4-1, 7122/6-1 and 7122/6-2.
Clean Sands and shales will generally show up as low and high gamma values respectively
(Fig. 3.13). However, carbonates will also tend to have low gamma values too, but at a
relatively shallow depth, they have anomalously high velocity. Sand and shale show
compaction along different gradients. This difference in compaction gradients is clearly
seen, in this case study, within the chemical compaction domain whereby under similar

Chapter 3. Compaction and Evolution of Rock Properties
42
temperature conditions and thermodynamic drive for more stable mineral assemblages, the
rate of cementation will be different given that the inter-granular volume (IGV) available for
quartz cement is different for sand and shale resulting from differential mechanical
compaction.
A cross plot of Vs versus Vp is generated in order to accurately define good reservoir
intervals across the study area that could be used for further rock property analysis. Vs is a
good frame indicator as it is transmitted through the grain framework. When combined with
Vp is serves as a good lithology indicator. Clean sands of the Stø Formation have higher Vs
than shales at a given Vp level. For example, at Vp = 3750 m/s (Fig. 3.14).
Fig. 3.14 Crossplot of Shear-wave velocity versus P-wave velocity for well 7123/4-1A color coded
with V-shale. S-wave velocities show a lithology dependent gradation, hence good lithology
indicators.
Vs used in Figure. 3.14 and Figure 3.15 is from direct measurements in Well 7123/4-1A,
though there exist several methods (Castagna et al., 1985, krief et al., 1990) for determining
Vs in areas where there are no direct measurements. The Triassic Snadd Formation is
almost entirely made up of shaly sandstones apart from the clean sands at depths of
approximately 2230m BSF (Fig. 3.15), corresponding to the tight Carnian sandstones.

Chapter 3. Compaction and Evolution of Rock Properties
43
Fig. 3.15 Attribute cross section from the Vs versus Vp cross plot versus depth (m) BSF for well
7123/4-1A, showing the vertical distribution of clean sands (orange) as in the Stø reservoir and shaly
sands (blue) as in the Snadd reservoir. The Triassic sequence is dominated by shaly sands.
A comparison of velocity logs and bulk density log for well 7123/4-1 (Fig. 3.16) reveals
that at the vicinity of the abrupt velocity increase, the density log does not show a
corresponding abrupt increase indicating that a different factor other than density is
responsible for the sudden change in velocity.
Fig. 3.16 Effect of incipient quartz cement on bulk density, well 7123/4-1 at present burial depth
below sea floor (BSF). Vp/ Vs / Bulk Density versus Depth (m) Below sea floor (BSF). The transition
zone (TZ) between mechanical compaction (MC) and chemical compaction is marked by the red line.

Chapter 3. Compaction and Evolution of Rock Properties
44
3.4.4 Correction for Exhumation and Comparative Analysis
Exhumation estimate is done at each well location and an estimated magnitude is found in
Table 3.1. Shales, corresponding to mechanical compaction domain are used. The entire
sonic log is used during rather than averaging, this allows for a more precise analysis of the
velocity variation with depth. When applying this simplistic method to correct for
exhumation, the choice of experimental data to use is essential as this could lead to
misleading estimates. This is illustrated in Figure 3.17, using mechanically compacted shales
only for well 7122/2-1 and experimental compaction curves for Kaolinite – Silt (50:50),
Kaolinite – Smectite (80:20) and Kaolinite (100 % ) results in exhumation estimates of
1200m, 2500m and 2700m respectively. The mineralogical composition of the experimental
data should reflect that of the natural samples, since velocities are also mineralogically
dependent.
Fig. 3.17 Exhumation estimates for well 7122/2-1 using experimental compaction curves for Clay -
Silt and Clay - Clay mixtures. The shales are for mechanical compaction domain only.
Shale being a mixture of clay, silt and electrostatically bound water, the kaolinite – silt
(50:50) curve is most appropriate assuming that kaolinite is the most abundant clay mineral
in the area though smectite precursors are also present especially in the Torsk Formation.
Based on this experimental curve, estimates from different wells are presented below. The
lowest estimate from well 7122/2-1 is probably due to its position close to Loppa High.
Estimates from individual wells presented below indicate differential magnitude in uplift.

Chapter 3. Compaction and Evolution of Rock Properties
45
Table. 3.1. Exhumation estimates for four wells based on experimental compaction curve of a
Kaolinite - Silt mixture (50:50). Mondol., (2011) (personal communication.
Wells Exhumation estimate (m)
7123/4-1A 1600
7122/6-1 1500
7122/6-2 1450
7122/2-1 1200
7122/4-1 1600
Comparative Analysis;
Experimental Compaction versus Natural Compaction
Calculated V-shale is for each well corresponding to mechanical compaction domain is
compared with experimentally compacted clay – clay and clay – silt mixtures both before
and after correcting for exhumation (Fig.3.18). The entire well data is also used for
comparison with published compaction curves (Fig. 3.20).
Fig. 3.18 Correction for exhumation using shales only, for five wells corresponding to mechanical
compaction. (a) Vp(m/s) – Depth(m)BSF at present burial depth compared with different
experimental clay mixtures. (b) Vp(m/s) – Depth (m) after correcting for exhumation and compared
with experimental samples.

Chapter 3. Compaction and Evolution of Rock Properties
46
When using well log velocity data that had not been corrected for exhumation, (Fig 3.18a),
the velocity is remarkably higher than that for experimental compaction curves. After
correcting for exhumation, it becomes apparent that the naturally compacted shale samples
corresponding to mechanical compaction show a generally similar compaction trend with
experimental curves, Mondol et. al. 2007, Mondol., (2011) (personal communication), with a
progressive increase in Vp with depth (Fi.3.18b).
Fig. 3.19 Shales only, corresponding to mechanical compaction after correcting for exhumation. (a)
Neutron porosity (NPHI) / Density porosity (DPHI) versus depth compared with experimental
porosity-depth curve for a Kaolinite – silt (50:50) mixture. (b) crossplot for bulk density – Depth for
shales compared with experimental density curve for a kaolinite – silt (50:50) mixture.
Neutron log is basically a measure of Formation water content which could be bound water,
crystallization water or free pore water and gives a measure of the porosity. In shales, water
occurs either within the molecular structure or between the phyllosilicate layers. This results
in high porosities in shales (Fig. 3.19) and could not be appropriate for comparison with
experimental data. Neutron porosity gives a rather good measure of porosity for brine-
saturated sandstones. Log derived neutron porosities is expressed mathematically as:
(Eq. 3.6)
Where is the true porosity, are constants and N is the reading from the neutron tool.

Chapter 3. Compaction and Evolution of Rock Properties
47
In contrast to the neutron porosity, using the bulk density of shales as 2.57g/cc and fluid
density of 1.09 g/cc, porosity (DPHI) is then calculated from log derived bulk density.
However, assuming a constant grain density after filtering out shales only, corresponding to
mechanical compaction, a close relationship seems to exist between the bulk density and
porosity. This gives a lower porosity when compared with neutron porosity (NPHI)
This relationship is expressed as:
(Eq. 3.7)
Solving for porosity gives:
(Eq. 3.8)
Where; is the matrix density, is the bulk density and is the fluid density.
Comparing DPHI/ NPHI with experimentally derived porosity from a kaolinite – silt
(50:50) mixture, a fair to slightly lower porosities with DPHI and higher porosity with NPHI
becomes evident (Fig.3.19a). Density from the natural samples is also seen to be slightly
higher than the experimental curve (Fig. 3.19b) reflecting a well advanced degree of
compaction. This could also suggest that these Formation generally have a relatively ≥ 50 %
kaolinite content though other factors could also result in higher density other than the clay
content. Clay mechanical compaction steadily increases with a corresponding increase in the
Kaolinite content (Mondol et al., 2007). As such, a possible contributing factor to the
resultant higher velocities from the well data when compared with Mondol., (2011)
(personal communication) compaction curve (Fig. 3.18b).

Chapter 3. Compaction and Evolution of Rock Properties
48
Fig. 3.20 Composite cross plot of Vp – Depth for 5 wells using entire well data. Trend lines from
three different published and experimental data have been included for comparison. (a) Present
depth below sea floor (BSF). (B) Corrected for Tertiary exhumation. The highlighted area (red
circle) represents anomalous velocity from shallow carbonates.
After correcting for exhumation, using the entire data (Fig. 3.20b), velocities from well logs
fits excellently with published compaction curve from Mondol. (2011) (personal
communication) and Storvoll et al. (2005), but are slightly higher than the Japsen. (1999)
curve (with an exception in well 7122/2-1) and the kaolinite – smectite curve, within the fine
grained sediments of the Nordland and Sotbakken Groups. Anomalous velocities,
highlighted by red circle, at such shallow depths are from limestones of the Kviting
Formation showing very low gamma ray values. However, from about 2000m well log
derived velocity deviates from Mondol. (2011) (personal communication) curve with higher
velocities throughout the mechanical compaction regime but shows a rather good match with
Japsen. (1999) and Storvoll et al. (2005) compaction curves. Velocities from the Hekkingen
Formation at approximately 3000m are quite lower than data from Japsen (1999), Marcussen
et al. (2010) and Storvoll et al. (2005) compaction curves irrespective of such a burial.
From about 3100m, there is a general deviation of the natural samples from all the published
and unpublished compaction curves (Fig. 3.20b) stipulating an abrupt change in compaction
regime.

Chapter 3. Compaction and Evolution of Rock Properties
49
Fig. 3.21 Modified tentative uplift map illustrating the total amount of uplift based on vitrinite data.
The area under consideration in this study is indicated by the red circle. Modified from: Ohm et al.
(2008).
Figure 3.21 depicts a tentative uplift estimate map (Ohm et al., 2008) based entirely on
vitrinite reflectance (Ro ) data from 67 exploration wells drilled in the Norwegian Barents
Sea with an uncertainty in the order of 500m. The method employed in this study gives a
similar uplift range without quantifying the associated uncertainties (Table. 3.1).
3.5 Discussion of Results
3.5.1 Compaction as a Function of Rock Properties
When analysing data from individual wells, a highly similar pattern in the velocity – depth
gradient is observed for all four wells, particularly in the mechanical compaction domain
(Fig. 3.10). This probably indicates no major lateral lithologic variations in the inter-well
areas. However, the Kviting Formation with a thickness of about 90 m in well 7122/4-1 thins
out and completely disappears towards the eastern wells and passes into the Kveite
Formation of the same Group which thins out in the opposite direction and is absent in well
7122/4-1. The Fuglen Formation, 29 m, also thins out in towards the east. The 44m thick
Nordmela Formation in well 7122/4-1 also gradually thins out towards the east with 11 m in

Chapter 3. Compaction and Evolution of Rock Properties
50
well 7122/4-1S. Lithologically, the Torsk Formation is composed claystones with basal
tuffaceous horizons which could serve as excellent smectite precursors explaining the lower
velocities at the start of the A1 interval in Figure 3.11. The thicknesses of the different
Formations vary but laterally extensive throughout the study area with the Fuglen Formation
as an exception.
At present day burial depths below 1530m BSF in well 7123/4-1A (Fig. 3.11), mechanical
compaction is the main process responsible for porosity reduction, increase in density and
consequently the velocity constrained by varying mineralogy and texture resulting from
differences in depositional environments though there seem to be very little variations in
gamma ray logs throughout this depth interval. This compaction regime is dominated by
mudstones and shales across the study area (Fig.3.13). Compaction in shales and mudstones
is highly controlled by mineralogy and micro-fabric (Fawad et al. 2010). That is if the
compacting sediment is grain supported or matrix supported. Increasing vertical effective
stress in a generally matrix supported system such as in the Cretaceous, Pliocene and
Pleistocene sediments, results in a higher orientation of clay minerals resulting in anisotropy
with higher velocities perpendicular to the direction of alignment. The degree of orientation
is has been shown (Oertel and Curtis, 1972, Curtis et al., 1980) not only to be a simple
function of strain but also by the presence of non-platy particles like quartz. This is however
a very complex process (Meade, 1964).
Analysis based on gamma ray logs show no significant lithologic variation around the
transition depth from mechanical to chemical compaction implying that these mudstones are
relatively homogenous. It can then be resolved that the sharp increase in velocity is not due
to a sudden change in lithology but rather a chemically induced change controlled by
thermodynamics. This velocity increase at present depths of 1530m BSF (≥ 45.9⁰C), in the
reference well 7123/4-1A, could be inferred as corresponding to the precipitated micro-
quartz cement released from the transformation of the clay mineral smectite to illite through
a mixed layer illite – smectite (IS) (Eq. 3.3). Water released from this transformation
(Abercrombie et al., 1994, Boles. and Franks., 1979, Peltonen et al., 2009) resulted in a
decrease in the resistivity log (Fig. 3.22) around the transition depth (1530m BSF present
depth). The smectite – illite transformation will only occur when pore water silica
concentration has been reduced to a normal saturation level relative to the temperature given
the assumption that pore water at deposition is supersaturated with respect to silica (Storvoll
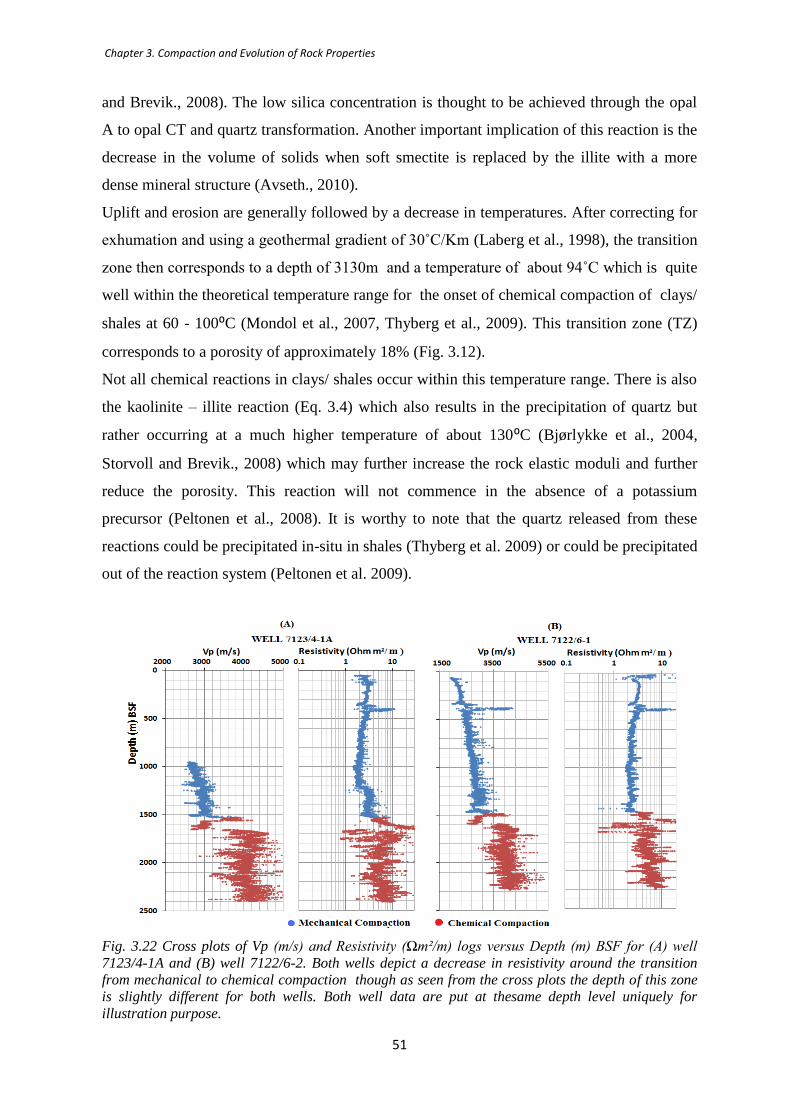
Chapter 3. Compaction and Evolution of Rock Properties
51
and Brevik., 2008). The low silica concentration is thought to be achieved through the opal
A to opal CT and quartz transformation. Another important implication of this reaction is the
decrease in the volume of solids when soft smectite is replaced by the illite with a more
dense mineral structure (Avseth., 2010).
Uplift and erosion are generally followed by a decrease in temperatures. After correcting for
exhumation and using a geothermal gradient of 30˚C/Km (Laberg et al., 1998), the transition
zone then corresponds to a depth of 3130m and a temperature of about 94˚C which is quite
well within the theoretical temperature range for the onset of chemical compaction of clays/
shales at 60 - 100⁰C (Mondol et al., 2007, Thyberg et al., 2009). This transition zone (TZ)
corresponds to a porosity of approximately 18% (Fig. 3.12).
Not all chemical reactions in clays/ shales occur within this temperature range. There is also
the kaolinite – illite reaction (Eq. 3.4) which also results in the precipitation of quartz but
rather occurring at a much higher temperature of about 130⁰C (Bjørlykke et al., 2004,
Storvoll and Brevik., 2008) which may further increase the rock elastic moduli and further
reduce the porosity. This reaction will not commence in the absence of a potassium
precursor (Peltonen et al., 2008). It is worthy to note that the quartz released from these
reactions could be precipitated in-situ in shales (Thyberg et al. 2009) or could be precipitated
out of the reaction system (Peltonen et al. 2009).
Fig. 3.22 Cross plots of Vp (m/s) and Resistivity (Ωm²/m) logs versus Depth (m) BSF for (A) well
7123/4-1A and (B) well 7122/6-2. Both wells depict a decrease in resistivity around the transition
from mechanical to chemical compaction though as seen from the cross plots the depth of this zone
is slightly different for both wells. Both well data are put at thesame depth level uniquely for
illustration purpose.

Chapter 3. Compaction and Evolution of Rock Properties
52
The incipient onset of quartz cementation observed by an abrupt increase in velocity, at
1530m does not coincide with a corresponding sudden increase in the bulk density
(Fig. 3.16). The quartz cement resulted in an abrupt velocity increase due to grain work
stiffening but does not affect the bulk density because the rock volume is not significantly
modified at the onset of quartz cementation. Higher densities (porosity reduction) probably
caused by quartz cement only becomes evident at about 1800m BSF (Fig. 3.16) in well
7123/4-1A. Porosity loss by mechanical compaction is quite limited and only chemical
compaction can result in 0% porosity.
Chemical compaction by quartz cement becomes dominant at present depth of ≥ 1530m in
(well 7123/4-1A), and is controlled basically by the time temperature integral (Walderhaug,
1994) and will continue during basin inversion (Bjørlykke et al., 2010) (Fig.3.5). This
process occurs in mudstones (Fig 3.7) as well as in sandstones (Fig 3.9) but at different
temperature range. In the Stø and Tubåen sandstones, the minor clay rich intervals in contact
with quartz grains could have evolved into stylolites (pressure solution) upon burial,
providing silica for quartz cementation. The good permeability in the Stø and Tubåen
Formation (NPD Factpage. 2011) suggests the probable presence of grain coating coupled
with moderate to low amounts of detrital clays serving as stylolite precursors. The high pore
pressures in the overlying Hekkingen Formation may also have resulted in a reduced amount
of mechanical compaction in the underlying Stø and Tubåen Formations during burial
explaining the good reservoir qualities.
Upon close observation form acoustic logs, there is a slight decrease in velocity towards the
lower section of the Fruholmen Formation (Krabbe Member) which is essentially shale,
underlain by shaly sandstones of the Snadd Formation. This is due likely to a change in
lithology (elastic property) from the quartz cemented sandstones of the upper Reke Member
to underlying pure shales of the Krabbe Member. This variation is more evident in well
7122/6-1 (Fig. 3.10).
After correcting for exhumation, at depths greater than 3100 m (with the exception of well
7122/2-1), well log derived velocities abruptly deviates further from all published and
unpublished compaction curves (Fig. 3.20b). Average velocity in the Kolje Formation is
about 3100 m/s at a depth of 2775 m but increases to about 4068 m/s at 3081 m in the Stø
Formation leading to a velocity increase of 1293 m/s over a distance of 306 m (Fig. 3.20b).
This suggests another mechanism responsible for the change in elastic rock properties

Chapter 3. Compaction and Evolution of Rock Properties
53
revealed by the rapid velocity increase over a relatively small depth interval. Mechanical
compaction from vertical effective stress alone cannot explain such a significant change.
Only chemical compaction (predominantly quartz cement) can result in an abrupt change in
velocity gradient by stiffening the sediment grain framework while its incompressibility is
increased resulting in an increase in velocity.
Present day geothermal gradients do not vary much across the study area with an average of
about 30⁰ C /Km (Laberg et al., 1998) coupled with no significant lateral depositional age
variation in the Triassic Formations. Thus the high degree of scatter in velocities between
1500 and 2700 m when all four wells are plotted together (Figure 3.20a) is due to the
varying burial depths coupled with the lateral and vertical changes in textural and
mineralogical composition resulting from different sediment provenance particularly during
the Triassic (Worsley, 2008) partly due to the complex interactions between tectonic
subsidence, fault reactivation and sediment supply influencing the basin infill (Glørstad-
Clark et al., 2010).
A unique burial depth will therefore be misleading to use as reference depth to distinguish
between mechanical and chemical compaction in the entire area as we see differences in
depth and temperatures for the transition zone (TZ) from one compaction regime to the other
(Table 3.2) both at present day and when corrected for exhumation. This is a result of the
structural style and differential uplift across the study area even between the relatively
closely spaced wells on the Tornerose prospect.
Table. 3.2 Transition zones (TZ) from mechanical to chemical compaction with the corresponding
temperatures of transition for five wells both at present day depth and temperatures and after
correcting for exhumation respectively.
Wells TZ depth at
Present day
(m)
TZ temperature
at present day
(⁰C)
TZ depth before
exhumation
(m)
TZ temperature
before
exhumation
(⁰C)
7123/4 – 1A 1530 45.9 3130 93.9
7122/6 – 1 1480 44.4 2980 89.4
7122/6 – 2 1460 43.8 2910 87.3
7122/2 – 1 1445 43.4 2645 79.4
7122/4 – 1 1713 51.3 3313 99.4

Chapter 3. Compaction and Evolution of Rock Properties
54
Analysis showed that sands and shales compact along different gradients (Fig. 3.13). A
cross plot of Vs versus Vp actually reveals a lithologic differentiation between sands and
shales (Fig. 3.14). Prolific sands of the Stø Formation have higher porosity when compared
to the feldspathic lithic arenites of the Snadd Formation with and increased clay content.
This increases the probability of clay occurring as pore fills resulting in higher Vp. The clays
can also be distributed in the Formation in several ways such as structural clays, coated clays
and laminar clays. These different modes of occurrences result in quite different effective
medium parameters and consequently on the acoustic velocities. Comparatively, the higher
porosity in the Stø formation makes it acoustically softer resulting in lower velocities. Vs
and Vp are quite useful both as lithology and pore fluid indicators. An attribute cross section
of the Vs versus Vp cross plot reveals that the Triassic Snadd sequence is dominated by
shaly sands apart from the tight Carnian sandstone at 2230m BSF (Fig. 3.15). This seems to
reflect the complex basin infill history as depicted by Glørstad-Clark et al. (2010). In
siliciclastic rocks, this cross plot can be used as a frame indicator.
3.5.2 Exhumation
Employing the difference between present day burial of a reference unit such as, the Stø
Formation, and its maximum burial prior to exhumation as the net uplift (Doré and Jensen,
1996) is of particular interest here because this is a major controlling aspect of compaction
(both mechanical and chemical), diagenesis, source rock maturation , cap rock integrity and
hydrocarbon migration .
Compaction based on well data reveals that below depths of approximately < 3.3 km, after
correcting for exhumation, natural shales compact more than experimentally compacted
Kaolinite – silt mixtures at the equivalent effective stress level (Fig.3.18b). High velocities
of the naturally compacted shale, (Fig.3.18b) after correcting for exhumation, could on one
hand be explained by the variability of mineralogy and textural composition of shales such
that, velocity – depth trends vary greatly in different types of shales (Storvoll et al., 2005).
Also early cement at shallow depths sourced from carbonate stringers (Dallan et al., 1988)
and/or biogenic silica ( alteration of amorphous biogenic silica Opal A to Opal CT at lower
temperatures) found throughout the A1 interval (Fig.3.11) could remarkably influence elastic
rock properties. Carbonates have a higher kinetic precipitation rate, as such the dissolution of
carbonates may be the rate limiting process, hence its chemical compaction is rather a

Chapter 3. Compaction and Evolution of Rock Properties
55
function of effective stress (Bjørlykke et al., 2004). Thus chemical compaction of carbonate
sediments is very different from siliciclastic sediments. Correcting for exhumation does not
actually reverse the chemical changes that these rocks had undergone while at higher depths.
Therefore, an aspect of cementation will be present in the natural samples, which cannot be
compensated for in the experimentally compacted samples.
This deviation from the compaction curve with a well-characterized mineralogical
composition, Mondol., (2011) (personal communication), (Fig. 3.20b), suggests a changing
mineralogical and textural composition of the natural sediments with more coarser clastics
with depth within the Adventdalen Group supported by similar changes in the density logs.
This indicates that at this depth interval, vertical effective stress is the driving mechanism for
mechanical compaction constrained by changing mineralogy.
For a well-defined lithology, experimental data can conveniently be used to calibrate natural
mechanical compaction trends and provide an enormous insight in predicting the elastic
properties and reservoir qualities of rocks buried below 1530m BSF (present depth) in well
7123/4-1A, and across the study area. After correcting for Tertiary exhumation, the higher
velocity – depth gradients in the well data than published compaction data is due to
overconsolidation explained by the burial history of the area.
However, there are some uncertainties such as with an elaborate estimation of exhumation
though the estimates obtained here infer a general increase in magnitude of exhumation
towards the east. Some of the frequently applied methods in uplifted offshore areas include
evaluating the displacement of rocks within the frame works of tectonics using subsidence
curves, thermal analysis using vitrinite reflectance and fission track data, stratigraphy using
section correlation, and compaction analysis using well log derived velocity data.
3.5.3 Compaction in Source Rocks
Density increases steadily with depth for all five wells (Fig. 3.10). However, a density
inversion from approximately 2.6 g/cc at 1600m to about 1.7 g/cc at 1700 m depth
corresponds to the 90m thick organic rich Hekkingen Formation (Fig. 3.11). This results
from both the physical properties of kerogen and overpressure. Pore pressures higher than
hydrostatic recorded at the top of the Hekkingen Formation (NPD Factpage. 2011) could
most likely have been generated during rapidly subsiding low permeability sediments under
anoxic conditions such that pore fluid pressure cannot attain hydrostatic equilibrium. This
relates to a decrease in vertical effective stress resulting in mechanical under-compaction.

Chapter 3. Compaction and Evolution of Rock Properties
56
This could probably also partly explain the good reservoir qualities in the underlying Stø
reservoir sandstone due to a lower degree of compaction. That is, if higher porosity and
permeability is found in this reservoir after correcting for exhumation, at depths > 3km
(Fig. 3.20b), then overpressure may likely have started to build up at a relatively shallow
depth (approximately < 1.5 km) when the Hekkingen Formation was still undergoing
mechanical compaction during a period of relatively rapid subsidence. Expulsion of liquid
hydrocarbons from kerogen and mineral dehydration could enhance fluid flux generated by
compaction, however this extra fluid flux will have a little impact on overpressure build up
(Mondol, 2008b).
Fig. 3.23 Cross plot of P-wave velocity (m/s) versus Density (g/cc) colour coded with V-shale. The
highlighted area (red circle) depicts low density and velocity in the organic rich and overpressured
Hekkingen Formation.
Across the entire area, the Hekkingen Formations exhibits the lowest density and velocity
(Fig. 3.23). Density and velocity inversion can be due to a number of factors such as the
intrinsic physical properties of a three dimension (3D) kerogen network (Philippi and
Cordell, 1974), low aspect ratio pores parallel to bedding due to transformation of kerogen
to liquid and gaseous hydrocarbon resulting in collapse of the kerogen network (Pepper and
Corvi, 1995, Vernik and Liu, 1997). However, kerogen is particulate organic matter and
actually load bearing (Palciauskas, 1991) though it is relatively soft compared to the
surrounding mineral matrix. With increasing temperatures, oil and gas is generated the
kerogen now becomes part of the pore fluids thus a decrease in the volume of solids while

Chapter 3. Compaction and Evolution of Rock Properties
57
the volume of liquids in the system increases. This also transformation influences the rate of
compaction in source rocks with high organic contents as in the Hekkingen Formation.
3.5.4 Uncertainties
Rock property analysis is entirely based on petrophysical well logs. At relatively shallow
depths below 1530m BSF, the study area is predominantly composed of mud rocks
(Fig. 3.13) from different depositional environments. This implies the clay mineralogy and
textural relationships may likely vary as well. This depth level has been deduced to
corresponding to mechanical compaction. Several previous studies involving mudstone
compaction trends (Fig. 3.24) and physical properties have shown the variability within mud
rock compaction depending on the clay mineral type, particle size, total amount of clays,
sand and silt particles present (Bjørlykke, 1998; Mondol et al., 2008b; Storvoll et al., 2005).
These variations also imply that velocity will also be influenced by the mineralogy, texture
and micro-fabric (Fawad et al., 2010).
Fig. 3.24 Variability in mudstone compaction trends. Variations are prominent in the mechanical
compaction. After Mondol et al., (2008b).
An integrated use of other rock property analytical techniques such as scanning electron
microscopy (SEM) and X-ray diffraction (XRD) within this study would give a more
Chapter 3. Compaction and Evolution of Rock Properties
58
quantitative mineralogical constrain. This would particularly illuminate the suggested
smectite to illite transformation (Eq. 3.3) as depicting the transition zone from mechanical to
chemical compaction at 1530m BSF (in well 7123/4-1A) and across the study area.
Adequate control of sediment composition and mineralogy will also narrow the margin of
uncertainty vis-a-vis estimation of the magnitude of Cenozoic exhumation when employing
the approach used herein. A good number of studies have been carried out in the area to
quantitatively estimate the exhumation employing varying approaches and results (Liu et al.,
1992, Ohm et al., 2008, Corcoran and Doré, 2005). This ambiguity vis-a-vis evaluation and
estimates from several other authors (Liu et al., 1992, Ohm et al., 2008, Japsen and
Chalmers, 2000) could probably be due to differences in reference baseline and estimation
methodology. Incorporating several approaches will reduce the margin of uncertainty.
Chapter 4. AVO/ AVA Modeling
59
CHAPTER 4: AVO/AVA MODELING
4.1 Introduction
Seismic wave propagation and eventual signature is a direct result of the seismic properties
of the media (rocks) through which it propagates. This is in relation to the sediment
depositional environment, extent of compaction and burial history. A good understanding of
the geologic framework is of prime importance in carrying out successful amplitude-versus-
offset (AVO) or amplitude-versus-angle (AVA) modeling. These seismic properties are; P-
and S-wave velocities, bulk density (ρb), Vp/Vs ratio, Poisson’s ratio (σ), impedances (Ip and
Is ), bulk modulus (K), shear modulus (μ) and Lame’s parameter (λ).
AVO/ AVA modeling and analysis are the evaluation of reflectivity as a function of offset. It
has been widely used initially as a method of validating seismic amplitude anomalies
associated with gas sands (Ostrander, 1984). However the success rate has not been
correspondingly high as most often the gas sands yielded amplitudes with lower impedance
than the surrounding shales and showed reflection coefficients that actually increased with
offset. Given that reflections from gas sands show variable AVO characteristics, proper
AVO analysis presents a robust tool for determining reflections that are not directly related
to anomalous (bright spots) strong reflections on stacked seismic data. There exists several
ways to generate, process and analyse AVO synthetic data such as: single-interface
modelling, single-gather modeling, 2D stratigraphic modelling and 2D full wave elastic
equation modelling (Li et al., 2007). Another approach which is used herein is to develop a
half-space model by averaging the elastic properties of the cap rock and reservoir interval of
interest. These averaged properties are used in the Zoeppritz (1919) equation.
The main objectives of this chapter are to evaluate reflectivity at the top of the Stø and
Snadd reservoir interval as a function of offset/ angle at in-situ condition. The in-situ pore
fluids will be replaced with different hydrocarbon fluids with different properties based on
the Gassmann’s equations and reflectivity at the top of these reservoirs will be re-evaluated.
Amplitude anomalies at the top of these reservoir sands with different pore fluid scenarios
will then be classified based on the classification scheme put forward by Rutherford and
Williams (1989). Sensitivity analysis will be performed using the Stø reservoir interval to
investigate the effects of changes in pore fluid compressibility and saturation effects on

Chapter 4. AVO/ AVA Modeling
60
synthetic seismograms and AVA character. To achieve these targets, a careful background
understanding of seismic theory and AVO modeling is essential.
4.2 Theoretical Background
Several approaches are used in seismic exploration. The most widely used techniques are
based on seismic refraction and/ or reflection. However, this study will focus on the seismic
reflection method. The following theoretic background gives a succinct and basic
understanding of the principles upon which AVO/AVA modeling is based. These principles
will directly be applied throughout the methodology while certain assumption will have to be
made to be able to constrain the resultant model.
4.2.1. Reflectivity Series
This is can be thought of as a time series of spikes whereby each spike represents a zero
offset P-wave reflection coefficient. Reflectivity is one of the fundamental physical
concepts in seismic method. It is obtained from the acoustic impedance by dividing the
difference in acoustic impedances by the sum of acoustic impedances between two bounding
layers. However, acoustic impedance is the product of the velocity and density within each
layer. The reflectivity series is often interpreted as the impulse response of the earth’s filter.
4.2.2. The Convolutional Trace Model
This model can be thought of as a mathematical combination of two signals in order to
obtain a modified third signal. Convolution in time corresponds to multiplying the amplitude
spectra and adding the phase spectra in the frequency domain.
However, the simplest version of this model is based on a number of assumptions which are:
- A horizontally layered earth model.
- Normally incident plane waves (implying no shear contributions).
- A stationary source pulse without any change with depth.
- Noise contribution is neglected.

Chapter 4. AVO/ AVA Modeling
61
A seismic trace, x(t), being a time measurement corresponding to a source / receiver pair, is
a result of a linear convolution between a the source pulse S(t) (wavelet) and the earth’s
reflectivity series r(t) (Fig.4.1).
(Eq. 4.1)
Fig. 4.1. Schematic illustration of the Convolutional trace model. The pulse used is a zero-phase
Ricker wavelet with peak frequency at 45 Hz.
4.2.3. Zoeppritz Equation and Aki-Richard Approximation
Variations in reflection amplitudes as a function of offset (angle) are due to mode conversion
at a seismic reflector. This depends on the contrast in elastic rock properties across this
interface and on the angle of incidence. Zoeppritz equations are in a general approach
employed to decipher how these amplitudes vary with offset (angle) for elastic material such
that the physical properties of the rocks across the seismic reflector can be deduced.
However, these equations (Zoeppritz, 1919) involve a myriad of expressions to relate
amplitude to the rock parameters and were thus simplified by the Aki – Richard
approximation in order to meet thesame purpose but with a more practical approach.
Zoeppritz Equation
Mode conversion (energy partitioning) occurs when the incident angle is greater than zero as
shown below. However according to Snell’s law, the angles of incidence(θ1) and refraction
(θ2) is equivalent to the ratio of the phase velocities(V1 and V2) and equal to the refractive
indices (n1 and n2) respectively. If only P-P reflections are measured, at the reflecting
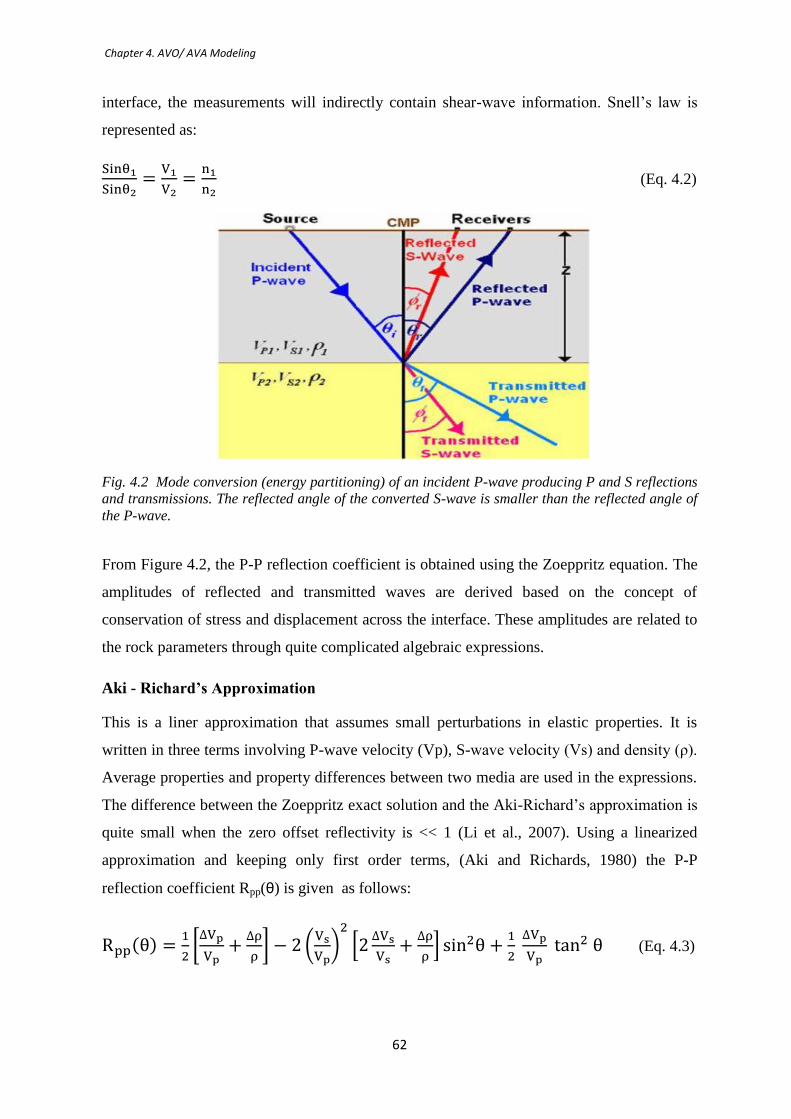
Chapter 4. AVO/ AVA Modeling
62
interface, the measurements will indirectly contain shear-wave information. Snell’s law is
represented as:
(Eq. 4.2)
Fig. 4.2 Mode conversion (energy partitioning) of an incident P-wave producing P and S reflections
and transmissions. The reflected angle of the converted S-wave is smaller than the reflected angle of
the P-wave.
From Figure 4.2, the P-P reflection coefficient is obtained using the Zoeppritz equation. The
amplitudes of reflected and transmitted waves are derived based on the concept of
conservation of stress and displacement across the interface. These amplitudes are related to
the rock parameters through quite complicated algebraic expressions.
Aki - Richard’s Approximation
This is a liner approximation that assumes small perturbations in elastic properties. It is
written in three terms involving P-wave velocity (Vp), S-wave velocity (Vs) and density (ρ).
Average properties and property differences between two media are used in the expressions.
The difference between the Zoeppritz exact solution and the Aki-Richard’s approximation is
quite small when the zero offset reflectivity is << 1 (Li et al., 2007). Using a linearized
approximation and keeping only first order terms, (Aki and Richards, 1980) the P-P
reflection coefficient Rpp(θ) is given as follows:
(Eq. 4.3)
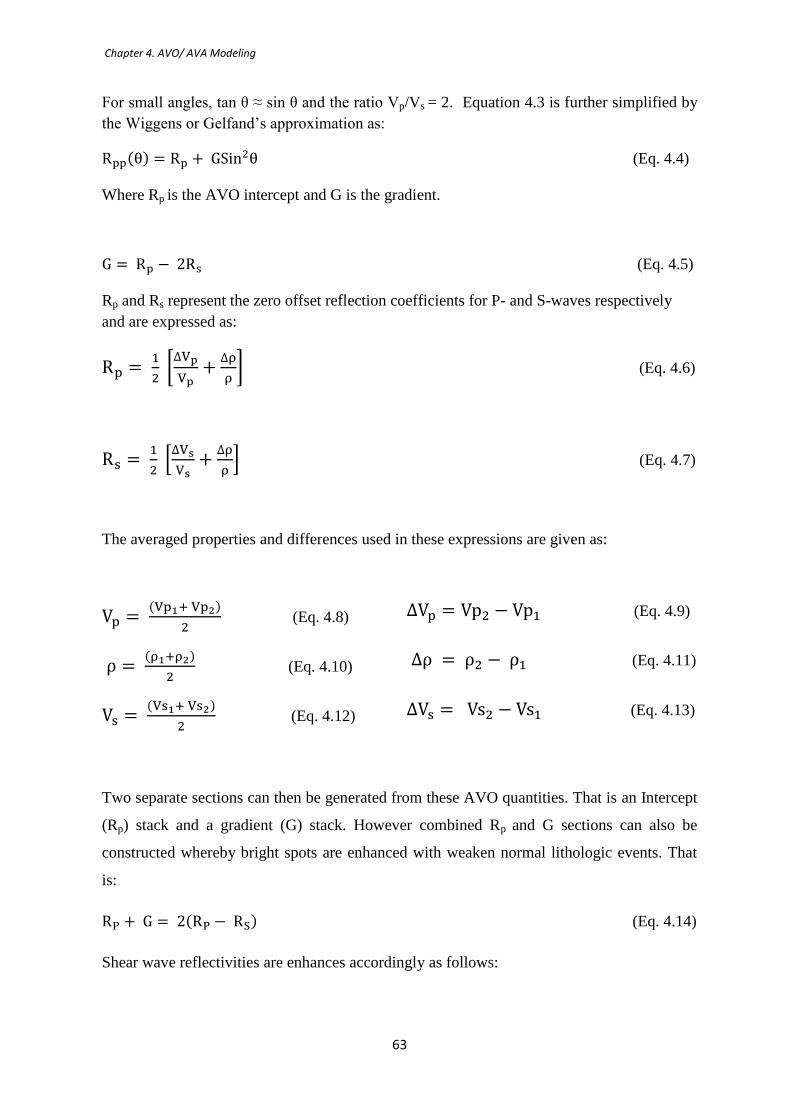
Chapter 4. AVO/ AVA Modeling
63
For small angles, tan θ ≈ sin θ and the ratio Vp/Vs = 2. Equation 4.3 is further simplified by
the Wiggens or Gelfand’s approximation as:
(Eq. 4.4)
Where Rp is the AVO intercept and G is the gradient.
(Eq. 4.5)
Rp and Rs represent the zero offset reflection coefficients for P- and S-waves respectively
and are expressed as:
(Eq. 4.6)
(Eq. 4.7)
The averaged properties and differences used in these expressions are given as:
(Eq. 4.8) (Eq. 4.9)
(Eq. 4.10) (Eq. 4.11)
(Eq. 4.12) (Eq. 4.13)
Two separate sections can then be generated from these AVO quantities. That is an Intercept
(Rp) stack and a gradient (G) stack. However combined Rp and G sections can also be
constructed whereby bright spots are enhanced with weaken normal lithologic events. That
is:
(Eq. 4.14)
Shear wave reflectivities are enhances accordingly as follows:

Chapter 4. AVO/ AVA Modeling
64
(Eq. 4.15)
4.2.4 AVO Reservoir Sand Classification Scheme
The Amplitude Versus Offset (AVO) signature of gas sands are largely controlled by the
normal incidence reflection coefficient (R₀) and the contrast in Poisson’s ratio at the
interface between the cap rock (shales) and the reservoir sands (Rutherford and Williams,
1989). The P-wave reflection coefficient varies greatly with angle of incidence. At small
incident angles, the relative changes in the reflection coefficient are seen to be large when
the contrast in Poisson’s ratio between the two media is large (Ostrander, 1984) . As it is the
case with parts of the study area, the contrast in Poisson’s ratio between the Hekkingen and
Stø Formations is quite large resulting in detectable amplitude changes.
Poisson’s ratio denoted (σ) is defined as a measure of the compressibility of a material
perpendicular to applied stress. Alternatively, it is the ratio of latitudinal to longitudinal
strain. For an isotropic elastic material, dynamic determination of Poisson’s ratio can be
calculated as it relates to the P-wave (Vp) and S-wave (Vs) velocities through the following
equation:
(Eq. 4.16)
Reflection coefficient (R) is the ratio defining the amplitude (energy) of a reflected wave to
the incident wave. For a normal incident wave, the reflection coefficient (R) has typical
values ranging from −1 to +1 and can be expressed as:
(Eq. 4.17)
Where;
ρ₁ is = density of medium 1, V1 is = velocity of medium 1, Z1= Acoustic impedance of
medium 1
V2 is = density of medium 2, V₂ is = velocity of medium 2 and Z2 = Acoustic impedance of
medium 2

Chapter 4. AVO/ AVA Modeling
65
For non-normal incidence angles, there exist four independent variables (Ostrander, 1984)
exist at a reflecting/ refracting interface controlling the reflection and transmission
coefficients between two isotropic materials: (a) the Vp ratio between the two media, (b) the
density ratio between the two media, (c) Poisson’s ratio in the upper medium and (d)
Poisson’s ratio in the lower medium
Based on Zoeppritz (1919) equations, Rutherford and Williams grouped gas sands into three
classes each of which is defined by their normal incidence reflection coefficient. Only the
shale/ sand reflectivity is considered and several factors such as bed tunning, attenuation and
propagation effects are not considered in the classification scheme. The different classes are
summarised as follows:
Class I: High Impedance Sands
The impedance is higher than the surrounding shales with a large positive value for the zero
offset reflection coefficient at the shale/ sand interface. This decrease in magnitude with
offset and a polarity change at large offsets / angles. The sands are quite mature, having
undergone moderate to high compaction. They are normally associated with areas onshore
though in uplifted areas such as in the Barents Sea region, such sands could be expected.
Class II: Near-zero Impedance Sands
The impedance is quite small and identical to that of the encasing material with reflection
coefficients values close to zero. It is either a small positive or negative value. This is often
difficult to detect in the presence of noise. A large fractional change in reflectivity occurs
from near to far offsets. If the reflection coefficient at zero offset is positive, then a polarity
change occurs. These sands are often moderately compacted and consolidated. They are
generally associated with areas both onshore and offshore.
Class III and IV: Low Impedance Sands
The impedance is lower than the encasing medium. Amplitude anomalies ‘bright spots’
occur on stacked seismic data with large reflectivities for all offsets. The fractional changes
in amplitudes as a function of offset are generally small. No polarity change occurs. For
class III, amplitudes increase with offset whereas for class IV, amplitudes decrease with
offset (positive AVO gradient). Both are associated with marine environment
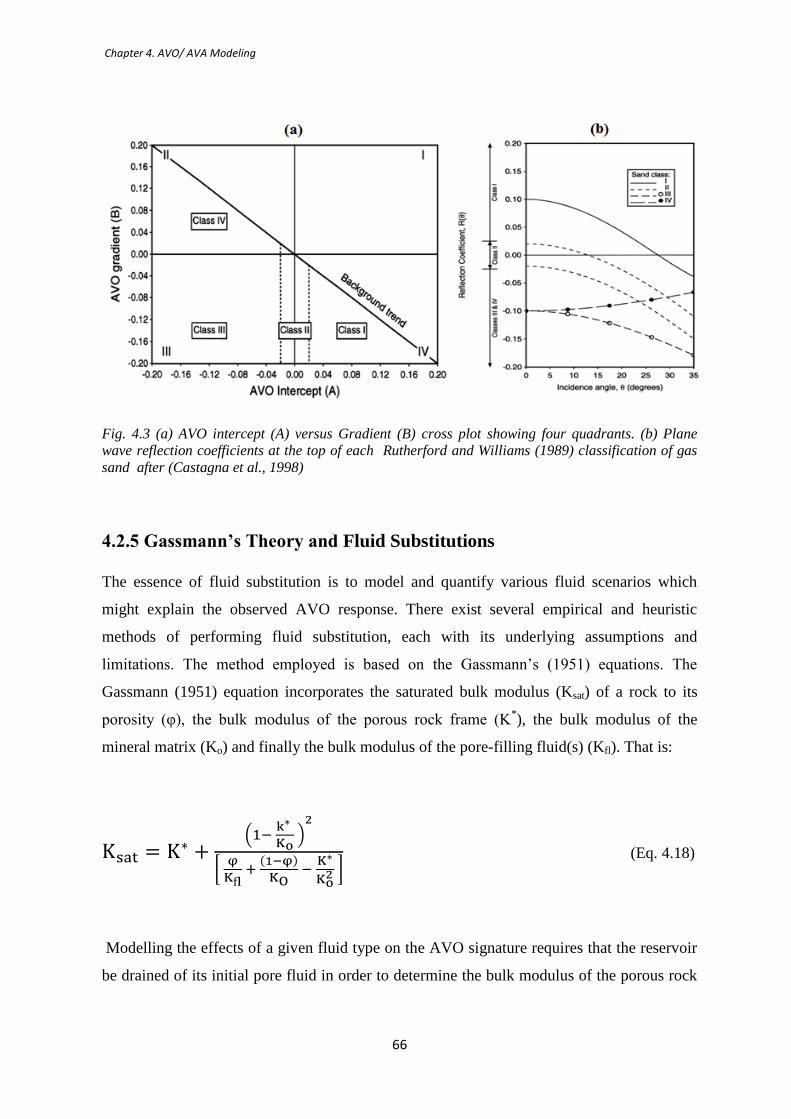
Chapter 4. AVO/ AVA Modeling
66
Fig. 4.3 (a) AVO intercept (A) versus Gradient (B) cross plot showing four quadrants. (b) Plane
wave reflection coefficients at the top of each Rutherford and Williams (1989) classification of gas
sand after (Castagna et al., 1998)
4.2.5 Gassmann’s Theory and Fluid Substitutions
The essence of fluid substitution is to model and quantify various fluid scenarios which
might explain the observed AVO response. There exist several empirical and heuristic
methods of performing fluid substitution, each with its underlying assumptions and
limitations. The method employed is based on the Gassmann’s (1951) equations. The
Gassmann (1951) equation incorporates the saturated bulk modulus (Ksat) of a rock to its
porosity (φ), the bulk modulus of the porous rock frame (K*), the bulk modulus of the
mineral matrix (Ko) and finally the bulk modulus of the pore-filling fluid(s) (Kfl). That is:
(Eq. 4.18)
Modelling the effects of a given fluid type on the AVO signature requires that the reservoir
be drained of its initial pore fluid in order to determine the bulk modulus of the porous rock

Chapter 4. AVO/ AVA Modeling
67
frame after which fluid substitution is employed and the bulk modulus of the rock saturated
with the substituting (new) fluid is calculated. K*
remains unchanged after fluid substitution.
Despite the robustness and general nature of this equation, it is based on a number of
assumptions which are: the rock is homogenous, isotropic, well connected pore network; the
saturating pore fluid is homogenous. The assumption on fluid immiscibility and
homogeneity are thought to be accomplished by systems which have attained phase
equilibrium over geologic time (Smith et al., 2003). Final assumption is, low seismic
frequencies to allow for pressure equalization on a scale greater than pore dimension and
less than the wavelength of propagating wave.
The bulk modulus of an isotropic rock is the ratio of hydrostatic stress to volumetric strain
and obtained from wire line log analysis using P- and S-wave velocities and bulk density (ρb)
measurements by employing the following equation:
(Eq. 4.19)
The bulk density (ρb), being an important input parameter in performing fluid substitution, is
however related to the fluid density (ρfl), porosity (φ), and grain density (ρg) through the
following equation which can also be solved to obtain the porosity:
(Eq. 4.20)
Given the parameters in Equations 4.19 and 4.20, P-wave velocity is however calculated as:
(Eq. 4.21)
Fluid parameters also have to be analyzed carefully as this yield misleading outputs for the
bulk modulus after fluid substitution. Therefore a priori knowledge of both the in-situ and
substituting fluid’s bulk modulus (Kfl) and density (ρfl) is necessary. Following the

Chapter 4. AVO/ AVA Modeling
68
assumption of a homogenous saturation, fluid parameters are calculated using the iso – stress
(Reuss) harmonic average for a two phase water-hydrocarbon system as:
(Eq. 4.22)
For the fluid density, we have:
(Eq. 4.23)
Where: Kw is the bulk modulus of water, Sw is the water saturation and Khc is the bulk
modulus of hydrocarbon fluid.
Mineralogical composition of the rock is required to calculate the bulk modulus of the
mineral matrix (Ko). This is commonly obtained from core samples, in the absence of which
the constituent mineral fractions are approximated using the gamma ray log (Vclay)
considering only quartz and clay end members. Ko is calculated from the volume fractions of
the rock and elastic moduli of the various phases using several effective medium models
such as Voigt-Reuss-Hill (VHR) average or the Hashin – Shtrikman (HS) average.
The shear modulus (µ) defined as the ratio of shear stress to shear strain is a rock frame
parameter which is rather independent on the pore fluid(s), there by remains unchanged
after fluid substitution. It is computed using the following equation:
(Eq. 4.24)
Consequently, Shear wave velocity can be calculated by rewriting Equation 4.24 as:
(Eq. 4.25)
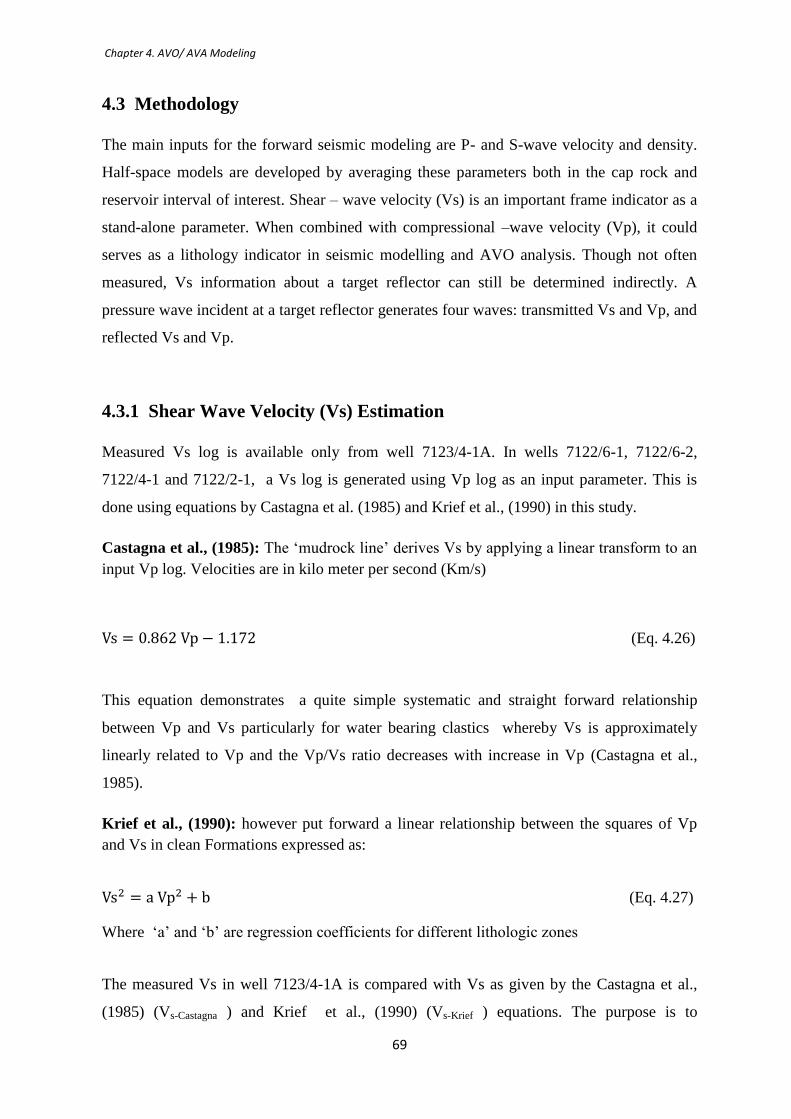
Chapter 4. AVO/ AVA Modeling
69
4.3 Methodology
The main inputs for the forward seismic modeling are P- and S-wave velocity and density.
Half-space models are developed by averaging these parameters both in the cap rock and
reservoir interval of interest. Shear – wave velocity (Vs) is an important frame indicator as a
stand-alone parameter. When combined with compressional –wave velocity (Vp), it could
serves as a lithology indicator in seismic modelling and AVO analysis. Though not often
measured, Vs information about a target reflector can still be determined indirectly. A
pressure wave incident at a target reflector generates four waves: transmitted Vs and Vp, and
reflected Vs and Vp.
4.3.1 Shear Wave Velocity (Vs) Estimation
Measured Vs log is available only from well 7123/4-1A. In wells 7122/6-1, 7122/6-2,
7122/4-1 and 7122/2-1, a Vs log is generated using Vp log as an input parameter. This is
done using equations by Castagna et al. (1985) and Krief et al., (1990) in this study.
Castagna et al., (1985): The ‘mudrock line’ derives Vs by applying a linear transform to an
input Vp log. Velocities are in kilo meter per second (Km/s)
(Eq. 4.26)
This equation demonstrates a quite simple systematic and straight forward relationship
between Vp and Vs particularly for water bearing clastics whereby Vs is approximately
linearly related to Vp and the Vp/Vs ratio decreases with increase in Vp (Castagna et al.,
1985).
Krief et al., (1990): however put forward a linear relationship between the squares of Vp
and Vs in clean Formations expressed as:
(Eq. 4.27)
Where ‘a’ and ‘b’ are regression coefficients for different lithologic zones
The measured Vs in well 7123/4-1A is compared with Vs as given by the Castagna et al.,
(1985) (Vs-Castagna ) and Krief et al., (1990) (Vs-Krief ) equations. The purpose is to
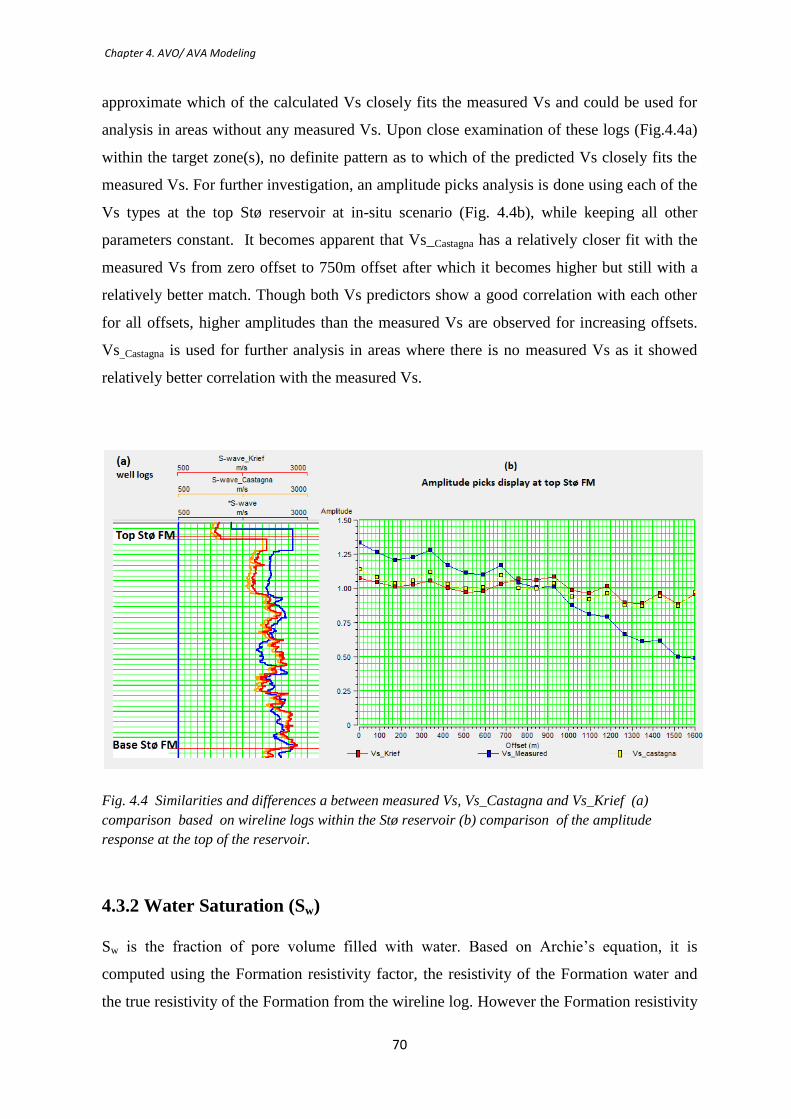
Chapter 4. AVO/ AVA Modeling
70
approximate which of the calculated Vs closely fits the measured Vs and could be used for
analysis in areas without any measured Vs. Upon close examination of these logs (Fig.4.4a)
within the target zone(s), no definite pattern as to which of the predicted Vs closely fits the
measured Vs. For further investigation, an amplitude picks analysis is done using each of the
Vs types at the top Stø reservoir at in-situ scenario (Fig. 4.4b), while keeping all other
parameters constant. It becomes apparent that Vs_Castagna has a relatively closer fit with the
measured Vs from zero offset to 750m offset after which it becomes higher but still with a
relatively better match. Though both Vs predictors show a good correlation with each other
for all offsets, higher amplitudes than the measured Vs are observed for increasing offsets.
Vs_Castagna is used for further analysis in areas where there is no measured Vs as it showed
relatively better correlation with the measured Vs.
Fig. 4.4 Similarities and differences a between measured Vs, Vs_Castagna and Vs_Krief (a)
comparison based on wireline logs within the Stø reservoir (b) comparison of the amplitude
response at the top of the reservoir.
4.3.2 Water Saturation (Sw)
Sw is the fraction of pore volume filled with water. Based on Archie’s equation, it is
computed using the Formation resistivity factor, the resistivity of the Formation water and
the true resistivity of the Formation from the wireline log. However the Formation resistivity

Chapter 4. AVO/ AVA Modeling
71
factor is dependent on the porosity and two empirical constants one of which is
multiplicative and the other is an exponent. These constants are formation dependent.
(Eq. 4.28)
Where: a is cementation factor, φ is porosity, m is cementation exponent, Rw is resistivity of
Formation water and Rt is true resistivity.
4.3.3 Density to Porosity Transform
Density to porosity transform is applied to well 7122/4-1 where porosity (φ) is calculated by
using a matrix density (ρma) of 2.65, a fluid density (ρfl) of 1.09g/cc and the observed log
density (ρlog) as follows:
(Eq. 4.29)
4.3.4 Wavelet
A wavelet is a mathematical representation of a source function. It is both time varying and
complex in shape and can be analyzed as a time series in the time domain or in the frequency
domains as a phase or amplitude spectrum. Ideally, a wavelet would be a spike in time with a
flat amplitude spectrum. There are several types of wavelets, two of which are commonly
used.
Minimum phase wavelets: whereby the energy concentration is at the start of the wavelet.
There is no negative energy at time zero, implying that the wavelet is causal.
Zero phase wavelets: it is time symmetrical (non-causal) with negative energy arriving
before time zero. Though physically not realistic, it is used by virtue of its resolving power.
The Ricker zero phase wavelet is used herein to generate synthetic seismograms. It consists
of a central peak and two side lobes. It has a dominant frequency at 45Hz, a sample rate of
2(ms) and a wavelet length of 200m. Basically this wavelet is defined by its peak frequency
in the amplitude spectrum or the dominant period in time. The wavelet period is the time
interval from one trough to the other. A broad amplitude spectrum results in a more
compressed pulse in time indicating an increase in the resolution (Fig. 4.5a). A zero phase

Chapter 4. AVO/ AVA Modeling
72
wavelet is desirable because since the energy is concentrated at a positive peak, a
convolution with a reflection coefficient yields a better resolution of the reflection.
Fig. 4.5 Ricker zero phase wavelets in time and frequency domain for different parameters. (a) The
dominant frequency is at 45Hz, sample rate of 2(ms) and wavelet length of 200m. It is used in this
study. (b) Is a 20Hz wavelet, with a sample rate of 2(ms), a wavelet length of 200m.
4.3.5 Upscaling
Seismic frequency in the Hertz (Hz) range samples large portions of the sub-surface. Thus,
elastic properties from seismic data are those averaged over relatively large intervals.
Inherent to generating synthetic seismograms is the process of relating the logging
frequencies to seismic wavelengths since synthetics correlate well bore-derived rock
properties to seismic data. This poses a problem of difference of scale between the logging
frequency in the Kilo Hertz (KHz) range and seismic data in the Hz range. There are several
blocking models such as the Backus average and traveltime (slowness) average.
Vp, Vs and bulk density logs are blocked in order to keep the low frequency variations
thereby allowing the definition of interfaces between various facies. This is most important
for this data type as it is observed that the choice of the block size will greatly condition the
synthetic output and eventually influence the AVO signature leading to erroneous
interpretations. A block size difference of just 3m gives a completely different amplitude
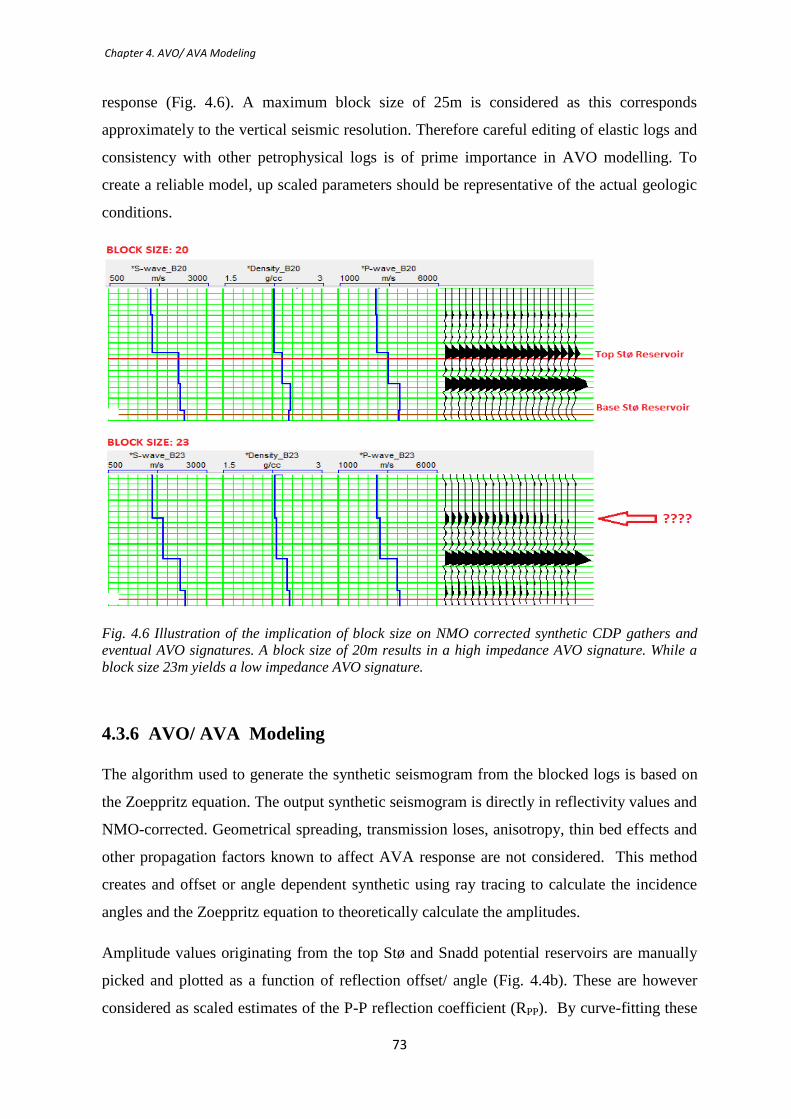
Chapter 4. AVO/ AVA Modeling
73
response (Fig. 4.6). A maximum block size of 25m is considered as this corresponds
approximately to the vertical seismic resolution. Therefore careful editing of elastic logs and
consistency with other petrophysical logs is of prime importance in AVO modelling. To
create a reliable model, up scaled parameters should be representative of the actual geologic
conditions.
Fig. 4.6 Illustration of the implication of block size on NMO corrected synthetic CDP gathers and
eventual AVO signatures. A block size of 20m results in a high impedance AVO signature. While a
block size 23m yields a low impedance AVO signature.
4.3.6 AVO/ AVA Modeling
The algorithm used to generate the synthetic seismogram from the blocked logs is based on
the Zoeppritz equation. The output synthetic seismogram is directly in reflectivity values and
NMO-corrected. Geometrical spreading, transmission loses, anisotropy, thin bed effects and
other propagation factors known to affect AVA response are not considered. This method
creates and offset or angle dependent synthetic using ray tracing to calculate the incidence
angles and the Zoeppritz equation to theoretically calculate the amplitudes.
Amplitude values originating from the top Stø and Snadd potential reservoirs are manually
picked and plotted as a function of reflection offset/ angle (Fig. 4.4b). These are however
considered as scaled estimates of the P-P reflection coefficient (RPP). By curve-fitting these

Chapter 4. AVO/ AVA Modeling
74
picked amplitude values to the theoretical RPP values given by the Zoeppritz equations,
estimates of P-wave reflectivities are obtained.
AVA analysis is carried out on reflectivity values from the top Stø and Snadd reservoirs
using the two term Aki-Richards approximations to the Zoeppritz equation. The results are
plotted based on the Rutherford and William’s reservoir sands classification scheme
(Fig. 4.3). This procedure is performed for the in-situ scenario of both reservoir intervals.
Pore fluid substitutions based on the Gassmann equations, for extreme cases are performed
to model 90% gas and 90% oil scenarios for the Stø reservoir. The assumed 10% water
saturation in both models is to approximate for irreducible water saturation. During the
substitution of the in-situ fluid by 90% gas, the following petrophysical parameters are used:
the matrix is considered to be clean sandstones by default with a bulk modulus of 40 GPa,
shear modulus of 44 GPa, and a matrix density of 2.65 g/cc. The hydrocarbon gas type is
default such that the bulk modulus is 0.021 GPa and density of 0.1 g/cc.
For the 90% Oil scenario, the matrix properties are kept constant as in the gas case. However
the oil properties are also considered by default to have a modulus of 1GPa and a density of
0.75 g/cc.
For the Snadd reservoir, the purpose of modelling Brine – filled reservoir is to nullify the
possible influence of varying quantities of gas and oil showings at different depth levels
present in the Snadd Formation as reported by the Norwegian Petroleum Directorate. This
gives control over the reservoir fluids to enable a further investigation of lithology and depth
effects on the resultant AVA response based on the assumptions upon which the model is
developed. The properties of brine used are: density of 1.09 g/cc and a modulus of 2.38 GPa.
After substituting the in-situ fluids, the AVA response for each pore fluid model is
investigated and the results are plotted using thesame classification scheme as in the in-situ
scenario for both the Stø and Snadd reservoirs.
Sensitivity analysis is performed using the Stø reservoir interval with well 7123/4-1A, to
investigate how changes in acoustic and elastic rock parameters, influence seismic response
eventual AVO signatures. The in-situ scenario (brine) is successively substituted with 10%,
50% and 90% gas saturations. The respective synthetic seismograms are generated and AVA
analysis carried out.

Chapter 4. AVO/ AVA Modeling
75
4.4 Results
Due to scaling during the conversion of amplitudes to reflectivities, the following scale is
adapted particularly for this study to enable classification of the resultant AVA responses:
Table. 4.1 Adapted range of reflectivity values used to classify AVA response.
Reflectivity range Classification
− 0.035 − 0 Class II
0 − 0.035 Class II P
0.035 − 0.07 Class I
4.4.1 Stø Reservoir
A plot of Rp as a function of angle up to 40⁰ for the top Stø reservoir at in-situ scenario
(Fig. 4.7) shows varying but high Rp values from wells 7123/4-1A and 7122/6-1. In Well
7122/6-2, Rp is relatively lower and well 7122/4-1, located about 39km to the west of the
other three wells, towards the Snøhvit field, the Stø reservoir rather displays very low Rp. A
classification of the AVO response of the Stø reservoir sands at in-situ scenario, oil – filled
and gas – filled scenarios are summarized in Table 4.2.
Table. 4.2 Top reservoir sand reflection coefficient versus angle behaviour of the Stø reservoir
for different fluid scenarios
Wells Scenario Class Quadrant Intercept
Gradient
7123/4-1A In-situ I IV + -
Oil Weak II P IV + -
Gas II P IV + -
7122/6-1 In-situ I IV + - Oil Weak II P IV + -
Gas II P IV + -
7122/6-2 In-situ Weak II P IV + -
Oil Weak II P IV + -
Gas II P IV + -
7122/4-1 In-situ II P IV + -
Oil II IV - -
Gas II IV - -
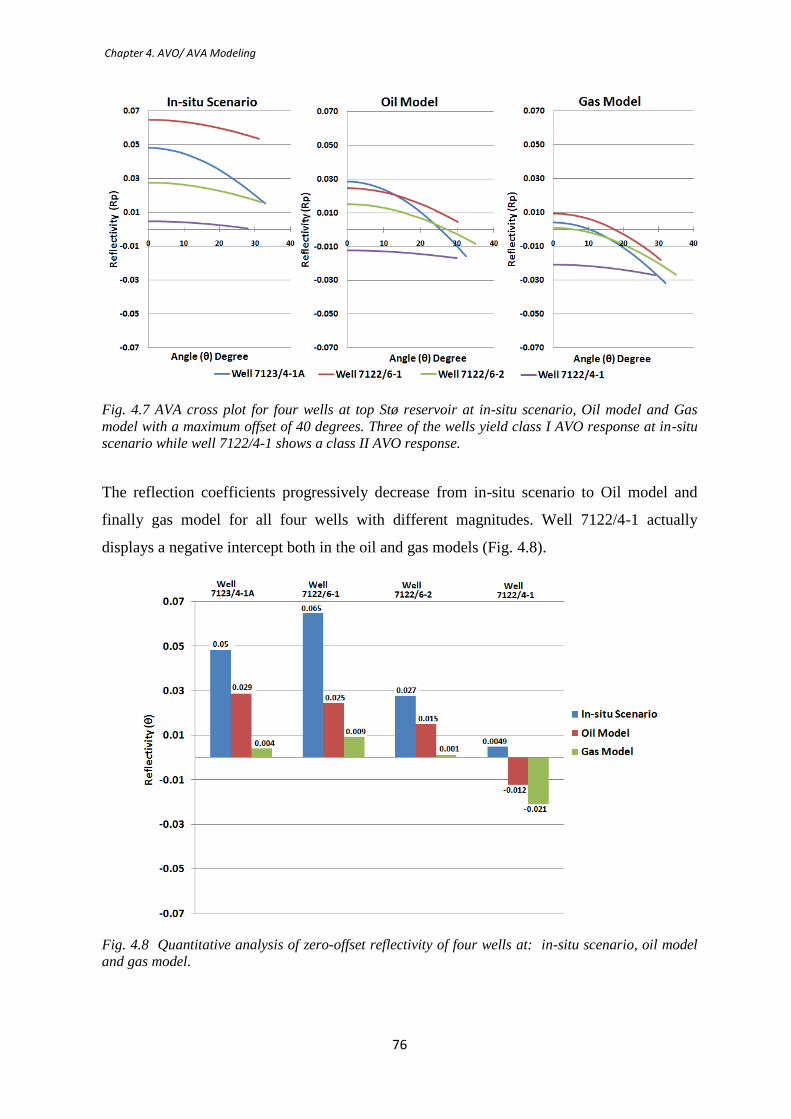
Chapter 4. AVO/ AVA Modeling
76
Fig. 4.7 AVA cross plot for four wells at top Stø reservoir at in-situ scenario, Oil model and Gas
model with a maximum offset of 40 degrees. Three of the wells yield class I AVO response at in-situ
scenario while well 7122/4-1 shows a class II AVO response.
The reflection coefficients progressively decrease from in-situ scenario to Oil model and
finally gas model for all four wells with different magnitudes. Well 7122/4-1 actually
displays a negative intercept both in the oil and gas models (Fig. 4.8).
Fig. 4.8 Quantitative analysis of zero-offset reflectivity of four wells at: in-situ scenario, oil model
and gas model.
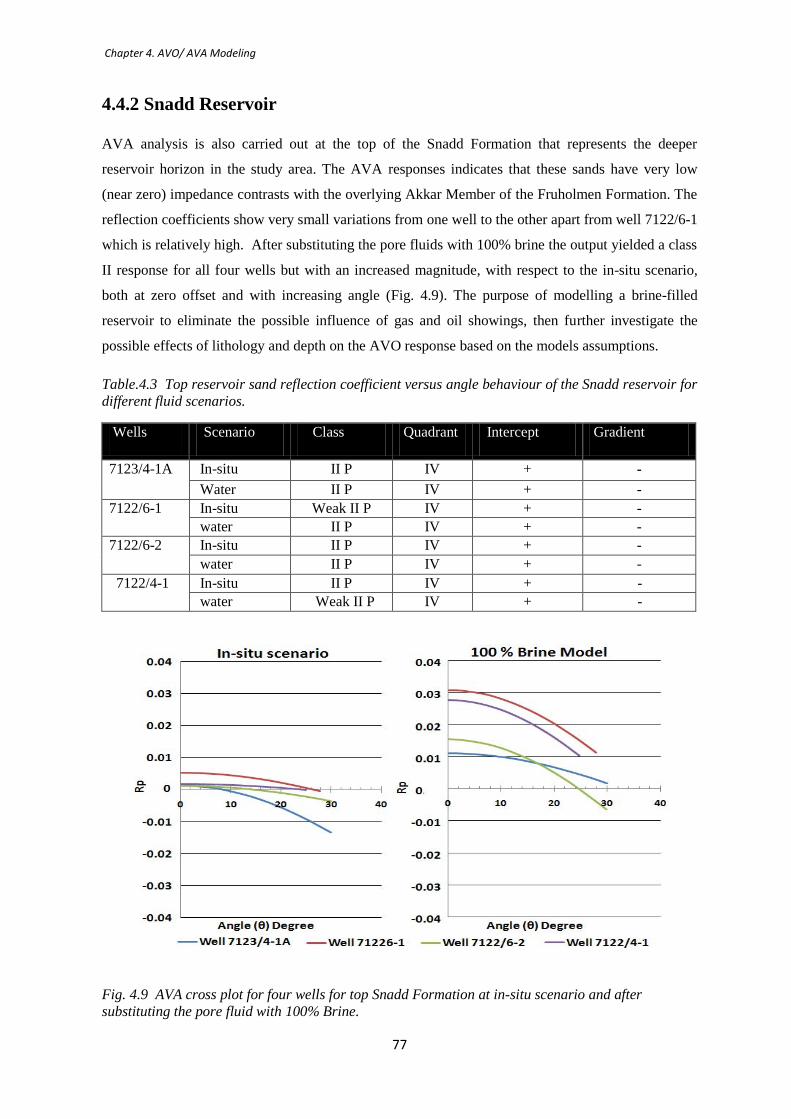
Chapter 4. AVO/ AVA Modeling
77
4.4.2 Snadd Reservoir
AVA analysis is also carried out at the top of the Snadd Formation that represents the deeper
reservoir horizon in the study area. The AVA responses indicates that these sands have very low
(near zero) impedance contrasts with the overlying Akkar Member of the Fruholmen Formation. The
reflection coefficients show very small variations from one well to the other apart from well 7122/6-1
which is relatively high. After substituting the pore fluids with 100% brine the output yielded a class
II response for all four wells but with an increased magnitude, with respect to the in-situ scenario,
both at zero offset and with increasing angle (Fig. 4.9). The purpose of modelling a brine-filled
reservoir to eliminate the possible influence of gas and oil showings, then further investigate the
possible effects of lithology and depth on the AVO response based on the models assumptions.
Table.4.3 Top reservoir sand reflection coefficient versus angle behaviour of the Snadd reservoir for
different fluid scenarios.
Wells Scenario Class Quadrant Intercept Gradient
7123/4-1A In-situ II P IV + -
Water II P IV + -
7122/6-1 In-situ Weak II P IV + -
water II P IV + -
7122/6-2 In-situ II P IV + -
water II P IV + -
7122/4-1 In-situ II P IV + -
water Weak II P IV + -
Fig. 4.9 AVA cross plot for four wells for top Snadd Formation at in-situ scenario and after
substituting the pore fluid with 100% Brine.

Chapter 4. AVO/ AVA Modeling
78
In order to quantitatively illustrate the magnitude of variations in reflectivity, zero offset P-
wave reflection coefficients of the all four wells for the two fluid scenarios are plotted as
shown in Figure 4.10. It shows a relatively large increase in reflectivity with varying extents
(for different wells) suggesting an indication of the possible effects of oil and gas shows on
the AVA response.
Fig. 4.10 Illustration of zero offset reflectivity for four wells at in-situ scenario (blue) and at 100%
brine saturation (red).
4.4.3 Sensitivity Analysis
Using well 7123/4-1A, an investigation of the dependence of seismic signatures and eventual
AVO responses on acoustic and elastic rock properties by varying the pore fluid saturation
using a two phase water – gas system gives quite interesting results. At the in-situ scenario,
the Stø Formation displays a positive reflection coefficient at normal angles of incidence.
Introduction of an initial 10% gas significantly results in a visible and direct change in the
seismic response. However, increasing gas saturation to 50% yields a very mild change on
the synthetics when compared with the 10% scenario. Further increase in the gas saturation
to 90% does not lead to a clear change on the synthetics at the top of the reservoir
(Fig. 4.11).

Chapter 4. AVO/ AVA Modeling
79
Fig. 4.11 Comparison of seismic responses to changes in reservoir fluid property and saturations
from in-situ fluid (brine) to 10%, 50% and 90% gas saturations respectively. The offset range is from
0m to 1600m in all cases. Note the large change from in-situ scenario to 10% gas saturation.
To quantify fluid saturation effects, on the AVO response, relative percentage changes in
Vp, Vs, bulk density and Poisson’s ratio for the different gas saturations are calculated and
the results are displayed in Figure 4.12. A 10% gas saturation results in a dramatic decrease
in Vp by a factor of −16.05%. The Poisson’s ratio decreases by a factor of −59.79% and the
density by −1.06 %. At gas saturations of 50% gas (brine 50%) and 90% gas, the relative
decrease in Vp is −15.72% and a further small decrease by −13.97% respectively. The
difference in Poisson’s ratio decrease between gas saturations of 50 to 90% is quite small
(0.96) compared to gas saturations of 10 to 50% (9.25). Density decreases with increasing
gas saturation. Vs on the contrary increase steadily, with small increments for the various
gas saturations.
Fig. 4.12 Fluid saturation effects on dynamic elastic properties of the Stø reservoir sands.
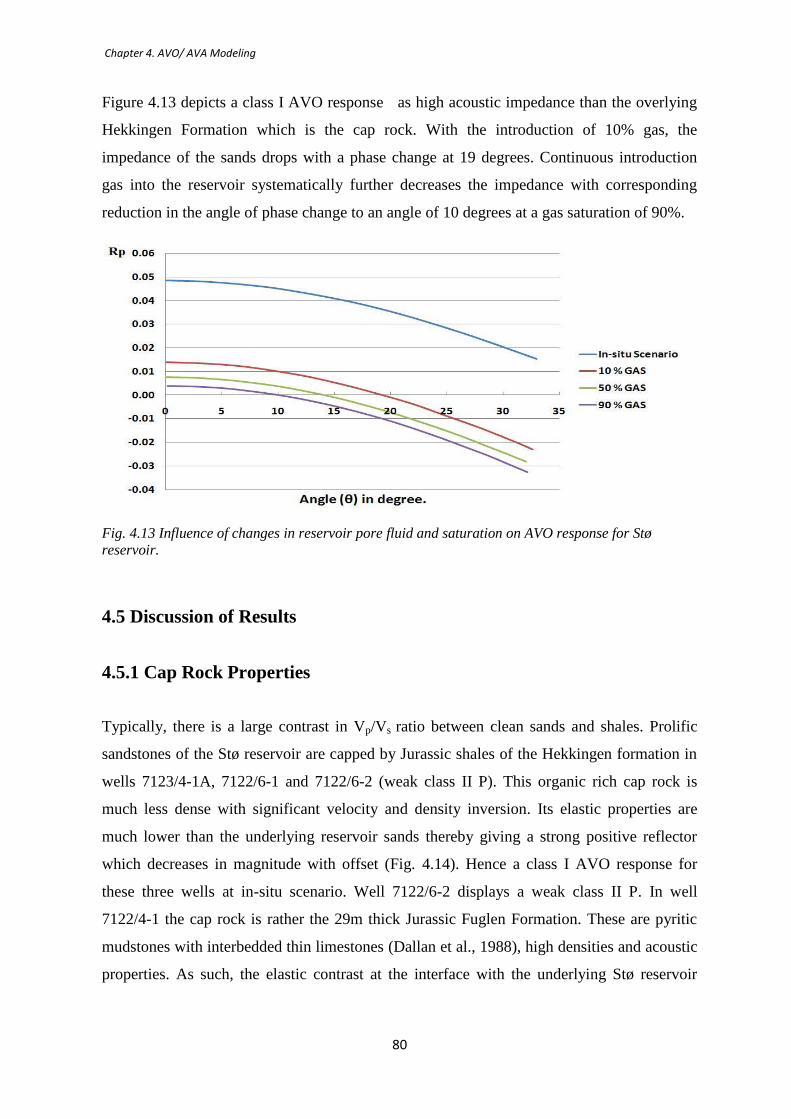
Chapter 4. AVO/ AVA Modeling
80
Figure 4.13 depicts a class I AVO response as high acoustic impedance than the overlying
Hekkingen Formation which is the cap rock. With the introduction of 10% gas, the
impedance of the sands drops with a phase change at 19 degrees. Continuous introduction
gas into the reservoir systematically further decreases the impedance with corresponding
reduction in the angle of phase change to an angle of 10 degrees at a gas saturation of 90%.
Fig. 4.13 Influence of changes in reservoir pore fluid and saturation on AVO response for Stø
reservoir.
4.5 Discussion of Results
4.5.1 Cap Rock Properties
Typically, there is a large contrast in Vp/Vs ratio between clean sands and shales. Prolific
sandstones of the Stø reservoir are capped by Jurassic shales of the Hekkingen formation in
wells 7123/4-1A, 7122/6-1 and 7122/6-2 (weak class II P). This organic rich cap rock is
much less dense with significant velocity and density inversion. Its elastic properties are
much lower than the underlying reservoir sands thereby giving a strong positive reflector
which decreases in magnitude with offset (Fig. 4.14). Hence a class I AVO response for
these three wells at in-situ scenario. Well 7122/6-2 displays a weak class II P. In well
7122/4-1 the cap rock is rather the 29m thick Jurassic Fuglen Formation. These are pyritic
mudstones with interbedded thin limestones (Dallan et al., 1988), high densities and acoustic
properties. As such, the elastic contrast at the interface with the underlying Stø reservoir

Chapter 4. AVO/ AVA Modeling
81
sands is quite small. This inevitably results in a strong class II P AVO anomaly for the in-
situ scenario.
Fig. 4.14 Lateral variations in cap rock properties and its influence on AVO interpretation
Considering the interface between Triassic heterolithic Snadd reservoir sandstones and the
Akkar Member of the Fruholmen Formation as caprock at in-situ condition, there is no major
lateral change in the cap rock. The acoustic impedance contrast is quite small resulting from
similar elastic properties across the interface. This similarity in elastic properties reflects the
degree of heterogeneity within the Snadd reservoir with relatively high shale content
(Fig.4.15), thereby yielding very low impedance AVO response for all wells.
Fig. 4.15 High gamma ray measurements across the studied Snadd reservoir for five wells.
Reservoir heterogeneity is largely related to different sediment provenances during the Triassic.
Therefore, the AVO response of the Stø reservoir is largely controlled by the cap rock
properties. The Hekkingen – Fuglen interface in well 7122/4-1 could be misinterpreted as
corresponding to thesame interface of Hekkingen – Stø in well 7123/4-1A as a result of the
lateral lithological variation of the cap rock (Fig. 4.14).

Chapter 4. AVO/ AVA Modeling
82
4.5.2 Pore Fluid Property and Saturation Effects on AVO Response
So far mainly the effects of changes in elastic property across the cap rock – reservoir
interface on the AVO response have been considered. An equally important issue is the
effects of changes in fluid properties on AVO response after the pore fluid saturant is
changed (Fig. 4.7). Brine is highly incompressible therefore substituting it with more
compressible fluids such as oil and gas reduces the incompressibility of the Stø sandstones.
Thus the bulk modulus of the brine – saturated reservoir sands is higher than that of the gas
model. This result in the Vp of the brine-saturated in-situ scenario to be considerably higher
than that of the gas model. Vs increases slightly as a result of the density reduction
(Eq. 4.25). This reduces the Vp/Vs ratio with ΔVp and Δρ becoming more negative. The
Poisson’s ratio also consequently drops algebraically with an increase in pore fluid
compressibility. Thus considering the top Stø reservoir reflection (Fig. 4.7), successively
replacing the in-situ pore fluid (Brine) with oil and finally gas causes both Rp and G to
become more negative (Eq. 4.6 and Eq. 4.5) with different magnitudes, than for the
corresponding fully brine (in-situ ) saturated sands. This results in a decrease in reflection
coefficients with angle of incidence and a reverse in polarity at angles of < 19⁰ after
introducing an initial 10% gas into the reservoir (Fig. 4.13). The change in pore fluid
compressibility caused a maximum velocity variation of 16.05 % (Fig. 4.12), however
previous work (Hicks and Berry, 1956) predicted a maximum velocity variation in the range
of 15 to 20 %. Substantially changing the Poisson’s ratio between the Hekkingen
Formation and Stø reservoir, by changing the reservoir pore fluid properties, results in large
decrease P-wave reflection coefficient (more negative) with angle of incidence.
Table. 4.4 Pore fluids saturation effects on Vs and shear modulus.
Pore fluid saturation (%) Vs (m/s) Shear Modulus (GPa)
In-situ (Brine filled) 1612.43 5.88
10% gas 1621.00 5.89
50% gas 1656.72 5.90
90 % gas 1694.90 5.90

Chapter 4. AVO/ AVA Modeling
83
Fig. 4.16 Cross plots of (a) Ksat (b) Density (c) P-wave velocity (d) Vp /Vs ratio as a function of gas
saturation.
Employing a two phase, water – gas, system to investigate the effects of saturation is of
particular interest as the two fluids have contrasting properties. Brine and oil is usually
considered to have similar acoustic impedances. Considering Equation (4.19), an initial
introduction of 10% gas results in a dramatic drop in the saturated bulk modulus (Ksat) while
the density experiences only a comparatively slight decrease (Fig.4.16). This is reflected by
initial decrease in Vp seen both on seismic (Fig.4.11) and AVO response (Fig.4.13) with a
significant decrease in Rp as a function of angle (θ). Between gas saturations of 50 – 90%,
Ksat seems to stabilize while the density is still in sharp decline, suggesting that at these
saturations density is the controlling factor given that the shear modulus and other factors
influencing Vp are constant. Vs increase slightly while the shear modulus remains
practically unchanged (Table. 4.4). With a small increase in Vs, the change in Vp/Vs ratio is
small and the Poisson’s ratio change at these same saturations is very little with a value of
0.01(Fig. 4.12) resulting in a relatively smaller difference in the AVO response when
compared with the 10% gas saturation (Fig. 4.13). Vp/Vs ratio have been demonstrated to
be characteristically > 2.0 for water – saturated unconsolidated rocks and values of < 2.0
indicated either well – consolidate rock or the presence of gas in unconsolidated sand
(Gardner and Harris, 1968). The present results do not only confirm that Vp/Vs ratio are
< 2.0 (Fig. 4.16d) in consolidated rocks but also establishes a possible variation trend for
increasing gas saturation in the Stø reservoir based on this model.

Chapter 4. AVO/ AVA Modeling
84
4.5.3 Facies Variations and Depth Dependent AVO Signature
AVO anomalies result from a combined fluid and lithology (Smith, 1987) effects, however
depth is also an important factor that should be considered during AVO analysis. The
relatively high reflection coefficients in well 7122/6-1 (Fig. 4.10) could be inferred as portraying the
sand content of the Snadd reservoir at this well location (Fig. 4.15) at in-situ condition due to high
a impedance contrast with the caprock. Investigating lithology effects by flooding the
reservoir with 100% brine will of course give higher Rp values as earlier demonstrated.
However focus is on whether the variations of the relative magnitudes of these values are a
direct result of lateral variation in lithofacies, depth or rather a combination of both factors.
Lithologic heterogeneity induces a similarity in elastic and acoustic rock properties across
the reflecting / refracting interface between the Fruholmen Formation and the Snadd
reservoir sands (Fig. 4.15). Generally, Vp/Vs ratio is higher for shales than for ‘clean’ sands.
Increasing the shale content in ‘clean’ sands will give a more dense packing of grains
thereby portraying a higher Vp/Vs ratio in the resulting ‘shaly sands’. As a result, with
similar Poisson’s ratio across the reflecting/ refracting interface, one would expect small
changes in reflection coefficients (Koefoed, 1955).
Fig. 4.17 (A ) Poisson’s ratios for different wells depicting an indication of significant lateral facies
variation within the Snadd reservoir sandstones. (B) AVO response for thesame reservoir sands with
same pore fluids but located at two widely different depths in wells 7122/4-1 and 7122/6-1.
At well 7122/4-1, the considered reservoir sands at the top of the Snadd Formation are at a
depth of 2267m BSF while at well 7122/6-1, these sands are encountered at 1767m below
sea floor making a difference in depth of 500m. This difference depth corresponds to a
vertical effective stress of 5 MPa considerable enough to yield significant amount of
mechanical compaction.

Chapter 4. AVO/ AVA Modeling
85
Velocities and densities vary considerably as a function of depth. This depth dependence is
interpreted as a result of normal compaction (no overpressures) and diagenesis. Considering
the brine model for wells 7122/4–1 and well 7122/6–1 (Fig. 4.17b), the AVO intercept
becomes more negative in well 7122/4 –1 with depth, indicating that the acoustic impedance
contrast between the Fruholmen shales and Snadd reservoir sands increases with depth
accordingly. An explanation for this difference could be deduced from the differences in
rates of compaction of shales and sandstones. That is, the density of Fruholmen shales in
well 7122/4–1 is probably higher than in well 7122/6–1 given the extra 5MPa vertical
effective stress though compaction of shales and mud rocks is a complex process of physical
and chemical changes during burial.
The AVO response of the Snadd reservoir could probably be influenced by lateral facies
variations and burial depth. This facies variation and depth dependent variation in the AVO
response of brine filled sands may provide background knowledge for modelling different
hydrocarbon scenarios.
4.5.4 Models Uncertainties
In a more advanced study, one would have to specify the percentage content of the different
minerals in the reservoir rock matrix and use an averaging scheme to compute the effective
bulk moduli. The same applies to the fluid properties where the bulk moduli could be
computed using Patchy fluid mixing reflecting actual natural systems. The possibility that
velocities of consolidated porous rocks are affected by the extent of pore fluid homogeneity
(Gregory, 1976) though is taken care of by the initial assumptions (Gassmann, 1951) upon
which the fluid replacement models are based.
The assumptions upon which these models are developed could however be invalid in
anisotropic (Brown and Korringa, 1975) and heterogeneous material with contrasting elastic
properties (Berge et al., 1998) due to violation of the assumption on pore connectivity and
homogeneity of the rock particularly within the heterogeneous Snadd reservoir. Factors such
as fluid-cement intergrannular acoustic coupling (micro-cracks in cement), and chemical
interactions and pressures could also influence or dominate the effects of fluid saturation on
rock with low porosity (Gregory, 1976). Isolating the effects facies variation from depth
would be more accurate given a good control on mineralogy and pressure variation with
depth.

Chapter 5. Summary and Conclusions
86
CHAPTER 5: SUMMARY AND CONCLUSIONS
5.1 Summary
The Barents Sea is a complex mosaic of basins and platforms with substantial hydrocarbon
reserves. Intracontinental sedimentation had been active from about 240 million years ago
(Doré and Jensen, 1996) to early Cenozoic after which it bordered the developing Atlantic
and Arctic oceans. Sedimentary Groups encountered in the study area include the Kapp
Toscana, Adventdalen, Nygrunnen, Sotbakken and Nordland Groups.
An important aspect of the burial history of these sediments is the Cenozoic uplift which had
about three different episodes (Ohm et al., 2008). This had a tremendous impact on the
Hammerfest basin sedimentation and the hydrocarbon systems therein. Some of these
include; the apparently higher source rock maturity for current burial depths for source rocks
that were in the oil window prior to uplift and the low maturity at current depths for source
rocks that had just entered the oil window prior to uplift. In certain cases, there probably
could have been a seizure of hydrocarbon generation in areas that experienced the most
uplift, higher reservoir diagenesis, though permeability may rather slightly increase in a tight
reservoir sandstones due to rock elastic expansion due to a change in stress regime, cap rock
fracture and a lower seal integrity (except in highly ductile materials), oil and gas
redistribution or re-migration. As such, evaluation of the study area as a ‘normal’ subsiding
basin would be misleading with ultimately unrealistic overestimation of rock dynamic
properties.
The Tornerose prospect is found in block 7122 on one of positive elements along the
Hammerfest basin axis. The structure is a southwards dipping rotated fault block with a NW
– SE strike. This rotated fault block forms a structural closure as the main trapping
mechanism. Based on the displacement of Formation tops, this fault has a throw of about
280m. The discovery well bore is the well 7122/6-1 with Gas and Condensates as contents.
However the Stø and studied Snadd reservoirs are water wet.
Vertical effective stress generally increases as a monotonic function of depth thus; sediments
become more compacted and consolidated. Siliciclastic sediments undergo a progressive
and systematic change in intrinsic properties starting from the time the loose sediments are
deposited at the sea floor where the compact mechanically, principally controlled by vertical
effective stress , down to higher depth whereby with increased temperatures, chemical

Chapter 5. Summary and Conclusions
87
compaction is the dominant porosity reduction process. These processes follow different
gradients for both sandstones and shales.
Analysis of vertical and spatial variation in rock properties was carried out both at Formation
and Group stratigraphic levels. Evaluation of compaction mechanisms and rock properties in
within the context of this study had been met with a number of challenges and uncertainties
as Formation evaluation entirely based on analysis of petrophysical logs and available
literature.
No quantitative mineralogical analysis was available in this study. The lack of such data is
unfortunate since mechanical and chemical compaction in mud rocks is greatly influenced by
mineralogical and textural relationships (Fawad et al., 2010). Analysis of the gamma ray log
in concert with other log types, as used in this thesis, provides mainly information on gross
lithologic variation.
The well data are from different faulted segments across the area with a long tectonic history.
Therefore, application of this simplistic method to estimate the magnitude of Cenozoic
exhumation would not be able to isolate displacement due to regional uplift and displacement
due to local fault related basin inversion. Quantification of the magnitude of these
exhumation events gives a critical insight on the evolution of rock properties and adequate
assessment of hydrocarbon systems. The method employed in this work to quantify these
events had been quite straight forward and based on an experimental compaction curve of a
well characterized synthetic kaolinite – silt (50:50) mixture from Mondol., (2011) (Personal
communication).
AVO modelling is extensively employed in hydrocarbon exploration strategies. The core of
AVO/ AVA modeling within the context of this study had been to evaluate reflectivity as a
function of offset both at in-situ condition and at different pore fluid scenarios within the Stø
and Snadd reservoirs. Investigation of the influence of some major factors that could possibly
control the AVO response at the top of the Stø and Snadd reservoirs yielded some interesting
results from which several conclusions could be deduced. The normal incidence reflection
coefficient and contrast in Poisson’s ratio between two bounding media to a greatly
determines the resultant AVO response. This contrast in Poisson’s ratio could arise from a
number of factors such as facies variation, pore fluid properties, depth and porosity. Only the
effects of the first three factors have been investigated within this study.
Chapter 5. Summary and Conclusions
88
There are pros and cons associated with each of the AVO models presented herein. The cons
are however closely associated with the some of the basic assumptions upon which the
models were built.
5.2 Conclusions
Despite various assumptions and limitation associated with the different models and
approaches employed within the context of this study, the following conclusions can be
made:
Two distinct compaction trends are found across the study area. These are namely:
mechanical and chemical compaction. Porosity reduction by mechanical compaction
of siliciclastic sediments dominates down to 1530m BSF at present burial depth. This
process is governed by vertical effective stress. At depths > 1530m BSF, chemical
compaction is the main porosity reduction process controlled by a time – temperature
integral. Sands and shales compact along different gradients with sands showing a
higher compaction gradient than the shales.
At present burial, the transition from mechanical to chemical compaction domain in
the reference well 7123/4 – 1A occurs at a depth of 1530m BSF and a present day
temperature of about 45⁰C. After correcting for Cenozoic exhumation, this transition
occurs at a depth of 3130m and at a temperature of 93⁰C. This is inferred to as
corresponding to the chemical transformation of smectite to illite. Accurate
determination of this zone is of great value when predicting reservoir quality
(porosity, permeability, and cementation) particularly within the approach of this
study where temperature information is absent.
Experimentally compacted synthetic mudstones of kaolinite – silt (50:50), is shown to
be very a valuable tool to constrain naturally compacted mudstones from the study
area. Comparatively higher density/ velocity – depth gradients are due to the presence
of non – clay constituents such as shallow biogenic silica and carbonates formed at
low temperatures. Hence the good fit with other published data on naturally
compacted samples. Experimental data has also proven to be a useful tool in
estimating the magnitude of Cenozoic estimation in the area.

Chapter 5. Summary and Conclusions
89
The magnitude of exhumation is in the range of 1200 to 1600m across the study are
without quantifying the uncertainties that are associated with the application of the
method employed for correction. An integrated approach involving several techniques
in estimating the magnitude of Cenozoic exhumation will definitely reduce the margin
of uncertainty.
The good reservoir qualities found in the Stø formation given the suggested burial
may be related to the high pore pressures in the overlying Hekkingen Formation
which could have reduced the amount of mechanical compaction in the Stø
Formation.
Averaging of petrophysical logs for the AVO analysis and modeling is of prime
importance as an inaccurate block size would definitely result in a misleading AVO
response. Averaged logs should be representative of the actual geologic conditions for
the models to be reliable.
The Stø reservoir sandstones display class I AVO response in wells 7123/4-1A,
7122/6-1, weak class II P in well 7122/6-2. In well 7122/4-1, a strong class II P AVO
response is displayed at in-situ condition. Substituting the in-situ reservoir fluid with
90% oil gives a weak class II P AVO response for wells 7123/4-1A, 7122/6-1 and
7122/6-2. Well 7122/4-1 rather displays a class II response with a negative reflection
coefficient. Substituting the in-situ fluids with 90% gas gives a class II P AVO
response for wells 7123/4-1A, 7122/6-1 and 7122/6-2. Well 7122/4-1 displays a more
negative Rp. The resultant successive changes in intercept and gradient for the
different models are largely due to the changes in pore fluid compressibility after fluid
substitution.
At in-situ condition, in areas where the Hekkingen Formation is the cap rock, the Stø
reservoir sandstones yield a class I AVO response. However, in areas where the
Fuglen Formation rather serves as the cap rock, these sands display a low impedance
class II P AVO response. The Stø reservoir sandstones are quite homogenous with
good reservoir qualities throughout the study area. The disparity in AVO
characteristic of the Stø reservoir is largely influenced by the variability in the cap
rock properties across the study area. This gives a useful insight into the controls of

Chapter 5. Summary and Conclusions
90
cap rock properties on an AVO response and should be considered during AVO
analysis.
The studied Snadd reservoir sandstones at the Top of the Formation is characterised
by a class II P AVO response at in-situ condition across the study area. The low
impedance contrast with the overlying Fruholmen formation is a direct result of the
compositional heterogeneity of these sands with high clay content resulting in small
contrast in elastic rock properties across the reflecting interface between these two
Formations.
Increase in depth influences the AVO response of the Snadd reservoir by reducing the
elastic contrast across the reflecting interface with the cap rock (Fruholmen FM). The
Intercept becomes more negative. This is related to increase in the degree of
compaction resulting from vertical effective stress.
Reservoir pore fluid replacement with an initial introduction of small gas saturations
causes pronounce reduction in elastic moduli diagnostically significant on seismic.
Changes in gas saturations, between 50 and 90 %, are not too evident on seismic due
to the low sensitivity of seismic at high gas saturation. AVO analysis gives a
quantitative measure of these systematic changes at all gas saturations with a
corresponding decrease in the AVO intercept and consequent angles of polarity
change considering an initial class I AVO response. However these results establish
possible AVO variation trends for increasing gas saturation within the Stø reservoir
sandstones.
From a broad perspective, the various models presented in this thesis give a quick
preliminary AVO evaluation of the Stø and Snadd reservoirs. With an expanding data
base, more constrains could be incorporated into these elementary models.

References
91
References
ABERCROMBIE, H. J., HUTCHEON, I. E., BLOCH, J. D. & DE, C. P. 1994. Silica activity
and the smectite-illite reaction Geology 22, 539 -542.
AKI, K. & RICHARDS, P. G. 1980. Quantitative seismology : Theory and methods W. H.
Freeman and Co., 2.
AOYAGI, K., KAZAMA, T., Sekiguchi, K., Chilingarian, G.V., 1985. Experimental
compaction of Na-montmorillonite clay mixed with crude oil and seawater,
Water.Chemical geology, 49, 385 – 392.
ATHY, L.F., 1930. Density, porosity, and compaction of sedimentary rocks. American
Association of Petroleum Geologists Bulletin 14 (1), 1–24.
AVSETH, P. 2010. Explorational Rock Physics – The Link Between Geological Processes
and Geophysical Observables. In Petroleum Geoscience: From Sedimentary
Environments to Rock Physics. Springer Berlin Heidelberg 2010. 403 – 426.
AVSETH 2005. Quantitative Seismic Interpretation: applying rock physics tools to reduce
interpretatin risk. Cambridge University Press.
BALDWIN, B., BUTLER, C.O., 1985. Compaction curves. American Association of
Petroleum Geologists Bulletin 69 (4), 622–626.
BALDWIN, B., 1971. Ways of deciphering compacted sediments. Journal of Sedimentary
Petrology 41 (1), 293–301.
BERGE, P. A., THIMUS, J. F., ABOUSLEIMAN, Y., CHENG, A. H. D., COUSSY, O. &
DETOURNAY, E. 1998. Pore Compressibility in rocks. Biot Conference on
Poromechanics: Universite Catholique de Louvain, 351 - 356.
BERNABÉ, Y., FRYER, D. T. & HAYES, J. A. 1992. The effect of cement on the strength
of granular rocks. Geophys. Res. Lett., 19, 1511-1514.
BIRD, K. J., CHARPENTIER, R. R., GAUTIER, D. L., HOUSEKNECHT, D. W., KLETT,
T. R., PITMAN, J. K., MOORE, T. E., SCHENK, C. J., TENNYSON, M. E. A. &
WANDREY, C. J. 2008. Circum-Arctic Resource Appraisal: Estimates of
Undiscovered Oil and Gas North of the Arctic Circle. U.S Geological Survey 1.0,
3049.
References
92
BJØRKUM, P. A., OELKERS, E. H., NADEAU, P. H., WALDERHAUG, O. & MURPHY,
W. 1998. Porosity prediction in quartzose sandstones as a function of time,
temperature, depth, stylolite frequency, and hydrocarbon saturation AAPG Bulletin,
82, 637.
BJØRLYKKE, K. 1995. Geochemical constraints from formation water analyses from the
North Sea and the Gulf Coast Basins on quartz, feldspar and illite precipitation in
reservoir rocks Geological Society of London, 86, 33.
BJØRLYKKE, K. 1998. Clay mineral diagenesis in sedimentary basins — a key to the
prediction of rock properties. Examples from the North Sea Basin 33, 15.
BJØRLYKKE, K., CHUHAN, F., KJELDSTAD, A., GUNDERSEN, E., LAUVRAK, O. &
HGFEG, K. 2004. Modelling of sediment compaction during burial in sedimentary
basins. In: OVE, S. (ed.) Elsevier Geo-Engineering Book Series. Elsevier.
BJØRLYKKE, K., HØEG, K. & MONDOL, N. H. 2010. Introduction to Geomechanics:
Stress and Strain in Sedimentary Basins in,. Petroleum Geoscience. Springer Berlin
Heidelberg.
BJØRLYKKE, K. AND JAHREN, J. 2010. Sandstones and Sandstone Reservoirs. In
Petroleum Geoscience: From Sedimentary Environments to Rock Physics. Springer
Berlin Heidelberg 2010. 113 – 140.
BJØRLYKKE, K., RAMM, M. & SAIGAL, G. C. 1989. Sandstone diagenesis and porosity
modification during basin evolution International journal of earth sciences 78, 243.
BOLES., J. R. & FRANKS., S. G. 1979. Clay diagenesis in Wilcox sandstones of Southwest
Texas; implications of smectite diagenesis on sandstone cementation. SEPM Journal
of Sedimentary Research, 49, 55 - 70.
BROWN, R. J. S. & KORRINGA, J. 1975. ON THE DEPENDENCE OF THE ELASTIC
PROPERTIES OF A POROUS ROCK ON THE COMPRESSIBILITY OF THE
PORE FLUID. Geophysics, 40, 608-616.
BUGGE, T., ELVEBAKK, G., FANAVOLL, S., MANGERUD, G., SMELROR, M.,
WEISS, H. M., GJELBERG, J., KRISTENSEN, S. E. & NILSEN, K. 2002. Shallow

References
93
stratigraphic drilling applied in hydrocarbon exploration of the Nordkapp Basin,
Barents Sea. Marine and Petroleum Geology, 19, 13-37.
BUTT, F. A., DRANGE, H., ELVERHØI, A., OTTERÅ, O. H. & SOLHEIM, A. 2002.
Modelling Late Cenozoic isostatic elevation changes in the Barents Sea and their
implications for oceanic and climatic regimes: preliminary results. Quaternary
Science Reviews, 21, 1643-1660.
CASTAGNA, J. P., BATZLE, M. L. & EASTWOOD, R. L. 1985. Relationships between
compressional-wave and shear-wave velocities in clastic silicate rocks. Geophysics,
50, 571-581.
CASTAGNA, J. P., SWAN, H. W. & FOSTER, D. J. 1998. Framework for AVO gradient
and intercept interpretation. Geophysics, 63, 948-956.
CHUHAN, F., KJELDSTAD, A., BJØRLYKKE, K. & HOEG, K. 2002. Porosity loss in sand
by grain crushing - experimental evidence and relevance to reservoir quality Marine
and petroleum geology, 19(1), 39-53.
CHUHAN, F., KJELDSTAD, A., BJØRLYKKE, K. & HOEG, K. 2003. Experimental
compression of loose sands: relevance to porosity reduction during burial in
sedimentary basins Canadian Geotechnical journal, 40(5), 995-1011.
CORCORAN, D. V. & DORÉ, A. G. 2005. A review of techniques for the estimation of
magnitude and timing of exhumation in offshore basins. Earth-Science Reviews, 72,
129-168.
CURTIS, C. D., LIPSHIE, S. R., OERTEL, G. & PEARSON, M. J. 1980. Clay orientation in
some Upper Carboniferous mudrocks, its relationship to quartz content and some
inferences about fissility, porosity and compactional history. Sedimentology, 27, 333-
339.
DALLAN, A., WORSLEY, D. & OFSTAD, K. 1988. A lithostratigraphic scheme for the
Mesozoic and Cenozoic succession offshore mid- and northern Norway. NPD-
Bulletin, 4, 42-65.
DALLMANN, W. K. 1999. Lithostratigraphic lexicon of Svalbard. Review ad
recommendations for nomenclature use. Upper Palaeozoic to Quaternary Bedrock.
Norwegian Polar Institute, 318 pp.
References
94
DICKINSON, G., 1953. Geological aspects of abnormal reservoir pressures in the Gulf
Coast Louisiana. American Association of Petroleum Geologists Bulletin 37 (2),
410–432.
DJÉRAN-MAIGRE, I., TESSIER, D., GRUNBERGER, D., VELDE, B. & VASSEUR, G.
1998. Evolution of microstructures and of macroscopic properties of some clays
during experimental compaction. Marine and Petroleum Geology, 15, 109-128.
DORÉ, A. G. & JENSEN, L. N. 1996. The impact of late Cenozoic uplift and erosion on
hydrocarbon exploration: offshore Norway and some other uplifted basins. Global and
Planetary Change, 12, 415-436.
DOTT, R. H. 1964. Wacke, Graywacke and Matrix--What Approach to Immature Sandstone
Classification? . SEPM Journal of Sedimentary Research, 34.
DURMISHYAN, A.G., 1974. Compaction of argillaceous rocks. International Geology
Review 16 (6), 650–653.
DVORKIN, J. & NUR, A., . 1996. Elasticity of high-porosity sand-stones: Theory for two
North Sea data sets. Geophys, 61, 1363 - 1370.
EHRENBERG, S. N. & BOASSEN, T. 1993. Factors controlling permeability variation in
sandstones of the Garn Formation in Trestakk Field, Norwegian continental shelf
Journal of Sedimentary Research, 63, 929.
ENGELHARDT, W.V., Gaida, K.H., 1963. Concentration changes of poresolutions during
the compaction of clay sediments. Journal of Sedimentary Petrology 33 (4), 919–930.
ENGLAND., P. & MOLNAR., P. 1990. Surface uplift, uplift of rocks, and exhumation of
rocks. Geological Society of America, 18, 1173-1177.
FALEIDE, J. I., GUDLAUGSSON, S. T. & JACQUART, G. 1984. Evolution of the western
Barents Sea. Marine and Petroleum Geology, 1, 123-128, IN1-IN4, 129-136, IN5-
IN8, 137-150.
FALEIDE, J. I., VÅGNES, E. & GUDLAUGSSON, S. T. 1993. Late Mesozoic-Cenozoic
evolution of the south-western Barents Sea in a regional rift-shear tectonic setting.
Marine and Petroleum Geology, 10, 186-214.

References
95
FAWAD, M., MONDOL, N. H., JAHREN, J. & BJØRLYKKE, K. 2010. Microfabric and
rock properties of experimentally compressed silt-clay mixtures. Marine and
Petroleum Geology, 27, 1698-1712.
FOWLER, S.R., WHITE, R.S., LOUDEN, K.E., 1985. Sediment dewatering in the Makran
accretionary prism. Earth and Planetary Science Letters 75 (4), 427–438.
GABRIELSEN, R., H,., FÆRSETH, R., B,., JENSEN, L., N,., KALHEIM, J., E. & RIIS, F.
1990. Structural elements of the Norwegian continental shelf, Part I: The Barents Sea
Region. Norwegain Petroleum Directorate Bulletin, 6, 47.
GARDNER, G. H. F. & HARRIS, M. H. 1968. Velocity and Attenuation of Elastic waves in
Sands. PWLA 9th Annual Logging Symposium, 1968-M, 1-19.
GASSMANN, F. 1951. Elastic waves through a packing of spheres. Geophysics, 16, 673-
685.
GLØRSTAD-CLARK, E., FALEIDE, J. I., LUNDSCHIEN, B. A. & NYSTUEN, J. P. 2010.
Triassic seismic sequence stratigraphy and paleogeography of the western Barents Sea
area. Marine and Petroleum Geology, 27, 1448-1475.
GRABOWSKA-OLSZEWSKA, B. 2003. Modelling physical properties of mixtures of clays:
example of a two-component mixture of kaolinite and montmorillonite. Applied Clay
Science, 22, 251-259.
GREGORY, A. R. 1976. Fluid saturation effects on dynamic elastic properties of
sedimentary rocks. Geophysics, 41, 895 - 921.
GOULTY, N.R., 1998. Relationships between porosity and effective stress in shales. First
Break 16 (12), 413–419.
HAM, H.H., 1966. New charts help estimate formation pressures. Oil and Gas Journal 65
(51), 58–63.
HANSEN, S., 1996. A compaction trend for Cretaceous and tertiary shales on the
Norwegian shelf based on sonic transit times. Petroleum Geoscience 2 (2), 159–166
HEDBERG, H.D., 1936. Gravitational compaction of clays and shales. American Journal of
Science 31 (184), 241–287.
References
96
HICKS, W. G. & BERRY, J. E. 1956. APPLICATION OF CONTINUOUS VELOCITY
LOGS TO DETERMINATION OF FLUID SATURATION OF RESERVOIR
ROCKS. Geophysics, 21, 739-754.
HO, N.-C., PEACOR, D. R. & VAN DER PLUIJM, B. A. 1999. Preferred Orientation of
Phyllosilicates in Gulf Coast Mudstones and Relation to the Smectite-Illite Transition
47, 495-504.
HOUSEKNECHT, D. W. 1987. Assessing the Relative Importance of Compaction Processes
and Cementation to Reduction of Porosity in Sandstones AAPG Bulletin, 71.
JAPSEN, P. & CHALMERS, J. A. 2000. Neogene uplift and tectonics around the North
Atlantic: overview. Global and Planetary Change, 24, 165-173.
KOEFOED, O. 1955. ON THE EFFECT OF POISSON'S RATIOS OF ROCK STRATA ON
THE REFLECTION COEFFICIENTS OF PLANE WAVES*. Geophysical
prospecting, 3, 381-387.
KRIEF, M., GARAT, J., STELLINGWERFF, J. & VENTRE, J. 1990. A Petrophysical
Interpretation Using The Velocities Of P And S Waves (full-waveform Sonic). The
Log Analyst, 355-369.
LABERG, J. S., ANDREASSEN, K. & KNUTSEN, S. M. 1998. Inferred gas hydrate on the
Barents Sea shelf — a model for its formation and a volume estimate. Geo-Marine
Letters, 18, 26-33.
LANDER, R. H. & WALDERHAUG, O. 1999. Predicting porosity through simulating
sandstone compaction and quartz cementation. AAPG Bulletin, 83, 433 - 449.
LARSEN, G., CHILINGER, G.V., 1983. Diagenesis in Sediments and Sedimentary Rocks;
2, Introduction, Developments in Sedimentology 25B. Elsevier Scientific Publishing
Co., New York.
LI, Y., DOWNTON, J. & XU, Y. 2007. Practical aspects of AVO modeling. The Leading
Edge, 26, 295-311.
LIU, G., LIPPARD, S., FANAVOLL, S., SYLTA, S., VASSMYR, S., SYLTA, O. & DORE,
A. 1992. Quantitative geodynamic modelling of Barents Sea Cenozoic uplift and
erosion Norsk geologisk tidsskrift 72, 313.

References
97
LOENG, H. 1991. Features of the physical oceanographic conditions of the Barents Sea.
Polar Research, 10, 5-18.
MAGARA, K., 1968. Compaction and migration of fluids in Miocene mudstone, Nagaoka
plain, Japan. American Association of Petroleum Geologists Bulletin 52 (12), 2466–
2501.
MEADE, R. H. 1963. FACTORS INFLUENCING THE PORE VOLUME OF FINE-
GRAINED SEDIMENTS UNDER LOW-TO-MODERATE OVERBURDEN
LOADS1. Sedimentology, 2, 235.
MEADE, R. H. 1964. Removal of water and rearrangement of particles during the
compaction of clayey sediments—review U.S Geological Survey Professional Paper,
497B, 1 - 22.
MEADE, R.H., 1966. Factors influencing the early stages of the compaction of clays and
sands-review. Journal of Sedimentary Petrology 36 (4),1085–1101.
MINSHULL, T.A., WHITE, R., 1989. Sediment compaction and fluid migration in the
Makran accretionary prism. Journal of Geophysical Research, B, Solid Earth and
Planets 94 (6), 7387–7402.
MONDOL, N. H. 2008a. Experimental Compaction of clays: relationship between
permeability and petrophysical properties in mudstones. Petroleum Geoscience, 14,
319.
MONDOL, N. H. 2008b. Synthetic mudstone compaction trends and their use in pore
pressure prediction. First Break, 26, 0263-5046.
MONDOL, N. H., BJØRLYKKE, K., JAHREN, J. & HØEG, K. 2007. Experimental
mechanical compaction of clay mineral aggregates--Changes in physical properties of
mudstones during burial. Marine and Petroleum Geology, 24, 289-311.
MONDOL, N. H. (2011). Personal Communication, University of Oslo, Norway.
MORAD, S., ., AL-RAMADAN, K., ., KETZER, J., M,. & DE ROS, L., F,. 2010. The
Impact of Diagenesis on the heterogeneity of sandstone reservoirs: A review of the

References
98
role of depositional facies and sequence stratigraphy. AAPG Bulletin, 94, 1267 -
1309.
MØRK, A., KARUD, R. & WORSLEY, D. 1982. Depositional and diagenetic environments
of the Triassic and lower Jurassic succession of Svalbard. Canadian Society of
Geologist, Calgary, Alberta, Canada, 371e398.
MØRK, M. B. E. 1999. Compositional Variation and Provenance of Triassic Sandstone from
the Barents Shelf. Journal of Sedimentary Research 69, 690 - 710.
MURPHY, W. M., OELKERS, E. H. & LICHTNER, P. C. 1989. Surface reaction versus
diffusion control of mineral dissolution and growth rates in geochemical processes.
Chemical Geology, 78, 357-380.
NPD 2011. Fact pages. Norwegian Petroleum Directorate Fact pages.
OERTEL, G. & CURTIS, C., D 1972. Clay-Ironstone Concretion Preserving Fabrics Due to
Progressive Compaction. Geological Society of America Bulletin, 83, 2597-2606.
OHM, S. E., KARLSEN, D. A. & AUSTIN, T. J. F. 2008. Geochemically driven exploration
models in uplifted areas: Examples from the Norwegian Barents Sea. AAPG Bulletin,
92, 1191-1223.
OSBORNE, M. J. & SWARBRICK, R. E. 1999. Mechanisms for generating overpressure in
sedimentary basins: A reevaluation: Reply. AAPG Bulletin, 83(5), 800-801.
OSTRANDER, W. J. 1984. Plane-wave reflection coefficients for gas sands at nonnormal
angles of incidence. Geophysics, 49, 1637-1648.
PALCIAUSKAS, V.V., 1991, Primary migration of petroleum, in R. K. Merril, ed., Source
and migration processes and evaluation techniques: AAPG Treastise of Petroleum
Geology, Handbook of Petroleum Geology, P. 13 – 22.
PELTONEN, C., MARCUSSEN, Ø., BJØRLYKKE, K. & JAHREN, J. 2008. Mineralogical
control on mudstone compaction: a study of Late Cretaceous to Early Tertiary
mudstones of the Voring and More basins, Norwegian Sea Petroleum Geoscience, 14,
127.
PELTONEN, C., MARCUSSEN, Ø., BJØRLYKKE, K. & JAHREN, J. 2009. Clay mineral
diagenesis and quartz cementation in mudstones: The effects of smectite to illite
reaction on rock properties. Marine and Petroleum Geology, 26, 887-898.

References
99
PEPPER, A. S. & CORVI, P. J. 1995. Simple kinetic models of petroleum formation. Part III:
Modelling an open system. Marine and Petroleum Geology, 12, 417-452.
PERRODON, A. 1992. PETROLEUM SYSTEMS: MODELS AND APPLICATIONS.
Journal of Petroleum Geology, 15, 319-325.
PETERS, K. E. AND CASA, M. R., 1994. Applied Source Rock Geochemistry. In The
petroleum system – from source to trap: AAPG Memoir 60. P. 93 – 120.
PHILIPPI, G. & CORDELL, R. 1974. Depths of oil origin and primary migration: a review
and critique. AAPG bulletin 56 2029.
POLYAEVA, E., KLARNER, S., LOWREY, C. J., ZABRODOTSKAYA, O. 2011. Depth
Dependent Rock Physics Trends for Triassic Reservoirs in the Norwegian Barents
Sea. 73rd
EAGE Conference, Vienna, Australia, 23 – 26 May 2011.
PROSHLYAKOV, B.K., 1960. Reservoir properties of rocks as a function of their depth and
lithology. Geol. Nefti i Gaza 12, 24–29.
RIIS, F., ., LUNDSCHIEN, B., A,., HØY, T., ., MØRK, A., . & MØRK, M., B, E,. 2008.
Evolution of the Triassic Shelf in the northern Barents Sea region. Polar Research,
27, 318 - 338.
RUTHERFORD, S. R. & WILLIAMS, R. H. 1989. Amplitude-versus-offset variations in gas
sands. Geophysics, 54, 680-688.
SCLATER, J.G., CHRISTIE, P.A.F., 1980. Continental stretching; an explanation of the
post-Mid-Cretaceous subsidence of the central North Sea basin. Journal of
Geophysical Research 85 (B7), 3711–3739.
SMELROR, M., MØRK, A., MØRK, M. B. E., WEISS, H. M. & LØSETH, H. 2001. Middle
jurassic-lower cretaceous transgressive-regressive sequences and facies distribution
off northern nordland and troms, Norway. In: OLE, J. M. & TOM, D. (eds.)
Norwegian Petroleum Society Special Publications. Elsevier.
SMITH, G. C. 1987. Weighted Stacking for Rock Property Estimation and Detction of Gas.
Geophysical prospecting, 35, 993.

References
100
SMITH, T. M., SONDERGELD, C. H. & RAI, C. S. 2003. Gassmann fluid substitutions: A
tutorial. Geophysics, 68, 430-440.
STORVOLL, V., BJØRLYKKE, K., KARLSEN, D. & SAIGAL, G. 2002. Porosity
preservation in reservoir sandstones due to grain-coating illite: a study of the Jurassic
Garn Formation from the Kristin and Lavrans fields, offshore Mid-Norway. Marine
and Petroleum Geology, 19, 767-781.
STORVOLL, V., BJORLYKKE, K. & MONDOL, N. H. 2005. Velocity-depth trends in
Mesozoic and Cenozoic sediments from the Norwegian Shelf. AAPG Bulletin, 89,
359-381.
STORVOLL, V. & BREVIK., I. 2008. Identifying time, temperature, and mineralogical
effects on chemical compaction in shales by rock physics relations. Leading Edge, 27,
738.
TERZAGHI, K., 1925. Principles of soil mechanics: I—phenomena of cohesion of clays.
IV—settlement and consolidation of clay. Engineering News-Record 95 (19), 742–
746, 874–878.
THYBERG, B., JAHREN, J., WINJE, T., BJØRLYKKE, K., FALEIDE, J. I. &
MARCUSSEN, Ø. 2009. Quartz cementation in Late Cretaceous mudstones, northern
North Sea: Changes in rock properties due to dissolution of smectite and precipitation
of micro-quartz crystals. Marine and Petroleum Geology.
VASSOEVICH, N.B., 1960. Experiment in constructing typical gravitational compaction
curve of clayey sediments. Nov. Neft. Tekh., Geol. Ser. (News Pet. Tech., Geol.) 4,
11–15.
VELDE, B., 1996. Compaction trends of clay-rich deep sea sediments. Marine Geology 133
(3–4), 193–201.
VERNIK, L. & LIU, X. 1997. Velocity anisotropy in shales; a petrophysical study.
Geophysics, 62, 521-532.
VERNIK, L. & NUR, A., . 1992. Petrophysical classification of siliciclastics for lithology
and porosity predictions from seismic velocities:. AAPG Bulletin, 7620110221, 1295

References
101
WALDERHAUG, O. 1994. Temperatures of Quartz Cementation in Jurassic Sandstones
from the Norwegian Continental Shelf--Evidence from Fluid Inclusions SEPM
Journal of Sedimentary Research, 64A.
WALDERHAUG, O., BJØRKUM, P. A., NADEAU, H. P. & LANGNES, O. 2001.
Quantitative modelling of basin subsidence caused by temperature driven silica
dissolution and reprecipitation. Petroleum Geoscience, 7, 107-113.
WAPLES, D. W. & COUPLES, G. D. 1998. Some thoughts on porosity reduction -- rock
mechanics, overpressure and fluid flow. Geological Society, London, Special
Publications, 141(1), 73-81.
WELLER, J.M., 1959. Compaction of sediments. American Association of Petroleum
Geologists Bulletin 43 (2), 273–310.
WHITE, D. A. 1993. Geologic risking guide for prospects and plays. AAPG Bulletin, 77,
2048-2061.
WORSLEY, D. 2008. The Post-Caledonian development of Svalbard and the Western
Barents Sea. Polar Research, 27, 298 - 317.
WORSLEY, D., JOHANSEN, R., & KRISTENSEN, S.E. 1988. The Mesozoic and Cenozoic
succession of Tromsøflaket. In A Dallan, D. Worsley & K. Ofstad (Eds.), A
lithostratigraphic scheme for the Mesozoic and Cenozoic succession offshore Mid-
and Northern Norway. Norwegian Petroleum Directorate (NPD) Bulletin, 4, 42 – 65.
ZOEPPRITZ, K. 1919. Erdbebenwellen VIIIB, über Reflexion and Durchgang Seismischer
Wellen durch Unstetigkeitsflachen. Nachrichten, I, 66-84.

Appendix
102
Appendix
List of figures
Chapter 1. Introduction Fig. 1 Location map of the Barents Sea (adapted from Faleide et al., 1984)................................1
Fig. 1.1. Location map of two major commercial hydrocarbon fields in the South West Barents
Sea Snøhvit and Goliat Fields. Modified from NPD Factmaps (2011)...............................2
Fig. 1.3 Map of Norway and Barents Sea (inset map) and the location of the study
area about 45Km NNE of Goliat and about 55Km east of Snøhvit fields. Source: NPD
Factmaps (2011)..................................................................................................................2
Fig. 1.4 Well bore location map of the study area across the Tornerose prospect...........................8
Chapter 2. Regional Geological Framework
Fig. 2.1 Tectonic framework of the entire Barents Sea region. Source:(Gabrielsen et al., 1990)...12
Fig. 2.2 Subsidence curves for different parts of the Norwegian Barents Sea. Three major uplift
and erosion episodes are indicated to occur at 60 Ma, 35 Ma and recent. Source: (Ohm
et al., 2008)........................................................................................................................13
Fig. 2.3 Schematic illustration of Barents Shelf and Spitsbergen lithostratigraphic column.
Formation definition is by(Worsley, 2008). Source: (Bugge et al., 2002)........................15
Fig. 2.4 Core photograph of the Hekkingen Formation from well 7228/9-1S. Source:
(NPD, 2011)......................................................................................................................18
Fig. 2.5 Tentative maturity map depicting oil maturity distribution of Permian, Triassic and
Jurassic source rocks. This map is based on maturity data from wells in the area, semi-
regional maturity trends of vitrinite reflectance (Ro) versus depth. The study area is
highlighted by the solid red circle showing the occurrence of multiple source rock.
Modified from: Ohm et al., 2008......................................................................................19
Fig. 2.6 Wireline log character across the Stø Reservoir from well 7123/4-1A. P-wave, S-wave,
Neutron porosity, water saturation, resistivity and gamma ray logs respectively. Different
depositional facies are clearly identified using the gamma ray log..................................20
Fig. 2.7 Core photograph obtained around the top of Stø reservoir sandstones from well 7122/6-1
with a core start depth of 1595m BSF and end depth of 1599 m BSF. These sands are
prolific with excellent reservoir qualities. Source: NPD Factpage 2011..........................21
Fig. 2.8 Wireline log responses across the studied Snadd reservoir sand unit found at the top of
the Formation from well 7123/4-1A. P-wave, S-wave, Neutron porosity, water
saturation, resistivity and gamma ray logs respectively...................................................22
Fig. 2.9 Modified core photo of the Ladinian Snadd Formation from at two different depth from
(a) well 7230/05-U-04 AT 64.2m and (b) from well 7230/05-U-04 at 60.7m. Source:
Bugge et al. 2002..............................................................................................................22
Appendix
103
Fig. 2.10 Structural map of the study area illustrating the trap style of the Tornerose prospect on
the rotated fault block. Source: NPD Factmaps. 2011........................................................23
Chapter 3. Compaction and Evolution of Rock Properties Fig. 3.1 Principal aspects of sediment compaction. With increasing burial depth, sediments are
subjected to changes in physical properties as a function of increasing stress and
temperature. Source: Bjørlykke, 1998..............................................................................24
Fig. 3.2 Sonic velocity measurements (every 0.5 – 0.7m with depth) from seventeen
wells located in the western region in of the Haltenbanken area- Norwegian North Sea
(after Storvoll et al. 2005). The estimated trend line (dashed blue line) will be used for
comparism with well data from this study area..................................................................25
Fig. 3.3 Schematic illustration of the contributions of overburden stress, stress at grain contacts
and pore pressure to mechanical compaction.....................................................................27
Fig. 3.4 Experimental mechanical compaction of brine-saturated kaolinite aggregates, sorted by
grain size (after Mondol et al. 2008). Samples containing less than 2µm sized kaolinite
aggregates retained higher porosity compared to all other mixtures. The maximum
porosity reduction is observed in the composite mixtures containing all grain sizes,
demonstrating the importance of grain size and sorting in determining rock properties....27
Fig. 3.5 Diagenetic processes, mainly quartz cementation as a function of temperature and time.
Note that quartz cementation will continue also during uplift as long as the temperature
exceeds 70–800C. Source: (Bjørlykke et al., 2010)…………………………………….29
Fig. 3.6 Cross plots of P-wave velocity (a) and S-wave velocity versus the vertical effective stress
for dry (in gray) and brine-saturated (in black) clay mixtures (Mondol et al. 2007). Solid
lines show least square fits to the data................................................................................30
Fig. 3.7 Formation of (A) authigenic micro quartz (mQtz) cement in mudstones from Northern
North Sea. Source: (Thyberg et al., 2009). (B) pore filling illite formed either by alteration
(dissolution and precipitation) of smectite and/ or from kaolinite and K-feldspars Source:
(Bjørlykke, 1995)................................................................................................................31
Fig. 3.8 Experimental compaction of fine-grained and coarse-grained sand showing that well
sorted fine grained is less compressible than coarse grained sands. Source: (Chuhan et al.,
2003)...................................................................................................................................32
Fig. 3.9 (A) Schematic illustration of Pressure solution of quartz clasts at grain contacts with clays
(stylolite). Grain coatings prevent or slow down quartz cementation and preserve porosity
at greater depths. (b) Quartz cement with smooth crystal surfaces as overgrowth on clastic
grains. Source: (Bjørlykke et al. 2010)...............................................................................33
Fig. 3.10 Cross plots of Vp/ Bulk density / Neutron porosity/Gamma ray versus depth for five wells
cross the entire study area. Generally two distinct compaction trends are identified on all
cross plots............................................................................................................................37
Fig. 3.11 Vp (m/s) - Depth (m) plot for well 7123/4-1A at present burial depth below sea floor
(BSF). The various Formations have been separated in to different colours for better
illustration. The general trend line (in black) is not for a particular lithology but for the
entire well data. The highlighted area (black circle) represents anomalous velocity. The
Appendix
104
transition zone (TZ) separates mechanical compaction (MC) from chemical compaction
(CC).....................................................................................................................................38
Fig. 3.12 Shear modulus versus porosity (NPHI) for shales only in well 7123/4-1A. Colour coded
with depth to illustrate the transition zone (TZ) from mechanical compaction (MC) to
chemical compaction (CC) occurring at the ‘knee point’...................................................40
Fig. 3.13 Cross plots of P-wave versus Depth for (a) entire well data, (b) clean sands and (c) shales
only, for well 7123/4-1A colour coded with V-shale. The highlighted area in red circle
indicates a zone of overpressure in the Hekkingen Formation. Sands compact along a
higher gradient than shales. A similar pattern is observed for wells 7122/4-1, 7122/6-1 and
7122/6-2..............................................................................................................................41
Fig. 3.14 Crossplot of Shear-wave velocity versus P-wave velocity for well 7123/4-1A color coded
with V-shale. S-wave velocities show a lithology dependent gradation, hence good
lithology indicators.............................................................................................................42
Fig. 3.15 Attribute cross section from the Vs versus Vp cross plot versus depth (m) BSF for well
7123/4-1A showing the vertical distribution of clean sands (orange) as in the Stø
reservoir and shaly sands (blue) as in the Snadd reservoir. The Triassic sequence is
dominated by shaly sands...................................................................................................43
Fig. 3.16 Effect of incipient quartz cement on bulk density, well 7123/4-1 at present burial depth
below sea floor (BSF). Vp/ Vs / Bulk Density versus Depth (m) Below sea floor (BSF).
The transition zone (TZ) between mechanical compaction (MC) and chemical
compaction is marked by the red line.................................................................................43
Fig. 3.17 Exhumation estimates for well 7122/2-1 using experimental compaction curves for Clay -
Silt and Clay - Clay mixtures. The shales are for mechanical compaction domain only...44
Fig. 3.18 Correction for exhumation using shales only, for five wells corresponding to mechanical
compaction. (a) Vp(m/s) – Depth(m)BSF at present burial depth compared with different
experimental clay mixtures. (b) Vp(m/s) – Depth (m) after correcting for exhumation and
compared with experimental samples.................................................................................45
Fig. 3.19 Shales only, corresponding to mechanical compaction after correcting for exhumation. (a)
Neutron porosity (NPHI) / Density porosity (DPHI) versus depth compared with
experimental porosity-depth curve for a Kaolinite – silt (50:50) mixture. (b) cross plot for
bulk density – Depth for shales compared with experimental density curve for a kaolinite
– silt (50:50) mixture..........................................................................................................46
Fig. 3.20 Composite cross plot of Vp – Depth for 5 wells using entire well data. Trend lines from
three different published and experimental data have been included for comparison. (a)
Present depth below sea floor (BSF). (B) Corrected for Tertiary exhumation. The
highlighted area (red circle) represents anomalous velocity from shallow carbonates......48
Fig. 3.21 Modified tentative uplift map illustrating the total amount of uplift based on vitrinite data.
The area under consideration in this study is indicated by the red circle. Modified from:
(Ohm et al., 2008)...............................................................................................................49
Fig. 3.22 Cross plots of Vp (m/s) and Resistivity (Om²/m) logs versus Depth (m) BSF for (A) well
7123/4-1A and (B) well 7122/6-2. Both wells depict a decrease in resistivity around the
transition from mechanical to chemical compaction though as seen from the cross plots
the depth of this zone is slightly different for both wells. Both well data are put at
thesame depth level uniquely for illustration purpose.......................................................51

Appendix
105
Fig. 3.23 Cross plot of P-wave velocity (m/s) versus Density (g/cc) colour coded with V-shale. The
highlighted area (red circle) depicts low density and velocity in the organic rich and
overpressured Hekkingen Formation.................................................................................56
Fig. 1.24 Variability in mudstone compaction trends. Variations are prominent in the mechanical
compaction. After Mondol et al., 2008, (modified from Mondol et al., 2007)....................57
Chapter 4. AVO/AVA Modeling Fig. 4.1 Schematic illustration of the Convolutional trace model. The pulse used is a zero-phase
Ricker wavelet with peak frequency at 45 Hz…………………………………………….61
Fig.4.2 Mode conversion (energy partitioning) of an incident P-wave producing P and S
reflections and transmissions. The reflected angle of the converted S-wave is smaller than
the reflected angle of the P-wave…………………………………………………………62
Fig. 4.3 (a) AVO intercept (A) versus Gradient (B) cross plot showing four quadrants. (b) Plane
wave reflection coefficients at the top of each Rutherford and Williams (1989)
classification of gas sand after (Castagna et al., 1998)…………………………………..66
Fig. 4.4 Similarities and differences a between measured Vs, Vs_Castagna and Vs_Krief (a)
comparism on wireline logs within the Stø reservoir (b) comparison of the amplitude
response at the top of the reservoir………………………………………………………...70
Fig. 4.5 Ricker zero phase wavelets in time and frequency domain for different parameters. (a) The
dominant frequency is at 45Hz, sample rate of 2(ms) and wavelet length of 200m. It is
used in this study. (b) Is a 20Hz wavelet, with a sample rate of 2(ms), a wavelet length of
200m……………………………………………………………………….……………...72
Fig. 4.6 Illustration of the implication of block size on NMO corrected synthetic CDP gathers and
eventual AVO signatures. A block size of 20m results in a high impedance AVO signature.
While a block size 23m yields a low impedance AVO signature…………………………73
Fig. 4.7 AVA cross plot for four wells at top Stø reservoir at in-situ scenario, Oil model and Gas
model with a maximum offset of 40 degrees. Three of the wells yield class I AVO response
at in-situ scenario while well 7122/4-1 shows a class II AVO response…………………..76
Fig. 4.8 Quantitative analysis of zero-offset reflectivity of four wells at: in-situ scenario, oil model
and gas model………………………………………………………………………………76
Fig. 4.9 AVA cross plot for four wells for top Snadd Formation at in-situ scenario and after
substituting the pore fluid with entirely 100% Brine……………………………………...77
Fig. 4.10 Illustration of zero offset reflectivity for four wells at in-situ scenario (blue) and at 100%
brine saturation (red)………………………………………………………………………78
Fig. 4.11 Comparison of seismic responses to changes in reservoir fluid property and saturations;
from in-situ fluid (brine) to 10%, 50% and 90% gas saturations respectively. The offset
range is from 0m to 1600m in all cases. Note the large change from in-situ scenario to 10%
gas saturation………………………………………………………………………………79

Appendix
106
Fig. 4.12 Fluid saturation effects on dynamic elastic properties of the Stø reservoir sands………...79
Fig. 4.13 Influence of changes in reservoir pore fluid and saturation on AVO response for Stø
reservoir…………...……………………………………………………………………....80
Fig. 4.14 Lateral variations in cap rock properties and its influence on AVO interpretation…….....81
Fig. 4.15 High gamma ray measurements across the studied Snadd reservoir for five wells.
Reservoir heterogeneity is largely related to different sediment provenances during the
Triassic……….………………………………………………………………………........81
Fig. 4.16 Cross plots of (a) Ksat (b) Density (c) P-wave velocity (d) Vp /Vs ratio as a function
of gas saturation…………………………….…………………………………………….83
Fig. 4.17 (A ) Poisson’s ratios for different wells depicting an indication of significant lateral facies
variation within the Snadd reservoir sandstones. (B) AVO response for thesame reservoir
sands with same pore fluids but located at two widely different depths in wells 7122/4-1
and 7122/6-1……………………………………………………………………….…..…84

Appendix
107
List of Tables
Table. 1.1 Detail field statistics. (Source: NPD. 2011)……………………………………………….7
Table. 2.1 Stratigraphic statistics of five wells across the study area. Source: (NPD, 2011)……….14
Table. 3.1 Exhumation estimates for four wells based on experimental compaction curve of a
Kaolinite - Silt mixture (50:50). Mondol 2011 (personal communication)……………...45
Table. 3.2 Transition zones (TZ) from mechanical to chemical compaction with the corresponding
temperatures of transition for five wells both at present day depth and temperatures and
after correcting for exhumation respectively…………………………………………….53
Table. 4.1 Adapted range of reflectivity values used to classify AVA response...............................75
Table. 4.2 Top reservoir sand reflection coefficient versus angle behavior of the Stø reservoir for
different fluid scenarios……………………………………………………………….…75
Table. 4.3 Top reservoir sand reflection coefficient versus angle behavior of the Snadd reservoir
for different fluid scenarios………………………………………………………………77
Table. 4.4 Pore fluids saturation effects on Vs and shear modulus………………………………....82

Appendix
108

References
109
Related Documents