1 MASTER THESIS HOW ROBOTIC PROCESS AUTOMATION (RPA) INFLUENCES FIRM FINANCIAL PERFORMANCE IN THE NETHERLANDS

Welcome message from author
This document is posted to help you gain knowledge. Please leave a comment to let me know what you think about it! Share it to your friends and learn new things together.
Transcript

1
MASTER THESIS
HOW ROBOTIC PROCESS AUTOMATION (RPA) INFLUENCES FIRM FINANCIAL PERFORMANCE IN THE NETHERLANDS

2
MASTER THESIS
HOW ROBOTIC PROCESS AUTOMATION (RPA) INFLUENCES FIRM FINANCIAL PERFORMANCE IN THE NETHERLANDS
NAME: NIEK GOSEN STUDENT #: S2034700 E-MAIL: [email protected] FACULTY: BEHAVIOURAL, MANAGEMENT &
SOCIAL SCIENCES (BMS) STUDY PROGRAM: MSC BUSINESS ADMINISTRATION 1ST SUPERVISOR: DR. X. HUANG 2ND SUPERVISOR: DR. A.B.J.M. WIJNHOVEN DATE: 23-09-2019 WORD COUNT: 14978

3
Acknowledgements
This thesis is written as part of the Master of Science program Business Administration in the
specialization track Financial Management at the University of Twente, faculty of
Behavioural, Management & Social sciences (BMS). No external partners, such as
companies, did helped me write this thesis. Though, I would like to thank all the respondents
who were able to fill in the survey. They made it possible for me to obtain all the needed
data, so, I am really thankful they made time for me. Moreover, I would like to thank my first
and second supervisor at the University of Twente, Dr. X. Huang and Dr. A.B.J.M
Wijnhoven. They provided me valuable and well-founded feedback on my thesis. Also, my
family and friends did support me during the time I wrote this thesis, therefore, I would like
to thank them for their interest, time and support during the entire process.
Niek Gosen,
Oldenzaal, September 2019
4
Abstract
Literature suggests that firms employ technology in a firm to achieve better firm
performance, several studies have proven that employing some sort of technology (or IT) in a
firm does indeed result in a better firm performance and thus, achieve competitive advantage.
This thesis examined to what extent financial firm performance is influenced by the emerging
construct Robotic Process Automation (RPA). In addition, research suggested that IS
capabilities and IS resources should have a moderating impact on this relationship. Since
RPA is a relative new concept, it has not been researched that much, with this thesis, I would
like to fill this gap. With the help of a survey, the posited hypotheses and research question
were tested, where the respondents were financial and technology employees of firms in The
Netherlands. The results of the partial least squares regression showed that no evidence is
found to support the hypotheses and research question.
Keywords: firm performance, robotic process automation, RPA, IS capabilities, IS
resources, The Netherlands.

5
Table of Contents
Acknowledgements ........................................................................................................... 3
Abstract ............................................................................................................................. 4
1. Introduction ............................................................................................................... 7
1.1 Background .......................................................................................................................... 7
1.2 Relevance ............................................................................................................................ 8
1.3 Objective .............................................................................................................................. 9
1.4 Outline ................................................................................................................................. 9
2. Literature review ...................................................................................................... 10
2.1 Theories ...................................................................................................................... 10 2.1.1 Resource-based theory ...................................................................................................................... 10 2.1.2 Information processing perspective .................................................................................................. 11 2.1.3 Contingency theory ............................................................................................................................ 11 2.1.4 Potential IT value ............................................................................................................................... 12 2.1.5 Theory of irreversible investment under uncertainty ........................................................................ 13
2.2 Empirical study and Hypotheses development ................................................................... 14 2.2.1 Robotic Process Automation (RPA) and technological developments ............................................... 14 2.2.2 IS capabilities ..................................................................................................................................... 16 2.2.3 IS resources ........................................................................................................................................ 17 2.2.4 Firm performance .............................................................................................................................. 18 2.2.5 Control variables ................................................................................................................................ 18
3. Research method ..................................................................................................... 19
3.1 Research model .................................................................................................................. 19
3.2 Method .............................................................................................................................. 20
3.3 Measures ........................................................................................................................... 20 3.3.1 Dependent variable ........................................................................................................................... 20 3.3.2 Independent variable ......................................................................................................................... 21 3.3.3 Moderating variables ......................................................................................................................... 23 3.3.4 Control variables ................................................................................................................................ 24
3.4 Variable overview .............................................................................................................. 29
3.5 Model specification ............................................................................................................ 30
4. Data ......................................................................................................................... 32
4.1 Target group ...................................................................................................................... 32
4.2 Collection ........................................................................................................................... 33
4.3 Industry conversion ............................................................................................................ 33
4.4 Analyzing ........................................................................................................................... 34
5. Results ..................................................................................................................... 35
5.1 Validity adjustments .......................................................................................................... 35
5.2 Descriptive statistics & frequencies .................................................................................... 36
5.3 Factor analysis ................................................................................................................... 39

6
5.3.1 Convergent validity ............................................................................................................................ 39 5.3.2 Discriminant validity .......................................................................................................................... 43
5.4 PLS path analysis ................................................................................................................ 44 5.4.1 Hypothesis 1 ...................................................................................................................................... 45 5.4.2 Hypothesis 2 ...................................................................................................................................... 47 5.4.3 Hypothesis 3 ...................................................................................................................................... 49
6. Discussion ................................................................................................................ 50
7. Conclusion ................................................................................................................ 52
8. Implications ............................................................................................................. 53
9. Limitations and directions for further research ......................................................... 53
10. Bibliography .............................................................................................................. 55
11. Appendices ................................................................................................................ 59
1. Hierarchy in the context of the use of expert systems to supplement human decision making by employees (Endsley, 1999): ................................................................................................. 59
2. 10-level taxonomy involving cognitive and psychomotor tasks. ............................................ 59
3. Range of SIC Codes per division. ........................................................................................... 60
4. SPSS output ......................................................................................................................... 61
5. Survey questions .................................................................................................................. 63
6. Calculation sheet for discriminant validity ............................................................................ 86

7
1. Introduction
1.1 Background
Do you executives, managers and stakeholders in the financial environment ever wonder how
the finance function will look like in the future? Well, this question keeps many people
occupied, including me. Robotics is expected to be the biggest factor influencing the finance
function. Robotic Process Automation (abbreviated: RPA) are beginning to have a profound
effect on the business and is a promising new development (Lhuer, 2016). Humans are
humans, working with humans involves risk taking. Robots and computers on the other hand
can execute ‘human’ tasks more quickly, accurately and tirelessly. Due to this emerging
development, data is hugely increasing. Less people are sought after for executing repetitive
tasks, though more people are needed with analytical skills to investigate the bulk of data
harvested. Also, with this change in work, RPA means that people will have more interesting
and more challenging jobs. Usually, people were used to do repetitive, boring, uninterested
and deskilled tasks. RPA has the ability to make a shift that some activities involving the job
will be lost, but just parts, in addition it can also reassemble work into different types of job.
Moreover, Mahlendorf (2014) mentioned the relevance of this under-researched
subject. Due to the shift in information technology, traditional finance tasks, such as
processing data and reporting, can now be done with less manpower than before.
In a recent report by McKinsey and Company (Ostdick, 2016) on emerging and disruptive
technologies, it is predicted that automation technologies, such as RPA is, will have a
potential economic impact of nearly $6.7 trillion by 2025. It is expected to have the second
largest economic impact of the technologies considered, behind the rise of mobile internet for
smartphones and tablets. Therefore, obviously the growth of RPA is happening quickly and
does have the ability to be one of the leading technological platforms and is expected to be
the standard for doing business.
To understand RPA we should know where it came from, it is not a concept that
appeared out of the blue. There are three identified key predecessors of Robotic Process
Automation (Ostdick, 2016). First, screen scraping was used to create a bridge between
current systems and incompatible legacy systems in the time before the development of the
internet. More recently, it is been used to extract data from the web on the presentation layer.
Second, workflow automation and management tools dates back to 1920s where the term
workflow automation was first introduced, though, the term has become more frequently
used since the 1990s. It is capable of providing aid in order processing by capturing certain
8
fields of interest, such as customer information, invoice total and which and how many items
are ordered, translating them into your database. Advantages of workflow automation include
increased speed, efficiency and accuracy. And third, artificial intelligence was used first in
1956. It refers to the capability of computer systems to perform tasks that normally involves
human intervention and intelligence. While AI can be costly, the advantages gained from AI
include increased accuracy and precision in tasks of replacement of repetitive and time-
consuming manual labor. The aim of RPA is to cohere these three predecessors into a well
fully functional system, namely Robotic Process Automation. As the saying goes, one plus
one is three, is definitely applicable in this situation. All three separate technologies can be
somewhat of a small impact, but combining these three technologies is what truly makes
RPA such an impactful technological platform.
The term ‘Robotic Process Automation’ can be dated to the early 2000s where it first
was used. Deloitte (in Ostdick, 2016) even suggests that RPA is the combination of AI and
automation: “Robotic Process Automation (RPA), a synonym to AI, is the application of
technology allowing employees in a company to configure computer software or a ‘robot’ to
reason, collect and extract knowledge, recognize patterns, learn and adapt to new situations
or environments”. So, the question that arises then is: where is RPA headed? In particular, we
are interested whether this emergence of RPA does have an impact on the financial
performance of a firm, and if it indeed, as suggested, will create competitive advantage.
1.2 Relevance
Several research has been done in the field of computerization/automation and the effect on
(financial) firm performance (Brown, Gatian, & Hicks, Jr., 1995; Bharadwaj, 2000; Kotha &
Swamidass, 2000; Ravichandran & Lertwongsatien, 2005). These four key papers are the
basis for conducting this study. They all investigated the effect of technology on firm
performance. This study contributes to the literature in a way that these before mentioned
studies are dated from 2005 and further back in time, so this study can provide new insights.
In addition, these studies were conducted in a period where computer technologies were very
new to the market, in a way that computer-based firms are not the standard. Nowadays,
technology is inseparable of doing business. This study deviates in a way that several
constructs are included which are supposed to be of moderating impact. Also, RPA is a
relatively new concept and the effect on firm performance has not been researched yet.

9
1.3 Objective
The main objective that will framework this study is twofold. First, we would like to assess
the effect of the extent RPA is active in firms on firm performance. And second, we build our
research upon Ravichandran & Lertwongsatien (2005) for understanding the framework they
researched. We would like to assess the moderation impact of IS1 capabilities and IS
resources on the main relationship RPA and firm performance. The before mentioned
research investigated whether this framework was intercorrelated and found indeed sufficient
evidence, we employ this framework in a way that it is of moderating impact. Based on the
literature review, we have indeed strong evidence that this framework will be of moderating
impact between the relationship RPA and firm performance. Moderating indicates that the
strength of the effect of RPA on firm performance is explained by the framework. Based on
this information, the following research question has been formulated.
Research question: “In what direction (positive/negative) and to what extent does RPA
influence the financial performance of firms in particular industries for firms in the
Netherlands, and to what extent does IS capabilities and IS resources moderate the impact?”
1.4 Outline
This study is organized as follows. First of all, a literature review will be provided. This
section starts with pointing out relevant theories involving this subject. They are used to
interpret to interpret the results. After that, empirical research for Robotic Process
Automation, IS capabilities, IS resources, firm performance and the control variables will be
discussed, followed by a visual representation of the research model. Based on this empirical
research, several hypotheses are developed in order to be able to answer the research
question. Chapter three will include the research model, the selected research method, a
description of how to measure the constructs and hypotheses, a variable overview and model
specification for the hypotheses. The selected target group, which firms are being researched
and how the results are being collected and analyzed are presented in chapter four. The
results will be presented in chapter five, first, several adjustments are made to the data to
increase the validity. Also, the descriptive statistics and frequencies are given, subsequently a
factor analysis and a partial least squares regression are carried out. A discussion and
conclusion of the results are presented in chapter six for the former and chapter seven for the
1 IS stands for Information Systems

10
latter. Next, a couple of implications of the research are explained and to make this research
complete, a section of limitations and directions for further research is included.
2. Literature review
2.1 Theories
This thesis investigates the effect of RPA on firm performance. Therefore, several theoretical
perspectives should provide this study’s theoretical rationale for the investigation of the
effect of RPA on firm performance. There is a wide variety of theories that possibly could
underpin the mentioned relationship. Literature (Brown, Gatian, & Hicks, Jr., 1995;
Bharadwaj, 2000; Kotha & Swamidass, 2000; Ravichandran & Lertwongsatien, 2005)
employs (1) resource-based theory and (2) the information processing perspective, in addition
(3) contingency theory will be used as theoretical perspective. The reason for including the
contingency theory as a theoretical perspective is that firm performance is in a way
dependable of how an organization is structured. These theories are employed in this
research, to mainly underpin the importance of the internal characteristics of a firm in order
to create competitive advantages. The internal characteristics are the foundation to establish
and maintain a healthy and organized firm.
Subsequently two perspectives of information technology are utilized: (4) enabling
IT2 potential, and the (5) theory of irreversible investment under uncertainty. These two
theories are employed for the reasons to understand how IT even can be enabled in a firm and
what the best ways to invest are. Theories 1, 2 and 3 will therefore form the basis for theories
4 and 5. For example: a well-organized firm, that possesses strong internal characteristics, is
better able to enable the invested IT in the desired results: more results with less effort.
Besides, all the theories are used to interpret the results, the intention is not to formally test
these theories but rather adopt them as an eyeglass to look through.
2.1.1 Resource-based theory
This study draws upon the resource-based theory. The resource-based theory prescribes that it
addresses performance differences between firms using asymmetries in knowledge; the
resources of a firm are the main driver of firm performance and should enable a firm to
achieve its objectives and goals (Barrutia & Echebarria, 2015; Conner & Prahalad, 1996;
Dierickx & Cool, 1989). In addition, Das & Teng (2000) suggests that most traditional firms
2 IT stands for Information Technology
11
rely heavily on the analysis of the competitive environment and the resource-based view
focuses on the analysis of various resources possessed by the firm. Sustained firm resource
heterogeneity becomes a possible source of competitive advantage, due to the firm-specific
resources which are not perfectly mobile and imitable. Firms should seek a ‘perfect’ fit
between their internal characteristics (strengths and weaknesses) and their external
environment (opportunities and threats). The resource-based view stresses the internal
characteristics over the external environment in order to gain a competitive advantage over
competitors. Competitive advantage can be defined as a firm being able to produce a good or
service of equal value at a lower price or in a more desirable fashion.
2.1.2 Information processing perspective
The underlying definition of the information processing perspective is that organizations are
open social systems that must cope with environmental and organizational uncertainty
(Egelhoff, 1982; Keller, 1994). Developing information processing mechanisms capable of
dealing with uncertainty enables a firm to be effective, whereby uncertainty is defined as the
difference between the amount of information required to perform a task and the amount of
information already possessed by the firm (Galbraith, 1973, in Kotha & Swamidass, 2000).
According to Egelhoff (1988, in Kotha & Swamidass, 2000), a key assumption
involving the information processing perspective is that firms will attempt to close the
uncertainty gap by processing information. This can be achieved by gathering of additional
data, transforming the data, and storing or communicating the resultant information. Thus,
there is a relationship between the extent of uncertainty an organization faces and the amount
of information processing within the organization. To be an effective organization, one
should seek the ‘perfect’ fit between their information-processing capacities and the extent of
uncertainty they face. In the context of this thesis, we assume that RPA is able to come closer
to reducing the uncertainty gap to a reasonable amount.
2.1.3 Contingency theory
This study also draws upon the perception of the contingency theory. It states that there is no
best way to organize an organization, to make decisions or to lead a firm. It claims that the
optimal course of action is dependable (contingent) upon the internal and external
environment (Luthans, 1973). So, a leader should choose the right action for the right
situation.

12
The contingency approach was derived from other approaches that were not able to
cope with all the different situations of a firm. The classical approach claimed that a
bureaucratic design would lead to maximum efficiency under any circumstances, but it was
not able to cope with highly dynamic situations. The neo-classical theorists claimed that
decentralization was the best way to organize an organization under any circumstances.
Though, this approach did not work well in a highly cybernated (read: the automatic control
of a process or operation by means of computers) situation. The modern free-form systems
and matrix designs do have universal applicability, but even these approaches did not hold up
under all situations because they were not adaptable to a situation demanding cutbacks and
stability. The approaches (or designs) are conditional in nature. For a stable situation,
bureaucracy may be the best option and for a dynamic situation, the free form may be the
most appropriate approach. In a contingent organizational design, technology, economic,
social conditions and (human) resources are some of the variables that must be considered in
order to determine the best fit.
Fiedler (1967) even developed a contingency model of leadership effectiveness, based
on years of empirical research. Short saying, the model states that a task-directed leader is
most effective in very favorable and very unfavorable situations, and in addition, a human
relations-oriented leader is most effective in moderately favorable and unfavorable situations.
So, the human relations-oriented leader is in between the very two extremists of the task-
directed leader. To classify the situations, he used three dimensions: position power,
acceptance by subordinates and task definition. Classifying situations is the necessary goal of
any contingency approach.
2.1.4 Potential IT value
Research suggests that investments in complimentary assets, such as management skills, user
training, and application of standards, are critical to understanding the return on IT
investments (Barua, Lee & Whinston, 1996; Brynjolfsson & Yang, 1997; Milgrom &
Roberts, 1990, in Davern & Kauffman, 2000). Davern & Kauffman (2000), emphasize on the
consideration of potential value for an IT investment both in ex-ante project selection and ex-
post investment evaluation. In addition to considering IT expenditures and returns on
investment, they argue that it serves to distinguish, to compare the potential of an IT project
and its realized value.
13
The value of an IT investment is likely to be influenced by a spectrum of things
within the organization (e.g., once an application or infrastructure is built and implemented).
This is known as the conversion-effectiveness problems within the firm (Weill, 1990; Weill
& Olson, 1989; in Davern & Kauffman, 2000). The primary emphasis was to understand that
internal, as well as external, factors are weakening or strengthening the results of potential IT
investments. Management can play a huge role in achieving the highest possible realized
value by promoting the project in order to gain support within the firm. External factors, such
as, the actions of competitors, changes in technology in the marketplace and the actions of
government regulators may also influence the realized value of an IT investment. They
recognized in their paper internal and external moderators for IT value.
A lot of (senior) managers, who invest in IT, fail to appreciate the pervasive impacts
of conversion contingencies within the organization. In other words, managers undervalue the
power of internal and external factors, which are weakening or strengthening the results of
potential IT investments. This ought to be of huge importance. Consider the following
situation. Imagine you are sitting in a car and you would like to know what the car is capable
of. You already may be going very fast, but in the end you would like to know the maximum
qualities of the car. What is the car’s potential to go even faster? Is the handling precise?
What is the environmental context, for example, which road and weather conditions suits the
car best? This situation can be compared to IT investments, one should conduct an
appropriate assessment methodology that should lead to an understanding of the potential
value of an IT investment. So, for the practitioner, the potential value of IT investments
should be of more interest than the actual realized value. Therefore, it is crucial to assess
potential value and then sort out what kinds of complementary investments are needed, to
ensure that full potential value can be achieved.
2.1.5 Theory of irreversible investment under uncertainty
The theory of irreversible investment under uncertainty mainly focus on real options,
nevertheless it can be used as a perspective for investing in IT or in particular RPA. It implies
the similarity between a financial call option and an opportunity to invest in a real asset
(Murto & Keppo, 2002). Benaroch & Kauffman (1999), argue that this theory emphasizes the
option-like-characteristics of IT project investments and that a project embeds a real option
when it is able for management to take some further action (e.g., cancel, postpone or scale
up) in response to events occuring within the firm and its environment. Vercammen (2000) is

14
even more specific, he concludes that the standard problem comprised of a firm who must
decide when to invest a fixed amount P in exchange for a project with the value of V, where
the change of V goes hand in hand with time. An option’s value associated with waiting
normally exists, because the decision to invest is irreversible. And, therefore, P must be
significantly less than V in order for the investment to occur.
According to Murto & Keppo (2002), the value of the real option is equal to the net
present value of the investment after all costs plus the time value of the real option, in a
market with no large investors. The value of the option is maximized due to the selected entry
time. In other words, an investment is made at a moment when the time value is zero and the
net present value is strictly positive. On the contrary, with the presence of large investors, it
is much more complicated, because we then have to consider the impact of investments on
the net present values. Due to this, an investment game between firms arises. Long story
short, an investor should consider at what time to invest in a particular IT project.
2.2 Empirical study and Hypotheses development
2.2.1 Robotic Process Automation (RPA) and technological developments
As mentioned in the introduction, Robotic Process Automation does begin to have a profound
effect on the business. Anagnoste (2018) made even the distinction of four different robotic
stages. Orchestrated automation can be translated as: 5-20% is automated. This is mainly
rule-based including scripting, macros and other. Robotic Process Automation (RPA)
involves a minimum of 40% automation of tasks. RPA do have complex rules and includes
cross-application and system workflow automation. In addition, process automation of legacy
systems and user activity replication are included. Upward of 60% we find the cognitive
robotics (CRPA) and lastly, 80% and more is considered to be intelligent robotics (IRPA). At
CRPA we can think of natural language processing, such as voice recognition, cognitive
virtual assistants, voice assistants and cognitive computer vision. At IRPA the starting point
is self-learning and programming. In this phase, programmed robots can even learn and are
able to held a conversation. Anagnoste (2018) even stated that RPA is in the maturity phase
and CRPA and IRPA are on the rise.
Endsley (1999) developed a hierarchy in the context of the use of expert systems to
supplement human decision making by employees and can be seen in appendix 1. This list is
most applicable to cognitive tasks in which operators should respond to and make decisions
based on the system. Another list, including a 10-level taxonomy, should therefore be more
15
applicable to this study, since this taxonomy involves not merely cognitive tasks also
psychomotor tasks (physical movement), this list can be seen in appendix 2. This 10-level
taxonomy enables the researcher to distinguish and measure the level of automation active in
a firm.
For achieving competitive advantage, several organizations tend to involve in
strategic technology partnering, which can be described as the establishment of cooperative
agreements aimed at joint innovative efforts or technology transfer that can have a lasting
effect on the product-market positioning of participating companies (Hagedoorn &
Schakendraad, 1994). They even found evidence supporting their claim. The content and
direction of strategic linkages (or alliances) do significantly influence profitability in several
industries. Also, evidence suggests that companies attracting technology through their
alliances and companies concentrating on R&D cooperation have significantly higher rates of
profit. Thus, this implies that engaging in strategic technology alliances appears to be more
relevant to improve performance than just having a ‘normal’ alliance.
As the global competition and the threats of, for example, outsourcing and off-shoring
to low-cost countries increase, competitive manufacturing capability becomes more and more
urgent and critical for a firm. Automated systems are often regarded as highly efficient, and
have the potential to improve competitiveness (Mehrabi, Ulsoy & Koren, 2000; Yu, Yin,
Sheng & Chen, 2003). Säfsten, Winroth & Stahre (2007) even found evidence that it is
important to seek the right fit between the level of automation since it is found to be affecting
firm performance. With appropiate levels of automation, is it considered that a firm could
achieve the most positive effects on manufacturing performance. If the automation level is
too low, under-automation, or too high, over-automation, the potential positive benefits are
not fully utilized. Where we define appropiate as suitable for the best occasion, some firms
do require a lot more automation to enhance their firm performance than other firms.
Considering automation strategy as part of the manufacturing strategy is potentially
supporting improved manufacturing performance and competitiveness. Although, Säfsten,
Winroth & Stahre (2007) mainly focused on manufacturing, we could presume this applies to
all industries, whether or not to a lesser degree. Since firms automate and adopting
technology in their firm for several reasons; differentiation, growth, innovation and cost
reduction, we could presume that the main goal is to achieve competitive advantage and thus
a better firm performance (Brown et al., 1995). Therefore, we predict a positive effect of the
extent RPA is active in a firm to firm performance. In addition, it is important to filter for
firms operating in a stable environment, whereby we operationalize a stable environment as a
16
firm of which the threat of financial distress is not imminent. Firms facing, for example,
financial distress which are spending heavily on IT or RPA may encounter not any return at
all. Firms facing financial distress are excluded from this research.
H1: Firms with a higher degree of RPA experience a significantly higher degree of financial
firm performance.
2.2.2 IS capabilities
A given firm’s resources and capabilities are of upmost importance, resources enables a firm
to develop capabilities. Capabilities can be described as socially complex routines that
determine the efficiency with which firms transform inputs (resources) into outputs (Collis,
1994) (López-Cabarcos, Göttling-Oliveira-Monteiro, & Vázquez-Rodríquez, 2015).
However, resources alone are not enough to gain and sustain competitive advantage. These
benefits generally only emerge and endure if several activities and resources are
complementary. In addition, one of the main focusses of the resource-based theory is that
firms must base their strategic decisions on a strong set of resources that can generate
complex capabilities and lead to superior performance (López-Cabarcos et al., 2015). For the
sake of this research we follow Ravichandran & Lertwongsatien (2005) to limit the focus to
capabilities in the core functional areas such as planning, systems development, IS support
and IS operations for two reasons. First, consistent with prior research in strategy where
Grant (1991) stated that capabilities can be identified and appraised using a standard
functional classification of the firm’s activities. Second, IS capabilities have not been the
focus of prior IT-firm performance research.
Building upon Grant’s (1991) framework of capabilities, we argue that the ability to
achieve a better firm performance through RPA is dependent on the level of IS capabilities.
Based on the literature review we can formally state that an organization is more likely to
achieve a better firm performance in case the IS capabilities are well established. In this
thesis, we employ two of the four core functional areas, planning and systems development.
IS planning is for example an important process, it enables organizations to prioritize
business tasks and firms are therefore more likely to achieve its goals. With sophisticated IS
planning, convergence between IS and business managers on IT priorities can be achieved
(Boynton, Zmud, & Jacobs, 1994). In addition, to ensure their (IT) targets, which are set up at
the planning process, will be met, firms need to have a well functioning system development.
These two items will be the main focus of this thesis. Effectively utilized systems can be
17
obtained through a maintained mature IS support system, the most benefits can only be
achieved when the systems are fully utilized. Also, the continuity of the systems is an
important aspect for gaining the most benefits. System failures can lead to significant
business disruptions and financial losses.
In this research I focus on the first two items, IS planning sophistication and systems
development in order to test the IS capabilities of a firm, due to time and money reasons. One
cannot have a well established IS operations capability (support and operations) if the first
two items are not well established, therefore we are more interested in the first two items
rather than the IS operations capabilities. This claim is supported with evidence
(Ravichandran & Lertwongsatien, 2005). Organizations that do not have strong IS
capabilities may encounter problems to be succesfull at innovative projects which are meant
to enhance the firm’s performance. Therefore a moderate effect of IS capabilities between
RPA and firm performance is predicted.
H2: Well established IS capabilities in a firm will strengthen the relationship between RPA
and financial firm performance.
2.2.3 IS resources
Resources are the main raw materials in the development of capabilities. In the dynamic
capabilities perspective, the causal relationship between resources and capabilities is more
formally stated, where asset positions are posited to affect capability development (Teece,
Pisano, & Shuen, 1997). Teece et al. (1997) even argued that competencies and capabilities
are embedded in the organizational processes of a firm and the opportunities they afford for
developing competitive advantage are shaped by the assets the firm possesses and the path it
has adopted. Since IS resources are embedded in the organizational processes and based on
the literature review, in particular the resource-based theory, we also argue that the ability to
achieve better firm performance through RPA is dependent on the efficiency and wisely
chosen IS resources. Therefore, we predict a moderate effect of IS resources between RPA
and firm performance
H3: Well established IS resources in a firm will strengthen the relationship between RPA and
financial firm performance.
18
2.2.4 Firm performance
Detailed information about financial firm performance can be retrieved from companies’
profit and loss account, balance sheets and stock price data (Gosh, 2010). Gosh (2010) made
the distinction between accounting and a market-based measure of performance. Return on
assets (ROA) for the former and market to book value ratio for the latter. Bharadwaj (2000),
used the halo index as described in Brown and Perry (1994) to measure the operating and
financial firm performance. It was created by using five-year performance data prior to the
period during which the firms were ranked as IT leaders. The halo index includes measures
of corporate earnings, returns, growth, size, and risk. Kotha & Swamidass (2000), included
six performance measure in their research: after-tax return on total assets, after-tax return on
total sales, net profit position, market share relative to competition, sales growth position
relative to competitors, and overall firm performance. A combination of these six items
proved to be successful in previous research (e.g., Swamidass & Newell, 1987; Robinson &
Pearce, 1988; Venkatraman, 1989).
Another method to measure firm performance of a company involves benchmarking.
Brown, Gatian, & Hicks, Jr. (1995), assessed the performance of the sample firms by relating
sample firm financial performance to the performance of two industry benchmarks for all
comparisons. Benchmark 1 was calculated by computing the simple arithemic average of the
ratio of interest for all other firms in a sample firm’s industry, and weights all firms equally.
The second benchmark was computed by calculating the ratio of interest from appropiate
industry totals.
2.2.5 Control variables
In addition to the theoretical variables, control variables are used to test the relative
relationship of the independent and dependent variables. Following Ravichandran &
Lertwongsatien (2005), firm size, firm age and the information intensity of the industry are
used as control variables. These are held constant and remain unchanged throughout the
course of the study and are not the focus of this research, though they are included to test the
relative relationship of the dependent and independent variables. The size of a firm reflects
past success and may influence current performance, therefore it is included as control
variable (Aldrich & Auster, 1986). Firm age can also affect current performance, it can be
recognized as indication of external legitimacy of the existence of interfirm relationships, of
the staying power, and of the pervasiveness of internal routines.

19
And since we are using a cross-industry sample, it is required to control for the effect of
information intensity of the industry. Young firms (0 – 5 years in business), e.g., can be
subject to liability of newness which can disrupt their performance. Particular industries may
require a higher density of technology usage and the potential payoff from using technology
can therefore vary (Ravichandran & Lertwongsatien, 2005). Measurement of the control
variables is explained in section 3.3.4.
3. Research method
3.1 Research model
Below, a visual representation of the research model is provided. Robotic Process
Automation is the independent variable, IS capabilities and IS resources are the moderating
variables and firm performance is the dependent variable. The main relationship that will be
researched is RPA on firm performance. All effects are predicted to be positive. In addition,
three control variables are included: firm size, firm age and information intensity.
Figure 1: Research model
20
3.2 Method
For this research, three data collection methods were investigated. The first one was in-dept
interviews, a qualitative research technique that involves conducting intensive individual
interviews with a small number of respondents (Boyce & Neale, 2006). The main reason for
not employing this method is that it was not necessary to obtain (very) detailed information,
in addition, cost-related and time-related problems occurred when this method should be
employed. The second method (secondary data collection) was to use different databases to
obtain financial and technological information about firms. Since we are dealing with a
relative great number of indicators for the different variables, it was also a time-consuming
method to obtain data which met the requirements. The third method that was considered is
conducting a survey. It is a data collection method of gathering information, through a pre-
defined questionnaire, from a sample with the intention to generalize this simple to a larger
population. A survey offers a lot of advantages, it is for example easy and fast to obtain a lot
of data (Wright, 2005). So, with zero to a low amount of costs a lot of data can be obtained in
a really short period of time. Therefore, in according to Ravichandran & Lertwongsatien
(2005) and Kotha & Swamidass (2000) on this topic, the research method for this study is
conducting a survey. Both studies achieved a response rate of around 20%, so we can expect
the same percentage. This survey is not industry specific, all industries will be included. The
questions in the survey will be spread out regarding the control variables and four constructs:
RPA, firm performance, IS capabilities and IS resources. To guarantee the firms’ anonymity,
company names will not be disclosed. Therefore, it is not possible to include retrieved
additional information.
To test the three hypotheses, first of all factor analysis will be conducted. It is used to
measure the correlation between different statements corresponding to the constructs a
variable consists of and is used to measure the construct validity. Subsequently, a partial least
squares (PLS) path analysis will be executed, to test whether the independent variables affect
the dependent variable firm performance (Urbach & Ahlemann, 2010) (Henseler, Hubona, &
Ray, 2016). We use several different models to test all three hypotheses.
3.3 Measures
3.3.1 Dependent variable
For the measurement of firm performance, we follow Kotha & Swamidass (2000). The
combination of the items they used, were found to be successful by previous researchers,
21
therefore we chose to adhere to these items. This section contains six items: after-tax return
on total assets, after-tax return on total sales, net profit position, market share gains relative to
competition, sales growth position relative to competition, and overall firm
performance/success. For the first three items, respondents will be asked questions in order to
enable the researcher to successfully calculate and interpret these items. For the last three
items, respondents will be asked to rate their firm on this item using a Likert-type scale where
1 = lowest 20% and 5 = top 20 %. However, it has to be said that the last three items are not
100% valid. A firm can, for example, perform worse for 5 years and only last year see
improvements in overall success. This type of firms will likely be very positive about the last
item; overall firm performance/success. On the contrary, firms performing well over 5 years
and only last year see a decrease in overall success may answer this question relatively low in
comparison to the other group. So, to minimalize this problem, a question of how the trend of
overall firm performance over the last 10 years was (or for newly incorporated firms: from
begin to year t) is asked. Where overall firm performance can be seen as a combination of:
- After-tax return on total assets (ROA)
- After-tax return on total sales (ROS)
- Net profit position
- Market share gains relative to competition
- Sales growth position relative to competition
- Overall firm performance
3.3.2 Independent variable
As for the independent variable, we only have one: Robotic Process Automation (RPA).
For the first hypothesis, respondents will be asked what level of RPA is active in the firm.
We make the distinction between five different ‘levels’. These levels are based on Endsley’s
(1999) taxonomy and are reformulated to achieve a better level of understanding for the
respondents and also, Anagnoste’s (2018) work is considered. Below, the five levels of
automation used in this thesis.
1. Null to low level of automation (0-5%)
Employee is completely in charge and performs all the tasks or employee is almost
completely in charge and system provide some assistance in what to do. Example:
physically process orders in folders based on the system.
2. Low to medium level of automation (5-20%)

22
Employee and/or system generates and selects what to do and system will execute the
action. Employee still retains full control and can easily intervene. Mainly rule-based
including scripts, macros and other.
Example: generating tables in Excel based on the input of employee.
3. Medium level of automation (up to 60%)
Computer generates a list of decision options and selects one and carries it out if
employee consents or employee selects one. This level involves complex rules and
includes cross-application and system workflow automation.
Example: computer generates a list of options (e.g., calculate revenue for month)
based on date (system sees it is time for month-end) and executes this action. Data is
gathered through multiple applications (ERP-system).
4. Medium to high level of automation (up to 80%)
System presents a limited amount of possible actions, user can only select one of
these presented or system selects the best option and carries it out. Employee can still
intervene and monitor. From this stage on, dealing with cognitive robotics such as
natural language processing, voice recognition and cognitive computer vision.
Example: system knows inventory is running low, provides two options: buy
inventory or produce inventory itself. Based on selected option, system will initiate
the process. Employee can still cancel or adjust the selected option.
5. High level of automation (up to 100%)
System is completely in charge and will carry out all actions, employee is out of
control and cannot intervene. This level is self-learning and programming,
programmed robots can learn and are able to held a conversation.
Example: system knows inventory is running low, it will initiate a machine to produce
more items, subsequently another machine provides the delivery to the place where
inventory is held.
In addition, the distinction between seven different departments that specific level is
applicable is made. These will be the following ones:
• Production (when not manufacturing firm: responsible for the turnover)
• Supply chain (export, import, delivering, planning)
• Marketing
• Human Resource Management (HRM)
• Finance & Accounting (control)

23
• Information Technology (IT)
• Research & Development (R&D)
In case a firm consists of fewer departments, one can just answer: not applicable.
3.3.3 Moderating variables
Since we follow Ravichandran & Lertwongsatien (2005) for testing hypothesis 2 and 3, we
adhere to this study for measurement, all measurements are one on one related to their
statements. IS capabilities can be defined into two constructs: IS planning sophistication and
systems development capability. IS planning sophistication relates to the characteristics
(formality, comprehensiveness participation of key stakeholders) of the IS planning process.
Systems development capability relates to the quality of the systems delivery process and the
routines that lead to a reliable and controlled process. It measures the maturity, flexibility and
degree of control of the systems development. Measurement of these two constructs will be
both done by six statements, for the former and latter, as shown in table 1.
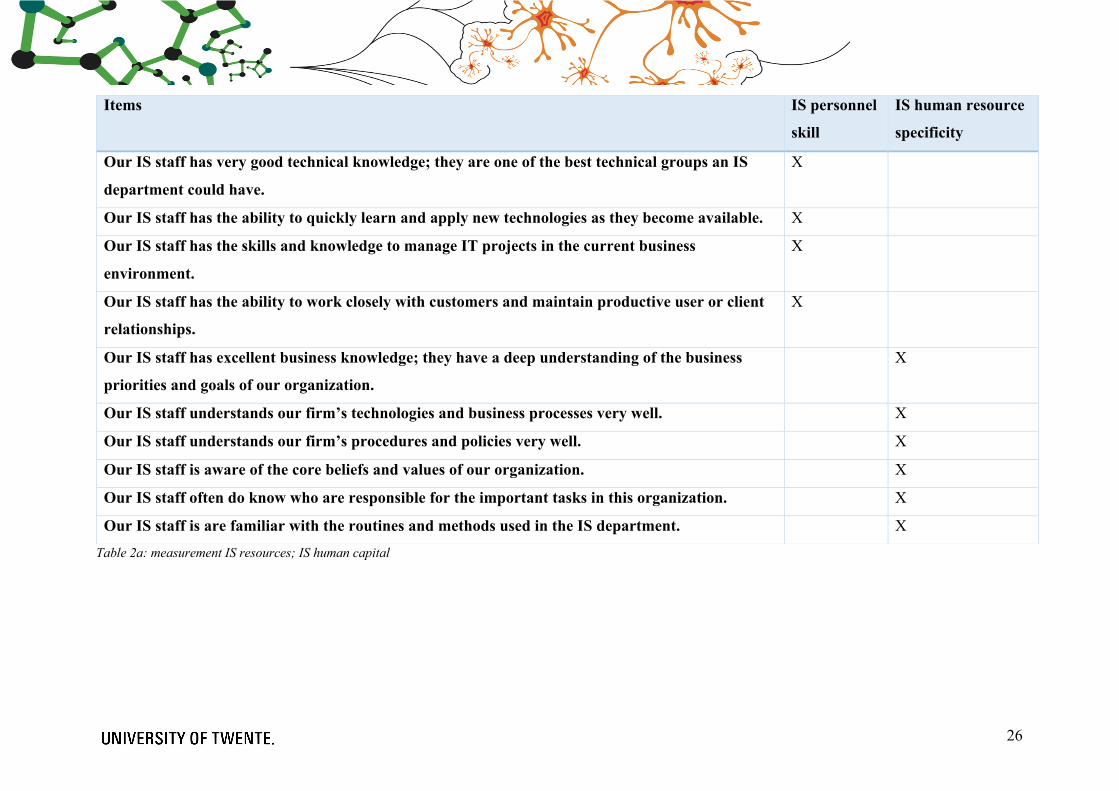
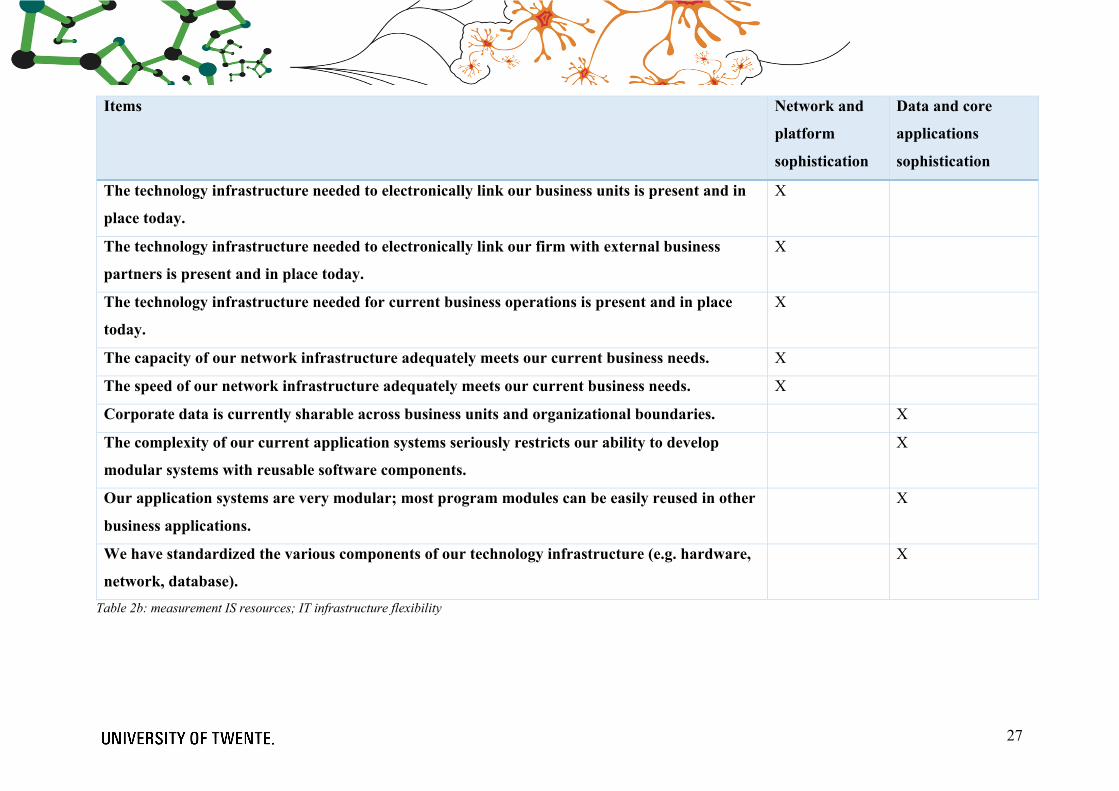
In the research model, two resources will be included: IS human capital and IT
infrastructure flexibility. IS human capital can subsequently be divided into two constructs:
IS personnel skill and IS human resource specificity. The former will be measured by four
statements and the latter by six statements, as shown in table 2a. IS personnel skill measures
the extent to which IS personnel is possessed with critical business, technology, managerial,
and interpersonal skills. IS human resource specificity relates to the extent to which IS
personnel had firm-specific knowledge and measures the extent to which IS personnel had a
good understanding of the organization’s product and services, its business processes, its
unique culture and routines and the extent of their acquaintanceship with people in the
organization. IT infrastructure is divided into network and platform sophistication and data
and core application sophistication. Network and platform sophistication measure the
connectivity, speed, capacity and the extent of standardization of the networks and computer
platforms in the organization. It is measured by five statements, shown in table 2b. Data and
core application sophistication measures the share-ability and reusability of the corporate data
and applications modules in core business applications. This construct is measured by four
statements, also shown in table 2b.

24
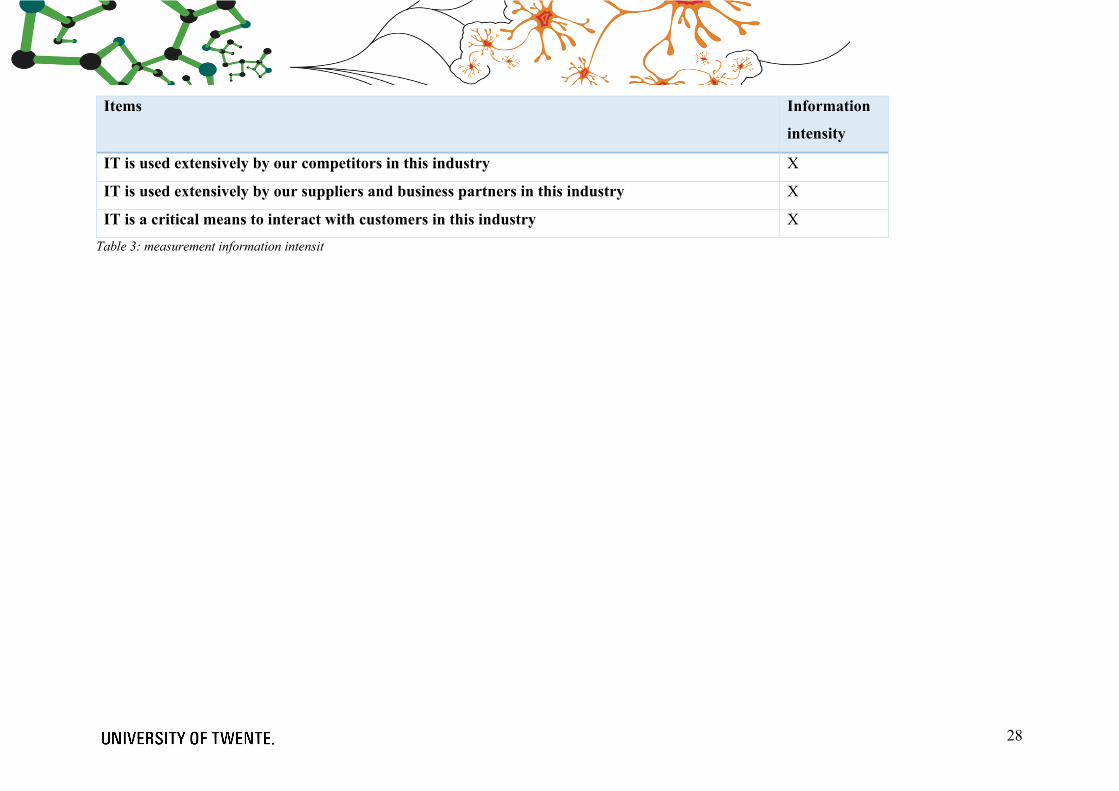
3.3.4 Control variables
In addition to the theoretical variables, we include three control variables. Firm size is
measured by the number of full-time employees active in the firm. Firm age is measured by
the number of years since the firm was incorporated. Information intensity (industry control)
is measured by three statements that assessed the extent to which suppliers, competitors and
business partners in the industry used IS. Measurement of information intensity is shown in
table 3. For the analysis of the PLS path models, we include an additional control variable for
the subjective firm performance measures (market share gains, sales growth rate and overall
firm performance), so for models 4, 6 and 8, to control for the fact that firms tend to answer
overall firm performance based on their recent performance. Therefore, a question of how the
trend of overall firm performance over the last 10 was (or for newly incorporated firms: from
begin to year t) is asked, as explained already in section 3.3.1. The respondent can choose
between five different ‘levels’: strong decreased, slightly decreased, more or less the same,
slightly increased and strong increased. The question is presented in appendix 5, question 7.

25
Table 1: measurement IS capabilities
Items IS planning
sophistication
Systems
development
IS planning is an ongoing process in our organization; planning is not a once-a-year activity. X
Business units’ participation in the IS planning process is very high. X
IS planning is initiated by senior management; senior management participation in IS planning is
very high.
X
We have a formalized methodology for IS planning. X
Our planning methodology has many guidelines to ensure that critical business, organizational, and
technological issues are addressed in evolving a IS plan.
X
We try to be very comprehensive in our planning, every facet is covered. X
Our systems development process can be easily adapted to different types of development projects. X
The systems development is continuously improved using formal measurement and feedback
systems.
X
Our systems development process has adequate controls to achieve development outcomes in a
predictable manner.
X
Our systems development process is flexible to allow quick infusion of new development
methodology, tools, and techniques.
X
Our systems development process facilitates reuse of software assets such as programs, design, and
requirement specifications.
X
We have a mature systems development process, the process is well defined and documented. X
26
Table 2a: measurement IS resources; IS human capital
Items IS personnel
skill
IS human resource
specificity
Our IS staff has very good technical knowledge; they are one of the best technical groups an IS
department could have.
X
Our IS staff has the ability to quickly learn and apply new technologies as they become available. X
Our IS staff has the skills and knowledge to manage IT projects in the current business
environment.
X
Our IS staff has the ability to work closely with customers and maintain productive user or client
relationships.
X
Our IS staff has excellent business knowledge; they have a deep understanding of the business
priorities and goals of our organization.
X
Our IS staff understands our firm’s technologies and business processes very well. X
Our IS staff understands our firm’s procedures and policies very well. X
Our IS staff is aware of the core beliefs and values of our organization. X
Our IS staff often do know who are responsible for the important tasks in this organization. X
Our IS staff is are familiar with the routines and methods used in the IS department. X
27
Items Network and
platform
sophistication
Data and core
applications
sophistication
The technology infrastructure needed to electronically link our business units is present and in
place today.
X
The technology infrastructure needed to electronically link our firm with external business
partners is present and in place today.
X
The technology infrastructure needed for current business operations is present and in place
today.
X
The capacity of our network infrastructure adequately meets our current business needs. X
The speed of our network infrastructure adequately meets our current business needs. X
Corporate data is currently sharable across business units and organizational boundaries. X
The complexity of our current application systems seriously restricts our ability to develop
modular systems with reusable software components.
X
Our application systems are very modular; most program modules can be easily reused in other
business applications.
X
We have standardized the various components of our technology infrastructure (e.g. hardware,
network, database).
X
Table 2b: measurement IS resources; IT infrastructure flexibility
28
Items Information
intensity
IT is used extensively by our competitors in this industry X
IT is used extensively by our suppliers and business partners in this industry X
IT is a critical means to interact with customers in this industry X Table 3: measurement information intensit
29
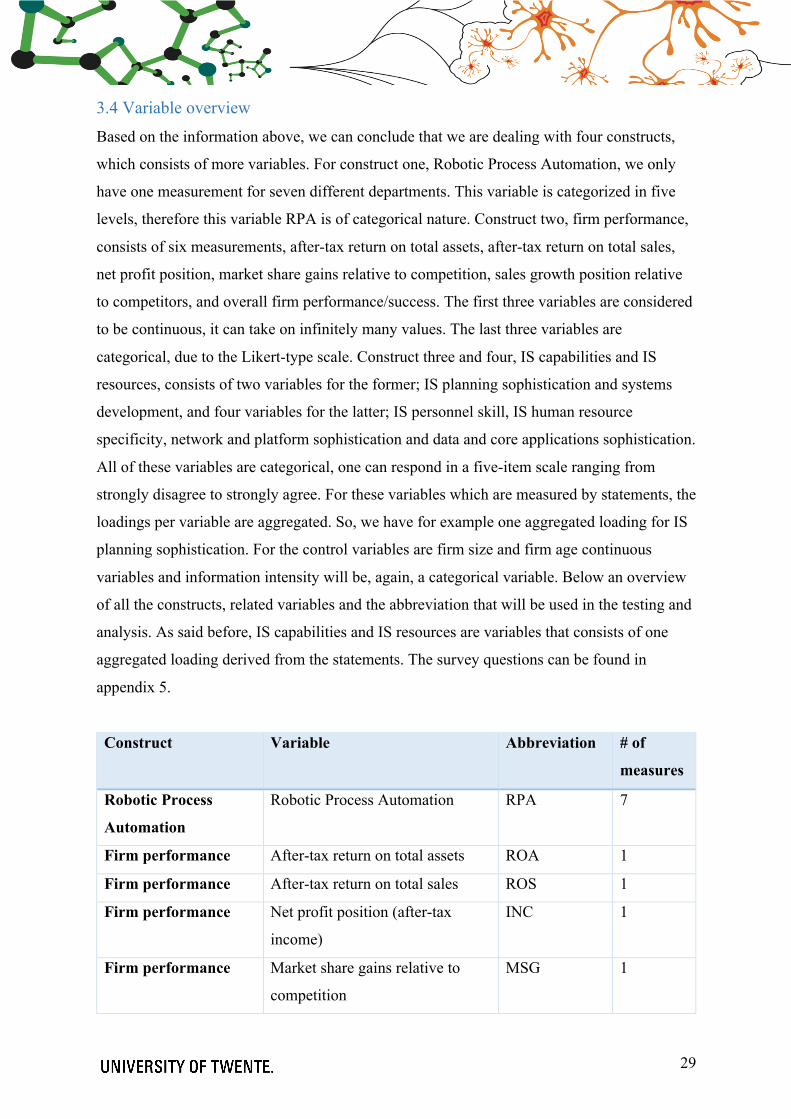
3.4 Variable overview Based on the information above, we can conclude that we are dealing with four constructs,
which consists of more variables. For construct one, Robotic Process Automation, we only
have one measurement for seven different departments. This variable is categorized in five
levels, therefore this variable RPA is of categorical nature. Construct two, firm performance,
consists of six measurements, after-tax return on total assets, after-tax return on total sales,
net profit position, market share gains relative to competition, sales growth position relative
to competitors, and overall firm performance/success. The first three variables are considered
to be continuous, it can take on infinitely many values. The last three variables are
categorical, due to the Likert-type scale. Construct three and four, IS capabilities and IS
resources, consists of two variables for the former; IS planning sophistication and systems
development, and four variables for the latter; IS personnel skill, IS human resource
specificity, network and platform sophistication and data and core applications sophistication.
All of these variables are categorical, one can respond in a five-item scale ranging from
strongly disagree to strongly agree. For these variables which are measured by statements, the
loadings per variable are aggregated. So, we have for example one aggregated loading for IS
planning sophistication. For the control variables are firm size and firm age continuous
variables and information intensity will be, again, a categorical variable. Below an overview
of all the constructs, related variables and the abbreviation that will be used in the testing and
analysis. As said before, IS capabilities and IS resources are variables that consists of one
aggregated loading derived from the statements. The survey questions can be found in
appendix 5.
Construct Variable Abbreviation # of
measures
Robotic Process
Automation
Robotic Process Automation RPA 7
Firm performance After-tax return on total assets ROA 1
Firm performance After-tax return on total sales ROS 1
Firm performance Net profit position (after-tax
income)
INC 1
Firm performance Market share gains relative to
competition
MSG 1

30
Firm performance Sales growth position relative to
competition
SGP 1
Firm performance Overall firm performance/success OFP 1
IS capabilities IS planning sophistication PLS 6
IS capabilities Systems development SYD 6
IS resources IS personnel skill PES 4
IS resources IS human resource specificity HRS 6
IS resources Network and platform
sophistication
NPS 5
IS resources Data and core applications
sophistication
DCS 4
Control variable Firm size SIZ 1
Control variable Firm age AGE 1
Control variable Industry control IND_CNTRL 3 Table 4: variable overview
3.5 Model specification For this research, we investigated three different regression techniques, ordinary least
squares, structural equation modelling and partial least squares. For several reasons we initial
argued that OLS, instead of SEM method, is a better fit for this study (Xiao, 2013) (Little,
Card & Bovaird, 2007). First of all, for the sake of this study we do not need the dependent
variable to be simultaneous, it can appear on both sides of the equation. Secondly, SEM is
able to deal with time-series data, which we do not have in this thesis. And third, SEM is a
really complex model, in this case we prefer simplicity because the fitting ability is similar.
In addition, another concern is the requirement for a much larger sample size. OLS can be
regressed with a minimum of 50 respondents, where SEM can be regressed with atleast a
minimum of around 200 respondents (Xiao, 2013).
But, in case we are dealing with a greater number of observations than the number of
variables (or parameters), PLS provides estimates for this kind of complex models (Henseler,
et al., 2013). It can be applied in many instances of small samples when other methods fail.
When the given assumptions of OLS are not met, OLS will not provide us with the best
estimates. Also, when we are dealing with a relatively small sample size, missing values and
the existence of any multicollinearity PLS provide much more accurate estimates than OLS
31
does (Farahani, Rahiminezhad, Same, & Immannezhad, 2010). And since we are dealing with
latent (hidden) variables, a relatively small sample size, a lot of indicators (for the constructs)
and some missing values, PLS can provides us with better insights than OLS. Therefore, we
chose, in adherence to Ravichandran & Lertwongsatien (2005), to test the models using the
partial least squared regression method. In addition, (Henseler, Hubona, & Ray, 2016) even
states that PLS is a variance-based SEM method which is regarded as the “most fully
developed and general system” and has been widely used in information systems research
(Marcoulides & Saunders, 2006), and other fields.
Partial least squares (PLS) is a multivariate statistical technique which allows a
comparison between multiple response variable and multiple explanatory variables and is one
of a number of covariance based statistical methods (Farahani, et al., 2010). The prediction of
y from x and to describe the common structure underlying the two variables is the main goal
of this technique.
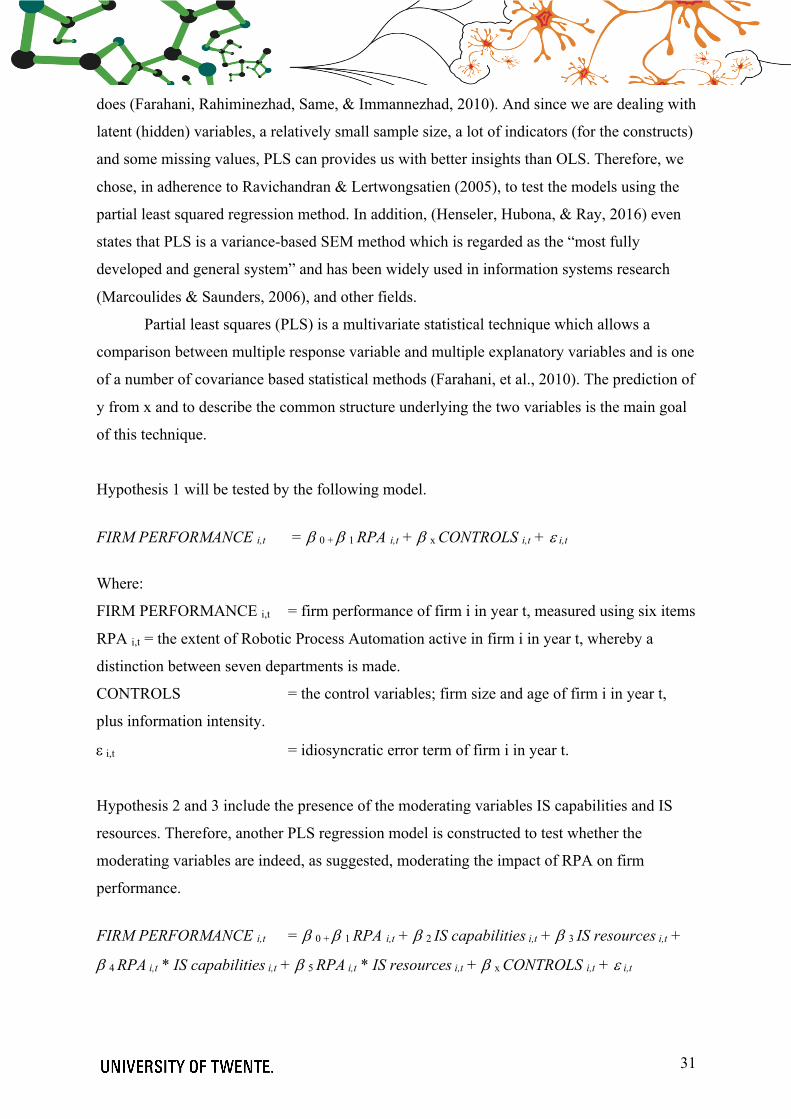
Hypothesis 1 will be tested by the following model.
FIRM PERFORMANCE i,t = b 0 + b 1 RPA i,t + b x CONTROLS i,t + e i,t
Where:
FIRM PERFORMANCE i,t = firm performance of firm i in year t, measured using six items
RPA i,t = the extent of Robotic Process Automation active in firm i in year t, whereby a
distinction between seven departments is made.
CONTROLS = the control variables; firm size and age of firm i in year t,
plus information intensity.
e i,t = idiosyncratic error term of firm i in year t.
Hypothesis 2 and 3 include the presence of the moderating variables IS capabilities and IS
resources. Therefore, another PLS regression model is constructed to test whether the
moderating variables are indeed, as suggested, moderating the impact of RPA on firm
performance.
FIRM PERFORMANCE i,t = b 0 + b 1 RPA i,t + b 2 IS capabilities i,t + b 3 IS resources i,t +
b 4 RPA i,t * IS capabilities i,t + b 5 RPA i,t * IS resources i,t + b x CONTROLS i,t + e i,t
32
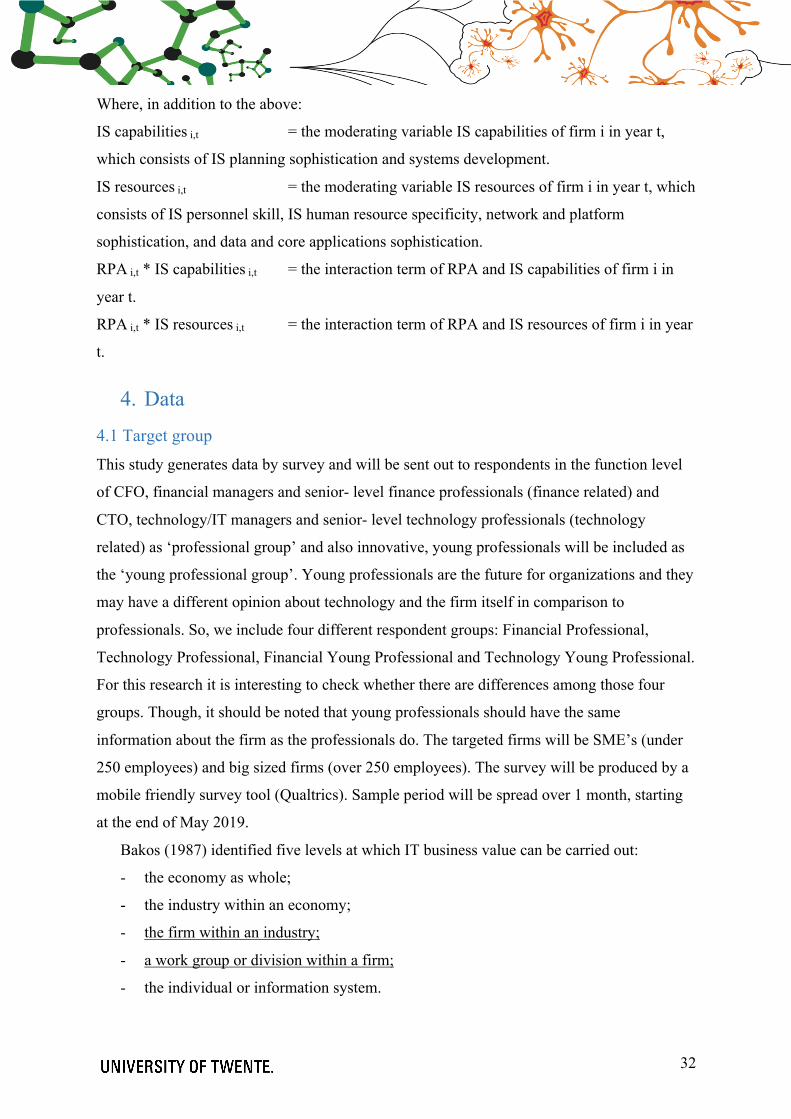
Where, in addition to the above:
IS capabilities i,t = the moderating variable IS capabilities of firm i in year t,
which consists of IS planning sophistication and systems development.
IS resources i,t = the moderating variable IS resources of firm i in year t, which
consists of IS personnel skill, IS human resource specificity, network and platform
sophistication, and data and core applications sophistication.
RPA i,t * IS capabilities i,t = the interaction term of RPA and IS capabilities of firm i in
year t.
RPA i,t * IS resources i,t = the interaction term of RPA and IS resources of firm i in year
t.
4. Data 4.1 Target group This study generates data by survey and will be sent out to respondents in the function level
of CFO, financial managers and senior- level finance professionals (finance related) and
CTO, technology/IT managers and senior- level technology professionals (technology
related) as ‘professional group’ and also innovative, young professionals will be included as
the ‘young professional group’. Young professionals are the future for organizations and they
may have a different opinion about technology and the firm itself in comparison to
professionals. So, we include four different respondent groups: Financial Professional,
Technology Professional, Financial Young Professional and Technology Young Professional.
For this research it is interesting to check whether there are differences among those four
groups. Though, it should be noted that young professionals should have the same
information about the firm as the professionals do. The targeted firms will be SME’s (under
250 employees) and big sized firms (over 250 employees). The survey will be produced by a
mobile friendly survey tool (Qualtrics). Sample period will be spread over 1 month, starting
at the end of May 2019.
Bakos (1987) identified five levels at which IT business value can be carried out:
- the economy as whole;
- the industry within an economy;
- the firm within an industry;
- a work group or division within a firm;
- the individual or information system.

33
This thesis is focusing on the firm within an industry (underlined) and departments within a
firm. The target group will be reached through researcher’s own network, which are all
spread over the country; The Netherlands.
4.2 Collection Due to the fact of proper data collection, the survey will be tested on forehand on a pilot
group. This pilot group enables the researcher to include the feedback into an adjusted survey
which eventually leads to an increase in validity and reliability, due to reducing the
measurement error, and in particular systematic error (Hair, Black, Babin, & Anderson,
2006).
The pilot group did indeed provided feedback about the survey. First of all, the
opening statement contained some sentence structure errors in the translated (Dutch) version.
These errors are adjusted. Questions 8-10 about the financial numbers should be asked in
thousands or millions, was the general feedback. Therefore, question is formulated to force
respondents to answer in thousands (x1,000). Question 11, a performance measure, was not
really clear, more explanation is needed. An example, for more clarification, is given now. In
addition, the third answer option does now possess the name ‘average’, also to increase
clarification for respondents. Lastly, an option ‘unknown’ is added for respondents who are
not able to answer this question. Question 13-15 are questions that involves a five-item scale,
in the initial version only two values were given: strongly disagree and strongly agree.
Respondents of the pilot group found it to be better to see at least one more value. Therefore,
the third item is now valued as ‘neutral’. In addition to question specific feedback, there was
some general feedback that involved translation errors in the language Dutch, these errors are
now adjusted.
4.3 Industry conversion The article of Anagnoste (2018), included a chart in which different industries are being
categorized. He used for his research the following industries: banking & financial services,
insurance, healthcare, manufacturing, hi-tech & telecom and energy & utilities. In addition,
he included the potential for RPA for these different industries in different roles. At least for
all of the before mentioned industries, the potential for RPA is moderate to high. With the
exception of banking & financial services and manufacturing, these industries do have a high

34
potential for RPA, which could indicate that in the finance & accounting industry there are
many tasks that can be, or already are, automated.
According to the U.S. Securities and Exchange Commission (2018), the following
industries are categorized: [agriculture, forestry and fishing], mining, construction,
manufacturing, [transportation, communications, electric, gas and sanitary service],
wholesale trade, retail trade, [finance, insurance and real estate], services and lastly, public
administration. For a closer look to the range of SIC Codes and the corresponding divisions, I
would like to refer to the appendix 3, table 16.
For the sake of this study, we make the distinction between resource winning,
manufacturing of products, providing service and selling the actual products. We would like
to assess whether there is a significant difference among industries, this can only be realized
if we make a clear distinction. In addition, we included financial services and public
administration.
Industry conversion
Range of code Category Abbreviation Division(s)
0100 – 0999,
1000 – 1499,
1500 – 1799
Resource winning RES Agriculture, forestry and
fishing; mining; construction.
2000 – 3999 Manufacturing MAN Manufacturing
4000 – 4999,
7000 – 8999
Services SER Transportation,
communications, electric, gas
and sanitary service; services.
5000 – 5199,
5200 – 5999
Retail RET Wholesale trade; retail trade.
6000 – 6799 Financial services FIN Finance, insurance and real
estate.
9100 – 9729 Public administration PUB Public administration. Table 5: Industry conversion
4.4 Analyzing To analyze the results following of the Likert-scale questions, parametric statistics cannot be
used for interpretation. The analysis should rely on the ordinal nature of the data. Therefore,

35
we use nonparametric procedures—based on rank, median or range—and distribution free
methods such as tabulations, frequencies, contingency tables and chi-squared statistics to
analyze Likert-scale results (Clasen & Dormody, 1994).
For the PLS path analysis, it is necessary to check for multicollinearity, which refers to
predictors that are correlated to other predictors. It exists if a predictor is not just correlated to
the dependent variable, but also to each other (SPSS Test, n.d.). To test for multicollinearity,
we will use VIF values, whereby a value of 1-10 means no existence of multicollinearity and
a value of <1 or >10 means multicollinearity exists. (Statistics Solutions, n.d.).
5. Results In this chapter, the data gained from the survey will be analyzed. The data is analyzed by the
program called SPSS Statistics, version 25. Data collection is ended on the 12th of June, the
collection period stretched over around three weeks. To increase the reliability, the aim of
this survey was to obtain the highest possible number of respondents. To regress the models
explained in 3.5, we use the program SmartPLS, version 3.2.8. This program enables us to
regress the latent variables, including the moderating variables.
5.1 Validity adjustments To increase the validity some adjustments were made. 1 line contained wrong inserted
performance (profit, assets sales) numbers, there was a point placed between the numbers.
So, for example, 1,400 was given as answer, but Qualtrics recorded it as it was 1.4.
Therefore, this line is adjusted to the right amount. 2 other lines contained also errors, the
reported performance measures were not given in thousands. They were reported as whole.
Therefore, adjustments were made in order to increase the validity. Another action that took
place involved missing values. Missing values can disturb the mean and variance values,
therefore missing values were identified. For the performance measures (Q8-Q10), some
respondents answered with 0. This is identified as a missing value, respondents were not able
or did not want to give that information. For question 11 and question 12 there were also
identified missing values. If answered unknown for the former and not applicable for the
latter, it is identified as missing value.
Not only missing values were identified, also outliers were identified and excluded
from the analysis. For the size (number of employees), all above 5000 employees is excluded.

36
This leads to an exclusion of 2 fields. For age, all above 100 years is excluded. This leads to
an exclusion of 3 fields. For the performance measures (Q8-Q10) the following values were
excluded. After-tax income (Q8) above 100,000, resulted in 3 excluded outliers. Total assets
(Q9) above 10,000,000, resulted in 1 excluded outlier. And sales revenue (Q10), above
1,000,000 resulted in 3 excluded outliers. For detecting the outliers, the inter-quartile range
method was used. Values 1,5 times above or below the box-and-whisker plot were deleted.
5.2 Descriptive statistics & frequencies A total of 70 respondents started the survey. Due to the filter, introduced in chapter 2.2.1,
firms facing financial distress are excluded from this research. Respondents who answered
question 1 with probably yes or definitely yes are being considered to be facing financial
distress in the near future. There were in total six respondents who did answer probably yes
or definitely yes, which leads to a valid N of 64. So, in every table from now on we will see
missing values of at least six. A cumulative percentage of 91.4% of the respondents are not
facing imminent financial distress, whereby almost 61.4% of the respondents answered with
definitely not, as shown in appendix 4, table distress.
Table 6 depicts the descriptive statistics for Robotic Process Automation, where a
value of 1 means null to low level of automation and a value of 5 means a high level of
automation active in that particular department in the firm. The results show us the highest
value (mean) of 3.73 for the IT department and the lowest value of 2.95 for the marketing
department, which means that it is more likely that firms employ automation in their IT
department than their marketing department.
Table 7 depicts the descriptive statistics for firm performance. As you can see, there
are 6 items that measures the firm performance. The first number is given in thousands,
where no pre-defined range was set. The second and third were calculated by dividing
income by total assets for the former and by dividing income by total revenue for the latter.
The last three items are subjective, where a value of 1 means lowest 20% and a value of 5 top
20%. The questions are all in comparison to competition. So, for example, for market share
gains, if answered lowest 20% it will mean that at least 80% of competitors are experiencing
more market share gains than you.

37
Descriptive Statistics RPA
Variable name N Minimum Maximum Mean Std. Deviation
RPA production 58 1 5 3.36 1.038
RPA supply chain 55 1 5 3.15 0.970
RPA marketing 62 1 5 2.95 0.982
RPA HRM 64 1 5 3.16 1.057
RPA finance 64 2 5 3.66 0.821
RPA IT 64 2 5 3.73 0.821
RPA R&D 54 1 5 2.96 1.149 Table 6: Descriptive Statistics RPA
Descriptive Statistics Firm Performance
Variable name N Minimum Maximum Mean Std. Deviation
After-tax income 49 -1800 100,000 8313.95 18,862.900
Return on assets 49 -0.72 10.00 0.6217 1.61836
Return on sales 48 -6.00 20.00 0.5051 3.07043
Market share gains 47 1 5 3.30 1.366
Sales growth 48 1 5 3.44 1.183
Overall performance 49 1 5 3.57 1.155 Table 7: Descriptive Statistics Firm Performance
Descriptive Statistics control variables
Variable name N Minimum Maximum Mean Std. Deviation
Size 62 15 3500 491.61 764.750
Age 61 2 100 44.64 32.797
Industry control |
Competitors
64 1 5 4.03 1.154
Industry control |
Suppliers, Business
64 1 5 3.81 1.220
Industry control |
IT critical means
64 1 5 3.83 1.336
Table 8: Descriptive Statistics control variables
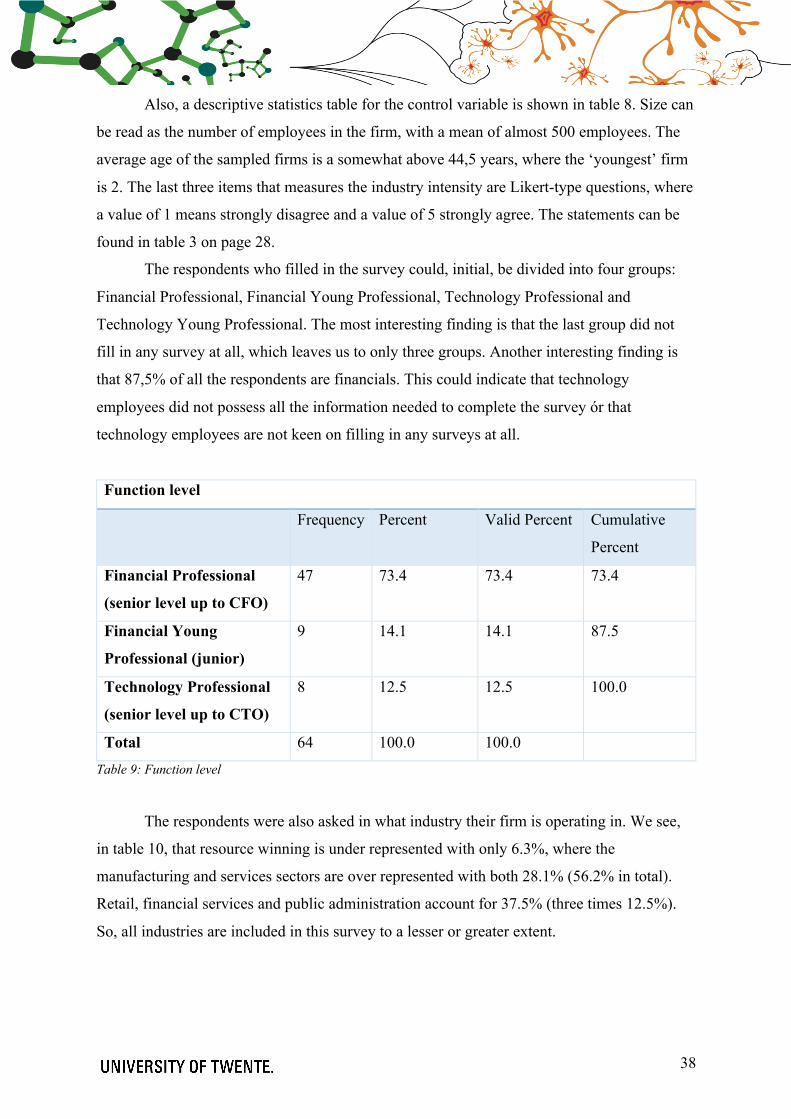
38
Also, a descriptive statistics table for the control variable is shown in table 8. Size can
be read as the number of employees in the firm, with a mean of almost 500 employees. The
average age of the sampled firms is a somewhat above 44,5 years, where the ‘youngest’ firm
is 2. The last three items that measures the industry intensity are Likert-type questions, where
a value of 1 means strongly disagree and a value of 5 strongly agree. The statements can be
found in table 3 on page 28.
The respondents who filled in the survey could, initial, be divided into four groups:
Financial Professional, Financial Young Professional, Technology Professional and
Technology Young Professional. The most interesting finding is that the last group did not
fill in any survey at all, which leaves us to only three groups. Another interesting finding is
that 87,5% of all the respondents are financials. This could indicate that technology
employees did not possess all the information needed to complete the survey ór that
technology employees are not keen on filling in any surveys at all.
Function level
Frequency Percent Valid Percent Cumulative
Percent
Financial Professional
(senior level up to CFO)
47 73.4 73.4 73.4
Financial Young
Professional (junior)
9 14.1 14.1 87.5
Technology Professional
(senior level up to CTO)
8 12.5 12.5 100.0
Total 64 100.0 100.0 Table 9: Function level
The respondents were also asked in what industry their firm is operating in. We see,
in table 10, that resource winning is under represented with only 6.3%, where the
manufacturing and services sectors are over represented with both 28.1% (56.2% in total).
Retail, financial services and public administration account for 37.5% (three times 12.5%).
So, all industries are included in this survey to a lesser or greater extent.

39
Industry
Frequency Percent Valid
Percent
Cumulative
Percent
Resource winning (agriculture;
forestry and fishing; mining;
construction)
4 6.3 6.3 6.3
Manufacturing 18 28.1 28.1 34.4
Services (transportation;
communications; electric, gas and
sanitary service; services)
18 28.1 28.1 62.5
Retail (wholesale trade; retail
trade)
8 12.5 12.5 75.0
Financial services (finance,
insurance and real trade)
8 12.5 12.5 87.5
Public administration 8 12.5 12.5 100.0
Total 64 100.0 100.0 Table 10: Industry of sample
5.3 Factor analysis The second part of the data analysis is to run a factor analysis to test for convergent and
discriminant validity. Where convergent validity is met when all its items load highly on one
factor. So, when some items do not have sufficient loadings (>0.70) they were dropped from
the construct in order to achieve convergent validity. Convergent validity is tested using
factor analysis. Discriminant validity is met when the square root of every average variance
extracted (AVE) value belonging to each latent construct is larger than any correlation among
any pair of latent constructs (Zait & Bertea, 2011). It is tested using a calculation sheet in
Excel and can be found in appendix 6.
5.3.1 Convergent validity Since we are dealing with latent constructs; hypothetical conceptual variables that represent
some underlying variables that are not directly observable (Bollen, 2002), they are all
identified as formative constructs, which in turn means that the indicators cause the construct
(Cenfetelli & Bassellier, 2009). We do have 37 different statements all divided over 8 latent
constructs; IS planning sophistication, systems development, IS personnel skill, IS human

40
resource specificity, network and platform sophistication, data and core applications
sophistication, industry control and last but not least firm performance.
The factor loadings of each item should be 0.70 or higher to be classified as valid
(Hair et al., 2006). In table 11, 12a, 12b and 13 the factor loadings for each construct are
given. For the content of the statements, I would like to refer to chapter 3.1 or appendix 5.
Only 3 out of 37 statements, the loadings are lower than 0.70, where the loading of DCS_2 is
almost zero, even after reverse coding. When we run a correlations matrix for that specific
construct, we do indeed see that DCS_2 does not correlate with statement 1, 3 and 4. So for
the further analyses, we exclude DCS from the research, due to its invalid measurement. We
cannot aggregate DCS into one variable that represents all the data, even if we exclude
DCS_2 we still have an alpha of only 0.628. Thus, we only use the aggregated variable of
network and platform sophistication to represent the data of IS resources; IT infrastructure
flexibility. This is sufficient, because we now have three, instead of four, measurements for
IS resources, whereas IS capabilities only have two measurements. That being said, all other
values for Cronbach’s alpha do meet the test prerequisite that the value should be 0.70 or
higher. The test of Cronbach’s alpha is known as a reliability measure (Bernstein & Nunnaly,
1994).
Following the research (Ravichandran & Lertwongsatien, 2005; Cenfetelli &
Bassellier, 2009), we are able to aggregate the indicators per measurement into one
representing construct, by using the regression method in SPSS, centering the values. So the
mean for the ‘new’ variable is 0 and the variance is equal to the squared multiple correlation
between the estimated factor scores and the true factor values. IS planning sophistication and
systems development were used as formative indicators of IS capabilities. Two factor
loadings are just below 0.70 and they are, therefore, excluded from the construct; they are not
fit to be an indicator for the construct. IS personnel skills and IS human resource specificity
were used as formative indicators of IS resources; human capital. Network and platform
sophistication and data and core applications sophistication were used as formative indicators
of IS resources; IT infrastructure flexibility, though, due to its invalid measurement, as
explained above, we cannot include data and core applications sophistication into the model,
which leaves us to a formative indicator of network and platform sophistication for IS
resources; IT infrastructure flexiblity. In addition, we factored the data from question 11, the
three objective firm performance measures, in table 14.

41
Table 11: factor loadings and Cronbach’s alpha for IS capabilities
Items IS personnel skill IS human resource
specificity
Loadings Loadings
Cronbach’s alpha 0.903
PES_1 0.862
PES_2 0.869
PES_3 0.916
PES_4 0.876
Cronbach’s alpha 0.871
HRS_1 0.732
HRS_2 0.789
HRS_3 0.852
HRS_4 0.765
HRS_5 0.723
Items IS planning
sophistication (initial)
IS planning
sophistication (revised)
Systems
development
Loadings Loadings Loadings
Cronbach’s alpha 0.825 0.797
PLS_1 0.702 0.720
PLS_2 0.793 0.848
PLS_3 0.650 -
PLS_4 0.798 0.830
PLS_5 0.773 0.760
PLS_6 0.670 -
Cronbach’s alpha 0.881
SYD_1 0.776
SYD_2 0.733
SYD_3 0.819
SYD_4 0.851
SYD_5 0.818
SYD_6 0.756

42
HRS_6 0.836 Table 12a: factor loadings and Cronbach’s alpha for IS resources; IS human capital
Items Network and
platform
sophistication
Data and core
applications
sophistication
Cronbach’s alpha 0.858
NPS_1 0.850
NPS_2 0.704
NPS_3 0.879
NPS_4 0.876
NPS_5 0.709
Cronbach’s alpha 0.450
DCS_1 0.802
DCS_2 *(R) 0.066
DCS_3 0.681
DCS_4 0.785 Table 12b: factor loadings and Cronbach’s alpha for IS resources; IT infrastructure flexibility
Note: (R) is reverse coded.
Items Industry control
Cronbach’s alpha 0.864
IND_CNTRL1 0.906
IND_CNTRL2 0.926
IND_CNTRL3 0.835 Table 13: factor loadings and Cronbach’s alpha for industry control.

43
Items Firm performance
Cronbach’s alpha 0.899
MSG 0.864
SGP 0.941
OFP 0.941 Table 14: factor loadings and Cronbach’s alpha for firm performance.
5.3.2 Discriminant validity For the measurement of discriminant validity, we used the following equation (Zait & Bertea,
2011):
Σ[λi2] AVE = ──────────── ,
Σ[λi2]+Σ[Var(εi)]
Equation 1: discriminant validity
Where λi is the loading of each measurement item on its corresponding construct and the
measurement error is εi. As said before discriminant validity is met when the square root of
every AVE value belonging to each latent construct is larger than any correlation among any
pair of latent constructs (Zait & Bertea, 2011). As a threshold, the value of AVE for each
construct should be above 0.50 (Fornell & Larcker, 1981). First, we calculated the AVE for
every construct, which are all above 0.50. Then we used the square root of the correlation
between the two constructs to test for discriminant validity. The constructs that were the
closest related were tested with each other, so for IS capabilities PLS & SYD were taken
together. For IS human capital, PES & HRS were taken together. For IT infrastructure
flexibility, NPS & DCS were taken together. The measurements of industry control and firm
performance were not tested for discriminant validity, cause both constructs were not closely
related to another construct. As you can see, in appendix 6, for all constructs, the AVE was
greater than 0.50 and were greater than the square root of the correlation, which indicates that
discriminant validity is established.
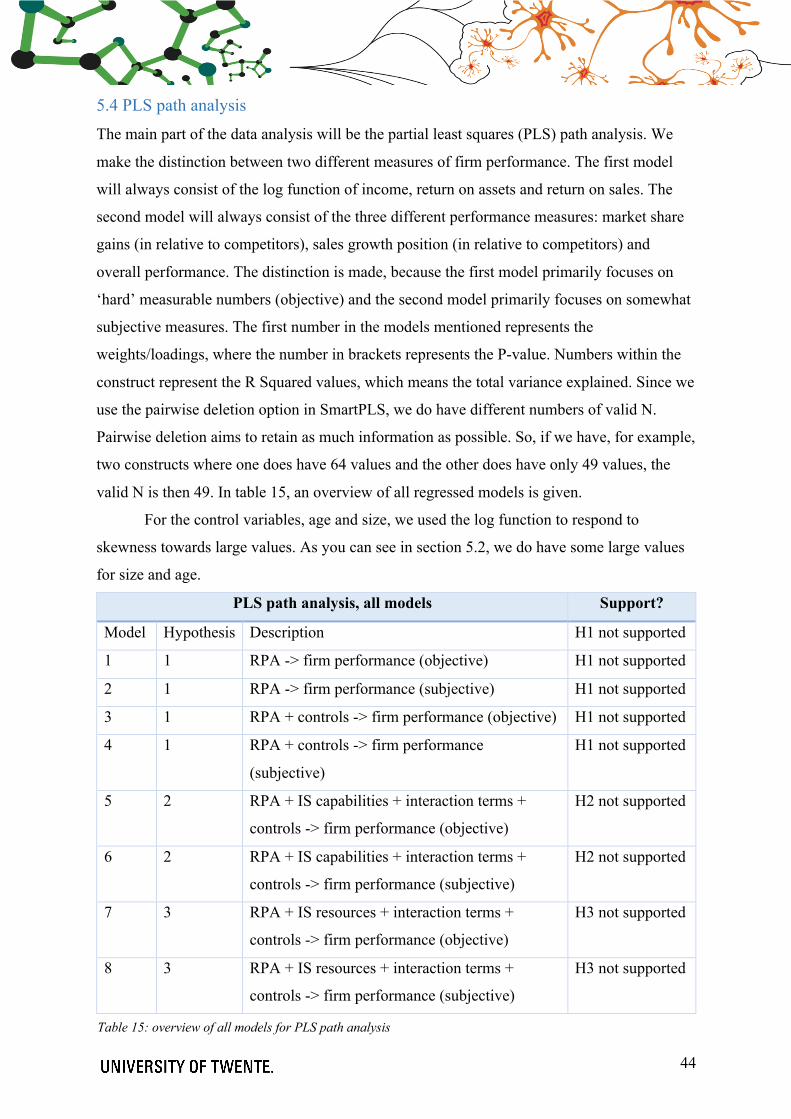
44
5.4 PLS path analysis The main part of the data analysis will be the partial least squares (PLS) path analysis. We
make the distinction between two different measures of firm performance. The first model
will always consist of the log function of income, return on assets and return on sales. The
second model will always consist of the three different performance measures: market share
gains (in relative to competitors), sales growth position (in relative to competitors) and
overall performance. The distinction is made, because the first model primarily focuses on
‘hard’ measurable numbers (objective) and the second model primarily focuses on somewhat
subjective measures. The first number in the models mentioned represents the
weights/loadings, where the number in brackets represents the P-value. Numbers within the
construct represent the R Squared values, which means the total variance explained. Since we
use the pairwise deletion option in SmartPLS, we do have different numbers of valid N.
Pairwise deletion aims to retain as much information as possible. So, if we have, for example,
two constructs where one does have 64 values and the other does have only 49 values, the
valid N is then 49. In table 15, an overview of all regressed models is given.
For the control variables, age and size, we used the log function to respond to
skewness towards large values. As you can see in section 5.2, we do have some large values
for size and age.
PLS path analysis, all models Support?
Model Hypothesis Description H1 not supported
1 1 RPA -> firm performance (objective) H1 not supported
2 1 RPA -> firm performance (subjective) H1 not supported
3 1 RPA + controls -> firm performance (objective) H1 not supported
4 1 RPA + controls -> firm performance
(subjective)
H1 not supported
5 2 RPA + IS capabilities + interaction terms +
controls -> firm performance (objective)
H2 not supported
6 2 RPA + IS capabilities + interaction terms +
controls -> firm performance (subjective)
H2 not supported
7 3 RPA + IS resources + interaction terms +
controls -> firm performance (objective)
H3 not supported
8 3 RPA + IS resources + interaction terms +
controls -> firm performance (subjective)
H3 not supported
Table 15: overview of all models for PLS path analysis
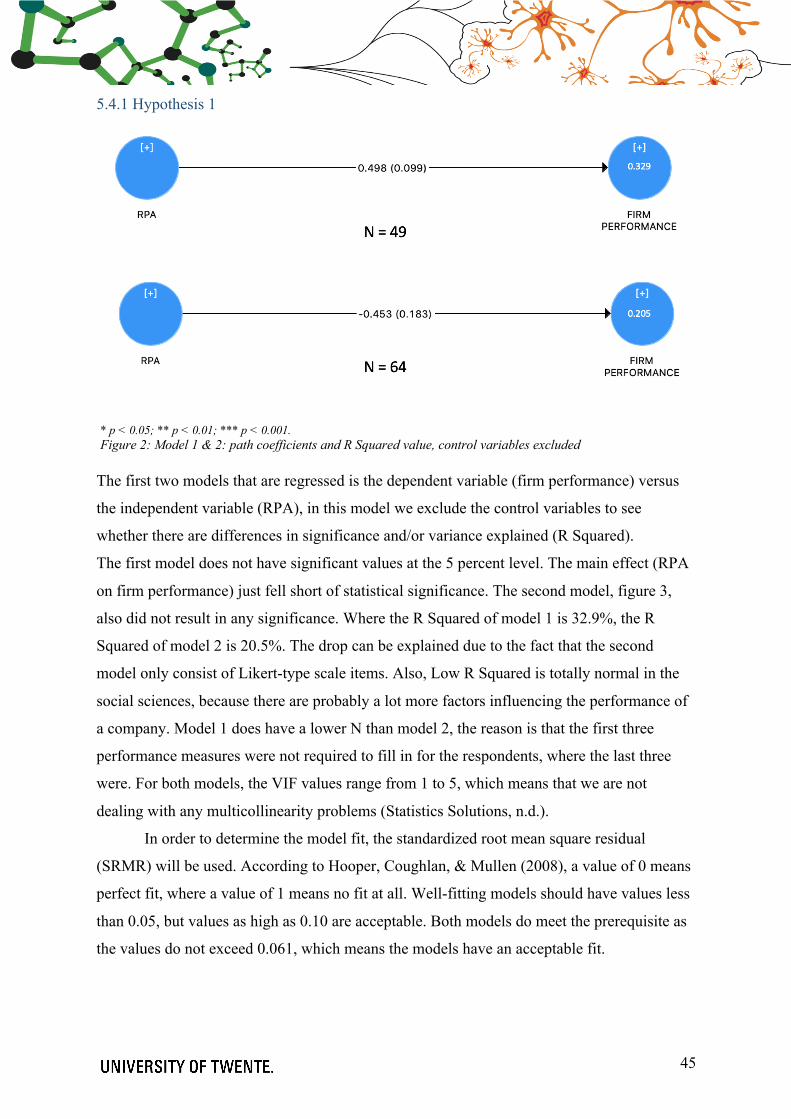
45
5.4.1 Hypothesis 1
The first two models that are regressed is the dependent variable (firm performance) versus
the independent variable (RPA), in this model we exclude the control variables to see
whether there are differences in significance and/or variance explained (R Squared).
The first model does not have significant values at the 5 percent level. The main effect (RPA
on firm performance) just fell short of statistical significance. The second model, figure 3,
also did not result in any significance. Where the R Squared of model 1 is 32.9%, the R
Squared of model 2 is 20.5%. The drop can be explained due to the fact that the second
model only consist of Likert-type scale items. Also, Low R Squared is totally normal in the
social sciences, because there are probably a lot more factors influencing the performance of
a company. Model 1 does have a lower N than model 2, the reason is that the first three
performance measures were not required to fill in for the respondents, where the last three
were. For both models, the VIF values range from 1 to 5, which means that we are not
dealing with any multicollinearity problems (Statistics Solutions, n.d.).
In order to determine the model fit, the standardized root mean square residual
(SRMR) will be used. According to Hooper, Coughlan, & Mullen (2008), a value of 0 means
perfect fit, where a value of 1 means no fit at all. Well-fitting models should have values less
than 0.05, but values as high as 0.10 are acceptable. Both models do meet the prerequisite as
the values do not exceed 0.061, which means the models have an acceptable fit.
* p < 0.05; ** p < 0.01; *** p < 0.001. Figure 2: Model 1 & 2: path coefficients and R Squared value, control variables excluded
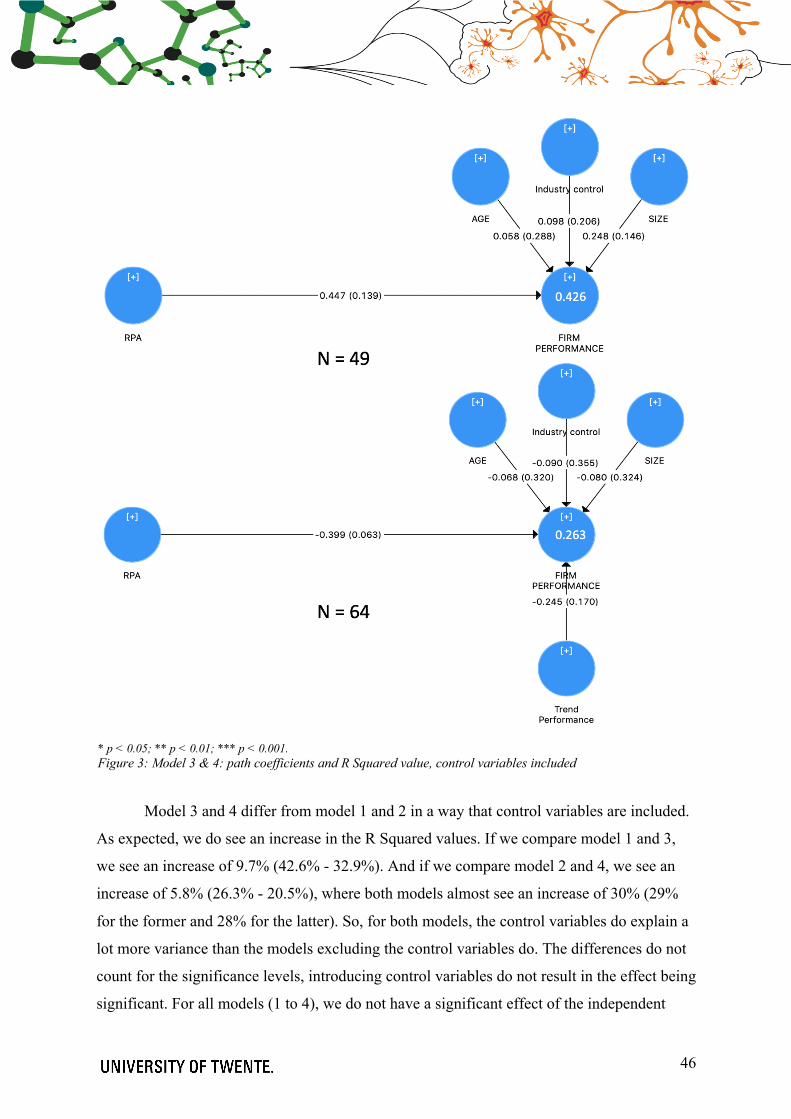
46
Model 3 and 4 differ from model 1 and 2 in a way that control variables are included.
As expected, we do see an increase in the R Squared values. If we compare model 1 and 3,
we see an increase of 9.7% (42.6% - 32.9%). And if we compare model 2 and 4, we see an
increase of 5.8% (26.3% - 20.5%), where both models almost see an increase of 30% (29%
for the former and 28% for the latter). So, for both models, the control variables do explain a
lot more variance than the models excluding the control variables do. The differences do not
count for the significance levels, introducing control variables do not result in the effect being
significant. For all models (1 to 4), we do not have a significant effect of the independent
* p < 0.05; ** p < 0.01; *** p < 0.001. Figure 3: Model 3 & 4: path coefficients and R Squared value, control variables included
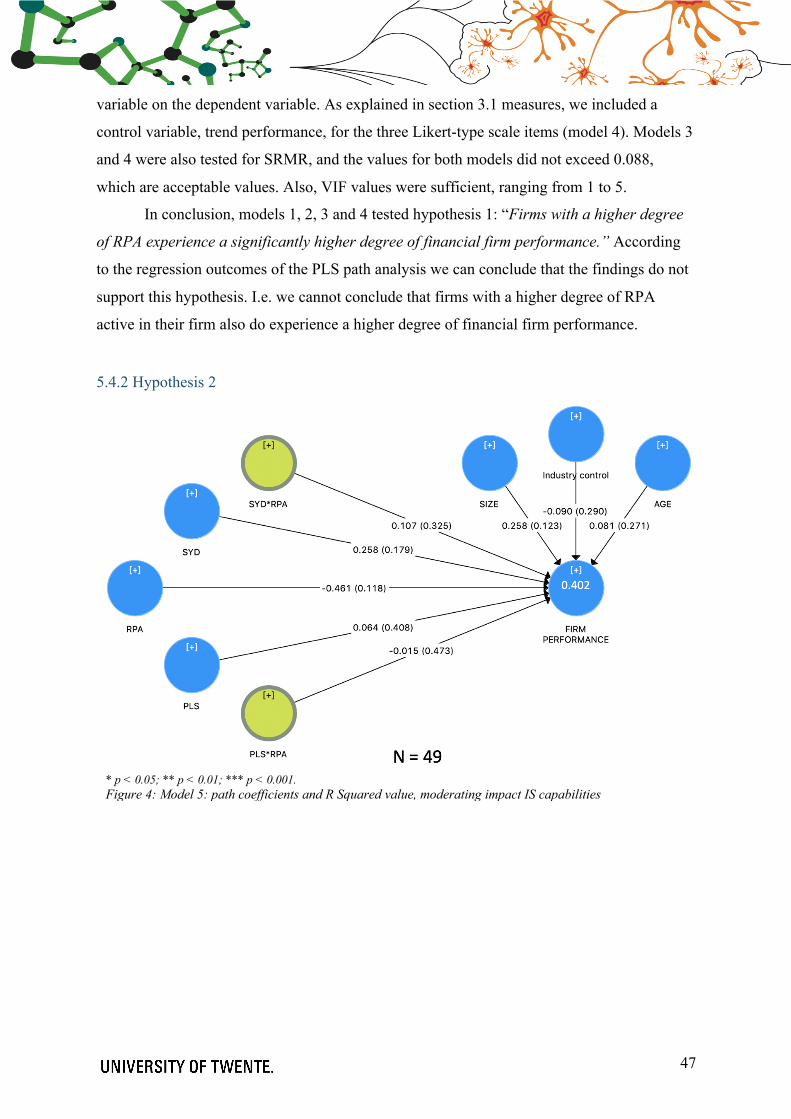
47
variable on the dependent variable. As explained in section 3.1 measures, we included a
control variable, trend performance, for the three Likert-type scale items (model 4). Models 3
and 4 were also tested for SRMR, and the values for both models did not exceed 0.088,
which are acceptable values. Also, VIF values were sufficient, ranging from 1 to 5.
In conclusion, models 1, 2, 3 and 4 tested hypothesis 1: “Firms with a higher degree
of RPA experience a significantly higher degree of financial firm performance.” According
to the regression outcomes of the PLS path analysis we can conclude that the findings do not
support this hypothesis. I.e. we cannot conclude that firms with a higher degree of RPA
active in their firm also do experience a higher degree of financial firm performance.
5.4.2 Hypothesis 2
* p < 0.05; ** p < 0.01; *** p < 0.001. Figure 4: Model 5: path coefficients and R Squared value, moderating impact IS capabilities

48
Models 5 and 6 are employed to test for the moderation of IS capabilities on RPA to firm
performance. As explained above, the first model, consist of the log function of income,
return on assets and return on sales. Where the second model consist of the three different
performance measures: market share gains (in relative to competitors), sales growth position
(in relative to competitors) and overall performance. Number of observations are, as
explained above, 49 for the former and 64 for the latter.
Only for model 6 the SRMR measure did exceed the value of 0.10 (0.100 for model 5
and 0.152 for model 6). Though, since Kenny (2015) argued that SRMR is a positively biased
measure for model fit and that bias is greater for small N and research with low degrees of
freedom, we are not stressed since we do indeed have a small N. R Squared values are still
acceptable for both models, 0.402 for the former and 0.522 for the latter. VIF values range
from 1 to 5, thus sufficient.
In both models, there is no significant relationship found. Even the moderation
effects; PLS*RPA and SYD*RPA are not significant, which indicates that we did not found
evidence to support hypothesis 2: “Well established IS capabilities in a firm will strengthen
the relationship between RPA and financial firm performance.” I.e. we cannot conclude that
well established IS capabilities in a firm strengthen the relationship between RPA and
financial firm performance.
* p < 0.05; ** p < 0.01; *** p < 0.001. Figure 5: Model 6: path coefficients and R Squared value, moderating impact IS capabilities

49
5.4.3 Hypothesis 3
* p < 0.05; ** p < 0.01; *** p < 0.001. Figure 6: Model 7: path coefficients and R Squared value, moderating impact IS resources
* p < 0.05; ** p < 0.01; *** p < 0.001. Figure 7: Model 8: path coefficients and R Squared value, moderating impact IS resources

50
Models 7 and 8 are employed to test for the moderation of IS resources on RPA to
firm performance. The firm performance indicators are the same as previous models. SRMR
did, again, exceed the value of 0.10 (0.218 for model 7 and 0.216 for model 8). R Squared
values did differ from previous two models. Model 7 compared to model 5, we see an
increase of 62% (from 0.402 to 0.652). Model 8 compared to model 6, we see a decrease of
23% (from 0.552 to 0.424). We can explain the increase of the variance due to an increase of
one moderating variable (3 instead of 2), therefore we are surprised by the decrease of model
8. We did not found evidence or any explanation of this occurrence. VIF values range from 1
to 5, thus sufficient.
In both models, there is, again, no significant relationship found. Even the moderation
effects; NPS*RPA, PES*RPA and HRS*RPA are not significant, which indicates that we did
not found evidence to support hypothesis 3: “Well established IS resources in a firm will
strengthen the relationship between RPA and financial firm performance.” I.e. we cannot
conclude that well established IS resources in a firm strengthen the relationship between RPA
and firm performance.
6. Discussion In this study we drew from the resource-based theory, the information processing perspective
and the contingency theory to examine how the internal characteristics of a firm, in particular
Robotic Process Automation (RPA), the IS capabilities and IS resources affect firm
performance. This study contributes to the growing literature in linking IT characteristics of a
firm and firm performance. In addition, this is one of the first studies that linked RPA to firm
performance. Based on the empirical research, we predicted that firms who do experience a
higher degree of RPA in their firm, should also experience better financial firm performance.
We also predicted that this relationship is enhanced by well-established IS capabilities and IS
resources.
The results do not provide us with empirical support for all three hypotheses. Though,
this does not implicate, by no means, that no effect exists. Significance tests can help to
discover whether the obtained data is subjected to any present effect. These findings are
somewhat surprisingly, since literature certainly suggests that a well-established IT
framework results in higher firm performance. On the other hand, most research linking IT
and firm performance is dated (10 years and older) and since the business is rapidly
changing, we are dealing fast emerging markets. I.e. RPA was not thoroughly researched, and

51
we incorporated this technology as one of the first in our research. As stated in the
introduction, RPA is a construct which evolved from three key predecessors.
So, as introduced before, this research is built open several papers. They have done
research in the field of computerization/automation and the effect on firm performance
(Brown, Gatian, & Hicks, Jr., 1995; Bharadwaj, 2000; Kotha & Swamidass, 2000;
Ravichandran & Lertwongsatien, 2005). Bharadwaj (2000), found evidence for the
relationship between superior IT capability and firm performance. Where in turn,
Ravichandran & Lertwongsatien (2005), also found evidence for the claim that intangible IS
resources and IS functional capabilities are critical determinants of how IT is deployed in the
organization, which in turn can affect firm performance. Brown, Gatian & Hicks, Jr. (1995),
researched the relationship of employing Strategic Information Systems (SIS) and firm
performance, and also found evidence supporting their claim that investments in SIS provides
firms with a competitive advantage, thus some financial indication should be noted of that
advantage. Kotha & Swamidass (2000), investigated the relationships between advanced
manufacturing technology (AMT) use and strategy orientations. Their results indicate that
firms with a well-thought strategy orientation are more likely to use AMT, which creates in
turn competitive advantage. So, to conclude, our results are not in line what literature
suggests. Based on earlier research in this field, we argued that RPA should also have a
positive effect on firm performance. This claim is not supported.
The reason for this unsupported claim cannot be explained right away. In the social
sciences we are dealing with a lot of other influencing factors. There may be other factors
(for example: external factors, such as government regulations) that do influence the firm
performance of a firm much more than any technology investment does. Another suggestion
we can think of is that the internal technology framework in a firm is more like a part of the
firm rather than an addition. In the early stages when technology was on the rise, firms could
gain competitive advantage over other firms if they managed to maintain a well-established
internal technology framework, since most firms did not have the resources to employ it in
their firm. Nowadays, most of the firms, if not all, do have any form of automation active in
their firm. Though it should be noted that this suggestion should be taken with a high level of
cautiousness. A metaphor with the internet can be established. In the 90’s only a couple of
households we able to use the internet, for a short period of time (due to practical and cost-
related reasons). Nowadays, 30 years later, we cannot think of a society without internet.

52
7. Conclusion The main objective of this study is to assess the effect of the extent RPA is active in a firm on
firm performance. In addition, the moderating impact of the IS capabilities and the IS
resources, drawn from the resource-based theory, is considered to have a moderating impact
on the main relationship. Based on this objective, the following research question was
formulated in order to give this study a solid research objective: “In what direction
(positive/negative) and to what extent does RPA influence the financial performance of firms
in particular industries for firms in the Netherlands, and to what extent does IS capabilities
and IS resources moderate the impact?” To be able to give a well substantiated answer to this
question, we drew up three hypotheses, based on empirical research.
The first one involves the main relationship we are interested in; “Firms with a higher
degree of RPA experience a significantly higher degree of financial firm performance.” For
this hypothesis, we employed four different PLS path models, where we make the distinction
between two different models with and without control variables where one model measures
the first three performance indicators (log function income, ROA and ROS) and where the
other model measures the last three performance indicators (OFP, MSG and SGP). As
expected, we see an increase of the R Squared values when we incorporate control variables.
Though, hypothesis 1 is by all four models not supported. We did not find exclusive evidence
to support the claim that firms with a higher degree of RPA active experience significantly
higher degrees of financial firm performance.
The second and third hypothesis involves the moderating impact of IS capabilities for
the former and IS resources for the latter on the main relationship (RPA on firm
performance). Hypothesis 2 is formulated as: “Well established IS capabilities in a firm will
strengthen the relationship between RPA and financial firm performance.” Hypothesis 3 is
formulated as: “Well established IS resources in a firm will strengthen the relationship
between RPA and financial firm performance.” For these hypotheses, we employed two
different models per hypothesis (four in total), where the same distinction for the
performance measures are made. In these models, we included, in addition to the original
model, the constructs for IS capabilities and IS resources and the moderation effects of these
latent variables. Just like hypothesis 1, we did not find any evidence supporting hypothesis 2
and 3. Which indicates that we cannot conclude that well established IS capabilities and IS
resources in a firm will strengthen the relationship between RPA and financial firm
performance.

53
Last but not least, based on the outcomes of the hypotheses, we can give a concise
answer to the research question. We cannot confirm that RPA does influence the financial
performance of firms in The Netherlands. In addition, well-established IS capabilities and IS
resources appear not to be influencing this, before mentioned, relationship.
8. Implications Our aim was to build upon several research which investigated the relationship of different
aspects of IT automation in a firm and firm performance. Also, since RPA is a new emerging
technology, it has not been researched thoroughly. With this study, we aimed to bridge that
gap. The major practical contribution is that we, in contrast to the prior predictions, found no
evidence to support the before mentioned claims. Managers and other executives of firms
can, therefore, be indifferent as to how much should be automated in their firm. This gives
further research the opportunity to support or refute our findings.
Firms that tend to aim for the best or highest possible firm performance should not try
to achieve that with employing more or less automation/technology, since our results
suggests that no competitive advantage can be obtained through employing more automation.
On the other hand, neglecting the IT policy and every other thing involved with automation
can possible lead to negative, undesired effects. So, it is really arguable if one should just
simply pay no more attention to IT anymore. We definitely think that IT should be well
managed, even if we did not found evidence supporting the claim that a better IT framework
results in better firm performance. Though, it is a thoughtful assumption and we cannot
support this with any evidence or data.
9. Limitations and directions for further research As with any other research, this study has also its limitations. The data obtained was cross-
sectional data, a snapshot in time. Therefore, we were only able to compare firms with other
firms. A suggestion for further research can therefore be, employing a longitudinal study for
different firms and measure whether there are significant differences between time-stamps.
I.e. measure at two different time-stamps the automation active in a firm and the firm
performance.
Due to time and cost related issues we were not able to obtain a relatively large
sample size. We initial got 70 responses, where 6 were invalid. So, to increase the power of

54
the research model and this study as whole, we recommend achieving a sample size as high
as possible for the most accurate results. Though, it has to be said that everything is done to
achieve the highest possible sample size. In addition, we used a data collection method where
only one representative of firm answered the survey. This method, therefore, suffers from the
fact that the data represents the opinions of only one person in the firm. However, the data
represents the perceptions of financials and technology employees in the firm, who are most
likely to possess the most information about automation active in a firm and the firm
performance. Hence, their answers are likely to be valid. A suggestion for further research
can be, obtaining data not only from one representative of firm but multiple.
Another limitation that we faced is the fact that Robotic Process Automation has not
been researched thoroughly and was therefore much more difficult to measure than other
variables. Also, we measured RPA with reference to different scales and the perceptions of
one representative of a firm. Suggestions for further research can be, employing a research on
RPA to enable the science to better understand this construct. In addition, new research can
measure RPA in a different way. Observations may suit this construct better, but it does cost
more money and can be really time-consuming.
This study is conducted in The Netherlands with no exception of any specific areas,
but due to convenience sampling and due to the fact that the researcher of this study has a
network where most of the representatives were located in the north-east of The Netherlands,
most of the respondents were located in the north-east of the country. A suggestion for
further research is therefore quite logical, other studies can consider other countries or
specific regions. In addition, we included every industry in this thesis, other studies could
consider focusing on fewer industries than we did.

55
10. Bibliography Aldrich, H., & Auster, E. R. (1986). Even dwarfs started small: Liabilities of age and size and
their strategic implications. Research in Organizational Behavior, 165-198.
Anagnoste, S. (2018). Robotic Automation Process – The operating system for the digital
enterprise. Proceedings of the International Conference on Business Excellence,
12(1), 54-69.
Bakos, J. Y. (1987). Dependent Variables for the Study of Firm and Industry-Level Impacts
of Information Technology. Proceedings of the Eighth International Conference on
Information Systems.
Barrutia, J. M., & Echebarria, C. (2015). Resource-based view of sustainability engagement.
Global Environmental Change, 34, 70-82.
Benaroch , M., & Kauffman, R. J. (1999). A case for using real options pricing analysis to
evaluate information technology project investments. Information Systems Research,
10(1), 70-86.
Bernstein, I. H., & Nunnaly, J. C. (1994). Psychometric theory. New York: McGraw-Hill
Higher INC.
Bharadwaj, A. S. (2000). A resource-based perspective on information technology capability
and firm performance: an empirical investigation. MIS quarterly, 169-196.
Bollen, K. A. (2002). Latent variabels in psychology and the social sciences. Annual review
of psychology, 53(1), 605-634.
Boyce, C., & Neale, P. (2006). Conducting in-depth interviews: A guide for designing and
conducting in-depth interviews for evaluation input.
Boynton, A. C., Zmud, R. W., & Jacobs, G. (1994). The influence of IT management practice
on IT use in large organizations. MIS Quarterly, 18(3), 299-318.
Brown, R. M., Gatian, A. W., & Hicks, Jr., J. O. (1995). Strategic Information Systems and
Financial Performance. Journal of Management Information Systems, 11(4), 215-248.
Cenfetelli, R. T., & Bassellier, G. (2009). Interpretation of formative measurement in
information systems research. MIS quarterly, 689-707.
Clasen, D. L., & Dormody, T. J. (1994). Analyzing Data Measured by Individual Likert-Type
Items. Journal of Agricultural Education, 35(4).
Collis, D. J. (1994). How Valuable Are Organizational Capabilities. Strategic Management
Journal, 15, 143-152.
Conner, K. R., & Prahalad, C. K. (1996). A resource-based theory of the firm: Knowledge
versus opportunism. Organization Science, 7(5), 477-501.

56
Das, T. K., & Teng, B.-S. (2000). A Resource-Based Theory of Strategic Alliances. Journal
of Management, 26(1), 31-61.
Davern, M. J., & Kauffman, R. J. (2000). Discovering potential and realizing value from
information technology investments. Journal of Management Information Systems,
16(4), 121-143.
Dierickx, I., & Cool, K. (1989). Asset stock accumulation and sustainability of competitive
advantage. Management Science, 35(12), 1504-1511.
Egelhoff, W. G. (1982). Strategy and structure in multinational corporations: an information
processing approach. Administrative Science Quarterly, 27(4), 435-458.
Endsley, M. R. (1999). Level of automation effects on performance, situation awareness and
workload in a dynamic control task. Ergonomics, 42(3), 462-492.
Farahani, H. A., Rahiminezhad, A., Same, L., & Immannezhad, K. (2010). A Comparison of
Partial Least Squares (PLS) and Ordinary Least Squares (OLS) regressions in
predicting of couples mental health based on their communicational patterns.
Procedia-Social and Behavioral Sciences, 5, 1459-1463.
Fiedler, F. E. (1967). A Theory of Leadership Effectiveness. New York: McGraw-Hill Book
Company.
Fornell, C., & Larcker, D. F. (1981). Evaluating structural equation models with
unobservable variables and measurement error. Journal of Marketing Research,
18(1), 39-50.
Gosh, S. (2010). Firm Performance and CEO Pay: Evidence from Indian Manufacturing. The
Journal of Entrepreneurship, 19(2), 137-147.
Grant, R. M. (1991). The resource-based theory of competitive advantage: Implications for
strategy formulation. California Management Review, 33(3), 114-135.
Hagedoorn, J., & Schakendraad , J. (1994). The effect of strategic technology alliances on
company performance. Strategic Management Journal, 15(4), 291-309.
Hair, J. F., Black, W. C., Babin, B. J., & Anderson, R. E. (2006). Multivariate Data Analysis.
Pearson Education Limited.
Henseler, J., Dijkstra, T. K., Sarstedt, M., Ringle, C. M., Diamantopoulos, A., Straub, D. W.,
. . . Calantone, R. J. (2013). Common Beliefs and Reality About PLS: Comments on
Rönkkö and Evermann. Organizational Research Methods, 17(2), 182-209.
Henseler, J., Hubona, G., & Ray, P. A. (2016). Using PLS path modeling in new technology
research: updated guidelines. Industrial Management & Data Systems, 116(1), 2-20.
57
Hooper, D., Coughlan, J., & Mullen, M. (2008). Structural equation modelling: Guidelines
for determining model fit. Articles, 53-60.
Keller, R. T. (1994). Technology-information processing fit and the performance of R&D
project groups: a test of contingency theory. Academy of Management Journal, 37(1),
167-179.
Kenny, D. A. (2015). Measuring model fit.
Kotha, S., & Swamidass, P. M. (2000). Strategy, advanced manufacturing technology and
performance: empirical evidence from U.S. manufacturing firms. Journal of
Operations Management, 18(3), 257-277.
Lhuer, X. (2016, 12). The next acronym you need to know about: RPA (robotic process
automation). Retrieved 10 05, 2018, from McKinsey&Company, Digital McKinsey;
Our insights: https://www.mckinsey.com/business-functions/digital-mckinsey/our-
insights/the-next-acronym-you-need-to-know-about-rpa
Little, T. D., Card, N. A., & Bovaird, J. A. (2007). Structural Equation Modeling of
Mediation and Moderation With Contextual Factors. Modeling contextual effects in
longitudinal studies, 207-230.
López-Cabarcos, M. Á., Göttling-Oliveira-Monteiro, S., & Vázquez-Rodríquez, P. (2015).
Organizational Capabilities and Profitability: The Mediating Role of Business
Strategy. SAGE Open, 5(4), 1-13.
Luthans, F. (1973). The contingency theory of management: A path out of the jungle.
Business Horizons, 16(3), 67-72.
Mahlendorf, M. D. (2014). The Multiple Roles of the Finance Organization: Determinants,
Effectiveness, and the Moderating Influence of Information System Integration.
Journal of Management Accounting Research, 26(2), 33-42.
Marcoulides, G. A., & Saunders, C. (2006). Editor's comments: PLS: a silver bullet? MIS
quarterly , iii-ix.
Mehrabi, M. G., Ulsoy, A. G., & Koren, Y. (2000). Reconfigurable manufacturing systems:
Key to future manufacturing. Journal of Intelligent Manufacturing, 11, 403-419.
Murto, P., & Keppo, J. (2002). A game model of irreversible investment under uncertainty.
International Game Theory Review, 4(2), 127-140.
Ostdick, N. (2016). The Evolution of Robotic Process Automation (RPA): Past, Present, and
Future. Retrieved from UiPath: https://www.uipath.com/blog/the-evolution-of-rpa-
past-present-and-future
58
Ravichandran, T., & Lertwongsatien, C. (2005). Effect of information systems resources and
capabilities on firm performance: A resource-based perspective. Journal of
Management Information Systems, 21(4), 237-276.
Säfsten, K., Winroth, M., & Stahre, J. (2007). The content and process of automation
strategies. International Journal of Production Economics, 110(1-2), 25-38.
SPSS Test. (n.d.). Multicollinearity Test Example Using SPSS. Retrieved from
https://www.spsstests.com/2015/03/multicollinearity-test-example-using.html
Statistics Solutions. (n.d.). Conduct and Interpret a Multiple Linear Regression. Retrieved
from https://www.statisticssolutions.com/multiple-linear-regression/
Teece, D. J., Pisano, G., & Shuen, A. (1997). Dynamic capabilities and strategic
management. Strategic Management Journal, 18(7), 509-533.
U.S. Securities and Exchange Commision. (2015, 01 25). Division of Corporation Finance:
Standard Industrial Classification (SIC) Code List. Retrieved from Division of
Corporation Finance: Standard Industrial Classification (SIC) Code List:
https://www.sec.gov/info/edgar/siccodes.htm
Urbach, N., & Ahlemann, F. (2010). Structural Equation Modeling in Information Systems
Research Using Partial Least Squares. Journal of Information Technology and
Application, 11(2), 5-40.
Vercammen, J. (2000). Irreversible investment under uncertainty and threat of bankruptcy.
Economics letters, 66(3), 319-325.
Wright, K. B. (2005). Researching Internet-based populations: Advantages and disadvantages
of only survey research, online questionnaire authoring software packages, and web
survey services. Journal of computer-mediated communication, 10(3).
Xiao, X. (2013). Structural equation modeling compared with ordinary least squares in
simulations and life insurers’ data.
Yu, J., Yin, Y., Sheng, X., & Chen, Z. (2003). Modelling strategies for configurable
assembly systems. Assembly Automation, 23(3), 266-272.
Zait, A., & Bertea, P. E. (2011). Methods for testing discriminant validity. Management &
Marketing Journal, 9(2), 217-224.
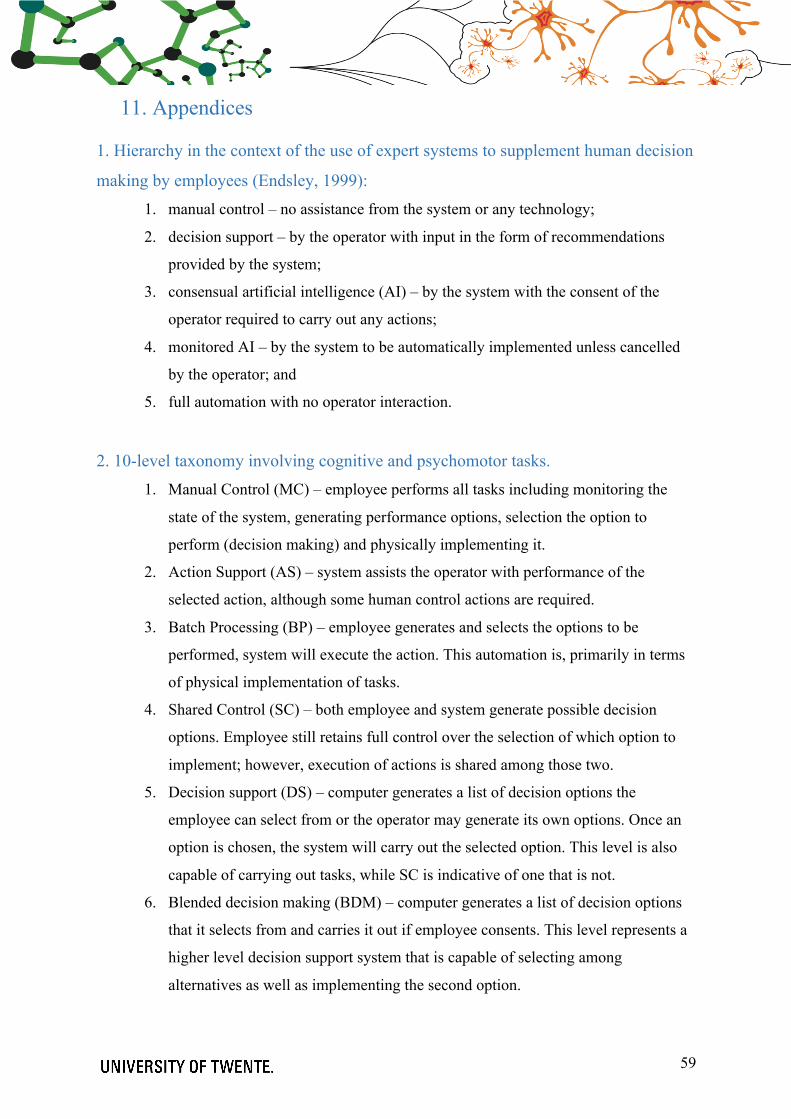
59
11. Appendices 1. Hierarchy in the context of the use of expert systems to supplement human decision
making by employees (Endsley, 1999): 1. manual control – no assistance from the system or any technology;
2. decision support – by the operator with input in the form of recommendations
provided by the system;
3. consensual artificial intelligence (AI) – by the system with the consent of the
operator required to carry out any actions;
4. monitored AI – by the system to be automatically implemented unless cancelled
by the operator; and
5. full automation with no operator interaction.
2. 10-level taxonomy involving cognitive and psychomotor tasks. 1. Manual Control (MC) – employee performs all tasks including monitoring the
state of the system, generating performance options, selection the option to
perform (decision making) and physically implementing it.
2. Action Support (AS) – system assists the operator with performance of the
selected action, although some human control actions are required.
3. Batch Processing (BP) – employee generates and selects the options to be
performed, system will execute the action. This automation is, primarily in terms
of physical implementation of tasks.
4. Shared Control (SC) – both employee and system generate possible decision
options. Employee still retains full control over the selection of which option to
implement; however, execution of actions is shared among those two.
5. Decision support (DS) – computer generates a list of decision options the
employee can select from or the operator may generate its own options. Once an
option is chosen, the system will carry out the selected option. This level is also
capable of carrying out tasks, while SC is indicative of one that is not.
6. Blended decision making (BDM) – computer generates a list of decision options
that it selects from and carries it out if employee consents. This level represents a
higher level decision support system that is capable of selecting among
alternatives as well as implementing the second option.

60
7. Rigid system (RS) – system only presents a limited set of actions to the operator.
Operator’s role is to select one and cannot generate any other options.
8. Automated decision making (ADM) – system selects the best option to implement
and carry out that action, based upon a list of alternatives it generates.
9. Supervisory control (SC) – system generates options, selects the option to
implement and carries out that action. Employee monitors the system and
intervenes only if necessary.
10. Full automation (FA) – system carries out all actions. Employee is completely out
of control in the process and cannot intervene.
3. Range of SIC Codes per division.
Range of SIC Codes Division
0100 – 0999 Agriculture, Forestry and Fishing
1000 – 1499 Mining
1500 – 1799 Construction
1800 – 1999 Not used
2000 – 3999 Manufacturing
4000 – 4999 Transportation, Communications, Electric,
Gas and Sanitary service
5000 – 5199 Wholesale trade
5200 – 5999 Retail trade
6000 – 6799 Finance, Insurance and Real Estate
7000 – 8999 Services
9100 – 9729 Public Administration
9900 – 9999 Nonclassifiable Table 16: Industries based on SIC codes (U.S. Securities and Exchange Commission, 2018)

61
4. SPSS output
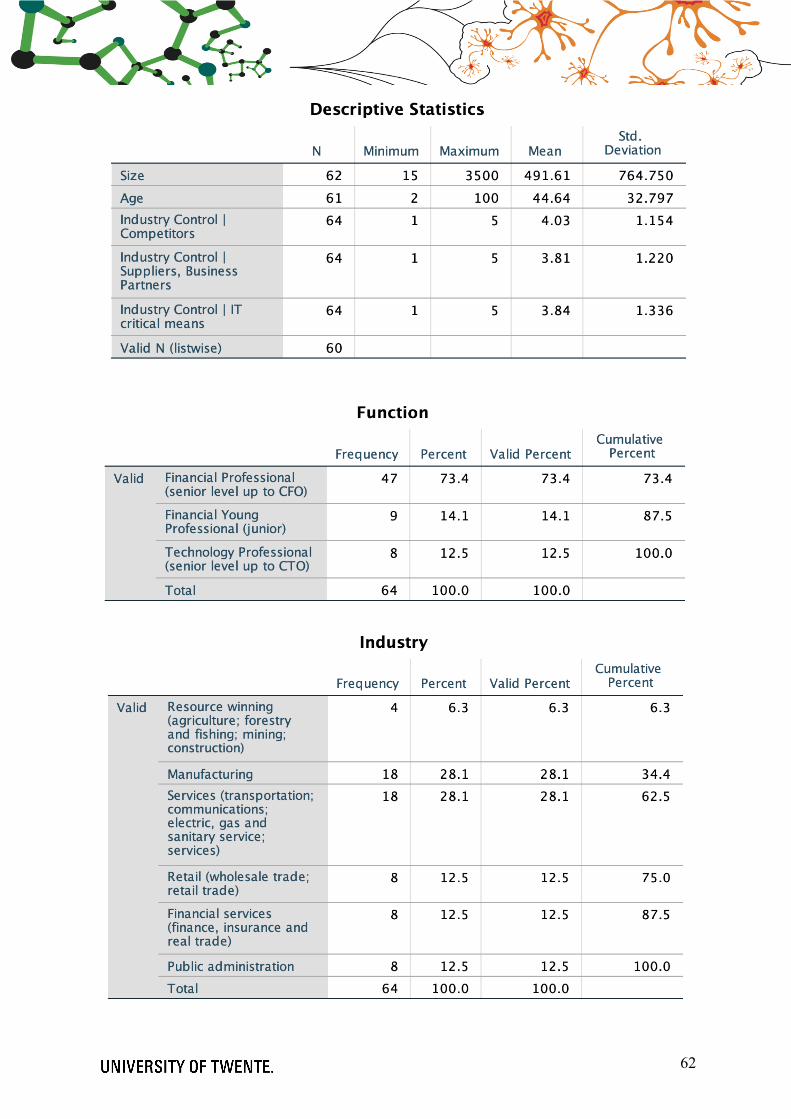
62

63
5. Survey questions
Thesis
Start of Block: Default Question Block
Info
The purpose of this survey is to test how Robotic Process Automation (RPA) influences firm
financial performance in The Netherlands. First of all, some general questions are asked, such
as size, age and industry related. Subsequently, questions regarding the financial performance
of the firm are being asked. Followed by a question about the automation levels active in the
firm and the last questions are statements regarding a few aspects of the firm.
This survey is written in two languages: English and Dutch. Please choose a language that
suits you best and that makes you most comfortable. This survey will take approximately
around 10 minutes of your time (on top of the page, you will see a progress bar) . In advance,
I would like to thank you for participating in this survey and to thank for your time.
This survey will be conducted anonymously, sensitive information will not be made public.
The main focus of this survey is to confirm or invalidate suggested relationships. This survey
will therefore not harm the respondents. By answering this survey, you voluntarily consent to
take this survey. You can withdraw from the research at any time without
explanation/justification.
Page Break
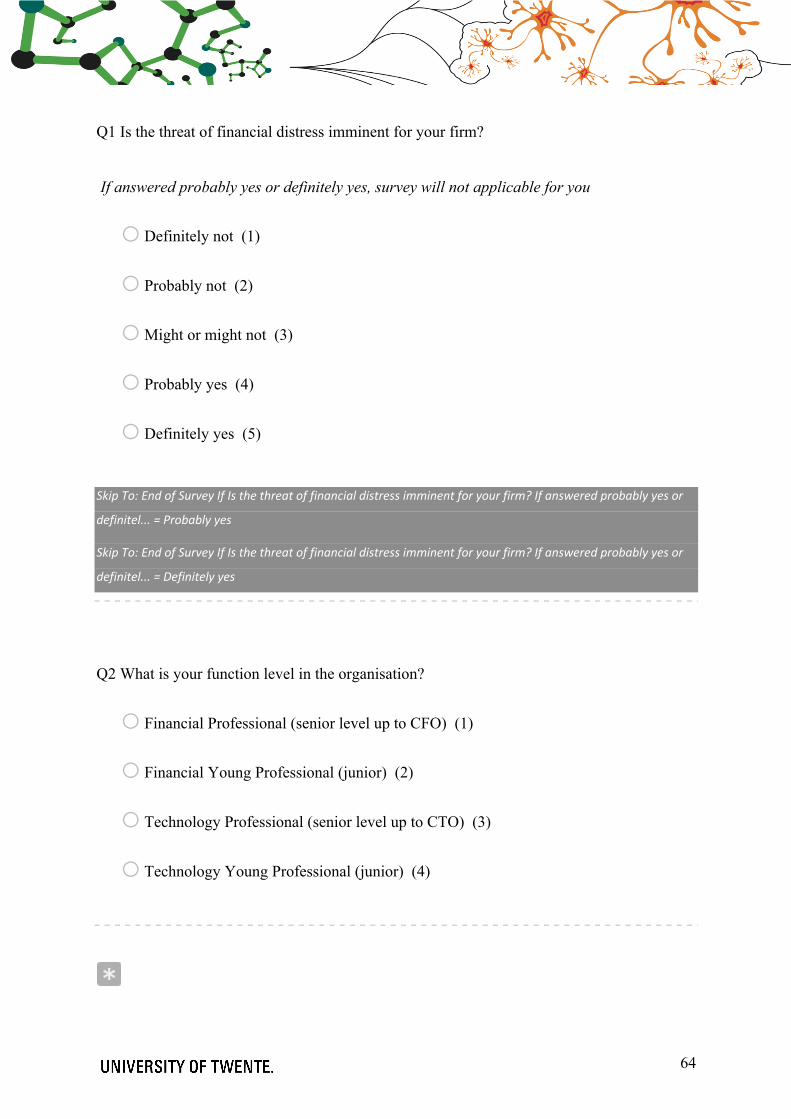
64
Q1 Is the threat of financial distress imminent for your firm?
If answered probably yes or definitely yes, survey will not applicable for you
o Definitely not (1)
o Probably not (2)
o Might or might not (3)
o Probably yes (4)
o Definitely yes (5)
Skip To: End of Survey If Is the threat of financial distress imminent for your firm? If answered probably yes or
definitel... = Probably yes
Skip To: End of Survey If Is the threat of financial distress imminent for your firm? If answered probably yes or
definitel... = Definitely yes
Q2 What is your function level in the organisation?
o Financial Professional (senior level up to CFO) (1)
o Financial Young Professional (junior) (2)
o Technology Professional (senior level up to CTO) (3)
o Technology Young Professional (junior) (4)
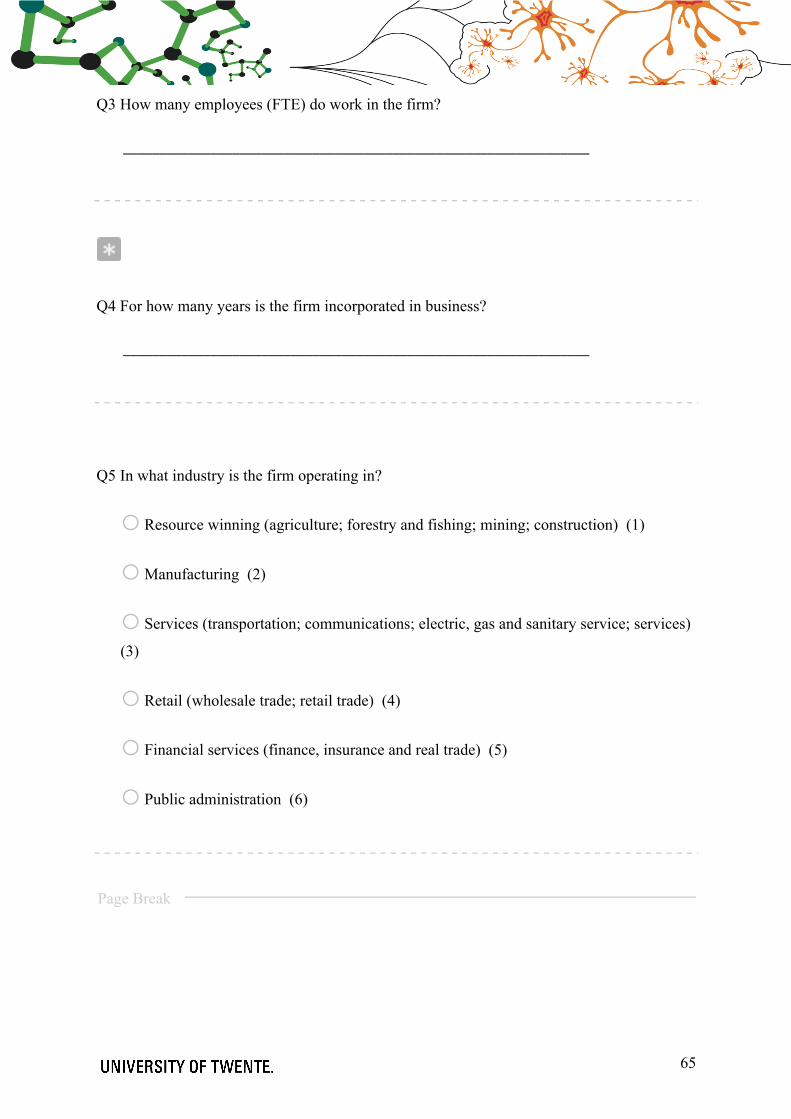
65
Q3 How many employees (FTE) do work in the firm?
________________________________________________________________
Q4 For how many years is the firm incorporated in business?
________________________________________________________________
Q5 In what industry is the firm operating in?
o Resource winning (agriculture; forestry and fishing; mining; construction) (1)
o Manufacturing (2)
o Services (transportation; communications; electric, gas and sanitary service; services)
(3)
o Retail (wholesale trade; retail trade) (4)
o Financial services (finance, insurance and real trade) (5)
o Public administration (6)
Page Break
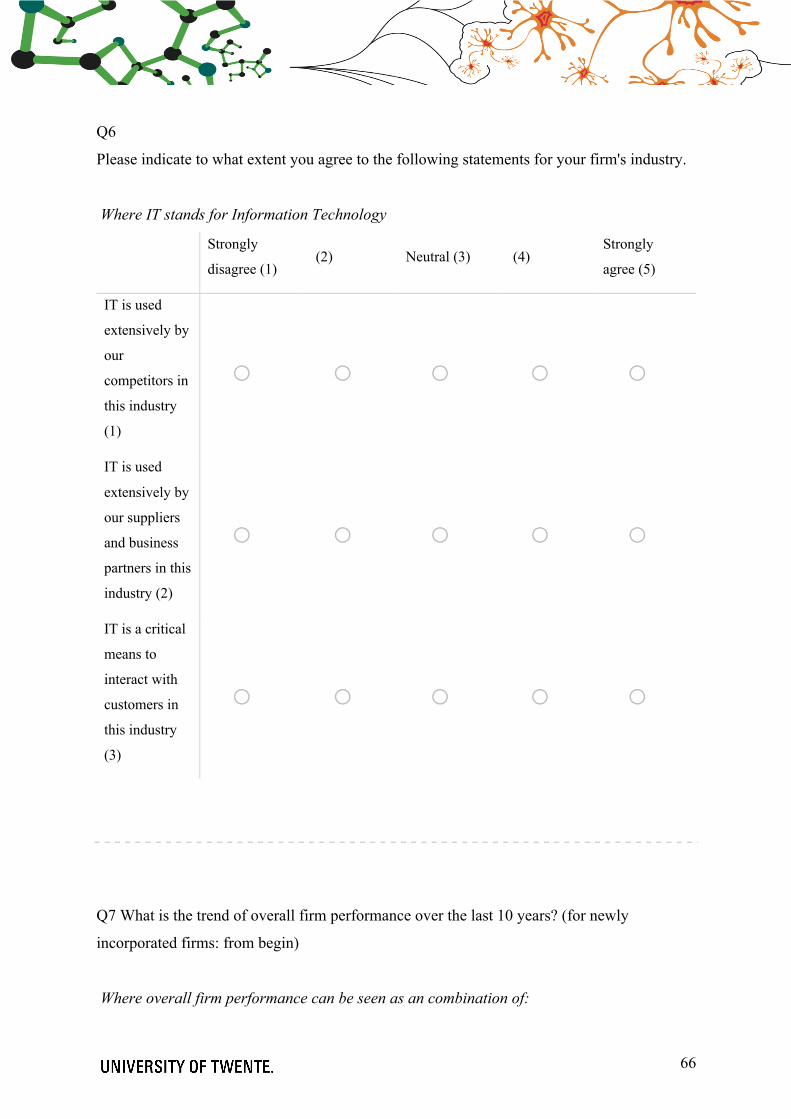
66
Q6
Please indicate to what extent you agree to the following statements for your firm's industry.
Where IT stands for Information Technology
Strongly
disagree (1) (2) Neutral (3) (4)
Strongly
agree (5)
IT is used
extensively by
our
competitors in
this industry
(1)
o o o o o
IT is used
extensively by
our suppliers
and business
partners in this
industry (2)
o o o o o
IT is a critical
means to
interact with
customers in
this industry
(3)
o o o o o
Q7 What is the trend of overall firm performance over the last 10 years? (for newly
incorporated firms: from begin)
Where overall firm performance can be seen as an combination of:

67
- After-tax return on total assets (ROA)
- After-tax return on total sales (ROS)
- Net profit position
- Market share gains relative to competition
- Sales growth position relative to competition
o Strong decreased (1)
o Slightly decreased (2)
o More or less the same (3)
o Slightly increased (4)
o Strong increased (5)
Q8 What is the amount of after-tax income (net income) (in €) on 01-01-2019?
Please answer in thousands! (x1,000)
________________________________________________________________
Q9 What is the average amount of total assets (in €) on 01-01-2019?
Please answer in thousands! (x1,000)
________________________________________________________________
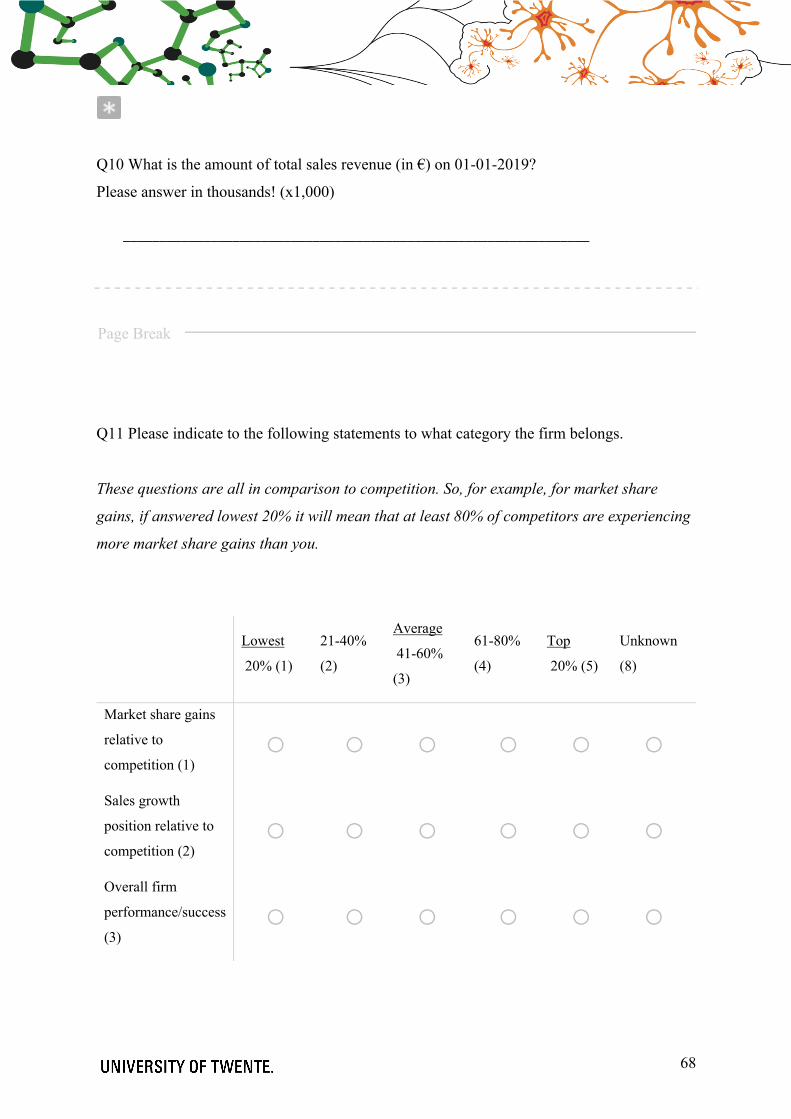
68
Q10 What is the amount of total sales revenue (in €) on 01-01-2019?
Please answer in thousands! (x1,000)
________________________________________________________________
Page Break
Q11 Please indicate to the following statements to what category the firm belongs.
These questions are all in comparison to competition. So, for example, for market share
gains, if answered lowest 20% it will mean that at least 80% of competitors are experiencing
more market share gains than you.
Lowest
20% (1)
21-40%
(2)
Average
41-60%
(3)
61-80%
(4)
Top
20% (5)
Unknown
(8)
Market share gains
relative to
competition (1) o o o o o o
Sales growth
position relative to
competition (2) o o o o o o
Overall firm
performance/success
(3) o o o o o o
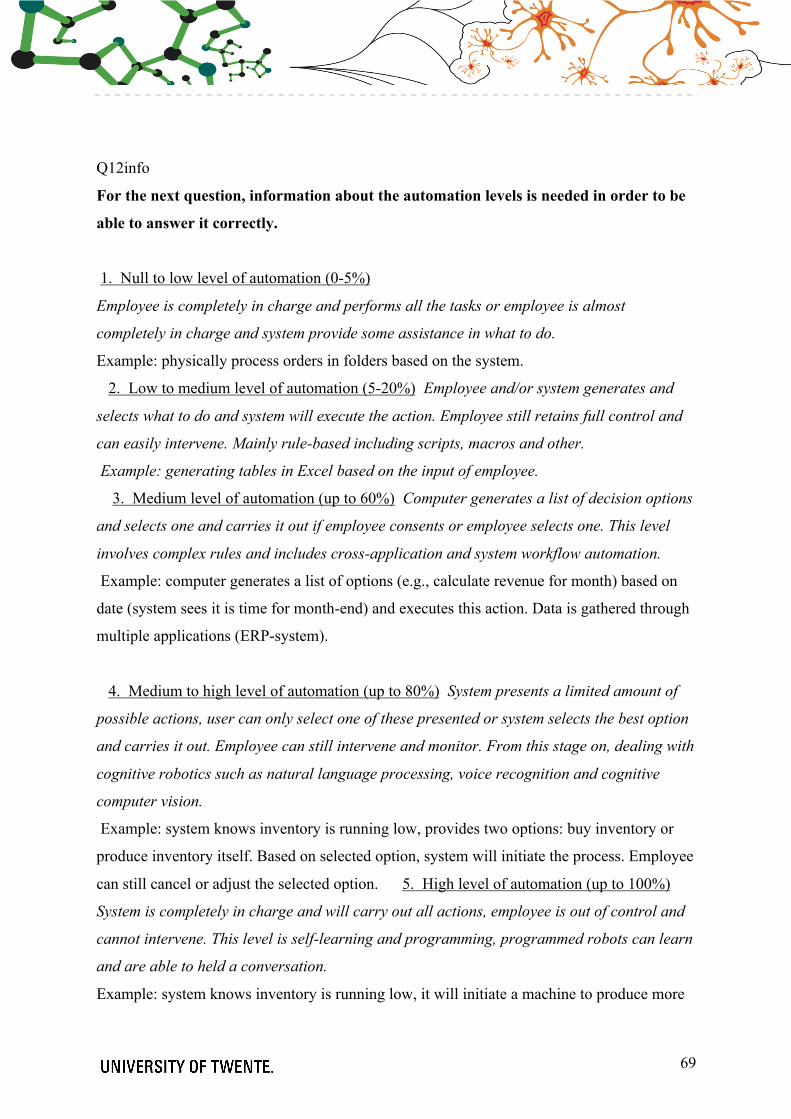
69
Q12info
For the next question, information about the automation levels is needed in order to be
able to answer it correctly.
1. Null to low level of automation (0-5%)
Employee is completely in charge and performs all the tasks or employee is almost
completely in charge and system provide some assistance in what to do.
Example: physically process orders in folders based on the system.
2. Low to medium level of automation (5-20%) Employee and/or system generates and
selects what to do and system will execute the action. Employee still retains full control and
can easily intervene. Mainly rule-based including scripts, macros and other.
Example: generating tables in Excel based on the input of employee.
3. Medium level of automation (up to 60%) Computer generates a list of decision options
and selects one and carries it out if employee consents or employee selects one. This level
involves complex rules and includes cross-application and system workflow automation.
Example: computer generates a list of options (e.g., calculate revenue for month) based on
date (system sees it is time for month-end) and executes this action. Data is gathered through
multiple applications (ERP-system).
4. Medium to high level of automation (up to 80%) System presents a limited amount of
possible actions, user can only select one of these presented or system selects the best option
and carries it out. Employee can still intervene and monitor. From this stage on, dealing with
cognitive robotics such as natural language processing, voice recognition and cognitive
computer vision.
Example: system knows inventory is running low, provides two options: buy inventory or
produce inventory itself. Based on selected option, system will initiate the process. Employee
can still cancel or adjust the selected option. 5. High level of automation (up to 100%)
System is completely in charge and will carry out all actions, employee is out of control and
cannot intervene. This level is self-learning and programming, programmed robots can learn
and are able to held a conversation.
Example: system knows inventory is running low, it will initiate a machine to produce more

70
items, subsequently another machine provides the delivery to the place where inventory is
held.
Q12 To what extent is automation active in the firm's several departments?
Please answer 6 if a given department does not exist in your firm.

71
1. Null to
low level
of
automatio
n (0-
5%) (1)
2. Low to
medium
level of
automatio
n (5-20%)
(2)
3. Medium
level of
automatio
n (up to
60%) (3)
4.
Medi
um to high
level of
automation
(up to 80%)
(4)
5. High
level of
automatio
n (up to
100%) (5)
6. Not
applicabl
e (6)
Production
(when not
manufacturin
g firm:
responsible
for the
turnover) (1)
o o o o o o
Supply chain
(export,
import,
delivering,
planning) (2)
o o o o o o
Marketing (3) o o o o o o Human
Resource
Management
(HRM) (4)
o o o o o o
Finance &
Accounting
(control) (5) o o o o o o
Information
Technology
(IT) (6) o o o o o o

72
Research &
Development
(R&D) (7) o o o o o o
Page Break
Info The following statements are the last questions of this survey
Q13 Please indicate to what extent you agree to the following statements for your firm.
Where IS stands for Information System
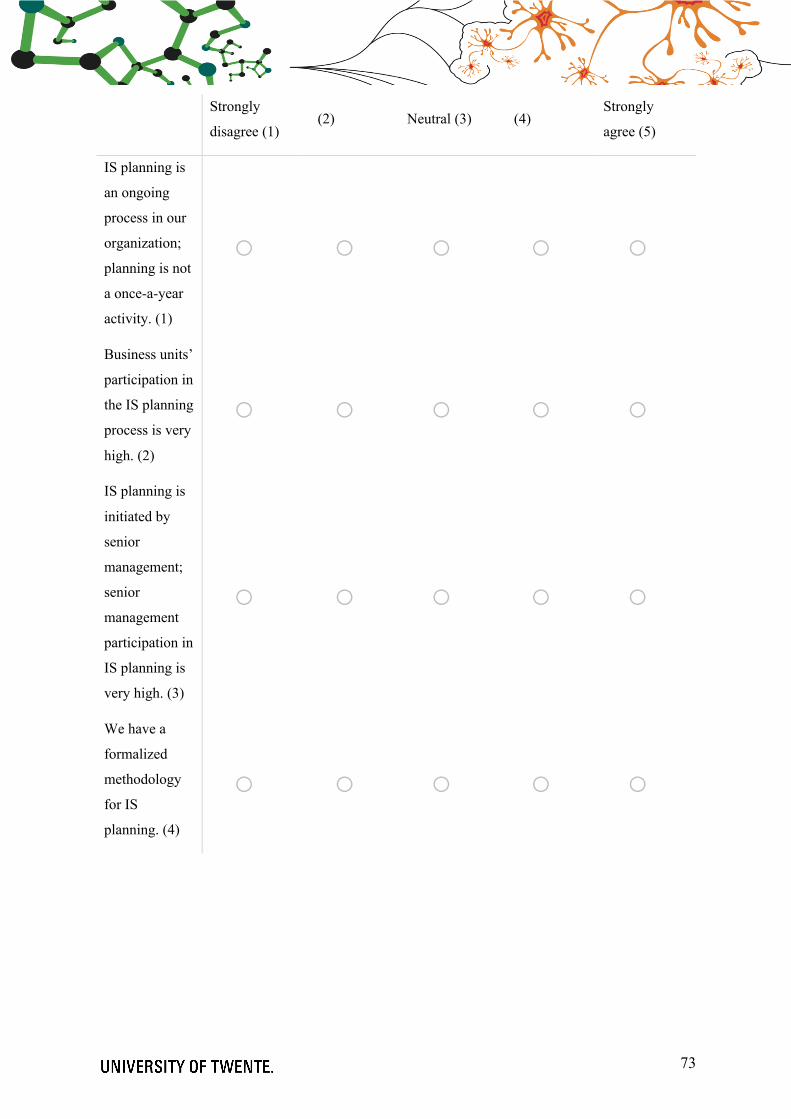
73
Strongly
disagree (1) (2) Neutral (3) (4)
Strongly
agree (5)
IS planning is
an ongoing
process in our
organization;
planning is not
a once-a-year
activity. (1)
o o o o o
Business units’
participation in
the IS planning
process is very
high. (2)
o o o o o
IS planning is
initiated by
senior
management;
senior
management
participation in
IS planning is
very high. (3)
o o o o o
We have a
formalized
methodology
for IS
planning. (4)
o o o o o

74
Our planning
methodology
has many
guidelines to
ensure that
critical
business,
organizational,
and
technological
issues are
addressed in
evolving a IS
plan. (5)
o o o o o
We try to be
very
comprehensive
in our
planning,
every facet is
covered. (6)
o o o o o
Our systems
development
process can be
easily adapted
to different
types of
development
projects. (7)
o o o o o
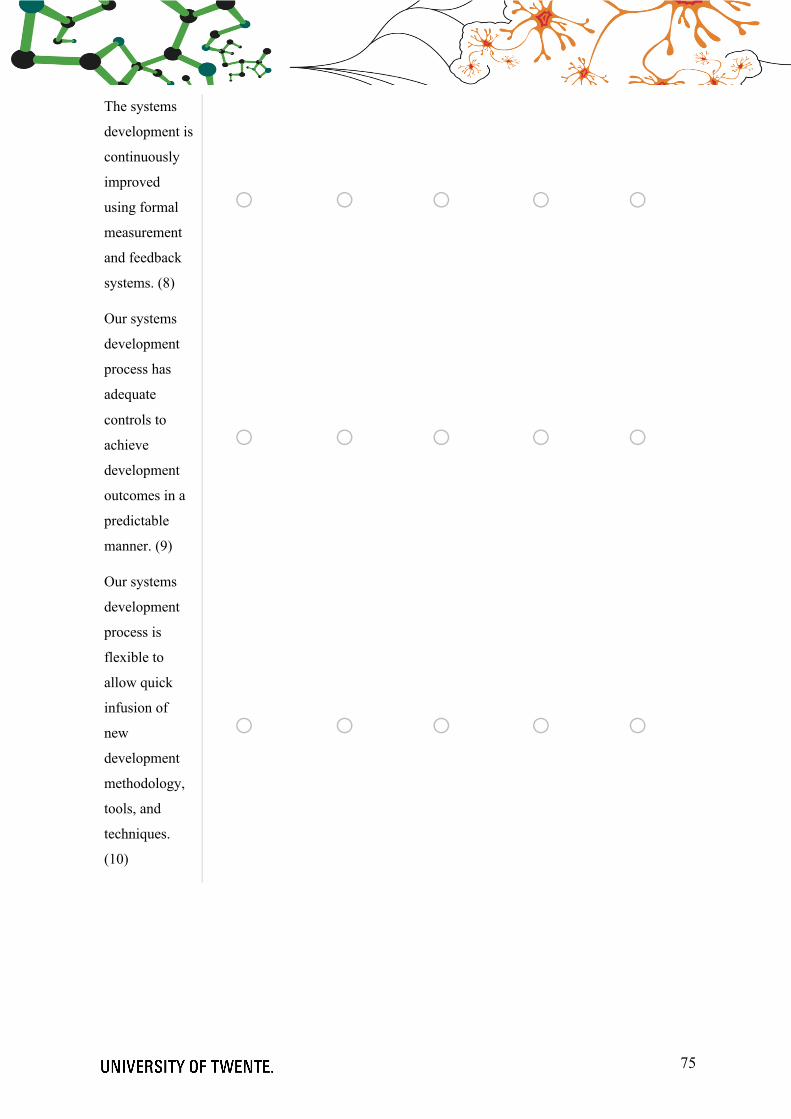
75
The systems
development is
continuously
improved
using formal
measurement
and feedback
systems. (8)
o o o o o
Our systems
development
process has
adequate
controls to
achieve
development
outcomes in a
predictable
manner. (9)
o o o o o
Our systems
development
process is
flexible to
allow quick
infusion of
new
development
methodology,
tools, and
techniques.
(10)
o o o o o
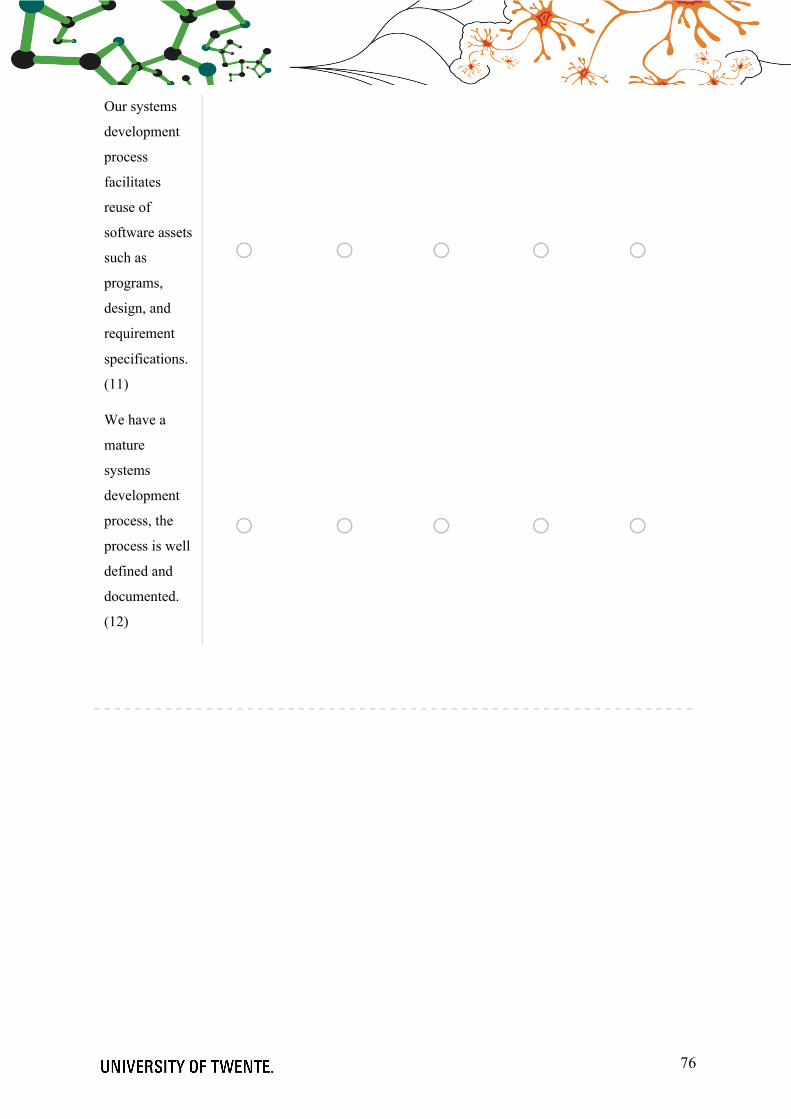
76
Our systems
development
process
facilitates
reuse of
software assets
such as
programs,
design, and
requirement
specifications.
(11)
o o o o o
We have a
mature
systems
development
process, the
process is well
defined and
documented.
(12)
o o o o o

77
Q14 Please indicate to what extent you agree to the following statements for your firm.
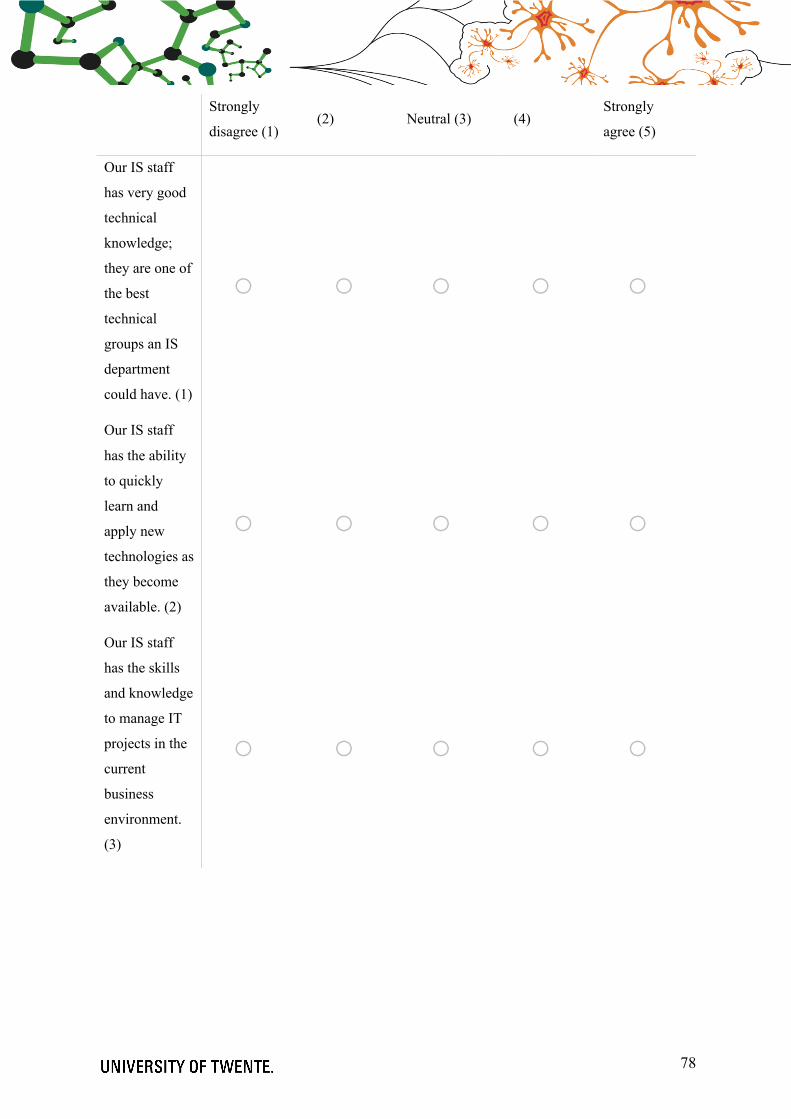
78
Strongly
disagree (1) (2) Neutral (3) (4)
Strongly
agree (5)
Our IS staff
has very good
technical
knowledge;
they are one of
the best
technical
groups an IS
department
could have. (1)
o o o o o
Our IS staff
has the ability
to quickly
learn and
apply new
technologies as
they become
available. (2)
o o o o o
Our IS staff
has the skills
and knowledge
to manage IT
projects in the
current
business
environment.
(3)
o o o o o

79
Our IS staff
has the ability
to work
closely with
customers and
maintain
productive
user or client
relationships.
(4)
o o o o o
Our IS staff
has excellent
business
knowledge;
they have a
deep
understanding
of the business
priorities and
goals of our
organization.
(5)
o o o o o
Our IS staff
understands
our firm’s
technologies
and business
processes very
well. (6)
o o o o o
Our IS staff
understands
our firm’s
procedures and
policies very
well. (7)
o o o o o

80
Our IS staff is
aware of the
core beliefs
and values of
our
organization.
(8)
o o o o o
Our IS staff
often do know
who are
responsible for
the important
tasks in this
organization.
(9)
o o o o o
Our IS staff is
are familiar
with the
routines and
methods used
in the IS
department.
(10)
o o o o o

81
Q15 Please indicate to what extent you agree to the following statements for your firm.
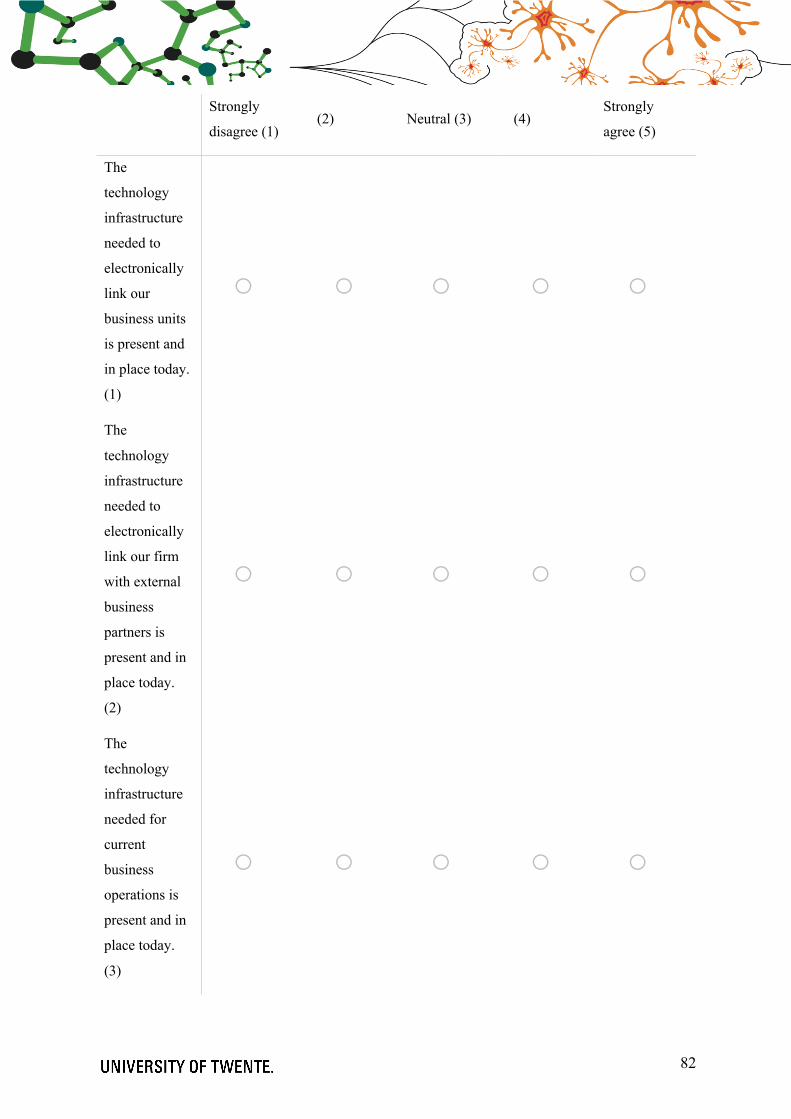
82
Strongly
disagree (1) (2) Neutral (3) (4)
Strongly
agree (5)
The
technology
infrastructure
needed to
electronically
link our
business units
is present and
in place today.
(1)
o o o o o
The
technology
infrastructure
needed to
electronically
link our firm
with external
business
partners is
present and in
place today.
(2)
o o o o o
The
technology
infrastructure
needed for
current
business
operations is
present and in
place today.
(3)
o o o o o
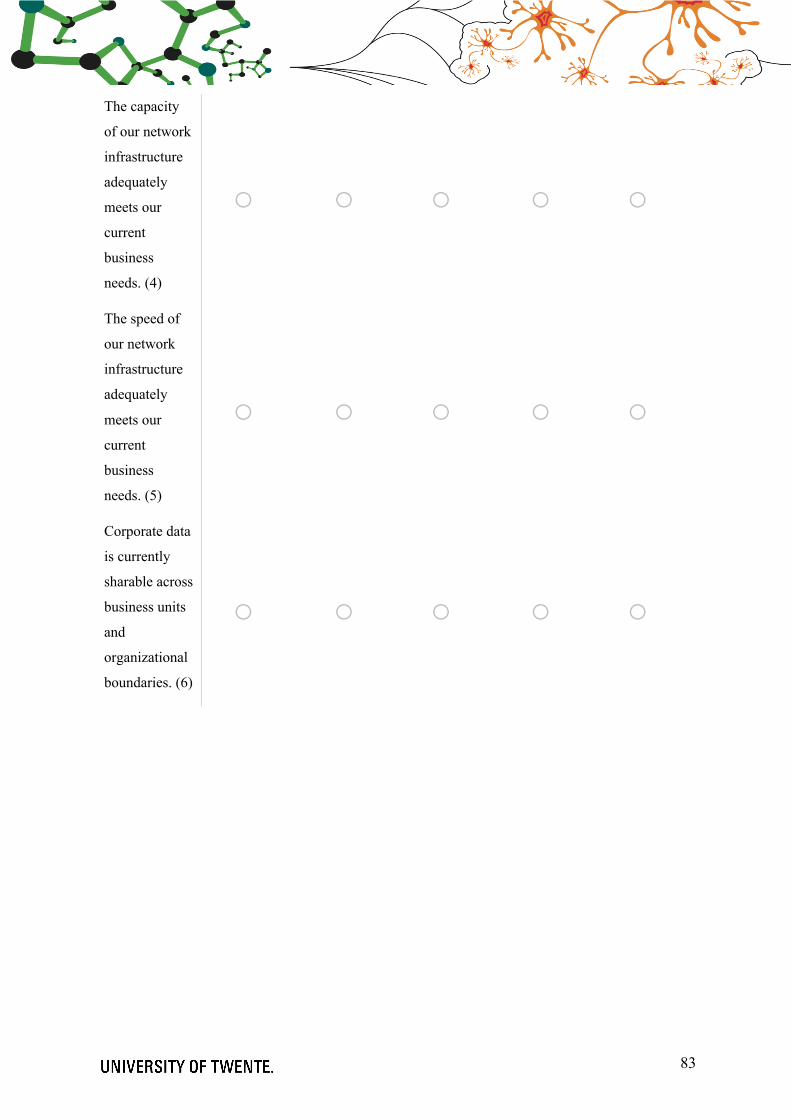
83
The capacity
of our network
infrastructure
adequately
meets our
current
business
needs. (4)
o o o o o
The speed of
our network
infrastructure
adequately
meets our
current
business
needs. (5)
o o o o o
Corporate data
is currently
sharable across
business units
and
organizational
boundaries. (6)
o o o o o

84
The
complexity of
our current
application
systems
seriously
restricts our
ability to
develop
modular
systems with
reusable
software
components.
(7)
o o o o o
Our
application
systems are
very modular;
most program
modules can
be easily
reused in other
business
applications.
(8)
o o o o o
We have
standardized
the various
components of
our technology
infrastructure
(e.g. hardware,
network,
database) (9)
o o o o o
85
Q16 Please write the name of your company.
(Not required and will not be disclosed if answered!)
________________________________________________________________
Q17 In case you would like to receive a summary of the research results, please write your e-
mail address.
________________________________________________________________
End of Block: Default Question Block

86
6. Calculation sheet for discriminant validity
Figure 8: calculation sheet for discriminant validity
Related Documents