Eberhard Karls Universit¨ at T¨ ubingen Mathematisch-Naturwissenschaftliche Fakult¨ at Wilhelm-Schickard-Institut f¨ ur Informatik Master Thesis Computer Science Detecting workload during integration of conflicting data using pupillometry Tobias Appel 27.02.2017 Reviewers Jun.-Prof. Enkelejda Kasneci (Computer Science) Wilhelm-Schickard-Institut f¨ ur Informatik Universit¨ at T¨ ubingen Prof. Peter Gerjets (Psychology) Leibniz-Institut f¨ ur Wissensmedien Universit¨ at T¨ ubingen

Welcome message from author
This document is posted to help you gain knowledge. Please leave a comment to let me know what you think about it! Share it to your friends and learn new things together.
Transcript

Eberhard Karls Universitat TubingenMathematisch-Naturwissenschaftliche Fakultat
Wilhelm-Schickard-Institut fur Informatik
Master Thesis Computer Science
Detecting workload during integration of
conflicting data using pupillometry
Tobias Appel
27.02.2017
Reviewers
Jun.-Prof. Enkelejda Kasneci(Computer Science)
Wilhelm-Schickard-Institut fur Informatik
Universitat Tubingen
Prof. Peter Gerjets(Psychology)
Leibniz-Institut fur Wissensmedien
Universitat Tubingen

Appel, Tobias:Detecting workload during integration of conflicting data usingpupillometryMaster Thesis Computer ScienceEberhard Karls Universitat TubingenThesis period: September 2016 - February 2017
i
Abstract
Assessing cognitive workload can be beneficial for various applications. Work-load measurement, however, is often intrusive or cumbersome. With recentdevelopments of eye-tracking technology, an un-intrusive and flexible way hasbecome available to assess workload. This work investigates the applicability offeatures derived from pupil size measurement to detect workload. Two datasetswere analyzed in search for suitable ways to derive the cognitive workload fromeye-tracking data, both of which were collected under similar circumstances. Inboth datasets, machine learning techniques were employed in order to classifydifferent degrees of cognitive workload.
Aiming to find features that would allow a generalization beyond the spe-cific data analyzed here, the pupil diameter was chosen as a focus, since othermeasures like fixations or saccades are very task-dependent. In order to achievethis goal, several methods were used individually and jointly, including meanpupil diameter, Index of Cognitive Activity and Fourier analysis. Results showthat single-trial classification using a subject-independent classifier is possiblefor larger workload differences yielding 70.3% accuracy, however very subtledifferences in workload can not be reliably detected. The classification at theindividual subject level shows much better results, providing us with the pos-sibility to design a classifier for online assessment of a subject’s workload aftera short training and setup phase.
ii
Acknowledgements
I would like to express my gratitude to my supervisor Jun.-Prof. Dr. EnkelejdaKasneci for her support, inspiration, and guidance. Throughout my thesisshe always pointed me into the right direction and aided me with advice.Furthermore, I want to thank my second supervisor Prof. Dr. Peter Gerjets,who contributed valuable input concerning the psychological aspects of mywork.
Moreover, Dr. Christian Scharinger has my gratitude for providing mewith the data for this work, as well as supporting me in analyzing it andinterpreting the results. I am also grateful for Dr. Thomas Kubler’s help. Heand the other members of the Perception Engineering team have proven tobe a valuable source of information and advice throughout the course of mythesis.
Christian Buhler, too, deserves a word of gratitude for proofreading mythesis on short notice.
Finally, I want to express my deep gratitude towards my girlfriend LuziaLeifheit and my family. Their constant encouragement and support have notonly given me strength in my years of study but have also kept me balancedduring the writing of this thesis. I am especially thankful for Luzia’s patience,calming me down and cheering me up, whenever it was needed and alwaysstanding by me. Thank you.
Contents
List of Figures vii
List of Tables ix
List of Abbreviations xi
1 Introduction 1
1.1 Motivation . . . . . . . . . . . . . . . . . . . . . . . . . . . . . . 1
1.2 Goal . . . . . . . . . . . . . . . . . . . . . . . . . . . . . . . . . 2
1.3 Methods . . . . . . . . . . . . . . . . . . . . . . . . . . . . . . . 3
1.4 Structure . . . . . . . . . . . . . . . . . . . . . . . . . . . . . . 3
2 Background 5
2.1 Eye tracking . . . . . . . . . . . . . . . . . . . . . . . . . . . . . 5
2.2 Cognitive workload . . . . . . . . . . . . . . . . . . . . . . . . . 7
2.3 The pupil . . . . . . . . . . . . . . . . . . . . . . . . . . . . . . 8
2.4 Related work . . . . . . . . . . . . . . . . . . . . . . . . . . . . 9
3 Material and Methods 11
3.1 N-back-flanker dataset . . . . . . . . . . . . . . . . . . . . . . . 11
3.1.1 Task and Stimulus . . . . . . . . . . . . . . . . . . . . . 11
3.1.2 Participants . . . . . . . . . . . . . . . . . . . . . . . . . 13
3.1.3 Devices . . . . . . . . . . . . . . . . . . . . . . . . . . . 13
3.1.4 Goal . . . . . . . . . . . . . . . . . . . . . . . . . . . . . 13
iii
iv CONTENTS
3.2 Text-picture dataset . . . . . . . . . . . . . . . . . . . . . . . . 13
3.2.1 Task and Stimulus . . . . . . . . . . . . . . . . . . . . . 14
3.2.2 Participants . . . . . . . . . . . . . . . . . . . . . . . . . 14
3.2.3 Devices . . . . . . . . . . . . . . . . . . . . . . . . . . . 14
3.2.4 Goal . . . . . . . . . . . . . . . . . . . . . . . . . . . . . 15
3.3 Task-evoked pupillary response . . . . . . . . . . . . . . . . . . 16
3.4 ICA . . . . . . . . . . . . . . . . . . . . . . . . . . . . . . . . . 16
3.5 Discrete Fourier analysis . . . . . . . . . . . . . . . . . . . . . . 18
3.6 Interval based pupil analysis . . . . . . . . . . . . . . . . . . . . 20
4 Results: N-back-flanker 21
4.1 Matching classification . . . . . . . . . . . . . . . . . . . . . . . 22
4.1.1 TEPR . . . . . . . . . . . . . . . . . . . . . . . . . . . . 23
4.1.2 ICA . . . . . . . . . . . . . . . . . . . . . . . . . . . . . 25
4.1.3 Fourier analysis . . . . . . . . . . . . . . . . . . . . . . . 25
4.1.4 Composite method . . . . . . . . . . . . . . . . . . . . . 26
4.2 Level classification . . . . . . . . . . . . . . . . . . . . . . . . . 26
4.2.1 TEPR . . . . . . . . . . . . . . . . . . . . . . . . . . . . 27
4.2.2 ICA . . . . . . . . . . . . . . . . . . . . . . . . . . . . . 28
4.2.3 Fourier . . . . . . . . . . . . . . . . . . . . . . . . . . . . 28
4.2.4 Composite method . . . . . . . . . . . . . . . . . . . . . 29
5 Results: Text-Picture 37
5.1 Task-evoked pupillary response . . . . . . . . . . . . . . . . . . 39
5.2 ICA . . . . . . . . . . . . . . . . . . . . . . . . . . . . . . . . . 41
5.3 Interval-based analysis . . . . . . . . . . . . . . . . . . . . . . . 43
5.4 Frequency analysis . . . . . . . . . . . . . . . . . . . . . . . . . 44
5.5 Composite method . . . . . . . . . . . . . . . . . . . . . . . . . 47
6 Discussion and Outlook 51

CONTENTS v
Bibliography 55

vi CONTENTS
List of Figures
2.1 SMI RED250 remote eye tracker [1] . . . . . . . . . . . . . . . . 6
2.2 SMI wearable eye tracker [2] . . . . . . . . . . . . . . . . . . . . 7
3.1 Timing and procedure of the n-back-flanker trials . . . . . . . . 12
3.2 Timing and procedure of the text-picture trials . . . . . . . . . 15
3.3 Wavelets used in this work . . . . . . . . . . . . . . . . . . . . . 17
3.4 Decomposition and thresholding of a pupil signal . . . . . . . . 19
4.1 Average pupil diameter per subject for level 1 . . . . . . . . . . 23
4.2 Average pupil dilation for level 1 . . . . . . . . . . . . . . . . . 24
4.3 Pupil diameter averaged over the first n trials . . . . . . . . . . 24
4.4 ICA averaged over the first n trials . . . . . . . . . . . . . . . . 25
4.5 Average pupil dilation per n-back level . . . . . . . . . . . . . . 27
4.6 Frequency distribution for the n-back levels . . . . . . . . . . . . 28
4.7 Mean weights for Fourier frequencies . . . . . . . . . . . . . . . 29
4.8 Contribution of the features to level 0 and level 1 for the SVM . 30
4.9 Contribution of the features to level 0 and level 2 for the SVM . 30
4.10 Contribution of the features to level 1 and level 2 for the SVM . 30
4.11 ROC curve of the classification level 0 vs. rest . . . . . . . . . . 32
4.12 ROC curve of the classification level 1 vs. rest . . . . . . . . . . 32
4.13 ROC curve of the classification level 2 vs. rest . . . . . . . . . . 33
4.14 Contribution of the features to the classes ‘level 0’ and ‘level 1’ . 34
4.15 Contribution of the features to the classes ‘level 0’ and ‘level 2’ . 34
vii

viii LIST OF FIGURES
4.16 Contribution of the features to the classes ‘level 1’ and ‘level 2’ . 35
5.1 Median and quartiles over all trials . . . . . . . . . . . . . . . . 37
5.2 Mean pupil diameter after n trials . . . . . . . . . . . . . . . . . 39
5.3 Mean pupil diameter of the subjects over the course of the stim-
ulus presentation and after trial-wise normalization . . . . . . . 40
5.4 Progression of the average ICA considering only the first n trials 41
5.5 Mean values of the ICA for the whole trial 0-7000 ms . . . . . . 42
5.6 Frequencies of the Fourier analysis . . . . . . . . . . . . . . . . 45
5.7 Weights of the Fourier frequencies for all trials and subjects . . 46
5.8 Average weights of the Fourier frequencies per subject . . . . . . 46
5.9 Weights of the SVM . . . . . . . . . . . . . . . . . . . . . . . . 47
5.10 Weights of the SVM averaged over all subjects . . . . . . . . . . 48

List of Tables
4.1 Classification results for n-back-flanker for all trials . . . . . . . 22
4.2 Classification of the different levels based on individual features 26
4.3 Classification of the different levels for subject 5 based on indi-
vidual features . . . . . . . . . . . . . . . . . . . . . . . . . . . 26
4.4 Classification of the different levels for subject 19 based on in-
dividual features . . . . . . . . . . . . . . . . . . . . . . . . . . 27
4.5 Results of the level classification based on the neural network
model . . . . . . . . . . . . . . . . . . . . . . . . . . . . . . . . 31
5.1 Accuracy scores for the whole trial (0-7000ms) . . . . . . . . . . 38
5.2 Best intervals for global classification and their corresponding
classification accuracy . . . . . . . . . . . . . . . . . . . . . . . 44
ix

x LIST OF TABLES

List of Abbreviations
CLT Cognitive load theoryEEG ElectroencephalographyFFT Fast Fourier decompositionICA Index of Cognitive ActivitySVM Support vector machinesTEPR Task-evoked pupillary response
xi

xii LIST OF ABBREVIATIONS
Chapter 1
Introduction
1.1 Motivation
When we process information, there are many factors which contribute tothe task’s subjective difficulty. The complexity of the processed materialis one main criterion, but there are many more factors, such as distractingadditional information (i.e., information that is either not relevant for thetask or redundant). The learner themself contributes to the difficulty throughtheir mood and mental state. Furthermore, everything that reduces theability to focus, e.g., fatigue or illness, will make the task more difficult for anindividual. Apart from temporary factors, there are those that are persistentover long periods: intelligence, expertise in a relevant field, or experience withthe task or topic.
According to Lysaght and Hill [3], the workload a subject experiencesduring a task is made up of three different aspects: the difficulty of the actionsrequired for task completion and time or accuracy constraints; environmentalcontext like heat, lighting or usability of a system required for the task; andthe influence of the subject themself in the form of experience, skills, orpersonality traits.
An accurate evaluation of the current workload, i.e., the effort it takesan individual to complete a task, would have a great variety of applications,e.g., in the automotive context, aviation, or psychological research. This workaddresses workload detection in the educational context. The assessment ofthe individual workload level would allow to adjust the difficulty of exercisesor reading tasks according to the workload that students experience. If theworkload during a task is unexpectedly high, the difficulty can be loweredto avoid frustration. On the order hand, if a student executes a task almosteffortlessly, they can be given more difficult exercises.
1
2 CHAPTER 1. INTRODUCTION
It is hard to measure workload directly, yet it causes physiological reactionsthat are measurable. Amongst those physiological indicators, the averagepupil diameter during a chosen period of time was successfully used as anindicator for workload in many studies [4, 5, 6]. The pupil dilation can bemeasured with an eye tracker, a device that measures eye movements, gazepoints and pupil data. One has to distinguish between head-mounted trackersand remote ones. The former one is similar in appearance to a pair of glassesand is worn, which makes it suitable for tasks that allow for movements of thesubject. The latter one consists of several stationary cameras that are usuallymounted near a display and measure the subjects eyes from a distance. Oneof the advantages that workload detection based on eye tracking offers, is thenon-invasiveness. The subject does not have to be prepared with electrodesor otherwise connected to a machine, which makes eye tracking easy to useand quickly to set up. With the rapid pace of technological advancement, themeasurements get more accurate and devices that are not dedicated for eyetracking might be employed to do so. The quality of webcams is increasing,thus they can already be used for eye tracking even though the accuracy is notyet on par with regular eye trackers [7]. In the near future it might be possibleto use easily affordable devices for accurate eye tracking. The emergence ofVR-technology also offers great potential for eye tracking. There already aresuccessful studies that combine the two [8]. Workload and fatigue detectionwould be a useful in VR-settings to prevent the user from overexerting orto identify motion-sickness caused by the VR-environment. Already today,the easy availability and setup make eye measurements in general and pupildiameter in particular an excellent choice as an indicator for workload with agreat perspective for future improvement.
This thesis explores the possibilities and limitations of workload assessmentbased on pupillometry. Several different analysis techniques will be presentedand tested on two different datasets stemming from previous experiments con-ducted by Scharinger et al. [9]. The focus is on workload imposed by distract-ing or conflicting information as well as imposed by general task difficulty.
1.2 Goal
This thesis aims to assess the use of pupillometry as a tool to evaluate cog-nitive workload. Pupillometry is a well established method for this, but moststudies concentrate on large-scale differences in workload. This work focuseson workload changes by minor distractions or those caused by redundant orexcessive information, but also applies different measures to large-scale work-load differences in order to evaluate the possibilities and limitations of building
1.3. METHODS 3
a feasible classifier.
The ultimate goal is to find reliable ways to measure workload using pupil-lometry and extrapolate a general rule from the datasets used here. If it ispossible to find such general indicators, a predictor can be constructed thatcan be employed in other studies and projects.
1.3 Methods
There is a variety of methods that are used to analyze pupil signals. Thefirst method used is the increase in pupil diameter as a task-evoked pupillaryresponse [4]. More specifically, one looks at the average pupil diameter after atask is handed to a subject and compares it to the average pupil diameter inother situations. The second tool that will be used is the Index of CognitiveActivity. It searches for small local peaks in the pupil signal, since they are anindicator for cognitive load. In addition to these established approaches, wewill test different ways to divide the time frame of a trial into intervals andsearch for useful segmentations that carry information that might exceed themean value. Finally, we take a look at the frequencies that the pupil signal iscomprised of to find differences that are indicative of increased or decreasedcognitive load.
1.4 Structure
After this introductory chapter, Chapter 2 introduces the basic conceptsthat are relevant for this work. More specifically, eye tracking is brieflyintroduced and the necessary background knowledge is established. Fur-thermore, Chapter 2 gives an overview over pupillometry and variousfactors influencing pupil size changes. Finally, related work and the stateof the art in workload assessment based on eye-related measures are presented.
Chapter 3 is dedicated to the data and methods employed for dataanalysis. First, the two datasets that are used in this work are presented indetail as well as all preprocessing that took place before the analysis. Themethods already mentioned briefly in this chapter are elaborated on furtherand explained in-depth.
The results of the analysis for two different datasets are presented inChapters 4 and 5, respectively. Furthermore the different methods areevaluated and compared to each other with regard to their indicativeness forcognitive workload.

4 CHAPTER 1. INTRODUCTION
This work is concluded by Chapter 6, which discusses the main findingsand their implications. Furthermore, an outlook on future work is given andthe research question, whether pupillometry is suited to detect the changesthat we want to differentiate, is answered.
Chapter 2
Background
This work aims to apply techniques from computer science to a physiolog-ical measure in order to get insight into psychological processes. As such,background information from different fields is needed to understand it. Thischapter will provide an overview over the eye-tracking procedures that areused as well as the physiology of the eye itself, and especially of the pupil.Additionally, a short summary of the cognitive load theory is provided, whichis needed to interpret the results.
2.1 Eye tracking
Eye tracking is the process of measuring either the point of gaze (where oneis looking) or the motion of the eye relative to the head. A device used forthis procedure is called an eye tracker. Eye movement has been studied sincethe 1800s but only on the basis of visual observations or using very intrusivemethods, like giant contact lenses connected to an aluminium pointer [10]. In1937, Guy Thomas Buswell was the first to use light beams directed at theeye which were reflected and captured on film. He used his apparatus to studyreading behavior and noticed differences in oral and silent reading. In the1950s and 1960s, Alfred Lukyanovich Yarbus conducted research concerningtask-dependent exploration strategies. In 1967, he published a book called“Eye Movements and Vision” [11] that would be quoted by eye-trackingenthusiasts for the next decades and is still one of the most influential booksin the research field. Since then technology has advanced and eye trackershave become increasingly versatile, accurate and popular.
In general, there are two different types of eye trackers in use today:remote eye trackers and head-mounted eye trackers. The former utilizeseveral infrared, near-infrared or regular cameras (usually mounted as anarray below a display) to measure the pupil and calculate the gaze position
5

6 CHAPTER 2. BACKGROUND
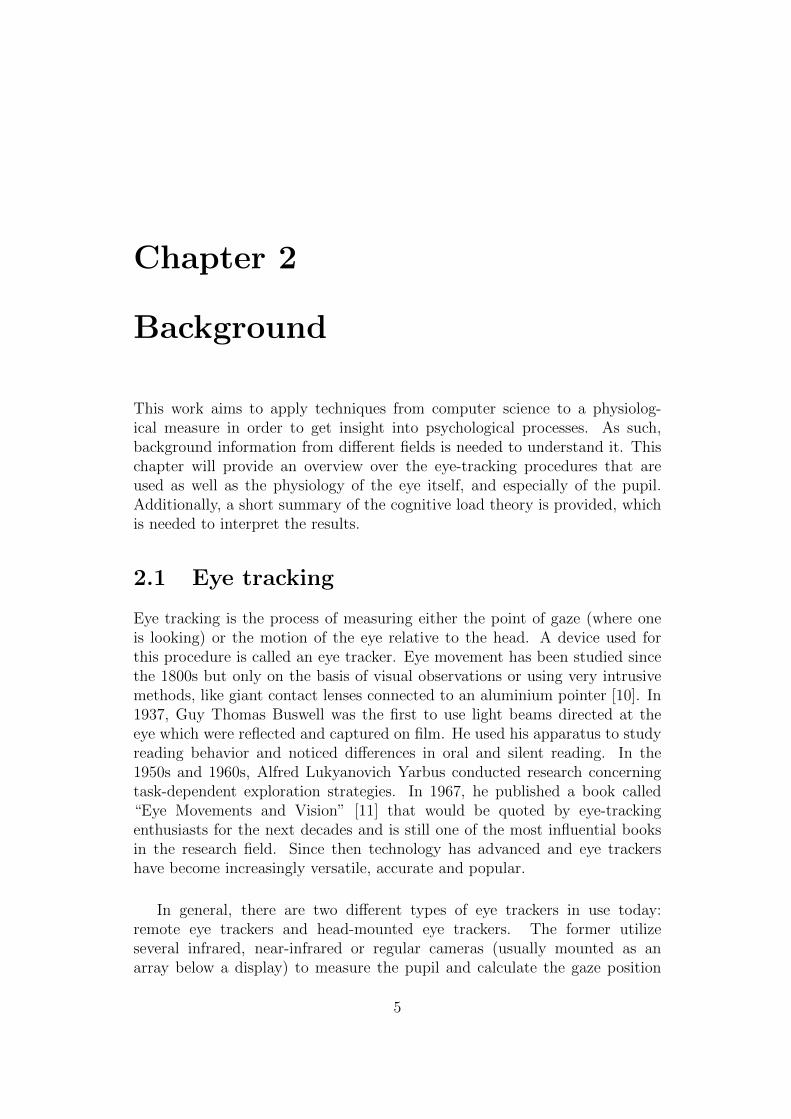
Figure 2.1: SMI RED250 remote eye tracker [1]
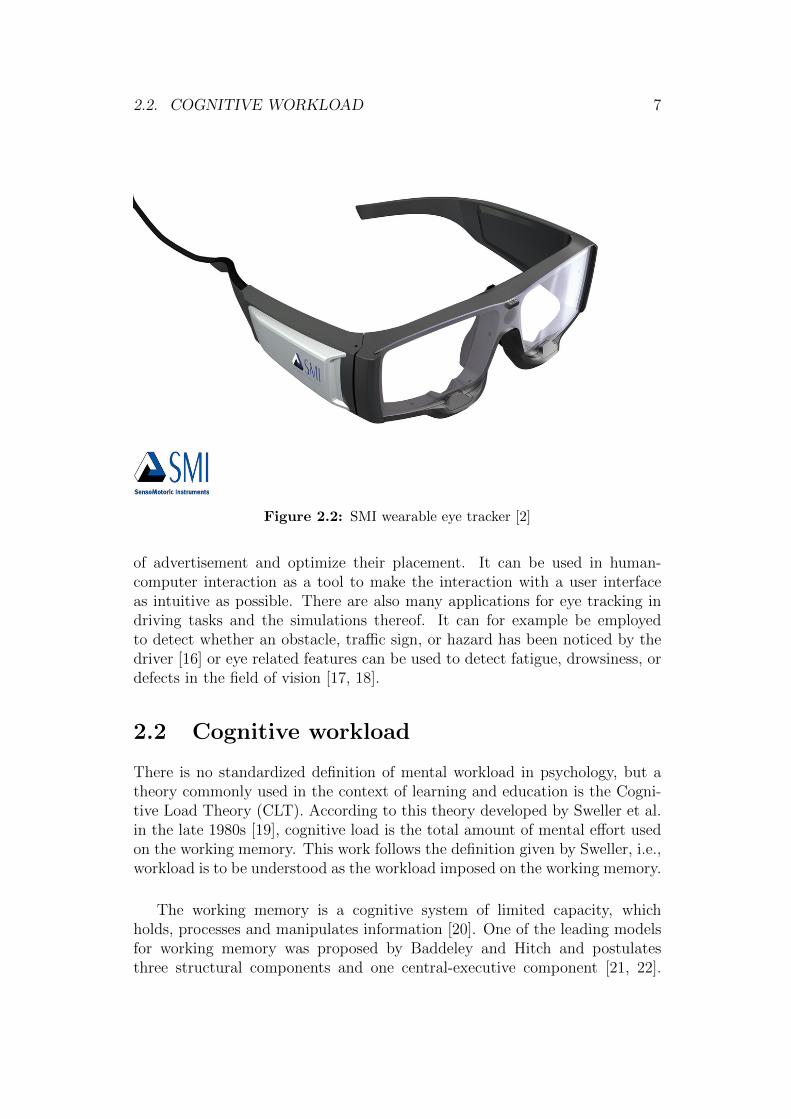
based on that data. The latter are similar in appearance to glasses butfeature several cameras. One is facing away from the wearer and (usually)two infrared or near-infrared cameras are fixed below the wearer’s eyes andcapture the eye movements. From the recorded pupil and eye data, thegaze vectors for both eyes are calculated with regard to the current headposition of the wearer. Since in both cases the pupil has to be detected inan image, this means that apart from the pupil center used for the gazevector, the pupil diameter is an additional measure that can be used as asource of data. Two examples of eye trackers can be seen in Figures 2.1 and 2.2.
It is noticeable that one of the main sources of error in eye-trackingsettings is a non-robust pupil signal. Such error arises from challenges in theimage-based detection of the pupil and are related to changing illumination,eyelashes covering the pupil, blinks, or glasses [12, 13]. To ensure a reliablepupil signal, several algorithms have been introduced to tackle the abovechallenges with promising results [14, 15].
Eye tracking has many applications in a wide variety of fields. It canbe employed in many psychological studies - especially reading studies. Assoon as a study involves visual perception, it can benefit from eye tracking.Marketing and economics also utilize eye tracking to analyze the efficiency
2.2. COGNITIVE WORKLOAD 7
Figure 2.2: SMI wearable eye tracker [2]
of advertisement and optimize their placement. It can be used in human-computer interaction as a tool to make the interaction with a user interfaceas intuitive as possible. There are also many applications for eye tracking indriving tasks and the simulations thereof. It can for example be employedto detect whether an obstacle, traffic sign, or hazard has been noticed by thedriver [16] or eye related features can be used to detect fatigue, drowsiness, ordefects in the field of vision [17, 18].
2.2 Cognitive workload
There is no standardized definition of mental workload in psychology, but atheory commonly used in the context of learning and education is the Cogni-tive Load Theory (CLT). According to this theory developed by Sweller et al.in the late 1980s [19], cognitive load is the total amount of mental effort usedon the working memory. This work follows the definition given by Sweller, i.e.,workload is to be understood as the workload imposed on the working memory.
The working memory is a cognitive system of limited capacity, whichholds, processes and manipulates information [20]. One of the leading modelsfor working memory was proposed by Baddeley and Hitch and postulatesthree structural components and one central-executive component [21, 22].
8 CHAPTER 2. BACKGROUND
The central-executive component supervises the information integration andcoordinates the other components. Those ”slave systems” are the visiospatialscratchpad, the phonological loop and the episodic buffer. The visiospatialscratchpad stores visual and spacial information and can for instance beused to construct and manipulate images and represent mental maps. Thephonological loop stores and maintains phonological information by refreshingit in a loop. The last component, the episodic buffer, links information acrossdomains and associates it with a temporal sequence. It is also serves as a linkbetween working memory and long-term memory.
Usually three core executive functions of the working memory are dif-ferentiated [20]: updating, shifting and inhibition. The process of retrieval,transformation and substitution of information is referred to as updating.Shifting denotes the act of redirecting the focus of attention to newly relevantinformation, while inhibition refers to the process of suppressing informationthat is not relevant for the current processing step.
CLT focuses on learning and instructional design and divides cognitiveworkload into three types. The first is intrinsic cognitive load, which refersto the difficulty or demands of the task or topic itself. The second form ofcognitive load is extraneous load. It refers to the way the task is presented tothe subject and it’s influence on the effort needed. The last type is germanecognitive load, which describes the mental effort put into building schemataor a permanent store of knowledge. This work will focus mainly on extraneouscognitive load and partly on intrinsic workload.
An increase in cognitive load has physiological consequences for a subject,that can be measured. Gerjets et al. successfully applied machine learningalgorithms to EEG measurements and obtained promising results regardingcross-task classification [23]. Additional studies by Spuler et al. suggests thatan EEG-setup with fewer electrodes combined cross-participant classificationmay be sufficient to estimate a subject’s cognitive workload [24]. Further phys-iological measures carry information about the cognitive workload. Scharingeret al. have shown that the pupil is indicative of cognitive load [25]. Heartrateand skin conductance are also a measure sensitive to cognitive workload [26].
2.3 The pupil
The eye is a light-sensitive sensory organ and provides humans and nearly allvertebrates with the ability of vision. It is roughly spherical in shape andits opening to the outside world consists of several layers. The outermostlayer that light has to pass before it reaches the retina, is the cornea, a
2.4. RELATED WORK 9
lens-like transparent structure that refracts light. After passing the cornea,the light travels through the anterior chamber and past the iris, followed bythe posterior chamber and finally the lens. The lens refracts the light one lasttime before it hits the retina [27].
The aperture in the eye regulating the amount of light that passes to theretina is the pupil. It is the opening in the pigmented structure called theiris, which houses the two antagonistic smooth muscle groups controlling theiris and thereby the pupil. The dilator muscle responsible for the increasein diameter of the pupil is controlled by the sympathetic nervous system,while the sphincter muscle that constricts it receives its signals from theparasympathetic system [28]. The interplay between both of them determinesthe size of the pupil.
Changes in pupil diameter may have many different reasons, the mostcommon being the regulation of the amount of light that enters the eye.A phenomenon unrelated to that function is known as hippus or pupillaryunrest, which is a rhythmical and regular contraction and dilation of the pupil[29]. It is independent of eye movement and lighting conditions and usuallynormal, however pathological hippus can occur with increased frequencyand/or amplitude.
The adaptation of the pupil to the current lighting conditions is knownas the pupillary light reflex. A greater intensity of light causes the pupilto constrict, whereas a smaller intensity leads to a dilation of the pupil.Depending on the subject, the influence of light can change the pupil diameterby 1-9mm. This reflex serves as a diagnostic indicator of the neurologicalstate [30].
2.4 Related work
Workload has been analyzed in many different driving tasks. For example,Kutila et al. derived a SVM-based classifier estimating the cognitive load of adriver based on gaze and head position as well as lane-keeping [31]. Palinko etal. used a remote eye tracker to analyze the pupil change rate as an indicatorfor workload [6]. A secondary task (peripheral detection task) as a measure forworkload was employed by Patten et al. to distinguish experienced from inex-perienced drivers [32]. Reimer et al. used different physiological measures forworkload estimation during a driving task i.e., heart rate and skin conductance[26].
10 CHAPTER 2. BACKGROUND
Studies by Xu et al. [33] and Wang et al. [34] examined pupillary responseto arithmetic challenges under different conditions like lighting and emotionalchanges. De Greef et al. found pupil diameter and fixation time to be indica-tive of higher cognitive load, while saccade distance and speed were not [35].Findings by Iqbal et al. show that tasks with higher cognitive load inducegreater pupillary responses [5]. Qian et al. were able to combine pupil diam-eter with EEG readings to train a classifier for single-trial classification for avisual target detection task [36].
A study conducted by Ahlstrom et al. revealed that air traffic controllersexperience shorter blinks and a higher mean pupil diameter during phases ofhigh workload [37]. Di Nocera et al. found that workload could be derivedfrom a pilot’s fixation patterns during a simulated flight [38].
Finally, several studies have been conducted concerning the cognitive work-load during simulated warfare tasks. Van Orden et al. found neural networks,pretrained on earlier data and utilizing a moving mean of blink frequency, fix-ation frequency and pupil diameter, to be useful in classifying workload duringa mock anti-air-warfare task [39]. A similar task was used by Berka et al., butinstead of pupillary reactions they used EEG recordings for workload detection[40].
Chapter 3
Material and Methods
This chapter is dedicated to the methodology employed . First, we present thetwo datasets in the Sections 3.1 and 3.2, respectively. For both datasets fromScharinger et al. [9] that were analyzed with regard to pupillography, thereis a detailed explanation of the task, the devices that were used to recordthe data, and information on the subjects that participated in both studies.These two sections are followed by a description of the methods that wereemployed for workload-related data analysis. The first parameter we assessedis the task-evoked pupillary response in the form of average pupil diameter,followed by the Index of Cognitive Activity and the Fourier analysis. Theanalysis is concluded by an interval-based approach.
The goal is to find features the are suited for classification of differentconditions based on machine learning techniques.
3.1 N-back-flanker dataset
This dataset originates from “When flanker meets the n-back: What EEG andpupil dilation data reveal about the interplay between the two central-executiveworking memory functions inhibition and updating” [9] by Scharinger et al.and contains eye-tracking data from a n-back task that was combined withflanker stimuli.
3.1.1 Task and Stimulus
The task consists of a sequences of stimuli and each stimulus shows one centralletter from the set L = {S,H,C, F}, flanked by three letters on each side thatare either the same or a different letter from L, e.g., HHH C HHH or FFFF FFF. Over the course of the experiment subjects must state whether the
11
12 CHAPTER 3. MATERIAL AND METHODS
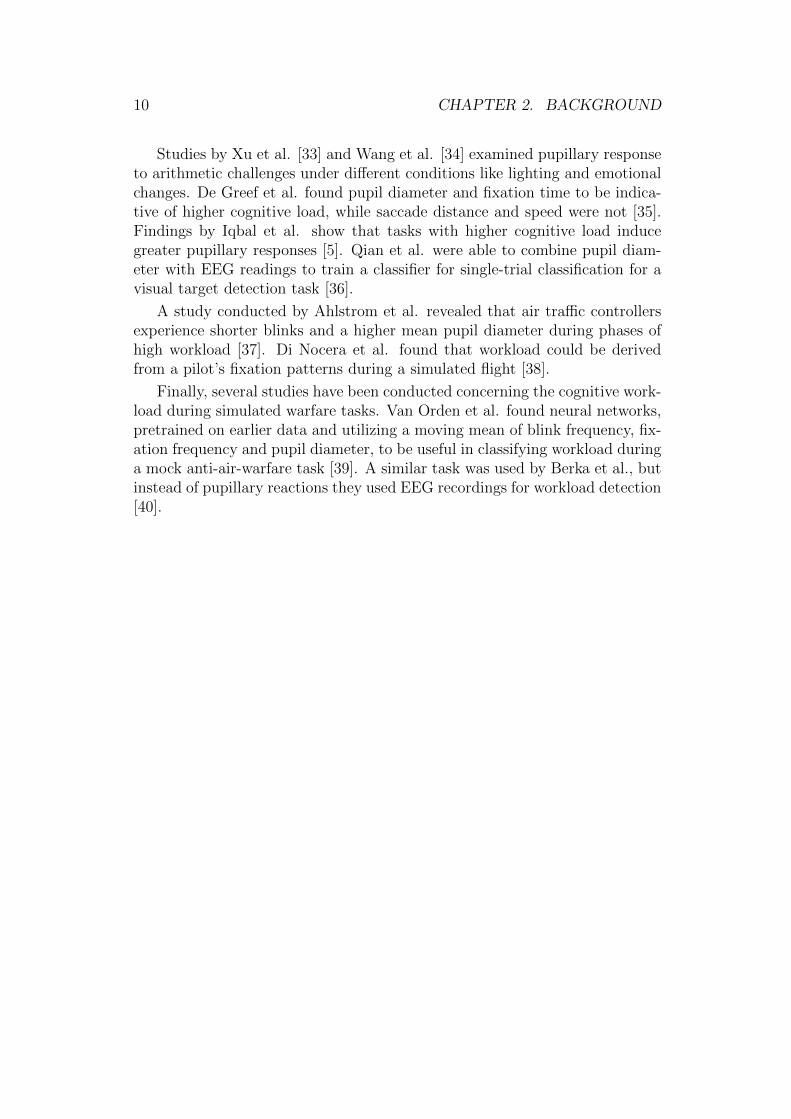
currently presented center stimulus is the same as the one n trials before bypressing one of two buttons. Subjects were instructed to ignore the flankersand focus on the central stimulus as well as to answer as fast and accurateas possible. The different n-back levels are 0, 1 and 2, where level 0 refers tocomparing the current letter with a constant letter shown at the beginning ofthe test. Per trial, the stimulus was presented for 0.5 seconds followed by ablack screen for 1.5 seconds .
Figure 3.1: Timing and procedure of the n-back-flanker trials
For every subject, there are two blocks which each consists of one 0-backtask, one 1-back task and one 2-back task and had 154 trials per task. Half ofthe trials were targets that coincided with the stimulus n trials before and theother half were non-targets that did not coincide. About two thirds of all trialswere congruent, e.g., FFF F FFF, and about one third was incongruent, with20 control trials per block equally distributed over congruent and incongruentstimuli. These control trials consisted just of the flankers without centralstimulus and serve the purpose of avoiding a diminishing flanker effect in thelater parts of a block. A combination of two consecutive incongruent trialswas excluded in the pseudo-random generation of the sequences. This wasdone to avoid the Gratton effect: attenuation of the interference caused bythe incongruent trials due to conflict adaption processes [41]. Apart from thisartificial limitation, the sequences were randomly generated for each block
3.2. TEXT-PICTURE DATASET 13
and participant.
Participants underwent a training phase for each level before they startedthe trials that are analyzed here. They were presented with a block from thelevel they were training for and continued to receive a training block until theyreached an accuracy of at least 60%.
3.1.2 Participants
The experiment was conducted with 28 students of the University of Tubingen,with German being their mother tongue. They received a payment of 8e perhour and did not have any neurological disorders. All participants had normalor corrected-to-normal vision. The local ethics committee of the KnowledgeMedia Research Center Tuebingen approved the study. Participants gave theirwritten consent at the beginning of the study.
3.1.3 Devices
The stimulus was presented on a 22-inch monitor with a resolution of 1,680 ×1,050 and a font-size of 25 utilizing the Arial font. Eyes were tracked with a250 Hertz SMI remote eye-tracking system. A chin rest ensured the distanceof 70 cm was constant over the course of the test. Recording took place inSMI iView X 2.7.13. Calibration was done at the beginning and in every breakusing SMI’s built in 9-point calibration.
3.1.4 Goal
For this dataset, we aim to classify two conditions: trials with congruentflankers and trials with incongruent flankers. The possibility to do so wouldindicate that one can identify slight distraction just by using the pupil signal.This would set the ground for further investigation and might be useful in thedevelopment of assistant programs. In addition to the distinction between con-gruent and incongruent trials, we also want to distinguish between the threedifferent n-back levels. The workload differences between the three levels areexpected to be greater than those between congruent and incongruent trials,so we expect the classification rate to be better too.
3.2 Text-picture dataset
The second dataset was also collected by Scharinger et al., but the results andconclusions drawn from it are still in review.
14 CHAPTER 3. MATERIAL AND METHODS
3.2.1 Task and Stimulus
Participants were presented with a sequence of stimuli that consisted of animage and accompanying sentence, both of which the subjects were askedto memorize. The images were line-drawings depicting different situationswith varying degrees of detail. For instance, the drawing could either show ateacher pointing to an empty blackboard or one that points at a blackboardthat has an algebraic formula on it. The accompanying text either matchesthe line-drawing, partially matches it, or has no relation to it at all. In thecase of a match, both the line-drawing and the text have the same degree ofspecificity. A partial match means that the degree of specificity is different,but text and drawing roughly have the same meaning. When the meaningof picture and text are in no way related, there is a mismatch. This isindependent of the specificity of picture and text.The text-picture combinations were presented in five blocks with 48 trialseach. All images were surrounded with a thin black frame of equal size (860× 650 px) and were placed aligning with the upper screen border with adistance of 56px and centered on the horizontal axis. The accompanying textwas centered below the drawing with a distance of 80px and was written inArial, font size 30.
Each stimulus is presented for 5 s and is succeeded by a central fixationcross for 2 s. Equal numbers of matching trials, partially matching trialsand mismatching ones make up each block. The text-picture combinationsare chosen randomly and come from a pool of sentences and pictures of 70different topics previously used by Arndt et al. [42] and Schuler et al. [43].Per block, every topic is unique and cannot appear more than once and topicsare randomly chosen for every block. The ratio of old and new topics wascounterbalanced over all three conditions and all five blocks.
3.2.2 Participants
25 subjects participated in the paid experiment (8e per hour). They wereGerman native speakers, right-handed and had normal or corrected-to-normalvision. The local ethics committee of the Leibniz-Institut fur WissensmedienTubingen approved the study. Participants gave their written informed consentat the beginning of the study.
3.2.3 Devices
Stimulus presentation took place on an 22-inch monitor that had a resolutionof 1,680 × 1,050. For eye tracking, a SMI remote eye tracker was used that ran250 Hertz and was calibrated with SMI’s built in 9-point calibration routine.

3.2. TEXT-PICTURE DATASET 15
Figure 3.2: Timing and procedure of the text-picture trials
SMI iView X 2.7.13 was used for recording. A chin rest was employed for aconstant distance of 70 cm between the subjects and the monitor.
3.2.4 Goal
The goal for the second dataset is to correctly classify trials with matching pic-ture and text and trials with mismatching picture and text. One would expectan increased workload caused by the integration of mismatching informationand a smaller workload if text and picture match.

16 CHAPTER 3. MATERIAL AND METHODS
3.3 Task-evoked pupillary response
Task-evoked pupillary response denotes the change in pupil diameter that iscaused by a task given to the subject. The task causes cognitive load, andas a result, decreases the parasympathetic activity in the peripheral nervoussystem, leading to an increase in pupil diameter [44]. There is a linear relationbetween the cognitive demands of the task and the pupil diameter increase.
TEPR shows the expected behavior in a wide variety of tasks, includingshort-term memory, language processing, reasoning, perception, sustained at-tention and selective attention [4]. Additionally, TEPR was found to fulfillKahneman’s three criteria for indicating processing load [4]: the ability to re-flect differences in processing load within a task, between different tasks, andfinally between different individuals [45].
3.4 ICA
The index of cognitive activity is a measure that is used as an indicator forbrain activity over a certain period of time. In the patent that forms the basisfor this measure [46], the authors state that the pupil dilates during a periodof increased cognitive activity. This is in accordance with Kahneman’s theoryof attention [45]. There are other pupil oscillations that are very similar inappearance but do not stem from cognitive activity, but from the light reflex,which causes the pupil to pulsate visibly. During the light reflex, the circularmuscles contract, while the radial muscles inhibit the pupil from dilating, andboth together result in a visible pulsing of the pupil. The dilations caused byworkload however are caused by the radial muscles dilating the pupil whilethe circular muscles prohibit the pupil from contracting, leading to a sharperand higher rise in pupil diameter than during the light reflex. The basic ideais to filter the pupil signal for high frequent changes in diameter by means ofwavelet analysis.
For this to work properly, the pupil signal has to be consistent or elsethe wavelet analysis will fail. This means that blinks and artifacts due toa weak pupil detection or other disturbances have to be removed. They areeither simply removed or the missing segments are linearly interpolated. Thisguarantees a continuous pupil signal and affects approximately 3-4% of allobservations.
Once the preprocessing is done, the wavelet analysis begins. Waveletanalysis consists of repeated orthogonal transformations of a signal thataims to decompose it into independent components. These independent
3.4. ICA 17
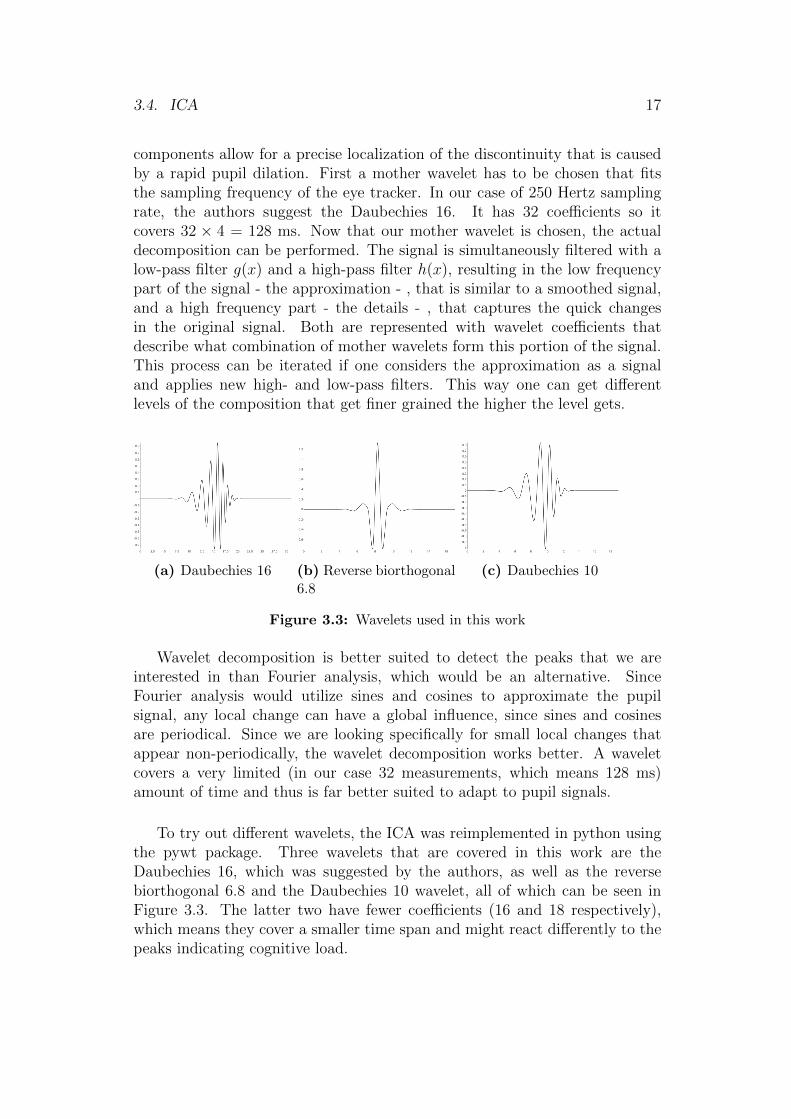
components allow for a precise localization of the discontinuity that is causedby a rapid pupil dilation. First a mother wavelet has to be chosen that fitsthe sampling frequency of the eye tracker. In our case of 250 Hertz samplingrate, the authors suggest the Daubechies 16. It has 32 coefficients so itcovers 32 × 4 = 128 ms. Now that our mother wavelet is chosen, the actualdecomposition can be performed. The signal is simultaneously filtered with alow-pass filter g(x) and a high-pass filter h(x), resulting in the low frequencypart of the signal - the approximation - , that is similar to a smoothed signal,and a high frequency part - the details - , that captures the quick changesin the original signal. Both are represented with wavelet coefficients thatdescribe what combination of mother wavelets form this portion of the signal.This process can be iterated if one considers the approximation as a signaland applies new high- and low-pass filters. This way one can get differentlevels of the composition that get finer grained the higher the level gets.
(a) Daubechies 16 (b) Reverse biorthogonal6.8
(c) Daubechies 10
Figure 3.3: Wavelets used in this work
Wavelet decomposition is better suited to detect the peaks that we areinterested in than Fourier analysis, which would be an alternative. SinceFourier analysis would utilize sines and cosines to approximate the pupilsignal, any local change can have a global influence, since sines and cosinesare periodical. Since we are looking specifically for small local changes thatappear non-periodically, the wavelet decomposition works better. A waveletcovers a very limited (in our case 32 measurements, which means 128 ms)amount of time and thus is far better suited to adapt to pupil signals.
To try out different wavelets, the ICA was reimplemented in python usingthe pywt package. Three wavelets that are covered in this work are theDaubechies 16, which was suggested by the authors, as well as the reversebiorthogonal 6.8 and the Daubechies 10 wavelet, all of which can be seen inFigure 3.3. The latter two have fewer coefficients (16 and 18 respectively),which means they cover a smaller time span and might react differently to thepeaks indicating cognitive load.
18 CHAPTER 3. MATERIAL AND METHODS
For the ICA, we use just the first iteration of the discrete wavelet trans-form. It captures the rough structure of the signal without too much detail.This means that rapid changes in pupil diameter will not be captured by theapproximation and they will be visible in the details. Once these are extracted,we apply hard minimax thresholding [47] to the details coefficients. Thisdenoises the signal by eliminating very small fluctuations and leaves just thesignificant changes in the details. Points in time where the detail coefficientsare greater than zero after the thresholding are those that indicate a pupilchange that is more than just noise and might be caused by cognitive workload.
In the second step, the original signal is searched for discontinuities. Onlyif a coefficient of the details is large and the analysis of the discontinuitiesindicate a large jump at the same time, then this point is counted a beingindicative of a pupillary expression of cognitive load. To determine whether aparticular point in time is a discontinuity, a window of length n is employed.One considers the n previous measurements and for each calculates thedifference to the one before. Then a threshold based on the minimax method[47] is calculated and if the current measurement is above that threshold, itis considered to be a discontinuity. For this work the window size was set to 20.
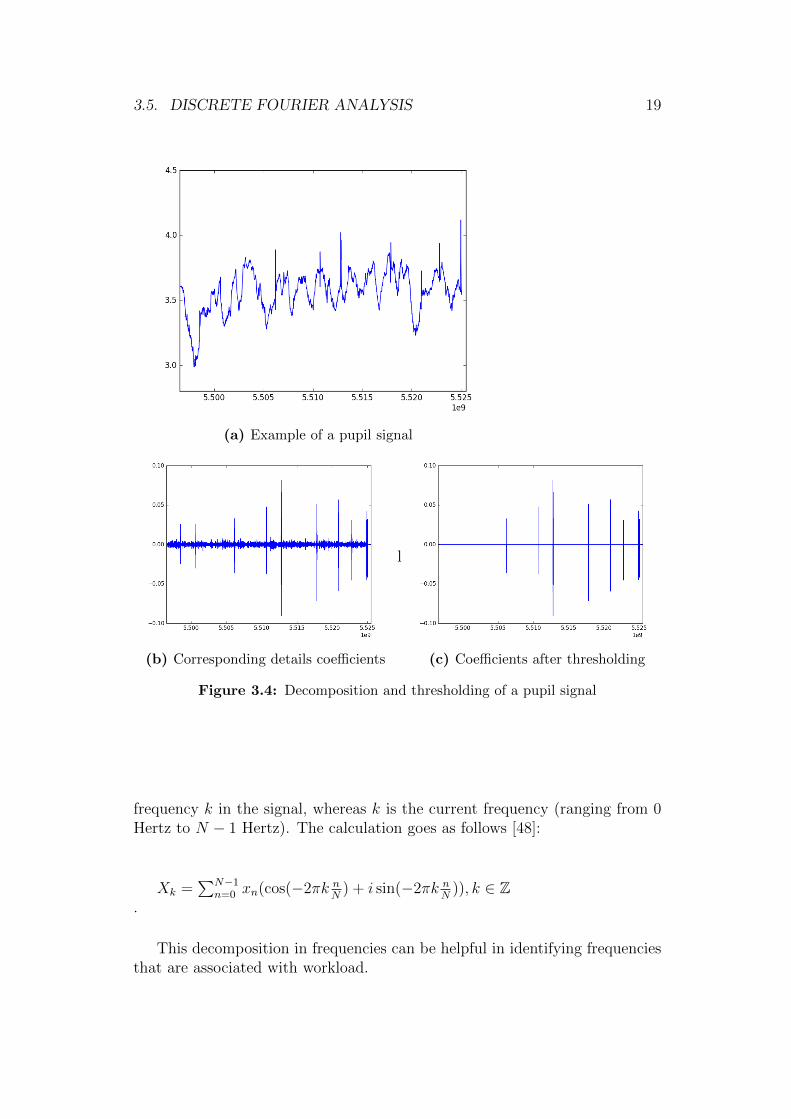
An illustration of the wavelet decomposition and the thresholding processis given in Figure 3.4.
The Index of Cognitive Activity works best if long time spans are analyzedso the thresholds that are calculated are meaningful. Because of the nature ofour data, many trials are left out, which leads to a very fragmented signal. Tocompensate for this, the detail coefficients were calculated per trial and thenthresholds were derived based on all trials and not just on one. This leads toa stable threshold.
3.5 Discrete Fourier analysis
Fourier analysis is the study of approximating a function by sums of simpletrigonometric functions. This approximation technique dates back to the1800s and is derived from Joseph Fourier’s work on Fourier series. Thediscrete version of this approximation takes N equally spaced samples froma signal and outputs the frequencies and amplitudes of the trigonometricfunctions needed to approximate the signal.
Let n be the currently considered sample, N the number of samples inour signal and xn the value of the signal at time n, then Xk is the amount of
3.5. DISCRETE FOURIER ANALYSIS 19
(a) Example of a pupil signal
(b) Corresponding details coefficients
l
(c) Coefficients after thresholding
Figure 3.4: Decomposition and thresholding of a pupil signal
frequency k in the signal, whereas k is the current frequency (ranging from 0Hertz to N − 1 Hertz). The calculation goes as follows [48]:
Xk =∑N−1
n=0 xn(cos(−2πk nN
) + i sin(−2πk nN
)), k ∈ Z.
This decomposition in frequencies can be helpful in identifying frequenciesthat are associated with workload.
20 CHAPTER 3. MATERIAL AND METHODS
3.6 Interval based pupil analysis
The TEPR just gives a rough impression of the workload a subject experiencesduring a trial. For trials that are longer than just one or two seconds, itmay be beneficial to not just look at the whole trial and the average pupildiameter, but at different intervals and their means. Since the second datasetfeatures a trial length of seven seconds, there might be several parts of thetrial that are indicative of the difference between matching and mismatchingtrials. To determine if that was the case, we created a search-space S of allinterval combinations that range from one integer to another and that onecan divide the seven seconds of the trial into:
For some index set I let xi = [ai, bi), 0 ≤ ai,≤ bi ≤ 7 ∈ N be half-openintervals and X = ∪ixi a finite disjunct union thereof. The set of all suchunions makes up the search-space S.
To get the features for a trial, we take the median value per interval, re-sulting in a feature vector that has length n where n is the number of intervalsused.
Chapter 4
Results: N-back-flanker
The n-back-flanker dataset suffers from a flaw that makes normalizationalmost useless: Very short trials. 500 ms of stimulus presentation followed by1500 ms of black screen is too short for the pupil to return to the baseline.Therefore, normalizing the pupils with such a baseline would result in nouseful data. To combat this circumstance, only trials that fulfill certaincriteria were taken into consideration: Only trials that follow a congruent onewere examined as to ensure at least similar baselines, but normalization stilldid not seem reasonable. Additionally, trials with a reaction time of less than200ms were excluded, same holds for trials where no reaction was recorded.Control trials were not taken into consideration as they provoked no reactionfrom the subjects and do not follow the same regularity as normal trials.Trials with missing data were rejected in order not to introduce unnecessarynoise or uncertainty by interpolating.
The results reported here consider the whole duration of a trial (0-2,000ms). The threshold for the ICA was calculated from the detail coefficients ofall subjects since the number of usable trials per subject shows high variance.This was done to prevent a threshold that is extremely low to be generatedfor a subject that has just a tiny amount of usable trials. If there are nopeaks in those few trials, the threshold that is calculated is meaningless andjust contributes noise to the ICA feature. The window size was set to 20.
One type of classifier that was used in this work is linear support vectormachines (SVM). The penalty parameter C was set to 1 and the L2-penaltywas used. The features were centered by removing the mean and scaled tohave a standard deviation of 1. This ensures that the scales for all featuresare the same. Classification via SVM was done in Python using the sklearnpackage’s LinearSVM class. The reported scores are the result of averaging10,000 individual runs with a random split of the dataset. For each run, an
21
22 CHAPTER 4. RESULTS: N-BACK-FLANKER
equal number of trials for both classes was chosen and randomly split with aratio of 80:20 into training and validation set.
The neural network used in 4.2.4 had a hidden layer of 32 neurons. Itused a logistic activation function and a cross-entropy cost function. Theclassification results were generated by 10-fold-cross-validation.
In many cases, the number of trials per subject that have no missingvalues is below 10% and in some cases, none of them fit the criteria mentionedabove. This makes classification for individual subjects feasible only for twosubjects, namely subjects 5 and 19, which have a missing trial rate of 29.545%and 18.398% respectively, and renders it impossible to study individualclassifiers on a large scale. For the two mentioned subjects, there are about 40useful trials per level and condition, making only the level-wise classificationpossible, since the number of features would be too large for the small datasets.
4.1 Matching classification
The first way to classify the trials, is into congruent and incongruent ones.This was done for every level separately. An overview of the results at cross-subject level is given in Table 4.1. This classification for individual features wasconducted to explore the potential of the different approaches before combiningthem for the final analysis. Most results are just at chance level and detailsare provided in this section.
level 0Method Accuracymax value 0.491tepr 0.492Ica db16 0.496ICArbio6.8
0.497
ICA db10 0.498Fourier 0.502composite 0.511
level 1Method Accuracymax value 0.492tepr 0.492Ica db16 0.496ICArbio6.8
0.491
ICA db10 0.492Fourier 0.490composite 0.486
level 2Method Accuracymax value 0.494tepr 0.497Ica db16 0.496ICArbio6.8
0.493
ICA db10 0.492Fourier 0.487composite 0.482
Table 4.1: Classification results for n-back-flanker for all trials

4.1. MATCHING CLASSIFICATION 23
4.1.1 TEPR
Across all levels, the maximum value as well as the median of a trial seemto have no implication on the matching condition. The reason can bee seenin Figures 4.1, 4.2, and 4.3. Figure 4.1 shows the mean pupil diameter persubject for the n-back level 1. Please note that some values are missing, dueto no suitable trial falling into that category. Figure 4.3 depicts the averagedevelopment of the pupil diameter over the course of a level-1-trial, whereasFigure 4.2 illustrates the development over time, exemplified by the averagepupil diameter considering the first n trials. The variance between subjects isextremely high and the resulting mean over all subjects is almost identical,leading to a correct classification rate of around 50% for all levels.
Figure 4.1: Average pupil diameter per subject for level 1
Besides, the pupil diameter decreases over time due to fatigue, which makesthe average pupil diameter alone almost useless for the classification of individ-ual trials. The curves in Figure 4.3 shows that the global average for congruenttrials is 5.28mm, while the average for incongruent trials is 5.25mm. Using thisto discriminate the two classes, the decision threshold is somewhere betweenthose two values. However, considering only the first 90 trials of a block, theaverages for both classes are higher than the two global averages, which means

24 CHAPTER 4. RESULTS: N-BACK-FLANKER
that during the first 90 trials, most incongruent trials are classified wrong. Nor-malizing would remedy this behavior, but is not possible due to the missingbaseline.
Figure 4.2: Average pupil dilation for level 1
Figure 4.3: Pupil diameter averaged over the first n trials
4.1. MATCHING CLASSIFICATION 25
4.1.2 ICA
Independent of the wavelet used for the ICA, the results are similar: Theclassification of congruent vs. incongruent trials is at chance level. Figure 4.4shows the average ICA considering the first n trials. One can observe that theICA is higher for incongruent trials than for congruent ones, but it decreasesover time. This leads to an effect similar to the one in Section 4.1.1. Thisdecrease of the ICA over time can be a sign of learning. Once the subjects areused to the task, it takes less effort to solve it. A similar effect was reportedby Marshall during an unmodified n-back task [49].
Figure 4.4: ICA averaged over the first n trials
4.1.3 Fourier analysis
The global scores for the Fourier features seem to carry no information aboutthe cognitive workload, possibly because the difference in workload is too smallbetween congruent and incongruent trials.
26 CHAPTER 4. RESULTS: N-BACK-FLANKER
4.1.4 Composite method
Combining all features and training a classifier on them changes the resultsonly slightly. Since none of the collected features scores above chance in theSVM-classification , the negative result for their combination is to be expected.
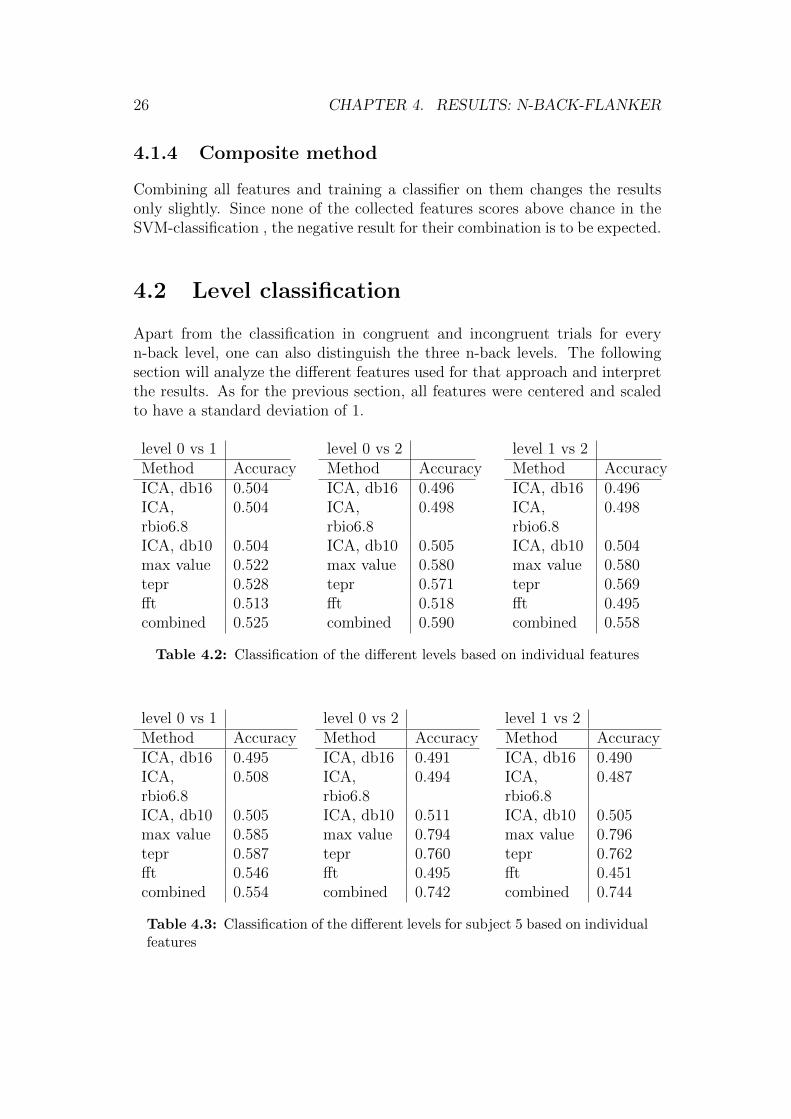
4.2 Level classification
Apart from the classification in congruent and incongruent trials for everyn-back level, one can also distinguish the three n-back levels. The followingsection will analyze the different features used for that approach and interpretthe results. As for the previous section, all features were centered and scaledto have a standard deviation of 1.
level 0 vs 1Method AccuracyICA, db16 0.504ICA,rbio6.8
0.504
ICA, db10 0.504max value 0.522tepr 0.528fft 0.513combined 0.525
level 0 vs 2Method AccuracyICA, db16 0.496ICA,rbio6.8
0.498
ICA, db10 0.505max value 0.580tepr 0.571fft 0.518combined 0.590
level 1 vs 2Method AccuracyICA, db16 0.496ICA,rbio6.8
0.498
ICA, db10 0.504max value 0.580tepr 0.569fft 0.495combined 0.558
Table 4.2: Classification of the different levels based on individual features
level 0 vs 1Method AccuracyICA, db16 0.495ICA,rbio6.8
0.508
ICA, db10 0.505max value 0.585tepr 0.587fft 0.546combined 0.554
level 0 vs 2Method AccuracyICA, db16 0.491ICA,rbio6.8
0.494
ICA, db10 0.511max value 0.794tepr 0.760fft 0.495combined 0.742
level 1 vs 2Method AccuracyICA, db16 0.490ICA,rbio6.8
0.487
ICA, db10 0.505max value 0.796tepr 0.762fft 0.451combined 0.744
Table 4.3: Classification of the different levels for subject 5 based on individualfeatures

4.2. LEVEL CLASSIFICATION 27
level 0 vs 1Method AccuracyICA, db16 0.497ICA,rbio6.8
0.497
ICA, db10 0.500max value 0.608tepr 0.618fft 0.516combined 0.605
level 0 vs 2Method AccuracyICA, db16 0.501ICA,rbio6.8
0.501
ICA, db10 0.497max value 0.931tepr 0.915fft 0.516combined 0.912
level 1 vs 2Method AccuracyICA, db16 0.496ICA,rbio6.8
0.496
ICA, db10 0.500max value 0.932tepr 0.915fft 0.489combined 0.908
Table 4.4: Classification of the different levels for subject 19 based on individ-ual features
4.2.1 TEPR
Figure 4.5 depicts the average pupil diameter for the different n-back levels. Itis apparent that the three curves are almost identical, except for the shift alongthe Y-axis, and as such the average pupil diameter over the course of a trial isa clear indicator for the n-back level. This is also reflected in the classificationresults, which are shown in Table 4.2. According to these results, the averagepupil diameter (TEPR) of a trial as well as the maximum value over the courseof a trial are the most discriminative features. Clearly, a higher pupil diameterindicates higher workload, which is consistent with the literature [4].
Figure 4.5: Average pupil dilation per n-back level
28 CHAPTER 4. RESULTS: N-BACK-FLANKER
4.2.2 ICA
Looking at the ICA results from Table 4.2, the classification success for allwavelets is around chance level. The only wavelet consistently scoring justabove 50% is the Daubechies 10 wavelet. One possible explanation for theseresults is the short duration of the trial. More specifically, in this experimentwe are looking at a period of 2,000 ms, so the ICA is low and most trialswill show an ICA of 0. Having low discrete values makes finding a decisionthreshold for the classification difficult, which may help explaining the poorresults.
4.2.3 Fourier
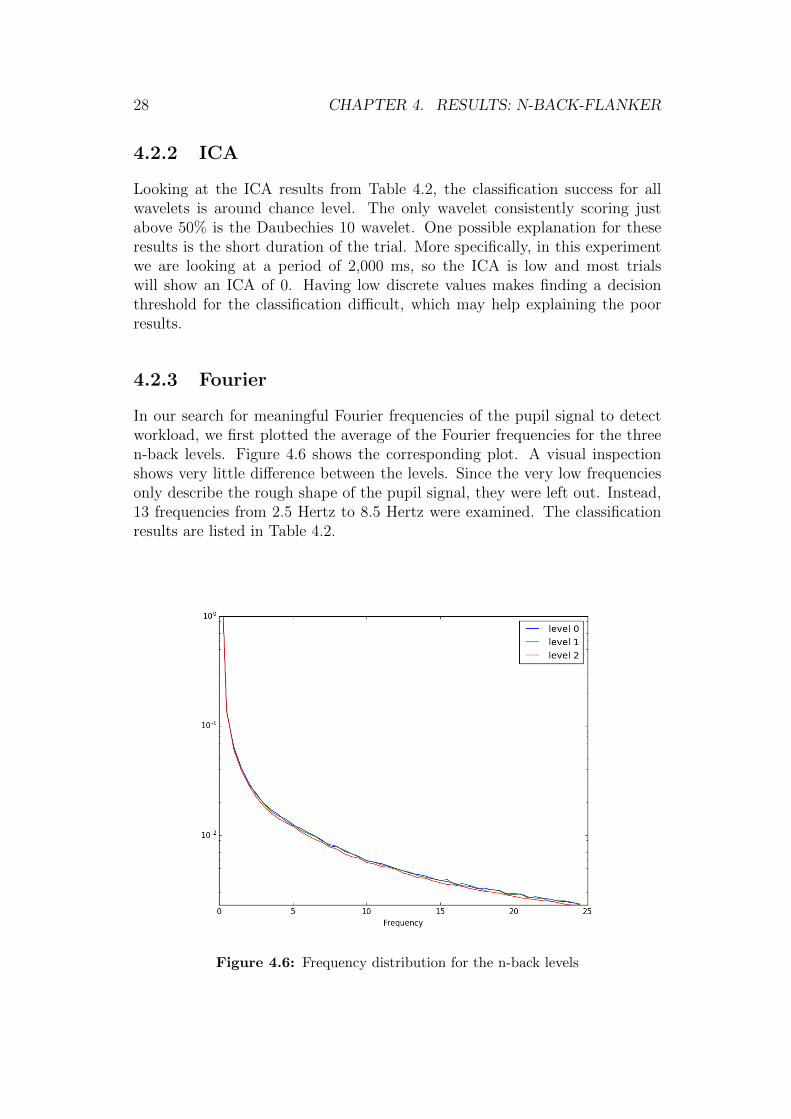
In our search for meaningful Fourier frequencies of the pupil signal to detectworkload, we first plotted the average of the Fourier frequencies for the threen-back levels. Figure 4.6 shows the corresponding plot. A visual inspectionshows very little difference between the levels. Since the very low frequenciesonly describe the rough shape of the pupil signal, they were left out. Instead,13 frequencies from 2.5 Hertz to 8.5 Hertz were examined. The classificationresults are listed in Table 4.2.
Figure 4.6: Frequency distribution for the n-back levels
4.2. LEVEL CLASSIFICATION 29
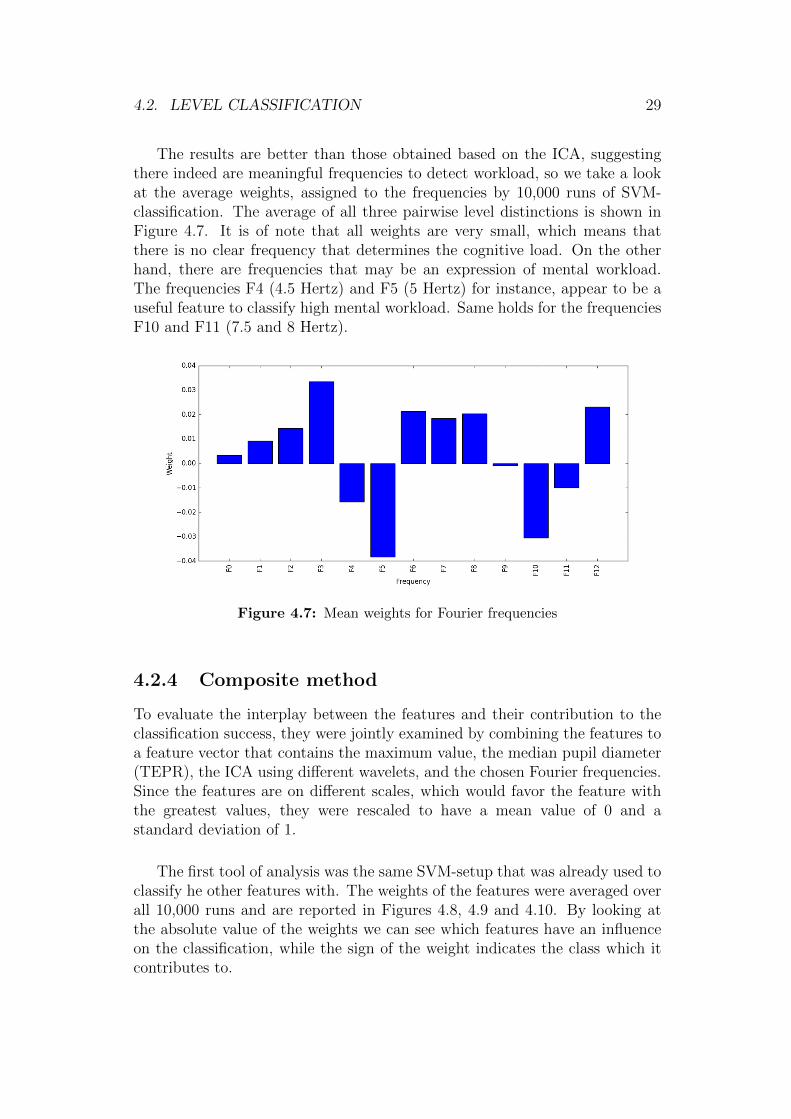
The results are better than those obtained based on the ICA, suggestingthere indeed are meaningful frequencies to detect workload, so we take a lookat the average weights, assigned to the frequencies by 10,000 runs of SVM-classification. The average of all three pairwise level distinctions is shown inFigure 4.7. It is of note that all weights are very small, which means thatthere is no clear frequency that determines the cognitive load. On the otherhand, there are frequencies that may be an expression of mental workload.The frequencies F4 (4.5 Hertz) and F5 (5 Hertz) for instance, appear to be auseful feature to classify high mental workload. Same holds for the frequenciesF10 and F11 (7.5 and 8 Hertz).
Figure 4.7: Mean weights for Fourier frequencies
4.2.4 Composite method
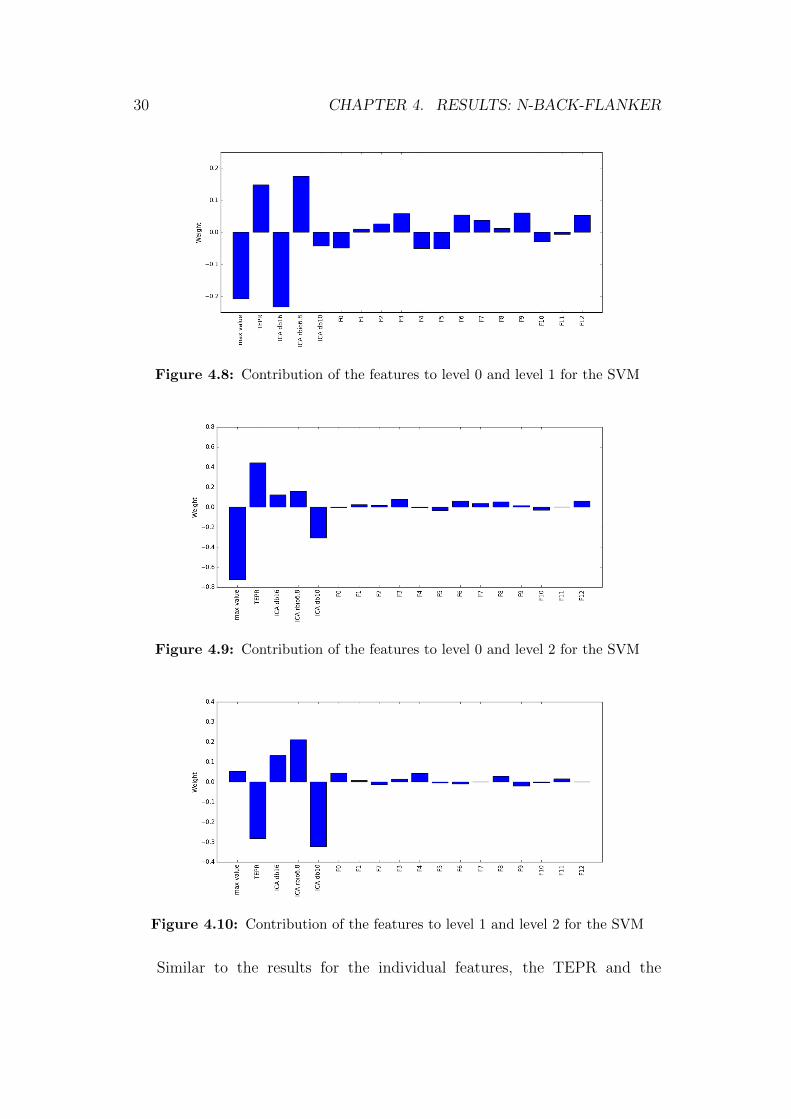
To evaluate the interplay between the features and their contribution to theclassification success, they were jointly examined by combining the features toa feature vector that contains the maximum value, the median pupil diameter(TEPR), the ICA using different wavelets, and the chosen Fourier frequencies.Since the features are on different scales, which would favor the feature withthe greatest values, they were rescaled to have a mean value of 0 and astandard deviation of 1.
The first tool of analysis was the same SVM-setup that was already used toclassify he other features with. The weights of the features were averaged overall 10,000 runs and are reported in Figures 4.8, 4.9 and 4.10. By looking atthe absolute value of the weights we can see which features have an influenceon the classification, while the sign of the weight indicates the class which itcontributes to.
30 CHAPTER 4. RESULTS: N-BACK-FLANKER
Figure 4.8: Contribution of the features to level 0 and level 1 for the SVM
Figure 4.9: Contribution of the features to level 0 and level 2 for the SVM
Figure 4.10: Contribution of the features to level 1 and level 2 for the SVM
Similar to the results for the individual features, the TEPR and the

4.2. LEVEL CLASSIFICATION 31
maximum value carry the most information, while the Fourier frequenciescontribute little to the classification result. The ICA utilizing the Daubechies10 wavelet consistently either has no influence (in the case of level 0 vs. level1) or implies membership to the more workload-heavy class. In general, ityields the best results of the wavelets. The weight of the maximum valuebehaves similar: Classifying level 0 against level 1 and level 0 against level2, a high maximum value is indicative for higher workload, while it seemsto have no effect in the classification of level 0 against level 2. This canbe interpreted in a way that higher peaks in the pupil signal mean higherworkload. The ICA using the Daubechies 16 wavelet has no clear indicationas it either contributes slightly to the workload-lighter class or greatly tothe class with more workload (as in level 0 vs. level 1). Looking at theICA with the reverse biorthogonal 6.8 wavelet, it appears to suggest theclass with less workload. This possibly means that the wavelet is unsuitedto detect the peaks in the pupil signal caused by mental workload and in-stead reacts to noise. The results based on the ICA features alone support this.
Since the weights reported are the average of 10,000 weight vectors thatoriginate from different SVMs, the absolute value of the weights is alsoindicative of the quality of the results. The smaller the weights are, the lessdistinct the classification is. This is shown by the ‘level 0 vs. level 1’-casehaving small average weights, while the case of ‘level 0 vs. level 2’ has largerweights, which is reflected in the scores.
The second method of analysis was a neural network. The correspondingreceiver operating characteristic (ROC) curves are presented in Figures 4.11,4.12, and 4.13. Table 4.5 shows the results of the neural network that wereachieved in pursuit of classifying the three n-back levels.
Accuracylevel 0 vs rest 0.686level 1 vs rest 0.672level 2 vs rest 0.751average 0.703
Table 4.5: Results of the level classification based on the neural network model
The ROC curves describe how a classifier performs depending on thediscrimination threshold and reports the true positive rate as a function offalse positive rate, where the true positive rate is the fraction of positivesamples correctly classified and the false positive rate is the fraction ofnegative examples incorrectly classified. As a reference, a line through the
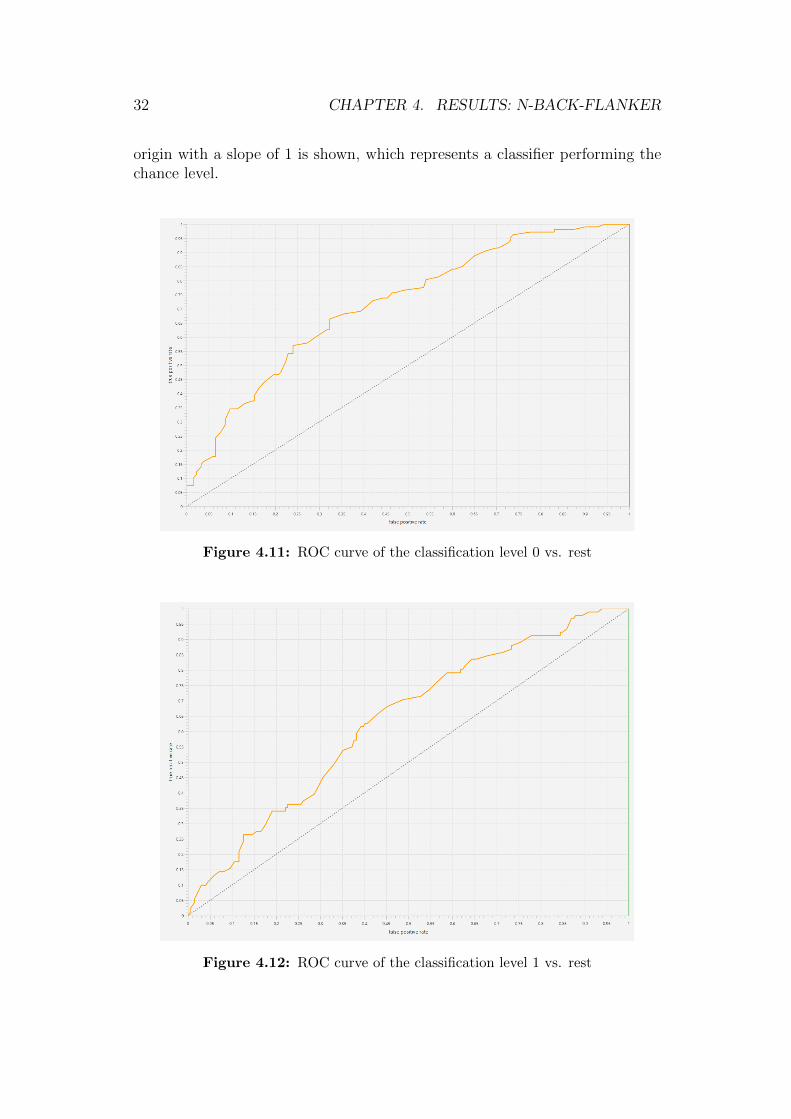
32 CHAPTER 4. RESULTS: N-BACK-FLANKER
origin with a slope of 1 is shown, which represents a classifier performing thechance level.
Figure 4.11: ROC curve of the classification level 0 vs. rest
Figure 4.12: ROC curve of the classification level 1 vs. rest

4.2. LEVEL CLASSIFICATION 33
Figure 4.13: ROC curve of the classification level 2 vs. rest
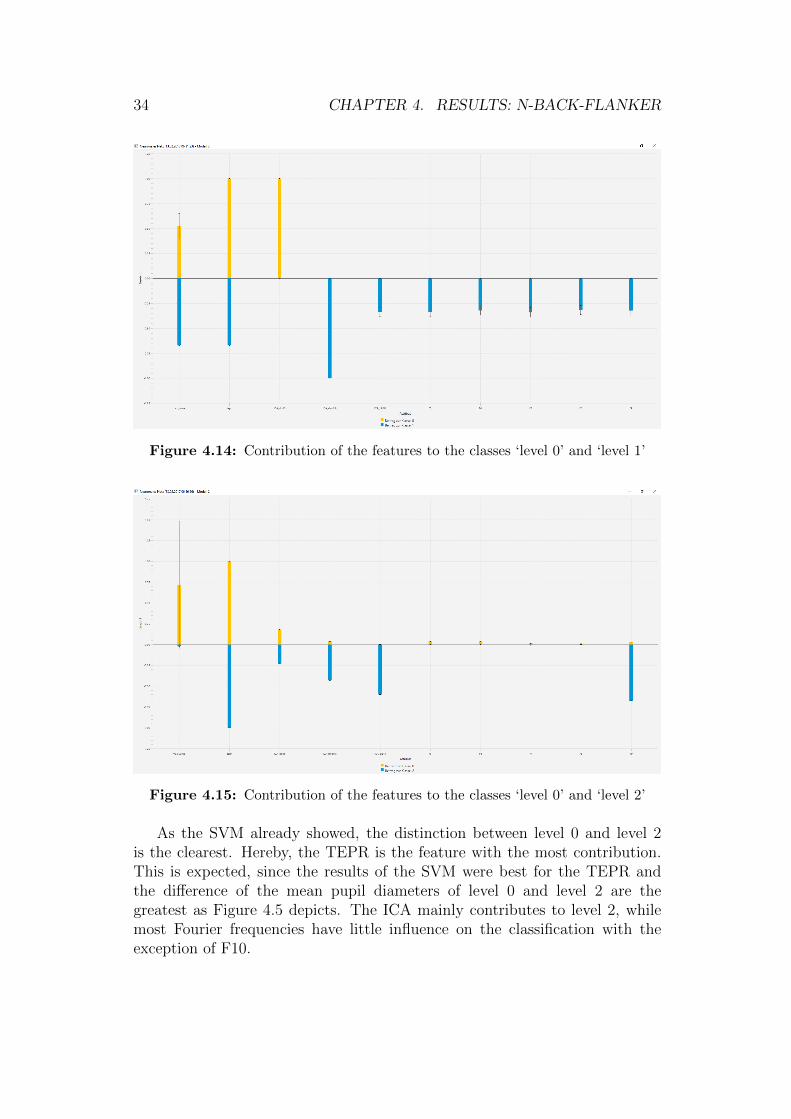
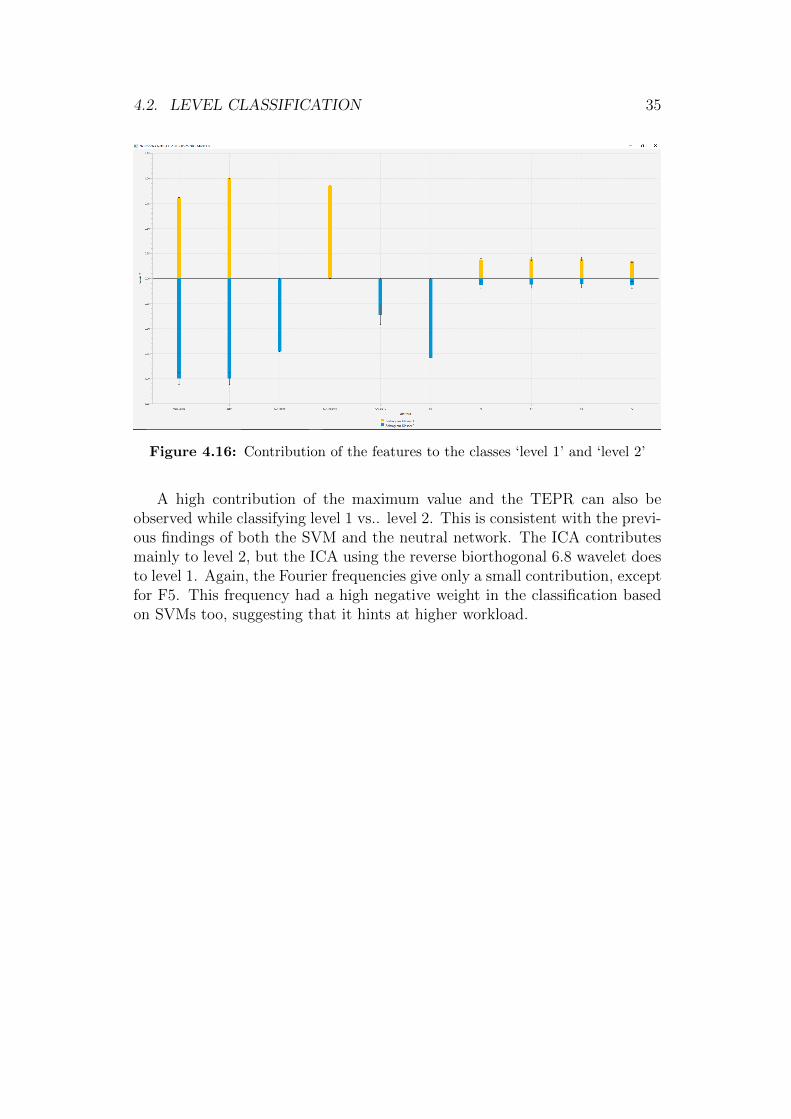
Figures 4.14, 4.15, and 4.16 depict the contribution of the features to thedifferent n-back levels computed based on the LICON-method [50]. Lookingat these contributions, the results are similar to those obtained based onthe SVM analysis. Again, the maximum value and TEPR are the mostdiscriminative, closely followed by the ICA. The ICA with the Daubechies10 wavelet also consistently indicates the class with more workload, which issupported by the weight analysis of the SVM. The ICA using the Daubechies16 and reverse biorthogona l6.8 wavelets, show no clear indication concerningworkload. TEPR and maximum value contribute greatly to both classes, andas such are important for the classification. Concerning the Fourier frequen-cies, the frequency F5 (5 Hertz) mostly contributes to the workload-heavyclass, while the other frequencies are ambiguous. This backs the result of theFourier analysis.
Classifying trials from the n-back levels 0 and 1, the maximum valuecontributes to both classes, but overall indicates level 1. On the other hand,the TEPR hints more at level 0, while being the most influential feature.Depending on the wavelet that the ICA used, the resulting feature eithercontributes to level 0 (Daubechies 16) or level 1 (reverse biorthogonal 6.8 andDaubechies 10). All Fourier frequencies slightly point to level 1.
34 CHAPTER 4. RESULTS: N-BACK-FLANKER
Figure 4.14: Contribution of the features to the classes ‘level 0’ and ‘level 1’
Figure 4.15: Contribution of the features to the classes ‘level 0’ and ‘level 2’
As the SVM already showed, the distinction between level 0 and level 2is the clearest. Hereby, the TEPR is the feature with the most contribution.This is expected, since the results of the SVM were best for the TEPR andthe difference of the mean pupil diameters of level 0 and level 2 are thegreatest as Figure 4.5 depicts. The ICA mainly contributes to level 2, whilemost Fourier frequencies have little influence on the classification with theexception of F10.
4.2. LEVEL CLASSIFICATION 35
Figure 4.16: Contribution of the features to the classes ‘level 1’ and ‘level 2’
A high contribution of the maximum value and the TEPR can also beobserved while classifying level 1 vs.. level 2. This is consistent with the previ-ous findings of both the SVM and the neutral network. The ICA contributesmainly to level 2, but the ICA using the reverse biorthogonal 6.8 wavelet doesto level 1. Again, the Fourier frequencies give only a small contribution, exceptfor F5. This frequency had a high negative weight in the classification basedon SVMs too, suggesting that it hints at higher workload.

36 CHAPTER 4. RESULTS: N-BACK-FLANKER

Chapter 5
Results: Text-Picture
Only trials without missing data or artifacts were considered valid forfurther analysis. For classification, a linear SVM was run 10,000 timesand the results were averaged. For each run, an equal number of matchingand mismatching trials were chosen and the model was trained on 80%of those trials, while 20% were used for validation. This holds for boththe classification using all subjects and for the classification per subject.By splitting the dataset, the results get less representative, but the moreruns are performed and averaged, the less variance influences the results andthe more accurately it represents the actual potential that lies within the data.
Figure 5.1: Median and quartiles over all trials
37

38 CHAPTER 5. RESULTS: TEXT-PICTURE
Table 5.1: Accuracy scores for the whole trial (0-7000ms)
Subject TEPR ICA Fourieranalysis
globallybestinterval
individualbest in-terval
composite compositeindivid-ual
global 0.498 0.501 0.510 0.538 - 0.521 -averageper subject
0.518 0.491 0.490 0.525 0.586 0.520 0.536
1 0.460 0.527 0.450 0.503 0.577 0.483 0.4932 0.448 0.585 0.549 0.416 0.526 0.524 0.5503 0.602 0.529 0.460 0.673 0.631 0.539 0.5344 0.467 0.457 0.559 0.492 0.574 0.571 0.5545 0.630 0.447 0.675 0.628 0.684 0.662 0.6826 0.578 0.467 0.586 0.537 0.577 0.619 0.6117 0.495 0.465 0.440 0.506 0.559 0.420 0.4238 0.455 0.533 0.438 0.550 0.616 0.499 0.5239 0.562 0.490 0.454 0.522 0.604 0.444 0.50810 0.425 0.447 0.518 0.460 0.464 0.486 0.50111 0.479 0.453 0.529 0.414 0.542 0.508 0.54812 0.551 0.458 0.554 0.464 0.550 0.529 0.56213 0.579 0.455 0.472 0.542 0.583 0.489 0.47614 0.570 0.488 0.532 0.559 0.660 0.545 0.55515 0.487 0.506 0.489 0.526 0.551 0.468 0.47616 0.518 0.620 0.580 0.545 0.593 0.578 0.57417 0.581 0.457 0.522 0.557 0.635 0.536 0.51918 0.542 0.456 0.566 0.467 0.604 0.567 0.58319 0.457 0.474 0.469 0.443 0.605 0.452 0.55220 0.457 0.489 0.453 0.513 0.558 0.471 0.49921 0.493 0.468 0.489 0.534 0.562 0.520 0.52622 0.510 0.609 0.563 0.526 0.567 0.599 0.64023 0.555 0.489 0.508 0.546 0.601 0.499 0.50524 0.461 0.456 0.481 0.519 0.595 0.481 0.49425 0.581 0.457 0.543 0.532 0.640 0.516 0.516
For the SVM, the LinearSVM class from python’s sklearn framework wasused. The penalty was the L2 and the penalty parameter C was set to 1.Additionally, class weights were employed and set to ‘balanced’ to counter thefact that there can be an unequal distribution of matching and mismatchingtrials for small data sizes that might occur in subject-wise classification.
An overview over the dataset is given in Figure 5.1, where the median overall trials is shown as well as the upper and lower quartile in light colors. It isnoticeable that the variance is very high. This will make separating the classes
5.1. TASK-EVOKED PUPILLARY RESPONSE 39
very challenging. Results for the whole trial (0-7000 ms) are provided in Table5.1.
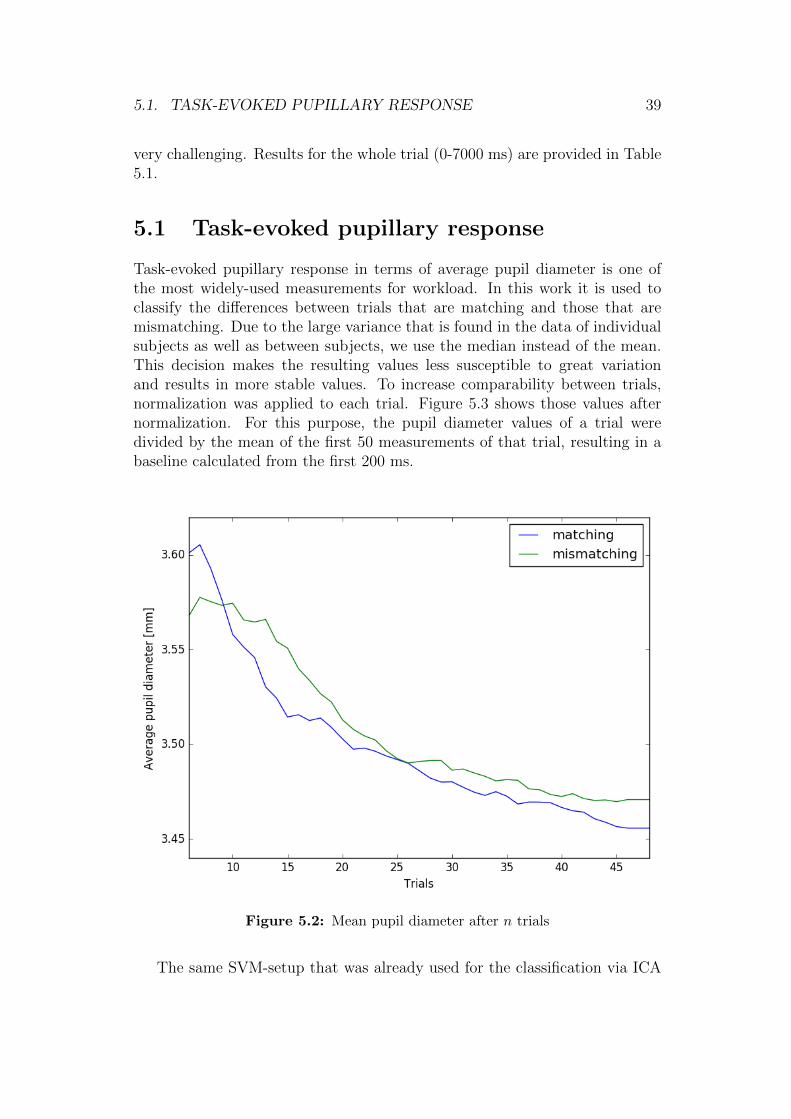
5.1 Task-evoked pupillary response
Task-evoked pupillary response in terms of average pupil diameter is one ofthe most widely-used measurements for workload. In this work it is used toclassify the differences between trials that are matching and those that aremismatching. Due to the large variance that is found in the data of individualsubjects as well as between subjects, we use the median instead of the mean.This decision makes the resulting values less susceptible to great variationand results in more stable values. To increase comparability between trials,normalization was applied to each trial. Figure 5.3 shows those values afternormalization. For this purpose, the pupil diameter values of a trial weredivided by the mean of the first 50 measurements of that trial, resulting in abaseline calculated from the first 200 ms.
Figure 5.2: Mean pupil diameter after n trials
The same SVM-setup that was already used for the classification via ICA

40 CHAPTER 5. RESULTS: TEXT-PICTURE
was also used for the average pupil diameter.
Table 5.1 presents the classification success based on the average pupildiameter over the course of the stimulus presentation of a trial. Utilizingall trials, a score of 49.8% was reached, while the average result of thesubject-wise classification was 51.8%. The difference between the median ofmatching and mismatching trials combined with the high variance leads toa result that is at chance level. The average score per subject being slightlybetter than the global score is not surprising since the individual differencesbetween subjects can be addressed and exploited.
Figure 5.3: Mean pupil diameter of the subjects over the course of the stimuluspresentation and after trial-wise normalization

5.2. ICA 41
The progression of the median diameter of the pupil averaged over the firstn trials is shown in Figure 5.2. It is noticeable that the average pupil diametergradually decreases over time. According to Lowenstein and Loewenfeld [51],such a decrease is an indicator for tiredness and fatigue, which is fitting for thetask and the length of blocks and trials. The influence of the decreasing pupildiameter over time on the classification results should however be negated bynormalizing the trials.
5.2 ICA
The results reported consider the whole interval of a trial (0-7,000 ms) and nonormalization was applied in order to not influence the ICA. The thresholdof the ICA was calculated separately for each subject since there were enoughvalid trials per subject to justify that decision. 32 was chosen as the windowsize for the ICA.
Figure 5.4: Progression of the average ICA considering only the first n trials

42 CHAPTER 5. RESULTS: TEXT-PICTURE
Figure 5.5: Mean values of the ICA for the whole trial 0-7000 ms
5.3. INTERVAL-BASED ANALYSIS 43
As shown in Table 5.1, the results using all subjects combined (global)are at chance level and the difference between the means of matching andmismatching trials is only 0.107. Looking at the average results of thesubject-wise classification, the impression is similar: A classification ratearound chance level and a minor difference in ICA of 0.121. Details on thedifference of the ICA for all subjects can be found in Figure 5.5. The slightlyincreased ICA is in accordance with our expectation. The mismatchingcondition puts a greater strain on the working memory, which is reflected inthe increased ICA, although the difference is not great enough to yield resultsabove chance level. This is partly due to the discrete values of the ICA. Whenthe mean values of the matching and mismatching classes are very similar,the decision boundary would ideally be placed right in the middle betweenthe two. In the case of global classification, this boundary would be 3.369,but since the values of the ICA are all integer values, there will be errors. Aclassification is possible as soon as the difference in the mean values is greaterthan 1, which is also reflected in the individual classification results. Such adifference is given for subjects 2, 8, 16, and 22 and their individual results aresignificantly better than chance level.
Another observation about the ICA is captured in Figure 5.4. The graphshows the development of the average ICA if only the first n trials are consid-ered. It is interesting to see that the average ICA increases with the progressionof the trials. This is plausible since a subject tires during a block, as can beseen in Figure 5.2. Since the workload depends on the mental state of thesubject, the increasing tiredness leads to an increase in cognitive load, whichis reflected in the ICA. As already seen in Sections 4.1.1 and 4.1.2, this gradualchange of a feature throughout a block renders it useless for classification.
5.3 Interval-based analysis
To get a more detailed analysis based on how the pupil diameter developsover the course of a trial, the interval-based approach presented in Section3.6 was designed. The results surpass those of the simpler TEPR and score53.8% for the best combination in the global classification. Detailed resultscan be inspected in Table 5.2, where not only the best results for the globalclassification are shown, but are also compared to those of the individualsubjects.
Besides the best global results, the individual best results for every subjectare also reported. These scores however are achieved on interval combinationsthat are specifically tailored towards a single subject. They vary greatly be-tween subjects and are not suited to derive a general rule from them. They

44 CHAPTER 5. RESULTS: TEXT-PICTURE
mainly report the large differences between subjects and illustrate the difficultyof finding meaningful features for a group of subjects. On the other hand, theyshow which results can be achieved on the individual level.
Table 5.2: Best intervals for global classification and their corresponding clas-sification accuracy
Interval global 1 2 3 4 5 6 7 8
0 1 2 3 4 5 6 7 53.8 50.3 41.6 67.3 49.2 62.8 53.7 50.6 55.0
0 1 2 3 4 5 6 7 53.7 46.1 47.3 63.2 55.0 61.7 55.1 48.0 58.1
0 1 2 3 4 5 6 7 53.6 50.1 43.7 66.3 48.6 60.0 53.5 49.0 53.7
0 1 2 3 4 5 6 7 53.5 50.0 48.4 64.6 47.3 60.0 53.5 46.5 54.4
0 1 2 3 4 5 6 7 53.5 47.2 47.4 64.4 50.3 60.1 52.1 48.2 58.6
Interval 9 10 11 12 13 14 15 16 17
0 1 2 3 4 5 6 7 52.2 46.0 41.4 46.4 54.2 55.9 52.6 54.5 55.7
0 1 2 3 4 5 6 7 52.4 45.3 41.5 54.0 54.8 57.5 52.1 55.8 49.8
0 1 2 3 4 5 6 7 49.9 44.8 43.0 52.6 53.5 56.7 51.4 57.9 53.4
0 1 2 3 4 5 6 7 48.8 42.1 46.0 47.9 50.9 62.2 51.5 52.3 54.7
0 1 2 3 4 5 6 7 47.5 43.3 41.8 52.3 52.8 61.0 51.4 56.3 53.3
Interval 18 19 20 21 22 23 24 25
0 1 2 3 4 5 6 7 46.7 44.3 51.3 53.4 52.6 54.6 51.9 53.2
0 1 2 3 4 5 6 7 50.7 50.7 53.2 53.2 53.5 54.6 51.2 50.0
0 1 2 3 4 5 6 7 47.9 46.7 50.3 52.8 53.7 55.0 49.1 53.5
0 1 2 3 4 5 6 7 56.1 59.4 52.2 53.1 48.6 52.8 48.0 51.2
0 1 2 3 4 5 6 7 52.9 55.2 51.6 50.9 51.7 53.0 52.1 51.0
5.4 Frequency analysis
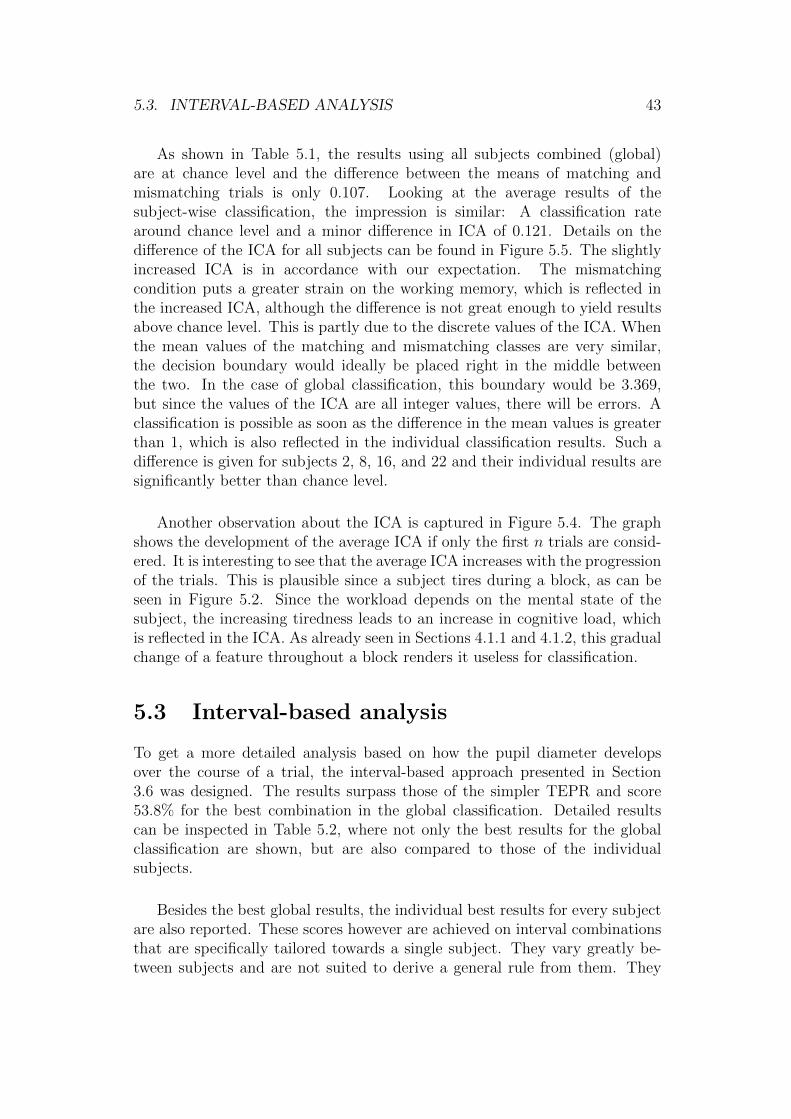
Since we want to identify frequencies that are indicative of cognitive workload,we first inspected the averaged coefficients for the two classes. Figure 5.6shows the corresponding graph.
5.4. FREQUENCY ANALYSIS 45
Figure 5.6: Frequencies of the Fourier analysis
As features, 14 equally spaced frequencies ranging from 2 to 8 were used.The global results as well as the individual ones suggest that there is informa-tion regarding workload encoded in the Fourier frequencies. The weights thatwere assigned to the different frequencies by the SVM for the classificationwith all trials are shown in Figures 5.7, whereas the average weights of thesubject-wise classification are presented in Figure 5.8.
Similar to the n-back-flanker dataset, frequencies of about 5 Hertz seemto indicate higher workload, as well as frequencies just above 7 Hertz. Fre-quencies around 3.5 Hertz and 6.5 Hertz on the other hand seem to suggestless workload. Subjects that scored well in the classification via ICA and trialnumber score also higher than average when we use the Fourier frequencies.There may be a connection between the high scoring frequencies of the Fourieranalysis and the peaks in the pupil signal measured by the ICA.

46 CHAPTER 5. RESULTS: TEXT-PICTURE
Figure 5.7: Weights of the Fourier frequencies for all trials and subjects
Figure 5.8: Average weights of the Fourier frequencies per subject
5.5. COMPOSITE METHOD 47
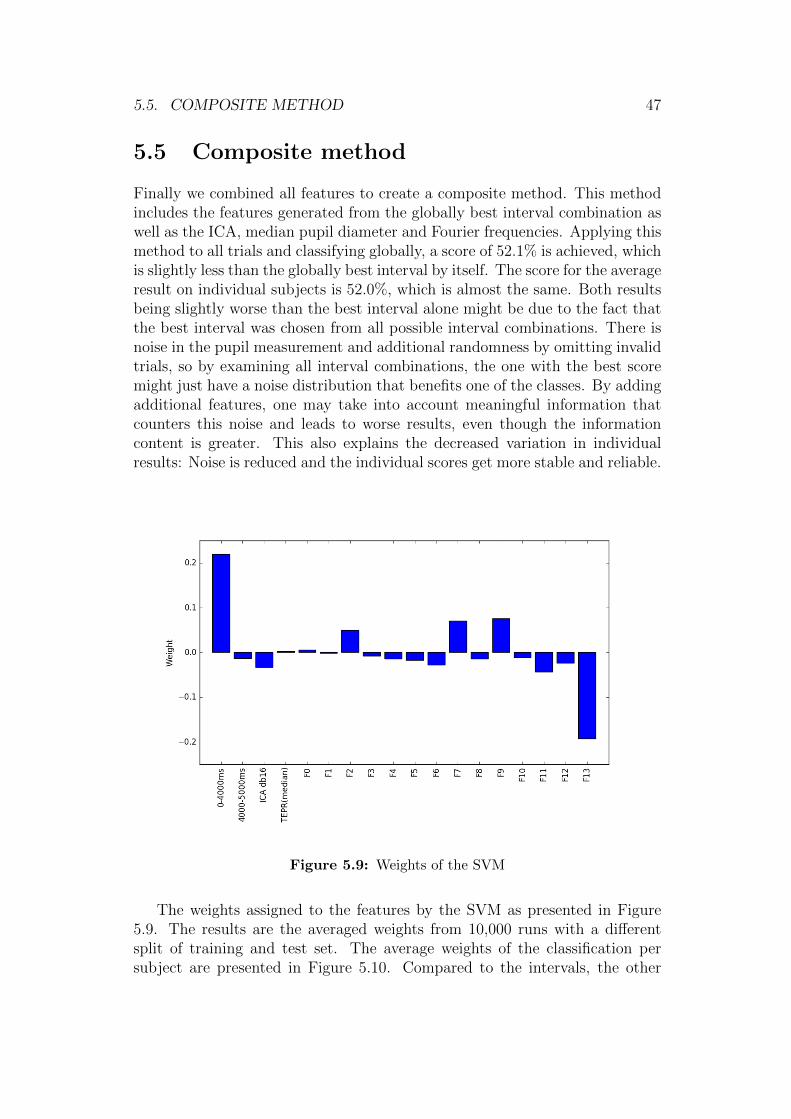
5.5 Composite method
Finally we combined all features to create a composite method. This methodincludes the features generated from the globally best interval combination aswell as the ICA, median pupil diameter and Fourier frequencies. Applying thismethod to all trials and classifying globally, a score of 52.1% is achieved, whichis slightly less than the globally best interval by itself. The score for the averageresult on individual subjects is 52.0%, which is almost the same. Both resultsbeing slightly worse than the best interval alone might be due to the fact thatthe best interval was chosen from all possible interval combinations. There isnoise in the pupil measurement and additional randomness by omitting invalidtrials, so by examining all interval combinations, the one with the best scoremight just have a noise distribution that benefits one of the classes. By addingadditional features, one may take into account meaningful information thatcounters this noise and leads to worse results, even though the informationcontent is greater. This also explains the decreased variation in individualresults: Noise is reduced and the individual scores get more stable and reliable.
Figure 5.9: Weights of the SVM
The weights assigned to the features by the SVM as presented in Figure5.9. The results are the averaged weights from 10,000 runs with a differentsplit of training and test set. The average weights of the classification persubject are presented in Figure 5.10. Compared to the intervals, the other
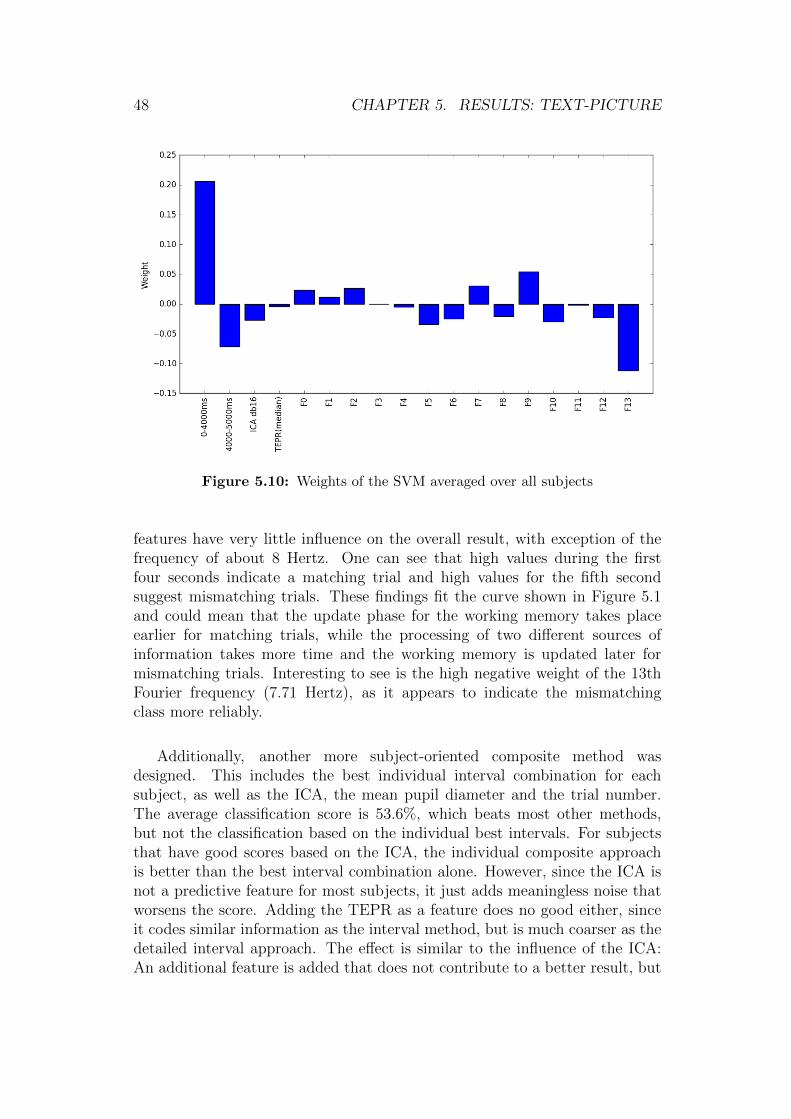
48 CHAPTER 5. RESULTS: TEXT-PICTURE
Figure 5.10: Weights of the SVM averaged over all subjects
features have very little influence on the overall result, with exception of thefrequency of about 8 Hertz. One can see that high values during the firstfour seconds indicate a matching trial and high values for the fifth secondsuggest mismatching trials. These findings fit the curve shown in Figure 5.1and could mean that the update phase for the working memory takes placeearlier for matching trials, while the processing of two different sources ofinformation takes more time and the working memory is updated later formismatching trials. Interesting to see is the high negative weight of the 13thFourier frequency (7.71 Hertz), as it appears to indicate the mismatchingclass more reliably.
Additionally, another more subject-oriented composite method wasdesigned. This includes the best individual interval combination for eachsubject, as well as the ICA, the mean pupil diameter and the trial number.The average classification score is 53.6%, which beats most other methods,but not the classification based on the individual best intervals. For subjectsthat have good scores based on the ICA, the individual composite approachis better than the best interval combination alone. However, since the ICA isnot a predictive feature for most subjects, it just adds meaningless noise thatworsens the score. Adding the TEPR as a feature does no good either, sinceit codes similar information as the interval method, but is much coarser as thedetailed interval approach. The effect is similar to the influence of the ICA:An additional feature is added that does not contribute to a better result, but

5.5. COMPOSITE METHOD 49
introduces more noise.
A detailed analysis of the individual weights is not possible due to thedifferent lengths of the feature vectors.

50 CHAPTER 5. RESULTS: TEXT-PICTURE
Chapter 6
Discussion and Outlook
Various applications of workload measurement make reliable methods toassess workload highly sought-after. Especially physiological measures areuseful, since they do not rely on the subjects self-assessment or feedback.The average pupil diameter as captured by an eye tracker has been usedas an indicator for workload for several decades, but mostly for large scaledifferences. By combining different features derived from of the pupil signaland using neural networks, we were able to classify small changes caused byminor distractions or unfavorable circumstances just above chance level, butnot with a high enough score to be applicable as a prediction tool. Largeworkload differences however yielded the expected good classification results.
Apart from the traditional approach of averaging the pupil diameter ofa trial, we took into consideration different methods. As one measure ofworkload, the ICA was implemented as described in Section 3.4 and was testedwith different wavelets. Additionally, we applied the Fourier transformationand evaluated the coefficients of different frequencies. The length of thetext-picture dataset lends itself to an interval-wise analysis, which yieldedbetter results than just the average pupil dilation. Overall, the matchingcondition in the n-back-flanker dataset could be classified only at an accuracyinsignificantly better than chance level, but we were able to distinguish then-back levels with an average accuracy of 70.3%. These numbers show that itis possible to separate the differences in intrinsic workload, but the extraneousworkload caused by the flankers has proven to be difficult to recognize. Theinability to normalize the trials may be the main reason for this, makingsingle-trial classification almost impossible due to the gradual pupil changeover time. Case studies of subjects 5 and 19 show that it is possible toconstruct specialized classifiers designed for specific individuals that achieveeven better scores than the global classification.
51
52 CHAPTER 6. DISCUSSION AND OUTLOOK
In the text-picture dataset, the classification rate of our method using acombination of pupil-related features was 52.1% considering the distinctionbetween matching and mismatching trials. Training individual classifiers forevery subject however, the score could be increased to 53.6%.
The inability to classify the difference in workload caused by the flankersin the n-back-flanker dataset is in accordance to previous findings reportedby Scharinger et al. [9]. The authors found that the effect of the flankersdiminishes with increasing n-back level and only level 0 consistently showedsignificant differences throughout all measurements, while level 1 did for mostmeasures and level 2 only for few. Most measures also showed a significant dif-ference between the three n-back levels, which is in accordance with our results.
A way to remedy some problems of the single-trial classification would beto find a way to detrend the pupil signal. In the case of the n-back-flankerdataset, this calls for a more sophisticated normalization method. Normalizingmay help to use the average pupil diameter, but it does not do so for the ICA,thus one has to come up with another way of detrending.
The Fourier analysis brought to light interesting data. Consistentlythroughout both datasets, there seem to be frequencies that indicate higherworkload. Frequencies of 2 Hertz, 5 Hertz, and just above 7 Hertz showedhigher coefficients for trials with more cognitive workload. Since these findingswere made in both datasets individually, there may be a task-independentway to get an indication for workload. Pooling similar frequencies by formingbins for adjacent ones may help amplify this effect. Further research has tobe conducted to confirm or dismiss the theory of Fourier analysis revealingworkload information.
The analysis based on pupillometry alone worked well for the n-back levels,but poorly for the classification of the matching condition in both datasets.Going one step further, one could include additional eye measures and testthem jointly with pupillometry. Measures derived from the fixations andsaccades as well as the scanpath most likely contain information regardingthe workload, so a scanpath analysis could be useful, especially for thetext-picture dataset.
Since eye movements have an influence on the measured pupil diameter, afurther analysis could be done just based on pupil measures during fixations.The actual time span that would be used per trial would decrease, but noisecaused by saccades could be avoided. Additionally, the information thatmight be encoded in fixations and saccades could smoothly be integrated into

53
this approach.
For a more accurate classification of the n-back levels, the blink rate couldbe of use. Considering batches of consecutive trials, a measure like ‘blinks perminute’ or ‘blinks per time interval’ could be employed. Furthermore, othermeasures like the ICA could be applied to batches of consecutive trials, aswell as the pupil mean and other pupil related measures.

54 CHAPTER 6. DISCUSSION AND OUTLOOK

Bibliography
[1] SMI. Remote eye tracking: Smi red250mobile eye tracker, 2015. [Online;accessed February 27, 2017].
[2] SMI. Smi wearable etg old design, 2011. [Online; accessed February 27,2017].
[3] R. J. Lysaght, S. G. Hill, A. O. Dick, B. D. Plamondon, and P. M. Linton.Operator workload: Comprehensive review and evaluation of operatorworkload methodologies. Technical report, ANALYTICS INC WILLOWGROVE PA, 09 1989.
[4] J. Beatty. Task-evoked pupillary responses, processing load, and the struc-ture of processing resources. Psychological Bulletin, 91(2):276–292, March.
[5] S. T. Iqbal, X. Sam Zheng, and B. P. Bailey. Task-evoked pupillaryresponse to mental workload in human-computer interaction. In CHI ’04Extended Abstracts on Human Factors in Computing Systems, CHI EA’04, pages 1477–1480, New York, NY, USA, 2004. ACM.
[6] O. Palinko, A. L. Kun, A. Shyrokov, and P. Heeman. Estimating cognitiveload using remote eye tracking in a driving simulator. In Proceedings ofthe 2010 Symposium on Eye-Tracking Research #38; Applications, ETRA’10, pages 141–144, New York, NY, USA, 2010. ACM.
[7] O. Komogortsev W. Sewell. Real-time eye gaze tracking with an un-modified commodity webcam employing a neural network. In Z. W. Rasand M. Michalewicz, editors, CHI EA ’10 CHI ’10 Extended Abstracts onHuman Factors in Computing Systems, Lecture Notes in Artificial Intel-ligence, pages 3739–3744, Atlanta, Georgia, USA, 2010.
[8] M. Stengel, S. Grogorick, M. Eisemann, E. Eisemann, and M. A. Mag-nor. An affordable solution for binocular eye tracking and calibration inhead-mounted displays. In Proceedings of the 23rd ACM InternationalConference on Multimedia, MM ’15, pages 15–24, New York, NY, USA,2015. ACM.
55
56 BIBLIOGRAPHY
[9] C. Scharinger, A. Soutschek, T. Schubert, and P. Gerjets. When flankermeets the n-back: What eeg and pupil dilation data reveal about theinterplay between the two central-executive working memory functionsinhibition and updating. Psychophysiology, 52(10):1293–1304, 2015.
[10] E. Huey. The Psychology and Pedagogy of Reading (Reprint). MIT Press,1968 (originally published 1908).
[11] A. L. Yarbus. Eye Movements and Vision. Plenum Press, 1967.
[12] W. Fuhl, M. Tonsen, A. Bulling, and E. Kasneci. Pupil detection forhead-mounted eye tracking in the wild: an evaluation of the state of theart. Machine Vision and Applications, 27(8):1275–1288, 2016.
[13] T. Appel, T. Santini, and E. Kasneci. Brightness- and motion-based blinkdetection for head-mounted eye trackers. In Proceedings of the 2016 ACMInternational Joint Conference on Pervasive and Ubiquitous Computing:Adjunct, pages 1726–1735. ACM, 2016.
[14] W. Fuhl, T. C Santini, T. Kubler, and E. Kasneci. Else: Ellipse selectionfor robust pupil detection in real-world environments. In Proceedings ofthe Ninth Biennial ACM Symposium on Eye Tracking Research & Appli-cations, pages 123–130. ACM, 2016.
[15] W. Fuhl, T. Santini, G. Kasneci, and E. Kasneci. Pupilnet: Con-volutional neural networks for robust pupil detection. arXiv preprintarXiv:1601.04902, 2016.
[16] E. Kasneci, G. Kasneci, T. C Kubler, and W. Rosenstiel. Online recog-nition of fixations, saccades, and smooth pursuits for automated analysisof traffic hazard perception. In Artificial neural networks, pages 411–434.Springer, 2015.
[17] E. Kasneci, K. Sippel, K. Aehling, M. Heister, W. Rosenstiel, U. Schiefer,and E. Papageorgiou. Driving with binocular visual field loss? a study ona supervised on-road parcours with simultaneous eye and head tracking.PloS one, 9(2):e87470, 2014.
[18] C. Braunagel, E. Kasneci, W. Stolzmann, and W. Rosenstiel. Driver-activity recognition in the context of conditionally autonomous driving. InIntelligent Transportation Systems (ITSC), 2015 IEEE 18th InternationalConference on, pages 1652–1657. IEEE, 2015.
[19] J. Sweller. Cognitive load during problem solving: Effects on learning.Cognitive Science, 12(2):257–285, 1988.
BIBLIOGRAPHY 57
[20] A. Diamond. Executive functions. Annual Review of Psychology, 64:135–168, 2013.
[21] A. D. Baddeley and G. J. Hitch. Working memory. In G. Bower, editor,The psychology of learning and motivation, volume VIII, pages 47–89.Academic Press, New York, 1974.
[22] A. D. Baddeley. The episodic buffer: A new component of working mem-ory? Trends in Cognitive Sciences, 4(11):417–423, 2000.
[23] P. Gerjets, C. Walter, W. Rosenstiel, M. Bogdan, and T. O. Zander. Cog-nitive state monitoring and the design of adaptive instruction in digitalenvironments: lessons learned from cognitive workload assessment usinga passive brain-computer interface approach. Frontiers in Neuroscience,8:385, 2014.
[24] M. Spuler, C. Walter, W. Rosenstiel, P. Gerjets, K. Moeller, and E. Klein.Eeg-based prediction of cognitive workload induced by arithmetic: a steptowards online adaptation in numerical learning. ZDM, 48(3):267–278,2016.
[25] C. Scharinger, Y. Kammerer, and P. Gerjets. Pupil dilation and eeg alphafrequency band power reveal load on executive functions for link-selectionprocesses during text reading. PLOS ONE, 10(6):1–24, 06 2015.
[26] B. Reimer and B. Mehler. The impact of cognitive workload on physiologi-cal arousal in young adult drivers: a field study and simulation validation.Ergonomics, 54(10):932–942, 2011. PMID: 21973004.
[27] E.B. Goldstein. Sensation and Perception. Available Titles CengageNOWSeries. Wadsworth-Thomson Learning, 2002.
[28] H. P Rang, M. M. Dale, J. M Ritter, and P. K. Moore. Pharmacology,page 163. Edinburgh ; New York : Churchill Livingstone, 5th ed edition,2003. Previous ed.: 1999.
[29] J. W. McLaren, J. C. Erie, and R. F. Brubaker. Computerized analysis ofpupillograms in studies of alertness. Investigative Ophthalmology & VisualScience, 33(3):671, 1992.
[30] G. J. Augustine D. Fitzpatrick W. C. Hall A.-S. LaMantia J. O. McNa-mara Purves, D. and L. E. White. Neuroscience. Sinauer Associates, 4edition, 2008.
[31] M H Kutila, M Jokela, T Makinen, J Viitanen, G Markkula, and T WVictor. Driver cognitive distraction detection: Feature estimation and

58 BIBLIOGRAPHY
implementation. Proceedings of the Institution of Mechanical Engineers,Part D: Journal of Automobile Engineering, 221(9):1027–1040, 2007.
[32] C. J. D. Patten, A. Kircher, J Ostlund, L. Nilsson, and O. Svenson.Driver experience and cognitive workload in different traffic environments.Accident Analysis & Prevention, 38(5):887 – 894, 2006.
[33] Jie Xu, Yang Wang, Fang Chen, and Eric Choi. Pupillary Response BasedCognitive Workload Measurement under Luminance Changes, pages 178–185. Springer Berlin Heidelberg, Berlin, Heidelberg, 2011.
[34] W. Wang, Z. Li, Y. Wang, and F. Chen. Indexing cognitive workloadbased on pupillary response under luminance and emotional changes. InProceedings of the 2013 International Conference on Intelligent User In-terfaces, IUI ’13, pages 247–256, New York, NY, USA, 2013. ACM.
[35] T. de Greef, Harmen Lafeber, Herre van Oostendorp, and Jasper Lin-denberg. Eye Movement as Indicators of Mental Workload to TriggerAdaptive Automation, pages 219–228. Springer Berlin Heidelberg, Berlin,Heidelberg, 2009.
[36] M. Qian*, M. Aguilar, K. N. Zachery, C. Privitera, S. Klein, T. Car-ney, and L. W. Nolte. Decision-level fusion of eeg and pupil features forsingle-trial visual detection analysis. IEEE Transactions on BiomedicalEngineering, 56(7):1929–1937, July 2009.
[37] U. Ahlstrom and F. J. Friedman-Berg. Using eye movement activity asa correlate of cognitive workload. International Journal of Industrial Er-gonomics, 36(7):623 – 636, 2006.
[38] F. Di Nocera, M. Camilli, and M. Terenzi. Using the distribution of eyefixations to assess pilots’ mental workload. Proceedings of the HumanFactors and Ergonomics Society Annual Meeting, 50(1):63–65, 2006.
[39] K. F. Van Orden, W. Limbert, S. Makeig, and T.-P. Jung. Eye activitycorrelates of workload during a visuospatial memory task. Human Factors,43(1):111–121, 2001. PMID: 11474756.
[40] C. Berka, D. J. Levendowski, C. K. Ramsey, G. Davis, M. N. Lumicao,K. Stanney, L. Reeves, S. H. Regli, P. D. Tremoulet, and K. Stibler.Evaluation of an eeg workload model in an aegis simulation environment,2005.
[41] G. Gratton, M. G. H. Coles, and E. Donchin. Optimizing the use ofinformation: Strategic control of activation of responses. Journal of Ex-perimental Psychology: General, 121(4):480–506, 12 1992.

BIBLIOGRAPHY 59
[42] J. Arndt, A. Schuler, and K. Scheiter. Text–picture integration: How de-layed testing moderates recognition of pictorial information in multimedialearning. Applied Cognitive Psychology, 29(5):702–712, 2015. ACP-15-0022.R2.
[43] A. Schuler, J. Arndt, and K. Scheiter. Processing multimedia material:Does integration of text and pictures result in a single or two intercon-nected mental representations? Learning and Instruction, 35:62 – 72,2015.
[44] A. E. Kramer. Physiological metrics of mental workload: A review ofrecent progress, 1990.
[45] D. Kahneman. Attention and Effort. Prentice Hall, 1973.
[46] S. P. Marshall. Method and apparatus for eye tracking and monitoringpipil dilation to evaluate cognitive activity, 07 2000.
[47] D. L. Donoho and J. M. Johnstone. Ideal spatial adaptation by waveletshrinkage. Biometrika, 81(3):425, 1994.
[48] W. H. Press, S. A. Teukolsky, W. T. Vetterling, and B. P. Flannery. Nu-merical Recipes 3rd Edition: The Art of Scientific Computing. CambridgeUniversity Press, New York, NY, USA, 3 edition, 2007.
[49] S. P. Marshall. The index of cognitive activity: measuring cognitive work-load. In Proceedings of the IEEE 7th Conference on Human Factors andPower Plants, pages 7–5–7–9, 2002.
[50] G. Kasneci and T. Gottron. Licon: A linear weighting scheme for thecontribution ofinput variables in deep artificial neural networks. In Pro-ceedings of the 25th ACM International on Conference on Informationand Knowledge Management, pages 45–54. ACM, 2016.
[51] O. Lowenstein and I. E. Loewenfeld. The sleep-waking cycle and pupillaryactivity. Annals of the New York Academy of Sciences, 117(1):142–156,1964.

60 BIBLIOGRAPHY

Selbstandigkeitserklarung
Hiermit versichere ich, dass ich die vorliegende Masterarbeit selbstandig undnur mit den angegebenen Hilfsmitteln angefertigt habe und dass alle Stellen,die dem Wortlaut oder dem Sinne nach anderen Werken entnommen sind,durch Angaben von Quellen als Entlehnung kenntlich gemacht worden sind.Diese Masterarbeit wurde in gleicher oder ahnlicher Form in keinem anderenStudiengang als Prufungsleistung vorgelegt.
Ort, Datum Unterschrift
Related Documents