THESIS SUBMITTED IN THE PARTIAL FULFILLMENT OF THE REQUIREMENT FOR THE AWARD OF THE DEGREE OF MASTER OF CIVIL ENGINEERING IN SOIL MECHANICS AND FOUNDATION ENGINEERING. By Kunal Sarkar EXAM ROLL NO- M4CIV10-01. Under The guidance of DR. S. GHOSH. Prof. of Civil Engg. DR. S.N. MUKHERJEE. Prof. Civil Engg. Department of Civil Engineering Faculty of Engineering & Technology Jadavpur University Kolkata-700032 2010

Welcome message from author
This document is posted to help you gain knowledge. Please leave a comment to let me know what you think about it! Share it to your friends and learn new things together.
Transcript
THESIS SUBMITTED IN THE PARTIAL FULFILLMENT OF THE REQUIREMENT FOR THE AWARD OF THE DEGREE
OF
MASTER OF CIVIL ENGINEERING
IN SOIL MECHANICS AND FOUNDATION ENGINEERING.
By
Kunal Sarkar
EXAM ROLL NO- M4CIV10-01.
Under The guidance of
DR. S. GHOSH.
Prof. of Civil Engg.
DR. S.N. MUKHERJEE. Prof. Civil Engg.
Department of Civil Engineering Faculty of Engineering & Technology
Jadavpur University Kolkata-700032
2010
Department of Civil Engineering Faculty of Engineering & Technology
Jadavpur University
CERTIFICATE OF APPROVAL*
The foregoing thesis is hereby approved as a creditable study of an
engineering subject carried out and presented in a manner satisfactory to
warrant its acceptance as a pre-requisite to the degree for which it has been
submitted. It is understood that by this approval the undersigned do not
necessarily endorse or approve any statement made, opinion expressed or
conclusion drawn therein, but approve the thesis only for the purpose for
which it is submitted.
FINAL EXAMINATION FOR 1.
EVALUATION OF THESIS
2.
3.
(Signatures of Examiners)
*Only in case the thesis is approved.
Department of Civil Engineering Faculty of Engineering & Technology
Jadavpur University
Certificate
We hereby recommend that the thesis prepared under our supervision by
Sri Kunal Sarkar, entitled “Laboratory and Field test Evaluation Clay liner
materials(with and without amendment), and synthetic materials for
chrome tannery sludge disposal system”can be accepted in partial
fulfillment of the requirement for the Degree of Master of Civil Engineering
in Soil Mechanics & Foundation Engineering from Jadavpur University.
In-Charge of Thesis:
Countersigned:
Head of the Department:
(Civil Engineering Department)
Dean:
(Faculty of Engineering & Technology
Department of Civil Engineering Faculty of Engineering & Technology
Jadavpur University
ACKNOWLEDGEMENTACKNOWLEDGEMENTACKNOWLEDGEMENTACKNOWLEDGEMENT
I am extremely thankful and indebted to Prof. S. Ghosh and Prof. S.N. Mukherjee of
Civil Engineering Department, Jadavpur University, for their valuable guidance,
constant support and encouragement throughout my thesis work.
I am extremely grateful to Prof. S. Chakraborti, Head, Civil Engineering Department as
a source of constant encouragement and continuous valuable suggestions throughout
the work. Again, I am indebted to Prof. (Dr.) S. P. Mukherjee Section-in-Charge, Soil
Mechanics & Foundation Engineering Division for his constant moral support.
I also sincerely thanks to Prof. R. B. Sahu, Prof. P. Bhattacharya, Prof. G. Bhandari, Prof.
P. Aitch and Prof. S. K. Biswas for their constant support for my thesis work.
I sincerely acknowledge the help of Mr. Rabin Pal, Mr. Apurba Banerjee and Mr. Ranjit
Kusari, Laboratory Technical staffs and Mr. Rajesh Sardar and Mr. Brindaban Naskar,
Project attendant and other laboratory attendant of soil Mechanics laboratory of Civil
Engineering Department, Jadavpur University, Kolkata. Thanks to all other teachers &
Staffs of Civil Engineering Department for their kind co-operation.
Last but not the least, I express my sincere gratitude to all of my friends, Soil Mechanics
and Foundation Engineering section, Civil Engineering Department, for being with me
in the hard time that was needed to complete this thesis.
Kolkata Date:
.
………………………………………… Kunal Sarkar
(ROLL NO – 000810402001). EXAM. ROLL NO : M4CIV- 10-01.
DEPARTMENT OF CIVIL ENGINEERING. FACULTY OF ENGINEERING &TECHNOLOGY.
JADAVPUR UNIVERSITY
CONTENTS
Page No.
CHAPTER-1: Introduction……………………………………...........1-4
CHAPTER-2: Review of literature and waste generation in
tanneries…………………………………. …………………………… 5-42
CHAPTER-3: Theoretical consideration of metal adsorption…….43-45
CHAPTER-4: Objective of the study, scope of work
..…………………………………..….46-47
CHAPTER-5: Test Programme and experimental procedure….…48-66
CHAPTER-6: Test results Graphs and
Discussions………………..………..67-157
CHAPTER-7: Conclusions……………………………………………158-159
Chapter-8 : Scope for future work…………………………..160
REFERENCES…………………………………………………………161-164
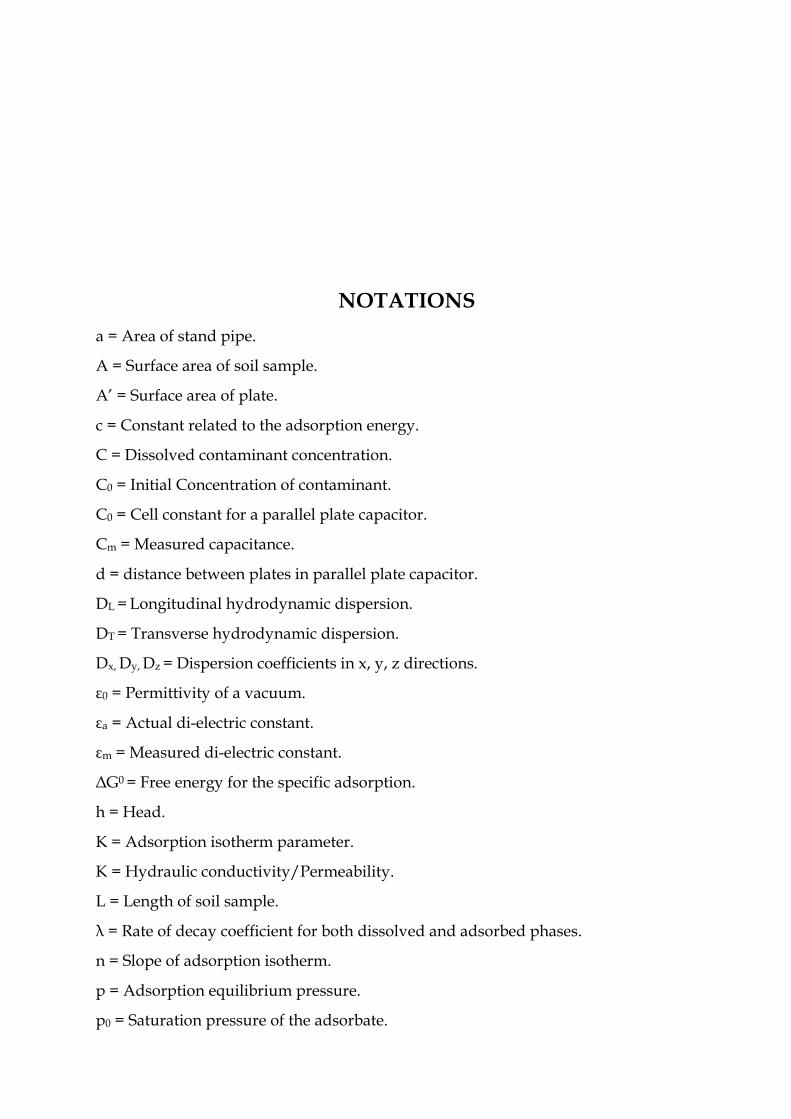
NOTATIONS
a = Area of stand pipe.
A = Surface area of soil sample.
A’ = Surface area of plate.
c = Constant related to the adsorption energy.
C = Dissolved contaminant concentration.
C0 = Initial Concentration of contaminant.
C0 = Cell constant for a parallel plate capacitor.
Cm = Measured capacitance.
d = distance between plates in parallel plate capacitor.
DL = Longitudinal hydrodynamic dispersion.
DT = Transverse hydrodynamic dispersion.
Dx, Dy, Dz = Dispersion coefficients in x, y, z directions.
ε0 = Permittivity of a vacuum.
εa = Actual di-electric constant.
εm = Measured di-electric constant.
∆G0 = Free energy for the specific adsorption.
h = Head.
K = Adsorption isotherm parameter.
K = Hydraulic conductivity/Permeability.
L = Length of soil sample.
λ = Rate of decay coefficient for both dissolved and adsorbed phases.
n = Slope of adsorption isotherm.
p = Adsorption equilibrium pressure.
p0 = Saturation pressure of the adsorbate.
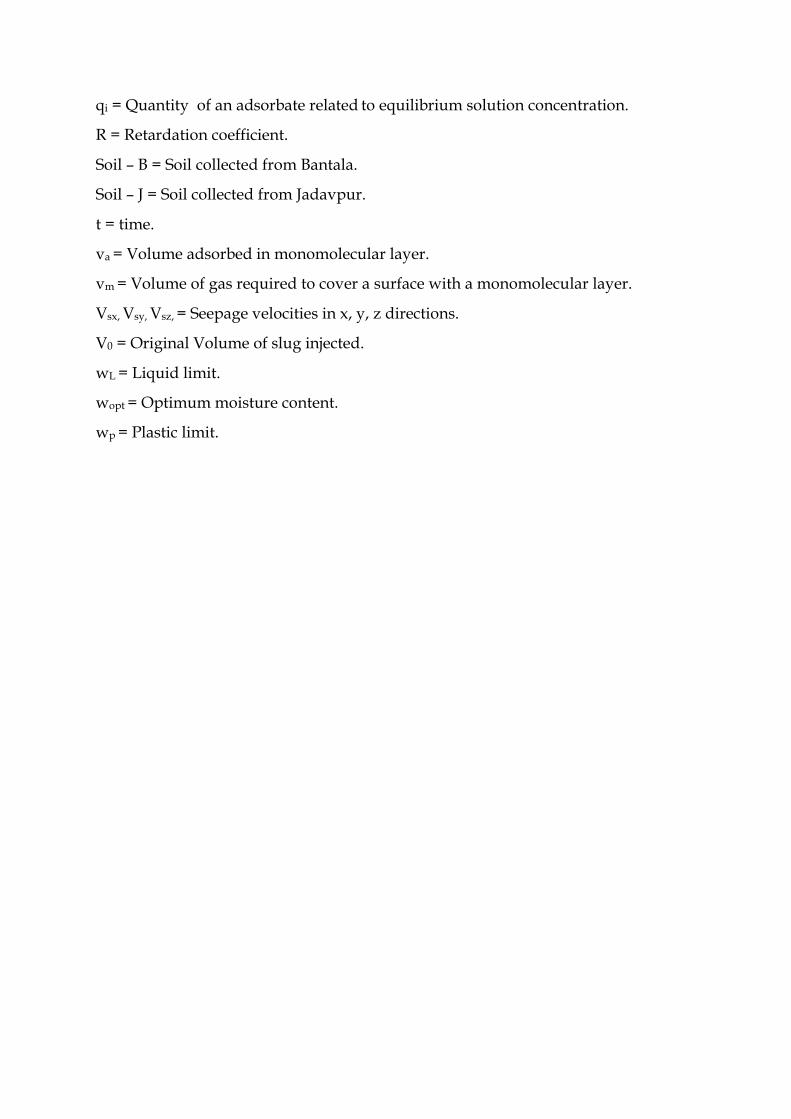
qi = Quantity of an adsorbate related to equilibrium solution concentration.
R = Retardation coefficient.
Soil – B = Soil collected from Bantala.
Soil – J = Soil collected from Jadavpur.
t = time.
va = Volume adsorbed in monomolecular layer.
vm = Volume of gas required to cover a surface with a monomolecular layer.
Vsx, Vsy, Vsz, = Seepage velocities in x, y, z directions.
V0 = Original Volume of slug injected.
wL = Liquid limit.
wopt = Optimum moisture content.
wp = Plastic limit.
1
CHAPTER - 1
INTRODUCTION
Chromium is considered to be a toxic heavy metal generated from
various industries such as metallurgical, refractory, chemical pigments,
electroplating and tanning along with liquid or solid waste. The tanning
industry is a major contributor of chromium pollution in India. It is estimated
that in India alone, about 2000–3000 tones of chromium escape into
environment annually from the tanning industries, with chromium
concentration ranging between 2000 and 5000 mg/L in the effluent, compared
to the recommended permissible limit of 2 mg/L (Apte et. al. 2005).The
tannery process along with waste generated in the processes is given in Table-
A. Recently, installation of wastewater treatment plants in tanneries has
considerably reduced the chromium content of such effluents particularly
with the intention of recovery and reuse of yielded chromium. But, one of the
serious emerging environmental problems of the tanning industry still
remaining is the proper disposal of chromium-contaminated chemical sludge
which is produced as a bye product of wastewater treatment. As scientific
solid waste disposal practices are almost very few in India, large amount of
chromium-contaminated sludge is usually disposed in unlined and ill-
maintained solid waste dumping grounds/landfills. So the fate of chromium
in such disposal sites is a cause of grave ongoing concern owing to leaching
under favorable condition.
Ground water is one of the primary drinking water sources for rural
life and also in some of the urban peri-urban interfaces. The agriculture, small
scale industries also use subsurface water in many places. From such above
mentioned waste disposal sites, the soil and subsurface water pollution of
adjacent areas takes place continuously, due to migration of chromium
through sub soil water.
2
The movement of leachate containing toxic chromium metal (Cr6+)
which comes in direct contact with the soil matrix becomes a complex
phenomenon and gives rise to a major geo-environmental problem. Solute
transport mechanism of such pollutant through groundwater is an important
aspect in the design of protective measure for preventing ground water
pollution and also for land contamination. Sub surface including soil ground
water environment in a waste disposal site is one of the major concerning area
of human settlement.
Chromium in soils potentially occurs in the trivalent (+3 chromic) or
hexavalent (+6 chromate) oxidation states under natural environmental
condition. The hexavalent state of chromium, Cr (VI), is highly toxic and a
human mutagenic. The trivalent state of chromium, Cr (III), is much less toxic
than Cr (VI). Soil composition (electron donor availability, soil texture,
competing ions, adsorption capabilities, etc.) and conditions in the soil (pH,
moisture content, temperature, and the presence of vegetation) are the
principal factors affecting the adsorption, leachability and mobility of
chromium (Zachara et al., 1989; Hanson et al., 1993; James, 1994; Milacic and
Stupar, 1995; Chen and Hao, 1996). It is identified that electron donors (i.e.
natural reductants) such as Fe (II), ferrous iron mineral and organic matter are
present in soil. They can transform the more toxic hexavalent chromium to the
less toxic trivalent form. The availability of Cr (III) in soil solution is limited
by the formation of hydroxides as Cr (OH)3 & Cr2O3(H2O) or by co-
precipitation with Fe, forming (Crx, Fe1-x) (OH)3, (Crx, Fe1-x) OOH and Fex, Cr2x
O3. Bichromate can react with soil organic carbon according to 2Cr2O72- + 3Co
+ 16 H+→ 4Cr3+ + 3CO2 + 8H2O and the Cr3+ may hydrolyze and precipitate
as Cr – oxides or it may bind to the remaining soil organic matter. Such
natural attenuation of hexavalent chromium is of great interest .
The literatures entail that clay can be used as a liner material for
containment of heavy metals generated in leachates. Compacted clay liners
are widely used as hydraulic barriers in waste-containment facilities. To be an
3
effective, soil lining system should have low hydraulic conductivity, which in
many cases is considered to be less than 1 x 10 -7 cm/s (Benson et al 1994). In
recent years, guidelines have been compiled for selecting appropriate soil
properties and compaction methods resulting in low hydraulic conductivity
(Gordon et al. 1984; Daniel 1990). Researchers have found that natural
reductants (Fe, organic matter) present in soil can transform Cr (VI) to less
toxic Cr (III) and thereby resulting in the natural attenuation capacity of clay
(Blowes et al 1997, Jardine et al 1999, Kozuh et al 2000).
At present geosynthetic clay liner (GCL), Geomembranes(GM) are also being
considered as a replacement of clay liners.GCL may be used in conjunction
with GMS as a part of double composite liners separated by a secondary
leachate collection system in Municipal solid waste landfills. GCL’s are
manufactured by sandwiching a uniform layer of dry bentonite between two
geotextiles or attached to a synthetic membrane with an adhesive.GCL
maintains a hydraulic conductivity of 1* 10-7 cm/s or less. GCL can withstand
a large distortions and large tensile strains without undergoing significant
change in hydraulic conductivity.
Geomembrane liners have very low and are used to control fluid migrations
in landfills. Two commonly used GM types are polyethylene(PE) and
polyvinyl chrolide(PVC).
The impact of chromium on human health and the environment
require an evaluation of the potential risk of chromium entering the
groundwater flow system and transportation of the same beyond its
compliance boundaries. So in this present condition a proper contaminant
barrier system is to be assessed to reduce chromium pollution through fine
grained soil by retarding flow of leachate containing chromium generated at
dumping sites of the tannery wastes.
In this context there is a need to design a properly compacted clay liner
for the containment of the waste at disposal sites/landfills so that leachate
4
generated from that source, containing appreciable amount of chromium, can
be retarded while migrating through fine grained soil. Very few studies have
been carried out in this context in performance of the clay liner for reduction
of chromium pollution through fine grained soil. (Avudainayagam et al,
2006). Some works have been reported on GCL and Geomembranes recently.
So keeping this in view, the present study was undertaken with the objective
to asses the suitability of different types of liners such as (a) geosynthetic clay
liners,(b) geomembranes and (c) clayey soil samples are to be collected from
different areas of plant and neighboring areas for using as a liner material in a
landfill near tannery waste disposal site to prevent chromium contamination
in the surrounding lithospheric environment with the hypothesis that the soil
to be used possess good chromium attenuation capacity. This study has also
assessed the performance of clayey soils with various amendments (such as
fly-ash, bentonite, and rice husk) in chromium decontamination/containment.
Leather Complex at Bantala in South 24 Paraganas district of West
Bengal is considered as proposed site for the present investigation. Soil was
also collected from near Darshan Bhavan, in Jadavpur University Campus,
Kolkata.
5
CHAPTER - 2
REVIEW OF LITERATURE
A limited number of research works have been carried out by different
investigators in the recent past to understand the effectiveness of clayey soil &
other geosynthetic materials to be used as a liner material in landfill as well as
to explore scientifically adsorption phenomenon of chromium by these
materials. Some works were reported on immobilization / containment of
chromium with addition of different admixtures to the soil. A few of them are
described below in the relevant discussion.
A competent liner made of compacted clay is normally expected to fulfill the
following requirements:
1. Hydraulic conductivity of the compacted clay liner should be 1 x 10 -7 cm /s
or less.
2. There should not be any presence of shrinkage cracks due to desiccation in
compacted clay.
3 Clods should not be present in the compacted clay.
4. Compacted clay liner should have adequate strength for stability under
compressive loads as well as along side slopes.
5. There should be minimal influence of leachate on hydraulic conductivity.
6. The soil to be used as a liner material should possess good natural
attenuation capacity of chromium.
7. There should be presence of natural reductants i.e. electron donors like
Fe (II), ferrous iron mineral and organic matter which can control the mobility
of chromium.
6
Geosynthetic clay liners (GCL) should have the following requirements(Rowe
2005):
1. The geosynthetics should be prehydrated with water for getting lower
hydraulic conductivity.
2. Whenever possible real leachates should be used as simulated and real
leachates behave differently.
3. Laboratory test should continue to a large number of pore volumes (15 for
strong acids and bases) to achieve full breakthrough of key chemical
constituents.
4. Foundation layer underlying the GCL should have higher initial water
content for lesser desiccation.
5. Higher the overburden stress at the time of GCL hydration, lesser is the risk
of desiccation.
Geomembranes should have the following requirements ( as per US
Environment Agency):
1. Geomembranes must be deployed without tension
2. Pressures on the Geomembranes must be less than 55 kPa (8 psi.)
3. Geomembrane (not ambient) temperature must be specified
4. Geomembranes should be just taut at minimum service temperature or
covering temperature
5. Scratching of Geomembranes should be avoided as (through dragging and
so on) as even shallow scratches can initiate stress cracks.
6. Ensure Geomembranes are ballasted against wind uplift
7. Place no horizontal seams on slopes
8. Seaming should be avoided in corners.
7
9. Over grinding of Geomembranes should be avoided.
10. After completely installing any section of geomembrane liner cover the
section immideatly with a layer of suitable material to protect it against
damage
2.1: Studies on effectiveness of clayey soil to be used as liner material in
landfills:
2.1.1: Benson et al. (1994) exhibited a database containing laboratory
measurements of hydraulic conductivity and associated soil properties which
were extracted from construction reports for compacted soil liners from 67
numbers of different landfills in North America. This database was used to
evaluate relationships between hydraulic conductivity, compositional factors,
and compaction variables and to identify minimum values for soil properties
that are likely to yield a hydraulic conductivity <1x10 -7 cm/s. A graphical
analysis suggested that a geometric mean hydraulic conductivity <1 x 10 -7
cm/s can be achieved if the liquid limit ≥ 20%, the plasticity index ≥ 7%, the
percent fines (<No. 200 sieve) ≥ 30%, and the percent clay (<2 µm) ≥ 15%. A
multivariate regression equation was also developed that can be used to
8
estimate the hydraulic conductivity as a function of soil composition and
compaction conditions.
2.1.2: Kaya et al. (1997) investigated the possibility of using dielectric constant
and electrical conductivity to characterize and identify contaminated fine
grained soils. To investigate the usefulness of the preceding concept, the di-
electric constant and the electrical conductivity of kaolinite, bentonite and a
local soil were determined at various ion concentrations, organic liquids, and
moisture content. They concluded that both di-electric constant and electrical
conductivity of soil-fluid system were mainly controlled by properties of
pore fluid as given and characterization and identification of contaminated
soils may be accomplished by monitoring both di-electric constant and
conductivity of the subsurface.
2.1.3: Kim et al. (1997) conducted a series of column and tank test using
bromide as source solution to estimate effective porosity and seepage velocity
through compacted clay. The effective porosity of the soil specimens was
found to be in the range between 89 to 104%. The seepage velocity estimated
from effective porosity as well as total porosity was almost same and did not
show any significant impact on the estimated transport parameters. The
parameter estimated from breakthrough curve data from column/tank tests
appeared to be reasonable. The hydro dynamic dispersion co-efficient was
found to have a linear relationship with seepage velocity. They recommended
that in evaluating the transport parameters (i.e. retardation factor,
hydrodynamic dispersion coefficient seepage velocity etc.) pertaining to the
contaminant movement through soil liner, a tracer test should be conducted
for correct estimation of the seepage velocity.
9
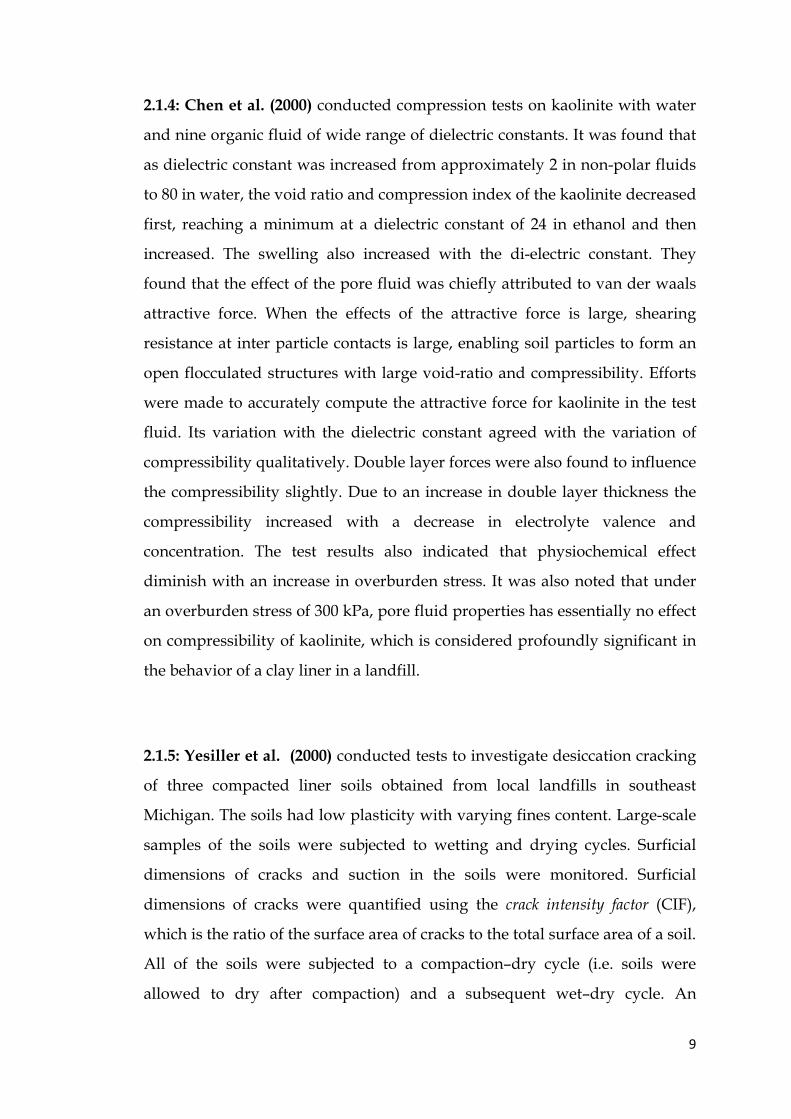
2.1.4: Chen et al. (2000) conducted compression tests on kaolinite with water
and nine organic fluid of wide range of dielectric constants. It was found that
as dielectric constant was increased from approximately 2 in non-polar fluids
to 80 in water, the void ratio and compression index of the kaolinite decreased
first, reaching a minimum at a dielectric constant of 24 in ethanol and then
increased. The swelling also increased with the di-electric constant. They
found that the effect of the pore fluid was chiefly attributed to van der waals
attractive force. When the effects of the attractive force is large, shearing
resistance at inter particle contacts is large, enabling soil particles to form an
open flocculated structures with large void-ratio and compressibility. Efforts
were made to accurately compute the attractive force for kaolinite in the test
fluid. Its variation with the dielectric constant agreed with the variation of
compressibility qualitatively. Double layer forces were also found to influence
the compressibility slightly. Due to an increase in double layer thickness the
compressibility increased with a decrease in electrolyte valence and
concentration. The test results also indicated that physiochemical effect
diminish with an increase in overburden stress. It was also noted that under
an overburden stress of 300 kPa, pore fluid properties has essentially no effect
on compressibility of kaolinite, which is considered profoundly significant in
the behavior of a clay liner in a landfill.
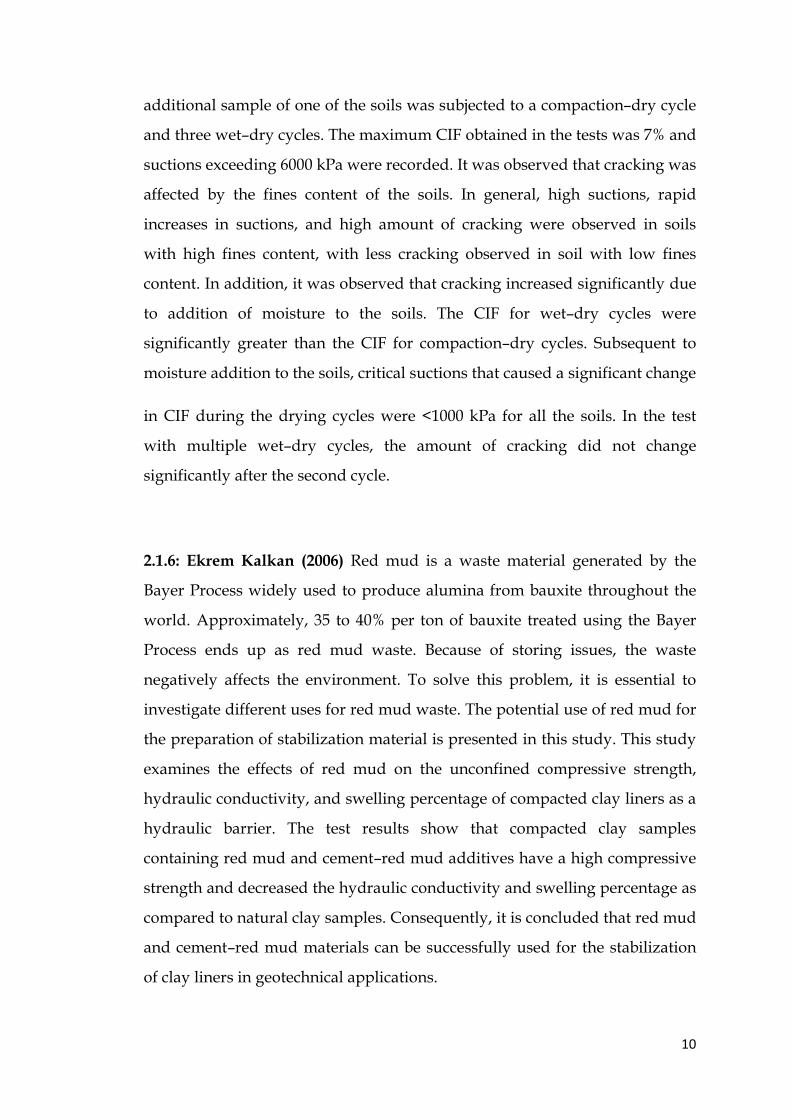
2.1.5: Yesiller et al. (2000) conducted tests to investigate desiccation cracking
of three compacted liner soils obtained from local landfills in southeast
Michigan. The soils had low plasticity with varying fines content. Large-scale
samples of the soils were subjected to wetting and drying cycles. Surficial
dimensions of cracks and suction in the soils were monitored. Surficial
dimensions of cracks were quantified using the crack intensity factor (CIF),
which is the ratio of the surface area of cracks to the total surface area of a soil.
All of the soils were subjected to a compaction–dry cycle (i.e. soils were
allowed to dry after compaction) and a subsequent wet–dry cycle. An
10
additional sample of one of the soils was subjected to a compaction–dry cycle
and three wet–dry cycles. The maximum CIF obtained in the tests was 7% and
suctions exceeding 6000 kPa were recorded. It was observed that cracking was
affected by the fines content of the soils. In general, high suctions, rapid
increases in suctions, and high amount of cracking were observed in soils
with high fines content, with less cracking observed in soil with low fines
content. In addition, it was observed that cracking increased significantly due
to addition of moisture to the soils. The CIF for wet–dry cycles were
significantly greater than the CIF for compaction–dry cycles. Subsequent to
moisture addition to the soils, critical suctions that caused a significant change
in CIF during the drying cycles were <1000 kPa for all the soils. In the test
with multiple wet–dry cycles, the amount of cracking did not change
significantly after the second cycle.
2.1.6: Ekrem Kalkan (2006) Red mud is a waste material generated by the
Bayer Process widely used to produce alumina from bauxite throughout the
world. Approximately, 35 to 40% per ton of bauxite treated using the Bayer
Process ends up as red mud waste. Because of storing issues, the waste
negatively affects the environment. To solve this problem, it is essential to
investigate different uses for red mud waste. The potential use of red mud for
the preparation of stabilization material is presented in this study. This study
examines the effects of red mud on the unconfined compressive strength,
hydraulic conductivity, and swelling percentage of compacted clay liners as a
hydraulic barrier. The test results show that compacted clay samples
containing red mud and cement–red mud additives have a high compressive
strength and decreased the hydraulic conductivity and swelling percentage as
compared to natural clay samples. Consequently, it is concluded that red mud
and cement–red mud materials can be successfully used for the stabilization
of clay liners in geotechnical applications.
11
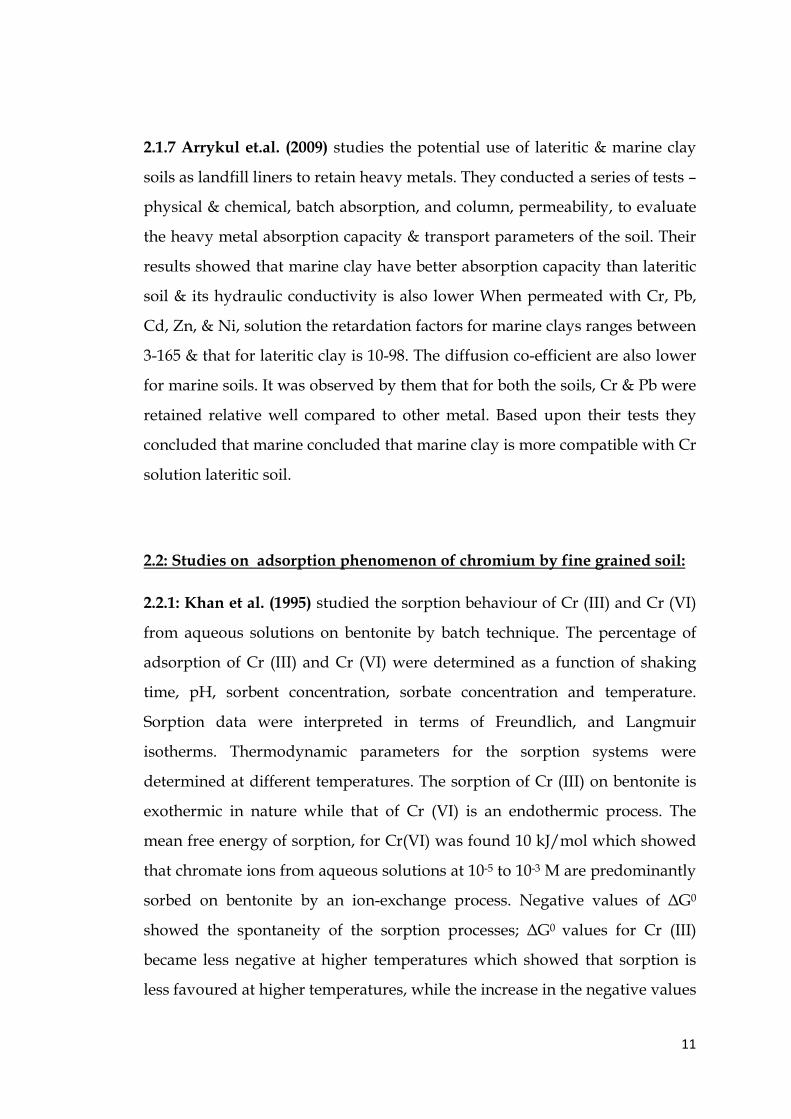
2.1.7 Arrykul et.al. (2009) studies the potential use of lateritic & marine clay
soils as landfill liners to retain heavy metals. They conducted a series of tests –
physical & chemical, batch absorption, and column, permeability, to evaluate
the heavy metal absorption capacity & transport parameters of the soil. Their
results showed that marine clay have better absorption capacity than lateritic
soil & its hydraulic conductivity is also lower When permeated with Cr, Pb,
Cd, Zn, & Ni, solution the retardation factors for marine clays ranges between
3-165 & that for lateritic clay is 10-98. The diffusion co-efficient are also lower
for marine soils. It was observed by them that for both the soils, Cr & Pb were
retained relative well compared to other metal. Based upon their tests they
concluded that marine concluded that marine clay is more compatible with Cr
solution lateritic soil.
2.2: Studies on adsorption phenomenon of chromium by fine grained soil:
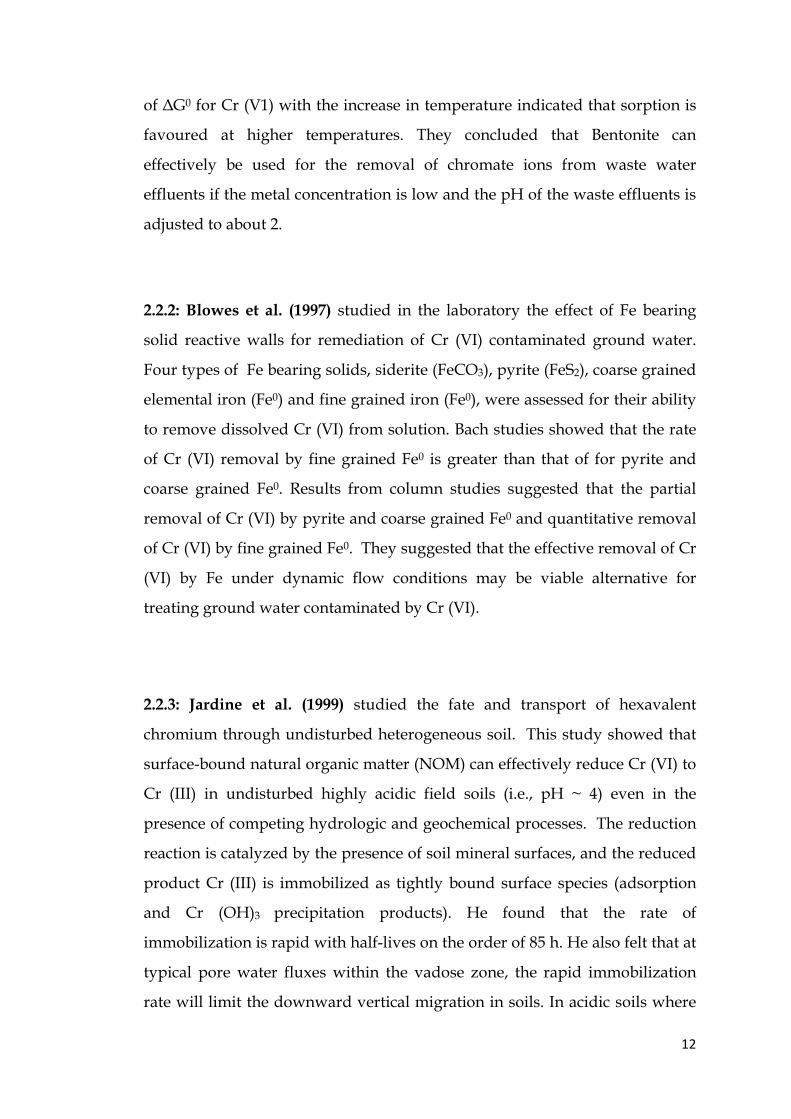
2.2.1: Khan et al. (1995) studied the sorption behaviour of Cr (III) and Cr (VI)
from aqueous solutions on bentonite by batch technique. The percentage of
adsorption of Cr (III) and Cr (VI) were determined as a function of shaking
time, pH, sorbent concentration, sorbate concentration and temperature.
Sorption data were interpreted in terms of Freundlich, and Langmuir
isotherms. Thermodynamic parameters for the sorption systems were
determined at different temperatures. The sorption of Cr (III) on bentonite is
exothermic in nature while that of Cr (VI) is an endothermic process. The
mean free energy of sorption, for Cr(VI) was found 10 kJ/mol which showed
that chromate ions from aqueous solutions at 10-5 to 10-3 M are predominantly
sorbed on bentonite by an ion-exchange process. Negative values of ∆G0
showed the spontaneity of the sorption processes; ∆G0 values for Cr (III)
became less negative at higher temperatures which showed that sorption is
less favoured at higher temperatures, while the increase in the negative values
12
of ∆G0 for Cr (V1) with the increase in temperature indicated that sorption is
favoured at higher temperatures. They concluded that Bentonite can
effectively be used for the removal of chromate ions from waste water
effluents if the metal concentration is low and the pH of the waste effluents is
adjusted to about 2.
2.2.2: Blowes et al. (1997) studied in the laboratory the effect of Fe bearing
solid reactive walls for remediation of Cr (VI) contaminated ground water.
Four types of Fe bearing solids, siderite (FeCO3), pyrite (FeS2), coarse grained
elemental iron (Fe0) and fine grained iron (Fe0), were assessed for their ability
to remove dissolved Cr (VI) from solution. Bach studies showed that the rate
of Cr (VI) removal by fine grained Fe0 is greater than that of for pyrite and
coarse grained Fe0. Results from column studies suggested that the partial
removal of Cr (VI) by pyrite and coarse grained Fe0 and quantitative removal
of Cr (VI) by fine grained Fe0. They suggested that the effective removal of Cr
(VI) by Fe under dynamic flow conditions may be viable alternative for
treating ground water contaminated by Cr (VI).
2.2.3: Jardine et al. (1999) studied the fate and transport of hexavalent
chromium through undisturbed heterogeneous soil. This study showed that
surface-bound natural organic matter (NOM) can effectively reduce Cr (VI) to
Cr (III) in undisturbed highly acidic field soils (i.e., pH ~ 4) even in the
presence of competing hydrologic and geochemical processes. The reduction
reaction is catalyzed by the presence of soil mineral surfaces, and the reduced
product Cr (III) is immobilized as tightly bound surface species (adsorption
and Cr (OH)3 precipitation products). He found that the rate of
immobilization is rapid with half-lives on the order of 85 h. He also felt that at
typical pore water fluxes within the vadose zone, the rapid immobilization
rate will limit the downward vertical migration in soils. In acidic soils where
13
the pH is 4, the availability of even small amounts of surface-bound NOM
(0.05% w/w on the solid) along soil flow paths can dramatically impede the
mobility of Cr (VI) in the environment. Organic amendments to Cr (VI)-
contaminated acidic soils could easily be engineered into an effective remedial
strategy targeted at Cr immobilization.
2.2.4: Kozuh et al. (2000) studied the kinetics of reduction and oxidation of
soluble chromium in various soils at constant soil moisture and constant
temperature. A total of 1500 g each of four moist soils (clay, peat, sand, and
cambisols) was mixed with 200 cm3 of an appropriate amount of aqueous
solution of CrCl3 or K2Cr2O7, such that the final concentrations of added
chromium in these soils were between 1.0 and 1000 µgg-1. Duplicate samples
were mixed using a plastic-coated metal mechanical stirring device to obtain a
homogeneous thick paste. The latter was placed in a 2.0 dm3 shallow plastic
container to achieve rapid evaporation of excess water and left at constant
temperature. The moisture of the soils was kept constant throughout the
experiment by periodical watering. The 2.00-g samples of moist soil were
taken for the determination of total exchangeable chromium and Cr (VI) over
a time span of 1-10 days after addition. The kinetics of the reduction of soluble
Cr (VI) added to the soil was studied in peat, clay, sand and combisols. The
concentration of added Cr (VI) were 1, 10, 25, and 50 µg (g of dry soil) -1 . The
reduction of soluble Cr (VI) was observed in all four soils investigated. The
decrease of the concentration of soluble Cr (VI) was rapid at the beginning (1-
3 days after application) and much slower in the following days. Possible
oxidation of soluble Cr (III) added to soils was studied in peat, sand, clay, and
the cambisols. A total of 10, 100, and 500 µg of Cr (III) (g of dry soil)-1 were
added to the soils, and oxidation was followed at constant moisture and
temperature over a period of up to 10 days. The parameters influencing the
reduction and oxidation of soluble chromium depends mostly on the content
of the electron donors [organic matter, Fe (II), HS-], manganese (IV) oxides,
14
and texture of the soil, as well as on the conditions in the soil, i.e., moisture,
pH, and temperature. Reduction of soluble chromium was observed in all the
soils examined. Up to 3 days of the experiment, the reaction was found to be
first order with respect to Cr (VI). Oxidation of soluble chromium was
observed especially in soils high in manganese (IV) oxides and low in organic
matter. Soils that were low in organic matter and high in manganese (IV)
oxides deserve special attention. These types of soil might be well able to
oxidize chromium despite the fact that this process was generally found to be
very slow. The results indicated that the oxidation and reduction of soluble
chromium added to soils depends on the soil structure and on the
reduction/oxidation conditions in the particular soil.
2.2.5: Bandyopadhyay et al. (2005) carried out laboratory study on the use of
clay-bed liner for investigation of chromium (Cr 6+) adsorption capacity of
clay from chrome-bearing liquid wastes. The study was conducted using
commercially available kaolin as adsorbent and synthetic solution of
potassium dichromate as adsorbate. The retention experiment was carried out
on a set-up specially devised to simulate column studies. The effluent samples
from the set-up were collected at definite intervals of time and analyzed for
various cations, (eg, Cr 6+, Na+, K +, Ca2+ and Mg2+). The plots for
concentration of Cr 6+ against cumulative volume of outflow resembled an S-
shaped break-through curve, representing retention of chromium by the bed
of kaolin. The permeability of the kaolin bed before the application of the
influent solution was 0.75 x 10 -5 cm/s and reached a higher value around 6.5
x 10 -5 cm/s immediately after application of influent solution. This rise in
permeability was mainly due to immediate wash-out of the fines upon
application of the feed solution. Then it was remain almost same through out
the experiment. Based on the findings, they concluded that the clay-bed has
considerable retention capacity for higher valency chromium ions. Hence, the
clay bed as liner can be effectively used as a potential barrier to the passage of

15
hexavalent chromium resulting in lesser permeation of this hazardous
material into the groundwater.
2.2.6: Ashraf et al. (2006) studied adsorption of heavy metals on glacial till soil
to determine the effect of surface potential, pH and ionic potential on the
adsorption of metal ions, hexavalent chromium Cr(VI), trivalent chromium
Cr(III), nickel Ni(II) and cadmium Cd(II). Batch tests were performed to
determine the effect of pH (2–12) and ionic strength (0.001–0.1 M KCl) on zeta
potential of the glacial till soil. The point of zero charge (pHPZC) of glacial till
was found to be 7.0±2.5. Surface charge experiments revealed high buffering
capacity of the glacial till. Batch adsorption experiments were conducted at
natural pH (8.2) using various concentrations of selected metals. The
adsorption data was described by the Freundlich adsorption model. The
models parameters of Ni(II), Cd(II), Cr(III), and Cr(VI) were given by him as:
log KF Ni(II) = 0.36±0.2, log KFCd(II) = 0.14±0.1, log KFCr(III) = 0.69±0.1, log KFCr(VI)
=1.15±0.05. Overall glacial till showed lower adsorption affinity to Cr (VI) as
compared to cationic metals, Cr (III), Ni (II) and Cd (II).
2.2.7: Banks et al. (2006) studied the impact of growing plants and
supplemental organic matter on chromium transport in soil. In this regard
Ashland soil was used, obtained from Kansas State University, Department of
Agronomy, North Agricultural Farm in Manhattan. Two soil treatments were
used: untreated Ashland soil and Ashland soil amended with 10 % (by
volume) composted cow manure. Prior to test all soils were amended with
low concentration and high concentration of K2Cr2O7. It was found that
concentration of chromium in leachates from the low organic matter columns
were consistently higher than in high organic matter column. The organic
matter reduced the Cr (VI) to Cr (III) and then negatively charged functional
16
groups associated with the organic constituents adsorbed the cationic
chromium, resulting in lower concentration in leachate. In both un-vegetated
columns and vegetated columns Cr content had no impact on moisture.
Root growth parameters were more useful as an indicator of chromium
concentration than shoot measurement. Maximum rooting depth and depth to
maximum root density were easily determined and provided partial
verification that the high Cr treatment resulted in phytotoxic effect.
Phytotoxicity of high chromium concentrations in soil would be a limitation
to the use of plants in the stabilization of Cr contaminated soil. They observed
that plants alone had no impact on the chromium oxidation state in soil.
Analyses of column leachate plant biomass, soil indicated that more
chromium leaching occurred in the vegetated, low organic columns.
2.2.8: Jayabalakrishnan et al. (2007) carried out laboratory batch experiment
to evaluate the adsorption of chromium Cr, on raw vermiculite which is
magnesium – aluminum – iron silicate with a suggested formula of (Mg, Fe+2,
Al) 3 (Al, Si) 4 O10 (OH) 2. 4H2O [1], of grades 1 to 5 as a function of solution
concentration onto raw vermiculites from Tamil Nadu Minerals Limited
(TAMIN) Chennai, India. The various vermiculite showed a rapid
instantaneous adsorption of Cr among which grade 2 removed 97.4% of Cr
from 250 mg/L of the equilibrium solution proved to be an efficient candidate
for the removal of chromium.
2.3: Studies on geotextiles, geomembranes
2.3.1:Petrov J.R.,Rowe et.al.(1997) studied the effects of different factors
affecting the GCL hydraulic conductivity. They performed a series of confined
swell & hydraulic conductivity tests on a needle punched geosynthetic clay
liner. The bulk soil used by them in the GCL contained 91% smectile & 9%
non clay minerals like quartz, feldspar ect. They found that the hydraulic
17
conductivity of GCL decreases with the increase in confining pressure. The
hydraulic conductivity decreases from
3.7 x 10 -9 cm/s to 6.4x 10 -9 cm/for low stress conciliations (3-4kpa) & from
7.1x10 -10 cm /s to
7.9x 10 -10 cm/s for high stress (109-117kpa) .
They also noted that the k value of GCL increases 2.5 to 3.5 times, than the k
value of unaltered GCL due to needle punching, but the needle punching is
highly effective for restricting the swelling of GCLS.
They also observed that the hydraulic conductivity of GCLS due to
permeation of tap water is
1.6x10 -7 cm/s but when ethanol is permeated it increases to 4.1x10 -7 cm/s.
2.3.2.: Didier Bouzza & Cazaux(2000) conducted a series of gas permeability
tests on partially saturated needle- punched GCLS, with nitrogen as the
permanent medium. The hydration procedure was found to have a strong
influence on gas permeability on GCL’S. For the range of overburden
pressure considered in that investigation, a reasonable linear relationship on a
linear log scale was observed between permeability & water content. It was
noted by them that the permeability of GCL decreased by 2 to 3 order for a
volumetric water content varying from 26- 66%. On the other hand the
variation of overburden pressure from 20- 80kpa was found to induce a
change of less than 1 order of magnitude in permeability of GCL. However
there is a well defined relationship between the permeability & air content.
They felt that size & shape of the gravel in the drainage layer immediately
18
above GCL does not affect the gas permeability very much unless it is
subjected to very high overburden pressure.
2.3.3 As per Zornberg, Adam, Bouzza (2002) there are various types of
geosynthetics which can be used in waste contaminant applications, & each
have a specific function, which are:
• Separation: The material is placed between 2 dissimilar
materials so that both material can function as per their
requirements
• Reinforcement: Provides tensile strength in materials which
lacks in tensile strength.
• Drainage: It transmit flow within the place of the structure.
• Hydraulic barrier: The geosynthetic material can be relatively
imperious & its sole function is to contain liquids or gases.
2.4.4: Jamieson, Rowe & Lange (2005) studied the attenuation of heavy metals
by Geosynthetic clay liners. They studied the migration of selected metals
(AI,Fe,Mr,Ni,Pb,Cu,Cd,Zn) by using continuous flow permeameters &
diffusion testing in of a municipal solid waste leachate & acid mine drainage
solution. They measured the ability of GCL to attenuate metals by monitoring
aqueous solutions before & after the experiment & by bulk analysis of GCL
itself. Delayed breakthrough times & material analysis obtained by them
showed the evidence of metal attenuation. The result obtained by them in
case of diffusion cell MSW after 30 days showed that the metal retention is
highest in case of cu & was nearly 98%. The mass retained by GCLS in case of
Ni,Pb, & Zn were 78%, 96%, & 89% respectively.
19
2.4: Studies on the use of admixtures (bentonite, fly ash rice husk etc.) in
chromium containment/decontamination:
2.4.1Chakir et.al.(2001) has studied the removal of Cr3+ from aqueous
solutions using bentonite and activated perlite. Perlite is an inert glassy
volcanic ryholitic rock which will expand when quickly heatedto above 870
◦C. It expands up to 20 times its original volume. It contains greater than 70%
silica, and are highly adsorptive. According to them bentonite have large
specific area ,cation exchange capacity adsorptive capacity due to which they
are very effective in decontamination of high level heavy metal wastes. From
kinetic study it has been seen by them that the uptake of Cr(III) by bentonite
is very rapid compared to expanded perlite. They have calculated the
sorption capacities of the two sorbents, at different pH, and has fitted the
experimental data points to the Freundlich and Langmuir models,
respectively, both for bentonite and expanded perlite They have observed
that the removal of Cr3+ from aqueous solutions is more effective in case of
bentonite(95%) but less in case of perlite(40-50%)
2.4.2.Dermatos and Meng (2003) has studied the use of fly ash waste
materials along with quick lime to immobilize trivalent and hexavalent
chromium present in artificially contaminated clayey soils. They have
evaluated the degree of metal immobilization by using Toxicity
Characteristics Leaching Procedure(TCLP) and also by well controlled
extraction equipments. Their main objectives are:
• To immobilize Cr3+ and Cr6+ within a solidified matrix and to satisfy
the final product as per EPA regulations.
• Investigate the scope for re-use of the treated final product.
• Elucidate the mechanisms controlling heavy metal immobilization in
treated solid.
20
So to fulfill the above objectives they had make a contaminated soil mixtures
and has stabilized it with quicklime ,sodium sulphate decahydrate and fly
ash.
They have studied leaching test results along with XRD and SEM analyses
and suggested that the controlling mechanism for Cr6+ is surface adsorption
whereas for Cr3+ is hydroxide precipitation. They have concluded that
addition of quicklime and fly-ash has reduced heavy metal leachability below
the regulation limits. It has been seen by them that addition of fly ash has
improved the stress- strain characteristics of treated solids which allows their
re-use as construction materials.
2.4.3.:Bayrak,Yesiloglu,Gecgel(2006), has studied the adsorption behavior of
Cr6+on activated hazelnut shell and activated bentonite. The Cr6+ was
obtained by them from synthetic solutions.They have prepared hazelnut in
two sizes viz.0.5 and 1.0mm, and obtained activated bentonite by refluxing
15grams of bentonite with sulphuric acid at 600C for 30mins and then
cooling andf filtering it.According to them bentonite have large specific area
,cation exchange capacity adsorptive capacity due to which they are very
effective in decontamination of high level heavy metal wastes.They have
observed that maximum removal occurs at pH 3 for hazelnut shell and pH 5
for activated bentonite. The maximum percent removal observed by them was
85% for hazelnut shell and 91% for activated bentonite.
21
Manufacturing process and wastewater generation in
tanneries
MANUFACTURING PROCESS
PRETANNING OPERATION
Hides and skins
Skins of cows and buffalos are called 'hides'. Skins of goats and sheeps
are called 'skins'. In India, 80% of hides available from fallen—those
that died naturally cows and buffaloes due to ban on cow slaughter in
many pans of the country. Goat and sheep skins are, however, by-
product of the meat industry. Hides are 2 to 3 sq mater in size and
weight 10 to 20 kg. Skins are smaller in size, 0.4 to 0.5 sq meter and
lighter in weight around 1 to 2 kgs. Slaughter hides and skins contain
60-70% of moisture, which make them liable to bacterial attack which
in turn decompose the hides and skins.
Curing
Protective treatment administered soon after the hides and skins are
flayed, is called curing. Curing creates an environment for the hides
and skins in which the protein destroying organism cannot function.

22
Its sole purpose is to ensure that the hides and skins are protected
during transit from slaughter house to the tanneries which are
generally located some good distance away. It also facilitates storing.
In India curing is done by the following methods:
(a) Wet salting
(b) Dry salting
(c) Drying
In the first process, 30-40% common salt is used on green weight basis
to dehydrate the hides and skins. In the second process hydration is
achieved by salting and natural drying. The last process achieves
dehydration by natural drying without salt.
Trimming and sorting
Cured hides and skins arriving at tannery are trimmed to remove long
shanks and other unwanted areas. Trimmed hides are sorted for size
and weight and formed into batches ready to undergo further
operations in the tannery.
TYPES OF TANNING PROCESS AND THEIR UNIT OPERATIONS
The various sectional operations of processing raw hides and skins
into semi-finished leather and/or finished leather varies from one area
to another area and tannery to tannery. From the data collected from
about 1500 tanneries functioning in various parts of the country, it is
23
observed that the tanning process can mainly be classified into 5 major
types namely:
(i) Processing raw hides and skins into vegetable tanned semi-
finished leather (Raw to E.I)
(ii) Processing raw hides and skins into chrome tanned semi-hnished
leather (Raw to wet blue)
(iii) Processing of the raw hides and skins into finished leather by
adopting chrome tanning (Raw to finishing)
(vi) Processing the vegetable tanned semi-finished leather into
finished leather by adopting chrome tanning process (E.I to
finishing)
(v) Processing the chrome tanned semi-finished leather into finished
leather (Wet blue to finishing)
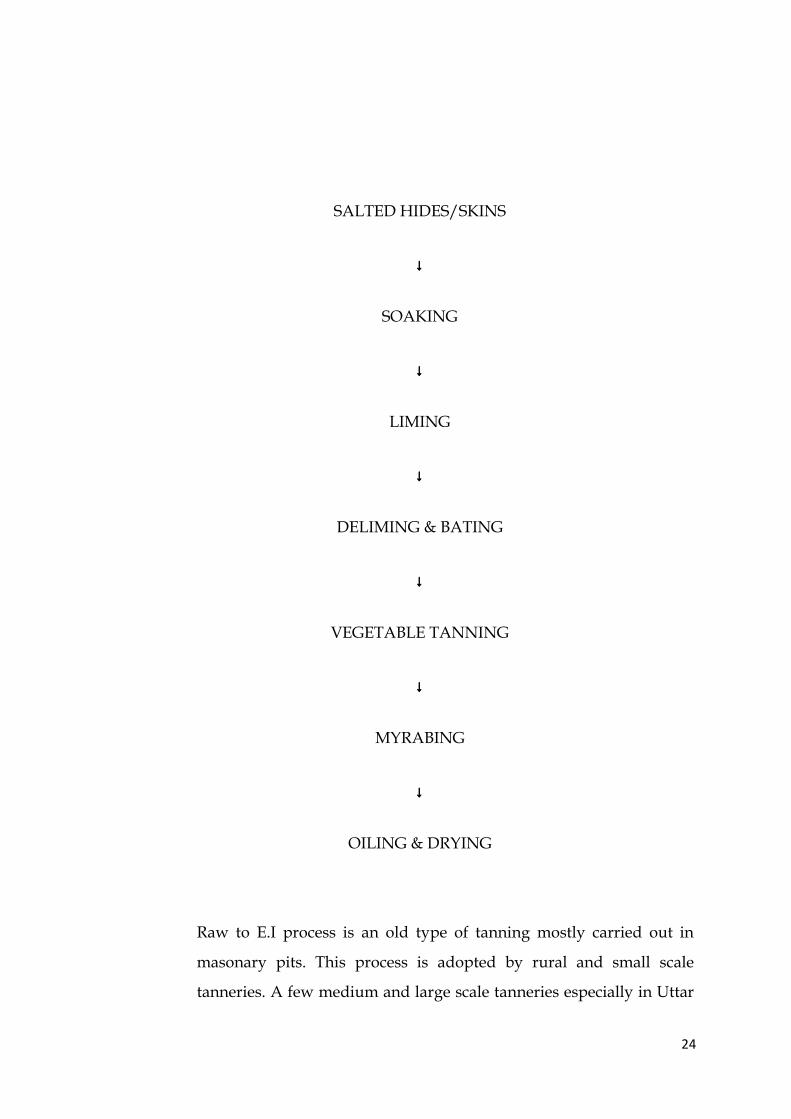
Raw hide to vegetable tanned semi-finished leather
The various stages of operations in processing of raw hides/skins into
vegetable tanhed semi-finished leather called East India Leather (E.I)
is shown in the following process flow diagram:
24
SALTED HIDES/SKINS
↓↓↓↓
SOAKING
↓↓↓↓
LIMING
↓↓↓↓
DELIMING & BATING
↓↓↓↓
VEGETABLE TANNING
↓↓↓↓
MYRABING
↓↓↓↓
OILING & DRYING
Raw to E.I process is an old type of tanning mostly carried out in
masonary pits. This process is adopted by rural and small scale
tanneries. A few medium and large scale tanneries especially in Uttar
25
Pradesh and Bihar area also adopt the vegetable tanning process for
manufacturing sole leathers and industrial leathers from cow and
buffalo hides.
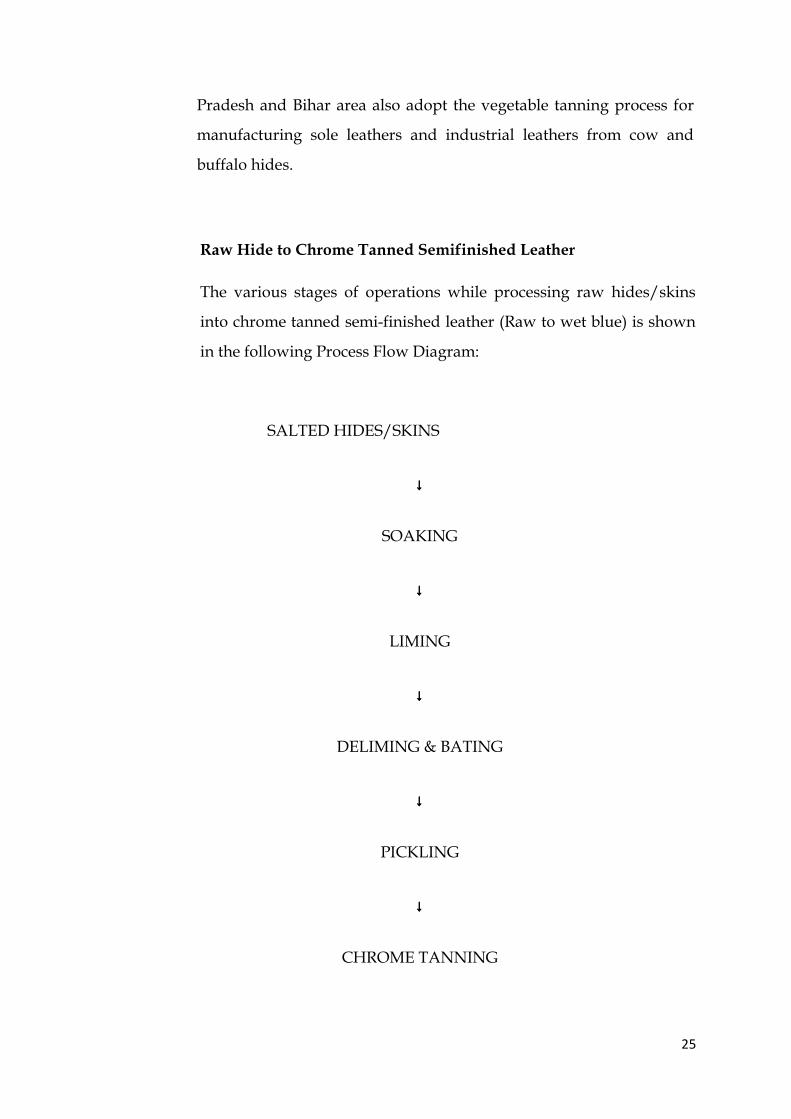
Raw Hide to Chrome Tanned Semifinished Leather
The various stages of operations while processing raw hides/skins
into chrome tanned semi-finished leather (Raw to wet blue) is shown
in the following Process Flow Diagram:
SALTED HIDES/SKINS
↓↓↓↓
SOAKING
↓↓↓↓
LIMING
↓↓↓↓
DELIMING & BATING
↓↓↓↓
PICKLING
↓↓↓↓
CHROME TANNING
26
Most of the small scale and medium scale tanneries adopt this
process. These tanneries are mostly feeder units for major mechanised
tanneries having facility to process the wet blue into finished leather.
Beam house operations namely, soaking, liming, deliming and bating
are carried out in pits or paddles. Tanyard operations namely,
pickling and chrome tanning, are carried out in drums.
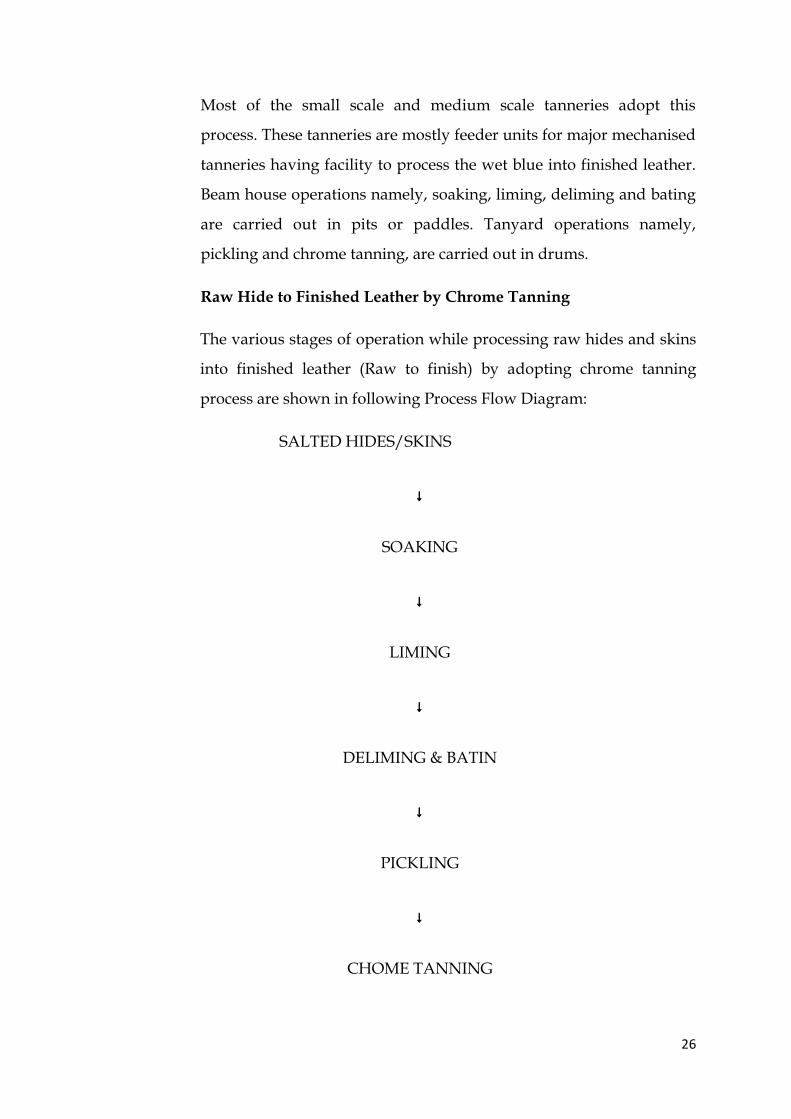
Raw Hide to Finished Leather by Chrome Tanning
The various stages of operation while processing raw hides and skins
into finished leather (Raw to finish) by adopting chrome tanning
process are shown in following Process Flow Diagram:
SALTED HIDES/SKINS
↓↓↓↓
SOAKING
↓↓↓↓
LIMING
↓↓↓↓
DELIMING & BATIN
↓↓↓↓
PICKLING
↓↓↓↓
CHOME TANNING
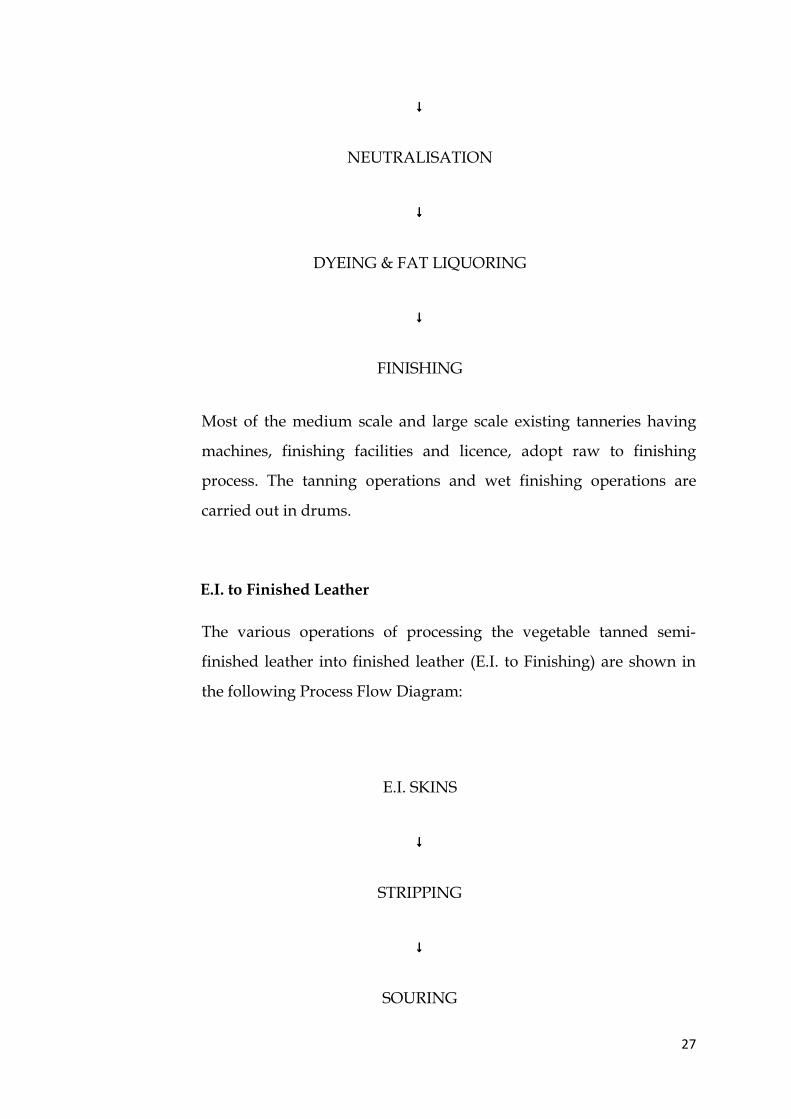
27
↓↓↓↓
NEUTRALISATION
↓↓↓↓
DYEING & FAT LIQUORING
↓↓↓↓
FINISHING
Most of the medium scale and large scale existing tanneries having
machines, finishing facilities and licence, adopt raw to finishing
process. The tanning operations and wet finishing operations are
carried out in drums.
E.I. to Finished Leather
The various operations of processing the vegetable tanned semi-
finished leather into finished leather (E.I. to Finishing) are shown in
the following Process Flow Diagram:
E.I. SKINS
↓↓↓↓
STRIPPING
↓↓↓↓
SOURING
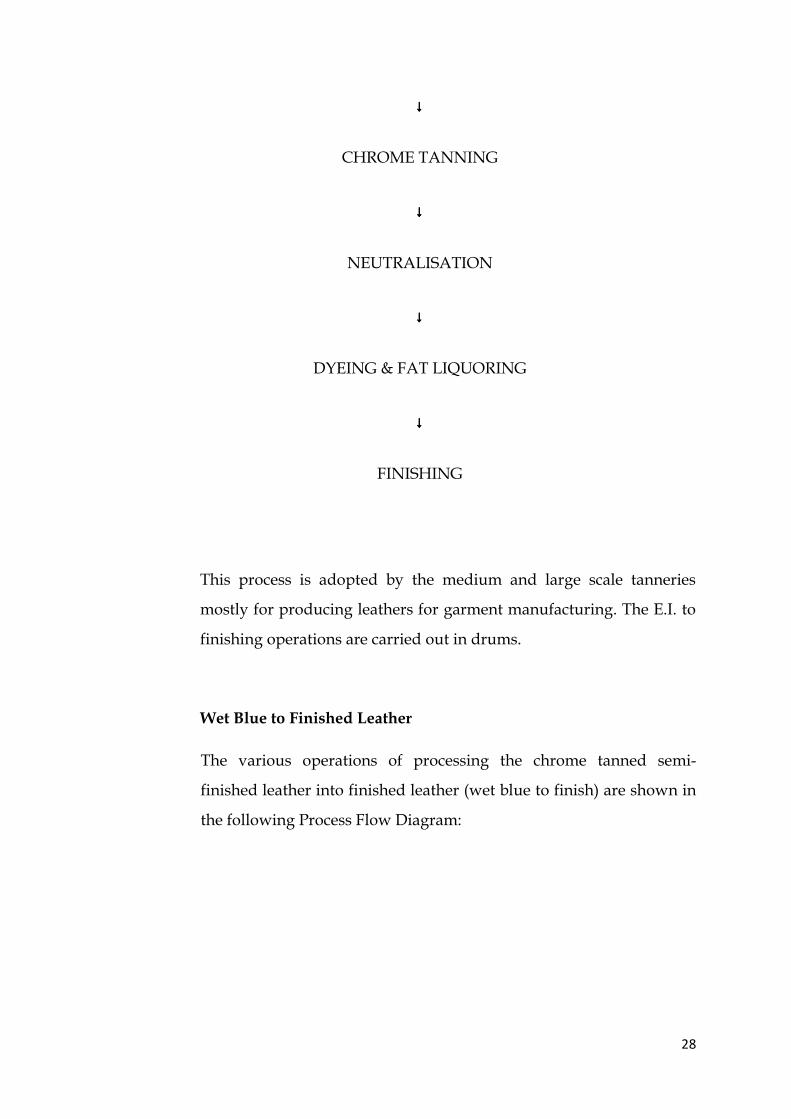
28
↓↓↓↓
CHROME TANNING
↓↓↓↓
NEUTRALISATION
↓↓↓↓
DYEING & FAT LIQUORING
↓↓↓↓
FINISHING
This process is adopted by the medium and large scale tanneries
mostly for producing leathers for garment manufacturing. The E.I. to
finishing operations are carried out in drums.
Wet Blue to Finished Leather
The various operations of processing the chrome tanned semi-
finished leather into finished leather (wet blue to finish) are shown in
the following Process Flow Diagram:
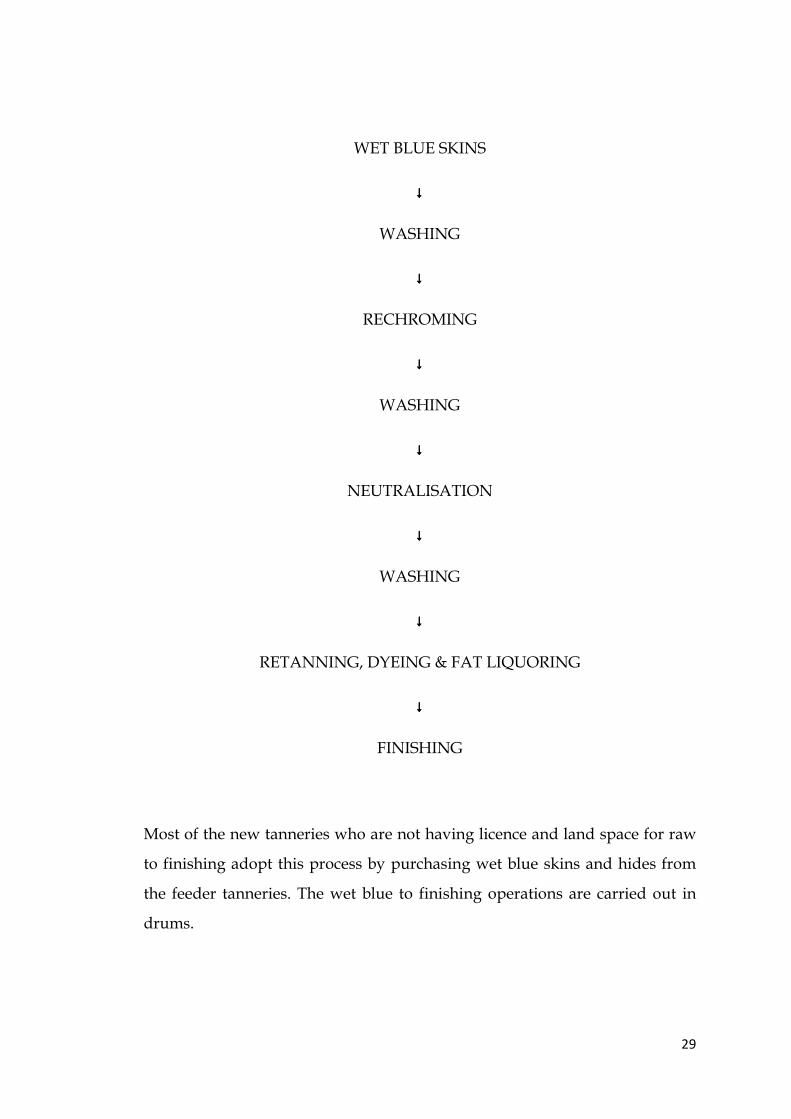
29
WET BLUE SKINS
↓↓↓↓
WASHING
↓↓↓↓
RECHROMING
↓↓↓↓
WASHING
↓↓↓↓
NEUTRALISATION
↓↓↓↓
WASHING
↓↓↓↓
RETANNING, DYEING & FAT LIQUORING
↓↓↓↓
FINISHING
Most of the new tanneries who are not having licence and land space for raw
to finishing adopt this process by purchasing wet blue skins and hides from
the feeder tanneries. The wet blue to finishing operations are carried out in
drums.
30
WASTE GENERATION IN TANNERIES
WATER USAGE AND WASTEWATER DISCHARGE
In the development of the tanning industry, water plays a vital role as
the industry consumes large quantities of water. Approximately 30-40
litres of water is used for processing one kg of raw hide/skin into
finishing leather. Most of the Indian tanneries which are located near
the river banks or natural water bodies draw surface water. Ground
water from their own open wells/tubewells existing within their
premises is also used by some tanneries. Most of the traditional
tanneries do not have overhead water tanks for proper distribution
system. Water is being pumped directly to the process and in a few
tanneries, it is stored in open cement lined pits and ground level
tanks.
In general, the quantity of water usage and nature of wastewater
discharge varies from process to process and tannery to tannery and
from time to time. Most of the discharges are intermittent. The
average water usage and wastewater discharge per kg of hide/skin
for different process are as follows:
(a) Raw to E.I: 25-30 I/kg of raw weight.
(b) Raw to wet blue: 25-30 I/kg of raw weight.
(c) Raw to finish: 30-40 I/kg of raw weight.
(d) E.I to finish: 40-50 I/kg of E.I weight.
(e) Wet blue to finish: 20-25 I/kg of wet blue weight.
31
Most of the tanneries neither have proper drainage system for
collection of the waste-water nor any effluent treatment system. The
wastewater is discharged from various sectional operatons
intermittently and it takes its own course to the nearby low lying area,
neighbouring land, pond, stream, road side etc.
CHARACTERISTICS OF WASTEWATER
Characteristics of the effluents vary from tannery to tannery and in
any one tannery with respect to time. The wastewater from
beamhouse process viz. soaking, liming, deliming etc. are highly
alkaline, containing decomposing organic matter, hair, lime, sulphide
and organic nitrogen with high BOD and COD. The waste water from
lanyard process viz. pickling, chrome tanning are acidic and coloured.
Vegetable tan wastewater contain high organic matter. The chrome
tanning wastes contain high amounts of chromium mostly in the
trivalent form. The details of the tanning operations, water and other
chemicals used, general constitutes in the wastewater are furnished in
Table A
Characteristics of The Sectional Wastewater
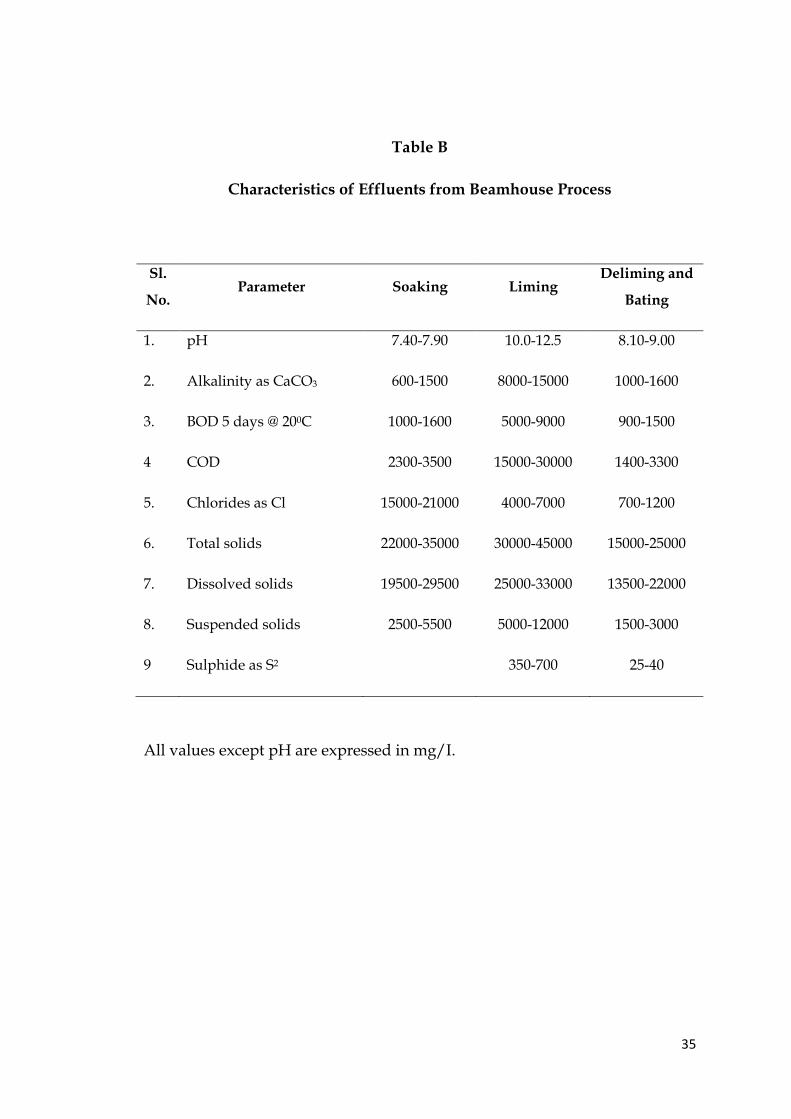
The characteristics of the sectional wastewater from the beamhouse
operations viz. soaking, liming, deliming are given in Table B.
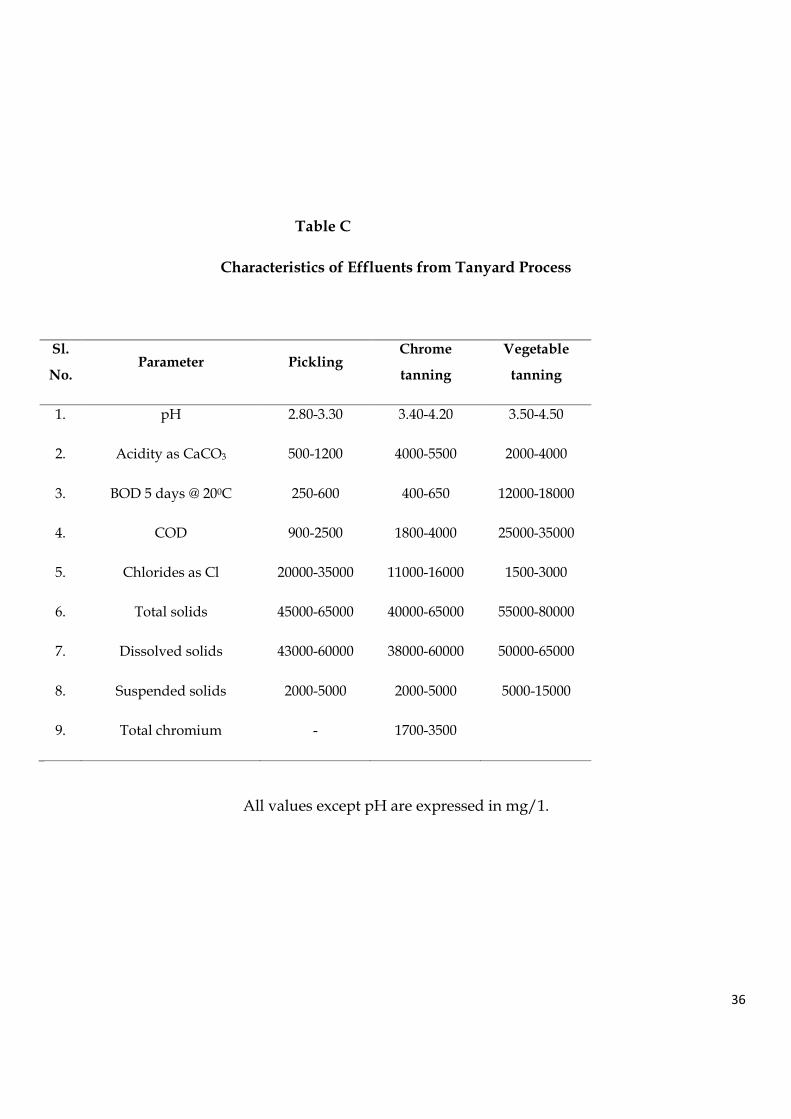
Characteristics of the sectional wastewater from tanyard operations
viz. pickling, chrome tanning, vegetable tanning, myrob liquor are
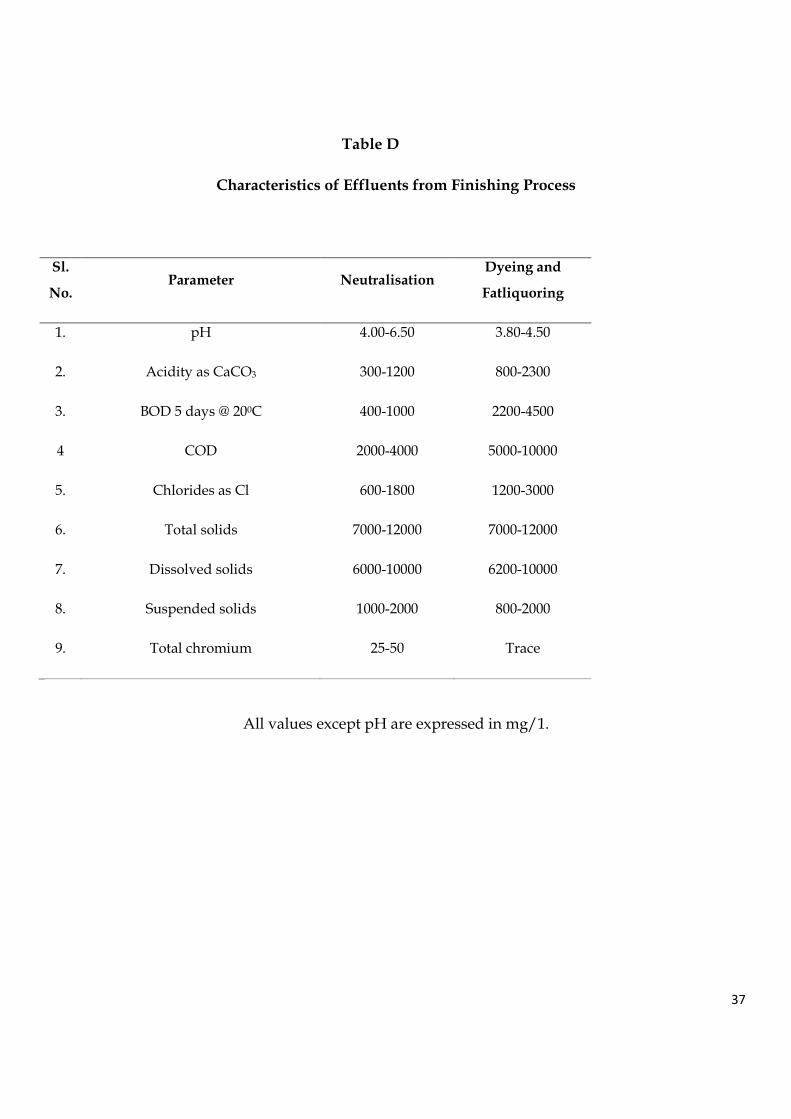
furnished in Table C. The characteristics of sectional wastewater from
finishing operations viz. neutralisations, dyeing and fat liquoring are
furnished in Table D
Characteristics of The Composite Wastewater
The characteristics of the composite wastewater is governed by the
following factors:
32
� Intermittent discharge of wastewater from different sectional
operations.
� Wide variation in the volume and quality of wastewater from
section to section.
� Partial operations in one tannery and balance operation in another
tannery.
It would be difficult to arrive at a realistic characteristic range of the
composite efflp-ents to be discharged by various tanning units.
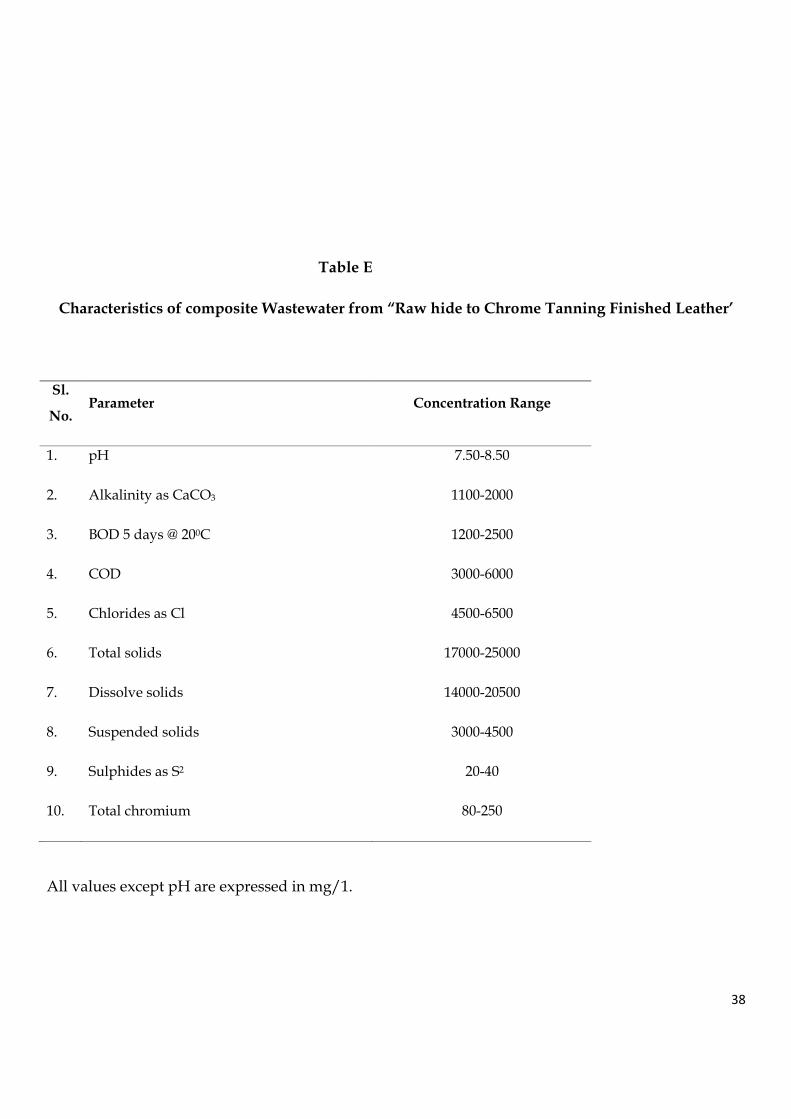
However, from the analysis of the wastewater samples collected from
various tanneries located in Calcutta and Tamil Nadu region, the
general characteristics range of the composite wastewater from raw to
finishing process is given in Table E.
The wide variation of BOD, COD, chromium, sulphide & other
parameters exhibited in raw to finish composite wastewater is due to
the variation in the process, changes in the type, quantity and quality
of chemicals used for the process, fluctuations in the volume of water
used for process and washings.
33
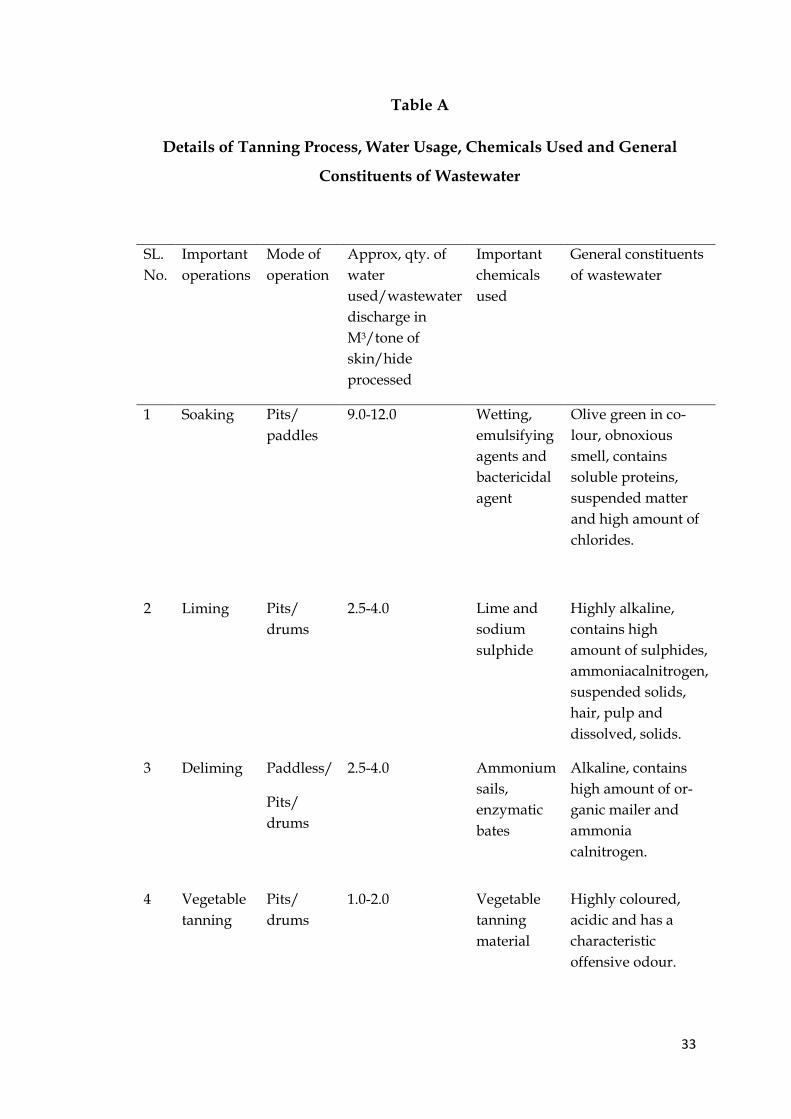
Table A
Details of Tanning Process, Water Usage, Chemicals Used and General
Constituents of Wastewater
SL.
No.
Important
operations
Mode of
operation
Approx, qty. of
water
used/wastewater
discharge in
M3/tone of
skin/hide
processed
Important
chemicals
used
General constituents
of wastewater
1 Soaking Pits/
paddles
9.0-12.0 Wetting,
emulsifying
agents and
bactericidal
agent
Olive green in co-
lour, obnoxious
smell, contains
soluble proteins,
suspended matter
and high amount of
chlorides.
2 Liming Pits/
drums
2.5-4.0 Lime and
sodium
sulphide
Highly alkaline,
contains high
amount of sulphides,
ammoniacalnitrogen,
suspended solids,
hair, pulp and
dissolved, solids.
3 Deliming Paddless/
Pits/
drums
2.5-4.0 Ammonium
sails,
enzymatic
bates
Alkaline, contains
high amount of or-
ganic mailer and
ammonia
calnitrogen.
4 Vegetable
tanning
Pits/
drums
1.0-2.0 Vegetable
tanning
material
Highly coloured,
acidic and has a
characteristic
offensive odour.
34
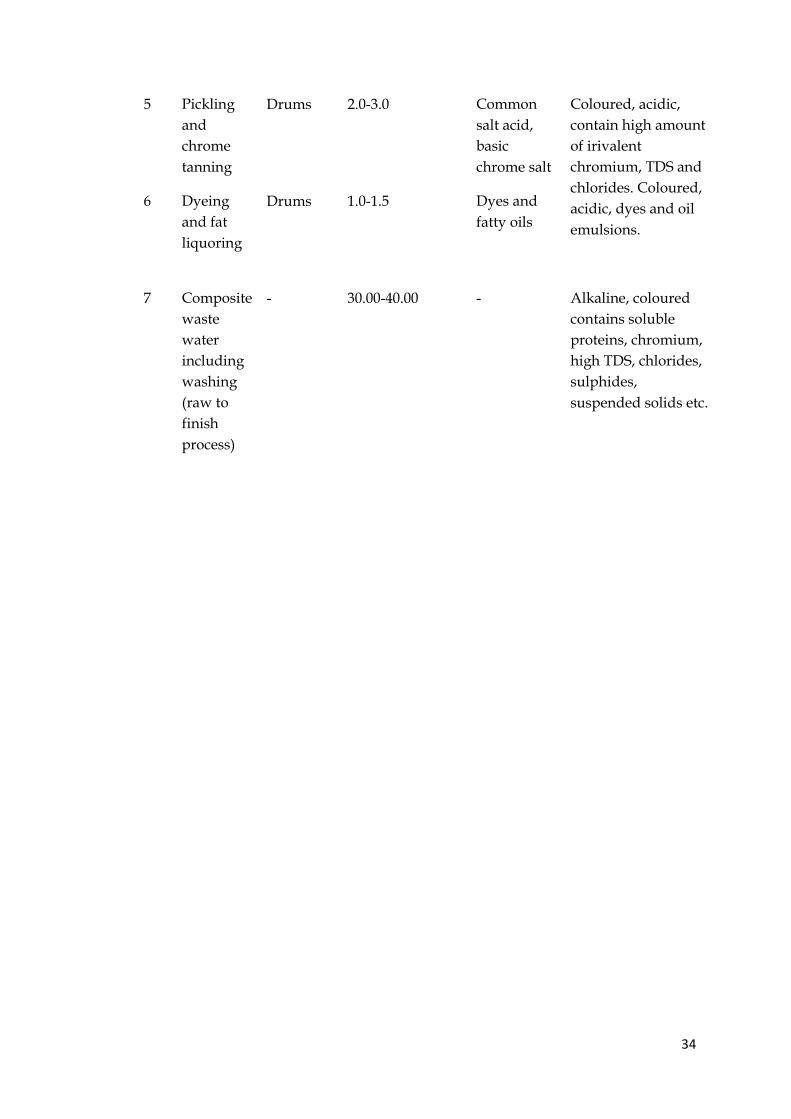
5 Pickling
and
chrome
tanning
Drums 2.0-3.0 Common
salt acid,
basic
chrome salt
Coloured, acidic,
contain high amount
of irivalent
chromium, TDS and
chlorides. Coloured,
acidic, dyes and oil
emulsions.
6 Dyeing
and fat
liquoring
Drums 1.0-1.5 Dyes and
fatty oils
7 Composite
waste
water
including
washing
(raw to
finish
process)
- 30.00-40.00 - Alkaline, coloured
contains soluble
proteins, chromium,
high TDS, chlorides,
sulphides,
suspended solids etc.
35
Table B
Characteristics of Effluents from Beamhouse Process
Sl.
No. Parameter Soaking Liming
Deliming and
Bating
1. pH 7.40-7.90 10.0-12.5 8.10-9.00
2. Alkalinity as CaCO3 600-1500 8000-15000 1000-1600
3. BOD 5 days @ 200C 1000-1600 5000-9000 900-1500
4 COD 2300-3500 15000-30000 1400-3300
5. Chlorides as Cl 15000-21000 4000-7000 700-1200
6. Total solids 22000-35000 30000-45000 15000-25000
7. Dissolved solids 19500-29500 25000-33000 13500-22000
8. Suspended solids 2500-5500 5000-12000 1500-3000
9 Sulphide as S2 350-700 25-40
All values except pH are expressed in mg/I.
36
Table C
Characteristics of Effluents from Tanyard Process
Sl.
No. Parameter Pickling
Chrome
tanning
Vegetable
tanning
1. pH 2.80-3.30 3.40-4.20 3.50-4.50
2. Acidity as CaCO3 500-1200 4000-5500 2000-4000
3. BOD 5 days @ 200C 250-600 400-650 12000-18000
4. COD 900-2500 1800-4000 25000-35000
5. Chlorides as Cl 20000-35000 11000-16000 1500-3000
6. Total solids 45000-65000 40000-65000 55000-80000
7. Dissolved solids 43000-60000 38000-60000 50000-65000
8. Suspended solids 2000-5000 2000-5000 5000-15000
9. Total chromium - 1700-3500
All values except pH are expressed in mg/1.
37
Table D
Characteristics of Effluents from Finishing Process
Sl.
No. Parameter Neutralisation
Dyeing and
Fatliquoring
1. pH 4.00-6.50 3.80-4.50
2. Acidity as CaCO3 300-1200 800-2300
3. BOD 5 days @ 200C 400-1000 2200-4500
4 COD 2000-4000 5000-10000
5. Chlorides as Cl 600-1800 1200-3000
6. Total solids 7000-12000 7000-12000
7. Dissolved solids 6000-10000 6200-10000
8. Suspended solids 1000-2000 800-2000
9. Total chromium 25-50 Trace
All values except pH are expressed in mg/1.
38
Table E
Characteristics of composite Wastewater from “Raw hide to Chrome Tanning Finished Leather’
Sl.
No. Parameter Concentration Range
1. pH 7.50-8.50
2. Alkalinity as CaCO3 1100-2000
3. BOD 5 days @ 200C 1200-2500
4. COD 3000-6000
5. Chlorides as Cl 4500-6500
6. Total solids 17000-25000
7. Dissolve solids 14000-20500
8. Suspended solids 3000-4500
9. Sulphides as S2 20-40
10. Total chromium 80-250
All values except pH are expressed in mg/1.
39
POLLUTION LOAD INCLUDING SOLID WASTES
The main pollutants namely BOD, COD, TS, chlorides, sulphates, sulphides and chromium,
estimated in terms of kg per tonne of raw hides or skins processed into finished leather.Total
average daily discharge of pollutants from the Indian tanning industry is estimated in tons..
The following observations can be made:
1. The composite wastewater from raw to finishing process is alkaline (pH 7-9) with
average contribution of about 575 kg of total solids, 465 kg of dissolved solids, 240 kg of
Chloride, 135 kg of COD, 100 kg of Sulphate, 65 kg of BOD, 7.5 kg of Chromium and 4
kg of Sulphide per ton of raw hides/skins processed into finished leather.
2. The total pollutional discharge from the Indian tanning industry is high in terms of
dissolved solids and chorides estimated at about 860 tons and 360 tonnes per day
respectively. The BOD and COD discharges are estimated as high-100 tonnes and 200
tonnes, respectively, per day. In addition to other pollutants like sulphate, sulphide etc.",
about 11 tonnes of chromium is also discharged which causes prob lems in the disposal
of sludge collected in the treatment plants besides involving wastage of a costly
chemical.
3. The number of tanneries in Tamil Nadu is about 600 which is only 30% consid ering the
total number of 2000 tanneries all over India. But the pollutional con tribution is more
than 45%. Similarly, in U.P. the number of tanneries is about 200 which is only 10%
considering the tanneries all over India. But their pollutional contribution is 20%.)This is
due to the concentration of more large scale tanneries in Tamil Nadu and Uttar Pradesh
compared to the other States. It is also interesting to note that though the number of
tanneries in Karnataka is about 180 which is 9% of the 2,000 total number of industries,
but their pollutional load is only 3%. This is due to the fact that the tanneries in the State
are mostly cottage and small scale units.
40
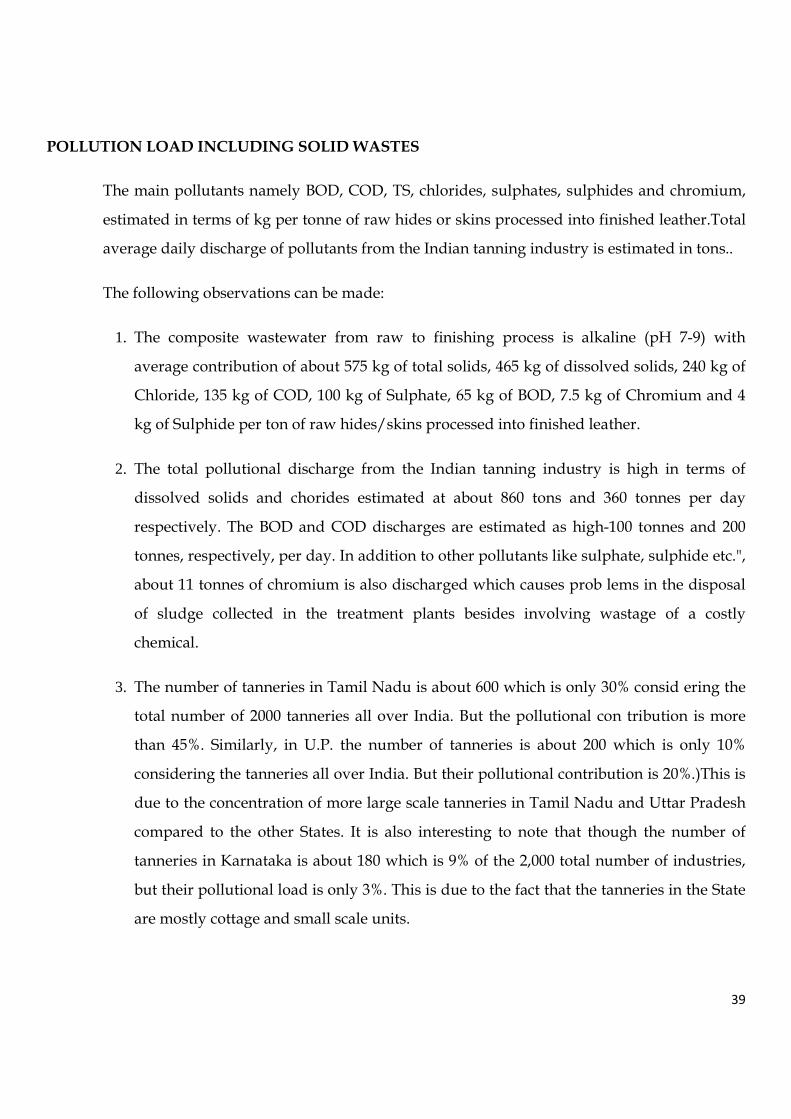
Fig :1 Sources of wastewater in chrome tanning process
41
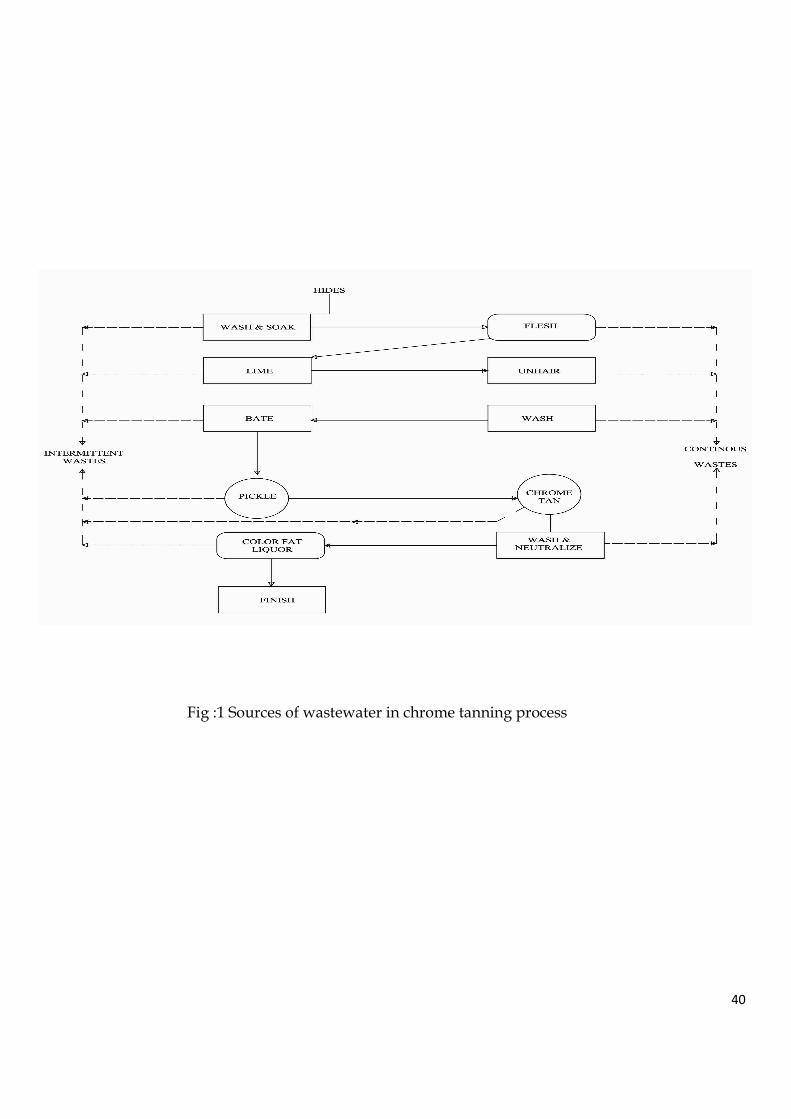
Fig:2 Typical system for wet blue to finising tannery waste water
42
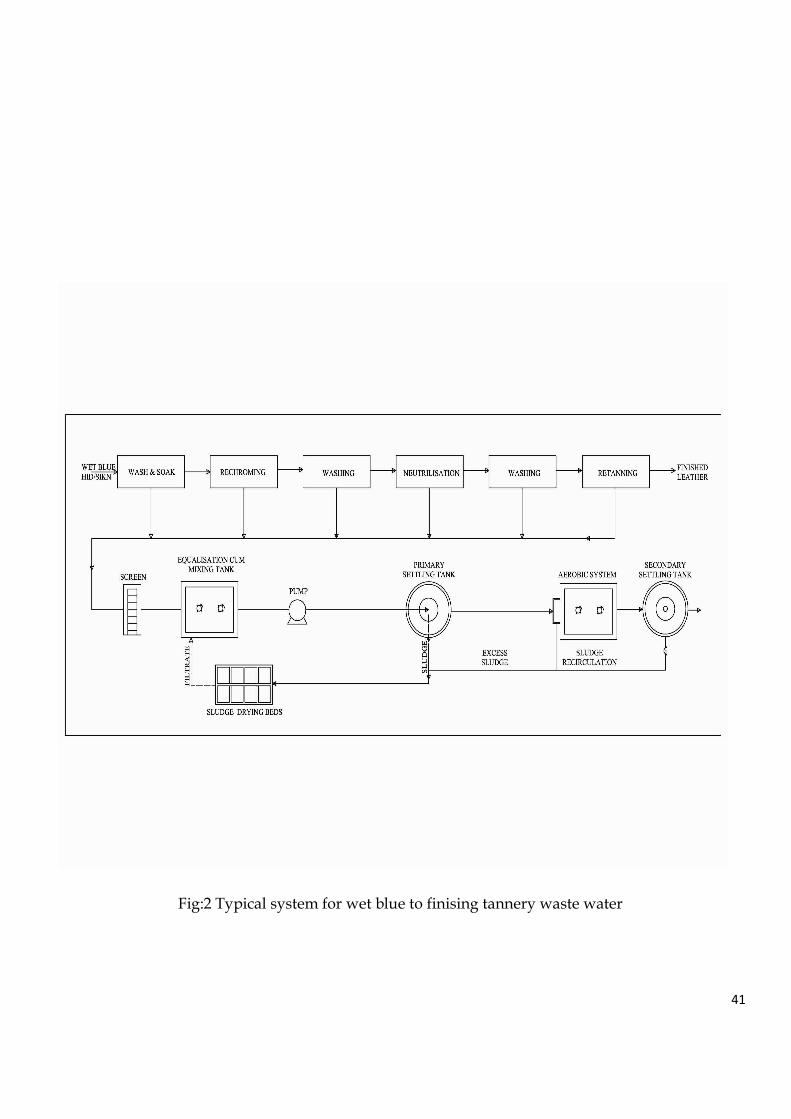
Fig:3 Typical system for raw to finising tannery waste water
43
CHAPTER-3
THEORITICAL CONSIDERATION OF METAL ADSORPTION
Adsorption is a two dimensional accumulation of matter at the solid/water interface and is
understood primarily in terms of intermolecular interaction between solute and solid phases. These
interactions comprise of different interactions: first surface complication reactions which are basically
inner-sphere surface complexes at a certain distance from the surface, third, hydrophobic expulsion
of metal complexes containing highly non-polar organic solutes and fourth, surfactant adsorption of
metal-polyelectrolyte complexes due to reduced surface tension. Often heavy metal adsorption is also
described in the scientific literature in terms of two basic mechanisms: specific adsorption, which is
characterized by more selective and less reversible reaction including chemisorbed inner-sphere
complexes, and non-specific adsorption, which involves rather weak and less selective out sphere
complexes.
3.1. Soil-Metal Adsorption:
Adsorption of heavy metal ions on soil and soil constituents is influenced by a
variety of parameters, the most important one being pH, type and specification of metal ion
involved, heavy metal competition soil composition and aging. Soil plays an important role for
heavy metal retention. In general coarse-grained soils exhibit lower tendency for heavy metal
adsorption than fine with large surface areas such as clay minerals, iron and manganese
oxyhydroxides, humic acids and others and displays enhanced adsorption properties. Clay is
known for their ability to effectively remove heavy metals by specific adsorption and cation
exchange as well as metal oxyhydroxides.
In our case study special concentration of interest is chromium adsorption.
Adsorption and precipitation behavior of Cr in soils is controlled by a variety of factors such as –
44
redox potential, oxidation state, pH, soil minerals, competing ions, complexing agents and others.
These factors affect most of the partitioning process of Cr between the solid and the aqueous
media in soils. The most important among these are the hydrolysis of
Cr3+ and Cr6+, adsorption/desorption and precipitation of Cr. Hexavalent Cr species are adsorbed
by a variety of soil phases with hydroxyl groups on their surface such as Fe, Mn and Al oxides,
kaolinites and montmorillonite. The adsorption of hexavalent Cr increases with decreasing pH
value due to protonation of the hydroxyl groups. Obviously, Cr6+ adsorption is favored if the
surfaces are positively charged was found to be greatest in lower pH materials enriched with
kaolinite and crystalline Fe oxides. Cr3+ are rapidly and specifically adsorbed by Fe and Mn oxides
and clay minerals with about 90 % of added being adsorbed within 24h. Adsorption increases
with pH and content of soil organic matter while it decreases in the presence of competing cations
or dissolved organic ligands in the solution. Both Freundlich and Langmuir isotherms can be used
to describe adsorption behavior of Cr3+ on solid phases.
3.2. Adsorption Isotherms:
Isotherm gives the relationship between contaminants sorbed in to soil surface an
that presents in soil pore water at equilibrium i.e. an empirical model, usually based upon simple
mathematical relationship between concentration of the heavy metal in the liquid phase and the
solid phase at equilibrium and at constant temperature, these relationship are called isotherm.
The most commonly used isotherm is the Langmuir Isotherm, which has been
originally derived for adsorption of gases on plane surfaces such as glass, mica and platinum. It is
applied for adsorption of heavy metal ions on to soils and soil components in the form
qi = (b* K Ce)/(1+ K Ce) ----------------------- (A)
Where the quantity qi of an adsorbate is related to the equilibrium solution concentration of the
adsorbate Ce by the parameters K & b. the steepness of the isotherm is determined by K.
45
Freundlich equation of isotherm
qi = a* Ce n-------------------------------(B)
Where a, K, n are adjustable positive valued parameters with n ranging only between 0 and 1.
Converting the Freundlich equation to the logarithmic form, the equation becomes
log qi = log a + n log Ce
Another adsorption isotherm is Linear Isotherm. Linear Isotherm expressed mathematically as
S = K* C
Where S is the mass of the contaminant sorbed per unit dry mass of solid, C is the concentration of
contaminant in solution at equilibrium.
46
CHAPTER-4
OBJECTIVE OF THE STUDY AND SCOPE OF WORK
4.1: Objectives:
The main objective of this present dissertation study is to assess the suitability of different types of
liner materials viz. Compacted Clay Liners (CCL), Geosynthetic Clay liners (GCL), and
Geomembrane liners (GM) for preventing the chromium contamination taken place in chrome
tannery plant in the lithospheric environment through laboratory and some relevant field
investigation. Performance assessment of various amendmented soils with fly-ash, bentonite, rice
husk etc. for chromium decontamination in soil from waste containment structure is also a secondary
objective of the study.
4.2: Scopes:
The following scopes for the present work have been undertaken:
1. Reconnaissance of the sites for selection of suitable location for the collection of soil and
sludge.
2. Collection of soil samples from the tannery site/other site.
3. Determination of physical and chemical properties of sludge. The major testing parameters
include: 1)Field moisture content, 2) Bulk density, 3) Atterberg limits, 4) specific gravity, 5)
Particle Size distribution, 6) Shear parameter, 7) Alkalinity, 8) Sulphate, 9) Chloride, 10)
Organic matter.
4. Testing of physico-chemical properties of two types of soil samples namely:
Soil – B (collected from Bantala) and Soil – J (collected from Jadavpur) to be used as a clay
liner.
5. Testing of various properties of GCL & Geomembrane material in Soil Mechanics Lab. of
Jadavpur University which include: a) Interphase shear strength, b) Tensile strength, c)
Puncture resistance, d) Permeability, e) Chemical Resistance
47
6. Determination of permeability of clayey soil with amendments like rice husk, bentonite, and
fly-ash.
7. Di-electrical constant to review the contaminant intensity of Soil-B and Soil-J.
8. Batch adsorption study of amended clayey soil mixed with optimum quantity.
9. Assessment of adsorptive behavior/study of sample soil (Soil – J), to be used as suitable liner
material for adsorptive removal and determination of breakthrough time for Chromium
uptake by conducting tests in a fabricated tank with variation in soil thickness and slope.
10. Assessment of suitable property of Geosynthetic clay liner(GCL), Geomembrane material to be
used as suitable liner material for chromium removal/containment and determination of
breakthrough time for Chromium uptake by conducting tests in a fabricated tank as
mentioned in above.
11. Vertical column test with Soil– B and Soil-J (with and without amendment) for obtaining
breakthrough curve and for understanding the leachate behavior.
12. Electrical Resistivity tests at Leather Complex Bantala to understand the variation in resistivity
due to presence of Total Dissolved Solids (TDS).
13. Scanning Electron Microscope study of Soil-B and Soil-J spiked with chromium solution, (with
and without amendment) to observe change in the structure of soil due to chromium
adsorption.
14. Conducting Field tests with Compacted clay liner(CCL) and Geosynthetic clay liner(GCL) in
Plant site, Leather Complex, Bantala, West Bengal.
48
CHAPTER-5
TEST PROGRAMME AND EXPERIMENTAL PROCEDURE.
5.1: TEST PROGRAMME
Following tests were performed for the present research in order to achieve the objective in
accordance with scope of work.
5.1.1: Tests for physical properties of soil samples:
Following laboratory and field tests are carried in the present study:
Laboratory Tests:
• Field moisture content.
• Field bulk unit weight
• Particle size distribution.
• Atterberg limits:
a) Liquid Limit.
b) Plastic Limit.
• Permeability Test of clayey soil with amendments viz. rice husk, bentonite and
fly-ash.
• Specific Surface Area of both Soil-B and Soil-J.
• Di-electric Constant.
• Scanning electron microscope test (SEM).
Field Tests:
• Electrical Resistivity Test.
49
5.1.2: Test for chemical properties of soil samples:
• Batch Adsorption Studies (with soil and amendment mixture).
• Isotherm studies.
• Vertical Column Test of soil (with and without amendment).
• Test with experimental tank..
5.1.3: Test for physical and chemical properties of Geosynthetic Clay Liner and Geomembrane:
o Interphase shear strength,
o Tensile strength,
o Puncture resistance,
o Permeability,
o Chemical Resistance.
o Large Scale Tank Test.
5.1.4 Field Tests:
• Using compacted clay as liner material.
• Using GCL as a liner material
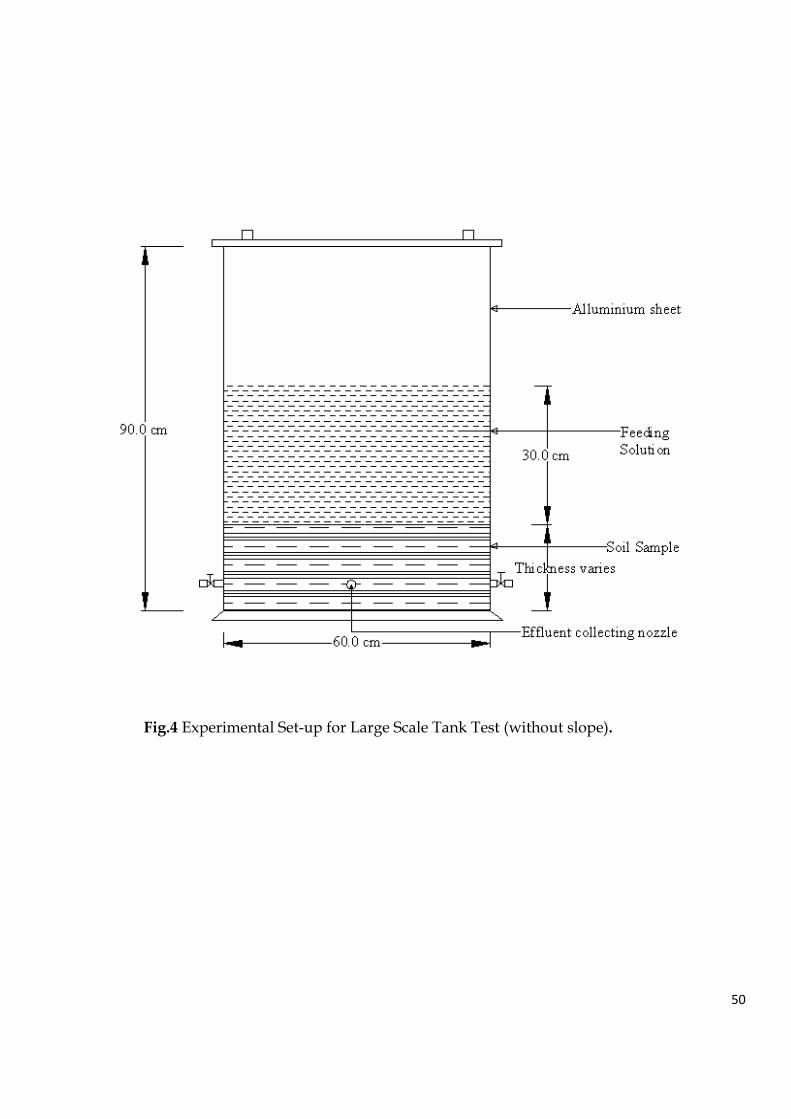
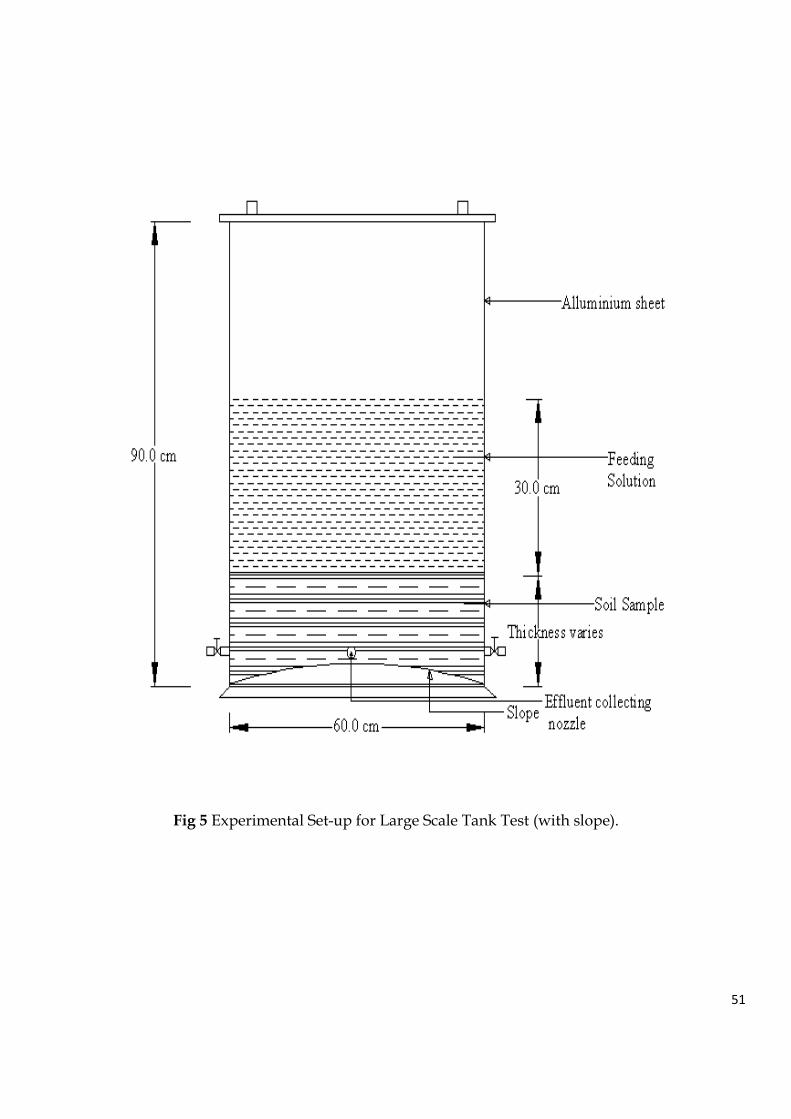
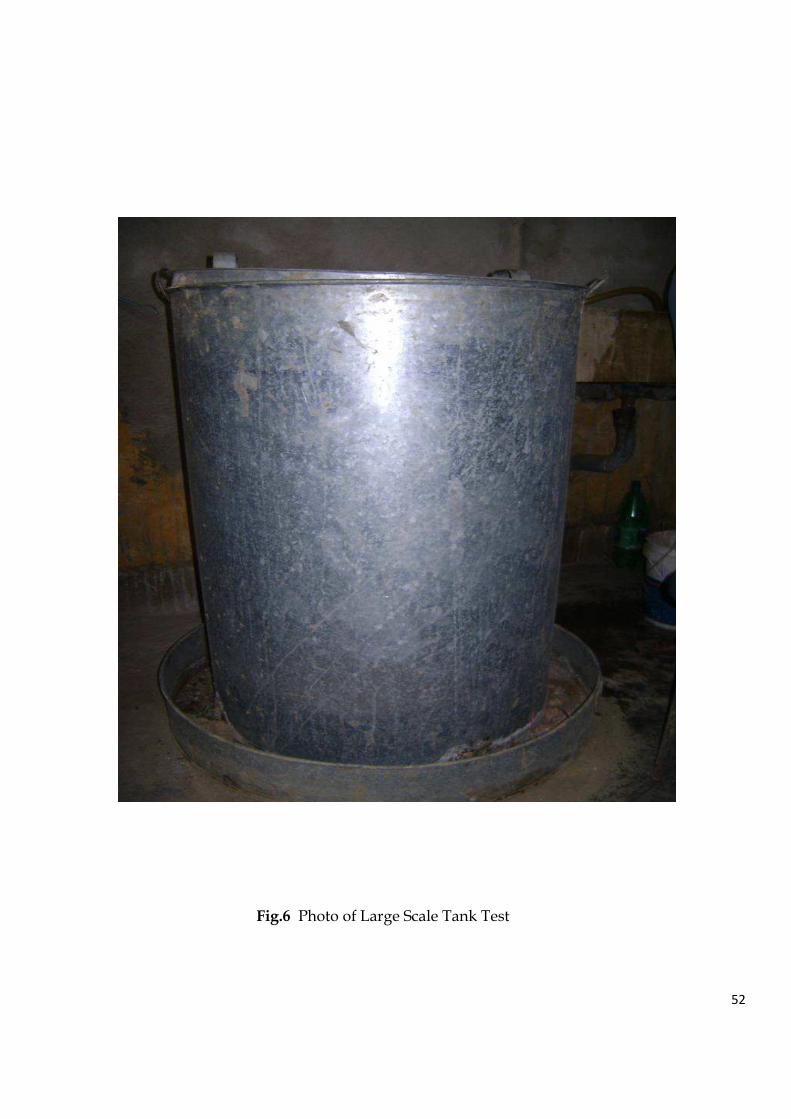
5.1.5: Experimental Setup: A tank has been fabricated for conducting tests with the soil in question as
liner for studying the character of leachate generated due to the permeation of chromium solution
through the soil with changing slopes and thickness The tank is made up of aluminum sheet having a
diameter of 60 cm and a height of 90 cm, with a provision of placing soil at a slope by use of a
template. The schematic diagram of the setup is shown in Fig. 4 and 5and photo shown in Fig6.The
template consists of several perforations that allows the leachate generated to accumulate at the
bottom of tank wherefrom its collection can be made at different time intervals as samples.
Specially built permeability test apparatus (Standard Falling Head Permeameter) has been
made for conducting falling head permeability test in large scale.
50
Fig.4 Experimental Set-up for Large Scale Tank Test (without slope).
51
Fig 5 Experimental Set-up for Large Scale Tank Test (with slope).
52
Fig.6 Photo of Large Scale Tank Test
53
5.2: EXPERIMENTAL PROCEDURE.
5.2.1: Determination of physical properties of soil samples:
5.2.1.1. Field Moisture Content:
Field water content of soil was determined by collecting the soil samples in a container from the field
and brought it to the laboratory and weighing each container with soil. Then the containers with soils
were oven dried at 110 ±50C. The containers with dried soils were weighed again. The difference
between two weights of each can gave the weight of water present in soil. Dividing this weight by
dry weight of soil, the moisture content of field soil was obtained as per IS-2720-Part-18-1982
(Reaffirmed-1997).
5.2.1.2.. Field Bulk Unit Weight:
Field bulk unit weight was determined by inserting sampling tubes into the soil in the field and
carrying it to the laboratory without changing the moisture content of samples. The bulk unit weight
was determined by dividing the weight of sample to volume of sample 38 mm diameter and 76 mm
high.
5.2.1.3.. Particle Size Distribution:
Particle size distribution of soil sample was determined by standard hydrometric analysis.
Hydrometer conforming IS-2720-Part-IV-1985 was used for the test.
5.2.1.4.. Liquid Limit & Plastic Limit:
Liquid limit and plastic limit of the oven dried soil samples were determined according to IS-
2720(Part-V)-1985.
54
5.2.1.5.. Permeability:
Falling head permeability test was carried out for determining the permeability of soil with
amendments as per IS-2720-Part-17-1986(Reaffirmed-1997). For a falling head test arrangement the
specimen was connected through the top inlet to selected stand pipe. The bottom outlet shall be
opened and the time interval required for the water level to fall from a known initial head to a known
final head as measured above the centre of the outlet was recorded. Three successive observations
were taken to the determination of permeability.
The permeability was calculated as:
Kp = 2.303 (a L)/A (t1 – t2) log 10 (h1/h2).
Where, a = area of stand-pipe. A = Surface area of the soil sample mixed with amendment . L = length
of soil sample mixed with amendments. t1 = initial time. t2 = final time. h1 = initial head. h2 = final
head.
5.2.1.6.. Test for specific surface area of soil:
Principle:
BET equation:
Brumam, Emmet & Teller 1930
p 1 c – 1 p
= + x ……………(1)
va (p – po) vm x c vm x c po
Where, p is the adsorption equilibrium pressure. po is the saturation pressure of the adsorbate on the
sample at cooling bath temperature, liquid temperature 196 oC. va is the volume adsorbed in
55
monomolecular layer. ’c’ is a constant related to the adsorption energy. p/po is a constant relative
pressure of the adsorbate (N2 gas). vm = volume of gas required to cover a surface with a
monomolecular layer.
In given system, c & vm are constant.
p p
= m x + b
va (p – po) po
or, y = mx + c straight line. Plotting [p/ {va (p – po)}] against (p/po) a straight line is obtained. BET
linearity is fulfilled in a relative pressure range 0.05 to 0.35 (p/po). Based on this equation, the semi
automatic machine measures the surface area of a soil sample by measuring pressure on vacuum
before adsorption and after adsorption.
Procedure:
5 gram of soil sample was taken in a glass burette and was heated at 200oC and was placed in
vacuum. The stop cock was closed and the burette was cooled and was placed within a vacuum flask
full of liquid N2. Vacuum was created stop cock was opened and adsorption switch was pressed.
Then adsorption of N2 gas by the surface of the powder soil sample took place. Reading come in the
burette after sometime was weight of burette was taken.
]
56
Specific surface area (m2/gm)
Surface area (m2)
=
[(wt of burette + wt of sample of soil) – wt of burette]
5.2.1.7.. Test for di-electric constant of soil:
Mathematical analysis if “Shering Bridge”:
At balanced condition of the bridge, we get,
Z1/Z2 = Z3/Z4
Or, Z1.Z4 = Z3.Z2.
Where, Z1 = R1 + 1/ (jωC1).
Z2 = 1/ (jωC2).
Z3 = R3.
Z4 = 1/ {1/R4 + 1/ (jωC4)}. = R4/ (1 + jωR4C4).
Therefore,
{(R1 + 1/ (jωC1)) (R4/ (1 + jωR4C4))} = R3 (1/ (jωC2)).
Or, jωC2R4R1 + R4C2/C1 = R3 + jωR4C4R3.
Equating real and imaginary part, we get,
R4C2 / C1 = R3. ωC2R4R1 = ωR4C4R3.
Or, C1 = (R4/R3)C2. Or, R1 = (C4R3)/C2.
57
Measured Dielectric Constant (εm) = (C1d)/( ε0A’).
Where, ε0 = 8.854 x 10⁻¹² F/m. A’ = 20 cm x 20 cm. d = 2.5 cm.
Using the above formula the values of capacitors at different frequencies
(1 MHz to 30 MHz) can be found out and then Dielectric Constant at those frequencies can be
obtained. After this procedure, the “Method of curve fitting” was applied for finding other values of
Dielectric constant at different higher frequencies (30 MHz to 100 MHz).
Method of curve fittings:
Let the value of the capacitance be Y and the value of the frequency be X, then the nature function of
X. i.e. Y = f(X) is XYn = b, where a and b are constant.
Taking logarithm (base 10) both sides,
Log (X) + a log (Y) = log (b)
Or, log (Y) = 1/a log (b) – 1/b log (X)
Or, log (Y) = A – B log(X).
Where, A = 1/a log (b) and B = 1/a.
Also let, y = A – Bx. And yx = Ax – Bx2.
Where, y = log (Y), and x = log (X).
The above equation gives the values of capacitance with different frequencies. Now the following
method was adopted, taking summation both sides for above two equations.
Σ y = nA – B Σ x ………………………. (2)
Σ xy = A Σ x – B Σ x2. ………………… (3)
n = total numbers of observed values.
The above equations (Eq (1) & Eq (2)) solved the values of A and B, and the equations of the function
Y = f (X) can be obtained. Apply the values of X (frequency), the values of Y (capacitance) can be
58
obtained and therefore the values of Dielectric constant (εm) was found out by using the following
formula, εm = (Yd)/ ( ε0A’).
Where, ε0 = 8.854 x 10⁻¹² F/m. A’ = 20 cm x 20 cm. d= 2.5 cm.
Experimental Procedure:
Shering Bridge is used to measure the unknown capacitor.
Let, C1 = Capacitor whose capacitance is to be measured (unknown value)
R1 = A series resistance representing the loss in the capacitor C1.
C2 = A loss free standard capacitor (Air capacitor).
R3 = A non-inductive resistance.
R4 = A variable non-inductive resistance in parallel with variable capacitor C4.
C4 = a variable capacitor (Decade capacitor Box) was used.
A signal source (1 MHz to 33 MHz, 500 mV) as a input signal (sine wave) voltage. A cathode ray
oscilloscope (CRO) was used as a detector. Initially the unknown value of the capacitor was
measured by the LCR meter (1 KHz to 100 KHz and 500 mV). With the help of this value of the
components (C2, R2, C4, R3, R4) can be set up. A balanced condition i.e. there was no current flow in
the detector (CRO) and a straight line in CRO was observed.
Z1/Z2 = Z3/Z4
Or, Z1.Z4 = Z3.Z2.
5.2.1.8.. Scanning Electron Microscope(SEM) Test: The instrument used here is SEM S 430 I from
LEO, U.K. The powdered samples were dried and scanned in Secondary Electron (SE) mode SEM
micrographs. Micrographs of soil particles were recorded at different magnifications to understand
the morphology of the specimens. The test is performed in CGCRI , Jadavpur, Kolkata.
59
5.2.1.9. Test for determining the Electrical resistivity of Soil: This test is done as per ASTM G 187-05
by Geotest Engineers Pvt. Ltd.
5.2.2: Test for chemical analysis:
5.2.2.1. Determination of pH value of soil:
Electrometric method was used as per IS-2720-Part-26-1987 (Reaffirmed-1997) to measure pH of a
given sample using a digital pH meter (RI 152 - R India). The instrument was calibrated at first by
using standard buffer solution of known pH. The buffer solution of pH 4.0, 7.0, 9.20 was used for the
purpose. The electrodes are thoroughly rinsed with double distilled water after every use. Before
immersing the electrodes in unknown sample, the same was dried with tissue paper or fresh cotton.
The buffer reading in the pH meter was adjusted by manual knob. The temperature of the experiment
was carried out at 240C. After calibration of the electrodes with known pH, it was blotted with tissue
paper and then is immersed in the unknown sample. The direct reading showed the value of pH.
5.2.2.2.. Batch Adsorption Studies:
This test was carried out to determine the kinetics and equilibrium of adsorption phenomenon. The
rate at which adsorption takes place dictate the contact time between the adsorbent and solution,
which is required to be provided for optimum adsorption. In this test 100 ml of sample containing
1mg/L of chromium and 100 gm/l of field soil was taken in six polythene bottles and kept in a
horizontal shaker. Every half an hour interval one bottle was taken out from the shaker and the
supernatant was analyzed for the residual concentration of chromium. Such tests were repeated with
similar time intervals and with different initial concentration of chromium and with different soil
mass quantity.
60
5.2.23.. Isotherm Studies:
The adsorption of substance from one phase to the surface of other in a specific system leads to a
thermodynamically defined distribution of those substances between the phases when the system
reaches equilibrium i.e. when ceasing of sorption occurs. The common manner, in which it is
expressed, is the amount of sorbet adsorbed per unit weight of sorbet (X/M) as a function of residual
equilibrium concentration C of substances remaining in solution phase. An expression of this type,
termed an adsorption isotherm defined the functional equilibrium distribution of adsorption with
concentration of adsorbate in the solution at constant temperature. Experimental isotherms are
useful for describing sorption capacity to evaluate the suitability of adsorbent. Sorption kinetics were
studied for chromium concentration of different initial concentrations for 1 mg/l, 2 mg/l, 3 mg/l, 4
mg/l, 5 mg/l with different time intervals e.g. 30 min, 60 min, 90 min, 120 min, 150 min, 180 min. The
specimens were placed in 250 ml glass bottle in which first soil sample and then chromium
concentration solution was added for sorption mechanism. The 250 ml glass bottle was fixed on a
rotary shaker and samples were taken at different time intervals and the supernatant was analyzed
for chromium adsorption. The minimum time after which there was no increase in the adsorption
rate of chromium was taken as equilibrium time, and the concentration of chromium remaining at
that time in the supernatant is called equilibrium concentration. The isotherms were drawn with
equilibrium concentration (mg/l) in x-axis and the ratio of amount of chromium removed to amount
of soil in y-axis for a specified concentration.
5.2.2.4. Vertical Column Test:
This test was carried out for obtaining breakthrough curves by evaluating some time concentration
parameters and also for drawing the sorption isotherms. In this test a column of diameter 115 mm
and height 580 mm made of steel was used (Fig-7). Homogeneous soil(with or without mixing
amendments) brought from the site was placed in the column and compacted in a layer of height of
550 mm with relative compaction 85% with respect to standard proctor density and was saturated
with distilled water for 24 hours. Potassium dichromate solution was used as source solution of
chromium of concentration 7.5 mg/L. The solution was allowed to pass through the soil at a steady
61
flow of 0.27 ml/min (vertical). Effluent concentration and discharge were measured with respect to
time intervals at the end point and at the three intermediate points of soil column.
5.2.2.5. Large Scale Tank Test:
This test was carried out for obtaining breakthrough curves by evaluating some time concentration
parameters. In this test a tank of diameter 600 mm and height 900 mm made of steel was used
Homogeneous soil brought from the site was placed in the tank and compacted in a layer of height of
100 mm, 200mm and 300 mm. The layers were placed with slope and without slope in the tank(Fig 5).
The relative compaction was 85% with respect to standard proctor density and was saturated with
distilled water for 24 hours before conducting every test. Potassium dichromate solution was used as
source solution of chromium of concentration 7.5 mg/L. The solution was allowed to pass through
the soil at a steady flow of 2.74 ml/min (vertical). Effluent concentration and discharge were
measured with respect to time intervals at the end point of soil column. This test is also done by
placing a Geosynthetic clay liner and a Geomembrane over the soil layer of thickness 300mm(Fig.8)
5.2.2.6. Effect of pH on chromium removal:
The sludge sample collected from the tannery site was filled in a steel column of 115 mm diameter
and 580 mm long up to a height of 550 mm with light compaction. Water was allowed to pass
through the sludge sample uniformly at a constant velocity for saturation. Normal water with pH
value of 6.86 was permeated through the sludge from an overhead tank with a constant head and
leachate was collected at different time interval from effluent point of the column and concentration
of chromium leached out was measured. When the variation of concentration of chromium leached
out with time become asymptotic, test was terminated.
62
5.2.2.7. Measurement of Chromium concentration:
The reduction of hexavalent chromium was determined colorimetrically at 540 nm using the
diphenyl carbazide (DPC) method. In a 10mL volumetric flask, 1mL of sample was mixed with 9mL
of 0.2M H2SO4. Then 0.2mL of freshly prepared 0.25% (w/v) DPC in acetone was added to the
volumetric flask. The mixture was then vortexes for about 15–30 s and let to stand between 10 and 15
min for full colour development. The red-violet to purple colour formed was then measured at
OD540 using distilled water as reference. Instrument used was calibrated using 0.1–4.0 mg/L Cr (VI)
prepared from Cr (VI) stock solution (1000 mg/L). Then a standard curve was prepared for
absorbance vs. chromium concentration (0.1-3.0 mg/L). From this standard curve the concentration
of chromium was measured from absorbance value, which was obtained from Uv-Vis
spectrophotometer (VARIAN 50-e). For solutions which had concentration greater than 3.0 mg/L, ten
times dilution was made to get the absorbance value in the range of standard curve. In the present
investigation, sensitive and selective method (DPC) has been followed for the determination of
chromium (VI). The most widely used reagent for chromium (VI) determination is diphenyl
carbazide. Throughout the present study the concentration behavior of Cr (VI) is measured. Cr (III)
can be determined after it is oxidized to Cr (VI) by Bromine Water.
5.2.2.8. Test for Cation Exchange Capacity (CEC):
5 gm. Soil was transferred without loss to a 500 ml conical flask and 125 ml of natural ammonium
acetate solution was added to it. The content was shaken occasionally for an hour and was kept
overnight. The content was filtrate through Whitman 41 filter paper. The filtrate was transferred to a
one liter volumetric flask. The soil was transferred to the filter paper and was allowed to leach
continuously with natural ammonium acetate solution taking 20 ml at a time. The leachate was
allowed to drain completely before adding the flash aliquot. The leachate was collected for the
determination of individual cations. The residue retained on the filter paper was taken form the
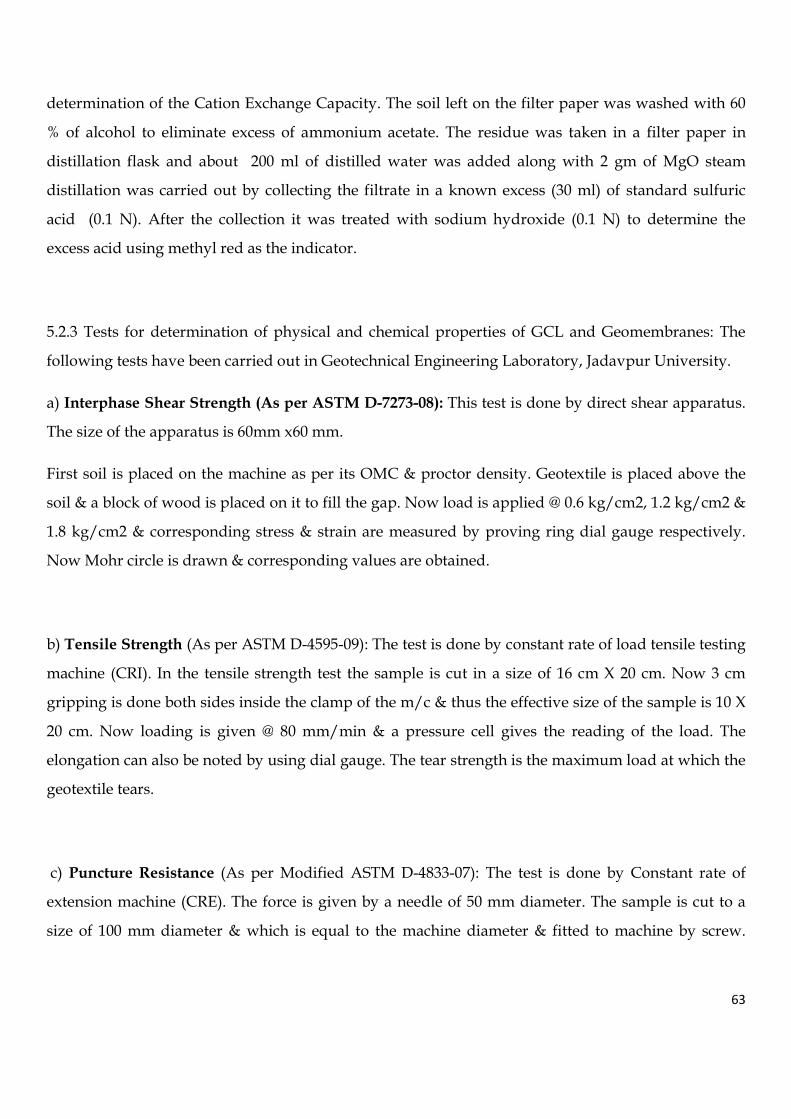
63
determination of the Cation Exchange Capacity. The soil left on the filter paper was washed with 60
% of alcohol to eliminate excess of ammonium acetate. The residue was taken in a filter paper in
distillation flask and about 200 ml of distilled water was added along with 2 gm of MgO steam
distillation was carried out by collecting the filtrate in a known excess (30 ml) of standard sulfuric
acid (0.1 N). After the collection it was treated with sodium hydroxide (0.1 N) to determine the
excess acid using methyl red as the indicator.
5.2.3 Tests for determination of physical and chemical properties of GCL and Geomembranes: The
following tests have been carried out in Geotechnical Engineering Laboratory, Jadavpur University.
a) Interphase Shear Strength (As per ASTM D-7273-08): This test is done by direct shear apparatus.
The size of the apparatus is 60mm x60 mm.
First soil is placed on the machine as per its OMC & proctor density. Geotextile is placed above the
soil & a block of wood is placed on it to fill the gap. Now load is applied @ 0.6 kg/cm2, 1.2 kg/cm2 &
1.8 kg/cm2 & corresponding stress & strain are measured by proving ring dial gauge respectively.
Now Mohr circle is drawn & corresponding values are obtained.
b) Tensile Strength (As per ASTM D-4595-09): The test is done by constant rate of load tensile testing
machine (CRI). In the tensile strength test the sample is cut in a size of 16 cm X 20 cm. Now 3 cm
gripping is done both sides inside the clamp of the m/c & thus the effective size of the sample is 10 X
20 cm. Now loading is given @ 80 mm/min & a pressure cell gives the reading of the load. The
elongation can also be noted by using dial gauge. The tear strength is the maximum load at which the
geotextile tears.
c) Puncture Resistance (As per Modified ASTM D-4833-07): The test is done by Constant rate of
extension machine (CRE). The force is given by a needle of 50 mm diameter. The sample is cut to a
size of 100 mm diameter & which is equal to the machine diameter & fitted to machine by screw.
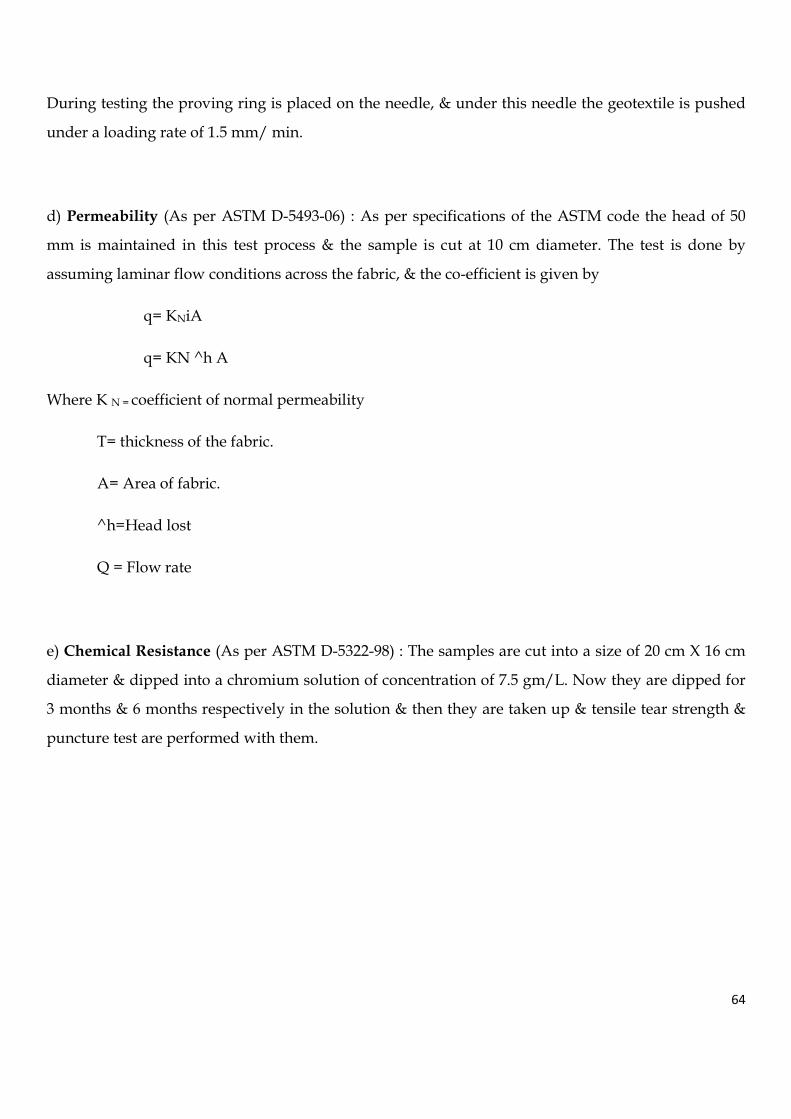
64
During testing the proving ring is placed on the needle, & under this needle the geotextile is pushed
under a loading rate of 1.5 mm/ min.
d) Permeability (As per ASTM D-5493-06) : As per specifications of the ASTM code the head of 50
mm is maintained in this test process & the sample is cut at 10 cm diameter. The test is done by
assuming laminar flow conditions across the fabric, & the co-efficient is given by
q= KNiA
q= KN ^h A
Where K N = coefficient of normal permeability
T= thickness of the fabric.
A= Area of fabric.
^h=Head lost
Q = Flow rate
e) Chemical Resistance (As per ASTM D-5322-98) : The samples are cut into a size of 20 cm X 16 cm
diameter & dipped into a chromium solution of concentration of 7.5 gm/L. Now they are dipped for
3 months & 6 months respectively in the solution & then they are taken up & tensile tear strength &
puncture test are performed with them.
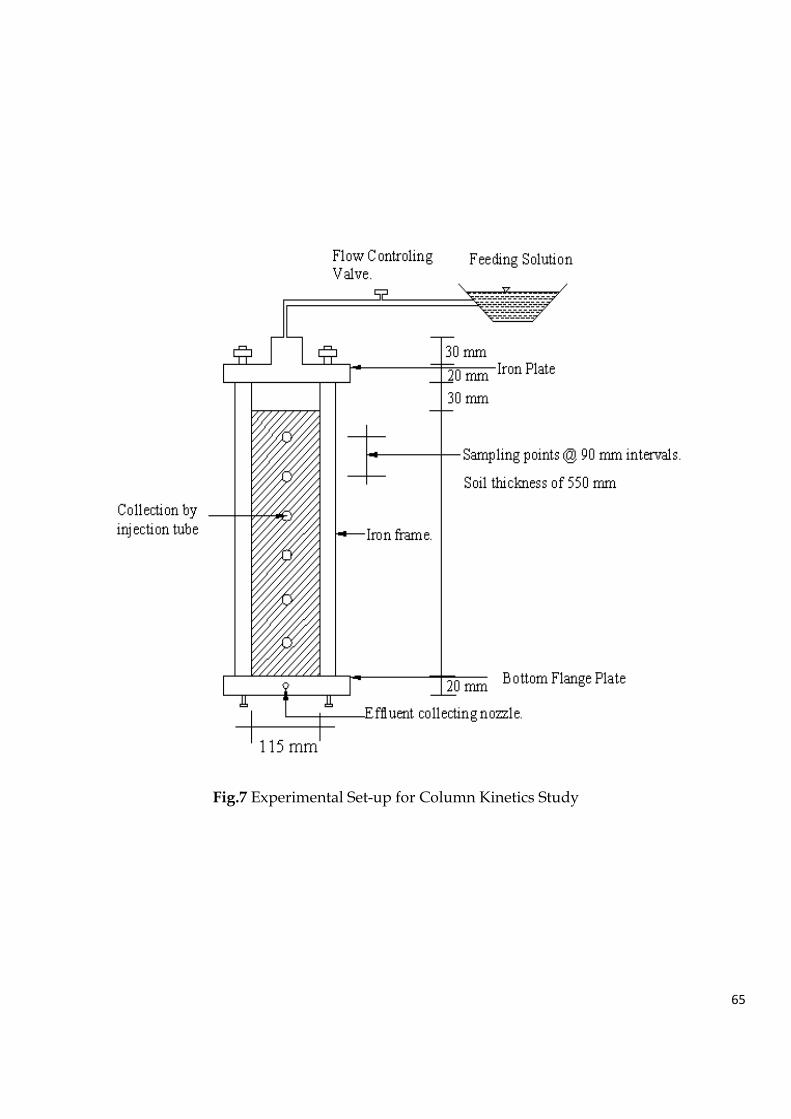
65
Fig.7 Experimental Set-up for Column Kinetics Study
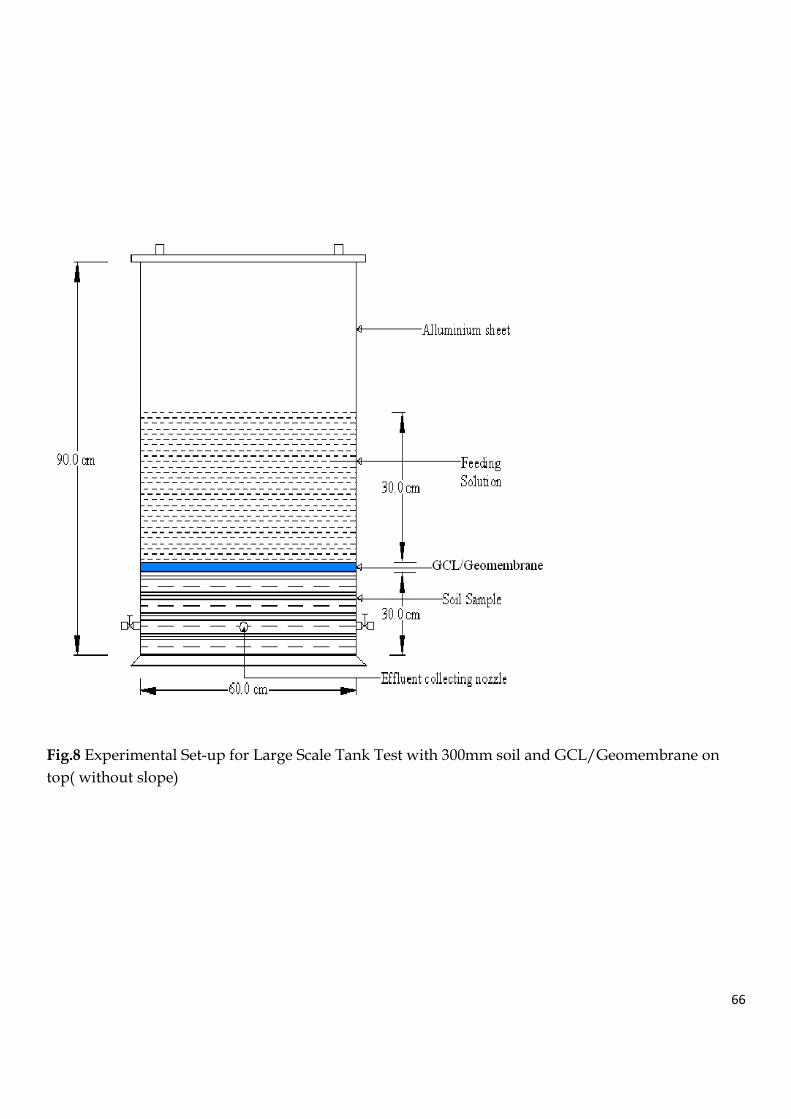
66
Fig.8 Experimental Set-up for Large Scale Tank Test with 300mm soil and GCL/Geomembrane on
top( without slope)
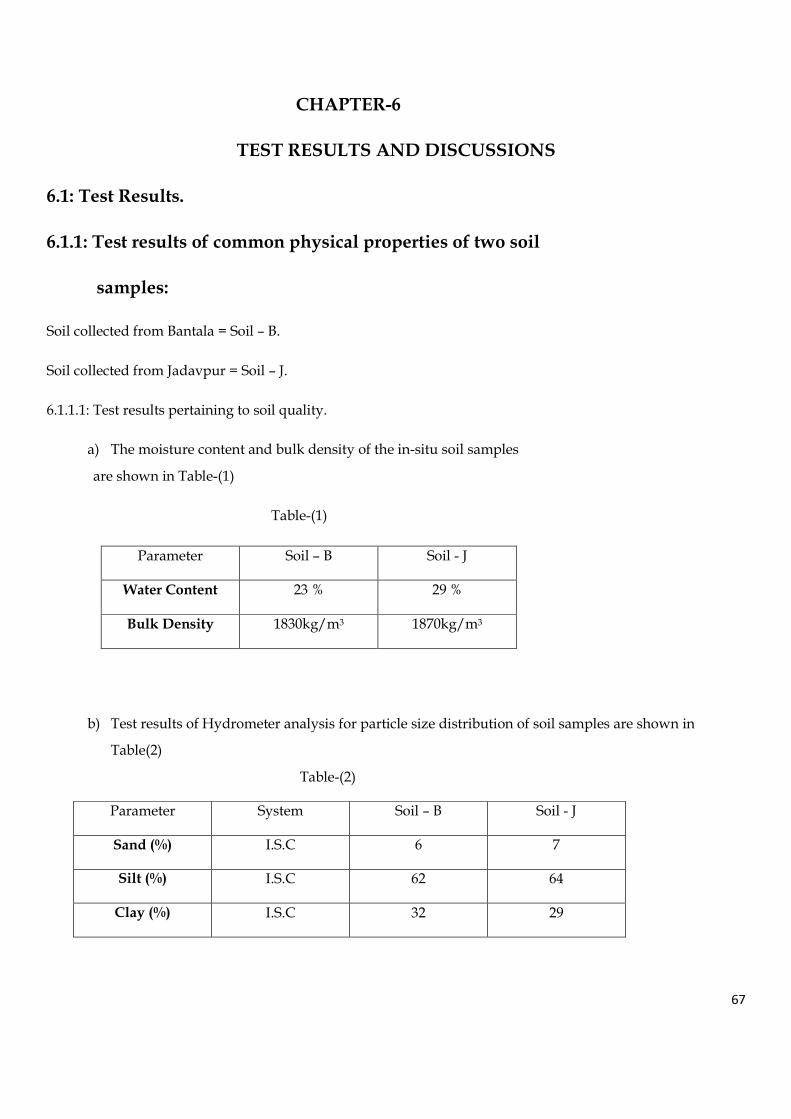
67
CHAPTER-6
TEST RESULTS AND DISCUSSIONS
6.1: Test Results.
6.1.1: Test results of common physical properties of two soil
samples:
Soil collected from Bantala = Soil – B.
Soil collected from Jadavpur = Soil – J.
6.1.1.1: Test results pertaining to soil quality.
a) The moisture content and bulk density of the in-situ soil samples
are shown in Table-(1)
Table-(1)
Parameter Soil – B Soil - J
Water Content 23 % 29 %
Bulk Density 1830kg/m3 1870kg/m3
b) Test results of Hydrometer analysis for particle size distribution of soil samples are shown in
Table(2)
Table-(2)
Parameter System Soil – B Soil - J
Sand (%) I.S.C 6 7
Silt (%) I.S.C 62 64
Clay (%) I.S.C 32 29
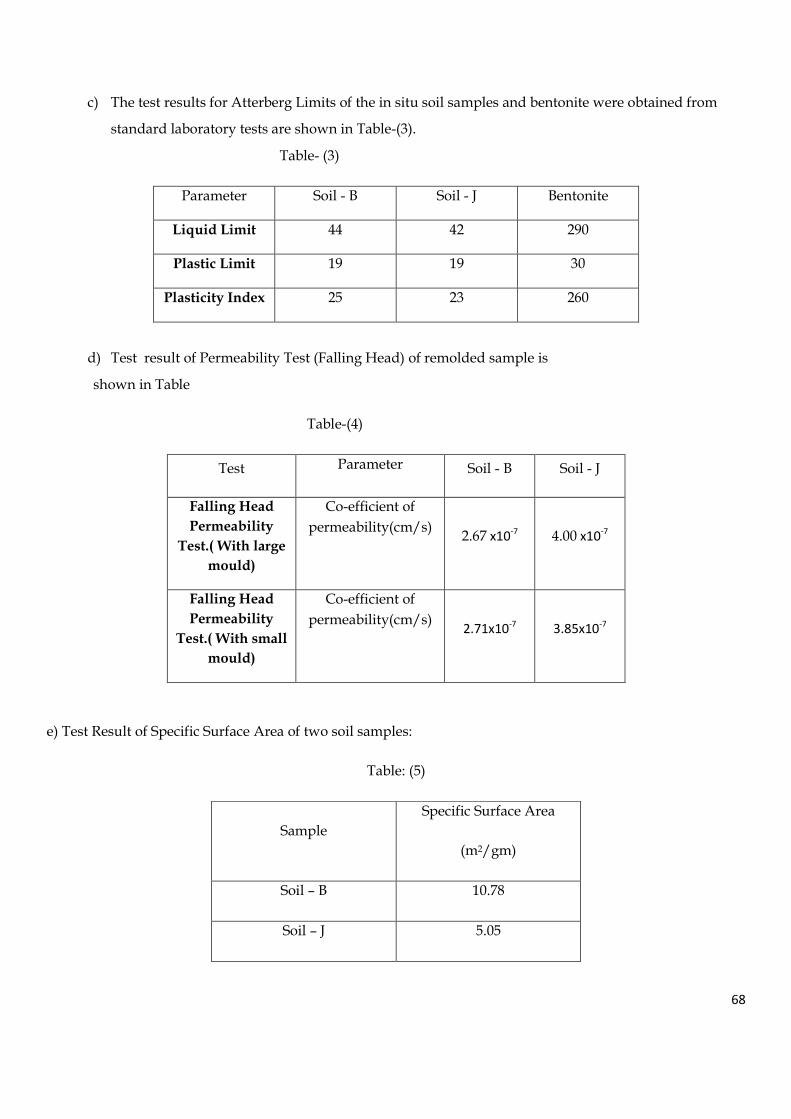
68
c) The test results for Atterberg Limits of the in situ soil samples and bentonite were obtained from
standard laboratory tests are shown in Table-(3).
Table- (3)
Parameter Soil - B Soil - J Bentonite
Liquid Limit 44 42 290
Plastic Limit 19 19 30
Plasticity Index 25 23 260
d) Test result of Permeability Test (Falling Head) of remolded sample is
shown in Table
Table-(4)
Test Parameter Soil - B Soil - J
Falling Head
Permeability
Test.( With large
mould)
Co-efficient of
permeability(cm/s) 2.67 x10
-7 4.00 x10⁻⁷
Falling Head
Permeability
Test.( With small
mould)
Co-efficient of
permeability(cm/s) 2.71x10
-7 3.85x10⁻⁷
e) Test Result of Specific Surface Area of two soil samples:
Table: (5)
Sample
Specific Surface Area
(m2/gm)
Soil – B 10.78
Soil – J 5.05
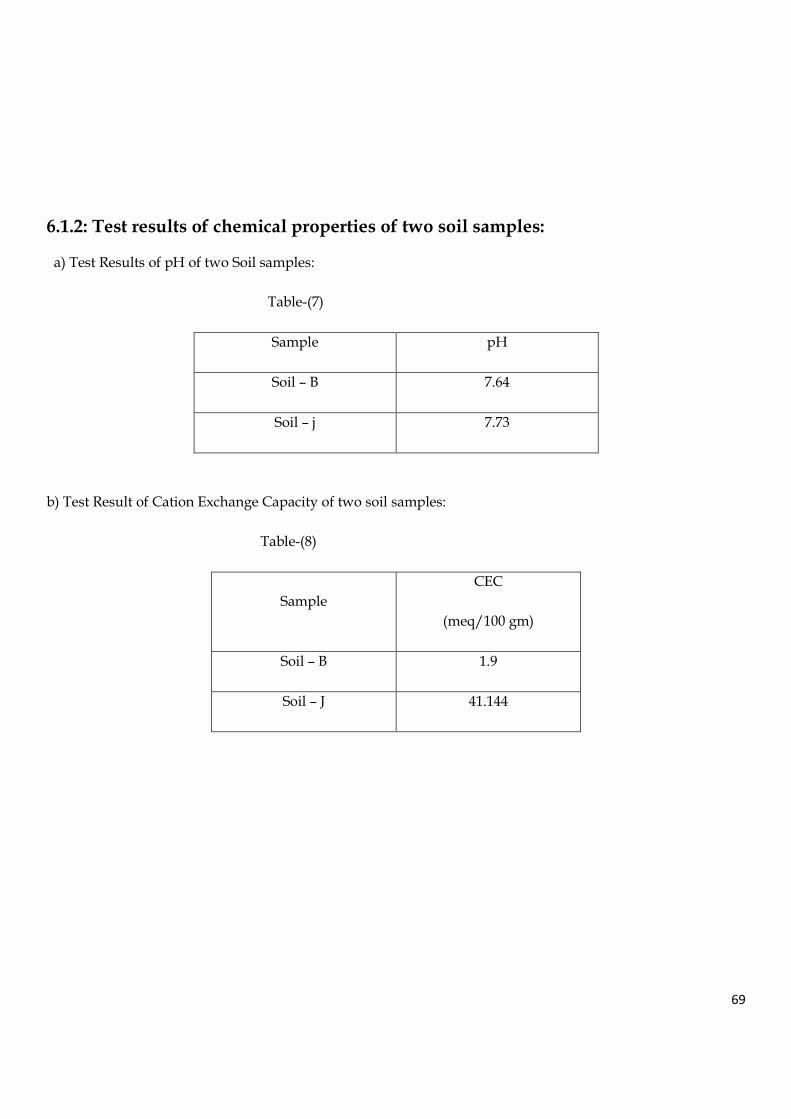
69
6.1.2: Test results of chemical properties of two soil samples:
a) Test Results of pH of two Soil samples:
Table-(7)
Sample pH
Soil – B 7.64
Soil – j 7.73
b) Test Result of Cation Exchange Capacity of two soil samples:
Table-(8)
Sample
CEC
(meq/100 gm)
Soil – B 1.9
Soil – J 41.144
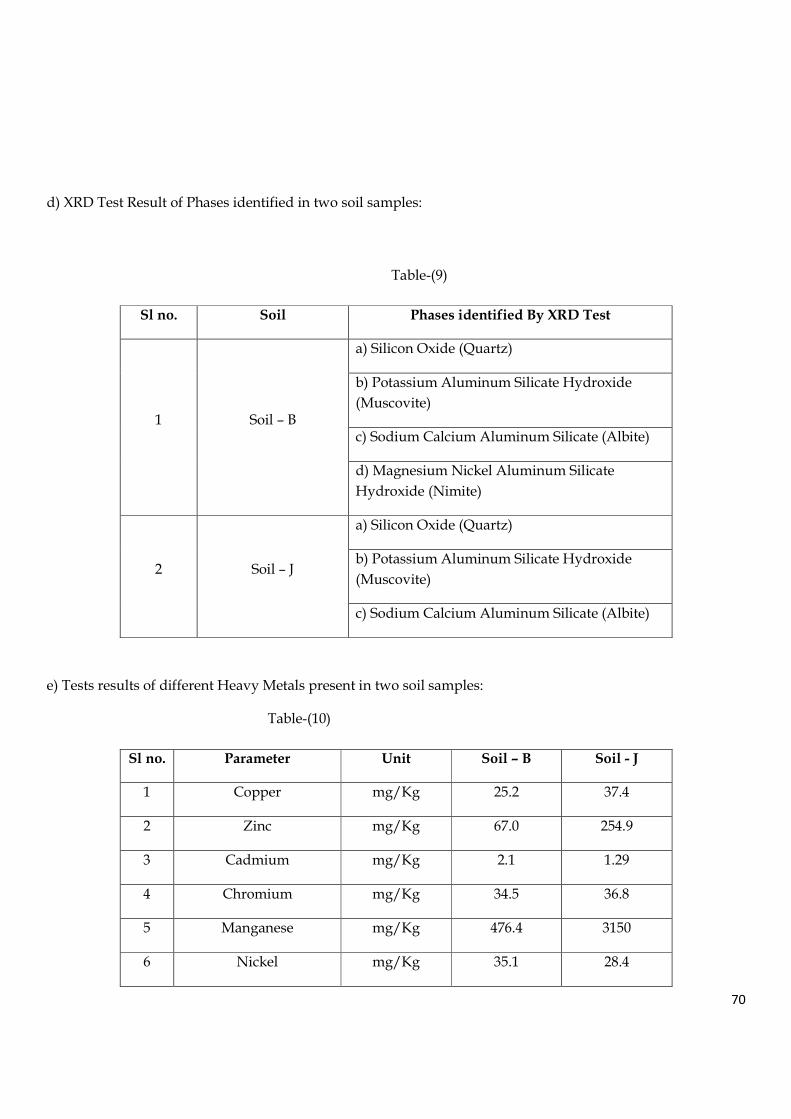
70
d) XRD Test Result of Phases identified in two soil samples:
Table-(9)
Sl no. Soil Phases identified By XRD Test
1 Soil – B
a) Silicon Oxide (Quartz)
b) Potassium Aluminum Silicate Hydroxide
(Muscovite)
c) Sodium Calcium Aluminum Silicate (Albite)
d) Magnesium Nickel Aluminum Silicate
Hydroxide (Nimite)
2 Soil – J
a) Silicon Oxide (Quartz)
b) Potassium Aluminum Silicate Hydroxide
(Muscovite)
c) Sodium Calcium Aluminum Silicate (Albite)
e) Tests results of different Heavy Metals present in two soil samples:
Table-(10)
Sl no. Parameter Unit Soil – B Soil - J
1 Copper mg/Kg 25.2 37.4
2 Zinc mg/Kg 67.0 254.9
3 Cadmium mg/Kg 2.1 1.29
4 Chromium mg/Kg 34.5 36.8
5 Manganese mg/Kg 476.4 3150
6 Nickel mg/Kg 35.1 28.4
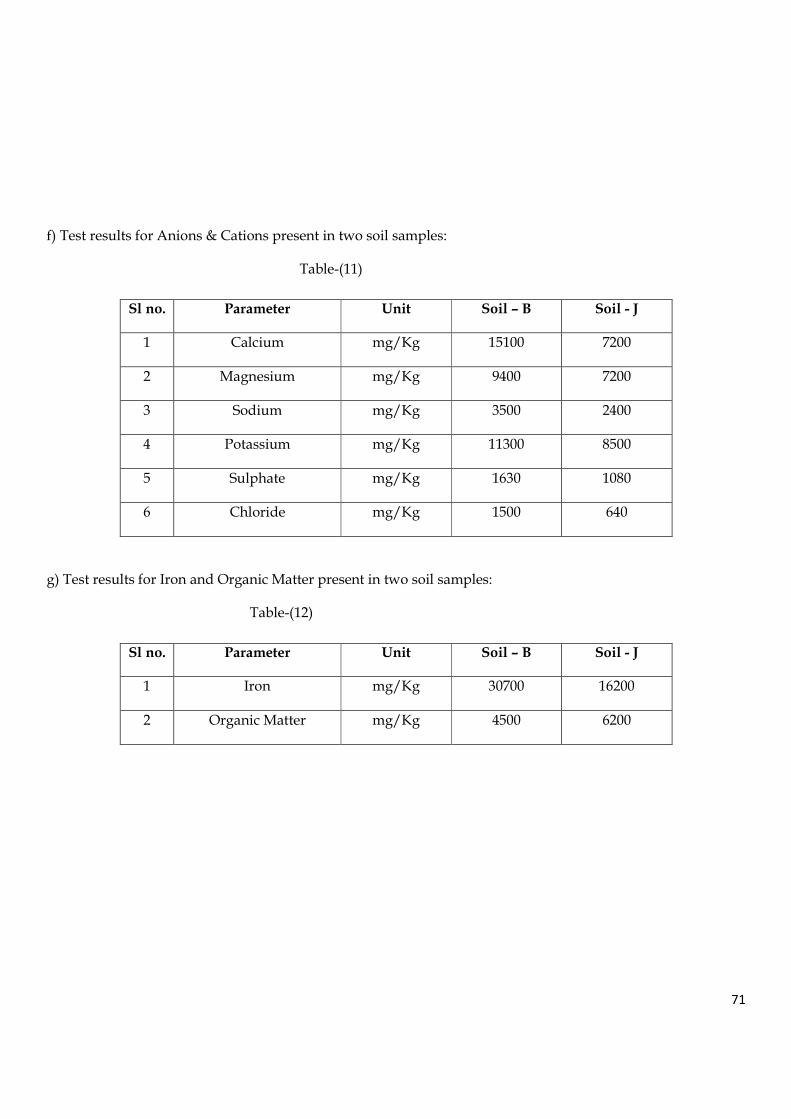
71
f) Test results for Anions & Cations present in two soil samples:
Table-(11)
Sl no. Parameter Unit Soil – B Soil - J
1 Calcium mg/Kg 15100 7200
2 Magnesium mg/Kg 9400 7200
3 Sodium mg/Kg 3500 2400
4 Potassium mg/Kg 11300 8500
5 Sulphate mg/Kg 1630 1080
6 Chloride mg/Kg 1500 640
g) Test results for Iron and Organic Matter present in two soil samples:
Table-(12)
Sl no. Parameter Unit Soil – B Soil - J
1 Iron mg/Kg 30700 16200
2 Organic Matter mg/Kg 4500 6200
72
Discussion on soil quality:
The test results of some relevant physical properties of two soil samples namely Soil – B
(collected from Bantala) & Soil – J (collected from Jadavpur) are presented in Table (1) through Table
(5). Both the soil was collected from 2 m depth from the existing ground level. The data revealed that
the soils are primarily cohesive in nature, with high silt content and low permeability. Silt content of
Soil –B & Soil – J are 62% and 64% respectively. The hydraulic conductivity (K) values for Soil – B and
Soil – J are 2.70 x 10⁻⁷ cm/s and 3.93 x 10⁻⁷ cm/s respectively. Both the K values are slightly greater
than the desired permeability of 1 x 10⁻⁷ cm/s for using same as clay liner. Hence the soils possess a
reasonable property against transmission of leachate to the surrounding ground water resources due
to low permeability.
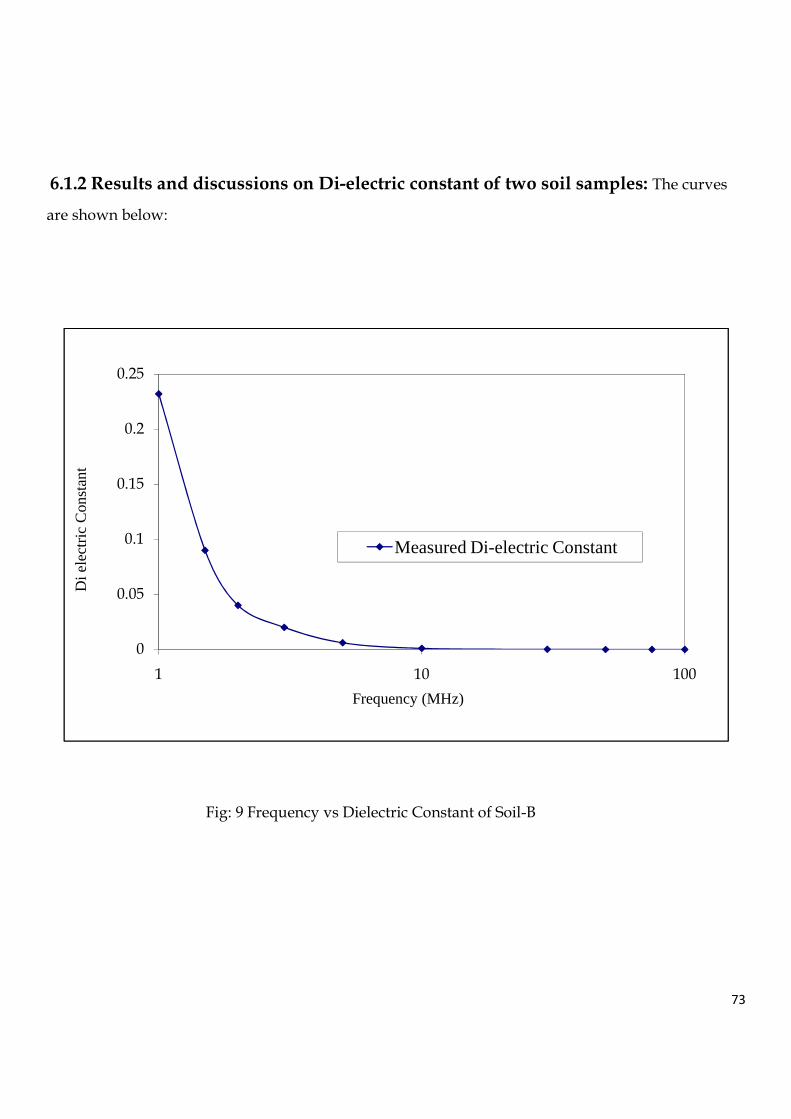
73
6.1.2 Results and discussions on Di-electric constant of two soil samples: The curves
are shown below:
Fig: 9 Frequency vs Dielectric Constant of Soil-B
0
0.05
0.1
0.15
0.2
0.25
1 10 100
Di e
lect
ric C
onst
ant
Frequency (MHz)
Measured Di-electric Constant
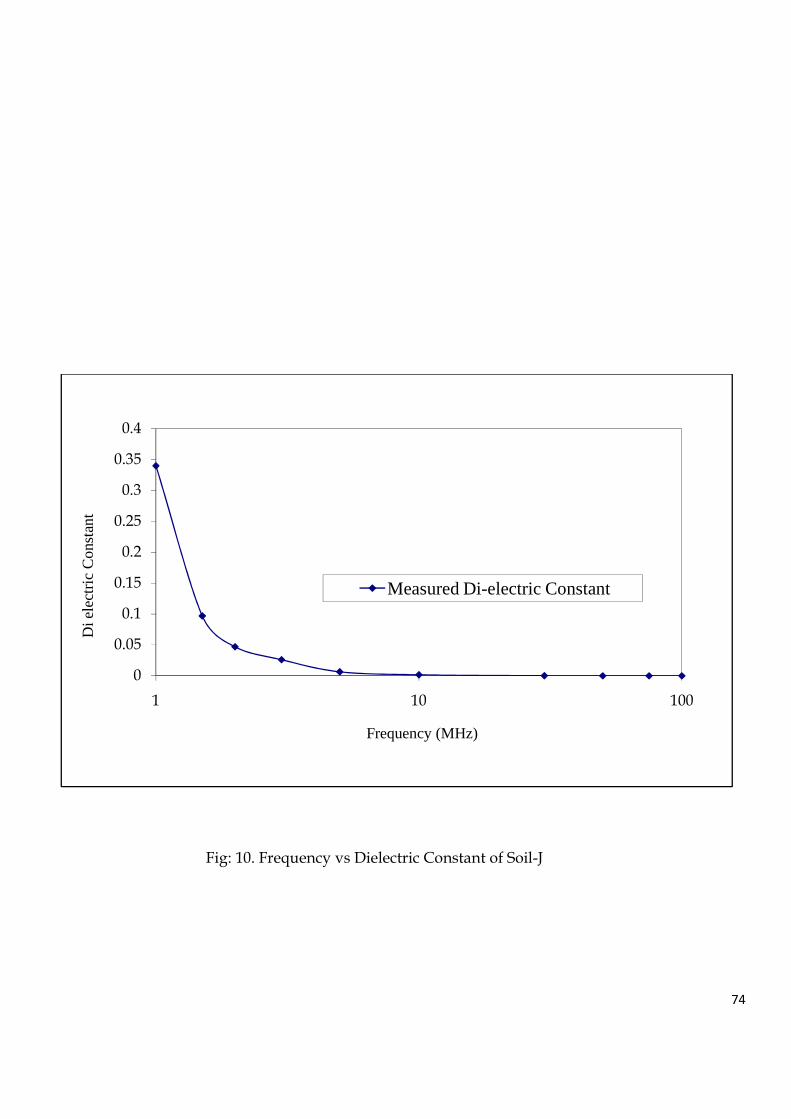
74
Fig: 10. Frequency vs Dielectric Constant of Soil-J
0
0.05
0.1
0.15
0.2
0.25
0.3
0.35
0.4
1 10 100
Di e
lect
ric
Co
nsta
nt
Frequency (MHz)
Measured Di-electric Constant
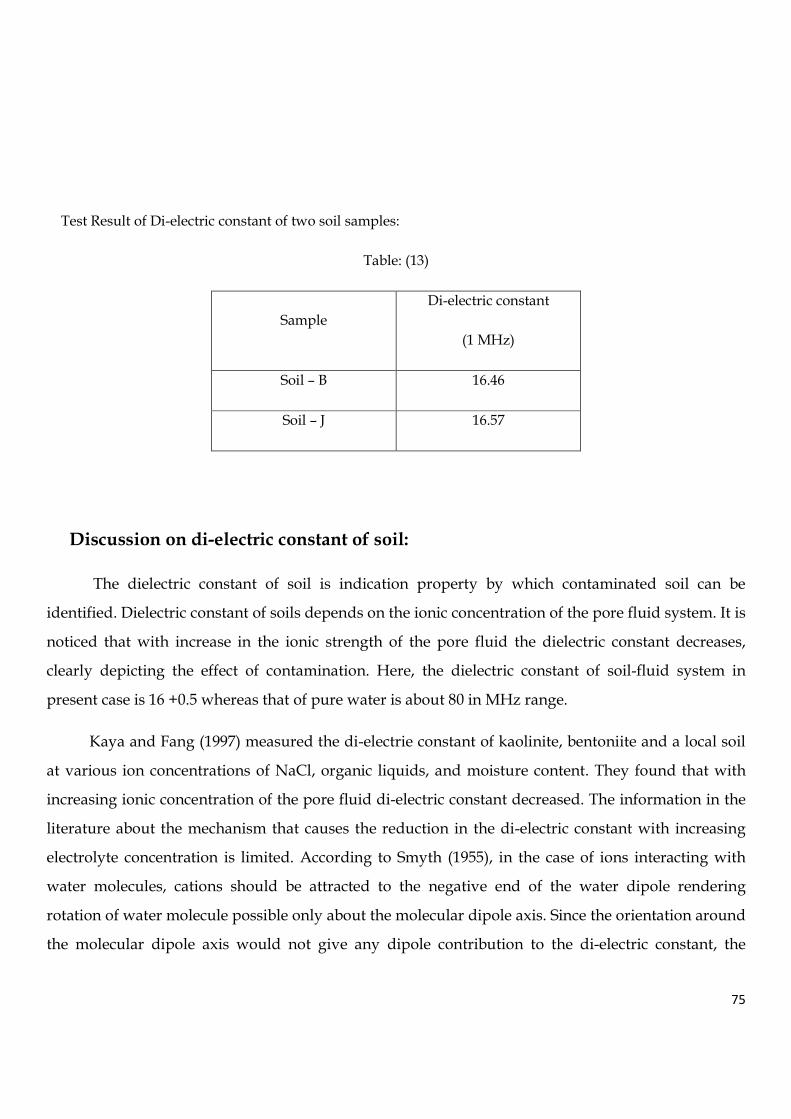
75
Test Result of Di-electric constant of two soil samples:
Table: (13)
Sample
Di-electric constant
(1 MHz)
Soil – B 16.46
Soil – J 16.57
Discussion on di-electric constant of soil:
The dielectric constant of soil is indication property by which contaminated soil can be
identified. Dielectric constant of soils depends on the ionic concentration of the pore fluid system. It is
noticed that with increase in the ionic strength of the pore fluid the dielectric constant decreases,
clearly depicting the effect of contamination. Here, the dielectric constant of soil-fluid system in
present case is 16 +0.5 whereas that of pure water is about 80 in MHz range.
Kaya and Fang (1997) measured the di-electrie constant of kaolinite, bentoniite and a local soil
at various ion concentrations of NaCl, organic liquids, and moisture content. They found that with
increasing ionic concentration of the pore fluid di-electric constant decreased. The information in the
literature about the mechanism that causes the reduction in the di-electric constant with increasing
electrolyte concentration is limited. According to Smyth (1955), in the case of ions interacting with
water molecules, cations should be attracted to the negative end of the water dipole rendering
rotation of water molecule possible only about the molecular dipole axis. Since the orientation around
the molecular dipole axis would not give any dipole contribution to the di-electric constant, the
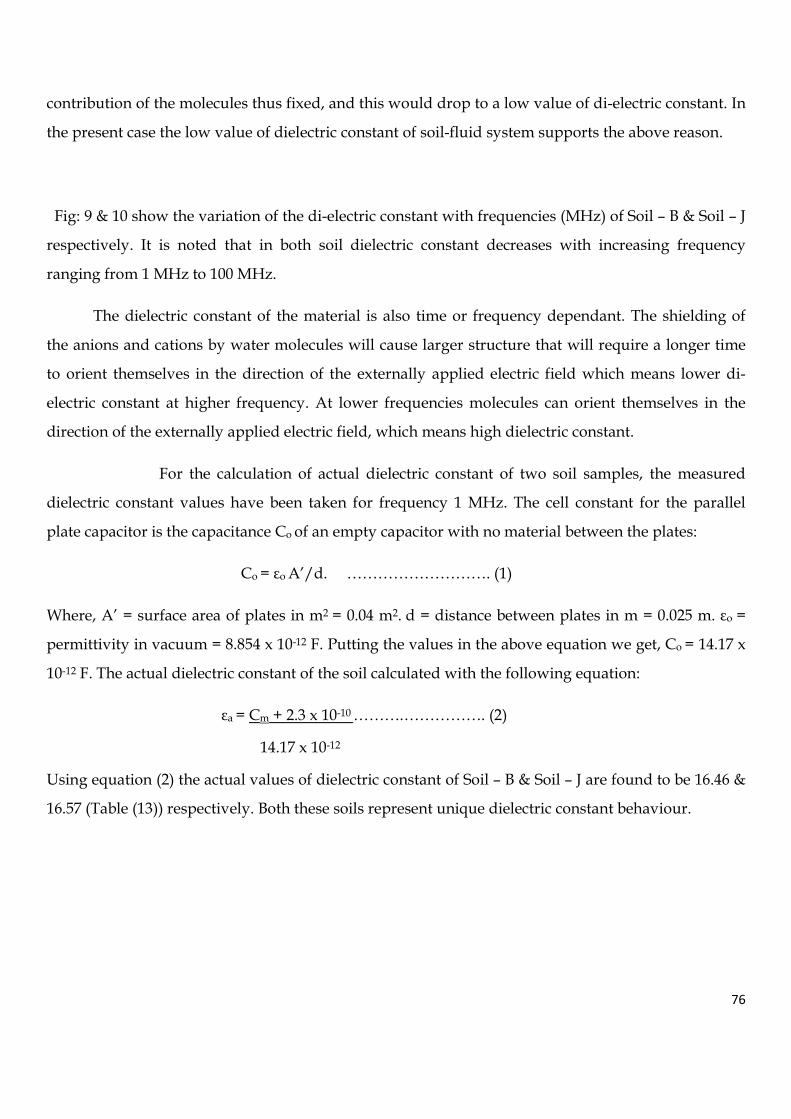
76
contribution of the molecules thus fixed, and this would drop to a low value of di-electric constant. In
the present case the low value of dielectric constant of soil-fluid system supports the above reason.
Fig: 9 & 10 show the variation of the di-electric constant with frequencies (MHz) of Soil – B & Soil – J
respectively. It is noted that in both soil dielectric constant decreases with increasing frequency
ranging from 1 MHz to 100 MHz.
The dielectric constant of the material is also time or frequency dependant. The shielding of
the anions and cations by water molecules will cause larger structure that will require a longer time
to orient themselves in the direction of the externally applied electric field which means lower di-
electric constant at higher frequency. At lower frequencies molecules can orient themselves in the
direction of the externally applied electric field, which means high dielectric constant.
For the calculation of actual dielectric constant of two soil samples, the measured
dielectric constant values have been taken for frequency 1 MHz. The cell constant for the parallel
plate capacitor is the capacitance Co of an empty capacitor with no material between the plates:
Co = εo A’/d. ………………………. (1)
Where, A’ = surface area of plates in m2 = 0.04 m2. d = distance between plates in m = 0.025 m. εo =
permittivity in vacuum = 8.854 x 10⁻¹² F. Putting the values in the above equation we get, Co = 14.17 x
10-12 F. The actual dielectric constant of the soil calculated with the following equation:
εa = Cm + 2.3 x 10⁻¹⁰ ……….……………. (2)
14.17 x 10⁻¹²
Using equation (2) the actual values of dielectric constant of Soil – B & Soil – J are found to be 16.46 &
16.57 (Table (13)) respectively. Both these soils represent unique dielectric constant behaviour.
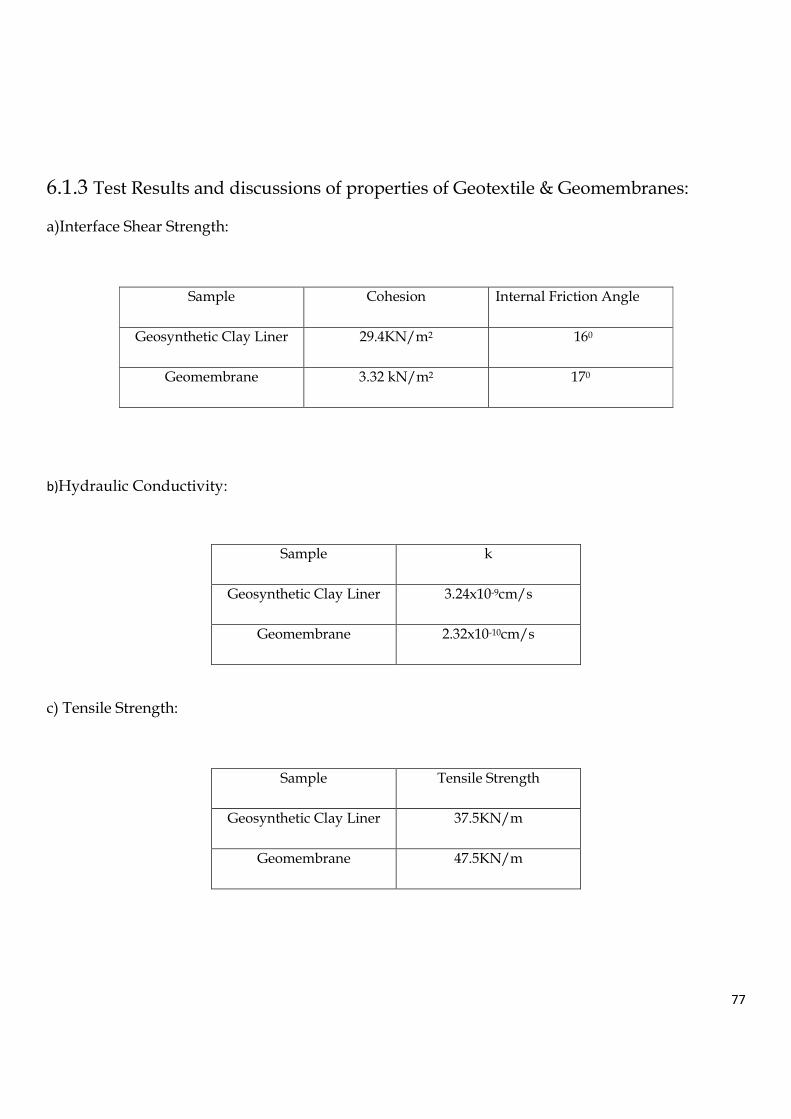
77
6.1.3 Test Results and discussions of properties of Geotextile & Geomembranes:
a)Interface Shear Strength:
Sample Cohesion Internal Friction Angle
Geosynthetic Clay Liner 29.4KN/m2 160
Geomembrane 3.32 kN/m2 170
b)Hydraulic Conductivity:
Sample k
Geosynthetic Clay Liner 3.24x10⁻⁹cm/s
Geomembrane 2.32x10⁻¹⁰cm/s
c) Tensile Strength:
Sample Tensile Strength
Geosynthetic Clay Liner 37.5KN/m
Geomembrane 47.5KN/m
78
d)Puncture Resistance:
Sample Puncture Resistance
Geosynthetic Clay Liner 0.472KN
Geomembrane 0.614KN
e)Chemical Resistance:
Sample
Tensile Strength after
3month immersion in
chromium solution.
Tensile Strength after 6month
immersion in chromium solution.
Geosynthetic Clay Liner 34.5KN/m 30.0KN/m
Geomembrane 40KN/m 35.5KN/m
Sample
Puncture Resistance after
3month immersion in
chromium solution.
Puncture Resistance after
6month immersion in chromium
solution.
Geosynthetic Clay Liner 0.432KN 0.402KN
Geomembrane 0.57KN 0.544KN
79
Discussion on properties of GCL and Geomembrane properties:
a) Tensile Strength: Minimum value specified for geosynthetics is 13.5KN/m (Rao 1999) . Both GCL
and Geomembranes used are fulfilling the liner criteria (Table 6.1.3,c)
b). Hydraulic conductivity: Specified value is in order of 1x10⁻⁸ cm/s minimum in case of GCL and
in order of 1x10⁻⁹cm/s minimum(Rao1999) in case of Geomembranes. Both GCL and Geomembranes
used are fulfilling the liner criteria (Table 6.1.3,b).
c) Puncture Strength: Minimum value specified is 0.36KN (Rao 1999). Both GCL and Geomembranes
used are fulfilling the liner criteria (Table 6.1.3,d).
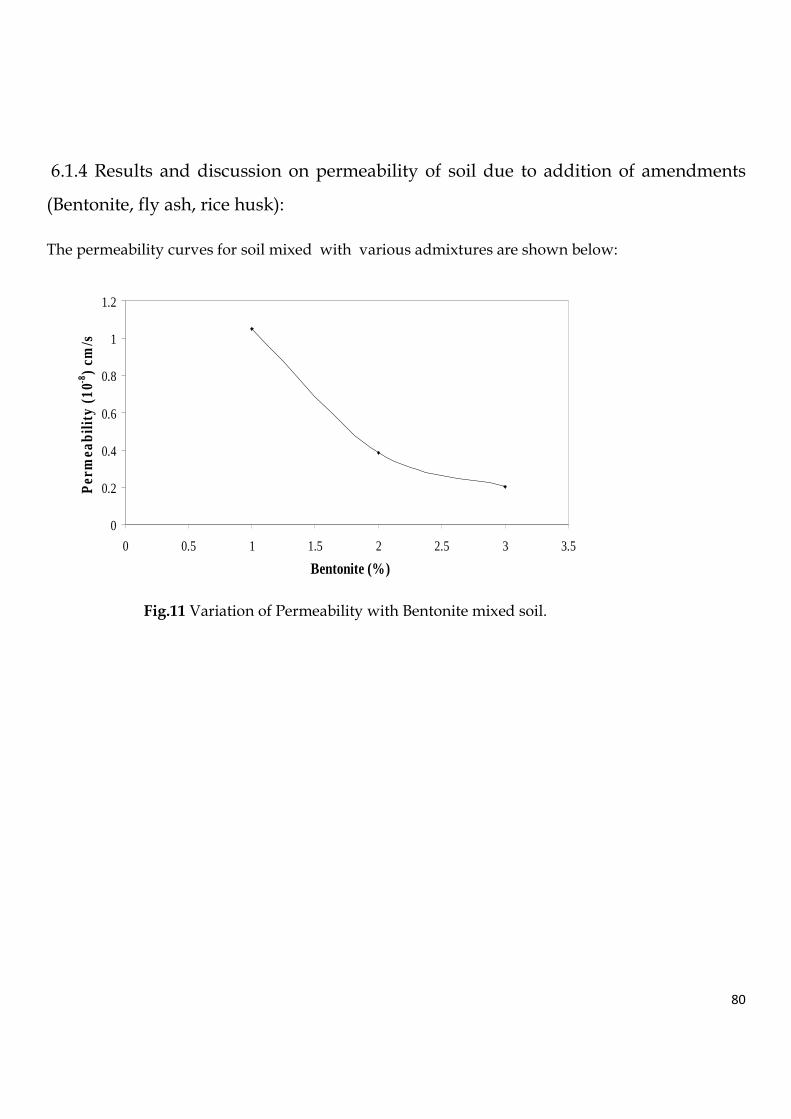
80
6.1.4 Results and discussion on permeability of soil due to addition of amendments
(Bentonite, fly ash, rice husk):
The permeability curves for soil mixed with various admixtures are shown below:
Fig.11 Variation of Permeability with Bentonite mixed soil.
0
0.2
0.4
0.6
0.8
1
1.2
0 0.5 1 1.5 2 2.5 3 3.5
Bentonite (%)
Per
mea
bilit
y (1
0-8)
cm/s
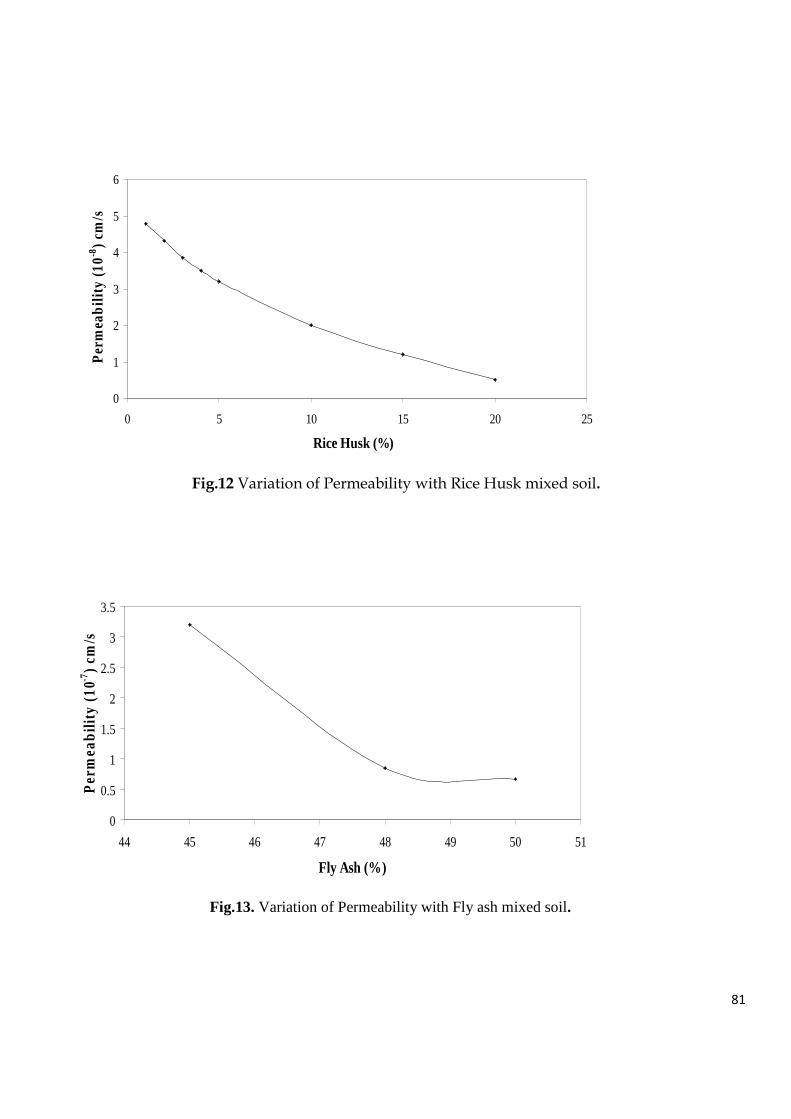
81
Fig.12 Variation of Permeability with Rice Husk mixed soil.
Fig.13. Variation of Permeability with Fly ash mixed soil.
0
1
2
3
4
5
6
0 5 10 15 20 25
Rice Husk (%)
Per
mea
bilit
y (1
0-8)
cm/s
0
0.5
1
1.5
2
2.5
3
3.5
44 45 46 47 48 49 50 51
Fly Ash (%)
Per
mea
bilit
y (1
0-7)
cm/s
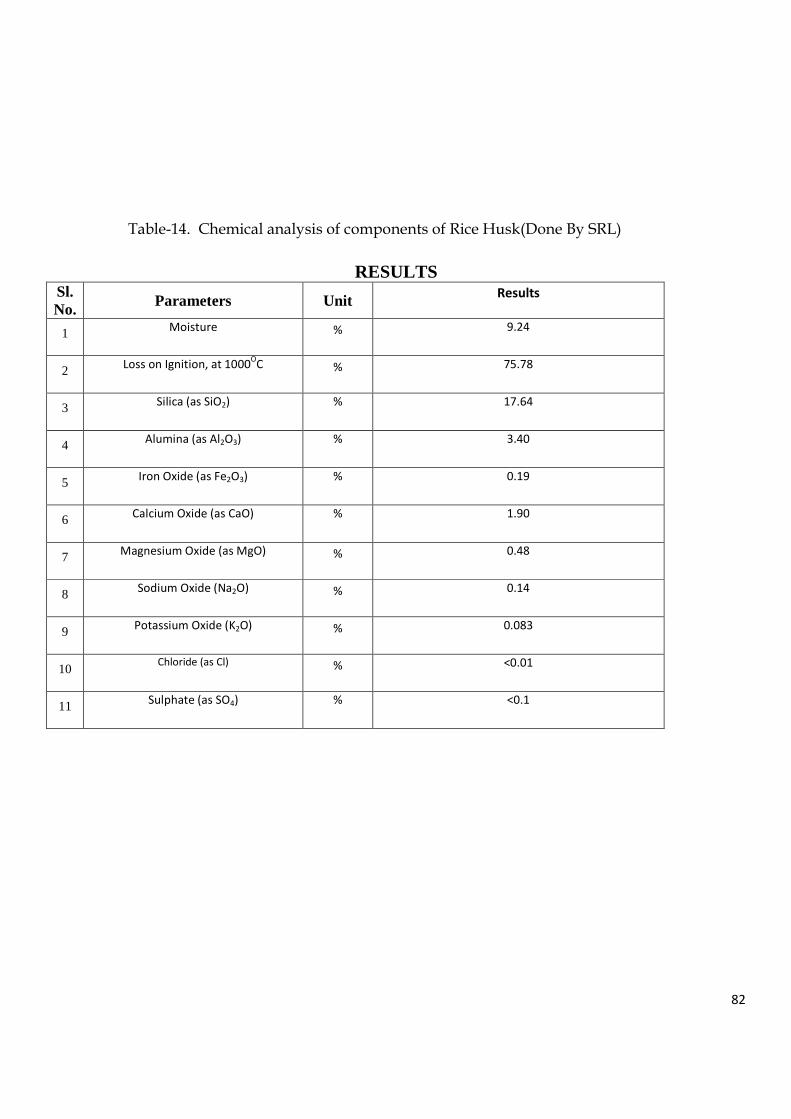
82
Table-14. Chemical analysis of components of Rice Husk(Done By SRL)
RESULTS Sl. No. Parameters Unit Results
1 Moisture % 9.24
2 Loss on Ignition, at 1000OC % 75.78
3 Silica (as SiO2) % 17.64
4 Alumina (as Al2O3) % 3.40
5 Iron Oxide (as Fe2O3) % 0.19
6 Calcium Oxide (as CaO) % 1.90
7 Magnesium Oxide (as MgO) % 0.48
8 Sodium Oxide (Na2O) % 0.14
9 Potassium Oxide (K2O) % 0.083
10 Chloride (as Cl) % <0.01
11 Sulphate (as SO4) % <0.1
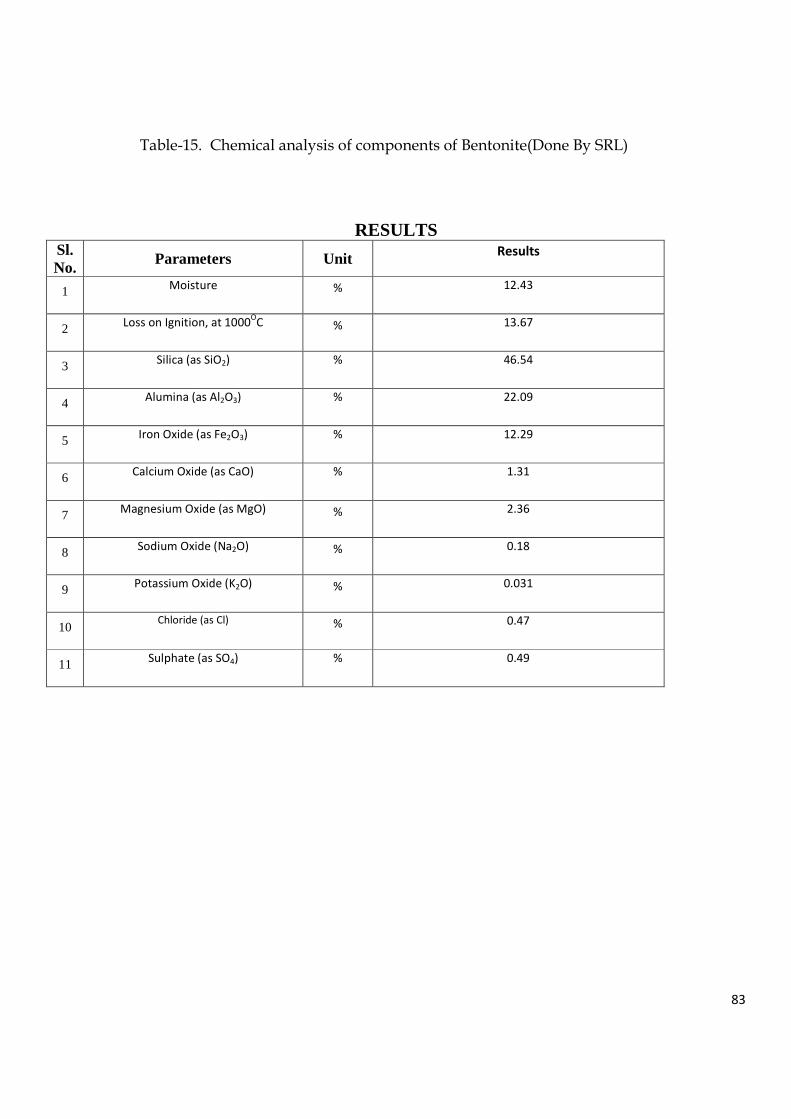
83
Table-15. Chemical analysis of components of Bentonite(Done By SRL)
RESULTS Sl. No. Parameters Unit Results
1 Moisture % 12.43
2 Loss on Ignition, at 1000OC % 13.67
3 Silica (as SiO2) % 46.54
4 Alumina (as Al2O3) % 22.09
5 Iron Oxide (as Fe2O3) % 12.29
6 Calcium Oxide (as CaO) % 1.31
7 Magnesium Oxide (as MgO) % 2.36
8 Sodium Oxide (Na2O) % 0.18
9 Potassium Oxide (K2O) % 0.031
10 Chloride (as Cl) % 0.47
11 Sulphate (as SO4) % 0.49
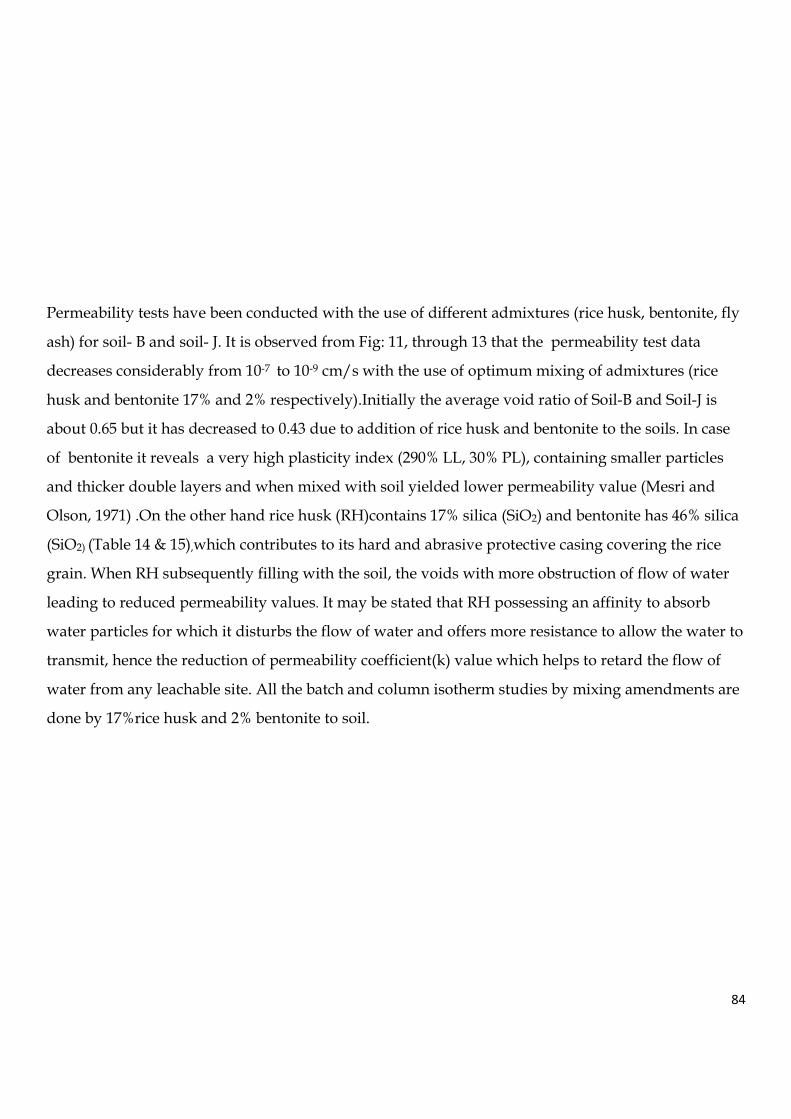
84
Permeability tests have been conducted with the use of different admixtures (rice husk, bentonite, fly
ash) for soil- B and soil- J. It is observed from Fig: 11, through 13 that the permeability test data
decreases considerably from 10-7 to 10-9 cm/s with the use of optimum mixing of admixtures (rice
husk and bentonite 17% and 2% respectively).Initially the average void ratio of Soil-B and Soil-J is
about 0.65 but it has decreased to 0.43 due to addition of rice husk and bentonite to the soils. In case
of bentonite it reveals a very high plasticity index (290% LL, 30% PL), containing smaller particles
and thicker double layers and when mixed with soil yielded lower permeability value (Mesri and
Olson, 1971) .On the other hand rice husk (RH)contains 17% silica (SiO2) and bentonite has 46% silica
(SiO2) (Table 14 & 15),which contributes to its hard and abrasive protective casing covering the rice
grain. When RH subsequently filling with the soil, the voids with more obstruction of flow of water
leading to reduced permeability values. It may be stated that RH possessing an affinity to absorb
water particles for which it disturbs the flow of water and offers more resistance to allow the water to
transmit, hence the reduction of permeability coefficient(k) value which helps to retard the flow of
water from any leachable site. All the batch and column isotherm studies by mixing amendments are
done by 17%rice husk and 2% bentonite to soil.
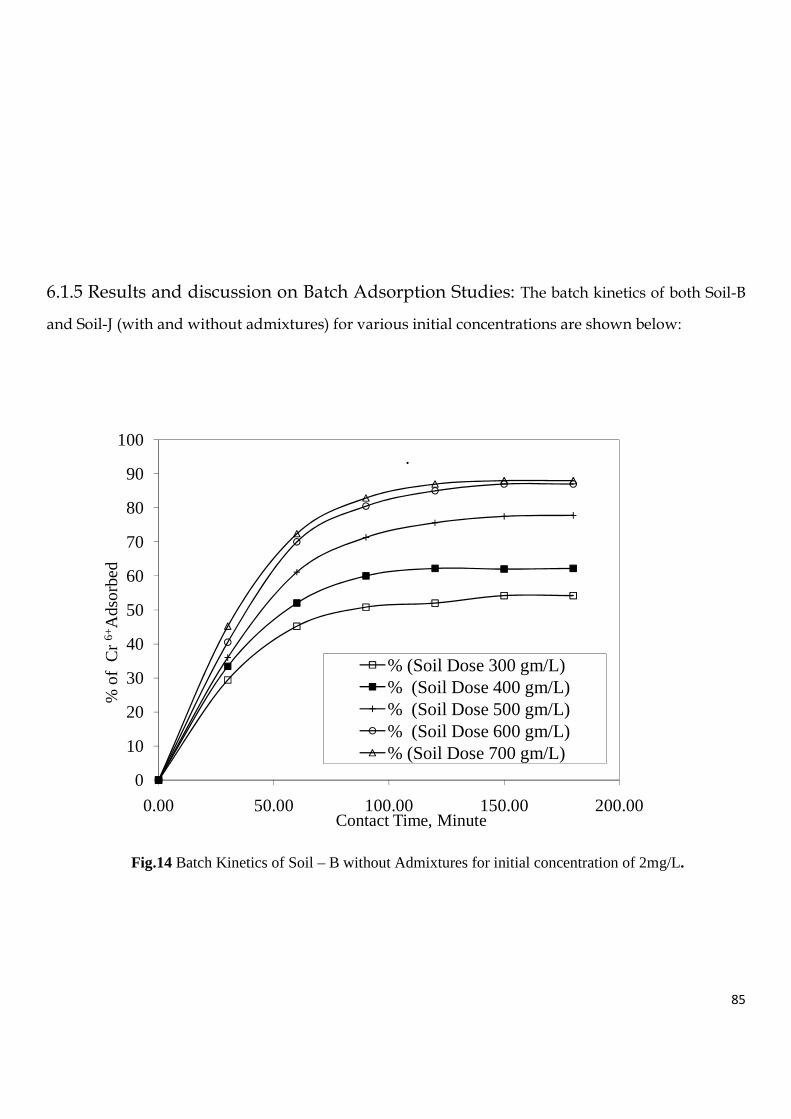
85
6.1.5 Results and discussion on Batch Adsorption Studies: The batch kinetics of both Soil-B
and Soil-J (with and without admixtures) for various initial concentrations are shown below:
Fig.14 Batch Kinetics of Soil – B without Admixtures for initial concentration of 2mg/L.
0
10
20
30
40
50
60
70
80
90
100
0.00 50.00 100.00 150.00 200.00
% o
f C
r 6+ A
dso
rbe
d
Contact Time, Minute
% (Soil Dose 300 gm/L)% (Soil Dose 400 gm/L)% (Soil Dose 500 gm/L)% (Soil Dose 600 gm/L)% (Soil Dose 700 gm/L)
.
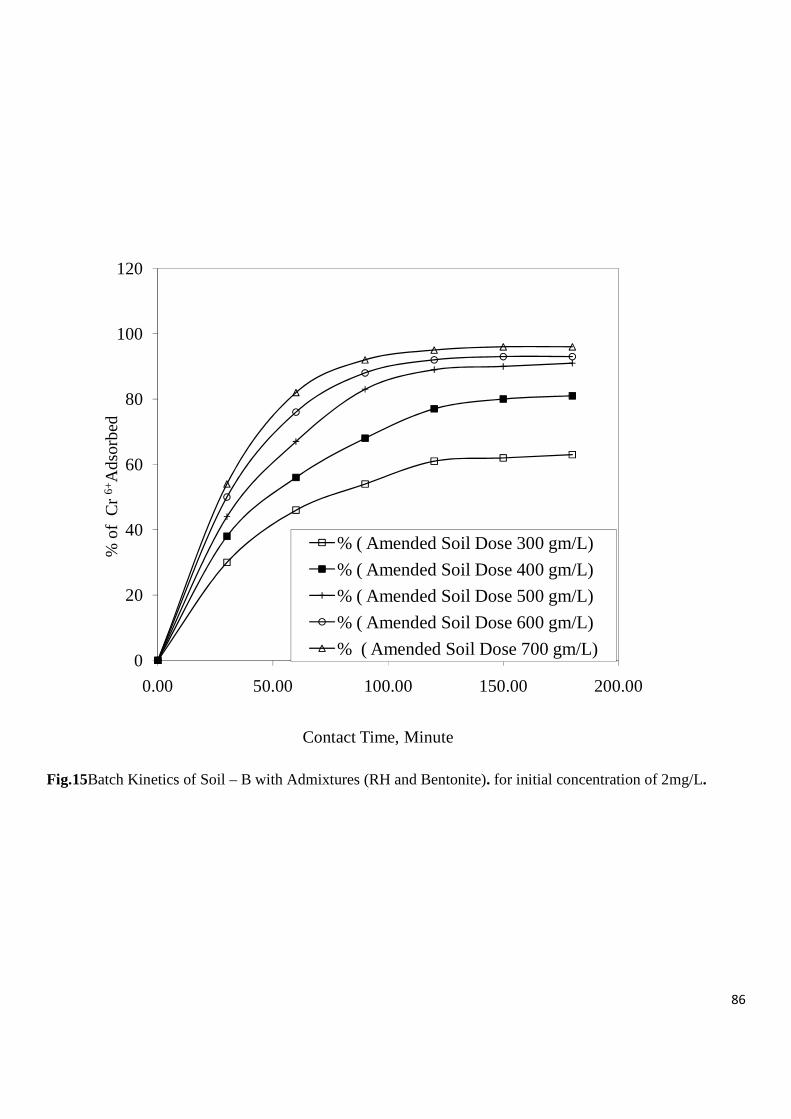
86
Fig.15Batch Kinetics of Soil – B with Admixtures (RH and Bentonite). for initial concentration of 2mg/L.
0
20
40
60
80
100
120
0.00 50.00 100.00 150.00 200.00
% o
f C
r 6+ A
dso
rbed
Contact Time, Minute
% ( Amended Soil Dose 300 gm/L)
% ( Amended Soil Dose 400 gm/L)
% ( Amended Soil Dose 500 gm/L)
% ( Amended Soil Dose 600 gm/L)
% ( Amended Soil Dose 700 gm/L)
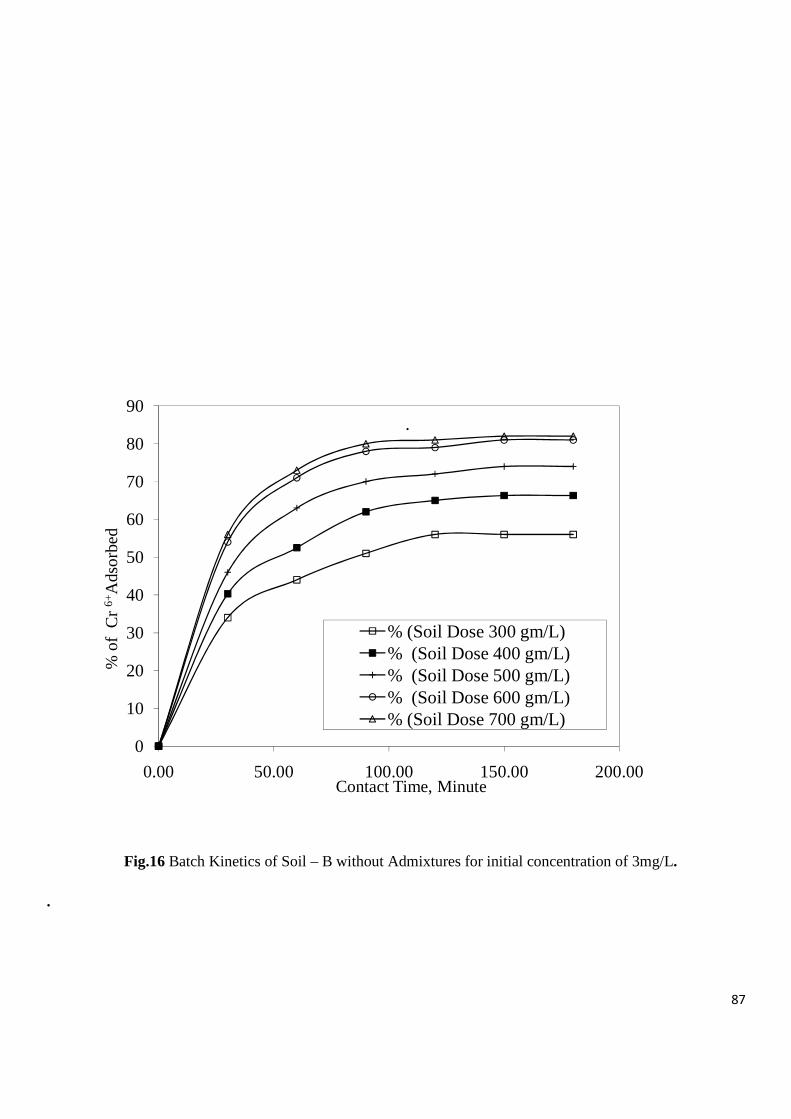
87
Fig.16 Batch Kinetics of Soil – B without Admixtures for initial concentration of 3mg/L.
.
0
10
20
30
40
50
60
70
80
90
0.00 50.00 100.00 150.00 200.00
% o
f C
r 6+ A
dso
rbe
d
Contact Time, Minute
% (Soil Dose 300 gm/L)% (Soil Dose 400 gm/L)% (Soil Dose 500 gm/L)% (Soil Dose 600 gm/L)% (Soil Dose 700 gm/L)
.
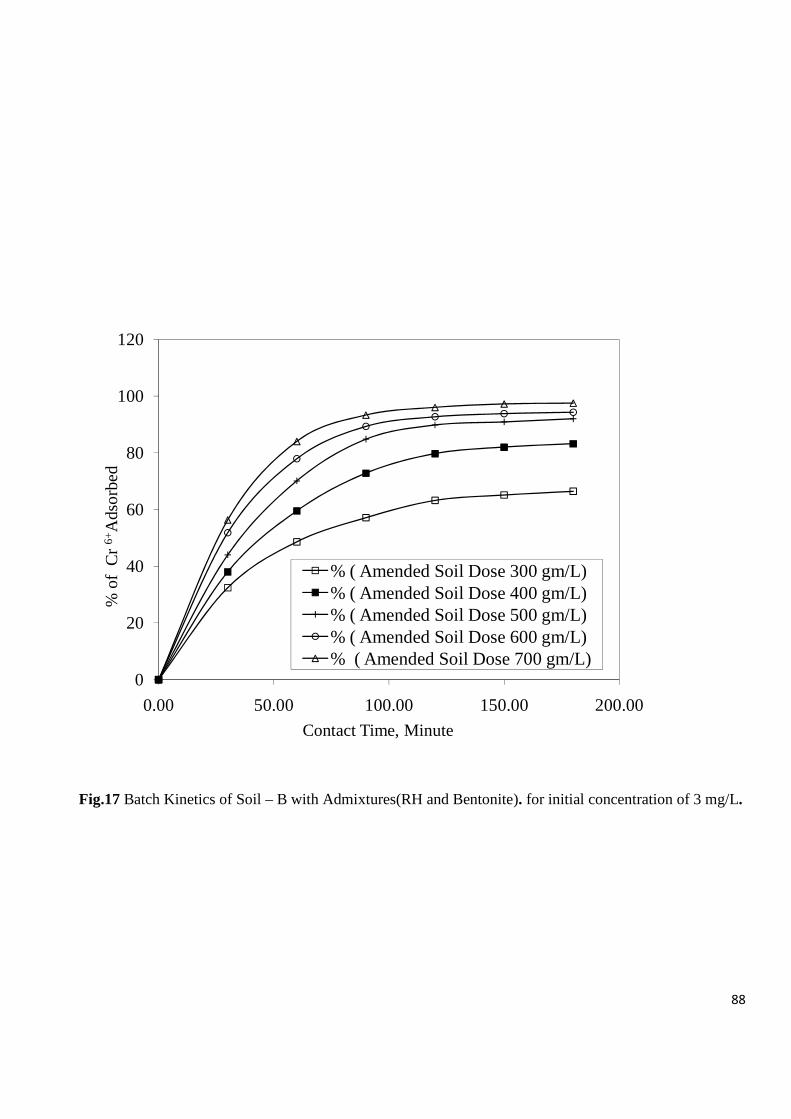
88
Fig.17 Batch Kinetics of Soil – B with Admixtures(RH and Bentonite). for initial concentration of 3 mg/L.
0
20
40
60
80
100
120
0.00 50.00 100.00 150.00 200.00
% o
f C
r 6+ A
dso
rbe
d
Contact Time, Minute
% ( Amended Soil Dose 300 gm/L)% ( Amended Soil Dose 400 gm/L)% ( Amended Soil Dose 500 gm/L)% ( Amended Soil Dose 600 gm/L)% ( Amended Soil Dose 700 gm/L)
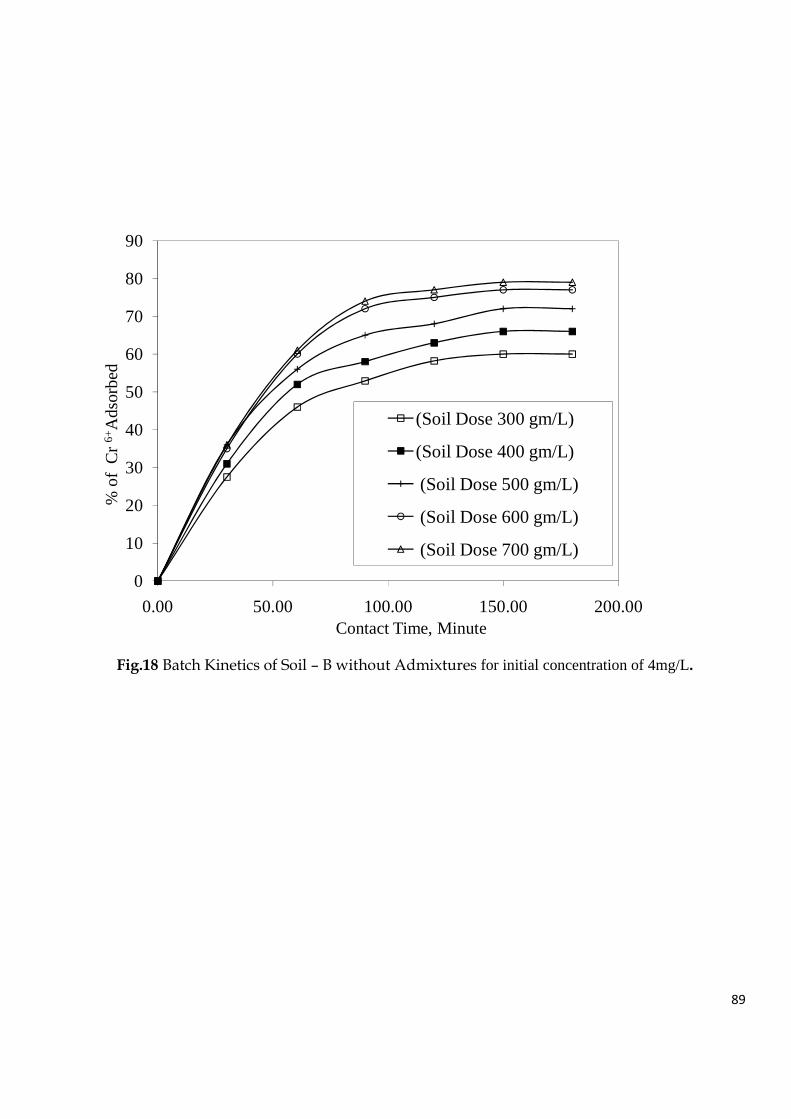
89
Fig.18 Batch Kinetics of Soil – B without Admixtures for initial concentration of 4mg/L.
0
10
20
30
40
50
60
70
80
90
0.00 50.00 100.00 150.00 200.00
% o
f C
r 6+ A
dso
rbed
Contact Time, Minute
(Soil Dose 300 gm/L)
(Soil Dose 400 gm/L)
(Soil Dose 500 gm/L)
(Soil Dose 600 gm/L)
(Soil Dose 700 gm/L)
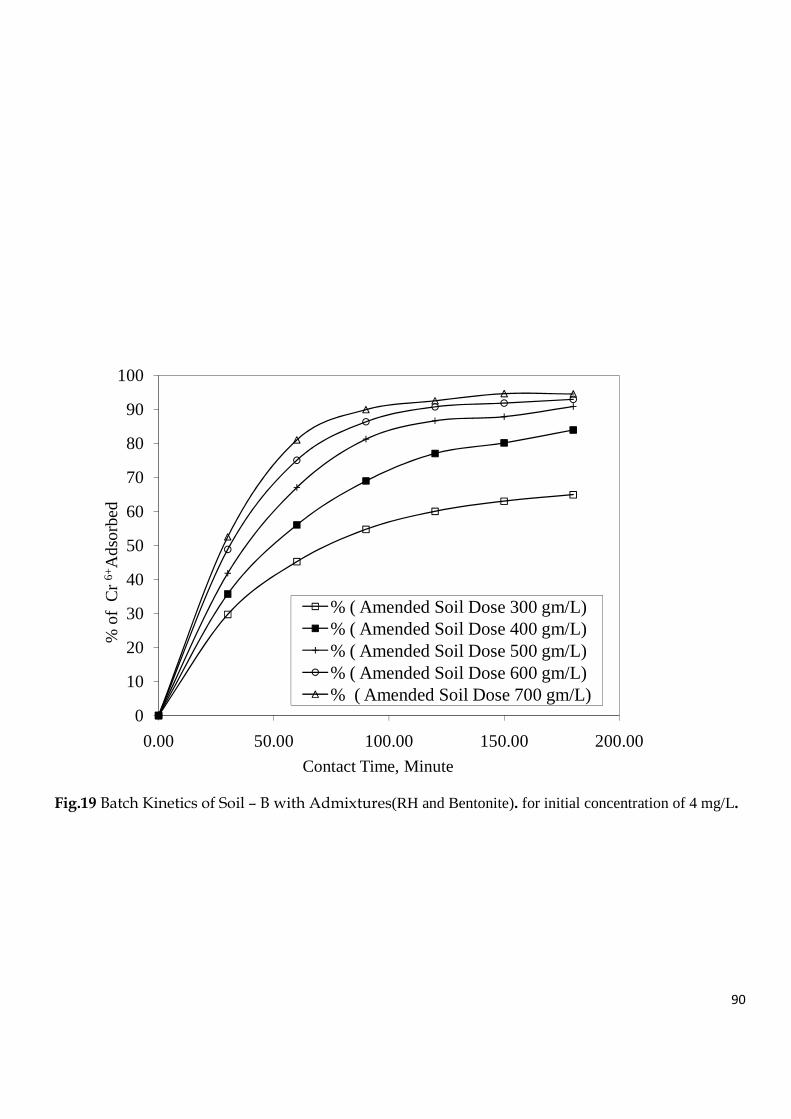
90
Fig.19 Batch Kinetics of Soil – B with Admixtures(RH and Bentonite). for initial concentration of 4 mg/L.
0
10
20
30
40
50
60
70
80
90
100
0.00 50.00 100.00 150.00 200.00
% o
f C
r 6+ A
dso
rbe
d
Contact Time, Minute
% ( Amended Soil Dose 300 gm/L)% ( Amended Soil Dose 400 gm/L)% ( Amended Soil Dose 500 gm/L)% ( Amended Soil Dose 600 gm/L)% ( Amended Soil Dose 700 gm/L)
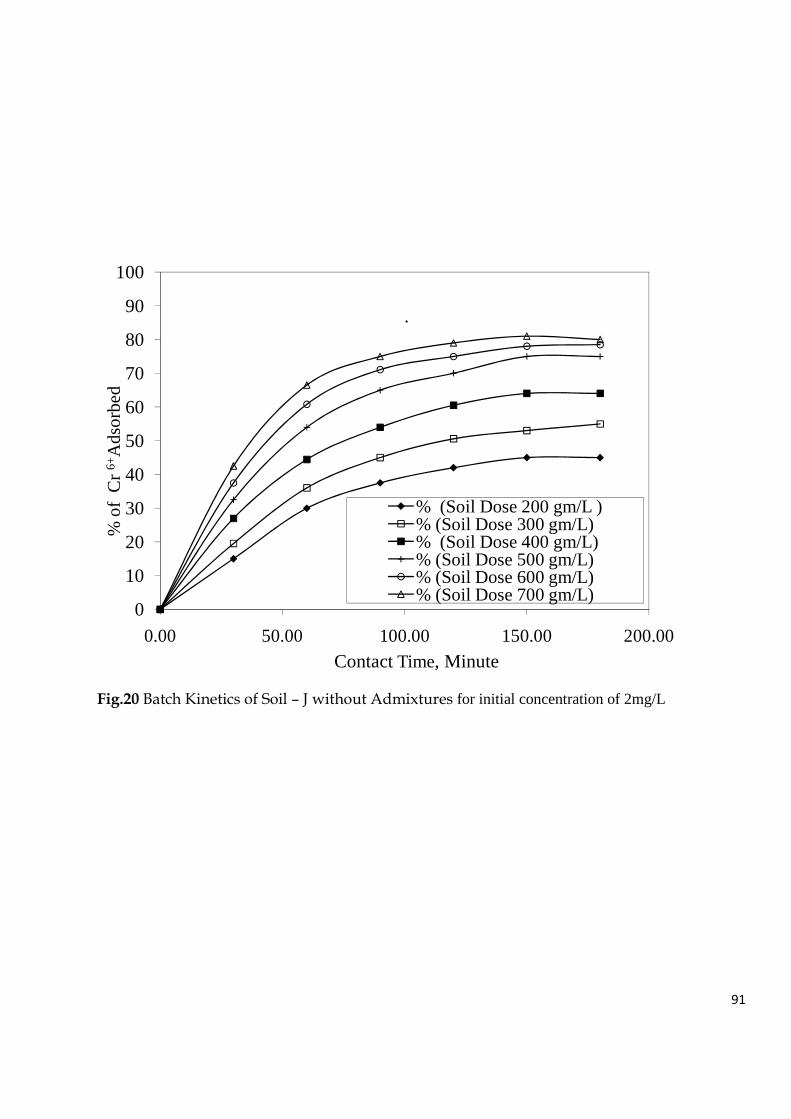
91
Fig.20 Batch Kinetics of Soil – J without Admixtures for initial concentration of 2mg/L
0
10
20
30
40
50
60
70
80
90
100
0.00 50.00 100.00 150.00 200.00
% o
f C
r 6+ A
dso
rbe
d
Contact Time, Minute
% (Soil Dose 200 gm/L )% (Soil Dose 300 gm/L)% (Soil Dose 400 gm/L)% (Soil Dose 500 gm/L)% (Soil Dose 600 gm/L)% (Soil Dose 700 gm/L)
.
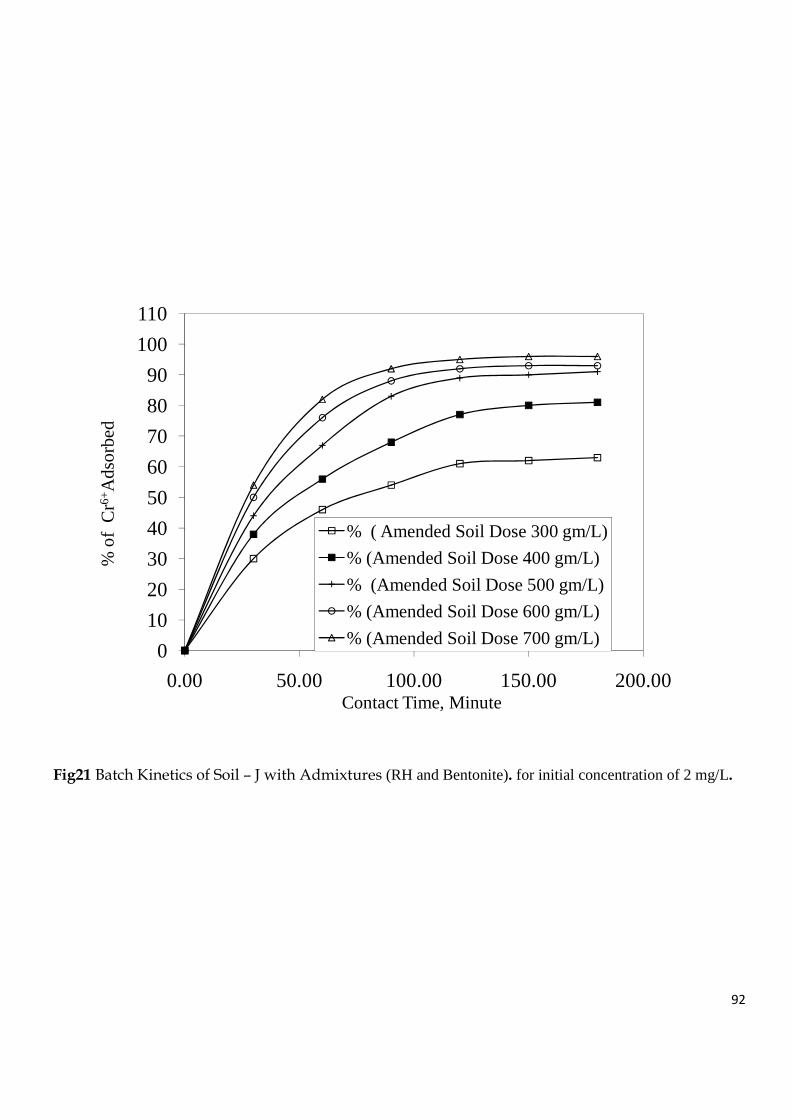
92
Fig21 Batch Kinetics of Soil – J with Admixtures (RH and Bentonite). for initial concentration of 2 mg/L.
0
10
20
30
40
50
60
70
80
90
100
110
0.00 50.00 100.00 150.00 200.00
% o
f C
r6+A
dso
rbe
d
Contact Time, Minute
% ( Amended Soil Dose 300 gm/L)
% (Amended Soil Dose 400 gm/L)
% (Amended Soil Dose 500 gm/L)
% (Amended Soil Dose 600 gm/L)
% (Amended Soil Dose 700 gm/L)
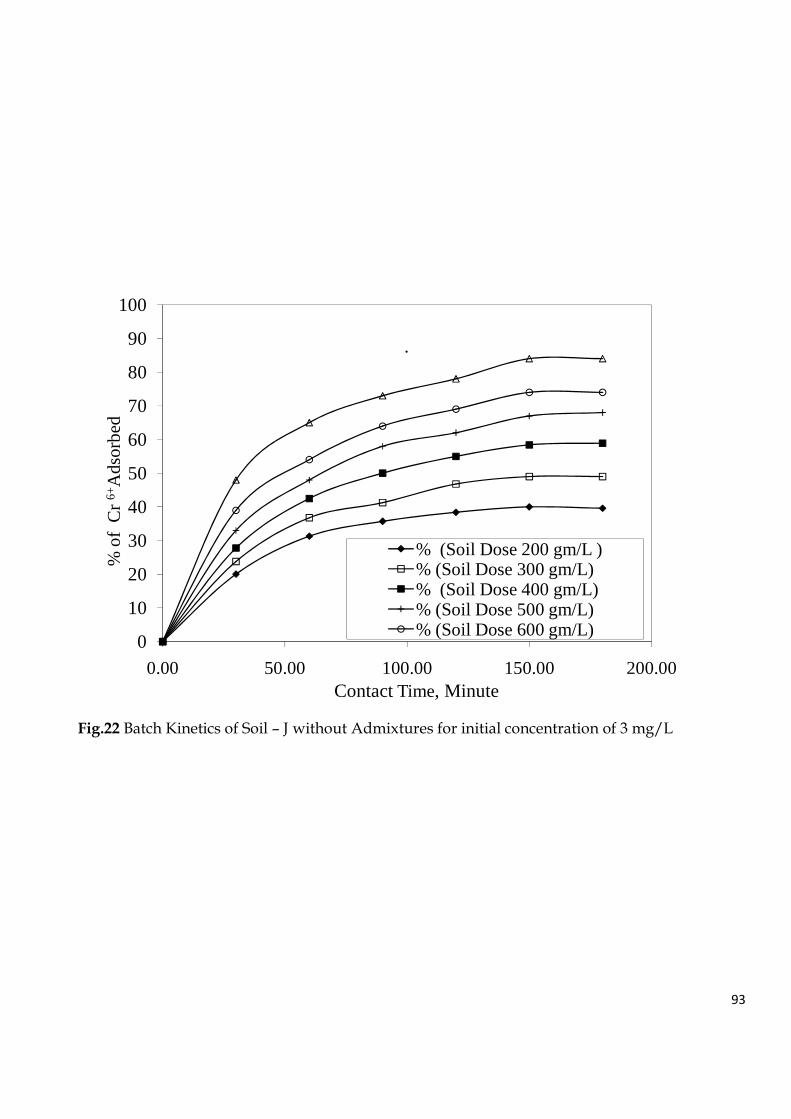
93
Fig.22 Batch Kinetics of Soil – J without Admixtures for initial concentration of 3 mg/L
0
10
20
30
40
50
60
70
80
90
100
0.00 50.00 100.00 150.00 200.00
% o
f C
r 6+ A
dsor
bed
Contact Time, Minute
% (Soil Dose 200 gm/L )% (Soil Dose 300 gm/L)% (Soil Dose 400 gm/L)% (Soil Dose 500 gm/L)% (Soil Dose 600 gm/L)
.
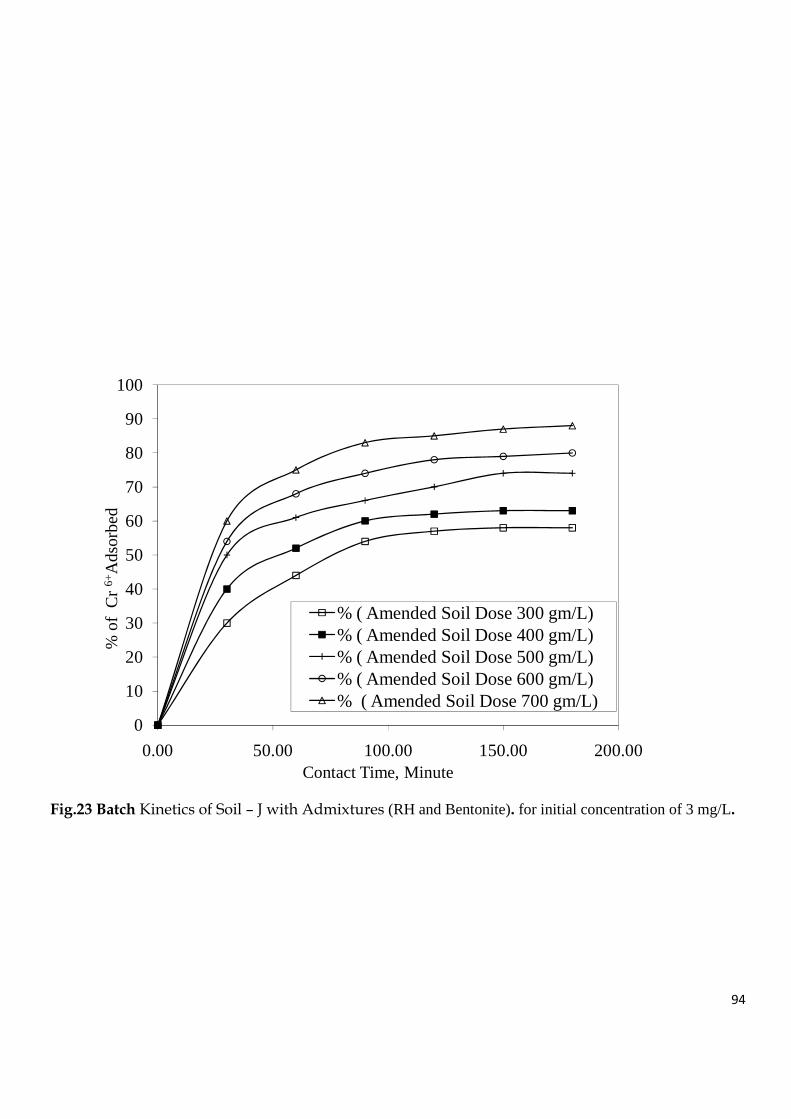
94
Fig.23 Batch Kinetics of Soil – J with Admixtures (RH and Bentonite). for initial concentration of 3 mg/L.
0
10
20
30
40
50
60
70
80
90
100
0.00 50.00 100.00 150.00 200.00
% o
f C
r 6+ A
dso
rbe
d
Contact Time, Minute
% ( Amended Soil Dose 300 gm/L)% ( Amended Soil Dose 400 gm/L)% ( Amended Soil Dose 500 gm/L)% ( Amended Soil Dose 600 gm/L)% ( Amended Soil Dose 700 gm/L)
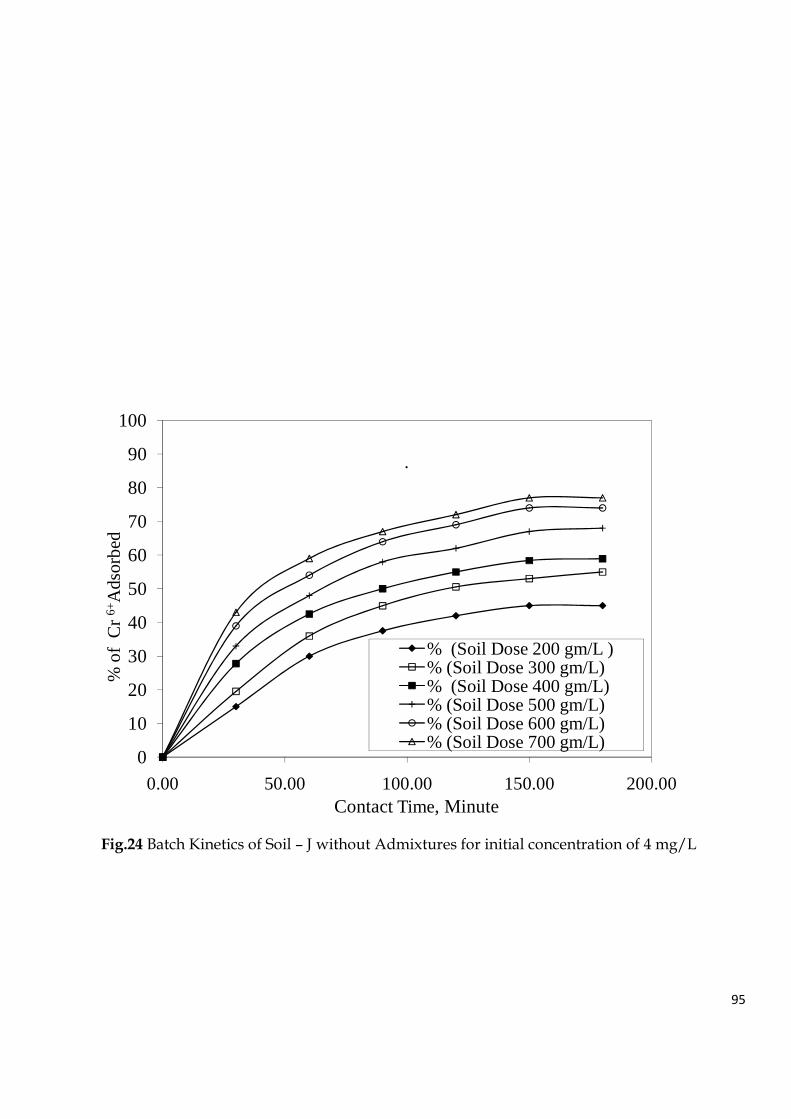
95
Fig.24 Batch Kinetics of Soil – J without Admixtures for initial concentration of 4 mg/L
0
10
20
30
40
50
60
70
80
90
100
0.00 50.00 100.00 150.00 200.00
% o
f C
r 6+ A
dsor
bed
Contact Time, Minute
% (Soil Dose 200 gm/L )% (Soil Dose 300 gm/L)% (Soil Dose 400 gm/L)% (Soil Dose 500 gm/L)% (Soil Dose 600 gm/L)% (Soil Dose 700 gm/L)
.
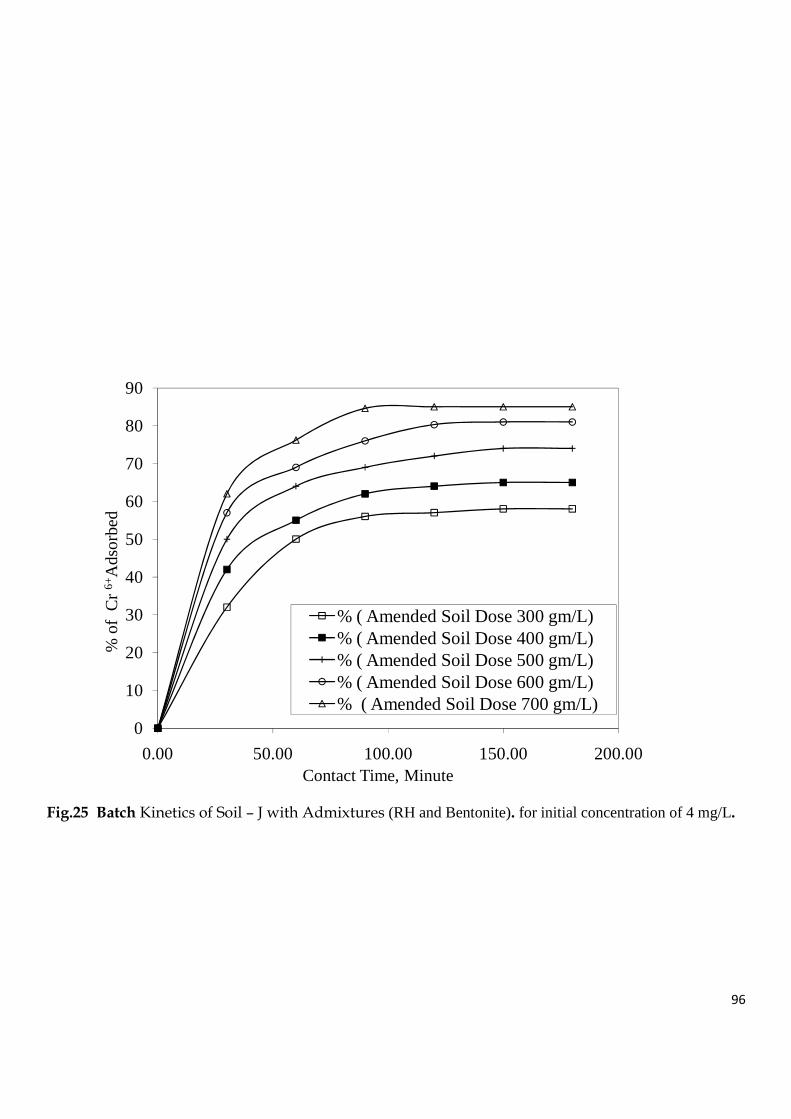
96
Fig.25 Batch Kinetics of Soil – J with Admixtures (RH and Bentonite). for initial concentration of 4 mg/L.
0
10
20
30
40
50
60
70
80
90
0.00 50.00 100.00 150.00 200.00
% o
f C
r 6+ A
dso
rbe
d
Contact Time, Minute
% ( Amended Soil Dose 300 gm/L)% ( Amended Soil Dose 400 gm/L)% ( Amended Soil Dose 500 gm/L)% ( Amended Soil Dose 600 gm/L)% ( Amended Soil Dose 700 gm/L)
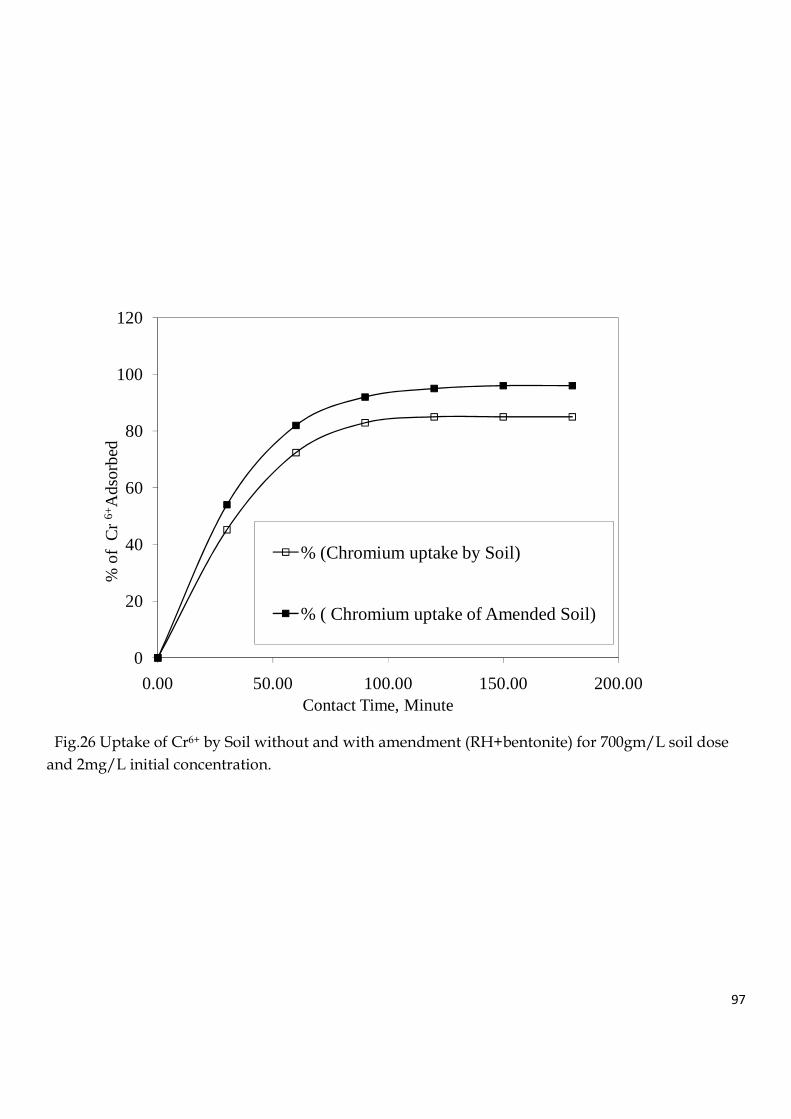
97
Fig.26 Uptake of Cr6+ by Soil without and with amendment (RH+bentonite) for 700gm/L soil dose
and 2mg/L initial concentration.
0
20
40
60
80
100
120
0.00 50.00 100.00 150.00 200.00
% o
f C
r 6+ A
dso
rbed
Contact Time, Minute
% (Chromium uptake by Soil)
% ( Chromium uptake of Amended Soil)
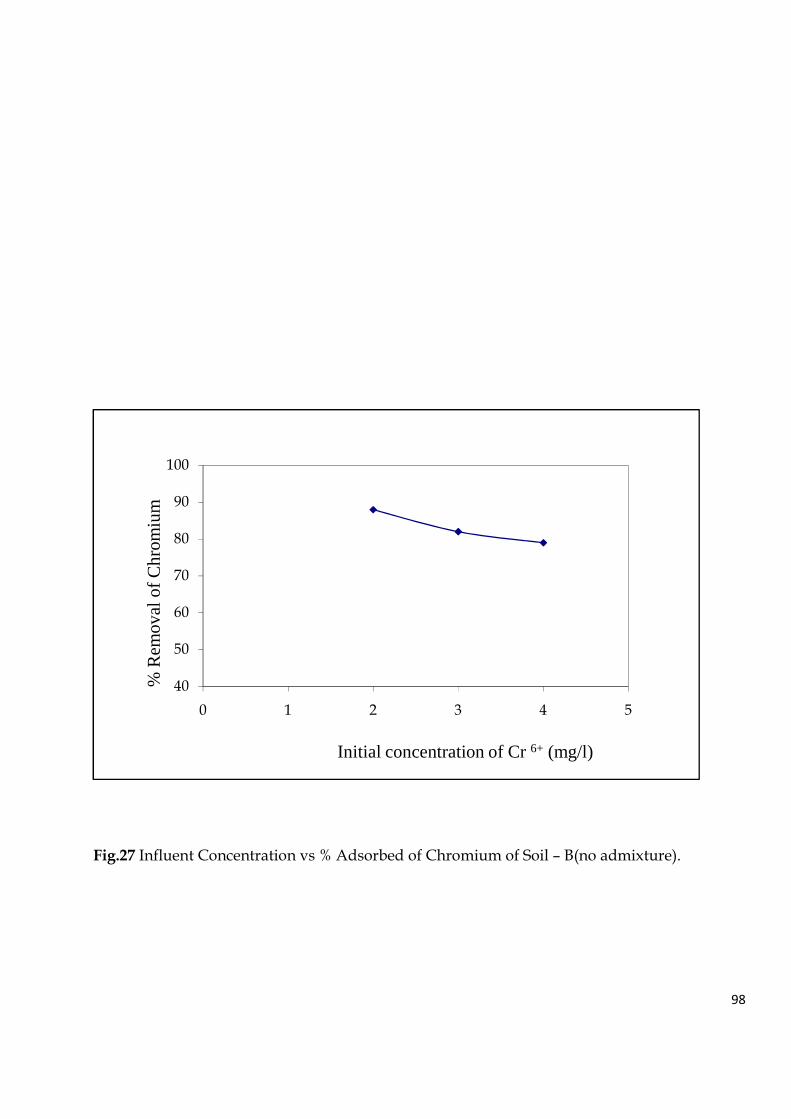
98
Fig.27 Influent Concentration vs % Adsorbed of Chromium of Soil – B(no admixture).
40
50
60
70
80
90
100
0 1 2 3 4 5
% R
emov
al o
f Ch
rom
ium
Initial concentration of Cr 6+ (mg/l)
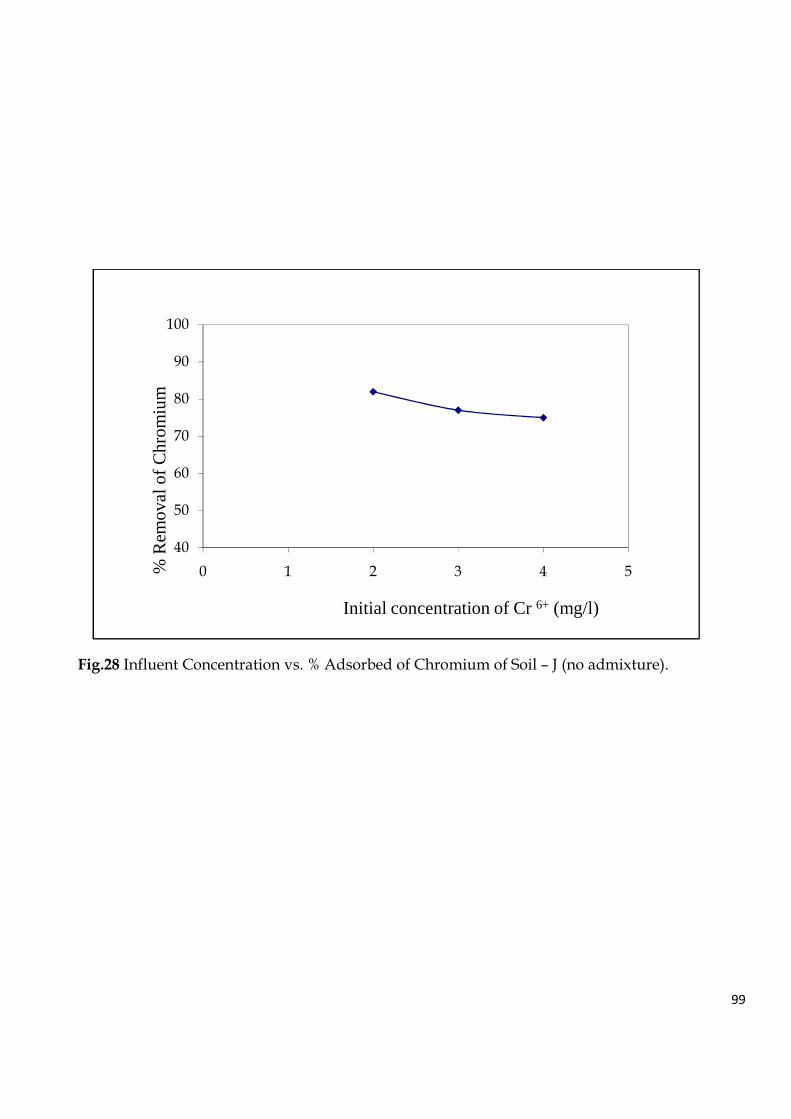
99
Fig.28 Influent Concentration vs. % Adsorbed of Chromium of Soil – J (no admixture).
40
50
60
70
80
90
100
0 1 2 3 4 5% R
emo
val o
f Ch
rom
ium
Initial concentration of Cr 6+ (mg/l)
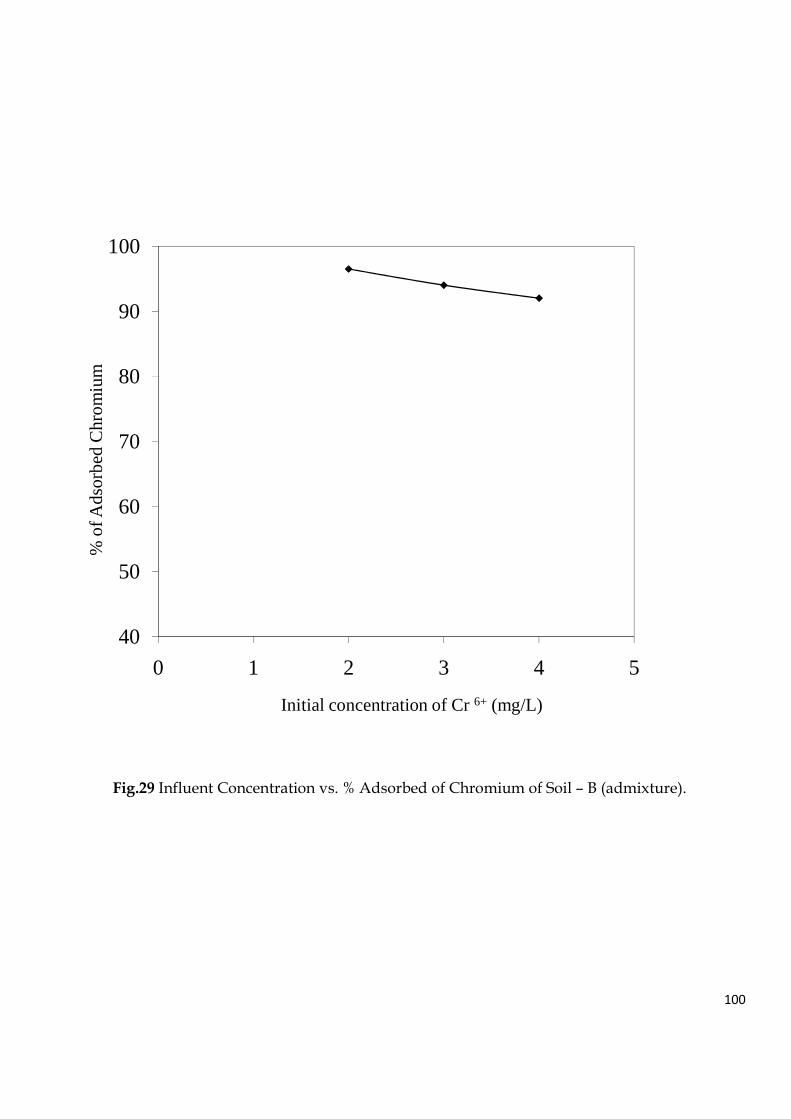
100
Fig.29 Influent Concentration vs. % Adsorbed of Chromium of Soil – B (admixture).
40
50
60
70
80
90
100
0 1 2 3 4 5
% o
f Ads
orb
ed C
hro
miu
m
Initial concentration of Cr 6+ (mg/L)
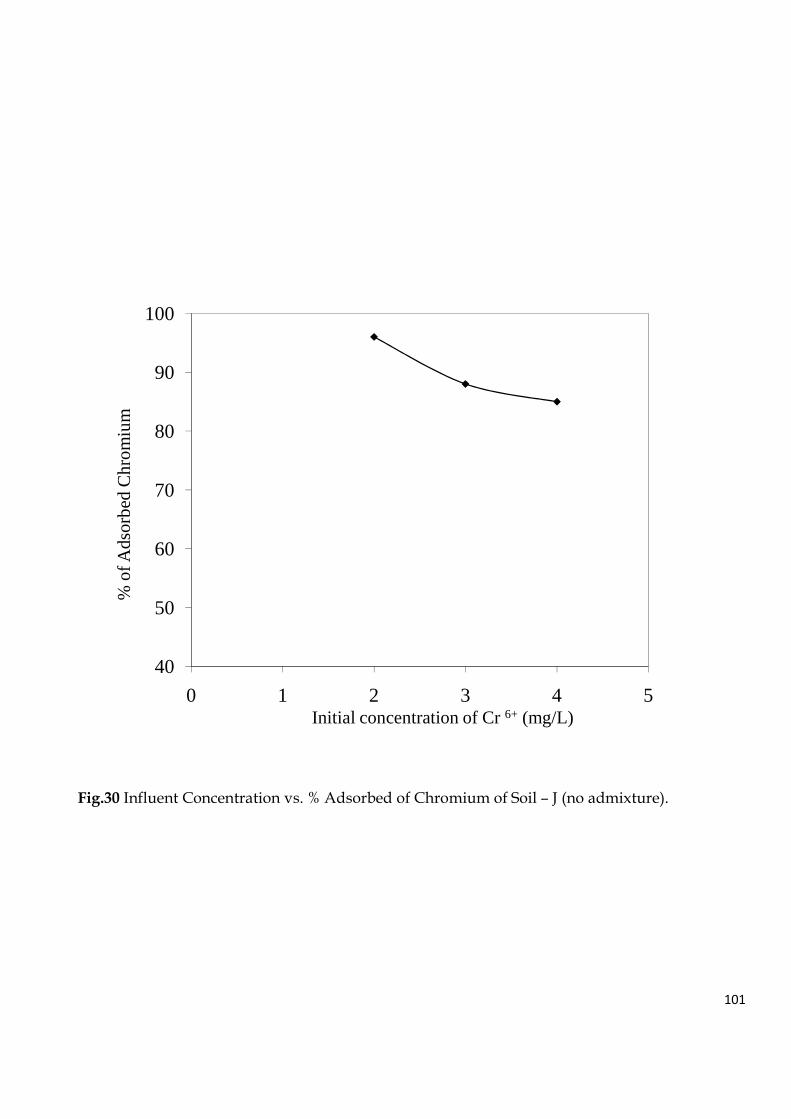
101
Fig.30 Influent Concentration vs. % Adsorbed of Chromium of Soil – J (no admixture).
40
50
60
70
80
90
100
0 1 2 3 4 5
% o
f Ads
orb
ed C
hro
miu
m
Initial concentration of Cr 6+ (mg/L)
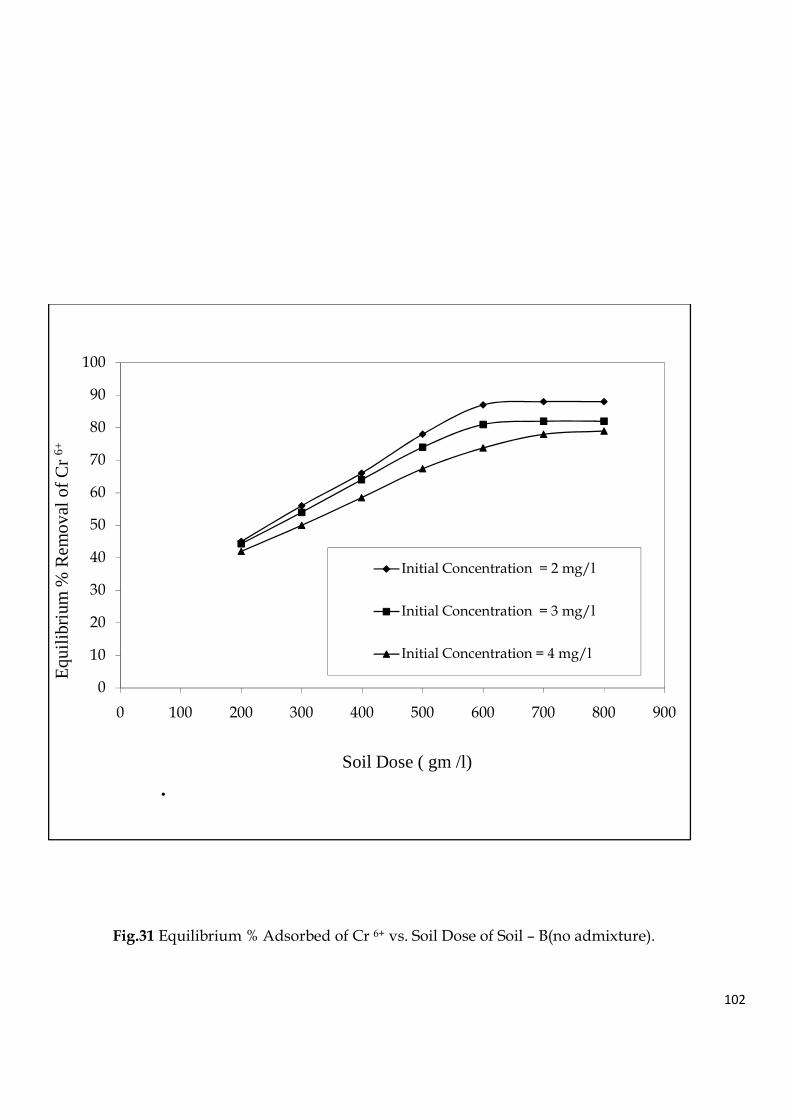
102
Fig.31 Equilibrium % Adsorbed of Cr 6+ vs. Soil Dose of Soil – B(no admixture).
0
10
20
30
40
50
60
70
80
90
100
0 100 200 300 400 500 600 700 800 900
Equ
ilibr
ium
% R
em
oval
of C
r 6+
Soil Dose ( gm /l)
.
Initial Concentration = 2 mg/l
Initial Concentration = 3 mg/l
Initial Concentration = 4 mg/l
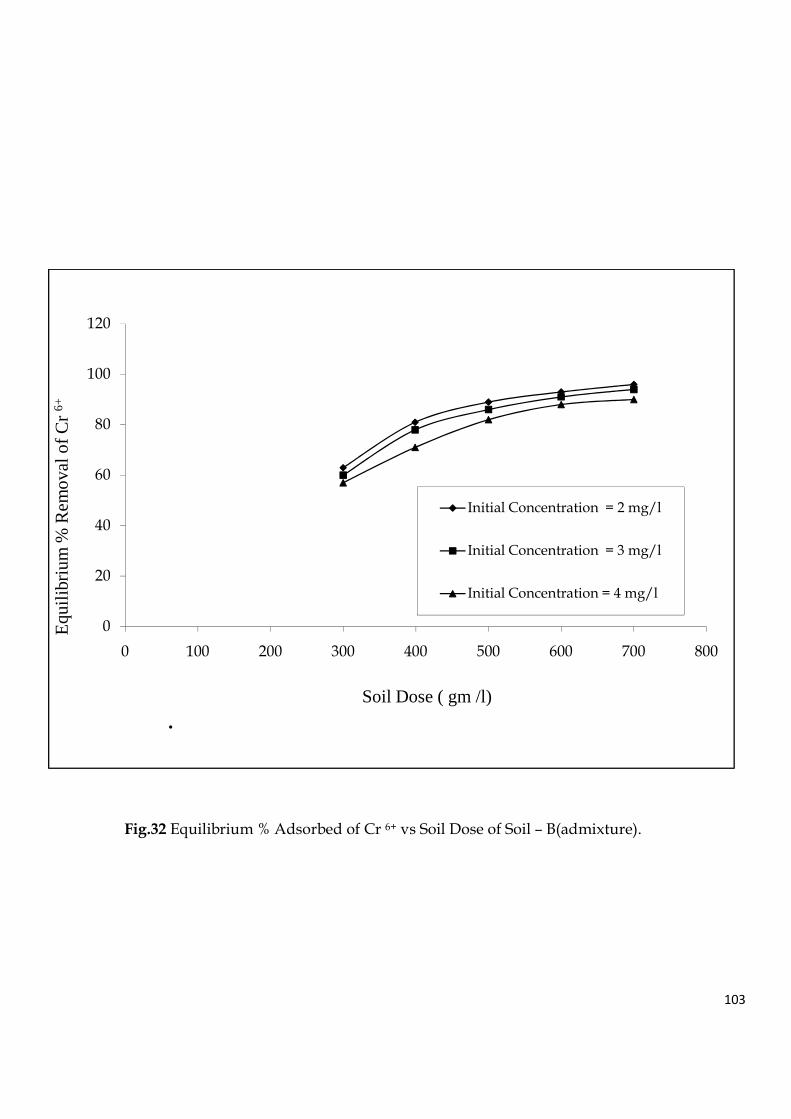
103
Fig.32 Equilibrium % Adsorbed of Cr 6+ vs Soil Dose of Soil – B(admixture).
0
20
40
60
80
100
120
0 100 200 300 400 500 600 700 800
Equ
ilibr
ium
% R
em
ova
l of C
r 6+
Soil Dose ( gm /l)
.
Initial Concentration = 2 mg/l
Initial Concentration = 3 mg/l
Initial Concentration = 4 mg/l
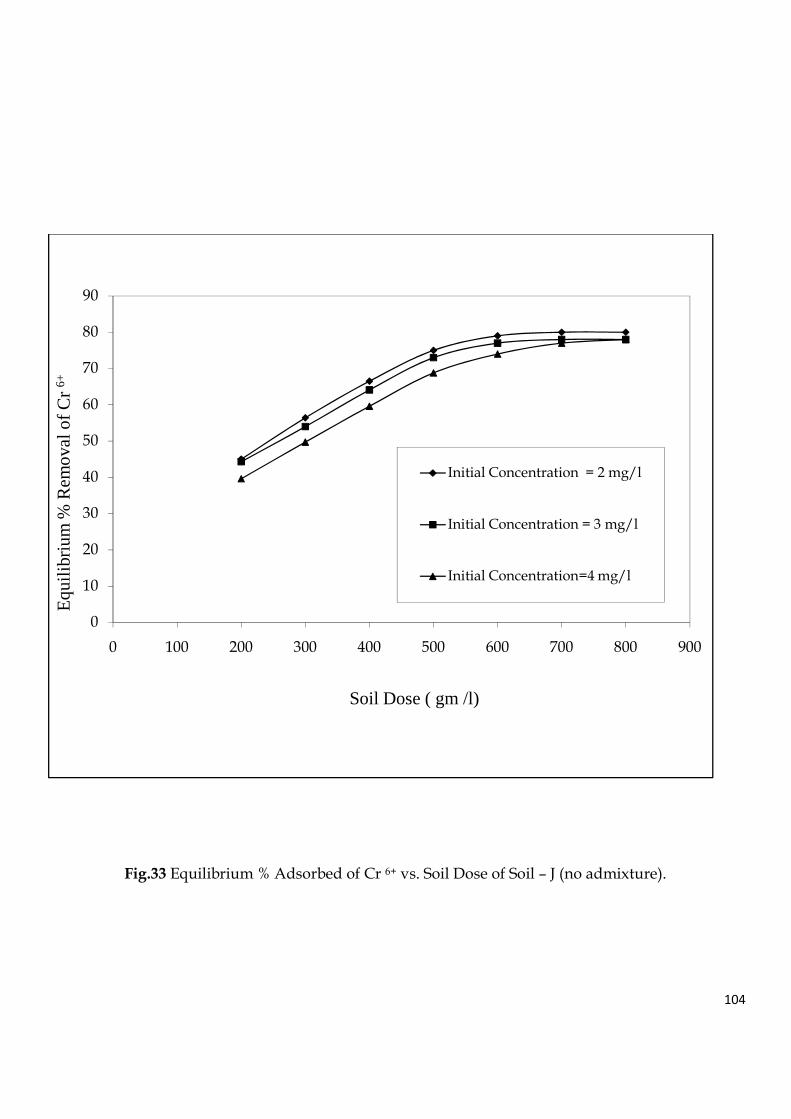
104
Fig.33 Equilibrium % Adsorbed of Cr 6+ vs. Soil Dose of Soil – J (no admixture).
0
10
20
30
40
50
60
70
80
90
0 100 200 300 400 500 600 700 800 900
Eq
uilib
rium
% R
em
ova
l of C
r 6+
Soil Dose ( gm /l)
Initial Concentration = 2 mg/l
Initial Concentration = 3 mg/l
Initial Concentration=4 mg/l
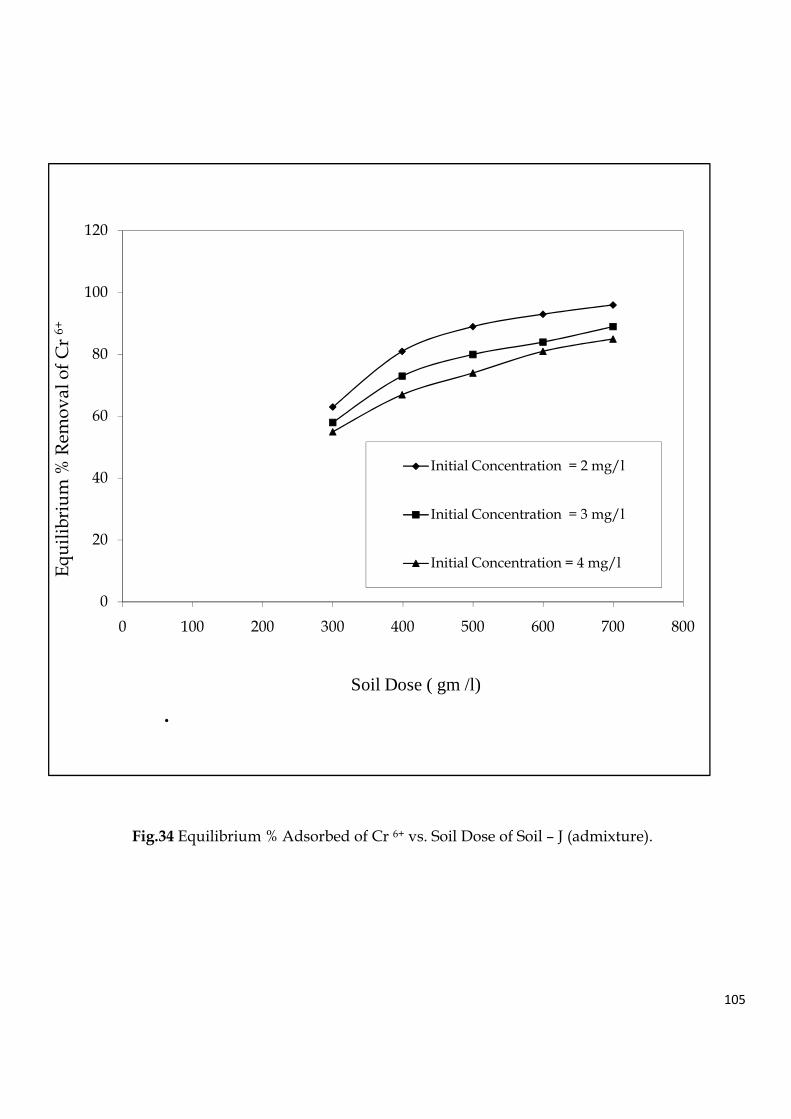
105
Fig.34 Equilibrium % Adsorbed of Cr 6+ vs. Soil Dose of Soil – J (admixture).
0
20
40
60
80
100
120
0 100 200 300 400 500 600 700 800
Eq
uil
ibri
um
% R
emo
va
l o
f C
r 6+
Soil Dose ( gm /l)
.
Initial Concentration = 2 mg/l
Initial Concentration = 3 mg/l
Initial Concentration = 4 mg/l
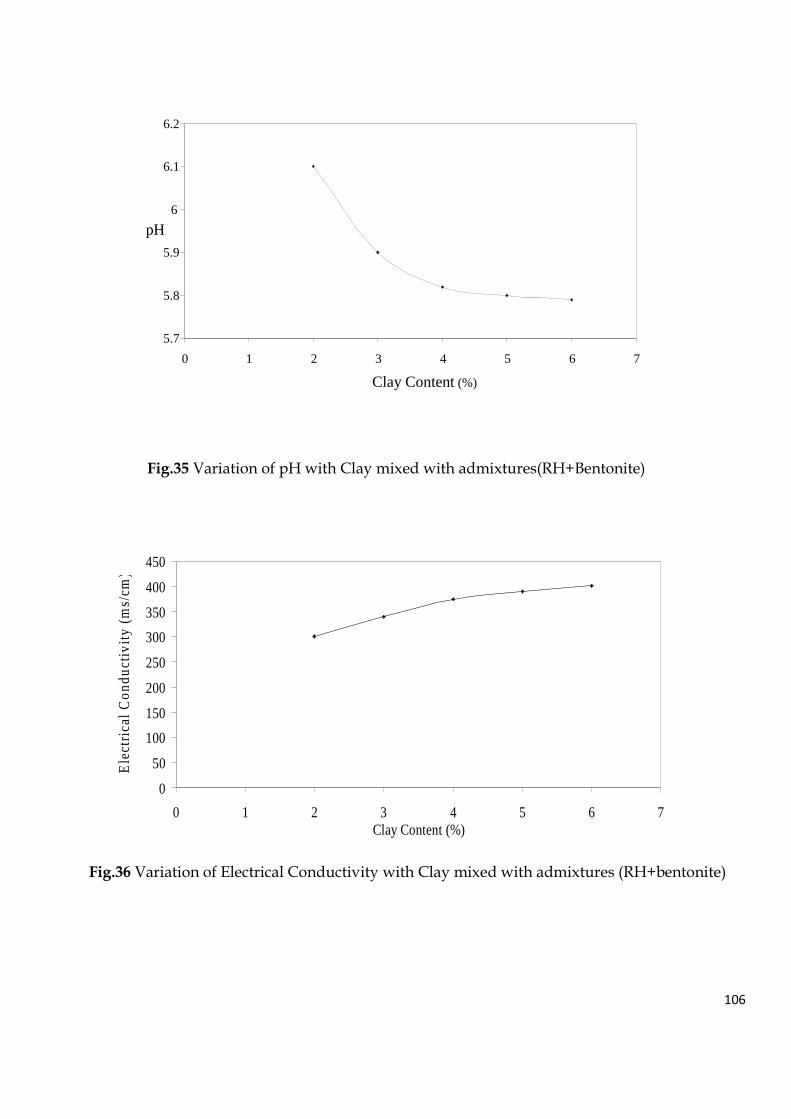
106
Fig.35 Variation of pH with Clay mixed with admixtures(RH+Bentonite)
Fig.36 Variation of Electrical Conductivity with Clay mixed with admixtures (RH+bentonite)
0
50
100
150
200
250
300
350
400
450
0 1 2 3 4 5 6 7Clay Content (%)
Ele
ctri
cal C
on
du
ctiv
ity (
ms/
cm)
5.7
5.8
5.9
6
6.1
6.2
0 1 2 3 4 5 6 7
Clay Content (%)
pH
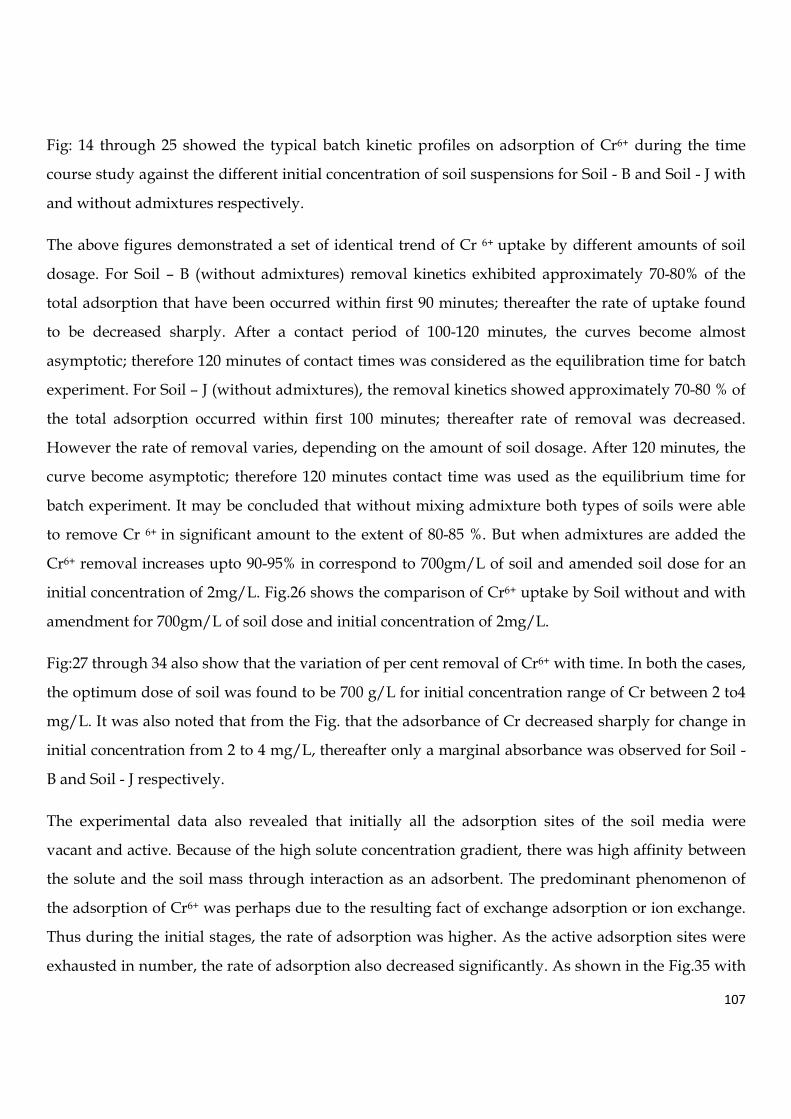
107
Fig: 14 through 25 showed the typical batch kinetic profiles on adsorption of Cr6+ during the time
course study against the different initial concentration of soil suspensions for Soil - B and Soil - J with
and without admixtures respectively.
The above figures demonstrated a set of identical trend of Cr 6+ uptake by different amounts of soil
dosage. For Soil – B (without admixtures) removal kinetics exhibited approximately 70-80% of the
total adsorption that have been occurred within first 90 minutes; thereafter the rate of uptake found
to be decreased sharply. After a contact period of 100-120 minutes, the curves become almost
asymptotic; therefore 120 minutes of contact times was considered as the equilibration time for batch
experiment. For Soil – J (without admixtures), the removal kinetics showed approximately 70-80 % of
the total adsorption occurred within first 100 minutes; thereafter rate of removal was decreased.
However the rate of removal varies, depending on the amount of soil dosage. After 120 minutes, the
curve become asymptotic; therefore 120 minutes contact time was used as the equilibrium time for
batch experiment. It may be concluded that without mixing admixture both types of soils were able
to remove Cr 6+ in significant amount to the extent of 80-85 %. But when admixtures are added the
Cr6+ removal increases upto 90-95% in correspond to 700gm/L of soil and amended soil dose for an
initial concentration of 2mg/L. Fig.26 shows the comparison of Cr6+ uptake by Soil without and with
amendment for 700gm/L of soil dose and initial concentration of 2mg/L.
Fig:27 through 34 also show that the variation of per cent removal of Cr6+ with time. In both the cases,
the optimum dose of soil was found to be 700 g/L for initial concentration range of Cr between 2 to4
mg/L. It was also noted that from the Fig. that the adsorbance of Cr decreased sharply for change in
initial concentration from 2 to 4 mg/L, thereafter only a marginal absorbance was observed for Soil -
B and Soil - J respectively.
The experimental data also revealed that initially all the adsorption sites of the soil media were
vacant and active. Because of the high solute concentration gradient, there was high affinity between
the solute and the soil mass through interaction as an adsorbent. The predominant phenomenon of
the adsorption of Cr6+ was perhaps due to the resulting fact of exchange adsorption or ion exchange.
Thus during the initial stages, the rate of adsorption was higher. As the active adsorption sites were
exhausted in number, the rate of adsorption also decreased significantly. As shown in the Fig.35 with

108
increase of clay content, the pH value of solution was reduced. It is also evident from the Fig: 36. the
electrical conductivities (Ec) of the solutions increased with increase of clay content in the mixture. If
concentration of H+ ions are considered solely , test results of pH and Ec test are resistant
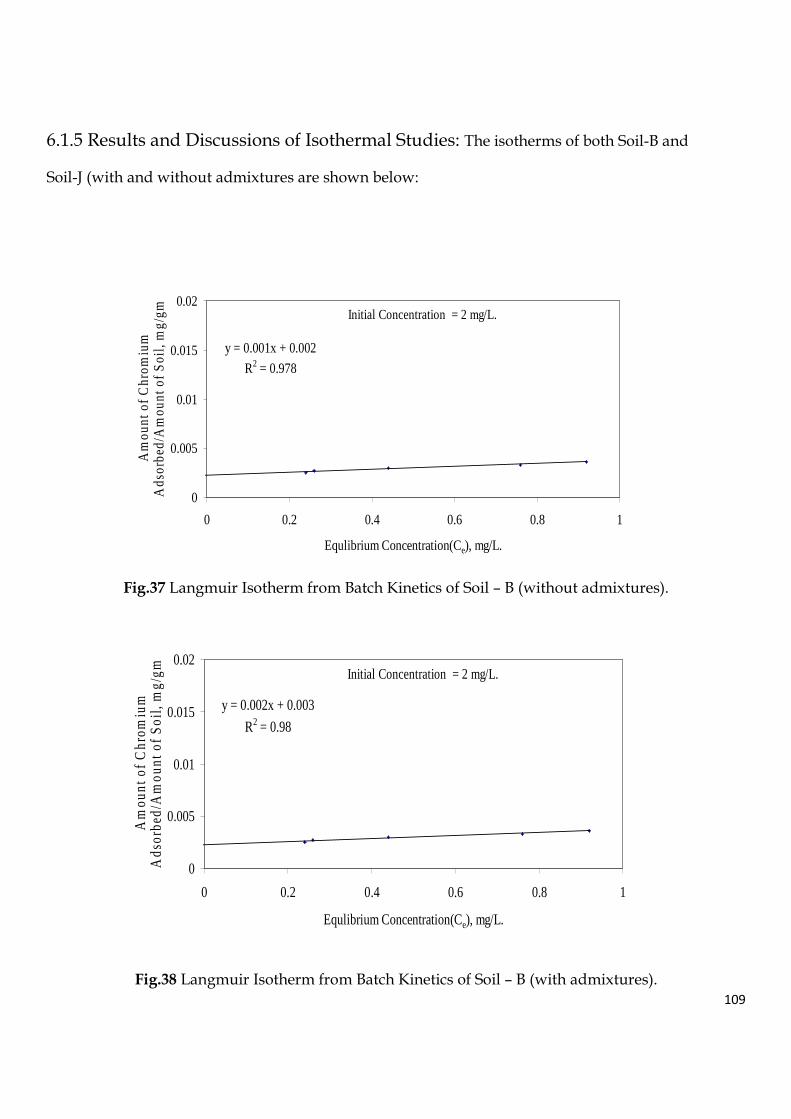
109
6.1.5 Results and Discussions of Isothermal Studies: The isotherms of both Soil-B and
Soil-J (with and without admixtures are shown below:
Fig.37 Langmuir Isotherm from Batch Kinetics of Soil – B (without admixtures).
Fig.38 Langmuir Isotherm from Batch Kinetics of Soil – B (with admixtures).
y = 0.001x + 0.002
R2 = 0.978
0
0.005
0.01
0.015
0.02
0 0.2 0.4 0.6 0.8 1
Equlibrium Concentration(Ce), mg/L.
Am
ount
of C
hrom
ium
A
dsor
bed/
Am
ount
of S
oil,
mg/
gm.
Initial Concentration = 2 mg/L.
y = 0.002x + 0.003
R2 = 0.98
0
0.005
0.01
0.015
0.02
0 0.2 0.4 0.6 0.8 1
Equlibrium Concentration(Ce), mg/L.
Am
ount
of C
hrom
ium
A
dsor
bed/
Am
ount
of S
oil,
mg/
gm.
Initial Concentration = 2 mg/L.
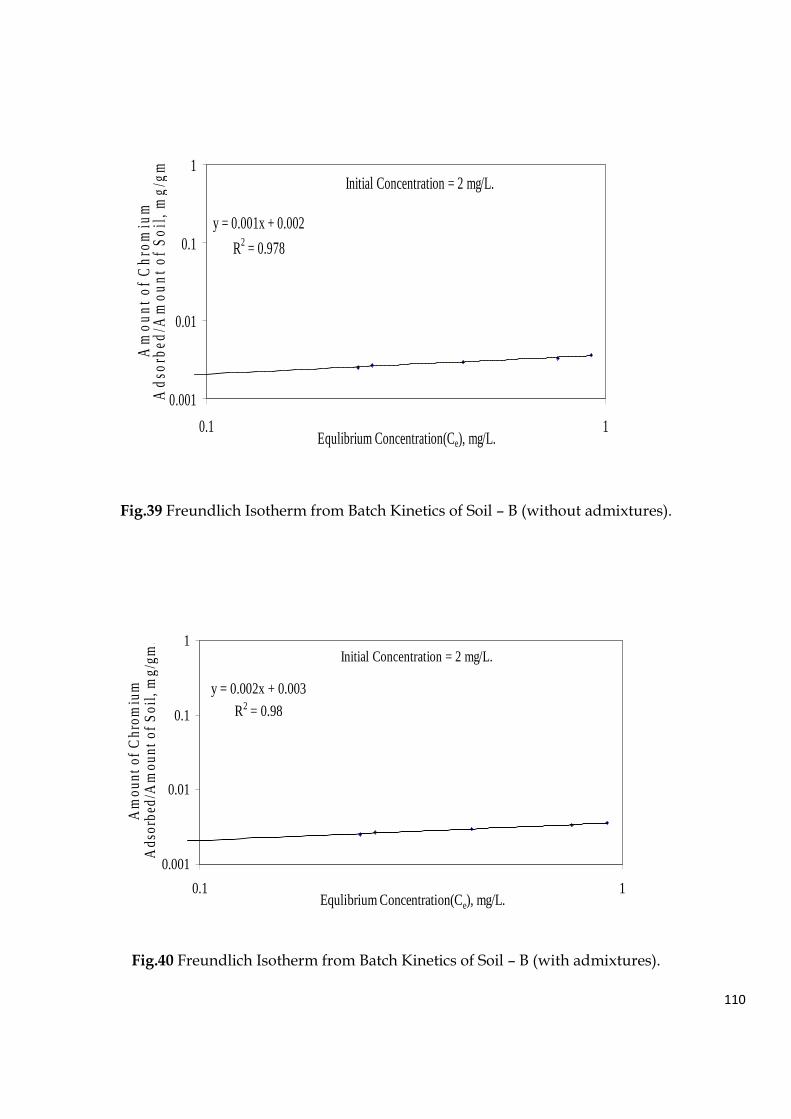
110
Fig.39 Freundlich Isotherm from Batch Kinetics of Soil – B (without admixtures).
Fig.40 Freundlich Isotherm from Batch Kinetics of Soil – B (with admixtures).
y = 0.001x + 0.002
R2 = 0.978
0.001
0.01
0.1
1
0.1 1Equlibrium Concentration(Ce), mg/L.
Am
oun
t of
Chr
omiu
m
Ad
sorb
ed/A
mou
nt o
f S
oil,
mg/
gm.
Initial Concentration = 2 mg/L.
y = 0.002x + 0.003
R2 = 0.98
0.001
0.01
0.1
1
0.1 1Equlibrium Concentration(Ce), mg/L.
Am
ount
of C
hrom
ium
A
dsor
bed/
Am
ount
of S
oil,
mg/
gm.
Initial Concentration = 2 mg/L.
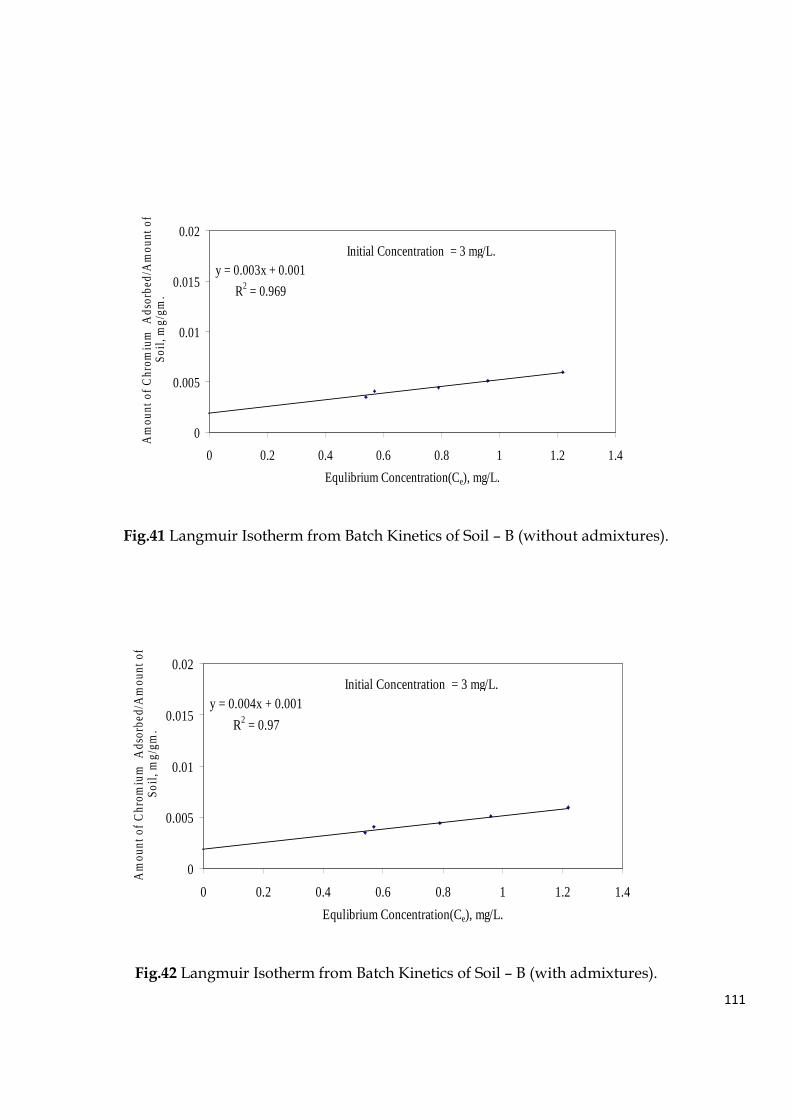
111
Fig.41 Langmuir Isotherm from Batch Kinetics of Soil – B (without admixtures).
Fig.42 Langmuir Isotherm from Batch Kinetics of Soil – B (with admixtures).
y = 0.003x + 0.001
R2 = 0.969
0
0.005
0.01
0.015
0.02
0 0.2 0.4 0.6 0.8 1 1.2 1.4
Equlibrium Concentration(Ce), mg/L.
Am
ount
of
Chr
omiu
m A
dsor
bed/
Am
ount
of
Soi
l, m
g/gm
.
Initial Concentration = 3 mg/L.
y = 0.004x + 0.001
R2 = 0.97
0
0.005
0.01
0.015
0.02
0 0.2 0.4 0.6 0.8 1 1.2 1.4
Equlibrium Concentration(Ce), mg/L.
Am
ount
of
Chr
omiu
m A
dsor
bed/
Am
ount
of
Soi
l, m
g/gm
.
Initial Concentration = 3 mg/L.
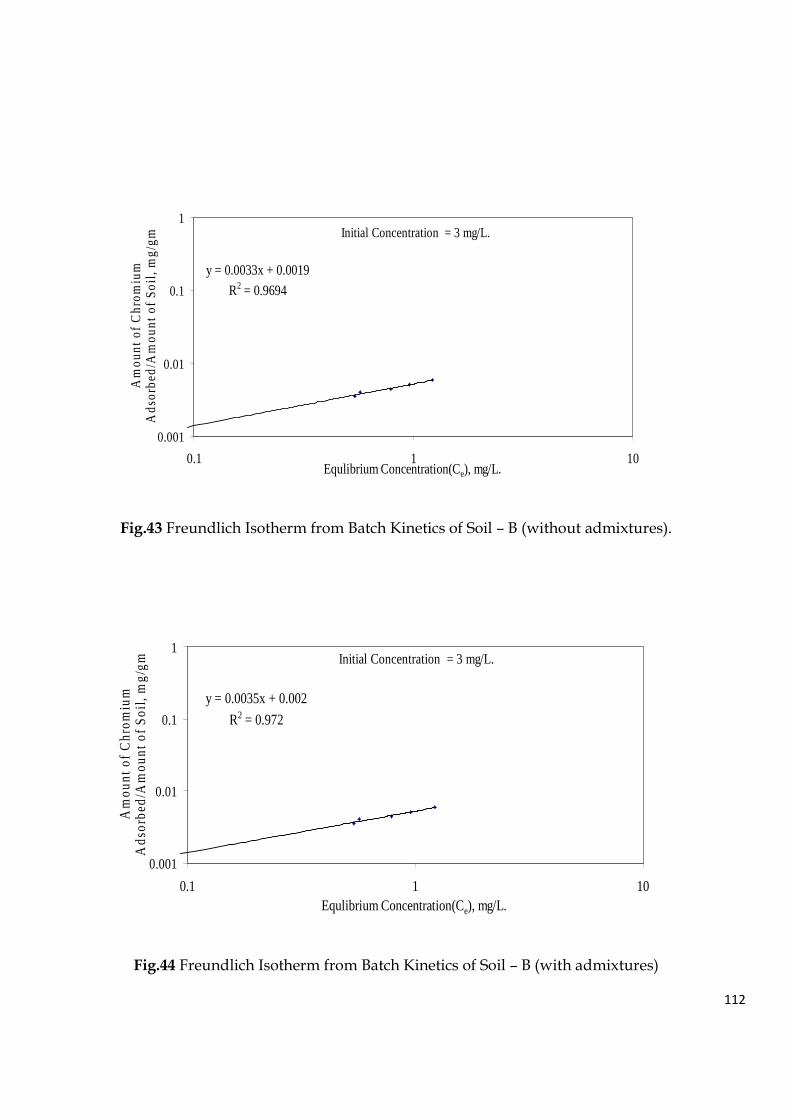
112
Fig.43 Freundlich Isotherm from Batch Kinetics of Soil – B (without admixtures).
Fig.44 Freundlich Isotherm from Batch Kinetics of Soil – B (with admixtures)
y = 0.0033x + 0.0019
R2 = 0.9694
0.001
0.01
0.1
1
0.1 1 10Equlibrium Concentration(Ce), mg/L.
Am
ou
nt
of
Ch
rom
ium
A
dso
rbed
/Am
ou
nt
of
So
il, m
g/g
m.
Initial Concentration = 3 mg/L.
y = 0.0035x + 0.002
R2 = 0.972
0.001
0.01
0.1
1
0.1 1 10Equlibrium Concentration(Ce), mg/L.
Am
ou
nt
of
Ch
rom
ium
A
dso
rbed
/Am
ou
nt
of
So
il, m
g/g
m.
Initial Concentration = 3 mg/L.
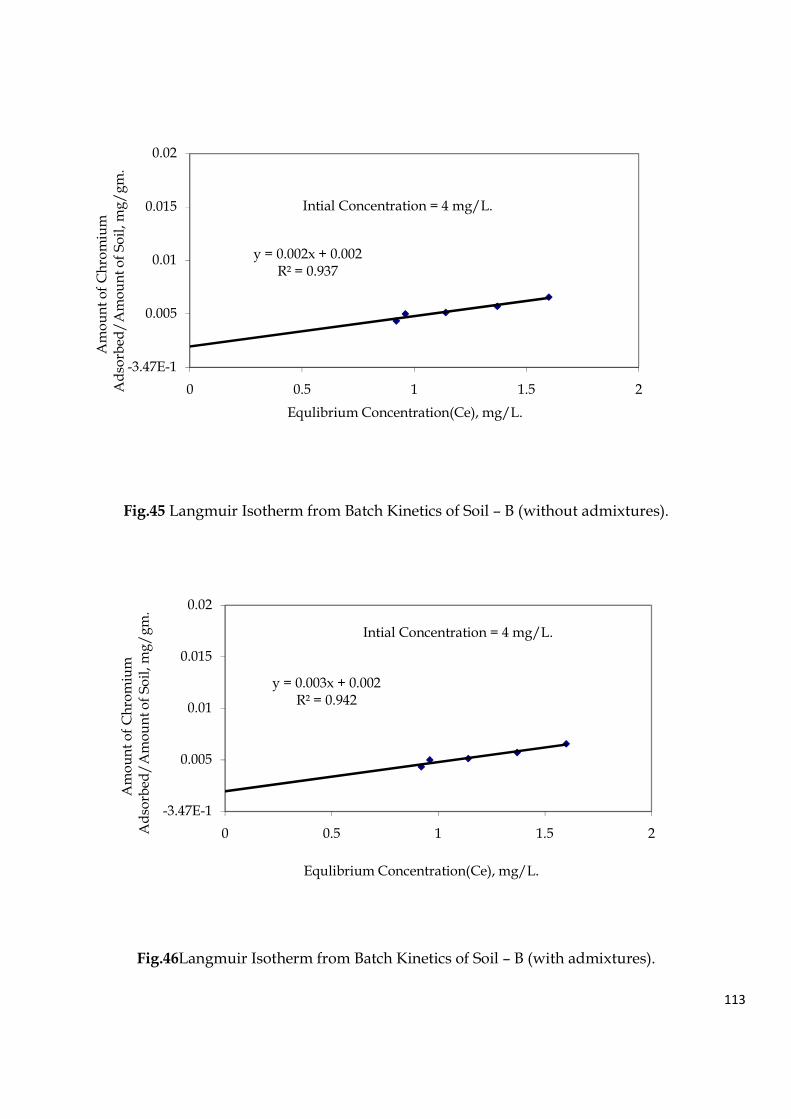
113
Fig.45 Langmuir Isotherm from Batch Kinetics of Soil – B (without admixtures).
Fig.46Langmuir Isotherm from Batch Kinetics of Soil – B (with admixtures).
y = 0.002x + 0.002R² = 0.937
-3.47E-1
0.005
0.01
0.015
0.02
0 0.5 1 1.5 2
Am
ou
nt
of
Ch
rom
ium
Ad
sorb
ed/
Am
ou
nt
of
So
il, m
g/
gm
.
Equlibrium Concentration(Ce), mg/L.
Intial Concentration = 4 mg/L.
y = 0.003x + 0.002R² = 0.942
-3.47E-1
0.005
0.01
0.015
0.02
0 0.5 1 1.5 2
Am
ou
nt
of
Ch
rom
ium
Ad
sorb
ed/
Am
ou
nt
of
So
il, m
g/
gm
.
Equlibrium Concentration(Ce), mg/L.
Intial Concentration = 4 mg/L.
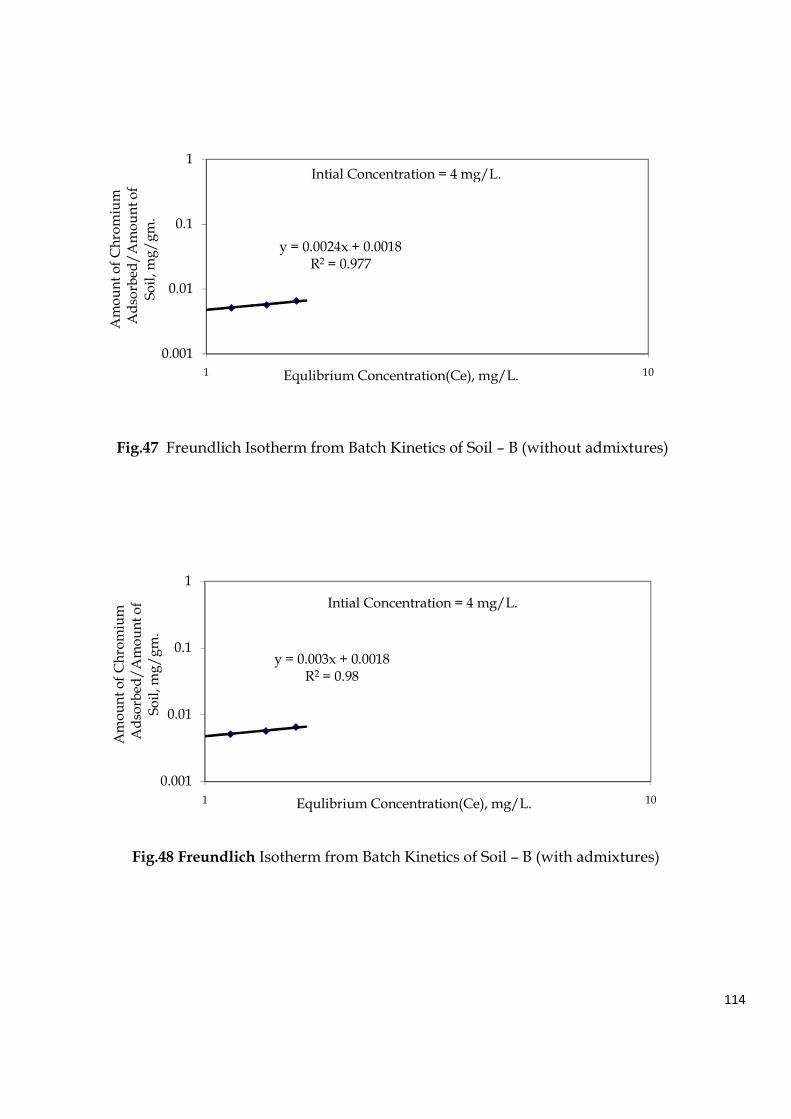
114
Fig.47 Freundlich Isotherm from Batch Kinetics of Soil – B (without admixtures)
Fig.48 Freundlich Isotherm from Batch Kinetics of Soil – B (with admixtures)
y = 0.0024x + 0.0018R2 = 0.977
0.001
0.01
0.1
1
1 10
Am
ou
nt
of
Ch
rom
ium
Ad
sorb
ed/
Am
ou
nt
of
So
il, m
g/
gm
.
Equlibrium Concentration(Ce), mg/L.
Intial Concentration = 4 mg/L.
y = 0.003x + 0.0018R2 = 0.98
0.001
0.01
0.1
1
1 10
Am
ou
nt
of
Ch
rom
ium
Ad
sorb
ed/
Am
ou
nt
of
So
il, m
g/
gm
.
Equlibrium Concentration(Ce), mg/L.
Intial Concentration = 4 mg/L.
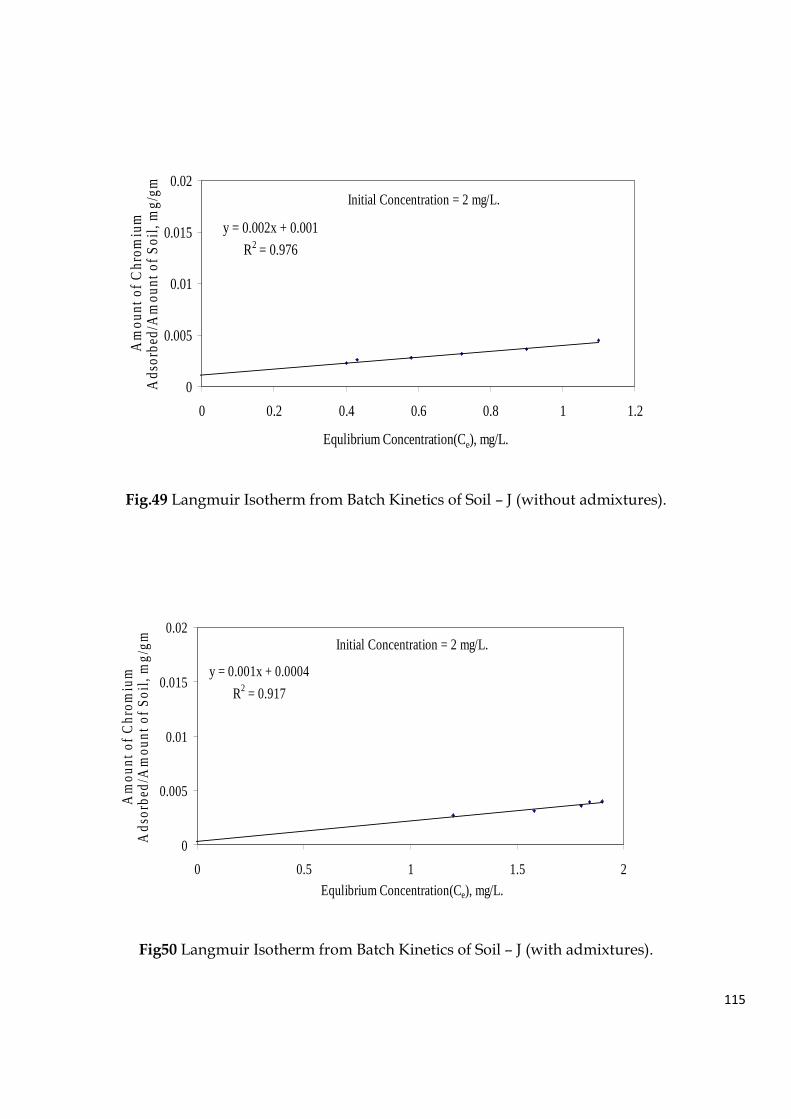
115
Fig.49 Langmuir Isotherm from Batch Kinetics of Soil – J (without admixtures).
Fig50 Langmuir Isotherm from Batch Kinetics of Soil – J (with admixtures).
y = 0.002x + 0.001
R2 = 0.976
0
0.005
0.01
0.015
0.02
0 0.2 0.4 0.6 0.8 1 1.2
Equlibrium Concentration(Ce), mg/L.
Am
ount
of C
hrom
ium
A
dsor
bed/
Am
ount
of S
oil,
mg/
gm.
Initial Concentration = 2 mg/L.
y = 0.001x + 0.0004
R2 = 0.917
0
0.005
0.01
0.015
0.02
0 0.5 1 1.5 2
Equlibrium Concentration(Ce), mg/L.
Am
ou
nt
of
Ch
rom
ium
A
dso
rbed
/Am
oun
t o
f S
oil,
mg
/gm
.
Initial Concentration = 2 mg/L.
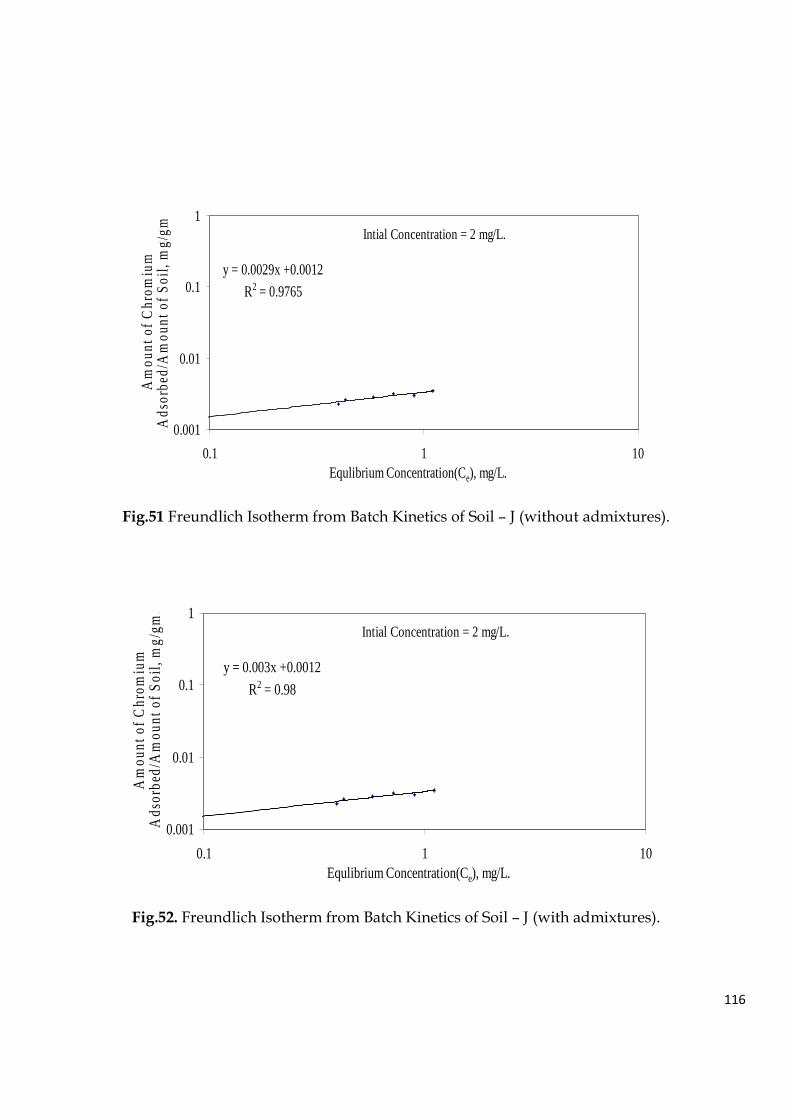
116
Fig.51 Freundlich Isotherm from Batch Kinetics of Soil – J (without admixtures).
Fig.52. Freundlich Isotherm from Batch Kinetics of Soil – J (with admixtures).
y = 0.0029x +0.0012
R2 = 0.9765
0.001
0.01
0.1
1
0.1 1 10Equlibrium Concentration(Ce), mg/L.
Am
ount
of
Chr
omiu
m
Ads
orbe
d/A
mou
nt o
f S
oil,
mg/
gm.
Intial Concentration = 2 mg/L.
y = 0.003x +0.0012
R2 = 0.98
0.001
0.01
0.1
1
0.1 1 10Equlibrium Concentration(Ce), mg/L.
Am
ount
of C
hrom
ium
A
dsor
bed/
Am
ount
of S
oil,
mg/
gm.
Intial Concentration = 2 mg/L.
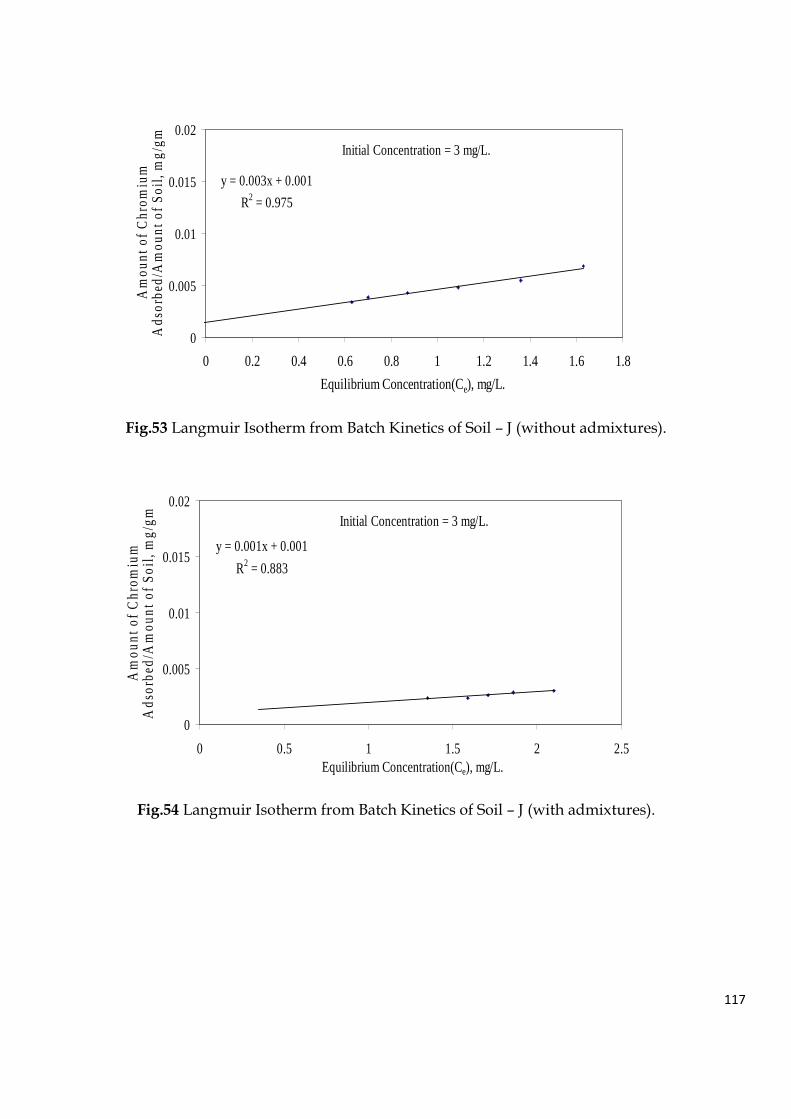
117
Fig.53 Langmuir Isotherm from Batch Kinetics of Soil – J (without admixtures).
Fig.54 Langmuir Isotherm from Batch Kinetics of Soil – J (with admixtures).
y = 0.003x + 0.001
R2 = 0.975
0
0.005
0.01
0.015
0.02
0 0.2 0.4 0.6 0.8 1 1.2 1.4 1.6 1.8
Equilibrium Concentration(Ce), mg/L.
Am
ou
nt
of
Ch
rom
ium
A
dso
rbed
/Am
ou
nt
of
So
il, m
g/g
m.
Initial Concentration = 3 mg/L.
y = 0.001x + 0.001
R2 = 0.883
0
0.005
0.01
0.015
0.02
0 0.5 1 1.5 2 2.5Equilibrium Concentration(Ce), mg/L.
Am
ou
nt
of
Ch
rom
ium
A
dso
rbed
/Am
oun
t o
f S
oil,
mg
/gm
.
Initial Concentration = 3 mg/L.
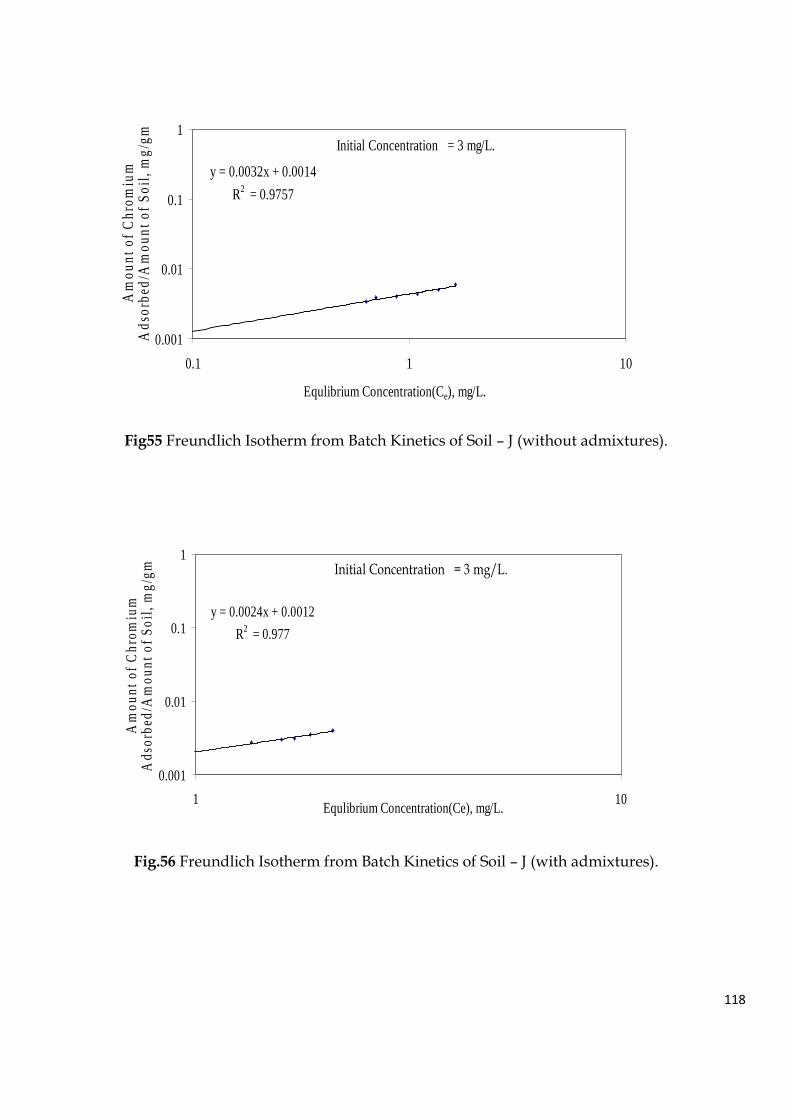
118
Fig55 Freundlich Isotherm from Batch Kinetics of Soil – J (without admixtures).
Fig.56 Freundlich Isotherm from Batch Kinetics of Soil – J (with admixtures).
0.001
0.01
0.1
1
0.1 1 10
Equlibrium Concentration(Ce), mg/L.
Am
ou
nt
of
Ch
rom
ium
A
dso
rbed
/Am
ou
nt
of
So
il, m
g/g
m.
Initial Concentration = 3 mg/L.
y = 0.0032x + 0.0014
R2 = 0.9757
0.001
0.01
0.1
1
1 10Equlibrium Concentration(Ce), mg/L.
Am
ou
nt
of C
hro
miu
m
Ads
orb
ed/A
mo
un
t o
f S
oil,
mg
/gm
.
Initial Concentration = 3 mg/L.
y = 0.0024x + 0.0012
R2 = 0.977
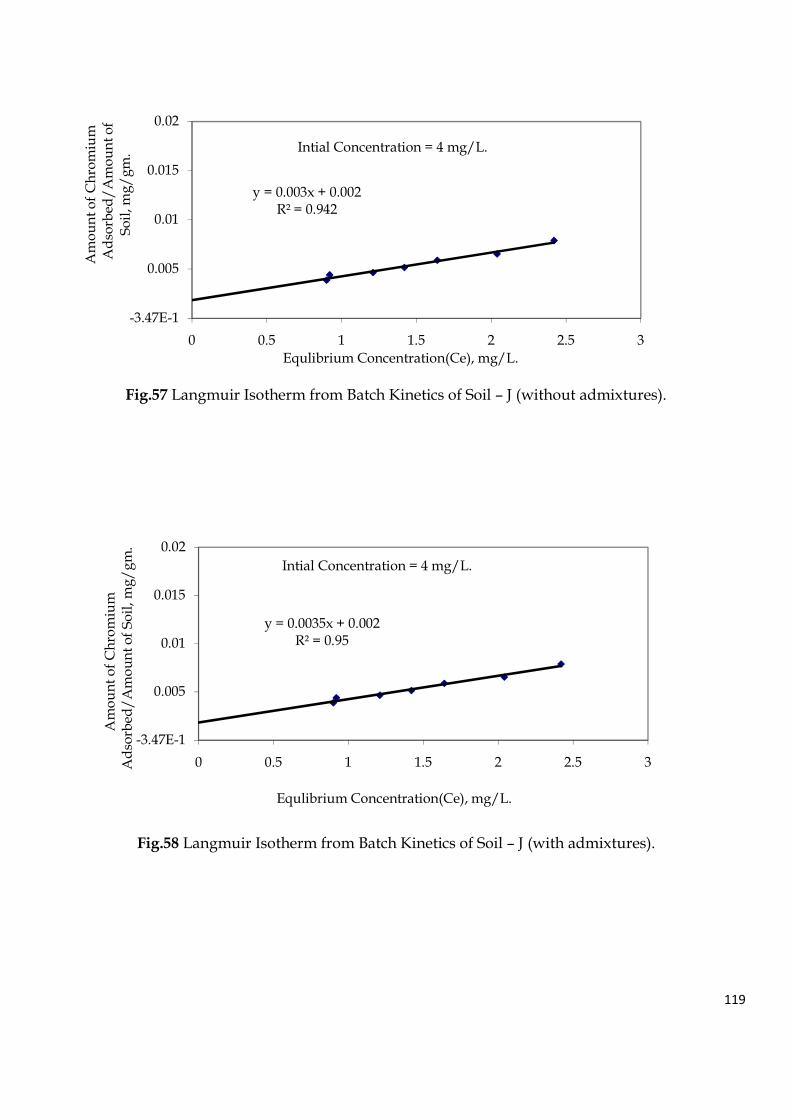
119
Fig.57 Langmuir Isotherm from Batch Kinetics of Soil – J (without admixtures).
Fig.58 Langmuir Isotherm from Batch Kinetics of Soil – J (with admixtures).
y = 0.003x + 0.002R² = 0.942
-3.47E-1
0.005
0.01
0.015
0.02
0 0.5 1 1.5 2 2.5 3
Am
ou
nt
of
Ch
rom
ium
Ad
sorb
ed/
Am
ou
nt
of
So
il, m
g/
gm
.
Equlibrium Concentration(Ce), mg/L.
Intial Concentration = 4 mg/L.
y = 0.0035x + 0.002R² = 0.95
-3.47E-1
0.005
0.01
0.015
0.02
0 0.5 1 1.5 2 2.5 3
Am
ou
nt
of
Ch
rom
ium
Ad
sorb
ed/
Am
ou
nt
of
So
il, m
g/
gm
.
Equlibrium Concentration(Ce), mg/L.
Intial Concentration = 4 mg/L.
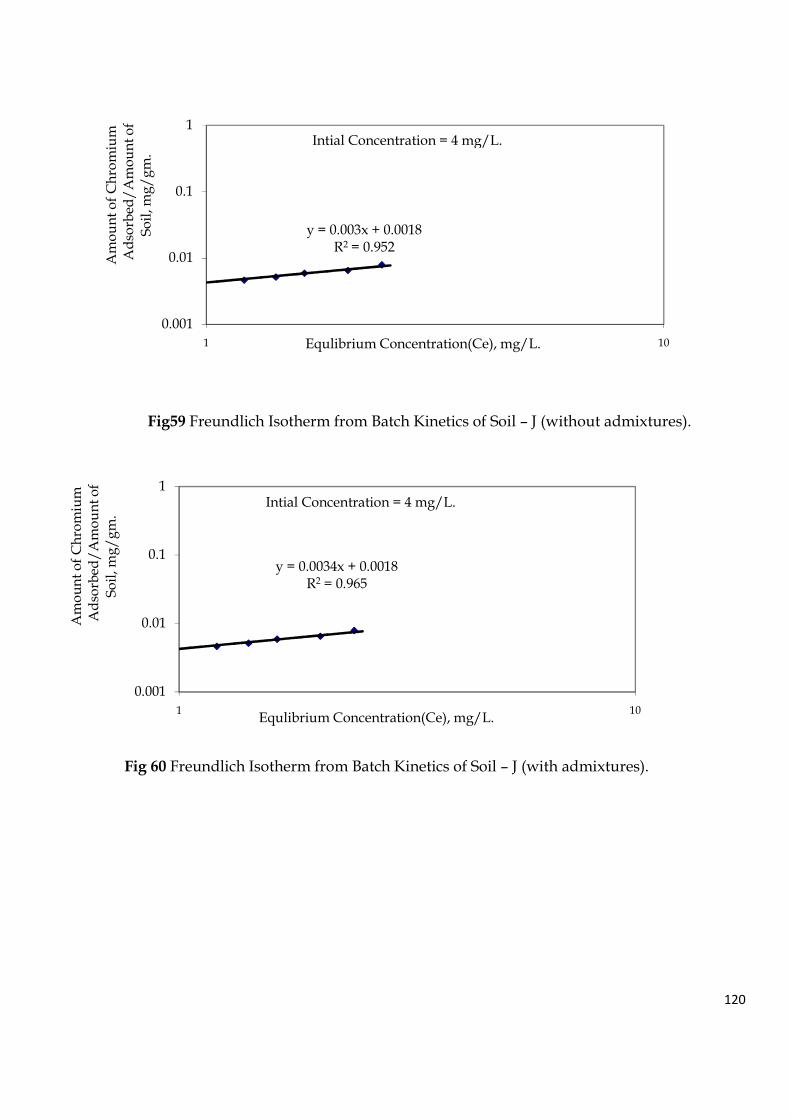
120
Fig59 Freundlich Isotherm from Batch Kinetics of Soil – J (without admixtures).
Fig 60 Freundlich Isotherm from Batch Kinetics of Soil – J (with admixtures).
y = 0.003x + 0.0018R2 = 0.952
0.001
0.01
0.1
1
1 10
Am
ou
nt
of
Ch
rom
ium
Ad
sorb
ed/
Am
ou
nt
of
So
il, m
g/
gm
.
Equlibrium Concentration(Ce), mg/L.
Intial Concentration = 4 mg/L.
y = 0.0034x + 0.0018R2 = 0.965
0.001
0.01
0.1
1
1 10
Am
ou
nt
of
Ch
rom
ium
Ad
sorb
ed/
Am
ou
nt
of
So
il, m
g/
gm
.
Equlibrium Concentration(Ce), mg/L.
Intial Concentration = 4 mg/L.
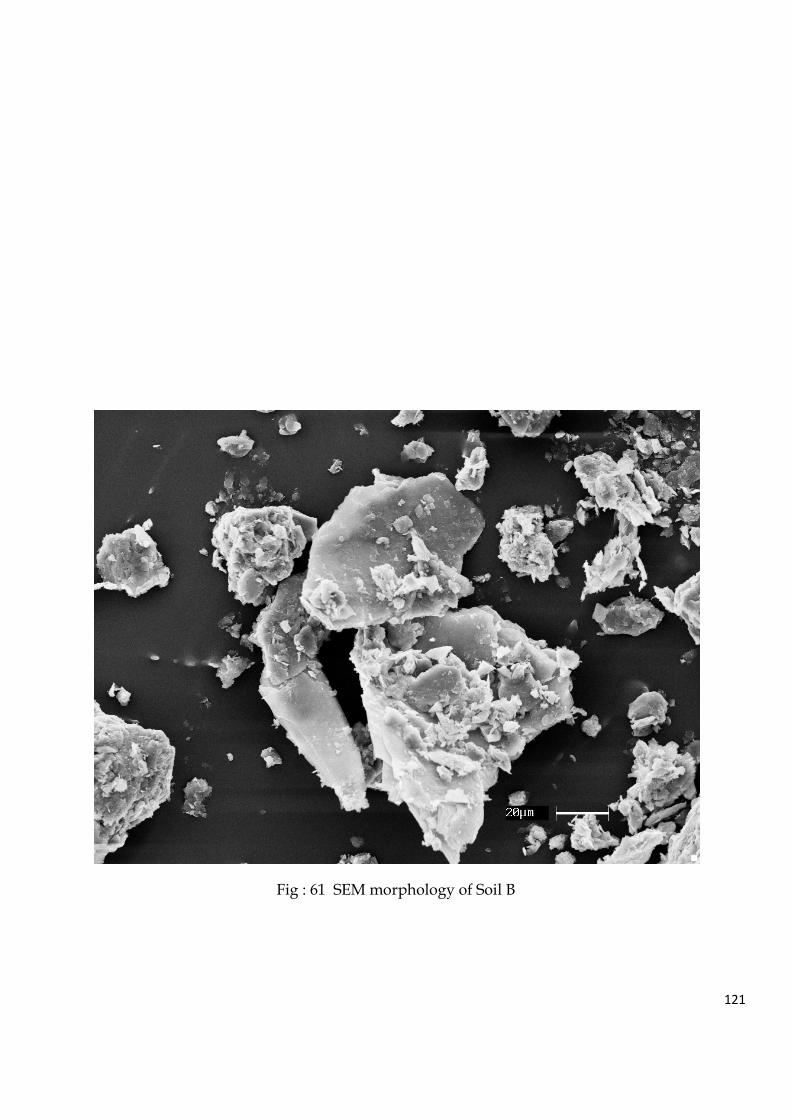
121
Fig : 61 SEM morphology of Soil B
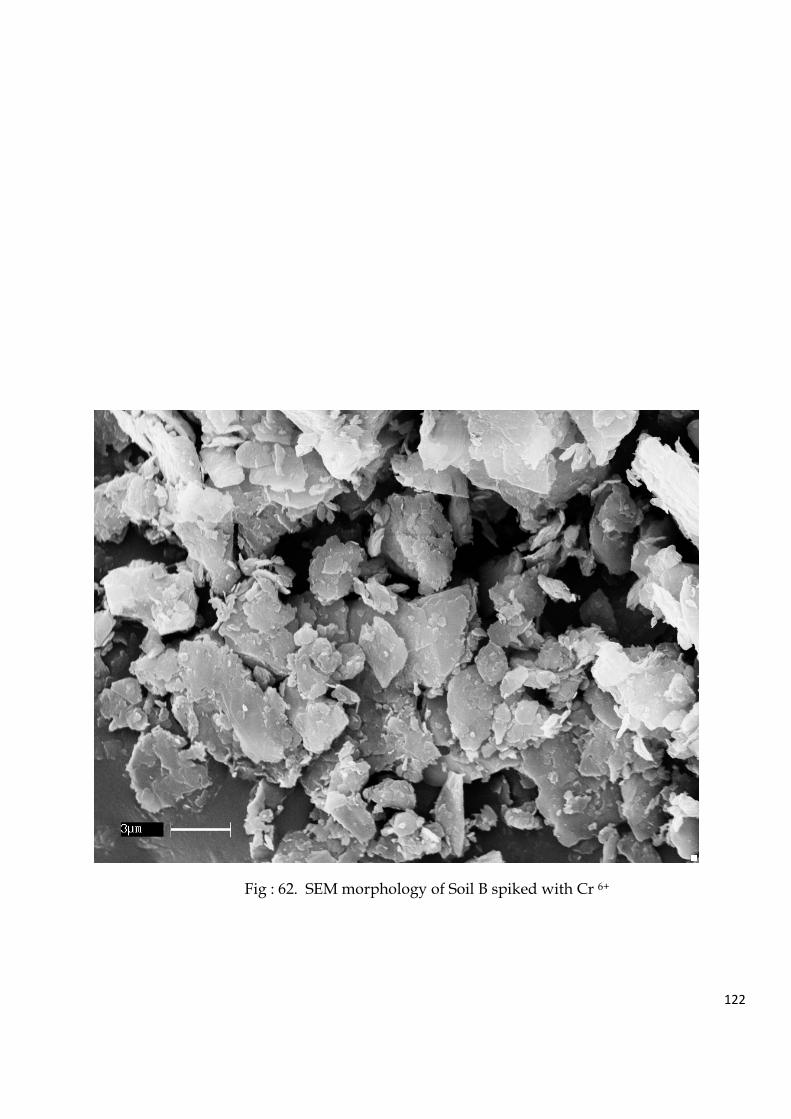
122
Fig : 62. SEM morphology of Soil B spiked with Cr 6+
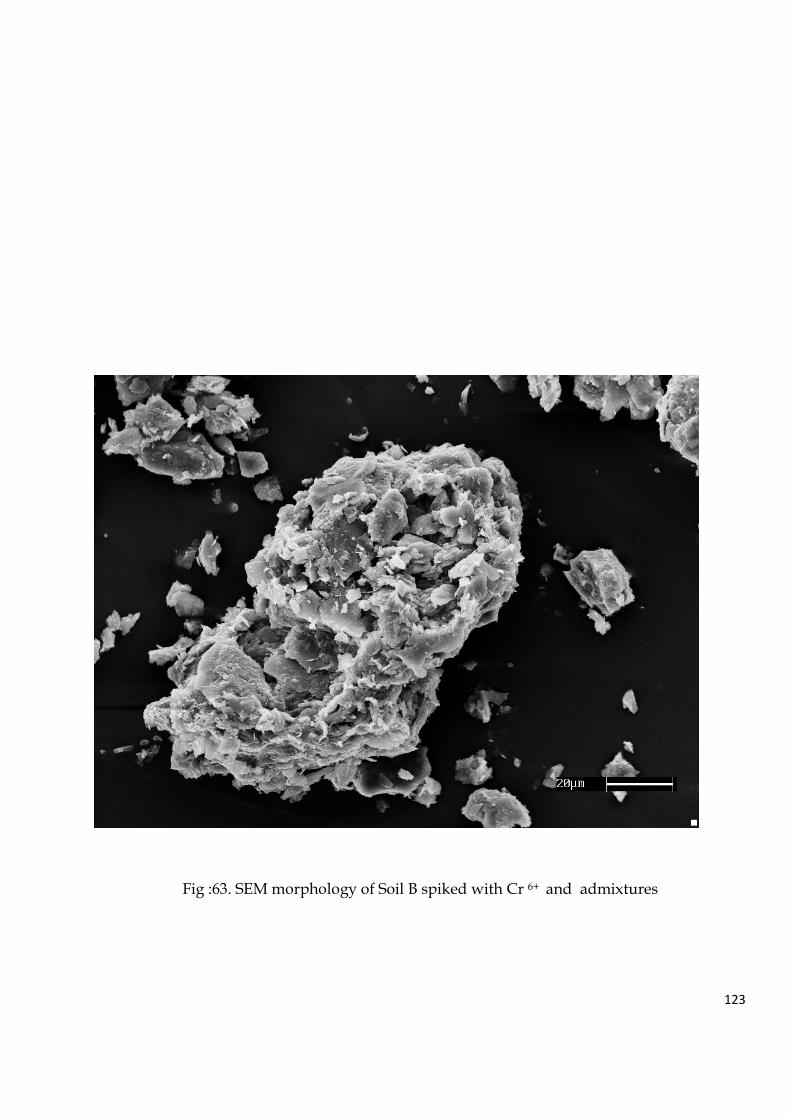
123
Fig :63. SEM morphology of Soil B spiked with Cr 6+ and admixtures
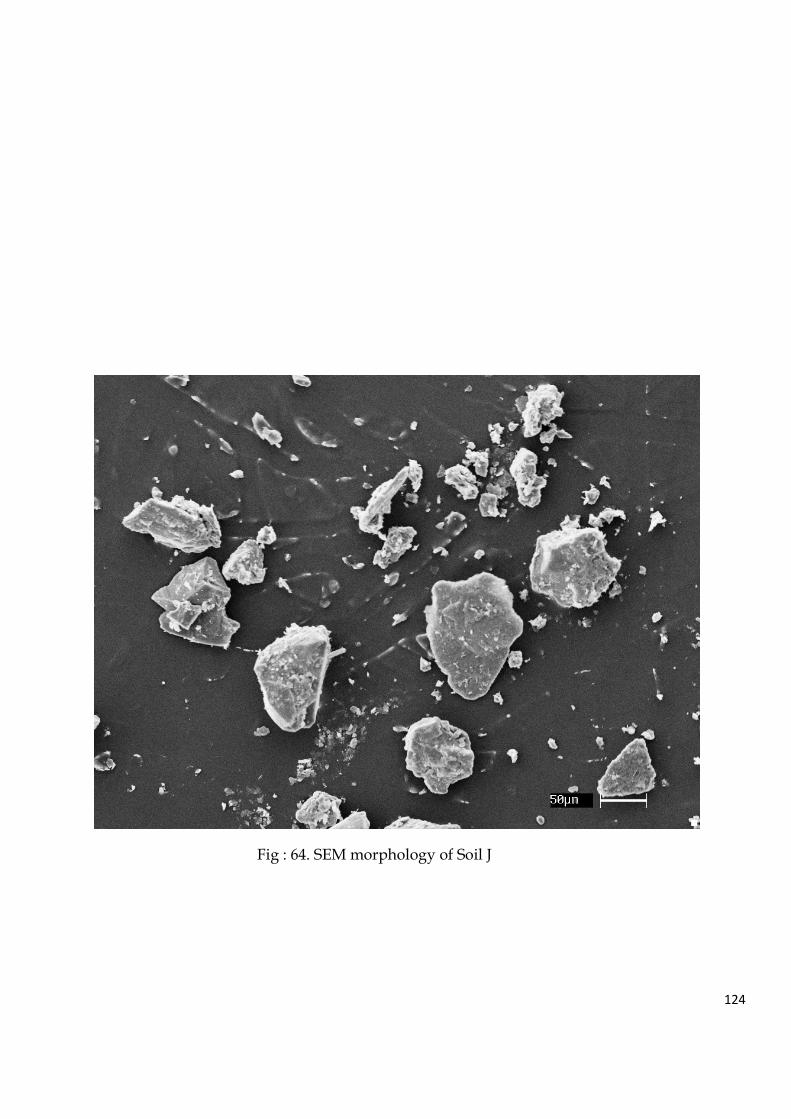
124
Fig : 64. SEM morphology of Soil J
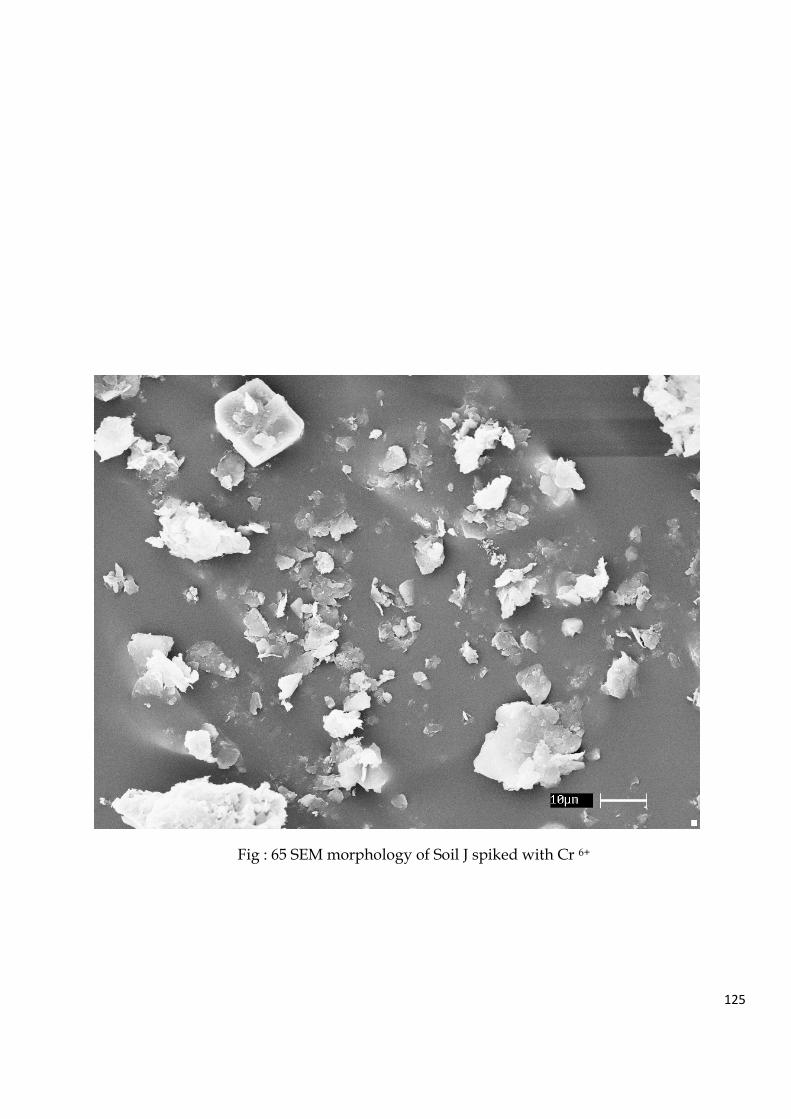
125
Fig : 65 SEM morphology of Soil J spiked with Cr 6+
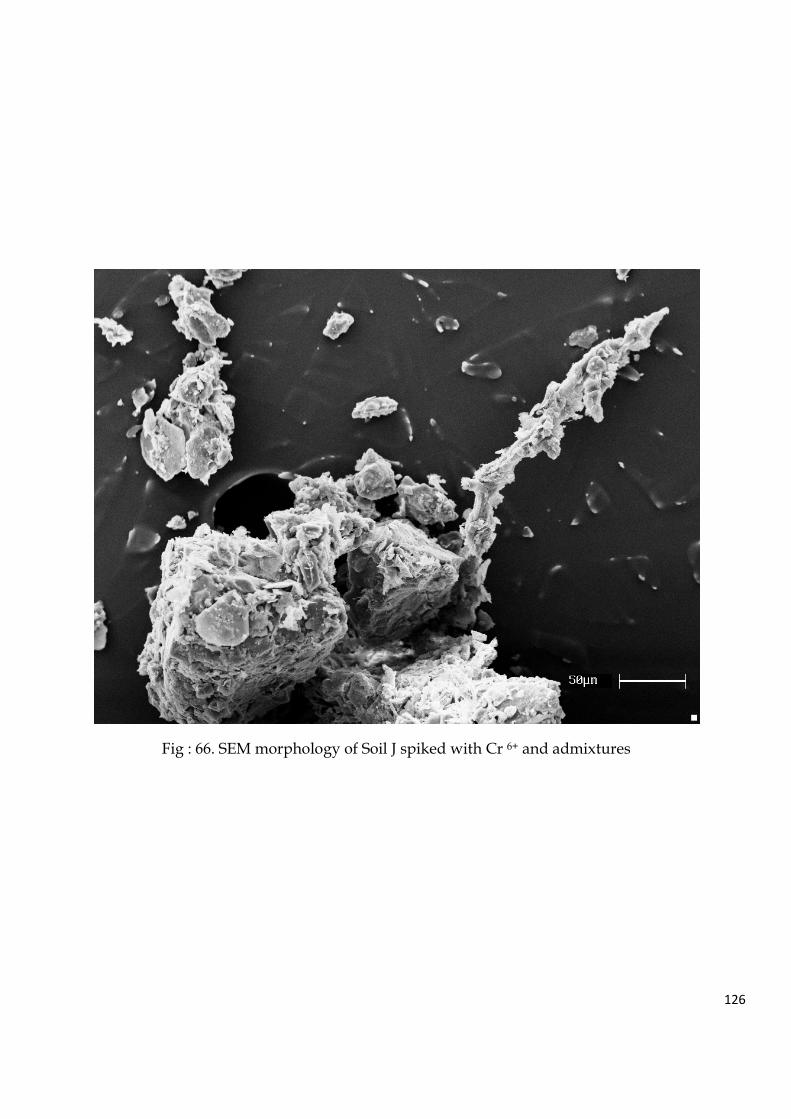
126
Fig : 66. SEM morphology of Soil J spiked with Cr 6+ and admixtures
127
The adsorption isotherm was plotted using the batch experimental data as obtained from time
concentration study using soil and without addition of admixtures with a typical single initial
concentration and equilibrium concentration obtained after a specified time period. The test results
were plotted in both Langmuir and Freundlich isotherm models, as shown in Fig: 37 through 60 for
Soil-B and Soil - J respectively. Both this models showed reasonably good agreement as evident from
Figures. The average value ‘n’ for Soil - B was 0.0022 and for Soil- J was 0.0027 without admixtures,
but due to the addition of admixtures the average value ‘n’ for Soil - B was 0.0029 and for Soil- J was
0.003 respectively which shows no significant change . Low value of ‘n’ (Slope of the line) revealed
that both the soil has high rate of Cr6+ adsorption capacity. Because of low value of ‘n’ (Slope of the
line) the retardation co-efficient Rd, which indicated the contaminant migration also would be less
which corroborated high chromium adsorptive capacity of the test soils. It is also found that Rd value
of the soil without admixture is is 1.028 whereas with application of admixture its value increases to
1.05 which is considered to be marginally higher. Hence attenuation capacity of soil with admixtures
has slightly enhanced. From the isotherm plots 1/n value is increased in case of admixture which
further corroborates the above findings.
It is found from above figures that the use of different ingredients such as bentonite, rice husk with
soil improves the sorption capacity of soil in the form of 20%.The soils have pH value of 7.64 and 7.33
which indicates a mild alkaline formation of carbonate of metal. But however with addition of
admixtures the pH has changed to a range of 5.8-6.1(Fig.35) which is most favourable for Cr6+
adsorption (Yu et. al 2008). AlsoThis chromium was considered to link with the rice husk through –
COO and -O- groups via ionic exchange with a proton (Hu et.al 2004). Fig 61 through 66 shows SEM
morphologies of the soil before and after chromium sorption with and without admixtures. It
indicates that surface structure of soil was disintegrated after Cr6+ adsorption. this may be attributed
to the considerable oxidation capability of Cr6+ towards soil. Naturally occurring Fe ion in soils and
sediments create a spatially fixed reducing zone or barrier. Redox sensitive contaminants such as cr6+
are immobilized or precipitated as they migrate through the reducing zone with following chemical
action.
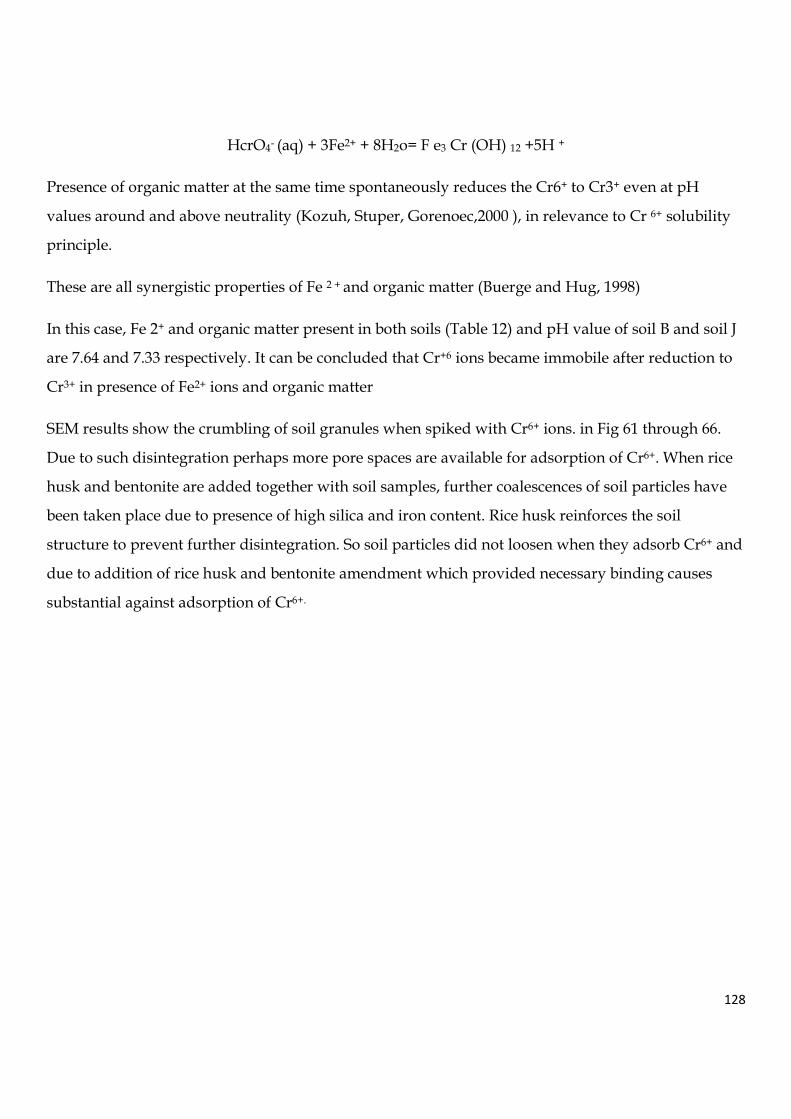
128
HcrO4- (aq) + 3Fe2+ + 8H2o= F e3 Cr (OH) 12 +5H +
Presence of organic matter at the same time spontaneously reduces the Cr6+ to Cr3+ even at pH
values around and above neutrality (Kozuh, Stuper, Gorenoec,2000 ), in relevance to Cr 6+ solubility
principle.
These are all synergistic properties of Fe 2 + and organic matter (Buerge and Hug, 1998)
In this case, Fe 2+ and organic matter present in both soils (Table 12) and pH value of soil B and soil J
are 7.64 and 7.33 respectively. It can be concluded that Cr+6 ions became immobile after reduction to
Cr3+ in presence of Fe2+ ions and organic matter
SEM results show the crumbling of soil granules when spiked with Cr6+ ions. in Fig 61 through 66.
Due to such disintegration perhaps more pore spaces are available for adsorption of Cr6+. When rice
husk and bentonite are added together with soil samples, further coalescences of soil particles have
been taken place due to presence of high silica and iron content. Rice husk reinforces the soil
structure to prevent further disintegration. So soil particles did not loosen when they adsorb Cr6+ and
due to addition of rice husk and bentonite amendment which provided necessary binding causes
substantial against adsorption of Cr6+.
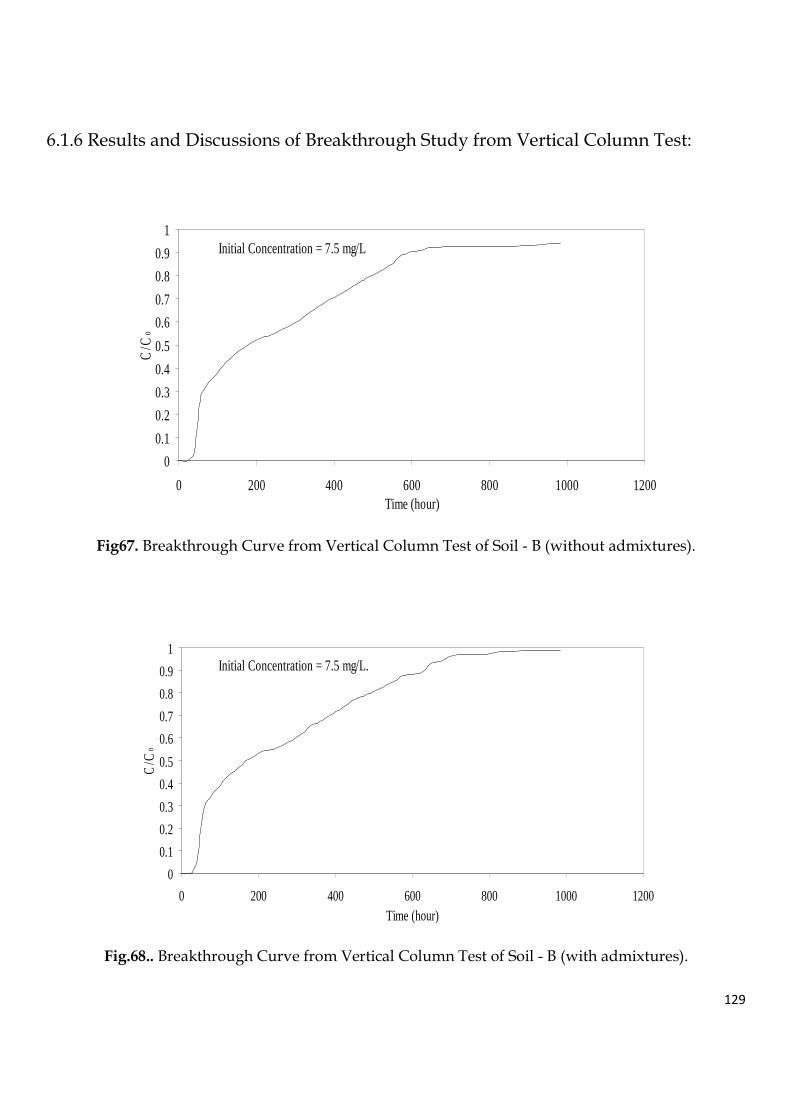
129
6.1.6 Results and Discussions of Breakthrough Study from Vertical Column Test:
Fig67. Breakthrough Curve from Vertical Column Test of Soil - B (without admixtures).
Fig.68.. Breakthrough Curve from Vertical Column Test of Soil - B (with admixtures).
0
0.1
0.2
0.3
0.4
0.5
0.6
0.7
0.8
0.9
1
0 200 400 600 800 1000 1200Time (hour)
C/C
o
Initial Concentration = 7.5 mg/L
0
0.1
0.2
0.3
0.4
0.5
0.6
0.7
0.8
0.9
1
0 200 400 600 800 1000 1200Time (hour)
C/C
o
Initial Concentration = 7.5 mg/L.
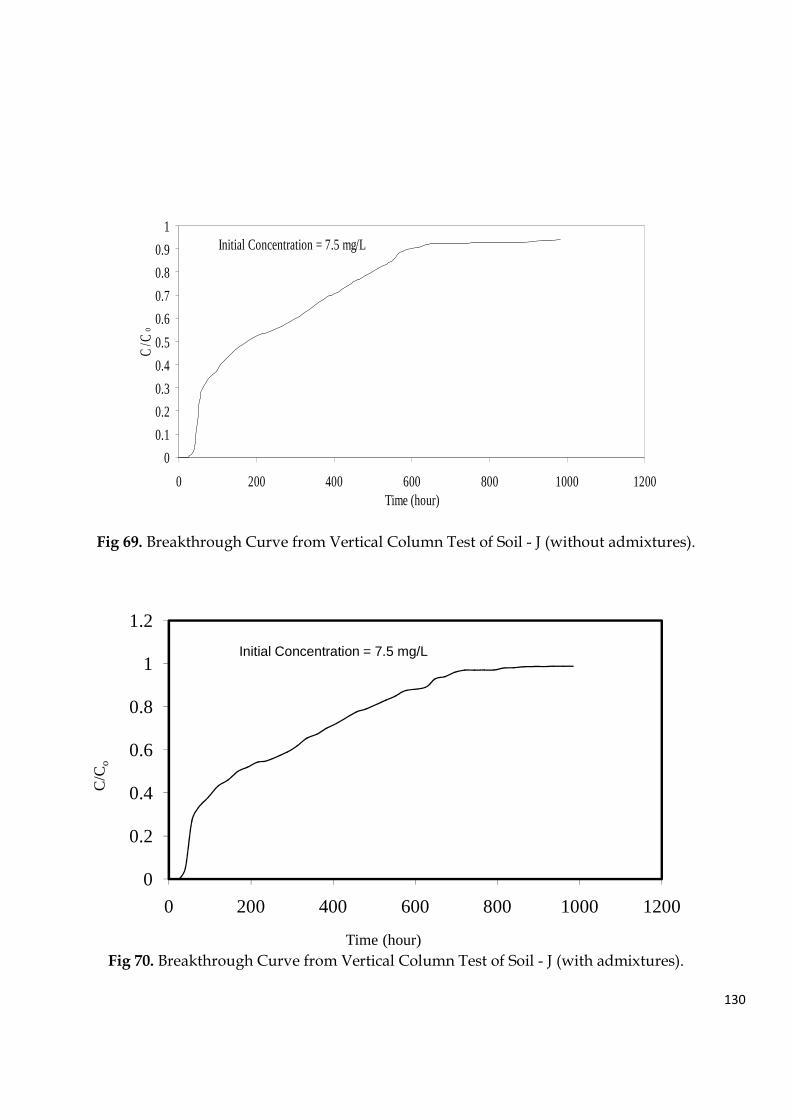
130
Fig 69. Breakthrough Curve from Vertical Column Test of Soil - J (without admixtures).
Fig 70. Breakthrough Curve from Vertical Column Test of Soil - J (with admixtures).
0
0.1
0.2
0.3
0.4
0.5
0.6
0.7
0.8
0.9
1
0 200 400 600 800 1000 1200Time (hour)
C/C
o
Initial Concentration = 7.5 mg/L
0
0.2
0.4
0.6
0.8
1
1.2
0 200 400 600 800 1000 1200
C/C
o
Time (hour)
Initial Concentration = 7.5 mg/L
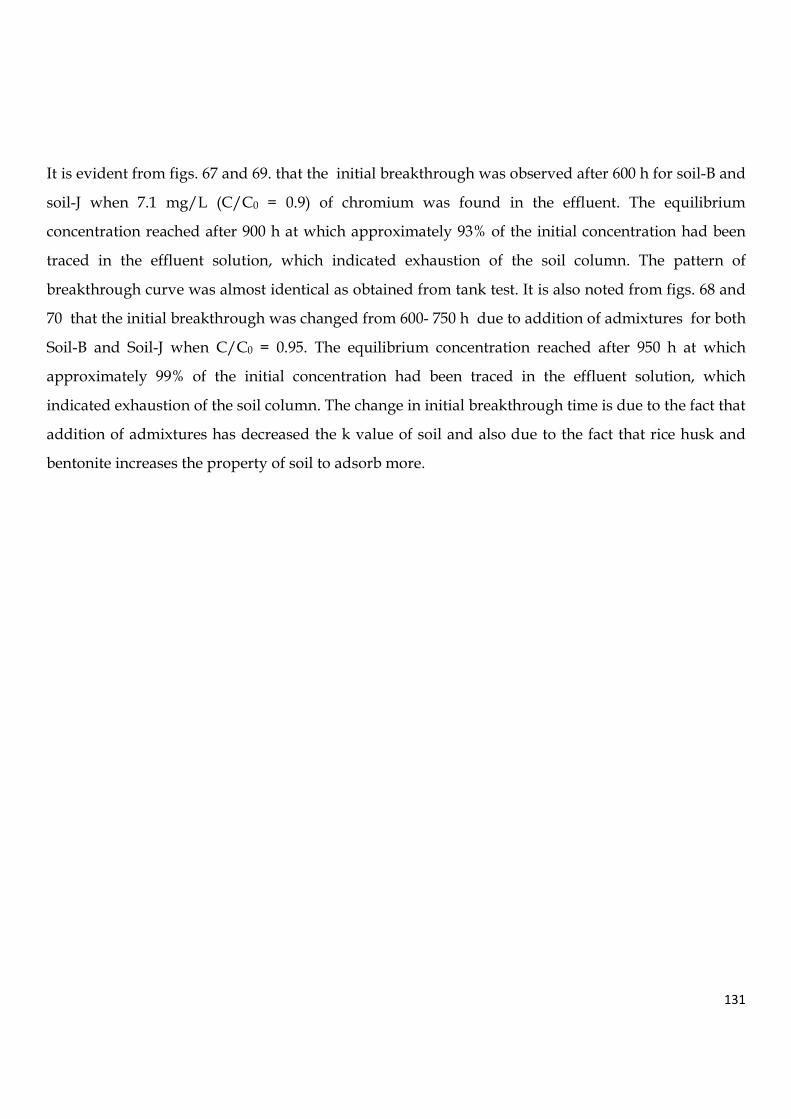
131
It is evident from figs. 67 and 69. that the initial breakthrough was observed after 600 h for soil-B and
soil-J when 7.1 mg/L (C/C0 = 0.9) of chromium was found in the effluent. The equilibrium
concentration reached after 900 h at which approximately 93% of the initial concentration had been
traced in the effluent solution, which indicated exhaustion of the soil column. The pattern of
breakthrough curve was almost identical as obtained from tank test. It is also noted from figs. 68 and
70 that the initial breakthrough was changed from 600- 750 h due to addition of admixtures for both
Soil-B and Soil-J when C/C0 = 0.95. The equilibrium concentration reached after 950 h at which
approximately 99% of the initial concentration had been traced in the effluent solution, which
indicated exhaustion of the soil column. The change in initial breakthrough time is due to the fact that
addition of admixtures has decreased the k value of soil and also due to the fact that rice husk and
bentonite increases the property of soil to adsorb more.
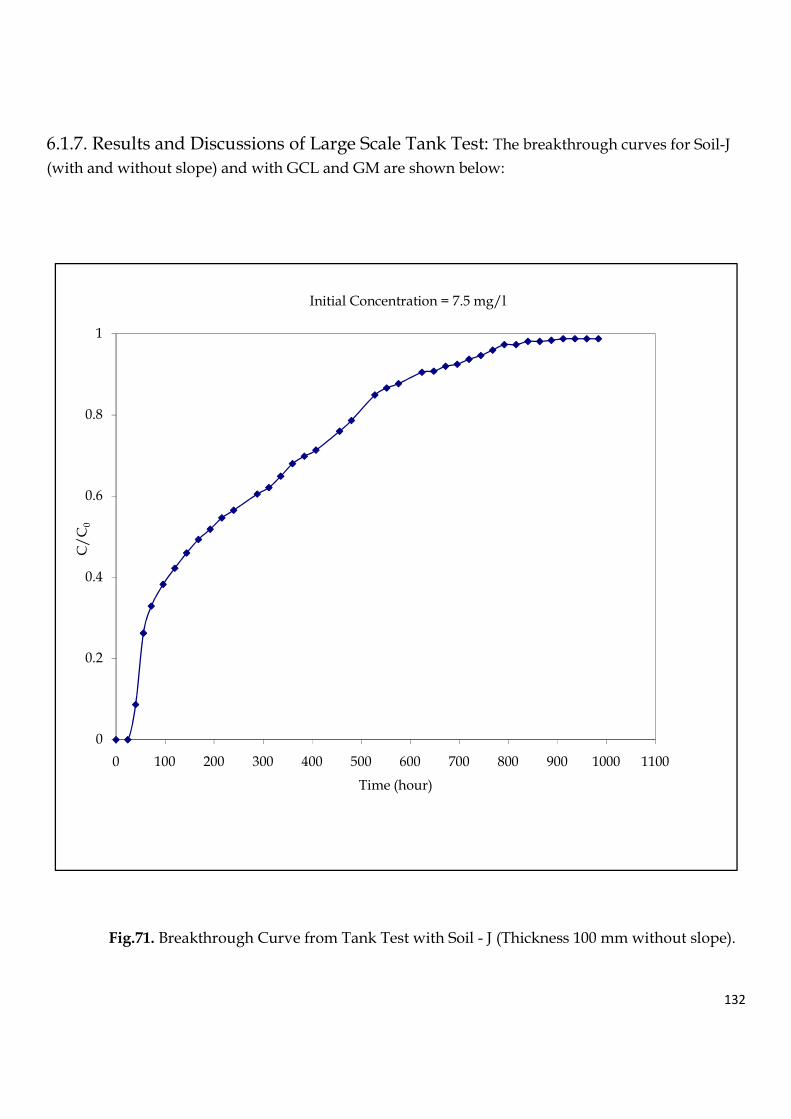
132
6.1.7. Results and Discussions of Large Scale Tank Test: The breakthrough curves for Soil-J
(with and without slope) and with GCL and GM are shown below:
Fig.71. Breakthrough Curve from Tank Test with Soil - J (Thickness 100 mm without slope).
0
0.2
0.4
0.6
0.8
1
0 100 200 300 400 500 600 700 800 900 1000 1100
C/
C0
Time (hour)
Initial Concentration = 7.5 mg/l
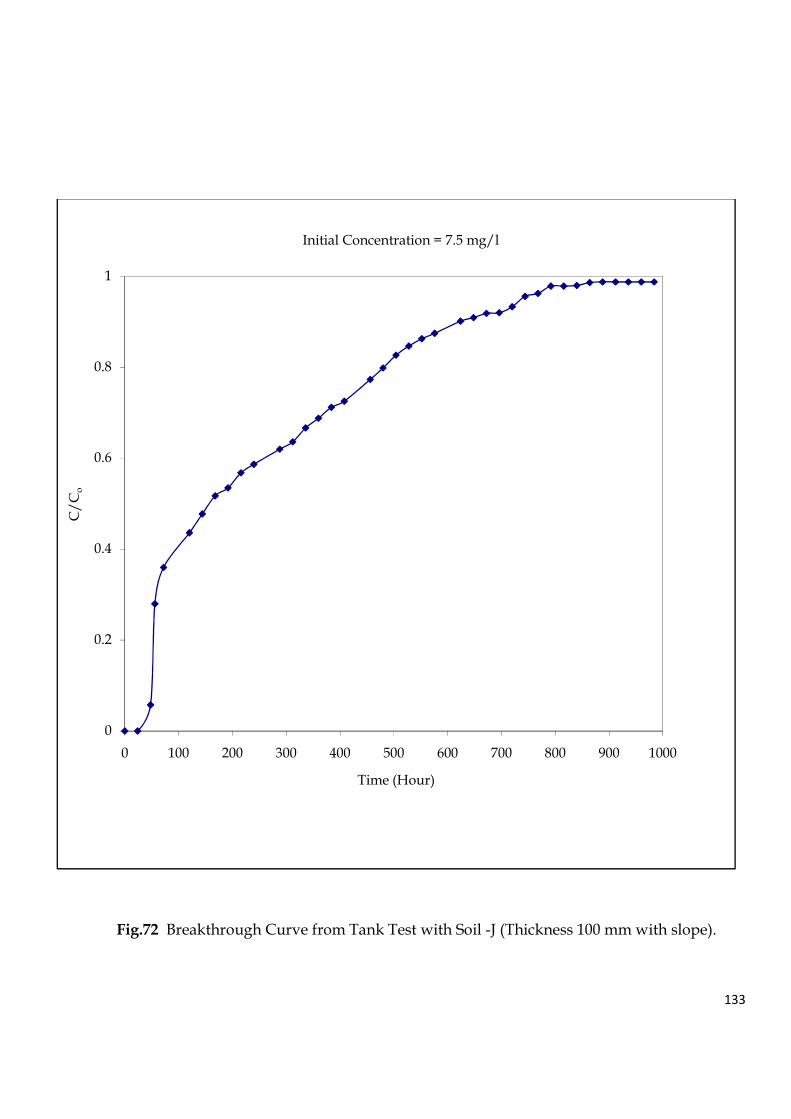
133
Fig.72 Breakthrough Curve from Tank Test with Soil -J (Thickness 100 mm with slope).
0
0.2
0.4
0.6
0.8
1
0 100 200 300 400 500 600 700 800 900 1000
C/
Co
Time (Hour)
Initial Concentration = 7.5 mg/l
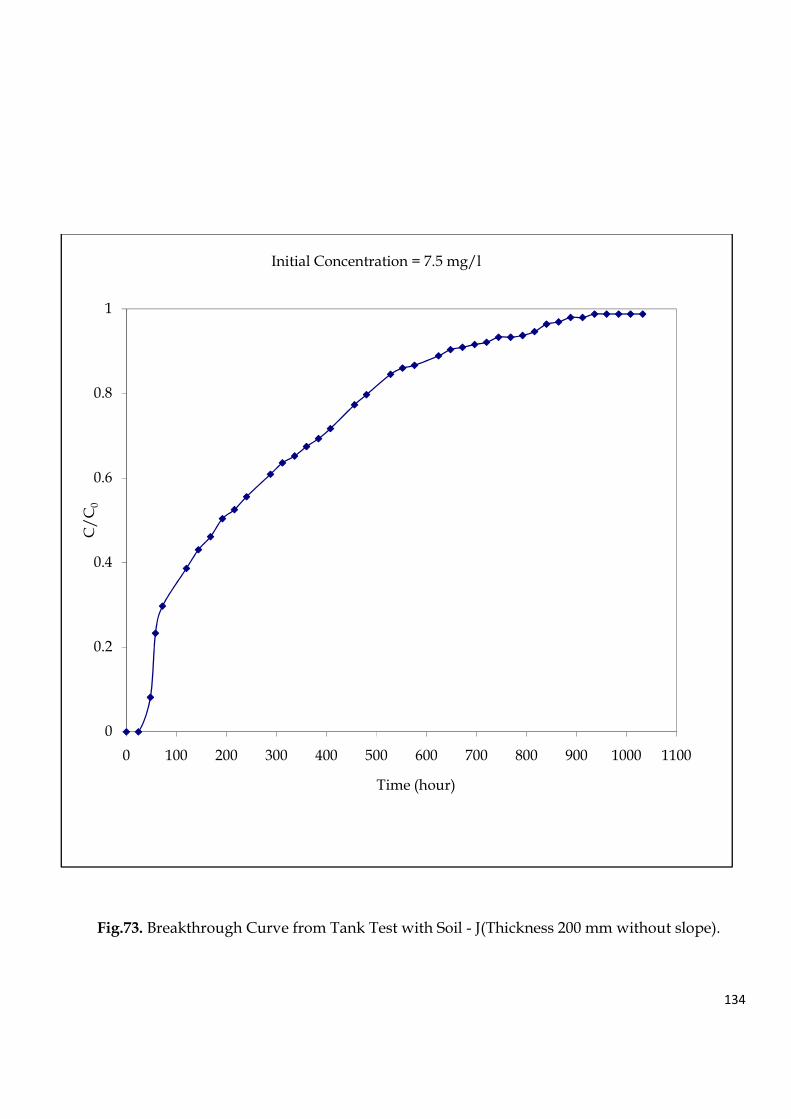
134
Fig.73. Breakthrough Curve from Tank Test with Soil - J(Thickness 200 mm without slope).
0
0.2
0.4
0.6
0.8
1
0 100 200 300 400 500 600 700 800 900 1000 1100
C/
C0
Time (hour)
Initial Concentration = 7.5 mg/l
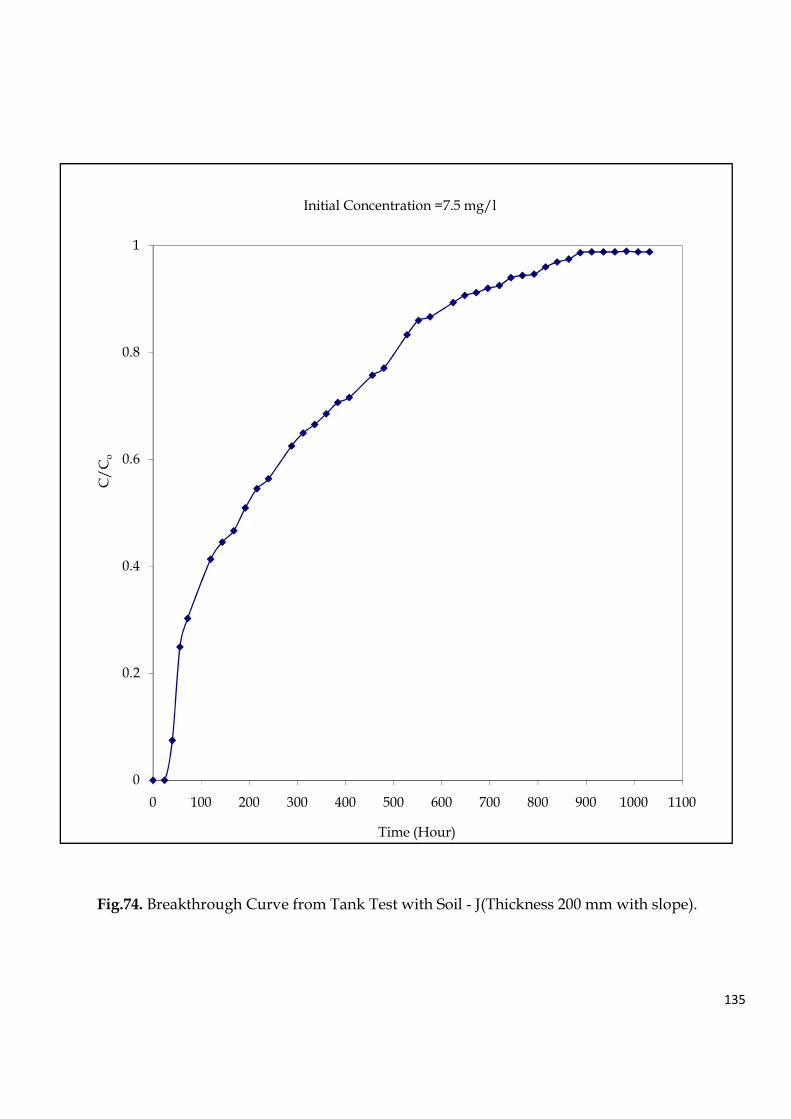
135
Fig.74. Breakthrough Curve from Tank Test with Soil - J(Thickness 200 mm with slope).
0
0.2
0.4
0.6
0.8
1
0 100 200 300 400 500 600 700 800 900 1000 1100
C/
Co
Time (Hour)
Initial Concentration =7.5 mg/l
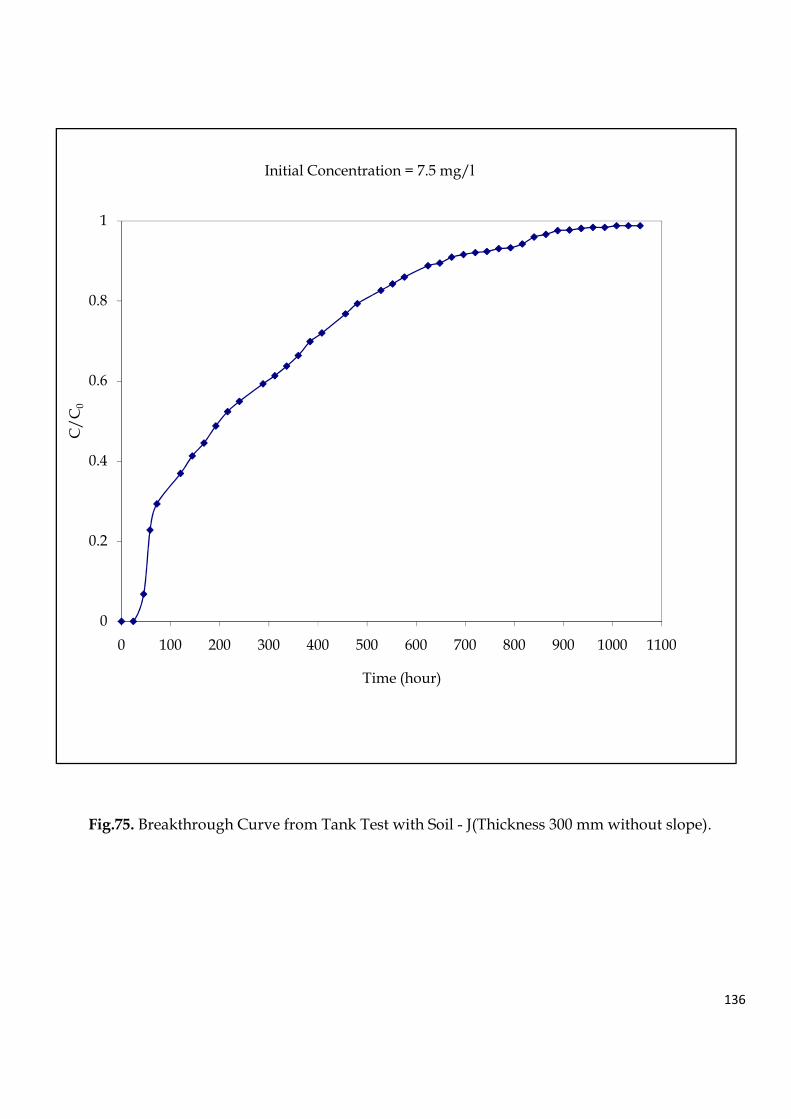
136
Fig.75. Breakthrough Curve from Tank Test with Soil - J(Thickness 300 mm without slope).
0
0.2
0.4
0.6
0.8
1
0 100 200 300 400 500 600 700 800 900 1000 1100
C/
C0
Time (hour)
Initial Concentration = 7.5 mg/l
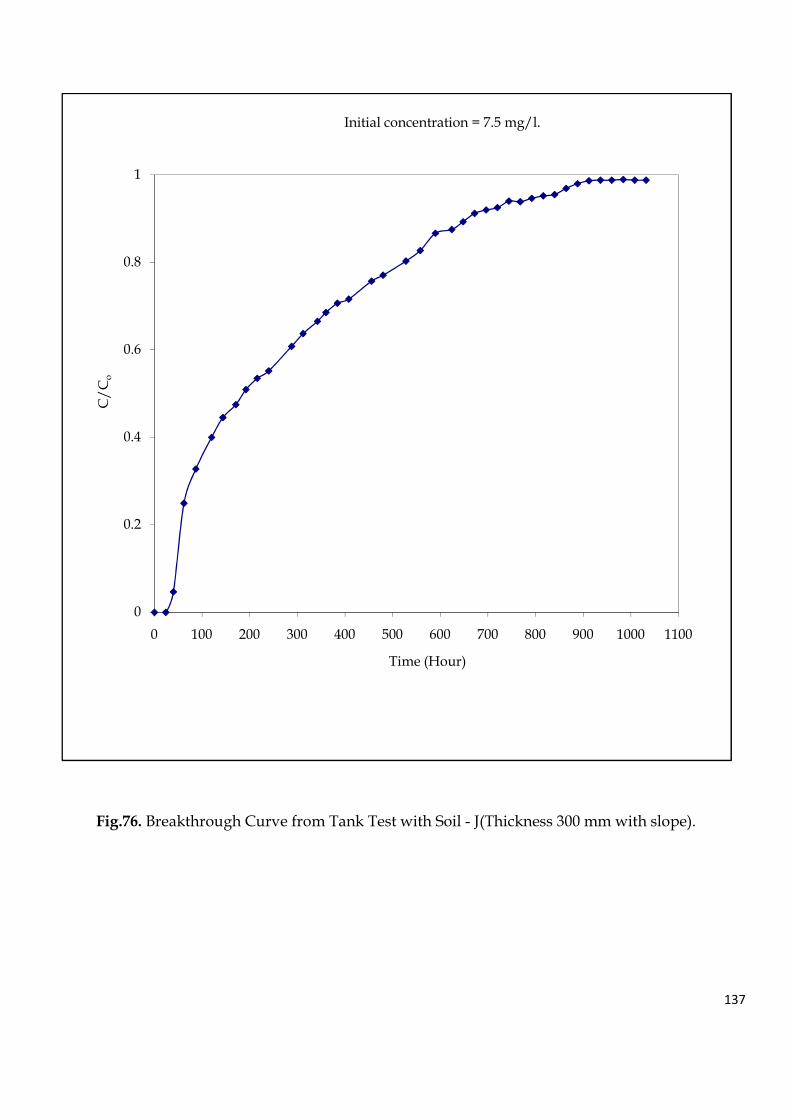
137
Fig.76. Breakthrough Curve from Tank Test with Soil - J(Thickness 300 mm with slope).
0
0.2
0.4
0.6
0.8
1
0 100 200 300 400 500 600 700 800 900 1000 1100
C/
Co
Time (Hour)
Initial concentration = 7.5 mg/l.
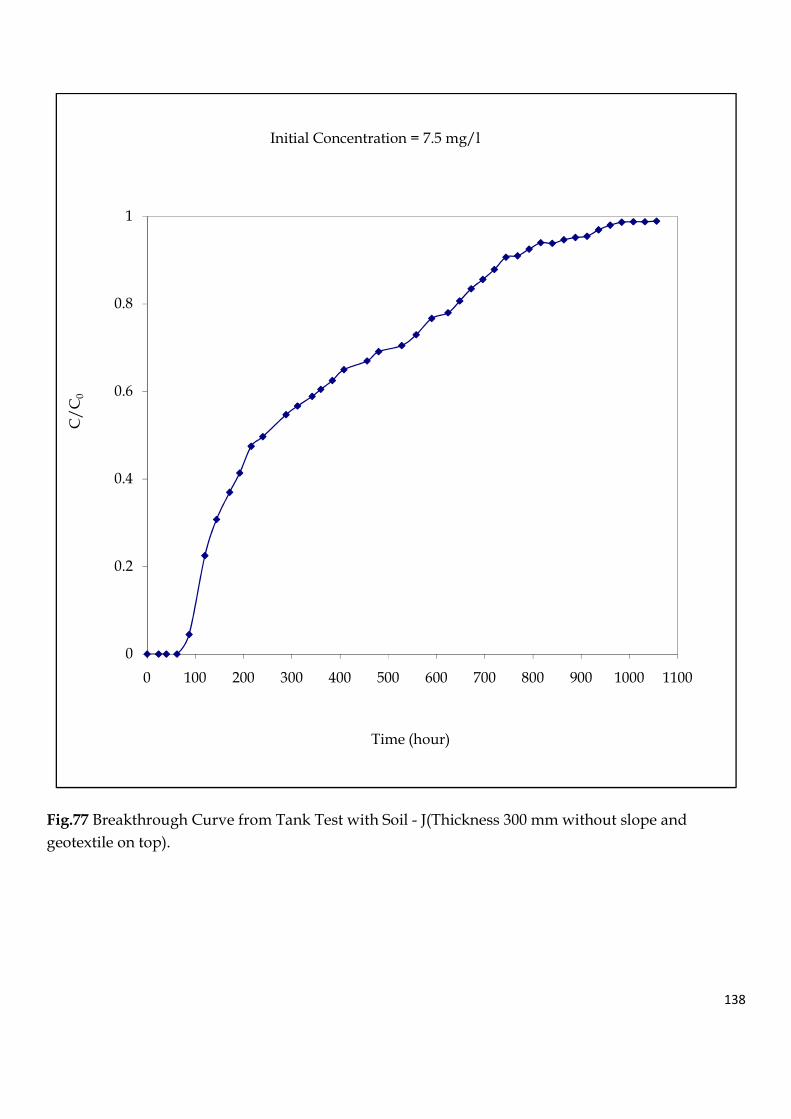
138
Fig.77 Breakthrough Curve from Tank Test with Soil - J(Thickness 300 mm without slope and
geotextile on top).
0
0.2
0.4
0.6
0.8
1
0 100 200 300 400 500 600 700 800 900 1000 1100
C/
C0
Time (hour)
Initial Concentration = 7.5 mg/l
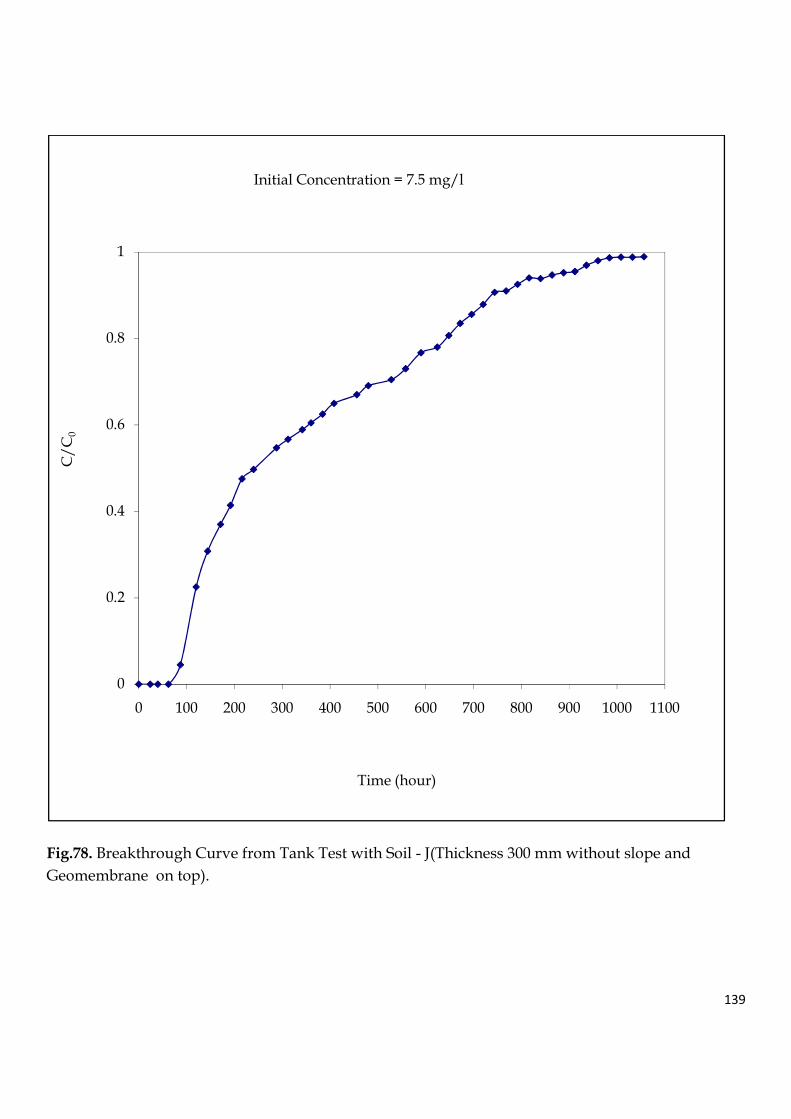
139
Fig.78. Breakthrough Curve from Tank Test with Soil - J(Thickness 300 mm without slope and
Geomembrane on top).
0
0.2
0.4
0.6
0.8
1
0 100 200 300 400 500 600 700 800 900 1000 1100
C/
C0
Time (hour)
Initial Concentration = 7.5 mg/l
140
Figure 71 through 78show the typical breakthrough curve as obtained from Large Scale Tank Test
which exhibited the variation of concentration ratio (i.e., C/C0) with time for an input Cr
concentration of 7.5 mg/L for soil thickness 100 mm without slope and with slope provided at the
bottom of the soil respectively for Soil - J. The Soil thicknesses of 200 and 300 mm were also being
taken for the test with and without slope of the soil layer.
The initial breakthrough was observed after 700 h when 7.0 mg/L of Cr was found in the effluent
with soil thickness 100mm, without any slope at the bottom of soil layer wherethe equilibrium
concentration reached after 900 h at which approximately 98 % of the initial concentration was traced
in the effluent solution which indicated almost the exhaustion of soil column.
When a mild slope was provided at the bottom of the soil column in all the cases, the breakthrough
occurred earlier than the case where there was no slope at the bottom. This was due to the mild slope
which enabled the leaching solution for draining to the effluent point relatively at faster rate. As per
EPA minimum technology guidance (MTG 1985) for hazardous waste, landfills slopes should be
provided greater than or equal to 2 %. It has been shown by Kmet et al., (1981) that for a given slopes
up to 2 % there was marked improvement in performance of landfills with respect to leakage. The
slope in the present investigation was given as 1.16 %. It was also noticed that the effect of slope on
leachate behavior is marginal. It is also in good agreement with the observations of Drury D (1997).
The tank test were also carried out with Soil – J by using a soil thickness of 300 mm without slope and
providing a GCL and geomembrane on top of the soil bed (shown in Fig: 8). The initial breakthrough
was observed after 800 hrs in case of GCL and 825 hrs in case of geomembrane when a breakthrough
concentration of 7.0 mg/L was found in the effluent.
GCL possesses low hydraulic conductivity primarily from the smectile components small particle
size, large surface area having capability to adsorb and effectively immobilize pore water through a
variety of short range and long range hydration mechanisms.
It is observed from Fig through that breakthrough time of Cr6+ adsorption using gcl, is proceeded
approximately 100hrs more than that for CCL. The reasons can be attributed to the low levels of
hydraulic conductivity of GCL due to double diffused layer(DDL) effect and osmotic swelling .water
molecules in DDL are strongly bond to the clay surface and they do not contribute for providing any
space to permeate water. Osmotic swelling is attributed to osmotic phase in which the water
141
molecules are attracted into internal clay surfaces. Number of layers of water molecules at
equilibrium is proportional to cation concentration in bulk water (Onikata et.al 1999). When the bulk
water contains a low concentration of monovalent cations, and the monovalent cations occupy
exchange sites a large fraction of total water is bound so that less mobile water is available for flow
and hydraulic conductivity is low(Katsumi 2010)
On the other hand, breakthrough time for Cr6+ adsorption by use of geomembranes is further
proceeded by about 25hrs than that found for GCL. Geomembranes (GM) are solids and there is no
flow through an intact GM. However water and contaminants can potentially migrate through GM
by moleculer diffusion. Permeation Co-efficient (Permeability of HDPE) of GM which takes into
consideration portioning of and diffusion is very low (2.3x10⁻¹⁶m2/s) (Rowe 2005) and henceforth rate
of Cr6+ movement is also lowered compared to that of GCL.
Also the electrical conductivity tests with chrome waste leachate indicates the conductivity of GM is
460mho/cm compared to GCL value of 425mho/cm. This property also corroborating the attribution
of lower transmitting ability of liquid in case of GM than GCL.
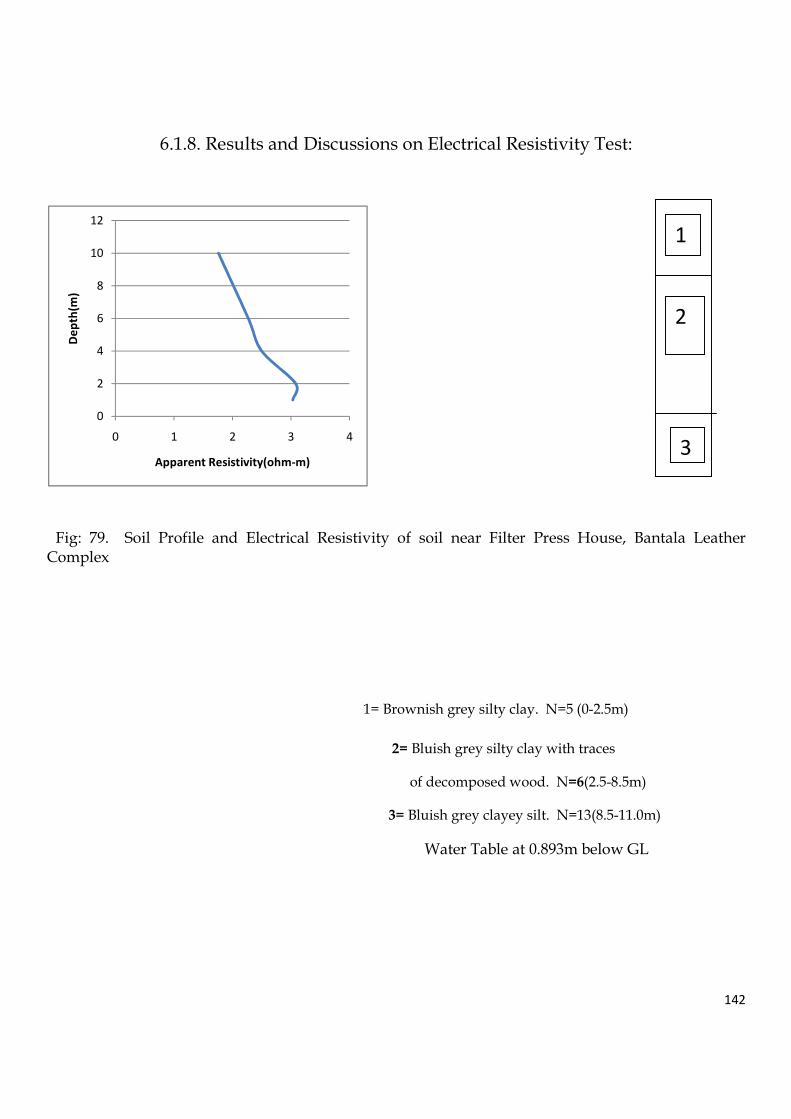
142
6.1.8. Results and Discussions on Electrical Resistivity Test:
Fig: 79. Soil Profile and Electrical Resistivity of soil near Filter Press House, Bantala Leather Complex
1= Brownish grey silty clay. N=5 (0-2.5m)
2= Bluish grey silty clay with traces
of decomposed wood. N=6(2.5-8.5m)
3= Bluish grey clayey silt. N=13(8.5-11.0m)
Water Table at 0.893m below GL
0
2
4
6
8
10
12
0 1 2 3 4
De
pth
(m)
Apparent Resistivity(ohm-m)
1
2
3
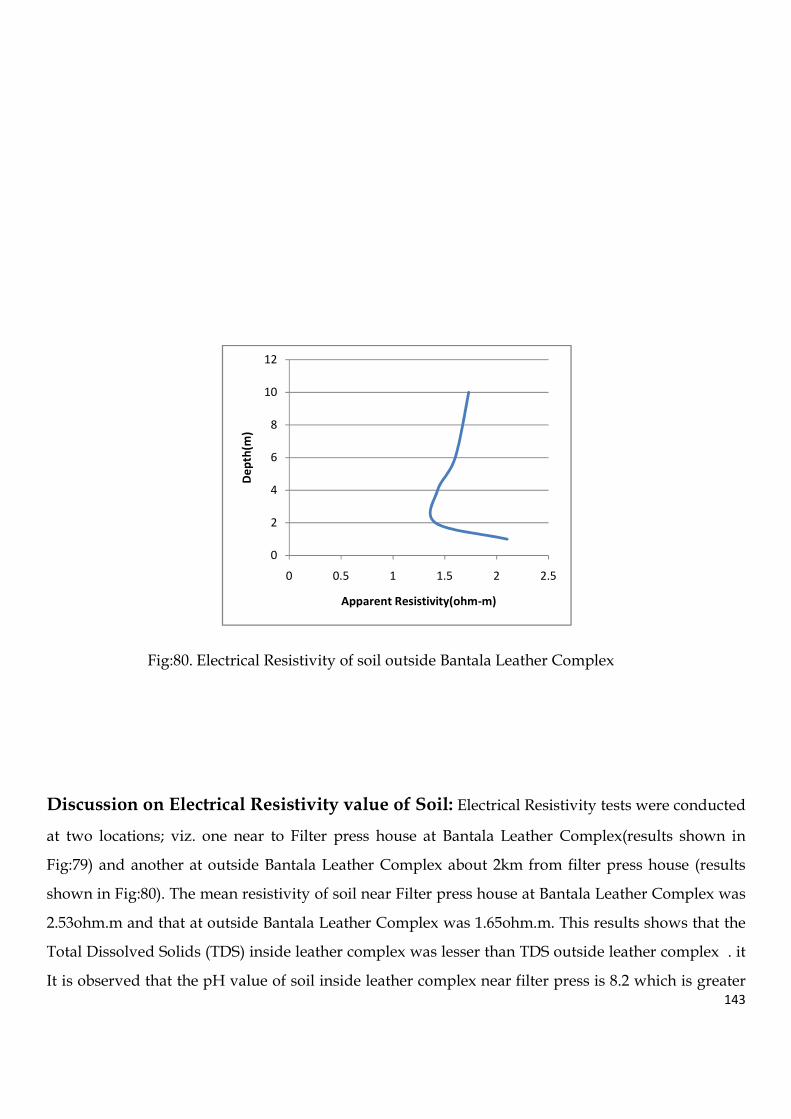
143
Fig:80. Electrical Resistivity of soil outside Bantala Leather Complex
Discussion on Electrical Resistivity value of Soil: Electrical Resistivity tests were conducted
at two locations; viz. one near to Filter press house at Bantala Leather Complex(results shown in
Fig:79) and another at outside Bantala Leather Complex about 2km from filter press house (results
shown in Fig:80). The mean resistivity of soil near Filter press house at Bantala Leather Complex was
2.53ohm.m and that at outside Bantala Leather Complex was 1.65ohm.m. This results shows that the
Total Dissolved Solids (TDS) inside leather complex was lesser than TDS outside leather complex . it
It is observed that the pH value of soil inside leather complex near filter press is 8.2 which is greater
0
2
4
6
8
10
12
0 0.5 1 1.5 2 2.5
De
pth
(m)
Apparent Resistivity(ohm-m)
144
than pH of outside soil which is 7.6, which shows that the Cr6+ is precipitated and as a result TDS
value at Filter press house is less than that outside Leather complex and also the resistivity valuews
are different , and high value of resistivity inside complex which also indicates that soil possess more
salt content. The soil profile at Bantala leather complex is also shown upto 11m in Fig: 79.
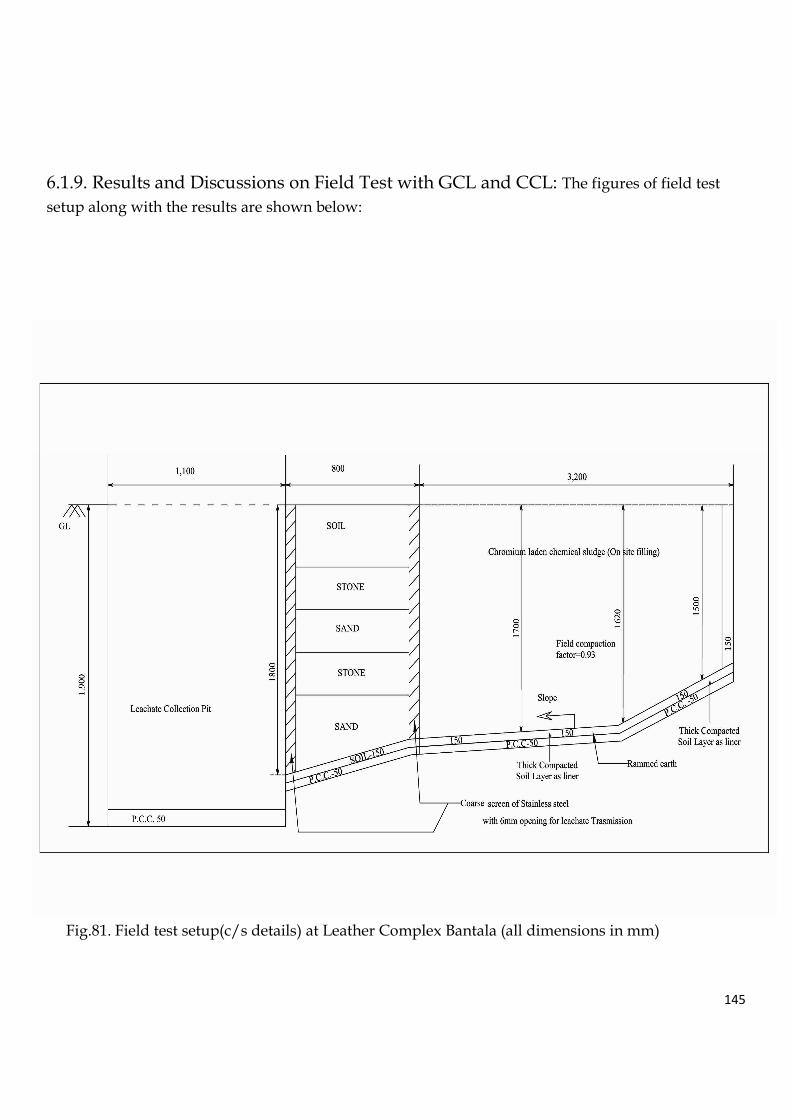
145
6.1.9. Results and Discussions on Field Test with GCL and CCL: The figures of field test
setup along with the results are shown below:
Fig.81. Field test setup(c/s details) at Leather Complex Bantala (all dimensions in mm)
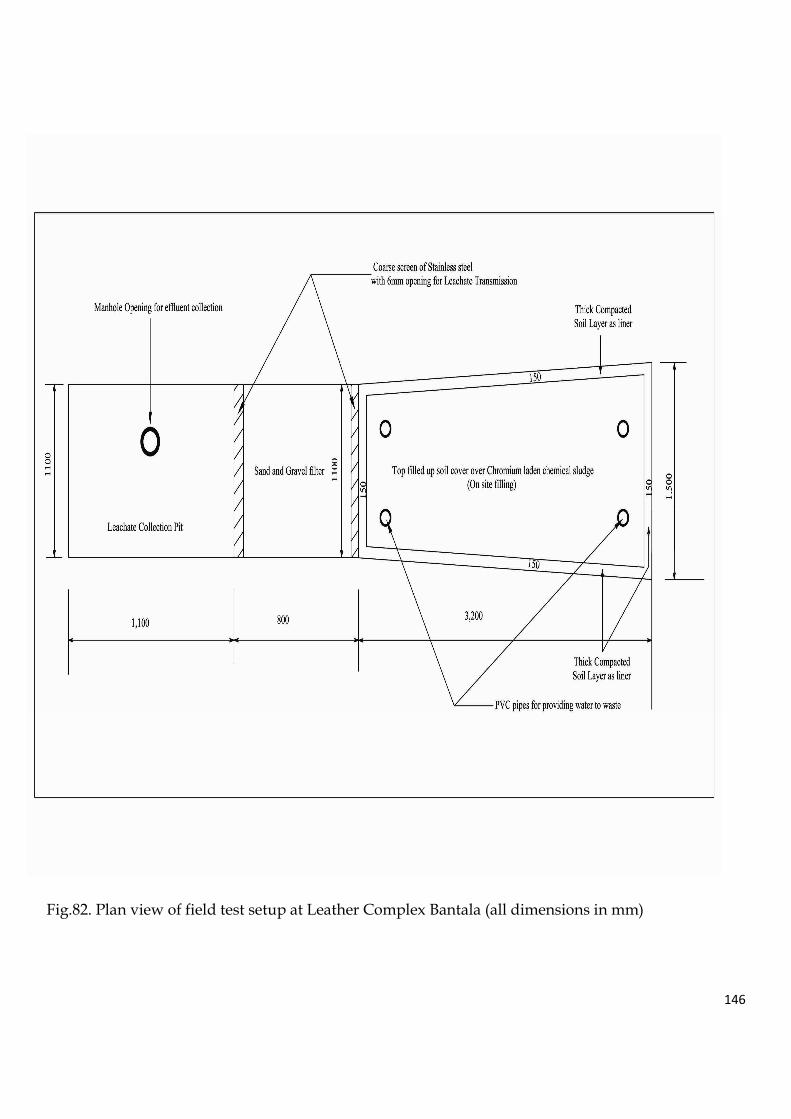
146
Fig.82. Plan view of field test setup at Leather Complex Bantala (all dimensions in mm)
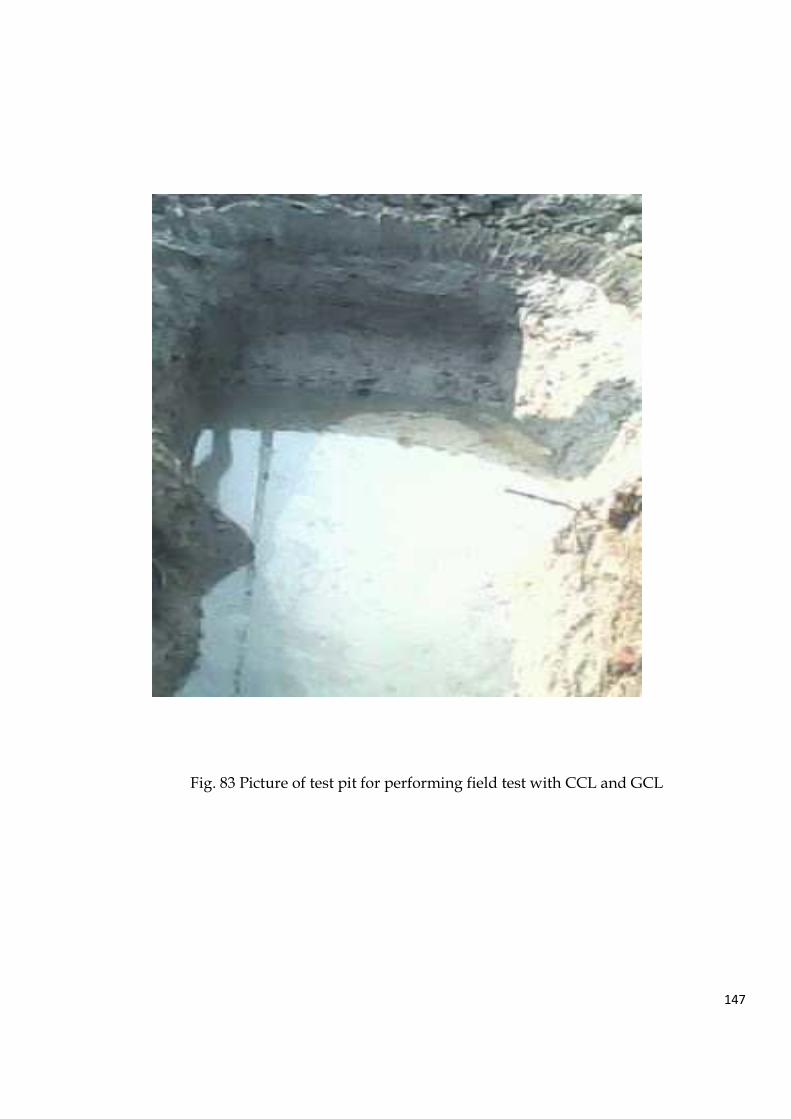
147
Fig. 83 Picture of test pit for performing field test with CCL and GCL
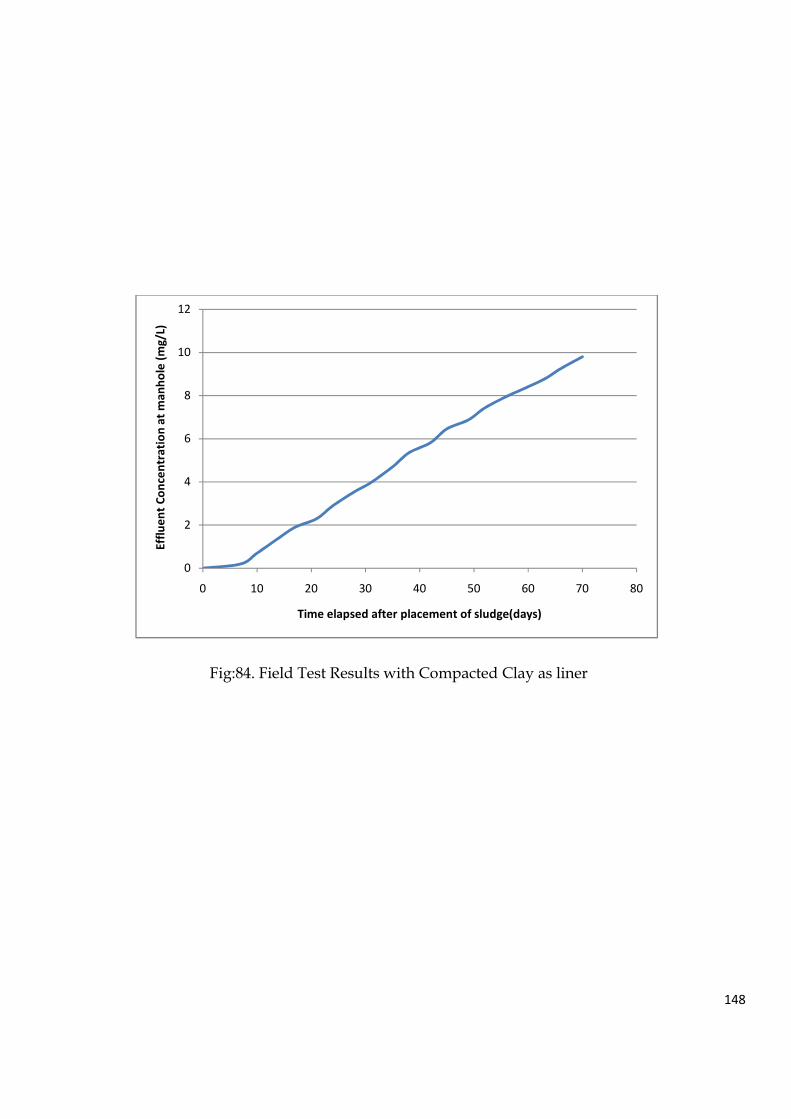
148
Fig:84. Field Test Results with Compacted Clay as liner
0
2
4
6
8
10
12
0 10 20 30 40 50 60 70 80
Eff
lue
nt
Co
nce
ntr
ati
on
at
ma
nh
ole
(m
g/L
)
Time elapsed after placement of sludge(days)
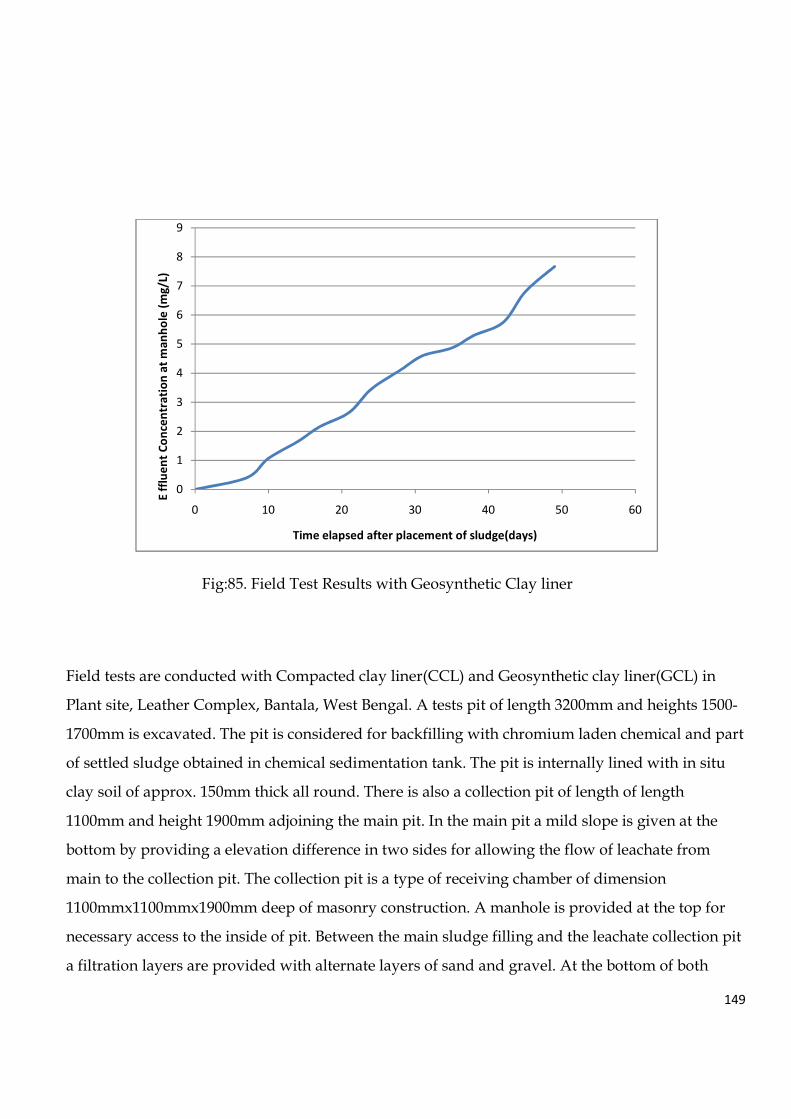
149
Fig:85. Field Test Results with Geosynthetic Clay liner
Field tests are conducted with Compacted clay liner(CCL) and Geosynthetic clay liner(GCL) in
Plant site, Leather Complex, Bantala, West Bengal. A tests pit of length 3200mm and heights 1500-
1700mm is excavated. The pit is considered for backfilling with chromium laden chemical and part
of settled sludge obtained in chemical sedimentation tank. The pit is internally lined with in situ
clay soil of approx. 150mm thick all round. There is also a collection pit of length of length
1100mm and height 1900mm adjoining the main pit. In the main pit a mild slope is given at the
bottom by providing a elevation difference in two sides for allowing the flow of leachate from
main to the collection pit. The collection pit is a type of receiving chamber of dimension
1100mmx1100mmx1900mm deep of masonry construction. A manhole is provided at the top for
necessary access to the inside of pit. Between the main sludge filling and the leachate collection pit
a filtration layers are provided with alternate layers of sand and gravel. At the bottom of both
0
1
2
3
4
5
6
7
8
9
0 10 20 30 40 50 60
E f
flu
en
t C
on
cen
tra
tio
n a
t m
an
ho
le (
mg
/L)
Time elapsed after placement of sludge(days)

150
main and collection pit a PCC layer of 50mm is provided to resist upcoming of subsurface water
and above it liners (either GCL or CCL) are provided. Tannery wastes from Filter Press in Bantala
Leather Complex are dumped inside the main pit and it is watered periodically. The leachate thus
generated passes through the liner system and get stored in the collection tank, from which it is
collected regularly and the chromium concentration present in it is measured in the laboratory.
The sectional view and plan of field setup is shown in Fig 81 and 82 and a photograph is also
exhibited in Fig 83.
The initial value of chromium concentration of the waste used in field test from Filter Press, Bantala
Leather Complex is 25mg/L. The field test results are shown in Fig84 and 85. The effluent
concentration of chromium after 70 days in case of CCL is 9.8mg/L which implies that about nearly
40% is sorbed by CCL in 70 days. The effluent concentration of chromium after 49 days in case of
GCL is 7.67 mg/L which implies that about nearly 30% is sorbed by GCL in 49 days. The tets are
being continued.
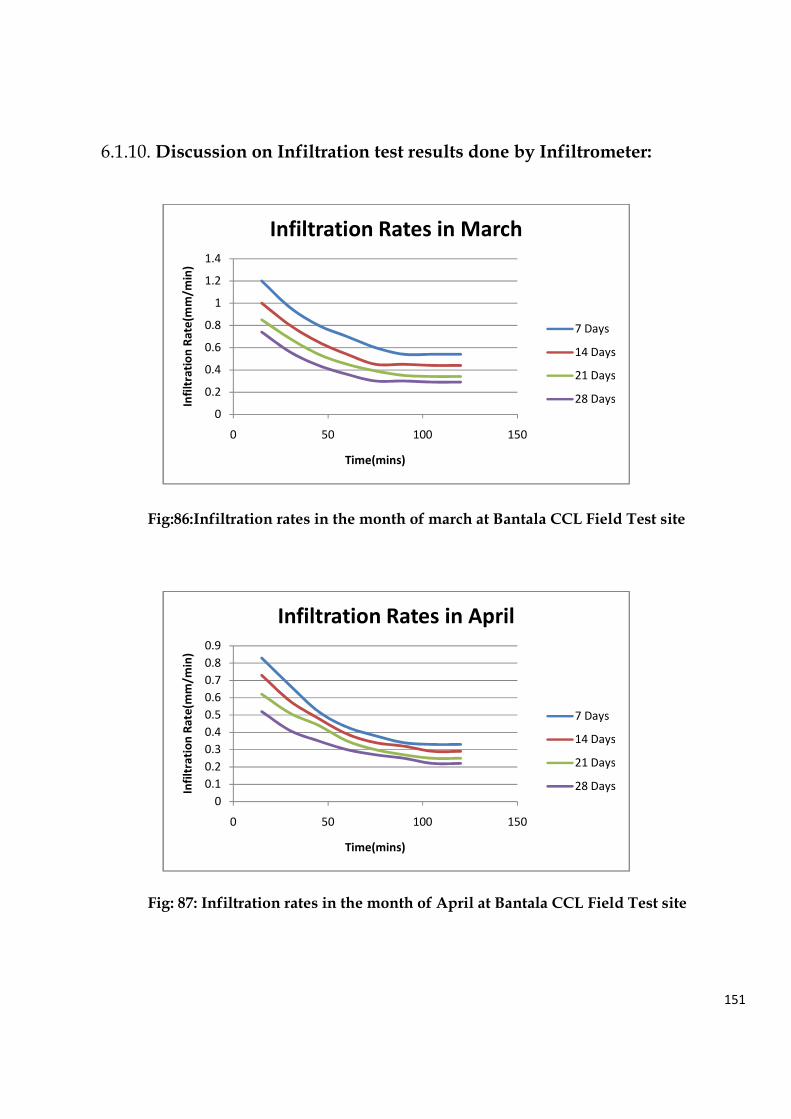
151
6.1.10. Discussion on Infiltration test results done by Infiltrometer:
Fig:86:Infiltration rates in the month of march at Bantala CCL Field Test site
Fig: 87: Infiltration rates in the month of April at Bantala CCL Field Test site
0
0.2
0.4
0.6
0.8
1
1.2
1.4
0 50 100 150
Infi
ltra
tio
n R
ate
(mm
/min
)
Time(mins)
Infiltration Rates in March
7 Days
14 Days
21 Days
28 Days
0
0.1
0.2
0.3
0.4
0.5
0.6
0.7
0.8
0.9
0 50 100 150
Infi
ltra
tio
n R
ate
(mm
/min
)
Time(mins)
Infiltration Rates in April
7 Days
14 Days
21 Days
28 Days
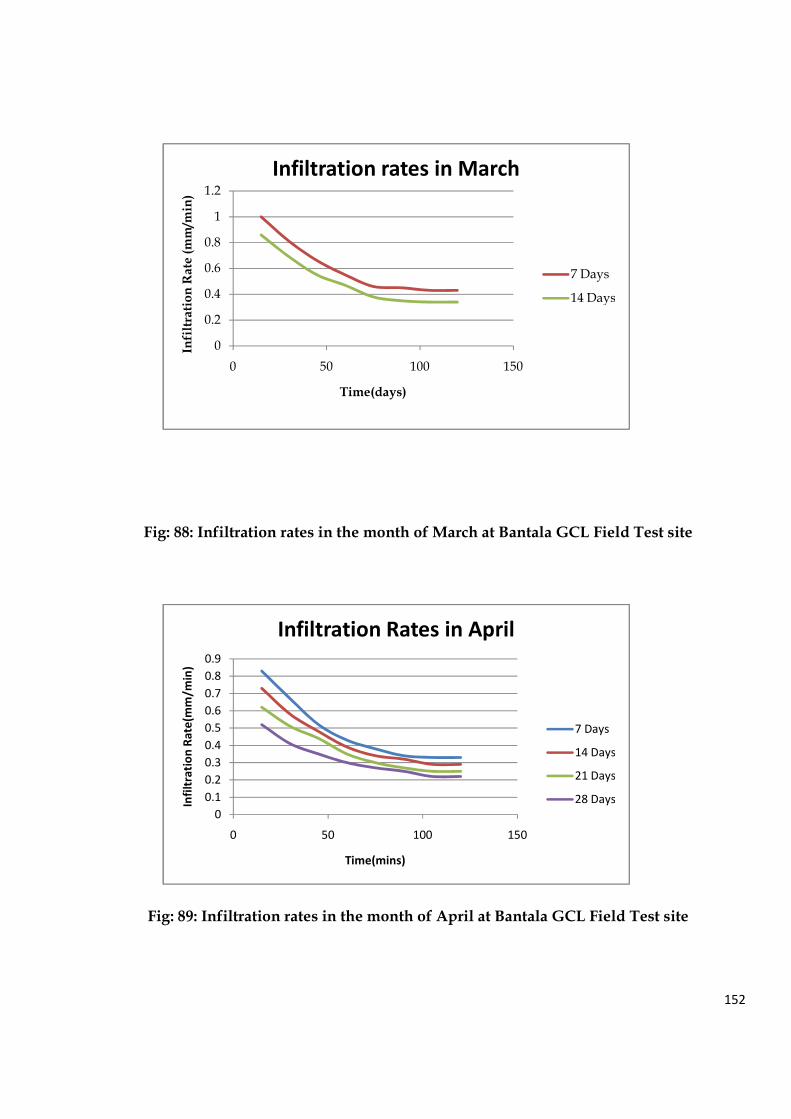
152
Fig: 88: Infiltration rates in the month of March at Bantala GCL Field Test site
Fig: 89: Infiltration rates in the month of April at Bantala GCL Field Test site
0
0.2
0.4
0.6
0.8
1
1.2
0 50 100 150
Infiltra
tion R
ate
(m
m/m
in)
Time(days)
Infiltration rates in March
7 Days
14 Days
0
0.1
0.2
0.3
0.4
0.5
0.6
0.7
0.8
0.9
0 50 100 150
Infi
ltra
tio
n R
ate
(mm
/min
)
Time(mins)
Infiltration Rates in April
7 Days
14 Days
21 Days
28 Days

153
Infiltration tests are performed at a small pit adjoining the field test pit(both CCL and GCL) and at a
depth equal to the field test pit .The infiltration test results are shown for the month of March and
April in Fig:86 through 89.Initially the infiltration rates are higher for both the cases but it has
decreased considerably with time due to the presence of low permeability liner systems nearby.
It is also observed from the above figures decrease of in filtration rate is marginally different. The
comparative rate of change of infiltration rates for both the materials are insignificant. The test is also
being continued. Hence no final comments can be given.
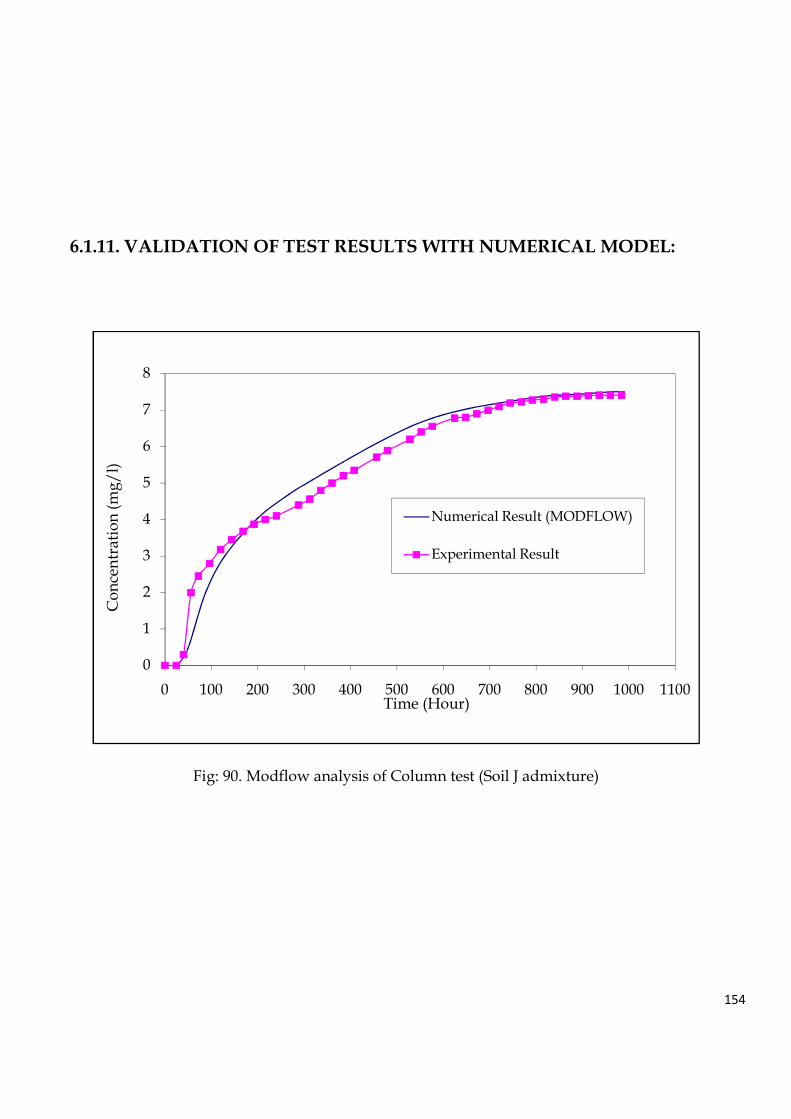
154
6.1.11. VALIDATION OF TEST RESULTS WITH NUMERICAL MODEL:
Fig: 90. Modflow analysis of Column test (Soil J admixture)
0
1
2
3
4
5
6
7
8
0 100 200 300 400 500 600 700 800 900 1000 1100
Co
nce
ntr
atio
n (
mg
/l)
Time (Hour)
Numerical Result (MODFLOW)
Experimental Result
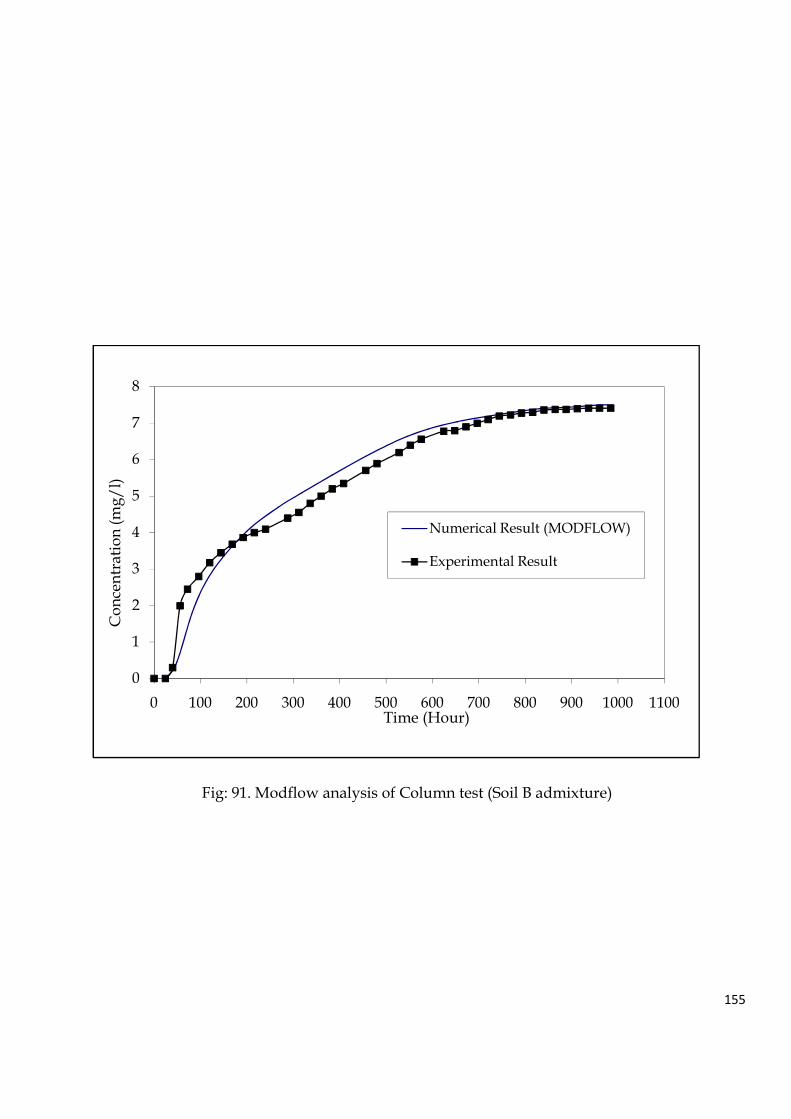
155
Fig: 91. Modflow analysis of Column test (Soil B admixture)
0
1
2
3
4
5
6
7
8
0 100 200 300 400 500 600 700 800 900 1000 1100
Co
nce
ntr
atio
n (
mg
/l)
Time (Hour)
Numerical Result (MODFLOW)
Experimental Result
156
The variation concentration of chromium with time as obtained from vertical column test for Soil-B
and Soil-J(with admixtures) is shown in Fig:90 and 91 and also, in the same figure the theoretical
curve obtained from standard software MODFLOW Code MT3DMS (Chiang 2005) is also fitted.
MODFLOW is a modular three-dimensional finite-difference groundwater model published by
the U. S. Geological Survey. The first public version of MODFLOW was released in 1988 and is
referred to as MODFLOW-88. The most recent version of MODFLOW- 2000 attempts to incorporate
the solution of multiple related equations into a single code. To achieve the goal, the code is divided
into entities called processes. Each process deals with a specific equation. MT3DMS is a code related
to MODFLOW. This code is a transport model uses a mixed Eulerian-Lagrangian approach to the
solution of the three-dimensional advective-dispersive-reactive transport equation.
The equation is as follows,
R ∂C/∂t = [∂/∂x{Dx(∂C/∂x)} +∂/∂y{Dy(∂C/∂y)} +∂/∂z{Dz(∂C/∂z)}]
- [∂/∂x(Vsx C) +∂/∂x(Vsy C) + ∂/∂x(Vsz C)] ± λRC.
Where, Dx, Dy, Dz are Dispersion coefficients in x, y, z directions. Vsx, Vsy, Vsz, are Seepage velocities in
x, y, z directions. R = Retardation coefficient. t = time. λ = Rate of decay coefficient for both dissolved
and adsorbed phases. (Freeze and Cherry 1979, Zheng and Bennett 2002). For three dimensional
conditions the solution is given by (Bendient et al. 1994)
C (x,y,z,t) = C0V0/{8(̟t)3/2 (DL DT DZ)1/2} exp [ -{(x – x0 –Vst)2 /4DLt } - {(y – y0)2 /4DTt } - {(z – z0)2
/4DZt }.
Where, V0 = Original Volume of slug injected. C0 = Initial Concentration of contaminant. DL =
Longitudinal hydrodynamic dispersion. DT = Transverse hydrodynamic dispersion. C = Dissolved
contaminant concentration.
The abbreviation MS denotes the Multi-Species structure for accommodating add-on reaction
packages. MT3DMS includes three major classes of transport solution techniques, i.e., the finite
difference method; the particle tracking based Eulerian-Lagrangian methods; and the higher-order
finite-volume TVD method. In addition to the explicit formulation of MT3D, MT3DMS includes an
implicit iterative solver based on generalized conjugate gradient (GCG) methods. If this solver is
157
used, dispersion, sink/source, and reaction terms are solved implicitly without any stability
constraints.
The parameter used in the model are layer type {Confined or unconfined), head (1820 mm),
layer thickness (600 mm), cell status (Fixed head, Free head or Inactive), time(40 day), vertical
hydraulic conductivity (2.71 x 10⁻⁹ m/s), horizontal hydraulic conductivity (2.71 x 10⁻⁸ m/s), effective
porosity (0.25), initial concentration (0 µg/m3), input rate of contaminant (7.5 x 10⁶ µg/m3).The Figure
shows good agreement between the theoretical and experimental curves.
The maximum error and minimum error in between numerical result and observed
experimental results are 0.5mg/l and -0.45 mg/l respectively. Standard deviation of the maximum
and minimum error is 0.014 mg/l. Coefficient of variance of observed value and value obtained from
numerical model are 34% and 37% respectively.
158
Chapter-7
Conclusions: Following conclusions are drawn on the basis of laboratory and
field test studies:
1. In the present work Cr6+ was found to be a traceable toxic metal in chrome tanning chemical
sludge, which is satisfactorily attenuated by the soil sample taken from the two sites
2. The field soil samples have very low permeability and possess a marginally higher value than
the recommended value for a good lining system, which indicates good resistance against
transmission of leachate to ground water.
3. Vertical breakthrough column test shows the almost identical trend that is obtained in
horizontal tank test. In this case also indicates that an equilibrium time was achieved after 900
hours after the feeding in case of without admixture.. It is also noted that the initial
breakthrough was changed from 600- 750 h due to addition of admixtures when C/C0 = 0.95.
The equilibrium concentration reached after 950 h at which approximately 99% of the initial
concentration had been traced in the effluent solution for vertical column test which shows a
marginal improvement of lining quality by the use of amended soil.
4. The mechanism of chromium attenuation was primarily due to the adsorption by the soil as
indicated by adsorption isotherm studies. From adsorption isotherm model (Freundlich), it
was found that r2 = 0.98 for both the soil with admixture and r2 = 0.97 for both the soil without
admixture and also low value of ‘n’ (slope of the best fitted line) which also reveals a good
adsorption capacity of these soils.
159
5. Soil permeability values can be reduced substantially (3x10⁻⁷ to 2.8x10⁻⁹cm/s) and sorption
capacity can be enhanced marginally (20%) with the addition of admixtures (rice husk: 17%,
bentonite: 2%)
6. Breakthrough curves from the large scale tank test with Soil-J shows that the effect of the
thickness on the breakthrough capacity is marginal. When the slope below the soil bed is given
the breakthrough is faster than without slope case. These studies also indicate that an
equilibrium time achieved after 900 hours. The initial breakthrough was observed after 800 hrs
in case of GCL and 825 hrs in case of geomembrane when 7.0 mg/L of Cr was found in
the effluent and in these cases the equilibrium time achieved after1000 hours. Hence, it may be said
that GM base3d liner system is more preferred.
7.The Electrical Resistivity Test (ERT) shows that the total dissolved solids(TDS) present in the
soil inside the Bantala Leather Complex is lesser than that present in soil outside the complex which
reveals that the ionic or salt concentration is more in the surrounding soil of waste landfill site.
8. SEM results have shown crumbling of soil granules when spiked with Cr6+ ions. But when
rice husk is added with soil, coalescences of soil particles have been taken place and it has been
reinforced the soil structure to prevent further disintegration. Hence soil particles has not
loosen when they adsorb Cr6+due to addition of rice husk and adsorption of Cr6+ for this
amendment enhanced.
9. Both the CCL and GCL liners have satisfactory field performance as shown by the field test
results which showed that nearly 40% of effluent is sorbed by CCL in 70 days and that for
GCL is 30% in 49 days, though the tests are continued.

160
Chapter-8: Scope of Future Work
1) Performing more field test with geomembranes for longer duraqtion.
2) Performing field test with clay liner and admixtures for longer duration.
3) Performing tank test with Soil-B and Soil-J with admixtures and variation of concentration of
waste composition.
4)Evaluation of optimum liner system along with appropriate design of lining system for landfill
of toxic waste.
161
REFERENCES:
• Al-hamdan, A. Z. and Reddy, K. R., (2006) “Adsorption of heavy metals in glacial till soil.”
Geotechnical and Geological Engineering, Springer, 24, 1679-1693.
• Apte, A. D., Verma, S., Tare, V. and Bose, P. (2005) “Oxidation of Cr (III) in tannery sludge to
Cr (VI): Field observations and theoretical assessment.” Journal of Hazardous Materials, Elsevier
B.V., 215-222.
• Arrykul et.al.(2009) “Potential use of lateritic & marine clay soils as landfill liners for retention
of heavy metals” .” Journal of Hazardous Materials, Elsevier B.V., 444-451
• Bandhyopadhaya, K., Misra, A. K. and Som, N. (2003) “Use of clay-bed liner for retention of
chromium from aqueous media: a laboratory study.” Journal of the Institution of Engineers
(India), 85, 41-45.
• Banks, M. K., Schwab, A. P. and Henderson, C. (2005) “Leaching and reduction of chromium
in soil as affected by soil organic content and plants.” Chemosphere 62 (2006), 255-264.
• Benson, C., Zhai, H. and Wang, X. (1994) “Estimating Hydraulic Conductivity of Compacted
Clay Liners.” Journal of Geotechnical Engineering, ASCE, 120, 366-387.
• Benson, C., Daniel, D. E. and Boutwell, G. P. (1999) “Lessons learned from compacted clay
liner.” Journal of Geotechnical Engineering, ASCE, 116(11), 1641-1660.
• Blowes, D. W., Ptacek, C. J. and Jambor, J. L. (1997) “In-situ remediation of Cr (VI)-
contaminated groundwater using permeable reactive walls: Laboratory studies.” Environ. Sci.
Technol. 31(12),3348-3357.
• Boltz, Benson, and Boutwell (1998) “Estimating optimum water content and maximum dry
unit weight for compacted clays.” Journal of Geotechnical and Geoenvironmental Engineering,
ASCE, 124(9), 907-912.
162
• Bayrak,Yesiloglu,Gecgel(2006), “ Study on adsorption behavior of Cr6+on activated hazelnut
shell and activated bentonite.” Journal of Hazardous Materials, Elsevier B.V., 312-320.
• Carrier, M. and Soga, K. (1999) “A four terminal measurement system for measuring the
dielectric properties of clay at low frequencies.” Elsevier Science B.V., Engineering Geology,53,
115-123.
• Chakir (2001) “Study on the removal of Cr3+ from aqueous solutions using bentonite and
activated perlite” . .” Journal of Hazardous Materials, Elsevier 112-120.
• Chen, J., Anandarajah, A. and Inyang, H. (2000) “Pore fluid properties and compressibility of
kaolinite.” Journal of Geotechnical and Geoenvironmental Engineering, ASCE, 126(4), 798-807.
• Chen, J. M., Hao, O. J., (1996) “Environmental factors and modeling in microbial chromium
(VI) reduction.” Water Environ. Res. 68, 1156-1164.
• Chiang W. H. (2005) “3D-Ground water modeling with PMWIN.” Springer.
• Dermatos and Meng (2003) “Use of fly ash waste materials along with quick lime to
immobilize trivalent and hexavalent chromium present in artificially contaminated clayey
soils.” .” Journal of Hazardous Materials, Elsevier 92-100
• Didier, Bouzza, and Cazaux, (2000) “Gas Permeability of Geosynthetic clay liners.” Journal of
Geotextrile and Geomembrane (19) 2000.
• Draper, N. et. al (1981) “Applied regression analysis” Willey, New York.
• Drury, D., (1997) “Hydraulic considerations for choice of landfill liner.” Proceedings of
conference organized by British Geotechnical Society and Cardiff School of Engineering, University of
Wales, Cardiff 16-18th September, 312-318.
• Gordon, M. E., Huebner, P. M., and Kmet, P., (1984) “An evaluation of the performance of four
clay lined landfills in Wisconsin.” Proc., Seventh Annual Madison Waste Conference., Univ. of
Wisconsin, Madison, Wis., 399-460.
• Hanson, A. T., Dwyer, B. D., samani, Z. A., York, D. (1993) “Remediation of chromium
containing soils by heap leaching: a column study.” J. Environ. Eng. 119, 824-841.
• James, B. R., (1994) “Hexavalent chromium solubility and reduction in alkaline soils enriched
with chromate ore processing residue.” J. Environ. Qual. 23, 227-233.
• Jamieson,H, Rowe.K.R,and Lange(2005), “Attenuation of heavy metals by Geosynthetic clay
liners.” Geosynthetic Research and Development, ASCE, 132-140.
163
• Jardine et al (1999) “Fate and transport of hexavalent chromium in undisturbed heterogeneous
soil.” Environ. Sci. Technol. 33, 2939-2944.
• Jayabalakrishnan, R. M. and Mahimaraja, S. (2007) “Adsorption of hexavalent chromium onto
raw vermiculite grades as a function of solution concentration.” Journal of Applied Sciences
Research, 3(11): 1262-1266.
• Kalkan Ekrem. (2006) “Utilization of red mud as a stabilization material for the preparation of
clay liners.” Elsevier Science, Engineering Geology, 87, 220-229.
• Katsumi,T(2010) “Geosynthetic clay liners for waster containment facilities.” CRC Press, New
York, 55-83.
• Kaya, A. and Fang, H. Y. (1997) “Identification of contaminated soils by dielectric constnt and
electrical conductivity.” Journal of Environmental Engineering, ASCE, 123(2), 169-177.
• Khan, S. A., Rehman, R. and Khan, M. A. (1995) “Adsorption of chromium (III), chromium (VI)
and silver (I) on bentonite.” Waste Management, 15(4), 271-282.
• Kim, J. Y., Edil, T. B. and Park, J. K. (1997) “Effective porosity and seepage velocity in column
tests on compacted clay.” Journal of Geotechnical and Geoenvironmental Engineering, ASCE,
123(12), 1135-1141.
• Kmet, P., Quinn, K. J., Slavic, C., (1981) “Analysis and design parameters affecting collection
efficiency of cley lined landfills.” From 4th Annual Madison Conference of Applied Research and
Practice on municipal and industrial waste.
• Kozuh, N., Stuper, J. and Gorenc, B. (2000) “Reduction and oxidation processes of chromium
in soils.” Environ. Sci. Technol. 34, 112-119.
• Mesri,G and Olson,R(1970) “Mechanisms controlling the permeability of clays.” Clay and Clay
Minerals, Vol-19 ,151-158.
• Milacic, R., Stuper, J., (1995) “Fractionation and oxidation of chromium in tannery waste and
sewage sludge amended soils.” Environ. Sci. Technol. 29, 506-514.
• Onikata, Kondo; M, Hayashi N and Yamanka,S(1999) “Complex formation of cation
exchanged montmorrilonites with propylene carbonate; osmotic swelling in aqueous
electrolyte solutions.” Clays and Clay Minerals, Vol-47, No.5 ,672-677.
• Petrov J.R.,Rowe (1997) “ Selected factors influencing GCL hydraulic conductivity.” Journal of
Geotechnical and Geoenvironmental Engineering 683-695.
164
• Rao,V.R, Raju .S.V.G.(1990) “Engineering with Geosynthetics” Tata McGraw-Hill Publising
Company Limited.
• Rowe,R.K(2005) “Long term performance of contaminant barrier systems.” Geotechnic 55,
No.9,631-678.
• Tzou, Loppert and Wang(2003) “Catalysed chromium(VI) reduction by organic compounds
and soil minerals” Journal of Environmental Quality. 32:2076-2084 (2003).
• Yesiller, N., Miller, C. J., Inci, G. and Yaldo, K. (2000) “Desiccation and cracking behavior of
three compacted landfill liner soils.” Engineering Geology, Elsevier Science, 57,105-121.
• Zachara, J. M., Ainsworth, C. C., Cowan, C. E., Resch C. T., (1989) “ adsorption of chromate by
subsurface soil horizons.” Soil Sci. Soc. Am. J. 53, 418-428.
• Zornberg Adam, Bouzza (2002) “Geosynthetics in waste containment facilities: Recent
advances” 7th. ICG- Delmas , 495-507.
Related Documents