Massively parallel polymerase cloning and genome sequencing of single cells using nanoliter microwells Jeff Gole 1 , Athurva Gore 1 , Andrew Richards 1 , Yu-Jui Chiu 2 , Ho-Lim Fung 1 , Diane Bushman 3 , Hsin-I Chiang 1,5 , Jerold Chun 3 , Yu-Hwa Lo 4 , and Kun Zhang 1 Kun Zhang: [email protected] 1 Department of Bioengineering, Institute for Genomic Medicine and Institute of Engineering in Medicine, University of California at San Diego, 9500 Gilman Drive, La Jolla, CA, 92093, USA 2 Materials Science and Engineering Program, University of California at San Diego, 9500 Gilman Drive, La Jolla, CA, 92093, USA 3 Dorris Neuroscience Center, Molecular and Cellular Neuroscience Department, The Scripps Research Institute, La Jolla, California 92037 4 Department of Electrical and Computer Engineering, University of California at San Diego, 9500 Gilman Drive, La Jolla, CA, 92093, USA Abstract Genome sequencing of single cells has a variety of applications, including characterizing difficult- to-culture microorganisms and identifying somatic mutations in single cells from mammalian tissues. A major hurdle in this process is the bias in amplifying the genetic material from a single cell, a procedure known as polymerase cloning. Here we describe the microwell displacement amplification system (MIDAS), a massively parallel polymerase cloning method in which single cells are randomly distributed into hundreds to thousands of nanoliter wells and simultaneously amplified for shotgun sequencing. MIDAS reduces amplification bias because polymerase cloning occurs in physically separated nanoliter-scale reactors, facilitating the de novo assembly of near- complete microbial genomes from single E. coli cells. In addition, MIDAS allowed us to detect single-copy number changes in primary human adult neurons at 1–2 Mb resolution. MIDAS will further the characterization of genomic diversity in many heterogeneous cell populations. The genetic material in a single cell can be amplified in vitro by DNA polymerase into many clonal copies, which can then be characterized by shotgun sequencing. Single-cell genome sequencing has been successfully demonstrated on microbial and mammalian cells 1–6 , and applied to the characterization of the diversity of microbial genomes in the ocean 7 , somatic mutations in cancers 8, 9 and meiotic recombination and mutation in sperm 3, 10 . The most commonly used method for amplifying DNA from single cells is multiple displacement amplification (MDA) 2 . Currently, the major technical challenge in using MDA is the highly uneven amplification of the one or two copies of each chromosome in a single cell. This high amplification bias leads to difficulties in assembling microbial genomes de novo and inaccurate identification of copy number variants (CNV) or heterozygous single nucleotide changes in single mammalian cells. Recent developments of bias-tolerant algorithms 11, 12 5 Present address: Department of Animal Science, National Chung Hsing University, Taichung, Taiwan AUTHOR CONTRIBUTIONS JG and KZ conceived and designed the experiments. JG, AR, and HIC performed the experiments. JG and YJC fabricated the microwell arrays. HLF performed sequencing. DB provided neuronal nuclei. JG, AG, and KZ analyzed data and wrote the manuscript with inputs from YHL and JC. NIH Public Access Author Manuscript Nat Biotechnol. Author manuscript; available in PMC 2014 June 01. Published in final edited form as: Nat Biotechnol. 2013 December ; 31(12): . doi:10.1038/nbt.2720. NIH-PA Author Manuscript NIH-PA Author Manuscript NIH-PA Author Manuscript

Welcome message from author
This document is posted to help you gain knowledge. Please leave a comment to let me know what you think about it! Share it to your friends and learn new things together.
Transcript
Massively parallel polymerase cloning and genome sequencingof single cells using nanoliter microwells
Jeff Gole1, Athurva Gore1, Andrew Richards1, Yu-Jui Chiu2, Ho-Lim Fung1, DianeBushman3, Hsin-I Chiang1,5, Jerold Chun3, Yu-Hwa Lo4, and Kun Zhang1
Kun Zhang: [email protected] of Bioengineering, Institute for Genomic Medicine and Institute of Engineering inMedicine, University of California at San Diego, 9500 Gilman Drive, La Jolla, CA, 92093, USA2Materials Science and Engineering Program, University of California at San Diego, 9500 GilmanDrive, La Jolla, CA, 92093, USA3Dorris Neuroscience Center, Molecular and Cellular Neuroscience Department, The ScrippsResearch Institute, La Jolla, California 920374Department of Electrical and Computer Engineering, University of California at San Diego, 9500Gilman Drive, La Jolla, CA, 92093, USA
AbstractGenome sequencing of single cells has a variety of applications, including characterizing difficult-to-culture microorganisms and identifying somatic mutations in single cells from mammaliantissues. A major hurdle in this process is the bias in amplifying the genetic material from a singlecell, a procedure known as polymerase cloning. Here we describe the microwell displacementamplification system (MIDAS), a massively parallel polymerase cloning method in which singlecells are randomly distributed into hundreds to thousands of nanoliter wells and simultaneouslyamplified for shotgun sequencing. MIDAS reduces amplification bias because polymerase cloningoccurs in physically separated nanoliter-scale reactors, facilitating the de novo assembly of near-complete microbial genomes from single E. coli cells. In addition, MIDAS allowed us to detectsingle-copy number changes in primary human adult neurons at 1–2 Mb resolution. MIDAS willfurther the characterization of genomic diversity in many heterogeneous cell populations.
The genetic material in a single cell can be amplified in vitro by DNA polymerase into manyclonal copies, which can then be characterized by shotgun sequencing. Single-cell genomesequencing has been successfully demonstrated on microbial and mammalian cells1–6, andapplied to the characterization of the diversity of microbial genomes in the ocean7, somaticmutations in cancers8, 9 and meiotic recombination and mutation in sperm3, 10. The mostcommonly used method for amplifying DNA from single cells is multiple displacementamplification (MDA)2. Currently, the major technical challenge in using MDA is the highlyuneven amplification of the one or two copies of each chromosome in a single cell. Thishigh amplification bias leads to difficulties in assembling microbial genomes de novo andinaccurate identification of copy number variants (CNV) or heterozygous single nucleotidechanges in single mammalian cells. Recent developments of bias-tolerant algorithms11, 12
5Present address: Department of Animal Science, National Chung Hsing University, Taichung, Taiwan
AUTHOR CONTRIBUTIONSJG and KZ conceived and designed the experiments. JG, AR, and HIC performed the experiments. JG and YJC fabricated themicrowell arrays. HLF performed sequencing. DB provided neuronal nuclei. JG, AG, and KZ analyzed data and wrote the manuscriptwith inputs from YHL and JC.
NIH Public AccessAuthor ManuscriptNat Biotechnol. Author manuscript; available in PMC 2014 June 01.
Published in final edited form as:Nat Biotechnol. 2013 December ; 31(12): . doi:10.1038/nbt.2720.
NIH
-PA Author Manuscript
NIH
-PA Author Manuscript
NIH
-PA Author Manuscript
have greatly mitigated the effects of uneven read depth on de novo genome assembly andCNV calling, yet an unusually high sequencing depth is still required, making this approachimpractical for organisms with large genomes.
Several strategies have been developed to reduce amplification bias, including reducing thereaction volume13, 14 and supplementing amplification reactions with single-strand bindingproteins or trehalose5, 15. Post-amplification normalization by digesting highly abundantsequences with a duplex-specific nuclease has also been used to markedly reduce bias2.Despite these efforts, amplification bias still remains the primary technical challenge insingle-cell genome sequencing. A relatively large amount of sequencing is still necessary toobtain a high-quality genome sequence even with these improvements. Using cells thatcontain multiple copies of the genome or multiple clonal cells has been the only viablesolution to achieve near complete genome coverage with MDA16, 17. Other methods such asMALBAC utilize quasi-linear amplification to reduce exponential amplification bias18;however, the specific polymerase required can introduce a higher level of amplificationerror, complicating further analysis.
We reasoned that whole-genome amplification is always prone to bias because repeatedpriming in similar locations becomes exponentially more favorable as the reactioncontinues. Thus, we hypothesized that bias could be reduced by limiting the reaction so thatjust enough amplification occurs to allow sequencing, thereby limiting the potentialiterations of repeated priming. In addition, we supposed that reducing the reaction volumeby ~1,000 fold to nanoliter levels, which increases the effective concentration of thetemplate genome, might both reduce contamination and improve amplification uniformity,as the higher concentration of template would lead to more favorable primer annealingkinetics in the initial stages of MDA13, 14.
To test these hypotheses, we developed the microwell displacement amplification system(MIDAS), an approach that allows for highly parallel polymerase cloning of single cells inthousands of nanoliter reactors. Each reactor spatially confines a reaction within a 12 nLvolume, to our knowledge the smallest volume that has been implemented to date. Coupledwith a low-input library construction method, we achieved highly uniform coverage in thegenomes of both microbial and mammalian cells. We demonstrated substantial improvementboth in de novo genome assembly from single microbial cells and in the ability to detectsmall somatic copy number variants in individual human adult neurons with minimalsequencing effort.
RESULTSMIDAS implements massively parallel polymerase cloning
We designed and fabricated microwell arrays of a size comparable to standard microscopeslides. The format of the arrays, including well size, pattern and spacing, was optimized toachieve efficient cell loading, optimal amplification yield and convenient DNA extraction.Each slide consisted of 16 arrays, each containing 255 microwells of 400 μm in diameter,allowing for parallel amplification of 16 separate heterogeneous cell populations (Fig. 1a).All liquid handling procedures (cell seeding, lysis, DNA denaturation, neutralization andaddition of amplification master mix) required one pump of a pipette per step per array,minimizing the labor required for hundreds of amplification reactions. This system requiresless of each amplification and library construction reagent than conventional methods, aseach microwell spatially confines the reaction to 12 nL in volume.
We tested multiple cell-loading densities to ensure that each well would contain only onesingle cell, and initially loaded the microwells at densities of roughly 1 cell per well and 1
Gole et al. Page 2
Nat Biotechnol. Author manuscript; available in PMC 2014 June 01.
NIH
-PA Author Manuscript
NIH
-PA Author Manuscript
NIH
-PA Author Manuscript
cell per 10 wells. By the Poisson distribution, in the 1 cell per well case, 63% should have atleast one cell, but 26% could have more than one. In the 1 cell per 10 well case, no morethan 0.5% of the wells should contain more than 1 cell. We confirmed that the cells wereindeed being seeded at the expected distribution using fluorescent microscopy after stainingcells with SYBR Green I (Supplementary Fig. 1). We thus decided to load cells at a densityof 1 cell per 10 wells, ensuring that 99.5% of generated amplicons would arise from a singlecell. The remaining empty wells served as internal negative controls, allowing easydetection and elimination of contaminated samples. We further confirmed proper microbialand mammalian cell seeding in microwells at the 1 cell per 10 well level by scanningelectron microscopy (Fig. 1b, Supplementary Fig. 2).
After seeding of cell populations into each microwell array, we performed limited multipledisplacement amplification on the seeded single cells in the partitioned microwells, eachwith a physically separated (save for a thin aqueous layer atop the arrays) volume of ~12 nL,in a temperature and humidity controlled chamber (Fig. 1c, Supplementary Fig. 1). We usedSYBR Green I to visualize the amplicons growing using an epifluorescent microscope(Supplementary Fig. 3). A random distribution of amplicons across the arrays was observedwith ~10% of the wells containing amplicons, further confirming the parallel and localizedamplification within individual microwells as well as the stochastic seeding of single cells19.After amplification in the microwells, we used a micromanipulation system to extractamplicons from individual wells for sequencing (Fig. 1c). We estimated that the masses ofthe extracted amplicons ranged from 500 picograms to 3 nanograms.
When performing a single-cell amplification experiment, there are two potential sources ofcontamination that could result in an inaccurate characterization of the genome of thesample of interest. These are exogenous contamination, in which samples are exposed tocell-free DNA from environmental sources or reagents, and cross-well contamination, inwhich DNA from one microwell diffuses into other microwells. We ensured that neitherform of contamination was occurring. To detect arrays that contained exogenouscontamination, we checked for a uniform increase of fluorescent signal across allmicrowells. Any samples that showed this high fluorescence across all wells were removed;thus, any samples exposed to cell-free DNA were simply not analyzed. To ensure that cross-well contamination was not occurring, we performed fluorescent monitoring at 30-minuteintervals during the amplification procedure. Only single wells with single ampliconsoriginating from a single point were extracted for analysis, preventing any cross-wellcontamination or selection of any wells containing more than one cell (Supplementary Fig.4). If even a miniscule amount of DNA was diffusing out of a microwell, an increasedfluorescence would be observed in adjacent wells owing to amplification occurring in everywell19; this diffusion was not observed in any cases. We further confirmed that cross-wellcontamination was not occurring by loading a mixture of human neuronal nuclei with twoseparate genomic backgrounds and confirming that all extracted cells corresponded only toone background (Supplementary Table 1).
To construct Illumina sequencing libraries from the extracted nanogram-scale DNAamplicons, we used a modified in-tube method based on the Nextera Tn5 transposase.Previous studies have shown that Nextera transposase-based libraries can be prepared usingas little as 10 picograms of genomic DNA20. However, the standard Nextera protocol wasunable to generate high-complexity libraries from MDA amplicons, resulting in poorgenomic coverage (data not shown). To address this issue, we used random hexamers andDNA Polymerase I to first convert the hyperbranched amplicons into unbranched double-stranded DNA molecules, which allowed effective library construction using in vitrotransposition (Fig. 1d). In addition, we used a small reaction volume to further increase theefficiency of library construction20.
Gole et al. Page 3
Nat Biotechnol. Author manuscript; available in PMC 2014 June 01.
NIH
-PA Author Manuscript
NIH
-PA Author Manuscript
NIH
-PA Author Manuscript
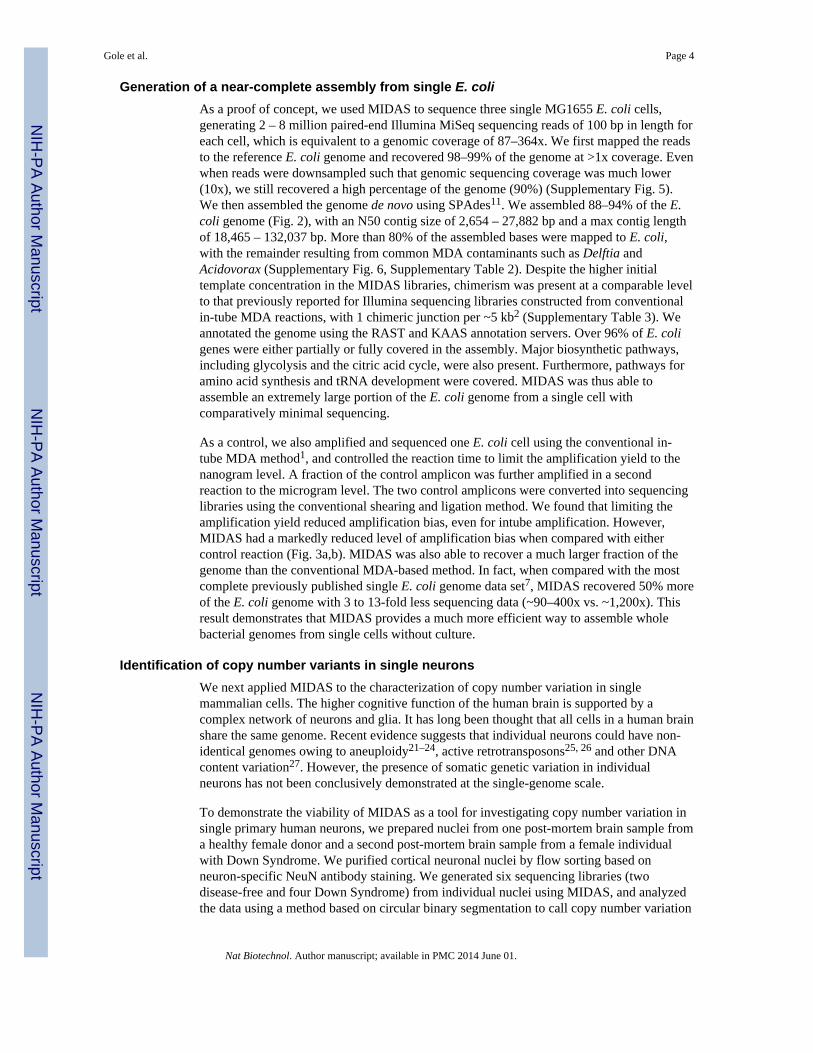
Generation of a near-complete assembly from single E. coliAs a proof of concept, we used MIDAS to sequence three single MG1655 E. coli cells,generating 2 – 8 million paired-end Illumina MiSeq sequencing reads of 100 bp in length foreach cell, which is equivalent to a genomic coverage of 87–364x. We first mapped the readsto the reference E. coli genome and recovered 98–99% of the genome at >1x coverage. Evenwhen reads were downsampled such that genomic sequencing coverage was much lower(10x), we still recovered a high percentage of the genome (90%) (Supplementary Fig. 5).We then assembled the genome de novo using SPAdes11. We assembled 88–94% of the E.coli genome (Fig. 2), with an N50 contig size of 2,654 – 27,882 bp and a max contig lengthof 18,465 – 132,037 bp. More than 80% of the assembled bases were mapped to E. coli,with the remainder resulting from common MDA contaminants such as Delftia andAcidovorax (Supplementary Fig. 6, Supplementary Table 2). Despite the higher initialtemplate concentration in the MIDAS libraries, chimerism was present at a comparable levelto that previously reported for Illumina sequencing libraries constructed from conventionalin-tube MDA reactions, with 1 chimeric junction per ~5 kb2 (Supplementary Table 3). Weannotated the genome using the RAST and KAAS annotation servers. Over 96% of E. coligenes were either partially or fully covered in the assembly. Major biosynthetic pathways,including glycolysis and the citric acid cycle, were also present. Furthermore, pathways foramino acid synthesis and tRNA development were covered. MIDAS was thus able toassemble an extremely large portion of the E. coli genome from a single cell withcomparatively minimal sequencing.
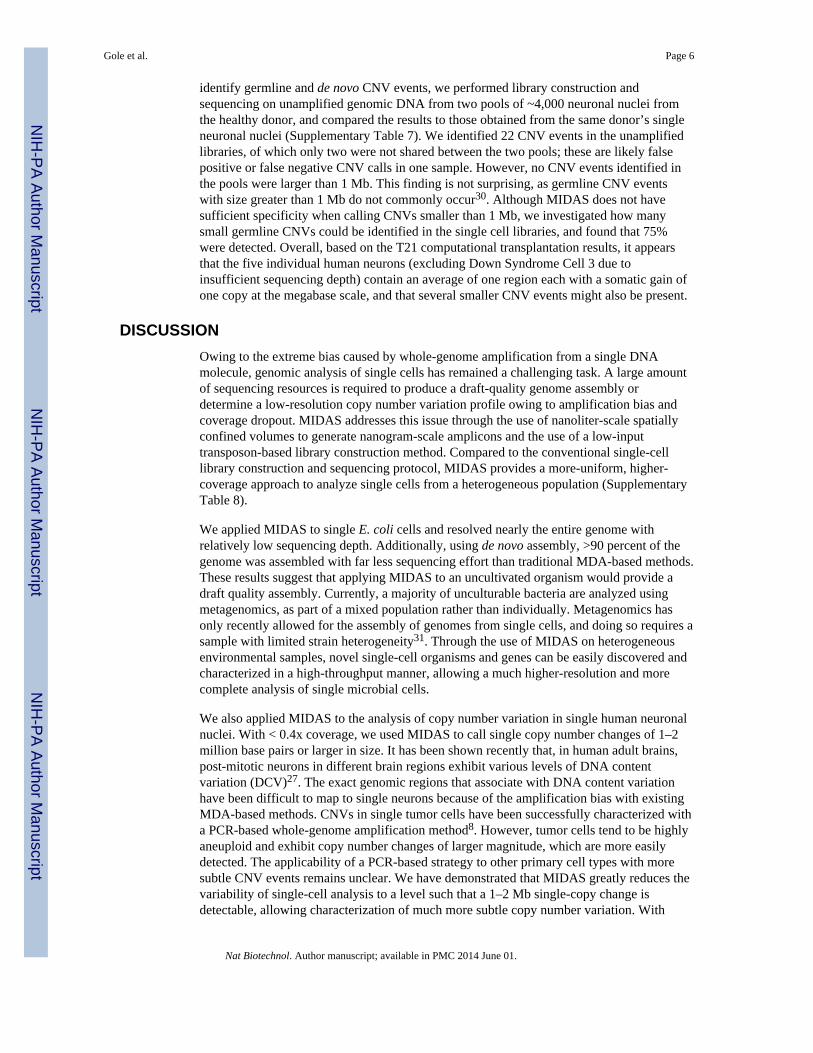
As a control, we also amplified and sequenced one E. coli cell using the conventional in-tube MDA method1, and controlled the reaction time to limit the amplification yield to thenanogram level. A fraction of the control amplicon was further amplified in a secondreaction to the microgram level. The two control amplicons were converted into sequencinglibraries using the conventional shearing and ligation method. We found that limiting theamplification yield reduced amplification bias, even for intube amplification. However,MIDAS had a markedly reduced level of amplification bias when compared with eithercontrol reaction (Fig. 3a,b). MIDAS was also able to recover a much larger fraction of thegenome than the conventional MDA-based method. In fact, when compared with the mostcomplete previously published single E. coli genome data set7, MIDAS recovered 50% moreof the E. coli genome with 3 to 13-fold less sequencing data (~90–400x vs. ~1,200x). Thisresult demonstrates that MIDAS provides a much more efficient way to assemble wholebacterial genomes from single cells without culture.
Identification of copy number variants in single neuronsWe next applied MIDAS to the characterization of copy number variation in singlemammalian cells. The higher cognitive function of the human brain is supported by acomplex network of neurons and glia. It has long been thought that all cells in a human brainshare the same genome. Recent evidence suggests that individual neurons could have non-identical genomes owing to aneuploidy21–24, active retrotransposons25, 26 and other DNAcontent variation27. However, the presence of somatic genetic variation in individualneurons has not been conclusively demonstrated at the single-genome scale.
To demonstrate the viability of MIDAS as a tool for investigating copy number variation insingle primary human neurons, we prepared nuclei from one post-mortem brain sample froma healthy female donor and a second post-mortem brain sample from a female individualwith Down Syndrome. We purified cortical neuronal nuclei by flow sorting based onneuron-specific NeuN antibody staining. We generated six sequencing libraries (twodisease-free and four Down Syndrome) from individual nuclei using MIDAS, and analyzedthe data using a method based on circular binary segmentation to call copy number variation
Gole et al. Page 4
Nat Biotechnol. Author manuscript; available in PMC 2014 June 01.
NIH
-PA Author Manuscript
NIH
-PA Author Manuscript
NIH
-PA Author Manuscript
(CNV)28 (Supplementary Table 4). Raw sequencing reads were divided into 49,891genomic bins ~60 kb in size, each of which had been previously determined to contain asimilar number of sequencing reads in a fully diploid cell28. Although clonal read countsarising from PCR duplication appeared relatively high, this is a consequence of the low-input Nextera library construction protocol; because the amplification is limited, the amountof initial molecules is smaller, leading to more duplicates. However, the reduction in biascompensated for the apparent decrease in usable read count. We similarly observed amarked reduction of amplification bias in the MIDAS libraries when compared to theconventional in-tube MDA-based method (Fig. 3c,d). However, both MIDAS and intubeMDA had higher levels of sequencing bias and variability than data generated fromunamplified genomic DNA from 4,000 mammalian cells, though the bias in MIDAS wasonly slightly higher. Using a larger bin size of ~240kb (which results in a lower-resolutionanalysis) allowed MIDAS to match the level of bias from unamplified genomic DNA(Supplementary Fig. 7).
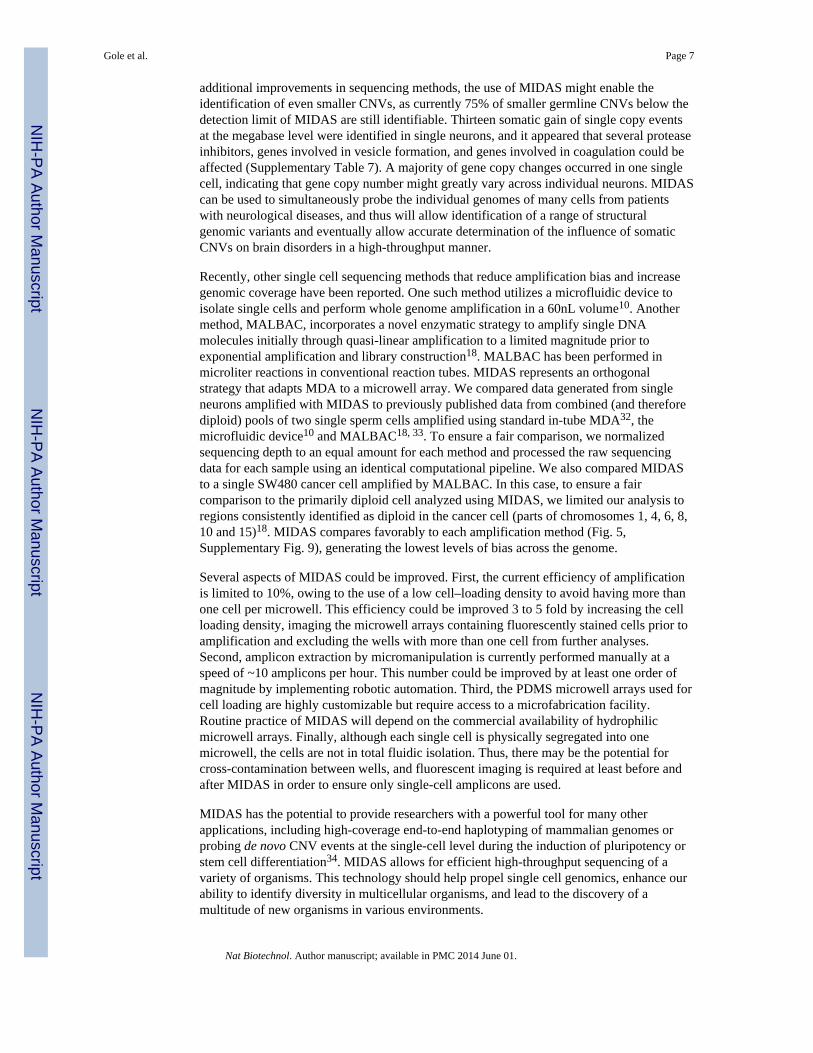
We next sought to characterize the sensitivity of detecting single copy-number changes. Itwas not possible to distinguish true copy number differences from random amplificationbias for the conventional single-cell MDA data, even with aggressive binning into largegenomic regions. However, the uniform genome coverage in the MIDAS libraries allowedclear detection of Trisomy 21 in each of the Down Syndrome nuclei (Fig. 4a, b). Rigorousvalidation of single-cell sequencing methods has been extremely challenging, primarilybecause any single cell might have genomic differences that are not detectable in the bulkcell population. Hence, there is no reference genome that single-cell data can be comparedto. To determine the CNV detection limit of MIDAS, we computationally simulatedsequencing data sets containing reference CNV events 1 or 2 Mb in size. We randomlyselected 1 or 2 Mbps regions of either chromosome 21 (to simulate the gain of a single copy,the smallest possible copy number change) or chromosome 4 (as a negative control), andcomputationally transplanted these regions into 100 other random genomic locations(Supplementary Table 5). This computational approach, similar to a strategy previously usedfor assessing sequencing errors29, yielded data sets containing reference CNVs at knownpositions without affecting the inherent technical noise in the data. We identified 99/100 of 2Mb T21 insertions and 80/100 of 1 Mb T21 insertions in the simulated data set from DownSyndrome Cell 1, indicating that MIDAS is able to call copy number events at themegabase-scale with high sensitivity (Fig. 4c, Supplementary Table 5). As expected,detection levels in the other data sets were similar for libraries with sufficient sequencingdepth (80/100 for Down Syndrome Cell 2, 99/100 for Down Syndrome Cell 4), whilelibraries with insufficient sequencing depth could not be used for accurate small CNVcalling (32/100 for Down Syndrome Cell 3). As expected, the insertion of diploidchromosome 4 regions did not generate any copy number calls. High-fidelity CNV calling(96%) at the 2 Mb level was retained even when 20% additional random technical noise wasapplied to the read count results (Supplementary Fig. 8). When the same simulation wasperformed with data from traditional in-tube MDA libraries, no T21 insertions weredetected, indicating that at this level of sequencing depth, traditional MDA-based methodsare unable to call small CNVs (Fig. 4d).
We next performed CNV calling on each individual neuron using the parameters calibratedby the T21 transplantation simulation. MIDAS called 9–18 copy number events in eachneuron (Supplementary Table 6). Only 8/60 called CNV events were larger than 2 Mb, andonly 13/60 were larger than 1 Mb. It remained unclear whether the remaining eventsrepresented true copy number changes or whether they were false positives owing to thesmall size of most of the calls. It was also unclear which CNV calls represented somaticcopy number variation and which represented germline CNV calls that might have beenmissed in one sample. To address these issues and further probe the ability of MIDAS to
Gole et al. Page 5
Nat Biotechnol. Author manuscript; available in PMC 2014 June 01.
NIH
-PA Author Manuscript
NIH
-PA Author Manuscript
NIH
-PA Author Manuscript
identify germline and de novo CNV events, we performed library construction andsequencing on unamplified genomic DNA from two pools of ~4,000 neuronal nuclei fromthe healthy donor, and compared the results to those obtained from the same donor’s singleneuronal nuclei (Supplementary Table 7). We identified 22 CNV events in the unamplifiedlibraries, of which only two were not shared between the two pools; these are likely falsepositive or false negative CNV calls in one sample. However, no CNV events identified inthe pools were larger than 1 Mb. This finding is not surprising, as germline CNV eventswith size greater than 1 Mb do not commonly occur30. Although MIDAS does not havesufficient specificity when calling CNVs smaller than 1 Mb, we investigated how manysmall germline CNVs could be identified in the single cell libraries, and found that 75%were detected. Overall, based on the T21 computational transplantation results, it appearsthat the five individual human neurons (excluding Down Syndrome Cell 3 due toinsufficient sequencing depth) contain an average of one region each with a somatic gain ofone copy at the megabase scale, and that several smaller CNV events might also be present.
DISCUSSIONOwing to the extreme bias caused by whole-genome amplification from a single DNAmolecule, genomic analysis of single cells has remained a challenging task. A large amountof sequencing resources is required to produce a draft-quality genome assembly ordetermine a low-resolution copy number variation profile owing to amplification bias andcoverage dropout. MIDAS addresses this issue through the use of nanoliter-scale spatiallyconfined volumes to generate nanogram-scale amplicons and the use of a low-inputtransposon-based library construction method. Compared to the conventional single-celllibrary construction and sequencing protocol, MIDAS provides a more-uniform, higher-coverage approach to analyze single cells from a heterogeneous population (SupplementaryTable 8).
We applied MIDAS to single E. coli cells and resolved nearly the entire genome withrelatively low sequencing depth. Additionally, using de novo assembly, >90 percent of thegenome was assembled with far less sequencing effort than traditional MDA-based methods.These results suggest that applying MIDAS to an uncultivated organism would provide adraft quality assembly. Currently, a majority of unculturable bacteria are analyzed usingmetagenomics, as part of a mixed population rather than individually. Metagenomics hasonly recently allowed for the assembly of genomes from single cells, and doing so requires asample with limited strain heterogeneity31. Through the use of MIDAS on heterogeneousenvironmental samples, novel single-cell organisms and genes can be easily discovered andcharacterized in a high-throughput manner, allowing a much higher-resolution and morecomplete analysis of single microbial cells.
We also applied MIDAS to the analysis of copy number variation in single human neuronalnuclei. With < 0.4x coverage, we used MIDAS to call single copy number changes of 1–2million base pairs or larger in size. It has been shown recently that, in human adult brains,post-mitotic neurons in different brain regions exhibit various levels of DNA contentvariation (DCV)27. The exact genomic regions that associate with DNA content variationhave been difficult to map to single neurons because of the amplification bias with existingMDA-based methods. CNVs in single tumor cells have been successfully characterized witha PCR-based whole-genome amplification method8. However, tumor cells tend to be highlyaneuploid and exhibit copy number changes of larger magnitude, which are more easilydetected. The applicability of a PCR-based strategy to other primary cell types with moresubtle CNV events remains unclear. We have demonstrated that MIDAS greatly reduces thevariability of single-cell analysis to a level such that a 1–2 Mb single-copy change isdetectable, allowing characterization of much more subtle copy number variation. With
Gole et al. Page 6
Nat Biotechnol. Author manuscript; available in PMC 2014 June 01.
NIH
-PA Author Manuscript
NIH
-PA Author Manuscript
NIH
-PA Author Manuscript
additional improvements in sequencing methods, the use of MIDAS might enable theidentification of even smaller CNVs, as currently 75% of smaller germline CNVs below thedetection limit of MIDAS are still identifiable. Thirteen somatic gain of single copy eventsat the megabase level were identified in single neurons, and it appeared that several proteaseinhibitors, genes involved in vesicle formation, and genes involved in coagulation could beaffected (Supplementary Table 7). A majority of gene copy changes occurred in one singlecell, indicating that gene copy number might greatly vary across individual neurons. MIDAScan be used to simultaneously probe the individual genomes of many cells from patientswith neurological diseases, and thus will allow identification of a range of structuralgenomic variants and eventually allow accurate determination of the influence of somaticCNVs on brain disorders in a high-throughput manner.
Recently, other single cell sequencing methods that reduce amplification bias and increasegenomic coverage have been reported. One such method utilizes a microfluidic device toisolate single cells and perform whole genome amplification in a 60nL volume10. Anothermethod, MALBAC, incorporates a novel enzymatic strategy to amplify single DNAmolecules initially through quasi-linear amplification to a limited magnitude prior toexponential amplification and library construction18. MALBAC has been performed inmicroliter reactions in conventional reaction tubes. MIDAS represents an orthogonalstrategy that adapts MDA to a microwell array. We compared data generated from singleneurons amplified with MIDAS to previously published data from combined (and thereforediploid) pools of two single sperm cells amplified using standard in-tube MDA32, themicrofluidic device10 and MALBAC18, 33. To ensure a fair comparison, we normalizedsequencing depth to an equal amount for each method and processed the raw sequencingdata for each sample using an identical computational pipeline. We also compared MIDASto a single SW480 cancer cell amplified by MALBAC. In this case, to ensure a faircomparison to the primarily diploid cell analyzed using MIDAS, we limited our analysis toregions consistently identified as diploid in the cancer cell (parts of chromosomes 1, 4, 6, 8,10 and 15)18. MIDAS compares favorably to each amplification method (Fig. 5,Supplementary Fig. 9), generating the lowest levels of bias across the genome.
Several aspects of MIDAS could be improved. First, the current efficiency of amplificationis limited to 10%, owing to the use of a low cell–loading density to avoid having more thanone cell per microwell. This efficiency could be improved 3 to 5 fold by increasing the cellloading density, imaging the microwell arrays containing fluorescently stained cells prior toamplification and excluding the wells with more than one cell from further analyses.Second, amplicon extraction by micromanipulation is currently performed manually at aspeed of ~10 amplicons per hour. This number could be improved by at least one order ofmagnitude by implementing robotic automation. Third, the PDMS microwell arrays used forcell loading are highly customizable but require access to a microfabrication facility.Routine practice of MIDAS will depend on the commercial availability of hydrophilicmicrowell arrays. Finally, although each single cell is physically segregated into onemicrowell, the cells are not in total fluidic isolation. Thus, there may be the potential forcross-contamination between wells, and fluorescent imaging is required at least before andafter MIDAS in order to ensure only single-cell amplicons are used.
MIDAS has the potential to provide researchers with a powerful tool for many otherapplications, including high-coverage end-to-end haplotyping of mammalian genomes orprobing de novo CNV events at the single-cell level during the induction of pluripotency orstem cell differentiation34. MIDAS allows for efficient high-throughput sequencing of avariety of organisms. This technology should help propel single cell genomics, enhance ourability to identify diversity in multicellular organisms, and lead to the discovery of amultitude of new organisms in various environments.
Gole et al. Page 7
Nat Biotechnol. Author manuscript; available in PMC 2014 June 01.
NIH
-PA Author Manuscript
NIH
-PA Author Manuscript
NIH
-PA Author Manuscript
METHODSMicrowell Array Fabrication
Microwell arrays were fabricated from polydimethylsiloxane (PDMS). Each array was 7mm × 7 mm, with 2 rows of 8 arrays per slide and 255 microwells per array. The individualmicrowells were 400 μm in diameter and 100 μm deep (~12 nL volume), and were arrangedin honeycomb patterns in order to minimize space in between the wells. To fabricate thearrays, first, an SU-8 mold was created using soft lithography at the Nano3 facility at UCSan Diego. Next, a 10:1 ratio of polymer to curing agent mixture of PDMS was poured overthe mold. Finally, the PDMS was degassed and cured for 3 hours at 65 °C.
Bacteria and Neuron PreparationE. coli K12 MG1655 was cultured overnight, collected in log-phase, and washed 3x in PBS.After quantification, the solution was diluted to 10 cells/μL. Human neuronal nuclei wereisolated as previously described27, 35 and fixed in ice-cold 70% ethanol. Nuclei were labeledwith a monoclonal mouse antibody against NeuN (1:100 dilution) (Chemicon, Temecula,CA) and an AlexaFluor 488 goat anti-mouse IgG secondary antibody (1:500 dilution) (LifeTechnologies, San Diego, CA). Nuclei were counterstained with propidium iodide (50ug/ml)(Sigma, St. Louis, MO) in PBS solution containing 50 μg/ml RNase A (Sigma) and chickerythrocyte nuclei (Biosure, Grass Valley, CA). Nuclei in the G1/G0 cell cycle peak,determined by propidium iodide fluorescence, were electronically gated on a BectonDickinson FACS-Aria II (BD Biosciences, San Jose, CA) and selectively collected based onNeuN+ immunoreactivity.
Cell Seeding, Lysis, and Multiple Displacement AmplificationAll reagents not containing DNA or enzymes were first exposed to ultraviolet light for 10minutes prior to use. The PDMS slides were treated with oxygen plasma to make themhydrophilic and ensure random cell seeding. The slides were then treated with 1% bovineserum albumin (BSA) (EMD Chemicals, Billerica, MA) in phosphate buffered saline (PBS)(Gibco, Grand Island, NY) for 30 minutes and washed 3x with PBS to prevent DNA fromsticking to the PDMS. The slides were completely dried in a vacuum prior to cell seeding.Cells were diluted in 1x PBS to a concentration of 0.1 cells per well per array, and 3 μL ofcell dilution was added to each array. This dilution ensures that approximately 99.5% of thewells have no more than one cell.
Initially, to verify that cell seeding adhered to the Poisson distribution, cells were stainedwith 1x SYBR green and viewed under a fluorescent microscope. Proper cell distributionwas further confirmed with SEM imaging. For SEM imaging, chromium was sputtered ontothe seeded cells for 6 seconds to increase conductivity. Note that the imaging of cell seedingwas only used to confirm the theoretical Poisson distribution and not performed duringactual amplification and sequencing experiments due to the potential introduction ofcontamination.
After seeding, cells were left to settle into the wells for 10 minutes. The seeded cells werethen lysed either with 300 U ReadyLyse lysozyme at 100 U/μL (Epicentre, Madison, WI)and incubation at room temperature for 10 minutes, or with five 1 minute freeze/thaw cyclesusing a dry ice brick and room temperature in a laminar flow hood. After lysis, 4.5 μL ofalkaline lysis (ALS) buffer (400 mM KOH, 100 mM DTT, 10 mM EDTA) was added toeach array and incubated on ice for 10 minutes. Then, 4.5 μL of neutralizing (NS) buffer(666 mM Tris-HCl, 250 mM HCL) was added to each array. 11.2 μL of MDA master mix(1x buffer, 0.2x SYBR green I, 1 mM dNTP’s, 50 μM thiolated random hexamer primer, 8Uphi29 polymerase, Epicentre, Madison, WI) was added and the arrays were then covered
Gole et al. Page 8
Nat Biotechnol. Author manuscript; available in PMC 2014 June 01.
NIH
-PA Author Manuscript
NIH
-PA Author Manuscript
NIH
-PA Author Manuscript
with mineral oil. The slides were then transferred to the microscope stage enclosed in acustom temperature controlled incubator set to 30 °C. Images were taken at 30-minuteintervals for 10 hours using a 488 nm filter.
Image AnalysisImages were analyzed with a custom Matlab script to subtract background fluorescence.Because SYBR Green I was added to the MDA master mix, fluorescence under a 488 nmfilter was expected to increase over time for positive amplifications. If a digital profile offluorescent wells with increasing fluorescence over time was observed (approximately 10–20 wells per array), the array was kept. If no wells fluoresced, amplification failed andfurther experiments were stopped. Alternatively, if a majority of the wells fluoresced, thearray was considered to have exogenous contamination from environmental DNA andsubsequent analysis was similarly stopped. If 2 abutting wells fluoresced, neither wasextracted due to the higher likelihood of more than one cell in each well existing (as in thiscase, seeding was potentially non-uniform). Finally, only wells with amplicons originatingfrom a single point were extracted, ensuring that only single-cell derived amplicons wereprocessed; thus, any potential cross-well contamination was prevented.
Amplicon Extraction1 mm outer diameter glass pipettes (Sutter, Novato, CA) were pulled to ~30 um diameters,bent to a 45 degree angle under heat, coated with SigmaCote (Sigma, St. Louis, MO), andwashed 3 times with dH20. Wells with positive amplification were identified using thecustom Matlab script described above. A digital micromanipulation system (Sutter, Novato,CA) was used for amplicon extraction. The glass pipette was loaded into themicromanipulator and moved over the well of interest. The microscope filter was switchedto bright field and the pipette was lowered into the well. Negative pressure was slowlyapplied, and the well contents were visualized proceeding into the pipette. The filter wasthen switched back to 488 nm to ensure the well no longer contained any fluorescentmaterial. Amplicons were deposited in 1 μL dH20.
Amplicon QuantificationFor quantification of microwell amplification, 0.5 μL of amplicon was amplified a secondtime using MDA in a 20 μL PCR tube reaction (1x buffer, 0.2x SYBR green I, 1 mMdNTP’s, 50 mM thiolated random hexamer primer, 8U phi29 polymerase). After purificationusing Ampure XP beads (Beckman Coulter, Brea, CA), the 2nd round amplicon wasquantified using a Nanodrop spectrophotometer. The 2nd round amplicon was then diluted to1 ng, 100 pg, 10 pg, 1 pg, and 100 fg to create an amplicon ladder. Subsequently, theremaining 0.5 μL of the 1st round amplicon was amplified using MDA along with theamplicon ladder in a quantitative PCR machine. The samples were allowed to amplify tocompletion, and the time required for each to reach 0.5x of the maximum fluorescence wasextracted. The original amplicon concentration could then be interpolated. This 2nd round ofMDA was only performed during amplicon quantification in order to determineapproximately how much DNA was produced in each microwell. Amplicons that weresequenced were only subjected to the initial round of MDA, and thus did not have anysecondary MDA or quantification performed.
Low-input library construction1.5 μL of ALS buffer was added to the extracted amplicons to denature the DNA followedby a 3-minute incubation at room temperature. 1.5 μL of NS buffer was added on ice toneutralize the solution. 10 U of DNA Polymerase I (Invitrogen, Carlsbad, CA) was added tothe denatured amplicons along with 250 nanograms of unmodified random hexamer primer,
Gole et al. Page 9
Nat Biotechnol. Author manuscript; available in PMC 2014 June 01.
NIH
-PA Author Manuscript
NIH
-PA Author Manuscript
NIH
-PA Author Manuscript
1 mM dNTPs, 1x Ampligase buffer (Epicentre, Madison, Wi), and 1x NEB buffer 2 (NEB,Cambridge, MA). The solution was incubated at 37 °C for 1 hour, allowing second strandsynthesis. 1 U of Ampligase was added to seal nicks and the reaction was incubated first at37 °C for 10 minutes and then at 65 °C for 10 minutes. The reaction was cleaned usingstandard ethanol precipitation and eluted in 4 μL water.
Nextera transposase enzymes (Epicentre, Madison, WI) were diluted 100 fold in 1x TEbuffer and glycerol. 10 μL transposase reactions were then conducted on the elutedamplicons after addition of 1 μL of the diluted enzymes and 1x tagment DNA buffer. Thereactions were incubated for 5 minutes at 55 °C for mammalian cells and 1 minute at 55 °Cfor bacterial cells. 0.05 U of protease (Qiagen, Hilden, Germany) was added to each sampleto inactivate the transposase enzymes; the protease reactions were incubated at 50 °C for 10minutes followed by 65 °C for 20 minutes. 5 U Exo minus Klenow (Epicentre, Madison,WI) and 1 mM dNTP’s were added and incubated at 37 °C for 15 minutes followed by 65°C for 20 minutes. Two stage quantitative PCR using 1x KAPA Robust 2G master mix(Kapa Biosystems, Woburn, MA), 10 μM Adapter 1, 10 μM barcoded Adapter 2 in the firststage, and 1x KAPA Robust 2G master mix, 10 μM Illumina primer 1, 10 μM Illuminaprimer 2, and 0.4x SYBR Green I in the second stage was performed and the reaction wasstopped before amplification curves reached their plateaus. The reactions were then cleanedup using Ampure XP beads in a 1:1 ratio. A 6% PAGE gel verified successful tagmentationreactions.
Bulk Sample Library ConstructionGenomic DNA was extracted from approximately 4,000 neuronal nuclei using the DNeasyblood and tissue kit (Qiagen, Hilden, Germany). The genomic DNA was incubated with 1μL undiluted Nextera transposase enzymes and 1x tagment DNA buffer for 5 minutes at 55°C. The reactions were cleaned with MinElute columns (Qiagen, Hilden, Germany) andeluted in 20 μL water. 5 U Exo minus Klenow (Epicentre, Madison, WI) and 1 mM dNTP’swere added and incubated at 37 °C for 15 minutes followed by 65 °C for 20 minutes. Twostage quantitative PCR using 1x KAPA Robust 2G master mix (Kapa Biosystems, Woburn,MA), 10 μM Adapter 1, 10 μM barcoded Adapter 2 in the first stage, and 1x KAPA Robust2G master mix, 10 μM Illumina primer 1, 10 μM Illumina primer 2, and 0.4x SYBR Green Iin the second stage was performed and the reaction was stopped before amplification curvesreached their plateaus. The reactions were then cleaned up using Ampure XP beads in a 1:1ratio. A 6% PAGE gel verified successful tagmentation reactions.
Mapping and De novo Assembly of Bacterial GenomesBacterial libraries were size selected into the 300–600 bp range and sequenced in anIllumina MiSeq using 100 bp paired end reads. E. coli data was both mapped to thereference genome and de novo assembled. For the mapping analysis, libraries were mappedas single end reads to the reference E. coli K12 MG1655 genome using default Bowtieparameters with removal of any reads with multiple matches. Contamination was analyzed,and clonal reads were removed using SAMtools’ rmdup function. Chimeras were analyzedby flagging paired reads on the same strand or paired reads with a mismatched orientation.Chimeric junctions were defined as the number of chimeric reads divided by the totalnumber of mapped bases. For the de novo assembly, paired end reads with a combinedlength less than 200 bp were first joined and treated as single end reads. All remainingpaired end reads and newly generated single end reads were then quality trimmed. De novoassembly was performed using SPAdes11 v. 2.4.0. Corrected reads were assembled withkmer values of 21, 33, and 55. The assembled scaffolds were mapped to the NCBI ntdatabase with BLAST, and the organism distribution was visualized using MEGAN36.Obvious contaminants (e.g., human) were removed from the assembly and the assembly was
Gole et al. Page 10
Nat Biotechnol. Author manuscript; available in PMC 2014 June 01.
NIH
-PA Author Manuscript
NIH
-PA Author Manuscript
NIH
-PA Author Manuscript
analyzed using QUAST37. The remaining contigs were annotated using RAST38 andKAAS39.
Identification of CNVs in MIDAS and MDA dataMammalian single-cell libraries were sequenced in an Illumina Genome Analyzer IIx orIllumina HiSeq using 36 bp single end reads. The CNV algorithm previously published byCold Spring Harbor Laboratories8 was used to call copy number variation on each singleneuron, with modifications to successfully analyze non-cancer cells. Briefly, for eachsample, reads were mapped to the genome using Bowtie. Clonal reads resulting fromPolymerase Chain Reaction artifacts were removed using samtools, and the remainingunique reads were then assigned into 49,891 genomic bins of approximately 60 kb in sizethat were previously determined such that each would contain a similar number of readsafter mapping28. Each bin’s read count was then expressed as a value relative to the averagenumber of reads per bin in the sample, and then normalized by GC content of each bin usinga weighted sum of least squares algorithm (LOWESS). Circular binary segmentation wasthen used to divide each chromosome’s bins into adjacent segments with similar means.Unlike the previously published algorithm, in which a histogram of bin counts was thenplotted and the second peak chosen as representing a copy number of two, it was assumed,due to samples not being cancerous and thus being unlikely to contain significant amountsof aneuploidy, that the mean bin count in each sample would correspond to a copy numberof two. Each segment’s normalized bin count was thus multiplied by two and rounded to thenearest integer to call copy number. MIDAS data clearly showed a CNV call designatingTrisomy 21 in all Down Syndrome single cells, while the traditional MDA-based methodwas not able to call Trisomy 21.
Identification of Artificial CNVs in MDA and MIDAS dataIn order to test the ability of the CNV algorithm described above to call small CNVs,artificial CNVs were computationally constructed. Prior to circular binary segmentation, ineach Down Syndrome sample, one hundred random genomic regions across chromosomes1–22 were chosen, each consisting of either 17 or 34 bins of approximately 60 kb in size.Each region was replaced with an equivalently sized region from chromosome 21 orchromosome 4 (Supplementary Table 5). The above algorithm was then run on each“spiked-in” sample, and the number of new CNV calls in each sample that matched eachspike-in was tallied. For the chromosome 21 spike-ins, MIDAS was able to accurately call98% of spiked-in CNVs at the 2 Mb level and 68% of spiked-in CNVs at the 1 Mb level,while the traditional MDA-based method was not able to call any spiked-in CNVs. Asexpected, spike-ins of chromosome 4 did not result in any additional CNV calls.
Supplementary MaterialRefer to Web version on PubMed Central for supplementary material.
AcknowledgmentsWe thank C. Chen, H. Choi, and the UCSD Nano3 facility for initial help with microwell fabrication, F. Liang forinitial technical assistance, P. Pevzner for advices on de novo genome assembly. This project was funded by NIHgrants R01HG004876, R01GM097253, U01MH098977 and P50HG005550, and NSF grant OCE-1046368.
References1. Zhang K, et al. Sequencing genomes from single cells by polymerase cloning. Nat Biotechnol. 2006;
24:680–686. [PubMed: 16732271]
Gole et al. Page 11
Nat Biotechnol. Author manuscript; available in PMC 2014 June 01.
NIH
-PA Author Manuscript
NIH
-PA Author Manuscript
NIH
-PA Author Manuscript
2. Rodrigue S, et al. Whole genome amplification and de novo assembly of single bacterial cells. PLoSOne. 2009; 4:e6864. [PubMed: 19724646]
3. Fan HC, Wang J, Potanina A, Quake SR. Whole-genome molecular haplotyping of single cells. NatBiotechnol. 2011; 29:51–57. [PubMed: 21170043]
4. Hou Y, et al. Single-cell exome sequencing and monoclonal evolution of a JAK2-negativemyeloproliferative neoplasm. Cell. 2012; 148:873–885. [PubMed: 22385957]
5. Pan X, et al. A procedure for highly specific, sensitive, and unbiased whole-genome amplification.Proc Natl Acad Sci U S A. 2008; 105:15499–15504. [PubMed: 18832167]
6. Marcy Y, et al. Dissecting biological “dark matter” with single-cell genetic analysis of rare anduncultivated TM7 microbes from the human mouth. Proc Natl Acad Sci U S A. 2007; 104:11889–11894. [PubMed: 17620602]
7. Yoon HS, et al. Single-cell genomics reveals organismal interactions in uncultivated marine protists.Science. 2011; 332:714–717. [PubMed: 21551060]
8. Navin N, et al. Tumour evolution inferred by single-cell sequencing. Nature. 2011; 472:90–94.[PubMed: 21399628]
9. Xu X, et al. Single-cell exome sequencing reveals single-nucleotide mutation characteristics of akidney tumor. Cell. 2012; 148:886–895. [PubMed: 22385958]
10. Wang J, Fan HC, Behr B, Quake SR. Genome-wide single-cell analysis of recombination activityand de novo mutation rates in human sperm. Cell. 2012; 150:402–412. [PubMed: 22817899]
11. Bankevich A, et al. SPAdes: a new genome assembly algorithm and its applications to single-cellsequencing. J Comput Biol. 2012; 19:455–477. [PubMed: 22506599]
12. Chitsaz H, et al. Efficient de novo assembly of single-cell bacterial genomes from short-read datasets. Nat Biotechnol. 2011; 29:915–921. [PubMed: 21926975]
13. Hutchison CA 3rd, Smith HO, Pfannkoch C, Venter JC. Cell-free cloning using phi29 DNApolymerase. Proc Natl Acad Sci U S A. 2005; 102:17332–17336. [PubMed: 16286637]
14. Marcy Y, et al. Nanoliter reactors improve multiple displacement amplification of genomes fromsingle cells. PLoS Genet. 2007; 3:1702–1708. [PubMed: 17892324]
15. Inoue J, Shigemori Y, Mikawa T. Improvements of rolling circle amplification (RCA) efficiencyand accuracy using Thermus thermophilus SSB mutant protein. Nucleic Acids Res. 2006; 34:e69.[PubMed: 16707659]
16. Woyke T, et al. One bacterial cell, one complete genome. PLoS One. 2010; 5:e10314. [PubMed:20428247]
17. Fitzsimons MS, et al. Nearly finished genomes produced using gel microdroplet culturing revealsubstantial intraspecies genomic diversity within the human microbiome. Genome Res. 2013
18. Zong C, Lu S, Chapman AR, Xie XS. Genome-wide detection of single-nucleotide and copy-number variations of a single human cell. Science. 2012; 338:1622–1626. [PubMed: 23258894]
19. Blainey PC, Quake SR. Digital MDA for enumeration of total nucleic acid contamination. NucleicAcids Res. 2011; 39:e19. [PubMed: 21071419]
20. Adey A, Shendure J. Ultra-low-input, tagmentation-based whole-genome bisulfite sequencing.Genome Res. 2012; 22:1139–1143. [PubMed: 22466172]
21. Rehen SK, et al. Constitutional aneuploidy in the normal human brain. J Neurosci. 2005; 25:2176–2180. [PubMed: 15745943]
22. Rehen SK, et al. Chromosomal variation in neurons of the developing and adult mammaliannervous system. Proc Natl Acad Sci U S A. 2001; 98:13361–13366. [PubMed: 11698687]
23. Yang AH, et al. Chromosome segregation defects contribute to aneuploidy in normal neuralprogenitor cells. J Neurosci. 2003; 23:10454–10462. [PubMed: 14614104]
24. Yurov YB, et al. Aneuploidy and confined chromosomal mosaicism in the developing humanbrain. PLoS One. 2007; 2:e558. [PubMed: 17593959]
25. Muotri AR, Gage FH. Generation of neuronal variability and complexity. Nature. 2006; 441:1087–1093. [PubMed: 16810244]
26. Singer T, McConnell MJ, Marchetto MC, Coufal NG, Gage FH. LINE-1 retrotransposons:mediators of somatic variation in neuronal genomes? Trends Neurosci. 2010; 33:345–354.[PubMed: 20471112]
Gole et al. Page 12
Nat Biotechnol. Author manuscript; available in PMC 2014 June 01.
NIH
-PA Author Manuscript
NIH
-PA Author Manuscript
NIH
-PA Author Manuscript
27. Westra JW, et al. Neuronal DNA content variation (DCV) with regional and individual differencesin the human brain. J Comp Neurol. 2010; 518:3981–4000. [PubMed: 20737596]
28. Baslan T, et al. Genome-wide copy number analysis of single cells. Nat Protoc. 2012; 7:1024–1041. [PubMed: 22555242]
29. Shendure J, et al. Accurate multiplex polony sequencing of an evolved bacterial genome. Science.2005; 309:1728–1732. [PubMed: 16081699]
30. Abecasis GR, et al. An integrated map of genetic variation from 1,092 human genomes. Nature.2012; 491:56–65. [PubMed: 23128226]
31. Albertsen M, et al. Genome sequences of rare, uncultured bacteria obtained by differentialcoverage binning of multiple metagenomes. Nat Biotechnol. 2013; 31:533–538. [PubMed:23707974]
32. Kirkness EF, et al. Sequencing of isolated sperm cells for direct haplotyping of a human genome.Genome Res. 2013; 23:826–832. [PubMed: 23282328]
33. Lu S, et al. Probing meiotic recombination and aneuploidy of single sperm cells by whole-genomesequencing. Science. 2012; 338:1627–1630. [PubMed: 23258895]
34. Hussein SM, et al. Copy number variation and selection during reprogramming to pluripotency.Nature. 2011; 471:58–62. [PubMed: 21368824]
35. Westra JW, et al. Aneuploid mosaicism in the developing and adult cerebellar cortex. J CompNeurol. 2008; 507:1944–1951. [PubMed: 18273885]
36. Huson DH, Auch AF, Qi J, Schuster SC. MEGAN analysis of metagenomic data. Genome Res.2007; 17:377–386. [PubMed: 17255551]
37. Gurevich A, Saveliev V, Vyahhi N, Tesler G. QUAST: quality assessment tool for genomeassemblies. Bioinformatics. 2013; 29:1072–1075. [PubMed: 23422339]
38. Aziz RK, et al. The RAST Server: rapid annotations using subsystems technology. BMCGenomics. 2008; 9:75. [PubMed: 18261238]
39. Moriya Y, Itoh M, Okuda S, Yoshizawa AC, Kanehisa M. KAAS: an automatic genomeannotation and pathway reconstruction server. Nucleic acids research. 2007; 35:W182–185.[PubMed: 17526522]
Gole et al. Page 13
Nat Biotechnol. Author manuscript; available in PMC 2014 June 01.
NIH
-PA Author Manuscript
NIH
-PA Author Manuscript
NIH
-PA Author Manuscript
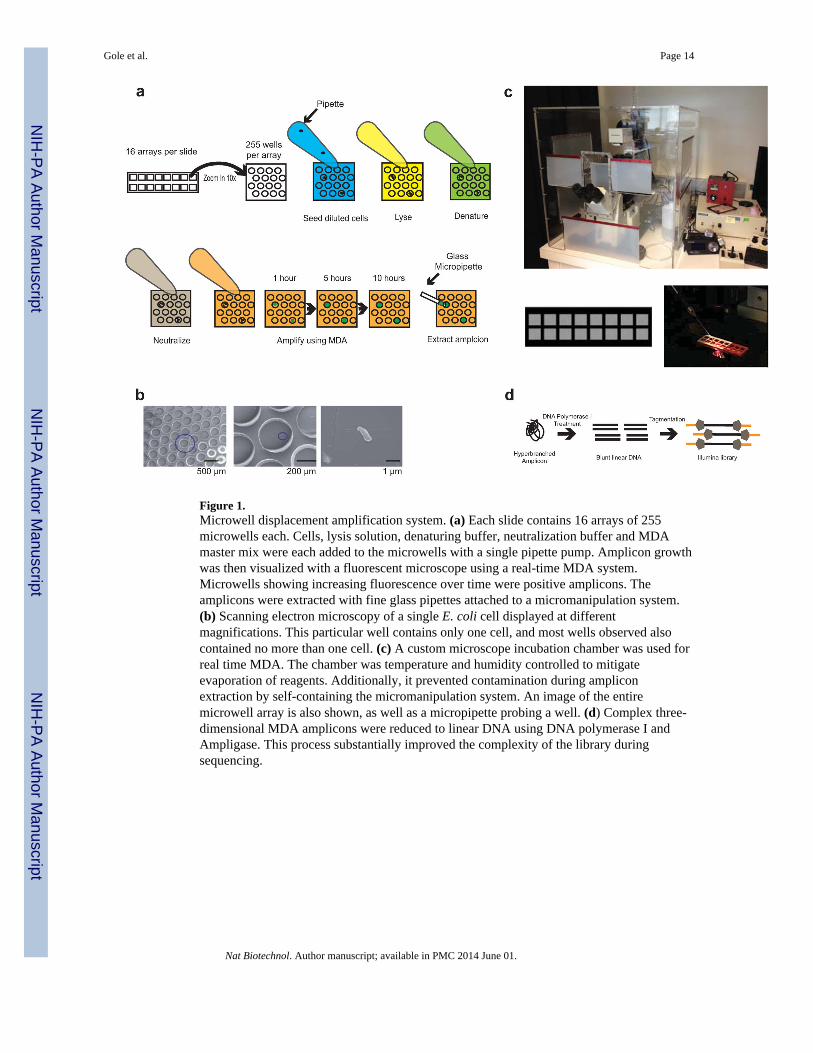
Figure 1.Microwell displacement amplification system. (a) Each slide contains 16 arrays of 255microwells each. Cells, lysis solution, denaturing buffer, neutralization buffer and MDAmaster mix were each added to the microwells with a single pipette pump. Amplicon growthwas then visualized with a fluorescent microscope using a real-time MDA system.Microwells showing increasing fluorescence over time were positive amplicons. Theamplicons were extracted with fine glass pipettes attached to a micromanipulation system.(b) Scanning electron microscopy of a single E. coli cell displayed at differentmagnifications. This particular well contains only one cell, and most wells observed alsocontained no more than one cell. (c) A custom microscope incubation chamber was used forreal time MDA. The chamber was temperature and humidity controlled to mitigateevaporation of reagents. Additionally, it prevented contamination during ampliconextraction by self-containing the micromanipulation system. An image of the entiremicrowell array is also shown, as well as a micropipette probing a well. (d) Complex three-dimensional MDA amplicons were reduced to linear DNA using DNA polymerase I andAmpligase. This process substantially improved the complexity of the library duringsequencing.
Gole et al. Page 14
Nat Biotechnol. Author manuscript; available in PMC 2014 June 01.
NIH
-PA Author Manuscript
NIH
-PA Author Manuscript
NIH
-PA Author Manuscript
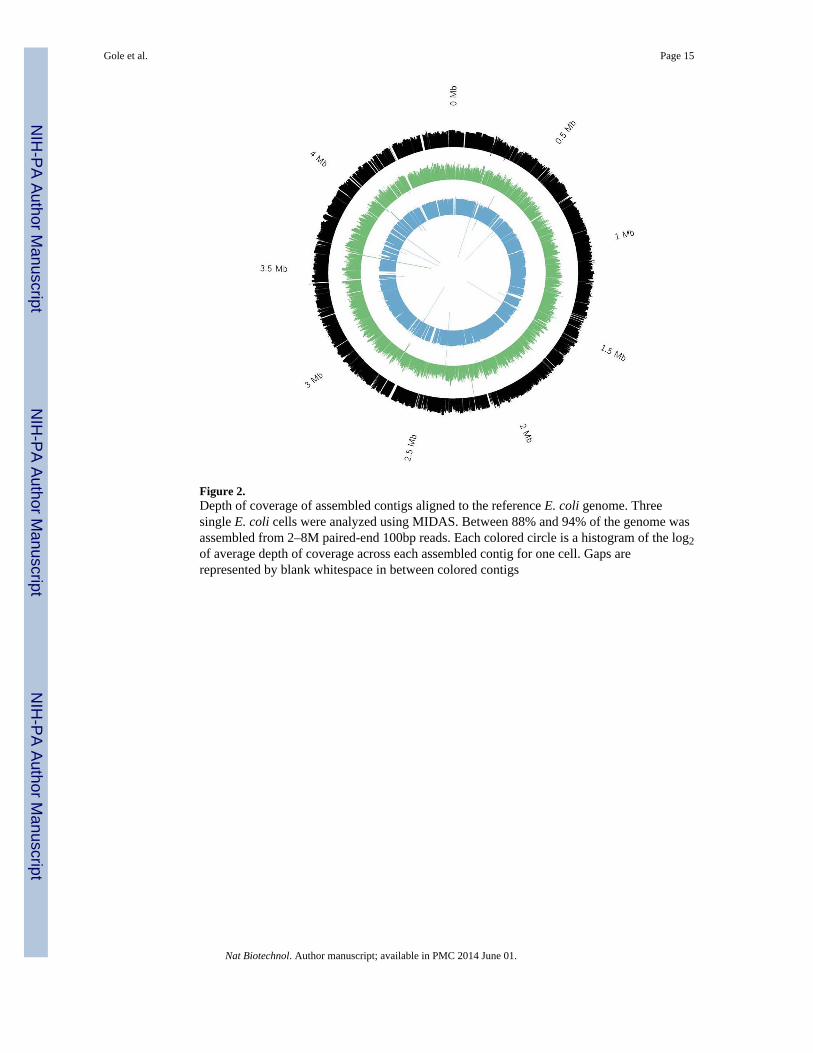
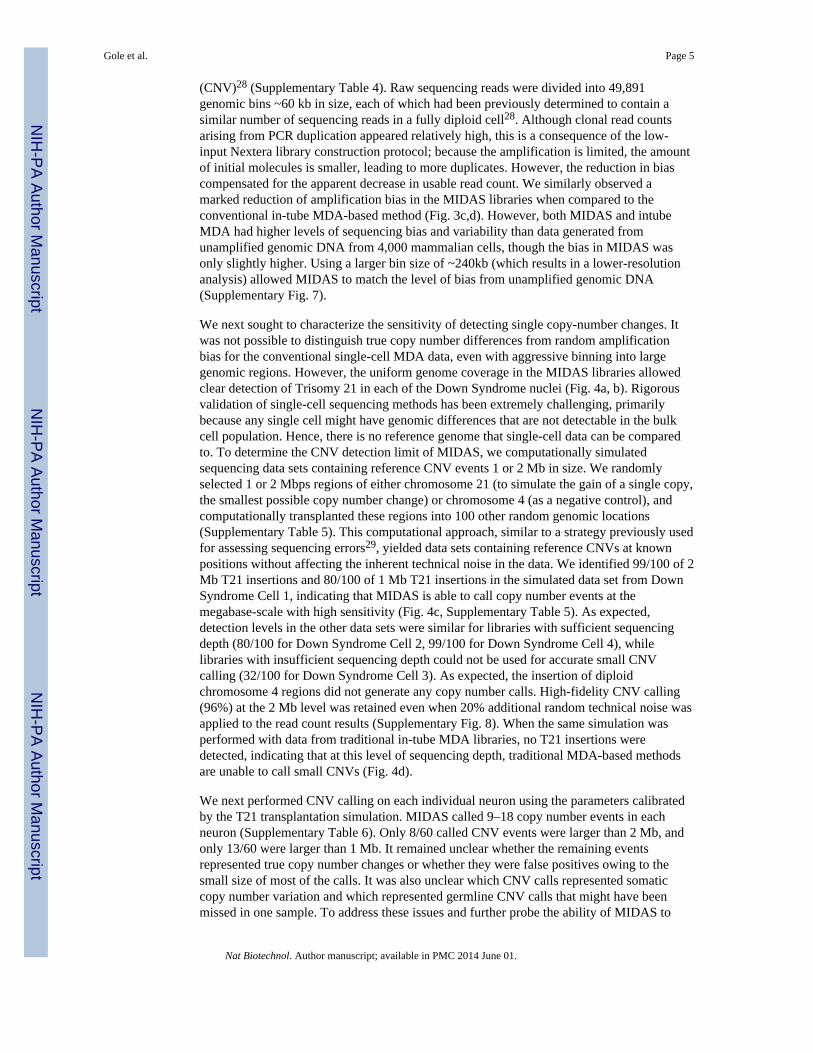
Figure 2.Depth of coverage of assembled contigs aligned to the reference E. coli genome. Threesingle E. coli cells were analyzed using MIDAS. Between 88% and 94% of the genome wasassembled from 2–8M paired-end 100bp reads. Each colored circle is a histogram of the log2of average depth of coverage across each assembled contig for one cell. Gaps arerepresented by blank whitespace in between colored contigs
Gole et al. Page 15
Nat Biotechnol. Author manuscript; available in PMC 2014 June 01.
NIH
-PA Author Manuscript
NIH
-PA Author Manuscript
NIH
-PA Author Manuscript
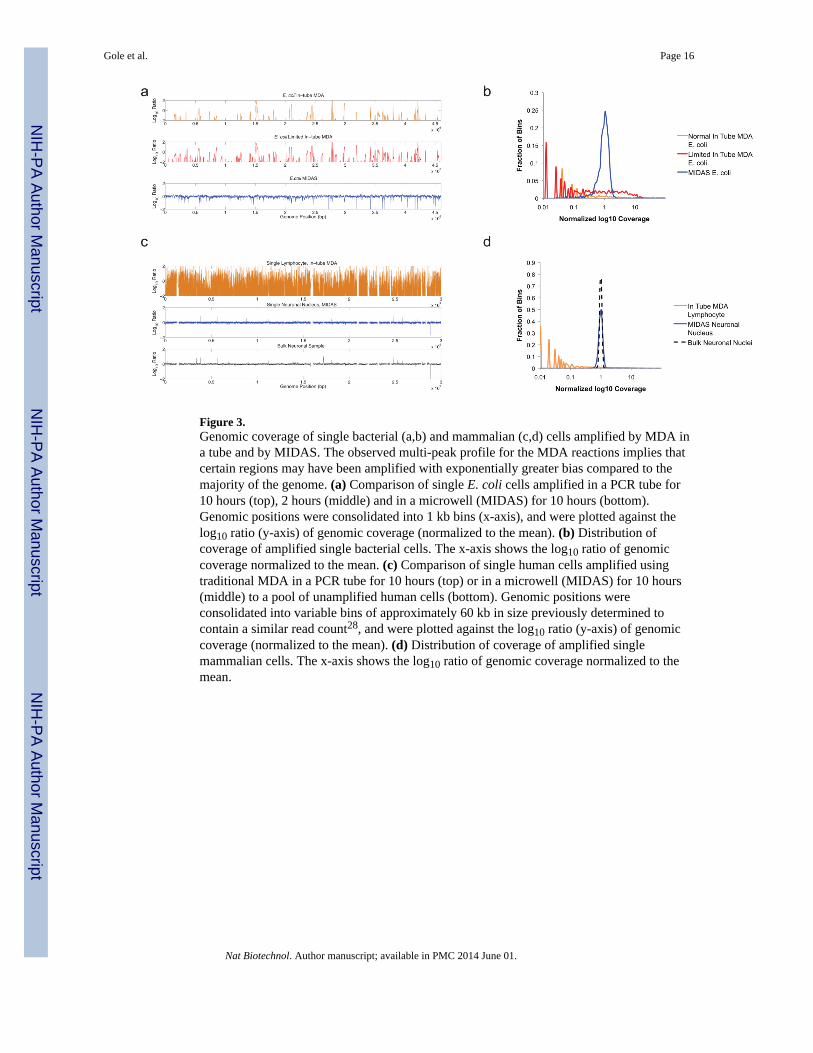
Figure 3.Genomic coverage of single bacterial (a,b) and mammalian (c,d) cells amplified by MDA ina tube and by MIDAS. The observed multi-peak profile for the MDA reactions implies thatcertain regions may have been amplified with exponentially greater bias compared to themajority of the genome. (a) Comparison of single E. coli cells amplified in a PCR tube for10 hours (top), 2 hours (middle) and in a microwell (MIDAS) for 10 hours (bottom).Genomic positions were consolidated into 1 kb bins (x-axis), and were plotted against thelog10 ratio (y-axis) of genomic coverage (normalized to the mean). (b) Distribution ofcoverage of amplified single bacterial cells. The x-axis shows the log10 ratio of genomiccoverage normalized to the mean. (c) Comparison of single human cells amplified usingtraditional MDA in a PCR tube for 10 hours (top) or in a microwell (MIDAS) for 10 hours(middle) to a pool of unamplified human cells (bottom). Genomic positions wereconsolidated into variable bins of approximately 60 kb in size previously determined tocontain a similar read count28, and were plotted against the log10 ratio (y-axis) of genomiccoverage (normalized to the mean). (d) Distribution of coverage of amplified singlemammalian cells. The x-axis shows the log10 ratio of genomic coverage normalized to themean.
Gole et al. Page 16
Nat Biotechnol. Author manuscript; available in PMC 2014 June 01.
NIH
-PA Author Manuscript
NIH
-PA Author Manuscript
NIH
-PA Author Manuscript
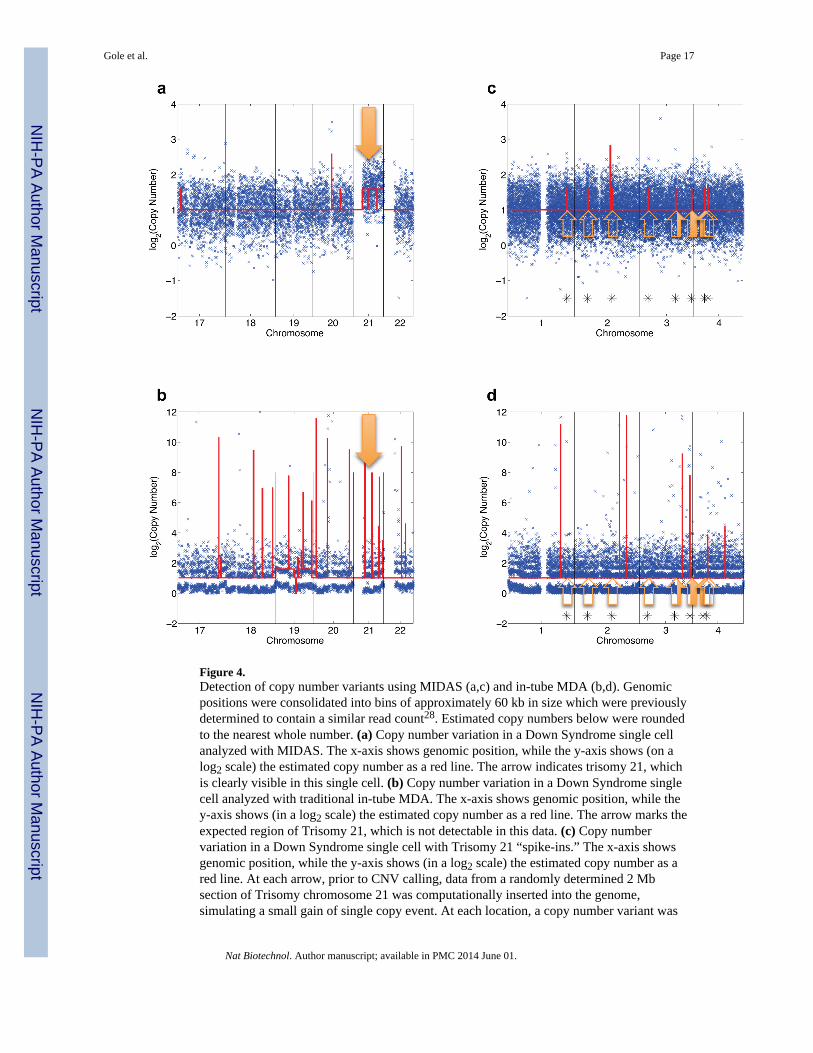
Figure 4.Detection of copy number variants using MIDAS (a,c) and in-tube MDA (b,d). Genomicpositions were consolidated into bins of approximately 60 kb in size which were previouslydetermined to contain a similar read count28. Estimated copy numbers below were roundedto the nearest whole number. (a) Copy number variation in a Down Syndrome single cellanalyzed with MIDAS. The x-axis shows genomic position, while the y-axis shows (on alog2 scale) the estimated copy number as a red line. The arrow indicates trisomy 21, whichis clearly visible in this single cell. (b) Copy number variation in a Down Syndrome singlecell analyzed with traditional in-tube MDA. The x-axis shows genomic position, while they-axis shows (in a log2 scale) the estimated copy number as a red line. The arrow marks theexpected region of Trisomy 21, which is not detectable in this data. (c) Copy numbervariation in a Down Syndrome single cell with Trisomy 21 “spike-ins.” The x-axis showsgenomic position, while the y-axis shows (in a log2 scale) the estimated copy number as ared line. At each arrow, prior to CNV calling, data from a randomly determined 2 Mbsection of Trisomy chromosome 21 was computationally inserted into the genome,simulating a small gain of single copy event. At each location, a copy number variant was
Gole et al. Page 17
Nat Biotechnol. Author manuscript; available in PMC 2014 June 01.
NIH
-PA Author Manuscript
NIH
-PA Author Manuscript
NIH
-PA Author Manuscript
called, showing that MIDAS can detect 2 Mb copy number variation accurately. (d) Copynumber variation in a Down Syndrome single cell with Trisomy 21 “spike-ins.” The x-axisshows genomic position, while the y-axis shows (on a log2 scale) the estimated copy numberas a red line. At each arrow, prior to CNV calling, data from a randomly determined 2 Mbsection of Trisomy chromosome 21 was computationally inserted into the genome,simulating a small gain of single copy event.
Gole et al. Page 18
Nat Biotechnol. Author manuscript; available in PMC 2014 June 01.
NIH
-PA Author Manuscript
NIH
-PA Author Manuscript
NIH
-PA Author Manuscript
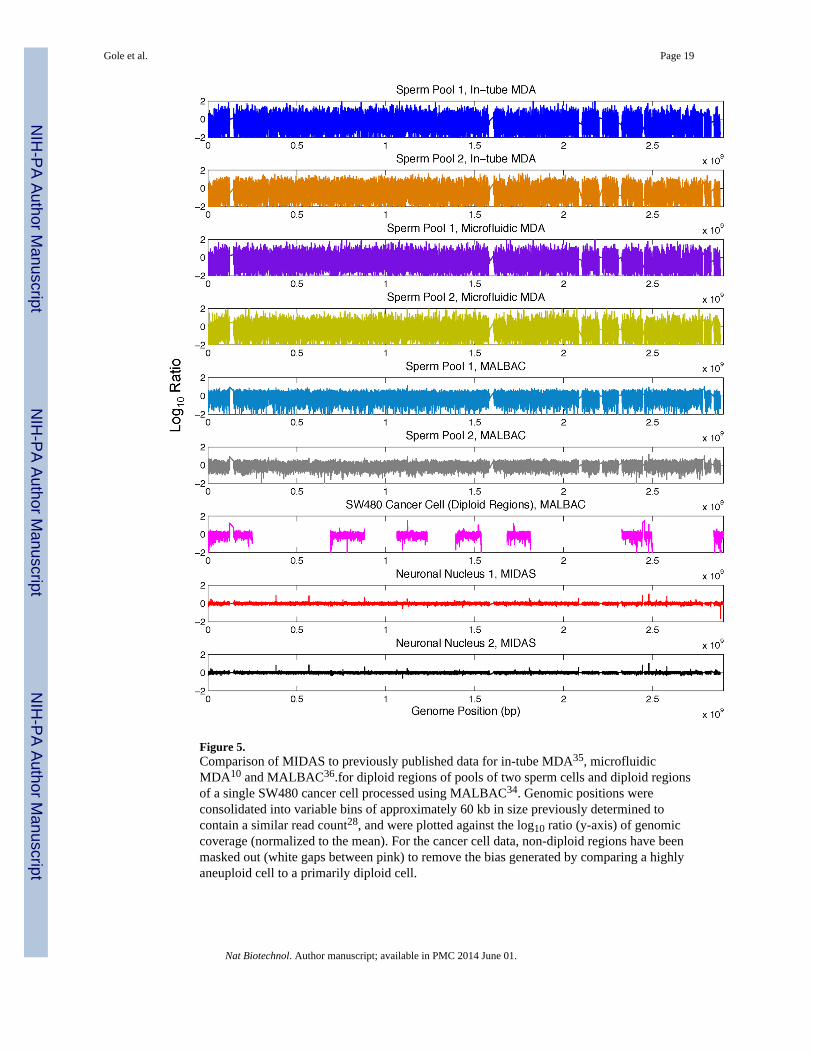
Figure 5.Comparison of MIDAS to previously published data for in-tube MDA35, microfluidicMDA10 and MALBAC36.for diploid regions of pools of two sperm cells and diploid regionsof a single SW480 cancer cell processed using MALBAC34. Genomic positions wereconsolidated into variable bins of approximately 60 kb in size previously determined tocontain a similar read count28, and were plotted against the log10 ratio (y-axis) of genomiccoverage (normalized to the mean). For the cancer cell data, non-diploid regions have beenmasked out (white gaps between pink) to remove the bias generated by comparing a highlyaneuploid cell to a primarily diploid cell.
Gole et al. Page 19
Nat Biotechnol. Author manuscript; available in PMC 2014 June 01.
NIH
-PA Author Manuscript
NIH
-PA Author Manuscript
NIH
-PA Author Manuscript
Related Documents