74 | NATURE | VOL 550 | 5 OCTOBER 2017 ARTICLE doi:10.1038/nature23912 Massively parallel de novo protein design for targeted therapeutics Aaron Chevalier 1,2 *, Daniel-Adriano Silva 1,2 *, Gabriel J. Rocklin 1,2 *, Derrick R. Hicks 1,2,3 , Renan Vergara 1,2,4 , Patience Murapa 5 , Steffen M. Bernard 6,7 , Lu Zhang 8,9 , Kwok-Ho Lam 10 , Guorui Yao 10 , Christopher D. Bahl 1,2 , Shin-Ichiro Miyashita 11,12 , Inna Goreshnik 1 , James T. Fuller 5 , Merika T. Koday 5,13 , Cody M. Jenkins 5 , Tom Colvin 1 , Lauren Carter 1,2 , Alan Bohn 5 , Cassie M. Bryan 1,2 , D. Alejandro Fernández-Velasco 4 , Lance Stewart 2 , Min Dong 11,12 , Xuhui Huang 9 , Rongsheng Jin 10 , Ian A. Wilson 6,7 , Deborah H. Fuller 5 & David Baker 1,2 Small (4–12 kDa) binding proteins have the potential to bridge the gap between monoclonal antibodies and small molecule drugs 1–3 , with advantages of stability and amenability to chemical synthesis over monoclonal antibodies, and of selectivity and designability over small molecules. Directed evolution, starting from naturally occurring small protein scaffolds, has previously been used to generate new binding proteins 4 . While powerful, such approaches have limitations: they cannot modify the overall shape of the starting scaffold protein(s), they can sample only a very small fraction of sequence space, and naturally occurring disulfide mini-proteins can be difficult to express. Computational protein design has the potential to overcome these limitations by efficiently sampling both shape and sequence space on a much larger scale, and by generating readily producible proteins, as recently demonstrated by the design of stapled mini-protein scaffolds with a wide range of shapes 5 . Despite this potential, the high cost of synthesizing genes for each designed protein has, until recently 6 , limited testing to small numbers (tens) of designs for any one application, which is too few to systematically explore the determinants of protein binding and folding and provide feedback to improve the computational model 7,8 . Here, we describe an integrated computational and experimental approach that enables the rapid design and testing of tens of thousands of de novo mini-protein binders. Our approach exploits advances in both DNA manufacturing and protein design that have led to a fortu- nate convergence between the upper limit of the size of oligonucleotides (230 bp) that can be synthesized as pools of 10,000 or larger 9,10 , and the lower limit of the size of genetically encodable computationally designed proteins (roughly 40 amino acids). To generate binders for a given target, we used Rosetta 11 to design thousands of protein scaffolds with varying shapes, dock these onto the target, optimize the residues at the interface for high-affinity binding, and identify, from the resulting pool of hundreds of thousands of designs, approximately 10,000 with high predicted stability and affinity. This large pool of computational designs, together with controls probing aspects of the design procedure, was then experimentally evaluated by encoding each individual sequence in a single oligonucleotide, manufacturing the oligonucleotides in parallel, sorting yeast libraries displaying the designs labelled with fluorescent targets, and using deep sequencing to identify the designs most enriched for binding (Fig. 1). High-throughput computational design As targets, we selected Influenza A H1 haemagglutinin (HA), as this virus remains a serious public health concern 12 , and botulinum neurotoxin B (BoNT/B), which causes the acute neuroparalytic syn- drome of botulism and is one of the most lethal natural toxins known (with a lethal dose of approximately 1 ng per kg) 13 . We generated virtual scaffold libraries with over 4,000 backbone geometries in five different topologies: HHH, EHEE, HEE, EEHE, and HEEH (where H indicates an α-helix and E a β-strand) with or without 5,6 diverse disulfide con- nectivities (Fig. 1a). To design binding interfaces, we superimposed helical segments of the scaffolds on interface helices in previously solved HA and BoNT/B complexes (the previously designed HA binders HB36.6 and HB80.4 14–16 , and the natural target of BoNT/B synaptotagmin-II (Syt-II) 17 ), seeded the newly formed interfaces De novo protein design holds promise for creating small stable proteins with shapes customized to bind therapeutic targets. We describe a massively parallel approach for designing, manufacturing and screening mini-protein binders, integrating large-scale computational design, oligonucleotide synthesis, yeast display screening and next-generation sequencing. We designed and tested 22,660 mini-proteins of 37–43 residues that target influenza haemagglutinin and botulinum neurotoxin B, along with 6,286 control sequences to probe contributions to folding and binding, and identified 2,618 high-affinity binders. Comparison of the binding and non-binding design sets, which are two orders of magnitude larger than any previously investigated, enabled the evaluation and improvement of the computational model. Biophysical characterization of a subset of the binder designs showed that they are extremely stable and, unlike antibodies, do not lose activity after exposure to high temperatures. The designs elicit little or no immune response and provide potent prophylactic and therapeutic protection against influenza, even after extensive repeated dosing. 1 Department of Biochemistry, University of Washington, Seattle, Washington 98195, USA. 2 Institute for Protein Design, University of Washington, Seattle, Washington 98195, USA. 3 Molecular and Cellular Biology Program, University of Washington, Seattle, Washington 98195, USA. 4 Facultad de Medicina, Universidad Nacional Autónoma de México (UNAM), Ciudad Universitaria, México City 04510, Mexico. 5 Department of Microbiology, University of Washington, Seattle, Washington 98109, USA. 6 Department of Integrative Structural and Computational Biology, The Scripps Research Institute, 10550 North Torrey Pines Road, La Jolla, California 92037, USA. 7 The Skaggs Institute for Chemical Biology, The Scripps Research Institute, 10550 North Torrey Pines Road, La Jolla, California 92037, USA. 8 State Key Laboratory of Structural Chemistry, Fujian Institute of Research on the Structure of Matter, Chinese Academy of Sciences, Fuzhou, Fujian 350002, China. 9 Department of Chemistry and State Key Laboratory of Molecular Neuroscience, The Hong Kong University of Science and Technology, Clear Water Bay, Kowloon, Hong Kong, China. 10 Department of Physiology and Biophysics, University of California, Irvine, California 92697, USA. 11 Department of Urology, Boston Children’s Hospital, Boston, Massachusetts 02115, USA. 12 Department of Microbiology and Immunobiology and Department of Surgery, Harvard Medical School, Boston, Massachusetts 02115, USA. 13 Virvio Inc., Seattle, Washington 98195, USA. *These authors contributed equally to this work. © 2017 Macmillan Publishers Limited, part of Springer Nature. All rights reserved.

Welcome message from author
This document is posted to help you gain knowledge. Please leave a comment to let me know what you think about it! Share it to your friends and learn new things together.
Transcript
7 4 | N A T U R E | V O L 5 5 0 | 5 O c T O b E R 2 0 1 7
ARTicLEdoi:10.1038/nature23912
Massively parallel de novo protein design for targeted therapeuticsAaron chevalier1,2*, Daniel-Adriano Silva1,2*, Gabriel J. Rocklin1,2*, Derrick R. Hicks1,2,3, Renan Vergara1,2,4, Patience Murapa5, Steffen M. bernard6,7, Lu Zhang8,9, Kwok-Ho Lam10, Guorui Yao10, christopher D. bahl1,2, Shin-ichiro Miyashita11,12, inna Goreshnik1, James T. Fuller5, Merika T. Koday5,13, cody M. Jenkins5, Tom colvin1, Lauren carter1,2, Alan bohn5, cassie M. bryan1,2, D. Alejandro Fernández-Velasco4, Lance Stewart2, Min Dong11,12, Xuhui Huang9, Rongsheng Jin10, ian A. Wilson6,7, Deborah H. Fuller5 & David baker1,2
Small (4–12 kDa) binding proteins have the potential to bridge the gap between monoclonal antibodies and small molecule drugs1–3, with advantages of stability and amenability to chemical synthesis over monoclonal antibodies, and of selectivity and designability over small molecules. Directed evolution, starting from naturally occurring small protein scaffolds, has previously been used to generate new binding proteins4. While powerful, such approaches have limitations: they cannot modify the overall shape of the starting scaffold protein(s), they can sample only a very small fraction of sequence space, and naturally occurring disulfide mini-proteins can be difficult to express. Computational protein design has the potential to overcome these limitations by efficiently sampling both shape and sequence space on a much larger scale, and by generating readily producible proteins, as recently demonstrated by the design of stapled mini- protein scaffolds with a wide range of shapes5. Despite this potential, the high cost of synthesizing genes for each designed protein has, until recently6, limited testing to small numbers (tens) of designs for any one application, which is too few to systematically explore the determinants of protein binding and folding and provide feedback to improve the computational model7,8.
Here, we describe an integrated computational and experimental approach that enables the rapid design and testing of tens of thousands of de novo mini-protein binders. Our approach exploits advances in both DNA manufacturing and protein design that have led to a fortu-nate convergence between the upper limit of the size of oligonucleotides (230 bp) that can be synthesized as pools of 10,000 or larger9,10, and the lower limit of the size of genetically encodable computationally
designed proteins (roughly 40 amino acids). To generate binders for a given target, we used Rosetta11 to design thousands of protein scaffolds with varying shapes, dock these onto the target, optimize the residues at the interface for high-affinity binding, and identify, from the resulting pool of hundreds of thousands of designs, approximately 10,000 with high predicted stability and affinity. This large pool of computational designs, together with controls probing aspects of the design procedure, was then experimentally evaluated by encoding each individual sequence in a single oligonucleotide, manufacturing the oligonucleotides in parallel, sorting yeast libraries displaying the designs labelled with fluorescent targets, and using deep sequencing to identify the designs most enriched for binding (Fig. 1).
High-throughput computational designAs targets, we selected Influenza A H1 haemagglutinin (HA), as this virus remains a serious public health concern12, and botulinum neurotoxin B (BoNT/B), which causes the acute neuroparalytic syn-drome of botulism and is one of the most lethal natural toxins known (with a lethal dose of approximately 1 ng per kg)13. We generated virtual scaffold libraries with over 4,000 backbone geometries in five different topologies: HHH, EHEE, HEE, EEHE, and HEEH (where H indicates an α -helix and E a β -strand) with or without5,6 diverse disulfide con-nectivities (Fig. 1a). To design binding interfaces, we superimposed helical segments of the scaffolds on interface helices in previously solved HA and BoNT/B complexes (the previously designed HA binders HB36.6 and HB80.414–16, and the natural target of BoNT/B synaptotagmin-II (Syt-II)17), seeded the newly formed interfaces
De novo protein design holds promise for creating small stable proteins with shapes customized to bind therapeutic targets. We describe a massively parallel approach for designing, manufacturing and screening mini-protein binders, integrating large-scale computational design, oligonucleotide synthesis, yeast display screening and next-generation sequencing. We designed and tested 22,660 mini-proteins of 37–43 residues that target influenza haemagglutinin and botulinum neurotoxin B, along with 6,286 control sequences to probe contributions to folding and binding, and identified 2,618 high-affinity binders. Comparison of the binding and non-binding design sets, which are two orders of magnitude larger than any previously investigated, enabled the evaluation and improvement of the computational model. Biophysical characterization of a subset of the binder designs showed that they are extremely stable and, unlike antibodies, do not lose activity after exposure to high temperatures. The designs elicit little or no immune response and provide potent prophylactic and therapeutic protection against influenza, even after extensive repeated dosing.
1Department of Biochemistry, University of Washington, Seattle, Washington 98195, USA. 2Institute for Protein Design, University of Washington, Seattle, Washington 98195, USA. 3Molecular and Cellular Biology Program, University of Washington, Seattle, Washington 98195, USA. 4Facultad de Medicina, Universidad Nacional Autónoma de México (UNAM), Ciudad Universitaria, México City 04510, Mexico. 5Department of Microbiology, University of Washington, Seattle, Washington 98109, USA. 6Department of Integrative Structural and Computational Biology, The Scripps Research Institute, 10550 North Torrey Pines Road, La Jolla, California 92037, USA. 7The Skaggs Institute for Chemical Biology, The Scripps Research Institute, 10550 North Torrey Pines Road, La Jolla, California 92037, USA. 8State Key Laboratory of Structural Chemistry, Fujian Institute of Research on the Structure of Matter, Chinese Academy of Sciences, Fuzhou, Fujian 350002, China. 9Department of Chemistry and State Key Laboratory of Molecular Neuroscience, The Hong Kong University of Science and Technology, Clear Water Bay, Kowloon, Hong Kong, China. 10Department of Physiology and Biophysics, University of California, Irvine, California 92697, USA. 11Department of Urology, Boston Children’s Hospital, Boston, Massachusetts 02115, USA. 12Department of Microbiology and Immunobiology and Department of Surgery, Harvard Medical School, Boston, Massachusetts 02115, USA. 13Virvio Inc., Seattle, Washington 98195, USA.*These authors contributed equally to this work.
© 2017 Macmillan Publishers Limited, part of Springer Nature. All rights reserved.
Article reSeArcH
5 O c T O b E R 2 0 1 7 | V O L 5 5 0 | N A T U R E | 7 5
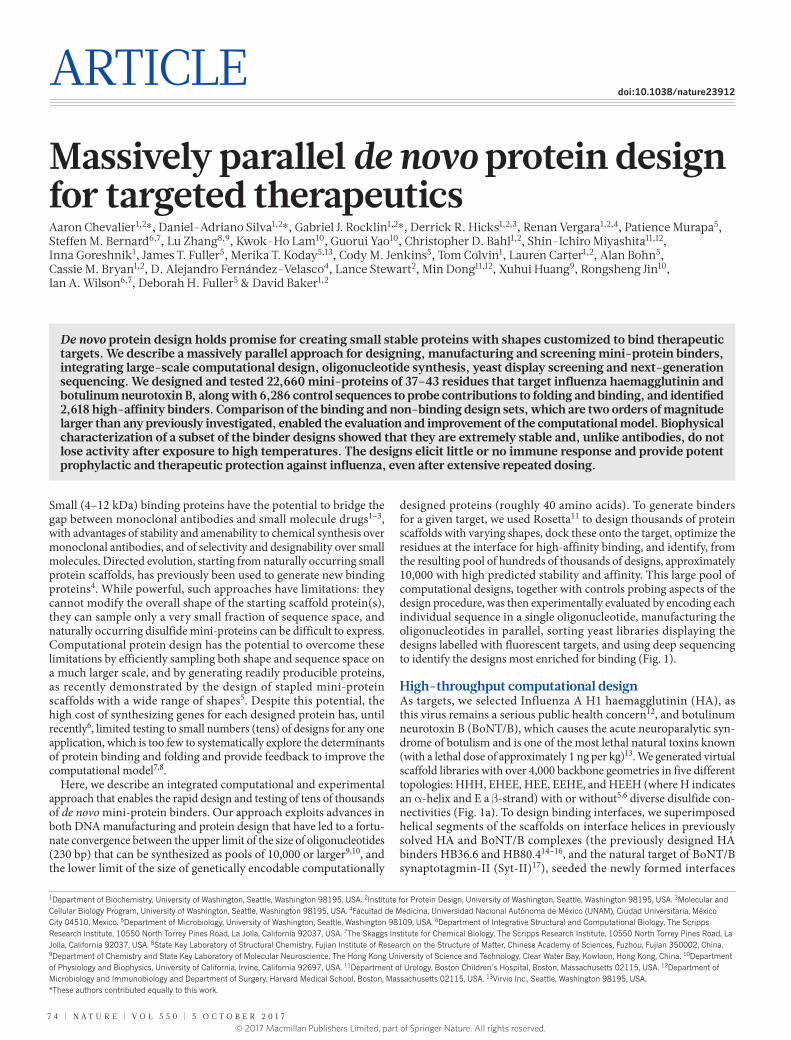
with hotspot residues from these helices (Extended Data Fig. 1) and designed the remainder of the residues to maximize binding affinity and monomer stability using Rosetta combinatorial sequence optimi-zation (Supplementary Fig. 1). The designs interact with the targets in a myriad of ways (Fig. 1b), with a wide range of buried surface areas at the interface (Fig. 1c) resulting from variations in the Rosetta designed interactions outside the hotspot residues. As HA and BoNT differ in shape (the HA epitope is more concave and the BoNT epitope is flatter), the design protocol favoured different topologies in the two cases (α –β for HA and all α for BoNT).
For experimental characterization, we selected 7,276 designs against HA and 3,406 designs against BoNT (see Methods). To probe con-tributions to folding and binding, we also included a variety of con-trol sequences in which the amino acids outside the helical interface motif were randomly permuted, the core residues were randomly per-muted, all the core residues were mutated to valine, the loop residues were mutated to Gly-Ser, or the designed binding sites were omitted. Oligo pools encoding all of the design and control sequences (16,968 in total) were synthesized, amplified, and co-transformed into yeast, along with a linearized yeast display vector (Fig. 1d). The resulting yeast libraries, displaying the 16,968 proteins, were incubated with a range of concentrations of fluorescently labelled target, in some cases after protease treatment to remove poorly folded designs. Cells displaying designs that bound the target were retrieved by fluorescence-activated cell sorting (FACS, Fig. 1e). The frequency of each design and control sequence in each pool was determined by deep sequencing the sorted
cell populations, and the sequences were categorized on the basis of the sorting condition in which they were most enriched (Extended Data Fig. 2).
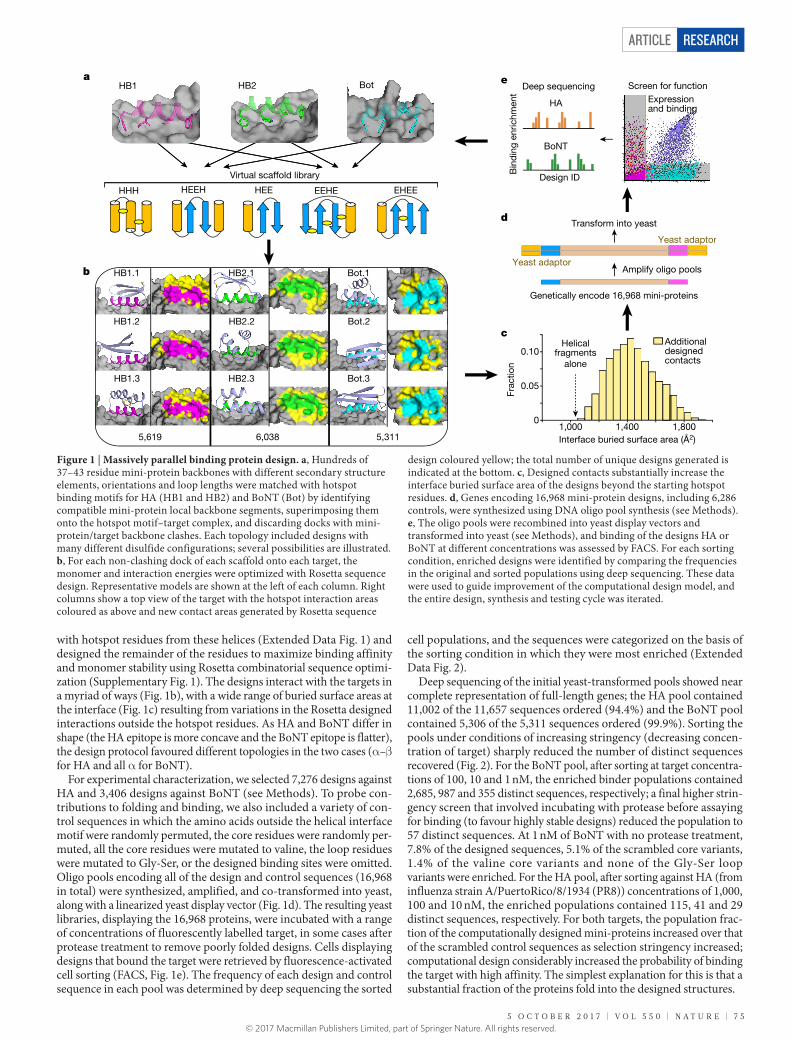
Deep sequencing of the initial yeast-transformed pools showed near complete representation of full-length genes; the HA pool contained 11,002 of the 11,657 sequences ordered (94.4%) and the BoNT pool contained 5,306 of the 5,311 sequences ordered (99.9%). Sorting the pools under conditions of increasing stringency (decreasing concen-tration of target) sharply reduced the number of distinct sequences recovered (Fig. 2). For the BoNT pool, after sorting at target concentra-tions of 100, 10 and 1 nM, the enriched binder populations contained 2,685, 987 and 355 distinct sequences, respectively; a final higher strin-gency screen that involved incubating with protease before assaying for binding (to favour highly stable designs) reduced the population to 57 distinct sequences. At 1 nM of BoNT with no protease treatment, 7.8% of the designed sequences, 5.1% of the scrambled core variants, 1.4% of the valine core variants and none of the Gly-Ser loop variants were enriched. For the HA pool, after sorting against HA (from influenza strain A/PuertoRico/8/1934 (PR8)) concentrations of 1,000, 100 and 10 nM, the enriched populations contained 115, 41 and 29 distinct sequences, respectively. For both targets, the population frac-tion of the computationally designed mini-proteins increased over that of the scrambled control sequences as selection stringency increased; computational design considerably increased the probability of binding the target with high affinity. The simplest explanation for this is that a substantial fraction of the proteins fold into the designed structures.
d
c
b
a eHB1 HB2 Bot Screen for functionDeep sequencing
HA
BoNT
Design ID
Bin
din
g en
richm
ent
Interface buried surface area ( 2)
Additionaldesignedcontacts
Frac
tion
Helicalfragments
alone
HHH EHEE HEE EEHE HEEH
Virtual scaffold library
5,311 6,038 5,619
Genetically encode 16,968 mini-proteins
Amplify oligo pools
Transform into yeast
Yeast adaptor
Yeast adaptor
Bot.3 HB2.3 HB1.3
Bot.2HB2.2HB1.2
Bot.1 HB2.1 HB1.1
0.05
0.10
01,000 1,400 1,800
Expressionand binding
Figure 1 | Massively parallel binding protein design. a, Hundreds of 37–43 residue mini-protein backbones with different secondary structure elements, orientations and loop lengths were matched with hotspot binding motifs for HA (HB1 and HB2) and BoNT (Bot) by identifying compatible mini-protein local backbone segments, superimposing them onto the hotspot motif–target complex, and discarding docks with mini-protein/target backbone clashes. Each topology included designs with many different disulfide configurations; several possibilities are illustrated. b, For each non-clashing dock of each scaffold onto each target, the monomer and interaction energies were optimized with Rosetta sequence design. Representative models are shown at the left of each column. Right columns show a top view of the target with the hotspot interaction areas coloured as above and new contact areas generated by Rosetta sequence
design coloured yellow; the total number of unique designs generated is indicated at the bottom. c, Designed contacts substantially increase the interface buried surface area of the designs beyond the starting hotspot residues. d, Genes encoding 16,968 mini-protein designs, including 6,286 controls, were synthesized using DNA oligo pool synthesis (see Methods). e, The oligo pools were recombined into yeast display vectors and transformed into yeast (see Methods), and binding of the designs HA or BoNT at different concentrations was assessed by FACS. For each sorting condition, enriched designs were identified by comparing the frequencies in the original and sorted populations using deep sequencing. These data were used to guide improvement of the computational design model, and the entire design, synthesis and testing cycle was iterated.
© 2017 Macmillan Publishers Limited, part of Springer Nature. All rights reserved.
ArticlereSeArcH
7 6 | N A T U R E | V O L 5 5 0 | 5 O c T O b E R 2 0 1 7
The design population included 3,264 BoNT designs with single disulfides and 3,594 HA designs with multiple disulfides in geometri-cally allowed positions. For both targets, designs containing disulfides had similar success rates to those in which disulfides were absent (26.2% versus 25.5% for BoNT and 0.5% versus 0.8% for HA), consistent with a late and non-instructive role for disulfides in protein folding. However, when the design libraries were treated with trypsin before binding selection, only disulfide-stabilized designs were recovered; although they do not guide protein folding, the disulfides clearly confer stability against proteolysis (Extended Data Table 1).
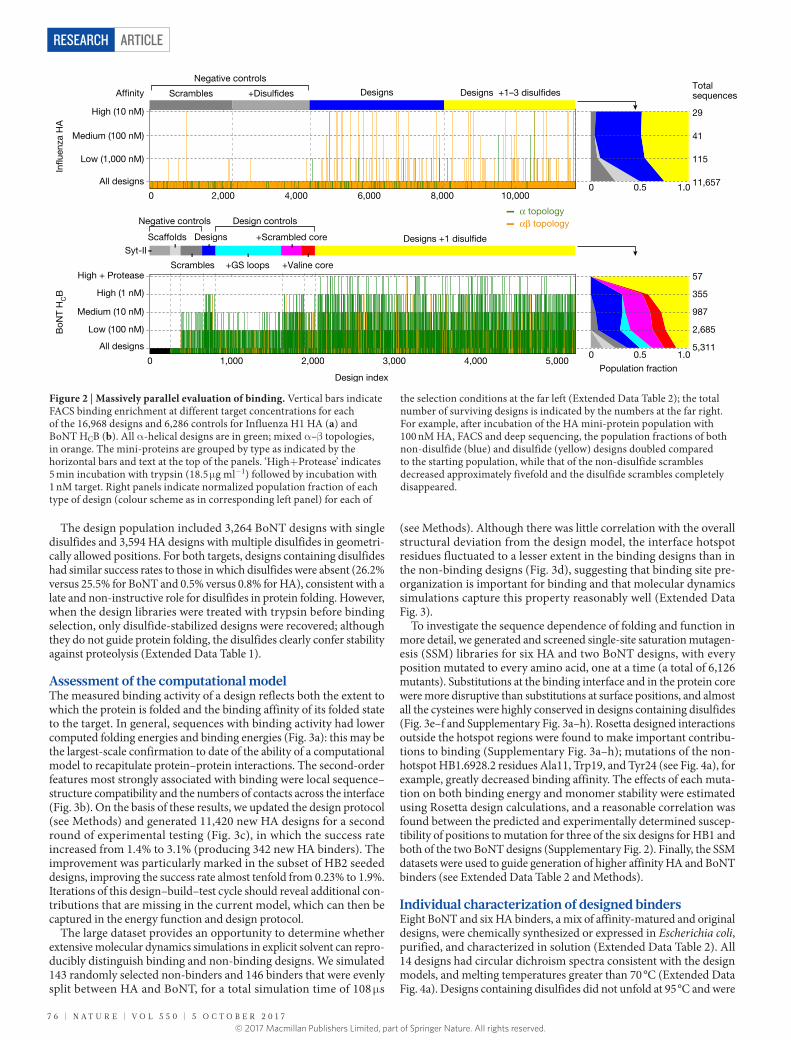
Assessment of the computational modelThe measured binding activity of a design reflects both the extent to which the protein is folded and the binding affinity of its folded state to the target. In general, sequences with binding activity had lower computed folding energies and binding energies (Fig. 3a): this may be the largest-scale confirmation to date of the ability of a computational model to recapitulate protein–protein interactions. The second-order features most strongly associated with binding were local sequence–structure compatibility and the numbers of contacts across the interface (Fig. 3b). On the basis of these results, we updated the design protocol (see Methods) and generated 11,420 new HA designs for a second round of experimental testing (Fig. 3c), in which the success rate increased from 1.4% to 3.1% (producing 342 new HA binders). The improvement was particularly marked in the subset of HB2 seeded designs, improving the success rate almost tenfold from 0.23% to 1.9%. Iterations of this design–build–test cycle should reveal additional con-tributions that are missing in the current model, which can then be captured in the energy function and design protocol.
The large dataset provides an opportunity to determine whether extensive molecular dynamics simulations in explicit solvent can repro-ducibly distinguish binding and non-binding designs. We simulated 143 randomly selected non-binders and 146 binders that were evenly split between HA and BoNT, for a total simulation time of 108 μ s
(see Methods). Although there was little correlation with the overall structural deviation from the design model, the interface hotspot residues fluctuated to a lesser extent in the binding designs than in the non-binding designs (Fig. 3d), suggesting that binding site pre- organization is important for binding and that molecular dynamics simu lations capture this property reasonably well (Extended Data Fig. 3).
To investigate the sequence dependence of folding and function in more detail, we generated and screened single-site saturation mutagen-esis (SSM) libraries for six HA and two BoNT designs, with every position mutated to every amino acid, one at a time (a total of 6,126 mutants). Substitutions at the binding interface and in the protein core were more disruptive than substitutions at surface positions, and almost all the cysteines were highly conserved in designs containing disulfides (Fig. 3e–f and Supplementary Fig. 3a–h). Rosetta designed interactions outside the hotspot regions were found to make important contribu-tions to binding (Supplementary Fig. 3a–h); mutations of the non- hotspot HB1.6928.2 residues Ala11, Trp19, and Tyr24 (see Fig. 4a), for example, greatly decreased binding affinity. The effects of each muta-tion on both binding energy and monomer stability were estimated using Rosetta design calculations, and a reasonable correlation was found between the predicted and experimentally determined suscep-tibility of positions to mutation for three of the six designs for HB1 and both of the two BoNT designs (Supplementary Fig. 2). Finally, the SSM datasets were used to guide generation of higher affinity HA and BoNT binders (see Extended Data Table 2 and Methods).
Individual characterization of designed bindersEight BoNT and six HA binders, a mix of affinity-matured and original designs, were chemically synthesized or expressed in Escherichia coli, purified, and characterized in solution (Extended Data Table 2). All 14 designs had circular dichroism spectra consistent with the design models, and melting temperatures greater than 70 °C (Extended Data Fig. 4a). Designs containing disulfides did not unfold at 95 °C and were
0 2,0001,000 3,000 4,000 5,000
0 2,000 4,000 6,000 8,000 10,000
In�u
enza
HA
BoN
T H
CB
High + Protease
Low (1,000 nM)
Medium (100 nM)
High (10 nM)
115
41
29
Negative controls
Negative controlsTotalsequences
Low (100 nM)
Medium (10 nM)
High (1 nM)
2,685
987
355
57
α topologyαβ topology
All designs 5,311
11,6570 1.00.5
0 1.00.5
Design index
Af�nity Scrambles +Disul�des Designs Designs +1–3 disul�des
Scrambles
Designs +Scrambled core Designs +1 disul�deScaffolds
+GS loops +Valine core
Population fraction
Design controls
All designs
Syt-II
Figure 2 | Massively parallel evaluation of binding. Vertical bars indicate FACS binding enrichment at different target concentrations for each of the 16,968 designs and 6,286 controls for Influenza H1 HA (a) and BoNT HCB (b). All α -helical designs are in green; mixed α –β topologies, in orange. The mini-proteins are grouped by type as indicated by the horizontal bars and text at the top of the panels. ‘High+ Protease’ indicates 5 min incubation with trypsin (18.5 μ g ml−1) followed by incubation with 1 nM target. Right panels indicate normalized population fraction of each type of design (colour scheme as in corresponding left panel) for each of
the selection conditions at the far left (Extended Data Table 2); the total number of surviving designs is indicated by the numbers at the far right. For example, after incubation of the HA mini-protein population with 100 nM HA, FACS and deep sequencing, the population fractions of both non-disulfide (blue) and disulfide (yellow) designs doubled compared to the starting population, while that of the non-disulfide scrambles decreased approximately fivefold and the disulfide scrambles completely disappeared.
© 2017 Macmillan Publishers Limited, part of Springer Nature. All rights reserved.
Article reSeArcH
5 O c T O b E R 2 0 1 7 | V O L 5 5 0 | N A T U R E | 7 7
resistant to trypsin (Extended Data Fig. 5); reduction of the disulfides with the reducing agent tris(2-carboxyethyl)phosphine (TCEP) con-siderably decreased their stability (Extended Data Fig. 4b,c). The BoNT binders bound to HCB with affinities ranging from 1 to 20 nM by biolayer interferometry, and also bound the serotype G of botulinum neurotoxin (BoNT/G) (see Methods and Supplementary Fig. 4). The HA binders bound to HA proteins from two H1N1 influenza strains, PR8 and A/California/04/2009 (CA09); the three affinity- matured binders had affinities against CA09 below 10 nM (Extended Data Table 2). We succeeded in solving crystal structures of both HA and BoNT HCB binders (HB1.6928.2.3 and Bot.671.2.1, respec-tively) in complex with their targets. In both cases the complexes were in excellent agreement with the computational design models (monomer-Cα root-mean-square deviation (r.m.s.d.) = 0.94 Å for HB1.6928.2.3, and 0.82 Å for Bot.671.2.1, see Fig. 4a–b, Extended Data Fig. 6 and Supplementary Tables 1 and 2).
To compare the ability of the designs to survive high temperature exposure with that of antibodies, we incubated HB1.6928.2.3,
Bot.671.2.1, and the haemagglutinin-targeting antibody mAb FI6v3 at 80 °C for various times before performing binding assays to their respective targets. The mini-protein binders showed no detectable loss of binding after 1 hour at high temperature, while FI6v3 binding activity was reduced by approximately 74% (Fig. 4c). These results sug-gest that therapeutics relying on small designed proteins could bypass the requirement for cold chain management for monoclonal antibodies.
In vitro assays were carried out for BoNT and influenza. HB1.6928.2.3, an affinity-matured, disulfide-containing design, strongly neutra-lized PR8 and CA09 influenza viruses after 48 hours in culture, with a half-maximal effective concentration (EC50) value for Cal09 (CA09) more than 100-fold lower than the broadly neutralizing antibody FI6v318, or the previously designed HB36.614, on the basis of mass (Fig. 4d; the EC50 is similar to the antibody on a molar basis). Paralleling this, Bot.671.2 protected rat cortical neurons against the entry of the BoNT/B toxin and against cleavage of the vesicle-associated membrane protein 2 (VAMP2; the intracellular target of BoNT/B) (Fig. 4e) at lower concentrations than Syt-II (the BoNT/B receptor), which con-tains the same hotspot residues (Extended Data Fig. 7). The increase in protection is likely to reflect both the reduction in conformational entropy of the binding motif and the additional designed interface contacts.
HB1.6928.2.3 protected mice from influenza both pre- and post- exposure. Intranasal administration of HB1.6928.2.3 twenty-four hours before lethal challenge with CA09 influenza resulted in 100% survival
Exp
erim
enta
l SS
M
Exp
erim
enta
l SS
M
–2 0 –2 0
–2
0
Binding energy
HB1 HB21.0 2.0 3.0 4.0 5.0
0
10
20Binding designsNon-binding designs
Average hotspot r.m.s.d. (Å)
Num
ber
of d
esig
ns
Mean per-positionchange in binding
Mean per-positionchange in binding
dc
BoN
TM
onom
er e
nerg
yH
AM
onom
er e
nerg
y
40
0.4
0
0.2
0.04
0
0.35
190 250Side-chain probability Interface atom count
4 10
10
0
0.2
0
0.04
60 140
0.01
0.03
0
0.1
a b Designs only
Suc
cess
rat
eS
ucce
ss r
ate
Non-bindersBinders
e f
0
–2
–4
0
–2
–4
0–2–4
0–2–4
BoN
TP
rob
abili
ty d
ensi
tyH
AP
rob
abili
ty d
ensi
ty
Computed (Rosetta) SSM
Computed (Rosetta) SSM
0
–1
1
0.02
All sequences
BindersNon-binders
0.05
100
8
90
252
AUC = 0.77
Generation 1Generation 2
0
Suc
cess
rat
e
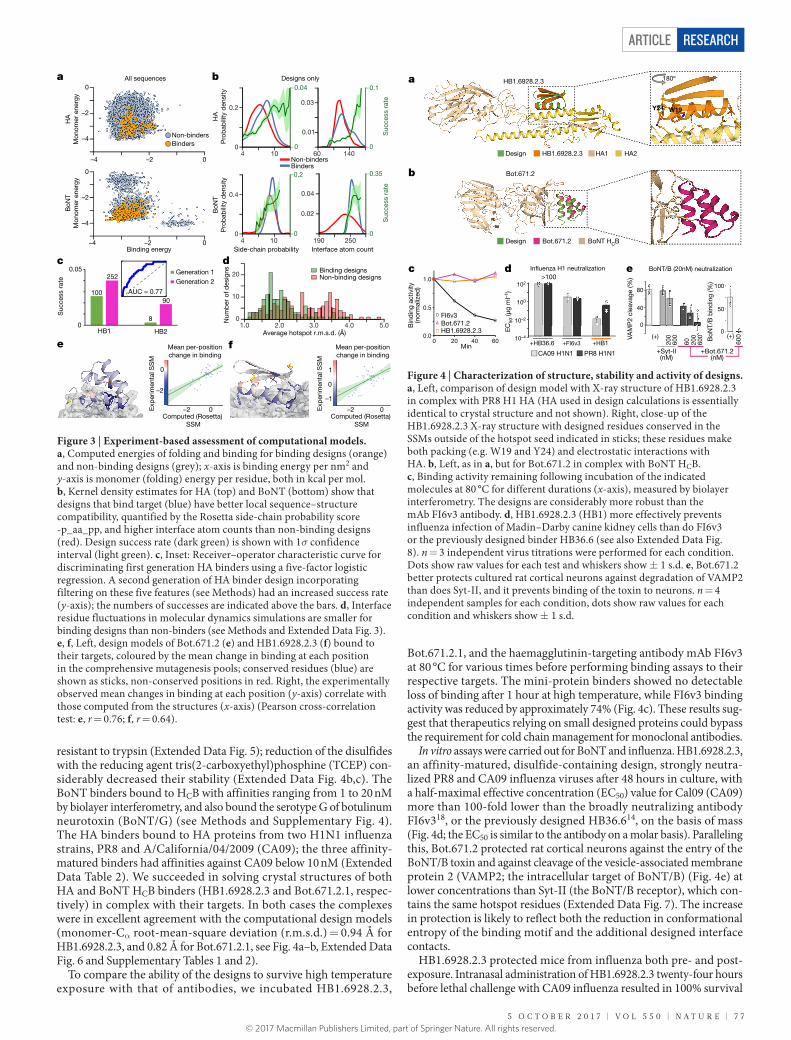
Figure 3 | Experiment-based assessment of computational models. a, Computed energies of folding and binding for binding designs (orange) and non-binding designs (grey); x-axis is binding energy per nm2 and y-axis is monomer (folding) energy per residue, both in kcal per mol. b, Kernel density estimates for HA (top) and BoNT (bottom) show that designs that bind target (blue) have better local sequence–structure compatibility, quantified by the Rosetta side-chain probability score -p_aa_pp, and higher interface atom counts than non-binding designs (red). Design success rate (dark green) is shown with 1σ confidence interval (light green). c, Inset: Receiver–operator characteristic curve for discriminating first generation HA binders using a five-factor logistic regression. A second generation of HA binder design incorporating filtering on these five features (see Methods) had an increased success rate (y-axis); the numbers of successes are indicated above the bars. d, Interface residue fluctuations in molecular dynamics simulations are smaller for binding designs than non-binders (see Methods and Extended Data Fig. 3). e, f, Left, design models of Bot.671.2 (e) and HB1.6928.2.3 (f) bound to their targets, coloured by the mean change in binding at each position in the comprehensive mutagenesis pools; conserved residues (blue) are shown as sticks, non-conserved positions in red. Right, the experimentally observed mean changes in binding at each position (y-axis) correlate with those computed from the structures (x-axis) (Pearson cross-correlation test: e, r = 0.76; f, r = 0.64).
Bot.671.2b
HB1.6928.2.3a
c BoNT/B (20nM) neutralizationIn�uenza H1 neutralization
180º
d e
W19Y24
Design HB1.6928.2.3 HA1 HA2
Design Bot.671.2 BoNT HCB
0 20 40Min
60
Bin
din
g ac
tivity
(nor
mal
ized
)
HB1.6928.2.3
FI6v3Bot.671.2
0
50
100
+Bot.671.2(nM)
+Syt-II(nM)
(+)
200
600
60 200
600 (+)
600BoN
T/B
bin
din
g (%
)
VAM
P2
clea
vage
(%)
0
40
80
CA09 H1N1 PR8 H1N1
+HB36.6 +FI6v3 +HB1
>100
EC
50 (µ
g m
l–1)
100
102
10–2
10–4
0.5
1.0
0.0
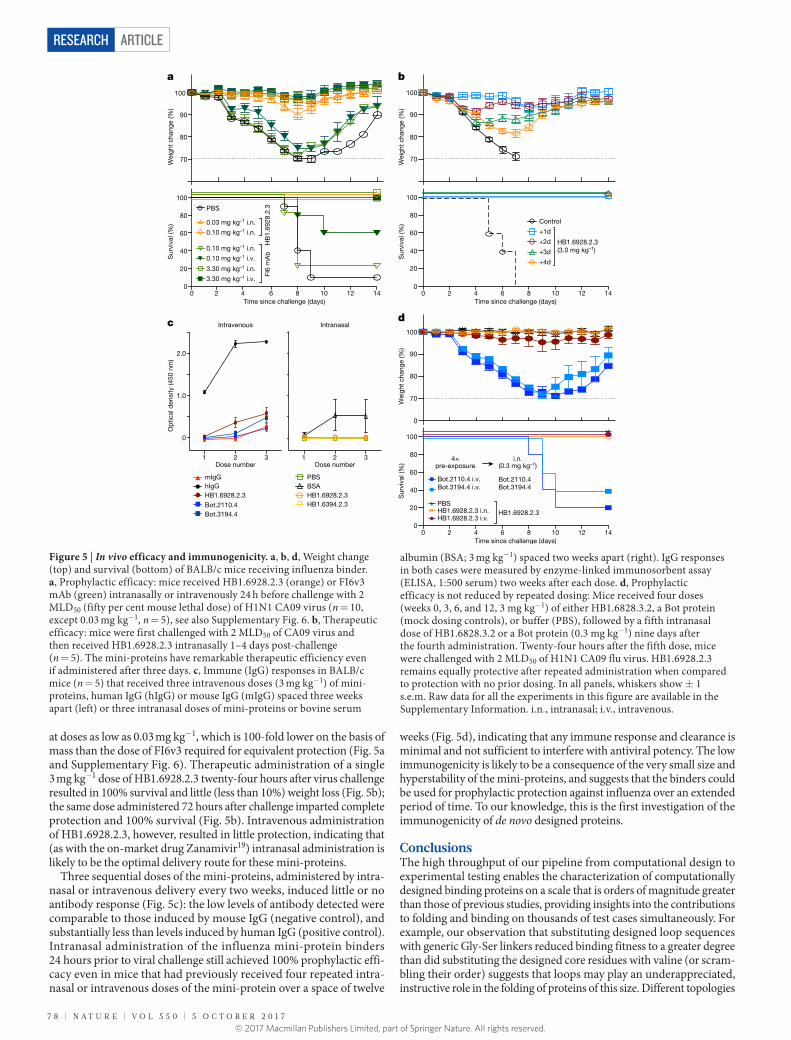
Figure 4 | Characterization of structure, stability and activity of designs. a, Left, comparison of design model with X-ray structure of HB1.6928.2.3 in complex with PR8 H1 HA (HA used in design calculations is essentially identical to crystal structure and not shown). Right, close-up of the HB1.6928.2.3 X-ray structure with designed residues conserved in the SSMs outside of the hotspot seed indicated in sticks; these residues make both packing (e.g. W19 and Y24) and electrostatic interactions with HA. b, Left, as in a, but for Bot.671.2 in complex with BoNT HCB. c, Binding activity remaining following incubation of the indicated molecules at 80 °C for different durations (x-axis), measured by biolayer interferometry. The designs are considerably more robust than the mAb FI6v3 antibody. d, HB1.6928.2.3 (HB1) more effectively prevents influenza infection of Madin–Darby canine kidney cells than do FI6v3 or the previously designed binder HB36.6 (see also Extended Data Fig. 8). n = 3 independent virus titrations were performed for each condition. Dots show raw values for each test and whiskers show ± 1 s.d. e, Bot.671.2 better protects cultured rat cortical neurons against degradation of VAMP2 than does Syt-II, and it prevents binding of the toxin to neurons. n = 4 independent samples for each condition, dots show raw values for each condition and whiskers show ± 1 s.d.
© 2017 Macmillan Publishers Limited, part of Springer Nature. All rights reserved.
ArticlereSeArcH
7 8 | N A T U R E | V O L 5 5 0 | 5 O c T O b E R 2 0 1 7
at doses as low as 0.03 mg kg−1, which is 100-fold lower on the basis of mass than the dose of FI6v3 required for equivalent protection (Fig. 5a and Supplementary Fig. 6). Therapeutic administration of a single 3 mg kg−1 dose of HB1.6928.2.3 twenty-four hours after virus challenge resulted in 100% survival and little (less than 10%) weight loss (Fig. 5b); the same dose administered 72 hours after challenge imparted complete protection and 100% survival (Fig. 5b). Intravenous administration of HB1.6928.2.3, however, resulted in little protection, indicating that (as with the on-market drug Zanamivir19) intranasal administration is likely to be the optimal delivery route for these mini-proteins.
Three sequential doses of the mini-proteins, administered by intra-nasal or intravenous delivery every two weeks, induced little or no antibody response (Fig. 5c): the low levels of antibody detected were comparable to those induced by mouse IgG (negative control), and substantially less than levels induced by human IgG (positive control). Intranasal administration of the influenza mini-protein binders 24 hours prior to viral challenge still achieved 100% prophylactic effi-cacy even in mice that had previously received four repeated intra-nasal or intravenous doses of the mini-protein over a space of twelve
weeks (Fig. 5d), indicating that any immune response and clearance is minimal and not sufficient to interfere with antiviral potency. The low immunogenicity is likely to be a consequence of the very small size and hyperstability of the mini-proteins, and suggests that the binders could be used for prophylactic protection against influenza over an extended period of time. To our knowledge, this is the first investigation of the immunogenicity of de novo designed proteins.
ConclusionsThe high throughput of our pipeline from computational design to experimental testing enables the characterization of computationally designed binding proteins on a scale that is orders of magnitude greater than those of previous studies, providing insights into the contributions to folding and binding on thousands of test cases simultaneously. For example, our observation that substituting designed loop sequences with generic Gly-Ser linkers reduced binding fitness to a greater degree than did substituting the designed core residues with valine (or scram-bling their order) suggests that loops may play an underappreciated, instructive role in the folding of proteins of this size. Different topologies
Wei
ght
chan
ge (%
)70
80
90
100
0
0
20
40
60
80
100
Sur
viva
l (%
)
HB1.6928.2.3 i.v.HB1.6928.2.3 i.n.PBS
HB1.6928.2.3
4×pre-exposure
i.n.(0.3 mg kg–1)
Bot.3194.4 i.v. Bot.3194.4Bot.2110.4 i.v. Bot.2110.4
a
c
b
Time since challenge (days)
Time since challenge (days)
70
80
90
100
0
20
40
60
80
100
+4d
+3d
+2d
+1d
Control
HB1.6928.2.3(3.0 mg kg–1)
Time since challenge (days)
Wei
ght
chan
ge (%
)
70
80
90
100
0 2 4 6 8 10 12 14 0 2 4 6 8 10 12 14
0 2 4 6 8 10 12 14
0
20
40
60
80
100
PBS
Sur
viva
l (%
)
Wei
ght
chan
ge (%
)S
urvi
val (
%)
dIntravenous Intranasal
Dose number
0
1.0
2.0
Op
tical
den
sity
(450
nm
)
1 2 3Dose number
1 2 3
PBSBSAHB1.6928.2.3HB1.6394.2.3
hIgGmIgG
Bot.2110.4Bot.3194.4
HB1.6928.2.3
0.10 mg kg–1 i.n.
0.03 mg kg–1 i.n.
HB
1.69
28.2
.3
0.10 mg kg–1 i.n.
0.10 mg kg–1 i.v.
3.30 mg kg–1 i.n.
3.30 mg kg–1 i.v.
FI6
mA
b
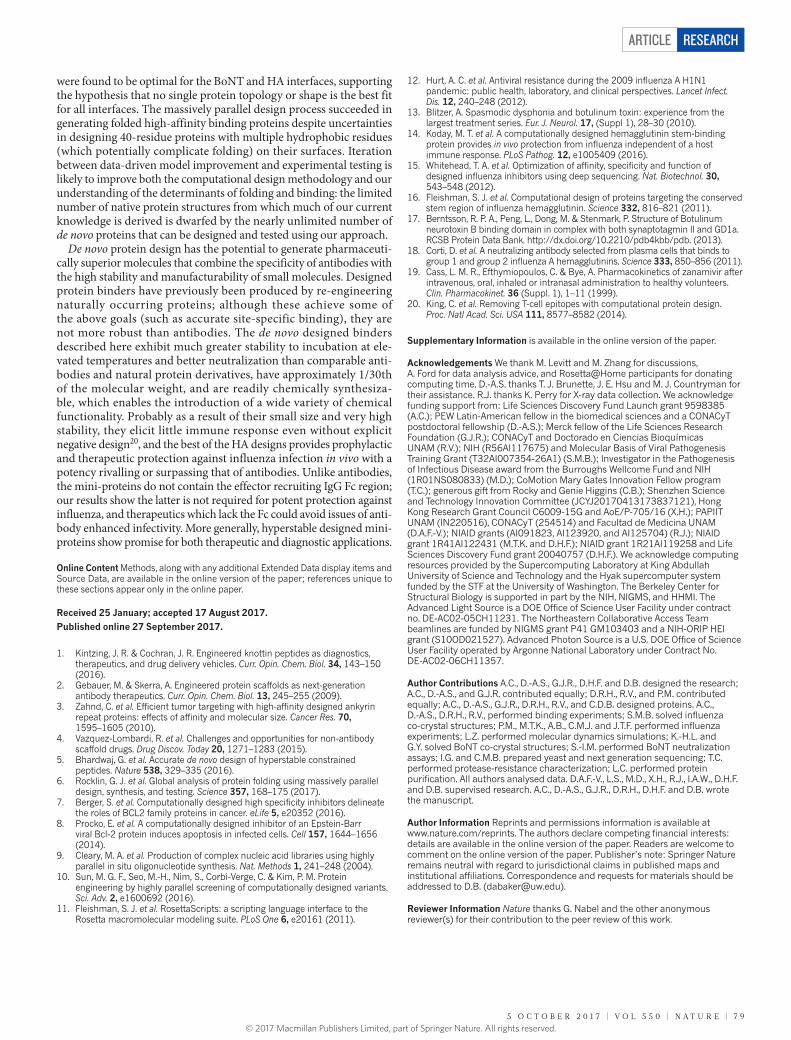
Figure 5 | In vivo efficacy and immunogenicity. a, b, d, Weight change (top) and survival (bottom) of BALB/c mice receiving influenza binder. a, Prophylactic efficacy: mice received HB1.6928.2.3 (orange) or FI6v3 mAb (green) intranasally or intravenously 24 h before challenge with 2 MLD50 (fifty per cent mouse lethal dose) of H1N1 CA09 virus (n = 10, except 0.03 mg kg−1, n = 5), see also Supplementary Fig. 6. b, Therapeutic efficacy: mice were first challenged with 2 MLD50 of CA09 virus and then received HB1.6928.2.3 intranasally 1–4 days post-challenge (n = 5). The mini-proteins have remarkable therapeutic efficiency even if administered after three days. c, Immune (IgG) responses in BALB/c mice (n = 5) that received three intravenous doses (3 mg kg−1) of mini-proteins, human IgG (hIgG) or mouse IgG (mIgG) spaced three weeks apart (left) or three intranasal doses of mini-proteins or bovine serum
albumin (BSA; 3 mg kg−1) spaced two weeks apart (right). IgG responses in both cases were measured by enzyme-linked immunosorbent assay (ELISA, 1:500 serum) two weeks after each dose. d, Prophylactic efficacy is not reduced by repeated dosing: Mice received four doses (weeks 0, 3, 6, and 12, 3 mg kg−1) of either HB1.6828.3.2, a Bot protein (mock dosing controls), or buffer (PBS), followed by a fifth intranasal dose of HB1.6828.3.2 or a Bot protein (0.3 mg kg−1) nine days after the fourth administration. Twenty-four hours after the fifth dose, mice were challenged with 2 MLD50 of H1N1 CA09 flu virus. HB1.6928.2.3 remains equally protective after repeated administration when compared to protection with no prior dosing. In all panels, whiskers show ± 1 s.e.m. Raw data for all the experiments in this figure are available in the Supplementary Information. i.n., intranasal; i.v., intravenous.
© 2017 Macmillan Publishers Limited, part of Springer Nature. All rights reserved.
Article reSeArcH
5 O c T O b E R 2 0 1 7 | V O L 5 5 0 | N A T U R E | 7 9
were found to be optimal for the BoNT and HA interfaces, supporting the hypothesis that no single protein topology or shape is the best fit for all interfaces. The massively parallel design process succeeded in generating folded high-affinity binding proteins despite uncertainties in designing 40-residue proteins with multiple hydrophobic residues (which potentially complicate folding) on their surfaces. Iteration between data-driven model improvement and experimental testing is likely to improve both the computational design methodology and our understanding of the determinants of folding and binding: the limited number of native protein structures from which much of our current knowledge is derived is dwarfed by the nearly unlimited number of de novo proteins that can be designed and tested using our approach.
De novo protein design has the potential to generate pharmaceuti-cally superior molecules that combine the specificity of antibodies with the high stability and manufacturability of small molecules. Designed protein binders have previously been produced by re- engineering naturally occurring proteins; although these achieve some of the above goals (such as accurate site-specific binding), they are not more robust than antibodies. The de novo designed binders described here exhibit much greater stability to incubation at ele-vated temperatures and better neutralization than comparable anti-bodies and natural protein derivatives, have approxi mately 1/30th of the molecular weight, and are readily chemically synthesiza-ble, which enables the introduction of a wide variety of chemical functionality. Probably as a result of their small size and very high stability, they elicit little immune response even without explicit negative design20, and the best of the HA designs provides prophylactic and therapeutic protection against influenza infection in vivo with a potency rivalling or surpassing that of antibodies. Unlike antibodies, the mini-proteins do not contain the effector recruiting IgG Fc region; our results show the latter is not required for potent protection against influenza, and therapeutics which lack the Fc could avoid issues of anti-body enhanced infectivity. More generally, hyperstable designed mini- proteins show promise for both therapeutic and diagnostic applications.
Online Content Methods, along with any additional Extended Data display items and Source Data, are available in the online version of the paper; references unique to these sections appear only in the online paper.
received 25 January; accepted 17 August 2017.
Published online 27 September 2017.
1. Kintzing, J. R. & Cochran, J. R. Engineered knottin peptides as diagnostics, therapeutics, and drug delivery vehicles. Curr. Opin. Chem. Biol. 34, 143–150 (2016).
2. Gebauer, M. & Skerra, A. Engineered protein scaffolds as next-generation antibody therapeutics. Curr. Opin. Chem. Biol. 13, 245–255 (2009).
3. Zahnd, C. et al. Efficient tumor targeting with high-affinity designed ankyrin repeat proteins: effects of affinity and molecular size. Cancer Res. 70, 1595–1605 (2010).
4. Vazquez-Lombardi, R. et al. Challenges and opportunities for non-antibody scaffold drugs. Drug Discov. Today 20, 1271–1283 (2015).
5. Bhardwaj, G. et al. Accurate de novo design of hyperstable constrained peptides. Nature 538, 329–335 (2016).
6. Rocklin, G. J. et al. Global analysis of protein folding using massively parallel design, synthesis, and testing. Science 357, 168–175 (2017).
7. Berger, S. et al. Computationally designed high specificity inhibitors delineate the roles of BCL2 family proteins in cancer. eLife 5, e20352 (2016).
8. Procko, E. et al. A computationally designed inhibitor of an Epstein-Barr viral Bcl-2 protein induces apoptosis in infected cells. Cell 157, 1644–1656 (2014).
9. Cleary, M. A. et al. Production of complex nucleic acid libraries using highly parallel in situ oligonucleotide synthesis. Nat. Methods 1, 241–248 (2004).
10. Sun, M. G. F., Seo, M.-H., Nim, S., Corbi-Verge, C. & Kim, P. M. Protein engineering by highly parallel screening of computationally designed variants. Sci. Adv. 2, e1600692 (2016).
11. Fleishman, S. J. et al. RosettaScripts: a scripting language interface to the Rosetta macromolecular modeling suite. PLoS One 6, e20161 (2011).
Supplementary Information is available in the online version of the paper.
Acknowledgements We thank M. Levitt and M. Zhang for discussions, A. Ford for data analysis advice, and Rosetta@Home participants for donating computing time. D.-A.S. thanks T. J. Brunette, J. E. Hsu and M. J. Countryman for their assistance. R.J. thanks K. Perry for X-ray data collection. We acknowledge funding support from: Life Sciences Discovery Fund Launch grant 9598385 (A.C.); PEW Latin-American fellow in the biomedical sciences and a CONACyT postdoctoral fellowship (D.-A.S.); Merck fellow of the Life Sciences Research Foundation (G.J.R.); CONACyT and Doctorado en Ciencias Bioquímicas UNAM (R.V.); NIH (R56AI117675) and Molecular Basis of Viral Pathogenesis Training Grant (T32AI007354-26A1) (S.M.B.); Investigator in the Pathogenesis of Infectious Disease award from the Burroughs Wellcome Fund and NIH (1R01NS080833) (M.D.); CoMotion Mary Gates Innovation Fellow program (T.C.); generous gift from Rocky and Genie Higgins (C.B.); Shenzhen Science and Technology Innovation Committee (JCYJ20170413173837121), Hong Kong Research Grant Council C6009-15G and AoE/P-705/16 (X.H.); PAPIIT UNAM (IN220516), CONACyT (254514) and Facultad de Medicina UNAM (D.A.F.-V.); NIAID grants (AI091823, AI123920, and AI125704) (R.J.); NIAID grant 1R41AI122431 (M.T.K. and D.H.F.); NIAID grant 1R21AI119258 and Life Sciences Discovery Fund grant 20040757 (D.H.F.). We acknowledge computing resources provided by the Supercomputing Laboratory at King Abdullah University of Science and Technology and the Hyak supercomputer system funded by the STF at the University of Washington. The Berkeley Center for Structural Biology is supported in part by the NIH, NIGMS, and HHMI. The Advanced Light Source is a DOE Office of Science User Facility under contract no. DE-AC02-05CH11231. The Northeastern Collaborative Access Team beamlines are funded by NIGMS grant P41 GM103403 and a NIH-ORIP HEI grant (S10OD021527). Advanced Photon Source is a U.S. DOE Office of Science User Facility operated by Argonne National Laboratory under Contract No. DE-AC02-06CH11357.
Author Contributions A.C., D.-A.S., G.J.R., D.H.F. and D.B. designed the research; A.C., D.-A.S., and G.J.R. contributed equally; D.R.H., R.V., and P.M. contributed equally; A.C., D.-A.S., G.J.R., D.R.H., R.V., and C.D.B. designed proteins. A.C., D.-A.S., D.R.H., R.V., performed binding experiments; S.M.B. solved influenza co-crystal structures; P.M., M.T.K., A.B., C.M.J. and J.T.F. performed influenza experiments; L.Z. performed molecular dynamics simulations; K.-H.L. and G.Y. solved BoNT co-crystal structures; S.-I.M. performed BoNT neutralization assays; I.G. and C.M.B. prepared yeast and next generation sequencing; T.C. performed protease-resistance characterization; L.C. performed protein purification. All authors analysed data. D.A.F.-V., L.S., M.D., X.H., R.J., I.A.W., D.H.F. and D.B. supervised research. A.C., D.-A.S., G.J.R., D.R.H., D.H.F. and D.B. wrote the manuscript.
Author Information Reprints and permissions information is available at www.nature.com/reprints. The authors declare competing financial interests: details are available in the online version of the paper. Readers are welcome to comment on the online version of the paper. Publisher’s note: Springer Nature remains neutral with regard to jurisdictional claims in published maps and institutional affiliations. Correspondence and requests for materials should be addressed to D.B. ([email protected]).
reviewer Information Nature thanks G. Nabel and the other anonymous reviewer(s) for their contribution to the peer review of this work.
12. Hurt, A. C. et al. Antiviral resistance during the 2009 influenza A H1N1 pandemic: public health, laboratory, and clinical perspectives. Lancet Infect. Dis. 12, 240–248 (2012).
13. Blitzer, A. Spasmodic dysphonia and botulinum toxin: experience from the largest treatment series. Eur. J. Neurol. 17, (Suppl 1), 28–30 (2010).
14. Koday, M. T. et al. A computationally designed hemagglutinin stem-binding protein provides in vivo protection from influenza independent of a host immune response. PLoS Pathog. 12, e1005409 (2016).
15. Whitehead, T. A. et al. Optimization of affinity, specificity and function of designed influenza inhibitors using deep sequencing. Nat. Biotechnol. 30, 543–548 (2012).
16. Fleishman, S. J. et al. Computational design of proteins targeting the conserved stem region of influenza hemagglutinin. Science 332, 816–821 (2011).
17. Berntsson, R. P. A., Peng, L., Dong, M. & Stenmark, P. Structure of Botulinum neurotoxin B binding domain in complex with both synaptotagmin II and GD1a. RCSB Protein Data Bank. http://dx.doi.org/10.2210/pdb4kbb/pdb. (2013).
18. Corti, D. et al. A neutralizing antibody selected from plasma cells that binds to group 1 and group 2 influenza A hemagglutinins. Science 333, 850–856 (2011).
19. Cass, L. M. R., Efthymiopoulos, C. & Bye, A. Pharmacokinetics of zanamivir after intravenous, oral, inhaled or intranasal administration to healthy volunteers. Clin. Pharmacokinet. 36 (Suppl. 1), 1–11 (1999).
20. King, C. et al. Removing T-cell epitopes with computational protein design. Proc. Natl Acad. Sci. USA 111, 8577–8582 (2014).
© 2017 Macmillan Publishers Limited, part of Springer Nature. All rights reserved.
ArticlereSeArcH
MethOdSUnless stated otherwise, the experiments were not randomized and the investiga-tors were not blinded to allocation during experiments and outcome assessment.Mini-protein binders design. Mini-protein design began by defining a variety of mixed α –β and α -only scaffold topologies using the RosettaRemodel ‘blueprint’ format21 with the requirement of at least one 10–14-residue helix. The blueprints were used to generate backbones using the Rosetta Monte Carlo-based fragment assembly protocol22,23. Between one and three disulfides were added to a subset of these backbones at geometrically allowed positions. Sequence design was performed using the FastDesign protocol with layer control active, alternating between side-chain rotamer optimization and gradient-descent-based energy minimization. For each topology, over 10,000 structures were generated and filtered on overall energy per residue and score terms related to backbone quality, compactness and disulfide quality (see Supplementary Appendix).
To match the mini-protein scaffolds with the desired target helix-binding motifs, we used the Rosetta MotifGraft Mover7,24. The inputs were composed of: (1) HB36, HB80 or Syt-II helical binding motifs (Protein Databank (PDB) IDs: 3R2X, 4EEF and 2NM1, respectively); (2) the context target protein (influenza HA or BoNT HCB); and (3) the above described library of de novo mini-protein scaffolds. Matching parameters were set to perform full backbone alignment of the input motif, with a maximum backbone r.m.s.d. = 1 Å, endpoints r.m.s.d. = 1 Å, clash_score_cutoff = 5 and enabling revert_graft_to_native_sequence. In the case of BoNT/B’s Syt-II binding domain, the hotspots were defined as: Met1, Phe2, Leu5, Lys6, Lys8, Phe9, Phe10, Glu12, Ile13 (see Extended Data Fig. 1). For the influenza HA HB80.4 (HB1) binding domain, the hotspots were defined as: Phe1, Ile5, Ile9, Phe13. For the influenza HA HB36.6 (HB2) binding domain, the hotspots were defined as: Phe1, Met5, Trp9, Phe13. Following MotifGraft, we performed Rosetta’s sequence repack of interface neighbouring residues (except hotspots), Cartesian minimization and filtering using the scoring function Talaris2013 or Talaris2014.
After the first round of HA design and testing, the Kolmogorov–Smirnov two-sample test was used to determine P values for the null hypothesis that the computational metrics of the binding versus non-binding designs were drawn from the same underlying distribution. Using the metrics that correlated strongly with success (such as those shown Fig. 3b), a second round of HA design was performed which incorporated more stringent filtering on a broader range of metrics. The metrics used to select the first round of HA designs were delta G of binding (ddg filter), shape complementarity (sc), and interface buried surface area (SASA). The additional metrics used to select the second generation HA designs and shown to be highly predictive of round one success in the logistic regression model (Fig. 3c inset) were average degree (degree), side-chain probability given phi-psi (p_aa_pp), per cent core by side-chain neighbours, phi-psi probability given side-chain (rama) and more stringent shape complementarity. Design models are available online (https://zenodo.org, http://dx.doi.org/10.5281/zenodo.838815).Software analysis. All amino acid sequences were reverse translated and codon optimized for yeast using DNAworks 2.025. Sequence identity calculations were performed with a subset of designs using PRALINE26 after PSI-BLAST global alignment. Sequencing pairing after Illumina deep sequencing was performed using PEAR27. Plots and visualizations were created using Seaborn statistical visualization tools28, Python (Python Software Foundation) and Python’s scikit-learn (INRIA).Gene pools. Oligo library pools ordered from either CustomArray or Agilent with all genes 3′ and 5′ flanked with common 20-bp adaptor segments to allow amplification. We obtained conventional oligonucleotides (PCR primers and sequencing primers) from Integrated DNA Technologies. The raw oligonucleotide pools were amplified with Kapa HiFi Hotstart Ready Mix (Kapa Biosystems) using extension primers to add pETCON yeast homologous recombination segments (40 bp) to each end. All amplifications were performed using real-time PCR on a MiniOpticon (Bio-Rad) for between 9 and 20 cycles. Quantitative PCR ampli-fication was critical as over-amplification of gene pools resulted in low transfor-mation efficiency. Amplified pools were size-selected on a 2% agarose gel and cleaned (Qiagen QIAquick Gel Extraction Kit). A second round of quantitative PCR amplification was performed with the same primers on the size-selected pools to generate 2–4μ g of DNA. Yeast EBY100 cells were transformed with library DNA and linearized pETCON plasmid29 using an established protocol30. After transfor-mation (minimum 1 × 10⁷ transformants), cells were grown overnight in SDCAA medium in 30-ml cultures at 30 °C, passaged once, and stored in 20 mM HEPES 150 mM NaCl pH 7.5, 20% (w/v) glycerol in 1 × 10⁷-cell aliquots at − 80 °C.Yeast display and deep sequencing. Cell aliquots were thawed on ice, centrifuged at 13,000 r.p.m. for 30 s, resuspended in 1 × 10⁷ cells per ml of C-Trp-Ura medium and grown at 30 °C for 16 h. Cells were then centrifuged at 13,000 r.p.m. for 1 min and resuspended at 1 × 10⁷ cells per ml SGCAA medium and induced at 30 °C for
16–24 h. Cells were labelled with either biotinylated BoNT HCB, PR8 haemag-glutinin, or CA09 haemagglutinin, washed, secondarily labelled with streptavidin– phycoerythrin (SAPE, Invitrogen) and anti-c-Myc fluorescein isothiocyanate (FITC, Miltenyi Biotech), and sorted by fluorescent gates under various stringency conditions using a Sony SH800. HA target proteins were produced as previously described16. Cells were recovered overnight at 2.5 × 10⁵ collected cells per ml SDCAA medium, whereupon at least 1 × 10⁷ cells were spun down at 13,000 r.p.m. for 1 min and stored as cell pellets at − 80 °C before library preparation for deep sequencing. Between 1 × 10⁷ and 4 × 10⁷ yeast cells were barcoded and prepared for deep sequencing for each library as previously described15. Enhanced score files including all sequences ordered, computational metrics, and enrichments are available online (https://zenodo.org, http://dx.doi.org/10.5281/zenodo.838815).SSM and affinity maturation. SSM libraries for eight designs (Supplementary Figs 2 and 3a–h) were constructed from Agilent gene pools, and yeast display selections performed as described above, using target protein concentrations of 1,000 nM, 100 nM, 10 nM and 1 nM for HA, and 100 nM, 10 nM, 1 nM, 1nM + (trypsin at 18.5 μg ml−1) for BoNT HCB. Upon deep sequencing, the five most beneficial mutations at nine positions in each of the HA designs predicted to result in higher affinity were combined into high-diversity libraries (< 1 × 10⁷) using wobble bases as guided by SwiftLib31. A DNA library for each design was constructed from assembly PCR using Ultramer oligonucleotides (Integrated DNA Technology) to encode the variable region. Primers and sequences are listed in Supplementary Table 3. These libraries went through three increasing stringency sorts: rd1 100 nM, rd2 10 nM, and rd3 1 nM against CA09. Promising constructs were identified through Sanger sequencing of a subset of the final rd3 pool. Versions of the BoNT designs were directly generated from SSMs by incorporating the best beneficial mutations to create high-affinity variants; no selections were used.Mini-protein expression and peptide synthesis. Genes encoding the designed protein sequences were synthesized and cloned into pET-28b(+ ) E. coli plasmid expression vectors (GenScript, N-terminal 6 × His tag and thrombin cleavage site). Plasmids were then transformed into chemically competent E. coli Lemo21 cells (NEB). Protein expression was then induced with 1 mM of isopropyl β -d- thiogalactopyranoside (IPTG) at 18 °C. After overnight expression, cells were collected and purified by nickel affinity followed by size-exclusion fast pro-tein liquid chromatography (Superdex 75 10/300 GL, GE Healthcare) and mass spectrum verification of the molecular weight of the species in solution (Thermo Scientific). Peptide sequences were synthesized from commercial vendors Biomatik or CS Bio in 50 mg quantities with 70% purity requirements. Sequences containing cysteines underwent standard natural oxidation performed by vendor.Circular dichroism. Far-ultraviolet circular dichroism measurements were carried out with an AVIV spectrometer model 420 in PBS buffer (pH 7.4) in a 1 mm path-length cuvette with protein concentration of approximately 0.25 mg ml−1 (unless otherwise mentioned in the text). Temperature melts were from 25 to 95 °C and monitored absorption signal at 222 nm (steps of 2 °C per min, 30 s of equilibration by step). Wavelength scans (195–260 nm) were collected at 25 °C and 95 °C, and again at 25 °C after fast refolding (roughly 5 min). Four chemically synthesized, disulphide-containing mini-proteins (see Extended Data Fig. 4b) were also characterized at a concentration of approximately 0.2 mg ml−1 in the absence or presence of 2.5 mM of the reducing agent TCEP5.Biolayer Interferometry. Binding data were collected in an Octet RED96 (ForteBio) and processed using the instrument’s integrated software using a 1:1 binding model. For BotNT/B binding proteins, the target BoNT heavy chain protein domains (HCB or HCG) were covalently linked to amine-reactive sensors (ARG2, ForteBio) at 5 μ g ml−1 in acetate buffer for 300 s, while the binding proteins to assay were diluted from a concentrated stock into binding buffer (10 mM HEPES, pH 7.4, 150 mM NaCl, 3 mM EDTA, 0.05% surfactant P20, 0.5% non-fat dry milk). For influenza binding proteins, streptavidin-coated biosensors were dipped in wells containing biotinylated HA proteins (100 nM) in binding buffer for immobilization for 300 s, while the binding proteins to assay were diluted from a concentrated stock into binding buffer (1 × phosphate buffered saline (PBS) pH 7.4, 0.01% BSA, 0.002% Tween 20). After baseline measurement in binding buffer alone, the binding kinetics were monitored by dipping the biosensors in wells containing defined concentrations of the designed protein (association) and then dipping the sensors back into baseline wells (dissociation). For heat-time courses, the proteins were incubated for defined times at a concentration of 160 nM in PBS buffer (150 nM NaCl, pH = 7.4) and then diluted to 8 nM in the final buffer and assayed as described above.BoNT/B (HCB) co-crystal structures. HCB was expressed and purified as pre-viously described32. For X-ray crystallography, the HCB-Bot.671.2 complex was prepared by mixing HCB with the binder at a molar ratio of 1:1.5 and the complex was further purified by a Superdex 200 SEC (GE Healthcare) in a buffer containing 150 mM NaCl, 10 mM Hepes pH 7.0, 1 mM TCEP. Initial crystallization screens
© 2017 Macmillan Publishers Limited, part of Springer Nature. All rights reserved.
Article reSeArcH
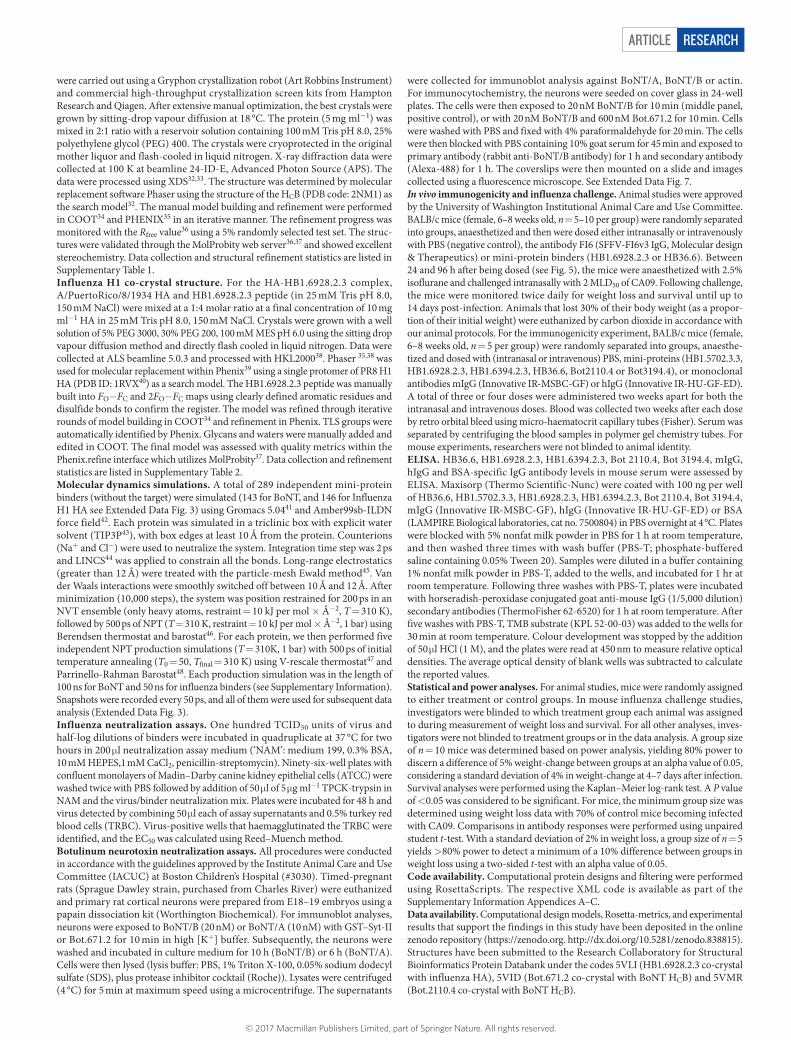
were carried out using a Gryphon crystallization robot (Art Robbins Instrument) and commercial high-throughput crystallization screen kits from Hampton Research and Qiagen. After extensive manual optimization, the best crystals were grown by sitting-drop vapour diffusion at 18 °C. The protein (5 mg ml−1) was mixed in 2:1 ratio with a reservoir solution containing 100 mM Tris pH 8.0, 25% polyethylene glycol (PEG) 400. The crystals were cryoprotected in the original mother liquor and flash-cooled in liquid nitrogen. X-ray diffraction data were collected at 100 K at beamline 24-ID-E, Advanced Photon Source (APS). The data were processed using XDS32,33. The structure was determined by molecular replacement software Phaser using the structure of the HCB (PDB code: 2NM1) as the search model32. The manual model building and refinement were performed in COOT34 and PHENIX35 in an iterative manner. The refinement progress was monitored with the Rfree value36 using a 5% randomly selected test set. The struc-tures were validated through the MolProbity web server36,37 and showed excellent stereochemistry. Data collection and structural refinement statistics are listed in Supplementary Table 1.Influenza H1 co-crystal structure. For the HA-HB1.6928.2.3 complex, A/PuertoRico/8/1934 HA and HB1.6928.2.3 peptide (in 25 mM Tris pH 8.0, 150 mM NaCl) were mixed at a 1:4 molar ratio at a final concentration of 10 mg ml−1 HA in 25 mM Tris pH 8.0, 150 mM NaCl. Crystals were grown with a well solution of 5% PEG 3000, 30% PEG 200, 100 mM MES pH 6.0 using the sitting drop vapour diffusion method and directly flash cooled in liquid nitrogen. Data were collected at ALS beamline 5.0.3 and processed with HKL200038. Phaser 35,38 was used for molecular replacement within Phenix39 using a single protomer of PR8 H1 HA (PDB ID: 1RVX40) as a search model. The HB1.6928.2.3 peptide was manually built into FO− FC and 2FO− FC maps using clearly defined aromatic residues and disulfide bonds to confirm the register. The model was refined through iterative rounds of model building in COOT34 and refinement in Phenix. TLS groups were automatically identified by Phenix. Glycans and waters were manually added and edited in COOT. The final model was assessed with quality metrics within the Phenix.refine interface which utilizes MolProbity37. Data collection and refinement statistics are listed in Supplementary Table 2.Molecular dynamics simulations. A total of 289 independent mini-protein binders (without the target) were simulated (143 for BoNT, and 146 for Influenza H1 HA see Extended Data Fig. 3) using Gromacs 5.0441 and Amber99sb-ILDN force field42. Each protein was simulated in a triclinic box with explicit water solvent (TIP3P43), with box edges at least 10 Å from the protein. Counterions (Na+ and Cl−) were used to neutralize the system. Integration time step was 2 ps and LINCS44 was applied to constrain all the bonds. Long-range electrostatics (greater than 12 Å) were treated with the particle-mesh Ewald method45. Van der Waals interactions were smoothly switched off between 10 Å and 12 Å. After minimization (10,000 steps), the system was position restrained for 200 ps in an NVT ensemble (only heavy atoms, restraint = 10 kJ per mol × Å−2, T = 310 K), followed by 500 ps of NPT (T = 310 K, restraint = 10 kJ per mol × Å−2, 1 bar) using Berendsen thermostat and barostat46. For each protein, we then performed five independent NPT production simulations (T = 310K, 1 bar) with 500 ps of initial temperature annealing (T0 = 50, Tfinal = 310 K) using V-rescale thermostat47 and Parrinello-Rahman Barostat48. Each production simulation was in the length of 100 ns for BoNT and 50 ns for influenza binders (see Supplementary Information). Snapshots were recorded every 50 ps, and all of them were used for subsequent data analysis (Extended Data Fig. 3).Influenza neutralization assays. One hundred TCID50 units of virus and half-log dilutions of binders were incubated in quadruplicate at 37 °C for two hours in 200 μ l neutralization assay medium (‘NAM’: medium 199, 0.3% BSA, 10 mM HEPES,1 mM CaCl2, penicillin-streptomycin). Ninety-six-well plates with confluent monolayers of Madin–Darby canine kidney epithelial cells (ATCC) were washed twice with PBS followed by addition of 50 μ l of 5 μ g ml−1 TPCK-trypsin in NAM and the virus/binder neutralization mix. Plates were incubated for 48 h and virus detected by combining 50 μ l each of assay supernatants and 0.5% turkey red blood cells (TRBC). Virus-positive wells that haemagglutinated the TRBC were identified, and the EC50 was calculated using Reed–Muench method.Botulinum neurotoxin neutralization assays. All procedures were conducted in accordance with the guidelines approved by the Institute Animal Care and Use Committee (IACUC) at Boston Children’s Hospital (#3030). Timed-pregnant rats (Sprague Dawley strain, purchased from Charles River) were euthanized and primary rat cortical neurons were prepared from E18–19 embryos using a papain dissociation kit (Worthington Biochemical). For immunoblot analyses, neurons were exposed to BoNT/B (20 nM) or BoNT/A (10 nM) with GST–Syt-II or Bot.671.2 for 10 min in high [K+] buffer. Subsequently, the neurons were washed and incubated in culture medium for 10 h (BoNT/B) or 6 h (BoNT/A). Cells were then lysed (lysis buffer: PBS, 1% Triton X-100, 0.05% sodium dodecyl sulfate (SDS), plus protease inhibitor cocktail (Roche)). Lysates were centrifuged (4 °C) for 5 min at maximum speed using a microcentrifuge. The supernatants
were collected for immunoblot analysis against BoNT/A, BoNT/B or actin. For immunocytochemistry, the neurons were seeded on cover glass in 24-well plates. The cells were then exposed to 20 nM BoNT/B for 10 min (middle panel, positive control), or with 20 nM BoNT/B and 600 nM Bot.671.2 for 10 min. Cells were washed with PBS and fixed with 4% paraformaldehyde for 20 min. The cells were then blocked with PBS containing 10% goat serum for 45 min and exposed to primary antibody (rabbit anti-BoNT/B antibody) for 1 h and secondary antibody (Alexa-488) for 1 h. The coverslips were then mounted on a slide and images collected using a fluorescence microscope. See Extended Data Fig. 7.In vivo immunogenicity and influenza challenge. Animal studies were approved by the University of Washington Institutional Animal Care and Use Committee. BALB/c mice (female, 6–8 weeks old, n = 5–10 per group) were randomly separated into groups, anaesthetized and then were dosed either intranasally or intravenously with PBS (negative control), the antibody FI6 (SFFV-FI6v3 IgG, Molecular design & Therapeutics) or mini-protein binders (HB1.6928.2.3 or HB36.6). Between 24 and 96 h after being dosed (see Fig. 5), the mice were anaesthetized with 2.5% isoflurane and challenged intranasally with 2 MLD50 of CA09. Following challenge, the mice were monitored twice daily for weight loss and survival until up to 14 days post-infection. Animals that lost 30% of their body weight (as a propor-tion of their initial weight) were euthanized by carbon dioxide in accordance with our animal protocols. For the immunogenicity experiment, BALB/c mice (female, 6–8 weeks old, n = 5 per group) were randomly separated into groups, anaesthe-tized and dosed with (intranasal or intravenous) PBS, mini-proteins (HB1.5702.3.3, HB1.6928.2.3, HB1.6394.2.3, HB36.6, Bot2110.4 or Bot3194.4), or monoclonal antibodies mIgG (Innovative IR-MSBC-GF) or hIgG (Innovative IR-HU-GF-ED). A total of three or four doses were administered two weeks apart for both the intranasal and intravenous doses. Blood was collected two weeks after each dose by retro orbital bleed using micro-haematocrit capillary tubes (Fisher). Serum was separated by centrifuging the blood samples in polymer gel chemistry tubes. For mouse experiments, researchers were not blinded to animal identity.ELISA. HB36.6, HB1.6928.2.3, HB1.6394.2.3, Bot 2110.4, Bot 3194.4, mIgG, hIgG and BSA-specific IgG antibody levels in mouse serum were assessed by ELISA. Maxisorp (Thermo Scientific-Nunc) were coated with 100 ng per well of HB36.6, HB1.5702.3.3, HB1.6928.2.3, HB1.6394.2.3, Bot 2110.4, Bot 3194.4, mIgG (Innovative IR-MSBC-GF), hIgG (Innovative IR-HU-GF-ED) or BSA (LAMPIRE Biological laboratories, cat no. 7500804) in PBS overnight at 4 °C. Plates were blocked with 5% nonfat milk powder in PBS for 1 h at room temperature, and then washed three times with wash buffer (PBS-T; phosphate-buffered saline containing 0.05% Tween 20). Samples were diluted in a buffer containing 1% nonfat milk powder in PBS-T, added to the wells, and incubated for 1 hr at room temperature. Following three washes with PBS-T, plates were incubated with horseradish- peroxidase conjugated goat anti-mouse IgG (1/5,000 dilution) secondary antibodies (ThermoFisher 62-6520) for 1 h at room temperature. After five washes with PBS-T, TMB substrate (KPL 52-00-03) was added to the wells for 30 min at room temperature. Colour development was stopped by the addition of 50 μ l HCl (1 M), and the plates were read at 450 nm to measure relative optical densities. The average optical density of blank wells was subtracted to calculate the reported values.Statistical and power analyses. For animal studies, mice were randomly assigned to either treatment or control groups. In mouse influenza challenge studies, investigators were blinded to which treatment group each animal was assigned to during measurement of weight loss and survival. For all other analyses, inves-tigators were not blinded to treatment groups or in the data analysis. A group size of n = 10 mice was determined based on power analysis, yielding 80% power to discern a difference of 5% weight-change between groups at an alpha value of 0.05, considering a standard deviation of 4% in weight-change at 4–7 days after infection. Survival analyses were performed using the Kaplan–Meier log-rank test. A P value of < 0.05 was considered to be significant. For mice, the minimum group size was determined using weight loss data with 70% of control mice becoming infected with CA09. Comparisons in antibody responses were performed using unpaired student t-test. With a standard deviation of 2% in weight loss, a group size of n = 5 yields > 80% power to detect a minimum of a 10% difference between groups in weight loss using a two-sided t-test with an alpha value of 0.05.Code availability. Computational protein designs and filtering were performed using RosettaScripts. The respective XML code is available as part of the Supplementary Information Appendices A–C.Data availability. Computational design models, Rosetta-metrics, and experimental results that support the findings in this study have been deposited in the online zenodo repository (https://zenodo.org. http://dx.doi.org/10.5281/zenodo.838815). Structures have been submitted to the Research Collaboratory for Structural Bioinformatics Protein Databank under the codes 5VLI (HB1.6928.2.3 co- crystal with influenza HA), 5VID (Bot.671.2 co-crystal with BoNT HCB) and 5VMR (Bot.2110.4 co-crystal with BoNT HCB).
© 2017 Macmillan Publishers Limited, part of Springer Nature. All rights reserved.
ArticlereSeArcH
21. Huang, P.-S. et al. RosettaRemodel: a generalized framework for flexible backbone protein design. PLoS One 6, e24109 (2011).
22. Lin, Y.-R. et al. Control over overall shape and size in de novo designed proteins. Proc. Natl Acad. Sci. USA 112, E5478–E5485 (2015).
23. Koga, N. et al. Principles for designing ideal protein structures. Nature 491, 222–227 (2012).
24. Silva, D.-A., Correia, B. E. & Procko, E. Motif-driven design of protein–protein interfaces. Methods Mol. Biol. 1414, 285–304 (2016).
25. Hoover, D. M. & Lubkowski, J. DNAWorks: an automated method for designing oligonucleotides for PCR-based gene synthesis. Nucleic Acids Res. 30, e43 (2002).
26. Bawono, P. & Heringa, J. PRALINE: A versatile multiple sequence alignment toolkit. Methods in Mol. Biol. 1079, 245–262 (2013).
27. Zhang, J., Kobert, K., Flouri, T. & Stamatakis, A. PEAR: a fast and accurate Illumina Paired-End reAd mergeR. Bioinformatics 30, 614–620 (2014).
28. Waskom, M. et al. seaborn: v0.7.1. http://dx.doi.org/:10.5281/zenodo.54844 (2016).
29. Chao, G. et al. Isolating and engineering human antibodies using yeast surface display. Nat. Protocols 1, 755–768 (2006).
30. Benatuil, L., Perez, J. M., Belk, J. & Hsieh, C.-M. An improved yeast transformation method for the generation of very large human antibody libraries. Protein Eng. Des. Sel. 23, 155–159 (2010).
31. Jacobs, T. M., Yumerefendi, H., Kuhlman, B. & Leaver-Fay, A. SwiftLib: rapid degenerate-codon-library optimization through dynamic programming. Nucleic Acids Res. 43, e34 (2015).
32. Jin, R., Rummel, A., Binz, T. & Brunger, A. T. Botulinum neurotoxin B recognizes its protein receptor with high affinity and specificity. Nature 444, 1092–1095 (2006).
33. Kabsch, W. XDS. Acta Crystallogr. D Biol. Crystallogr. 66, 125–132 (2010).34. Emsley, P. & Cowtan, K. Coot: model-building tools for molecular graphics.
Acta Crystallogr. D Biol. Crystallogr. 60, 2126–2132 (2004).
35. McCoy, A. J. et al. Phaser crystallographic software. J. Appl. Crystallogr. 40, 658–674 (2007).
36. Brünger, A. T. Free R value: a novel statistical quantity for assessing the accuracy of crystal structures. Nature 355, 472–475 (1992).
37. Chen, V. B. et al. MolProbity: all-atom structure validation for macromolecular crystallography. Acta Crystallogr. D Biol. Crystallogr. 66, 12–21 (2010).
38. Otwinowski, Z. & Minor, W. Processing of X-ray diffraction data collected in oscillation mode. Methods Enzymol. 276, 307–326 (1997).
39. Adams, P. D. et al. The Phenix software for automated determination of macromolecular structures. Methods 55, 94–106 (2011).
40. Gamblin, S. J. et al. The structure and receptor binding properties of the 1918 influenza hemagglutinin. Science 303, 1838–1842 (2004).
41. Van Der Spoel, D. et al. GROMACS: fast, flexible, and free. J. Comput. Chem. 26, 1701–1718 (2005).
42. Lindorff-Larsen, K. et al. Improved side-chain torsion potentials for the Amber ff99SB protein force field. Proteins 78, 1950–1958 (2010).
43. Jorgensen, W. L., Chandrasekhar, J., Madura, J. D., Impey, R. W. & Klein, M. L. Comparison of simple potential functions for simulating liquid water. J. Chem. Phys. 79, 926–935 (1983).
44. Hess, B., Bekker, H., Berendsen, H. J. C. & Fraaije, J. G. E. M. LINCS: A linear constraint solver for molecular simulations. J. Comput. Chem. 18, 1463–1472 (1997).
45. Essmann, U. et al. A smooth particle mesh Ewald method. J. Chem. Phys. 103, 8577–8593 (1995).
46. Berendsen, H. J. C. in Computer Simulation in Materials Science (eds Meyer. M. & Pontikis, V.) 139–155 (Springer, 1991).
47. Bussi, G., Donadio, D. & Parrinello, M. Canonical sampling through velocity rescaling. J. Chem. Phys. 126, 014101 (2007).
48. Nosé, S. & Klein, M. L. Constant pressure molecular dynamics for molecular systems. Mol. Phys. 50, 1055–1076 (1983).
© 2017 Macmillan Publishers Limited, part of Springer Nature. All rights reserved.
Article reSeArcH
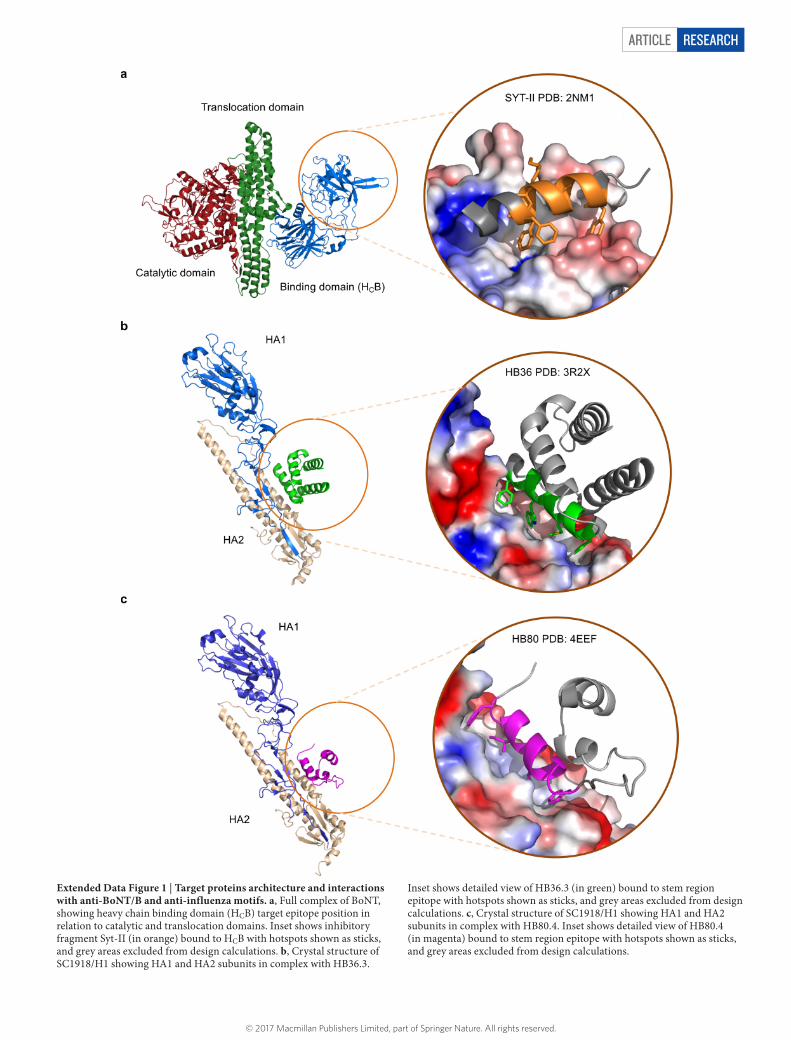
Extended Data Figure 1 | Target proteins architecture and interactions with anti-BoNT/B and anti-influenza motifs. a, Full complex of BoNT, showing heavy chain binding domain (HCB) target epitope position in relation to catalytic and translocation domains. Inset shows inhibitory fragment Syt-II (in orange) bound to HCB with hotspots shown as sticks, and grey areas excluded from design calculations. b, Crystal structure of SC1918/H1 showing HA1 and HA2 subunits in complex with HB36.3.
Inset shows detailed view of HB36.3 (in green) bound to stem region epitope with hotspots shown as sticks, and grey areas excluded from design calculations. c, Crystal structure of SC1918/H1 showing HA1 and HA2 subunits in complex with HB80.4. Inset shows detailed view of HB80.4 (in magenta) bound to stem region epitope with hotspots shown as sticks, and grey areas excluded from design calculations.
© 2017 Macmillan Publishers Limited, part of Springer Nature. All rights reserved.
ArticlereSeArcH
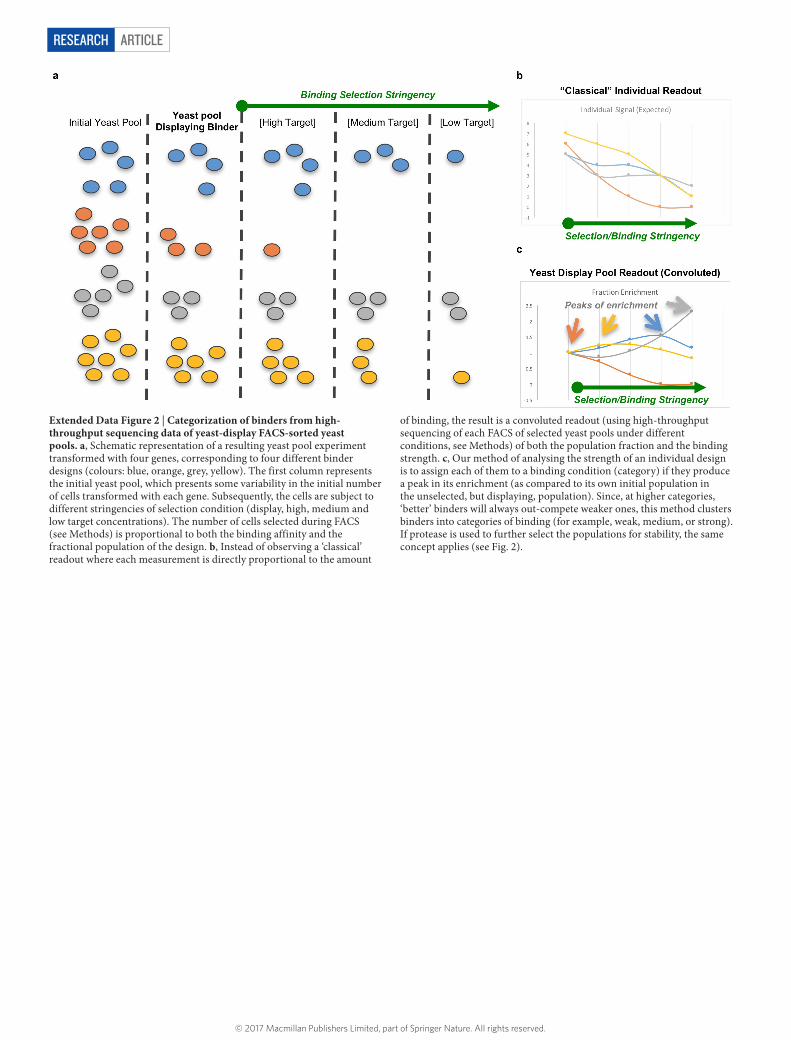
Extended Data Figure 2 | Categorization of binders from high-throughput sequencing data of yeast-display FACS-sorted yeast pools. a, Schematic representation of a resulting yeast pool experiment transformed with four genes, corresponding to four different binder designs (colours: blue, orange, grey, yellow). The first column represents the initial yeast pool, which presents some variability in the initial number of cells transformed with each gene. Subsequently, the cells are subject to different stringencies of selection condition (display, high, medium and low target concentrations). The number of cells selected during FACS (see Methods) is proportional to both the binding affinity and the fractional population of the design. b, Instead of observing a ‘classical’ readout where each measurement is directly proportional to the amount
of binding, the result is a convoluted readout (using high-throughput sequencing of each FACS of selected yeast pools under different conditions, see Methods) of both the population fraction and the binding strength. c, Our method of analysing the strength of an individual design is to assign each of them to a binding condition (category) if they produce a peak in its enrichment (as compared to its own initial population in the unselected, but displaying, population). Since, at higher categories, ‘better’ binders will always out-compete weaker ones, this method clusters binders into categories of binding (for example, weak, medium, or strong). If protease is used to further select the populations for stability, the same concept applies (see Fig. 2).
© 2017 Macmillan Publishers Limited, part of Springer Nature. All rights reserved.
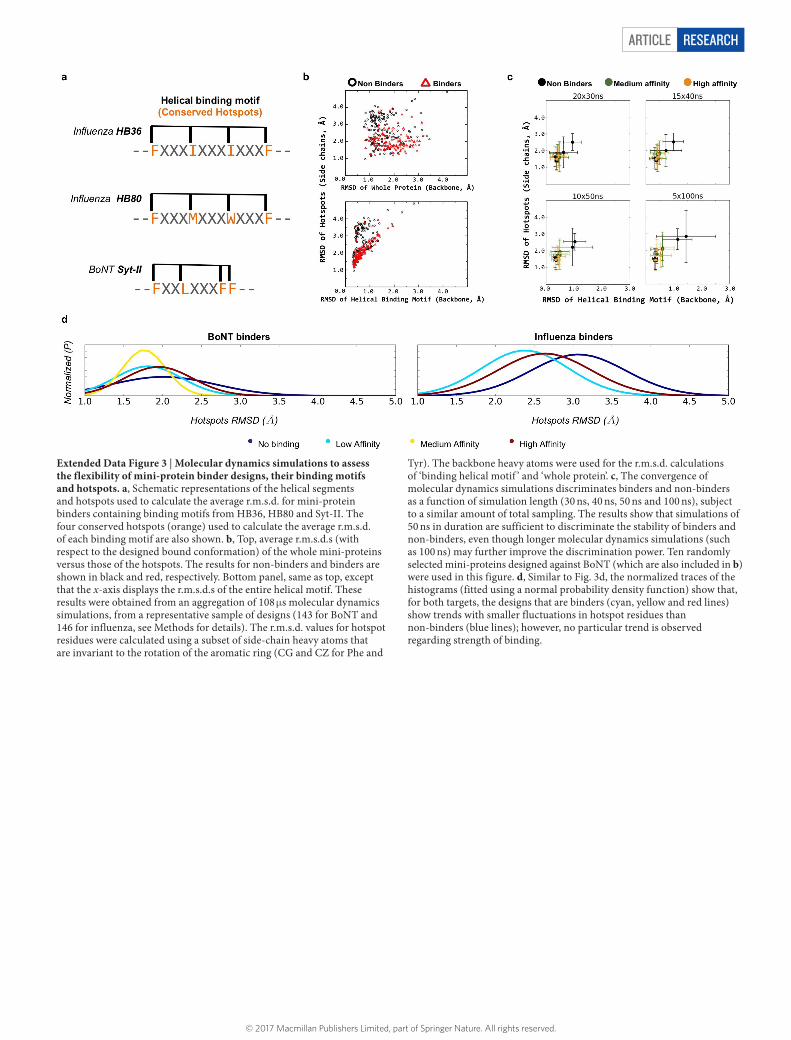
Article reSeArcH
Extended Data Figure 3 | Molecular dynamics simulations to assess the flexibility of mini-protein binder designs, their binding motifs and hotspots. a, Schematic representations of the helical segments and hotspots used to calculate the average r.m.s.d. for mini-protein binders containing binding motifs from HB36, HB80 and Syt-II. The four conserved hotspots (orange) used to calculate the average r.m.s.d. of each binding motif are also shown. b, Top, average r.m.s.d.s (with respect to the designed bound conformation) of the whole mini-proteins versus those of the hotspots. The results for non-binders and binders are shown in black and red, respectively. Bottom panel, same as top, except that the x-axis displays the r.m.s.d.s of the entire helical motif. These results were obtained from an aggregation of 108 μ s molecular dynamics simulations, from a representative sample of designs (143 for BoNT and 146 for influenza, see Methods for details). The r.m.s.d. values for hotspot residues were calculated using a subset of side-chain heavy atoms that are invariant to the rotation of the aromatic ring (CG and CZ for Phe and
Tyr). The backbone heavy atoms were used for the r.m.s.d. calculations of ‘binding helical motif ’ and ‘whole protein’. c, The convergence of molecular dynamics simulations discriminates binders and non-binders as a function of simulation length (30 ns, 40 ns, 50 ns and 100 ns), subject to a similar amount of total sampling. The results show that simulations of 50 ns in duration are sufficient to discriminate the stability of binders and non-binders, even though longer molecular dynamics simulations (such as 100 ns) may further improve the discrimination power. Ten randomly selected mini-proteins designed against BoNT (which are also included in b) were used in this figure. d, Similar to Fig. 3d, the normalized traces of the histograms (fitted using a normal probability density function) show that, for both targets, the designs that are binders (cyan, yellow and red lines) show trends with smaller fluctuations in hotspot residues than non-binders (blue lines); however, no particular trend is observed regarding strength of binding.
© 2017 Macmillan Publishers Limited, part of Springer Nature. All rights reserved.
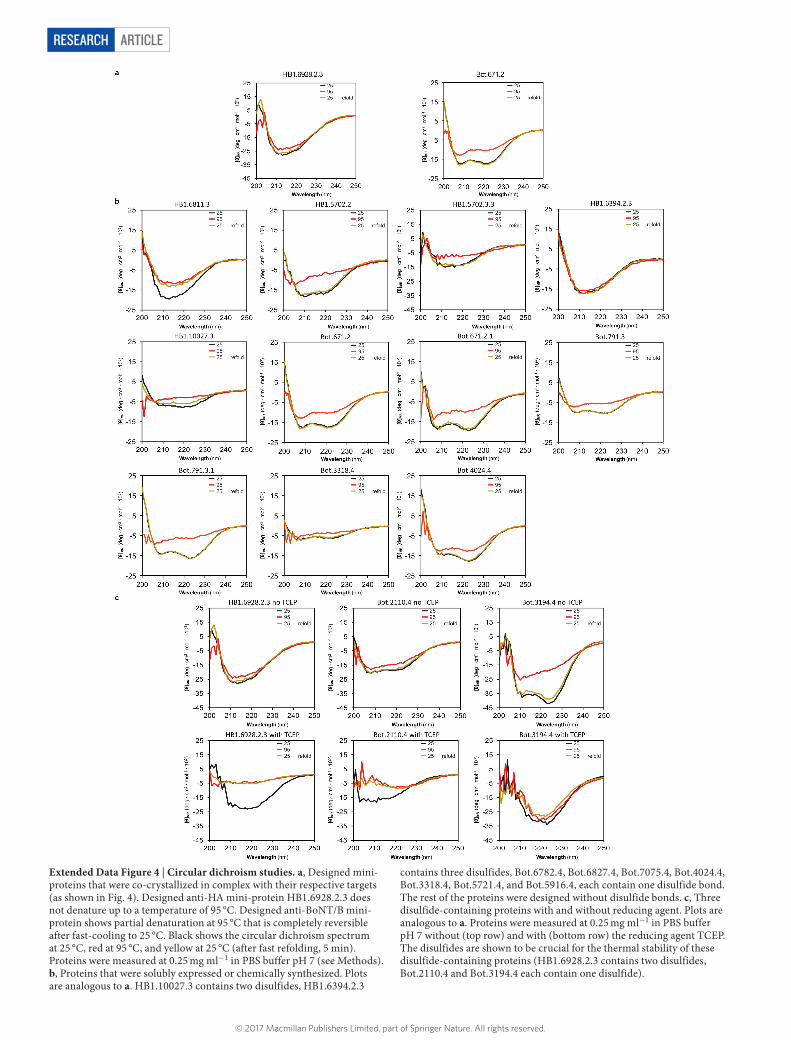
ArticlereSeArcH
Extended Data Figure 4 | Circular dichroism studies. a, Designed mini-proteins that were co-crystallized in complex with their respective targets (as shown in Fig. 4). Designed anti-HA mini-protein HB1.6928.2.3 does not denature up to a temperature of 95 °C. Designed anti-BoNT/B mini-protein shows partial denaturation at 95 °C that is completely reversible after fast-cooling to 25 °C. Black shows the circular dichroism spectrum at 25 °C, red at 95 °C, and yellow at 25 °C (after fast refolding, 5 min). Proteins were measured at 0.25 mg ml−1 in PBS buffer pH 7 (see Methods). b, Proteins that were solubly expressed or chemically synthesized. Plots are analogous to a. HB1.10027.3 contains two disulfides, HB1.6394.2.3
contains three disulfides, Bot.6782.4, Bot.6827.4, Bot.7075.4, Bot.4024.4, Bot.3318.4, Bot.5721.4, and Bot.5916.4, each contain one disulfide bond. The rest of the proteins were designed without disulfide bonds. c, Three disulfide-containing proteins with and without reducing agent. Plots are analogous to a. Proteins were measured at 0.25 mg ml−1 in PBS buffer pH 7 without (top row) and with (bottom row) the reducing agent TCEP. The disulfides are shown to be crucial for the thermal stability of these disulfide-containing proteins (HB1.6928.2.3 contains two disulfides, Bot.2110.4 and Bot.3194.4 each contain one disulfide).
© 2017 Macmillan Publishers Limited, part of Springer Nature. All rights reserved.
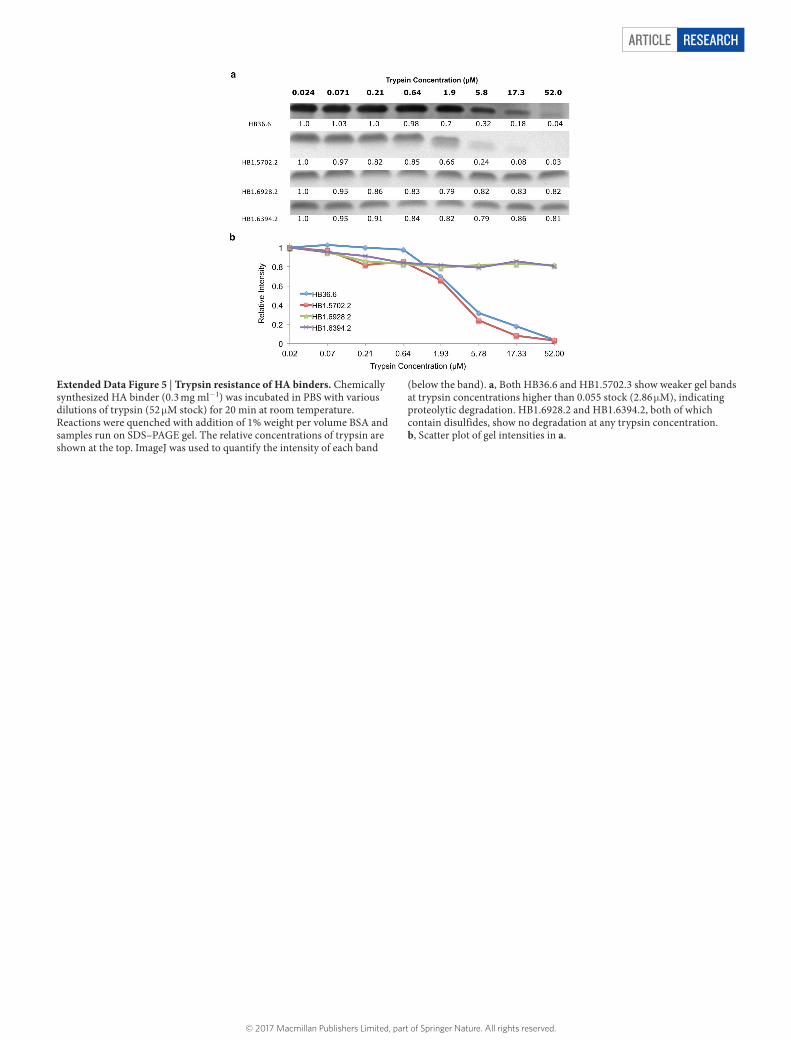
Article reSeArcH
Extended Data Figure 5 | Trypsin resistance of HA binders. Chemically synthesized HA binder (0.3 mg ml−1) was incubated in PBS with various dilutions of trypsin (52 μ M stock) for 20 min at room temperature. Reactions were quenched with addition of 1% weight per volume BSA and samples run on SDS–PAGE gel. The relative concentrations of trypsin are shown at the top. ImageJ was used to quantify the intensity of each band
(below the band). a, Both HB36.6 and HB1.5702.3 show weaker gel bands at trypsin concentrations higher than 0.055 stock (2.86 μ M), indicating proteolytic degradation. HB1.6928.2 and HB1.6394.2, both of which contain disulfides, show no degradation at any trypsin concentration. b, Scatter plot of gel intensities in a.
© 2017 Macmillan Publishers Limited, part of Springer Nature. All rights reserved.
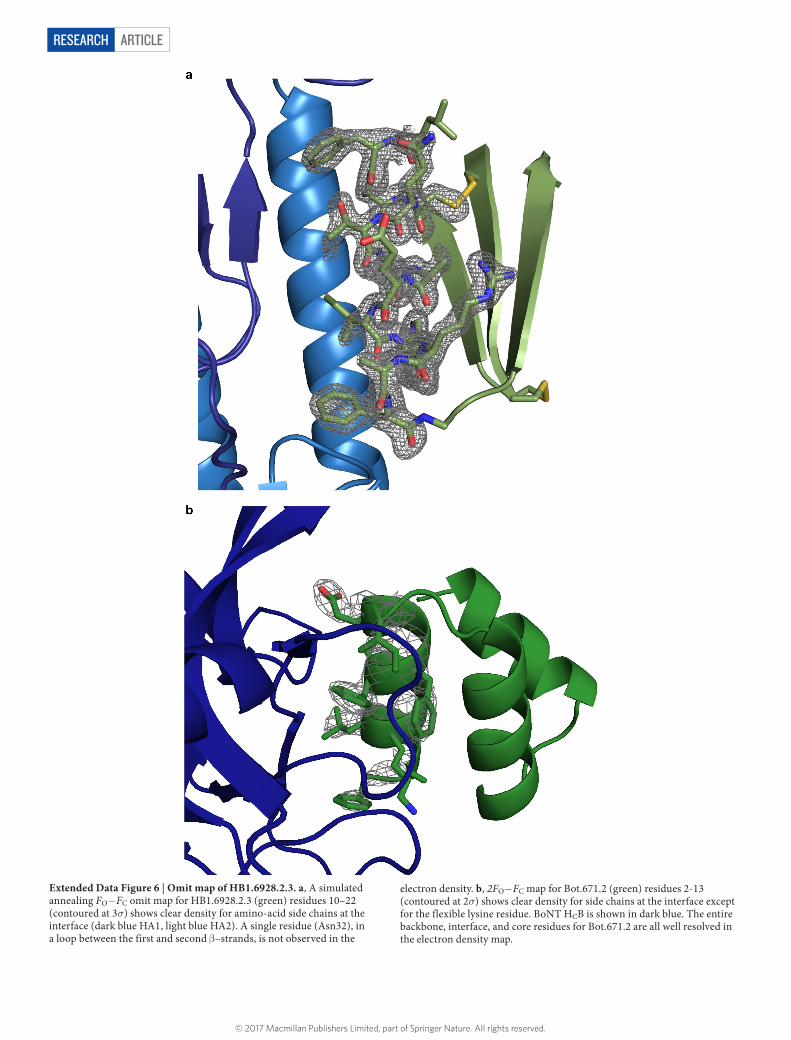
ArticlereSeArcH
Extended Data Figure 6 | Omit map of HB1.6928.2.3. a, A simulated annealing FO− FC omit map for HB1.6928.2.3 (green) residues 10–22 (contoured at 3σ) shows clear density for amino-acid side chains at the interface (dark blue HA1, light blue HA2). A single residue (Asn32), in a loop between the first and second β –strands, is not observed in the
electron density. b, 2FO− FC map for Bot.671.2 (green) residues 2-13 (contoured at 2σ) shows clear density for side chains at the interface except for the flexible lysine residue. BoNT HCB is shown in dark blue. The entire backbone, interface, and core residues for Bot.671.2 are all well resolved in the electron density map.
© 2017 Macmillan Publishers Limited, part of Springer Nature. All rights reserved.
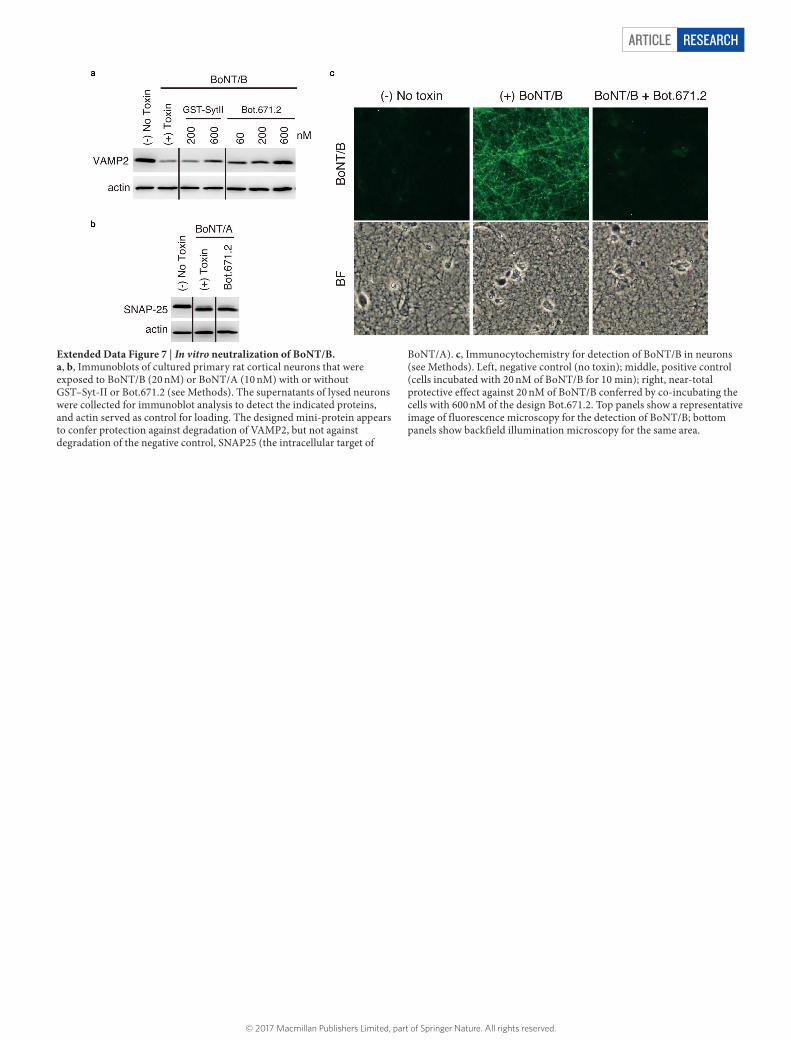
Article reSeArcH
Extended Data Figure 7 | In vitro neutralization of BoNT/B. a, b, Immunoblots of cultured primary rat cortical neurons that were exposed to BoNT/B (20 nM) or BoNT/A (10 nM) with or without GST–Syt-II or Bot.671.2 (see Methods). The supernatants of lysed neurons were collected for immunoblot analysis to detect the indicated proteins, and actin served as control for loading. The designed mini-protein appears to confer protection against degradation of VAMP2, but not against degradation of the negative control, SNAP25 (the intracellular target of
BoNT/A). c, Immunocytochemistry for detection of BoNT/B in neurons (see Methods). Left, negative control (no toxin); middle, positive control (cells incubated with 20 nM of BoNT/B for 10 min); right, near-total protective effect against 20 nM of BoNT/B conferred by co-incubating the cells with 600 nM of the design Bot.671.2. Top panels show a representative image of fluorescence microscopy for the detection of BoNT/B; bottom panels show backfield illumination microscopy for the same area.
© 2017 Macmillan Publishers Limited, part of Springer Nature. All rights reserved.
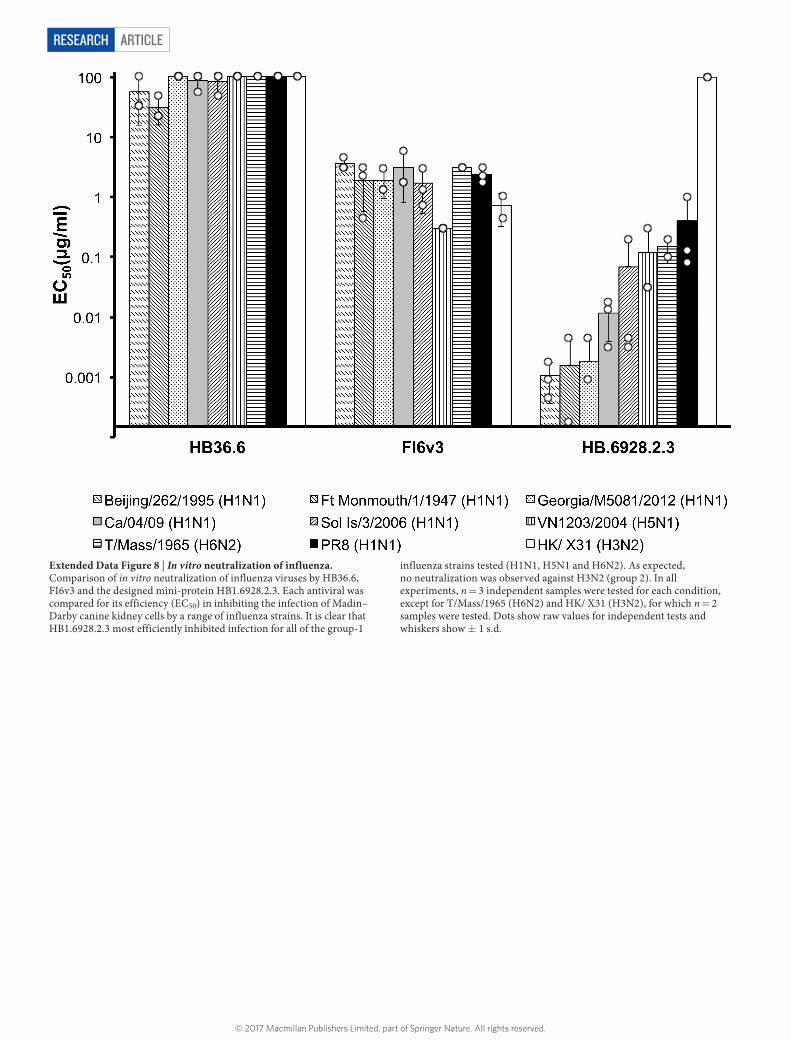
ArticlereSeArcH
Extended Data Figure 8 | In vitro neutralization of influenza. Comparison of in vitro neutralization of influenza viruses by HB36.6, FI6v3 and the designed mini-protein HB1.6928.2.3. Each antiviral was compared for its efficiency (EC50) in inhibiting the infection of Madin–Darby canine kidney cells by a range of influenza strains. It is clear that HB1.6928.2.3 most efficiently inhibited infection for all of the group-1
influenza strains tested (H1N1, H5N1 and H6N2). As expected, no neutralization was observed against H3N2 (group 2). In all experiments, n = 3 independent samples were tested for each condition, except for T/Mass/1965 (H6N2) and HK/ X31 (H3N2), for which n = 2 samples were tested. Dots show raw values for independent tests and whiskers show ± 1 s.d.
© 2017 Macmillan Publishers Limited, part of Springer Nature. All rights reserved.
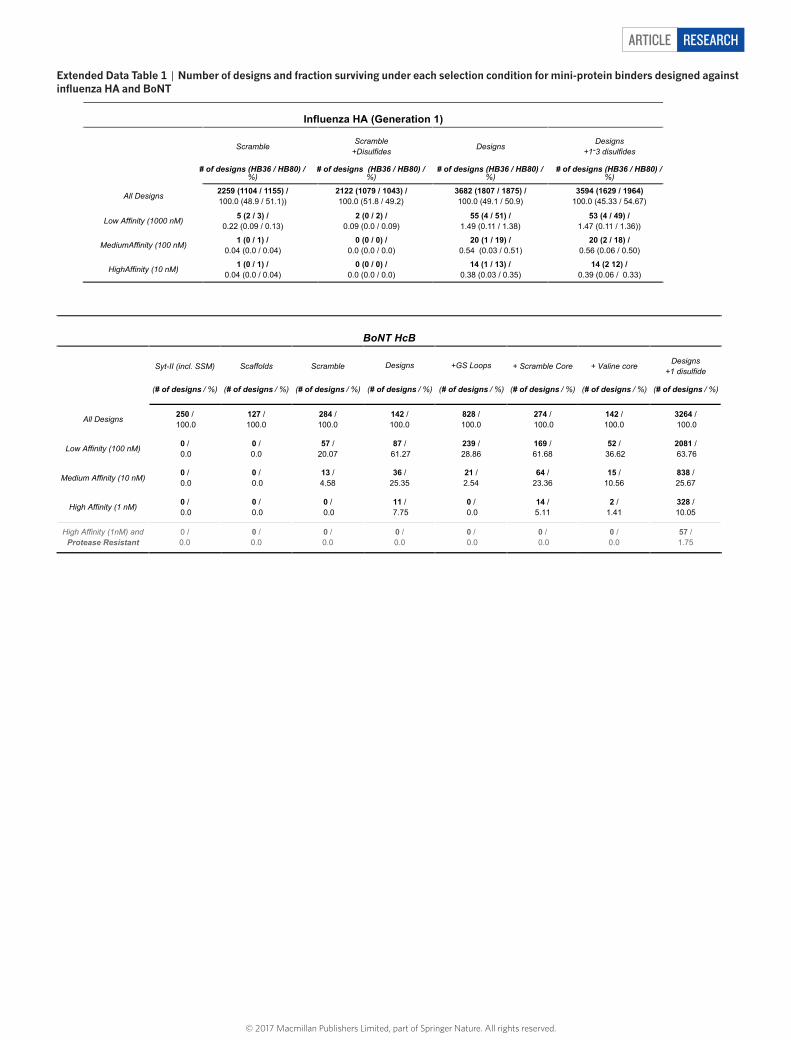
Article reSeArcH
extended data table 1 | Number of designs and fraction surviving under each selection condition for mini-protein binders designed against influenza hA and BoNt
© 2017 Macmillan Publishers Limited, part of Springer Nature. All rights reserved.
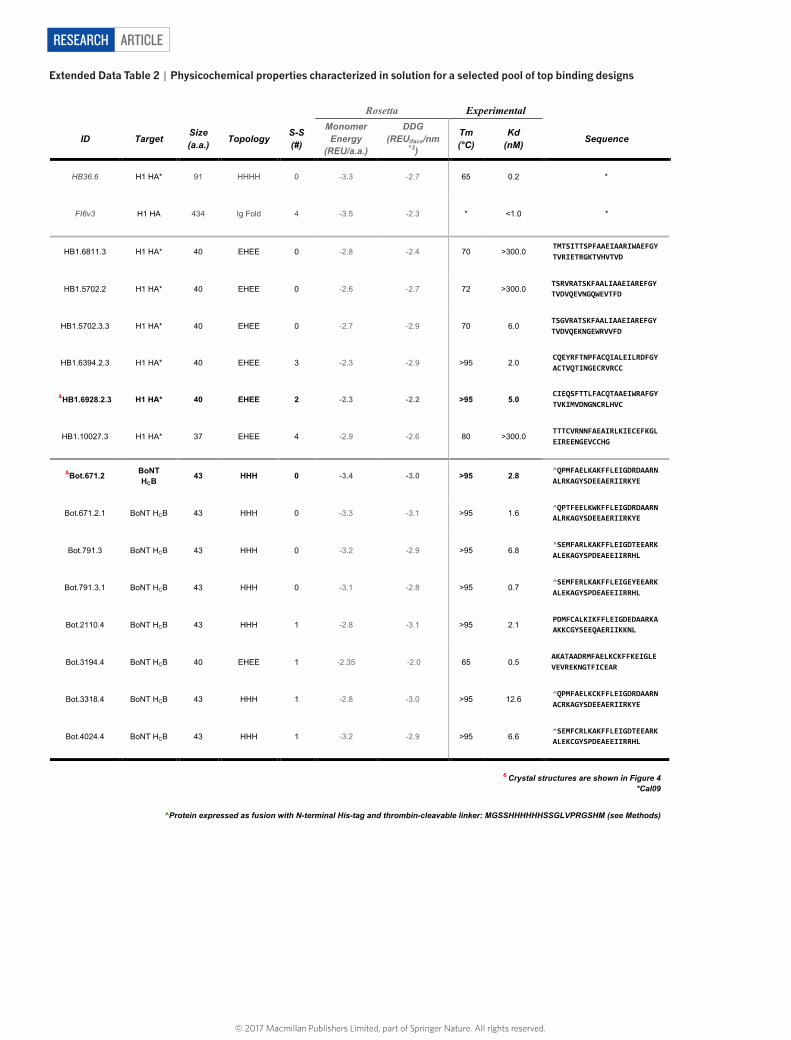
ArticlereSeArcH
extended data table 2 | Physicochemical properties characterized in solution for a selected pool of top binding designs
© 2017 Macmillan Publishers Limited, part of Springer Nature. All rights reserved.

1
nature research | life sciences reporting summ
aryJune 2017
Corresponding author(s): David Baker
Initial submission Revised version Final submission
Life Sciences Reporting SummaryNature Research wishes to improve the reproducibility of the work that we publish. This form is intended for publication with all accepted life science papers and provides structure for consistency and transparency in reporting. Every life science submission will use this form; some list items might not apply to an individual manuscript, but all fields must be completed for clarity.
For further information on the points included in this form, see Reporting Life Sciences Research. For further information on Nature Research policies, including our data availability policy, see Authors & Referees and the Editorial Policy Checklist.
Experimental design1. Sample size
Describe how sample size was determined. Survival analyses were performed by using the Kaplan-Meier log-rank test. A P value of <0.05 was considered to be significant. For mice, the minimum group size was determined using weight loss data with 70% of control mice becoming infected with CA09. Comparisons in antibody responses were performed using unpaired student t-test. Based on a standard deviation of 2% in weight loss, a group size of n = 5 yields >80% power to detect a minimum of a 10% difference between groups in weight loss using a two-sided t-test with an alpha value of 0.
2. Data exclusions
Describe any data exclusions. None
3. Replication
Describe whether the experimental findings were reliably reproduced.
Experimental finders were statistically significant and no attempt at reproduction was performed.
4. Randomization
Describe how samples/organisms/participants were allocated into experimental groups.
Female, 6–8 week-old BALB/c mice (female, 6-8 weeks old, n=5-10/group) were randomly separated into groups
5. Blinding
Describe whether the investigators were blinded to group allocation during data collection and/or analysis.
For mouse experiments, researchers were not blinded to animal identity.
Note: all studies involving animals and/or human research participants must disclose whether blinding and randomization were used.
6. Statistical parameters For all figures and tables that use statistical methods, confirm that the following items are present in relevant figure legends (or in the Methods section if additional space is needed).
n/a Confirmed
The exact sample size (n) for each experimental group/condition, given as a discrete number and unit of measurement (animals, litters, cultures, etc.)
A description of how samples were collected, noting whether measurements were taken from distinct samples or whether the same sample was measured repeatedly
A statement indicating how many times each experiment was replicated
The statistical test(s) used and whether they are one- or two-sided (note: only common tests should be described solely by name; more complex techniques should be described in the Methods section)
A description of any assumptions or corrections, such as an adjustment for multiple comparisons
The test results (e.g. P values) given as exact values whenever possible and with confidence intervals noted
A clear description of statistics including central tendency (e.g. median, mean) and variation (e.g. standard deviation, interquartile range)
Clearly defined error bars
See the web collection on statistics for biologists for further resources and guidance.
2
nature research | life sciences reporting summ
aryJune 2017
SoftwarePolicy information about availability of computer code
7. Software
Describe the software used to analyze the data in this study.
All amino-acid sequences were reverse translated and codon optimized for yeast using DNAworks 2.025. Sequence identity calculations were performed with a subset of designs using PRALINE after PSI-BLAST global alignment. Sequencing pairing after Illumina deep sequencing was performed by PEAR. Plots and visualizations were created using Seaborn statistical visualization tools, Python (Python Software Foundation), and python’s scikit-learn (INRIA).
For manuscripts utilizing custom algorithms or software that are central to the paper but not yet described in the published literature, software must be made available to editors and reviewers upon request. We strongly encourage code deposition in a community repository (e.g. GitHub). Nature Methods guidance for providing algorithms and software for publication provides further information on this topic.
Materials and reagentsPolicy information about availability of materials
8. Materials availability
Indicate whether there are restrictions on availability of unique materials or if these materials are only available for distribution by a for-profit company.
No known restrictions
9. Antibodies
Describe the antibodies used and how they were validated for use in the system under study (i.e. assay and species).
mIgG (Innovative IR-MSBC-GF) hIgG (Innovative IR-HU-GF-ED)
10. Eukaryotic cell linesa. State the source of each eukaryotic cell line used. ATCC
b. Describe the method of cell line authentication used. Authenticated by vendor (ATCC). We did not do any additional authentication.
c. Report whether the cell lines were tested for mycoplasma contamination.
Cell line was tested by vendor for mycoplasma contamination. We did not perform any additional testing for mycoplasma.
d. If any of the cell lines used are listed in the database of commonly misidentified cell lines maintained by ICLAC, provide a scientific rationale for their use.
None
Animals and human research participantsPolicy information about studies involving animals; when reporting animal research, follow the ARRIVE guidelines
11. Description of research animalsProvide details on animals and/or animal-derived materials used in the study.
Female, 6–8 week-old BALB/c mice (female, 6-8 weeks old, n=5-10/group)
Policy information about studies involving human research participants
12. Description of human research participantsDescribe the covariate-relevant population characteristics of the human research participants.
None
nature research | flow cytom
etry reporting summ
aryJune 2017
1
Corresponding author(s): David Baker
Initial submission Revised version Final submission
Flow Cytometry Reporting Summary Form fields will expand as needed. Please do not leave fields blank.
Data presentationFor all flow cytometry data, confirm that:
1. The axis labels state the marker and fluorochrome used (e.g. CD4-FITC).
2. The axis scales are clearly visible. Include numbers along axes only for bottom left plot of group (a 'group' is an analysis of identical markers).
3. All plots are contour plots with outliers or pseudocolor plots.
4. A numerical value for number of cells or percentage (with statistics) is provided.
Methodological details5. Describe the sample preparation. Cell aliquots were thawed on ice, centrifuged at 13,000 r.p.m. for 30 s,
resuspended in 1e7 cells per ml of C-Trp-Ura media and grown at 30 °C for 16 h. Cells were then centrifuged for 13,000 r.p.m. and resuspended at 1e7 cells per ml SGCAA media and induced at 30°C for 16–24 h. Cells were labeled with either biotinylated BoNT HCB, PR8 hemagglutinin, or CA/04/09 hemagglutinin, washed, secondary labeled with SAPE (Invitrogen) and anti-cmyc FITC (Miltenyi Biotech).
6. Identify the instrument used for data collection. Sony SH800
7. Describe the software used to collect and analyze the flow cytometry data.
Sonh SH800 instrument software
8. Describe the abundance of the relevant cell populations within post-sort fractions.
This is listed in extended data table 2.
9. Describe the gating strategy used. FSC/SSC gates were set loosely to capture single cells. Sorting was set to sem-purity on SH800. Binding gates were defined as binding signal above negative control cells(displaying cells non-binding).
Tick this box to confirm that a figure exemplifying the gating strategy is provided in the Supplementary Information.
Related Documents