MassARRAY ® System A Flexible & Powerful System for Genetic Analysis

Welcome message from author
This document is posted to help you gain knowledge. Please leave a comment to let me know what you think about it! Share it to your friends and learn new things together.
Transcript

MassARRAY® System
A Flexible & Powerful System for
Genetic Analysis

• Multiplex Genotyping(iPLEX Gold up to 40 plex)
• Allelotyping• Allele specific expression• Quantitative gene expression• Gene copy number variation• OncoCarta Oncogene panel
• Methylation Analysis(EpiTYPER)
• SNP Discovery• Signature Sequence
Identification (iSEQ)
Nanodispenser Data AnalysisMass
SpectrometryBiochemistry
MassCLEAVE MassEXTEND Oligo QC
• Oligo nucleotidequality analysis
One System – Multiple Applications
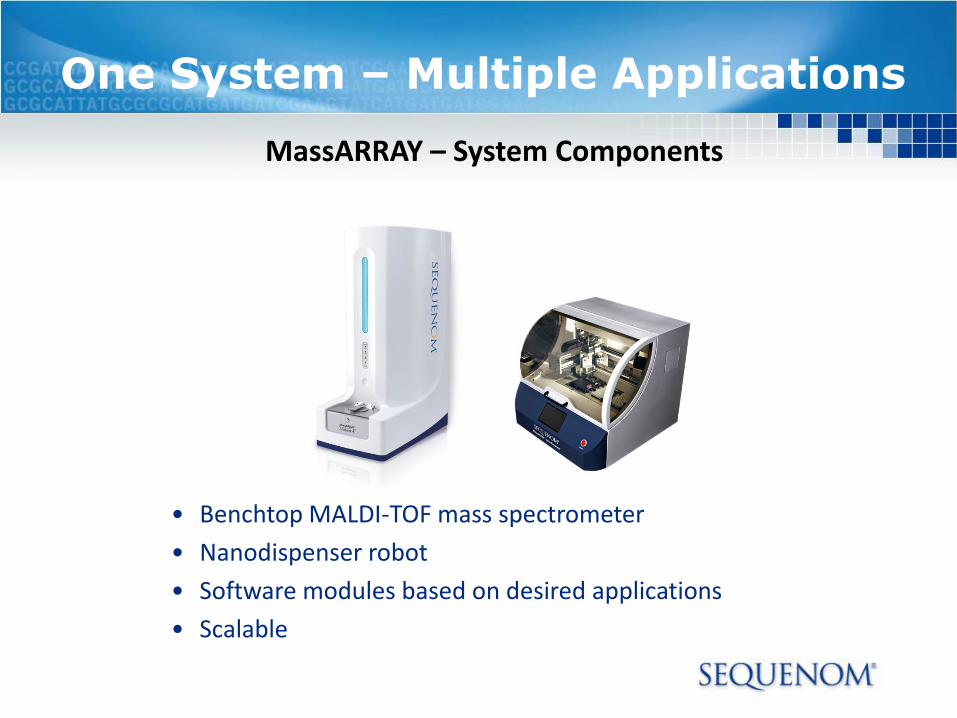
MassARRAY – System Components
• Benchtop MALDI-TOF mass spectrometer
• Nanodispenser robot
• Software modules based on desired applications
• Scalable
One System – Multiple Applications

De
tecto
r+
+
Matrix/AnalyteLaser Desorption and IonizationAcceleration and Detection
+
+
Mass Spectrum m/z
MALDI-TOF MS: “Electrophoresis in Vacuum”

MALDI-TOF MS
Each base has defined molecular mass:
dAMP = 313.2 Da
dCMP = 289.2 Da
dGMP = 329.2 Da
dTMP = 304.2 Da

Miniaturized Sample pad -
SpectroCHIPTM
Automated Data Acquisition and Analysis
MALDI-TOF Mass Spectrometry
1
23
4 5 StatisticalSampling
MassARRAY ®

A T G T
10 mer tag
10 mer tag
10 mer tag
10 mer tag
A TT A
G TC A
A G
PCRPrimer Extension
A,C,T,G terminators
Sample Conditioning
Dispensing
Data Acquisition
SAP
EX
TE
ND
Pri
mer
Allele
1
EX
TE
ND
Pri
mer
Allele
1
Allele
2
EX
TE
ND
Pri
mer
Allele
2
A A G G
iPLEX Genotyping Assay
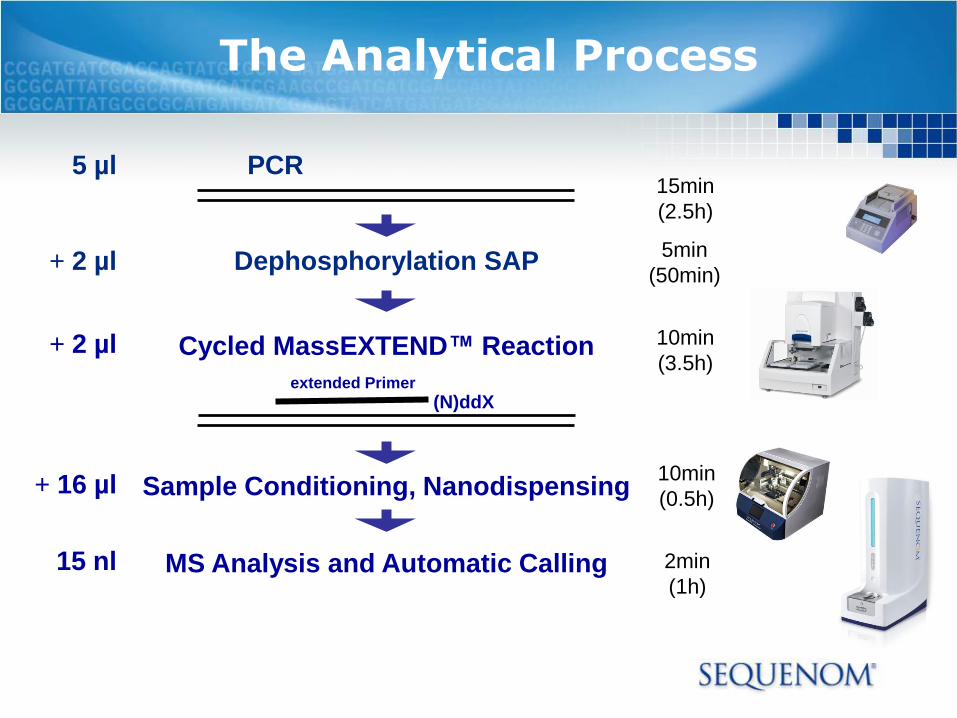
The Analytical Process
5 µl
+ 2 µl
+ 2 µl
+ 16 µl
15 nl
Dephosphorylation SAP
Cycled MassEXTEND™ Reaction
PCR
Sample Conditioning, Nanodispensing
MS Analysis and Automatic Calling
(N)ddXextended Primer
15min
(2.5h)
5min
(50min)
2min
(1h)
10min
(3.5h)
10min
(0.5h)
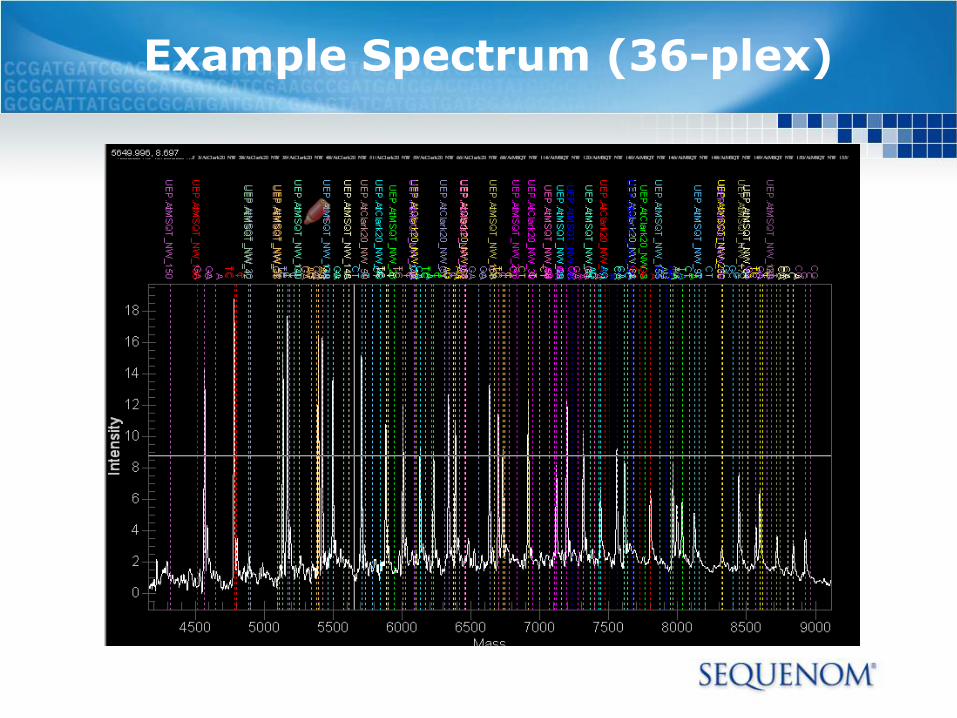
Example Spectrum (36-plex)

What is MassARRAY® QGE?
MassARRAY® QGE precisely measures
gene expression levels from a wide
variety of samples using rcPCR and
MALDI-TOF MS.
It’s the ideal method for fine mapping
and gene expression validation
100 1,000 10,000
10,000
1000
10
100
Number of Samples
Num
ber
of G
enes
Array
MassARRAY®
RT-PCR
Total RNA or mRNA is reverse-transcribed to cDNA. The resultant
cDNA and a synthesized competitor that differs in one nucleotide
undergo real competitive PCR (rcPCR).
Following amplification, remaining nucleotides are deactivated by
SAP treatment (not shown). A single base primer extension step is
performed, and the primer extension products are quantitatively
analyzed using MALDI TOF MS.

Quantitative Gene Expression Analysis

MassARRAY® QGE Process Workflow
Raw data acquisition, calculation of most stable genes, geometric mean, and normalization factors using geNorm
Treat, grow, & isolate as necessary
23
4
5
1QGE Assay Design
Run PCR
MassARRAY®
MALDI-TOF
SAP & Mass Extend
Isolate RNA Perform RT-PCR
C
SpectroCHIP®
& Nanodispenser
Perform mass extension with iPLEX®
chemistry
Design primers & synthetic competitor for each target; Run rcPCR reaction
Conditioning & automated dispensing
G
cDNA competitor

Features of MassARRAY® QGE
Feature MassARRAY® QGE Advantage
Assay Design o Examine 20-200 genes for large sample studies
o Multiplex up to 24 targets per reaction
o Run universal reaction conditions
o Start with as little as 5 pg material
Data Analysis o Detect as little as 3 molecules (1 aM) per reaction
o Differentiate 10% change in expression levels
o Get high precision over a large dynamic range (~3% CV)
o Normalize against multiple reference genes for more accurate data
Multi Application System o Analyze expression markers, methylation, genotype and sequence
o Combine data for better predictive studies

Gene Expression Workflow with MassARRAY® QGE
MassARRAY® QGE Applications
o Post-array validation
o Viral load determination
o Biomarker characterization
o Disease association studies
o Copy number variance
o Allelotyping experiments
o Loss of heterozygosity
o Quantitative infection resistance & drug
response
o Alternative to RT-PCR
Biological Question
Cancer
Autoimmune Disorders
Organ Rejection
Developmental Studies
Sample Preparation
Data Analysis and
Target Prioritization
Expression Profiling
Target Validation
and characterization
ControlSample
MassARRAY®
System
Gene Expression
Methylation
Genotyping
Microarray

rcPCR and QGE Assay Design
Real Competitive PCR
In rcPCR an internal standard
(competitor) and cDNA are co-
amplified in the same reaction.
The concentration of the target
transcript is calculated from the
ratio of the resulting PCR
products.
MassARRAY® QGE determines
the ratios through the
measurement of primer
extension product mass
signals.
How does the QGE Assay
Design Work?
• Up to 24 genes can be designed
and assayed in the same reaction
• Import gene name, transcript ID,
Exon_Exon ID and sequence for
each target of interest
(MySEQUENOM)
• Design PCR primers or mass
extend primer to span intron-exon
boundaries to prevent genomic
DNA contamination
• Finds the best set of primers for
the target nucleotide within a 80-
120 base region
• Allows you to select spectral
mass peak options for minimal
peak separation and the upper
peak limit, important when
multiplexing

MassARRAY® QGE Software
MassARRAY® QGE software accurately measures
gene expression levels. The QGE software
package follows these steps:
1. Create assays using QGE Assay Design
2. Import assays designed into QGE AssayEditor
3. Create and configure plates, applying assays
and samples in QGE PlateEditor
4. Transfer plate material to a SpectroCHIP® for
processing
5. Analyze spectral data acquired using QGE
Analyzer
QGE Assay Design
QGE Analyzer

Example Assay Design and Peak Pattern
Molecular Mass Legend
1 ..GC = 5835.8 Da
2 ..GCC = 6109.0 Da
3 ..GCG = 6149.0 Da
ACCAGCTTGACCAGCGACGC ACCACCTTGACCAGCGACGGTGGTCGAACTGGTCGCTGC
1 2 3
5500 6000 6500M/Z
9000
Interesting TipUp to 24 genes can be plexed in the same reaction
Instead of 3 peaks shown here, you would have up to 72 peaks within the spectra
Mass spectrum at left
represents one well in a 384-
well plate
TGGTCGAACTGGTCGCTGC
cDNA PCR product (CXCR4) Competitor PCR product
Extend primer Extend primer
TGGTCGAACTGGTCGCTGCG TGGTCGAACTGGTCGCTGCC
Mass Extension Reaction
Competitor extension productcDNA extension product

MS Profile of Competitor Titration and cDNA
Primer cDNA Competitor
5500 6000 6500M/Z
9000
Primer cDNA Competitor
5500 6000 6500M/Z
9000
Primer cDNA Competitor
5500 6000 6500M/Z
9000
Incre
asin
g c
om
pe
tito
r co
nce
ntr
atio
ns
A
B
C Interesting TipThe number of titration points and difference in
competitor concentrations between points is up to
you. It will differ depending on your knowledge of
the input cDNA.
In general, a 12-point titration with 1:7 serial
dilutions will cover the complete transcript range
(1-2.8 x 10⁸)
In a QGE experiment, as the competitor
concentration increases, the relative amount
of cDNA decreases proportionally
As depicted in panel B, a ratio of 1:1
represents equal amounts of competitor and
cDNA
A 1:1 ratio, dubbed the equivalence point
(EC50), is where amplification of both
species are equal
The initial cDNA concentration can be
determined from the competitor titration

PCR Plate Set-up with Competitor Titration
In this example, a competitor titration from 10-18 to 10-12 is used to
determine cDNA concentrations
One or more cDNA species (up to 24) can be quantified in each well
for any given cell/tissue type
The MALDI/TOF mass spectra will provide a readout of each
individual well (illustrated in next slide)

Competitive Template Titration
The graph shows the hill-slope curves for 3
genes (GAPDH, HMBS, & CXCR4) titrated
against the gene-specific competitor for a
given tissue sample.
The EC50 value for each gene is determined
by looking at the point where the cDNA
frequency is 0.500 (or 1:1).
The concentration of CXCR4 is ~1 x 10-13 M
(3 x 10⁵ molecules)
Since a broad competitor titration was used,
the concentration of all 3 genes could be
determined even if they are more than 3 logs
apart.
Interesting Tip
To calculate the number of molecules, divide the concentration by 1 x 10-18 and
multiply by 3.
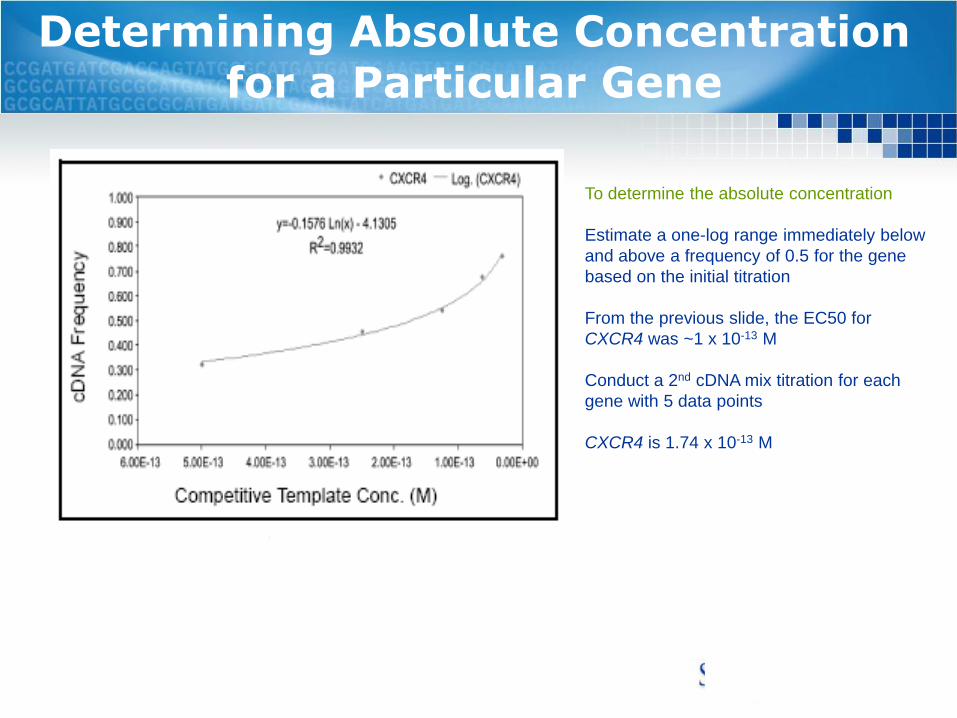
Determining Absolute Concentration for a Particular Gene
To determine the absolute concentration
Estimate a one-log range immediately below
and above a frequency of 0.5 for the gene
based on the initial titration
From the previous slide, the EC50 for
CXCR4 was ~1 x 10-13 M
Conduct a 2nd cDNA mix titration for each
gene with 5 data points
CXCR4 is 1.74 x 10⁻¹³ M
The Value and Ease of Data Normalization
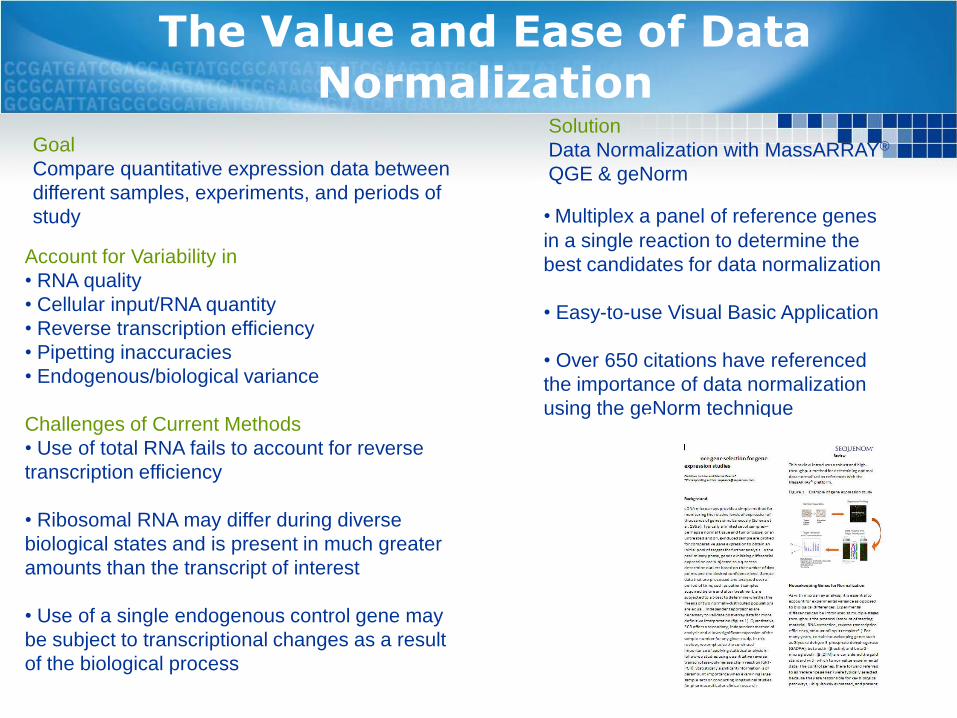
Goal
Compare quantitative expression data between
different samples, experiments, and periods of
study
Account for Variability in
• RNA quality
• Cellular input/RNA quantity
• Reverse transcription efficiency
• Pipetting inaccuracies
• Endogenous/biological variance
Challenges of Current Methods
• Use of total RNA fails to account for reverse
transcription efficiency
• Ribosomal RNA may differ during diverse
biological states and is present in much greater
amounts than the transcript of interest
• Use of a single endogenous control gene may
be subject to transcriptional changes as a result
of the biological process
Solution
Data Normalization with MassARRAY®
QGE & geNorm
• Multiplex a panel of reference genes
in a single reaction to determine the
best candidates for data normalization
• Easy-to-use Visual Basic Application
• Over 650 citations have referenced
the importance of data normalization
using the geNorm technique
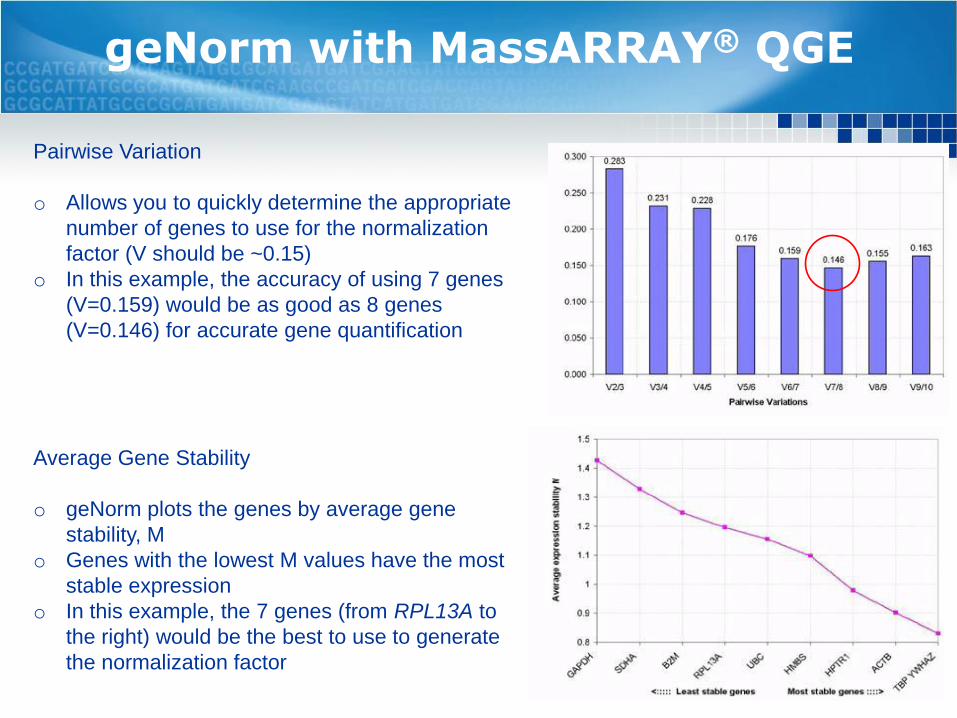
geNorm with MassARRAY® QGE
Pairwise Variation
o Allows you to quickly determine the appropriate
number of genes to use for the normalization
factor (V should be ~0.15)
o In this example, the accuracy of using 7 genes
(V=0.159) would be as good as 8 genes
(V=0.146) for accurate gene quantification
Average Gene Stability
o geNorm plots the genes by average gene
stability, M
o Genes with the lowest M values have the most
stable expression
o In this example, the 7 genes (from RPL13A to
the right) would be the best to use to generate
the normalization factor

Human Normalization Panel

QGE has Many Advantages over Real-time PCR for Gene Quantitation
Results
Comparing ratios for 12 different assays with up to
10,000 fold differences in expression levels it has
been reported that there is not statistically
significant difference between the results from
QGE and RT-PCR; except sensitivity.
• 100% of MassARRAY® QGE assays worked
first-pass with standardized PCR conditions
• 42% of assays failed first pass in RT-PCR
• ~50-100 times less total RNA was used in QGE
• Greater sensitivity was obtained with QGE
• Uniform standard conditions can be used with
QGE
Elvidge et al. Anal. Biochem., Vol. 339, 2005
RT-PCR
Expected ratio
QGE

RT-PCR QGE
Gene Tm Ratio Ratio Concentration Tm
BMP2 - - 0.74 10-17 M 56
BNIP3 62 9.36 7.70 10-14 M 56
CA9 60 40.43 72.25 10-14 M 56
EGLN1 62 2.95 3.29 10-14 M 56
EGLN2 60 0.91 0.97 10-15 M 56
EGLN3 60 9.02 6.46 10-14 M 56
HFE - - 1.78 10-17 M 56
HIF1A 56 0.41 0.48 10-15 M 56
NDRG1 62 51.28 52.75 10-14 M 56
PPP1CC 56 0.74 0.71 10-15 M 56
SLC3A2 58 1.38 1.87 10-14 M 56
VEGF 60 4.21 2.81 10-13 M 56
Comparison of Results betweenQGE and SYBR Green RT-PCR
Elvidge et al. Anal. Biochem., Vol. 339, 2005
• QGE reactions required
only one condition
• RT-PCR required 4
different conditions
• QGE was more sensitive
than RT-PCR
• QGE gives absolute
amounts rather than
relative numbers
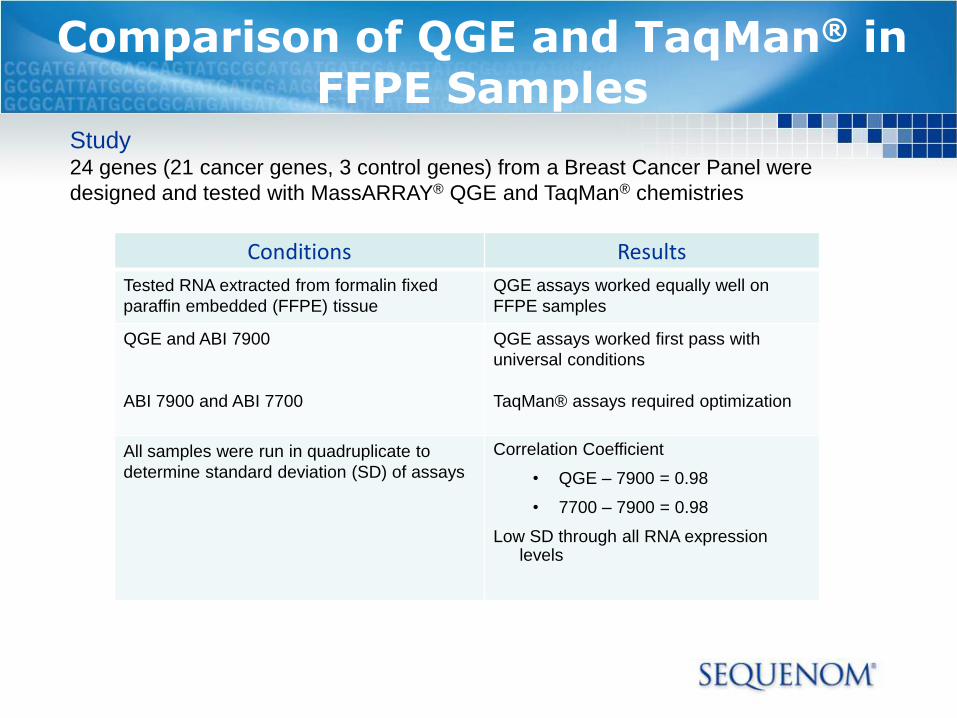
Comparison of QGE and TaqMan® in FFPE Samples
Conditions Results
Tested RNA extracted from formalin fixed
paraffin embedded (FFPE) tissue
QGE assays worked equally well on
FFPE samples
QGE and ABI 7900
ABI 7900 and ABI 7700
QGE assays worked first pass with
universal conditions
TaqMan® assays required optimization
All samples were run in quadruplicate to
determine standard deviation (SD) of assays
Correlation Coefficient
• QGE – 7900 = 0.98
• 7700 – 7900 = 0.98
Low SD through all RNA expressionlevels
Study24 genes (21 cancer genes, 3 control genes) from a Breast Cancer Panel were
designed and tested with MassARRAY® QGE and TaqMan® chemistries

0
10
100
1000
10,000
100,000
20
40
60
80
0
100
Co
nce
ntr
atio
n (f
M)
Relative Stan
dard
Deviatio
n (R
SD) %
• Relative Average Standard Deviation for QGE of 2.6%
• Relative Standard Deviation doesn’t vary with concentration
1 2 3 4 5 6 7 8 9 10 11 12 13 14 15 16 17 18 19 20 21 22 23 24
Expression RSD
3% RSD
Relative Standard Deviation for QGE Assay Doesn’t Vary with Concentration

Validation of gene expression data
Objectives
• Use alternate technology to
validate gene expression levels in
samples previously run on
microarrays
• Identify a smaller subset of
biomarker genes to assay using
signal-to-noise, shrunken
centroid, and minimum entropy
• Assess level of agreement in
gene expression level data from
microarray and iPLEX® assay
measurements
Conclusions
• MassARRAY® system
successfully measures gene
expression levels
• Method validated original
microarray data
• 20-gene subset may be enough
for clinical diagnostic use
• iPLEX® multiplexing will allow for
3 new 20-plex assays to measure
60 remaining probe sets
Next Steps
Additional subsets
Development of clinical panel
Affx Array HG-U133A
38,500 genes
Informative Panel
80-gene signature
Control gene panel
MassARRAY®
20-gene subset
10 control genes
Biological Question
Identify biomarkers for
lung cancer using
smokers without cancer
and smokers with cancer
Smoker
Without
Cancer
Smoker
With Cancer

MassARRAY® System for Multiple Applications
APPLICATIONS
Genotyping – iPLEXTM Gold
Assay Design
Individual and Multiplexed Genotyping
Oligo QC
Haplotyping
Quantitative Gene Analysis - QGE
Allele/Mutation Frequency Analysis
Expression Profiling
LOH
Gene Copy Number
Viral Load
Comparative Sequence Analysis
SNP Discovery
Pattern Recognition
(Microbial Typing)
Methylation Analysis - EpiTyperTM

Ultrasensitive mRNA Detection of Nearly Identical Plant Genes
Soybean is a complex plant with
many genes having transcribed
homologs
“MassARRAY readily distinguished between nearly identical gene transcripts, and accurately measured differential levels in a single assay using minute amounts of plant total RNA (5 ng) “
“simple diploid genomes like one of Arabidopsis have long stretches of highly homologous DNA and duplicated
genes and would benefit from this approach”
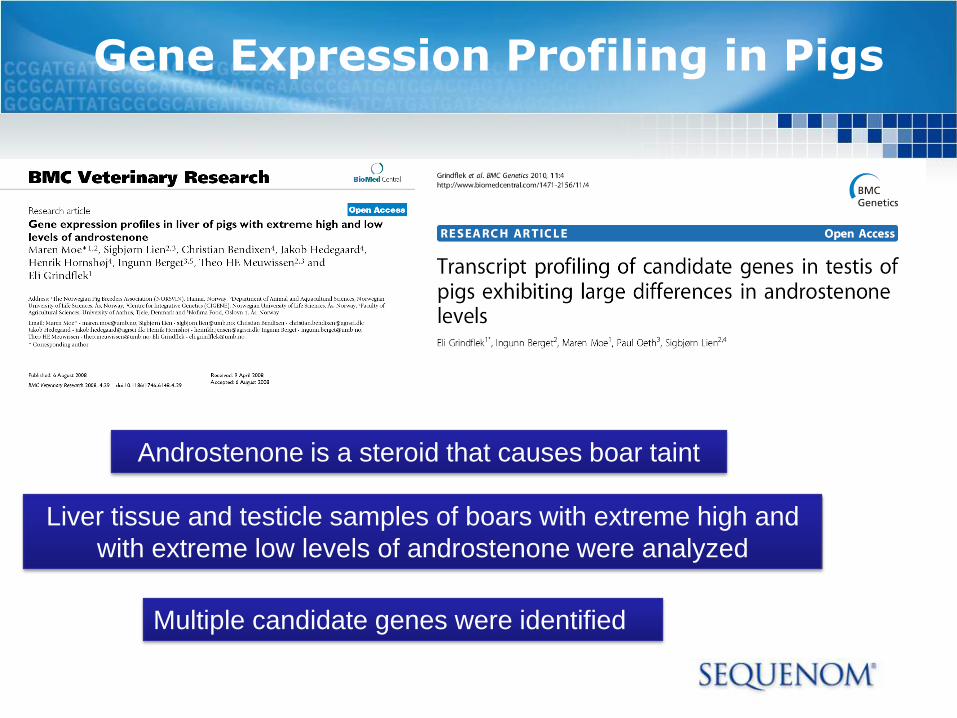
Gene Expression Profiling in Pigs
Androstenone is a steroid that causes boar taint
Liver tissue and testicle samples of boars with extreme high and
with extreme low levels of androstenone were analyzed
Multiple candidate genes were identified

Cancer Res 2009; 69: (13). July 1, 2009; 5568-5574
Gene Expression Profiling in Prostate Cancer
Polymorphisms in non-coding
regions at 8q24 are known to be
associated with prostate cancer risk
Next gen sequencing was used to identify miRNAs expressed in
prostatectomy tissue
Transcript levels of multiple genes (esp. MYC) were analyzed in
context of risk allele status (incl. a 14plex)
No evidence was found for significant miRNA transcription and no
convincing association between
RNA expression and risk-allele status was detected.

VOLUME 41 NUMBER 8 AUGUST 2009 NATURE GENETICS; 882-884
The 3C Method in Colorectal Cancer
3C: chromatin
conformation
capture
competitive
quantitative PCR
3C: Fixation of cells in specific chromatin
formation
RE digestion, fragment ligation, de-
crosslinking
-> library of ligation products
“This platform (Sequenom QGE) possesses the properties necessary
for rigorous quantification and has been shown to be sensitive,
accurate, and precise in the detection of nucleic acids”

PCR Amplification
Primer Extension
Peak Area
comparison
GC
SAP Treatment
Sample conditioning, nanodispensing & mass spectrometry
C
G
G
CgDNA Amplicon Competitor Amplicon
Genomic DNA mixed
with Competitor
Genomic DNA Competitor
C
G
Competitive PCR
PrimerPrimer
Gene Copy Number Analysis
Oeth et al AACR Poster (2005)

Quantification of Gene Amplification
RT-PCR
MassARRAY® QGE for quantification of HER2 amplificationThe HER2 gene encodes for a receptor of the EGF receptor family and is amplified in ~30% of invasive breast cancer cases. The drug Herceptin® selectively blocks the receptor on the cell surface reducing tumor growth (Figure 1).
To classify the tumor and determine if Herceptin® will be an effective treatment, tumor tissue is analyzed for over-expression of the receptor on the cell surface or gene amplification of the HER2 gene.
Current Methods and ResultsCurrent methods for assessment include quantifying gene amplification via FISH (staining for chromosome 17 q11.2-q12.0) and membrane staining of malignant cells for protein expression using IHC (Figure 2). The concordance rate between the two methods is 98.7%. FISH and IHC can be expensive and time consuming.
MCF7—normal copy number control with normal expression levels of HER2 protein
T-47D—previously shown to have 2-fold increase in copy number compared to MCF7 and exhibits HER2 over-expression
BT-474—known to have significant gene amplification associated with high HER2 protein over-expression
Results with MassARRAY® QGEThe MassARRAY® QGE method was used to determine differences in copy number of ERB2 associated with chromosome 17 q12 amplification in 3 breast cancer cell lines: MCF7, T-47D, and BT-474.
Our data (Figure 3) confirms these previous characterizations and shows greater than 20-fold increase in gene copy number between BT-474 and T-47D, and 40-fold increase in gene copy number relative to the MCF7 cell line. MassARRAY® QGE offers accuracy, throughput, sample conservation, and reduction in processing time.
Figure 1
Figure 2
FISH
IHC
Figure 3

MassARRAY ® in HPV detection
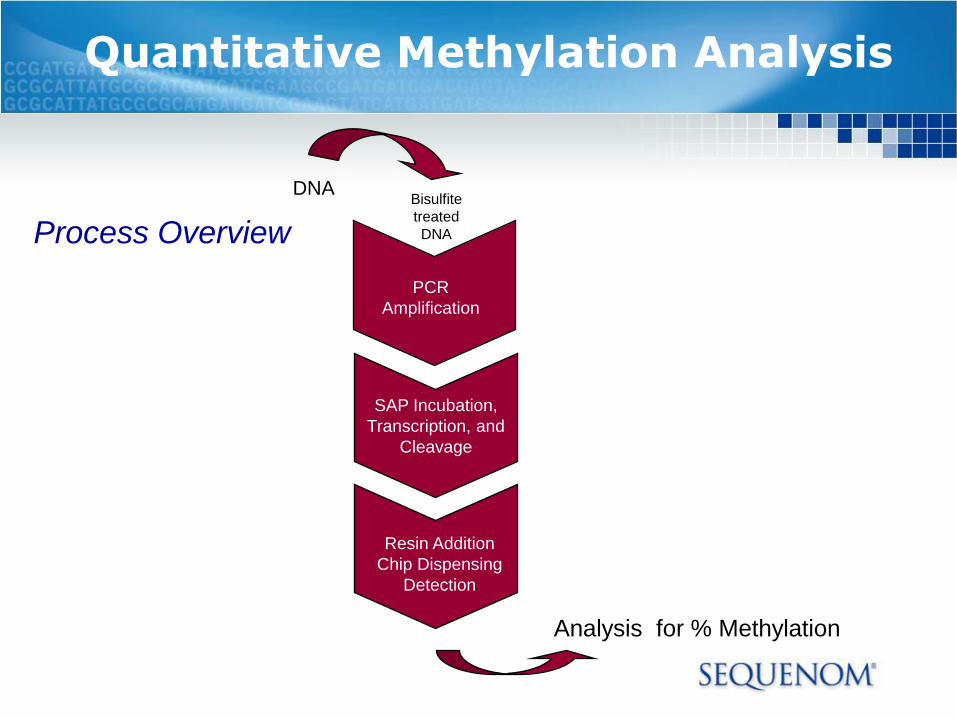
PCR
Amplification
SAP Incubation,
Transcription, and
Cleavage
Resin Addition
Chip Dispensing
Detection
DNABisulfite
treated
DNA
Quantitative Methylation Analysis
Analysis for % Methylation
Process Overview

EpiTyper™-Assay Concept
Bisulfite treatment introduces “methylation dependent“ sequence changes.
A G T C A G A G A C G
A G T T A G A G A C G
Bisulfite treatment
PCR
me
me
A G T U A G A G A C G
A G T C A G A G A C G
A G T T A G A G A T G
Bisulfite treatment
PCR A G T U A G A G A U G
Bisulfite treatment converts every Cytosine to Uracil whereas every methylated Cytosine stays Cytosine.

PCR from genomic DNA
after Bisulfit treatment
SAP treatment
In vitro transcription
base-specific
cleavage reaction
Conditioning
Dispensing
MALDI-TOF MS
5’- -3’
T7 tagged primer
5’- -3’
T7 promotor
3’- -5’
UU
U
reverse strand
Quantitative Methylation Analysis

Quantitative Methylation Analysis
3100 3150 3200 3250 3300 3350 3400
1 (publicatio) 2 (publicatio) 3 (publicatio) 4 (publicatio)
100% Methylated Template
50% Methylated Template
30% Methylated Template
0% Methylated Template
CG
CG
AC
CA
CT
CG
CA
AC
CA
CT

Positioning EpiTYPER™
Ultra Sensitive Detection
Genome Wide Analysis
High ThroughputAccurate, quantitativeScanning of Target RegionsDetermination of % Methylation at Individual CpG
Accurate
Quantitative
Analysis
SEQUENOM®
EpiTYPER™

EpiTYPER™ Overview
Quantitative• Allows quantitative assessment of relative methylation in target
regions between 100-600 bp length.
Range• Relative methylation can be assessed in a range between 5 - 95 %
with a standard deviation of 5%.
Uses Standard Bisulfite Kits• Process works with most commercial bisulfite treatment kits
(usually 1µg genomic DNA required in these kits)
Flexible• Process works from paraffin embedded tissue as well as higher
quality DNA
Assay an entire region for CpGs
• Quantitation of ~85% of CpG sites in any amplicon

Quantitative Methylation Analysis in Lung Cancer
48 patients tumor and
adjacent normal tissue
analyzed
EpiTyper: analysis of 47
promoter regions including
1425 individual CpG sites
Clear clustering of tumor and normal samples

Microarray expression analysis
EpiTyper: analysis of miRNA-129-2 CpG island
Majority of the tumors were hypermethylated. This
results in miRNA-129-2 silencing, which de-represses
SOX4 expression. This was correlated to shorter overall
survival, microsatellite instability and MLH1 methylation
status.
Comprehensive screening of miRNA regulators at the
3´UTR regions of all known oncogenes is suggested
EpiTyper™: Endometrial Cancer

EpiTyper™: Colorectal Cancer
Whole genome approach
EpiTyper: 60 markers for validation
Clustering in to 3 EpigenotypesHME (high-methylation epigenotype)
IME (intermediate-methylation epigenotype)
LME (low-methylation epigenotype)
Worse prognosis: IME + KRAS-mutation(+)

• Methylation was much better predictor of survival
than expression
• Combining both methodologies provides best
results
• MassARRAY® platform can do both gene
expression and methylation
Gene Expression Methylation Combined algorithm
Combined Algorithm is More Predictive thanExpression or Methylation Individually
Related Documents