http://fst.sagepub.com/ International Food Science and Technology http://fst.sagepub.com/content/10/5/323 The online version of this article can be found at: DOI: 10.1177/1082013204047904 2004 10: 323 Food Science and Technology International L. A. Ramallo, C. Schvezov and R. H. Mascheroni Mass Transfer During Osmotic Dehydration of Pineapple Published by: http://www.sagepublications.com On behalf of: Consejo Superior de Investigaciones Científicas (Spanish Council for Scientific Research) can be found at: Food Science and Technology International Additional services and information for http://fst.sagepub.com/cgi/alerts Email Alerts: http://fst.sagepub.com/subscriptions Subscriptions: http://www.sagepub.com/journalsReprints.nav Reprints: http://www.sagepub.com/journalsPermissions.nav Permissions: http://fst.sagepub.com/content/10/5/323.refs.html Citations: What is This? - Dec 2, 2004 Version of Record >> at UNLP on July 1, 2014 fst.sagepub.com Downloaded from at UNLP on July 1, 2014 fst.sagepub.com Downloaded from

Welcome message from author
This document is posted to help you gain knowledge. Please leave a comment to let me know what you think about it! Share it to your friends and learn new things together.
Transcript
http://fst.sagepub.com/International
Food Science and Technology
http://fst.sagepub.com/content/10/5/323The online version of this article can be found at:
DOI: 10.1177/1082013204047904
2004 10: 323Food Science and Technology InternationalL. A. Ramallo, C. Schvezov and R. H. Mascheroni
Mass Transfer During Osmotic Dehydration of Pineapple
Published by:
http://www.sagepublications.com
On behalf of:
Consejo Superior de Investigaciones Científicas (Spanish Council for Scientific Research)
can be found at:Food Science and Technology InternationalAdditional services and information for
http://fst.sagepub.com/cgi/alertsEmail Alerts:
http://fst.sagepub.com/subscriptionsSubscriptions:
http://www.sagepub.com/journalsReprints.navReprints:
http://www.sagepub.com/journalsPermissions.navPermissions:
http://fst.sagepub.com/content/10/5/323.refs.htmlCitations:
What is This?
- Dec 2, 2004Version of Record >>
at UNLP on July 1, 2014fst.sagepub.comDownloaded from at UNLP on July 1, 2014fst.sagepub.comDownloaded from
Mass Transfer During Osmotic Dehydration of Pineapple
L.A. Ramallo,1 C. Schvezov1 and R.H. Mascheroni2∗
1Facultad de Ciencias Exactas, Químicas y Naturales, Universidad Nacional de Misiones, Felix de Azara 1552,3300 Posadas, Misiones, Argentina
2CIDCA (CONICET – UNLP) and MODIAL Facultad de Ingeniería, UNLP, 47 and 116, 1900 La Plata,Argentina
The diffusion coefficients of water and solutes are important parameters in the analysis, design and opti-misation of an osmotic dehydration process. This work estimated by Fick’s Law the diffusion coefficientsof water and sucrose during the osmotic dehydration of slices of pineapple fruit in sucrose solution atdifferent temperatures. In addition, it analysed the effect of the change in thickness (shrinkage) duringthe process, and the use of higher order terms in the analytical solution. The model results were in goodagreement with experimental data of water loss and solid gain. The best fit was found when the shrink-age was considered in a simple model based on the solution of Fick’s Law. The equilibrium watercontent ranged between 34 and 36% for a 60% w/w sucrose solution and was practically independent oftemperature. Equilibrium sugar content increased from 45 to 54% as the temperature rose from 30 to50°C. Thickness variation was found to be independent of temperature and was only dependent onwater content.
Key Words: pineapple, osmotic dehydration, diffusion coefficients
INTRODUCTION
There is currently a worldwide interest in develop-ing conservation methods for fruits and vegetables thatprovoke the least changes in the food’s originalcharacteristics and that can also be used to induce spe-cific quality enhancements in the food, such as bettertaste or texture or the incorporation of selected addi-tives. Osmotic dehydration (OD) is one of the mostoften cited techniques because it can comply with allthe above-mentioned features. Meanwhile, the applica-tion of OD to other, more common fruits like apples,pears, strawberries, bananas, etc., has been extensivelystudied (Torregiani, 1993; Spiazzi and Mascheroni,1997), although the potential OD treatment of pineap-ple has been much less investigated (Ramallo, 2001).
In brief, osmotic dehydration is a technique used forthe partial removal of water when foods (normallyfruits or vegetables) are placed in a hypertonic solu-tion. During the process, two counter-current flowstake place: water flows out from the food to the solu-
*To whom correspondence should be sent(e-mail: [email protected]).Received 4 September 2003; revised 20 April 2004.
Food Sci Tech Int 2004; 10(5):323–332© 2004 Sage PublicationsISSN: 1082-0132DOI: 10.1177/1082013204047904
tion and the solute is transferred from the solution tothe food. The design of its commercial applicationsneeds to count on methods for the prediction of masstransfer during the process. A realistic description ofthe physical characteristics of osmotic dehydrationimplies considering diffusion between cells, within thecellular volume and across cell membranes (Marcotteand Le Maguer, 1992; Spiazzi and Mascheroni, 1997;Yao and Le Maguer, 1997).
In most cases, OD is modelled in an oversimplifiedway by means of Fick’s Second Law. When, addition-ally, constant properties and homogeneous structureare supposed, there exists an analytical solution forregular shapes that has the form of an infinite series(Crank, 1975). Later reduction from the analyticalsolution to a simplified linear model that uses only thefirst term of the series may introduce significant errors,additional to those due to the simplification of thephysical problem (Feng et al., 2000). Differentsimplified approaches to the exact solution imply dif-ferent degrees of accuracy in predicted concentrationsand diffusion coefficients (Azuara et al., 1992; Nsonziand Ramaswamy, 1998; Sabadini et al., 1998;Achariyaviriya et al., 2000).
The diffusion coefficients of water and solutes areimportant parameters in the analysis, design and opti-misation of the osmotic dehydration process. As previ-ously stated, in general, the method of linear solutionof Fick’s law with constant volume was used to estim-ate the diffusion coefficients. But, in fact, during the
05 228FST10.5.047904 21/9/2004 09:26 Page 323
at UNLP on July 1, 2014fst.sagepub.comDownloaded from
osmotic dehydration process, the food undergoesimportant changes in thickness (Spiazzi andMascheroni, 1997; Mavroudis et al., 1998; Reppa et al.,1999). Therefore, the assumption of constant volumeintroduces additional sources of error in the predictionof diffusion coefficients.Based on the above-mentioned characteristics of OD,the purposes of this work were the determination ofthe equilibrium water and sucrose contents and thevolume variation during the osmotic dehydration ofslices of pineapple in a stirred sucrose solution at dif-ferent temperatures; the development of a simplemodel based on the solution of Fick’s Law with shrink-age to predict the osmotic dehydration kinetics ofpineapple slices and to study the accuracy of differentsimplified schemes; the estimation of the diffusioncoefficients of water and sucrose using the linear solu-tion of Fick’s Law, and to quantify the effect of consid-ering shrinkage and the use of higher order terms inthe analytical solutions on predicted coefficient values.Also, the influence of temperature on the diffusioncoefficient was determined.
MATERIALS AND METHODS
Sample Preparation
Pineapples of the variety Anana Comosus CayenaLisa were used for the assays. Fruits were producedover the coast of Uruguay River, Misiones, Argentina,and those with a commercial degree of maturity andstill firm texture were selected. Fruits were manuallypeeled, cored, cut in the shape of half-slices 0.6cmthick and 11.5 ± 0.5cm in diameter, and gently blottedwith tissue paper to remove the excess of surfacehumidity. Thin half slices were selected to ensure uni-dimensional diffusion during dehydration experiments.
There is a great variation in sugar concentrationbetween the base and the top of the fruit, thereforeonly the central zone of each fruit was used to obtainhomogeneous samples for sample preparation.
Volume Variation During Dehydration
Mass diffusion was assumed to be unidimensionaland sample diameter remains almost constant duringdehydration due to the particular structure of pineap-ple tissues, the effect of shrinkage, expressed as avolume factor (Sv), that relates the current thickness lto its initial value l0, can be defined as (Mavroudis etal., 1998):
Sv = l/l0
The dependence of Sv with the dimensionless watercontent w/w0 (w current and w0 initial water contents,
dry basis) was analysed applying different regressionmodels. The model that better represented the behavi-our of the system is that with higher correlation coeffi-cient.
Osmotic Dehydration
An aqueous sucrose solution (60% w/w) was used asa dehydrating agent. The weight ratio of solution tofruit was at least 20 :1 to avoid significant dilution ofthe medium during the experiments. The vessel wascovered with a sheet of aluminium film to preventevaporation of syrup. Dehydration was run immersingan open mesh plastic basket with the fruit in the stirredosmotic solution at the pre-selected temperature. Atpre-established times, a sample (a half-slice) wasremoved from the osmotic medium, rinsed withdeionised water and blotted with tissue paper toremove excess surface solution. The sample wasweighed and its thickness was measured, then it wasdivided into two fractions. One was used to determinewater content and the other for sugars content.
Dehydration tests were performed at 30 and 50°C induplicate and at 40°C by sextuplicate, so as to bettercharacterise the possible dispersion of experimentaldata.
Determination of Water Content
Moisture content was determined gravimetrically byvacuum oven drying at 70 ºC until constant weight (forapproximately 40h).
Determination of Sucrose Content
Each sample was weighed and crushed in mortar for10min, then 80mL of ethanol-water solution (80 :20 involume) for each 2.5g of fruit was added. The mixturewas allowed to settle in a water bath at 75 ºC for 1hwith sporadic stirring, and then filtered through filterpaper (the solid residue was washed with 20mL ofethanol–water solution, and added to the main solu-tion). The final volume was registered and the solutionwas kept under refrigeration until it was used for thechromatographic analysis.
Quantitative determination was performed by liquidchromatography (HPLC) in isocratic conditions withan Amino-NH2 column (250mm � 4.6mm), mobilephase of acetonitrile :water (75 :25) with a flow rate of1.5mL/min and refraction index detector.
Modelling of Water and Sucrose Diffusion in the Fruit
Unidirectional diffusion during OD of fruit or veg-etable disks is the normal assumption. This approachhas been recently used, among others, with bananaslices 6mm thick (Waliszewski et al., 1997) with apple
324 L.A. RAMALLO ET AL.
05 228FST10.5.047904 21/9/2004 09:26 Page 324
at UNLP on July 1, 2014fst.sagepub.comDownloaded from
disks 5mm thick and 70mm in diameter (Kaymak-Ertekin and Sultanoglu, 2000), with 0.4�4�4cm and0.6�6�6cm apple slabs (Salvatori and Alzamora,2000) and with potato slices 1cm thick (Rastogi et al.,2000). In the particular case of OD of pineapple,Kosegarten-Conde et al. (1999) and Nicoleti et al.(2001) considered 1cm thick pineapple slices (cored oruncored) as infinite slabs.
Our approximate theoretical evaluation was basedon samples size and shape, the experimental values ofDef for water and sucrose and on the considerationsfrom a previous work paper (Turhan and Erdogdu,2003). These calculations showed that the assumptionof plane plate geometry introduced a relative error inpredicted concentrations lower than 1% during thefirst 6h of process at 30°C that extends to 12h at 50°C.
The weight ratio of solution to fruit of at least 20 :1and the gentle stirring of the solution assured the con-ditions of constant solute concentration on the surfaceof samples.
The mass balances considering unidimensional dif-fusion in rectangular coordinates are:
��
�
W
t� � �
�
�
x� �Dwef �
�
�
W
x�� (1)
��
�
S
t� � �
�
�
x� �Dsef �
�
�
S
x�� (2)
The analytical solutions to (1) and (2) in terms ofaveraged concentrations W� and S� (Fick’s second law),considering uniform initial concentrations of water andsolute, Wo and So, external constant concentrationsWe and Se, constant size of the sample, homogeneousstructure and constant diffusion coefficients, can bewritten as (Crank, 1975):
� ��
n�0
exp ��Dwef (2n � 1)2 t� (3)
� ��
n�0
exp ��Dsef (2n � 1)2 t� (4)
Approximations to the Analytical Solution
Equations (3) and (4) have the drawbacks of beinginfinite series difficult to evaluate and from which dif-
fusion coefficients and process time cannot be derivedin a straightforward manner. Normally, approximateversions of these solutions are used in the evaluation ofmost dehydration processes, not only OD but also inhot-air drying (Zogzas and Maroulis, 1996; Feng et al.,2000; Varadharaju et al., 2001).
These approximations can be arbitrarily classified inconstant volume and variable volume methods.
Constant Volume Methods
Model I.I. Slope Method
This method uses only the first term of the analyticalsolution. Its use is widespread in the modelling of thedrying processes (Sander et al., 1998; Karatas andPinarh, 2001). It is based in the property of the analyti-cal solution that – at sufficiently long times – the termsof order higher than 1 tend to zero. Notwithstanding,in many cases, this simplification is used throughout allthe dehydration process.
The simplified forms of the analytical solutions (3)and (4) are:
� exp ��Dwef t� (5)
� exp ��Dsef t� (6)
Model I.II. Use of Higher Order Terms
This model is the same, but uses more than oneterm in the analytical solution in order to decrease thetruncation error.
When using only one term on the series solution,some criteria of validation have been reported, as thecondition (W�–We)/(Wo–We) < 0.6 (Perry et al., 1984).It is important to determine the number of terms of theanalytical solution needed for the convergence ofEquations (3) and (4) to the experimental data of ODover all the time period. In order to estimate this, theresults of fitting n-terms expressions of Equations (3)and (4) were compared to the fitting of results to the(n+1)-terms expressions. A statistical study of thesefittings (Ramallo, 2001) showed that there were nosignificant differences to the 95% of confidence levelbetween using three and four terms in the analyticalsolutions. So, only three terms were used in this model.The resulting equations were:
2
�4l 2
8�2
S� � Se�So � Se
2
�4l 2
8�2
W� � We��Wo � We
2
�4l 2
1��(2n � 1)2
8�2
S� � Se�So � Se
2
�4l 2
1��(2n � 1)2
8�2
W� � We��Wo � We
Mass Transfer During Osmotic Dehydration of Pinea 325
05 228FST10.5.047904 21/9/2004 09:26 Page 325
at UNLP on July 1, 2014fst.sagepub.comDownloaded from
Variable Volume Models
These models incorporate the volume variationduring dehydration, as a function of average watercontent, derived from experimental data in Equation(13). Two options, similar to the case of constantvolume were tested.
Model II.I. Slope Method with Shrinkage
This model uses only the first term of the series solu-tion and incorporates – in an approximate manner –the shrinkage in the value of l. Similar procedures wereused recently by Achariyaviriya et al. (2000) in model-ling OD of mango and papaya and by Azzous et al.(2002) in drying of grapes. The equations obtainedwere:
� exp ��Dwef
t� (9)
� exp ��Dsef
t� (10)
Model II.II. Use of Higher Order Terms and Shrinkage
The resulting equations are similar to Equations (7)and (8), but the constant thickness l was replaced by itsvariable value given by Equation (13).
�
exp ��Dwef t�� �
1
9� exp ��9Dwef t� (11)
� �2
1
5� exp��25Dwef t�
�
exp ��Dsef t�� �
1
9� exp ��9Dsef t� (12)
� �2
1
5� exp��25Dsef t�
RESULTS AND DISCUSSION
Volume Variation During Dehydration
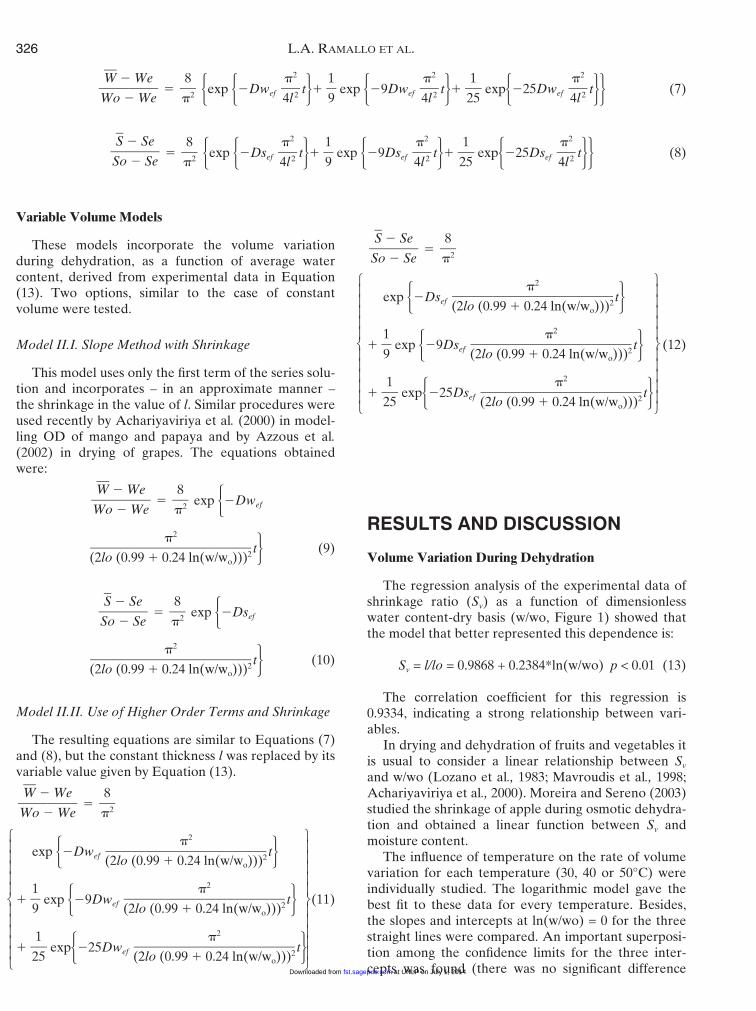
The regression analysis of the experimental data ofshrinkage ratio (Sv) as a function of dimensionlesswater content-dry basis (w/wo, Figure 1) showed thatthe model that better represented this dependence is:
Sv = l/lo = 0.9868 + 0.2384*ln(w/wo) p < 0.01 (13)
The correlation coefficient for this regression is0.9334, indicating a strong relationship between vari-ables.
In drying and dehydration of fruits and vegetables itis usual to consider a linear relationship between Sv
and w/wo (Lozano et al., 1983; Mavroudis et al., 1998;Achariyaviriya et al., 2000). Moreira and Sereno (2003)studied the shrinkage of apple during osmotic dehydra-tion and obtained a linear function between Sv andmoisture content.
The influence of temperature on the rate of volumevariation for each temperature (30, 40 or 50°C) wereindividually studied. The logarithmic model gave thebest fit to these data for every temperature. Besides,the slopes and intercepts at ln(w/wo) = 0 for the threestraight lines were compared. An important superposi-tion among the confidence limits for the three inter-cepts was found (there was no significant difference
2
����(2lo (0.99 � 0.24 ln(w/wo)))2
2
����(2lo (0.99 � 0.24 ln(w/wo)))2
2
����(2lo (0.99 � 0.24 ln(w/wo)))2
8�2
S� � Se�So � Se
2
����(2lo (0.99 � 0.24 ln(w/wo)))2
2
����(2lo (0.99 � 0.24 ln(w/wo)))2
2
����(2lo (0.99 � 0.24 ln(w/wo)))2
8�2
W� � We��Wo � We
2
����(2lo (0.99 � 0.24 ln(w/wo)))2
8�2
S� � Se�So � Se
2
����(2lo (0.99 � 0.24 ln(w/wo)))2
8�2
W� � We��Wo � We
326 L.A. RAMALLO ET AL.
� �exp ��Dwef t�� �1
9� exp ��9Dwef t�� �
2
1
5� exp��25Dwef t�� (7)
� �exp ��Dsef t�� �1
9� exp ��9Dsef t�� �
2
1
5� exp��25Dsef t�� (8)
2
�4l 2
2
�4l 2
2
�4l 2
8�2
S� � Se�So � Se
2
�4l 2
2
�4l 2
2
�4l 2
8�2
W� � We��Wo � We
05 228FST10.5.047904 21/9/2004 09:26 Page 326
at UNLP on July 1, 2014fst.sagepub.comDownloaded from
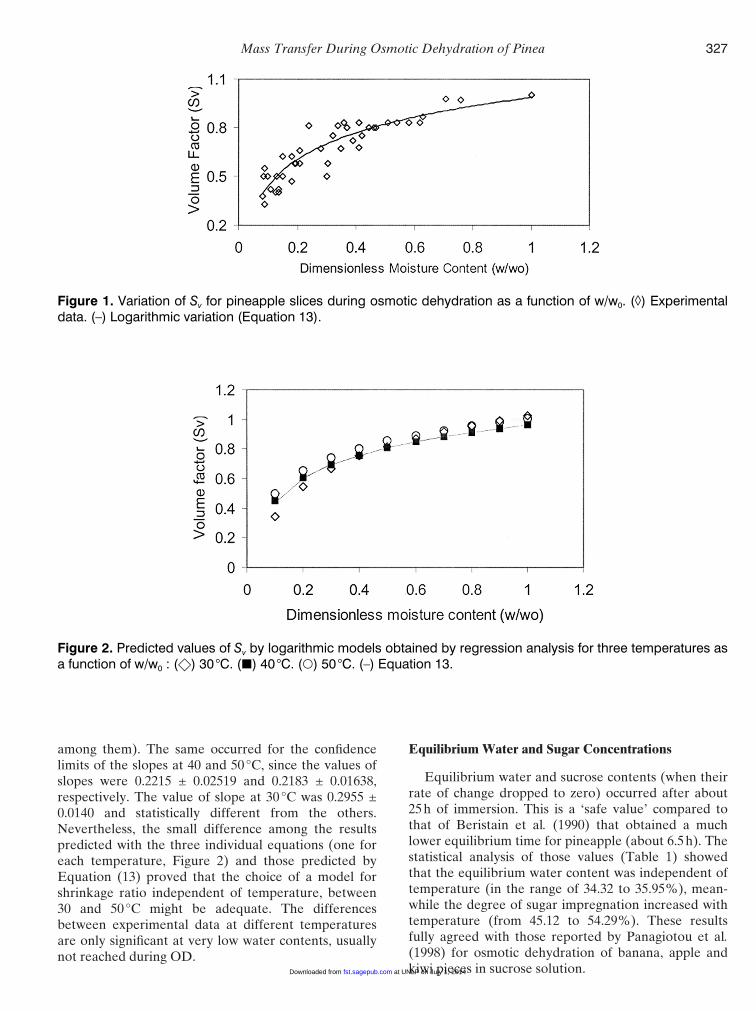
among them). The same occurred for the confidencelimits of the slopes at 40 and 50°C, since the values ofslopes were 0.2215 ± 0.02519 and 0.2183 ± 0.01638,respectively. The value of slope at 30°C was 0.2955 ±0.0140 and statistically different from the others.Nevertheless, the small difference among the resultspredicted with the three individual equations (one foreach temperature, Figure 2) and those predicted byEquation (13) proved that the choice of a model forshrinkage ratio independent of temperature, between30 and 50°C might be adequate. The differencesbetween experimental data at different temperaturesare only significant at very low water contents, usuallynot reached during OD.
Equilibrium Water and Sugar Concentrations
Equilibrium water and sucrose contents (when theirrate of change dropped to zero) occurred after about25h of immersion. This is a ‘safe value’ compared tothat of Beristain et al. (1990) that obtained a muchlower equilibrium time for pineapple (about 6.5h). Thestatistical analysis of those values (Table 1) showedthat the equilibrium water content was independent oftemperature (in the range of 34.32 to 35.95%), mean-while the degree of sugar impregnation increased withtemperature (from 45.12 to 54.29%). These resultsfully agreed with those reported by Panagiotou et al.(1998) for osmotic dehydration of banana, apple andkiwi pieces in sucrose solution.
Mass Transfer During Osmotic Dehydration of Pinea 327
Figure 1. Variation of Sv for pineapple slices during osmotic dehydration as a function of w/w0. (◊) Experimentaldata. (–) Logarithmic variation (Equation 13).
Figure 2. Predicted values of Sv by logarithmic models obtained by regression analysis for three temperatures asa function of w/w0 : (�) 30 °C. (�) 40 °C. (�) 50 °C. (–) Equation 13.
05 228FST10.5.047904 21/9/2004 09:26 Page 327
at UNLP on July 1, 2014fst.sagepub.comDownloaded from
Variation of Water and Sucrose Concentration andApparent Diffusion Coefficients
The results obtained at 40°C were used to comparethe accuracy of the different models, because theexperimental procedure at this temperature was run bysextuplicate.
The agreement between experimental results andthe predicted values for the different models duringosmotic dehydration of pineapple slabs at 40°C(Figures 3 and 4) showed that additional modificationsin the classic linear model (I.I), transformed into
328 L.A. RAMALLO ET AL.
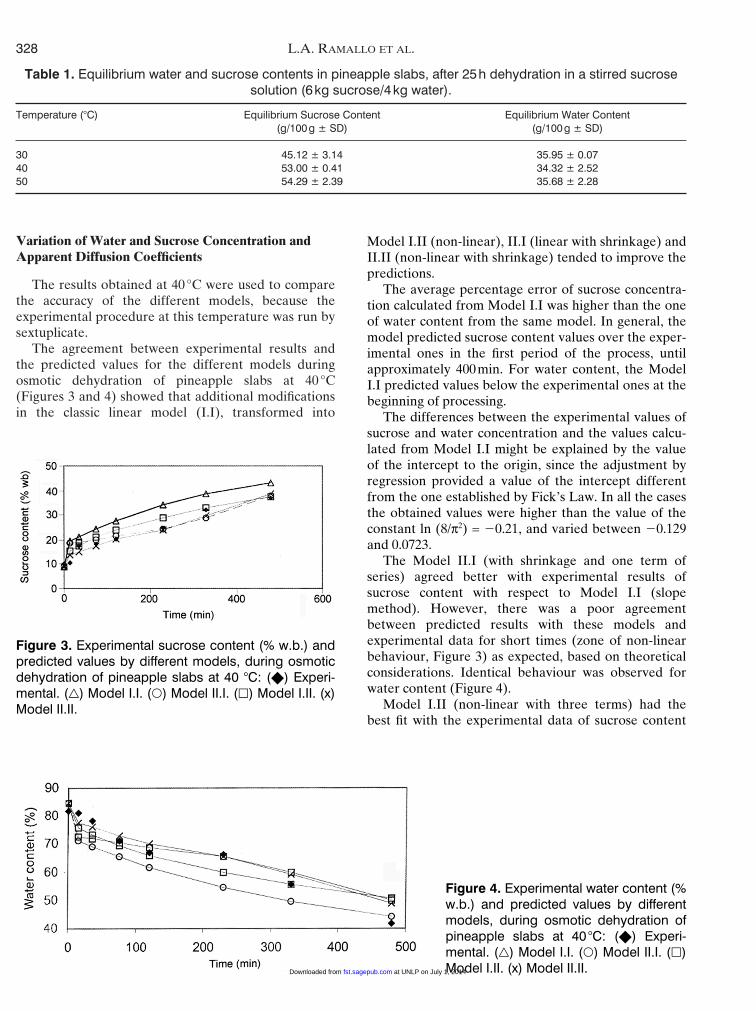
Table 1. Equilibrium water and sucrose contents in pineapple slabs, after 25h dehydration in a stirred sucrosesolution (6kg sucrose/4kg water).
Temperature (°C) Equilibrium Sucrose Content Equilibrium Water Content(g/100g ± SD) (g/100g ± SD)
30 45.12 ± 3.14 35.95 ± 0.0740 53.00 ± 0.41 34.32 ± 2.5250 54.29 ± 2.39 35.68 ± 2.28
Figure 3. Experimental sucrose content (% w.b.) andpredicted values by different models, during osmoticdehydration of pineapple slabs at 40 °C: (�) Experi-mental. (�) Model I.I. (�) Model II.I. (�) Model I.II. (x)Model II.II.
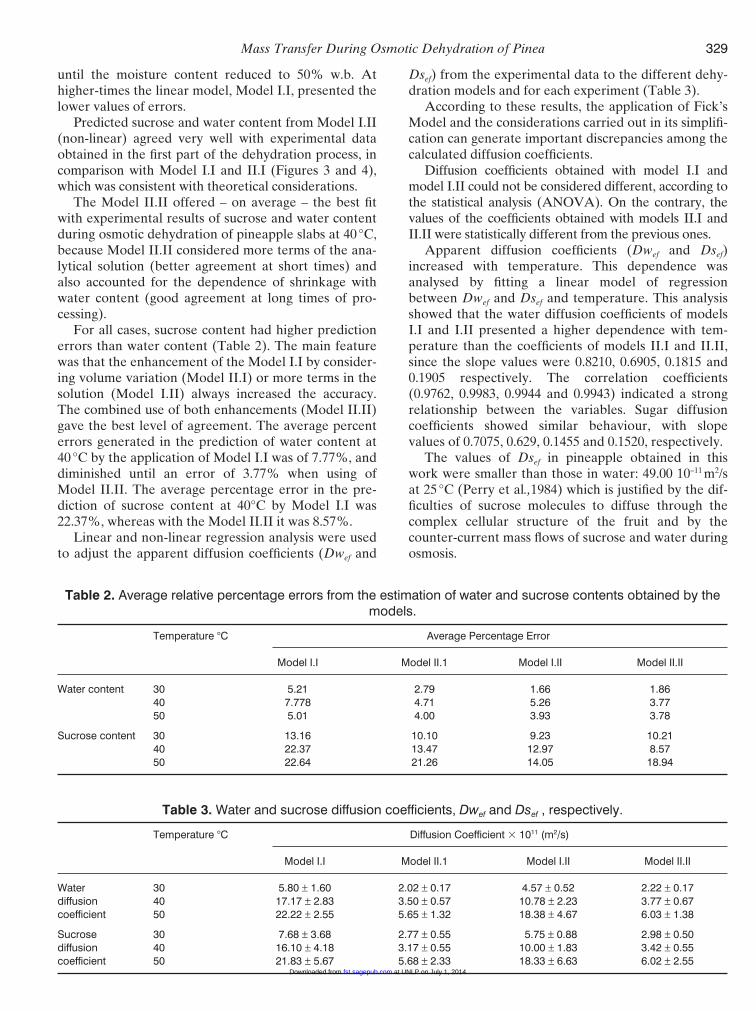
Figure 4. Experimental water content (%w.b.) and predicted values by differentmodels, during osmotic dehydration ofpineapple slabs at 40 °C: (�) Experi-mental. (�) Model I.I. (�) Model II.I. (�)Model I.II. (x) Model II.II.
Model I.II (non-linear), II.I (linear with shrinkage) andII.II (non-linear with shrinkage) tended to improve thepredictions.
The average percentage error of sucrose concentra-tion calculated from Model I.I was higher than the oneof water content from the same model. In general, themodel predicted sucrose content values over the exper-imental ones in the first period of the process, untilapproximately 400min. For water content, the ModelI.I predicted values below the experimental ones at thebeginning of processing.
The differences between the experimental values ofsucrose and water concentration and the values calcu-lated from Model I.I might be explained by the valueof the intercept to the origin, since the adjustment byregression provided a value of the intercept differentfrom the one established by Fick’s Law. In all the casesthe obtained values were higher than the value of theconstant ln (8/π2) = �0.21, and varied between �0.129and 0.0723.
The Model II.I (with shrinkage and one term ofseries) agreed better with experimental results ofsucrose content with respect to Model I.I (slopemethod). However, there was a poor agreementbetween predicted results with these models andexperimental data for short times (zone of non-linearbehaviour, Figure 3) as expected, based on theoreticalconsiderations. Identical behaviour was observed forwater content (Figure 4).
Model I.II (non-linear with three terms) had thebest fit with the experimental data of sucrose content
05 228FST10.5.047904 21/9/2004 09:26 Page 328
at UNLP on July 1, 2014fst.sagepub.comDownloaded from
until the moisture content reduced to 50% w.b. Athigher-times the linear model, Model I.I, presented thelower values of errors.
Predicted sucrose and water content from Model I.II(non-linear) agreed very well with experimental dataobtained in the first part of the dehydration process, incomparison with Model I.I and II.I (Figures 3 and 4),which was consistent with theoretical considerations.
The Model II.II offered – on average – the best fitwith experimental results of sucrose and water contentduring osmotic dehydration of pineapple slabs at 40°C,because Model II.II considered more terms of the ana-lytical solution (better agreement at short times) andalso accounted for the dependence of shrinkage withwater content (good agreement at long times of pro-cessing).
For all cases, sucrose content had higher predictionerrors than water content (Table 2). The main featurewas that the enhancement of the Model I.I by consider-ing volume variation (Model II.I) or more terms in thesolution (Model I.II) always increased the accuracy.The combined use of both enhancements (Model II.II)gave the best level of agreement. The average percenterrors generated in the prediction of water content at40°C by the application of Model I.I was of 7.77%, anddiminished until an error of 3.77% when using ofModel II.II. The average percentage error in the pre-diction of sucrose content at 40°C by Model I.I was22.37%, whereas with the Model II.II it was 8.57%.
Linear and non-linear regression analysis were usedto adjust the apparent diffusion coefficients (Dwef and
Dsef) from the experimental data to the different dehy-dration models and for each experiment (Table 3).
According to these results, the application of Fick’sModel and the considerations carried out in its simplifi-cation can generate important discrepancies among thecalculated diffusion coefficients.
Diffusion coefficients obtained with model I.I andmodel I.II could not be considered different, according tothe statistical analysis (ANOVA). On the contrary, thevalues of the coefficients obtained with models II.I andII.II were statistically different from the previous ones.
Apparent diffusion coefficients (Dwef and Dsef)increased with temperature. This dependence wasanalysed by fitting a linear model of regressionbetween Dwef and Dsef and temperature. This analysisshowed that the water diffusion coefficients of modelsI.I and I.II presented a higher dependence with tem-perature than the coefficients of models II.I and II.II,since the slope values were 0.8210, 0.6905, 0.1815 and0.1905 respectively. The correlation coefficients(0.9762, 0.9983, 0.9944 and 0.9943) indicated a strongrelationship between the variables. Sugar diffusioncoefficients showed similar behaviour, with slopevalues of 0.7075, 0.629, 0.1455 and 0.1520, respectively.
The values of Dsef in pineapple obtained in thiswork were smaller than those in water: 49.00 10–11 m2/sat 25°C (Perry et al.,1984) which is justified by the dif-ficulties of sucrose molecules to diffuse through thecomplex cellular structure of the fruit and by thecounter-current mass flows of sucrose and water duringosmosis.
Mass Transfer During Osmotic Dehydration of Pinea 329
Table 2. Average relative percentage errors from the estimation of water and sucrose contents obtained by themodels.
Temperature °C Average Percentage Error
Model I.I Model II.1 Model I.II Model II.II
Water content 30 5.21 2.79 1.66 1.8640 7.778 4.71 5.26 3.7750 5.01 4.00 3.93 3.78
Sucrose content 30 13.16 10.10 9.23 10.2140 22.37 13.47 12.97 8.5750 22.64 21.26 14.05 18.94
Table 3. Water and sucrose diffusion coefficients, Dwef and Dsef , respectively.
Temperature °C Diffusion Coefficient � 1011 (m2/s)
Model I.I Model II.1 Model I.II Model II.II
Water 30 5.80 ± 1.60 2.02 ± 0.17 4.57 ± 0.52 2.22 ± 0.17diffusion 40 17.17 ± 2.83 3.50 ± 0.57 10.78 ± 2.23 3.77 ± 0.67coefficient 50 22.22 ± 2.55 5.65 ± 1.32 18.38 ± 4.67 6.03 ± 1.38
Sucrose 30 7.68 ± 3.68 2.77 ± 0.55 5.75 ± 0.88 2.98 ± 0.50diffusion 40 16.10 ± 4.18 3.17 ± 0.55 10.00 ± 1.83 3.42 ± 0.55coefficient 50 21.83 ± 5.67 5.68 ± 2.33 18.33 ± 6.63 6.02 ± 2.55
05 228FST10.5.047904 21/9/2004 09:26 Page 329
at UNLP on July 1, 2014fst.sagepub.comDownloaded from
The simplified Model I.I is generally used to deter-mine apparent diffusion coefficients in osmotic dehy-dration: our values for Dwef and Dsef for this model areof the same order of those found for other fruits andvegetables like apples (Lazarides et al., 1997), carrots(Rastogi and Raghavarao (1998) and bananas (Rastogiet al., 1997). However, our Dwef were somewhat lowerthan those published by Beristain et al. (1990) and byRastogi and Niranjan (1998) for pineapple.
The temperature dependence of the diffusion coeffi-cients (Dsef and Dwef) at the tested dehydration con-ditions was evaluated using an Arrhenius type model:
Def = D0e–E/RT (14)
Where D0 is an adjustable parameter, E the activa-tion energy for the osmotic process, R the ideal gasconstant and T the absolute temperature in K.
In this empirical model, the magnitude of E is anindication of the influence of temperature on theosmotic process. The values of energy of activation(Table 4) obtained are in the rank of those found inprocesses of osmotic dehydration of fruits and the veg-etables (Lazarides et al., 1997) in potatoes and applesand Beristain et al. (1990) in pineapple.
Application of the Models: Prediction for DifferentThickness or Temperature
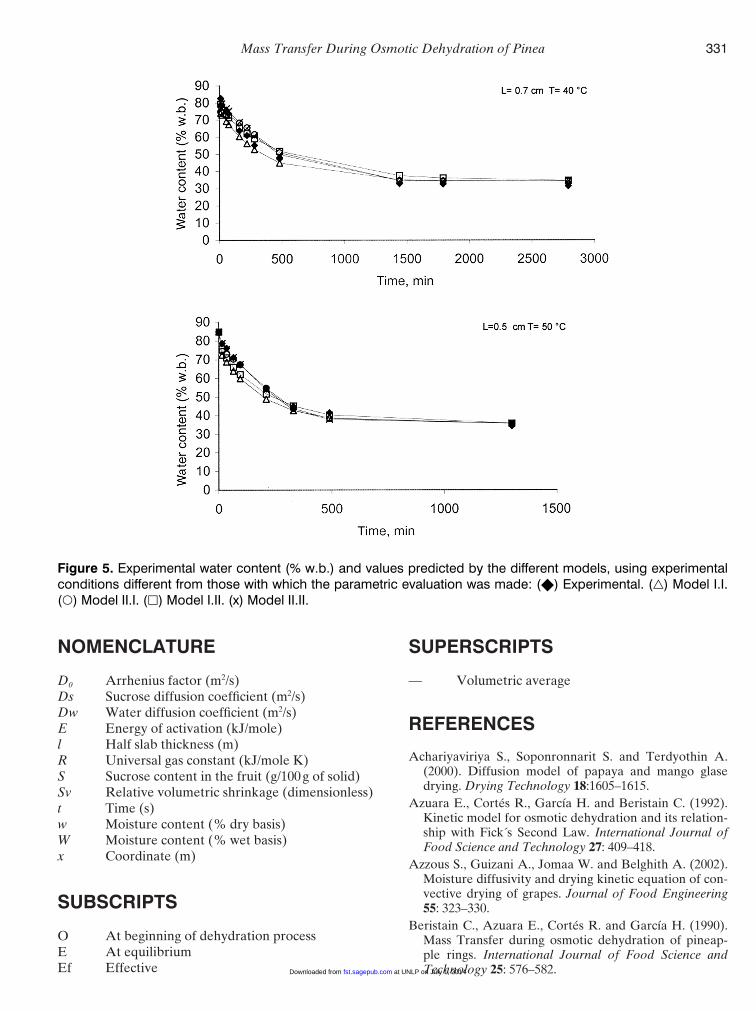
Several dehydration experiences with pineappleslices of different thickness and at different tempera-ture (0.7cm and 40 ºC, and 0.5cm at 50 ºC) to verify theproposed models and to compare the experimentalresults and the predicted values by the models.
In the first case (L = 0.7cm, Figure 5), the change ofthickness with respect to water content (models II.Iand II.II) did not improve the predictions obtainedwith respect to Fick’s Model (model I.I, Table 5). Onthe contrary, the results of the second experience (L =0.5cm) indicated that model II.II was one that bestpredicted the variation of moisture and sucrose contentduring osmotic dehydration.
In all the cases, Fick’s Model better predicted thewater loss than the sucrose gain, during the osmoticdehydration of pineapple in hypertonic sucrose solu-tion.
330 L.A. RAMALLO ET AL.
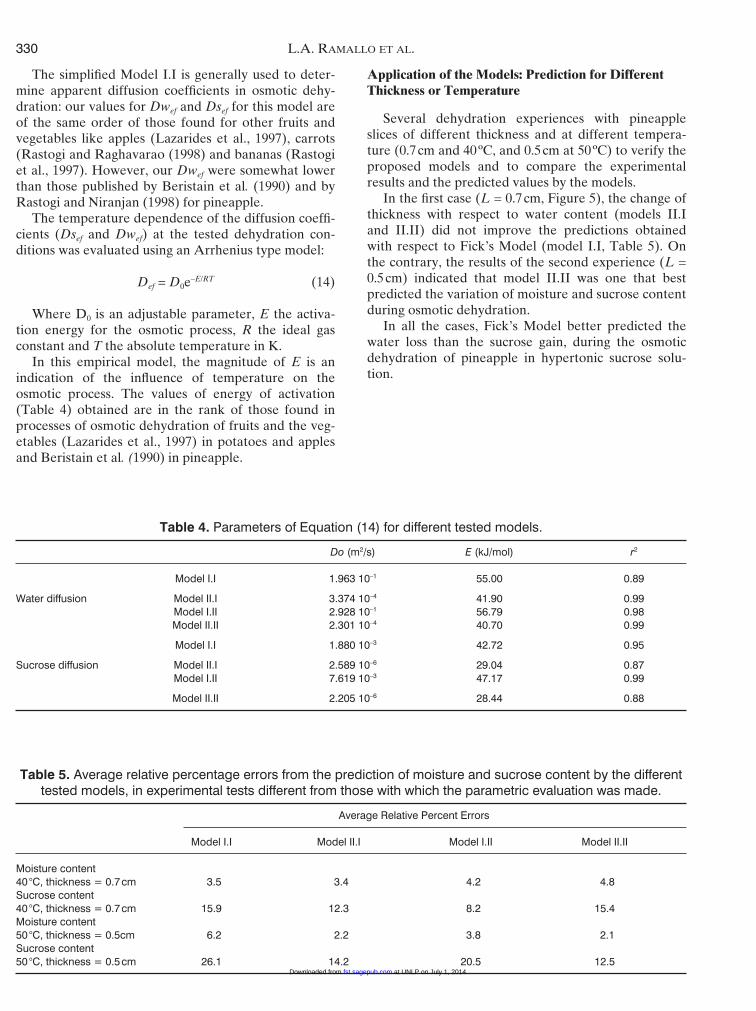
Table 4. Parameters of Equation (14) for different tested models.
Do (m2/s) E (kJ/mol) r2
Model I.I 1.963 10–1 55.00 0.89
Water diffusion Model II.I 3.374 10–4 41.90 0.99Model I.II 2.928 10–1 56.79 0.98Model II.II 2.301 10–4 40.70 0.99
Model I.I 1.880 10–3 42.72 0.95
Sucrose diffusion Model II.I 2.589 10–6 29.04 0.87Model I.II 7.619 10–3 47.17 0.99
Model II.II 2.205 10–6 28.44 0.88
Table 5. Average relative percentage errors from the prediction of moisture and sucrose content by the differenttested models, in experimental tests different from those with which the parametric evaluation was made.
Average Relative Percent Errors
Model I.I Model II.I Model I.II Model II.II
Moisture content40°C, thickness = 0.7cm 3.5 3.4 4.2 4.8Sucrose content40°C, thickness = 0.7cm 15.9 12.3 8.2 15.4Moisture content50°C, thickness = 0.5cm 6.2 2.2 3.8 2.1Sucrose content50°C, thickness = 0.5cm 26.1 14.2 20.5 12.5
05 228FST10.5.047904 21/9/2004 09:26 Page 330
at UNLP on July 1, 2014fst.sagepub.comDownloaded from
NOMENCLATURE
D0 Arrhenius factor (m2/s)Ds Sucrose diffusion coefficient (m2/s)Dw Water diffusion coefficient (m2/s)E Energy of activation (kJ/mole)l Half slab thickness (m)R Universal gas constant (kJ/mole K)S Sucrose content in the fruit (g/100g of solid)Sv Relative volumetric shrinkage (dimensionless)t Time (s)w Moisture content (% dry basis)W Moisture content (% wet basis)x Coordinate (m)
SUBSCRIPTS
O At beginning of dehydration processE At equilibriumEf Effective
SUPERSCRIPTS
— Volumetric average
REFERENCES
Achariyaviriya S., Soponronnarit S. and Terdyothin A.(2000). Diffusion model of papaya and mango glasedrying. Drying Technology 18:1605–1615.
Azuara E., Cortés R., García H. and Beristain C. (1992).Kinetic model for osmotic dehydration and its relation-ship with Fick´s Second Law. International Journal ofFood Science and Technology 27: 409–418.
Azzous S., Guizani A., Jomaa W. and Belghith A. (2002).Moisture diffusivity and drying kinetic equation of con-vective drying of grapes. Journal of Food Engineering55: 323–330.
Beristain C., Azuara E., Cortés R. and García H. (1990).Mass Transfer during osmotic dehydration of pineap-ple rings. International Journal of Food Science andTechnology 25: 576–582.
Mass Transfer During Osmotic Dehydration of Pinea 331
Figure 5. Experimental water content (% w.b.) and values predicted by the different models, using experimentalconditions different from those with which the parametric evaluation was made: (�) Experimental. (�) Model I.I.(�) Model II.I. (�) Model I.II. (x) Model II.II.
05 228FST10.5.047904 21/9/2004 09:26 Page 331
at UNLP on July 1, 2014fst.sagepub.comDownloaded from
Crank J. (1975). The Mathematics of Diffusion. Oxford:Clarendon Press.
Feng H., Tang J. and Dixon-Warren J. (2000). Determina-tion of moisture diffusivity of red delicious appletissues by thermogravimetric analysis. Drying Techno-logy 18: 1183–1199.
Karatas S. and Pinarh I. (2001). Determination of mois-ture diffusivity of pine nut seed. Drying Technology 19:701–708.
Kaymak-Ertekin F. and Sultano_lu M. (2000). Modellingof mass transfer during osmotic dehydration of apples.Journal of Food Engineering 46: 243–250.
Kosegarten-Conde C., Palou E. and Lopez-Malo A.(1999). Drying behavior and quality characteristics ofosmotically treated, air-dried pineapple. In: IFTAnnual Meeting, paper 22D-46.
Lazarides H., Gekas V. and Mavroudis N. (1997). Appar-ent mass diffusivities in fruit and vegetable tissuesundergoing osmotic processing. Journal of Food Engin-eering 31: 315–324.
Lozano J., Rotstein E. and Urbicain M.J. (1983). Shrink-age, porosity and bulk density of foodstuffs at changingmoisture contents. Journal of Food Science 48:1497–1502.
Marcotte M. and Le Maguer M. (1992). Mass transfer incellular tissues. Part II: Computer simulations vs exper-imental data. Journal of Food Engineering 17: 177–199.
Mavroudis N., Gekas V. and Sjöholm I. (1998). Osmoticdehydration of apples. Shrinkage phenomena and thesignificance of initial structure on mass transfer rates.Journal of Food Engineering 38: 101–123.
Moreira R. and Sereno A. (2003). Evaluation of masstransfer coefficients and volumetric shrinkage duringosmotic dehydration of apple using sucrose solutions instatic and non-static conditions. Journal of Food Engin-eering 57: 25–31.
Nicoleti J.F., Telis-Romero J. and Telis V.R.N. (2001).Air-drying of fresh and osmotically pre-treated pineap-ple slices: fixed air temperature versus fixed slice tem-perature drying kinetics. Drying Technology 19:2175–2191.
Nsonzi F. and Ramaswamy H. (1998). Osmotic dehydra-tion kinetics of blueberries. Drying Technology 16:725–741.
Panagiotou N.M., Karathanos V.T. and Maroulis Z.B.(1998). Mass transfer modelling of the osmotic dehy-dration of some fruits. International Journal of FoodScience and Technology 33: 267–284.
Perry R.H., Green D.W. and Maloney J.O. (1984). Perry’sChemical Engineering Handbook, 6th edn, New York:McGraw Hill.
Ramallo, L.A. (2001). Deshidratación osmótica de ananá:Un modelo matemático sencillo. Magíster Thesis,UNaM, Argentina.
Rastogi N.K., Raghavarao K.S. and Niranjan K. (1997).Mass transfer during osmotic dehydration of banana:Fickian diffusion in cylindrical configuration. Journal ofFood Engineering 31: 423–432.
Rastogi N.K. and Niranjan K. (1998). Enhanced masstransfer during osmotic dehydration of high pressuretreated pineapple. Journal of Food Science 63: 508–511.
Rastogi N.K. and Raghavarao K. (1998). Water andsolute diffusion coefficients of carrot as a Function oftemperature and concentration during osmotic dehy-dration. Journal of Food Engineering 34: 429–441.
Rastogi N.K., Angersbach A. and Knorr D. Synergisticeffect of high hydrostatic pressure pretreatment andosmotic stress on mass transfer during osmotic dehy-dration. (2000). Journal of Food Engineering 45: 25–31.
Reppa A., Mandala J., Kostaropoulos A. and SaravacosG. (1999). Influence of solute temperature and concen-tration on the combined osmotic and air drying. DryingTechnology 17: 1449–1458.
Sabadini E., Carvalho Jr. B., Sobral P. and Hubinger M.(1998). Mass transfer and diffusion coefficient determi-nation in the wet and dry salting of meat. DryingTechnology 16: 2095–2115.
Salvatori D. and Alzamora S.M. (2000). Structuralchanges and mass transfer during glucose infusion ofapples as affected by blanching and process variables.Drying Technology 18: 361–382.
Sander A., Tomas S. and Skansi D. (1998). The influenceof air temperature on effective diffusion coefficient ofmoisture in the falling rate period. Drying Technology16: 1487–1499.
Spiazzi E.A. and Mascheroni R.H. (1997). Mass transfermodel for osmotic dehydration of fruits and vegetables.I. Development of the simulation model. Journal ofFood Engineering 34: 387–410.
Statgraphics (1993). Statgraphics User Manual. Version 7for DOS. Rockville, MD: Manugistics, Inc.
Torregiani D. (1993). Osmotic dehydration in fruit andvegetable processing. Food Research International 26:59–68.
Turhan M. and Erdogdu F. (2003). Error associated withassuming a finite regular geometry as an infinite one formodeling of transient heat and mass transfer processes.Journal of Food Engineering 59: 291–296.
Varadharaju N., Karunanidhi C. and Kailappan R. (2001).Coffee cherry drying: a two-layer model. DryingTechnology 19: 709–715.
Waliszewski K.N., Texon N.I., Salgado M.A. and GarcíaM.A. (1997). Mass transfer in banana chips duringosmotic dehydration. Drying Technology 15:2597–2607.
Yao Z. and Le Maguer M. (1997). Analysis of mass trans-fer in osmotic dehydration based on profiles of concen-tration, shrinkage, transmembrane flux and bulk flowvelocity in the domain of time and space. Journal ofFood Process Engineering 20: 401–414.
Zogzas N.P. and Maroulis Z.B. (1996). Effective moisturediffusivity estimation from drying data. A comparisonbetween various methods of analysis. Drying Techno-logy 14: 1543–1573.
332 L.A. RAMALLO ET AL.
05 228FST10.5.047904 21/9/2004 09:26 Page 332
at UNLP on July 1, 2014fst.sagepub.comDownloaded from
Related Documents