PAPERS PRESENTED AT MASS SPECTROMETRY CONFERENCE 1 1 . ;•:•-. •..'.•.••.•I'S;: y •-wm f-y'-:^^ ;;. . .;:•::.•:^.•r•o i Si JUNE 3-8, 1962 NEW ORLEANS, LA. ASTM COMMITTE

Welcome message from author
This document is posted to help you gain knowledge. Please leave a comment to let me know what you think about it! Share it to your friends and learn new things together.
Transcript

PAPERS PRESENTED AT
MASS SPECTROMETRY CONFERENCE
1 1 .
;•:•-. •..'.•.••.•I'S;:
y •-wm f-y'-:^^
; ; . . .;:•::.•:^.•r•o
i Si
JUNE 3-8 , 1962
NEW ORLEANS, LA.
A S T M COMMITTE

PAPERS PRESENTED AT
MASS SPECTROMETRY CONFERENCE
JUNE 3-8 , 1962
NEW ORLEANS, LA.
A S T M COMMITTEE E-14

P R E F A C E
This volume is a collection of papers presented at the
Tenth Annual Meeting of ASTM Committee E-14 on Mass Spectrometry,
held June 3 - June 8, 1962, in New Orleans, Louisiana.
It is intended that this volume be distributed only to
members of ASTM Committee E-14, and therefore should not be
considered as publication.
Program Committee
R. E. Fox, Chairman R. A. Brown A. G. Sharkey W. M. Hickam
1962 Officers
V. H. Dibeler, Chairman R. E. Fox, Vice-chairman R. A. Brown, Vice-chairman G. F. Crable, Secretary J. H. Beynon, Member-at-Large C. F. Robinson, Member-at-Large

TABLE OF CONTENTS
PROCEEDINGS OF THE ASTM COMMITTEE E-ll* ON MASS SPECTROMETRY
New Orleans, Louisiana, June, 1962 Page
No.
HTOROCARBOK STUDIES I
1. Mass Spectrometrlc Investigation of Thermally Treated Extracts from Coal,
A. G. Sharkey, Jr., J. L. Shultz, and R. A. Friedel, Bureau of Mines, Bruoeton, Pa, 1
2. Analysis of Saturated Hydrocarbons in Boiling Range 1*50-900 F, W. C. Ferguson and L. R. Snyder, Union Oil Company of California, Brea, California H
3. Mass Spectrometric Analysis of Middle Distillate Saturated Hydrocaxhons, A. Hood, P. R. Moramessin, and B. K. Fritts, Shell Development Company, Houston, Texas 12
k . Characterization of Aromatics in Light Catalytic Cycle Stock, K. W. Bartz, Thomas Aczel, H. E. Lumpkin, and F. C. Stehllng, Humble Oil and Refining Company, Baytown, Texas .- 13
5. The Mass Spectra and Analytical Correlations of Cj. Through C.Q Coda Compounds,
R. F. Kendall, F. 0. Cotton, N. G. Foster, and B. H. Eccleston, Bureau of Mines, Bartlesville, Oklahoma 26
6. Determination of Hydrocarbon Types in Kerosene Range Distillates by Mass Spectrometry, (Withdrawn)
L. R. Snyder, H. E. Howard, Eind W. C. Ferguson, Union Oil Company of California, Brea, California 27
7. Mass Spectrometry of Sulfur Compounds. IV. Studies of the Mass Spectra of 2-t-Butyl-, 3-t-Butyl-, and 2, 5, di-t-Butylthlophenes,
N. G. Foster, D. E. Hirsch, R. F. Kendall, and B. H. Eccleston, Bureau of Mines, Bartlesville, Oklahoma 28
8. Appearance Potentials and Mass Speotra of Fluorinated Olefins, Chava Lifshitz and F. A. Long, Cornell University, Ithaca, New York 29
9. Mass Spectra of Terpene and Sesquiterpene Hydrocarbons, C. B. Koons and J. N. Mercer, Jersey Production Reseaxch Company, Tulsa, Oklahoma 37
10. Rearrangement Ions of Aliphatic Esters as Observed in the Mass Spectrometer,
H. 0. Colomb, Jr., B. D. Fulks, and V. A. Yarborough, Union Carbide Chemicals Company, South Charleston 3, West Virginia 41
HYDROCARBON STUDIES II
11. Mass Spectra of Trimethylsilyl Esters, R. I!. Teeter, California Research Corporation, Richmond, California 51
(Continued on next page)

TABLE OF COinENTS - Continued
HYDROCARBOI': STUDIES II - Continued Page No.
12. Information Regarding the Fragraentation of Long Chain Compou-itls Obtained from the Mass Spectra of Heavy Isotope-Labelled Molecules,
Kg, Xinh-Nguyen, Ragnar Ryhage, Stina StUllberg-Stenhagen, and Einar Stenhagen, Institute of Medical Biochemistry^ University of Goteborg, liass Spectrometry Laboratory, Karolinska Institutet, Stoclcholia 60, Sweden 57
13, Detergent Alkylate Analysis by Mass Spectrometry, E. •:•!. Poj'er, M. C. Hammi.ng, and H. T. Ford, Continental Oil Corapany, Ponca City, Oklahoisa 58
ll*. fess Spectra Correlations and Appearance Potentials of the Major Tobacco Alkaloids,
W. F. Kuhn, C. J. Varsel, and W, A. Powell* Philip Morris Research Center, Richmond 6, Virginia •Department of Chemistry, University of Richmond, Virginia 67
15. Speotra of Compounds of Biological Interest, K. Biemann and J. A. McCloskey, Department of Chemistry, Massachusetts Institute of Technology, Cambridge, Massachusetts 78
16. Recent Studies of n-Paraffin Mass Spectra, John C. Schug, Gulf Research and Development Company, Pittsburgh, Pa 81
17. Application of the Improved Quasl-Equlllbrium Theory of Mass Speotra to Propane,
Marvin L. Vestal and William H. Johnston, V/illiam H. Johnston Laboratories, Inc., Baltimore, Maryland, and Austin L. Wahrhaftig, University of Utah, Salt Lake City, Utah 94
18. Quantitative Observations of Metastable Ion Transitions with a I80 Mass Spectrometer,
Norman D. Coggeshall, Gulf Research Research and Development Company, .--Pittsburgh 30, Pa IQQ
19. The Chemistry of Unimolecular Ion Decorapositions, Fred W. McLafferty and Roland. S. Gohlke, Eastern Research Laboratory, The Dow Chemical Company, Framlngham, Massachusetts 115
20. Mass Spectra of Organic Compounds Using a Radio Frequency Spark Source, Michel Desjardins, Neil Hodgson, and Williara Baun, Wright Patterson Air Force Base, Dayton, Ohio 123
ANALYTICAL TECHNIQUES I
21. Application of Time-of-Flight Mass Spectrometry and Gas Chromatography to Reaction Studies,
E. J. Levy, E. D. Miller, and W. S. Beggs, Atlantic Refining Company, Philadelphia, Pennsylvania 131
(Continued on next page)

TABLE OP CONTENTS - Continued
ANALYTICAL TECHNIQUES I - Continued Page No.
22. Use of Capillary Gas Chromatography with a TOF Mass Speotrometer, W. H. McFadden, Roy Teranishl, D. R. Black, and J. C. Day, U. S. Dept. of Agriculture, Western Regional Research Laboratory, Albany, California 142
23. Uses of a Total Ionization Monitor for Tlme-of-Flight Mass Spectrometry, Roland S. Gohlke,
•/ The Dow Chemical Company, Eastern Research Laboratory, Framlngham, Massachusetts ' . . . 147
2 k . Copolymer Analysis by Pyrolysis and Mass Spectrometry, G. G, VJanless, Esso Research and Engineering Company, Linden, New Jersey 152
25. Mass Spectrometric Study on the Evaporation of Volatile Components in Commercial Polyethylene,
Kisaku Nakagawa, Electrical Communication laboratory, Nippon Telegraph and Telephone Public Corporation, Musashino-shi, Tokyo, Japan 159
26. A Mass Spectrometrlc Study of Phosgene and Its Intermediaries, H. R. Harless and C. M. Lovell, Research and Development Dept., Union Carbide C;hemicalE Company, South Charleston, V/est Virginia 166
27. Mass Spectrometric Study of Polymeric Ions, A. H. Turnbull, Atomic Energy Research Establishment, Harwell, Berkshire, England 170
28. Investigations of Azide Decomposition Reactions by Isotopic Tracer Technique,
Donald P. Easter and Amos J. Coleman, USAERDL, Fort Belvoir, Virginia 174
29. An Isotope Dilution—Mass Spectrographlc—Sealed Tube Mlcroanalytical Method for Combined Oxygen Determination,
R. N. Boos, A. Soha, and N. R. Trenneir, Merck Sharp and Dohme Research Laboratories, Division of Merck and Co., Ino., Rahway, New Jersey 182
30. Approaches to ftess Spectrometer Gas Analysis Using Photographic Plate Ion Detection,
James W. Guthrie, Sandia Corporation, Alburquerque, New Mexico 192
ANALYTICAL TECHNIQUES II
31. Upper Atmospheric Ion Composition Measurements with Magnetic Mass Spectrometer,
John H. Hofftnan, Charles Y. Johnson, and Julian C. Holmes, U. S. Naval Research Laboratory, Washington 25, D. C I97
32. Oxygen Outgassing Caused by Electron Bombardment of Glass, Jack L. Lineweaver, Coming Glass Vlorks, Coming, New York 198
(Continued on next page)

TABIE OF CONTENTS - Continued
ANALYTICAL TECHNIQUES II - Continued Page No.
33- Mass Spectrometric Investigation of Gas Evolution from Metals, John Roboz and Robert Wallace, General Telephone and Electronics Laboratories, Inc., Bayside 60, New York 199
31*. The Effects of Surface Reactions on Mass Spectra, Dwight A. Hutchison, John W. Kraus*, and Louis G. Pobo, Argonne National Laboratory, Argonne,,Illinois, *The K. W. Kellogg Company, Jersey City 3, New Jersey 209
35- The Analysis of Gases in Transistor Packages Using an Ultra High Vacuum Mass Spectrometer System,
P. D. Davidse, Philco Scientific Laboratory, Blue Bell, Pa 214
3 6 . Analysis of Gas in Glass Diodes without Diode Destruction, R, A. Meyer, Atomics International, Canoga Park, Ceillfomia, and J. Brandewie, Autonetics, Downey, California 216
37- Residual Gases During Operation and Life-Testing of Power Klystrons, Lowell Noble and Robert K. V/aits, Eitel-McCullough, Inc., San Carlos, California 218
38. Solution of Linear Simultaneous Equations, J. Leonard, Tidewater Oil Company, Martinez, Callfomia 219
39. Realization of an I.B.M. Punched Cards File for Identification of Chemical Compounds,
A. Cornu, Centre D'Etudes Nucleaires De Grenoble, Grenoble, France 226
IHSTRUl.Er.TATION I
1*0. A Mass Spectrometer for a Study of the Composition of the Upper Atmosphere,
Alfred 0. Nier, University of Minnesota, f'ii-meapolis, Minnesota 231
1|-1. A Quadrupole Spectrometer for Precision Mass Determinations, U. von Zahn, S. Gebauer, and W. Paul, Physikalisches Institut, Bonn, Germany 232
1*2. High Resolution Time-of-Flight Mass Spectrometer, D. B. Harrington, The Bendix Corporation, Cincinnati Division, Cincinnati, Ohio, and R. S. Gohkle, The Dow Chemical Corapany, Eastern Research Laboratories, Framlngham, Massachusetts 234
(Continued on next page)
/

TABLE OF CONTENTS - Continued
INSTRUMENTATION I - Continued Page No.
43. A Cascade Mass Spectrometer, F. A. White, J. C. Sheffield, and F. M. Rourke, General Electric Company, Knolls Atomic Power Laboratory, Schenectady, Neu York 244
44. An Experiment Involving the Numerical Determination of Ion Paths in Non-Homogeneous Magnetic Fields,
A. C. Lilly, T. J. Weismann, and D. A. Lowitz, Gulf Research and Development Company Pitcsburgh, Pa 250
45. A High Sensitivity Mass Spectrometer Source, M. Doctoroff and S. S. Grossel, Vacuum Electronics Corp. Plainview, New York 261
46. Source Design Considerations for Sector Mass Spectrometers, GeoiTge Salser and Yuji Tajima, Dept. of Chemical Engineering, New York University, New York, New York 263
47. Study of Resolving Power of a Single Focusing, 60 , 12 inch Radius Mass Spectrometer,
Graham G. Wanless and George A. Glock, Jr. Esso Research and Engineering Company, Linden, New Jersey 269
48. Correction Coils for Second Order Focusing with the Argonne 100 Inch Radius Mass Spectrometer,
C. M. Stevens, Argonne National Laboratory, Argonne, Illinois 279
49. Mechanical Modification of Two-Stage Mass Spectrometer at Vallecitos Atomic Laboratory,
W. E. Duffy, General Electric Company, Atomic Power Equipment Department, Vallecitos Atomic Laboratory, Pleasanton, California 280
INSTRUMENTATION II
50. Some New Examples of Application of the Atlas Mass Spectrometer CH 4, Drs. Curt Brunnee, Ludolf Jenckel, Kurt Kronenberger Atlas Mess Und Analysentechnlk, G.m.b.H., Bremen, Germany, and Dr. Gerhard Splteller Organisch-Chemisches Institut der Universitat Wien Bremen, Germany 289
51. Application of Polyphenyl Ethers as Condensation Pump Fluids in Mass Spectrometry,
F. C' Maseles, Mass Spectrometry Laboratory, University of Texas, Austin, Texas 295
52. Simultaneous Measurement of Two Ion Currents by Pulse Counting in a Mass Spectrometer,
L. A. Dietz, General Electric Company, Knolls Atomic Power Laboratory, Schenectady, New York 300
53. Display System for Recording Rapid Changes in Gas Composition, B.R.F. Kendall, Nuclide Analysis Associates, Box 752, State College, Pa 306
(Continued on next page)
vii

TABLE OF CONTENTS - Continued
INSTRUMENTATION II - Continued Page No.
5I*. Modif IcatlonB to the Inlet and Recording Systems of a C. E. C. 21-103c Mass Spectrometer to Enable Direct Gas Introduction for Dynamic Evolution Studies,
J. D. Reynolds and P. C. Green, General Dynamics, Fort Worth, Texas . . . * 313
55. Improvement in Readout Accuracy of the CEC Mascot, H. M. Grubb and R. W. Vander Haar, Research and Development Dept., American Oil Company, Whiting, Indiana 317
NEGATIVE ION SYMPOSIUM
56. Negative Ion Formation in Varioiis Gases at Pressures up to .5 ram Hg, B. K. Curran, Westlnghouse Research Laboratories, Pittsburgh 35, Pa 324
57. Electron Transfer in CoUlslons of Negative Ions with 0„ Molecules, T. L. Bailey, College of Engineering and Dept. of Physics, University of Florida, Gainesville, Florida 333
58. Some Unique Applications of Negative Ion Mass Spectra, Bussell Baldock, Chemistry Division, Oak Ridge Nationeil laboratory, Oak Ridge, Tennessee 334
59. Electron Affinities of the Halogens, B. W, Steiner, M. L. Seman, and L, M. Branscomb, National Bureau of. Standfirds, Washington 25, D. C. , and B. S. Berry, Yale University, New Haven, Connecticut 342
60. Meaeurement of Electron Capture Cross Sections Using Swaim Methods, G. S. Hurst, Heeilth Physics Division, Oak Ridge National Laboratory, Oak Ridge, Tennessee 348
COLLISION PROCESSES
6IA. A Mass Spectrometrlc Investigation of Secondary Reeictions in Mixtures Containing Hg Vapour,
V. Cermak and Z. Herman, Institute of Physical Chemistry, Czechoslovak Academy of Sciences, Prague, Czechoslovakia 358
613. Rare Gas Molecule-Ion Formation by Mass Spectrometry. Kinetics of Pccy , Ne„+, and He + Formation by Second and Third Order Processes,
J. S. Dahler, J. L. Franklin, M. S. B. Munson, and F. H. Field, Humble Oil and Refining Corapany, Baytown, Texas 365
62. A High Pressure Mass. Speotrometrio Study of Reeictions of Rare Gases with Ng and CO,
M. S. B. Munson, F. H. Field, and J. L. Franklin, Research and Development, Humble Oil and Refining Company, Baytown, Texas "•• 366
(Continued on next page)

TABLE OF CONTENTS - Continued
COLLISION PROCESSES - Continued Page No.
63. Observation of the Products of Collision Processes and Ion Decomposition in a Linear, Pulsed Tine-of-rlight Mass Spectrometer,
R . E . Ferguson, K. E. McCulloh, and II. II. Rosenstock, National Bureau of Standards, Washington, D. C. . . ' 367
6 k . Velocity Dependence of Ion-Molecule Reaction Cross Sections, D. A. Kubose and W. H. Hamill, Dept. of Chemistry and Radiation Laboratory, University of Notre Dame, South Bend, Indiana 368
65. Mass Spectrometrlc Observation of Electron and Proton Transfer in 'Cermak' Experiments,
A. Henglein and G. A. Muccini, Mellon Institute, Pittsburgh, Pa 379
66. The Effect of Pressure Scattering on High Precision Isotopic Abundance Measurements,
K. A. Kaiser, University of Minnesota, Minneapolis, Minnesota (Present Address: Argonne National Laboratory, Argonne, Illinois) 391
67. Ions in the Carbon Dioxide Glow Discharge, P. H. Dawson and A. W. Tickner, National Research Council, Ottawa, Canada 392
68. Determination of Electronic Energy Levels of Molecules by Low Energy , Electron Impact,
1/ Aron Kx^ipermann and Lionel M. Raff, Dept. of Chemistry, University of Illinois, Urbana, Illinois 395
69. Photoionization Processes Studied by Mass Spectrometry, (withdrawn) D. C. Frost, D. Mak, and C. A. McDowell, Dept. of Chemistry, University of British Columbia, Vancouver 8, British Columbia 396
SOLIDS TECHNIQUES
70. Study of Low Melting Metals by Spark Source Mass Spectrometry, W. A. Wolstenholme emd J, D. Waldron, Associated Electrical Industries Limited, Instrumentation Division, Apparatus Dept. Barton Dock Road, Urmston, Manchester, England 397
71. Ion Charge Distribution in a R. F. Spark Ion Source and Its Effect on Quantitative Analysis,
Edward B. Owens, Lincoln laboratory, Massachusetts Institute of Technology, Lexington 73, Massachusetts 403
72. Photographic Quantitative Analysis with a Solids Spark Mass Spectrograph,
Charles W. Hull, Consolidated Electrodynamics Corporation, Pasadena, Callfomia 404
73. Improved Accuracy in Solids Mass Spectrometry, (Withdrawn) G. D. Perkins and Charles F. Robinson, Bell and Howell Research Center, Pasadena, California 413
(Continued on next page)

TABLE OF CONTENTS - Continued
SOLIDS TECHNIQUES - Continued Page No.
7!*. Studies with Spark Source Mass Spectrometry, W, Fletcher, United Kingdom Atomio Energy Commission, Capenhurst, England 414
75. Ion Source for Solid Materials, (Withdrawn) Richard F, Herzog and Helmut J. Liebl, Geophysics Corporation, Bedford, Massachusetts 420
76. High Temperature Vaporization Studies, J. Drowart, Laboratoire de Chimle Physique I, University of Brussels, Brussels, Belgiimi 421
77. Thermodynamics of Dilute Solutions by Knudsen Cell Techniques, John H. Norman and Perrin Winchell, General Dynamics-General Atomio, San Diego, California 427
78. The Vaporization of Beryllium, Magnesium, and Aluminum Borates, Alfred Buchler and Joan B. Berkowitz-Mattuck, Arthur D. Little, Inc., Cambridge, Massachusetts 432
79. Mass Spectrometric Study of High Temperatiire Reactions of BF^(g) with Oxides, -
William P. Sholette and Richard F. Porter, Dept. of Chemistry, Cornell University, Ithaca, New York 439
80. A New Method of Increasing the Efficiency of Surface Ionization Sources, N. R. Daly and N. C. Fenner, (Withdrawn) Atomic Weapons Research Establishment, Aldermaston, England 441

MASS SPECTRCMETRIC INVESTIGATIONS OF THERMALLY TREATED EXTRACTS FROM COAL
by
A. G. Sharkey, Jr.,° J. L. Shultz,'' and R. A. Friedel*^
ABSTRACT
As part of an investigation to obtain information on the chemical structure of coal, mass spectrometrlc techniques were used to study pyridine extracts. Materials extractable at room temperature from Pittsburgh seam (hvab), Wyoming subbitumlnous, and North Dakota lignite were examined before and after heating for 4 hours at 450° C. Changes were observed in the carbon numher distribution for several aromatic structures
INTRODUCTION
As part of a program at the Federal Bureau of Mines to obtain information on the structure of coal, mass spectrometric techniques were used to investigate coal and various materials derived from coal. The purpose of this investigation was to determine primary materials associated with the coal structure. H. W. Holden and J. C. Robb (6) pyrolyzed coal directly in a mass spectrometer ion source and R. I. Reed (11, 12) has applied mass spectrometrlc techniques to coal and coal extracts. Because of the complexity of the spectra obtained under normal operating conditions and the lack of calibration data, only qualitative Interpretations were attempted in these preceding investigations.
While several investigators have noted the similarity in the infrared (l.r.) spectra of coal, various extracts of coal, and condensates obtained by the vacuum pyrolysis of coal, little has been reported concerning the constituents of these materials or the molecular weight distribution of these constituents (2, 10). In an investigation of pyridine extracts of various coals, H. N. M. Dormans and D. W. van Krevelen found average molecular weights of approximately 500 for extracts from coal with 80 and 91 percent carbon (3). The highest average molecular weight, near 1200, was reported for a pyridine extract from 87 percent carbon coal. J. K. Brown, in a summary of the i.r. results for extracts, noted that while the closest agreement between the i.r. spectra of extracts and the parent coals was shown for extracts obtained vith good solvents, the major bands persisted even with the poor coal solvents ( ) . Similarly, in investigating condensates from the vacuum pyrolyBls of coal to 550" C, A. A. Omlng and B. Grelfer reported that condensates constituting up to 10 percent of the coal had l.r. spectra very similar to the spectrum of the coal (10).
In the present mass spectrometrlc investigation, low-ionizing voltage techniques were used to produce a spectrum consisting primarily of molecular-ions (4, 13, 14). With this technique, many structural tjrpes associated with materials derived from coal can be identified and, in certain Instances, carbon number distribution data can be obtained for the alkyl derivatives. The mass spectrometer is ideally suited for this type of investigation as (1) it is a hig]ily sensitive analytical tool, (2) the equivalent of only O.OQI ml. of liquid sample is required for analysis, and (3) vacuum pyrolysis and similar investigations can be carried out directly in the instrument, thus reducing the possibility of secondary reactions.
One phase of this investigation was the determination of changes occurring in material extracted at room temperature, follouing heating to temperatures associated with low-temperature carbonization. By investigating the extracted material apart from the coal structure, it was hoped that changes occurring in the major hydro-
a. Supervisory physicist. b. Mathematician. c. Project coordinator.
All authors are with the Pittsburgh Coal Research Center, Bureau of Hines, U. S. Department of the Interior, Pittsburgh, Fa.

Through ball joint isolation valve to spectrometer-all heated
Removoble sample cup 5mm. i.d. X 3mm. deep
Removable for sample introduction
For air venting
Molten Gallium
Rod and Gallium pot assembly free to move inside. Raise to stop pumping and vaporize sample
Soft iron
Figure 1. - Mass spectrometer heated inlet system for solids. (Liumpkin - reference 8)
202 230 258 286 314 342 370 398 216 244 272 300 328 356 384 MOLECULAR WEIGHT
1 1
t fV \ K k\ y r v7 h / L /
/ r / 1 / 1/
X
r 1
1 1
/ " > X y 6
i r y ^ t
1 1
1 1 1
X
\ \ \
X
\ \ \ \
\ \ \
1 1 1
I I I I I I I 4-r ing peri-condensed aromatics
o Unhealed extract X Heated extract, 450' 'C.-4 hours
X ^ Y V
" - ^ ^ ~ x X „
I I I I I I I
-
-
-
. ^
~
Figure 2, - Partial mass spectrum of pyridine extract from Wyoming subbituminous, 75.5 per cent carbon, coal.

carbon portion of coal could be determined independently of physical and geometrical features (such as pore structure of the particular coal). It has been established that primary tars and coal extracts contain similar components; however, it has not been determined how close is this relationship, or what differences do exist in the two materials (16).
EXTRACTION PROCEDURE AND RESULTS
For this investigation, it vas desirable to obtain a maximum yield of extract at room temperature. Dormans and van Krevelen found that coals could be exhaustively extracted by shaking with pyridine at room temperature for about 17 hours (3). Yields and also average molecular weights for the extracted material compared favorably with those obtained using Soxhiet extraction methods. Pyridine extracts for this investigation were prepared following the general procedure outlined by Dormans and van Krevelen. A sample of dry, greater than 200-mesh coal was prepared from newly-mined lumps of Pittsburgh seam (hvab), 84 percent carbon coal. The coal was stored under nitrogen following preparation. Approximately 1 gram of the coal was extracted to exhaustion by shaking with 10 cm^ of pyridine for 17 hours. The extract was prepared and handled in an inert atmosphere. Including Introduction of the extract into the inlet system of the mass spectrometer. A Consolidated Electrodynamics Model 21-103c mass spectrometer, equipped with the solids inlet system shovn in figure 1, was used for all determinations (8). Approximately 5-mg samples were Introduced.
Ultimate analyses for the three coals Investigated, Pittsburgh seam (hvab), Wyoming subbitumlnous, and North Dakota lignite (vitrain), and also the percent of material extracted vith pyridine at 25° C, are given in table 1. The percentages of extracted material obtained are in agreement vith results reported by Dormans and van Krevelen (.3).
TABLE 1. - Carbon content and percent of coal extracted with pyridine at 25' C
Percent Percent Coal carbon extracted
Bituminous, 84.0 21.2 Pittsburgh seam (hvab)
Subbituminous, 75.5 13.5 Nugget Mine, Wyoming
Lignite (vitrain), from 67.9 9.5 Klncald Mine, Burke Co. North Dakota
A major portion of each extract from the above coals was heated (under vacuum) for 4 hours at 450' C. Mass spectra to approximately mass 400 were obtained of the original extracts and the heated portion. To compare the major features in the spectra before and after heating, the spectra were tabulated on the basis of peak height (in chart divisions) per unit charge to the mass spectrometer (5 mg). Peak intensities at any given mass in the spectra are an Indication of the relative concentrations of material having this molecular weight. Alkyl series corresponding to the folloving structural types are shown in figures 2-7: For Pittsburgh seam coal— 4-rlng, perl-condensed and fluorenes; subbituminous coal— 4-rlng, peri-condensed and acenaphthenes; lignite— 4-rlng, perl-condensed and anthracenes and/or phenanthrenes.
CHANGES IN SPECTRA FOLLOWIITG HEATING
Mass spectra of the extracts before and after heating shov the following general features: The extract from the Pittsburgh seam coal shows one to three maxima for the various alkyl series. After heating, the alkyl series shov only one or tvo maxima vith the majority having a single, vell-deflned maximum. The unheated extract from subbituminous coal is the most complex, shoving three to six maxima for most alkyl series. Following heating, the number of maxima is reduced to three or less. The alkyl series for the extract from lignite shov the least complexity, having only one or tvo maxima, both before and after heating. In all these spectra a mnxlTmmi indicates the presence of one (or more) structural type. While peak intensities for the extracts froo Pittsburgh seam and subbituminous coals are comparable before and

Acenaphthenes and / or biphenyls o Unheated extract X Heated extract, 450°C.-4 hours
182 210 238 266 294 322 350 378 406 434 168 196 224 252 280 308 336 364 392 420
MOLECULAR WEIGHT
Figure 3. - Pa r t i a l mass spectruni of pyridine extract from Wyoming subbituminous, 75.5 per cent carbon, coal .
4 - r i n g peri-condensed aromatics o Unheated extract X Heated extract,450''C.-4 hours
202 2,6 230 ^^^ 258 ^^^ 286 ^^^ 314 3^3 342 35^ 370 33^ 398
MOLECULAR WEIGHT
Figure 4. - Pa r t i a l mass spectrum of pyridine extract from North Dakota lignite, 68 per cent carbon.

after heating, a major reduction (one-tenth to one-third of original Intensity) is shovn for all peaks in the pyridine extract from lignite following heating. Partial analyses of the gases produced during the four hours of heating at 450° C are shcrwn in table 2.
TAHLE 2.- Partial analysis of gas from vacuum pyrolysis of coal extracts heated to 450° C for 4 hours
Gas
Hz CH4
=2%
C3H8
CO2
Total of above components
Weight Bituminous
.041
2.08
1.06
.61
.42
4.21
percent of coal ex Subbituminous
.083
3.59
1.89
1.31
1.70
8.57
tract Lignite
.13
4.55
1.85
1.26
2.83
10.62
Mass spectra of thermally treated Pittsburgh seam and subbituminous coal extracts show many of the same features. Peak intensities for the various alkyl series in Pittsburgh seam and subbituminous coal extracts indicate considerable simplification of the mixture after heating. Peak distribution curves for the heated Pittsburgh seam extract, in general, show a single, well-defined maximum, and indicate a much lower average molecular weight for the alkyl derivatives. The mass spectrum of the heated extract of subbitumlnous coal also indicates a considerably less conplex mixture after thermal treatment. This Is illustrated by the peak distribution curve for 4-ring, perl-condensed compounds (figure 2). In this instance, a single, well-defined maximum is shown. Prior to heating six maxima were present, indicating a minimum of six different structural types having molecular weights in the same series of mass numbers. Other than an Indication of a large reduction in the amount of material having molecular weight below 400, mass spectra of the pyridine extractable material from lignite show essentially the same features before and after heating (figures 4 and 5). The total quantity of gas produced by heating the extracts increases with decreasing rank of the coals, consistent with results obtained for the pyrolysis of whole coal. Gases from all three heated extracts Indicate extensive dealkylation. The lignite extract produced the largest amount of CO2 as expected from the higher oxygen content,
QUANTITATIVE ANALYSIS OF PYRIDINE EXTRACT FROM PITTSBURGH SEAM COAL
The largest amount of pyrldine-extractable material was obtained from Pittsburgh seam coal and, following heating of this extractable material, the mass spectrum indicates the least complex mixture. For these reasons, the pyridine extract from Pittsburgh seam coal was chosen for an attempt at a quantitative analysis. A portion of the unheated material was analyzed by mass spectrometry without further treatment giving the results shown in table 3. The major portion of the sample (approximately .15 g) was transferred in an Inert atmosphere to a sample tube, placed under vacuum, and heated to 450* C for 4 hours. Analysis of the solid residue from the heated extract is also given in table 3, The carbon number range for the unheated and heated extracts was approximately Cg to C^Qt with structures containing from one to six or more rlng(s) indicated. Major constituents, having values from 9 to 18 percent, included the following compounds and their alkyl derivatives: Naphthalenes, acenaphthenes and/or biphenyls, acenaphthylenes and/or fluorenes, anthracenes and/or phenanthrenes, phenylnaphthalenes and/or methylenephenanthrenes, and 4-rlng perl-condensed compounds. Minor constituents, having values from 1 to 7 percent, included: Benzenes, naphthols and/or indenes, Indans and/or tetralins, and 4-rlng cata-condensed compounds. Molecular weight distribution data for homologous series corresponding to phenanthrenes and/or anthracenes, acenaphthylenes and/or fluorenes, and 4-ring cata-condensed structures are shown in figures 8, 9, and 10, Approximate values for contributions to the same homologous series by larger ring systems (Indicated on figures) were calculated using average sensitivities for these higher molecular weight constituents.

I5r
14-
13-
12-
T
Anthracenes and / or phenanthrenes o Unheated extract X Heated extract,450"C.-4hours
X o u I
< UJ 0.
MOLECULAR WEIGHT
Figure 5. - Par t ia l mass spectrum of pyridine extract from North Dakota lignite, 68 per cent carbon.
1 1~ 4-ring peri-condensed aromatics
o Unheated extract X Heated extract, 450°C.-4 hours
J L 202 230 258 286 314 342 370 398
216 " 244 272 300 328 356 384
MOLECULAR WEIGHT
Figure 6. - Par t ia l mass spectrunn of pyridine extract from Pittsburgh seam (hvAb), 84 per cent carbon, coal.

TABLE 3.- Mass spectrometric analyses of pyridine extracts from Pittsburgh seam (hvab), 84 percent carbon coal.
Compotind types, Volume percent Incltiding
alkyl derivativesl/
Benzenes
Indans, tetralins
Naphthalenes
Acenaphthenes, biphenyls
Acenaphthylenes, fluorenes
Anthracenes, phenanthrenes
Phenylnaphthalenes, methylenephenanthrenes
4-ring peri-condensed aromatics
4-rlng cata-condensed aromatics
Naphthols, Indenes
Unknowns (estimated)
Unheated
3.4
0.8
17.8
12.3
15.9
9.1
11.2
11.1
7.4
1.0
10.
Solid residue from heating to 450° C
4.1
1.3
14.9
11.7
14.8
13.4
10.9
8.9
6.6
3.4
10.
I j Values Include contributions to same homologous series by high molecular weight alkyl derivatives of five- and six-member ring systems.
An Increase in the concentration of components in the mass 200-500 range was found for extracts heated to 450° C for 4 hours. For example, the 3-ring phenanthrene and/or anthracene alkyl derivatives in the mass range 178-304 (figure 8) increased by a factor of 2 during heating. Molecular weight distribution data for other compound types (figures 9 and 10) indicate dealkylation. In addition, the high concentration of methane relative to hydrogen observed in the gases produced during the heating of the extract suggests the decomposition of alkyl substituents (9). There was also a decrease in the concentration of 4- and larger ring systems in the heated extract.
Accompanying the dealkylation was a tendency for the maximum concentration in any homologous series to occur 28 to 55 mass units higher, that is, after the addition of alkyl groups containing two to four carbon atoms. This distribution is similar to that observed in low-temperature carbonization products and also other materials derived from coal and processed at temperatures below 500° C.
A small percentage of residue, corresponding to an estimated 10 percent of the total sample introduced, remained following the mass spectrometric analysis. As indicated in table 3, very little low molecular-weight (m.w. < 150) phenolic material was found in the pyridine extract prepared under essentially oxygen-free conditions.
From this investigation it appears doubtful that vacuum pyrolysis products reported by previous investigators actually represent primary decomposition material. Holden and Robb, in their mass spectrometric investigation, heated the coal for days at temperatures up to 420° C (7). Sun, Ruof, and Howard used an average temperature of 550° C for 4 hours (15); Grelfer used temperatures over 500° C for from 1 to 3 hours (5^); Batchflder considered low-temperature tar closely related to primary material (1). Techniques for pyrolyzing the coal rapidly are perhaps the only valid methods for studying the primary thermal decomposition products.
The fact that the extractable material changed when heated to temperatures slightly above the plastic range for coal is of considerable Interest and can possibly give an Insight into the role played by these materials during coal decomposition and coking. Results obtained in this preliminary Investigation possibly support a theory that materials derived from coal decrease in complexity in the order (1) extractable material, (2) low-temperature carbonization product, and (3) high-temperature carbonization product. While the step from low- to high-temperature carbonization is well established, the role played by the extract in this series is not as well known and vill bear further investigation by this technique.

' ^ ^ 180 '^^ 208 222 236 ^^^ 264 ^^^ 292 ^ ^ ^ 320 " ^ 348 ^^^
MOLECULAR WEIGHT
Figure 7. - Pa r t i a l mass spectrum of pyridine extract from Pit tsburgh seam (hvAb), 84 per cent carbon, coal .
—
—
— - c
z/ /
r
1
1 1 X
/ 1
1 1 1 1 1 / X /
/ / / /
/ / 1 /
1 /
1 1
\ '
\ X \
\ v
1 1 1 1 1 1 1 1 1 Fluorenes and / or ocenophthylenes
o Unheated extract X Heated extroct, 450»C.-4 hours
o^"" '^^ '^^ .
\ ^ ^ ^ y^^ X ° °'' >^
\ \ X
\ \ \
X X x...^
^ ^ '^x ^ x
1 1 1 1 1 1 1 1 1
—
—
\
—
-
— -
178 206 234 262 290 318 346 192 220 248 276 304 332
MOLECULAR WEIGHT 360
374
Figure 8. - .Mass spectrometer analyses of pyridine extract of Pi t tsburgh seam (hvAb), 84 per cent carbon, coal .

REFERENCES
1. Batchelder, H. R., R. B. Filbert, Jr., and W. H. Mink. Ind. Eng. Chem. v. 52,
1960, pp. 131-136.
2. Brown, J. K. Fuel (London), v. 38, 1959, pp. 55-63.
3. Dormans, H. N. M. and D. W. van Krevelen. Fuel (London), v. 39, 1960, p. 273.
4. Field, F. H. and S. H. Hastings. Anal. Chem. v. 28, 1956, pp. 1248-1255.
5. Grelfer, Bernard. Thesis, Dept. of Chemistry, Carnegie Inst, of Technol.,
Pittsburgh, Pa., 1958.
6. Holden, H. W. and J. C. Robb. Nature, v. 182, 1958, p. 340.
7. Holden, H. W. and J. C. Robb. Fuel (London), v. 39, 1960, pp. 39-46.
8. Lumpkin, H. E. and G. R. Taylor. Anal. Chem. v. 33, pp. 476-477, 1961.
9. Madison, J. J. and R. M. Roberts. Ind. Eng. Chem., v. 50, 1958, pp. 237-250.
10. Oming, A. A. and B. B. Grelfer. Fuel (London), v. 35, 1956, p. 381.
11. Reed, R. I. and W. Snedden. Third International Conference on Coal Science,
Valkenburg, Netherlands, April 27-30, 1959.
12. Reed, R. I. Fuel (London), v. 39, 1960, p. 341.
13. Sharkey, A. G. Jr., G. Wood, J. L. Shultz, I. Wender, and R. A. Friedel. Fuel (London), v. 38, 1959, p. 315.
14. Sharkey, A. G. Jr. Encyclopedia of Spectroscopy, ed. G. L. Clark, Reinhold
Publishing Corp., Nev York, 1960, pp. 607-613.
15. Sun, Bozen, C. H. Ruof, and H. C. Howard. Fuel (London), v. 37, 1958, pp. 299-308.
16. Vahrman, M. Nature, v. 189, 1961, pp. 136-137.

3.0
2.5
I- 2.0 z UJ u cc -UJ 0 . ' I 5 UJ i . -^ Z _) O >
1.0
p -
Fluorenes and / or ocenophthylenes -X Unheoted extract O Heated extract
450°C . -4 hours
-*• Includes 5-ring cata-condensed " system
- g—r / - d
ty\ tx
J_J 166 194 222 250 278 306 334 362 „ ,
180 208 236 264 292 320 348 376 MOLECULAR WEIGHT
Figure 9. - Mass spectrometer analyses of pyridine extract of Pittsburgh seam (hvAb), 84 per cent carbon coal.
1.5
UJ o a: UJ 0. I
UI
3 * o > .5
^^y 1 — \ — I — \ — \ \ \
4-ring cato-condensed aromatics X Unheoted extract o Heoted extract
4 5 0 ° C - 4 hours
-^Includes 6-ring peri-condensed system -
- / / I
X
I ^ L 228 256 284 312 340 368 396
242 270 298 326 354 382 410 MOLECULAR WEIGHT
Figure 10. -Mass spectrometer analyses of pyridine extract of Pittsburgh seam (hvAb), 84 per cent carbon coal.
10

ANALYSIS OF SATURATED HYDROCARBONS
IN BOILING RANGE 450-900°F
W. C. Ferguson and L. R. Snyder Union OIL Company of Califoinla
Brea, California
Abstract
A method for the determination of six compound classes
In saturated hydrocarbon samples has been developed. These
classes Include paraffins and mono-, di-, tri-, tetra- and
pentanaphthenes. The method is applicable to saturate fractions
extracted from both straightrun and cracked stocks in the carbon
number range from about 12 through 35 (450°-900°F). Data on
which the method is based will be presented, together with some
typical analytical results.
11

MASS SPECTROMETRIC ANALYSIS OF MIDDLE DISTILLATE
SATURATED HYDROCARBONS
A. Hood, P. R, Monmessln, and B. K. Fritts Shell Development Company
Houston, Texas
Abstract
A mass spectrometrlc method Is described for the analysis
of mixtures of saturated hydrocarbons containing 11 to 18 carbon
atoms per molecule. It Is based on polyisotopic fragment Ions and
provides volume percentages of n-alkanes plus Isoalkanes, monocyclo
aikanes, dlcycloalkanes, trlcycloalkanes, tetracycloalkanes, and
monoaromatics. The significant advantages of this method are (1) that
It has been developed specifically for the C.. to C,o range of ii io
petroleum saturates and (2) that It has been based primarily on
hydrocarbon-type concentrates and therefore, for the most part, is
not limited by the assumptions associated with pure compound calibrations.
12

Characterization of Aromatics In Light Catalytic Cycle Stock
hy
Tho.-nas Aczel, K. W. Bartz, H. E. Lumpkin and F. C. Stehllng
Humble Oil & Refining Company Research and Development
Baytown, Texas
Abstract
This paper describes the identification of aromatic compound types In a narrow fraction of a Light Catalytic Cycle Stock. Particular emphasis is given to the part of the investigation concerned with the analysis of compounds in the CfiH2jj_il). series. The data obtained indicate that these compounds are naphthenonaphthalenes, such as tetra-hydroanthraceneSj tetrahydrophenanthrenes and benzindanes, and the corresponding ketones.
Analytical evidence in support of the conclusions reported is discussed in detail. The investigation was carried out on sharp chromatographic fractions obtained by alumina gel percolation of the aromatic portion of a narrow distillate (622-625*^^) . Individual fractions were examined mainly by MS, but UV, NMR, IR, and catalytic micro-dehydrogenatlon techniques were also employed.
Introduction
Interest in the composition of light cycle stocks from catalytic cracking stems from the possibility of using this material as a source of higher valued products. As reported in a previous paper (l), an extensive program for the characterization of the major components contained in this refinery stream has been carried out in our Laboratories. The investigation was conducted on a narrow boiling (622-625°F) distillate fraction, vhich was previously shown to contain the maximum concentration in the compounds hitherto characterized as acenaphthenes and acenaphthylenes, respectively. One of the aljns of this study was in fact to prove or disprove the presence of these compound type s.
The general approach to the problem consisted in the examination,by MS, UV, NMR, IR and microdehydrogenation techniques, of sharply separated chromatographic fractions obtained by repetitive alumina gel percolations of the aromatic portion of the material under investigation.
Details on the separation technique used and other experimental conditions are reported in the above mentioned vork. In brief, the former consisted of an initial separation on aluTiina gel and repercolatlon on the same media of blends of adjacent cuts which appeared to be of interest. Thus cuts number 10, 11, 12, 13 and I k , l6, 17, l8 obtained in the first step became the feed for percolations A and B, respectively. The degree of separation achieved is Illustrated in Figure 1, in which summations by series of lov voltage parent peak intensities are plotted versus weight per cent of sample off the chromatographic column. The overlap noted between the terminal part of percolation A and the first of percolation B is due to the contiguity of the cuts selected for repercolatlon.
The Identification of the compound types belonging respectively to the CnH2n-6) O^H^n-S, CnH2n-10) CnH2n-l6 and CnH2n-l8 series, i.e. alkylbenzenes and benzothlophenes, indanes and tetralins, indenes, dihydroanthracenes and fluorenes, phenanthrenes and anthracenes, is discussed in our previous communication.
This paper deals vith the characterization of the corapound types found in the '^nH2n-12 3"" Cj,H2n-llt series.
Discussion
'^nH2n-12 Series
As expected, this series consists of tvo compound types, naphthalenes and dlbenzothlophenes (6). The bimodal distribution of the parent peak Intensities, plotted against cumulative weight per cent of the chromatographic fractions, in the -12 series is shovn in both Figures 1 and 2. The separation between the C15 naphthalenes and the Cj_^ dlbenzothlophenes of the same molecular veight is particularly evident in Figure 2, as well as the carbon number separation, in order of decreasing molecular veight, achieved
13

5 -g^
m
-s
0>
<1> C/5
-o e e =3
cn J2 o a>
Q .
c-
o
o
o
S 8 ^ ?1 (VJ
nnji3did y3d SNOISIAIC NI SIHOGH xwad
14

f o r t h e n a p h t h a l e n e s i n p e r c o l a t i o n A. These i d e n t i f i c a t i o n s a r e s u b s t a n t i a t e d by t h e d a t a shovn in F i g u r e 3 , i n which t h e c h a r a c t e r i s t i c fragment peaks a r e p l o t t e d . Fragment peaks c h a r a c t e r i s t i c of a l k y l n a p h t h a l e n e s a r e predominant i n p e r c o l a t i o n A, c o i n c i d i n g v i t h t h e f i r s t maximum i n t h e p a r e n t peak p l o t , v h i l e t h e i n t e n s e peak a t m/e 197 , a t t r i b u t e d t o d l b e n z o t h l o p h e n e s , c o i n c i d e s v i t h t h e maximum in p e r c o l a t i o n B. F u r t h e r ev idence f o r t h e s e i d e n t i f i c a t i o n s i s f u r n i s h e d by t h e l a r g e s i z e of t h e peaks a t m/e l U l and a t m/e 197 compared t o t h o s e a t m/e 127 and a t m/e l 8 3 .
The p r e s e n c e of a compound of mo lecu l a r formula CJ^JH-J^QS i s proved a l s o by t h e l o v v o l t a g e i s o t o p i c r a t i o s r e p o r t e d b e l o v :
Exper imen ta l T h e o r e t i c a l Cut No. ( P e r c o - 15 20 25 30 35 C^jHiS C13H10S l a t i o n B )
Peak h e i g h t 199,^ Peak h e i g h t 198^ 15 .29 1 5 . 1 2 13.kk 15.2I 15-30 l6.1t9 15.00
Heteroatoms can be detected from Isotopic ratios because of the relatively more abundant Cl3 carbon isotope (8).
The difference between the average isotopic value found and the theoretical value for C13H10S of + 0.27^ is higher than expected, and is probably due to the recording system rather than to a mixture of the hydrocarbon and sulfur compound, as high isotope ratios are also observed in other series.
UV spectra obtained on the above listed fractions contain characteristic dibenzothiophene absorption bands.
'^n"2n-l't Series
Mass speotral data indicate the presence of at least two and possibly three compound types in this series, revealed by the maxima in the plots of concentrations of individual carbon numbers versus veight per cent sample off the chromatographic column (Figure k ) . It must be noted that concentrations vere determined by lov voltage analysis (7). Since only approximate calibration data vere available, these should be regarded only as indicative of trends.
The first compound type is concentrated in fractions A-7 through A-1*0. The maxima for the individual carbon numbers appear again in order of decreasing molecular veight. The appearance of a second compound type is indicated by a second series of strong maxima in the C^-r and C g curves, respectively at A-kk and B-5 and at B-10.
Fractions A-kk and B-5 are equivalent because of the overlap in percolations A and B as mentioned in the introduction.
Indication of a third class of compounds belonging to the CnH2n-lli series is given by another maximum in the C^g ourve at cuts B-35 and B-kO. No identification of this type has been attempted because of the extremely small amount present in the distillate under examination.
The high voltage fragmentation pattern (Figure 5) offers sparse clues for the identification and differentiation of the tvo compound types. The most abundant peaks can be attributed to a loss of a methyl group from the moleoule lon, indicating the presence of at least two methyl substituents on the nucleus and possible nuclear molecular veights of 168 and 182.
Identifications for the tvo major compound types were carried out by using auxiliary spectral techniques. The investigation was focused primarily on the fractions in which raaximum concentrations of the CjjH2jj.iI| compound types were Indicated by raass spectral data.
The conclusions reached and the supporting evidence are discussed below in separate sections.
First Compound Type
Examination of the high and low voltage mass spectra and precise isotope ratio measurements (Table I) indicated that this compound type is a hydrocarbon of molecular formula CjiH2n-l4, as expected, with a nuclear molecular veight of l63 or l82.
NMR speotra obtained on fractions A-25 and A-35 contain absorption bands at
15

n O
1 i •
o
1 i
o
1 1
o 01
o a
u
O C
o> o "S > Q
CO
CM I
c CVJ
c O
OJ
1N30 d3d 3Wrn0A Nl SNOIlVaiN33NO0
16

chemical shifts characteristic of
(1) (2) (3) ( k ) (5)
Aromatic H, CHp o; to an aromatic ring, CHo cc to an aromatic ring, CH2 P or p^ to an aromatic ring, CH; attached to an alicyclic ring.
This evidence is compatible with the following nuclear structures:
CX3 ocQ a ? Perlnaphthane 1,2,3,'*-Tetra- l,2,3,U-Tetra- Benz[f lindane Benz[e] indane Nuclear MW I68 hydroanthracene hydrophenanthrene Nuclear MW 166 Nuclear MW 168
Nuclear MW 182 Nuclear MW l82
NMR data definitely exclude the presence of acenaphthenes
although this compound type has been considered to be one of the major components in middle distillates. This contention is based on the fact that neither fraction A-25 nor A-35 has an NMR absorption band at about 6.8 to 7-0 T (tetramethysilane standard = 10.0 ppm). The methylene groups in acenaphthene absorb at 6.85 T, and methyl substitution in the 3 or 8 position vould be expected to cause the ortho methylene resonance to shift upfleld from this value by about 0.15 ppn. The NMR spectrum of A-35 given in Figure 6 shovs no significant absorption in this range. It might be proposed that if the 1 and 2 carbon atoms in acenaphthene were each substituted with two methyl groups that no resonance at 6.85 T vould be obtained. Assuming that the CjjH2n-ll). species in A-35 are acenaphthenes, then the MS data indicate an average of 3.8 carbon atoms in side chains, predominantly as methyl groups. The intense absorption betveen 7.5 to 8.0 T indicates bhat the substituents are largely attached to aromatic rings, hence the 1 and 2 carbon atoms of acenaphthene could not be exhaustively methylated.
The NMR spectrum of A-25 is very similar to that of A-35, except that the band assigned to CHj's attached to alicyclic ring is relatively more intense in the former fraction. This indicates that the decrease in the average carbon number observed by MS in proceeding from A-25 to A-35 is caused primarily by a decrease in the number of alicyclic methyl groups, the aromatic methyl content remaining approximately constant.
UV spectra obtained on fractions A-25, A-35 and A-'+O (Figure 7) are broadly compatible vith those published (3) for the five compounds depicted above. They are consistent vith a perinaphthanic type structure vith the exception of an absorption band at 255 millimicrons present in fractions A-35 and A-l+O and a weak band at 326 millimicrons observed in all three fractions. The other suggested structures give rise to bands at 326 millimicrons, but not to the one at 255 millimicrons. In addition, they present weak bands in the 300-320 millljnicrons region not detected in these fractions.
The intensities of the UV bands attributed vith certainty to the first compound type (at 233 and at 326 millimicrons) follow the same variation pattern through the fractions exa riined as the corresponding MS parent peak intensities.
Since the absorption band at 255 millimicrons is increasing in intensity frora fraction A-27 to fraction A-UO it can be ascribed to the second compound type in this series. The band at 282 millimicrons is probably common to both compound types.
The presence of moderate concentrations of tetrahydroanthracenes and tetrahydrophenanthrenes in the above fractions has been verified by catalytic microdehydrogenation techniques. This approach has been described by Keulemans and Voge { k ) , Rovan (9) and Cousins (2). The dehydrogenation is carried out in a stream of carrier gas and the effluent products are examined by GC. According to their data the corapounds
17

E E E E E
J_ J_ I _L i n O >" O i " OJ 5 N K w
nn j iBd id d i d SNOISIAia NI S IHOGH >iv3d OBio^ddoo sdoiosi

containing cyclohexyl rings are dehydrogenated to the corresponding aromatics, while the cyclopentyl rings remain essentially unaltered.
Slight modifications on the technique allowed its application to the problems encountered in this vork. The equipment consisted essentially of a pyrex glass reaction tube heated at 700°F containing a platinum on AI2O3 catalyst, connected on one side to a supply of the carrier gas (helium) and on the other to a cold trap. Reaction products collected in the cold trap were transferred to the mass speotrometer for analysis and the data obtained compared vith those recorded prior to dehydrogenation. The use of MS was warranted by the complexity of the materials under investigation.
Experiments with pure compounds and literature data indicated that tetrahydroanthracenes and tetrahydrophenanthrenes dehydrogenate to anthracenes and phenanthrenes belonging to the Cj^H2n-l8 series, vhile benzindanes and perinaphthanes remain either unaffected or dehydrogenate at the most to compounds in the CjjH2n-i6 series.
The presence of anthracenes and phenanthrenes and the simultaneous decrease in the CnH2n-lU ^ypes detected by both MS and UV, as shovn below, in the dehydrogenation products pf cuts A-13 and of a blend of cuts A-27,-28,-29-31, indicates therefore that these fractions contain both tetrahydroanthracenes and tetrahydrophenanthrenes.
Dehydrogenation Data
A. MS Analysis by Low Voltage Nbthod (wt. per cent)
Compound Type
CnM2n-6
Cn''2n-8
<^n'^2n-10
OnH2n-12
^n^gn-lU
^^n^Sn-ie
Cn«2n-l8
Cut A-13 Feed
10.9
2.8
1+5.5
36.6
k.2
Product
12.fc
50.6
22.lt
7-1
7-1
+ 1.9
- 2.8
+ 5.1
-l4.2
+ 2.9
+ 7.1
B. Differential UV Data (vt. per cent)
Found after Dehydrogenation Cut A-13
Anthracenes (at 377 m i) I.5
Phenanthrenes (at 255 m^) 7.2
total CnH2n-l8 8.7
Cuts A-27,-28,-29,-31 Feed
3.8
1.8
18.0
70.8
5.6
Cuts A-27,-28,-29,-31
3-3
13-1
l6.it
Product
12.2
2.5
0.8
31.6
31.1
13.0
8.6
A
+ 8.1*
+ 0.7
+ 0.8
+13-8
-39-7
+ 7.k
+ 8.6
The MS data also show an increase in the -12 and -l6 series. These may "be attributed to craking of the - I k types to naphthalenes and to the dehydrogenation of perinaphthanes or benzindanes. The unreacted material in the Cj H2j _i]4. series consists probably of benzindanes, although incomplete dehydrogenation of the other types cannot be excluded completely.
Second Compound Type
The material giving origin to the second series of maxima In Figures h and 5 is an oxygenated type, possibly one of the following structures, appropriately substituted with methyl groups to account for their molecular veights from 210 to 22U.
Perinaphthanone Nuclear MW l82
Benzindanone Nuclear MW l82
Te t r ah y d rophe nan -threnone Nuclear MW I96
Tetrahydro-anthracenone Nuclear MW I96
19

.52 "to
o c
<I o» o
i Q
C/3
c CVJ
c CJ
iN30 d3d 3WmOA Nl SNOIlVaiN30NO0
20

The e x p e r i m e n t a l ev idence i n suppo r t of t h e s e s t r u c t u r e s f u r n i s h e d by e x a c t MS i s o t o p i c d a t a , h i g h r e s o l u t i o n mass measurements , IR and UV s p e c t r a , i s d i s c u s s e d be low. The pWrsenoe of a s i m i l a r c l a s s of compounds, f l u o r e n o n e s , i n Wilmington p e t r o l e u m h a s been r e p o r t e d r e c e n t l y by La tham'e t^ al-r—(5') • •
The measurement of i s o t o p e r a t i o s from mass s p e c t r a l d a t a can be a ve ry powerfu l t e c h n i q u e i n i n d i c a t i n g t h e p r e s e n c e of a h e t e r o - a t o m i n a m o l e c u l e . The f i r s t c l u e t h a t t h e second peak i n t h e Cj Ho , ih s e r i e s was an oxygenated compound came from examining t h e r a t i o s of t h e peak h e i g h t s of masses 211 and 210 (C^g) in t h e f r a c t i o n s t a b u l a t e d be low:
B-1 B-5 B-10 B-15 CxffiiQ Cl5%l t°
I s o t o p e , R a t i o , i 17-69 17.OI 16 .48 16 .58 17-57 16.I+7
The I s o t o p i c v a l u e a t B-1 i s i n very good agreement with t h a t expec ted f o r a C^^xQ hydroca rbon ; t h e va lue a t B-5 i s i n t e r m e d i a t e ; t h o s e f o r B-10 and B- I5 a r e much l o v e r . The i s o t o p e r a t i o s fo r t h e l a t t e r t v o f r a c t i o n s check ex t r eme ly v e i l v i t h t h e t h e o r e t i c a l va lue of 16.14-7 fo r an oxygenated compound, C^i 'H-^ifi. Th is m a t e r i a l i s t h u s b e l i e v e d t o be an oxygenated compound. F r a c t i o n B-5 i s a mix tu re of t h e hydrocarbon and t h e oxy-compound and the i s o t o p i c d a t a i s I n t e r m e d i a t e f o r t h i s f r a c t i o n , a s vould be e x p e c t e d f o r a mixt u r e . The i s o t o p i c d a t a mentioned above, t o g e t h e r wi th s i m i l a r d a t a f o r o t h e r f r a c t i o n s , a r e g iven in Table I . In examining t h e s e d a t a one should b e a r i n mind t h a t an unexp la ined b i a s of about + 0 . 1 ^ t o + 0 . 3 ^ has been e x p e r i e n c e d r e c e n t l y i n a l l of t h e i s o t o p i c d a t a o b t a i n e d on our i n s t r u m e n t . Th is i s e x e m p l i f i e d by t h e measured i s o t o p i c v a l u e s fo r t h e we l l i d e n t i f i e d C- c: d i b e n z o t h i o p h e n e (CnH2n-12 s e r i e s ) .
Exact mass measurements , c a r r i e d out on a CEC Model 21-110 h igh r e s o l u t i o n mass s p e c t r o m e t e r of t h e Mattauch d e s i g n a l s o confirmed t h e p r e s e n c e of oxygenated compounds i n t h e s e f r a c t i o n s . Data o b t a i n e d on f r a c t i o n B-12 a r e r e p o r t e d b e l o v .
Nominal Mass Measured Mass T h e o r e t i c a l Mass f o r
Cl5HlltO C i 6 " l 8
210 210 .173 210 .171 210.207
"^ le^ ie" ^^17^20
22lt 2214-.187 22 l t . l 91 22lt.227
The infrared spectrum of fraction B-10 contains tvo sharp carbonyl bands. One at 1682 cm"-'- is believed due to a conjugated carbonyl and the other at 1725 cm"-'- is attributed to a non-conjugated carbonyl.
Examination of the UV spectra of several fractions containing the oxygenated material reveals that each has a veak, yet distinct maximum, at 255 m^. This absorption band first appears in the UV spectrum of A-35 (shovn in Figure 7), and is consistent with the appearance of the C^-j oxygenated compound, shovn by the MS data in Figure It. The -saHe_255-m'[r' baa!i-aisS-appears In A-ltO, and in the fractions of the B percolation through B-I5, as shown in Figure 8. The initial appearance, general variation of Intensity, and disappearance of the UV features in the chromatographic fractions agree well with the MS plots.
A complete interpretation of the data is hindered by the appearance in these fractions of two other compound types dlbenzothlophenes and dihydroanthracenes. Althoiigh not quite sufficient by themselves, the .'ata obtained are consistent with the conclusions deduced from the MS and IR spectra, which '..learly indicate that the second compound type found in the C H2jj_2lt. series is an aroraatic ketone. In addition to the evidence discussed above, the similarity of the high voltage mass spectrum to that of the first compound type indicates an analogous ring structure, I.e. the structures of ketonaphthenonaphthalenes shovn at the beginning of this section.
Conclusion
The investigation discussed in this report, together vith the data already published (l) has led to a radical change in our ideas of the nature of certain compound types in light catalytic cycle stocks. We deera particularly e.^nifleant the proofs obtained on the absence of acenaphthenes, at least in the narrov distillate fraction studied. The discovery of an oxygenated corapound type in .relatively high concentration is also meaningful.
The gathering of the detailed information obtained in the course of this work vas made possible by the sharp separations achieved and the integration of complementary
21

'-r
-s
cc UJ m s
- §
- 8
" « ! Z
- o 3
o Q-
E
a> o a>
cn
CA <l>
CO
c CV)
c o
JUO-
~indl3dld H3d SNOISIAia Nl S1H0I3H ><V3d a3133d»00 3d010SI
22

analytical techniques and tools. The role of mass spectrometry In particular vas shown to be extremely valuable, both in indicating the presence of different compound types, and thus pinpointing the fractions to be subjected to further analysis, and in identifying the components contained in the same fractions. The data obtained by the use of high resolution mass spectrometry illustrate well the power of this technique.
Acknowledgement
We vish to thank Dr. P. J. Klaas, formerly of Esso Research and Engineering Company, for the precise mass measurements obtained on the high resolution mass spectrometer. We wish to thank also Mr. D. J. Krlsher, Mr. J. L. Taylor, Mr. G. R. Taylor, Mr. R. K. Saunders, Mr. T. J. Denson, Mr. Theo Hines, and Mr. H. W. Kinsey for their valuable contributions to experimental phases of this work.
Literature Cited
Bartz, K. W., Aczel, T., Lumpkin, H. E., and Stehllng, F. C , A.C.S., Dlv. of Petroleum Chem. Preprints, Vol. 7 , No. 1, page lltl.
Cousins, L. R., Clancy, D. J., and Crable, G. F., Anal. Chem., 33, 1875 (I961).
Friedel, R. A., Orchln, M., Catalog of Ultraviolet Spectra of Aromatic Compounds, John Wiley, Inc., Nev York, 1951, Nos. 213, 211t, 215, 216.
Keulemans, A.J.M., Voge, H. H., J. Phys. Chem., 63, 76 (1959)-
Latham, D. R., Ferrin, C. R., and Ball, J. S., Anal. Chem. 3lt, 311 (1962).
Lumpkin, H. E. and Johnson, B. H., Anal. Chem. 26, 1719 (l95li).
Lumpkin, H. E., Anal. Chem., 30, 321 (I958).
Lumpkin, H. E., and Nicholson, D. E., Anal. Chem. 32, 7k (i960).
Rowan, Robert, Anal. Chem., 33, 658 (I961).
Table I
C No.
^15
=16
°17
=15
C16
=17
20
1 7 . 6 9
1 9 . 0 7
1
16 .69
17 .69
Perc 25
1 7 . 8 6
I s o t o p e R a t i o s from
= nH2n
Expe r imen ta l o l a t i o n A.
30.
1 6 . 7 2
17 .87
P e r c o l a t i o n B .
5
1 6 . 7 6
1 7 . 0 1
17 .60
10
16 .50
i 6 . i t 8
F r a c t i o n s 35
16 .67
1 7 . 8 1
F r a c t i o n s
15
16 .58
MS Lov Vol tage S p e c t r a _jl^ S e r i e s
ItO
1 6 . 9 2
17.8ii
18 .03
The Hydrocarbon
16.U6
17 .57
1 8 . 6 8
Hydrocarbon
I6.1t6
17-57
1 8 . 6 8
D r e t l c a l Oxygenated
15-36
l6.1t7
17-58
Oxygenated
15-36
l 6 . i t 7
17-58
Compd.
Compd.
23
230 240 260 270 280 290 300 WAVE LENGTH (MILLIMICRONS)
340 350
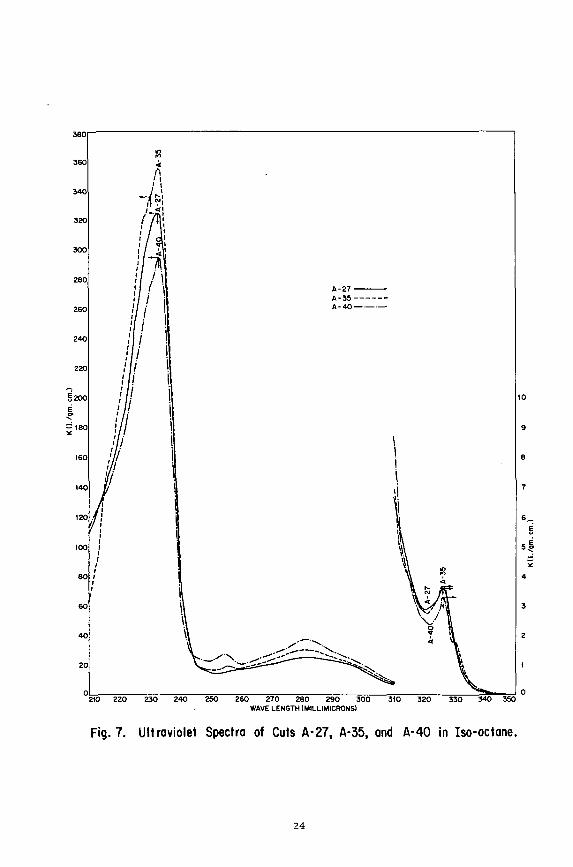
Fig. 7. Ultraviolet Spectra of Cuts A-27, A-35, and A-40 in Iso-octane,
24

2 3 4
F ig . 6. NMR Spectrum of Cut A - 3 5 .
5 6 7 Chemical Shift , ppm
I I I
I I
£20 I » 240 290 ^ r - - 1 - - > - -300 MO 3T0 SSO 390 400
Fig. 8. Ultraviolet Spectra of Cuts B -1 , B-5, B-10, and B-15 In Iso-octane.
25

THE MASS SPECTRA AND ANALYTICAL CORRELATIONS OF C5 THROUGH C,o CODA COMPOUNDS
by
R.F. Kendall, F .O . Cotton, N . G . Foster, and B.H. Eccleston Bartlesville Petroleum Research Center, Bureau of Mines
U.S. Department of tfie Interior, Bartlesville, Ok la .
SUMMARY
The problem of air pollution is of national interest, and as a port of the investigation of this problem the Bartlesville Petroleum Research Center is studying exhaust gases produced by automotive engines. These gases have been cited as contributors to the eye-irr i tating components of the smog that plagues urban areas throughout the country. Identifications of the hydrocarbons in automobile exhaust gases ore hindered by the relative unavailabil ity of pure mass spectra reference materials, especially of unsaturated hydrocarbons other than the simple alkenes.
The moss spectra and analytical correlations of over 30 cycloolefins, diolefins, and acetylenes (CODA compounds) ore reported. Spectra correlations ore supported by low voltage moss data. Methods ut i l iz ing gas-liquid chromatography for isolating high purity unsaturated reference compounds are described.
Particular emphasis is given to the moss fragmentation patterns of the acetylenes as compared to those of the cycloolefins and diolefins. Moss interpretation of mixtures containing such hydrocarbon types is frequently diff icult because each type has the same empirical formula, C^H2n-2 ' ° " ^ ° " abundance of rearrangement peaks.
Avai labi l i ty of spectra and correlations on pure CODA compounds should aid in future identification studies on exhaust gases.
26

DETERMINATION OF HYDIUJCAEIBON TYPES IN KEROSENE
RANGE DISTILLATES BY MASS SPECTROMETRY
L. R. Snyder, H. E. Howard, and W. C. Ferguson Union Oil Company of California
Brea, California
Manuscript Withdrawn
27

MASS SPECTROMETRY OF SULFUR COMPOUNDS. IV . STUDIES OF THE MASS SPECTRA OF 2-t-BUTYL-, 3-t-BUTYL-, AND 2,5-DI-t-BUTYLTHIOPHENES
by
N . G . Foster, D.E. Hirsch, R.F. Kendall , and B.H. Eccleston Bartlesville Petroleum Research Center, Bureau of Mines
U.S. Department of the Interior, Bartlesville, Ok la .
SUMMARY
The moss spectra of more than 50 alkylthiophenes hove been reported in recent years, providing o better understonding of the processes of frogmentotion in such molecules. Studies of moss spectra of the available tertiary butyl thiophenes have indicated a mechanism of fragmentation entirely different from that proposed for the bulk of the thiophenes. These data and similar results on closely related alkylbenzenes, observed by other workers, prompted the more detailed study of these types of alkylthiophenes reported here.
T>ie mass spectra of 2 - , 3 - , and 2,5-di-t-butylthiophenes are presented and the possible paths of ion fragmentation discussed. Low voltage data w i l l be used to support these suggested mechanisms. The fragmentation mechanisms wi l l be compared with those existing for other a l ky l thiophenes and with those reported by other workers for analogous alkylbenzenes. The analytical consequences of fragmentations from these types of thiophenes wi l l be discussed*
Knowledge of spectra of these types of compounds and of their fragmentation patterns w i l l aid in interpreting mass spectra and in predicting basic moss spectral patterns for al l a lky l th iophenes .
28

Appearance Potentials and the Masa Spectra of
Fluorinated Olefins
Chava Lifshitz and F. A. Long Chemistry Department, Cornell University
Ithaca, New York
Abstract
Appearance potentials and mass spectra have been determined for a group of simple fluorinated olefins. In some respects the reactions of the positive ions are similar to those of the'hydrocarbon analogues; for example there are frequent losses of Ha or HP to form acetylene ions. Rearrangement processes, Involving atom migration, occur more frequently In the more highly fluorinated compounds. For" the most part the relative rates of the unimolecular decomposition processes vary with the energy demands, but frequency factors are occasionally quite low for rearrangements. The observed appearance potentials agree fairly well with values calculated from heats of formation of the species Involved, but there are some exceptions. Ionization efficiency curves for some of the fragments from CFsCFH and CaP* show Interesting features which are discussed.
Introduction
The mass spectra of fluorocarbons are usually quite different from those of the hydrocarbon analogues. For Instance, several Interesting rearrangements are observed, which are absent In the hydrocarbon spectra''. The fluorinated olefins were chosen In the present study, because these compounds show considerable parent lon peaks In their spectra, contrary to the behavior of the fluorinated paraffins^. Furthermore, the heats of formation of several of the fluoroethylenes have been determined experimentally by Neugebauer and Margrave^, while others are known from estimations^. It Is thus possible to gain further Information from the appearance potentials of the different fragments about the thermochemistry of the radicals and Ions Involved.
Experimental
The data were taken on a C.E.C. mass spectrometer, model 21-401, • which has been modified as described previously*.
Appearance potentials were determined by the vanishing current method, using argon or neon as calibrating gas. In the same way as has previously been discussed*.
The fluoro-ethylenes studied were all better than 99.856 pure.
Results and Discussion
75 volt spectra
Table I gives the spectra (In terms of percentage yields of the varloua Ions) of several fluoroethylenes. These were obtained with 75 volt electrons, 10 uA current and an accelerating voltage of 210 v.
On leave from the Israel Atomic Energy Commission
29

Table I
Species
CHa;*; CH3+ CaH\ CsHsT CsHsl
CF\ CFH'^, CFHa]; CaFH"^, CaPHaJ CaPHa* CFa\ CFaHT CaFa . CaFaH% CaFsHa CFg'" C2F3+, CaPaH"*" CaF4 +
Species
CHa"*" CaHa+ C2H3+ CaH4 + CF+ CPH+ CFHa+ C2FH+^ CaFHa"*" CaPH3+ CF2+ CFaH+ CaPa"*" CaPaH+^ CaFaHa+ CP3+ CaF3+ CaF3H+ CaF4 +
Masi
CHa CHa
0.9 0.1 k . l
24.7 26.8 41.5p
Appearance
CHsCHa
19.0 13.2 14, Oe 10.60
3 Spectra of
CHa CHF
0.6 0.2 1.8 9.9
11.4
2.8 0.9 0.1 10.4 24.9 34.5p
Table
Potentials i
CHa CHF
15.73 14.3s
15.43
14.04 14.02 10.4s
Fluoroethylenes
CH^CF^
2.6
1.1
13.1
12.4 9.2 16.7
0.9 0.3
4.8 35.4p
f
II
CHFCFa
15.2 5.7
1.8
1.7 16.0 1.0 29.7
0.4 26.2p
f
for Fluoroethylenes In volt
CHaCFa
17.a 19.78
15.23
15.0a 14.4* 14.80
16.67 10.45
CHFCFa
15.a 15.38
2o
19.28 14.2a 14,83 16.13
10.33
CPaCPa
28.6
10.6
0.3
1.3 37.3
20.4p
a
CPaCPa
14.08
15,13
13.54 16. Oo
10.1a
30

Intenaltles are rounded off to the nearest 0.1^ and most of the peaks below this value are omitted. Doubly,charged Ions are not Included, The agreement with previously published results on CaH*. CH2CF2 and CaF4 Is good, except for a generally smaller degree of reaction In the present case. This Is especially apparent for CaF4, where CaFa"*" is the highest peak In the spectrum whereas CF"*" is the highest according to Dibeler and coworkers^.
As one goes from ethylene to perfluoroethylene, successively substituting the hydrogens by fluorines, the general features are a gradual lowering of the yields of acetylene Ions (CaHa"'", CaHF+ or CaPa^) and an Increase In the yields of the rearrangement products CH3''", CHaF , CPaH"*", and CF3+ as well as CF ,
CHaCFa and CHFCFa show low yields of the parent-mlnus-one-hydrogen-atom; a similar behavior has been observed In CeF4Ha and CBFBH^, There Is In this ethylene series also a gradual decrease In parent lon yield and an Increase In the yields of Ions of the type CHa , CHF"*" and CPa"*".
Appearance Potentials
Table II summarizes the appearance potentials observed for the main peaks of the fluoroethylenes. These data are averages of from 3 to 5 runs for each species. The standard deviations are In the order of from 0,05 to 0,10 e,v,, for the more abundant Ions,
The Ionization potentials of these compounda have been prevloualy determined. The values which were obtained are listed In Table III.
Spectro-scoplc
CaH4 CHaCHF
CH2CF2
CHFCF2 C2F4
Comparl
Present Electron Impact
10,66 10,45
10,45
10,33 10,12
Table III
son of Ionization
Previous Eleotron Impact
10,46-10,9®
9.3^°
Potentials
Photo-; Ionization
10.37® 10.36« 10.30® 10.33^ 10,14® 10,12®
10,51''
The present electron Impact Ionization potentials are all 0.1-0.2 e.v, higher than the photoionization values®.^ except that for C2P4, Other appearance potentials which have been measured previously are for the fragments from CaH4 ® and for CPa"*" from CaF4^° and the agreement Is quite good.
The Ions of lowest appearance potential for the "hydrogen" end of the series (Table II) are the acetylene Ions, which are formed from the parent by an Ha or HF split, while for the more fluorinated members the rearrangement Ions CPaH"*", CF3"'" and CF"*" lead to the lowest appearance potentials. The energy demand for the production of the CXa"*" Ions (CHa+, CHF"*" and CFa"*") decreases with fluorine content. On the other hand, the energy which Is needed for the production of parent-minus-one-atom Increases with fluorine content; this again Is similar to the trend observed for fluorobenzenes^. The next section Illustrates these features further.
Breakdown Mechanisms
Figure 1 shows the proposed mechanism for the CH2CHF spectrum. The numbers above the formulas are the percentage yields, while those above the arrows are the energy differences in going from parent ion to product lon. C2H2"'" is formed from the parent by an HF split, while C2HF"'" is formed by an H2 split. Although the acetylenic ions have lower appearance potentials than the parent-minus-one-F or one-H ions, their total yield Is lower. This is indicative of unfavorable frequency factors. CF"*" is formed by direct rearrangeraent from the parent,
31

together with GH3 and not with CHa-fH; this will become evident in the forthcoming thermochemical calculations.
9.9
34.5 ^ CHaCHF .
A.P.=10.4s
4.98 ,
CaHa
11.4 C2H3+
10.4 C2HF"'"
24.9 • CaHaP"*"
2.8 CF •
Fig, 1, Mechanism of CHaCHF spectrum
Figure 2 ahows the mechanism for the production of the CH2CF2 spectrum. Here already a greater contribution from rearrangement ions as compared to acetylenic Ions, is observed. That CH2"'' is not a secondary (from C2H2F+ or CH2F9 but formed directly by cleavage of the ethylenic bond, will be seen from the thermoehemlcal calculations. Neutral radicals are assumed to be formed along with the different positive ions. Indeed no negative ions have been observed for CHaGFa^^.
Figure 3 shows the proposed mechanism for CaF4. The possibility that CF is a secondary as well as a prImajTr is shown by the arrow In parentftesis. The value of 1.7 which Is given beside the arrow will be discussed in the following section.
Ionization Efficiency Curves
It is seen that on the whole the energy demand ia what determines the lllcelihood of a process, but there are some striking exceptions. In CaP* (Fig. 3) for example, CP3'*' has the lowest appearance potential other than the parent, yet comprises only 1.3 percent of the spectrum at 75 volta. Figure 4 shows the Ionization efficiency curve for this ion; tne striking feature is that there is almost no linear rising part.
35.4
CH2CF2 A.P.=10.4s
3.99 . y ^
4.33 .
6.2B >
4.63 ,
\ 4.7a,.
\ 7.35 ,
9.2 CaHF"'"
16.7 4,9p CaHaF+ '
4,8 , CaPaH
12,4 CHaP"'-
13.1 CF+
2.6
1,1 C2H£+
CHa+
Fig, 2, Mechanism of CHaCFa spectrum
32

Fig. 3. Mechemism of CPaCFa spectrum
In order to study this point further, the dependence of the percentage yields of the different fragments from CaF4 upon the ionizing voltage waa determined. Figure 5 ahowa this dependence for several ions. Ve-I^ Is the ionizing voltage minus the ionization potential of the parent. CF3'*' rises to a low maximum yield at a relatively low Vg-I* and then levels off. CP" shows a similar behavior to that of CFa'*' at low voltages (see Figure 5) but at higher voltages the CF"*" yield rises very steeply.
The dependence of the percentage yields of the different fragments from CFHCPa on the ionizing voltage was also studied and the results are given in Figure 6 (the voltage scale was not calibrated in this case). Here, too, CPaH"*" rises to a maximum but this ia at a much higher yield than CPa''" in CaF4 and at a liigher ionizing voltage.
Several ionization efficiency curves for CF''" are shown in Figure 7. These were drawn so that the slopes of the linear parts are equal in all three oases. The CF curve from CHaCFa illustrates the expected behavior. The CF"*" curve from C2F4 shows a break, while the CF+ curve from CHFCFa shows a long tall.
It is appropriate to point out at this point how appearance potentials were determined for CF''" and CF3''" In CaP4 and for CP+ from CFHCPa. In all of these casea the preaaure of the gaa studied and that of the argon were matched so that the first parts of the ionization efficiency curves for the ion and for Ar" coincided (contrary to the usual procedure* of matching the linear parts). The values thus obtained are the ones given in Table II. A second appearance potential of 17.r V was determined for CF"*" in CaF4 from the break in the ionization efficiency curve by adjusting the pressures of C2P4 and Ar so that the linear slopes were the aame. If it is assumed that this higher appearance potential la the conaequenoe of a secondary decomposition proceaa one calculates the parenthetically noted value of 1.7 volts for going from CaPa to CF"*" (Figure 3). Appearance potentials for these Ions CF''" and CF3+ are uncertain to a greater degree than Is shown by the experimental spread because of the odd shapes of the ionization efficiency curves.
Thermochemical Calculations
Sorae thermochemical calculations were carried out based on the measured appeareince potentials. Table IV shows some of the heats of formation which were used in theae calculations, aa well as the results obtained. The values for CHaCHF and CPaCFH are estimations by Meslov and Maslov^. The AHf value for CHaCHF is shown to be correct by the appearance potential of CBH3"'' from thla compound; knowing the heat of formation of CaHa"*" from Ita appearance potential from C2H4, the heat of formation of CHsCHF is calculated to be -1.22 e.v.
The heats of formation of CHaP"*", CPaH''" and CFs"*" given In Table IV are from their respective appearance potentials in CHaCPa, CHFCFa and CFaCPa. The listed heat of formation of CF was uaed In these calculations. These results are based on two assumptions, namely that neutral CF is formed in the processes forming these three ions and that excess rearrangement activation energy is negligible.
33

35
\ o
^ o c
s o o. e o o
O - P (0
T ^
u n)
c 0} h OJ
IXt,4 E ^ '^
<D "D ^ CM O
N
O «
c X 0) u
34

The heat of formation of CF+ given in Table IV is calculated from its appearance potential in CHaCHF assuming the process: CHaCHF—* • CH3 -I- CF"*". From the heats of formation of CF"*" and CF the ionization potential of CF is calculated to be 9.59 v. As any contribution from rearrangement energy was again neglected in this case AHf(CF''') as well as I.P. (CF) constitute upper limits. The latest spectroscopic ionization potential of CF is 8.9 volts^'. The posBlbillty that CF+ is formed by the process:
CHaCHF — » • CHa •<• H + CP"''
instead of by direct rearrangement from the parent was considered but discarded, because this would give I.P. (cP) = 6.22 e.v., which Is much lower than any of the previously reported results on CF.
Table IV
Heats of Formation and Ionization Potentials of Some Selected
Fluorocarbon Species
Species AHf,e.v.
C H B C H P * CHaCFa* CHFCFa* CFaCPa* CFsCF-CPa* CHaP''' CPaH"'' CP,''-CF+
CF* CPa CHaF CPa*
-1.22^ -3.36^
-6.59^ -11.22"^ -te.48 +6.1r -1-3.72
+12.8a
+3.2a'^ -1.60
-5.a"
I.P..V
9.59
9.45 8.9
Literature values which were used in our calculations a. Ref. 3, these are estimations which are good to within 5-10J6 b. Ref. 2, experimentally determined values c. Ref. 12, an estimation based on AHf(C2F4) d. Ref. 13, based on the spectroscopically deteimlned C-F bond
energy. e. Ref. 14, from kinetic meaaurementa of activation energies.
From the heats of formation of CFa and CP3'*" (Table I V ) , the ionization potential of CF3 is calculated to be 8.9 v, as compared to the direct electron Impact value on the CFa radical, of 10.1 v^®. The preaent value la in better agreement with the value based on CF3 appearance potentials from trlf luoromethyl halidea^''. The present low value may be the adiabatic ionization potential of the radical. On the other hand, the possibility of an lon-palr formation cannot be excluded, especially in view of the peculiar ionization efficiency ourve of CP3 from C2F4.
If CF and CHaF''" are both formed by similar rearrangements from the parent CHaCFa, then the difference In their appearance potentials from this compound Is equal to the difference In the ionization potentials of the respective radicals, becauae both of theae differences are equal to the AH of the reaction:
CHaP'*' -H CF V CHaF -I- CP"'"
Having obtained an Independent value for the ionization potential of CF (Table IV) one may proceed to calculate the ionization potential of CHaF. The value (9.4s v) thus obtained Is in good agreement with the direct measurement on this radical (9.33 v ) , according to Lossing and coworkers'-®.
Attempts were made to calculate the ionization potentials of CHF and CFa from their appearance potentials in CHFCFa a n d CaF4, respectively. In order to do this, the heat of formation of CFa had to be known. There
35

are several conflicting values for this in the literature. The value in Table IV of AHf'(cFa) = -1.60 is calculated from measurements on the appearance potential of CaF4"'" from C3P0 and Is in good agreement with the value of Margrave and coworkers'-®. Even so It is an upper limit due to possible rearrangement energy. But the appearance potential of CHa"*" in CaH4 is 2.b volts higher tlian the calculated value, if CH, ia formed with CHa. The CHa"'' appeareince potential In CHaCFa is ~ 1.6 volts higher than the calculated value, if CHa"*" la formed with CFa. Yet both of these appearance potentials are several volts lower than the values calculated. If CHa"'' is a secondary (in one caae via CaHs and in the other via CaHaP''"). It thus seems that excess energy is involved in the breakage of the ethylene bond and the CHP"*" and CFa"*" appearance potentials cannot be used to calculate their ionization potentials.
References:
1. J. R, Majer, "Mass Spectrometry of Fluorine Compounds" in Advances in Fluorine Chemistry, M. Stacey, J. C, Tatlow and A. G, Sharpe, Editors, Vo. 2, pp. 55-103.
2. C. A. Neugebauer and J. L. Margrave, J. Phya. Chem., 60, I318 (I956). 3. P. G. Maslov and Yo P. Maslov, Khlm. 1. Teckhnol. TopTlv 1. Masel
_2, No. 10. 50-5 (1958); CA . p. 1910. 4. A. B. King and P. A. Long, J. Chem. Phys., 29, 374 (1958). 5. F.L. Mohler, v. H. Dibeler and R. M. Reese,"j. Res. Natl. Bur. Stand.
49, 343 (1952). 6. P. H. Field and J. L. Franklin, "Electron Impact Phenomena" pp. 248-
253. 7. Price and Tutte, Proc. Roy. Soc. A174 207 (1940). 8. R. Bralaford, P. v. Harris and W. C, Price, Proc. Roy. Soc. A258
459 (i960). 9. Matsunaga and Watanabe, private communication. 10. J. L. Margrave, J. Chem. Phys., , l43 (1959). 11. R. M. Reese, V. H.Dibeler and P. L. Mohler, J. Res. Natl. Bur.
Stand. 51, 367 (1956). 12. H. C. Duus, Ind. Eng. Chem. 47. 1445 (1955). 13. E. B. Andrews and R. P. Barrow. Nature I65, 89O (1950). Proc. Roy
Society (London) 64A. 68I (1951). 14. B. S. Rabinovitch and J. P. Reed. J. Chem. Phys., 22. 2092 (1954). 15. J. W. C. Johns and R. P. Barrow. Proc. Roy. Soc. ATT. 476 (1958). 16. F. P. Lossing, P. Kebarle and J. B. Desousa, "Advances In Mass
Spectrometry", Ed. J. D. Waldron. Pergamon Press, p. 439 (1959). 17. V. H. Dibeler, R. M. Reese and P. L. Mohler. J. Res. Natl. Bur.
Stand. 2L, 367 (1956). 18. L. Brewer. J. L. Margrave, R. P. Porter and K. Wleland. J. Phys.
Chem. 65. 1913 (I96I).
36

KASS SPZCTRA OF T3EPSNID AHD SSSQUITlfflP^MS HYDROCARBOHS
C. B. Koons and J . N. Mercer J e r s e y Eroduc t ion Rasecirch Company
Tulca , a-.lr.homa
A study of the mass spectral - chemical structure correlations of fifteen terpene and sesquiterpene hydrocarbons v;ill be presented. The presence of carbon-carbon double bonds in all of these hydrocarbons maltes correlation difficult because of the abundance of rearrangeraent peaks. However, the fraQraentations of these hydrocarbons on electron impact do seem to present certain patterns which may ba useful to 'the analyst invol- ed in either qualitat'ive or quantitative analysis of these hydrocarbons. Some excellent mciss spectral data ai-id interpretations have been reported by Rriedman and Uolf (I958) and Gilchrist and Reid (I960). This report will be concerned vri."oh five of the same hydrocarbons investigated by these woi-kors as v'--,-ll cs six terpenes and four sesquiterpenes not reported.
The mass spectra for these hydrocarbons were obtained on a Consolidated SI-IO3C mass spectrometer and recorded with the C3C Mascot peak digitizer. The mass spectra were •cci;en with 70 volt ionizing electrons. idiaust pumping was accanplished t r i th a Varian 'Kj/liter/sec. ion pump. Liquid and solid samples were introduced into the mass speotrometer through the Microtek Dry Orifice Inlet System, which was described in sorae detail by Mc.M.ams and Harris at the last A,3TM i i- lk Meeting in Chicago. A double-ended-glass pipet was used for the liquid sami les and a glass sample oup dipper for solids sueh as camphene. Standard deviation of sample size on multiple runs with the double-ended pipet was 2 0 and the solids dipper 3t=- Tills heated inlet system is so constructed that the vaporized sample comes in contact only with glass. Metal surfaces, which are knovm to catalyze double bond migrations in hydrocarbons, are avoided. In order to determine if any appreciable double bond migrations aiid subsequent rearrangements /ere occurring in the heated inlet system at 150° C , spectra were obtained on several of the same terpenes investigated by Friedman and Wolf (1953). In their system, the sajnples were sealed directly to a tube going into the ionization chamber and wore run from the vapor pressure of the sample at dry ice temperature. Spectra on four hydrocarbons xrere corapored; c.araphene, dipentene, o^-pinene, and ^-pinene. Figure 1 shows comparisons of the more praninent spectral peaks for caiirohenc, and Figure 2 the sajne for ( (.-pinene. Dipentene and 0-pinene gave similar results. It appears that sijnilar spectra are obtained by the ti/o methods, and that double bond migration is negligible in the heated inlet system. The inlet system v/as maintained at 150° C. for obtaining the mass spectra of the eleven terpene and four sesquiterpene hydrocarbons.
Tlie investigated terpene and sesquiterpene hydrocarbons are listed in Table I. Tliese hydrocarbons wore obtained fi-om canraorcial soiu:ces ; Hercules Powder Co., Dodge and Olcott, Hoyden nev.-port Chemical Corporation, and Fritzche Eros. Inclvided in the samples (Table l) is an acyclic terpene, six monocyclic terpenes of which tliree contain exocyclic double bonds and throe do not, four bicyclic terpenes of which two contain an exocyclic double bond and two do not, snd four sesquiterpene hydrocai-bons of which tvro are bicyclic and tvro tricyclic.
Total ionization was obtained by the sumjiiation of peck heights from m/e 27 to ra/e parent +2. The total ionization for tho eleven C10H16 isaners v/as very similar, averaging I.58 i.08 relative to the total ionization of normal butane. Tne relative total ionization for the four sesquiterpenes vras I.92 i.09. The range is again quite small. These results seera to agree v/oll with the v/ork done by Mohler and coworkers v/liere "they found that the total ionization for Cl-Glo hydrocarbons to be essentially constant for isomers but proportional to molecular weight. Field and Eranlilin have lator proposed that the lack of the dependence of the total ionization upon the structure of the individual isomers is evidence in favor of the molecular-ion intei-mediate theory. If the decamposltlon of the molecule occurred immediately upon ionization, larger variations in the amount of ionization occurring v/ith the different isomers miglit be expected.
In the follov/ing discussion, the monoisotopic peak heights for the various hydrocarbon spectra are expressed in per cent of total ionization. I/;t us first look at the most praninent peajcs for the acyclic and monocyclic terpenes listed in Table I. The base peaks are enclosed in rectangles. It is apparent that there is aonsiderable variation of spectra v/ith structui^e. The monocyclic terpenes because of the stability associated v ith the ring have much more intense parent peaks than does the acyclic terpene. It should also be noted that the parent peaks are more intense for the monocyclic terpenes v/ith both double bonds in the ring than those v/ith one double bond exocyclic. The myreene spectrura shov/s raany more Cp, C3, and Clf fragments, such as ra/c 111, indicating moi-e severe fragmentation in the absence of the ring. Tlie tv/o monocyclic terpenes with the larger minus - 15 peaks are o(- and V-te-ri/inene which have tv/o me'bhyl groups allylic to a double bond in the ring. Tlie minus - U3 pealcs are quite large in all terpene
37

TABLE I
PROMirnHI-IT SP3CTRAL FSAKS OF TSRPEHE AM) SESQUITfiRPEME HTOROCARBONS
Terpenes
Name
Myreene
y -Torp inene
a - T e r p i n e n e
a - P h e l l a n d r e n e
Dipen tene
T e r p i n o l e n e
/3 - P h e l l a n d r e n e
a - P i n e n e
3-Carene
/3-Pinene
Camphene
S t r u c t u r e
K >
Classif icat ion
Acyclic
Monocyclic
Monocyclic
Monocyclic
Monocyclic
Monocyclic
Monocyclic
Bicyclic
Bicyclic
Bicyelie
Bicyclic
Per Cent of m/e 136
1.1
6.9
4.7
4.4
2.5
3.1
3.7
2.4
3.3
1-9
3-1
121
1.3
6.4
/10.6/
2.7
2.6
5.3
1.3
4.8
3.3
2.4
11.8
Total Ionization
?3_
1 5 . 5
/ 1 3 . 9 /
9-0
7-5
/ 1 4 . 6 /
/ 1 9 - 3 /
/ 2 6 . 7 /
./lfe-9/
/ 1 9 . 4 /
/ 1 9 . 0 /
68
2 . 7
0 . 2
0 . 9
0 . 6
/ I 6 . 0 7
2 . 6
7 . 2
1.5
0 . 6
0 . 8
4 .0
4 l
/ 1 9 . 4 /
4 . 3
4 . 2
4 . 7
5.2
5.5
4 . 9
6 .9
5.4
1 0 . 3
10 .0
S-i G qul 'ucrpene s
Name
C:'.dinene
;3 -Caryophyl lene
a -Cedrene
Longi fo lene
S t r u c t u r e
y ^
h n^H
c lass i f i ca t ion
Bicyclic
Bicyclic
Tricyclic
Tricyclic
m/e Per C: : 204
6 .0
0 . 6
2 . 3
1.8
jnt of Total Ii 161 119
/ IW
1.6
3.0 ,
3 .3
2 . 3
1.3
/13.2/
2 .h
Dnizat 93
1.8
6 . 1
6 .9
/ 4 . 2 /
ion 4 i
4 . 9
/a-9/
6.7
3-9
38

spectra including those shown here. It is the base peak in four and the second largest in the other three. Friedman and Wolf have proposed a cyclic C-j/H/p ion intermediate for camphene fragraentation, v;hich also could bo formed from the terx^enos shov/n here. Tlie largo 93 peak for myi-cono may indicate ring closure after loss of a 3 cai-bon group. Tlie tv/o largest 93 peaks are formed from ot- and p-phellandrene which contain the isopropyl group allylic to the double bond. Dipentene shov/s the smallest 93 peak, probably because of the preferred allylic bond rupture to form the prominentjn/e 63 fragrnent. This hydrocarbon is the only one by v/hich ti-/o allylic bond ruptures can occur- siraultaneously to produce C5H8 fragnents.
Also shovm in Table I is similar data for the bicyclic terpenes. Tlio parent peak intensities are siiiiila:- to those for the monocyclic terpenes v/ith one oouble bond exocyclic. . Ring strain no doubt accounts for the reduced parent peak intensities. Camphene shov/s the largest minus - 15 peak, probably due to allylic -Jjond ruptm-e. The other tlu-ee bicyclic terpenes do not contain methyl groups oiiy^tic^o a owuqla bond. The minus - 43 peak is the base peak in the spectra of these four hydrocarbons. For the first three, the fragmentation likely involves the loss of the bridge structure CoH^ plus an additional hydrogen. For camphene, the rupture probably occurs ot the bonds of the quaternary carbon. 'The largest minus - 43 peaks occur in the spectra of o<- and P-pinene in v/hich double bonds are allylic to the bridge structure. The hydrocarbons containing the double bond exocyclic show larger amounts of C2, Cj, and Clj fragraents, such as m/e 4l. Apparently the presence of double bonds in the ring increases the stability of the ring and prevents extensive fragmentation.
The spectra for the sesquiterpene hydrocarbons because of their more complicated structure shov/ more complex fragmentation patterns. The prominent peaks for these hydrocarbons are also shovm in Table I. Cadinene shov/s the largest parent ion, m/e 204, probably due to the comparative stability of the fused six carbon rings, and the presence of both double bonds in "the rings. «-cedrene contains the next largest parent ion, probably because of the absence of exocyclic double bonds. The other tv/o possess raore ring strain and exocyclic double bonds and the molecular ion is quite small. None of these hydrocarbons shov/ very large minus - 15 peaks, and these are not listed in Table I. Longifolene shov/s the Irjrgest minus - 15 paolc i-elative to the parent, probably because of the presence of the double bond allylic to tho angular methyl grouii. Cadinene' s base peak occurs at m/e 161, the loss of 43 mass units or the isopropyl group from the ring. The other tln-oe do not have large minus - li-3 peaks or isopropyl groups at-tached to a ring. Tlie base peak for -codrane occurs at m/c II9, a C9H11 fragment. Tho fragmentation to form this ion no doubt involves several bond ruptures, either simultaneously or consecutively. One plausible simultaneous ruptur-e could occur in the tv/o cyclopentane rings adjacent to the tv/o quaternary caibons. The base peak for longifolene occurs at m/e 95, a CyHn" fragment v/h.i.ch v/as so pi-ominent in the spectra of the terpene hydrocarbons. This syjue peak is also large for fl-caryophylleno end «-cedrenc, and aiay lndlc;'.to that the sesquiterpene molecular ion, lih; the tei-peiie counterpart, fragments to foim a stable C7H9 cyclic inteiTiijdiat.j ion of tho foim pi-ox.)osed by V/olf and yriodman. The base peak for P-caryophyllone OCCLU-S at m/e 4l along v/ith :: high concentration of C^, C^, and Cj,. fragraents. Ttie instability of the fused foiu' a.nd nine carbon rings may account for the; extensive fragmentation of this molecular ion.
From the data on these tei-pene and sesquiterpene hydrocarbons, it appears that the three structural churaeterlstics v/hich most greatly affect the mass spectral patterns of these hydrocarbons are (1) position of double bonds, either cyclic or exoj-yclic, (2) position of poss.i.blo fragmentation allylic to a double bond, and (3) presence or absence of ring strains. Because of the evident differences in the spectra of these hydrocarbons, it is believed that effective qualitative or quantitative analysis by mass spectrometry is possible v/ith these naturally-occurring hydrocarbons.
References
1. L. Friedman and A. P. Wolf, J. Am. Chem. Soc. 80, 2424 (I958). 2. T. Gilchrist and R. I. Reed, Experimentia I6, I34 (I960). 3. D. R. McAdams and H. J. Harris, A.S.T.M. EM!4 Caamlttee on Mass Spectrometry, June
1961.
39

P R O M i m r PEAKS OF CAMPHENE
F I G . I
P R O M i m r PEAKS OPot-PIHEHE CioHie^li C g H|3B!!tii]i!!VfrT3
C 7 H9t-!'PWi'!.limWJiW!lWB>>! !''.".V.!J!il)i!p«.IH^^^ MIIIIIIIIIIIIUIIIIIIIlllllllMllllllilUIUIlllllllllllllMlllllltlllllllllllnnilHIllllllllllllllllliniHIIIIIinilUMMMIMMMIMMMIMUIMII
C7 H e ^ l ^ ^ ^ i ^ ^ S P c 7 H 7 M W i a .
C 4 H 5 ^
C3 HsUai'JffiBHfe
C3 H3 i l l i i l l . . ^
C2 H3 liimiiHuyiiiiiimiu
IB FRIEDMAN & WOLF E2SSS2Sa KOONS & MERCER
FIG. 2
40

REARRANGEMENT IONS OF ALIPHATIC ESTERS AS
OBSERVED IN THE MASS SPECTROMETER
H. 0. Colomb, Jr., B. D. Fulks and V. A. Yarborough
The mass spectra of aliphatic esters have previously been correlated with their structure by Sharkey, Shultz and Friedel. The high resolution mass spectra of many of these esters as obtained by Beynon, Saunders and Williams have largely confirmed postulations concerning the fragmentation processes.
The determination of structure by mass spectrometry is made more difficult by molecular rearrangement. In the esters presented here, the major rearrangements are specific and may even aid in structure determination.
The first slide lists the most important rearrangement ions in the mass spectra of the formic acid esters and their abundance relative to the most intense peak in the spectrum which is called the base peak. The general formula for these esters may be written:
0 II
R,C-0-R. where R. and R, are alkyl groups.
The R. group corresponds to the acid portion of the ester and the R2 group to the alcohol portion.
The most important rearrangement peaks in the formic acid esters are the ions at m/e 31, 45 and the |R2-H + or olefin ion. The base peak is the same in these esters as it is in the corresponding alcohol for all except n-butyl, 3°-butyl, isoamyl and cyclohexyl, and in general the mass spectra resemble those of the alcohols, R2OH. The peak at m/e 45 is the base peak in the formates of 2° alcohols as it is in the alcohol. Of all the esters, the olefin ion is largest in the formic acid esters where R2 is butyl or less (except 2°-butyl).
The acetic acid esters are shown in Slide 2. Here the major rearrangement ions have the same Cype of structure as they do in all the esters studied above the formates. The base peak for all the acetates is the m/e 43, ( [CH3C0II+) ion. The relative intensity of the olefin ion, ( [R2"^3"'") > shows the same relationship as in the higher esters, that is, cyclohexyl gives the maximum olefin ion intensity and neopentyl gives the least. Also the n-and iso-alcohol esters give more olefin ion intensity than do the 2°-alcohol esters.
The [RJ^COO + 2H] "•" or acid plus 2 hydrogen atoms peak at m/e 61 is not as intense In the acetates as it is in the other acid esters. The general trend, however, is evident in that n-alcohol esters give rise to more rearrangement than branched or 2°-alcohol esters. The [RICOO -I- 2HI1+ peak is least for the ester from the most highly branched alcohol, neopentyl and 3°-butyl, as is the case in all the acid esters above the acetates.
41

SLIDE 1
REARRANGEMENT ION INTENSITY IN FORMIC ACID ESTERS
Ethyl^
Propyl
Isopropyl
n-Butyl
2°-Butyl
Isobutyl
3 "-Butyl
n -Amy I
2°-Amyl
Isoamyl
Neopentyl
Cyclohexyl
Base Peak
31
31
45
56
45
43
41
42
45
55
57
67-
R2-H,7o
71.3
65.0
30.0
100
26.9
80.6
39.2
58.3
27.3
74.0
2.3
17.1
M/e 31
100
100
6.0
57.8
18.0
64.5
18.1
50.9
9.1
42.7
14.5
10.0
M/e 45
32.6
3.0
100
7.4
100
2.6
8.4
5.2
100
10.0
7.2
3.5
Sharkey, A. G. Jr., et al., Anal. Chem. 31 87 (1959)
SLIDE 2
REARRANGEMENT ION INTENSITY IN ACETIC ACID ESTERS
Ethyl-*-
Propyl
Isopropyl
n-Butyl
2°-Butyl^
Isobutyl
3 "-Butyl
n-Amyl
2°-Amyl
Isoamyl
Neopentyl
Cyclohexyl
Sharkey, A.
Bas
G. Jr
e Peak
43
43
43
43
43
43
43
43
43
43
43
43
. , et al.
R2-H,%
5.0
10.6
7.6
34.6
19.7
22.9
35.4
46.3
12.9
39.7
2.7
55.0
, Anal. C
M/e 61 [R^COO -F 2H]"^
"Beynon, et al.
10.5
20.4
14.2
10.7
4.5
2.5
1.6
23.4
2.5
12.3
1.0
5.6
Chem. 31 87 (1959)
Ibid. 33 221 (1961)
42

Slide 3 shows the relative abundance of the two types of rearrangement ions for propionic acid esters. The n-alcohol esters in this series give the largest [RlCOO -F liQ-^ ion intensity, and the esters from neopentyl and S^-butyl alcohols give the least.
Slide 4 shows the relative abundance of the rearrangement ions in the butyric acid esters. Both the olefin ion and the [RICOO -H 2H])"'" ion are more intense than in the corresponding acetates and propionates. Also, in general the more stable the R2"'" ion is the less will be the [RiCOO -H 2H]"'' ion intensity. The base peak is usually the RiCO'*' ion but depends more on the nature of the R2 group than it does in the other esters except the valerates.
Slide 5 shows the relative abundance of the rearrangement ions in the isobutyric acid esters. Here the effect of chain branching in R- is evident and in most cases causes a decrease in the olefin ion and QliCOO + 2Hj + ion intensities from those in the unbranched acid esters. The isoamyl ester gives about as Intense an olefin ion as does the cyclohexyl ester.
Slide 6 shows the rearrangement ion intensities for the valeric acid esters. The [Rj COO -1- 2H]+ lon is maximum in intensity for all the esters except the ethyl and isobutyl compounds. The olefin ion is also at maximum intensity for R2 n-amyl and higher The intensity of the [Rj CO]- ion is more dependent on R2 than any of the other acid esters studied.
Slide 7 gives the rearrangement ion intensities for the pivalic acid esters which are esters of acetic acid with all the hydrogens of the alkyl part of the acid group replaced by methyl groups. Because of the large amount of chain branching in R^ the base peak is the m/e 57 which is probably the C4H9'*- ion. This peak is so intense as to be off scale in some of these ester spectra when run at normal pressure. The olefin ion is lowest in intensity and the [RJ^COO -H 2 H ] + ion intensity is much decreased over the corresponding valerate ester.
The effect of chain branching in RQ^, the alkyl portion of the acid group, is more clearly shown in Slide 8 which lists the rearrangement ion intensity for the cyclohexyl esters. The QRICOO -f 2H]"'" ion intensity increases as Rj increases and decreases with increased chain branching.
The mechanism McLafferty proposed to explain the formation of the QRICOO -I- 2H]-*- ion is shown in Slide 9. This concept involves a six membered ring-type intermediate with the shift of a hydrogen beta to the carbonyl carbon and one which is gamma. This gives an alkene radical and a positive ion which is stabilized by resonance. This mechanism requires both beta and gamma hydrogens in the alcohol portion of the ester; indeed, where there are no hydrogens beta to the carbonyl carbon as in the 3°-butyl esters, there is very little rearrangement; and, in the neopentyl esters where the gamma hydrogens are all replaced by methyl groups, there is even less rearrangement. In these later cases, it would seem more reasonable to expect a methyl shift, and Slide 10 shows the
43

SLIDE 3
REARRANGEMENT ION INTENSITY IN PROPIONIC ACID ESTERS
Ethyl^
Propyl
Isopropyl
n-Butyl
2°-Butyl
Isobutyl
3"-Butyl
nrAmyl
2°-Amyl
Isoamyl
Neopentyl
Cyclohexyl
Base Peak
29
57
57
57
57
57
57
57
57
57
57
57
R2-H,7o
17.8
10.9
9.2
32.4
14.3
26.1
10.7
37.2
16.6
49.1
4.0
58.0
M/e 75 [RJ^COO - 2H]'*'
8.2
34.7
22.7
23.7
7.2
6.0
2.9
34.3
6.9
10.3
0.9
21.4
^Sharkey, A. G. Jr., et al., Anal. Chem. 31 87 (1959)
SLIDE 4
REARRANGEMENT ION INTENSITY IN BUTYRIC ACID ESTERS
M/e 89 [RJ^COO + 2H]'^
Ethyl 71 7.0 13.0
Propyl 7"1 29.8 54.6
Isopropyl 43 13.9 18.9
n-Butyl 71 54.7 52.0
2°-Butyl 71 25.9 18.7
Isobutyl 71 42.3 14.8
3°-Butyl 43 35.8 7.8
n-Amyl 43 48.3 48.1
2°-Amyl 71 20.9 11.2
Isoamyl 71 72.2 12.2
Neopentyl 71 10.2 1.2
Cyclohexyl 71 83.2 60.2
44

intensity of the (RiCOO -i- CH^]"*" ion in the neopentyl esters. This ion and the olefin ion are the most important rearrangement ions in these spectra.
This same mechanism, shown in Slide 11, has been applied to the rearrangement ion, [CH2COOR2 -*• ^ 1 - ^ , found in some methyl and ethyl esters. This rearrangement requires a hydrogen gamma to the carbonyl carbon and the only acids in this series that meet this requirement are butyric and valeric acids. In Slide 12, this is shown to be the case, only butyric and valeric esters having this peak in appreciable abundance.
To test the validity of the mechanism even further, cyclohexyl butyrate and valerate were synthesized with the alpha positions of the cyclohexyl group deuterated. The rearrangement peak, [R^COO -I- 2H] + , was found to be shifted, and the ratio of the intensities corresponding to the addition of two hydrogens, hydrogen-deuterium and two deuteriums was 1:2:1. This corresponds to an equal choice of hydrogen and deuterium for the rearrangement. This result seemed puzzling as all the hydrogens gamma to the carbonyl carbon had been replaced by deuterium. However, investigation of the molecular models (Figures 1 and 2) shows that when the cyclohexyl group is in the boat form all the hydrogens on the same side as the carbonyl group are accessible to the carbonyl oxygen by a cyclic mechanism like that previously outlined. The three hydrogens on the side of the cyclohexyl group opposite to the ester carbonyl group are not accessible to the carbonyl oxygen without bond breaking. Thus, in the rearrangement process, there is an equal choice among four hydrogen and four deuterium atoms for the two atoms shifted. The deuterated esters were checked by NMR and found to be essentially completely deuterated in the alpha positions of the cyclohexyl group and nowhere else. In conclusion, the experimental evidence is consistent with the cyclic mechanism and involves the concerted shift of a hydrogen beta to the carbonyl carbon and one further down the chain, the gamma one being favored, to form the [RICOO -f 2H]"'" rearrangement ion.
45

SLIDE 5
REARRANGEMENT ION INTENSITY IN ISOBUTYRIC ACID ESTERS
Ethyl
Propyl
Isopropyl
n-Butyl
2°-Butyl
Isobutyl
3°-Butyl
n-Amyl
2 °-Amyl
Isoamyl
Neopentyl
Cyclohexyl
Base Peak
43
43
43
43
43
43
43
43
43
43
43
43
R2-H,%
8.5
12.7
8.3
40.0
25.3
45.2
6.9
27.5
14.1
51.3
13.0
52.3
M/e 89 [ R ^ C O O -t 2H]"^
2.8
3 0 . 9
8.7
52.8
20.0
22.3
2.2
3 5 . 9
9 . 4
8.8
1.2
5 4 . 0
SLIDE 6
REARRANGEMENT ION INTENSITY IN VALERIC ACID ESTERS
E t h y l
P r o p y l
I s o p r o p y l
n - B u t y l
2 " - B u t y l
I s o b u t y l
3 " - B u t y l
n-Amyl
2"-Amyl
I s o a m y l
N e o p e n t y l
C y c l o h e x y l
Base Peak
29
85
43
29,85
85
85
60
85
85
70
82
85
R2-H,7.
22.8
30.9
16.1
93.8
42.1
62.4
20.3
90.2
35.6
100
15.3
100
M/e 103 [RJ^COO -H 2H]"^
5 . 3
6 2 . 2
2 5 . 3
6 7 . 5
2 6 . 0
19 .7
7 .9
7 3 . 9
1 8 . 9
1 2 . 8
1.6
8 4 . 8
46

SLIDE 7
REARRANGEMENT ION INTENSITY IN PIVALIC ACID ESTERS
E t h y l
P r o p y l
I s o p r o p y l
n - B u t y l
2 " - B u t y l
I s o b u t y l
3 " - B u t y l
n-Amyl
2°-Amyl
I s o a m y l
N e o p e n t y l
C y c l o h e x y l
Base Peak
57
57
57
57
57
57
57
57
57
57
57
57
R2-H,%
4.3
6.6
5.8
18.0
6.9
21.2
3.8
15.5
6.2
34.8
8.8
15.6
M/e 103 [R^COO -I- 2 H ] '
. 2
2 0 . 3
4 . 8
2 2 . 2
5 .2
1 4 . 4
. 1
2 8 . 2
6 . 8
7 . 3
2 5 . 1
SLIDE 8
REARRANGEMENT ION INTENSITY IN
CYCLOHEXYL ESTERS
R2-H
Mass 82
17.2
52.6
58.0
82.5
52.2
100
15.6
Ester
Formate
Acetate
Propionate
Butyrate
Isobutyrate
Valerate
Pivalate
R j COO -t-
.36
5.7
21.4
60.1
54.0
84.8
25.2
2H + Mass
47
61
75
89
89
103
103
47

SLIDE 9
REARRANGEMENT MECHANISM OF THE [R,COO -I- 2H]"^ ION-"-
M H^
\ / - ^ + \ y \ y : 0 ^ + 9 ^cN f z *• h. c
iyy \ ' y ^ 'y
II / \
H—0 Rj HlcLafferty, F. W. , Anal. Chem. 31 85 (1959)
SLIDE 10
RELATIVE INTENSITY OF THE [R COO + CH,]"^ REARRANGEMENT
ION IN THE NEOPENTYL ESTERS
Acid Intensity, %
Formic 0.3
Acetic 16.2
Propionic 13.8
Butyric 14.9
Isobutyric 20.4
Valeric 15.2
Pivalic 5.2
48

SLIDE 11
REARRANGEMENT MECHANISM IN METHYL AND ETHYL ESTERS
> - < ^ 0 ' c " ^ 0 ^ U y\\ > II + I
/ ' ^ C H 2 > ' \ _ , ^ '^ C H f \ - R
R — - C H o > ~ 9 c;
HlcLafferty, F. W. , Anal. Chem. 31, 82 (1959)
SLIDE 12
RELATIVE INTENSITY OF THE [CH2COOR2 -t H]"^
REARRANGEMENT ION
R„ Group
Acid
Acetic
Propionic
Butyric
Isobutyric
Valeric
Pivalic
Methyl
16.0*+
0.2*+
63.2
2 . 8
100
0 . 6
Ethyl
3.9*+
0 . 1 *
41.9*
6 . 3
50.2
0 . 5
*From Sharkey, et al., Anal. Chem. 21 88-9 (1959)
+Parent peak, not a rearrangement peak
49

ioi
u Ih-
! - < • y ^
• * " ' ' • " • ) ' • '
: - - H ' \ / ' - , • ' . . • • • : - • ' • '
y ' • • ' . ' . • . . ^ '
. ' o^^H • • i . . . - - s ^ ^ ^
• . y y . : y ' • - ^ •.!.;.•-. / . ' . -1 • . • ; ; - • ' - • ; . • ^
f''^\.' •. •• r. " . ' y
ai:-.:"* '•: v-: . • . •
' ' . ' " ' ^ : ~ ' • ^ : - .
• ' - , . , : ' • . ' ; . . • ' . , » " , ; ' '
• ' : ' ' : • • ' • : • • ' • ' . . ' • . • • • • • : • •
TT"* • ''• ' y y •"!•.'••.'••'•'•'
' • • • . ' ' . , - • , .
. . • ^ • : - ^ • : > •
^^^^^f' ^^^^H ^k. ^ ^ 1 ^ r 1 .•• :• •• - ' y . y ^
."•'
" •• : " * • ' • " , - \
: ' . • " ^ : ' ; / - • ' " -w
••• ^.^ • I -t^-iy •; ^ ^. _ •• r-v ' ''r.— - ' •-:".*''•',.' ' . " ' ' — ' ^ — " T " : — ' ^y~ •
; 'C./; . ' . '^-yy ••: • ' • " • . • • • •= • : • • * . . . ' V v / - . - ' : - - ' ' , ' ; '
y '''yyt'-yyy,^:^'-zy-yX:''^'Z ' y ^ :y-^y. " * • ; . ' . ' '••'. / . • ' • . • - ' ' ' • : • ' ' ' • '.'-^if-^''." '-.••'' • - - .
,-' y . y ' ' . y . ' - . 0^ . ' : ^ ^ ' ' ' > - - ^y< -M^yy -^ y'y;. •"•-•'
- f . - ' ' . ^^B|^^^w'-^ ' ^ '-v '^^ ^ ^ ^ ^ H P ^ S B J ^ B ':- l''^L
- •'"•^^R^v^K '" • • •'•^"- • j . j^^B^'.,-^/- ' ,^*.•.••;•.; ..•. ' ^ ^ L - • ' ' j y ' z C y ' '
^^ /m^ f '{•W^^'^^^^^MWy ^ ^ y f y S ' - ^ y x.'.-.-yyLy ^ ^^^Bmi^Bi*''^'r^-T^^^^^^^l ..•
•'-'c-yZr- y^ f ' ^^^^z ' . ' ' - y ^ ' ^Xy '.'.•'it}k-^-'y^if-yy.zS.'-Z'• • ' "'.'•'•' • • ' " • ' " •.. - ^ f ^ y - : ^ v . : i ^ ^ .' ••--•,...V i/; • . - • . • • • : . .
.'•^-••.^'•''t;^';• ^'^z'.y.l'y ••!'?'//'•"•.!^'i'•'.••'•• ^'V • '
fi K
•"'•':':;•:• 'v'"' / ' : - ' ' ' . • . . '
• ^ • • ' • • . ' • ' . • ^ " ' • • ' • '
• . - ' • ' . " • ' •
•• y - y Z - - ' - y ' ':
'•"'•••••7-- '-•• • m--' m* / y ^ y - ^ ^
yA.0 yy-y^^^
. . . . ^ . • , • . • . • , _ . ' . . • . t .
, s.y . ' . . •'."- 1 • - ' • • • , ' • . •
- ' ' • ' . ' ' • . • ' . •
'.' Cy.y^zyzf0yy-.yy'':y^yy':.'-^ z^'. '':''-zz.:y- :..•'',.•,-.-'.'•"c . ' : ' • - y v ^ y • - ' ' - ' • • .'y:.' '-'.. ' ' 'y.'-. . ' y . - . - ' Z : •-.'•• •:• ;?•
•"'.._:,..—^- i l ' i ^ y X :'•'•-'I-zr:{_'•:•••:;'•••': •:/(/•:,: ' " ^ k ' '•-•••.'.''''''i^y^ ••Z.s.y-yz- '''"',':y.'''-''i'-.'' l " ••-.:••?'•' ' •^y ' ' ' ' ' ' ' ' ^" ' ' ' "^?*^ '. ^''^"^^yxyX'-yi-'.'^^ . ' W l - - . y ^ ^ \y - \ , ' . ' ' ) y ' " ' y ' ' " ' ' : - ^ ' z - -T- - ' y
-..J . »jL.".jjj^jd|^^H ' ) ^k •/ .
l^^^K'^lH^^^^^^^^vi^^^^r .—1^^^/-' ' ' ' - ' '• ' •.•
:-• j^^^P^^X^..: ; -^z:. t;:; .•
- • . • • • - /' f ' .• , . ' .- ,• , • '.• :~. ••-- .'•. - ' • -•.
;-.- . -..^'y ^'c^''yz-::rr' 'z'y^-:.^^z y^z-z.-:'-' ';•'". •" -••.''. ,**'^^c'^" . ': ' . ,- ' • ; '"•••/"^ • • .-"s. . - : • ' > • ' ' • , - - '^''•-
50

MASS SPECTRA OF TRIMETHYLSILYL ESTERS R. M. Teeter
Callfomia Research Corporation, Richmond, Callfomia
Hexamethyldisllazane (HMDS) was introduced as a reagent for the preparation of volatile derivatives for mass spectrometry in 1957 by Langer, Connell,and Wender (1) and by Sharkey, Friedel, and Langer. (2) The group fr:om the Bureau of .Mines has continued to use HMDS profitably for the preparation of ethers.(3,4)
Independently, Becke-Goehrlng and Wunsoh (5) and Blrkofer and Ritter (6) have treated acids with HMDS to form,, trimethylsilyl esters, but no mass spectra were reported. Ruhlmann and Giesecke (7) have used the esters, prepared by a different technique, to aid the gas chromatographic analysis of amino acids.
The reactions to be discussed are given below:
(cH3)^5;-/«/«-.5/(cH,)3 +- ^ R O H .- A ROS/QcH,')^ -f-NH3
HMDS -h ;iRNMa > A KNHs;CcHj)j-h KHj
H M D S •«- ATiCOCi \ >• A RCC30S;(CH,^3 + NH:,
The principal advantage of trimethylsilyl (TMS) esters over other acid derivatives is the simplicity of preparation.. In a typical preparation one places 2 or 3 mg of an acid or acid mixture in a small flask, adds a crystal of NH4CI and 8 or 10 drops of HMDS. The mixture is heated under reflux for 2 or 3 hours, and a 1-ul sample is removed for mass spectral analysis. Usually, no isolation step is required since the molecular weights of most of the esters are higher than that of the HMDS. The flask Is a special one consisting of a 10 mm diameter refliax condenser sealed off into a test tube end 1-2 cm below the water Jacket. A standard taper Joint at the top accepts a drying tube to protect from atmospheric moisture. Protection from moisture is important since hydrolysis occurs very readily. A drop of purified TMS benzoate exposed to air starts to deposit crystals of benzoic acid in about 10 minutes. Excess HMDS protects the esters.
In the mass spectra of the esters, the loss of methyl is frequently the most favored process, with the resulting M-I5 peak the largest In the spectrum. In the case of the benzoate ester, the m/e/179 from the loss of methyl is even larger than the very stable benzoyl lon at m/e I05. The speotiTum of TMS octadecanoate shows an even larger M-I5. It can be seen from this that the TMS group sometimes dominates the spectrum to the point where structural information is lost.
(1) S. H. Langer, S. Connell, and I. Wender, J. Org. Chem. 23, 50 (1958).
(2) A. G. Sharkey, Jr., R. A. Friedel, and S. H. Langer, Anal. Chem. 29, 770 (1957).
(3) S. H. Langer, R. A. Friedel, I. Wender, and A. G. Sharkey, Jr., Anal. Chem. ^O, 1353 (1958).
(4) S. Friedman, M. L. Kaufman, and I. Wender, J. Org. Chem. 27, 664 (I962). "~
(5) M. Becke-Goehrlng and G. Wunsch, Chem. Ber. 93, 326 (I960).
(6) L. Blrkofer and H. Ritter, Chem. Ber. 93, 424 (i960).
(7) K, Ruhlmann and W. Giesecke, Angew. Chem. 72> H J (I96I).
51

Although the study of the effeot of HMDS on other functional groups has been largely confined to hydroxy and amino substituents, it is worth noting that in the one case studied, ester interchange did not take place. The spectrum of the TMS ester from hydrogen methyl terephthalate has its largest peak at m/e 237, the M-15 fragment from methyl trimethylsilyl terephthalate. The M-I5 fragment (at m/e 295) from bis(trimethylsilyl) terephthalate was present but corresponded roughly to the very small amount of free terephthalic acid in the original half-ester.
Reaction of HMDS with hydroxy and amino groups proceeds as described in the papers already cited; amino acids yield N-(trimethylsilyl) amino trimethylsilyl esters. In the spectrum of the product from norleuclne, the M and M-I5 peaks are present; and, in addition, peaks at m/e I88 and m/e 232 due respectively to the amino ester and silylamlno ester are found. The reaction paths are shown in Figure 1.
Figure 1
HiH-cu-cooii HMos^ H.,/V-CK-coo5'CcKi')3 ^^p Ccri3),s,-NH-CH-coo5,Y:cHj),
(CMO.CHi (cH.y CH,
l i
/)E.X. 2)-C^y
V
!)e.x. X)9fAiHENTATl0/tl
ttiN-Crt-COOS.'CcHi)a C<^Hj)j5i' N H -CH - Coos/ M j
The structure of the m/e 232 ion will be discussed later.
In Figure 2 the heights of the 188 and 232 peaks are plotted as a function of time of reaction with HMDS.
:t
2^
Figure 2
y-^-"^ V , M/^ ;iSS.
X / / x^"*/^ "^
HRA- zo The m/e I88 peak shows the typical behavior of an inter
mediate that is consumed by a subsequent reaction. That it does not drop to zero is probably due to the presence of a small fragment of the same m/e from the final product.
Several esters undergo decarboxylation. An example is the fragmentation of the product from £-hydroxybenzoic aoid. The M-15 fragment is at m/e 267. This ion loses COg to form an lon at m/e 223. That 44 is lost in one unit is shown by a large metastable peak at m/e 186.3. A mechanism Is proposed in Figure 3 for a generalized aromatic aoid.
52

Figure 3
Ortho attack by the charged silicon atom is a possibility but is probably not the major route on the basis of the evidence in Table I.
Table I
Y
-OH -NHa -NOa -CHa -COOCH3 -C00S1(CH3)3
Z
-H -H -H -CHa -H -H
Ht(M-59)/Ht(M-15)
0.4 0.3 0.09 0.02 0.2 0.07
m/e Metastable
186.3 185.4 (144.7)* (144.7)* 157.1 (213.5)
( ) Metastable ion not observed. * Metastable lon lost in HMDS spectrum.
Note that in the case of the £-nltroester, where the nitro group cannot donate electrons, the extent of the reaction is decreased relative to that observed with hydroxy and amino substituents. Mesitolc acid, with both ortho positions blocked, still loses CO2.
Further evidence in favor of attack on the carbon holding the carboxyl comes from the spectra of some aliphatic esters as shown in Figure 4.
53

Figure 4
R-CK^-C Oe.x.
y
O (I c
/ Si (CH^)3
( M )
y
CH3
Acid
Octanolc Decanoic Octadecanolc Alanine
CH3
C M - / 5 - )
Ht(M-59)/Ht(M-15)
0.046 0.043 0.046 0.12
CHa
y N
( M - ^ )
The first three esters show a small M-59/M-I5 ratio, while in alanine this ratio is larger. This may reflect a change in mechanism with the nitrogen participating in the formation of a five-membered ring Intermediate. Here we do not have the supporting evidence of metastable peaks.
In the spectrum of the product from aspartic acid, we can see a peak whioh seems to be characteristic of most a-amino acids. The reactions are shown in Figure 5.
H,N-CH-Coori ^^ P3
Figure 5
«
CWi-CooH
CH-CloSi&Hj),
CHj- C o a 51 CCH )3 j) _ c h .' CH - C 00 SM CCHJ>3
CHJ) S," N I+-CH- coo S; CcHa) 3
(-iti-ii CH-COOS(CCH3>3
c^^-n)
(3^-^
O e . i . A) -CHjC0o3r6:ri;;)_j
« ®
CcH3)3 5\NH = CH (tHjjj Si N H =CH- C005; Ccrt,)^
CHj-C0O5iCCHj)j ( * ' » )
(cH,)j Si NH-CH-caosI (crt3)2
CHi-Coo5i((:Hj)_,
Apparently the diester is formed which then loses ammonia to give the maleate or fumarate product, characterized by its M-15 peak at m/e 245. The same lon is formed under the same conditions by dehydration of malic acid. The completely silylated material fragments to yield ions at 232 and 218, the latter Is common to most amino acid esters except proline, which does not have a primary amino group.
54

An m/e 232 ion has already been mentioned as a fragment from the norleuclne ester. In this case, and in that of leucine, mass 232 can be obtained by the loss of n-propyl or isopropyl, respectively, from the parent lon; but the Isoleuclne ester shows the same ion in the same abundance. Figure 5 shows the stJructures assigned on this basis.
Figure 6
(CHj)^ SI NK-CH- COOSi'Cct+j') 3
NOFiLEUCl lVE
K ) S<"NH = CH '3 (
. (cHj^jSi NH-OI-Coosi CCH3)3 >• ^\^j)^SlNH-CH-a»hl»a
cH,-CMCCH3)a '
LEUCIME
(CHj-)jSi NH- C M - coo s; O^H^y
H,C-CH-CH^-CW,
i s o L e u d M E .
Loss of CaHr from the trimethylsilyl group, accompanied by rearrangement, seems a likely route, especially since M-43 Ions are seen in other ester spectra where, in some cases, there is no other possible source. The reaction is probably loss of a methyl radical (to M-15) followed by loss of neutral ethylene. The I58 fragment (M-117) is also common to most amino acid ester spectra and is exactly analogous to the "amine fragment" that Blemann(8) reports in the spectra of the ethyl esters. In both types of esters, it is frequently the largest peak in the spectrum.
One reaction other than that of active hydrogen replacement was found in our survey. Reaction of HMDS with phthallc anhydride yields N-trlmethylsllylphthalimide which undergoes an interesting series of reactions in the mass spectrometer. The sequence is shown in Figure 7.
Figure 7
o y C ^ Cx>
rl O
HMDS (l^^-^yK ^.y , . ' ^ J f ^ C ^ y y ^ ^ ^ Z /cu ^
o
t II (^If)
0
35> o C *
CXy o
•^5i (CH:, \ a04) >f> ^ u
o
—COa - SI (rcH,-)3 «
( ' '^) ' ' ' ^1 (CH.> (/oa)
CSN
(8) K. Blemann, JACS 8 ^ , 3795 (1961)
55

On eleotron Impact a parent lon is fomed (m/e 219) followed by loss of methyl to give the base peak at m/e 204. Migration of eleotrons yields the aoylonlum ion. Rotation of the other carbonyl can then give the rearranged product containing a potential COa group. Another electron shift can then lead to expulsion of COa with a confirming metastable peak at 125.5. The resulting ion at m/e 160 subsequently fragments to the phenylene nitrile lon of m/e 102.
The critical point in this reaction sequence is the decarboxylation step, and It is tempting to postulate that the original reaction product might have the structure shown for the 204 ion Just before decarboxylation. However, the structure of Compound A was verified by an Independent synthesis from potassium phthallmide and chlorotrimethylsllane. The mass and infrared spectra of the substance prepared by the two routes were identical.
Table II is a list of the compounds whioh have yielded esters or other products on treatment with hexamethyldisllazane.
Table II
Phosphoric Aoid Benzoic Acid Terephthalic Acid Hydrogen Methyl Terephthalate Phthallc Anhydride £-Hydroxybenzoic Acid £-Aminobenzoic Acid p-Nltrobenzolc Acid Mesitolc Acid Octanolc Acid Decanoic Acid Octadecanolc Acid Maleic Acid Fumaric Acid Succinic Acid g-Toluenesul'fonic Acid
Malic Acid e-Amlnocaprolc Acid Caprolactam
Alanine Serine Asjaartlc Acid Lysine Tryptophan Proline Methionine Ethionine Phenylalanine Glutamic Acid Leucine Isoleuclne Norleuclne Heptafluorobutyrlc Acid
56

INFORMATION REGARDING THE FRAGMENTATION OF LONG CHAIN COMPOUNDS
OBTAINED FROM THE MASS SPECTRA OF HEAVY ISOTOPE-LABELLED MOLECULES
Ng. Dlnh-Nguyen, Ragnar Ryhage, Stina Stallberg-Stenhagen and Einar Stenhagen
Institute of Medical Biochemistry University of Goteborg, and Mass Spectrometry Laboratory
Karolinska Institutet Stockholm 60, Sweden
Abstract
A study of the mass spectra of a series of Isomeric
long chain methyl esters with a -CD.-group at different positions
along the chain has given infonnation about hydrogen—deuterium
exchange—phenomena and the formation of ions through elimination—
rearrangement and elimination—coupling reactions. Results obtained
13 with C and halogen-substituted esters have given further information
on some of these processes.
57

DETERGENT ALKYLATE ANALYSIS BY MASS SPECTROMETRY
By
E. W. Boyer, M. C. Hamming, and H. T. Ford Research and Development Department
Continental Oil Company Ponca City, Oklahoma
ABSTRACT
Analysis of detergent alkylate by mass spectrometry is conventionally based upon pattern coefficients obtained by examination of distillation fractions from crude alkylates. A new approach based on rearrangement phenomena and employing sensitivity data Independent of volume or pressure measurements Is described. The quantitative rearrangement technique reduces and simplifies computations. Calibration data presented should be directly appllable in other laboratories for molecular distribution analysis on a wide range of monoalkylbenzene systems.
INTRODUCTION
Analyses of alkylbenzenes in the detergent alkylate range are normally accomplished by the use of synthetic cracking patterns. These synthetic patterns are obtained by mass spectrometer examination of narrow fractions separated from crude alkylate by high efficiency distillation. Analytical techniques using this approach have been described by Brown et al (4). Modifications of this basic technique have been utilized In many laboratories concerned with the characterization of detergent alkylates by mass spectrometry. T.he basic concept in the synthetic cracking pattern method_ of calculation involves the use of mixed alkylbenzene Isomers of essentially the same molecular weight to represent the fragmentation patterns of the mixed isomers in an alkylate to be examined. Although the technique is entirely satisfactory for determining molecular distribution of alkylate samples similar in chemical history to that from which the calibration fractions were separated, serious limitations are apparent when attempts are made to apply these patterns to alkylbenzenes of dissimilar structure. The work to be presented here describes a technique which, to a large extent, overcomes these limitations to conventional analytical methods. Analysis is based upon a sufficient consistency of the rearrangement ions (m/e 162 and above) relative to the CnH2n-7 fragment ions (F-l). The rearrangement ions are equal in mass number to the molecular ions of lower homologs (P). Corrections to the polycomponent molecular ion are based on measurements of the parent minus one peak. Sensitivity data presented are based on total ionization studies of thirty-six known structure alkylbenzenes synthesized at Continental Oil Company or obtained from API Research Project 42.
58

PARENT MOLECULE PSEUDO STRUCTURES OF FRAGMENT IONS
H H H l l l l
R - C - C - C - R
O" " " ^ ^ H^ I H H H © ^-
^ < R ' - C - l C - C - R — ^ W R ' - C - H + R " y y
J = i Mj monocomponent peak, M, at m/e I Pj polycomponent peak ,P, at m/e i Qjj calibration coefficient, a , at m / e = i , for component j Xj divisions of base peak, x, of component j appearing ' in mixture spectrum
kj.j correction factor, k, at m/e i - l Figure I
CONSISTENCY OF THE 190/189 RATIO AFTER >d BOND CLEAVAGE
MOL. MOLECULAR p , WT STRUCTURES / p - j RATIOS
246 C7 - C - C 4 0. 181
6 274 C 7 - C - C 6 y \ ^ ^ "X u ^ 0 ' 9 3
' C7-C-H C7-C-H -^
288 C 7 - C - C 7 y < p p_, ^ 0.197
(^ J m/e 190 m/e 189
302 C 7 - C - C 8 / 0.195
^ ' ^ Figure H
59

GENERAL THEORY
Alkylbenzenes cannot form, by simple bond cleavage under electron bombardment, fragment ions equal in mass to molecular ions of lower homologs. Theoretical considerations supporting the major premises of this analytical method can be slmpl-y stated. Molecular ions of alkylbenzenes in a mixture spectrum can occur by four processes: 1.) by a molecular specie actually present in the mixture, 2.) by concerted bond cleavage and rearrangement, 3.) by contributions from heavy Isotopes, and 4.) by intermolecular processes. Considering these four possibilities for the formation of an alkylbenzene molecular ion, it is possible to eliminate intermolecular processes, since it has been shown (1) that contributions from such processes are negligible at the pressures normally employed in analytical mass spectrometers. Effects of contributions from heavy isotopes can be corrected by the use of standard tables of natural abundance such as that oC McAdams (8). This leaves only two possibilities for the formation of a molecular ion in a mixture spectrum. Since the intensity of molecular ions in the mixture is desired, it is necessary only to correct this peak for contributions through rearrangement processes. Figure 1 shows the schematic arrangement of beta bond cleavage of the alkylbenzene under electron bombardment. It is important to emphasize that the lon structures shown are symbolic and are not intended to represent the true configuration. Skeletal rearrangements of the phenyl moiety of the molecule may take place. Evidence has been presented by Meyerson and his coworkers (12,13,14,16) and others (6) that the C7H7-*' ions are the symmetrical seven-member tropylium ion.
Mechanism 1 in figure I, showing the formation of an ion one mass unit less than a molecular ion, results from the true heterolytic cleavage of the beta bond. Formation of a lower molecular weight parent ion, mechanism 2, demonstrates a typical beta bond cleavage (7,11) with simultaneous proton shift. These two processes are interdependent in a manner not yet completely understood. General considerations and mechanisms of rearrangements under electron bombardment have been adequately described by McLafferty (9,10). Studies in this laboratory under different pressures have shown that P is not second order dependent on P - 1 at reasonable pressures. No work has been done to establish the order of dependence of P - 1 on P, although it appears that low voltage appearance potential studies would elucidate this mechanism (5). Data presented later will show a remarkable resemblance in the relative abundances of these two ions formed from several different molecular species of monoalkyl substituted benzenes. The basic premise in this work will support the theory that the contribution from any moleoular specie to a molecular ion of a lower homolog, P, can be calculated from the peak intensity at P - 1. From this consideration and data presented in subsequent tables, it will be shown that the following equation is valid.
Hj^J = Fi - ki-l (Pi-1)
60

Mj Monocomponent peak, M, at m/e i
Pi Polycomponent peak, P, at m/e i
a^j Calibration coefficient, a, at m/e = i, for component J
xj Divisions of base peak, y., of component, j, appearing in mixture spectrum
ki_j^ Correction factor, k, at m/e i-l
Intensity factors (If) are reciprocals of total Intensity sensitivities relative to normal hexadecane calculated by the follov/ing formula:
I = (m/e 226) {TL A) ^ (EnCie) (m/e A)
where
m/e 226 = Peak height in division at m/e 226 for nCi6
EnCi6 = Total ionization of nCig (25 to 228)
m/e A = Peak height in divisions at molecular ion for compound A
ZlA = Total ionization of compound A (25 to molecular ion +2)
The products of F - 1 and the corresponding If yield the partial volume fractions (15) which are subsequently normalized to 100 per cent.
Relative sensitivities are, to an extent, dependent upon the method of reducing the polycomponent peak to a monocomponent peak. The correction factors "k" and the intensities factors "If" from Table I are dependent variables and should not be used separately.
RESULTS AND DISCUSSION
Figure 2 shows the data obtained by examination of fragment ion intensities from beta bond cleavage of four alkylbenzenes of different molecular weights, each having a C7 branch. The two ions formed corresponding to P and P - l are m/e I90 and m/e I89, respectively. The ratio P/P - 1 is shown to be usably consistent. A similar study of thirty-six alkylbenzene standards provided additional data for calculating the contribution to P as a function of P - 1, regardless of the precursor to P - l . A summary of data for the calculation of alkylbenzenes by the rearrangement technique is given in Table I. Correction factors for rearrangement ions vary inversely with the moleoular weight (above mass 190) and become quite small at higher masses, while the Isotopic contributions become larger with increasing molecular weight.. To simplify calculations, these two contributions are combined in the final correction factor "k"; therefore only one mathematical operation is neoessary, based on the P - l peak, to calculate the contribution from any number of higher homologs to the ion intensity at mass P.
61

TABLE I
SUMMAHY OF DATA FOR IHE CALCULATION OF AUnfLBENZENES
BY THE REARRANOmENT TECHMIQUE
Carton No. of Molecule
12 13(a) Ik 15(a) 16 17(a) 18 19(a) 20 21 22 23(a) 2k 25(a) 26 27(a) 28(a) 29(a) 30(a)
31 32(a) 33(a)
3Ma) 35 36(a) 37(a) 38(a) 39(a) l«D(a) hl{a) h2{a)
"k" Correction Factor
(Applied to P from P-l)
.1629
.1795
.1944
.2055
.2058
.2100
.2191
.2262
.2318
.2387
.21 98
.2545
.2656
.2767
.2878
.2989
.3100
.3212
.3322
.3431*
.351*5
.3656
.3767
.3879
.3989
.4101
.4212
.1*323
.kksk
.1*51*5
.1*769
"If" Intensity Factor
(Reciprocal of Total Intensity Sensitivity)
.1505
.1584
.1661*
.2186
.2708
.311*1*
.3581
.3778
.1«X)8
.1(615
.1*713
.1*791
.U869
.1*91*7
.5021*
.5103
.5181
.5259
.5337
.51*15
.51*93
.5571
.561*9
.5727
.5805
.5883
.5961
.6039
.6117
.6195
.6273
(a) Extrapolated values
Efforts to evaluate the absolute accuracy of this method face the same dilemma as efforts to evaluate accuracy of the synthetic cracking pattern technique. Because of the complexity of the mixture, a typical detergent alkylate cannot be blended from known compounds. Previous analytical methods were not amenable to component analysis of simple mixtures of single isomers; however the present technique is applicable to any alkylbenzene mixture above mass l62. To demonstrate this, a blend of seven different known structure alkylbenzenes was made and analyzed using the figures from Table I. Blend values and analytical results are shown In Table II. Average error of ±0.5 per cent is not outstanding compared with results expected from component analysis; however, when compared with results obtained from typical detergent alkylate pattern coefficients (Table II), the accuracy and extended application of the rearrangement technique can be appreciated.
62

TABLE II
ANALYSIS OF SYNTHETIC MIXTURE (Liquid Volume Per Cent)
Blended Compounda Method
Calculated By Calculated By Synthetic Rearrangement Cracking
Method Pattern Method
1-phenyloctane
5-phenyldeoane
3-phenyldodecane
7-pheuyltetradecane
6-phenylpentadecane
8-phenyIhexadecane
2-phenylootadecane
Carbon No. of Aliyl Chain
8
9
10
U
12
13
Ik
15
16
17
Average Molecular Wei|
5.2
17.0
1*1*.5
13.8
10.0
6.0
3-5
TART,E III
ANALYSIS OF
Sht
DODECYLBENZENE
Continental's Synthetic Cracking Pattern Method
-
1.6
9.6
28.0
1*7.2
8.7
2.6
1.1*
0.6
0.3
242
4.9
17.6
43.2
13.8
10.7
6.3
3.5
Continental'! Rearrange
raent Method
0.3
0.8
8.7
27.9
47.8
9.4
2.6
1.3
0.8
0.4
242
1.9
27.1
41.7
12.2
8.4
4.8
3.9
3
Published Method(l)
-
1.1
7.6
25.8
49.5
10.2
2.9
1.4
0.8
0.5
243
Average Molecular Weight by the Mechrolab Osmometer 237
(1) Brown, R. A., Skahan, D. J., Cirillo, V. A., Melpolder, F. W., Anal. Chem. ^ 1 , 1531-8 (1959).
63

Results from analysis of a typical dodecylben-zene mixture by this technique, by the synthetic cracking pattern method used at Continental Oil Company, and by the only previously published method by Brown et al (4) are shown in Table III. It should be emphasized that Continental's synthetic pattern data were obtained by calibration on fractions separated from a mixture very similar to the dodecylbenzene analyzed here. The rearrangement method is based entirely upon studies of pure alkylbenzene different in structure from those typically present in the dodecyl type alkylate produced by phenylating polypropylenes. Even so, the analytical accuracy is completely acceptable when compared with results obtained by the other methods. Average molecular weights calculated from the distribution analysis compare favorably with those obtained on the Mechrolab osmometer showing an average difference of 5 amu. This difference may well result from the fact that the osmometer is measuring the true average molecular weight of the mixture, while the m.ass spectrometer values represent the average molecular weight of the alkylbenzenes only.
A more stringent test of the applicability of this new method to complex mixture analyses has been made. A heavy residual alkylate, C22 "to Cl\2, was fractionated into approximately nine 10 per cent cuts and a bottoms portion. Each fraction was analyzed, and data obtained are shown in Table IV. These data were calculated to original sample composition with results shown under composite analyses. Distribution data obtained by the new method are shown in the last column of Table IV. Although absolute agreement is not extremely flattering, when the raass range of the sample and the complexity of such mixtures are considered, these results are entirely acceptable. The average molecular weights calculated from distribution data, 399, agree very well with the osmometer molecular weight of 396. Agreement between molecular weights obtained by these methods is not offered as proof of accuracy but serves only as circumstantial evidence for reasonable accuracy and consistency of the analytical method.
Any component in the mixture, other than alkylbenzenes, which contributes to the P or P - 1 peak intensities will interfere with accurate analyses. Generally, such interference can be expected from indanols, condensed tetracyclonaphthenes, certain sulfur-containing compounds, many halogenated compounds, etc. The analytical method Is intended for application to detergent alkylate systems where typical aromatic content is approximately 99 per cent with a small saturate or cycloparaffin content. The method has been successfully applied to complex systems containing as little as 10 per cent alkylbenzenes in a mixture composed primarily of saturates and olefins. Generally, the method is applicable to any system for which the synthetic cracking pattern method was useful and is far less sensitive to changes in branching of the alkyl substituent.
This analytical technique has been in use at Continental Oil Company for the past year. It has been used successfully on detergent alkylate mixtures ranging from C9 through C42. The data presented in Table I should be usable for analyses of similar mixtures from any mixture spectrum obtained on a CEC-103 or comparable mass spectrometer. Recent work, which will be the subject of later papers, has demonstrated a similar applicability to dlalkylbenzenes.
64

+> -H u a OJ >i u H
O CO H O O CO
H < ^ J ^ n l / ^ v O ^ - C \ J a ^ C V J ^ - r n c v j r H r H O O O O O
-^ ONcnO m _ ^ C7N-=1- tfWD - ^ ^ O ' J D J - r O H O O O O
-4 -aJC\ j ro - : tvOCTNOjmHv£) i r \ i r \ t ^ -:t
rn in t^ ON OJ Oxco oo C—* m UMTN ir\ f-
m m < \ j M ) m h - O H O
0\-.=i- -:t vo ir\VO 0^ t -CO
3 H t - ON o w o t ^ ON H
r - - * oDvo r - ONO
VOGO o \ O H U N ^ m < n rH H OJ SD VD H H VO W ON
^
CO
si
I •n a o o la
f> ~
l-t . O -P
o w o t r , ONCO m ON rH
v o j rH c
i/\ c^ Oi in t ^ o . ^ m . *
OJ IA O CO O CVI O tjs.4- tJN
H CO CO ON CVJ CJN ITsSD ,
CVJ fo .4 - icsso t r o p 9 N Q rH CVJ r o . ^ m v o c v j o j c v j c v j c v j o j o j c v j f n f n r i ^ m p o r o m
CVJVO O . * CO CVJ O H o r i 3 - UN t -ro cn m m m m 1 J -CO CVJVO p ; * s
E^^g^55!3 4» a &
a«5^ss|i 1J^ m m i r \ i r \ i r \ Fv<
CJN ! . ,4J
B l 0) o a g o m IH O
CVJ + J . o .Q
" ^ ^ u Jd n o
cv,l£ cr. >> >.
fl P
4* +> f i XI CO CO .H .H
H 0) 4)
• » » c^ u u %h o o 0) a>
rH H
43 3 ID 01 CJ B) to
o p gj
< <
65

ACKNOWLEDGMENTS
The authors wish to thank Mr. Alex Shadan for synthesizing many of the standards used in this work; also we thank Dr. Joseph A. Dixon for standards provided from API Research Project 42. Instrumental data were obtained by Messrs. C. F. Maddox, E. E. McKelvey, and \1. K. Moore. Mrs. VJ. M. Wright contributed substantially by doing much of the detailed computation and organization of the data presented.
REFERENCES
1. Beynon, J. H., "Mass Spectrometry and Its Application to Organic Chemistry," pp. 275-277, Elsevier, Amsterdam I96O
2. Boyer, E. W., Users' Clinic, Consolidated Electrodynamics Corporation, E-l4 Meeting on Mass Spectrometry, Los Angeles (1959)
3. Boyer., E. W., Users' Clinic, Consolidated Electrodynamics Corporation, E-l4 Meeting on Mass Spectrometry, Atlantic City (196O)
4. Brown, R. A., Skahan, D. J., Cirillo, V. A., Melpolder, P. W., Anal. Chem. 31, 1531 (1959)
5. Bryce, W. A., and Clarke, E. W. C , in "Advances in Mass Spectrometry" (j. D. Waldron, ed.) p. 392, Pergamon Press, London, 1959
6. Foster, N. G., Hirsch, D. E., Kendall, R. F., Eccleston, B. H., and Ward, C. C , A.S.T.M., E-14 Meeting on Mass Spectrometry, Atlantic City, N. J. (i960)
7. Kinney, I. W., Jr., and Cook, G. L., Anal. Chem. 24, 1991 (1952)
8. McAdams, R. D., "Isotope Correction Factors for Mass Spectra of Petroleum Fractions," Esso Research Laboratories, Baton Rouge, Louisiana, 1957
g. McLafferty, F. W., Anal. Chem. 31. 82 (1959)
10. McLafferty, F. W., "Mass Spectrometry," in "Determination of Organic Structures by Physical Methods," suppl. ed., ed. by F. C. Nachod and W. D. Phillips, p. 131, Academic Press, New York, 196I
11. Meyerson, S., Appl. Spect. 9, 120 (1955)
12. Meyerson, S., and Rylander, P. N., J. Chem. Phys. 27, 901 (1957)
13. Meyerson, S., and Rylander, P. N., J. Phys. Chem. 62, 2 (1958)
14. Meyerson, S., Rylander, P. N., Eller, E. L., and McCollum, J. D., J. Am. Chem. Soc. 81, 2606 (1959)
15. Otvos, J. W., Stevenson, D. P., J. Am. Chem. Soc. 78, 546 (1956)
16. Rylander, P. N., Meyerson, S., and Grubb, H. M., J. Am. Chem. Soc. 79, 842 (1957)
66

MASS SPECTRA CORRELATIONS AND APPEARANCE POTENTIALS OF THE MAJOR TOBACCO ALKALOIDS
William F. Kuhn and Charles J. Varsel Philip Morris Research Center
Richmond 6, Virginia W. A. Powell
Department of Chemistry University of Richmond Richmond, Virginia
ABSTRACT
The mass spectra of some major tobacco alkaloids have been determined and correlations between the spectra and structures of these alkaloids are discussed. The more abundant peaks in the spectra of the alkaloids result from the following mechanisms: (1) The ionization of the molecule, (2) loss of a hydrogen atom from the molecule, (3) bond rupture between the pyridyl nucleus and the nucleus of the cyclic amine, and (4) splitting out an empirically CH3N neutral fragment. The moleoular weights of these alkaloids are readily determined from their Intense molecular ions .
The appearance potentials of the major ion species from these alkaloids were measured and probable modes of ion formation are discussed.
The design of a heated inlet operable at 200°C and 1 X 10" torr is presented.
INTRODUCTION
The main objectives of this project were three-fold: (1) to design and fabricate a heated inlet system for the mass spectrometer; (2) to analyze under normal operating conditions the major tobacco alkaloids; and (3) to determine the ionization potentials of the alkaloids as well as the appearance potentials of some of the major fragment ions derived from the alkaloids.
The tobacco alkaloids comprise a sraall fraction of the many organic corapounds which oannot be analyzed mass spectrometrioally at room temperature and pressure of 1 x 10-° mm. of Hg. or higher. Since this Is the oase, a suitable heated Inlet raust be Improvised in order to vaporize the alkaloids. From the mass spectrum of the alkaloid, It is then possible to arrive at a positive identification of said raaterial if present in a sample of unknown composition.
The ionization potential of a molecule is simply an additional physical constant similar to a boiling point, melting point, etc. Generally speaking, it oannot be used as a direct raethod of Identlfloatlon, but it oan serve as an additional parameter for substantiating the proposed structure of a corapound. The appearance potential of a fragraent ion may lend itself useful in in determining such entities as bond energy and heat of formation,
EXPERIMENTAL
A Consolidated Electrodynamics Corporation (CEC) Model 21-103 C Mass Spectrometer was used in this study. The general features of the instrument have "been previously described (1) . The salient modification of the Instrument is evident in the exhaust pumping systera. The standard raercury diffusion pump was replaced
67

HEATED INLET FOR MASS SPECTROMETRY
TO ISATRON FROM V-9 UANIFOLD
VEECO VALVES
STAINLESS STEEL 0LOCK
GALLIUM FRITS
VEECO VALVE
KOVAR
GOLD LEAKS
CAJON HIGH TEMPERATURI QUICK DISCONNECT
y/s-ues^ /
ALKALOID
NICOTINE m/i 162
161
133 84
APPEARANCE POTENTIAL
(glectron-volt)
8.01 ±0.06
I0 .05 t0 .06
1 1.18+0.09 9.88±0j03
RELATIVE INTENSITY (PERCENT)
19.2
17.6
26.6 100.0
ANABASINE 162
1 61
133
120
1 19
106 109
8 4
8 .70 tO f l8
10.12+0.07
I 0 . 9 8 ± O J 0 8
I0.S8±0X)4
1 1.48+0.09
I 3 . I 8 ± O J 0 6
I2 .89±0j04
9.58+0X)2
30 .9
2 1.5 4 2.3
16.3 3 2.1
4 5.4 57 .8
100.0
NORNICOTINE i4e
P47 1 2 0
1 1 9
1 1 8
8 0
7 0
9.30±0.06
I0.0S±0.03 10.14+0.02
I0.75±0.09
10.51 ± 0 . 0 6
9.S8±0.09
9.69+O.OS
2 3 . 1 3 4 . 1 3 2.5
1 0 0 . 0 2 2.1
2 1.5
8 0 . 4
APPEARANCE POTENTIALS and RELATIVE INTENSITIES of the
P R I N C I P A L IONS f rom
NICOTINE, ANABASINE, and NOQNICOTINE
Figure 2
68

by a Varian 8 l/sec. Vac-Ion pump with an argon stable cathode. The operating characteristics and the advantages of this purap have been described elsewhere (2).
The heated inlet system consists basically of three stainless steel valves to isolate the one-liter glass reservoir from the evacuation manifold, (see Figure 1) These valves are equipped with Viton seats and silicone rubber gaskets. The introduction of solid and viscous liquid samples is made possible by a Cajon vacuum coupling, fabricated into a sample holder, and positioned in the front of the heated inlet systera between two of the valves described above. A silicone rubber gasket insures a vacuuin seal between the body and the gland portions of this coupling. Graded seals (Kovar) are used to Join the glass to metal portions of the inlet. This entire coupling is heated electrically. The introduction of non-viscous liquids of low vapor pressure can be accomplished through the use of this coupling or they oan be charged through a gallium covered sintered disk as described by O'Neal and Weir (3).
The inlet line from tte gas manifold systera of the instrument is passed through the top of the oven and attached to one arra of a glass tee. The base of this tee is attached to the one-liter reservior in the oven. Restricted orifices (gold leaks) are inserted In this arm of the tee and at the base of the tee. The orifice in the arm of the tee serves two purposes: (1) it restricts the flow of gases frora the roora temperature manifold to the ion source, and (2) it minimizes condensation of high boiling materials on the glass tubing outside the oven. The gold leak in the base of the glass tee restricts the flow of gaseous high boiling materials effusing toward the ion souroe. The sample exhaust valve, Identical to those described above, is connected to the heated inlet reservoir. In operation, the residual air in the vaouum coupling Is evacuated, after which the entire coupling is heated, and the sample in the vacuum coupling is vaporized. The vapors are expanded into the heated reservoir through the sample inlet valve. These vapors diffuse from the reservoir to the lon souroe (isatron). The mass spectrum is then obtained in the usual manner.
The oven surrounding the heated inlet system is fabricated from asbestos board. An inner and outer casing are constructed of 0.25 inch asbestos board with a I.5 inch Fiberglass bat between these two casings. A two kilowatt, two-coil, rectangular heater is used to provide a fast increase in temperature. Current for this heater is supplied frora a two kilowatt Variac mounted above the oven. A Fenwal therrao-regulator is attached close to the heated sample reservoir to control the oven temperature. A thermocouple is used to monitor the teraperature of the heated inlet systera. The temperature of the oven may be varied from ambient to 300°C and controlled at less than 2% of the predetermined value.
The mass spectra of the alkaloids and their nuclear moieties were obtained at electron energies of seventy (70) volts and a magnet current of our hundred (400) milliamperes. The ion source was maintained at 250°C. The saraples of pyridine, piperldlne, pyrrolidine, and N-methylpyrrolidine were analyzed as received. The nicotine was freshly distilled prior to this study. Anabaslne, obtained from Fluka A. G. (Switzerland) and estimated to be 95% pure by paper chromatography, was analyzed as received. Nor-nicotine was isolated in our laboratory from the dlplcrate and analyzed without further purification. A search of the literature indicates that the mass speotral patterns of nicotine, anabaslne, nornicotlne, and N-methylpyrrolldine have not been reported previously.
69

00-1
75-
50-
25-
NICOTINE
6 ^ /
9^ . .1 .
or 1 . . 1 .
0 ^ o%
o; r^. of
P^ y CrV ' I I I
m/e 42 52 e2 72 ex ex lox nx ixx isx i42 i9X lex
MASS SPECTRA OF NICOTINE, ANABASINE, AND NORNICOTINE
Flguroi 3
STRUCTURES, NAMES, AND IONIZATION POTENTIALS OF
TOBACCO ALKALOIDS ANO THEIR NUCLEAR MOIETIES
NUCLEAR MOIETIES
O f? o ^ M
PYRIDINE
(9 -96+ 0 . 0 9 ».V.)
( 9 . 8 ± 0 . i e .V . I *
tH,
N K C T H Y L P T R R O L I O I H E
ie.06±o.oz«.vi
t f " H
PPERCINE PYRROLIDINE
T O B A C C O A L K A L O I D S
I 8 . 4 9 i 0 . 0 6 e . « ) ( a . 6 0 1 0 . 1 0 e.V.)
l 9 . 2 ± 0 . 2 i . V . l ' I S . J l O . Z e . v . l '
( 8 . 4 7 . . V . ) ' 1 8 . S 5 « . V . | '
D o CX) CX^ NICO T I N E
( 8.01 ± 0.06 •.¥.)
A N A B A S I N E
( 8 . 7 0 ± 0 . o e e . v . )
N O R N I C O T I N E
( 9 . 3 0 ± 0 . 0 6 e . V J
FICLO a FRANKLIN b. GALLCeOt • KI tCR
Figure 4
70

The mass spectra obtained for pyridine and piperldlne compare favorably with those listed in the American Petroleum Institute tables of raass spectral data. The raass spectrura of pyrrolidine was reported by Gallegos and Kiser {k).
The ionization and appearance potentials were measured using the technique of Dibeler and Reese (5). The instruraent modifications necessary to measure these potentials were described by Varsel and co-workers (6). In these studies, xenon was used as the calibrating gas. The ionization potential of xenon is 12.I5 electron volts (7).
RESULTS AND DISCUSSION
A. High Voltage Mass Spectra
In the mass spectrometer whioh operates at low pressures (ca. 10-° mm. Hg.) the molecules of the compound studied are bombarded in the gas phase with electrons of low energy (10 to 100 electron volts) . The processes which result from the Impact of electrons on organic molecules are exceedingly complex and are by no means fully understood (8,9, 10). If an impacting electron possesses energy greater than the ionization potential of the molecule, the most common primary process which results from this collision is the removal of one eleotron from the molecule:
M + e = M"*" + 2e.
The raolecular ion, (M ), may decompose Into a positive ion and a neutral fragment. This process oan ocour repeatedly, thus leading to a stepwise multi-fragmentation. The nature of the ions and their relative abundances depend on the structure of the molecules which are bombarded. In general, two compounds that are structurally different will give different fragraentation patterns. Like the infrared speotrura, the mass spectrum can be considered as a fingerprint of the compound.
The partial mass spectra of nicotine, nornicotlne, and anabaslne obtained at a potential of 70 electron volts are shown in the accompanying figure. (Figure 3) Structures are Included to coincide with the various ions which were detected. In all cases the molecular lon is one of the most abundant species noted.
The alkaloids are characterized by the following intense peaks: the molecular or parent, parent minus one (p-l), parent minus twenty-nine (p-29), and the parent minus seventy-eight (p78).
Although the empirical formulas of nicotine and anabaslne are identical, the mass spectra of these oompo\mds are quite different. The most outstanding difference is the relative intensity of the peaks in the m/e IC^ to I06 region. These ions are quite abundant in the spectrum of anabaslne, but are relatively small In the spectrum of nicotine.
Sinoe the molecular weight of nornicotlne is 148 as corapared to 162 for nicotine and anabaslne, there is no possibility of error in arriving at the identification of this compound whenever an unknown is suggested as being one of these three compounds.
B. Ionization and Appearance Potential Measureraents
The ionization potentials of nicotine, anabaslne, and nornicotlne together with their nuclear moieties, pyridine, N-raethylpyrrolidine, piperldlne, and pyrrolidine, were deterrained. (Figure k-) Because of the good agreement between the ionization potentials of the alkaloids with those of the corresponding
71

cyclic amine, it is suggested that the electron removed from the alkaloid molecule comes from the cyclic amine portion of the alkaloid during the ionization prooess.
With pyridine, good agreeraent between the observed value (9.98 eleotron volts) and the literature values (9.8 electron volts) was obtained. Our observed ionization potential of pyrrolidine is about 0.6 electron volts lower than other reported experimental values, but it is in good agreement with the value calculated by the equivalent orbital method. Our precision for the ionization potential of pyrrolidine was quite good. The cause of the discrepancy between the observed value and the literature values is not known.
The ionization potential of N-methyl pyrrolidine has not been reported previously. One would perhaps expect the Ionization potential of this compound to be lower than the ionization potential of pyrrolidine because of the electron donating capacity of the methyl group. The experiraental data attest to this fact in that the ionization potential of N-methylpyrrolldine is 8.06 electron volts, as compared to 8.6O electron volts for pyrrolidine.
The ionization potential observed for piperldlne is 8.it9 electron volts. This value is about 0.7 electron volts lower than the literature value, but the observed value agrees well with that value calculated frora the equivalent orbital raethod.
Nicotine (3'-pyridyl -2- (N-methyl)-pyrrolldine) t
The ionization potential for nicotine is 8.01 ± O.06 electron volts. The appearance potential of the m/e I6I ion (p-l) is 10.05 ± 0.06 electron volts. The hydrogen atom may be abstracted from the methyl group attached to the nitrogen atom of the N-raethylpyrrolldlnyl raoiety. The proposed raechanisra is:
^
^
- " ^
• - . N ^ HCH
+
? y y ^ = ^
y^ \ N / "
1 CHa
The appearance potential of the m/e I33 lon (p-29) is 11.18 ± 0.09 electron volts. This ion is thought to be formed by rupture of both bonds alpha to the nitrogen atom of the N-methylpyrrolldinyl nucleus. The proposed mechanism is:
+ CH3N
The appearance potential of the ra/e 84 ion (p-78) is 9.88 ± 0.03 electron volts. This ion is forraed by rupture of the carbon-carbon bond between the pyridyl and the N-methylpyrrolldinyl moieties. The proposed mechanism is:
72

^N-I
CH,
These energies give insight to some of the bond energies of nicotine.
Sinoe the appearance potential for the m/e 84 ion is less than that for the m/e l6l ion, it is probable that the carbon-carbon bond between the pyridyl and the N-methylpyrrolidinyl nuclei is weaker than the carbon-hydrogen bonds present in the N-methyl-pyrrolidlnyl moiety. The difference in the appearance potentials of these two ions is 0.I7 eleotron volts or 3-92 kcal (23.06 kcal/electron volt).
Since the m/e 133 ion is formed by breaking two bonds, one would expect that the appearance potential of this ion would be higher than those obtained when only one bond is broken. The experimental data support this premise.
Anabaslne (3' pyridyl-2-piperidlne)
Since both individual moieties for anabaslne are unsubstituted, one would expect the ionization potential of anabaslne to be higher than that of nicotine. This was shown by experimental data to be the case. The ionization potential of anabaslne is 8.70 ± 0.08 electron volts while that for nicotine is 8.01 ± 0.06 electron volts.
Since the bond dissociation energy required for the forraation of the m/e I6I ion (p-l) from the molecular lon in anabaslne (32.8 kcal) is less than that required for the forraation of the same ion in nicotine (47.1 kcal), it is suggested that the hydrogen atora reraoved to form this ion comes frora one of the carbon atoras of the piperidinyl nucleus. The proposed raechanisra is:
^ ^
^ N ^ " \ N ^
y ^
y y ^ H
Since beta bond cleavage is preferred, it should be noted that in the proposed mechanism the hydrogen atom Is beta not only to the pyridinyl raoiety but also to the nitrogen atom of the piperidinyl moiety.
The appearance potential of the ra/e I33 lon (p-29) is 10,98 ± 0.08 electron volts. This ion is thought to be formed by rupture of the bonds alpha and beta to the nitrogen atom of the piperidinyl nucleus. The mechanism raay be as follows:
z y n-
CHE
+ CHsNH
\N;
73

Since the m/e 119 ion is thought to be formed by splitting out a methylene group frora the already forraed m/e 133 ion, and additional bond must be broken and raore energy is required. One would therefore, suspect that the appearance potential of the m/e 119 ion would be higher than that of the m/e 133 ion. The experimental data show that the appearance potential of the m/3 119 lon (11.49 ± 0.03 electron volts) is about O.5I electron volt higher than that of the m/e 133 ion (10.98 ± 0.08 electron volt.)
The m/e 120 ion is possibly forraed by bond rupture of the two bonds beta to the nitrogen atom in the piperidinyl nucleus. Sinoe the appearance potential of this ion (10.58 electron volts) is less than that of the m/e 119 ion (11.49 electron volts), the author suggests that the bond dissociation energies of these bonds are less than the bonds alpha and gamma to the nitrogen atora. These latter bonds are thought broken to forra'the m/e 119 ion. The rupture of these latter bonds is postulated as the mode of formation for the m/e 119 ion. The proposed mechanism for the formation of the ra/e 120 ion is:
-CH
\N-1 H
CHJ + CgHe
The m/e I05 ion is thought to be formed by removing an additional methylene group from the already forraed m/e 119 ion. As stated previously, this process proceeds at the expense of energy; therefore, one would expect the m/e I05 ion to have a higher appearance potential than the m/e II9 ion. The observed values for the appearance potentials of the ra/e I05 and 119 ions are 12.89 and 11.49 electron volts, respectively. The observed data are in good agreement with the proposed raechanisra.
The experimental value for the appearance potential of the m/e 106 ion is I3.I8 ± O.06 electron volts. This ion could be formed by rupture of the bonds alpha and beta to the nitrogen atom of the piperidinyl nucleus according to the following mechanism:
C.HE
Another possibility, although less favorable, for the formation of this ion is the rearrangement of a hydrogen atom to the already formed m/e I05 ion.
The base peak (m/e 84 ion) from anabaslne is formed by breaking the bond between the pyridyl and the piperidinyl nuclei and imparting a positive charge to the piperidinyl nucleus. The observed value of 9.58 ± 0.02 electron volts for the appearance potential of this ion suggests, as in the case of nicotine, that the carbon - carbon bond between the two nuclei is weaker than any of the carbon-hydrogen bonds in the piperidinyl nucleus. The mechanism is:
74

^
Nornicotlne (3'- pyridyl -2- pyrrolidine)
The observed ionization potential (9.30 eleotron volts) for nornicotlne is somewhat higher than one would expect based upon the value obtained for pyrrolidine. (Recall that ionization potentials of nicotine and anabaslne agree closely with those of N-raethylpyrrolidine and piperldlne, respectively). However, the ionization potential of nornicotlne is lower than that of pyridine and the suggestion that the electron removed during the ionization process coraes frora the cyclic amine moiety is substantiated. Since all measureraents were raade at least in duplicate and the reproducibility within any given set of values was good, the apparent discrepancy is unexplainable at this time.
The appearance potential of the m/e 147 ion (p-l) from nornicotlne is 10.05 ± 0.03 electron volts. The energy difference between this value and that observed for the ionization potential indicates that the hydrogen atom removed comes from one of the carbon atoms of the pyrrolidinyl nucleus. Since the appearance potential of this ion is in excellent agreeraent with that of the m/e 161 ion (p-l) from anabaslne, it is suggested that the same prooess Is occurring in both cases. The proposed mechanism isi
• ^ ^ ^ ^
"•N-
The splitting out of the neutral fragment, empirically CH3N, forms the m/e II9 ion which is the base peak in the nornicotlne spectrum. The appearance potential for this ion (10.75 ± 0.05 electron volts) is slightly lower than that for the formation of the m/e 133 ion formed by the removal of the same neutral fragraent from nicotine and anabaslne. Since a large amount of energy is required to ionize the nornicotlne molecule, one would expect that the dissociation of the ionized molecule would proceed more readily than that observed for a molecule with a lower ionization potential if the sarae dissociation process is occurring. In this study, the observed data substantiate this postulation.
The observed appearance potential of the ra/e 120 ion is 10.14 ± 0.02 electron volts. This ion can be formed either by the formation of CsHt or CHsN neutral fragment from the raolecular ion. The formation of the latter fragment would require rearrangement of a hydrogen atom. Since this value is less than that observed for the m/e 119 ion, the data suggest that the CEH4 radical is the one actually forraed. If the CHsN radical were formed, the appearance potential of the m/e 120 lon should be greater than that of the ra/e 119 ion because of the energy requirements of the rearrangement process.
75

The formation of the m/e 118 lon oan occur if an additional hydrogen atom is removed from the m/e 119 ion. This process should proceed at the expense of energy and the appearance potential of the m/e 118 ion should be greater than the appearance potential of the m/e 119 ion. Experimentally this was not the case. The most probable mechanism for formation of the m/e 118 ion appears to be the splitting out of CsH* + 2H fragments from the molecular lon. In this case the appearance potential of the m/e 118 lon should be greater than that of the m/e 120 lon. The experimental data substantiate this proposal. The appearance potential of the m/e 118 ion (10.51 ± 0.06 electron volts) is greater by 0.37 electron volt than the appearance potential of the m/e 120 ion.
The m/e 80 ion in the nornicotlne spectrum is one of the more abundant ions. The appearance potential of this ion is 9.58 ± 0.09 electron volts. This ion is not as intense in the mass spectra of nicotine and anabaslne as it is in the nornicotlne spectrum. This ion is thought to be formed by the rearrangement of two hydrogen atoms to the pyridyl moiety of the alkaloid.
The formation of the m/e 70 ion is attributed to the cleavage of the carbon-carbon bond between the pyridyl and pyrrolidinyl nuclei. The appearance potential of this ion is 9.69 ± 0.05 eleotron volts which is in reasonable agreement with the appearance potentials of the ions formed, via this mechanism, from nicotine (9.88 ± O.03 electron volts) and anabaslne (9.58 ± 0.02 electron volts).
In the accompanying table, the appearance potentials and the pattern coefficients are listed for the ions which were studied. The data demonstrate that there is not a definite correlation between the pattern coefficients and the appearance potentials .
SUMMARY
The mass speotra of nicotine, anabaslne, nornicotlne and their nuclear moieties (pyridine, N-raethylpyrrolidine, piperldlne, and pyrrolidine) were obtained at eleotron energies of 70 electron volts.
The raass spectra of the alkaloids are characterized by the intense peaks attributable to the following ions; the molecular or parent, the parent minus one (p-l), the parent minus twenty-nine (p-29), and the parent minus seventy-eight, (p-78). This latter lon is formed by the rupture of the bond between the pyridyl and the respective cyclic arainyl nuclei. The Intensity of this lon in the spectra of all the alkaloids indicates the ease with whioh this bond is ruptured. Appearance potential data substantiate the weakness of this bond.
The ionization potentials of the alkaloids agree very closely with those of the respective cyclic amines. This Indicates that the electron removed from the alkaloid during the ionization process comes from the cyclic amine moiety.
Appearance potential data show that the carbon-carbon bond between the pyridyl and the cyclic amlnyl moieties is the weakest bond in all of the alkaloids studied. These data further indicate that the hydrogen atom removed to form the parent minus one ion comes from the N-methyl group in nicotine, and from the cyclic arainyl nitrogen in anabaslne and nornicotlne.
The heats of forraation of the fragraent ion and some of the bond dissociation energies may be determined from the data presented.
The studies presented herein were made possible by the design and fabrication of a suitable heated inlet system for
76

mast: spectrometei-. The outEtnnding feature of thi;- inlet is th.".t It permits the direct introduction of solids snd viscous liquids into the instrument.
LITERATURE CITED
1. D. J. Fraade, fnd R. F. Howard, Instruments snd Control Systems, 3' , 2272 (I96I).
2. R. D. High, and R. W. Schede, "The Use of an Electronic High Vacuura Pump on Various Types of Mass Spectrometers," AEC Report No. KD-1591, Oct., (1959)-
3. M. J. O'Neal, Jr., and T. P. V/eir, Anal. Chem. , 22, 83O (1951).
4. E. J. Gallegos and R. W. Kiser, J. Phys. Chem., 66, I36 (1962).
5. V. H. Dibeler, and R. M. Reese, J. Res. Natl. Bur. Std., 54, 127 (1955).
6. C, J. Varsel, F. A. Worrell, F. E. Resnik, and W. A. Powell, Anal. Chem., 32, l82, (196O).
7- F. H. Field and J. L. Franklin, "Electron Impact Phenoraena and the Properties of Gaseous Ions," p. 246, Academic Press, New York, N. Y., 1957.
8. A. J. B. Robertson, "Mass Spectrometry," Methuen, London, 1954.
9. F. H. Field and J. L. Franklin, op. cit, p. I66.
10. A. L. VJahrhaftig, Advances In Hass Spectrometry, ed. J. D. V/aldron, Pergamon Press, London, 1959.
77

SPECTRA CF CCM>OUHIS OF BIOLOGICAL DPEERBST *
K. Blemsim and Janes A. McCloskey Department of ChemlBtry, Massachusetts Institute of Technology,
Cambrld^, Mass.
Many of the organic compoundB which are of importance in biochemistry are of rather lew volatility, becaviBe of the number of polar groups present. Frequently these substances are encountered in rather small amounts thus making it difficult or impossible to employ chemical conversion into more volatile derivatives, an approach which we have used extensively in the past.
To obtain usable mass spectra of such compounds, such as nucleosides, free amino acids and peptides, etc., we have sublimed or distilled the sainples directly Into the Ionizing electron beam, a, of a Bendix TOF mass spectrDmetor using a tiny oven assembly (Fig. 1) which enters the source region through a vacuum lock, b, (lock and piston are from a Bendix Model 845 Hot Filament Sample System). To avoid accidental pyrolysis of the sample, catalytic effects of the filament material, and contamination of ccmsecutlve samples, the substance, £, Is placed Into a disposable glass cup, d, (short piece of melting point capillary). By passing current through the helix of resistance wire, e, the cup is heated to a temperature at which the compound has sufficient vapor pressure to give a good spectruni (for example, 80 - 200° for various amino acids). Care has to be taken not to apply too much heat which leads to too fast an evaporation.
The spectra are scanned within a few seconds or as slowly as 1 - 2 minutes, using a Honeywell-VisIcorder No. 1508.
Mass spectra of a number of nucleosides have been obtained . They permit identification of the base, which gives rise to rearrangement peaks involving the abstraction of one and two hydrogen atoms (m/e 112 and 113 in Figs. 2a and b). The sugar moiety also gives rise to a significant peak (m/e II7 In the deoxypentosldes shown in Figs. 2a and b, while it Is at 133 in pentosides). Isomers such as 2' - deoxyurldine (Fig. 2a) and 5' - decotylyxosyluracil (Fig. 2b) can be distinguished and the differences interpreted in terms of the structures.
Witb this technique it is quite easy to obtain the mass spectra of compounda deuterated on 0, N or S by simply evaporating in a dessicator a drop of a solution of the sample in DaO placed into the sample cup. Fig. 2c shows the spectrum of 5' - deoxyl-yxosyluracil so treated. The shifts of the peaks are in agreement with the assignments mentioned above. Furthermore, It indicates, for example, the structure of the fragment of mass 57 which cannot contain -OH becaiise its mass remains unchanged.
p The mass spectra of a considerable number of free amino acids have been obtained .
All exhibit a fragmentation pattern closely related to the speotra of amino acid ethyl esters and can, therefore, be Interpreted along the same lines. Differences in mass (28 m.u.) are observed with those fragments that contain the -COOH group (instead of -COOC„H_). In addition, the rearrangement of one hydrogen atom during the cleavage of the C^ - Cfi bond is observed to a certain extent.
To illustrate the extreme sensitivity of this method, a spectrum obtained with 0.25 microgram of phenylalanine is shown in Fig. 3.
* This work was supported by the National Institutes of Health (RG 5472) and the National Aeronautics and Space Administration (NsG 211 - 62).
1) For a more detailed discussion see K. Biemann and J. A. McCloskey, J. Am. Chem. Soe., 84, 2005 (1962).
2) For a more detailed discussion see ibid., August, 1962.
3) K. Blemann, J. Seibl and F. Gapp, J. Am. Chem. Soc., 82, 3795 (1961).
78

a I
1
Fig. 1. Sample system for introduction Into the ion source of a Bendix TOF Mass Spectrometer. For details see text.
U__J1
it) ^*^y
-1 'i'tfi T II7IS1
CH,OH
I^^O^^I ll7|Sli
L ^ mil ll.ll J
l1 ;t--
C^OH OH^C
' C — C
Mii^
X.
\ y ' -C'^OO OD.C
.l__ii2JB}l I n9(si|
30 4 0 50 SO 70 80 9 0 IOO MO 120 130 i 4 0 ISO IGO I/O 'PO 190 200 210 220 230
F i g . 2 . Hass spec t r a of (a) 2 ' - deoKyurldlne, (b) 5 ' - decotyHjrxoeyluracll and (c) Baffle as ( b ) , but t r e a t e d with D^O.
79

If) ID
O CVi
(D
?
& ii ft
w
CVI
O
80

A FRAGMENTATION MODEL FOR n-PARAFFINS
John C. Schug Gulf Research & Development Corapany
Pittsburgh, Pennsylvania
ABSTRACT
A tentative model is described to interpret the raass spectra of n-paraffins. In this model, it is assuraed that parent molecule ions dissociate to produce priraary fragraents which contain at least half the total nuraber of carbon atoras available. If the fragment ions retain sufficient excitation energy, they may dissociate further, with the same requirement that any products are at least half as large as the decaying species. At each step, all possible dissociations are assumed to be in competition. Rate constants are calculated by the latest version of the statistical theory. Breakdown curves are given for n-decane and described for other cases.
The assumed model is capable of explaining the dependence of the fragmentation patterns on the ionizing voltage, the relative abundances of nuraerous fragraent ions, and the observation of several metastable ion peaks. However, other expected metastables do not appear, and in addition it is impossible to reconcile the computed breakdown curves with the observed mass spectra by the use of a presently acceptable internal energy distribution function. The need for further experiments and calculations is pointed out,
I, INTRODUCTION
Very little is actually known about the dissociation processes that are responsible for the mass spectra of large raolecules. The fragmentation patterns of long-chain n-paraffin molecules have long been familiar, and have been thoroughly characterized , but no interpretation has been given for them. The recent studies by Beynon and coworkers on C^^-labeled raolecules have definitely proved that these patterns result frora a series of consecutive dissociations, • If, as in the present work, the statistical theory of mass spectra-^ be accepted, the same deduction can be drawn on the basis of the numerous metastable ion peaks that are observed^ in the spectra.
With the available data as a basis, it is possible to construct a number of reasonable dissociation raechanisras. In this paper, one such raodel is investigated, A tentative dissociation scheme for n-paraffin molecule-ions is postuated, and its predictions are compared with some experiraental observations.
It is assumed that the breaking of carbon-carbon bonds is the controlling process and, therefore, simple dissociations of the paraffinic chain are the only steps that are considered in this work. Finer details, such as atoraic rearrangement during dissociations and the loss of hydrogens, are left for future considerations. For the present, then, any fragment ions encountered will be characterized as CJ^, and the number of hydrogens contained in them will not be a point of concern. Whenever it becomes necessary to specify the fragment ions more completely, as in estimating activation energies and calculating dissociation rate constants, it will be assumed that all fragraent ions observed are of n-alkyl stoichiometry (CnH2n-(.i)'
The postulated dissociation scheme considered in this work is as follows:
3 ^ a) By virtue of their excess internal energies , parent molecule-ions,
^N^2N+2' 'iridergo primary dissociations to fragraents Cjj , where n N/2.
b) During the primary, as well as any successive dissociations, it is assumed that the excess internal energy is equipartltioned between the fragment ion and its complementary neutral fragment. This is expressed by
£• = nj(E-^o>/<"l+V^ <1)
where E is the excess energy of the initial ion, ^ ^ is the activation energy for the reaction, nj and nj are the numbers of degrees of freedom in the ionic and neutral products, respectively, and E' is the excess energy found in the resulting ionic species.
c) Independent of its origin, any fragment ion, C , that possesses sufficient energy may dissociate to smaller fragments, C , with the stipulation that m^n/2. ^
81

Table I.
ESTIMATED ACTIVATION ENERGIES FOR C-C BOND DISSOCIATIONS
Fragment Ion
CHj"*"
C2H5+
C3H/
c K "sy 'ey S»15^
V17"
S»19+
So»21+
'ni»23+
S2»25+
C H + 13 27
^."29"
C H + 15 31
S6"33" C H "•• 17 35
'^18"37
C^gHj,
Activation
n-pecane
3.6
1.8
0.9
0.7
0.6
0.5
0.5
0.5
0.8
---
...
...
...
...
...
...
...
...
Table II.
Energy (ev)
n-Eicosane
3.6
1.8
0.9
0.7
0.6
0.5
0.5
0.5
0.5
0.5
0.5
0.5
0.5
0.5
0.5
0.5
0.5
0.5
0.8
NORMAL MODE FREQUENCIES ASSUMED +
FOR C(jH2fH.2 MOLECULE ION
Mode
C-C Stretching
C-C-C Bending
C-H Stretching
CH3 Deformation
CH2 Deformation
CH2 Rocking
CH3 Rocking
Torsions
Number
N-1
N-2
2N+2
6
2N-4
2N-4
4
N-1
Frequency
1000 cm'^
500
3000
1400
1400
1200
1000
100
82

II. IMPLICATIONS OF THE MODEL
For a typical dissociation process,
y * ' l" + "2 ' (2) the activation energy, ^ Q , may be estimated by the relation,
^o = D(Rl-R2) + KRi) - I(Ri-R2)» < ^ ^ where D is the bond dissociation energy In the neutral species and 1 denotes ionization potential. In Table I are listed the activation energies obtained from this expression for the scission of all possible C-C bonds In n-decane and n-eicosane raolecule-ions. (Only the lower halves of columns 2 and 3 are important in this treatment.) Bond dissociation energies were taken as 3.4 and 3.7 ev^' , respectively, for interior and end bonds of the chains. The ionization potential of each molecule was taken as 10.2 ev^. The values used for the ionization potentials of n-alkyl radicals were determined by Clancy and Crable". The data of the latter investigations showed that I(CnH21«-l) decreases as n increases, but that the changes are very small for n > 6. In Table I, it is apparent that zero increments were assumed here for n > 6. It might be noted that if the increments are In fact different from zero, then the first feature (a) of the dissociation scheme (preceding section) is compatible with the various empirical observations' which are usually referred to as "Stevenson's Rule".
For dissociations other than the primary ones, the necessary data for estimating t_ are not presently available. For the lower molecular weight species, Eq. (3) generally leads to values of about 1 ev. In the present work, values of 1.2 and 1.0 ev were used for all subsequent reactions; the former quantity was applied to all losses of neutral C- fragments, and the latter to all other processes.
Earlier work ' has shown that the original version of the statistical theory-' gave poor results for the low-voltage mass spectra of n-parafflns. Consequently, in the present work, the improved expression for the rate constant given by Vestal et a y ' , lias been used: , _ _ „
i . /.. .\ T rT , -y N --+ I 'i
fei'j/ Q: L h}7+ • 2 J k(E) = } / - ^ . <*)
F-.
^ / N] ( T P r ^ i3"p p - i l
^ IP; (P-I)I[ hT7 ' ~ r j
where N is the number of oscillators In the decaying ion; i / and / / are the geometric mean frequencies of the normal ion and the transition complex; each term in the denominator (numerator) corresponds to a state of the normal ion (transition complex) in which P (Q) of the oscillators are excited and the remaining ones unexcited;
I/P
^ F .\K ^ '" >i ) \ (5)
i ^ 1 , ^ 1, ' " M ave the P excited oscillators, the bar indicates the arith-raean of all such possible terms, and a similar expression holds for ^ y ; and
where metic raeaii of all such po'ssible terras, and a sirailar expression holds for O ri^ each series terminates with the last positive term, or with K=N or L=N-1, whichever occurs first. Since Eq. (4) is so unwieldy, all the rate constants given in this paper have been evaluated with an IBM 7090 digital computer.
To evaluate rate constants, it is also necessary to specify frequency distributions for parent ions, decaying fragment ions, and the transition complexes of all reactions. An approximate frequency distribution for a CJJH2N+2 molecule-ion was obtained by generalizing the vibrational assignraents made by Herzberg for ethane and propane ^3, and is given in Table 11. For the transition complex of a primary reaction, this distribution was changed by deleting one C-C stretching mode (this corresponds to the reaction coordinate), and decreasing by a factor of ten each of: two C-C-C bending frequencies, four C-H stretching frequencies, four CH2 deformation frequencies, and four CH2 rocking frequencies. For fragment ions undergoing further dissociations, frequency distributions were obtained by simply choosing the appropriate number of each vibrational mode from Table II. These were then modified for the corresponding transition complexes in the sarae manner as described above for the priraary reactions. These assumptions are highly arbitrary and, therefore, the dissociation rate constants calculated here may be in considerable error; however, fragmentation patterns are determined by the relative rate constants of competing processes, and in this sense the results should be reasonable.
83

Table III.
COMPARISON OF RELATIVE ABUNDANCE CURVES FOR THREE n-PARAFFINS
Ionizing Voltage
Feature n-Decane n-Fentadecane n-Eicosane
C2H5 Appearance »- 17 volts -> 20 volts ^^24 volts
CjH^j+ Maximum 13 17 22
+ 18 27 32 C^Hg Maximum
CjH^* Plateau 28 46 >60
Table IV.
SOME OBSERVED METASTABLE PEAKS IN MASS SPECTRUM OF n-NONANE
* m
76.6
56.4
40.5
48.6
33.6
32.8
38.2
36.5
21.6
26.1
24.5
29.5
15.3
CgH^o*
S"20+
^9"20"^
S"l4^
C7H13+
S»15^
'=6"l3^
S»14-
C6"l3+
S"ll*
S»12^
C^H,^
C/,H +
Dissociation
(128) — » CjH^3+
(128) — * CjH^3+
(128)
(98)
(97)
(99)
(85)
(86)
(85)
(71)
(72)
(57)
(55)
'-*S"l2^
- ^ S"9"
— > C^H9+
- > C^H,+
—• "^y — > C^H3+
- ^ C3H7+
- ^ S » 7 *
- ^ S«6-'
—*S»5"'
—>'C,H +
(99)
(85)
(72)
(69)
(57)
(57)
(57)
(56)
( 3)
(43)
(42)
(41)
(29)
+ C2H3
+ S»7
+ C4H8
+ S«5
+ C3H4
+ C3H,
+ C2H^
+ S"6
+ C3H6
+ S»4
+ S"6
+ CH^
+ C,H,
84

Figures I and 2 show sorae rate constants calculated as a function of excess energy from Eq, (4) and the assumptions outlined above. In Fig, 1 are shown rate constants for the primary C-C bond scissions of the n-decane molecule-ion; each curve corresponds to a different activation energy. Fig. 2 gives rate constants for dissociation of a C-C bond in several different n-alkyl radical ions, in each case for ^ = 1.0 ev. The rate constants shown in the figures attain unreasonably high values, probably because of a poor choice of frequencies for the transition complexes. In the present work, the curves are not too important because the assumed raodel does not, in general differentiate the scission of various bonds in an ion, either in activation energies or in frequency distributions; in more refined treatments, their details will be much more iraportant.
3 The method of calculating breakdown curves is well-known, and therefore
is not repeated here; the procedure is laborious, but quite straightforward. In this work, an additional assumption has been made, viz,, that the fragraentation of any species is an all or nothing proposition. If the sum of the rate constants for all considered dissociations of an ion is less than 10 sec" , it was assumed that no fragmentation occurs. For rate constant sums greater than this value, fragmentation was assumed to be coraplete, with each of the possible fragments being obtained in proportion to the corresponding rate constant.
The breakdown curves calculated for n-decane are shown in Fig. 3, where every aspect of the postulated model is apparent. Analogous breakdown curves can be constructed for all n-paraffins. The essential features of all such curves are equivalent, and the only differences lie in the energies that are of interest. For example, in n-decane C3 ions predominate in the region of 4-5 ev. Calculations of n-eicosane show that about 10 ev is required for an equivalent result in that case. The greater energy spread for larger molecules is primarily caused by the fact that a greater number of consecutive reactions is required to cause the appearance of particular small fragment ions.
From the breakdown curves, denoted by f^(E)j the fractional abundance of each ion in a mass spectrura can be calculated by
0 0
^i = y ^i(^) p(E> dE (6>
where P(E), a normalized distribution of internal energies, is a function of the ionizing voltage, Chupka and Kaminsky " have recently measured the P(E) funcCions for propane and n-butane, but is not yet possible to generalize their results for larger inolecules.
Even without knowledge of the P(E) functions, though, the preceding considerations and results lead to a number of predictions regarding the mass spectra:
1. At low ionizing voltages, the mass spectra will be dorainated by C^ ions, where N/2 n N-2,
2. At all ionizing voltages, the sraaller ions in this range should be more abundant than the larger ones; i.e., F^_2 " N-3 " N-4 '"' ^N/2 > where F is as defined in Eq. (6) and the subscripts refer to carbon numbers,
3. Fragraent ions having N-1 carbon atoras should at all voltages constitute &. negligible part of the spectrura,
4. Regarding the energy dependence of the spectra, it is predicted that the larger the raolecule, the greater the ionizing voltage required before the pattern becomes independent of voltage,
5. The presence of numerous metastable ion peaks is predicted. For example, in n-decane, insofar as the activation energies and frequency distributions applicable to the primary formation of C^+, C7+, and CQ+ ions are equivalent as assuraed here, a metastable ion peak for each of these priraary reactions is expected.
85

— o UJ i n
•m
IS
s
22
20
18
16
14
12
10
8
6
—
- y y
— /yyyy
- / / / / / /
— l l l i l l
1 / / / / 1 1 ll
Eo.ev
y , 1 , 1
- 0 4 ^
1
0.5
: ^o .6_
= ;8 : ^8 -<0.9
^ \ a ~
—
—
1 1
22
20
IS
— 16
— 14
12
10
8
6
1.0 20 3.0 40 ENERGY (ev)
5.0 6.0
Figure 1. RJte const^nCs ca lcu la ted for priraary 6ioBoctat tous of a-d&caae., far several d i f fe rco t acc lva t lon energ ies .
o bJ OT ^ O O _1
22
18
14
10
6
—
-
—
—
_
—
1
C j i ^ -
yyy^ y y ^ ///y
/ / / Wl 1
I \ l / I l l l l
2.0 4.0 ENERGY (ev)
! 2. Rate conBCante ca lcu la ted for d i s soc i a t i on of several d j l t u rcn t n-alkyl ions , with an accivat jon energy of I.Oev,
86

As
III. COMPARISON WITH EXPERIMENT
In the present work, two types of experimental data were examined. These are (a) the variation of mass spectra with Ionizing voltage and (b) the occurrence of raetastable ion peaks. All of the data presented here were obtained with Consolidated Electrodynamics Corporation 21-103 standard mass spectrometers.
A. Patterns
The fragmentation patterns of n-decane, n-pentadecane, and n-eicosane were studied as a function of ionizing voltage, frora below the initial onset of ionization up to seventy volts. Some of the data are given in Figs. 4, 5, and 6, where the relative abundances of typical ions (given as per cent of the total observed ion current) are plotted against the ionizing voltage. Throughout the entire voltage range, the relative abundances of different classes of ions are much the same as at seventy volts • The C.J H2Y +I ions are always most abundant, but the general behavior is similar for all ions of the same carbon number. Where some carbon numbers have been left off the figures entirely, the curve shapes of the omitted ions do show continuous gradations between the curves that are plotted.
It seems to be a general result that in the spectrum of Cj4H2i^2^ ^ ^ curves for C ions can be divided into two classes, depending on whether n is greater or less than N/2. When n > N/2, the relative abundance begins at a raaxiraal value, but decreases rapidly as the ionizing voltage is increased. When n < N/2, the curves begin at rainimal values, pass through maxima, and attain plateaus. For smaller values of n, the maxima become broader and shift toward higher voltages, until finally, for C , Co^t and C3''', the curves do not pass through maxima but just increase over the entire voltage range.
In terms of the postulated raodel, the gradual changes noted in the curve shapes of Figs. 4-6 can be correlated with the numbers of consecutive dissociations needed to form each species and the nuraber of different paths that result in it. A regards the specific predictions listed at the end of the preceding section, each one may be examined in turn:
1. The first prediction is borne out. The data obtained at very low ionizing voltages are inaccurate, but the curves extrapolate in such a manner that at the onset, the spectra are dorainated by ions in the range N/2 X n . N-2,
2. It is obvious that the second expectation is fulfilled.
3, The third prediction is also accurate, as the C|,_i ions never account for more than a few hundredths of a per cent of the total ion current.
4, Table III contains a coraparison of the curves for several specific fragment ions in Figs. 4-6, Clearly, prediction (4) holds true also,
B. Metastables
When an ion of raass mn dissociates to yield an ion of raass m-j, and the rate constant is in the range of 10° sec"^, a 'Metastable ion peak" is often observed in the spectrura at an apparent mass value of
2 m* = m2 /m-j . (7)
4 Bloom and coworkers have already listed numerous observable metastables
in the mass spectra of n-paraffins. In the present work, in addition to observing tbe m* values, attempts were made to measure the ratio ra„/m , as well, by using a metastable suppressor as a retarding device; this experiment is sirailar to sorae raeasureraents described by Hippie £t al^^. Since the available instruraent with a heated inlet systera does not contain a metastable suppressor, no compounds larger than n-decane have yet been studied. The results obtained for n-nonane and n-decane are shown in Tables IV and V, respectively. In general, the observations and results are the sarae as those reported by Bloom et al; however, the metastables corresponding to loss of hydrogen alone are not shown in the tables because these reactions are not considered in the present work.
Every assignment made in Tables IV and V corresponds to the loss of a neutral fragment which contains at raost half the total nuraber of carbon atoms in the decaying species. This is clearly not in disagreement with the reactions postulated in the assuraed model and employed in the sample calculations. It is equally clear, though,
87

SOME
m*
8 9 . 9
70 .4
63 .4
61 .6
44 .7
50 .4
4 8 . 6
33 .6
32 .8
38 .3
36 .5
2 1 . 8
26 .0
24 .5
29 .5
27.7
15.3
Tabl. e V.
OBSERVED METASTABLE PEAKS SPECTRUM OF n-DECANE
C^QH22
C^gH22
C H + 8 18
C H + 8 16
C H + 8 17
'^7»16-'
C H + 7 14
S"l3^ C H +
7 15
^6«13^
'=6" l4"
C 6 " l 3 ^
S»ll*
'^5"l2'^
C 4 H /
C4H,+
C4H,+
D i s s o c i a t i o n
(142) > ^ ^ 8 " ^
( 1 4 2 ) — * C ^ H ^ ^
(114)
(112)
(113)
(100)
(98)
(97)
(99)
(85)
(86)
(85)
(71)
(72)
(57)
(55)
(55)
- > V l 3 "
-^%y - ^ S " i i ^
- ^ S " i i - '
-^sv - ^ cy - ^ %\^
- y — > '=4»8^
- ^ S"?""
-^sv —^ S"6^
—* S»5^
-*sV -^ sv
IN MASS
(113)
(loo;
(85)
(83)
(71)
(71)
(69)
(57)
(57)
(57)
(56)
(43)
(43)
(42)
(41)
(39)
(29)
1 + C2H5
1 + C3H,
^Vs +
+
+
+
+
+
+
+
+
+
+
+
+
+
'=2»5
S»6
S»5
S"5 C3H4
S"6
S»4
S"6
S"6
S"4
S»6
CH4
^"4
C2"2

that a metastable peak is not observed for every postulated reaction. One possible, reason for the absence of some expected metastables is that in the region of k " 10 sec~ , the rate constants vary extremely rapidly with the excess energy (see Figs, 1 and 2), It is quite possible that, for several competing reactions, extremely small differences in the activation energies and/or transition-complex frequency distributions would cause the relative yields in this energy range to be very unequal, while for larger energies, they would be essentially equal. Additional calculations must be made to confirm or deny this possibility,
IV. DISCUSSION
14 It has already been mentioned that Chupka and Kaminsky have experimentally
measured the P(E) functions Qsee Eq. (6)J for propane and n-butane molecule-ions. Since they found that these functions could be approximated on the basis of simple molecular orbital treatments, it is instructive to consider the required P(E) functions for sorae larger molecules.
In the seventy-volt spectrum of n-decane, the experimental yields of Cg, Cy, ^6* C3, C^, and C3 ions are in the ratios^ of 0,051:0,091:0,266:0,407:1.0:1.55. On comparing these numbers with the breakdown curves of Fig, 3, it is seen that the energy distribution function is required to have a maximum in the region of 3-4 ev, and also it must decrease quite rapidly at both higher and lower energies. In the case of n-eicosane, it is estimated that the corresponding maximum raust occur in the region of 10 ev.
The molecular orbitals employed by Chupka and Kaminsky were linear combinations of equivalent bond orbitals, as originally derived by Lennard-Jones and Hall, It is recalled that the latter authors made several attempts to calculate the ionization potentials of n-paraffins, and found it was impossible to decide whether the first ionization occurs frora a "symmetric" or an "antisymmetric" molecular orbital-'-""-*-". Whichever was assumed to be the case, it was possible to evaluate certain of the equivalent orbital interaction parameters by fitting a set of observed ionization potentials; however, an additional number of pararaeters were completely undetermined. One set of molecular orbital energy levels can be calculated from the determined parameters, but the other energy levels are not known.
In Figs, 7 and 8 are shown the energy levels calculated according to the two alternative assumptions for n-butane, n-decane, and n-eicosane ions. Fig. 7 is based on the assumption that the lowest ionization potential is for a symraetric molecular orbital, and Fig, 8 corresponds to the other case. In both figures, the energies shown are those above the minimum ionization potential, and the height of each line is proportional to the effective degeneracy of the energy level. In the former case, the quantity (a-b) is undetermined. The value indicated for it is a raaxiraura, and the energies of the antisyrametric molecular orbitals are shown as degenerate on the figure. When the other assumption is made, both (a+b) and c, are unknown. The value shown for (a+b) is a rainimum value, and that of c is the one found raost appropriate for propane and butane by Chupka and Kaminsky, Here, the undetermined energy levels are shown as two groups of degenerate ones centered at (a+b) and c. In both figures, the quantity X is undetermined; it is responsible for two states that are neglected in the equivalenC orbital treatment; and again, the value shown for it is that recomraended by Chupka and Kaminsky. In both cases, the values used for the "known" pararaeters are the same ones found appropriate by Lennard-Jones and Hall, and employed by Chupka and Kaminsky,
It is tempting to try to relate the requisite maxima in the P(E) functions to the high level density evident for the symmetric molecular orbitals in Fig, 7, However, neither Fig, 7 nor Fig, 8 provides an energy level distribution that is compatible with the required P(E) functions for decane and eicosane. If a choice must be made between the "symraetric" and "antisyrametric" assuraptions, the latter raust be preferred in the present case. It is quite possible here that the undeterrained energies of the syrametric raolecular orbitals could bunch together at an energy considerably higher than the 1,6-1.7 ev obtained in Fig, 7, Thus, the situation for n-decane looks very reasonable. On the ocher hand, this high level density will definitely not shift from 3-4 ev in decane to 10 ev in n-eicosane.
89

< z o
o < cr
0.6
0.4
0.2
0 2.0 4.0 6.0 EXCESS ENERGY (ev)
Figure 3. Breakdown curves calculamd for n-decane.
20 30
lONIZINO VOLTAGE(UNCORRECTED)
Figure 4. Typical daca showing the variation of the fragmeotatlon pattern ulch ionizing voltage for n-decane.
90

10 20 30 40 IONIZING VOLTAGE (UNCORRECTED)
Figure 5. Typical data showing the variation of the fragmentation pattei with Ionizing volcage for n-pencadecane.
< M Z o
o
o Q:
Q.
20
15
10
5
U
-
-
— J
- V
y
y-/
^ _ /
;><sS?S^
/ ^
. ^ X ' ^ s ' ^ i i *
/ ^
"^11*^23*
• 1 1
^ - 0 4 » B *
^ Z ^ 7 ^ ^
_^^C7H|5*
^ ^ 5 *
1 1 10 20 30 40 50
IONIZING VOLTAGE (UNCORRECTED) 60
Figure 6. Typical daca showing the variat ion of che fragmentation pattern with ionizing voltage for n-eicosane.
91

.—.
.o + »
o
i i j "Z < to o o LU
1
z
X —
^ • ^
. 0
I I 0 -
i i i
< f ) UJ 0
1
z
x - =
1
iL z < 1-3 m 1
z —
2
It _
0 —
X —
-
- to
- 10
- ^ >
10 > e> a: UJ
evi z Ul
.3 Zi.
— o
UJ
<
8 0 UJ
1
x-=
?l ~1 0
UJ z < 0 UJ 0
1
x-«=
1 '
3
Ul
1 OQ
1 Z
*
x~-
3 = 1 \ 0
-
-
(O
^ a>
> - l l Q : - S Ul o-Sj
•^ UJ s e .
« u e
H ci.-a
— O
92

Some of the possible reasons for the discrepancies found here are: (a) the Lennard-Jones and Hall energy levels are not appropriate; (b) the activation energies employed in the calculations are too high; and (c) the whole model applied here is in error. None of these possibilities can presently be singled out as the correct one.
2 Another difficulty arises when one considers the data of Beynon £t al on
C -labeled raolecules. Inasmuch as nothing was said to the contrary, it was tacitly assumed in the above treatment that during each dissociation an ion raay lose a neutral fragment from either of its ends with equal facility. However, such a picture is not capable of explaining the results of Beynon et_ , Although it presently appears that agreement can be obtained by slightly modifying the model, this problem will not be considered in detail at this tirae.
Future work tp either confirm or deny the appropriateness of the model suggested here must include: further experiraental and computational study of metastable peak intensities; experimental determinations of internal energy distributions in larger molecules; and inclusion of rearrangement processes in the calculations. Based on the necessarily qualitative considerations given in this paper, it can be concluded that the proposed model is reasonable in many respects. It is at least clear that the statistical theory is capable of interpreting the raass spectra of n-paraffins.
V. ACKNOWLEDGMENTS
The author is grateful to Dr. N. D. Coggeshall for numerous discussions, to Mr. J. p. Klems and Mr. H. T. Best for their experimental assistance, and to Professor A. L. Wahrhaftig for sending a preprint.
REFERENCES
D. Coggeshall, J. CHEM. PHYS. 33, 1247 (1960). H. Beynon, R. A. Saunders, A. Topham, and A. E. Williams, J. PHYS. CHEM. 65, 114 (1961).
M. Rosenstock, M. B. Wallenstein, A. L. Wahrhaftig, and H. Eyring, PROC. NATL. ACAD. SCI. U.S. 38, 667 (1952).
G. Bloom, F. L. Mohler, J. H. Lengel, and C. E. Wise, J. RES. NATL. BUR. STDS. 40, 437 (1948); E. G. Bloom, F. L. Mohler, C. E. Wise, and E. J. Wells, ibid. 43, 65 (1949).
D. Brown, J. CHEM. SOC. 1953, 2615. L. Cottrell, The Strengths of Chemical Bonds (Academic Press, Inc., New York, 19 54). E. Honig, J. CHEM. PHYS. 16, 105 (1948). J. Clancy and G. F. Crable, Personal communication. P. Stevenson, DISC. FARADAY SOC. J^, 35 (1951); TRANS. FARADAY SOC. 49, 867 (1953). Steiner, C. F. Glese, and M. G. Inghram, J. CHEM. PHYS. 34, 189 (1961). C. Schug and N. D. Coggeshall, J. CHEM. PHYS. 35, 1146 (1961). Vestal, A. L. Wahrhaftig, and W. H. Johnston, Paper No. 19 at the meeting of ASTM E-14, Mass SpecCrometry, at Chicago, 111. (June 1961).
13. G. Herzberg, Infra-red and Raman Spectra (D. VanNostrand Book Co., New York, 1945), pp. 344, 361.
A. Chupka and M. Kaminsky, J. CHEM. PHYS. 35, 1991 (1961). A. Hippie, R. E. Fox, and E. W. Condon, PHYS. REV. 69, 347 (1946). G. Hall, PROC. ROY. SOC. (London) A205, 541 (1951). Lennard-Jones and G. G. Hall, TRANS. FARADAY SOC. 48, 581 (1952). G. Hall, TRANS. FARADAY SOC. 50, 319 (1954).
1. 2 .
3 .
4 .
5 . 6 .
7 . 8 . 9 .
10. 1 1 . 12.
N J
H
E
R, T,
R, D, D,
B. J, M.
14. 15. 15 . 17. 18.
W J G J G
93

APPLICATION OF THE IMPROVED QUASI-EQUILIBRIUM
THEORY TO PROPANE^^'
Marvin L. Vestal Austin L. Wahrhaftig
Wm. H. Johnston
(2)
We have recent ly completed some extensive calculations on the unimolecular decomposit ion of propane . These calculations were based on the quas i -equ i l ib r ium theory originally developed by Rosenstock, et al (1) but used the improved method for counting the s ta tes of a collection of harmonic osc i l l a to rs which we p resen ted at the E-14 Comnnittee Meeting las t year in Chicago {Z, 3). The calculat ions were done on the IBM 7090 at Wr igh t -Pa t t e r son AFB. We wish to e x p r e s s our apprecia t ion to the Air Fo rce Aeronaut ical Resea rch Laboratory for support of this work and to Dr, Jean Fu t r e l l for his a s s i s t ance in running the computor calcula t ions .
The ra te equation derived in the original development of the quasi-equi l ibr ium. theory using the c lass ica l approximation, is given by
k ( E ) - i E-£, N-1 (1)
where E is the total energy in the molecule ion, Cpthe activation energy, N the number of osc i l l a to r s , and i t the frequency factor . Since the original development of this ra te equation, a number of invest igators have found ser ious quantitative d i sag reemen t be tween the predictioji of the theory, using equation (1), and exper iment . We recent ly developed a more accura te method for enumerat ing the s ta tes of a collection of non- identical harmonic osc i l l a to r s , which when used in the quas i -equ i l ib r ium theory, r e su l t s in equation (2) as the ra te express ion .
Z N - 1
0 u'^^-'-y &(?
(rp = TI JLJL V-i V;
• ^ ? / P vy^ 1'
(2)
and N a re the same as before and i* is the geometr ic mean frequency, ^ p , Here E.G., a dim.ensionless factor of o rder unity, is the rat io of the mean frequency to the a r i t h met ic mean of the products of the r ec ip roca l s of the molecula r f requencies taken P at a t ime . The daggers {\) denote s imi la r quanti t ies for the act ivated complex configuration.
F o r these calculations we have considered act ivated complex configuration in which some of the degrees of f reedom a re r ep resen ted as free r o t o r s . Fo r these c a s e s , the improved ra te express ion takes the form
(1) Work per formed at the William H. Johnston Labora to r i e s , I n c . , Ba l t imore , Md. , and was supported by U. S. Air F o r c e Contract AF 33(6 16)-7638.
(2) Universi ty of Utah and William H. Johnston Labora to r i e s , Inc,
94

T A B L E I . A C T I V A T I O N E N E R G I E S
R e a c t i o n o A A . P .
C3H8 + > C2H5+ 0 . 7 9
CjH8+ > c y 0 . 5 8
CjHs' ' ' > n - C j H , 1. 34
C3H8+ > S-C3H7+ 0 . 5 2
C3H8+ > C3H6+ 0 . 6 0
C2H5+ > C2H3+ 3 . 5
C 2 H / > CjHj'*' 3 . 3
CaH,"*" > C^Us^ 2 . 7
c y > C J H / 4 . 0
CjHs"^ > C3H3+ 6. 0
1.0 +
0.5 t
1.4 t
0 .5 t
i . o t
4 . 0 t
3.3 t
2 .8 +
3.6 1
. 3
. 3
. 2
. 2
. 2
. 4
. 4
. 3
. 3
C3H8+ > C2H5+ > C2H3+ (1)
> C2H4+ > C2H2+ (2)
> n-C3H7+ > C3H5+ > C3H3+ (3)
— ^ > s - C 3 H 7 + > C3H5+ >C3H3+ (4)
> C3H6+ > C3H4+ (5)
F i g u r e 1. S i m p l i f i e d R e a c t i o n S c h e m e U s e d F o r P r o p a n e
C a l c u l a t i o n .
95

K(E)^ V
y y
B ^
Q--\
z •Q ) r ( o 4 y ^ ' '
^ ' ' ^
yy ^ ^yy\ ^ ^ p Lk? M'"'
(3)
where L total numb constant.
^ is the number of free ro to r s in the act ivated complex configui nber of degrees of f reedom, and B is the geometr ic mean rotati
rat ion, N is the onal energy
Fo r applying the theory to subsequent fragmentat ion of the p r i m a r y ionic f ragments , it is n e c e s s a r y to consider the distr ibution of the initial excitation energy be tween charged and neutra l f ragments . If we a s sume that al l s ta tes within an energy shell between E and E + dE a r e equally probable , than the probabil i ty that sufficient energy is contained in the charged fragment for the secondary fragmentat ion to occur is given by
' - ^ ^ (4, P ( E )
J. o fi, i ^ )P , ( E - e r £ ) d e
where E is the total excitation of the paren t molecule- ion, fi^, is the activation energy for the p r i m a r y react ion, £ j , is the minimum energy requi red in the charged fragment for the secondary react ion to be observable./'j^(,Ej d € is the number of s ta tes of the charged fragment with energy between £ and £ + dE, and/° 2 (€ )dE is the co r responding number of s ta tes for the neutra l f ragment . The minimum energy 6 2 f"' the seconda r y reac t ion to be observed is found by calculating the ra te for the react ion a s a function of energy using the improved ra te equation and finding the energy at which this ra te exceeds some selected minimum. For these calculat ions, we used lO' s e c " ' as the minimum observable r a t e .
In these calculations we have also considered the effects of the t empera tu re in the ion source on the fragmentat ion pa t te rn . In these calculations we have made the follo"WLng assumpt ions :
1. The internal energy of the molecule- ion is the sum of the internal t he rma l energy of the molecule and the energy added by the ionization p r o c e s s .
2. The probabil i ty of adding a given energy by the ionization p roces s is independent of the the rmal energy of the molecule .
This is equivalent to assuming that the ionization potential is uneffected by the t empera tu re of the molecule , and that the probabil i ty of forming an ion with l ess v i b r a tional excitation than the molecule from -which it was formed is ze ro . It is well-known that the situation is rea l ly much more complex than this and these assumpt ions a r e cer tainly not valid for e lec t ron energies near threshold .
The simplified react ion scheme used for these calculations is shown in F igure 1. This is essent ia l ly the same react ion scheme used in previous calculat ions on propane by Wahrhaftig and co -worke r s (4). The activation energies a s sumed for these reac t ions
96

I l l
z < a 0 (£ D.
0 u.
I D.
<
0 Q
< Ul
lie
o Ul < J y .a < V)
M
U.
30NVClNnSV 3AIXV-I3a
97

a re shown in Table I where they a r e compared with differences in appearance potentials as given in Fie ld and Frankl in (5). For all of the more abundant r eac t ions , the appea r ance potentials used a r e within the range of e r r o r of the exper imenta l values as de t e r mined from differences in appearance potent ia ls . The act ivated complex configurations used in the calculations were s imi la r to those used by Kropf, Eyr ing, Wahrhaftig, and Eyring (4) except that: no free rotat ions were a s sumed for the no rma l s ta te , two free rotat ions for the act ivated complexes leading to the formation of C2H5+ and n - C ^ i ' * ' , one free rotation for C2H4+, and none for S-C3H7+ and C3H6+.
The calculated breakdown graph for propane is shown in F igure 2. Here we have plotted calculated re la t ive abundance of the ions ve r su s internal energy in the paren t molecule ion. The r a the r long tai ls on some of the decaying fragment ions is a r e su l t of the fluctuation of energy between charged and neutra l f ragments . We a r e fortunate in having the breakdown curves of Chupka and Kaminsky (6) with which to compare these r e s u l t s . The exper imental measu remen t is slightly smea red as a r e su l t of the energy spread in the e lec t ron beam and the the rma l energy of the molecule . In o rde r to have a more d i rec t comparison of the calculated resu l t s with the exper imenta l cu rves , it is n e c e s s a r y to include these effects in the calculations by averaging the calculated curves over suitable energy d is t r ibut ions . F o r the e lectron energy distr ibution we a s sumed a 2500° K Boltzmann dis t r ibut ion. The effect of t empera tu re was included by averaging the calculated distr ibution over the internal t he rma l energy distr ibution for the m o l e cules at 600° K. The breakdown curves resul t ing from averaging over both the e lec t ron energy distr ibution and the internal t he rma l energy distr ibution a r e shown in F igure 3. At the top a r e Chupka and Kaminsky' s exper imental breakdown curves and at the bottom our calculated breakdown curves .
Overa l l the ag reement between the two resu l t s is quite acceptable . Small d i s c repanc ies , such as the lower abundance of C2H2'*" ion in the calculat ions , probably resu l t f rom the use of the simplified react ion scheme.
One difference which appears significant, however, is the ra the r long tail on the parent ion curve in the exper imenta l r esu l t . There seems to be no way to account for this tail on the bas i s of d i rec t ionization and complete energy randomizat ion. Thus , i t appear s that this d iscrepancy may indicate e i ther autoionization, in which case the second derivat ive curve would be dis tor ted due to a different threshold law for this p r o c e s s , or it may indicate incomplete vibrat ional energy randomizat ion in which case all of the energy is not available to the fragmentation p r o c e s s . This point should be investigated fur ther .
Calculations on the var ia t ion of the propane m a s s spec t rum with e lec t ron energy and with t empe ra tu r e have a lso been completed. The r e su l t s of these calculat ions to gether with a more detailed discuss ion of the methods employed will be published e l s e where .
REFERENCES
1. Rosenstock, Wallenstein, Wahrhaftig, and Eyring, P r o c . Nat. Acad. Sci. U. 5. 38, 667 (1952).
2. Vestal , WahrhzLftig, and Johnston, "An Improved Integral Approximation in the Quas i -Equi l ibr ium Theory of Mass Spectra" , p resen ted at the ninth annual meet ing of the ASTM Committee E-14 on Mass Spec t romet ry , June 6, 1961.
3. Wahrhaftig, Vestal , and Johnston, "The Application of the Improved In tegra l A p proximat ion to the Quas i -Equi l ibr ium Theory of Mass Spect ra" , p resen ted at ninth annual meet ing of the ASTM Con^imittee E-14 on Mass Spec t romet ry , June 6, 1961.
4. Kropf, Eyr ing, Wahrhaftig, and Eyring, J . Chem. Phys . 32, 149(1960).
5. Field and Frankl in , Electron Impact Phenomena, Academic P r e s s , New York, 1957.
6. Chupka and Kaminsky, J . Chem. Phys . 35, 1991(1961).
98

IOO EX.PER1MENTAL
(CHUPKA* K A M I N S K Y )
5 " s
2 3 4- 5 S 7 I N T E K M A U EMEK&YCev)
F i q . 3 COMPARISON OF EXPEKIMEMTAL AND CALCULATED PROPAME BKEAKDONA/N Q K A P H S .
99

STUDIES OF METASTABLE ION TRANSITIONS WITH A 180° MASS SPECTROMETER
Norman D, Coggeshall Gulf Research & Development Co,
Pittsburgh 30^ Pa,
Abstract
The decay of metastable Ions through transitions giving an ionized fragment and a neutral radical has been investigated with a 180° raass spectroraeter. Four aspects of the main problem have been studied. These are: a) the decay of metastable ions within the ion source to produce a continuous distribution of "raetastable ions" ; b) an examination of the mathematical conditions relating dissociation beyond the ion source exit slit to the formation of a "raetastable" peak, to the shape of such a peakj to the cut-off imposed by the analyzer walls and to the length of travel during which detectable dissociation may occur; c) an examination of the conditions for determining lifetimes with a 180° instruraent and d) a consideration of the elements leading to the broadness of raetastable peaks.
The distribution function resulting from dissociation within the source drops very rapidly and is ordinarily hidden within the peak due to the daughter ion. The forraation of a metastable peak in a 180° instruraent results from a low-order dependence of where the ion fragment resulting from dissociation hits the focal plane on the position of dissociation beyond the exit slit. The cut-off raass due to ions striking the walls of the analyzer tube may be readily calculated. In a CEC Model 21-103 instrument there is adequate distance of free travel beyond the exit slit to allow the instrument to be used for lifetime measureraents. Using repeller voltages up to 120 volts, shorter lifetimes than those previously reported have been observed. For the m* = 31,9 raetastable peak frora n-butane, for example, there is evidence that the raetastable ions are created in at least three classes, each with its own lifetirae. The shortest lifetime observed was of the order of 9 X 10"° second. Evidence has been obtained to indicate that the broadness of the observed metastable peaks is probably the result of the perturbation of focussing conditions by the increased angular spread in the ion beara.
Introduction
The existence and interpretation of ions arising frora the dissociation of metastable ions are of great importance in constructing a theory of raass spectra. The present report gives some results from a quantitative examination of raetastable transition ions as observed in a 180° mass spectrometer. The ions resulting from the dissociation of metastable ions are usually observed at non-integral mass units. For simplicity these peaks will be referred to as raetastable ion peaks and the mass in each case will be referred to as the raetastable raass. The relationship between the raetastable mass, the mass of the raetastable ion from which it originates, and the mass of the dissociation fragment bearing the charge was first given by Hippie and Condon .
Unless otherwise stated, all data exarained were deterrained with Consolidated Electrodynamics Corporation Model No. 180° mass spectrometers, equipped with Isatron ion sources. In sorae cases, a metastable suppressor was used. Slit widths and electrode separations utilized were those normally used and recommended by the manufacturer.
Dissociation of Metastable Ions Within the Ion Source
Let us denote by UQ the total nuraber of Ions of mass ra created per unit area in the electron beam. We shall assume that a fraction of these are created in a metastable state with a decay constant ^ . We denote by ran the mass of the charged fragraent resulting frora dissociation. The apparent raass possessed by these ions when collected at the detector, otherwise referred to as the raetastable raass, is denoted by ra*. The geometry and symbols used for the ion source are given in Fig, 1. Here, the electron beam passes through the ionization region approximately one-half way between the repeller and the first slit. Ions will reach the first slit at a time ti after being forraed and with a potential of Vi, Ions will reach the second slit a time t j after passing through the first slit and with a total potential of V = V., + V-.
J. A, Hippie and E, U. Condon, Phys. Rev, 68, 54 (1945),
100

FIG. 2. Geometrical conditions required for a fragraent lon to be collected at the detector.
REPELLER ELECTRODE
ELECTRON BEAM
Ist SLIT
2nd SLIT
FIG. 1. Schematic ion source geometry and symbols.
101

The focussing conditions in a 180° instrument are given by
mV = r^eH^/(2c ) (1)
where r is the radius of curvature in cm., e is the charge of the electron in e.s.u., H is the raagnetic field in gauss, and c is the velocity of light in cm./sec. The potentials used in Eq. (1) must be in e.s.u. The apparent raass of a metastable ion is calculated by inserting in Eq. (1) the value of V at which it is observed and calculating for m*.
Metastable ions which dissociate immediately upon creation will yield norraal ions of raass mi, Metastable ions which dissociate at the exit slit will yield ions of the usual apparent raass m* given by
2 ra* = raj^ /m (2)
Metastable ions dissociating between the plane of the electron beam and the exit slit will appear at apparent masses lying between ra^^ and the ra* of Eq. (2). It is the purpose of this section to derive the distribution function for these metastable ions as a function of m*.
Let us consider a raetastable ion created at t=o in Che electron beam. Let us further consider the case wherein this ion dissociates at a tirae t before the ion has passed out of the source. The mi ion emerging frora the exit slit will have an equivalent potential Vg which will be less than the instrument potential V = Vj + V2. When Vg is equal to the potential which normally focusses normal ions of raass m]^, the mi lon resulting from dissociation of a raetastable ion will be collected and will have an apparent mass m* derived from Eq. (1). As will be seen later, we raay calculate Vg as a function of t and invert the function to evaluate t in terras of Vg. This, in turn, may be transformed to provide t as a function of ra*, i.e., t = t (ra*) ,
The number of metastable ions which dissociate in the interval between t and t + .<: t and which can be collected by the detector will be given by
f (m*)dra* = A Aan^e dt (3)
where f(m*) is the intensity distribution function for the nuraber of ions frora metastable transitions as a function of m*, and A is a collection and transmission factor which relates the nuraber of ions issuing from the exit slit to the internal geometry and discrimination of the source.
Using t = t(m*) we transform Eq. (3) to
V - /I t (m*) dt f (m*)dm* = ^ Aan e -j—^ dm*
from which we raay e x p r e s s f(m*) as
f(m*) = - - ^ Aan_,e dm* °
• y ) t ( m * ) (4)
The exact evaluation of t(m*) for a 180° instrument would be based on the equations of cycloidal motion. However, for the sake of tractability we shall ignore the raagnetic field. For large values of V-, (one-half the repeller voltage) this will be a good approximation, whereas for low values of Vj^, it will be very poor. We shall also assurae uniform electric fields between the repeller electrode and the first slit and between the first and second slits. This ignores the field penetration through the first slit but it would be impossible Co accounC for it in a simple analytical CreaCraent. The above approximations dictate that numerical results calculated from the following treatment should only be used to establish che qualitaCive and semi-quantitative nature of the behavior.
Let us first consider a metastable ion which dissociates before the first slit at time t (o < t < tj ) where t. is the time iC Cakes an ion of mass m Co reach Che first slit. We shall use the common operating conditions such that Vn/V2 is constant so that Vj = d-jV and V2 = d2V, d + d2 = 1. Applying the equations of motion to a charge particle in a uniform field, we find
^N. D. Coggeshall, Phys. Rev. 70, 270 (1946).
102

C tl
1H9I3H )IV3d 3nSVJ.SV13M
103

j / m-m ^ \ e dl 22 V. VL^=,Jv-f^2) Uli, v tH (5)
where v(2) is the velocity of the charged fragment resulting from the dissociation as it emerges from the second slit. If this lon is collected at the detector, it will appear at a mass m calculated from Eq. (1) by inserting the total instrument accelerating voltage V. We may use this with Eq. (1) to get
u2 2 H er
2c^
"1 / ™iv (2) \
7 i ~l / (6)
2 2 This allows us to replace the ra-,^ (2)/2 term and the V and V terms in Eq. (5) as functions of m*. When this is done and the resulting equation solved for c, we get
2 2 2 where a, = H er /2c and a^
We raay evaluate ti as
Y (m-im*-m ) /a-|a2m-i di \
1/2
(7)
t ^ = d
When this is inserted in Eq. (7), we may solve for the m* (1) which applies to ions dissociating at the first slit. This is given by
m*(l) = m, < 1 -( i I d, ^ (8)
Ce f(m*) betwee
<(mim*-m* )/a,a^midi r
Utilizing Eq. (4), we raay then evaluate f (m*) between m-. and m* (1) as
1/2
f (m*) = Aan„ - ^ ^^^ ' ^ ./(m, m*-m*'')/a^ a,m, d, ' \ (9)
For the evaluation of f(m*) corresponding to the dissociation time occurring between ty and t] + t y , let us denote t' = t - t . When this is done, we find for o < t < t that
m2^v2(2) mj eV^ + eV2 - eV2 z'm-mj \ J v(l) t
2 ra" ~^ y_ ra y \ (10)
where v(l) is the velocity of the undissociated metastable ion as it passes through the first slit. We may proceed through the same type steps as used above to transform Eq. (5) to derive an expression relating ra* and t. This is
— = J a, - — - act^ - a<rt sj~m* + a ra* C (11)
"l I ^ JUT* ) where ao, a^, ac, a^ and ay are consCants which may be evaluated in terms of m, mi, d, s, d-j , d2, a, and a2, Eq. (11) is quadratic in t so ChaC iC may be solved explicitly in terms of m* to obtain the t(ra*) function to use in Eq. (4). Using this and Eq. (9), che corapleCe f (m*) funcCion may be evaluaced for the distribution between m,- and m^/m, of the ions resulting from dissociaCion within the source.
The f(m*) funcCion discussed above drops very rapidly In progressing frora mi to lower raasses. When observable at all it Is In the forra of an asyraraetrlc tailing on the low mass side of che normal fragmenC peak. This tailing is normally not seen in the peaks from CEC Model 21 Instruments used without metastable suppressors. In these the lon source dimensions and normally used values of the di/d2 ratio favor a very sharp drop of the f(ra*) function. However, the ion source geometry and d,/d^ ratios effective in Che secCor Cype instrument, employed by Hippie, Fox and Condon^, favor a less steep descent of f(ra*) and the low mass asymmetric tailing raay be observed in Figs. 1 and 8 of their article.
J. A. Hippie, R. E. Fox and E, U. Condon, Phys. Rev. 69, 347 (1946),
104

2.5
3.0
3.S
K AO o o
4.5
o
\
\ o
o
5.0
5.5
6.0 0.3
n-BUTANE, ni*-3l.9 C4Hi(5e) —C5HJ(43)+CH3(I5)
'^.
-o—o—, O o-
1.0 1.5 2.0 2.5 3.0
2.5
3.0
3.5
o -I 4.5
5.0 —
5.5
6.0
t
0.3 0.5
Data used Co deterralne the lifetimes for the metastable ion transition giving ra* = 31.9 for n-butane.
n-BUTANE ni*-30.4 C4H,o* ( 5 8 ) — C 3 H J ( 4 2 ) + C H 4 ( I 6 )
*o.^ O
"V3
- O - O - o o o -
1.0 1.5 2.0 2.5 3.0 • i - l - t j IN MICRO SECONDS
FIC. 6. Data used to determine the lifetimes for the metastable ion transition giving m* = 30.A for n-butane.
105

The reason f(m*) drops so fast is that the raetastable ion spends most of its residence time in the ion source in the initial stages of its acceleration and, hence, most of the fragment ions from dissociation of raetastable ions in the source will have m* values so close to mj that their contribution cannot be detected. The f(m*) function cannot be graphically displayed without an arbitrary normalization at some mass value lower than ra,. This is because the f(m*) function possesses a singularity at m* = mj . To appreciate how the raajor contribution from f (ra*) is hidden within the experiraental peak width of the m. peak, let us consider
C H •*" (58) > CjHy"'' (43) -H 15; m* = 31.9 where m* designates the normally observed
metastable peak mass. We use the representative operating conditions of V = 1610 volts, V, = 2 volts. For these conditions t. = 1.01 x 10"° seconds and t, -H t, = 1.17 X 10"° seconds. Assuraing the raetastable ion to have a half life of 2 x 10"^ seconds, we find that 347. of the raetastable ions dissociate within the source but that 307. dissociate by the tirae they reach the first slit. Using the above relation for m*(l) we therefore find that of the total area under the f (ra*) curve, 887. of it lies within the extremely narrow mass interval (unobservable) between mi (43) and 0.99996 m^(43).
It would be of value to achieve experimental conditions such that the f (ra*) curve could be unambiguously recognized and measured on the low mass side of the raj^'*' peaks. This could provide further inforraatlon as to the approximate lifetimes of the metastable states dissociating to particular ions. We may obtain guidance on the physical conditions required by exaraining the above equations. Since the observations will be in the immediate neighborhood of m , we may express m* = ra^ - A m . . Ions dissociating as they pass through the first slit will give^i^m. (1) calculated from Eq. (8) as
^ m . (1) = m. d (m-m, )/m
The fraction of the total accelerating voltage, represented by dj , which operates
behind the first slit, may thus be adjusted to raake those ions dissaciating at the first slit appear at a^^ra, value outside the natural width of the ran"*" peak. If we neglect ^ m relative to m.^m,, we may simplify Eq. (7) to
The area under the f (m*) curve appearing between A m i ' and ^ m^" when both are sraaller than Am(l) but preferably lying outside the natural peak width will be
It
^ r a ^
y (12)
/f (m*)dm* = Aan^ /exp - ^ ([ /im^'/dj^ f^l^) - en.^ - ^ ( | .Am^'Vd^ ^1^2^(
t
iSira
This area will be increased by decreasing the numerical values of a^ and a2 which correspond to reducing the value of (H r ) and increasing the value of d (see Fig. 1), respectively. It should be remembered that the above derivations are based on the assumption of uniform electric fields, of no raagnetic field, and of no field penetration. The latter effect, particularly, will make the above relations useful only for qualitative guidance.
An experimental difficulty that may negate the effects of increasing d\ is the broadening of the raj^+ peak as the repeller voltage is increased. This may occur if the effect of increasing repeller voltage is to thicken the electron beara so that ions may be created at points of different potential. The raj^ peak raay also broaden due to changes in focus conditions. This broadening of the mj peak raay, therefore, completely obscure the f(ra*) contribution.
106

2.0
3.0
ISOPENTANE, m " - 2 9 . 5
C4H5(57)-*C3Hg(41) + CH4(I6)
4.0 \
19
o
o 6 o h
Q
5.0
6.0
O.S 1.0 1.5 2.0
t , -f t j IN MICRO SECONDS
FIG. 7. Data used to determine the lifetimes for the metastable ion transition giving m* = 29.5 for isopentane.
FIG. 8. Schematic diagram of the incremental velocity effect In metastable ion peak broadening.
2.5 3.0
107

Dissociation of Metastable Ions Beyond the Ion Source
Ion peaks resulting from the dissociation of metastable ions within the raagnetic analyzer region of a 180" Instrument would not appear if it were not for a fortuitous mathematical relationship. This is that the lateral displacement with which the fragraent ions strike the focal plane has a low order dependence upon the position at which the metastable ion dissociates for some distance beyond the exit slit. This is inherent in the derivation made by Hippie who showed that such a peak should be observed In a 180° instrument,
4 We may derive, in the same manner as Hippie , the f(m*) curve for ions
resulting from the dissociation of metastable ions past the exit slit in the same general procedure as before. We let t = o at the exit slit and derive t = t(ra*) for substitution in Eq. (4). Let us refer to Fig. 2 which refers to a 180** instruraent. Here, Si refers to the exit slit of the ion source and S2 refers to the entrance slic to the detector. Here, an m+ ion path has a radius R, the m-, fragmenC paCh has a radius r*, and r is the radius for the paths of ions normally focussed. From the geometry, we see that when a raetastable ion dissociates after traversing an angle 9, the conditions for the fragment to be collected dictate that:
r*2 ^ (Rr-r*)^ + (2r-R)^ + 2 (R-r*) (2r-R) cos G (13)
To s i m p l i f y t h i s we may use (from Eq. 1 ) :
2 2 mi V _ " V _ m*V _ H e „ ^ ,
*2 R2 r^ 2c2
Denoting m-ra, = A ra, this leads to;
cos e = (2 f^* s/T-2m* - A m ) (15)
(2 J-ffi* - J ' l h ) (z:im/Jm)
We may combine Eq, (15) with results from Eq. (14) to obtain
_^ 2 lAra* \/ra-2m* - A m t(ra*) = (rac/eH)cos~ ,„ t—r t—. .^ , —v (16) ^ ^ "• ' ^ (2Jra* -sj m) ( ^ m f yf m)
Using various results from above we, therefore, have for the distribution function of apparent metastable mass:
f (m*) = Aan e' ^ ^ ^ ^ _d_exp - ^ mc cos / 2 NTrn* J m - 2m* - A m \ (17) ° dra* eH L (2^/m*V^/^''^)(^m/Jra)y
In Eq, (17) only the derivative portion of the right-hand side need be considered to define Che shape of f (m*) , This is plotted in Fig, 3 for two cases: for ( / \ mc/eK) = 0,666 and 0,504. These correspond to m"'"(58) dissociating to m"*'(43) + m(15) with half life of 1,5 X 10"° sec and an impressed magnetic field of 4600 gauss for the first case and with half life of 2,5 x 10"° sec and an impressed magnetic field of 3300 gauss for the second case. These curves were determined by machine calculation. The calculations thus predict a sharp asymmetric peak which tails off Cowards higher mass,
4 Hippie determined the same type of results to explain the existence of a
metastable peak in a 180** Instrument, He discussed Che effect of baffles, sometimes used in a 180° instrumenC, which would cut out those ions which are not displaced very far frora m, /m. In Che CEC insCrumenCs used here, Chere are no baffles beCween Che exit slit of the source and the detector silt. It is, therefore, possible to calculate at what mass there would be a cut-off due to the ions hitting the walls of the analyzed tube. When we examine in detail how this cut-off operates, we find it does so for the Ions resulting frora dissociation of metastables rather than on the metastable ions before dissociation.
4 J. A. Hippie, Phys. Rev. 71, 594 (1947).
108

Referring to Fig. 4, f is the radius of the outer inside wall of the analyzer tube and we consider a raetastable ion progressing on a circle of radius R until it dissociates at point A. Ordinarily, it would then progress in a circular path of radius r* unless it encounters interference from the wall. This first occurs for the fragment paths that tangentially encounter the wall. In the figure c is the center of the tube, d is the center of the circle of radius R and f is the center of the circle of radius r*i Interference occurs when the distance g between points c and f is such that
r* + g = f
We raay evaluate g frora the relation
g2 = (R-r*) 2 + (R-r) 2 - 2 (R-r*) (R-r) cos 6 (18)
Let us denote the r a t i o r / r as h. Then using the re la t ionships in Eq. (14) we transforra Eq. (18) to
(h sj ra*m-m, ., 2 ^_^ , 1_ = ( J - ^ . / l ^ ) ^ +^5L -2( J m- J ra*) ^"^ . cos 6 (1^)
ra m r~Tn
We may find the effective m* at which wall incerference occurs by inserting the appropriate value of h in Eq, (19) and find the proper values of m* and cos 6 from the use of Eq. (15). In our instruments h was approximately 1.1^. For the mass 58 ion from n-butane, for example, decaying through a raetastable transition to a mass 43 ion to give the mass 31.9 metastable peak, che predicted cut-off is calculated by the above procedure a s mass 32,23. This corresponds to a limiting 6 of 0.310 radians and an allowable travel distance in the analyzer tube of 3.94 cm. The quantities evaluated for this particular metasCable Cransitlon will, in general, not be exactly applicable to other transitions. However, they will serve adequate order-of-magnitude values.
The upper raass limit of Che 31.9 peak from n-butane was experimentally evaluated by extrapolating the high mass side of the peak to the base line. This gave an upper limit to the raetastable peak of 32.27 which is in good agreement with the value predicted above of 32,23,
Lifetirae Measurements wich 180° Instrument
We shall show here that lifetirae raeasureraents may be made with a 180° machine and we shall provide several examples.
LeC us assurae ChaC ions of mass m are formed in the electron beam at a density of no per unit area. Let us assume as in Eq, (3) Chat a fraction a of chem are in che metastable state at the instant of formation. The number of ions of apparent mass m* =
ra /m will be given by the following equation:
- A (t +c^) - A s/v I(m*) = anoA(Vi,V2,V)e 1 2 (i-e ) D^(V)Dg (20)
Here, A(Vj^,V2^V) represents a collection-transmission factor, dependent on the potentials, which relates the number of metastable ions which emerge from the exit slit, available for dissociaCion, to the number created per unit area in che electron beam. Here, s is che distance such ions may travel with velocity v in the analyzer tube before effective cutoff, D-.(V) is a discrimination function which raeasures the beara attenuation due to initial kinetic energy components parallel to the magnetic field". Dg is a discrimination function which measures the beam attenuation due to kinetic energy components which are imparted to the ions by the process of dissociation of metastable states. Sirailarly, the intensity of the m ion peak will be given by:
I(m) = (l-a)no A(V;L^V^,V') D^(v') ^21)
where V2 and V indicate the different volcages fo'r focussing the m ion Chan were used for Che m* ion. Here, we omit any conCribuCion due Co undissoclaCed meCasCable ions reaching che collector. This is due to the facts that with the accelerating voltages used and wlch Che analyzer radius used, the total transic Cime is of the order of Cen microseconds. This is adequate for essentially compleCe dissociaCion for lifetimes of the order of 10"" sec.
Private communication ftom Dr. C. E, Berry.
^C. E, Berry, Phys. Rev. 78, 597 (1950).
109

Let us denote the ratio of these peak intensities as R(Vj ) where
(ti+t,) R(V^) = I(m)/I(m*) = Be ^ "
where
(l-a)A(Vi,V2,v')Dv(v') ^^2)
^ ' y ^ v a(l-e )I\,(V)D^A(Vi,V2,V)
Consider a set of runs, using constant magnetic field, in each of which a different V^ is used. The total accelerating voltages for parent ions and fragraent ions from metastable transitions will always be the same and, hence, B will be essentially constant. All terms in B are constant under the conditions defined except the ratio A(V.,V2,V )/ A(Vi VjjV). This ratio is that of the collection-transmission factor for the undissociated ion for the values of V corresponding to m and m*. Since the collection-transmission value will depend primarily on Vj , which is the sarae in both terms of the ratio, we may treat the latter as constant. We raay, therefore, plot log R(V] ) versus t-| +t2 to obtain information on metastable lifetimes.
A number of such experiments have been run in our Laboratory and the results are plotted in Figures 5, 6, and 7. In these experiments, Vj (one-half of repeller voltage) values up to 60 volts were used to reduce the total residence tirae ^.^t.^ to the submicrosecond values seen. The metastable peak intensities were taken from the raaxiraa of the metastable peaks. With each successive increase of V., the electron voltage (nominally 70 volts) was decreased a corresponding amount so that the ionizing electron energy would be essentially constant for all points. Straight lines may be drawn through different segments of the curve with the immediate interpretation that the metastable ions are distributed in different species characterized by different lifetimes. An examination of Hippie's measurement of the half life for one of the metastable transitions for n-butane shows that the shorter half lives were not found then as the residence times achieved were not short enough.
It could be argued that the data presented represent a continuous distribution of half lives. However, the straight-line portions are rather distinct. There is some evidence in these data to indicate that shorter half lives than those observed would be found with a further reduction of residence time. In Table I are given the half lives as calculated from the straight-line portions.
TABLE I
METASTABLE TRANSITION HALF-LIFE VALUES
Corapound Transition Half-Life Values
n-butane C I ^ - ^ Q ( 5 8 )—>C,H,(43) + CH (15) 8.9 x 10'^ sec.
n-butane C^HJ^Q(58)—> C H^ (42) +CH^(16)
6.1 X 10'' sec. 2.7 X 10"° sec.
5.8 X 10⁻⁷ sec. 4.8 X 10⁻⁶ gee.
isopentane C,H^(57) — > C3H5(41) + CH^(16) 1.03 x 10^^ sec. 5.4 X 10⁻⁶ gee.
Considerations on Metastable Peak Shape
In many cases, the peaks resulting from a raetastable ion transition occur so close to the normal ion peaks that the complete peak shape cannot be observed. An example, however, where the metastable peak lies apart from neighboring peaks is the m* = 31.9 peak for n-butane. In exaraining such raetastable peaks it is seen that there is tailing on the high raass side as predicted in Fig. 3. However, the peaks do not rise abruptly on the low mass side as predicted by Fig. 3, but show a surprising amount of tailing towards lower mass (see Fig. 9).
110

IC is imporcanC to determine, if possible, che origin of the low mass tailing. LeC us first consider the effects of Che incremenCal velocity changes imparted to the fragment ion in the process of dis^ciation. We may consider two extremes: the one in vhich an increment of velocity ,*t/" is imparted perpendicular to che velocity <.-v" of the parent ion, and the other in which the increment is added to or subtracted frora the parent ion velocity. In Fig, 8 we have a diagram, with exaggerated conditions, which applies to the first case for an ion which dissociates just as it passes through the exit slit. Let us suppose that the angle between the new velocity after dissociation and the velocity before dissociation is 0, Then 0 -^^A^l / i r ,
For the purposes of chis calculation we may neglect the change of absolute value of velocity. Using the same absolute value of *'<'" we may determine the center of the orbit of fragment ion after dissociation. This will be swung out from the focal plane by a distance s. where 9 = s/r. This center will be shifted parallel to the focal plane and relative to the original center by a distance A r where 6 = Ar/s, This deflection of orbit is equivalent to an apparent change of mass by ^^m. To determine ^ira we use the relations above plus the relations
mV
I Am/ra|
l-^V j = 2VAr/r|
j>^v/v|
to obtain 1 ( Am/m) 1 = 2 ( A ^ c r / ^ 2
Dissociations with the incremental velocity change opposite to that shown will produce che same value of A m.
For dissociations wherein the incremenCal velocicy compleCely adds Co or subcracts from the original velocity, we may use
m/W ^ Her/c
I /^-trj = ^ \ Ar/r I
to obtain j A m/m I = I 2(A.-'V/-*/-)
Thus, we see that the spread of apparent mass due to velocity additions perpendicular Co the original velocity depends upon the square of the small quantity (A'^/'V)^ whereas, the apparent raass spread due to additions or subtractions of the velocity increraent to the original velocity depends upon the first power of (A-V/^V^^ Thus, if the broadening of the peak were due to velocity additions, it should be dominated by the latter type. However, this argument is based on the assumption that the perpendicular type of dissociations would not sufficiently alter the solid angle of che beam to disturb focussing conditions.
Let us assume, for che moment, that the broadening is due to dissociations of Che laCcer type, wherein there is numerical addition or subtraction of the energy of dissociation to the kinetic energy of the fragment ion. Since the processes that produce the metastable ions are the same, by the statistical theory of mass spectra, then we should observe the same kinetic energy spread or equivalently, mass spread, in che normal m """ ion peak,
A comparison was made between the observed ( A m/ra) for the m* = 31.9 and the m, = 43 peaks for n-butane under a number of operating conditions. The ( S ra/ra) values were obtained by making, for each run, a plot of m versus chart distance and determining the width of che base of each peak. The width of the metastable peak was deterrained in each case by linearly extrapolating the sides of the peak to the base line, as in Fig, 9, The results of these determinations are given in Table II,
111

TABLE II
(/^m/ra) Values for m* = 31.9 and ra, = 43 for n-butane
(V* refers to the accelerating voltage for m* and V
refers to the accelerating voltage for m. = 43)
Repeller
1/2'/. of V
30 30 30 30
(2Vi)
* or V
V*
7 37 1180
1505
1880
2260
2635 737 1180 1880 2635
( <a.m*/m*)
0.0256 0.0223 0.0200 0.0198 0.0181 0.0177 0.0278' 0.0202 0.0175 0.0173
V
547 875 1116 1387 1676 1955 547 875 1387 1955
(^ra^/rai)
0.0089 0.0049 0.0047 3 0.00393 0.00366 0.00340 0.01325 0.00612 0.00426 0.00367
(A m*/ra*)/(^mi/ra^)
2.88 4.55 4.23 4.00 4.95 5.21 2.10 3.30 4.11 4.72
Examination of the conditions applied in Table II show that the observations were taken across a wide range of accelerating voltages with both small and large repeller voltages, The results show chat the { j ^ ra/m) values decrease with increased accelerating voltage as expected but noc Co changes in repeller voltage. In all cases,- (^m/m) for m* is larger Chan (.^m/m) for m, whereas, the relation would be reversed if Che broadening were due only Co Che kineCic energy spread effecClve for Che m, peak.
LeC us assume that the dissociation of Che meCasCable ions Is of a differenC Cype than the one Chat produces the normal mi'*' ions and that an extra increment of kinetic energy A V* is imparted Co the fragment ions. Let A V be Che energy spread of the normal m-, ions and assume Chat Che energy spread of Che metasCable ions can be represented by A V + ^^V*. Th^n Then
I ( Z^m*/ra*) I (^ V + A V*)/V*
We may then derive the relation
I (Am*/m*)/( Am-j /m; ) j = A(ra*/m] ) + (ra*/mi) (AV*/^^V)
This predicts that the ratio (^^m*/m*)/(^k m,/m,) should remain constant with increasing accelerating volcage. We see in Table II thac rather than remain constant, the ratio changes by a factor of two over the range studied. We thus conclude that the abnormal broadening in the metastable peak is not due to an extra increment of energy A V * IraparCed Co the fragmenC Ions during dissociation. Since we find no basis for an explanation based on incremental kinetic energy change, we conclude chat the breadth of the raetastable peak results from the details of the focussing action and its dependence on angular scatCer, i.e., an insCrumenCal effecC.
In an earlier section it was shown that the raetastable transitions studied exhibiCed species of differenc llfeciraes. IC is of interest to ascertain, if possible, if shape of the raeCasCable peak depends upon Che species making the major conCribuClon Co the raetastable peak. When low repeller voltages are used so that the residence time in the ion source is long (of Che order of 1.5 microseconds), the meCasCable peak is dominated by transitions of lifetimes of the order of 2 microseconds. If Che repeller volCage is high so ChaC the residence tirae is of Che order of several tenths of a microsecond and if Che shore llfeCime species predominaCe in the ion source (as was seen for Che Chree cases studied), the metastable peak is dominated by transitions of lifetimes of the order of hundredths of raicroseconds. If the raetastable transitions of short lifetime gave ions of a differenC kineCic energy spread, iC would be expecced thac che shape of Che metastable peak obcained wlch high repellers would be significantly different from the shape obcained with low repellers.
112

INCREASING MASS
FIG. 9. Method of extrapolating the sides of the ra* to deterralne .^ra*.
31.9 peak
J INCREASING MASS — ^
Comparison of the shape of metastable peaks^ m* = 31,9, obtained at different repeller voltages. A is for a peak obtained at low repeller voltage. C is for a peak obtained with high repeller voltage. B is the superposition of curve A distended in the vertical direction to the same height as curve C onto curve C.
113

In order to get information on this, a metastable peak obCained wich low repeller volcage was graphically expanded Co che same heighc as a peak obtained with high repeller volCage. The resulCs are shown in Fig. 10. Here, A represents the m* = 31.9 peak as observed with a repeller volcage of 3 volCs and C is the same peak as observed with a repeller voltage of 120 volts. Curve B Is chac produced by Che one-dimensional expansion of Curve A traced on top of Curve C. Here, che dashed porCion aC Che boCCom refers Co lower porcion from Curve C. On che whole, the curves are identical except for the departure as seen in the base. It is believed that this resulted from error in the expansion of the sraaller portions of Curve A. This laCCer scep was made by measuring peak Co che nearesC 0.001" aC polnCs separated by 1/64 inch and multiplying by a normalizing facCor. Uncil this experimenC can be done with greater accuracy, we must conclude that the factors affecCing peak shape, such as klnecic energy, and angular spread, are Che sarae for transitions of short and long half lives.
Acknowledgment
Appreciation is due Co Dr. J. C, Schug for various discussions on chese topics and to Messrs. J. P. Klems and H. T. Best for obtaining data and raaking calculations.
114

THE CHEMISTRY OF UNIMOLECULAR ION DECOMPOSITIONS
F. W. McLafferty and R. S. Gohlke Eastern Research Laboratory The Dow Chemical Company Framlngham, Massachusetts
Many correlations of mass spectra have been made in the last few years, and in most cases these have included some speculations on the mechanisms involved in formation of more abundant ions-"-' . At this time, it might be useful to attempt to set forth a more general picture of what is occurring during the unimolecular decomposition of organic ions caused by electron bombardment. The following picture is of necessity somewhat oversimplified, but the reader is referred to an amplified version which is in press^.
The title is meant to emphasize that these are types of chemical reactions. Despite the obvious differences between these and ordinary chemical systems, we find that emphasis on the similarities gives a useful framework for the understanding of the ion decomposition mechanisms. The major differences of these two chemical systems appear to be: (1) the effects of the extra energy imparted by the bombarding electrons, and (2) the effect of the removal of an electron on the stability of the positive ion as compared to its corresponding neutral entity.
Because any intermolecular reactions are ruled out by the low pressure in the ion source, there are relatively few modes of chemical reaction open to the molecular ion which is initially forraed by electron impact. The most obvious of these is simple bond cleavage.
Simple Bond Cleavage. In
^ A-B'^ + C-D
the B-C bond is cleaved to yield the ion A-B plus neutral fragraent C-D. The tendency for such a reaction to take place in general appears to be enhanced by
(1) the lability of the particular bond
(2) the stability of the ionic and neutral products
The factors in physical-organic chemistry which are found to affect ordinary chemical reactions appear applicable in general to these ionic systems also. Thus, the polarizability of the bonding electrons adjacent to an alkyl group increases in the order ethyl <isopropyl <tert-butyl, which fits in well with the known increased cleavage tendency at chain branchings in alkyl ions.
R-fCHsCHs < R}CH(CH3)a < RfC(CH3)3
As will be seen later, the stability of the product ion can also be used as a strong driving force for this increased cleavage. The strong influence of the inductive effect is seen in the CyHy'*' ion abundance in the beta-haloethylbenzenes.
ICH2}CH£^< BrCH2|CHe<^ <ClCH2iCH2^
The abundance of the C7H7+ ion is 8 % , 37%, and 5 7 % of the total ions for the iodo, bromo, and chloro compounds, respectively. Apparently, the e-lectronegative halogen atom pulls electrons out of the beta bond, thus weakening it, as well as increasing the ionization potential of the methyl halo radical.
Bond lability is also affected in an expected manner by resonance. Thus, in a benzoyl compound the cleavage of the 0-carbonyl bond is reduced by an electron-supplying functional group in the para-position, and increased by an electron-withdrawing compound in the sarae location.
115

H2l2^^?R < O;N:£^|.§R
In fact, such effects can be correlated with the Hammett sigma constant*.
The electron removed in ionization may create a site of initial localized charge which effects the subsequent cleavage of a neighboring bond. Favored sites are atoms such as nitrogen, sulfur and oxygen, which contain non-bonding electrons which are easily donated, i.e., have a low ionization potential.
• ^ y~^-® © R-CHs-O-R' > RfCHa-q-R' > R- + CHs-O-R'
Electron transfer to neutralize this localized charge, as first proposed by Cummings and Bleakney^, will explain the well known beta bond cleavage in ethers, amines, sulfides, etc. Undoubtedly, the stable oxonium ion thus forraed is a major driving force in this cleavage (it contains a new bond to compensate for the one cleaved) and could thus be viewed as the cause rather than the result of the mechanism shown. However, this concept of electron transfer to the site of initial localized charge has proved useful as a convention for such mechanisms.
This concept can also be applied to "even-electron" fragment ions such as
R^^Ha^CHs® > R® + CHE=CH2
Here the radical ion structure of the fragment dictates a localized charge, which can be neutralized by the transfer of a pair of electrons, resulting in the new alkyl positive ion and neutral olefin molecule. Here again, the stability of the products could be viewed as the cause as well as the result of this localized charge mechanism.
This mechanism can also be successfully applied to common unsaturated functional groups, e.g., aldehyde, ketone, acid, ester, olefin, phosphate, sulfonyl, etc. Initial ionization from the oxygen atom of a carbonyl group or from the TT-electrons of an unsaturated linkage can also cause transfer of electrons from an adjacent bond
^C=0.
R / • R
> CHa ®
•-CH
> R'
-CHs +
• +
R-
R-C-0®
© s(~-\. CH2=CH-CH2^
Product Stabilities. As outlined initially, the other major factor effect-ing the bond cleavage tendency is the stability of the ionic and neutral products produced. Here the significance" of the electron removed in ionization should be reeraphasized. This destroys the stability of the electron octet in producing the molecule ion, thus changing the stable "even-electron" molecule into an unstable "odd-electron". In the same way, a
H;0:H H:b:H®
neutral "odd-electron" radical is less stable than its "even-electron" ion counterpart, as the latter does not contain the unpaired electron.
116

H H H rc- H :c '*'
H , H The stability of the neutral product frora the ion degradation is analogous to the ordinary chemical case. For exaraple, unsaturated
molecules are generally more stable than saturated, thus the forraation of such molecules as olefins, H2O, HCN, CO, ROH, RCOOH, etc. can provide a major driving force for a particular decomposition. Product ion stabilities also parallel chemical experience. As predicted by the Huckel rule for 4n + 2 7r electrons, the tropylium® and cyclopropeniura ions (n=l and 0, respectively) are classic examples which provide strong driving forces.
© At\ , CH^-^^ffi^Ha®
and the stability of the allyl ion is well known. Non-classical ions such as the "protonated cyclopropane"^ and cyclic bromonium^ structures have been postulated to explain unusual fragment ion intensities.
f .. I /
CH2—T CH2 ,
The unusual chemical stability found for difluoro carbene, CF2:, as compared to CH2:. can account for the surprising loss of CF2 from the molecular ions of aromatic fluorocarbons^'®. As raentioned above, a series of oxonium (e.g., RCH2-0H^, RCH=0H©, RC=(0S, quaternary ammonium, and similar ions containing hetero atoras are unusually abundant, corresponding to their well known chemical stability.
The relative stabilities of the products will also detennine which of the two fragments resulting from the cleavage of the particular bond will hold the positive charge. This is known as "Stevenson's rule".^^ For example, in the prominent beta cleavage rearrangement of propionate esters,
RR'CH-CH2-0-C0-C2H5® >RR'C=CH2 + HO-CO-C2HS® or RR'C=CHa®+ HO-CO-CaHs
the propionic acid fragment has an ionization potential of 10.5 e.v. In the raass spectra of the ethyl (R=R'=H), n-butyl, (R=C2H5,R'=H) and isobutyl (R=R'=CH3) esters, the respective olefin ions increase markedly in abundance through the series, in line with the respective ionization potentials of C2H4, 10.5 e.v.; CH3CHaCH=CHa, 9-70 e.v.; and (CH3)2C=CHa, 9.3 e.v. Sirailarly, beta-phenethyl esters give CsHe''" as the most abundant ion in their spectra^^'^^ in line with the 8.9 e.v. ionization potential of styrene.
Cyclic Corapounds. Multiple cleavage of ring bonds is necessary to produce fragment ions in cyclic compounds. Thus, the cleavage of the AD bond as shown does not change the mass of the molecular ion, and further cleavage
A-4-lP A D © A C ®
• r I — ^ l . l ^ > I . I B C B—|-C B D
such as a bond BC is necessary to produce a fragraent ion.
Thus, raajor ions frora the 2,2,5,5—di-cyclopentanone-"-" might be explained by^
117

0©
/ \ CDa CD2 \ e / CH2-CHa
n©
/ CD2
CHz
CD2 II CH2
0
I CD2 CH2
CD2 11 CH2
After the initial cleavage at the carbonyl group, loss of the stable ethylene molecule from the opposite end of the resulting open chain fragment ion would yield the abundant odd-electron oxonium ion. The fact that the corresponding CDaCHa© olefin ion is also abundant suggests that the accompanying carbonyl neutral fragment has the stable cyclopropanone structure instead of the diradical initially formed. The spectrum also exhibits major even-electron ions formed through rearrangeraents.
Decomposition Through a Cyclic Transition State (Rearrangeraents). One of the most fascinating aspects of the chemistry of the unimolecular decora-position of these energetic ions is the high tendency to produce rearranged products, often through a specific and favored mechanism. In retrospect, this is not so surprising if one considers a number of features of this unique system of chemistry. Ordinary chemical reactions, e.g., substitution, usually involve the formation of a new bond at the same time a bond is ruptured, thus lowering the energy requirements. For unimolecular ion decompositions, rearrangement can similarly provide a mechanism for formation of a new bond to offset the bond cleaved.
To make this new bond through the simple reaction of two active centers such as
A - ^ ^ D , ^ A-D ,©
would not be generally feasible because of the marked change in the bonding orbital required in A and C. Actually, because of the cyclic transition state, there must be two bonds cleaved, and thus a compensating formation of two new bonds. This can be achieved by
B-A V
D-CP-J '(±1 -A--
• ^ -
A-D > + B
k — C® )
involving a concerted shift of electrons, of pairs of electrons.
This can be rewritten as shifts
^ ^ ®
y A-
B
L_
—D
+
— C^
_ J
The raost favored configurations of the cyclic transition state are those in which a concerted shift of electron pairs is possible. These are a four-membered ring, or a six-membered ring containing one double bond^
A
B=
B ^ D
- II + I
118

The tendency for an ion to undergo a particular rearrangement decora-position depends mainly on the relative probability of the transition state and the relative stabilities of the products. Where there is a strong tendency for one such rearrangement path is termed a "specific" rearrangement, or if there are quite a number of probable paths of similar energy requirements, the rearrangement is called "random".^*
Typical "random" rearrangements are the formation of ions such as C3HeD+5C3H5D2+, C2H4D+, etc. in the spectrum of CD3CH2CH2CH3^^ in competition with the expected major ions C3H7"'", C3H4D3+, C2H5+, etc. All of the bonds in such a hydrocarbon are similar in requiring a relative high a-mount of energy for their decomposition, so that this randomizing process can be viewed as a competing exchange of the hydrogen atoms in the excited molecular ion, possibly through four-merabered transition states^.
H-----CH-R'
\-^y R-HC-----H
t (CH2)
n
The presence of a polar functional group in the molecule usually lowers the energy required to cleave one or more of its bonds, decreasing the opportunity for such randomization. The hetero atoms of such functional groups can also provide a site for localization of the initial charge on molecular ion, which has been viewed as a driving force for such "specific" rearrangements-''*. Actually, there are a number of close analogs to such rearrangeraents, especially in high energy radiation, photochemical, and thermal reactions.
The four-membered ring transition state appears to be a logical explanation of a nuraber of rearrangeraents, although one cannot generalize in its application to similar types of corapounds. Thus, the large C2H4 ion in the spectrum of ethanol should appear to arise from the loss of a
- ^ HOH + CH2=CHa ©
molecule of water through such a transition state, a low energy process with a high entropy of ac t ivat ion ••• °. However, it has been shown that the raass spectra of deuterated n-butanols-"- do not show specific loss of a beta hydrogen atora with the ejected H2O molecule. This still might involve a four-membered ring intermediate with formation of a cyclic production^.
H--—OfP
y y ffs R_CH---^—CH2 > HOH + R-CH-CH2*=-'
y^^){ (CH2)„ Quite a wide variety of rearrangeraents appear to go through a four-
membered ring transition state^, such as'
®y—-s © H NH-CH2-R' H-^-—NHTCH2 @
^ \ J (—] 3> RCH-CHa + HaN=CH2 RCH CH2 RCH CH-^tHa
119

H-'"0CH3
CHaOOC C ^0
.© CH3OOC
-> HOCH3 + C C
yO
Probably the most well-defined general type of rearrangment is that of molecules containing unsaturated functional groups, involving a six-membered ring transition state-"-*'-"- .
!~Ms H2C
II HaC H2C R
This class of rearrangeraent is prominent for carbonyl compounds (ketones, aldehydes, esters, acids, amides, and carbonates), olefins, vinyl and phenyl ethers, n-alkyl benzenes, phosphates, sulfites, etc. The spectra of labelled compounds have shown-"-^'^"' -'- that almost all of the migrating hydrogen comes from the gamraa-position as shown. A wide variety of rearrangeraents have been reported which evidently go through such a six-membered ring transition state, such as
CHa®
• ^ HOH
which has its unsaturation situated differently in the ring-"- , abundant CHa=CHCH20H+ ion from 1,2-epoxypentane^^.
or the
Additionally, there are examples of ion rearrangements in which a three-membered ring transition state seems to be involved^. The best established case is the elimination of carbon monoxide from carbonyl corapounds, which has been described in detail by Beynon and co-workers^^.
In recent studies of the mass spectra of complex fused ring compounds the raajor cleavage paths seem to involve combinations of the principles outlined above. A major ion of keto steroids described by Budzikiewicz and Djerassi^* can be formulated as
->
while Biemann and co-workers^^ postulate an interesting series of degradations for the formation of raajor ions in the spectrum of ibogaine^^.
120

I A C\J CM
W © / K ' CJ FT
\
/
\ / / f
CVJ cu r-f
(U
e
CJ
^
/
^ /
o T
• w
yl /
- \ / /
r-1
01
E
/ \
©// \
tu
w
t o t<\
(1)
® @
IS CJ
Although the mechanisms summarized hopefully show some progress towards our understanding of the chemistry of such excited organic ions, the mass spectra of many compounds still cannot be predicted in even a qualitative fashion. Excellent recent research from a nuraber of laboratories involving labelled compounds promises that progress in the field should be much more rapid in the immediate future,' however.
121

REFERENCES
1. J. H. Beynon, "Mass Spectrometry and Its Applications to Organic Chemistry", Elsevier, Amsterdam, I960.
2. F. W. McLafferty, "Mass Spectroraetry" in "Determination of Organic Structures by Physical Methods", F. C. Nachod and W. D. Phillips, Editors, Academic Press, 1962.
5. F. W. McLafferty, "Decomposition and Rearrangements of Organic Ions" in "Mass Spectrometry of Organic Ions", F. W. McLafferty, Editor, Acaderaic Press, 1962.
k. F. W. McLafferty, Anal. Chem., 31, 't77 (1959).
5. C. S. Cummings and Walker Bleakney, Phys. Rev., 58, 77 (19'+0).
6. P. N. Rylander, Seymour Meyerson and Henry Grubb, J. Am. Chem. Soc,
79, 842 (1957).
7. P. N. Rylander, Seymour Meyerson, J. Am. Chera. Soc, 78, 5799 (1956).
8. F. W. McLafferty, et al. Anal. Chera., 31, 2 (1962).
9. J. R. Majer, J. Appl. Chera., JA 141 (1961).
10. Paul Natalis, Bull. Soc. Chem. Belg., 67, 599 (1958).
11. D. P. Stevenson, Disc. Far. Soc, 10, 35 (1951)-
12. E. M. Emery, Anal. Chem., 32, 1495 (I960).
13. F. W. McLafferty and R. S. Gohlke, Anal. Chem., 31, 2076 (1959).
14. F. W. McLafferty, Anal. Chem., 31, 82 (1959).
15. W. H. McFadden and A. L. Wahrhaftig, J. Am. Chem. Soc, 78, 1572 (195^
16. Lewis Friedman, F. A. Long, Max Wolfsburg, J. Chem. Phys., 27, 613 (1957).
17. W. H. McFadden, M. Lounsbury, and A. L. Wahrhaftig, Can. J . Chem., 36, 990 (1958). ~
18. F. W. McLafferty, Anal. Chem., 28, 306 (1956).
19. Ng. Dinh-Nguyen, Ragnar Ryahge, Stina Stallberg-Stenhagen, and Einar Stenhagen, Arkiv. for Kemi, I8, 393 (I96I).
20. Henry Grubb and Seymour Meyerson, in "Mass Spectroraetry of Organic Ions , F. W. McLafferty, Editor, Academic Press, New York, 1962.
21. F. W. McLafferty and M.C. Hamraing, Chem. and Ind., 1950, 1366.
22. Einar Stenhagen, Private Communication, I96O, Goteborgs University, Goteborgs, Sweden.
23. J. H. Beynon, G. R. Lester and A. W. Williaras, J. Phys. Chem., 63, 1861 (1959).
24. Herbert Budzikiewicz and Carl Djerassi, J. Am. Chem. Soc, 84, 1430 (1962). —
25. Klaus Biemann and M. Friedmann-Spiteller, J. Am. Chem. Soc, 84, (1962). —
122

MASS SPECTRA OF ORGANIC COMPOUNDS OBTAINED USING A RADIO FREQUENCY SPARK SOURCE
Michel Desjardins University of Cincinnati F. Nell Hodgson Monsanto Research Corporation William Baun Materials Central, Aeronautical
Systems Division
ABSTRACT
Mass spectra of organic compounds were obtained, using the C.E.C, Field Evaluation Unit Double Focusing Mass Spectrograph, equipped with a radio frequency spark source.
Spectra were obtained for fused aromatic hydrocarbons, metal phenyl compounds, amino acids, and heterocyclics. In addition to showing a parent lon, the speotra show characteristic fragmentation which permits in many oases, elucidation of molecular structure. Techniques are discussed and data are presented for compounds such as coronene, anthracene, tetra-phenylgermane, arginine, and thianthrene.
INTRODUCTION
The use of spark source mass spectrometry for organic materials has little precedent In the scientific literature. Indeed, It has been reported(i) that organic solids have been found to break up completely in the spark gap to yield the mass spectrura of the Individual elements Involved.
As reported previously by Baun and Plscherv'^^ of this laboratory, with amino acids it is possible to obtain fragmentation with masses up to and above the molecular weight by using the spark source.
It will be shown that characteristic fragmentation can be obtained with many organic compounds and in some cases the data are not unlike those which are obtained with the' conventional eleotron Impact ion source.
INSTRUMENT
The instrument used for this work was the prototype of the C.E.C. 21-110, a double focusing Instrument of the Mattauch-Herzog type. (3)
Figure 1 shows schematically the mass resolving system, whioh includes the souroe region, the electrostatic sector, the magnetio sector, and the photo box.
Figure 2 shows the instrument with the spark source in plaoe. The electrode arrangement for the spark source is shown In Figure 3. The radio frequency spark source Is supplied with 100-150 KV of rf voltage to the sample electrodes. Repetition rates of 1 to 10,000 pulses per second are available and the pulse length can be varied from 5 to 50 microseconds.
TECHNIQUE
In working with organic materials, conventional spark methods for nonconducting materials were tried. The most suitable was found to be one in which the samples were packed into hollow aluminimi electrodes. These were then used as sparking electrodes. For this reason aluminum lines of mass 13.5, 27, etc., appear in all the spectra.
123

RF SPARK ELECTRODES ENERGY STOP M D BEAM MONITOR ELECTRODE
ANOULAR STOP X \ r - — . — MAGNETIC SECTOR
OBJECT SUT
ELECTRIC SECTOR FOCAL PLAtlE ( PHOTOORAPHIC PLATE)
Figure 1 Mass Resolving System
CORONENE
^24^12
M.W=300 !
MASyCHARGC
Figure 4 Spark Mass Spectrum of Coronene
ANTHRACENE
5«-,
ANTHRACENE
111 iJ,
MASS/CHARGE
Figure 5 Spark Maas Spectrum of Anthracene
124

The speotra were reoorded on Ilford Q-2 plates. Exposures were measured in coulombs by the integrating beam monitor. The photographic plates were then read on a microphotometer and values for per cent transmission were obtained. All the speotra shown have been plotted using 100 minus % transmission as a function of the Intensity of the ion beams. In most spectra obtained, it was possible to observe one or more lines which showed photographic reversal due to very high intensity lon beams. The value for the per cent transmission of these lines has been reported as R.B.j i.e., reverse blackening.
DATA
In Figures 4 through 10, the data from the photographic plates have been plotted in a concise form, in order to easily observe the oharac-terlstios of all of the following speotra.
Coronene The spectrum of coronene as Illustrated in Figure 4, represents an almost ideal case since it is one of the most stable of the fused aromatic hydrocarbons. Hence a good vacuum oan be easily maintained while spark ionization takes plaoe. Several interesting points are apparent in the spectrum of this compound.
1. A parent ion oan be easily recognized. Examination of the photographic plate would reveal that the strong lines In the high mass region are, in addition to being darker, greatly broadened. This is true with most parent Ions. Since only transmission measurements were made, we are justified in showing these lines heavier than others.
2. Masses corresponding to a doubly charged molecular ion group are to be observed at m/e = 147.5 to 150.5.
3. It will be noted that this spectrum bears many similarities to the characteristic spectra of fused aromatic hydrocarbons as obtained by conventional electron-impact Ionization. One such similarity is the grouping of lines, the number of whioh corresponds to the number of carbon atoms in the moleoule.
4. Although a large portion of the ions produced are in the low mass range, one oan see that masses even greater than the moleoular weight occur. This is apparent also in the spectrum of anthracene. Figure 5.
Anthracene In the spectrum of anthracene. Figure 5a, one again observes the characteristic fragmentation that oocurred with coronene. However, with a 20-fold increase in exposure, as shown in Figure 5b, lines are deteoted up to the mass of a dimer and above. These lines also occur in groups and are due to rearrangement and addition processes.
Mixture The spectrum of chrysene, Figure 6a, Is another example of a spark ionized fused aromatic. Again the same characteristics are shown.
Triphenylsilane, the spectrum of whioh is shown in Figure 6b, is Interesting in that several definite ions can be identified. For example, at mass number 77 a group of lines is seen which corresponds to a single phenyl group with varying numbers of protons. The line at mass number 105 corresponds to a silicon atom with a single phenyl group. At mass 154 we observe a rearrangement whereby two phenyl groups are associated. Mass 183 represents the parent moleoule with a phenyl group removed. The parent ion is observed at 260, but a line at 259 representing the removal of the proton, probably from
125

126

the silicon, is more intense. Also a c3oubly charged parent lon is observed at mass 130. At mass 287 an additional lon oorresponding to the parent lon plus aluminum (from the electrodes) can be observed.
The mlxt-ure spectrtan of these compounds in approximately 50/50 proportion by weight is shewn in Figure 6c. The characteristic features of the individual speotra are retained in the mixture spectrum. No attempt has yet been made to make a quantitative measure of mixtures.
Thianthrene The spectrum of thianthrene, a compound of a somewhat different nature Is shown In Figure 7. Ions of special signlfioanoe are, of course, the parent ion at mass nuraber 2l6 and the doubly charged parent group observed at 107.5 to IO8.5. Mass number 184 is the diphenyl-monosulfur ion.
Removal of one C and one H from the parent ion gives a strong peak at mass number 171. The peak I52 results from the rearrangement ion formed by the removal of both sulfur atoms from the molecule. Again •the combination of aluminum with the organic molecule yields the lon at mass number 243.
Triphenylphosphine The spectrum of triphenylphosphine, illustrated in Figure Ba, shows similarities to that of triphenylsilane. A phosphorus-phenyl lon is observed at mass 107. At mass number 154, once again the rearrangement lon of two associated phenyl groups is observed. At mass nuraber I83 an lon oorresponding to the molecular weight minus one phenyl group occurs. The last strong mass observed is the parent peak. However, again by increasing the exposure, many additions and rearrangements can be observed as shown in Figure 8b.
Tetraphenylgermane Figure 9 illustrates the spectrum of tetraphenylgermane, a relatively high molecular weight compound. It is interesting because of the multiplicity of lines due to Isotopes of germanium. At the molecular weight no one strong peak is observed, but three moderately intense peaks, which are due to the more abundant isotopes of germanium, can be seen. In the same fashion, the fragment ion, triphenylgermanluKi, shows three strong lines at masses 301, 303 and 305 for each of these isotopes.
Again the biphenyl metal ions at masses 224, 226 and 228 are seen. The monophenyl metal ions at raasses 147, l49 and I5I, and also the metal isotopes at mass number 70, 72, 73, 74 and 76 oan be observed.
A.rRinine One advantage of the spark Ionization technique for organic compounds lies in the fact that compounds which oannot be ionized by conventional means oan be spark ionized. For example, in the case of amino acids, structural information oan frequently only be obtained by analyzing derivatives if a conventional lon source is used. Free amino acids, because of their zwitter lon character, have very low vapor pressures and frequently decompose if heated to the temperatures required for vaporization.(4) By using spark ionization, amino acids oan be ionized as suoh.
Figure 10 shows the mass spectrum of arginine, an amino aoid whioh gives some characteristic fragmentation by spark ionization. It has been noticed consistently that a proton can add to the amine group, giving rise to a parent plus one lon, usually stronger than the parent ion. This observation has been made using a conventional ion source for such compounds as peptidesV5) and esters of amino acids.{^) In the arginine mass spectrum, two lines can be observed one and two mass units greater than the moleoular weight. Both are stronger than the parent lon. These two lines oan be explained by the presence of the two amine groups to which a proton may add.
127

Ir I'lmmij'i'
\ y
CHRYSENE
I J C^8^12
9 TRIPHENYLSILANE Q ^ S i - H ^ (C6H5>3SiH
Q j MW=260
iiiyw^^^^^^^^ 1^^
I r
I iii4Jiiwiiyiii|iw^ ^ ^
MIXTURE
MASyCHAftGE
Figure 6 Spark Mass SpecCrum of (a) Chrysene
(b) Triphenylsilane
(c) Mixture of (a) and (b)
THIANTHRENE
(CeH4) S I
MAS^MABOE^
Figure 7 Spark Masa Spectrum of Thianthrene
iiiii IIIUiiliilUliiUiiii4Uili
128

i t
I t
TRIPHENYL PHOSPHIhC
9 (CsH5)3P
( X ^ ^ MW= 260
|ll|l ^^^ - MASyfcHARCE
TRIPHENYL PHOSPHINE
yuly rt-CHj) rrwtvs** T * C , f V . rT ,^V^^) , • '
Mu vm-y n'll |l|l |t|'|lllll|l|lli|'i1IHI|HI|'|llH 'i Iv i f'l' 111Mi n u i M I' ln 11. M M M 11 M11. | i
M i S S / C K * R G E
Figure 8 Spark Mass Spectrum of Triphenyl Phosphine
r*"E—•B-"
lr
\ t
TETRAPHENYL GERMANE
9 (CeH5)Ge
MW=380
yiiMiiiiilbiiigivijj.'.iiii
TETRAPHENYL GERMANE
'lift,.
MASS/CHARGE
Figure 9 Spark Mass Spectrum of Tetraphenyl Germane
ARGININE MW=174
H NCNHCHgCH2CH2CH(NH2)COOH
.'i|i:n:rpii}iui^LiU|iiu^ii^iiii^iiii^ui^:j;;^iiij^ijii^iui^ii4Liiiiiuaiiiii
Ftgure 10 Spark. Mass Spectrum o£ Arginine
129

Several characteristic lines in this spectrum may be observed. At mass 160 the parent-plus-one mass minus fifteen (or minus the NH group) occurs. The lines at masses I30 and 131 correspond to the parent-plus-one and the parent-plus-two masses minus 45 (or minus a carboxyl group).
SUMMARY
Certain difficulties are encountered in spark ionization of organic oompounds which are not met when using the conventional ion souroe. The greatest of these is that intensity measurements made from photographic plate blackening cannot, at this time, be considered as accurate or reproducible from plate to plate as measurements made by electrical means. The erratic nature of the spark precludes use of non-integrating electrical measurements of intensity. Also the spark mass spectrum is frequently much more difficult to interpret than the conventional mass spectrum due to the large number of recombination and rearrangement ions which occur.
Some of the advantages of spark ionization might now be considered. Compounds of low vapor pressure, which are troublesome for conventional ionization, can be easily ionized by the spark. The problem of thermal degradation, sometimes encountered in electron-Impact ionization, can many times be avoided in spark ionization.
For example, the conventional mass spectra of phthallc acid and phthallc anhydride are Identical due to the thermal conversion of the aoid to anhydride.(6) gy gpark ionization, different spectra are obtained for these oompounds, starting material.
eaoh being characteristic of the
From this short presentation one can recognize that the application of spark ionization raass spectrometry will have its place, along with conventional mass spectrometry, among the tools available for molecular structure studies.
BIBLIOGRAPHY
1. Craig, R. D., Errock, G. A. and Waldron, J. D. , Advances in Mass Spectroraetry, Session B, Pergamon Press, London, 1959.
2. Baun, W. L. and Fischer, D. W. , Anal. Chem. _24, 294 (I962).
3. Mattauch, J. and Herzog, R. , Z. phys. 83,, 447 (1934).
4. Biemann, K., Seible, J. and Gapp, P., J. Am. Chem. Soc. 83, 3795 (1961).
5. Biemann, K. , Gapp, F. and Seible, J., J. Am. Chem. Soo. 81, 2274 (1959).
6. Gohlke, R. S. and McLafferty, P. W., 4th Annual Meeting A.S.T.M. Committee E-l4, San Francisco, 1955.
130

APPLICATION OF TIME OF FLIGHT MASS SPECTROMETRY AND GAS CHROMATOGRAPHY TO REACTION STUDIES
E. J. Levy, E. D. Miller and W. S. Beggs Tfie Atlantic Refining Company
Philadelphia, Pa.
Introduction:
The work to be described represents an £;plication of tirne of flight mass spectrometry and gas chromatography to the study of the changes in product distribution, as a function of cracking cycle tine(l^, during the cracking of n-nonane over a silica alumina catalyst. Crocking cycle time msy be defined as the period that a catalyst is e ijosed to "feed" before it is regenerated. Ihis paper will describe the experimental techniques ond sorae of the initial results.
In the usual microcstolytic stv.dist a hydrocarVjor; feed is rllov.'ed to paes over a catalyst for a given period of time, e.g. 15 minutes .-'.nd then the products are collected and analyzed and the % conversion for the 15 minute period determined. The percent conversion determined in this way is an integral conversion and represents the total conversion for the 15 minute period.
In the present investigation, the cracking period was directed into short intervals of sp-proyimately 28 seconds (corre,sponding to one slug of feed) and then the conversion and product distribution for each 23 second period was determined separately.
Apparatus and Experim.ental Procedures:
The equipment used in this investigation is shown schematically in Fig, 1 and consists of:
1) B Fisher introduction valve 2) a temperature controlled reactor containing 5 grams ot silica-
alumina catalyst 3) an indicating sampling system Including a two position six
ported aerograph volve, a sampling loop, and a Gow- 'ac thermal conductivity cell
i) an FiScM Kodel 500 gas chromatograph 5) a Bendex Kodel-1.1 Time of Flight msss spectrometer
In a typical run, a slug of 50 microliters (.05 ml) of r-nonane is inti-oduced with a Fisher pipet through a Fisher introduction valve into a strecra of preheated helium flowing at 30 ml/min. and is carried over a catalyst bed maintained at 950°F, The n-nonane is partially crocked over the silica alumina catalyst and passes as a slug through the reference side of the thermal conductivity cell. 'In one position of the Aerograph valve the slug goes from the reference side of the thermal conductivity cell through the sampjle loop and out through the detector side of the thermal conductivity cell. As can be seen from figure 2, with the valve in the position described, a positive and then a negative deflection was obtained from, a recording potentiometer connected to the thermal conductivity cell. To transfer the product slug to the gas chromatography unit the above secuence is repeated except that when the positive deflection from the reference side of the thermal conductivity cell returns to the base line the Aerograph valve is switched and the sample is carried to the gas chromatographic inlet line. As may be noted in figure 2, no negative deflection was obtained indicating that the product slug was completely transferred to the gas chromatography unit.
The product slug was then separated by gas chromatography into some 35 peaks. The gas chromatographic column used for this separation was a l//V inch 50 foot length of 20;Z silicone grease in series vith a A foot section of 15% Carbowa:;; 20M on A-2-60 mesh Chromosorb-W. The column teraperature wes maintained at ZtCC, for the first 20 minutes and then programmed ot the rate of 5,6°C./rainute up to 200<=C. It was then held ot 200°C. until all the gos chromatographic peaks emerged. The total running; time for a chromatogram was approximately 90 minutes. Slugs l,2,3,4,9,l4,2A,54 and LU were analyzed for each series before regeneration. Slug /.5 would be euuiv-'lcnt to a slug 1 for a series using a catalyst after regeneration.
131

GLASS . . CHIPS
FISHER INLET
TO T.O.F. PROBE
THERMAL CONDUCTIVITY
CELL
Flenre 1
Schenatlcs of Egulpmftnt
SAMPLE TRAPPING
132

Figures 3 and i ai'o photographs of the catalytic cracking re?ctor, the vaouum manifold connecting the 9 micron leak from the gas chromatograph unit to the spectrometer, ond the Bendex Time of Flight Kass Spectrometer. The vacuu.m manifold enables the line between the leak, figure 5, which is located at the exit of the chromatographic unit to be evacuated before the valve to the spectrometer is opened. Once helium fills this line, little or no aii>:ili&ry pumping is required to m.aintain a pressure of 5 x 10~° m.m, in the spectrometer.
There are three modifications of the spectrometer that should be mentioned because they aided in obtaining useable mass spectra under the conditions of rapid variation of sample size over several orders of magnitude. The first is c. voltage selector switch which reproducibly changed the potentiel applied to the ion multiplier. It consisted of a high voltage rotary selector switch with neon bulbs connected in series between the selector positions, Sy turning the selector switch the gain of the ion multiplier can be changed rapidly and reproducibly to match the size of the sample being observed. Ihe second modification is a totel ionization switch which applies a -150 volt potential to the analog controller gate, thereby collecting the secondary electrons produced by ions at all masses present. Ihis device is a very convenient method for determining the time delay between the maximum of the peak on the gas chromatographic thei-mel conductivity cell and the maximum intensity of the sample in the spectrometer. The ions produced by the helium carrier gas are gated out by setting the analog scanner at Mass i. The third modification is an electrical connection between the scanner and the controller so thot the scan generator for the scanner will also drive the controller ond thereby record another complete mass spectrum separated by a small time interval as shown in figure 6. The dual speotra permit detection of composition changes within s single gas chromatographic peak snd help in making an accurate determination of the components contained within a single gas chromatographic peak.
Analysis of Spectra
The confidence that one can have in the reproducibility of tho mass spectra under various conditions are shown in Tables I, II, III. Hexene-1 was selected as the test compound because it appeared to show s greater variability in pattern then the equivalent saturated hydrocarbon. In Table I, a pattern study is shown for hexene-1 Introduced through a standard molecular leak inlet system. The first column lists the masses of the major ions observed. The second colu-mn contains the .-neon values for the patterns based on m/e 56=100^, The third column lists the standsrd deviations for the patterns. The next tv/o columns are the high and lov range from the mean. The last column is the confidence that one can have that any other pattern obtained will fall within the ranges defined. In Table II, the pattern data for 1-hexene introduced through the inlet system while helium is entering the spectrometer through the 9 micron glass leak from the gas chromatographic exit line, is treated in a similar fashion. This condition is equivalent to the isolation of a gas chromatographic peak plus carrier gas with a volve system as described by Ebert(2). In Table III hexene-1 was Introduced through the ges chromatographic leak end the ceto tested as before.
From this study it can be concluded that the conditions iji Tables I and II produced mass spectral patterns with a range of plus or minus 5-10/6, approximately 70^ of the time, VJlth the conditions shown in Table III, the variability in % pattern is considerably greater so that the spectro obtained have to be treated very cautiously. The repeated spectre es shown in figure 6 helped considerably in establishing confidence in the patterns.
Results and Discussion
A typical gas chromatogram obtained for the cracked products of n-nonane is shown in figure 7, The identifications of the peaks in figure 7 end the pro-duet distributions by weight % are shown in Table IV.
Vlhen percent conversion WOE plotted against slug number as shown in figtire 8 an initial conversion of 32% was obtained -.dth the fresh silica alumina (90 Atlantic P+L) catalyst and 23S6 with the steam deactivated catalyst (60 Atlantic D+1). Ihe values dropped sharply after a few slugs and leveled off at 20% end 9% respectively.
133

J & ^
H 69 56
55
43
42
a 39
27
m/e
84
69
56
55
43
42
4L
39
27
fDtt c m Studv of 1
Hexene-1
,. ,n 46.7
30.9 100
64.8
65.4
78 .5
96.3
48.7
53.4
Pat tern S
Hexene
44.5
31.6
100.0
65.1
66.8
78.4
97.1
48.0
54.6
(T 2 .88
1.37
0 .87
1.95
1.78
3.61
1.65
3.05
Table I
iexene-1 Throiiph InJct Svstem
- I n l e t Sjjratein
Range
2 .7
1.0
1.1
1.6
1.5
3.7
2.4
2.9
Table II
:tudv of Hexene-l Throuph I n l e t Svste
-1 -
1.29
2.38
4.47
3.96
1.55
3.98
0.90
0.32
In le t System
4.1 2 . 0
1.0
2 . 7
2 . 2
3.2
1.3
2.9
:m find Helium
j L T j
75.3 69.2
77.6
71 .2
69.1
65.5
74.1
65.8
+ Helium
Range H-M M-L
1.3 1.5
2.9
5.1
4.6
1.0
4 .1
0.9
0.3
2.8
4.2
3.9
2.3
3.6
1.1
0.3
. . i TA
71.8
77.0
69.9
71.2
67.4
66.4
79.7
64.8
134

o .
-a §
I
s
^
.1
o M
r-. c^ l >
u^ •
^ c-
vO •
CNi £>
CV .
-<f c-
m .
00 vO
C\2 •
->^ i >
OJ t30
to CV
r-l rH
o to C^ CV • •
iH iH
o . C\2
l > •
to
UPv .
o rH
C^ •
CJN
C3N •
C3N
O .
rH
C-.
c^
to O
. C\i
•Sf .
O i rH
o i H
. O
ITA .
c-
u^ to
. to
o •
c^ •H
u^ O
. o
Cf>
. t o
o o • t o
i H •
OO r H
C\2 CV
. Cf^
is! o CV J> -<• CV
o o rH
S • .
to ->4-
t o C^ • •
tO H
^ « m c<-\
^ -4- f^ cv
135

Figure 3
Photoerarh of Cr-t&lvtlc Reoctor
Fifmre L
FtiotogTi F.h of Timo of F l i rh t I'fss Spectromfiter
136

Table IV
I d e n t i f i c a t i o n
Gas Chrom. Feak #
1 2 3 U 5
6 7
8 9 10 11 12 12A 13 14 15 15A 16
17 18
19 20 21 22
23 2 i 25 26 26A 27 28 29 30 30A 31
of Gas Chromatoeranhic Peaks
I d e n t i f i c a t i o n
Itydrogen methane ethylene ethane propane projiylene isobutane 1-butene i sobutylene n-butone t r a n s butene-2 c i s butene-2 3 me butene-1 isopentane pentene-1 n-pentane pentene-2 2 me buter.e-2 3 me pentene-1 2 me pentane cyclopentane L, me pente.ne-2 3 me pentane n-hexane 3 me penter.e-2 t r a n s 3 e thy l butene-1 3 me pentene-2 c i s me cyclopentane 2 me 1,3 pentadiene benzene n heptane heptanes to luene u n i d e n t i f i e d Cg? nonane xylene M+P x y l e n . 0 rac. e t . benzene t r i , me. benzene t r i . me. benzene ClO aromatics C-yQ aromatics
and Product D i s t r i b u t i o n
) )
) )
) ) )
) ) )
) )
Weight Percent
2.4
0.920 0.895 0.793 3.172 0.633
2.148 0.716 0.964 0.663 0.110 1.060 0.220 1.069 0,542 1.409 0.031
0.277
0,165
0.403
0.128 0,081 0.041
0,186
0,077 0.288 0,045 78.395 0.305 0.110 0.801 0.550 0.178 0.033 0.124
Product distributions by csrbon number for an initial slug of n-nonene over a fresh and a steam deactivated catalyst are shovn in figure 9. Analysis of succeeding slugs indicated that the product distribution by carbon number remained approximately constent as a function of slug nuiiiber or cracking cycle time. As can be seen in figui e 10 when the ratios of isoC/ to nC^ are plotted against slug number there does not appear to be a significant change in ratio with slug number. When the ratios of C^ olefin to C/ paraffin are plotted against slug numbers (figure 11), there does appear to be a significant increase in ratio with increase in slug number.
Conclusions
The general techniques described here can be applied to any reaction that can be carried out in a flow system. V/hen applied to the study of the product distribution from the catalytic cracking of n-nonane over a silica alumina catalyst as a function of cycle tirae it wss found that the product distribution by carbon number was relatively independent of cycle time, however, the hydrocarbon type within a carbon number changed as a function of cracking cycle time.
References
(1) Blanding, F.H,, Ind. Eng. Chem, 4^ 1186 (1953) (2) Ebert, A. A. Jr., Ansl. Chem. 22 ^65 (1961).
137

«f-
c o
3
o
/ ^ fr* * hi
E u
c o
o
c o E
u
138

J ^ A A _ _ .AiAll____jL
•n-NONANE
.WL
J j J < - ^ 32 ••3 57
J ^ JL es 99 126
FJFure 6
n-:-.orrne Vctss Cii ectriim
5 4 182
FlFvre 7
Cfs Chr-omstocrfcm of Crac.'ted Froducts
139

G 90 D + L FRESH CATALYST A 60 D + L STEAM DEACTIVATED
SLUG NO.
Fipure 8
Percent Conversion v s . S lu r Number
PRODUCT DISTRIBUTION SLUG I
© 90 D+L FRESH CATALYST A 60 D+L STEAM DEACTIVATED
CH4 Cj C3 C4 C5 Cg C7 I Cg C|0 XYLENE \ / '
AROMATICS Fli 'urc 9
i ro i ' uc t [iftrjfc'Jtjor? bv Cjrbon .^.^ber
140

o
o I
o
< a:
O FRESH CATALYST A 6 0 D + L CATALYST
z li. 4 li. < tc
V) z li .
tiz o o o I I -<
Cb®'
± J I L 10 20 3 0
SLUG NO.
Figure 10
I so Cj/nCi vs j Sluf, .Nvunber
4 0
O FRESH CATALYST
A 60 D+L CATALYST
' • • X 1 — L . 10 20 30 40
SLUG NO.
Figure 11
Cl a ier in /Ci , Fa re f f ln v s . Slug Number
141

USE OF CAPILLARY GAS CHROMATOGRAPIK "WITH A TOF MASS SPECTROMETER
W. H. McFadden, Roy Teranishl, D. R. Black, and J. 0. Day
Western Regional Research Laboratory, Albany 10, California
In recent years considerable attention has been given to the direct introduction into a rapid scan mass spectrometer of eluents emerging from a gas chromatographic column (1,2,3)- This technique is of value when it is not possible or convenient to collect the eluent and perform the analysis by means of a conventional inlet system. Such can occur when the unknown chemical may be unstable and polymerize or oxidize before the operator can perform the mass analysis. Frequently, the eluent contains only et few micrograms of material and subsequent transfer to the mass spectroraeter may be difficult or inconvenient. Often these small amounts of material are collected with very low efficiency, primarily due to aerosol effects, and direct introduction becomes desirable.
Previous work has been done with packed chromatographic columns by diverting approxi-m.ately 1% of the total eluent into the mass spectrometer. With capillary chromatograms the total gas flow is normally about 1^ of that used in packed column chromatographs so it seemed logical to consider the possibility of Introducing the total eluent into the mass spectrometer. This simple extension of the existing technique is very desirable when analyzing complicated mixtures which can only be satisfactorily fractionated with a capillary chromatograph. Normally the capillary column can be expected to have 10 to 100 times the theoretical plates obtainable with a packed column and consequently will give separations not achieved by the latter. This is particularly necessary when the unresolved components have a similar mass spectral pattern such as occurs with meta and para xylenes.
The apparatus used in this work is shown schematically in Figure 1. The chromatographic equipment is operated in a conventional manner except that the exit pressure is reduced to vacuum. To compensate for this, the gauge pressure at the inlet is reduced by 15 lbs. and in this manner retention times are close to those observed with the same equipment operating under normal atmospheric outlet pressures. The auxiliary vacuum is used for preliminary evacuation of the chromatograph exit. Occasionally it is used to reduce by a factor of two to four the amount of eluent entering the mass spectrometer. In operation the micrometer valve is wide open.
The helium carrier gas from the chromatograph enters directly into the ionization chamber of a Bendix Time-of-Fllght Mass Spectrometer. The mass spectrometer vacuum system maintains a pressure of about 10"5 Torr (estimated from an ion gauge calibrated for dry air). The presence of an organic compound in the eluent is determined by-observing the mass spectral output on the oscilloscope. When an unknown appears, the mass spectrum is recorded on a Minneapolis-Honeywell Visacorder at a scan rate of m/e 2't-200 in 8 seconds.
In this preliminary work a simultaneous chromatographic detector has not been used. Consequently, without a chromatographic record, it is not possible to compare directly chromatograms obtained under vacuum with those obtained under normal operating conditions. However, reconstructed chromatograms have been obtained by plotting the intensity of the base peak recorded on the mass spectrum versus retention time. Although this does not give an exact measure of the amount of material, it enables the placement of the observed compounds and hence gives a general estimation of the chromatographic efficiency. Results have indicated this to be as good or better than that obtained by a similar column operating with a conventional ionization detector at atmospheric pressure. This is in accordance with currently accepted views on column operating efficiency { k ) .
In Figure 2, a typical chromatogram from a packed column is shown. The sample was a small fraction separated frora an orange juice condensate oil. The column was a 1" preparatory column but the separation efficiency was essentially the same as can be obtained on a 1/8" column. The substrate used for this separation was neopentylglycol-succinate and is considered to be very favorable for compounds of the type present in this unknown. The chromatogram shows the presence of six compounds which were identified primarily by matching the RF values of classically known compounds.
In Figure 3 ^ capillary chromatogram of the same sample is shown. In spite of the fact that the Dow 710 silicone oil used in the column gives poorer separation than the neopentylglycolsuccinate used in the packed column, the mixture is now resolved to show twelve compounds. Because the majority of these are Cio^ig terpenes it is essential that they must be separated if any raass spectral identification is to be obtained. For example, the mass spectra of a-thujene and a-pinene are sufficiently similar that 1-5^ impurity of a-thujene in a-pinene would go completely undetected. The pattern for
142

Hel ium
Inject ior iv i
S t ream Spl i t ter
C a p i l l a r y Co lumn
Mic rometer V a l v e
c — E :
y-r.
A u x i l i a r y V a c u u m
I o n i z a t i o n Chamber
Detector
O u t p u t S ignal
FIGURE 1
u. y
Di f fus ion Pump
Osc i l loscope
ORANGE JUICE COND. OIL
FORERUN FROM SILICONE COLUMN
7 ' , 1.0", N.P.S.
I I O ° C .
2X
p 5-
o tb
FIGURE 2
143

camphene differs considerably in the intensity of the base peak at ra/e 93 (22^ of the total ionization for a-pinene, 135 for camphene) but this difference is spread rather evenly throughout the other peaks so that 2'^ camphene in a-plnene might be interpreted as a small error in the base peak intensity. Clearly separation of these types of compounds is necessary. The two chromatographic peaks labeled CIQHIS ih Figure 3 have not yet been structurally identified but as impurities in the overwhelming myreene fraction, their presence was not even detectable.
Another example that emphasizes the need for the utmost separating power in the chromatographic equipment is given by results obtained on a tiny saraple of extract from peas. After a laborious series of chemical and extractive separations performed on 5000 lbs. of fresh peas, there was obtained, in addition to other fractions, about 3 - ^ microliters of a residual oil. This mixture gave 22 clear chromatographic peaks on a packed column. On a capillary column, 29 peaks were observed but this was not run with an optimum temperature program. With a lower temperature program the eluent from the capillary column was introduced into the mass spectrometer and 39 separate compounds were observed.
The class identity of these 39 compoiinds is shown in Table 1. Eighteen alkyl benzenes were observed. It is again emphasized that because raany of these have similar mass spectral patterns the identification of one in the presence of an isomer is difficult even in relatively large amounts.
Table 1
COMPOUNDS OBSERVED IN EXTRACTAMT FROM BLANCHED FRESH PEAS
O]
Number of Compounds
02
Cl,
Aliphatic Hydro-CEirbons above Cv 12 (Also possibly ketones)
Others: Terpenes, Indenes, Furans, etc.
Ibtal 39
Although the presence of several aliphatic hydrocarbons was determined, the mass spectra of the many isomers of CgHgo, Cj|_oH22, etc., are so similar that positive identification of such small quantities is almost impossible. It is of value however to get an estimate of how complex the mixture of this class of compound might be and again the combined capillary chromatography and mass spectrometry offers the most practical solution. Identification of some of the other compounds in this pea extract is still tentative and awaits further study.
144

ORANGE JUICE COND. OIL FORERUN FROM SILICONE COLUMN 250 ' , O.OI" I.D. CAPILLARY- T.O.F DOW 710
FIGURE .
CAPILLARY-TOF APPLE JUICE EXTRACT
16 13
12
15 14
80
10 8
i l
70 I06» IOO'
60 50 92*
40 S T
30 min. 85* C
FIGURE 4
145

As a final example of the advantages of this technique, some of the data obtained on an apple juice extract are presented. Figure It is a synthetic chromatogram obtained by plotting the intensity of the base peak versus the retention time. Several of the peaks have been identified and, as would be expected, correspond to compounds established by classical identification methods. In addition, a pentenal and hexenal were tentatively identified. These compounds may have been missed in classical work because of the long, tedious extractive procedures in which such labile compounds were decomposed. In the present work, since only a few microliters were required, a quick extraction was performed on 1 liter of apple juice with a low-boiling solvent that was easily evaporated off. The total time from beginning to final analysis was only a few hours and the possibility of error due to decomposition or oxidation is considerably reduced.
Chromatographic peaJts fifteen and sixteen have not yet been identified. A preliminary study Indicates that each of these may be two uncatalogued corapounds, possibly aldehydes or unsaturated esters or alcohols in the molecular weight range 114 to 128. If this work had been perforraed with a packed colimui, these two peaks would raost likely have been one chroraatographlc peak and the hope of identifying four uncatalogued compounds of moderate complexity from the mass spectrimi of their mixture would seem very unlikely. Indeed, it would not be easy to tell that four materials were present. Further work will be required, but the extra separation efficiency offered by the capillary column has in this case again given information not easily obtained.
In conclusion it is appropriate to note that this technique is only an extension of work pioneered and established by other workers (l,2,3). Because it raakes possible separations and mass analysis not attained from previously described techniques, it is desirable to emphasize the simplicity with which capillary chromatography can be coupled to a rapid scan mass spectrometer.
We wish to acknowledge the contributions and encouragement of many other members of the Western Regional Laboratory staff, in particular. Dr. J. W. Ralls and Mr. R. M. Seifert who permitted us to use their work on pea extractant as an example.
References
1. Gohlke, R. C , .'taal. Chem. 31, 535 (1959)-2. Lindeman, L. P., Annis, J. L., Anal. Chem. 32, 1742 (I960). 3. Ebert,' A. A., Jr., Anal. Chem. 33^ I865 (1951). k, Giddlngs, J. C , Nature I9I, 1291 (1961).
146

Uses of a Total Ionization Monitor for Time-of-Flight Mass Spectrometry
Roland S. Gohlke The Dow Cheraical Company
Eastern Research Laboratory Framlngham, Massachusetts
Our laboratory has had a mass spectroraeter, a time-of-flight instrument manufactured by Bendix, and has been modified to provide mass resolution which is considerably superior to time-of-flight instruments previously available. The mass spectrometer itself will be fully described in a paper to be given later in the week. One area we are going to investigate with the mass spectrometer is the study of cheraical reactions occuring at near atmospheric pressure in a flowing system. For example, we might wish to examine, in a continuous manner, changes in the product distribution from cracking ethylbenzene to styrene as the temperature or pressure of the reaction were modified. To this end we have constructed a highly versatile, miniature reactor which essentially fits into the ion source of the mass spectrometer in such a manner that the reactor orifice is within 1 1/2 em's of the ionizing electron beam. That's enough about the reactor - perhaps I'll describe it more fully at next year's meeting.
In preparing the mass spectrometer for its end use, it was desirable to incorporate several modifications into the mass spectrometer. One of these modifications appears to have a fairly wide area of application and this is what we wish to describe.
We have incorporated an electronic device into the raass spectrometer so that we have an option of two modes of operation. We can operate normally and obtain the usual 10,000 spectra per second from the instrument, or, we can obtain 5,000 spectra per second and a measureraent of the total nuraber of ions reaching the detector by switching in the circuitry shown in Fig. 1. This device functions as follows: on the first mass spectroraeter cycle we are given the normal mass spectrura in the usual manner, to use as we see fit. On the second raass spectroraeter cycle, however, -150 V is applied to one of the collectors in the multiplier within 0.5 microseconds and stays there for the entire, duration of that instrument cycle, which is 100 microseconds. This has the effect of collecting the electrons provided by all the ions as they strike the collector and hence is a measure, or at least an indication of the total number of ions that strike the collector. On instrument cycles 1, 5, 5, 7, etc., we obtain the normal mass spectrura which can be viewed with the oscilloscope or which can be scanned in the usual manner. On cycles 2 , k, 6, 8,etc., we obtain a voltage which is a raeasure of the total ionization occuring. The total ionization measurement is monitored with the meter on the scanner chassis and also with a recorder. We do not observe it on the oscilloscope.
A separate, simple power supply is used to power this alternal cycle integrator, as we call it, and this is shown in Figure 2. The entire device was constructed by B-Line Electronics of Saxonville, Massachusetts and cost us ©550.00.
We use it for a number of different tasks. We might use it to check whether or not the trap current regulator is helping to stabilize the mass spectroraeter output as shown in Figure 3, and we would see that the total ionization raonitor tells us that the trap current regulator is helping to alleviate a downward drift in total ionization which is occuring from some unknown cause in the unregulated mode. The total ionization monitor also provides a rapid raethod of adjusting the various mass spectrometer controls such as the horizontal and vertical deflection to provide maximum output. These adjustments can be made with a higher degree of sensitivity than is possible to obtain by trying to visually observe slight peak height changes on the oscilloscope. Adjustment of the raass spectrometer's external magnets is also facilitated with the total ionization raonitor.
We use it while we are obtaining spectra for analytical purposes as shown in Figure k . Here we felt that the previous sample had been pumped out at this point so we injected a new sample of 1//I of acetone into the inlet system. When the total ionization raonitor indicated that a reasonably
147
AlURMt* Crala UUgnMT
6BJ8 > • ! » T.
>.J00».
Figure 1
1.5A.
POWHR SUPPLY SKCTIOW
THORD.
24 t oo
d
c c o
,.d o o o o
c 6.3 V.A.C.
- W - W - t 'VWV^
: : ^ looks'
TK-lOB 1
QA2
All tectlflara S«latr»a CKR-70
t > +15W.
? ; :J: ' ' i o o w
- > -JOW.
7K-1W
J.^ 100/ US"
- • -150».
' 200» .
Figure 2
148
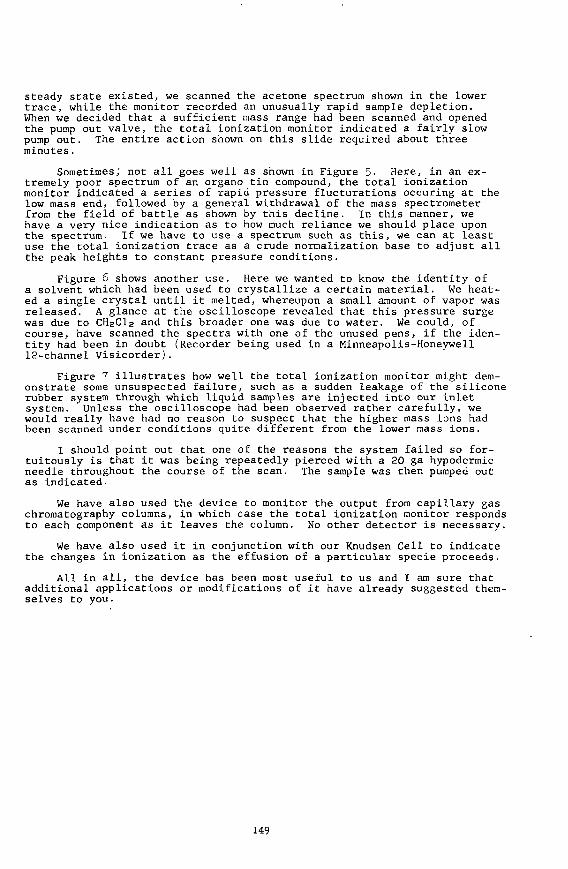
steady state existed, we scanned the acetone spectrum shown in the lower trace, while the monitor recorded an unusually rapid sample depletion. When we decided that a sufficient mass range had been scanned and opened the pump out valve, the total ionization monitor indicated a fairly slow pump out. The entire action shown on this slide required about three minutes.
Sometimes; not all goes well as shown in Figure 5. Here, in an extremely poor spectrum of an organo tin corapound, the total ionization raonitor indicated a series of rapid pressure flucturations occuring at the low mass end, followed by a general withdrawal of the raass spectrometer from the field of battle as shown by this decline. In this manner, we have a very nice indication as to how much reliance we should place upon the spectrum. If we have to use a spectrum such as this, we can at least use the total ionization trace as a crude normalization base to adjust all the peak heights to constant pressure conditions.
Figure 5 shows another use. Here we wanted to know the identity of a solvent which had been used to crystallize a certain material. We heated a single crystal until it melted, whereupon a small amount of vapor was released. A glance at the oscilloscope revealed that this pressure surge was due to CHsCls and this broader one was due to water. We could, of course, have scanned the spectra with one of the unused pens, if the identity had been in doubt (Recorder being used in a Minneapolis-Honeywell 12-channel Vislcorder).
Figure 7 illustrates how well the total ionization monitor might demonstrate some unsuspected failure, such as a sudden leakage of the silicone rubber system through which liquid samples are injected into our inlet system. Unless the oscilloscope had been observed rather carefully, we would really have had no reason to suspect that the higher mass ions had been scanned under conditions quite different from the lower raass ions.
I should point out that one of the reasons the system failed so fortuitously is that it was being repeatedly pierced with a 20 ga hypodermic needle throughout the course of the scan. The sample was then pumped out as indicated.
We have also used the device to monitor the output from capillary gas chromatography columns, in which case the total ionization monitor responds to each component as it leaves the column. No other detector is necessary.
We have also used it in conjunction with our Knudsen Cell to indicate the changes in ionization as the effusion of a particular specie proceeds.
All in all, the device has been most useful to us and I am sure that additional applications or modifications of it have already suggested themselves to you.
149

Figure 3
_ . . • - - •
.'y... — * S y
. . . -TV - - . - . \ - - r^
i-.z: r \ - —-_-.: —"_. —~
• . • ; r^ \ . - . ' - - ^
1 - • -
Lk-M —
y - Z } : ^ \ z - : : y r : - y z
-^.:, •-- y - z ^ = ^ •• .;_-.- v . . = = v :i=:
Figure 4
Figure 5
150

, —
IMC, MESS 'Af & „ . i - e HP \
^ ^ ^ ^ ^ y j ^
Figure 6
Figure 7
151

"AHALYSIS OF COPOLYMERS BY PYROLYSIS AND MASS SPECTROMETRY"
Graham G. Wanless Esso Research & Engineering Company
Linden, New Jersey
The first slide' '. If you please, will show where this method fits in the polyoer family. This tabulation shows skeletal parts of the Slnha classification scale, which lists polymers according to the manner In which they cooe apart, on pyrolysis.
Slide 1
Polymer Deftradation
Polymer
Ethylene or Methylene
n-Methyl Styrene
Methyl Methacrylate
Studies
Monomer Yield (Wt.7.)
0.025 Wt. 7.
45.
>95.
Products which produce high yields of monomers can be dealt with easily by assaying the off-gases. There are published methods for this, for example, Strassburger, Brauer et al (1960). We are concerned principally with the other end of the Simha scale--that is, with those polymers which yield minor amounts of monomeric gases, decompose by random scission, and yield predominantly lube-oil-like fragments.
The objective of this work was to develop a rapid mass spectrometrlc method for analysis of copolymers--and the particular example of this paper is the copolymer of 1-pentene and 4 methyl 1-pentene.
Our best procedure consists of depolymerizing a portion of a milligram sample of a polymer in a device which is attached directly to the heated inlet system of the mass spectrometer. This equipment is sketched in the next sllde(2).
Slide 2
ARD HEATED INLET SYSTEM USED FOR POLYMER DEPOLYMERIZATION
"1 SAMPLE CUT-OFF. VALVE
EVAPORATOR
479"'C.
SAMPLE CUP (A) GALLIUM VALVE
2 50°C
SAMPLE CHAMBER
SEPARATELY CONTROLLED HEATERS FOR EVAPORATOR & EVAP. LINE
R e p r i n t e d from J o u r n a l of Polymer Science 1962 u i t h kind pe rmi s s ion of t h e e d i t o r s .
152

More detail of the sample cup is shown in Slide 2A, please. (Referring to the slide ) This flange on the temperature probe forms a cover for the sample cup, after the latter has been raised up. Since the thermocouple bead is now inside the sample cup, we can know the polymer decomposition temperature rather exactly.
The mass spectrometer solids inlet system has two very special advantages for this type of work:
(a) Rapid escape of the cracked fragments into the cooler high-vacuum sample system of the instrument, thus allowing minimum thermal abuse of these fragments.
(b) The total ionization meter which permits us to control the quantity of cracked gasea introduced Into the Instrument—without having to weigh out a sample.
It has been known already that the spectra which one can obtain from such depolymerlzates are quite specific. I should make reference to an earlier paper in this committee by D. L. Cook in June 1959. An example of theae spectral regularities are shown in Slide 3. You will note how these characteristics persist up to C60 at least, thus embracing a sequence of 9 or 10 monomer units. The slide shows only the series CnH2n-2> which we prefer for this work.
Slide 2A
ARD - HIGH RANGE MASS SPECTROMETER EVAPORATOR AND SOLIDS INLET SYSTEM
SAMPLE BOTTLE OVEN 250°C
EVAPORATOR THERMOCOUPLE 449°C- ^
GALLIUM LEVEL-
~\'
W f e a • ' •—I -GLASS SAMPLE CUP
153

Slide 3
THREE DEPOLYMERIZATION METHODS YIELD COMPARABLE RESULTS
o r
< o-
. I
> < e t
UlOM.
1000-
IN-
10-
I.
- • • • 1
T^\ V ^ v f * I • . 1 / * !
J » H ^ *2 T » ' i /
V* : T •
^ " ^ ^ y L , 1
• a , ;
•• 1 H n N 49 H n
CARBON NUMBER IN SCRIES CnH,n - 2 '
Another objective of this slide is to show that essentially the.same results can be obtained, with aome variations in cracking aeverlty. Slide 3 shows results from three different cracking procedures--two variations using the apparatus already described, and a third in an all glass vacuum apparatus comparable to that of D. L. Cook(^959). Some latitude is present and this is very satisfactory from an analytical atandpolnt.
The real problem is how to interpret such spectra. Our basis for doing so Is the scheme shown tn the next sllde(^). please.
Thus, tf the copolymer is made from two monomers A and B, one would expect by simple theory to obtain the products and cross products shown In this slide. Now If the copolymer Is rich In B snd poor in A, one vould predict:
B>A
2B3' 2A
1A2B7 2A1B, etc.
Monomers
D i m e r s
T r i m e r s
T e t r a r a e r s
P e n t a m e r s
H e x a m e r s
H e p t a m e r s
O c t a m e r s
N o n a m e r s
A
2A
3A
4A
5A
6A
7A
SA
9A
B
AB
2A1B
3A1B
4A1B
SAIB
6A1B
7A1B
8A1B
2B
1A2B
2A2B
3A2B
4A2B
5A2B
6A2B
7A2B
S l i d e
3B
1A3B
2A3B
3A3B
4A3B
5A3B
6A3B
4
4B
1A4B
2A4B
3A4B
4A4B
5A4B
5B
1A5B
2 A SB
3ASB
4A5B
6B
1A6B
2A6B
3A6B
7B
1A7B
2A7B
8B
1A8B 9B
154

This Idea con be tested out by using a mass spectrum such as the one we have Just shown In a previous slide. Let B " C^ and A - Cj. Then the result of such a test Is shown in the next slide(S).
You will note that the predictions hold perfectly up to hexamers. After this sooe superimposed complications set in, but the data can still be uaed for analytical purposes up to the nonamers.
Slide 5
MASS
Fragment
IConomers
Dimers
Tr imers
T e t r a m e r s
Pentamers
Hexamers
Heptamers
Octamers
Nonamers
SPECTRAL ABUNDANCE
( S e r i e s CnH2n-2,
P r e d i c t e d Rat ios
C6>C5
C l 2 > C i o
Cl7 >Cl6
C23>C21
C29>C26 C28 .>C27
Css^'^ai C34 >C32
C41>C36 C40 ?C37 C39 >C38
C47>C4i C46 >C42 C45>C43
^^53 >^46 C52 >C47 C51 >C48 C5O >C49
RATIOS FOR COPOLYMER SAMPLE A
I s o t o p e C o r r e c t e d Data)
P r e d i c t i o n s Confirmed or Not ( F i g . z )
Yes
Yes
Yes
Yes
Yes Yes
Yes Yes
No No No but C 4 i > C 3 g e t c .
No No Yes + No bu t C47>C45 , e t c .
No No No No bu t C53>C5j^, e t c .
The theory says that we can carry out a one-step depolymerization and MS scanning operation, measure one or more pairs of peak ratios, and read the copolymer composition from a correlation plot. Slide 6 shows such a plot. This slide shows points for three unknown samples plotted about a two-point calibration curve. If one assumes that a linear calibration curve is a fact, then we have an absolute calibration. Rather than assuming this, it is much more satisfactory to correlate with an independent method. For this purpose ve use NMR data, on the basis of the next slide(^). (Referring to this slide ) The copolymers will have the ratio of CH + CH2 which will vary between these two extremes. QU
155

Slide 6
2.5
2.0
MASS SPECTROMETER CALIBRATION CURVE FOR COPOLYMERS 1-PENTENE AND 4-METHYL-l-PENTENE
i2 1.5
^
1.0 -
UJ X
S 0, Q.
0.1
1 1 (PROCEDUREH
(FOR ARD HIGH
1—
-
1667-23 ,
1
• 4 1
RANGE MASS
/ /
1 1 1
SPECTROMETER) A
1 6 6 7 - 2 5 - ^
1
1)
2)
1667-27 > /
/ •
NOTES: ~|
ORDINATE VALUES FROM C l 6 / C l 7 PEAK RATIOS
ABSCISSA VALUES FROM SIMULTANEOUS EQUATION CALCULATIONS USING 3 PAIRS OF PEAKS, ANO AVERAGING RESULTS
1 1
5 -
0% Cs 20% 40% 60% 80%
PERCENT OF C5 COMPONENT IN C5/C6 COPOLYMER
100% C5
156

Slide 7
NKR ASSAY CAN REFLECT COPOLYHER COMPOSITION
P o l y m e r
l - P e n t e n e ^ -
CHg - C
CH2
CH2
CH3
4 M e t h y l - 1 - P e n t e n e : -
CH2 " C
CHg
C - H
/ \ CH3 CH3
H 1
CH2 - C -
CH2
CH2
<=«3 _
H 1
CH2 - C -1
CHg
C - H / \
CH3 CH3
R a t i o CH + GH2
CH-j
2.3
n
1.0
n
Hovever, these Zeigler-type copolymers are insufficiently soluble for conventional NMR analysis. The difficulty can be overcome by depolymerizing the polymers in an apparatus shown In Slide 7A. This equipment is comparable to that of D. L. Cook (1959). It gives products of about the same molecular weight distribution as does the direct mass spectrometrlc method.
Slide 7A
POLYMER DEPOLYMERIZATION APPARATUS
/ r ^ 10 MM
m BLOCK HEATER 8 WOODS' METAL BATH
>Y
WET ICE TRAP-
TO -VACUUM
PUMP
\ r
\J l-LIQ NITROGEN TRAP
157

methods. The final slide (8) confirms the agreement between the MS and NMR
Slide 8
CORRELATION OF M.S. AND N.M.R. DATA (COPOLYMERS OF 1-PENTENE AND 4-METHYL 1-PENTENB
'^ 1 .20 | -CQ < ^ L l O h o <
tn <
J U
20
10
00
90
80
70
60
1
-
-
-
-
-
-
1
\
\ .
\
1
1
.
\
\ ^
\
1
1
\
i . \
- \
-J
-\
-
-^
0.80 -
25 50 75 PERCENT MONOMER (NMR)
100
.158

Mass Spectrometric Study on the Evaporation of Volatile Components in Coramercial Polyethylene
Kisaku Nakagawa
Electrical Communication Laboratory Nippon Telegraph and Telephone Public Corporation
Musashino-shi, Tokyo, Japan
1. Introduction
Mass spectrometric method has been utilized successfully in analyzing tbe degradation products of high polymers. Extensive ijorks have been conducted and excellent results have been reported.^ '^-^^
(k 'i) The recent advances in the field of high molecular weight mass analysis^ ' ^^ has caused us to study the possibilities of the direct application of the mass spectrometric method to the analysis of the structures of macromolecules, especially for branching structures.
One of the purposes of this paper is to verify the presence of the light components vhich are vaporizable in a vacuum vithout being subjected to degradative reactions. The other purpose is to offer the typical mass spectra of the volatile components in commercial polyethylene, and to make comparisons with standard linear hydrocarbons.
2. Preliminary Experiments
2.1. Moleoular Distillation of Polyethylene:
In order to confirm the existence of the light components which are volatile vhen the polyethylene is heated in a vacuum, a commercial high density sample (Marlex, made by Phillips Co. Nominal molecular veight: 70,000) was distilled as shovn in Fig. 1. Distillations vere performed over a temperature range of 150-'d0°C.
The raolecular weight of the evaporation products condensed on the dry ice trap were estimated cryoscopically, and were on the order of 500-1,500. The results are illustrated in Fig. 2.
The variation in molecular veight of the residual polymer vhich remained in the bottom of the stills vere estimated by means of limited viscosity measurements. The results shown in Fig. 3 indicate an Increase in the relative molecular weight up to 250°C. By interporating the curve in Fig. 3, the temperature at which the polymer sample begins to degrade can be estimated. Degradation reaction in Marlex appeared to predominate over the evaporation at about 280°C.
Finally, both the residues and products were examined by infrared absorption. In Fig. ka and b, the relative optical density of the absorption due to vinyl, vinylene and vinylidene radicals of the residues and products are illustrated, respectively. Since the molecules of Marlex are believed to have a vinyl radical at each end, the spectrum shown in Fig. kh could be taken as evidence of the general similarity of both molecules in the residue and product. Moreover, the opposite inclination in the relative optical density of vinyl (referred to the methylene rocking) against the distillation temperature could be regarded as evidence of the presence of evaporation stage prior to that of degradation.
Based on the results of this preliminary study, it would be reasonable to state the following conclusions; 1) In commercial polyethylene, there are components having a lov molecular veight and can
be vaporized at a certain temperature in a high vacuum. 2) The molecules in vaporized components have a similar terminal structure as these of
molecules in tbe residue.
2.2. Determination of Ion Source Temperature;
The optimum condition of the mass spectrometer vas determined by the folloving tests. Standard hydrocarbons (API), n-Hexadecane, 1-Hexadecene and 1-Pentadecene, were introduced into the spectrometer and analyzed. Both the ionic yield and the relative ion intensity in the spectra were found to be quite sensitive to the ion source temperature. These variations are shown in Fig. 5 and 6. The base peak was of Cl^g for three standard samples adopted and over the temperature range of 4O-270°C. Most of the peaks belong to
159 •

Ttv iKMciikr tfMirtficrr ct pOyatjylene r meUM ot eufxrHet tn tu^ tf MorMx
5 , - ^ ; 150 200 260 X O 350 4CO '
Distillation Tampcratirc C C )
Fig 4 o) " • w ' l * opHoai *"•( /> of Marlex raacL*
C 0 , „ - IOO)
160

the C^H2n+l sequence (abbreviated as 2n+l, hereafter) displayed nearly sirailar variations to eaoh other. Their intensity increased as the temperature was elevated up to about 200* 0 and turned to decrease for higher temperatures. The anomalous peaks in the 2n+l sequence are of CJ_Q, C^i and 0^2- These behaviors are found to have their maxima at about 120°C and minima at about 2000C.
Tvo species of ions, CgHt and C^Ht in the CnH2n-l sequence are observed to behave in nearly the same manner as those in the 2n+l sequence. Whereas, the peaks having more than k carbons belonging to this sequence are found to exhibit the similar variation of the anomalous peaks in 2n+l sequence.
The behavior of parent ions are unique to all others. Their decreases in intensity against the ion source temperature are observed to be almost linear up to 200°C. At higher temperatures they reduce their intensity to the amounts which are comparable to those of ions having I k or more carbon atoms.
In view of the ionic yield and the stability against the temperature fluctuation, the ion source was kept constant at 200OC throughout the process.
3. Experiraents on Polyethylene
3.1. Ion Source and the Instrument:
A conventional gas analysis ion source was modified slightly by winding a tungsten wire around the gas inlet glass pipe to serve as a simple furnace. Tungsten wire was 0.1 mm in diameter and the heating zone was to ram in length.
Sample polymers (re-precipitated powder) were placed in small vessel made of glass and placed in the furnace. Temperatures in the furnace vere indicated by raeans of an Alumel-Chromel thermocouple enclosed in a glass tube. The modified ion source is illustrated in Fig. 7. The ion Acceleration was reduced to 1,000 v (normally 2,000 v) to extend the analyzable mass range to the C^Q group or a little higher. The operation constants are listed in Table I.
Table I.
Operation Constants of the Instrument (Hitachi Model RMU-5)
Ion Acceleration Voltage 1,000 v Resolving Pover (appro.) 170 Analyzable Range below Cj Q group Ionization Voltage 80 v Ion Source Temperature 200°C
3.2. Operation: -7
When the instrument vas evacuated to the order of 10 mm Hg, degassing vas performed by maintaining the sample temperature at about 90°C. This condition vas attained by only heating the ion source to 200°C.
It took about I5 minutes to scan from the C-j to the C^g group. The repeated runs represented no marked decrease in ion intensity. Memory effect was examined by stopping the heating of the furnace before the elevation of teraperature to a higher value. About half an hour was found to be sufficient to reduce the ion intensities to the amount corresponding to the initial temperature of 90°C. In conclusion, raeraories were observed to be not essential in this case.
k. Results and Discussion
4.1. Mass Spectra:
In addition to Marlex, Hostalen GD was subjected to the analysis. Hostalen is a polyethylene raanufactured by the Ziegler-process. The nominal molecular weight is 70,000, the same as Marlex 5O-I5.
For both polyethylene samples, many peaks were observed in groups for every carbon number to the extend of our upper limit of mass range. An example of the spectra is shown in Fig. 8.
161

ISO soo zso 3CO SSO 400
Diatillatiofi Temperature { 'C)
F ig. 4 D) fteiarivm opuoai i^oaify or Marlex prootcf
C D,„ - (OOJ
'-'40 70 IOO 130 160 I90 220 250 i
Ion Source Temperature fCj
R g . 6 R t k j t i v t Ion Ir t tenslfy vacauo Ion eou ro t
Analyzer Envelope
Ionization Ctiarnber lon Lens
Ion Repe l le r—
TO K30 tM l«0 n o 220 20O StO
Ion Source Temperature Cc) Fig. 7 The modified ion eource
F i g . 5 lortlo y l s i a v r e u e i on sounw femperofur*
162

The characteristic features of these patterns are summarized as follows: 1) The peaks having the highest intensity is the Ci H ion for both saraples and over the
entire range of temperature. 2) Peaks are distinctly divided into groups according to their number of carbon atoms. 3) Each group consists of CnH^+i, CnHgn-l. O ^ E ^ , CnHjn-2 and lover Intensity ions. In
all groups except Cg-Cg, the CnH2n+ihave the largest and C Hojj_-| the next to the largest peak in their respective groups. In Cg-Cn groups, the C^Hgn-l have the largest peaks.
k) Total ionization of groups is expressed in the descending intensity Cl^, C3, Cj and the groups having more carbon atoras.
The percentage intensities of C^H^n+l and CjjH .-|_ relative to the base peak are illustrated in Fig. 9 and 10. The corresponding ions of the standard n-C gH lj. and l-CigH-32 are superimposed thereon. The anomalous peaks, of C^Q and Ci]_, vere found to be quite sensitive to the ion source temperature.
In comparing the Cj Hgjj+i patterns of standard normal paraffine with the oorresponding patterns of both polyethylene samples a close similarity was observed. On the contrary the C^H^-i patterns were observed "to come close to those of CX-define.
k . 2 - Reactions at Temperature below 350 C:
In Fig. 11, temperature dependence of typical peaks of both samples vere illustrated in Arrhenius plot. As shown in the figure, the processes of ion production, namely the production of vapor from the polymer sample, were found to consist of two stages: a gradual increase in intensity in the lower temperature range, and a following steeper increase at the higher temperatures. The former is named Process I, and the latter Process II.
Since, in this case, the peak height would be directly proportional to the rate of yield of vapor products, activation energies can be calculated from the figure directly.
For Process II, the activation energies are found to be 24.7 koal/mol and 3''-'0 kcal/ mol for Hostalen and Marlex, respectively. Tvo ionic species in each sample are regarded to behave similarly to each other. These activation energies are rauch lower than those presented by Jelllnek,^ ^ who offered the values of k6-66 kcal/mol, and of Madorsky^'' of 71 kcal/mol. Both authors associated these values to the reaction of thermal degradation in polyethylene.
Although the details of the reactions occurring in these temperature regions are not obvious, it might be speculated that some degradative reactions are taking place. They might be caused by some other reasons than the simple C-C ruptures. Moreover, the temperatures corresponding to the nicks of the curves in the figure are found to be about 290°C and 210°C for Marlex and Hostalen, respectively. The former is in fair agreement to the molecular distillation mentioned previously in Sec. 2.1.
For Process I, activation energies are found to be 6.7 and 5-8 kcal/mol for Ci Hg and OlfH- ions of Hostalen, and 7*6 and 6.5 kcal/mol for the corresponding ions of Marlex. Taking the mean values of all other ions belonging to each sequence, the value for Process I appeared to be 6.5 ± 1 - 2 kcal/mol. Taking into account the limited accuracy of the measurements, the vhole ions which appeared at temperatures lover than the nick could be regarded to have been generated through a reaction.
In view of the low value in the activation energy, the rate determining step in this region can be attributed to evaporation or diffusion of the vapor molecules.
Employing the spin-echo technique, McCall et al'' estimated the activation energy of the self-diffusion of low pressure polyethylene to be 5-3 kcal/mol. The same authors observed the levelling off in the activation energy at about C20-O30 in their experiment on standard hydrocarbons, and they correlated this phenomena with the segnental motion of molecular flow in polymers. On the other hand, Jensen^-^' estimated the vapor pressure of polyethylene (details were not given) by evacuating an oven containing the polymer through an orifice. Jensen reported that the vapor pressure, P, for the temperature range of 30-180' C, was expressible as log P = 7.4 - 4,500/T, which is the equivalent to an energy of activation of 8.9 kcal/mol.
Although both values are slightly different from the result obtained in this paper, McCall's value is rather close to ours. Taking into account the difference in the pump out speed betveen these tvo experimental conditions, it might be concluded that the reaction taking place during Process I is the evaporation of the lighter components included
163

ampl,: Marlex SCHS
Fig.8 A masa apeotwm of po^eltvrene
10 I I 12 13 Number of Carbon Atoms
Fig. 9 Rtiallv, Intmaltn el C,H^„,on* C.H,.-i Ian ot Hostalen OD
14 15
4 5 6 7 8 9 10 11 12 Number of Carbon Atoms
Fig. 10 Rtiatln Inlmtlty al C,H*„, tmd C.H*.., lent ot Marlax 50-15
13 IA 15
164

, 3S0 300 250 SOO ISOftJ
• t o
ta
Hostalen ^ c, H ; CHJ
•
• <;."»
• u
^ \
^ I
\ ^
\ \
X
\
n
y y
Pmcess 11
\ \
V X \ ^
1.6 1.7 IJB 1.9 2.0 2.1 2 2 2 i 2.4
lo'yr'K F i g . I I Ionic yield v.rsu, nolf irocol of waporatlon
tempcratt/n
originally in the polymer sample, and that the rate of the process is determined by the diffusion of these components through the sample.
Therefore, those ions vhich are detected at teraperatures corresponding to Process I could be subjected to the mass analysis.
5. Summary
Tvo samples of commercial polythylene vere heated in the furnace prepared close by the ion source of a mass spectroraeter. From the results obtained by this experiment and the preliminary works, the folloving conclusions are obtained: 1) Many ions vere deteoted vhen the sample vas heated up to about 150°C. These ions dis
play a pattern vhich is characteristic to the chain hydrocarbons having carbon atoms raore, at least, than l8. Cryosooplc determination indicated that the moleoular veight of the Marlex product at that teraperature to be about 500.
2) Arrhenius plot of the ion intensity indicates that the reactions taking place in the sample polyraer consist of tvo stages: Process I and II.
3) Activation energies of two samples corresponding to Process I are appeared to be equal to each other, and to be 6.5 i 1-2 kcal/mol. This value might be correlated to the diffusion process of the volatile components through the saraple polymers.
k) Process II vould be associated to some reaction of degradation. Activation energies corresponding to this stage are appeared to be 3'*-0 and 24.7 kcal/mol for Marlex and Hostalen, respectively.
5) Transition teraperatures from Process I to II indicate the point vhere the degradation in the polymer sample begins to predominate over the evaporation.
6) Thus, the peaks detected at temperatures in Prooess I are those of the ions of volatile components vhich evaporated out of polymer sample.
References
1) S. L. Madorsky and S. Straus, J. Res. NBS., 40, 4l7 (1948). 2) S. L. Madorsky, S. Straus, D. Thompson and L. Williamson, ibid., 42, 499 (1949). 3) B. 0. Achhammer, M. J. Reiney, L. A. Wall and F. W. Reinhart, J. Polymer Sci., 8, 555
(1952)-4) M. J. O'Neal, "Mass Spectroscopy in Physical Research", DBS circular 522 (1953)-5) A. Hood and M. J. O'Neal, "Advances in Mass Spectrometry", Pergamon, pp. 175 (1959)• 6) H. H. G. Jellinek, J. Polymer Sci., 3 , 859 (I9't8); 4, 1; I3 (1949). 7) S. L. Madorsky, ibid., 9, 133 (1952). 8) D. W. McCall, D. C. Douglass and E. W. Anderson, J. Chem. Phys., 30, 711 (1959). 9) Neals Jensen, J. Appl. Phys., 27, l460 (1948).
165

A MASS SPECTROMETRIC STUDY OF PHOSGENE AND ITS INTERMEDIARIES
By: H. R. Harless Research and Developraent Dept. Union Carbide Chemicals Corapany South Charleston, West Virginia
Phosgene (carbonyl chloride) is becoming more generally important as a coraraercial cheraical. Due to recent added interest in this highly corrosive material it appeared imperative that crude product mixtures and refined batches of phosgene be subjected to extensive analytical rectification.
Phosgene is usually produced by the direct reaction of carbon monoxide and chlorine. Chlorine can be purchased from commercial suppliers in a relatively pure state. Carbon monoxide is ordinarily made according to the reaction shown on slide 1.
2 H2O + CO2 + 3 CH4 ^ 4 CO + 8 H2
The carbon monoxide raade from this reaction is corabined with an equal ainount of chlorine at elevated temperatures as illustrated in the lower equation of the first slide.
CO + CI2 ^ COCI2
Analysis of phosgene had been accomplished, in the past, by wet-chemical methods using various techniques, raany of which eraployed modified Orsat equipment. These procedures are lengthy and costly, therefore various instrumental methods of analysis were investigated. Infrared spectroscopy proved to be of value in identifying functional groups of contained impurities but was not amenable to the coraplete analysis of phosgene plus all irapurities. Gas chromatography of commercial phosgene was explored but this method was also deficient due to the reactivity and corrosiveness of the material. The literature is essentially devoid of information about mass spectrometry and gas chromatography of phosgene.
At the Pittsburgh Conference on Analytical Chemistry and Applied Spectroscopy in March of this year W. H. Gunn and R. A. Murie, Diamond Alkali Research Center, Painesville, Ohio, noted that the reactivity and corrosiveness of hydrochloric acid, phosgene, and chlorine gases precluded their separation and determination via gas chromatography. A search of the literature by Gunn and Murie gave no information on this separation. Therefore, the development of columns for their separation was undertaken. A number of columns were investigated; some gave partial resolution, others resolved the component, but gave poor peaks. The substrate raaterials investigated included fluorocarbons, fluoro-silicone fluid, chlorowax, and other halogenated raaterials.
166

Also at the Pittsburgh meeting H. J. Hoenes, H. C. Proehl and Z. Nagy, Pittsburgh Plate Glass Company, Cheraical Division, Barberton, Ohio, described a gas chromatographic raethod for the analysis of oxygen, nitrogen, carbon monoxide, carbon dioxide and chlorine in phosgene. Using a single chromatograph with two colurans mounted on a four-way Teflon valve, their analysis was accomplished in about 30 minutes. With a four-meter column of Fluorolube and a one-meter column of 13X molecular sieve in series, oxygen, nitrogen, and carbon raonoxlde were eluted in tirae to turn the four-way valve causing phosgene to by-pass the molecular sieve column. A second saraple, injected with the raolecular sieve column in the by-pass position, gave a combined peak for oxygen, nitrogen, and carbon monoxide, but separated the carbon dipxide, chlorine, and phosgene. They noted that sample handling and peak height calibration were exceedingly delicate.
Since chemical methods are lengthy and expensive and other instrumental methods were not completely satisfactory, mass spectrometry was explored rigorously in this laboratory. Personal communications with commercial suppliers of phosgene indicated that they considered that it would be irapossible to analyze this material with a mass spectrometer. Our study was undertaken as a last resort.
The most severe obstacles to a study of phosgene by mass spectrometry are, 1. the corrosive nature of phosgene toward the raetals of the instrument, 2. the extreme dipole action upon the interior surfaces of the mass spectroraeter, resulting in memory effects, and 3. the reaction of phosgene with residual raicro amounts of water inside the instrument to form carbon dioxide and hydrogen chloride which is difficult to distinguish frora that contained in the original phosgene. Any water is iraraedlately consumed by the following reaction;
Cl
0=C(^ + HOH > CO, + 2 HCl
^ C l
(As a sidelight I would like to suggest that if you wish to remove all traces of moisture from your mass spectrometers, merely inject a sraall saraple of phosgene and pray for the life of your filament).
After raany attempts to reconcile anomalous results, especially spurious concentrations of carbon dioxide and hydrogen chloride, a conditioning method was developed, wherein a large preliminary injection of phosgene was allowed to reach equllibriura inside the mass spectrometer. It is believed that this pretreatment will involve dipole dislodgement of prior residents, positioning of dipoles upon the interior surfaces, and the reaction of phosgene with residual water.
A period of five to seven minutes with 100 raicrons of phosgene appears sufficient for equilibrium to be achieved by this pre-treatraent and subsequent evacuation of the mass spectroraeter results in stable operating conditions. A rigorous .. program has been pursued which indicates that satisfactory analytical results, for product raixtures, can be attained.
167

A typical analysis of cylinder-grade phosgene lists eight components as follows:
Compound Mole Per Cent
Carbon Monoxide 4.6 Carbon Dioxide 0.5 Hydrogen Chloride 0.2 Carbon Tetrachloride 0.1 Carbonyl Sulfide 0.1 Acetone 0.2 Sulfur Dioxide 0.1 Phosgene 94.2
In addition to these constituents, varying and sporadic amounts of nitrogen, chlorine, dichloroethane, and trichloropro-pene have been observed frora time to time.
Carbon tetrachloride was considered an incongruous constituent until impurities present in the carbon monoxide from the modified water-gas reaction were resolved. Excess methane, one of the materials usually present in the carbon monoxide, is sometimes carried with product carbon monoxide and is chlorinated, primarily, to carbon tetrachloride. An extension of this reaction also leads to infrequent traces of the C-2 and C-3 halogenated hydrocarbons.
Mass spectroraetry can be eraployed to resolve all of the listed impurities in phosgene. The easily predicted ionization raodes of phosgene are seen in the raonoisotopic mass spectrura shown in the next slide.
PHOSGENE MASS SPECTRUM (Monoisotopic)
M/E R.I.
12 0.3 16 0.1 28 2.3 31.5 0.2 35 24.9 47 3.2 63 100.0 70 4.1 82 0.6 98 3.8
Additional demands were placed upon our technique due to the highly corrosive nature of chlorine which is detrimental to metallic parts of the inlet system and ionization chamber of a mass spectroraeter. Free chlorine was eliralnated by agitating product raixtures frora the CO + CI2 reaction with raercury to forra the non-volatile chlorides of mercury prior to injection of the gaseous products into the instruraent. Estimates of the amounts of excess chlorine in certain mixtures were then raade, independently, by gravimetric methods.
ION+
C 0 CO
m e t a s t a b l e Cl
CCl COCl
CI2 CCI2
COCI2
168

CONCLUSION
Mass spectroraetry is araenable to analysis of phosgene in crude coramercial product mixtures and in refined batches of high-purity material. Irapurities inherent to the stepwise reactions leading to phosgene have been identified and resolved by applying unique conditioning raethods. Adaptation of these raethods to process control has been satisfactorily accorapllshed.
169

MASS SPECTRCMETRIC STUDY OP POLYMERIC IONS. A.H. Turnbull, Atomic Energy Research Establishment, Harwell, Berkshire,
England.
In the experiments described in thla paper, gas was admitted to the mass spectrometer through a molecular beam system. Hence gas molecules reaching the lon chamber of the mass spectrometer had followed a collision-free path. The general layout of the apparatus is shown in Pig. 1, ithile the molecular beam system is ahown in greater detail In Pig. 2.
Gas from a reservoir at pressures up to 6 atm. entered the first stage of the molecular beam system tlirough a 0,6 x 10"- Inch diameter orifice. Some of the gas molecules then entered the second stage through a 0,05 Inch diameter orifice. Gas-scattering of raolecules from the beam was minimised by keeping the distance between the first and second orifices as short as possible. This was achieved, as shown in Pig. 2, by mounting the second orifice on a cone. The first stage bolted directly on to the mouth of a 4 inch oil diffusion pump (speed 300 litres/sec), so that a pressure of about 1 torr was maintained within this stage for a reservoir pressure of about 5 atm. The second stage bolted directly on to a 2 inch oil diffusion pump (speed 70 litres/sec.) and was separated from the third stage by a slit 0,400 inch X 0.04 inch. The third stage was in tum separated from the mass spectrometer by a slit of the same size and nas pumped by a 2 inch merciiry diffusion punji with a liquid nitrogen trap (speed 30 litres/sec).
This inlet system and the associated mass spectrometer (6 inch radius analyzer, 90 deflection in magnetic field) were designed and constructed in the Reactor Technology Branch of the U,K,A.E.A. Reactor Group. During e35>eriments carried out there^ using carbon dioxide as the sample gas, polymeric ions of the form (002)^ were reported by Bentley'', who considered three possible sources.
(a) They a r e formed in the maas spectrometer itself, either by ion-molecule reaction or sane other process. Experimental evidence seemed to rule out this possibility.
(b) Polymeric molecules are formed during the expansion of the gaa from the reservoir into the molecular beam system. There was no evidence to show whether or not this v a s the cause. Bentley considered it unlikely on the grounds that an expansion involves, on average, the separation of adjacent molecules. Joule-Thomson cooling was calculated to be less than 6°C.
(c) Polymeric molecules are always present in carbon dioxide. Bentley considered that this was the most probable explanation "in the light of existing evidence".
The mass spectrometer and molecular beam inlet aystem mere transferred ftna the U.K.A.E.A. Reactor Technology Branch to A.E.R.E., Harwell yihere, in the course of further work, the existence of these polymeric ions was confirmed. Their source, however, is still doubtful. The results of two experiments did not support the hypothesis that polymeric molecules are always present in carbon dioxide.
Experiment 1. Two baffle plates, each carrying a 5 / l ^ inch diameter off-axis hole, were mounted inside the cone vAiich carried the entrance orifice of the second stage of the moleoular beam system, »rtille the large end of the cone was closed by a plate carrying a 0.25 inch x 0.042 Inch slit aligned with the entrance and exit slits of the third stage of the molecular beam system. Thus those gas moleciales which reached the ion source of the mass spectrometer must have suffered several thousand wall collisions between entering and leaving the second stage of the molecular beam system. The effect of the baffles was to cause the con5)lete disappearance of the ions (002)^ fron the mass spectrum for n > 1. (The intensity of the CO2 peak vas about 1/5 of the value prior to the insertion of the baffles).
Experiment 2. The gas reservoir and the pipe leading from it to the entrance orifice of the moleoular beam system were filled with 1/8 inch diameter lead shot, thus reducing the gas space to a large nuraber of small volumes irtiose
170

Sample
Molecular Beam System
Magnetic Analyser
Eleotron Beam
Eleotron l u l t i p l i e r
Cold Traps
Fig . 1 . Schematic Diagram of the Mass Spectrometer
and Molecular Beam In le t System
0.0006" Dia 0.05" Dia Orifice Orifice
Prcm Reservoir
0.4" X 0,04" Slit
4" Oil Diffusion Pnmp
2" Oil Diffuaion
Rjnm
Cold Trap and 2" Mercury Diffusion Rirap
Fig. 2. Molecular Beam Inlet System.
To Mass "Spectrometer
171

wall-to-wall dimension was about I/40 that of the empty reservoir. There was no resultant change in the relative intensities of the polymeric ions for a given carbon dioxide pressure in the reservoir.
The resiilts of Experiment 1 show that:
(a) The polymeric ions are not formed in the mass spectrometer,
(b) The polymers are destroyed by wall collisions.
On its way from the gas reservoir to the inlet of the moleculnr beam system, a molecule makes of the order of lo''- wall collisions. Sinoe polymers are in fact observed in the system (and a r e not formed in the mass speotrometer), they must if initially present in the reservoir, be reconsitituted by gas collisions made on the way from the reservoir to the inlet of the molecular beam system, (It was calculated that gas collisions would be about 10^ times as frequent as wall collisions). One therefoie postulates an initiation pro-
m, •m. (monomer)
"•1 ^ Tl, > m^ (dimer)
^1-1 * ""l " % **=•
and a chain tennination process as fol lows:-
K wall ^ nm.
The equation governing the react ion may therefore be w r i t t e n : -
where k and k . are ra te constants , P d
At equilibrium, i3[m j / d t = 0
m" , k [m,] + k. , n -1 p*- 1 •* d whence = — ,—: ^
The rate of chain tennination due to destruction at the wall is proportional to the rate of diffusion to the wall. According to the Einstein-Smoluchowski equation
k. = o 2D /A^ d n
where a = oonstant;
A = average distance to wall;
D = diffusion coefficient for m n n
Now D is inversely proportional to m and so one can write
^ - V^'K"] nAiere k i s a constant for a given value of n .
Then - ^ ^ = 1 + k A2[m«][m,] 11 p n ^
Ttixxa a change in A should caua£ a change in [m _. ]/[m ] , lAiich i s a t variance with the r e s u l t s of Experiinent 2,
172

With the molecular beam system and reservoir in their initial condition, several other gases were examined in the mass spectrometer, with the following results.
He. 0„: No polymers seen.
NgO: Polymers seen up to about (N 0),_
N_i A peak was seen at mass 56, i.e. (N ) , irtiich was about I/6 of the N„ peak. No other polymers were visible at least up to (No)(- • N from the same gas cylinder waa examined in a mass spectrometer with a conventional gas inlet system. No peak at mass 56 was visible.
SOp; Polymers were seen up to (SO )_ at raass 448. Peaks were also present at masses 80, 112, 144, 176, 268 and 240, which correspond to (SOg)^ + 0. When examined in a conventional mass spectrometer, SO- from the same gas cylinder showed only the usua] cracking pattern, with peaks at masses 32, 48 and 64.
It is considered possible that these polymers and complex molecules are created by a shock wave which forms in the molecular beam system, probably between the first and second orifices. By isolating the supply of gas to the reservoir and observing the rate of pressure drop in the latter as the gas passed into the molecular beam system, the mass flow rate of gas through the first orifice was determined, knowing the orifice area and the pressure on its downstream side, the gas velocity was calculated and found to be supersonic.
Experiments are in hand to test the shook wave hypothesis.
1. P.G. Bentley, Nature. 190. 432 (1961).
173

INVESTIGATIONS OF AZIDE DECOMPOSITION REACTIONS BY ISOTOPIC TRACER TECHNIQUE
Donald P. Easter and Amos J. Coleman
Basic Research Group U. S. Army Engineer Research and Development Laboratories
Fort Belvoir, Virginia
The thermal and photolytic decomposition of the metal azides has been the subject of much study, particularly over the past ten years. However, no firm conclusions have been drawn re garding the reaction mechanism. The overall decomposition is usually represented by the equation:
MeNg - Me + 3/2Na
where Me represents any metal. Since this must obviously be a step process we must consider the possible steps which can lead to this overall result. The formation of a neutral N3 radical is generally accepted as the key to interpretations of decomposition of ionic azides. ' Unimolecular breakdovTO of an azide radical to give a nitrogen molecule and an atom in their ground states re quires only 7. 5 kcal/mole but is forbidden by the correlation rules. Dissociation into excited products is permitted, but requires an additional 62 kcal/mole.
Unfortunately, the simple conclusion that the reaction must therefore be bimolecular is not borne out by kinetic studies. The evidence is not completely unequivocal, but a unimolecular process seems to be favored. Moreover, the products are not simply and invariably metal plus nitrogen. Depending upon the reaction conditions and the particular azide under study, varying amounts of nitrides and other products may be formed.
We have attacked this problem through the use of potassium azide labeled in a central or terminal position with nitrogen-15. ' ' (European and American usage differ with regard to the placing of the superscript numbers indicating atomic weights in formulae. In an effort to avoid any possible confusion in this regard, I have placed the superscript numbers directly over the symbol of the element). Figure 1 shows the two N-15 labeled forms of potassium azide. Since the compound is ionic, the two ends of the azide radical are indistinguishable. Below it are shown the three possible nitrogen molecules involving the mass 14 and 15 isotopes.
Two decomposition schemes will be considered, represented overall by the equations shown in Figure 2. Formation of potassium nitride indicated in the second equation may be considered to arise from the reaction of potassium metal with nascent nitrogen from decomposing azide around it, or by some stepwise process which does not involve the intermediate formation of free potassium. An alternative series of reactions in the presence of water can yield ammonia in the same overall stoichiometry without the intermediate formation of potassium nitride.
EXPERIMENTAL PART
The apparatus used in carrying out the decompositions is shown in Figure 3. The quartz r e action bulb is seen at the left of the figure. The gas handling system in which volatile reaction products-were pumped off and measured consists of a recording manometer, cold trap, small diffusion pump, Toepler pump, gas burette, and McLeod gauge. A more detailed diagram of the reaction cell and recording manometer is shown in Figure 4. The pressure change produced by the decomposition reaction was followed by means of a single arm mercury manometer with a resistance wire sealed into the arm holding the moving mercury column. Any change in the mercury level resulted in a change in resistance which was measured and recorded by the circuit shown in Figure 5. This set-up permitted unattended operation of the apparatus for extended periods of time with continuous registration of the progress of the reaction. Figures 6, 7, and 8 show some typical time-pressure curves obtained in various modes of decomposition. In all cases the reaction was continued to virtual completion; that is, until no further pressure change was observed over an extended period of time. The gas waa pumped over into the burette, measured, and transferred to a sample bulb for mass spectrometric analysis and determination of
174

14 14 15 14 15 14 K N N N K N N N
14 14 15 15 N, N N N,
FIGURE I
( I) 2KN3— 2 K * 3N
(2) 3KN, — K3N*4N,
L- 3K0H * NH
*3HeO FIGURE 2
175

isotopic distribution. Water was added to the solid residue remaining in the bulb, resulting in a vigorous effervescent reaction. The solution was then cooled to liquid air temperature, and a second gas sample was taken.
An alternative procedure, used in the photolysis experiments, was to expose a water solution ot the azide sample contained in a double walled quartz vessel to the light from a mercury lamp, GE UA-3. Cooling water circulating through the jacket held the temperature below 15°C during the reaction. After decomposition had apparently gone to completion, the solution was cooled to liquid air temperature and volatile products were pumped off and measured as described above.
Measurement of the isotopic distribution of nitrogen gas was made by standard mass spectrometric techniques. However, in order to make a similar determination on ammonia, it is essential to separate it quantitatively from water, since N-15 ammonia and HgO coincide on the mass scale. This, unexpectedly, proved to be a formidable problem. There are a number of well known procedures for producing dry ammonia gas which are not particularly difficult. But the quantitative removal of a small concentration of ammonia in water solution to permit gas analysis and isotope determination has so far defied all efforts. Chemical drying agents capable under atmospheric pressure of reducing partial pressure of water in a gas stream to <0. 001 mm are ineffective, since the traps must be evacuated to secure quantitative passage of NH3. The gas chromatograph, using packing of polyethylene glycol on fluoropack, gave apparent separation, in that the detector trace indicated no overlap of the water and ammonia peaks, but mass spectrometric analysis of the trapped fractions showed that large amounts of water remained in the ammonia, even after a double pass through the column. By proper control of flow rate and column temperature, separation of the ammonia and water peaks on the detector trace could be extended to any desired time. Fraction cutting could be accomplished with assurance of no sample overlapping. The unheated parts ot the apparatus were flamed for outgassing. Carrier gas was kept running continuously for weeks with liquid air trapping at the inlet and the whole system above atmospheric pressure. Even with all possible precautions that occurred to us, water contamination of the ammonia samples could not be eliminated.
Since isotopic distribution of the product ammonia is an important datum, we are now working on the chemical conversion of the ammonia to nitrogen to permit this determination.
Ammonia analyses to be reported here were made by titration following distillation from the basic solution remaining after the experimental procedure described above.
RESULTS
Our initial experimentation was done with terminally labeled compoimds, simply because this was the material which was most readily available. The results, predictably, were inconclusive. It was found that the fraction of azide decomposing by the metal plus nitrogen route, as indicated by the amount of hydrogen liberated in the reaction with water, varied from a maximum of 11% in the rapid thermolysis runs down to a fraction of 1%. Isotopic distribution of the nitrogen gas obtained in decomposition reactions of terminally labeled potassium azide showed less than half the theoretically expected amoimt of I^ .
Similar experiments made with centrally labeled potassium azide yielded only a fraction of 1% Ns, whereas random recombination of nitrogen atoms should have been expected to give a mixture consisting of 44.4% l^s, 44.4% I^lt, and 11.1% ifg .
The results, in summary, are shown in Figure 9. The relative amounts of hydrogen and ammonia in the products were taken to indicate the percentage decomposition of the azides by the alternate routes. Isotopic distribution of nitrogen in each mode of decomposition for the two types of N-15 labeled potassium azide is shown at the right.
The results are consistent with the hypothesis ot a vnimolecular process. The formation of a free azide radical at some stage of the reactions is neither conclusively supported nor precluded by these findings. However, further studies are in progress in these laboratories which it is hoped will conclusively answer this question.
176

TO PUMPS
Ouortz- Pyrex graded seol
Quartz
FIGURE 4
177

REFERENCES
1. Evans , B. L. and Yoffe, A. D. , P r o c . Royal Soc. (London) A250, 346(1959) .
2. Gray, P . and Waddington, T. C , P r o c . Royal Soc. (London) A241, 110(1957) .
3. J acobs , P . W. M. and Tompkins, F. C. , P r o c . Royal Soc. (London) A215, 265(1952) .
4. Clus ius , K. and Et tenberger , E . , Helv. Chim. Acta 38, 1834, 1843(1955) .
5. Clus ius , K. and Knopf, H. , Helv, Chim. Acta 39, 681(1956) .
6. Clus ius , K. and Schumacher , H. , Helv. Chim. Acta 41 , 972, 2265(1958) .
7. Eas t e r , D. P . , P r o c . 9th Annual Bas ic R e s e a r c h Con t rac to r s Conference and Symposium, USAERDL, 92-95 (1960).
178

D.c. POWER SUPPLY
+ 475v
60,000X1 g o o
^ V
Manometer
Recorder 50 mv
full scale
CIRCUIT DIAGRAM OF RECORDING MANOMETER
FIGURE 5
PHOTOLYSIS OF KN in AQUEOUS SOLUTION 3
300
250
E E
i iJ
cc cn CD UJ on Q.
cn < o
200
150
IOO
50
/
/
1
/ • • /
^
/ /
X / •
i
Lamp
V
off
50 IOO 150 200 250 300 350
TIME. MINUTES FIGURE 6
179

THERMOLYSIS OF KN at 5 4 0 " C 3
175
150
125
e E
UJ IOO IT in in ^ -rr. cr 75 a.
in
< "> 50
25
/
/
/
/
1
/
y-
10 20 30 4 0 5 0 60
TIME, MINUTES
FIGURE 7
70 80 90 IOO
THERMOLYSIS OF KN ot 452<'C 3
150
125
E IOO u ZO in in 7 5 UJ cc Q.
t n
< 50 ID
25 452°C
^
/
/
, /
/
/ "
, / y
A
y
/
)
0 IOO 200 300 400 500 600 700 800 900 1000 1100 1200
T I M E , MINUTES
FIGURE 8
180

Photo lys i s in wa te r solution
2K + 31^
K,N + 4N2
14
. 1415 N N 15 N=
38 .2%
57. 1
•
2K + 3N5
K3N + 4Ns
14
Ns _ 1 4 1 5 ' N N
15
Ns
31 .5%
67.6%
1.0%
Slow t h e r m o l y s i s
2K + 3Na
K3N + 4N2
2K + 3Ns
K3N + 4Ns _
T 14 NJ 42 .0% 1415 N N 50. 9% 15 1^ 7.0%
14 Ns 29.7% 1415 N N 69 .9% 15 NJ 0. 5%
Deflagration
1 2K + 3Ns
KgN + 4Na
14
Ns 1415
" N N 15
^
42. 1%
50. 9%
7.0%
Figure 9
181

AN ISOTOPE DILUTION-MASS SPECTROGRAPHIC-SEALED TUBE MICRQANALYTICAL
METHOD FOR COMBINED OXTGEN DETERMINATION
R. N. Boos, A. Soha, N. R. Trenner
Merck Sharp 8e Dolme Research Laboratories Division of Merck 8G CO., Inc., Rahway, N. J.
One of the most difficult problems in elemental analysis has been the direct determination of oxygen. Giving and Ligett published a ooinprehensive review of the literature in 19kk including 99 references(7), concluding that the methods then available were not wholly satisfactory.
Many papers concerning the direct determination of oxygen have been published during the past two decades 1)2,6,11,15,16,18,19,20,21 giving improvements on or variations of the Schutze method(l-7). Zimmerman(21) adapted Schutze's procedure to the micro scale and Unterzaucher(l-9) vastly improved upon it. The voluminous literature is indicative of the difficulties encountered which included the elimination of air inclusion during the insertion of the sample into the tube, a study of the correct temperature required for the conversion of CO2 to CO, the type of carbon essential to this conversion, the type of furnace that could withstand the extremely high temperature, the purification of the carrier gas, and the effects of the various pyrolytlc gases such as hydrogen, ammonia, hydrogen sulfide, carbon disulfide, and carbonyl sulfide. Unterzaucher(^O) found, too, that corapounds containing phosphorus and fluorine not only produced high results but also had a harmful effect on the tube packing so that subsequent determinations were unsatisfactory.
With these difficulties in mind, it was deemed advisable to study an entirely different technique; one that required no carrier gas, nor an extremely high temperature, n o r any added carbon which might contain adsorbed gases from the air, and yet would be specific for oxygen and thus unaffected by the pyrolytic gases evolved. An isotope dilution procedure similar to those developed for carbonO) Euid nitrogen(12) but involving Ol" seemed to offer an answer to these objectives, especially since this approach substitutes merely the attainment of total oxygen equilibration for the quantitative handling requirements of absolute methods.
Grosse, Hindin and Klrshenbaum(°)9) introduced an isotope dilution method for the direct determination of oxygen. They equilibrated a known weight of sample with a known volume of oxygen containing a known amount of 0^° in excess of the natural abundance in a platinum tube at 60O''-8OO*C. Grosse and KirshenbaumCl^) demonstrated an increased precision by using five to ten atom percent 0-1° enriched gas. Klrshenbaum, Streng and Grosse(l-3) extended the method to include fluorine compounds, and Klrshenbaum and Streng(l^) used the procedure for the determination of oxygen in rubber. The Schutze-Unterzaucher procedure gave low oxygen values for compounds which form difficultly combustible carbon residues, whereas the isotope dilution method gave acceptable results.
The elaborate gas-handling system for accurately measuring and transferring the enriched oxygen to the sample tube required by the above procedure could be eliminated by substitution of a crystalline, nonhygroscopic, Ol°-enriched organic compound that could be readily prepared. It was found that O^^-enrlched succinic acid, meeting these requirements, could be prepared by simple exchange between succinic acid and Ol°-enriched water in a Carius tube at llt5°C for 16 hours.
Preliminary experiments disclosed that, upon pyrolyzing an organic compound in a sealed, evacuated quartz tube at 800°C, a favorable equilibrium was established between CO2 and CO in the presence of the carbon resulting from the pyrolysis of the organic material. Since nitrogen would undoubtedly be one of the pyrolytic products of nitrogen-containing compounds, it was necessary to measure, mass spectroscopically, the ratio of the k6 to kk peaks (C02) rather than the 30 to 28 jieaks (CO).
Initially temperatures ranging from 600°C to 900°C were used for the pyrolysis of mixtures of tracer and sample. The variable mass k6 to kk ratios observed were attributed to the exchange of 0I8 with some 'background' source of O-'-" associated
182

Temp. ° C / l 5
1*00 500 600 700 800 Boo a 600 b
Table I .
Hr s . " o
O.Olt 0 .20 0.51* 0 .90 1.40 0 .035 0 .280
^T
7.13 4 . 6 5 2 . 2 8 1.95
Average
Table I I . •
r,j
.779
.776
.771
.770
.771*
a - carbon coated tube. b - outgassed a t 900 'c / l6 hours.
w
1.355 1.575 1.505 1.U30 1.570 1.620 1.61+5 1.505 1.075
Table
«S
1.595 1.51+5 1.550 1.500 1.605 1.580 1.595 1.51+5 1.015
I I I .
'•s
.290
.322
.309
.298
.310
.318
.319
.310
.323
" 0
.035
.024
.040
.075
.040
.046
.047
.038
.033
FiG. I
I'2/30
IZmmO.D.
5mm O.D.-
I3em.
lOcm.
2mm OD.-*] k I5n
B
A. QUARTZ PYROLYSIS TUBE PREPARED FOR CHARGING. B. CONSTRICTED AFTER CHARGING. C. SEALED UNDER VACUUM. D. PLATINUM WEIGHING-TUBE.
183

with the tube since they proved to be a function of the size of the tracer sainple used. The quantity of oxygen exchanged varied from 0.5 "ig to 1.5 mg depending upon the time and temperature of the pyrolysis. This prohibitively high blank was decreased to O.O5 mg to 0.1 mg of oxygen by utilizing a carbon-coated quartz tube prepared by the pyrolysis of acetone vapor at 1100°C. Unfortunately, however, the heavy deposit of carbon resulting from the pyrolysis of some organic compounds gave rise to a peeling away of the carbon coating from the wall of the tube iresulting in recurrent high background values.
Dahn, Moll and Menassa(5) reported that water resulted from heating oxygen-containing compounds with o-phenylenediamine hydrochloride at 300°C. Boyer, Graves, Suelter and Dempsey recently found that CO2 vas obtained on heating water with guanidine hydrochloride in a sealed tube in a "soft gas flame"('*).
Since It had been observed that the amount of exchange of 0^° with 0^° was a function of the temperature. Table I, it seemed apparent that by adding a mlxtujre of o-phenylenedlamine hydrochloride and guanidine hydrochloride to the sajsple and tracer and pyrolyzing at 400''C, the blank would be smal ler, less significant, and perhaps more reproducible. This proved to be the case and Indeed the blaiik was experimentally determined as about 43 micrograms of -oxygen, a more acceptable value.
Theory - Derivation and Definitions
The mass spectrometer measures:
Il46 _ _ Relative numbers of cl2ol"Ol° molecules . ,
i?*^ Relative numbers of cl^O^^O^^ molecules
Now: _ [N g] " (2)
Eqs. (1) 8: (2) combined: ^ ^ = r ^ ^ ^ (3) 4
but N19 = N^6 ^ 2N'*8
„16 ^ j^6 ^ 2 ^ k
.,18 . . Eq. (3) becomes: 1 = £ (4)
N-16
By definition: f^Q
Hl8
16 N-
l ^ \ N^^ N 1 ^ iji^
which by eq. (4) becomes:
^18 = — 2 (5)
Similarly f^g = - ^ — (6)
A study of the ol° content of the succinic acid tracer carried out using varied specimen weights revealed that there was a significant 0^° background (blank) contributed by the quartz ampule. The magnitude of this background effect was evaluated in the following maimer.
184
1 1 C00CH3
N . ^ S NH2
CH3O 1 ^ ^ CH2CN
y y N02
/ \ HP^'
{ J ^ J HSO,
HOOC / \ S02N(C2H5)2
Table IV.
tji Oxygen
C F
2 0 . 2 2 0 . 7
2 5 . 0 24 .4
2 3 . 2 2 2 . 3
2 5 . 0 2 6 . 0
4, E r r o r
2
3
4
4
H OH Na00C-C-C-C00Na.2H20
OH H
ny NHOH.HCl
COOH
1 0 . 6 1 1 . 0
I "^CONHg 14.4 14.2
y — C 0 0 C 2 H 5 2 2 . 8 2 2 . 9 0 .4 I H
HOOCCH2CH2COOH 54 .2 54 .4 0 .4
55.7 55.4
26.6 26.9
25.4 24.5 CH2NHCOOCH2C6H5
OCH2COOH
NO2 1^3 NHCO K ^ J m^ 33.8 32.7 3
O /CHoCHpOH SO2N/ " 33 .2 3 3 . 4 1
nug ^CH2CH20H (Cont inued on next page)
185

Let the symbols T refer to the succinic acid tracer, S to the sample and 0 to the backgro\ind, then the number of mole atoms of Ol" is given by the following summations:
N 1 8 = !;^ n ' ( J T _ _ ) + ^ ns (2 X lO'S)
Mr ^T + 2 Ms
>. . . >.. -\/ V tracer sample (7)
+ o (2 X 10"3)
background
MJ T rj, + 2 Ms S
+ "o (0.998) 15
W = Weight of tracer or sample in system.
M = Moleoular weight of tracer or sample.
n = Number of 0 atoms per molecule of tracer or sample.
rm = IT"" for tracer only.
554
Wg = Weight of oxygen contributed by background.
2 X 10"3 and O.998 are natural abundances of 0-'-° and O-"-" respectively.
The sought quantity is the weight fraction of oxygen in the
(9) 16 "s Ms
From combination of Eqs. (7), (8) and (9) and let
r = N*" for sample plus tracer pyrolysis:
^ N^k
128 "T XQ. = Mr (r^ + 2)
(rg -rm) + (0.998rg-4 x 10⁻³)w
Ws (4 X 10⁻³ -0.998 rg)
M = 18 n ( ~ ) + 16 n {— ) + 1.008 n„ + 12.01 n T o "rrj, + 2' o V^ + 2' H c
for succinic aoid n^ = 4; njj = 6, n^ = k
In this work r^ = 0.774 & WQ = 0.043 then (10) reduces to:
(10)
186

S02N(CH3)2
S02N(CH2)2
Table IV .
( c o n t i n u e d )
^ Oxygen
_C _F
2 1 . 9 2 3 . 0
E r r o r
4.5
NO2
29.6 30.6
23.0 23.3
N NO
• N N ^ O
= N ^ N=N' HaO
9.8 10.3
30.6 29.9
HO ^ _ _ ^ OH
LEAK-
| 2 % 0 ^
TO AMPULE BREAKER
r V
I'I G .U
l ' " / 3 0
Hg DIFFUSION
PUMP
'y LEAD SHOT
I x J - HOKE ALL-METAL VALyE*4l3 c"...::::]- smm MONEL TUBING
55.2 56.8
STANDARD REFERENCE GAS CO^'*
V— SAMPLE \ AMPULE
\ E V A C U A T I 0 N
ni'%0
-MANOMETER
TO MASS SPECTROMETER
I
TO MERCURY RESERVOIR
187

0.3834 Wm ( r b - 0 . 7 7 4 ) + ( 0 . 9 9 8 rc,-4 x 1 0 ' ^ ) WQ Xo = 2 5 (11)
Wg (4 X 10⁻³ - 0 .998 r g )
JJ ^ 0 .383 W^ ( 0 . 7 7 4 - r g ) - 0 . 0 4 3 rg ^ 2 ) o
_ 0 .383 W^ (rT - r g ) " o -
^S
f o r c a s e where X„ = 1 & Wa = o
(13)
Method
Apparatus - Fig. I shows the quartz pyrolysis tube and the platinum weighing tubes. The latter were made by cutting lengths of 2 mm o.d. platinum tubing and sealing one end by fusing the platinum in an oxyhydrogen flame.
A pot furnace that can be maintained at 400°C.
Consolidated-Nier, Model 21-201, Mass Spectrometer equipped with a modified manifold system as shown in Fig. II.
A modified ampule breaker as shown in Fig. III.
Reagents -
0xygen-l8 enriched succinic acid: 1.6 grams of succinic acid and 1 ml of 65 atom percent 0I8 enriched water are sealed into an 11 mm o.d. heavy walled Carius tube and heated overnight at l45°C. After cooling, the tube is opened and the contents transferred to a 50 ml r.b. flask for lyophilization. When most of the water lias been removed, the succinic acid is further dried to constant weight in a vacuum desiccator.
Guanidine hydrochloride.
o-Phenylenediamine hydrochloride.
Determination of rm -
An approximate weight of between two and four milligrams of the tracer compound are transferred to the platinum weighing tube which is then inserted into a quartz pyrolysis tube. After adding approximately 8 mg of a 1:1 mixture of o-phenylenediamine hydrochloride and guanidine hydrochloride, the quartz tube is constricted in the oxyhydrogen flame as shown in Fig. I-B, evacuated to a few microns, and then sealed off as shown in Fig. I-C to form the pyrolysis ampule.
The sealed ampule is Inserted into the electrically heated pot furnace and held at 400''C for I6 hours.
The ampule is put into the ampule breaker, the latter attached to the manifold of the mass spectrometer. Fig. II, and the system evacuated for ten minutes. The U tube is cooled in liquid nitrogen, the ampule broken and the non-condensible gases pumped off. After replacing the liquid nitrogen with a dry ice-acetone bath, the liberated CO2 is transferred by the Toepler pump to the mass spectrometer for measurements of the 46 and 44 peak heights when succeedingly set to fall on collector #2. In order to determine the peak heights more accurately, the read out devices originally provided with the mass spectrometer were replaced by a multirange Hewlett-Packard Model 4l2A vacuum tube voltmeter.
Let: r^= ^^S.
Table II shows values found for rrp for various quantities of tracer.
188

o''^
Oxygen Function
1 H / W g - -C-NH- , NO2
Table V.
5t Oxygen
Calc. Found
26.2 26.8
Relative Error
2
y
n --
CH,0, =NOH, -COOCgH^
)c=o
J 3 0 * ^ 0 0 0
C:H3C0 1 5 . 6 15 .4
0
NO2 , -C-NHg 1 6 . 9 1 6 . 6
7 . 6 7 . 7
0
-C-NH2 9 . 9 10.lt
0 0 ll II
CILC-, -C-NHg, NOg 1 5 . 8 1 5 . 5
1 5 . 5
23.lt 23.2
0
)! / C-N\ 9 .3 9 . 1
0
NOg, C-NH
-NH-CO-NH-
"" " ^ — 0 1 3 . 5 1 3 . 3 _^CH2
0
0
A " ^ l;-CHg-o- , CH3-SO2-0- •_ 33.Y 3 3 . 6
1 5 . 1 1 4 . 7
/ / \ \ II 11 < NN-C-CHg-O- , CH3-C-0- 3 2 . 3 3 2 . 4
HgPO^-O- , -OH , / C = 0 3 7 . 9 3 6 . 8
0 ll
CHjO, (CH,)3C00- , Cl CgH|,-C-N= 1 4 . 8 15 .2
189
2
14.8
6.6
15.2
14.8
6.9
15.4
0
It
1

Determination of rg -
Since the accuracy of an isotope dilution method is highest when the ainount of isotopically-labeled element approximately equals the unlabeled element content of the sample, the quantity of sample and tracer is so taken that rs = l/2 r^.
An accurately weighed sample, Wg, of the compound tn question is put into one of the platinum weighing tubes and an accurately weighed quantity of tracer, Wf, is put into a second one. The procedure is now exactly the same as that followed for the determination of r^.
Determination of the Oxygen Background, W^ -
Having determined rj for the tracer and rs for a known compound, W Q can be calculated from equation (13). Table III represents the oxygen background effect for various values of Wy, Ws, and rs when rr = 0.774 and succinic acid containing only QIO was used as a standard.
Discussion of Results
As shown in Tables IV and V a wide variety of oxygen-containing organic compounds which included most of the common oxygen functions as well as the Inclusion of elements, such as fluorine, sulfur, and phosphorus were used to test the subject method. It is worthy of note that fluorine, sulfur and phosphorus do not interfere.
Most of the compounds were prepared in our research laboratories and had been submitted for elemental analyses. Each compound had acceptable analyses for all of the elements present other than oxygen as well as having been characterized by a variety of appropriately critical physical measurements.
In Table V the compounds are listed only by their oxygen functions since they were compounds that might possibly have patent significance.
The only types of compounds thus far encountered whioh gave consistently unacceptable results were the coumarans and hydroxy benzoic acids yielding approximately 80 percent of the theoretical values.
References
1. Aluise, V. A., Hall, R. T., Steals, F. C , Becker, W. W., Anal. Chem. I9, 347 (1947).
2. Aluise, V. A., Alber, H. K., Conway, H. S., Harris, C. C , Jones, W. H., Smith, W. H., Ibid., 23, 530 (1951).
3. Boos, R. N., Jopes, S. L., Trenner, N. R., Ibid., 28, 390 (1956).
4. Boyer, P. D., Graves, D. J., Suelter, C. H., Dempsey, M. E., Ibid., 33, I906 (1961). ~
5. Dahn, W., Moll, H., Menassa, R., Helv. Chim. Acta 42, 1225 (1959).
6. Dundy, M., Stehr, E., Anal. Chem. 23, l408 (I951).
7. Elvlng, P. J., Ligett, W. B., Chem. Revs. 34, 129 (1944).
8. Grosse, A. V., Hindin, S. G., Klrshenbaum, A. D., J. Am. Chem. Soc, 68, 2119 (1946). —
9. Grosse, A. V., Hindin, S. G., Klrshenbaum, A. D., Anal. Chem. 21, 386 (1949).
10. Grosse, A. V., Klrshenbaum, A. D., Ibid., 24, 584 (1952).
(Continued on next page)
190

FOR TRUE ORIENTATION ROTATE 90°
SECTIONAL VIEW
AMPULE-BREAKING MECHANISM
References - Concluded
11. Holowchek, J., Wear, G. E. C , Ibid., 23, 1404 (1951).
12. Jones, 8. L., Trenner, N. R., Ibid., 28, 387 (I956).
13. Klrshenbaum, A. D., Streng, A. G., Grosse, A. V., Ibid., 24, I36I (1952).
14. Klrshenbaum, A. D., Streng, A. G., Ibid., 25, 638 (1953).
15. Kirsten, W., Mikrochemie ves. Mikrochim. Acta, 34, I5I (I949).
16. Korshun, M. 0., Zavodskaya Lab., 10, 24l (1941).
17. Schutze, M., Z. Anal. Chem., I18, 24l (1939.40).
18. Sheft, I., Katz, J., Anal. Chem. 29, 1322 (1957).
19. Unterzaucher, J., Ber., 73B, 391 (1940).
20. Unterzaucher, J., Chemie Ing. Tech., 22, 39 (195O).
21. Zimmerman, W., Z. Anal. Chem., II8, 258 (1939).
191

APPROACHES TO MASS-SPECTROMETER GAS ANALYSIS USING PHOTOGRAPHIC-PLATE ION DETECTION
J. W. Guthrie Sandia Corporation
Albuquerque, New Mexico
INTRODUCTION
The analytical technique to be described was developed while investigating the possibility of using photographic-plate ion detection to measure semlquantitatively the normal methane and complex methane in certain gas mixtures. Methane occurs as an undesired impurity in sealed ion accelerating tubes where deuterium and tritium are also present. The complex methane resulted from exchange reactions between ordinary methane, protium, deuterium, and tritium. The samples of interest also contained helium 3 from tritium decay and helium 4 from leak detecting and atmospheric gases. The total pressure in the approximately 100-cc glass and metal sample containers ranged from tenths of microns to several torr. Helium 4 was selected as the single component for method development.
A CEC Model 21-110 mass spectrometer equipped with a room-temperature, glass-inlet system; an electron-bombardment type ion source; and a photographic-plate, ion-detection system were used. Usable resolution to an M / A M = 5000 was available with a-primary slit width of 0. 002 inch. Ilford Q2 plates 15 x 2 x 1/32 Inches were used.
Reasons for selecting photographic-plate ion detection were:
1. Sample size and the desire to cover a wide mass range (36:1 possible on one exposure).
2. High-resolution requirements involved in the complex-methane spectrum.
3. To gain experience with photographic plates for future use in solids analysis. (It has since been found that for solids-analysis work some ofthe problems involving photographic-plate ion detection might be more easily solved using the gas-source, photographic-plate combination.)
ANALYTICAL TECHNIQUE AND RESULTS
Figure 1 is a flow diagram of the mass-spectrometer, gas-handling system. Helium 4 calibration spectra were produced on the plate by the following procedure:
1. A calibration bulb, with volumes equal to the sample container and the special opening device, was attached to the inlet system at the same connection where the sample would subsequently be attached.
2. Helium was introduced to the manifold and calibration bulb. The helium pressure in the system was measured with a CEC micromanometer. Helium was then trapped by a stopcock (not shown in Figure 1) in the portion of the calibration bulb equal to the sample-container volume. The helium in the remainder of the system was then pumped out.
3. The manifold "was isolated from the pumping system, and the trapped calibration gas was expanded to the stopcocks leading to the spectrometer ion source. Three paths, each with different leak rates, were available. A path having a leak rate of 0. 2 cc/sec for air was usually used.
192

CALIBRATION BULB OR SAMPLE AND OPENER DEVICE
A-E - STOPCOCKS
MANIFOLD M. S. ION SOURCE
DIAPHRAGM LEAKS
GAS INTRODUCTION SYSTEM AND MICROMANOMETER
COLD TRAP AND Hg DIFFUSION PUMP
MECHANICAL PUMP
Figure 1. Mass-Spectrometer, Gas-Handling System
MICRONS PRESSURE
Figure 2. Calibration Curve for Sample A
193

4. The stopcock to the selected leak was opened, and after a 1-minute delay a t imed exposure was made . After the f irs t exposure , 5 seconds were allowed to position the plate for a second exposure of the s a m e cal ibrat ion sample . The second exposure was usually twice the length of the f i rs t . Two different exposure t i m e s provided some a s su rance that a usable l ine density would be obtained; however , for some cal ibra t ions and samples only one exposure t ime was used. Fifteen exposures could be made on each pla te . The voltage se lec tor for the e lec t r i c sec tor was used to switch the beam off the photographic plate for exposure - t ime control .
This p rocedure was repea ted with a range of p r e s s u r e s . The ca l ibra t ion bulb was then removed and replaced with a sample container and i ts opening device. The sample gas was expanded to the s ame volume and introduced to the ion source through the same leak used for the cal ibrat ion gas . The same delay and exposure t imes used for ca l ib ra tion were used for the sample .
A record ing microphotometer was used to obtain data from the photographic plate for l ine-densi ty calcula t ions . A cal ibrat ion curve was made by plotting line density v e r s u s the helium p r e s s u r e t rapped in the cal ibrat ion volume before expansion and introduction to the m a s s - s p e c t r o m e t e r ion source . The par t i a l p r e s s u r e of helium in the sample was then obtained from the plot by using the density of the sample l ine .
4 + Two typical r e su l t s a r e given. F igure 2 shows a plot for Sample A where He
was the cal ibrat ion l ine. Only one exposure per cal ibrat ion p r e s s u r e was used . F igure 3 shows plots for Sample B. '^He"'"''' was the cal ibrat ion l ine, and two different exposure t imes were used for each cal ibrat ion p r e s s u r e and the sample . Fo r S a m p l e B , the line density was l e s s than the des i red level , and the sample helium p r e s s u r e was not bracketed during cal ibrat ion. The resu l t s for these typical samples compared favorably with r e su l t s of s imi l a r samples analyzed by conventional m a s s - s p e c t r o m e t e r gas -ana lys i s techniques .
F igure 4 shows data from a single exper iment to de te rmine the argon content of a i r for a s imple check on the method, '^ ' 'A was the ca l ibra t ion l ine , and two different exposure t imes were used for each cal ibrat ion p r e s s u r e and the a i r s ample . Since the argon content in a i r was known to be about 0. 93 mole percent , the range of argon p r e s s u r e s for cal ibrat ion spec t r a was defined when the p r e s s u r e of a i r to be introduced as the sample was chosen. The s tandard inlet sys tem was used for this exper iment . The mole fraction of argon in the a i r sample was calculated by reading the par t i a l p r e s s u r e of argon in the a i r sample from the ca l ibra t ion curves and dividing by the to ta l a i r sample p r e s s u r e measu red with the mic romanome te r . Argon values of 0. 98 and 1. 00 mole fraction percent were calculated from the data. Again the r ecorded density range was somewhat lower than that of the des i red s t ra igh t - l ine port ions of cal ibrat ion cu rves . Also, the l e s s than 1 micron values used for ca l ibra t ions were in a difficult range for the m i c r o m a n o m e t e r .
DISCUSSION
The technique descr ibed for helium 4 analys is depends somewhat upon previous knowledge of quanti t ies expected or upon having sufficient s i m i l a r samples for tes t r u n s . P r e l i m i n a r y tes t s a r e requi red to de te rmine :
1. The mos t des i rab le spec t rum line for cal ibrat ion (whether it be a line p r o duced by a singly or multiply charged ion or from a fragment or parent mo l ecule ion in the case of methane) .
2. Exposure t i m e s .
3. Best leak r a t e and ionizing cu r ren t to use so that exposures of l e s s than 10 seconds may be avoided.
Severa l changes could probably be made to speed up the analys is and include more data on each pla te . These changes might include:
1. Nar rowing the sl i t which defines the spec t rum height so that m o r e exposures per plate could be made .
194

60 SEC EXPOSURES
S5
w Q
30 SEC EXPOSURES
"1 I I I—I—I—r 40 50 60 70 80 90 100
MICRONS PRESSURE
Figure 3. Calibration Curves for Sample B
40 ARGON IN AIR
0.7
0 .6
tn 0 . 5
0.4
60-SEC EXPOSURES
0.3
.1 .2 .3 .4 .5 .6 .7 .8 .9 1.0
MICRONS OF ARGON
Figure 4. Calibration Curves for Argon in Air
195

2. Introducing calibration gas only one time and then plotting data relating line density with quantity of gas through the leak.
4 + 3. When the spectrum of interest is not crowded, such as in the He and the
He regions, several rows of spectra could be recorded by a slight change in the magnetic field after the first 15 exposures. This method has been used in the helium experiment for some samples.
In any event, the method is not rapid; however, for the particular samples of interest the method could be expanded to include helium 3, the hydrogen isotopes, and related components such as HD, HT, and DT.
The method can also be applied to the normal-methane/complex-methane analysis, but a major difficulty is lack of resolution. Singly charged parent molecules and singly charged fragments produced in the mass-spectrometer ion source may produce 70 lines in the spectrum between m/e 12 and 25. Background components also add to the spectrum in the region of interest. A resolution of M/AM > 100, 000 is required to resolve all the normal- and complex-methane species. With a resolution of 5000 and assuming little contributions from fragments containing C or parents and fragments containing
C, then 13 of the 15 ^'C-containing, parent-molecule ions may be assigned for first approximations. However, concentration ofthe various species can greatly alter this approach. Calibration plots would be made from CHj "*• lines. In the sample spectra observed to date, as many as 37 lines have been recorded between m/e 12 and 25. Twenty-nine of these lines have been assigned to the normal-methane and complex-methane spectra.
Our work on this project is incomplete and is likely to remain so for an indefinite time since solids analysis is presently of greater importance.
196

UPPER ATMOSPHERIC ION COMPOSITION MEASUREMENTS
WITH MAGNETIC MASS SPECTROMETER
John H. Hoffman, Charles Y. Johnson, and Julian C. Holmes U. S. Naval Research Laboratory
Washington 25, D. C.
ABSTRACT
Measuremencs to date have shown that the most abundant lon In the
F region of the ionosphere is 0 . Theory predicts that the 0 region yields
to an He region and finally to an H region with increasing altitude. In
order to provide direct experimental identification of these ions, and
possibly of other minor constituents, and to demonstrate the relative
importance of each as a function of altitude and solar activity, a magnetic
mass spectrometer having a 60 sector field and 1-1/2-inch radius has been
developed. This instrument, suitable for rocket or satellite experiments,
has a resolving power of about twenty and is capable of measuring the energy
distribution of ions from 0 to 2 kev/amu. Because the mass spectrometer
has a sensitivity of the order of tens of Ions per cc, depending on Instrument
orientation In the rocket and rocket velocity, it could be used to measure
the lon composition of interplanetary space.
197

OXYGEN OCTTGASSING CAUSED BY ELECTRON
BOMBARDMENT OF GLASS
Jack L. Lineweaver Corning Glass Works Corning, New York
Abstract
A flow system has been used to study the oxygen evolved,
as a result of electron bombardment, from twelve commercial glasses.
A small cathode ray tube, with the aluminum coated glass samples
located near the face plate, is sealed directly to the source of
a mass spectrometer. The samples are bombarded with a 3 x 3/4 inch
television type raster using 150 microamperes of 20 kev electrons.
It has been found that the outgassing, from all but two of the
-t/K glasses^ fits the empirical equation Q=Q<>o (1-e ). In this
equation, Q ts the sum of the oxygen released during the bombardment
time, t, and that evolved during a subsequent thermal outgas. A
mechanism for electron bombardment induced oxygen release is proposed.
198

MASS SPECTROMETRIC INVESTIGATION OF GAS EVOLUTION FROM METALS
John Roboz and Robert A. Wallace
General Telephone 5: Electronics Laboratories, Inc. Bayside, N. Y.
The objective of this work was two fold: first, to extend analytical methods Into the fractional ppm range; and second, to Investigate the mechanism of the gas evolution from metals. The particular metal selected was nickel; the techniques developed, however, may easily be adapted to similar studies of other metals, or even non-metals.
The three major parts of the apparatus are: The extraction system, the gas transfer system, and the analytical system, which is a 21-620, cycloidal focusing mass spectrometer (Fig. l).
Both fusion and hot extraction furnaces were used, and no significant changes were made on the more or less conventional designs, described in the literature (l). One minor modification Is the simple elevator design In the hot extraction tube, shown In Fig. 2 , It consists of a quartz platform, which can be moved up and down, making it possible to remove and re-introduce samples at any time.
In quantitative analytical work the major limitation of the vaouum fusion method Is believed to be the blank; thus our first objective was to reduce Its value. The total blank, obviously, represents the sum of the blanks of the various parts of the Instrument, Since conventional furnaces were used, no reduction in the bleink was expected from this part of the apparatus. Replacement of the chemical train by the mass spectrometer resulted in practically complete elimination of the blank contributed by the analytical system. Also, a very significant decrease in the blank was achieved through the design of the transfer system. Figure J shows a schematic drawing of the transfer system, A detailed description will be published elsewhere; only the more significant features will be discussed here. First, both stop-cocks and mercury cut-offs were completely eliminated by using stainless steel bellows seal valves. Second, the total pressure of the gases of interest in the system was kept at a level of 2-5 x 10"' Torr by means of the pumping system.
The most important component, D-j , Is a 5-stage mercury diffusion punrp, which serves to remove the gases from the extraction system. Fast removal of an the evolved gases from the hot zone Is one of the most significant factors in vacuum fusion and extraction analysis. The pumping speed of D, is 80 liters/sec, and its ultimate vacuum Is 5 X 10"° Torr. The fore-line of the transfer pump connects directly to the fine side of a second diffusion pump. On, providing a straight path to transfer the removed gases into a storage place or directly into the mass spectrometer. The purpose of this second pump is to Increase the accuracy of measuring the volume of the evolved gases. The pump was designed by Naughton and Uhlig (2) to have a constant volume fore-line. This was achieved by sealing an additional water-cooled tube into the condenser, so that mercury atoms with long mean free paths are condensed at a definite point, A third pump, D,, which is a standard pump, serves for evacuation and Initial outgassing and for removal of residual sample gases.
In order to establish the accuracy of the gas transfer system, two different sets of experiments were performed. In Table 1 data for determining reproducibility are shown with a calibrated helium leak. From these data it may be concluded that the reproducibility of the gas transfer system Is essentially limited by the slg^al-to-noise ratio of the detector system resulting in an accuracy within k to 6^,
In a second set of experiments, gas mixtures of similar quantity and composition to that expected from the nickel samples were prepared and transferred through the system. Results of a typical experiment are summarized in Table 2, The gas mixture was prepared right in the raetal Inlet system, and a known portion was taken out and reintroduced as an unknown sample. It can be seen that the transfer may be considered quantitative within about 5 to 6^, always negative. This Is In agreement with results obtained using the helium leak. There was no change in composition Euid this was. In fact, the raajor significance of this test.
As mentioned previously, the principal objective was to obtain low blank values. In conventional vacuum-fusion Instruments, according to an ASM specification (3), a blank of about 0,2 micron-liter/min Is necessary for quantitative determinations using standard operational procedure. Anyone with practical experience well knows how difficult it is to meet this requirement; in fact, the maintenance of low blanks is generally considered to be the major experimental problem in vacuum fusion analysis. With our equipment, it was possible to obtain blank values 5 to 20 times less th£ui those
199

0\
I I
a a
>
t i
I +> 9s o
,-1
!
b O . H 0) +> M o OJ Cl > H C3 H
o a o o
a Ti -H <u a [0 aJ o p tA
> T 4 t i
^ (>* K >
C ^ UA
+5
g . H
+> O IU
s
+>
ft ' H (U a
^ &
> . H • d
OJ
o\ .-<
K t
tys H
C5
d O i
s
200

reported in the literature both for fusion and extraction experiments.
The high vacuum, low blank, gas transfer system, combined with the mass spectrometer could, in principle, be utilized to extend analytical methods into the fractional ppm range. In Table J calculated detectibility limits are shown, corresponding to a reading of 3 divisions on the recorder.
As far as vacuum fusion techniques are concerned, the experlmentel results Indicated, that in spite of the low blanks, and in spite of the use of the mass spectrometer, it was not possible to obtain better results than those using conventional methods. This Indicates that the significance of the blank as a limiting factor is somewhat overestimated and directs attention to the problem of film formation during fusion analysis. Beach and Guldner {k) made an extensive study of the effect of evaporated films on the recovery of gases evolved from metals. Nickel exhibited the worst behavior, the limit of analysis being about 1-3 ppm. This is in agreement with our experiments. Our final conclusion Is that mass spectrometric technique oould be utilized to extend the vacuum fusion method into the fractional ppm range only If major modifications were also made on the furnace system, in order to eliminate or reduce film formation. This aspect of the problem was not pursued any further by us.
In the vacuum extraction type of analysis, the carbon film is totally absent, and the extraction is usueilly performed at temperatures at which the vapor pressure of the metals is relatively small. Therefore, the low blanks and the sensitivity of the mass spectrometer could be fully utilized. We were able to analyze very small gas quantities, originating either as impurities of very low concentration, such as in cathode studies where available samples are small, l,e., milligram size.
In Table •+ data are presented on the reproducibility of the determination of hydrogen In powder rolled nickel. Since the reproducibility of the transfer system has been determined previously (Table 1 and Table 2), the differences in the analyses made under identical conditions should provide infonnation on the reproducibility of the outgassing. The analyses were made in a quartz tube, at 1200° C for 10 min. From these and similar experiments, we may conclude that our data are reproducible within a factor of about two in the fractional ppm region. The limiting factor Is sample Inhomogeneity,
In order to obtain information on the mechanism of the gas evolution, both static and dynamic type measurements were used. In the dynamic studies the mass spectrometer was continuously following the gas evolution.
In regard to the evolution of carbon monoxide, it is generally believed that it is a result of the reaction between the carbon and oxygen content, present as carbides and oxides; there is no carbon monoxide present as such (5), We have contributed support to this theory by showing that the total oxygen content may be recovered as carbon monoxide using only hot extraction techniques, provided there is a stochiometric excess of carbon present In the nickel. This is usually the case In commercial nickel samples. Thus, in order to determine the total oxygen content, it is not necessary to fuse in graphite crucibles. If, however, the carbon content of the samples Is insufficient to convert all the oxygen into carbon monoxide, the quantity of gas evolved is limited by the carbon content.
Experimental data are presented in Table 5 for the evolution of hydrogen from nickel at various temperatures, ' It can be clearly seen that while the total hydrogen obtainable was essentially the same in all the experiments, only a fraction of the total could be recovered at a given temperature, below 1200° C, A step-wise increase of temperature resulted in renewed gas evolution. These experimental data may be examined in view of the two main theories of the mechanism of the hydrogen containment in metEj-s.
The process of the gas evolution from the metal into vacuum is dependent on the internal equilibrium pressure and the freedom of diffusion. The former is a function of the temperature, the quantity of the occluded gas and its mode of containment. The latter is characterized by the temperatvire and the activation energy. In a solution of the classical van't Hoff type, an interstitial solution, the equilibrium pressure of the solution must decrease with increasing solubility, as the temperature is raised, assuming a given concentration. This is a general characteristic of all endothermic occluders. Thus, the gas evolution should continue until all the gas is extracted into the external vacuum, and the rate of evolution should continuously decrease, in proportion to the decreasing concentration. This was obviously not the case In the present experiments,
Smith (6), on the other hand, has questioned the presence of any solid solution in
201

^ ^
P I
r\ ^ d- ITS
r \ OJ
rs cr\ t rA 0 OJ
•
Lr\ r ^
t < \
-=i-VO
M
OJ r A
ro
vo CO
H
LTN .-1
OJ
r A OJ
OJ
O OJ
r A
CO CO
OJ
d
j -LA
f A
vo LA
H
CO VO
Oj"
s H
O
&> lA
VO ITS
H
d
OJ I A
NA
vo CO
OJ
* CVJ o
J
H OJ
t o
t A OD
t A
I A J -
oJ
H H
OJ
. I t ITO
H
•P 1^
•ll •H a *
l A OV
OJ
'i g OJ
5
CT\ o OJ
1 u > <
8 OJ
1
s
o d
CO
o d
o CO
C\J
> + 4J
+> •H
O ^1 o
o d
o d
!3 &
o
d
^ ^
S .3 O
202

the case of endothermic occluders, and has assumed that the absorbed hydrogen resides in lattice defects, so-called rifts or pockets. The opening and closing of these rifts, resulting from both mechanical and heat treatments, completely control the presence and distribution of the hydrogen. Our present experimental data appears to favor the rift-occlusion theory rather than the classical-type lattice solution, since complete outgassing could not be achieved at any given temperature, and an increase in temperature resulted In renewed hydrogen evolution. In addition, if samples were removed by means of the elevator, after extraction had been completed at a given temperature, and later Introduced at the same temperature, additional hydrogen was released, . Although the quantities involved were very small, hardly exceeding the limits of detectibility, the trend Is Important, Again this can be explained by the rift-theory, assuming the opening of new rifts after the re-introduction of the samples,
in Fig, k dynamic measurements of the evolution of hydrogen are shown. It can be seen that after 2 min, the extraction Is complete. The hydrogen peak actually starts to decrease, which is, of course, a consequence of the continuous pumping through the leak. The desorption of gases from thin plates can be treated mathematically as a special case of Flck's law, and the coefficient of diffusion may be evaluated from a plot of the logarithm of the rate of evolution against time, assuming that the physical dimensions are known. From such an analysis, it was shown that the mechanism of the hydrogen evolution at a given temperature is completely diffusion controlled.
It must be emphasized here that these samples were "taken from the shelves," l.e,, the hydrogen content originated from the actual manufacturing process. In a series of experiments using the same nickel materials, all the hydrogen was removed by pumping at 1200° C for severed hours, and hydrogen was Introduced via diffusion, by simply heating the samples in a hydrogen atmosphere. In this way, we were able to introduce about the same quantity of hydrogen as the samples originally contained. Next we analyzed these ssmples to recover the hydrogen introduced and to observe whether the step-wise evolution also occurred. It was found that all the hydrogen introduced artificially could be removed at any desired temperature, and subsequent Increase of the teinperature did not result In additional hydrogen evolution. Experimental data are shown in Table 6, The total quantity of hydrogen can be seen to be the same, regardless of the temperature of the extraction. The mechanism of the release was found again to be controlled by diffusion. These experiments were also repeated using deuterium saturated samples, and the results were the same. Incidentally, use of deuterated samples enabled us to determine the diffusion coefficient of deuterium in nickel and Its temperature dependence which has not been previously measured. These experiments will be published elsewhere.
In summarizing these experimental results, we may conclude that the characteristics of the thermal evolution of hydrogen in nickel are dependent on the mode of contaliament, which, in tum. Is determined by the experimental conditions of the absorption of the gas. In cases where the gas absorption is purely diffusive in nature the containment Is In interstitial solution, and the total quantity of gas can be released at a given temperature. However, in cases where the gas content originates during manufacturing of the material as a result of chemical reactions on the surface, probably Involving water vapor, and where the metal is exposed to mechanical influence, the containment is in lattice defects and only portions of the total quantity can be released at a given temperature. The mechanism of the gas evolution In all cases is diffusion limited.
In the course of this work, it was observed that at 1200° C, after all the hydrogen was believed to be removed, a very slow hydrogen evolution persisted. At first this was considered to be due to an increase in the instrument background. Also the vacuum system as a whole and its various parts were accused of gettering and subsequently orutgasslng. This extraneous gas evolution, however, could be stopped easily by removing the samples from the hot zone by means of the elevator; this showed that the phenomenon was real. The quantity of this residual gas. In a 1 to 2 g sample, barely exceeded the limit of detectibility. Although the gas increased with increasing sample size, the linear relationship foimd between the weight of samples and the partial pressures in the case of the readily diffusible hydrogen was not followed. An example of a dynamic measurement may be seen in Fig. 5. This clearly shows that while all the hydrogen evolves in a matter of minutes, the peak does not decrease the way one would expect as a consequence of the pumping out of the mass spectrometer reservoir. Here it appears that approximately the same quantity of gas was evolving as was being pumped out. From leak rate calculations the quantity turned out to be about 0.01 ppm/mln, and the evolution continued for several hours, exhibiting a slow decreasing tendency. The study of the residual hydrogen Involves experimental difficulties since it occurs at only higher temperatures, where the vapor pressure of nickel is already such that intensive film formation takes place. This makes quantitative determinations almost Impossible.
203

TABLE 5
Temperature Outgassing Hydrogen
°C
300
600
800
1000
1200
1st
2nd
3rd
1st
2nd
1st
2nd
1st
2nd
1st
2nd
3rd
kth
^i - l /g
5.6
3.6
1.7
10.9
8.0
ppm
0.6
O.k
0,2
1.2
0.9
8.0
3.0
3.0
1.0
1.0
2.0
0,2
0,2
0.2
Total
2.6
25.5
0.9
0.3
0.3
0.1
0.1
-0.2
0.02
0.02
0.02
0.26
2.76
hi-l/g ppm p.-1/g
22.1
•
S2.1
0,6
0,6
3.6
0,6
k.2
2,0
0,2
0,2
0.2
2.6
29.5
2.1+
2.4
0.06
0.06
0.3
0.06
0.36
0.2
0.02
0.02
0.02
25.6
O.k
0.2
0.2
0.26 26.4
3.08 26.4
ppm
2.8
0.04
0.02
0,02
2.88
2.88
*Below limit of detectibility
204

The existence of this so-called residual hydrogen was previously observed In the outgassing of Iron, and was considered as a unique phenomenon (7). It is apparent now, that the same phenomenon also occurs with nickel, except that the quantities involved are smaller, In fact so small, that only the mass spectrometric method makes it possible to detect them. It appears from the kinetics of the evolution, that in whatever form the residual hydrogen Is contained, it must be firmly bound and the release imist be controlled by factors other than diffusion. This suggests the presence of ccmpounds such as water or a slowly decomposing hydride of an Impurity. Finally It should be mentioned that in the experiments with charged samples, no increase of the residual hydrogen was observed, indicating that no hydrogen entering via diffusion forms residual hydrogen. Also, in the case of samples charged with deuterium, no residual deuterium was observable. Thus the residual hydrogen must be a consequence of the complex processes that take place during the absorption of hydrogen in the course of the memufacturing of the metal, resulting In a different mode of containment.
In summary, an experimental technique has been developed for studying gas evolution from metals using conventional extraction devices, an advanced gas transfer system and a mass spectrometer as the analytical tool. Experimental information was obtained regarding both the mode of containment of the gases in nickel and the mechanism of their release. In addition, quantitative methods for the determination of gas content by means of hot extraction techniques were extended into the fractional ppm range.
References:
(1) Z. M. Turovtseva and L. L. Kimln, "Analysis of Gases in Metals", Consultants Bureau, New York, I962.
(2) J. J. Naughton and H. H. Uhllg, Ind. and Eng. Chem., Anal. Ed., 15, 750 (1943).
(3) "ASTM Standards on Electron-Tube Materials", ASM, Philadelphia, Pa., 1957, p. 212.
(4) A. L. Beach and W. 0 . Guldner, Anal. Chem., 51, 1722 (1959).
(5) C. J. Smlthells and C. E. Ransley, Proc. Roy. Soc. London, A. I55, I95 (I936).
(6) D. P. Smith, "Hydrogen in Metals", Unlv. of Chicago Press, Chicago, 1948,
(7) M, L, Hill, "Hydrogen Embrittlement In Metal Finishing", Reinhold, New York, 1961, p. 46,
205

Fig. 1 - View of the Apparatus
SAMPLE CHUTE
MAGNETIC SLUG
QUARTZ ELEVATOR
n o . 7 . QUARTZ TUBE WITH ELEVATOR.
206

n G . i .
SCHEMATIC DRAWING OF GAS TRANSFER SYSTEM.
iAziiy
207

TABI£ 6
Evolution of Hydroji en from Charged Samplea
Outgassing #1 #2 #5 #U #5
Quantities expressed; jil/g
1st
2nd
3rd
iBt
2nd
1st
2nd
1st
2nd
1st
2nd
}rd
53.0
6.0
<0.2
<0.2
<0.2
<0.2
O.ll
O.lt
0.2
32.1
<0.2
<0.2
<-0.2
0.6
0.2
0.2
30.6
<0.2
<0.2
<0.2
<0.2
0.2
3't.O
0.2
0.1.
<0.2
32.8
0.2
<0.2
Note: All 5 samples charged under identical conditions.
f jd i i n 0 (I u (1 0 n ll (t (111 (.1111111 (I 0 0 01111 (1111111II11111) n i) ' no. 5.
208

The Effects of Surface_ Reactions pn_ Ma_s_s_ Spiectra
Dwight A. Hutchison, John W. Kraus, Louis G. Pobo
Argonne National Laboratory, Argonne, Illinois
Introduction
A number of effects called "memory effects" are well known to those concerned with mass spectrometrlc analyses, particularly where great precision of analyses Is a matter of concern. If we eliminate electrical effects, e.g., polarization of input resistors to an electrometer, there still remain many disturbing "memory effects" with which to contend. It is well known that one must condition a mass spectrometer to obtain reproducible results. Baking at 250-300°C is a usual method of cleaning a vacuum system to rid it of adsorbed gases. Dependent on the gaseous adsorbing power of the metal from which the ion source box is constructed, varying amounts of gases introduced for analyses will be adsorbed. Before another sample can be analyzed, it is necessary to remove these gases so that they are not a source of interference to subsequent analyses. Methods used to eliminate these adsorbed gases consist of further baking, the introduction of a gas to be analyzed for a period of time necessary to displace the previously adsorbed sample, and the introduction of a gas which adsorbs more greatly than the previous sample yet has no ion peaks to interfere with the next sample to be analyzed.
As an example of the latter consider the isotopic analysis of carbon dioxide whioh is readily adsorbable on many metal surfaces, particularly Nichrome V or various steels from whioh most ion-source boxes are constructed. A technique of known practicability is to condition the ion-souroe with argon which apparently is more readily adsorbed than is carbon dioxide. In this manner the ion peaks due to m/e 40, 38, and 36 from argon do not interfere with the m/e 44, 45, and 46 peaks from carbon dioxide. It is commonly accepted that the reason for these procedures is to eliminate the Isotopic exchange reactions occurring on the surfaces in the ion-source region.
Inasmuch as 10 -'-IO colllslohs-cm -sec" occur between the gas and the ionization-box walls under usual operating conditions, it is not surprising that surface reactions occur. Yet, the ideas expressed in many published papers appear to neglect the possibility that surface reactions may obscure the observed ion currents which are thought to be due wholely to gas phase processes. It is our purpose here to review possible tests for surface and gas phase reactions, and to present some Illustrations of these tests wherein a typical electron-beam ion-source was employed.
Posslble^Tests fpr_ Surface Reactions
(a) Klrietic Order - The most definitive test as to whether a suspected secondary lon results from a surface or gas phase process is a determination of the kinetic order of the observed ionic current with respect to the various possible reactant molecular and ionic species. Since the composition of a gas is held oonstant during the course of observation, the kinetic order may be obtained from a record of ion current as a function of gas sample leak pressure if the leak is effusive. A log-log plot of the observed ion current versus leak pressure yields a straight line, the slope of which is numerically equal to the kinetic order with respect to the reactant species. If a first order plot is obtained for a secondary ion the atomic ion composition of which cannot have resulted from any one of the various possible reactant species, then there is evidence favoring a surface reaction for the formation of the secondary ion.
Post-Doctoral Research Fellow, 1957-58. Present address: The M. W. Kellogg Co., Jersey City 3, N. J.
Based on work performed under the auspices of the U. S. Atomic Energy Commission.
209

F i g . 1 . L o g - l o g p l o t of 1 - , 1,, , a n d 1,, f.+ v e r s u s l e a l c - p r e s s u r e . 1 2+ J^2+ 2
IOO
- 10
cr
u
- I 1 1—I—r
Blend Compos i t i on
9 3 . 9 4 % D2
6 .05 % N2
1.0
Slope
A N2D+ 2.00 ± 0.05 O 0^ 1.00 ± 0.05 D N t 1.00 ± 0.05
_J 1 1—L_L
1.0 10 IOO
LEAK PRESSURE ( m m H g ) •
Ig. 2. Log-log plot of 1^ ^, I Q _ , and Ij g versus leak-pressure.
100
- 10
LU CE CE
o
B l e n d C o m p o s i t i o n
8 4 . 3 % Hg
15.7 % O2
1.82 + 0.05 2 0.99 ± 0.05
05 1.04 + 0.05 1.09 ± 0.05
• l l l l I L
1.0 10
LEAK PRESSURE ( m m Hg)
IOO
210

(b) Ion Current versus Time - If a gas leak which separates the sample coritaTner~ahd ion-source region has been shown to exhibit effusive flow, then a linear relation between observed primary ion currents and gas sample pressure exists. Under these conditions a primary ion current villi decrease exponentially with time. If tvjo primary species react to fox'm a secondary ion species in the gas phase, then plots of the logs of the primary and secondary lon currents versus time yield straight lines, the slopes of which are related by,
k^ + k^ = kg (1)
where k is a slope, and the subscripts 1, 2, and S refer to the reactant species Mi, Mg, and the secondary species S, respectively. Gutbier-'- has shown Eq. (l) to hold experimentally in the case of reactions between Hg and Hg, Ar, Og, Ng, COg. If relation (l) does not nold, tnen one may suspect tne occurrence of a surface reaction.
(c) Ion Current versu^jremperature_of_^Ion;-SouT^ - It is well known that the 3ensTty~o? adsorbed molecules on~a surface depends exponentially on the reciprocal of the absolute temperature. Thus, tne ratio (li-)-ig)/ig wnere 1 is an ion current should remain essentially constant for a gas phase reaction and should vary considerably for a surface reaction. Under a given set of experimental conditions, one may record the various ion currents from the time when the electron beam filament Is turned on until it has heated the ion-source to some equilibrium temperatures. If the above ion-current ratio varies greatly, we may conclude partial evidence for a surface reaction.
(d) Change of Kinetic Order with Ion-Box Surface - The change of the kinetic~order or~"ii~reaction with a change in the^material or surface from which a reaction vessel is made is well known. Thus, if the inner surface of an ionlzatlon-source is changed, we may obtain information as to how to produce a surface or gas phase reaction.
(e) Chani e of Kinetic Order with. Gas Composition - If two reactant gases which adsorb differently on a given metal are Introduced into an ion-source, then In principle the surface coverage of reactant species may be altered which may alter the kinetic order. The change of kinetic order with gas composition allows elucidation of the reaction mechanism.
( ) Ion Current versus Repeller Voltage pr Electron Current - In principle, we might "expFc?~some "difTerences oT^surJace reac tion sTroiri gas phase reactions in plots of ion current versus repeller voltage and in ion current versus electron current. It would appear, however, until the effects of changing space-charge are better explained, that these plots lend little practical value in distinguishing between gas and surface reactions.
Illustrations of Methods
We wish to Illustrate the above listed tests from data which we have collected on the following reactions,
^2 "*" y ~* ^2^'^ "*" ° ( )
H^+) + 0^+) -» H0+ -h H (3)
CO ''" + O "*" -> COg + 0 (4)
where the symbol (+) Indicates that either of the reactant species may carry the positive charge.
In Figure 1 we have plotted the logs of iNgD+> IN2+' "" D?"^ versus the log of the leak pressure for reaction (2). The slopes for the reactant species are seen to be 1.00. The slope or kinetic order for the product N2D+ is 2.00. Thus, it would appear that reaction (2) occurs in the gas phase.
In Figure 2 we have made plots for reaction (3) similar to those in Figure 1. Again, the formation of reactant ions H2'^ and 0g+ is first
211

c o
• -
IA O
a. E o O
c V
O
1^
<n *
(D
O O
cn N sZ \ \
a> a. o
CO
— o +1 o cvi II
o +1 o
•
c o t tn o Cl
e o
TJ
0)
03
O O
a« to
o if>
CJ
o >y r>-0)
*
E E
O K
w (/) UJ Q:
< UJ
o o
(stmn qjD) lN3aanO NOI ^ 0 0 1 t i l l — I — I I I i _
212

Table 1. Variation of preBQure-order for formation of H0„ from gaa( varying In Hg-Oo composition.
PRESSURE DEPENDENCE OF HOg WITH
BLEND COMPOSITION IN Hg-Og MIXTURES.
Blend Composition
Hz
84.3
64.2
50.3
38.6
19.6
(%)
Os
15.7
35.8
49.7
61.4
80.4
Pressure Order
I.8Z
1.42
1.18
0.99
0.97
order with respect to pressure. However, the formation of the secondary ion HO2"'' changes from second order at the lower pressures to first order at the higher pressures. We may conclude that a gas phase reaction predominates at lower pressures and a surface reaction at higher pressures.
In both Figures 1 and 2 the data were collected with an ion-source constructed from Nichrome V metal. In Figure 3 we present data for reaction (4) for which a gold surface in the ionization box was used as well as a Nichrome V surface. It is seen that with the gold surface the formation of COg-f- Is second order with pressure which indicates a gas phase reaction, whereas a surface reaction is Indicated for the Nichrome V surface.
In Figure 4 we show a plot of the log of 102"*" ^H2'^' ' ' %02"'" " ^ psus time for reaction (3) using a gold surface for the ion-source. We find that the sum of the slopes (kHg-fkog) is equal to 6 ,k x 10-3 min.-l while kj[02+ ^s 6.5 X 10⁻³ mln.-l. This confirms Eq. (l) and a similar plot given by Gutbier.I One may conclude that a gas phase reaction is occurring. However, it is seen from Table 1 that the kinetic order for formation of HOg+ on a Nichrome V surface from the same gas mixture is 1.18 which indicates a predominant surface reaction.
In Table 1 we show how the kinetic order for formation of HOg by reaction (3) changes with gas sample composition when an ion-source made from Nichrome V is used. The interpretation of these data follow closely the work of Langmuir2 on platinum surfaces at higher temperatures where the oxygen is preferentially adsorbed instead of hydrogen. A similar explanation may account for our observed pressure-order changes.
We should like to mention that if two species react on the ion-box surface then we could obtain an experimental kinetic order of 2 even though a surface reaction were occurring. To eliminate such a case would require the variation of gas composition in conjunction with the other tests listed.
Conclusions
We have presented some methods for testing whether observed ion currents result from gas phase or surface reactions in the ion-source of a mass spectrometer. With these tests we have shown the existence of surface reactions occurring on the inner surfaces of the.ionization box. These processes could easily have been interpreted as gas phase reactions if the tests had not been run. It is our hope that these tests will be utilized by those who appear to consider all ions of a mass spectrum to be formed by gas phase processes.
References
-""H. Gutbier, Zeit. f. Naturforschung 12a, 499 (1957).
^I. Langmuir, Trans. Faraday Soc. 1?, 621 (1921-22).
213

(55) THE ANALYSIS OF GASES IN TRANSISTOR PACKAGES
USING AN ULTRA HIGH VACUUITI MASS SPECTRO^niiTER SYSTEM
P. D. Bavddse
Philco Scientific Laboratory
Blue Bell, Pennsylvania
Extended Abstract
The work described is part o f a s t u d y o f t h e f u n d a m e n t a l aspects of transistor failure. Some transistors that fail during aging tests show partial or complete restoration of their original characteristics following puncture of the transistor package. To further investigate this effect a device was constructed which would enable measurement of transistor properties during evacuation of the package, followed by the admission of another gas. A mass spectrometer was used to analyze the gas originally in the package.
The mass spectrometer used was a CEC 21-612 tube with an adsorption type forepump and a triode getter ion pujap. The system was all metal (except for a Bayard-Alpert ionization gauge) and bakeable. Preliminary experiments carried out with a non-bakeable mass spectrometer (CEC 21-103C) have given inconclusive results, because of the elution of gases, notably water vapor, from the walls of the system during the analysis.
Figure 1 shows the gas sampling device. The transistor can is punctured by using the movement of metal bellows to drive the can against a metal pin. The package is supported by a holder mounted on a flange which-has ceramic insulated feedthroughs for electrical connection to the ti-ansistor. The outside guide tube aligns the package during puncturing and carries a stop which keeps the bellows extended. On withdrawal of the stop by turning the lever to the "up" position the vacuum pulls in the bellows and forces the transistor can against the puncturing pin. By turning the lever another 180° to the original "down" position the transistor is moved up again. The whole operation may be performed with the index finger in about a second. The gas released is leaked into the mass spectroraeter section of the system.
Figure 2 is a photograph of the tiansistor can puncher mounted in the vacuum system. In the photograph is shown attached to the guide tube a microswitch which makes contact with the ring holding the cam when when the transistor package is punctured. The switch closes a relay circuit which activates a camera mounted on the screen of a transistor curve tracer. This permits recording of transistor characteristics as a function of time during the puncturing operation. A similar arrangement serves for examination of the transistor characteristics during admission of other gases.
The analysis of the results is complicated by the large number of variables in tr;;nsistor manufacture. As would be expected the detailed relationship between transistor characteristics and gas environment depends very much upon the particular type of transistor examined. The curves shown at the meeting illustrated some of the types of behavior seen, but the systematic investigation of these effects is, as yet, incomplete.
214

z 0. z < a: o
z
215

Analysis of Gas in Glass Diodes VJittiout Diode Destruction
h . A, Meyer, Atomics International, Canoga Park, Calif.
J, Brandewie, Autonetics, Downey, Calif.
Persistant failure of several types of glass enclosed diodes to meet performance specifications led to a request for analysis of the gas contained within the envelope. It was further requested that the diode junction be preserved to allow electrical testing, etching, etc. after the gas had been renioved. The second reTue.st precluded employment of standard vacuum crusher techniques and the apparatus shown in slide 1 was developed. This is of course a modification of the common magnetic hammer techninue and provides a method for limiting the travel of the punch.
The glassware Is based on a 55/50 standard taper joint. The punch and diode block holder shown in the slide detail was fabricated from brass. It provides opposing screws for holding the diode mounting blocks and also for centering the diodes under the punch. The top portion of the punch is threaded for the travel limiting nuts. The male member of the 55/50 joint was sealed, flattened and 2 electrical leads sealed through the eds es of the section. The punch and diode block holder was then cemented to the flat section with epoxy cement. The desie;n of the female Dart of the joint is obvious and contains the hammer guide and provision for connection to the mass speotrometer inlet system.
In operation the diode was mounted on a small steel block with epoxy cement as shovvn in the slide detail. Care was used to insure that the lead wire-glass junctions were covered and that envelope sides were well imbeded in the cement. R-313 bondini^ agent from the Carl H. Biggs Comoany, Santa Monica, California, was used throughout this work. It is a room temnerature short cure time epoxy cement.After a 24 hour precautionary cure period, the diode and block were placed in the apparatus. The punch travel limiting nuts were adjusted so the point would just contact the diode when a 0.020" shim was placed between the nut and the top of the holder. Thus, when the shin was removed, the point could penetrate 0.020" into the diode envelope. The diode lead wires were soldered to the electrical test connections and the female part of the joint sealed on with apiezon W. The apparatus was then connected to the mass spectrometer inlet and evacuated. The hammer was lifted with an external magnet and dropped to drive the diode punch into the glass envelope thus releasing the gas for normal volume measurement and mass spectrometer analysis.
During the testing of a large number of diodes only one junction was broken when the glass envelope was opened.
The test results, while not germane to the paper title, are interesting and conclusive. For example, while one set of 5 good
diodes averaged 5 x 10 standard cc of the typical nitrogen-areon carbon dioxide mijcture of combustion gases, 4 out of 5 failing
-3 diodes contained 9 x 10 cc of air containing the normal amount of oxygen and up to 5% trichlorethylene. The increase In gas volume and the presence of both oxygen and trichlorethylene used as a cleaner after sealing were positive proof of leaks in the diode envelope.
216

S- /V- 62. 9305-/355
217

RESIDUAL GASES DURING OPERATION AND
LIFE-TESTING OF POWER KLYSTRONS
Lowell Noble and Robert K. Walts Eitel-McCullough, Inc.
San Carlos, Cal.
ABSTRACT
The gases present during exhaust processing, operation, and life
testing of high-power klystrons were analyzed using a Diatron mass spectrometer.
During bakeout at 500 C, hydrogen, water, carbon dioxide, and methane were
evolved. Carbon dioxide, methane and carbon monoxide predominated during
cathode conversion. Electron bombardment of internal tube parts released
carbon monoxide. After seal-off, the pressure was 10 Torr (carbon monoxide,
methane, hydrogen). One hundred hours of klystron operation reduced the
pressure to 10 Torr (carbon monoxide, hydrogen). Microleaks in a sealed
klystron resulted in the appearance of argon; neither oxygen nor a mass 28
increase were detected. The argon disappeared during klystron operation.
218

SOLUTION OF LINEAR SIMULTANEOUS EQUATIONS
by
J , Leonard
Tidewater Oil Company Martinez, California
Abstract
A computer program for solving linear simultaneous equations is presented which works directly on a stored table of coefficients. No transfer matrix is required and the entire operation, including setting up the table of coefficients, can be bandied by non-technical personnel. Input data and output printout orders are completely independent of each other and the arrangement within the computer storage. The program currently in use involves a 26 x 26 matrix with 9 items of supplementary information. It provides submatrix operations of any order and is completely stored within the drum capacity of an IBM 650 computer. Computing times vary but are generally comparable with square inverse calculations of the same order.
Introduction
The purpose of this program is to provide a system which:
1) Calculates mass spectrometer and other data related to the analysis of hydrocarbon and gaseous mixtures.
2) Is as secure as possible from operator or key punch confusion.
3) Can be maintained and operated entirely by non-technical personnel.
4) Requires as little knowledge of computers or computer programming for set up or operation as possible.
Three versions of the program have been prepared:
1) The original version which was written in September 1957 for use on a Burroughs E-lOl computer,
2) A version for a basic IBM 650 computer with alphabetic feature which was written in 1959 and until recently was the version used.
3) An IBM 1620 version which is now in operation.
Some features of the original program were incorporated %^%o a program described by J. M, Gillette of Tidewater's computer department, \- / This IBM 650 program preceded our own IBM 650 version but was not adaptable to our needs for several reasons, including limitations on available storage space.
The comments which follow apply particularly to both the IBM 650 and 1620 versions. Both versions use identical key punch forms for all constant and data inputs. The routines have the following features:
1) No transfer matrix of any kind is used.
2) Input, matrix and output can be independently altered.
3) Tbe program instructions cannot be upset by any known key punch or data errors. Operations will either cease with an alarm or, in the case of improper data, will print out the defective case and then process correctly any following correct cases.
4) The program cannot be set up improperly on the computer.
219

Header Card DATft FOR CBU6 PROGRAM
Descriptio!*
y-^y.-^^. ayii Bac'fcgreunii
Sample Niimber Code .'
1 - 7 lis - 10 ; a i
/ • t y / z ^ . t r c y y
l8-20i 21 - 2h ; 25—27 :28—30 } l
'• 0 0 2 ] '. " ^ " ' •-• •
t oihyyZ •^••j-"'"'""-'""p""""""'""|""
....015..;,... ,_,, ; . I ,..,„
: 016 i
°26 : ^ J '(^.y J y . . -^ . y . ?j
.... ^^'i' I ' .... yy.Zj . ...py,. ..,./..<: \
028 J.C' •y.j. J..... ..^/ty.\P....y^^ 029\yy/ f_4', <y V/: i^ y £>\
••.."^^ : y . . ^ . L . 'AyJ J .. ...9 .y..
-..-.•^^^: ''• '..7y^.<?...'iy..'^•.''••y/• ' ' ^ 6 V s. ..O o ^ t o y o :
' ^ . y . - ^ . ^ P " .i ' .'-•- " . ' - 'i Giil . ^ C .c \ o -X 'Z ,c J O \
'^''^ .:.^ ^ . ''' y y V-. <5 ; o / , "S ;
0[i3 y C C / } . D >/ < . , / . .
P r e s s u r e !JQ:1,1
"''• Cjiapbricnt
t O
. ^ / ^ _ 7 • • • • • • •
ho':
Hydrogen
35)4 •
•58 >'
'd^o"7
0 7 2 ; ^
100 :
200
300
y . y c ' y J ..-i'
,. h/..iy.M:.y
• i . : ' yp.. . .^. •'.•
.:yiy.,'^,,/y^' y. . j . . . ' 'y .y .:'^:
£ C
C /
c o
c c
/ o
/ 1
c I
• . ' / .9Z r. ^ ' a -^KOB'SoIuble' ( O r s a t )
iOxygen ( O r s a t )
a , q 'Butane & L i g h t e r ( c t )
IjOO •
500
600 ,:
700 •
"BOO":
.?00-
j 2 ^ f " y l e n e s ( c t )
l l sopen t ane ( c t )
i.xi-Pentaae ( c t )
iTota l P e n t a n e s ( c t )
• • •DragTctT - i y - I
Dotto.iis (.111.) H - ' ^ ^
Bo
iMethane
1 a :Sth pne
yyyyyy . / . , / .:?.!^yiXQZen
...a ill ;Ethane
J y C x y g e h "
Y . X iisobu'tene
jArgon
<\ T ;Butene- l
l l sobu tane
^Propane
1 QiButadiene
1 o^Butenes o r Butene-2
. I sopen tane
in-Butane
Q'",^ iPentenes
•" ' !n-Pentane
; ,
\...y\
\ y • y
: ^ '
• <
^ K
i K
K
^ :
Except f o r columns l l - i tO i n t h e heade r c a r d , a l rcor i ' imris must be puiiohad.v^;,-.^
CL-33
2 2 0

5) No case type identifications are required. There is only one very complicated case in the program. All real caaes are simplifications of this complicated case. The input data are used by the routine to determine what skips of program instructions will take place to process a real case.
6) All card types are identified by their content. There are no extra punches required to identify card types. Header cards, for example, are identified as header cards because they contain alphabetic data.
7) The program is not committed to a particular mathematical procedure, Gauss-Seidel, square Inverse, delta and successive subtraction methods can be used with little or no change in operating instructions.
a 8) All input data and all intermediate data of interest are included in the output.
9) A means of switching to other programs, including IBM library programs, is provided in both the program and the wiring.
10) No coded titles are used in the output,
11) Calculations are rapid. The time required, however, can vary considerably depending on several factors including matrix arrangement, mode of operation, ond the leverage of the equations. In the Gauss-Seidel mode, an approximation is prepared by the program to reduce the number of cycles required for solution. The 1620 version, using Gauss-Seidel mode, often solves the equations in less time than that required to enter and punch out data.
The IBM 650 version has some unusual programming. There are no counters in the program. There are also no store data address or store instruction address instructions employed. The location of constant terms, including equation coefficients, is almost as important to the successful operation of the program as the instructions themselves.
The basic idea behind the original routine was to develop a case which was sufficiently complicated to cover all real cases. The developed case did not have to represent any real situation as all real cases would be merely simplifications of this complicated case. By this procedure, a minimum amount of storage would be required for instructions. Next was to try to develop an operating formula which could handle all of the principle mathematical problems to be encountered. No such formula exists but the following expression fulfilled our needs:
v' m + bx - ^ a x
With such an expression and a means of locating individual terms, any of several mathematical processes can be used by simply eliminating selected steps in the Operation. For example, eliminating all but the summation term provides the basic operation for square matrix calculation, eliminating the b and c terms provides an expression for calculating residuals, and using the expression as stated provides the expression for Gauss-Seidel operations. The basic expression for Gauss-Seidel operations is:
, "'i + «ii i - Z: "ir ^r V ral
The successive subtraction method uses the same operation steps as the Gauss-Seidel, The method is set up automatically whenever the matrix coefficients can be stated as a triangular matrix whose post diagonal terms are all zeros. .
Although the Gauss-Seidel form arose from building up several mathematical models, it was a fortunate choice. Our operators were familiar with the system,
nputer. up.matrice
having used it with a Consolidated Engineering Corporation Type 30-103 comp They were already uaing the C, E. Berry ' z convergence criterion to set up
221

for inversion by IBM library routines. (Using the largest or large terms for diagonal terms will not always produce satisfactory inverses for some of our matrices.) The Gauss-Seidel procedure also ia one which could be used without a transfer matrix if an efficient selection method, cycling method and means of estimating could be found. The solution to these problems on the IBM 650 was as folbws:
1) Set up the matrix as normally written using location 0051 for a... This produces two desired results. The matrix is exceedingly simple to load and all coefficient terms are located prior to the punch band.
2) Convert the punch band into registers which will contain all input and output data. In this manner, all data which are variable will be in predictable locations,
3) Set all constants associated with the program in rows which are aligned with the appropriate coefficient coliunns,
4) Use the first digit of the first word of each punch band as a selecting switch and the next three digits as an index.
5) Disregard normal program languages in favor of a language which is geographically oriented.
6) Use remnants of the answers to the preceding case as an estimate for the present case.
Input, output and security problems were solved in the following manner:
Location zero always contains zero, location 1950 always contains 8000 and locationsOOOl to 0036 contain the preferred order of output punching.
With this arrangement and the single read instruction calling for reading cards into band 1950, no card can enter without being subject to wiring and code checks except an IBM type load card. An IBM type load card, however, will cause a branch to the console switches to be executed and the console switch instruction will read in the next card. If this card is not a 5/card load card, both the 5/card load of the program and the program code will be destroyed. If a 5/card load program card is loaded, the program code will still be destroyed but alterations to the stored program can be made if cards of the proper format follow.
All input cards for cases contain the programs code. Therefore, the wrong code, the wrong wiring, the wrong program, or loss of cards from the correct program will result in a program stop.
The input cards are simple. Each card contains a seven-digit case identification number followed by a three-digit code. The header card which must be first of a set then contains an alphameric description of the case. The detail cards contain:
1) A three-digit index.
2) The data making up the constant term of the equations.
3) A ten-digit field consisting of background and/or combination analysis vector data.
4) A digit which shows whether the data are to be used to solve equations or to check equations solved by the use of other data.
The index in the case of mass spectrometer cases corresponds to the m/e data. Any three-digit index can be used except 000 and it is not necessary for each index to be a separate three-digit number. For example, 056 is used as the index for both grouped butylenes and a single butylene in the split butylene calculation. It is required, however, that there be a register for each index (two 056 registers in this case) and that the program properly set up switches and registers before solving the equations. A register with a zero index is not available. Therefore, the row, column, constants and register area associated with the zero index are free for storage of instructions.
222
The ten-digit field is a part of the vector used for combination analysis. The system used for combination analysis is similar to one described by James Weis at an earlier ASTM E-14 meeting. (')
On input, the program checks each card for suitability to the case being developed end the program being used. It then seeks out a register and stores the data. If required, it also turns on the switch for that register. The program senses the completion of case input by detecting the alphabetic information in the following header card.
Calculation proceeds as follows:
1) All switches are checked to see if a proper solution is set up. Switches and the location of data are altered as required.
2) In the Gauss-Seidel mode, an estimate is prepared.
3) The location of the first on switch is used to prepare a set of variable instructions. (A maximum of eight variable instructions are stored on the drum.)
4) The variable instructions and the location of the remaining switches determine the terms used in the calculation of an estimated root (Gauss-Seidel), The absolute difference between the absolute values of this term and the original estimate are added to the contents of a special accumulator and the new value stored,
5) Following switches are used in the same manner until all switches have been used to determine equations.
6) The sum of the absolute differences of the new and old estimates is compared against a atandard. If within the standard, the program branches to post matrix calculations. If the standard is not met, the special register is reset to zero and a new cycle is started.
7) The post matrix calculations consist of calculations of all residuals (using modified instructions of the basic operating formula), and a series of normally programmed steps.
The printout is accomplished by printing a title card, followed by any special cards, and then going to a printout priority routine. This priority routine checks for "on" switches in the order determined by the data located in storage locations 0001 to 0036, When an "on" switch is found, the register associated with that switch is printed. When the complete list of priorities has been checked, an off switch variation is made in the punching routine and the list of priorities is again searched. This time the routine checks for "off" switches. Each time an "off" switch is located, the appropriate register data are punched providing input data entered that register. If the register was not used for either input or calculations , it is ignored.
Once set up, the operational part of the program does not have to be changed for handling a wide variety of problems involving the solution of simultaneous linear equations. Non-technical people set up their problems by writing the coefficient matrix on an IBM "Drum Storage Layout Form" (IBM Form No. 22-6283-1). The three-digit indexes are listed in the preferred order on locations 0001 to 0036 and the first word of each register. The IBM form can also be used as a key punch form. We do not permit different variations of the routine to use the same code. The code is selected by one person who keeps track of all codes used. Training time to set up and operate the routines is less than eight hours. This does not include the time required to learn what peaks are involved in a mess spectrometer calculation or any data on the internal operations of the routines. An experienced operator can set up the routine es fast as he can copy his data onto the form.
223

_ p
; < I Q i ^ ! UJ 1 t4.
Iro -
t— u Q-
Q
3 a - I
f \ j <r <j- - *
CO as
o r-
-* o ^ iTv r o ,3-
(c a> cn
f - <r r r , oo 0 ^ \ 0 CO CD sj- r^ rsj r^ o^ C<-1 1 -O (NJ
o <-<
^ O n-1 4 - CO
^ o O cc J - CO
o
.<\ —<
O^ ( ^ O CO
:--; ^
f \ j r g
^
.-1 t*^
(^ ") ^ CO s ^ f \ J
o o o \ 0 rc^ ^ c ^ ^ ^
o J3 r -r- i r-t C^
vO lO sO .-\j —t r -
vO cn rsi -%'
—1 rrx CO
r- o [ ^ m
' cC^ ! "V
ir> f \ j . - • i n O 3 r ! r " FfTTsj
r-( ^
t u l U
z z -^ • U U J l U J UJ ^ e i ^ • - UJ U J « I C 3 Z 0 . Q- < CD UJ O O 1 - O 1 -
a Q; 3 in D a Q . CO ^ t E
<<i c * ^ 1 r-
o iTt j ,_t 1
r 1 rs i
.-*
^ r»
ro
O < * •
-* o-»
<f J^ r"
^
fNJ CO
-d-15
-*
rsi
UJ z UJ t— D OD
m QD o r-^ \ r \ \ t ~ - \ r \
CO CO
o r-o~c& o -d-CT-
o ^ r-*
;~i r*i ^ 00
o o o h-o i r
r o ao : ^ . • •
o c \r> r\'
O o
CD CO
O 1 ^
f\J r^
00
i n ; = i 7 q - ^ -
i n
r-l r-H
fO f^t o c CO
o o h - - - i r t vO
r-o^
1 r o r- i r-H .-H
r\J
r o 00 00 i f \ ; - ^ .-< rsj r^
CO r-H fNJ vO ^ ^ r - ,-^ f\J r-(
LU UJ Z
Z UJi I / ; < < Z j l i J 1 -
t- < i z z 3 K UJ I U CO n ! » - a O CO z o </) 1 IU LO
" ^ • y -
r o 00
00 CT'
i n r o
r-H
LU Z
< -z LU a
z
o o o o CtN ^ r o CO
CO -^J o e - ^ o
CO r s t
OD r-t 0>
-3-O-CN.'
CO f\J
a-
r^ f \ j •-- CO .NJ
•O O sO fNJ C*"i J ~ \
O^ Ch O-
r- .o - 1 o
.:-. r-- J
o
-~* o •=f
r o r-i n
ft-t r - l
-O
z
Co- o - :^ X) fNi - i -^ CO
C^ r-l O
-< rM CO O sO 00 .3-
^ 0 <J- ^ (O CO 00 vO fN; r^
o o ^H 1—t
U J l / l 1.5 l i J l i ) UJ
Q Z Z Z Q ;
t -
z
UJ < UJ X X I -t ~ t ~ -D LU UJ CD
rsj rsj
CT' O
CO rsj O '»
^ fT.
O-
-
Cl o ^ - — o: I/) I/) o LU UJ Q:] Q: ci; <
O ffi <0
224

References
(1) Mass Spectrometer Data Reduction Program for IBM 650, J . M. G i l l e t t e , Anal. Chem. 31, 1518 (1959).
(2) A Cri ter ion of Convergence for the Classical I t e ra t ive Method of Solving Linear Simultaneous Equations, C. E. Berry, Ann. Math. S ta t . XVI, No. 4 (1945).
(3) Analysis of Complex Hydrocarbon ^^i3ctu^es: Uazimum Ut i l iza t ion of Data from Combined Analytical Methods, James Wei, Charles D. Prater , Allan R. Emery, Am. Chem. Soc. , Div. Pe t ro l . Chem., Preprints 4 No. 3, 139-54 (1959).
225

C. E. N. - G. Grenoble, le 29 mai 1962
D. P. C. - S. I. S.
CONSTRUCTION OF AN I. B. M. PUNCHED CARDS FILE FOR IDEHTIFICATION
OF CHEHICAL COHPOUNDS BY THEIR MASS SPECTRA.- PAR Ayme CORNU -
After the spectrum of a given sample has been obtained, this spectrum is to be compared with all the pure compound spectra available in the laboratory, in order to find either an identical spectrum, or any similar ones.
At present, our own collection of mass speotra contains about three thousand three hundred speotra, and obviously, for eaoh analysis it is practically impossible to go through the whole of these records, to find an answer to our problem. Therefore we have established an index system permitting a fast access to the greater part of the whole collection.
Our index system is composed of one set of handwritten matrix cards, destined to set up two collections of I, B. M, punched cards, nominative an analytical cards respectively.
Each of such card corresponds to a pure compound whose mass spectrum is filed in our collection.
On each matrix card is registered :
1°/ - The name of the compound ;
2°/ - Its reference, order number and collection number ;
3°/ - Its molecular formula ;
4°/ - Its molecular weight ;
5°/ - The list of masses of the ten strongest peaks, classified according to decreasing height ;
6°/ - The developped formula.
All these cards are gathered in a collection which includes to this day i
- 1 715 Cards from A. P. I. Collection ;
800 Cards from G. A. M. S. ;
- 700 Cards from Litterature data.
TOTAL ... 3 215
Data registered on the matrix card are transcribed in perforations on I. B, H. punched cards, but this transcription is made in two stages.
226

3-Merhyl- 1-bu^ane^h^ol
dsopenfyl nnercaptan)
APi 1718
CjH^ljS M 104,21
55 70 41 4J 42 47 61 27 104 i9
CH3
HS-CH2CH2CH-CH3
CARTE MATRICE
ISOPEN.TYL M e R C A P T A N ,...I.H;.'k'l. .1 -
3 MfcTMVL' I B U T A N E T H I O L
•JJ^IT. Mi l? 3t;^l :: , ' - | l ' - : T I I |.:JM?I iiJ-:4«lAi*
i 7 i a
j t p . m | f l . n i f i l l f i i l i i i i i i t ( l « i . n l | i i M i M i | i i i i i i i M i M i i i i i i i i i i M i f f i i M i t ^
W*tHV6'W«<l3alSft''''''U ' • ' • ' HM t i I I I I I 111111111 I'l i X l l l M l l l * »»«. -d^at. „ .X. .J I I I * J11 |# i l l 11 f 1,11 t t 111} I > I t 111 i 1111111 t l tW 1J111111 M l t t l l JIJO i
L i M l i i t i i t i i t l t | M i i l i i l r | 1 1 T i i a j t t t i i a i i i i } i i i i i t t u M i t j ^ » ^ ^
UAJAi 119 (JJU* * I* • * • i.iM* M«II f M i i r j a 11. ' • * * • * • • * ! l l . ! l l i » i ! M | l l l W A W
CARTE ALPHABETIQUE
2 2 7

A ) — So-called "nominative" cards -
Nominative cards contain as perforations, the entire name of the compound, up to sixty types or signs, and the corresponding reference number (five figures, two letters and one figure).
Cards of this file do not contain any other scientific data and are exclusively destined to the clear interpretation of the compound name, on the analytical cards.
B) - So-called "analytical* cards -
Cards of this file contain :
1 °/ - In columns number one to forty, the masses of the ten strongest peaks, following the order of decreasing peak height. Each peak is represented by four figures thus hundreds, tens, units, and tenths of mass. It is possible to put down in this list, peaks of double-charged ions, wich are sometimes very strong in aromatic compound speotra.
2°/ - Molecular weight in columns number seventy to seventy twcw Decimal part is neglected, and, for Br and Cl, molecular weight is computed for the lighter isotope only.
' i ° I - Molecular formula are punched in columns number fifty two to sixty nine. Atom number of Carbon, Hydrogen, Bromine, Chlorine, Fluorine, Iodine, Nitrogen, Oxygen, Phosphorus, Sulphur, Silicium, are punched in predetermined columns, other eventually occuring elements are punched as "niscel-leanous".
4°/ — Reference number is punched, as for nominative cards, in columns number seventy-three to eighty.
After punching, these cards are interpreted, i. e., on each card are automatically printed ;
1"/ — The masses of the nine strongest peaks t
2 ° / - Molecular formula ;
3°/ - Reference number ;
40/ - Molecular weight ;
5°/ - Complete clear name of the compound.
For this last interpretation, which is printed on a second ,row, the nominative cards file must be introduced, in connection with the analytical cards file, in an I. B. M, collator.
Three copies of this analytical file are made in difffe-ent colours, blue, green and yellow.
Many tests are made for verification of punching ; wrong cards are eliminated and replaced by corrected ones.
.../
228

, s . I TO. I 41. I *». I 4a. I 47. I >.. I ar ^04. I M I »[ »»|| J I I I I f I I M « « m o i l Niuf HUI otANOt HCl 1 S S I <: I n MCBMi l N I o i m m i M v
NAM ob l&mHil a M C T H r u I B U T A ^ 4 e T H I O ( . 1 7 I S I S n
l l i l l l l
I ' S O P C N T V C M C R C A p t A N •
TT r« » i f ) • aa n i l 11 111 l l l l
I 1 2 2:2
I
n i l ]
I I 111 I l l l l
i i i i i i i i j t t i ; ; ! I I •
} t i l | ) I i j t l i I 111 I > f Mi i l I lU 1 i l l
I l l l l
I
44 • I
I
I M i l I
I l l t l
HMI
( I I > M«
t • I I * m i l n i l
mil 1 M | ]
I
4|4kM|4fa|4i4k ' ) I I '
l ^ l l ; I S I l i i | l
nil I
l l i l l l l I ?;>
I I i l l I I M I l l l l n b i I l l h I I l l h -*- I I Ml »-
an f la i i t l l a o f I I III 11 I I I I I I I
2 2 I j l I l l l l
1 1 I W 1 I I I
• UK
I I i j l
I I III I
i | ) ; 3
i« • « q * f « « « t « « H l
I S n c n C DE MASS0 4 44| I I'SIS > liSB i HiU i i i l l l S l i f l l S >;9|i i 9|>
I M I t i n I I m l l l i l l I I I I 11 111 I n i l
7 I I I I I
11 i j l
J r T ] 7 7 7 i | 7 7 7 7;J t I I
11 I I I 11 I I I i I i l l
l l l i l l i ; i l l l S l l l l t M l i l l l l t l M aiag « mmu tt rum u mmn » BOAD M
C.E.N.G. Uk..at,li» 4.
n i l I
7 7 717
• l l l l | l l l | l
.il
7 7 71
l l l ; i
II
II
III
IIII11 lilt
I l l f l l l l l l
1 1 1 1 1 1 1 1 1 1
4 4 4 4 4 4 4 4 4 4
i i l i i l S l i i
I l l l l t S I I I
7 7 7 7 7 7 7 7 7
l l l l i l l l l
111
77
l l l t l l l l l i a a « « } « « i « « i » l lct>.a4lri. d« m,
I I
444
l l l l
I I I
i j l l l l l l
111
44
i l l
I I I 1111 q i
117777
q i q i 11
t KKiiiti I
11 t l I t
iliji l l l l I
iitii|]|iii|i4> }
m i l
44
i|S|>SS
I I
7777
I I I I I I I
4|4|4|4 4
i i l l s
q i i i i i
777J7
I I I I l U l M l 11 I I
t i l
Sh
I I I
i l l l l
m i ] i i | i
1 11
44
l i i i i
t z I l l s
l 7 7
l l
I o
m i l nq n i i « « l f •
I I I
OARTE ANALYTIQUE
F I G . 3
Rtr .
!•> I f 0 >
1 » S »
3 8
3a
t t J S
as SSO
5 S »
5 < a
. 5 »
l a
sa
3 4
39 1
1 4 t
I T U
«T a
9 a 6
t o s t
9<
9 7
• 4 1
i i a 3
9C 1
8 4 6
S a 8 4
A t 1
AC i
« C !
t C !
« C !
• C !
A C .
A C •
AC '
j r E C T R E
i t S3 9
9T 9
t l a a
» 1 4 0
T 1 a<
8 9 1 1
8 1 1 8
8 1 1 8
1 8 4 3
1 1 8 T
H M Q r s
FIG. 4
229

Ill - UTILIZATION OF THE ANALYTICAL_FILES -
The first set of cards, (yellow coloured) is ranged according to molecular weights.
The second one (blue coloured) is filed according to reference numbers, and so, it forms a card copy of the spectral data lists.
The third one (green coloured) Is filed according to the masses of the ten strongest peaks in decreasing order.
After filing, cards are tabulated, giving a list somewhat similar to the "spec finder" of infrared Sadller speotra.
When the spectrum of the compound being investigated has been run, the strongest peaks are measured, and the list of the masses of the ten strongest peaks ; this list is immediately compared to the similar lists of the third cards file.
The order of masses of the ten strongest peaks seems to be a so characteristic value, for one compound, that it is almost certain that comparison of lists will permit identification of compound. If not, interversion of any peaks may be tried, for any differences may oocur in spectral patterns due to instrumental peculiarities in ionization prooess.
If no similar list of peaks is found, it must be suspected that either the collection do not contain the true answer to the problem, or the compound 'is not a pure compound and must undergo further separation. Eiamintation of spectra whose strongest peaks list is close to that of unknown compound can permit to obtain interesting data upon fragments or partial molecular structure of the analysed sample.
Practically, in the case of a pure compound whose spectrum is inside the collection, we do every time succeed in identification.
The yelloH coloured file, classified according to molecular weight, is very useful in identifications based upon parent peak examination. The file, at the analyst's disposal gives him a complete list of the different atom codinations able to bring about any given molecular weight. Consideration of other strong peaks printed on the card give many valuable informations for identification.
Using an I. B. M. sorter it is possible to file the cards in any derired order, or to eliminate those of oompounds with are obviously of no interest.
In conclusion, we think this punched card''file solves with simplicity the difficult problem of a fast access to the principal data of the totality of our mass spectra collection.
N. B. - After this work was completed, we found out that F. W, McLafferty (Anal. Chem 31-1160-1959) and G.C. Doderer (Applied Spectroscopy 14 K° I5-I39-I96O) have studied the same subject, and created indices of rather different form.
A. CORNU.
230

A MASS SPECTROMETER FOR A STUDY OF THE
COMPOSITION OF THE UPPER ATMOSPHERE
Alfred 0. Nier University of Minnesota Minneapolis, Minn.
ABSTRACT
A mass spectrometer suitable for installation In an Aerobee-Hl
rocket has been constructed based on the prototype developed earlier .
It will be used for a study of the composition of the atmosphere in the
range 100-250 km. Two shots are scheduled for 1952 in a cooperative program
with J. H. Hoffman, C. Y. Johnson and J. C. Holmes of the Naval Research
Laboratory. Details of construction and operation vill be discussed.
Alfred 0. Nier, Rev. Sci. Instr. 31, 1127 (1960).
231

A Quadrupole Spectrometer for Precision Wass Determinations
U. von Zatin, S. Gebauer and W. Paul
Physikalisches Institut, Bonn, Germany
The construction of a quadrupole spectrometer for precision mass determinations was stimulated by the fact that our knowledge about the accurate values of nuclidic masses is relatively poor in certain regions of the periodic table. Particularly, many of the elements between xenon and tungsten are known only to about one part in one million. Because of this situation, the layout of our quadrupole spectrometer is especially designed for heavy masses. The theory of the quadrupole spectrometer is given as reference I.
To achieve o reasonable resolving power, the ions should stay a long time within the quadrupole field. In our esse, we want to have the ions experience at least 500 periods of the Hf in the analyzing field. To reach this goal we buiIt a long f ield— it is about 6 m long, and second, we ore using rather slow ions—ions with an energy between 10 and 30 eV. Figures of the spectrometer are:
Length of field L = 5.82 m Field radius rQ= 3.5 cm Frequency 0 = 47 I kcps Hf amplitude I for A = 200) V = 3924 V DC voltage ' " U = 658 V Hf power " ' N = 290 W Entrance diaphragm (5 = I mm
Each electrode of the quadrupole field is made up of a group of 60 wires, which are stretched to 80% of their breaking load. The wires are fastened only at the ends of the field and in our opinion this is a fairly simple technique which gives us a rather constant field geometry. The ions are formed in a conventional electron impact source and detected by a 17 stage multiplier.
AAass scanning is achieved by simultaneous change of both the Hf voltage and the DC voltage with fixed frequency.
To compare an unknown mass with a reference mass, we make use of the linear relationship between focused mass and applied OC voltage. But this situation is complicated by the fact that the basic equation looks like this:
2 2 1 m.CO T Q
The mass ratio can be determined by the ratio of the applied DC voltages, but there appears the so-called Mathieu parameter "a" for both species of ions. These parameters determine the motion of the ions within the quadrupole field and the second equation gives the definition of "a". To derive the mass ratio from the voltage ratio alone, we need a criterion that a./a,, equa Is exact ly unity. For this the most sensitive test seems to be to look for the intens i ty of both peaks. Because the intensity ratio 1.^/1• which one measures at the detector is proportional to the initial ratio I_ |-./I , times a factor, which depends on both a values ' *
l2_ '2.0 ° - " ^ ^ ^ - "2 '1 ' '1,0' 0.23699- a,
The number 0,23699 is a fundamental constant of Wathieu's differential equation^ hence one get the correct intensity ratio at the detector only when a = a,. Eliminating a by means of the first equation gives the third expression
I, - 1,^0 T 0.23699- a , " " m ^ U , J
The ratio U over U is given by a precision resistor divider. The circuit is such that always this equation is valid:
^ 2 . R U| R + .^R
Therefore the intensity ratio as a function of A R is the following equation,
l l hj2.\i ° i ,, "'i R , " [ 'l ' I|,oL' °-23«99- »| - m ^ - R . A R J
232

Because A R is very small compared with R, we get a nearly straight line for the intensity ratio versus ^ R. The slope of this line depends on the factor with a . All these curves with different a. should have a unique crossing point. This point then gives us both the true intensity ratio and the true A R . From that ^ R one can easily calculate the mass ratio.
To test this method and our apparatus we measured the well-known mass ratio of xenon isotopes. The results are;
Mass ratio;
Quadrupole field
Ries, Damerow and Johnson (1960)
'^^xe
'^'xe
Intensi ty rat
'^'xe
'^^xe
=
Mass ratio;
''^Xe
1.007 632 +
1,007 632 +
io:
(0.7902 +
1 5
06 8
0.0020
f =Vl3l/l32'
0.7872
0.7877 +
1,015 173
± 1
1,015 171
+
0,0027
0
0
88
6
Quadrupole field
Nier (1950)
Quadrupole field
Damerow (I960)
The mass ratio of 132 over 131 agrees very well with the much more precise value of the Minnesota group. The relative abundance ratio for the two isotopes is also quite good. The first value is the measured value. Because we are using a multiplier and the conversion factor from ions to electrons depends on the velocity of the incident ion, we applied a correction factor 0,9962 to get the final result. Although both values agree with that of Nier, the agreement of the corrected value is much better. It seems to be worthwhile to emphasize that this Intensity measurement is done with a resolving power between 2,000 and 6,000,
To make further tests we compared two isotopes which are two mass units apart. In this case the agreement is not as good and there is no doubt that our measurement is in error. However, we now believe that we know the reason for this. There are indications that the intensity ratio is biased due to different time constants In the detection circuit for each peak, ana this causes an error in the mass ratio also,
I should make a short remark on the resolving power of the instrument. As you saw, the accuracy of our measurements depends mainly on the sensitivity of the intensity versus DC voltage variations. Therefore the resolving power is of secondary importance but should be high enough to resolve impurities. Our measurements are normally made with resolution below 10,000 and the maximum resolving power was 16,000. This value is not high enough to resolve carbon 13 peaks which make it necessary to select the reference peaks very carefully.
References
1. W. Paul, H. P. Reinhard, U. von Zahn, Z, Physik J_52, 143 (19581 2, U. von Zahn, submitted to Z. Physik,
233

HIGH RESOLUTION TIME-OF-FLIGHT MASS SPECTROMETER
by
D. B. Harr ington, Product Specialist , The Bendix Corporat ion, Cincinnati Division Cincinnati, Ohio
R. S. Gohlke, Resea rch Chemist , The Dow Chemical Company-Eas t e rn Research Labora tor ies F ramingham, Massachuse t t s
A brief descr ipt ion of the operat ion of the t ime-of-fl ight nnass spec t rome te r will be given, followed by a more detailed descr ipt ion of the factors affect -ing mass resolut ion . Following this , some examples will be given of i m proved mass resolut ion achieved with the high resolut ion t ime-of-f l ight
. mass spec t rome te r built by Bendix for The Dow Chemical Company.
The Bendix Mass Spec t rometer produces from 10,000 to 100,000 complete mass spec t ra every second. (All ins t ruments descr ibed in this paper ope r ate at the more s tandard 10 KC frequency). The f i rs t event in the fo rmation of each mass spec t ra is the creat ion of the ionizing e lec t ron beam in the ion source (Figure 1). This e lec t ron beam las ts approximate ly 0. 3 m i c r o seconds , and ordinar i ly the ion acce lera t ing pulse (ion focus pulse) occurs immedia te ly after the shut-off of the e lec t ron beam. The ions which have just been crea ted a r e thereby acce lera ted through the middle grid of the ion source and receive their final energy of 2, 800 volts fromi the ion energy gr id . All ions of the same m a s s to charge ra t io rece ive the same energy, so that the l ighter ions t ravel faster and reach the col lec tor f i r s t . These separa ted mass bunches a re amplified in the magnetic e lec t ron nnultiplier, whose output is presented to an oscil loscope synchronized with the o p e r a ting frequency of the mass s p e c t r o m e t e r . Simultaneously, individual mass signals as well as mass spec t ra can be be recorded on a char t r e c o r d e r , although the mechanism for this is not i l lus t ra ted in Figure 1.
There a r e two major factors affecting mass resolut ion in a t ime-of-f l ight ins t rument , space focussing and energy focussing. Figure Z i l lus t ra tes space focussing. We take two ions with the same m a s s , the same charge , and zero initial velocity. The initial position of the white ion is slightly forward of the black ion's position, so that when the ion acce lera t ing pulse is apJDlied, the white ion finds itself at a -200 volt potential while the black ion is at a -190 volt potential . The white ion will leave the ion source well in advance of the black ion, but the black ion will have 10 volts more energy, so that eventually it will overtake and pass the white ion. The height of the ion acce lera t ing pulse is chosen so that the black ion will just overtake the white ion at the col lec tor .
F igure 3 i l lus t ra tes energy focussing. We again have two ions with the same m a s s and the same charge , but this time their init ial d is tances fronn the co l lec tor a re identical , and their initial velocit ies a re equal but in opposite d i r ec t ions . As soon as the ion accelera t ing pulse is applied, the white ion inc r e a s e s its speed towards the col lec tor , while the black ion is brought to a stop and then r e tu rns to its initial posit ion. F r o m this tinne on, its s u b s e quent h is tory is identical to that followed previously by the white ion, since
234

the black ion velocity at this point is equal both in magnitude and direct ion to the initial velocity of the white ion. Therefore , the black ion will always t ra i l the white ion, and will reach the col lector after the white ion has a l ready been detected. The difference in a r r i va l t imes of these two ions will exactly equal, in this idealized ca se , the " turn-around t ime" of the black ion.
In p rac t i ce , a pulse height for the ion accelera t ing pulse is chosen which will give the best compromise between space focussing and energy focussing. This best compromise is indicated by the sharpness of the nnass spectrunn presented to the oscil loscope or to the r e c o r d e r .
T ime- lag energy focussing is a device for overcoming the dannaging effects which initial energ ies have on mass resolut ion. To help understand a la te r descr ipt ion of t ime- l ag energy focussing, an inspection of Figure 4 may prove useful. This shows a graph of ion t ime-of-fl ight ve r sus init ial pos i tion in the ionization region. This graph is super imposed on a schennatic of the ion sou rce . One curve holds true for ions with the same m a s s , the same charge and the same initial velocity. If any of these three p a r a m e t e r s is changed, a new curve is needed. To achieve best focussing for the white and black ion shown which have the sanne m a s s , charge and initial velocity, the height of the ion acce lera t ing pulse would be adjusted so that the maximum of this curve coincided with the position of the ionizing e lect ron beam within the ion sou rce . This would resu l t in the sma l l e s t flight t ime difference.
In Figure 5, a fannily of three curves is shown sirni lar to the single one shown in F igure 4. The three ions in Figure 5 all have the sanne m a s s , the same charge , and they all a re equally distant from the col lector at the moment when the e lec t ron beam is turned off. The middle ion has ze ro initial ve locity, while the white and the black ions have equal initial speed but opposite velocity. The white and black ions of Figure 5 correspond to the same two ions sho'wn in Figure 3. In t ime- lag energy focussing, the beginning of the ion acce lera t ing pulse is delayed, so that a t ime lag occurs between the end of the e lec t ron beam and the beginning of ion acce le ra t ion . During this lag, ions will move to new positions in the ionization region as a function of their initial ve loc i t ies . In the case of the ions in Figure 5, the optimum lag is that which will pe rmi t the white and black ions to move to new posit ions in the ion source where their t imes of flight will be equal to each other as well as being equal to the flight time of the middle ion having ze ro initial velocity. Since we a r e st i l l dealing with ions having the same mass and charge , t i m e -lag energy focussing is nnass dependent.
Theoret ica l ly , m a s s resolut ion in the t ime-of-fl ight mass spectronneter can be improved by increas ing ion energy and increas ing flight path, as well as by introducing t ime- lag energy focussing. In the la t ter half of 1961 the Cincinnati Division of The Bendix Corporat ion built a t ime-of-f l ight m a s s spectronneter for F . W. McLafferty and R. S, Gohlke of the E a s t e r n Resea rch Labora tory , The Dow Chemical Company, Framinghann. Massachuse t t s . Gohlke specified that this ins t rument should include t i m e -lag energy focussing, a flight path extended fronn the usual 100 cen t ime te r s to l67 c e n t i m e t e r s , and an ion energy var iable fronr\ 2, 800 to 5, 600 e lec t ron volts r a the r than the usual fixed energy of-2, 800 vol ts . In p rac t i ce , it was found that mass resolut ion was indeed improved markedly by t ime- lag energy focussing and by the increased flight path. However, increas ing the ion energy gave indications of actually worsening mass resolut ion, so that
235

the energy now used with this ins t rument is approximately 3, 000 e lect ron vol ts . Subsequent theore t ica l and experinnental work done by R. A. Fluegge at the Resea rch Labora tor ies Division of Bendix in Detroi t suggests s t rongly that increas ing ion energy does actual ly innprove the mass r e s o l u tion occurr ing just before the mult ipl ier anode, but that the output t ime constants of the readout c i r cu i t ry more than off-set this improvennent. As ion energy i n c r e a s e s , these time constants become increas ingly important because the time separa t ion of adjacent nnasses gets s m a l l e r .
A photograph of a s tandard Bendix Mass Spec t rometer utilizing a 100 cen t i -nneter flight path, 2,800 e .v . ion energy, and no t ime- lag energy focussing, is shown in Figure 6. This Model 12-101 Mass Spec t rometer is a lso equipped with a Model 925 Knudsen Cell Sample Inlet Sys tem. F igure 7 is a photograph of the Dow ins t rument , which shows the obviously longer flight path. The heated molecular leak inlet sys tem associa ted with this i n s t r u ment was designed by Gohlke and built under his di rect ion at Dow.
The harmful effect of large init ial energ ies on m a s s resolu t ion where no t ime- lag energy focussing is used can be seen by connparing F igures 8 and 10, which show spec t ra taken with a' s tandard Model 12-101 (Figure 6). F igure 8 shows the recorded spec t rum of m e r c u r y (there is an attenuation factor of 10 between the two t r aces ) and Figure 10 shows the recorded s p e c trunn of the CCI3 ion fronn carbon t e t r ach lo r ide . The osci l loscope p r e s e n tation of this same carbon te t rachlor ide spectrunn is shown in Figure 9. In each c a s e , the m a s s e s , reading from left to r ight , a re 117, 119, 121 and 123 a. nn, u. Even though the carbon te t rachlor ide peaks a r e a lmost half the mass of the nnercury peaks , the valley between peaks two mass units apar t is ce r ta in ly no lower for carbon te t rachlor ide than for m e r c u r y .
The mass resolut ion innprovement made in this carbon te t rach lor ide s p e c t rum by the longer flight path alone and by the combination of longer flight path and t ime- lag energy focussing can be seen in F igures 11 and 12. The same spec t ra a r e shown in both f igures; Figure 11 shows the osci l loscope presenta t ion and the osci l lograph presenta t ion is shown in Figure 12. The upper spec t rum in each figure shows the resolut ion given by the longer flight path by itself, and the lower spec t rum in each case shows the improvennent given by combining the longer flight path with 2. 6 mic roseconds of lag. Each spec t ra in Figure 12 is a lso divided into two at tenuat ions , xl and x5. In Figure 11, the peaks , reading left to r ight , a r e 117, I19 and 12 1 a. m. u. . while in Figure 12 the o rde r is r e v e r s e d .
Summariz ing our experience over the past 8 years as well as our future expectat ions , we a r r i v e at Figure 13. We define unit resolut ion as t h a t ' r e -solution which produces less than 1% peak height contr ibution. Good c o m parat ive figures for the resolut ion of var ious ion energy and flight path c o m binations using optimunn values of t ime- lag energy focussing a r e not ava i l able, so the improvement in resolut ion given by t ime- lag energy focussing is not included in Figure 13.
An a r t i c le by one of us which desc r ibes more fully the operat ion and appl ication of the Bendix Time-of-Fl ight Mass Spectronneter is l is ted below. This a r t ic le a l so contains a fairly connplete bibl iography.
Harr ington, D. B., "Encyclopedia of Spect roscopy" , Reinhold Publishing Company, I960, pp 628 - 647
236

0 - — - - I O O V . V y - CONTROL GRID
(PULSED) - IOO CM-
ION BEAM
- I 7 0 V . •f ISO V.
ION SOURCE
ANODE -
RESISTIVE SURFACES ON SLASS PLATES
Y DRIFT PATH
. J V_ " V "
ION SIGNAL COLLECTOR AND AMPLIFIER
(MAGNETIC ELECTRON MULTIPLIER)
SCHEMATIC OF BENDIX TIME-OF-FLIGHT MASS SPECTROMETER
©
ION SOURCE
-190V -200V
O 1
COLLECTOR
-270V -2800V -2800V
0 O ENERGY = 2600 e.v.
• ENERGY =: 2610 e.v.
0
SPACE FOCUSSING IN BENDIX T.O.F. MASS SPECTROHETER
FIGURE 2
237

o
ION SOURCE
o-»
COLLECTOR
-270V -2800V -2800V
0 O-*'
©
T
ENERGY FOCUSSING IN BENDIX T . O . F . HASS SPECTROMETER
FIGURE 3
±
TIHE OF
FLIGHT
OV
7nv I f -270V -2800V
INITIAL POSITION
TIHE-OF-FLIGHT VS. INITIAL ION POSITION
238

_L
I TIME OF
FLIGHT
OV
'7nvL -270V -2800V
INITIAL POSITION
•
TIME-LAG ENERGY FOCUSSING IN BENDIX T.O.F. MASS SPECTROMETER
FIGURE 5
Model 12-101 Bendix Mass S p e c t r o m e t e r with 100 cm. flight path
239

•1
V
7 ^ -
..,.;:
—
B t t n
- —
"»
. :-:
B nn
1—
-
^ T ; - J r
•--
m m
. • i .. .• . j . . . . i . J .
•-|.-U - : l.-r- : -i
y-Vy-'-f' j \ l I V
: • • . . ^
:~ • . : ! : .
-.y..--.:-r^r..y.r-
Z . • • » : :
y A J L L ,
i# ^ " •
— ; ; I i • !
: 1
-
- y y -v.---;-| z r i z - : j i j
• i r r .•-••ri-;T:m-TrrTL £ k k *._••• -T-L-. » • ! • : 1 . ! .. '• I ' i
^ ! • • V " ^ ;,:!,.. "
..•" ••T •("+" • :;: • T , j ' i
--4-;•!-•••]- -"r
• • _ J ^ L_
"' d -zy t y •
.yy^, J J.I u . ..1 .[....„. J i:_
-
- - I —
1 1 1 . y " ' " •"
-.
. y. ^ ^
! .. . ...,p..
[ .
^ ^
1 • . I
• ! M i ' • • ' . ' : ...
• i - i ! •! i
_
•
—
1 • 1 - 1 ; \ !
1
B
J
1: : ' ' 1
MERCURY ISOTOPES AS SCANNED ON lENI I I TIHE IF FlIWT MASS SPECTIIHETER
Flight path length = 100 c m . , lag - 0, energy = 2800 e .v . Masses , left to right: 196, 198, 199, 200, 201, 202, 204a .n^ .u .
Model 12-101 Bendix Mass Spectrometer at Dow Eas te rn Research Laborator ies with 167 cm. flight path.
240

FIGURE 9
CCI3 ions from carbon tetrachloride, oscilloscope presentation. Flight path length - 100 cm. , lag =0, energy = 2800 e .v.
Masses, left to right, 117, 119, 121, 123 a . m . u .
PARTIAL MASS SPECTRUM OF ~ CARBON TETRACHLORIDE —
Bendix Mass Spectrometer —
Ion Energy : 2800 e .v . — Flight Path I 100 cm. ^
FIGURE 10
241

FIGURE 11
CCI-j ions from carbon tetrachloride, oscilloscope presentation. Flight path = 167 cm. , Energy - 3150 e.v. Top Trace, Lag = 0. bottom trace, lag =2.6 ^ sec. Masses, left to right, 117, 119, 121 a .m.u .
CCl3'^ ions from carbon tetrachloride, oscillograph presentation. Flight path = 167 cm. . energy . 3150e.
242

w H W :^ o H U
OT OT <
2 >< :=! p
ffi H O
ffi H <;
H ffi
Q
O
W
w
o
OT > I? 2
H
O
OT w rt OT
D, O U
§ ^ 3 O
r^ to
So rt
to
T3
O
u 9) Pi
fc
Xi
CJ)
C W
o
ITl o M i n -H PJ
o i n
lU
o o ^H
o o fM
O O^ eg
* o o i n
w o o
y o i n
o o o
PJ
o o vO I -H
o o 00 PJ
o i n ^ H
fO
o o o
d" I -H
-o V
•4->
R)
g • iH
* n U *
243

A CASCADE MASS SFECTROMETER F . A Vfhite,* J.C. Sheffield, and F.K. Rourke
General Electric Company Knolls Atomic tower Laboratory**
Schenectady, New York
Introduction
The session this morning is devoted to instrumentation, and I shall describe an apparatus vdiich has been constructed at our laboratory that may have some novel Instrumentatlonal aspects. However, I should also like to focus attention on the variety of physical investigations vdiich can be pursued with this new tool. Hence, I shall refrain frora presenting a detailed description of the spectrometer, in order to indicate several Interesting and important phenomena which can be probed with this device.
Physical Description
The first slide is a schematic diagram of the electromagnet. It is basically "C" shaped. You will note that the exciting colls surround a massive cylinder. The cylinder is approximately 2 feet in diameter and 21 Inches in height. The exciting coll Includes 34,000 turns of copper wire which can produce a field up to 8000 gauss. The top and bottom yoke are trapezoidal shaped slabs, of 8 inches thickness. The dotted lines of the schematic mark the contour of the pole pieces, and suggest why the term "cascade" has been tagged to this spectrometer.
You will note that not one, but two successive l80° trajectories can be accommodated within the pole face boundaries. The pole face Is large (over 500 sq. inches) and the mean radius of curvature of the first trajectory Is 12 Inches. Consider now the second trajectory. You will note that, in principle, there Is no lower limit to the radii of curvature—only an upper limit (12 inches R - 180°) i.e., we have a continuum of possible lon paths— corresponding to a very wide range of ion energies and masses for a fixed magnetic field strength.
Slide No. 2 shows the complete "cascade" spectroraeter. It weighs between 9- and 10-ton. The vacuum chamber Is siraply a Duraluminum ring, machined to match the contour of the pole pieces that comprise an integral part of the vacuum chamber. Viton "0" rings complete tbe seal between the Duraluminum ring and top and bottom pole-piece surfaces. The magnet gap is 3/k inches and the vacuum charaber is ptuiped by two diffusion pumps complete with large liquid nitrogen traps. You will note that two mass spectrometer source assemblies, which are attached to the vacuum charaber. The first Is a conventional surface ionization source complete with suitable focusing plates. The second is located at the focal point or "detector' position of the first l8o° spectrometer. It can be employed for several distinct uses as a detector, as a surface ionization source, or as a target with which primary ions may interact to produce secondary ions. I shall forego further physical description of the machine except to point out that two detectors (a jTaraday cage converting to an electrometer, and a very small "semiconductor" magnetic electron mtiltiplier can be made to "scan" the entire focal plane of the 2nd l8o° analyzer. The electron multiplier, in fact, utilizes the fringing field of the magnet for its operation. V/e have discussed this device at a previous ASTO meeting (1960) and it has also been reported in the literature.-'-
*Fresent Address: Linear Accelerator Laboratory, Rensselaer Polytechnic Institute, Troy, New York
**Operated for the United States Atomic Energy Commission by the General Electric Company, Contract No. W-3I-IO9 Eng'. 52.
""•f. A. Vihite, J. C. Sheffield, and V/.D. Davis Nucleonics I9 58 (1961).
244

EXCITING COILS
CORE
POLE PIECE
1 1
s \ \ \ \
olide 1. Top view of electromagnet indicating the pole piece contour, yoke, and exciting coil.
Slide 2 . Assembled cascade spectrometer with oil diffusion pumps and liquid N2 traps. To the right of the two pyrex cap& can be seen the magnetic electron multiplier housing and scanning mechanism.
245

Glide No. 3 shows the tvro sources schematically, indicates the trajectories of primary and "cascaded" ion bea-Tis, and the "scanning" electron multiplier used to detect the arrival of single ionized atoms along the focal plane of the second l80° analyzing sector. At this point, I should probably state that the instrument was conceived so as to provide some insight into very complex interijlay of -phenomena that occur in the surface ionization process. It is our opinion that such studies must look at "transient as well as equilibrium phenomena. Let me siraply indicate the experimental observations vrtiich, in principle, can be obtained with this equipment.
1. Assume E2>Ej^. In this case the primary beam is decelerated, electrostatically reflected, ind the "eascaded" trajectory is similar to the priraary one. Note that this is a "reflection" two-stago. Instrument, rather^than "transmission" types which we have previously reported. '^ The "abundance sensitivity" we have measured to be about 100 times that of a single stage instrument.
2. Assume E2<E-]_. In this instance the primary beam will be incident on the second surface Ionization source filament. We are thus "doping" or loading the 2nd surface Ionization filament by lon bombardment. Inasmuch as Tg is variable (as well as the bombarding energy, E.-E ), we can study the re-emlssioi. process dynamically.
3. Pulsed Techniques. It is clear that the primary source can be pulsed with variable pulse widths and repetition rates. Our preliminary work indicates that such an approach is necessary in order to clearly differentiate between the primary reflection Ions and those which penetrate deeply into the "target" filament, diffuse to the surface, and become re-ionlzed.
k. Sputtering Phenomena. Sputtering takes place to some extent In every mass spectrometer source, in the conventional analyzing tube, and to an appreciable extent on the cathode of most spectrometer detectors, i.e., electron multipliers of one category or another. Sputtering, in fact, must play some role in changing the work function and hence the secondary electron yield of most mass spectrometer multipliers, at least if high current beams are monitored.
Because my time is limited, I will mention only three specific measurements that should be of academic and instrumental Interest to mass spectroscopists.
Let us use Cs -I33 as the primary ion beam. In all cases let E]>Eg, and now examine ions which are sputtered from two different "target" filaments, molybdenum and copper. V.'e recall that most atoms sputter off a surface as neutrals, but an appreciable fraction, possibly 1%, will come off as charged particles. The actual percentage is a function of many parameters. First considering the case where E]_ is ~ 10,000V, Eg is ~ 7OOOV and a thin molybdenum ribbon is used as either a clean surface ionization filament vSiich can be heated, or a sputtering target—where we observe Mo* ions and analyze them in the "cascade" or second trajectory.
Slide k shows us the qualitative picture we obtain. If we heat the filament to a suitably high temperature, thermally emitted Mo*' ions from the molybdenum filament may be mass analyzed. The resolution is poor because certain compromises have been made; wide slits, source somevrtiat out of focus, etc. '.vhat is of interest is that we obtain suljstantlally the same spectrum If we do not heat the filament, but bombard the cold molybdenum filament with a beam of Cs* ions. Sputtered atoms that leave with a single positive charge are accelerated through a potential E and the similarity of the spectrum to that of the thermally emitted spectrum, clearly indicates that the sputtered ions have a very limited energy distribution (< 10 ev).
It is also now of Interest to investigate the sputtering yield, as a
function of the energy of the bombarding cesium beam. Slide No. 5 indicates
2?.A.Vfhite and T.L.Collins Applied Spectroscopy 8 No. k , 169 (1954).
3r.A.Vfhite,if.M.Rourke,and J.C.Sheffield Applied Spectroscopy 12 No. 2 46 (1958).
246

MAGNET POLE PIECE
PRIMARY CESIUM ION BEAM
TRAJECTORIES OF SPUTTERED IONS (E2<E,)
REFLECTED IONS (E2> E|)
— n JE, E 2 ( _ l — \ - ^ ^ 'V rC^ i -
E,-Es •MAGNETIC ELECTRON MULTIPLIER
TARGET FILAMENT
Slide 3- Schematic of cascade spectrometer.
SPUTTERED SPECTRUM OF MOLYBDENUM FROM
~ 3 0 0 0 V Ct+ IONS
M o - IOO
• M o - 9 2
(~ 1.6 X 10"* AMR -FULL SCALE)
• Mo-IOO
THERMALLY EMITTED MOLYBDENUM SPECTRUM
Mo-92
Slide k . Sputtered spectrura of molybdenum produced by ion bombardment compared to a spectrum from a surf.qce inni^o+i^r. c. fais^u. spectrum from a surface ionization source.
247

our preliminary results and reveals the yield as a monitonically increasing function of bombardment energy. The data was obtained by applying suitable bias potentials. Eg, and adjusting the magnetic multiplier to the Mo -92 mass position. The assumption is made that the number of sputtered atoms vrtilch emerge with a single positive charge Is proportional to the total yield (vAiich is predominantly neutral).
Slide No. 6 shows results obtained v4ien a copper filament was bombarded with a cesium beam. It has special interest because copper cannot be analyzed via a surface ionization or thermal ion source. You will note that we obtained a completely resolved spectrum of the two copper Isotopes. We were also able to make a reasonably precise ratio determination of CU-63/CU-65.
The ratio v*ilch we obtained by this technique was 2.25 * 0.02, and we believe this is the first precision isotopic ratio determination made by analyzing sputtered species. Our value is in agreement with the accepted , values determined by electron bombardment of CuClg vapor by Brown and Inghram and of Duckworth and Hogg' using a spark source with a copper electrode.
We are not suggesting that a sputtering technique can ever compete in general applicability to surface ionization or electron bombardment sources in mass spectrometry. It will be appreciated, however, that the method is alraost non-destructive, requiring in favorable cases, a very small number of sputtered atoms (~10" grams), and it is possible that isotopic abundance determinations of surface atoms may be useful in diffusion studies, etc., as well as providing a tool for a further understanding of the sputtering phenomenon Itself.
I have not had time to review some of the other measurements that can be made with a speotrometer of this type. To date, however, it has proven to be an exceedingly versatile research tool. Vi'ith the aid of this Instrument we hope to make many additional measurements that will allow us to build better analytical spectrometers.
H. Brown and M. G. Inghram, Physical Review Jg, 347L { l 9 k 7 ) -
H. E. Duckworth and B. J. Hogg, Physical Review 7I, 212 (l9't7).
248

lOr
- l idc J . R. lncive y ie ld oj s^.utt^rcd Mo^-Vc ionL; irc.n C£. '-1^,3 ion bomb.irdTient (1350 t o 7000 ev r..inse).
1 1 1 O
9 -
1 6 -
o _i k i
o z cr UJ
0 Q. 1/1
UJ
> 3 -
- " 2 -UJ
tc
I 1350 2000 4000
CESIUM ION ENERGY (VOLTS)
Cu-63 /I
l ~ 5 « 10" ' " AMPERE) FULL SCALE
Cu-65
7000
o l lde 6. Mass spectrum of sput te red copper t a r g e t (I'roui oOO ev C. iorio}.
249

AN EXPERIMENT INVOLVING THE NUMERICAL DETERMINATION OF ION PATHS IN NOW-HOMOGENEOUS MAGNETIC FIELDS
by A. C. Lilly, Jr., T. J. Weismann and D. A. Lowitz Gulf Research & Development Co., P. 0. Drawer 2O58,
Pittsburgh JO; Pennsylvania
INTRODUCTION
In calculating the exact paths of charged particles in Inhomogeneous fields, a knowledge of the intensity of the raagnetic field at every point is necessary. Presently available empirical methods(1"^) for the determination of ion paths appear suitable for the design and construction of single collection mass spectrometers. In dealing with the simultaneous collection of more than one ion beam, a knowledge of the exact ion paths becomes important. The need for this information arose in our laboratory in connection with the construction of a double-focusing mass spectrometer employing simultaneous collection of three ion beams . This paper is concerned with the specific method employed in these trajectory calculations and the general applicability of the method in dealing with non-homogeneous, but known, magnetic fields.
Magnetic field matrices were compiled using a Hall device gaussmeter and the procedure of Coggeshall and Muskat - -' was adapted to enable calculations to be performed on an IBM 709O computer.(°^
EXPERIMENTAL
In order to adequately measure the magnetic field used in the computations, the apparatus shown in Figure 1 was employed. The field was measured by means of a Radio Frequency Laboratory Model 1295A Gaussmeter equipped irith an HB-9538 bismuth Hall-effect probe which was mounted on the carriage of a stepping device (originally designed for a well-logging application) having a variable step length adjustment which permitted the desired interval for raeasurement to be selected prior to the experiment. In practice, the instrument was so positioned that the interval of the automatic stepping device provided the x Interval of an x,y coordinate system. The desired y-value was obtained manually with the aid of a calibrated arm on the carriage and was adjusted before each set of measurements In the x-direction. We have raeasured the fields of two magnets by this procedure: a permanent magnet with an apparent 60° magnetic sector fabricated from magnetron magnets using soft iron pole pieces and an electromagnet with an apparent 60° inagnetic sector in a Nuclide Analysis Associates ratio mass spectrometer. For each of these magnets approximately JOOO field points were measured. Spacings of 0.1 cm in the field of the permanent magnet and 0.1 inch for that of the larger electromagnet were used. The measurements represent the z-component of the field in the central plane of the magnets and are accurate to ± 5^ or ± 10 gauss with a lower limit of 10 gauss . The raatrlx of field points thus measured may be transformed into any convenient coordinate system for utilization in the computer program. The format employed in these studies is shown in Figures 2 and 3. The coordinate system for the magnetic field "Was chosen so that its ordinate, y", was parallel to the bisector of the magnetic sector. The field matrix, defined by the x", y" coordinate system (Figure 2a), was oriented so that the x" axis was parallel to the x', y' coordinate
•"Dempster, A. J., Phys. Rev., 11, 516 (I918).
herzog, R., Zelts. f. Physik, 89, kk7 (l93lt).
^Mattauch, J. and Herzog, R., Zeits. f. Physlk, 89, 786 (193't) •
Nier, A. 0., Rev. Sci. Instruments, 11, 212 (l9l)-0).
^Coggeshall, N. D. and Muskat, M., Phy. Rev., 66, I87 { I 9 k k ) , y - —
The prograra is available through SHARE.
250

stepping de-vlce vith Radio Frequency Laboratory Model 1295A (gaussmeter and bismuth Hall-effect probe for magnetic field measurements.
y y =0*0
\ /
x„ ,y
\ i \
FIGURE 2a. Format showing placement of magnetic field coordinate system within coordinate system of particle's trajectory (fixed Instrument coordinate system).
FIGUKE 2b. Format showing effective displacement of magnetic field coordinate system.
251

systera of the particle's trajectory. The source was always taken at the origin of the particle's coordinate system. The input data for computing a particle's trajectory then consisted of (l) ibg, the angle between the particle trajectory and the x' axis at the source; (li) Xg, the distance of a reference point In the x", y" coordinate system from the y' axis; (lli) ys, the distance of a reference point in the x", y" coordinate system from the x' axis; (iv) R, the radius of the circular trajectory based on the particle's mass, charge, velocity and on the maxlraum value of the field, Hg; and (v) a dispersion angle, a , at the source, which defines two additional trajectories forming an envelope about the one defined by ipg and so placed that the trajectory defined by ^Q initially constitutes a central trajectory (Figure 3 ) .
The output data consisted of the x' and y' values for each trajectory and the field value encountered at each "printed out" point for the three trajectories.
In order to reorient the magnet by means of either a rotation or translation, the 'values of Xg, yg and g "sre changed accordingly so that in the next x', y' coordinate system, the x" axis was again parallel to the x' axis, and the source was again at the origin (Figure 2b).
Particle trajectories can, in prlnciple_, be calculated for a wide range of particle energies, angles of Incidence and source locations.
The procedure used for the calculations was essentially that of Coggeshall and Muskat(5). Starting with the Lorentz force law
t = l ( 4- T X^) (1)
and letting
E*= 0; B*= kB^ = kH^ (2)
it follows that
y = — X (3)
eH . -, , X = — y (4)
mc '' ^ ' If the normalized field h(x,y) is defined as follows
H(x.y)
equation (3) yields
„- - h(x,y) (5) 0
i/h(x,y: ^0 da + -2 (6)
'Where — = sin ipg and HQ is the maximum field value measured. R is the effective
radius in the field HQ.
Dispersion or aberration effects originating beyond the source slit may be simulated by the appropriate placement of the magnetic field matrix within the Instrument coordinate system. The iteration procedure used in carrying out the calculations may be explained as follows. The equation for sin ^ j^ vhere <()j_ is the angle the trajectory makes with the x axis after the first step, is given by
sin ij) = -K h^^Q(x,y)(x^-XQ) + sin ^^ (7)
where
K = and sin ([) = i eH„ ^ V
252
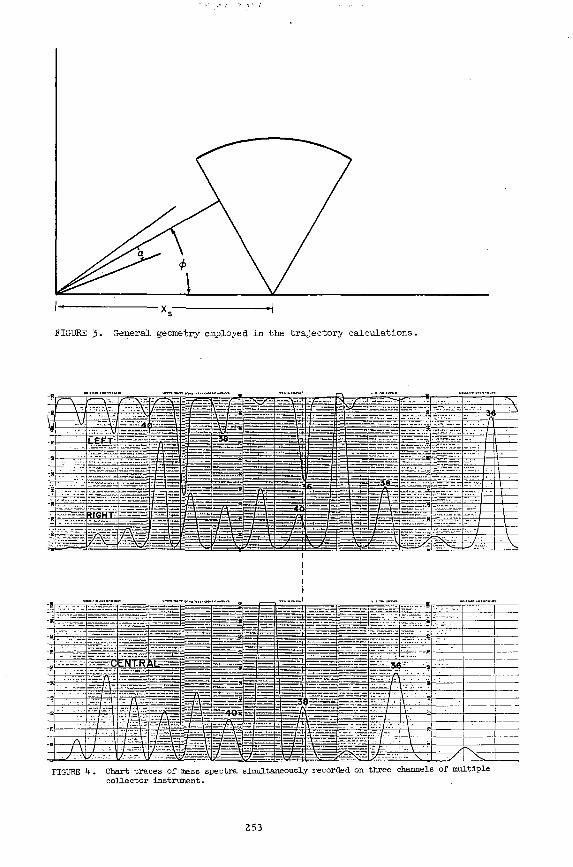
FIGURE 3 . Gene ra l geometry employed i n t h e t r a j e c t o r y c a l c u l a t i o n s .
FIGURE k . Chart t races of mass spectra siraultaneously recorded on three channels of multiple co l lec tor instrument.
253

After step 2 (at x„) the equation for sin ^ is
sin ijjg = -K f h2^^(x,y)(x2-x^) + h^^Q(x,y) (x^-x^) j + sin (p
and a t step j n=j
sin p^ ' -^Y y y ' ^ ^ y ^ - i ^ ^ ^ ^ *o
(8)
(9) n=l
In the limit as the size of the interval approaches zero one obtains
lim X -X T = 0 n n-1
-K / h(x,y) d^ + sin ^^ (10)
(lim x^-x^_^ = 0) — = -K j h(x,y) dx + .^
0
(11)
The calculations were repeated for intervals of decreasing length until the value of the integral was stabilized. The calculations described have been used in the design of a small 3'25" radius double-focusing raass spectrometer for potassium-argon geochronmetric measureraents. The spectrometer measvires three focused ion beams simultaneously, i.e., mass 36, 38 and kO, Figure k displays chart traces of the three beams obtained siraultaneously during a mass scan. By coraparison of the peaks in the region of the dashed line, it is evident that mass 36, 38 and l+O occur simultaneously within the -width of a single raass peak.
A raore quantitative presentation of the results is given in Table I.
TABLE I
Collector
Inner
Central
Outer
V(exp.)
A(calc.)
m/e
36
38
ko
1365 ± k o
= 1290
I/I ' ^ 0.814-
1.00
0.56
Slit Width
.o4o"
.025"
.040"
= 31.5°
16.5 cm
In making these measurements, mass 38 was collected on the central channel and the fraction of masses 36 and kO entering the designated channels was raeasured. V/i((,alc. Is the energy used in the calculations for the total placement of each of the three ion beams in their respective channels. V^(exp.) ^^ ^^^ e n e r g y required to yield the results shown in Table I, en^iloying the same values of ^ Q , X3 and yg used in the calculations. The observed deviation of 7 / ^ / ^ ^ ^ and V^jcalc.) °f ^ approaches the accuracy of the magnetic field measurements. A detailed raeasurement of the magnetic field permits other calculations of Interest to be made. Figure 5 illustrates the dependence of the focal properties of the 3'25" radius permanent magnet on the angle (f). It is seen that as this entry angle is varied from 28° to 33° the image lengths shift along the paths until at 33° the rays diverge completely.
254

^r 60»-«
.007" -' / ^ ^ 0 0 7 '
3 ^ ^ - ^
FIGURE 5 . Dependence of focal proper t ies of 5*25" radius permanent magnet on angle ^ .
FIGURE 6. General case of f i r s t -o rder focusing of ion beam in homogeneous magnetic f ie ld with sharply defined boundaries of any a rb i t r a ry shape (a f te r Reference 2 ) .
255

The symbols in the Herzog equation, which relates the pertinent parameters for focusing by an Irregularly contoured field with no fringe effects are defined in Figure 6. Transposed to yield the image distance the Herzog equation is
cos ((j) - e^)
(12) ^ 2 = -cos ((() - Eg)
cos Eg
•"1
h r
cos
sin ((}) -
cos e 'l - '2) cos Eg
This equation is given in terms of the deviation of the beam 9 rather than the sector angle. To obtain the equation in terms of the sector angle (|)' when considering a regular sector, one substitutes ij) = (j)' + e-|_ + eg. The angle £j_ and eg are, respectively, the angle of Incidence and the exit angle of the central ray.
Figure 7 illustrates the dependence of lo on the position of the sector's apex along the ordinate. Several values of €]_ are considered. The curve predicted by the Herzog equation for a perfect magnet of the same radius and angle is shown for comparison. The differences are probably due to the curvature of the field lines, as shown in Figure 8 for the small permanent magnet.
Figure 9 illustrates the dependence of Ig on £]_, the angle of incidence, for the dispersion angles 0.1° and 1.0° for the sraall perraanent magnet. Again the prediction of the Herzog equation for a perfect magnet of the same size is shown for comparison. Figure 10 illustrates this behavior for the NAA 6" radius electromagnet with a's of 0.5° and 1.0°.
(7) Coggeshall^ has studied the general form of the fringing fields on magnets by assuming the regions of constant magnetic potential are as shown in Figure 11. A Schwarz-Christoffel transformation "was then used to transform the upper pole piece surface onto the negative real axis and the median plane onto the positive real axis. The field was calculated between the two planes and again transformed back into the z-plane. The fringing field is then given in norraalized forra in terras of a parameter n which is the -ratio of pole piece thickness to gap Aridth. Using the fringing field curves published by Coggeshall, trajectories were calculated for the permanent and electromagnets described in this paper employing the same technique outlined for the trajectory calculations in the real fringing field. Figures 12 and I3 show the comparisons of the trajectories, for the permanent magnet with n = 1 and the electromagnet with n = 3^ with the trajectories calculated using the real fields . Also shown are the two normalized fields along the beam paths.
CONCLUSIONS
1. Using the measured values of the normal field in the median plane of the magnet of a double focusing mass spectrometer, the simultaneous trajectories for masses ^ 6 , 38 and l+O were calculated. Expressions published by Coggeshall and Muskat were used for the calculations. The experimental data for the simultaneous collection of the three masses reproduced the calculated values to a reasonably good degree of accuracy.
2. If the Herzog relationship for image length in terms of object length, incident angle and exit angle is used without considering the actual field contour, large errors can be accumulated due to irregularities in the slope of the contour. Calculated values of the image length based on the actual field deviate greatly from the values calculated by raeans of Herzog's relationship when the sector is assumed to be regular.
7 Coggeshall, N. D., Jour, of Applied Physics, I8, 855 (191+7).
256

E
i o .o
I l l l l J l—J I L J I L J \ I \ \ I \ I h (cm.)
FIGURE 7. Dependence of 1 . on position of apex of magnetic field sector along the ordinate.
Y(cm.) 3 8 6 0
3 0 0 0
1000
2 0 0
I I I I L
2 0 0
L 10 12 14 16
X (cm.) FIGURE 8. Field contour for 5.25" radius permanent magnet sector.
20 22
257

ACKNOWLEDGEMENTS
The authors are Indebted to Mr, Emmett B. Shutes for his assistance in design of the experimental apparatus and drawings and to Mr. Nicholas J. Bezak for his work in programming the trajectory problem.
258

c
3.25 RADIUS
PERMANENT MAGNET
• a=O.I°
° 0=1.0°
FIGURE 9. Dependence of 1 on c for 3.25" radius permanent magnet sector.
+ 3 r—
42
+ 1
O
"' - 1
- 2
- 3
-A
-5
- V,
HftfZOg
« - . 5 °
•€ ;v . . i .
NAA a' AO° Sector Mognet
l l l l i l l l l I \ I 9 10
1,(111.)
-co+in
- 0 O + I
NAA ra t io mass spectrcmeter.
ni
-co
- 0 0 -
- c o -
FIGURE 11• Type of magnet pole construction considered in conformal transformation (after Reference 7).
259

ts
U O S O C<l
§•5
O O Tj O 1H ^
la r i ca 0 O Ot
O aJ -d
f-i 0) tJ
d bO O
PI C >1 ^13 •» rH :3 - a
1-1 T J +J ( M l l 03
•H .O IT)
(i»H3U!) X
h iH Hi
•3f:
H SS
ill
n 4)
i "S p. s Tl m
l« B) TJ
X! +> -H
r j S) O
260

A High Sensltlvl'ty Hass Spectromstar Ion Source
M. Doctoroff^ and S.S. Grossel Tacuum-Eleotronles Corp.
Terminal Drive
k Bass Bpeotrcoeter lon source capable of prodaclng orer HX) tims ths positive lon output of tbs conventional Kler-4ype source^ has been developed. The distinguishing feature of this new source Is that both Ions and electrons move parallel to the axis of the tube. The axial souroe Is similar in concept to the one of Stain and Binns^ but differs in that no magnetic field Is required to ooUiniate the electron beam.
Fig. 1 Is a schematic diagram of ths source. Electrona accelerated from the fUamanb through tho grid aro brought to a focus In the vicinity of the lon voltage defining slit. Beyond this silt they diverge, some being collected by the ion focusing electrode, and the rest returning to tbe lon voltage plate and being collected there. As a result, ions are produced In three regions: between the filament and tha electron accelerating grid; between the accelerating grid and the voltage defining slit) and between tbe voltage defining slit and ths grounded object slit. Ions farmed between the filament and tbe electron accelerating grid return toward the fllamemt. Ions created beyond the accelerating grid, but not very near tho voltage defining slit, are not drawn out. These Ions, however, do partially neutralize space charge repuslon in the- electron beam,'^ allowing more effective focusing action. Ions generated in the third region, beyond the voltage defining slit, are not focused, and are only a minn percentage of those realised at the collector. Most of the extracted ions originate in a small Toluina around the voltage defining silt. Stopping potential measurements of the energy distribution in the lon beam, indicate that this volume is bounded by equipotentials separated by only a few volts. Only these ions, created in ths immediate neighborhood of the voltage defining slit, are focused onto the object slit, and they constitute nearly all of the emerging beam. In essence, the arrangement Is suoh that the major pairt of the Ions which reach the oolleotor cones from an area where the potential variation Is small, though ions with a large range of energies are fonned at other points within the source.
The axial source has a partial pressiire sensitivity approximately ten times greater than the Veeoo-Nler source at the same emission current of 2 miUianqwres. Operating at $0 milliamperes tbs axial source is about 100 times more sensitive than the Teeoo-Nler source at 2 milUnnperes. The detail available from the axial souree Is apparent in the Inset on Fin. i irtiere, at 10 milliamperes, a set of small peaks In ths sixties is scanned on a more sensitive scale. Object and Image slits were 0.006 and 0.015 Inches, respectively, and scans were taken in a Veeoo OA-3 gas analyzer tube having a 2 inch radius of curvature and a magnetio field of 1;000 gauss. It should be noted that the standard gas analyzer uses tha Nier-type source.
In conclusion, tha axial source has been found to generate an ion beam with a sufficiently ooall energy distribution for many mass spectrometry applications, and to be capable of a sensitivity 100 times that of a Nier pattern source.
* Now at Sylvanla Research labs, Waltham, Massachusetts 1 H. Doctoroff, S.S. Orossel, D.W. Oblas, Proceedings of the Second International Congress
on Vacuum Techniques, I96I Pergamon Press (In Print) • A.O. Nier, Rev. Sol , I n s t . 30, 212 (I9U0) 3 F.S. S te in , J .E . Binns, AEC Document MnDC-l670 (19lt8) •» E.G. Unde r , K.G. Hemquist , J . Appl. Phys. , 21j 1088 (1955)
261

ifi
UJ o tr o
<
X <
•I-l
_l trt
I -
m o o UJ o z o cc CD
LU O O CC V -
o z t r t
o o
trt
o
UJ
5
C3 Z
CO •=> l l J O Q
po SS ^ - ^ i i j _i UJ
CS)
< oc UJ _ l UJ o ^ 9 ^ tr o a: o UJ _ J UJ
CS) z Cf) 13 UJ
UJ
o
o CO < X <
UJ X
< cr < o o I -<
UJ X o CO
262

SOURCE DESIGN CONSIDERATIONS FOR SECTOR FIELD MASS SPECTROMETERS
George Salser and Yuji Tajima Department of Chemical Engineering
New York University, New York, New York
In our work with a 60° magnetio deflection rapid scan mass spectrometer, we have been able to observe certain effects which, in all probability, have not been as readily detected in machines with lower sweep speeds. Two of these effects, which I will discuss, originate in the source region and are highly undesirable. They are, namely,
1. The voltage effeot described by Nier and others — it is characterized by a drop in detector ion current when acceleration voltage is decreased; and
2. The instability of detector ion current with time under conditions which should lead to a stable ion current.
A short description of the machine will undoubtably make the discussion somewhat clearer. The machine, modeled after that of Blanchard and others at Laval University, is a rapid scan 60° magnetic deflection instrument with a 6" radius of curvature. An electron multiplier is used as a detector with its output displayed on an oscilloscope. For slow speed operation and absolute measureraent of ion current, provision, is made to replace the multiplier with a vibrating reed electrometer. An emission regulator is used and all circuits at high voltage are protected by guard shields. The norraal sweep voltage is frora 6000 to 1000 volts although tne machine will sweep down to 500 volts. The sweep speed may be varied from a sweep taking several seconds to sweeps of about a millisecond. All the units are highly regulated.
The machine as it was originally set up showed great instability and variability. Consequently, a program of rebuilding was started — all electronic control units were rebuilt to give outputs of high stability. Provisions were also made to supply the source region with all types of voltages whioh might be useful. Draw-out and repeller voltages, both fi.xed and variable with sweep, were installed.
The original source and its ion lens are, I am sure, familiar to most of you who have worked with sector machines. This is shown on Fig, 1. The source itself is of the electron bombardment type. The lens consists of plates set upon glass insulators — the voltages of these plates being derived from the accelerator.
To determine the voltage effeot, all variables were maintained constant and the accelerator was allowed to sweep. This results in a panoramic display of mass peaks on the scope, Tbe magnet was then manually swept at very slow speed causing the whole mass peak display to move across the face of the oscilloscope. V/hen the peak of a particular mass was focused at various acceleration voltages, its height was plotted to give a graph such as that shown in Fig. 2. The solid line is one of the better curves drawn from such data. As can be seen, the ion ourrent falls off alarmingly when the acceleration voltage is decreased below 2000 volts. Furthermore, the voltage effect curve was not at all stable — it varied almost from one minute to the next. The broken lines show sorae of the other curves which were obtained and indicate the variability which was encountered. Analytical work was, of course, irapossible under such conditions.
It was felt that modulation of the beam by the accelerator linked draw-out might cause the drop observed in the ion current. Consequently, the machine was equipped with both repeller and drawout plates, connected in a manner so that their voltages would remain fixed relative to the ionization region, during the period of a sweep. However, the voltage oould be set at any desired level. This modification resulted in a rather small improveraent indicating that although a modulation did occur, its contribution was small. The instability as well as a major portion of the voltage effeot remained unaffected,
rig. 3 shows one of the many modifications of the ion lens which was tried — deflector plates of the type shown were installed but again the improvement was small. The instability remained unchanged.
Theoretical considerations show that ions may be lost in a number of ways. One of these is space charge dispersion of the beam. Fig, h gives the .formula used for calculating this effect and some of the calculated values for our system. We have assumed that the beam consists of ions traveling in parallel paths with a
263

FIG. I
TYPICAL SOURCE OF ORIGINAL MACHINE
P>n
^^^^^^^^^^^^^^
\r^)
M, O
^
v}/////)////777?i ^/////////>//////}/A i . ^ ^ K K K K K K ' v \ v " . k ^ ^ ^ k • . l k - . - . k k k ' . k k O k ' . k - . ' . ' . U M
-7-7// / / • / / / / A f / / / / / / / r r r r
L\\v\\\\\^\\\\\^^ ^w^^m^:^^^ '' ' U J J I ' l / > / > > / > > / ! , / / / / / / / / / / / / ^ / > > n
FIG. 2
VARIATION IN ION CURRENT
OF A
SINGLE PEAK FOCUSED AT
VARIOUS ACCELERATION VOLTAGES
6000 1000
264

cross section equal to that of the exit slit. The values calculated are acceleration voltages required to prevent a widening of the beam by a factor greater than 2 in a length of 100 cm. This effect is maas dependent while our observations have shown that the voltage effect has little if any mass dependence. Furthermore, we do not have a parallel beam of ions — but one which broadens through the magnet region and is subsequently refocused which lowers the current density, and we do not normally operate with ion currents much in excess of 10"? amperes. On the basis of these considerations, we concluded that this space charge dispersion effect will not be prominent above 1000 volts, the region where we operate. However, in larger machines with longer path lengths, or at higher ion currents, the contribution of this effect might be quite large in the high mass range.
At this point, let us consider a top view of the mass spectrometer. This is shown in Fig, 5 — one can see the track which ions must take to reach the detector. Along the plane of the tube perpendicular to the vertical plane, there are no deflector plates to correct for deviations in the ion path. Consequently, any side accelerations received in this plane within the source region will irreversibly deflect the beam. If we consider a simple vector diagram of the acceleration voltage and some side acceleration, it can be seen that the effect of side vectors is indeed a voltage effeot since the angle changes rapidly as the acceleration voltage is reduced-. At 1000 volts, for example, a side vector of only 26 volts will completely eliminate the beam. This is in the order of magnitude of the voltage which would create the effect which has been observed in our machine.
Since such side vectors may arise in the ioniaation region as a result of penetration of the electron acceleration voltage and anode voltage, efforts have been made to eliminate such fields. After considerable shielding, it was found that the ionization region did indeed contribute a small side vector. This, however, was not enough to explain the voltage effeot encountered. In the course of this work, it was found that screens are not permissible in the electron beam since heating by electron bombardment occurred and resulted in surface ionization.
It was noticed that often for brief periods of perhaps 3-U seconds, the voltage effect would disappear. These were always preceded by a discharge of some kind, suggesting that perhaps arcing over the insulators occurred and effectively wiped them free of charge. Charges upon insulators would cause side acceleration vectors which would be variable with time. In view of the foregoing observations, sorae method of shielding the beam from the insulators was sought.
The use of a lens to shield a beam has long been known in cathod ray tube work. A detailed description of the two cylinder lens used by Epstein is given in the Proceedings of the Institute of Radio Engineers, Vol, 2k, 1936 . At the upper rignt in Fi£, 6 is the lens used in cathode ray tube work — it consists of two metal cylinders forming an optically spherical lens. For our work, an optically cylindrical lens is needed. This configuration is shown in the lower right — the lens consists of flat plates. The souroe using this lens is shown on the left half of the slide.
This assembly not only eliminated almost all traces of the voltage effect but also gave extreme stability, Repeller and drawout voltages were held constant with respect to the ionization region, VJhen they are linked to the accelerator power supply, modulation of the beam oocurred.
In the present lens design, the voltage ratio used is between li:l and 6:1, making the focal point for the main lens lie i-dthin the ionization region. A second lens forraed between the focus plates and the drawout plate shorten the focal length so tnat the crossover formed at the drawout plate is refocused as is shown in the slide. An exit slit has been omitted since the resolution is determined.by the crossover at the drawout plate and the presence of the slit would probably only cause modulation of the beam.
In conclusion, to eliminate the voltage effect and minimize the instability of the ion current, certain principles must be adhered to in the design and operation of sector field mass speotrometers. Namely,
1, The ion beam must "see" only conductors since insulators tend to collect charges causing highly undesirable electrostatic fields. Insulators may
265

FIG. 3
A TYPICAL MODIFICATION OF FOCUS PLATES
l O ^
^'' ^ ^ ' • ; j ^ ^ ' • ' • ' • ' • ^ '• '••-•-••'-•-'-"•-''^•-'•'-'-'•'-''^•-•-^'-'•vssAjA'•'•"•'•''
MUTUAL REPULSION OF IONS
z = V 4n« c^m. \c'm, I
Vol lagt raquirtd lor 9 ' 2
Curr.n1 - i
2 0 0 > I 0 " °
IOO . 1 0 " "
10 . 10- ' °
1 . I O - "
A M U
2 0 0
3200
2010
4 3 5
9 3
IOO
2 4 6 0
1590
3 4 5
74
5 0
1950
1260
274
58
25
1550
1000
218
4 6
Poth Length IOO c m
Baam C r o t i Section • O . Z S m m '
W o l i o n - W o t t , R A. Phil Mag. 3 , p 8 4 9 , 1927
266

be either physical supports and/or deposits from the back diffusion of pump oil, samples analyzed or residues from improper cleaning.
2. The ion lens and ion ejection system raust be designed so that modulation does not occur. Modulation can be produced not only during ion ejection from the ionization region but also by angles produced at crossover so that the ions can no longer be termed paraxial.
3. The ion beam must be shielded from all electrostatic fields crosswise to its path or deflection plates placed in the tube to correct for the effect of such fields.
We would like to take this opportunity to thank the Air Force Office of Scientific Research, Propulsion Division for their support of this work under contract AF li9(638)173 and Dr,C, E. Berry for his invaluable advice at a time when we had run out of answers.
267

FIG. 5
ION TRACE
TOP VIEW OF MACHINE
SIDE DEFLECTION VOLTAGE WHICH WILL ELIMINATE BEAM AT COLLECTOR
ACCELERATION VOLTAGE
6 0 0 0
3 0 0 0
1000
5 0 0
SIDE DEFLECTION
156
78
26
13
FIG. 6
SOURCE USING
T W O CYLINDER L E N S
SPHERICAL CONFIGURATION
TWO CYLINDER
LENS
CYLINDRICAL CONFIGURATION
268

'STUDY OF RESOLVING POWER OF A SINGLE-FOCUSSING, 12 IN. RADIUS, 60°, MASS SPECTROMETER"
Graham G. Wanless and George A, Glock, Jr,
I, INTRODUCTION
We thought that it would be of interest to describe the performance of our 12 in. radius, 60°, single-focussing mass spectrometer.
This instrument was a joint effort of General Electric Company and Esso Research and Engineering Company, I should give credit to L, A, Dietz of General Electric Company, and to W. H, King, Jr., and to B, E, Hudson, Jr,, of Esso Research and Engineering Company,
In the past, this mass spectrometer has been used on a variety of high temperature and high mass range problems up to about mass 900, where the peaks were still individually resolved. With the original 0,008 in. collimatlng slits, the resolving power was about 500,
More recently its resolving power has been Increased to a least 2750, It is the purpose of this paper to describe some experiments made with this problem In mind.
The first slide, if you please, will show a photograph of the mass tube.
Slide 1
The output signals are fed through a Cary vibrating reed amplifier, alternatively, to an oscillographic recorder and to a sensitive high-impedance recorder.
slide. The lon source design Is shown schematically in the second
ION SOURCE DESIGN
0.005L, j ~ i — 1 — —J
Sl ide 2
269

It contains three slits -
a) 0.005 in. ion-gun slit b) Two 0.0015 in. collirnating slits.
There is a lot to show on one slide. So let me show slide 2A, which is the same as slide 2 with the voltage divider added.
ION SOURCE DESIGN
H
I l l i II U ^ ' 1 n r p . II II ll II
II
5803 V. S900 SOTO eiO 970 90
LS-«-rM.t
Slide 2A
II. POTENTIAL RESOLUTION OF A SINGLE-FOCUSSING INSTRUMENT:
Slide 3
THE POTENTIAL RESOLVING POWER (Mp) IS
Mp =
LS-62-11450
Slide 3
where R = mass tube radius S = collector slit width W = width of ion-beam object (not necessarily equal to
collimatlng slit widths) A =• sum of instrumental aberrations contributed to the
refocussed ion beara.
W is the result of the electrostatic focussing in the ion gun, and it is dlTficult to know. If we assume that W equals the actual collirnating slit widths, then we can estimate the sum of the instrumental aberrations.
270

In our case.
Mp
R
S
W
= 2750, MINIMUM
= 12. IN.
= 0.00025 IN.
= 0.0015 IN. [ A S S U M E D ]
LS-62-11451
Slide 4
(a) If there were no instrumental aberrations,
- 6857. Mp = 12.0 (0.00025 + 0.0015)
(b)
FOR AN ASSURED RESOLUTION OF 2750,
12.0 MD = 2750 = (0.00025 + 0.0015 + A)
.A = 0.0026 IN.
LS-62-11452
Slide 5
(c) If 0.001 in. collimatlng slits were used, the resolution could be increased to 3109, or by about 14%.
Thus, it is evident that there is no use in reducing slit widths, unless concurrent progress is made in reducing aberrations.
III. PRACTICAL MEANS OF IMPROVING RESOLVING POWER: -
This subject has been considered carefully by Thorburn and Robbins (1) in relation to a Metropolitan-Vickers M.S. 2 mass spectrometer. Their paper is an excellent guide when studying this problem.
1. In the time available, it has not been possible to make a critical investigation of every variable. The subjects, although important, on which we have not worked are: -
271

(a) Spherical aberrations, and aberrations causing image curvature.
(b) Increasing the field strength of the yoke magnets.
(c) Space charge effects. These have been avoided. All oi the work presented was done with a sample charge of 0.6 mg.
2. We have studied eleven other variables which are discussed below: -
Reduction of slit widths: -
(a) Ion beam object width (collimatlng slits):
This instrument had great sensitivity, and it has been possible to trade some of it for increased resolving power. The collirnating slits have been reduced gradually from the original 0.008 in. widths to 0.0015 in.
(b) Collector slit:
At the same time, the collector slit has been reduced to 0.00025 in. Concurrently with these changes, reduction in instrumental aberrations have been made and these will be discussed.
The net result is a single-focussing instrument which can be used for conventional work, and after reducing collector slit width - in high resolution studies. As an example, we may enjoy a sensitivity for n-dodecane parent ion, in a resolved doublet, of 2000 chart divisions per milligram. Later slides will show examples.
INSTRUMENTAL ABERRATIONS
(c) STABILITY OF ACCELERATING VOLTAGE.
(d) PARALLEL ALIGNMENT OF COLLIMATING AND COLLECTOR SLITS.
to) REDUCTION OF SLIT LENGTHS.
n MINIMI7E EFFECT OF BACIcnRniINn SCATTERING BY DIFFERENTIAL PUMPING.
Slide 6
(c) Accelerating voltage:
We have studied this extensively and found that in our case, the stability of the high voltage power supply was not critical. This was established by various filter experiments. (See section 3-(k)). Our problem was shown to be a chromatic aberration.
(d) Parallel alignment of slits Is extremely critical, will show the symptoms ol this trouble.
Slide 7
272

SATELLITES AND SKEWED PEAK SHAPES
M43
XIOO
COLLECTOR . „ , , . SLIT WIDTHS " " " ^ S
Slide 7
(i) Satellite peaks which can be seen when the collector slit is opened rather widely,
and (li) Skewed peak shapes which are observed when the collector slit is closed down.
(These peaks were obtained from a blend of equal volumes of n-nonane and 2-octanone.)
After all of the electrical improvements were made, and which are discussed in this paper, successful twisting of the mass tube removed the peak satellites and increased resolution by 119% (from 1320 to 2900).
(e) Reduction of slit lengths to prevent scattering of the ion beam by impinging on the mass tube, in the region of the analyzer magnet.
Thorburn^-'^) found a 15% gain in resolution when the second collirnating slit was shortened, and a 40% gain when the collector slit was shortened.
So far, we have applied this to the second collimatlng slit by shortening it from 0.60 in. to 0.31 in. Time did not permit a special investigation of this change, but undoubtedly it helps, since our mass tube is 0.67 in. wide, inside, in the analyzer region.
(f) Differential pumping of the mass tube has been simulated in our InstrumenTJ by installing a second diffusion pump at the collector slits, and by inserting a slotted plate between the ion gun region and the analyzer region of the mass tube. The slot in this plate is 17 mm x 5 mm, and it has had no adverse effect on sensitivity. Narrower slots will be tried out.
This change was made to reduce pressure and to reduce ion beam scattering in the analyzer region. It has demonstrated that a mass tube of this size needs a second diffusion pump at the collector end of the tube. During the two years when the instrument was run with one diffusion pump, some accumulation of heavy ends occurred at the far end of the mass tube. This accumulation is being removed gradually since installation of the second pump. The pressure below the leak is now down to 1.8 x 10⁻⁷ mm Hg. Although we have not measured the gain in resolution directly, this change is undoubtedly a contributing factor to increased resolution.
Two other changes which contribute to quiet instrument operation Include (1) a separate ground from the chassis of the high voltage power supply, and (2) internal grounds in the mercury diffusion pumps.
273

Chromatic Aberrations: -
This is the principal area for research, factors which we have had a chance to study:
We will discuss five
CHROMATIC ABERRATIONS
(al
«D
a)
tt)
MINIMIZE EFFECT OF DRAWING-OUT FIELD.
OPTIMIZE FI^^MENT TO SHIELD POTENTIAL.
INCREASE ACCELERATING POTENTIAL.
PROVIDE D.C. CURRENT AROUND ION GUN.
REMOVE ION GUN OSCILLATION.
LS-62-114S5
Sl ide 8
(g) Any effect of the drawing-out field which may have existed was minimized by reducing the silt width at the ion chamber from 0.008 in. to 0.005 in. We found that this did not decrease sensitivity. It does hurt the cracking pattern somewhat, but we can stand it. With an ionization chamber temperature of 190°C,, in our instruraent, the M226/M57 peak height ratio for n-cetane is still 0.071.
(h) For our instrument the optimum filament - to - shield potential appears to be 45 volts. This is shown by data in the following taoie:
Table
F i l amen t - t o - sh i e ld p o t e n t i a l
55V 50 45 40 35 30 25 20 15
(1) Measured from
1_
Percent va l l ey in raass
base-
43 doublet
28.5% (1) 2 5 . 21 . ..«— 2 2 . 2 8 . 3 0 . 2 5 . 4 3 , 42,
- l i n e .
(1) Increasing accelerating potential increases resolving power as shown: -
Acce le ra t ing Voltage
5500V,
6600
Table I I
Percent va l ley in mass 128 doublet
21%
15
Approximate Resolving power
2780
2990
274

Most of our work has been done at 5500 Volts, Work above 6000 Volts will require redesigning of the clearances in the ion source.
(j) D.C. Circuitry around the ion source is commonly used in appearance potential worK. We have Deen pleased to find that it also contributes to increase resolving power. The arrangement shown in slide 9 gave a 50% gain in resolution compared to that obtained with the conven-tlonal AC-regulated filament circuit.
D.c. ION SOURCE CIRCUITRY
SAMPLE FILAMENT I REPELLER
^ ^^^^~^^^\y^rzz]y A-BATTCRIES
B-BATTCRIES
Slide 9
(k) Ion source oscillation. Even with complete D.C. circuitry around it, we have found that there is still an oscillation associated with the ion source. It can be removed or greatly reduced by Installing an additional capacitator in the high voltage power supply, as shown in slide 10. This raodification produces another gain in resolution of about 75%:
MODIFICATION TO HIGH VOLTAGE POWER SUPPLY
Slide 10
Many additional circuit raodifications have established that the effect is not a superimposed AC ripple coming from the high voltage power supply. The ripple is a phenomenon associated with the ion gun itself.
275

4. Instrument Tuning Parameters: -
IKSTnUMENT TUNING PARAMETERS
0) DRAWING-OUT POTENTIAL
ai) FOCUSSING POTENTIAL
ail) BEAM CENTERING POTENTIAL
Qv) REPELLER POTENTIAL
LS-62-114S8
please):
Slide 11
(1) Drawing out potential: (Referring to Slide 2A, again.
In this lon source design, the clearance between the flanges on the ion-gun exit slit plate and the drawing-out plate is only 0.055 in. This makes the drawing out potential non-critical with respect to general tuning of the ion beam. However, it does influence resolution. For a 5500 V. accelerating potential, the drawing-out potential is set at about 430 volts with respect to the shield potential.
(11) Focussing and (lli) beam centering potentials:
These are extremely critical and require 10-turn Helipots on the fine adjustraents.
(iv) Repeller potential:
Potentials of +2.2 to +2.9 volts are preferred for optimum resolving power.
IV. RESULTS:
(a) Resolution:
The net result of attention to these details Is shown in slide 12.
n-NONANE PLUS 2-OCTANONE
M43 M7I M126
Sl ide 12
276

We show the separation of the mass 43, 71 and 128 (parent) peaks for the pair n-nonane and 2-octanone. A resolving power of 2750 can be claimed.
Slide 13 shows similar pairs of parent peaks for the pairs
n-nonane and 2-octanone n-decane and 2-nonanone n-dodecane and 2-undecanone
PAIRS OF PARENT IONS
SENSITIVITY 2470
" " L D E C A N E . I2-MWANONE
1 . MW2 W
-000025"
Sl ide 13
(b) Sensitivity:
This Is indicated on the previous slide. With a 0.00025 in. collector slit, the sensitivity at mass 170 is 2000 divisions per milllgrara.
(c) Absolute Hass Measurements:
Finally does the machine give the right answers? accurate as can be obtained with a double-focussing machine?
Are they as
To attempt to answer this we have examined the nonane/octanone pair in the CEC-21-110 double-focussing mass spectrograph and in the mass spectrometer which we are describing. Ten sets of measurements were made in each instrument. The absolute values are quite close together as shown in the last slide:
ABSOLUTE MASS MEASUREMENTS
M43 A
M71 A
M128 A
CORRECT NUMBER
4 3 . 0 3 2 1
71 .0723
128 .1610
D.F. MASS SPECTROGRAPH
4 3 . 0 3 1 8 - 0 . 0 0 0 5
7 1 . 0 7 3 9 +0 .0016
128 .1599 - 0 . 0 0 1 1
S.F. MASS SPECTROMETER
4 3 . 0 3 4 0 •tO.0019
7 1 . 0 7 2 9 « l . 0 0 0 6
1 2 8 . 1 5 9 8 - 0 . 0 0 1 2
LS-62-11461
Slide 14
277

The 95% confidence limits for the data from the single-focussing mass spectrometer are as follows: -
M 43
0.0031
95% Confidence Limits
M 71
0.0018
H 128
0.0035
With the single-focussing machine we appear to have a slight systematic error at mass 43. It has not yet been investigated fully. But we can say that it is due neither to errors (a) in peak measuring, nor (b) in chart drive rate, nor (c) in ability of the recorder to keep up with the scanning rate. Probably the error Is associated with the analyzer magnet power supply.
We acknowledge the help of E. S. graphic results.
McBride, who provided the spectro-
Reference (1);
R. Thorburn and E. J. Robbins, "Increasing the Resolving Power of a Metropolitan - Vickers M.S.2 Mass Spectrometer with Particular Reference to Analysis of Uranium Hexafluoride." (United Kingdom Atomic Energy Authority, report DEG-94 (CA)).
278

CORRECTION COILS FOR SECOND ORDER FOCUSING WITH
THE ARGONNE 100 INCH RADIUS MASS SPECTROMETER
* C. M. Stevens
Argonne National Laboratory Argonne, Illinois
ABSTRACT
The second order coefficients, B,,, B,,, and B_, in the expression
^B - \ <hl "^ + ^ 2 ""^ + ^22 P > '
have been made very SXQBLI fox the Argonne 100 inch radius double focussing
instrumenC by Che use of Chree circular coils placed in Che magnet gap aC
the entrance, middle, and exit regions. The set of currents I., I-, and I.
required in each coil to give complete second order focussing was determined
assuming a set of linear first order equations,
K I = B
Comparison has been made between the measured value of the second order
coefficients before correction and the calculations of Hintenberger and
Konig.
* This work vas supported by the United States Atomic Energy Commission.
279

MECHANICAL MODIFICATION OF TWO-STAGE, 12-INCH RADIUS MASS SPECTROMETER AT
VALLECITOS ATOMIC LABORATORY
by
W. E. Duffy
I. INTRODUCTION
The instrument discussed in this report evolved from one developed at KnoHs Atomic Power Laboratory of General Electric Company. It was described first by White and Collins in 1954 in Applied Spectroscopy, Volume 8, page 169. The instrumenC originally contained an all-glass vacuum system. Vacuum was maintained by three large glass liquid nitrogen cold traps, three mercury diffusion pumps and one 140 1/min. mechanical pump. Pressure was measured by one thermocouple gage and three ionizaCion gages. In Chis laboratory a second, 70 l/m mechanical pump and a thermocouple gage were added but otherwise Che system remained unchanged. A flow diagram of the system as it existed at our laboratory is shown in the first slide.
Introduction of a solid sample required isolation of the source region by closing valves 3, 4, and 5, venting the source cap to atmosphere, melting the black sealing wax with a torch and temoving the cap. The old sample was then removed and replaced with a new one. The source cap was resealed on the system, pumped out with the mechanical pump and then opened to the mercury diffusion pump which pumped upon the source region. This operation usually required ten to fifteen minutes. . Subsequent pumpdown necessary to attain an operating pressure of 2 or 3 x 10"' Torr required 3 to 4 hours. Since a complete isotopic analysis required an hour or more the instrument was limited to two analyses per day, even with overnight pumping on the first sample.
II. PLANNED CHANGES
An increase in Che analytical requirements of the laboratory necessitated a modification of the mass spectrometer to permit more capacity. The most obvious improvement was some means to reduce pump-down time between analyses. The rapid sample-changers known personally to the author and reported in the literature did not possess all of the characteristics desired. It was resolved, therefore, to design a changer based upon that built by C. M. Stevens of Argonne National Laboratory but differing enough in detail Co fit che particular requirements of this instrument. Since adding a sample changer would mean redesign of the source end of the vacuum system it was decided ChaC a compleCely new vacuum sysCem would be designed. The idea grew unCil Che sysCem became all metal. The cold Craps and diffusion pumps were eliminated and replaced by ion getter pumps. The glass analyzer tubes were replaced by copper wave guide tubing bent to the proper dimensions.
The changes thus contemplated were intended to remove danger of glass breakage, to increase pumping speed and to eliminate cold traps and the attendant dependence upon liquid nitrogen. Also, use of ion getter pumps would provide a clean system free from potential contamination by mercury or oil diffusion pumps.
280

M e c h a n i c a l Pump
1 1
Figure 1. ORIGINAL ALL-GLASS SYSTEM
O-Ring Seal
Source Region
MOL 75L
Mechan ica l Pump Vac ion Pump
1 I
n Vacion Pump
I I
y<rz
1 Vac ion Pump
Mechan ica l Pump I I
Figure 2. PRESENT ALL-METAL SYSTEM
281

H I . MODIFICATION DESCRIPTION
Using the basic vacuum lock developed by C. M. Stevens of ANL and the high voltage ion source described by L. A. Dietz of KAPL , , as starting poinCs the sysCem shown in Che second siide was designed. '
The vacuum lock conCains essenCially two scages of differencial pumping. The first sCage is mechanical and operates continuously. Ic roughs ouC the source assembly after the O-ring seal has been tightened about the sliding piston. After pumping on this stage for a short period the O-ring seal is loosened sufficiently Co permiC movemenC of che pisCon and the source assembly is moved Co the second stage. The O-ring is then retightened. Valve No. 2, located between this second stage and the source region is kepC closed during Chis operaclon. This valve is then opened slightly to permit a small amount of Che included air to leak into the large Vac Ion pump. It is now closed until the Vac Ion pump recovers. This is repeated several times until the valve can be opened wide with very little change in the Vac lon pump current reading. The O-ring is now loosened slightly and the source assembly is moved into the source region. The O-ring is again tightened. The valve is closed and the Vac Ion pump now pumps directly upon the source assembly. Valve No. 1 is kept closed except during initial evacuation of the system.
Extraction of the source assembly is accomplished by loosening the O-ring seal and lifting the piston until the source assembly just clears the O-ring tightening nut. The counter weight stops at this point and holds the piston in this position. The O-ring is tightened and che old sample hat and filament is replaced by a new one. The sample introduction procedure is then repeated.
The sliding piston and cylinder of Che vacuum lock are made of 304 SS. BoCh surfaces are hard chrome placed and machined Co a clearance of ± 0.0002". The diameCer of Che pisCon is 2 inches. The close Colerances mainCained minimize in-leakage of air. This is decreased further by the Viton O-ring preceding the first stage of pumping.
The path of the ions in this instrument lies in a horizontal plane. The vacuum lock was designed to operate in a vertical plane along the axis of the source slit assembly. This arrangement permits the movable piston to be of minimum diameter and allows rotational and translational adjustment of the ion source.
The short piston is connected to the long piston directly through the source assembly and acts as a plug when the source is extracted. Furthermore the short piston separates the first stage of pumping from the second when the source is extracted. The source assembly itself is isolated from ground by specially built ceramic spacers. Each piston section is supported at three points. To permit proper alignment of the two sections during the insertion or extraction operations the short piston is supported by screws which hang loosely from the ceramic spacer. This allows a self-centering action during axial movement.
The electrical leads are introduced through a special ceramic seal with a stainless steel sleeve which is heliarc welded inside
282

Fig. 3 - Mass Spectrometer and Control
Fig. 4 a - Front View of Vacuum and Magnet Sections
283

the long piston. The short piston is grounded during source operation to prevent the buildup of a static charge. The two ion beam collimatlng slits are of fixed dimension and both are at ground potential. This differs from the design of Dietz which specifies a potential upon the first collimatlng slit. The z-focus plates are located between che Cwo collimatlng slits and are insulated from them. A battery voltage up to ± 300 volts may be applied to these plates.
The ion source was designed to operate at 15,000 volts. Tests with a megohmmeter show that the source will operate as designed. So far our power supply has limited us to 5000 volts.
A 75 liter per second Vac Ion pump operates continuously upon the source region. This is isolated from the analyzer by che 8-mil beam collimatlng slit. The first and second stage analyzer tubes are pumped on by an 8 liter per second Vac Ion pump which is located directly beneath the center slit. The detector region is pumped on by a second 8 liter per second Vac lon pump and is isolated from the analyzer region by the deCecCor sliC. The deCector, an eleccron mulcipller, may be sealed off from Che remainder of the sysCem by a one-inch gace valve which normally remains open. The Cwo eighc liter/sec. pumps share a common power supply. The 75 liCer per second pump has an independenC power supply.
The Cwo analyzer Cubes were bene Co specificacions from oxygen free, high conducCiviCy copper wave guide.
The center slit and detecCor slit were each made continuously adjusCable by using bellows seals and Cwo flat bladed micrometer depth gages to move the slits.
All vacuum seals were made with commercial shear seal flanges and copper gaskets or with Viton 0-rings where use of copper gaskets was impractical.
Two sapphire windows were located to observe the source region and permit pyrometer measurement of the sample filament temperature. A small cold-finger liquid nitrogen trap was flanged into the source region Co reduce sample background and help reduce pressure. Use of Chis cold Crap was inCended only when very high abundance sensitiviCy was desired. However, ic has been found ChaC regular use of the cold trap reduces sample introduction time by about one-half. The trap is kept filled throughout the day and allowed to warm up overnight.
Although the system was constructed entirely of metal, extensive high temperature bakeout was impractical due to the fixed and inflexible connections between the various components. This did not hinder the highly satisfactory performance of the vacuum system, however.
IV. PERFORMANCE
Operating pressure in Che source region was generally 1 to 3 X 10" Torr. Following an overnighc pump-down Che pressure was ofcen 2 Co 3 X 10"° Torr. The pressures in che analyzer and deCecCor regions were nearly equal and remained aC abouC 2 x 10~ Torr, even during sample change. There were no deCecCable leaks in Chese parCs of the sysCem.
284

Fig. 4 b - Front View of Vacuum and Magnet Sections
Fig. 5 a - Middle Slit and Detector Assemblies
285

During rouCine insCrument operation, using the cold finger, sample introduction procedure consisted of three minutes of pumping in Che firsC sCage, Cwo minuCes pumping in the second sCage and ten minutes pumping in Che source region before a saCisfacCory vacuum was obCained and sample analysis commenced. Occasionally addicional Cime was required, buC seldom was more Chan 20 minuCes of pumping necessary,
Approxima cely one hour is required for a compleCe isoCopic analysis. The resulc is thac the instrument easily may run from four to six samples per eight hour day.
Shut down of the instrument for any reason consists simply of switching off the pumps and venting the instrument. In order to protect the electron multiplier during a shutdown the one-inch gate valve in the rear is closed and the rear Vac Ion pump is left on.
Operation of the rapid sample-changer is quite simple. Trouble from galling of the sliding surfaces is eliminated by reasonable attention to cleanliness.
The use of copper sealing gaskets and Viton 0-rings has proven very satisfactory. The initial assembly of the system resulted in a practically leak-free unit.
V. COMPARISON OF OLD AND NEW INSTRUMENTS
Prior to modifica tion the instrument was limited to one to two analyses per eight hour day. Since modification the instrument easily may analyze four to six samples in the same period. Elimination of the large cold traps has reduced intrumental requirements for liquid nitrogen from 250 liters to 5 liters per week. Sample size, abundance sensitivity, adjacent mass resolution and counting rates remain essentially che same as before. Use.of the z-focus and the mechanical translaclonal and rotational adjustments permits very accurate positioning of the source filament and minimizes physical misalignment. The physical appearance of the instrument is improved and housekeeping simplified.
VI. FIGURES
The attached figures show different views of the instrument.
References:
1. Stevens, C, M. , Rev. Sci. Instr. 24 148 (1953).
2. Dietz, L. A., eC al. Anal. Chem. 32 1276 (1960).
286

Fig. 5 b - Middle Slit and Detector Assemblies
i
•
i
.
1 !
- _ _ „
Fig. 6 - Source Piston Fully Withdrawn
287

Fig. 7 a - Close-up View of Source Assembly
Fig. 7 b - Close-up View ol Source Assembly
288

C. Brunnee, L, Jenckel, K. Kronenberger ATLAS MESS- UND .JVNALYSENTHiCIIMK GmbH, Bremen, Germany
June 1962
1, Identi 1'ication of fractions which have been separated in a jjas chromatographic capillary column a) Instrument
In order to apply the Mass spectrometer CII h for this problem, a special inlet device had to be developed. This device can be seen in Fig. 1 as part of the total arrangement. At the end of the capillary column, the gas stream is split. The one partof the •'- . . gas stream ia directed to the detector of the gas chromatograph, the otlier part is directed to the inlet connection of the raass spectrometer. This inlet connection consists of a throttle capillary. The gas stream leaving the column flows freely around the throttle capillary without being in direct contact with the wall of the capillary column. In this way the liquid phase is prevented from reaching the inlot line to the ion source. The entire inlet arrangement can be heated up to 350°C. In addition to this special inlet arrangement, the CH h was also equipped with a special ion detection assembly, consisting of a multiplier and a cathode ray oscilloscope or a multiple galvanometer recorder respectively. The performance data which can be attained with such an instrument are listed in Fig. 2 as far as they are of interest for the problemdiscussed here,
h) Measuring accuracy under different conditions The accuracy of the recording of an ion current J belonging to a definite charac-teristic raass is mainly dependent .fn the mean statistical fluctuations F which decrease with increasing values of the ion current J and of the time constant T sf tlie recording system, proportional to
1
. >r,clr..t>tr C H t
of tlie recording s l//jT ; F = K/rJT. The value of JT depends on the necessary resolution and on the necessary scanning speed. To increase the resolving power requires narrowing the slit.widths, which results in a decrease of the ion current Jmax* ^" ^^~ crease of the resolving power with the acanning speed V remaining constant requires a reduction of the time constant T of the recording system, A reduction of the time constant T is also unavoidable when the scanning speed V is increased. In summary, it results: F~?const. K A ^ T T T where A is the reaolving power and V is the nuraber of recorded mass oktaves p,sec. It depends on the specific problem which res speed at a given maximum ion current lias to of a mass spectrometric analysis. Araong many and the time period of the appearance of the column nust be considered. In any case, reso should be chosen not higher than absolutely To retain high readout accuracy we ahall red required for the exact recording of the mass do not record the absolute ion currents but currents to the prevailing partial pressure order to eliminate the influence of the temp pressure on the distribution of the peak hei
Fig. 2
olving power and which scanning be chosen for the performance factors the substance quantity fractions at the outlet of the
Iving power and scanning_,speed necessary, uce the rainimum scanning speed apectrum in that way that we
the proportion of the ion of the fraction measured, in orary alteration of the partial lit3 in the mass spectrum
289

for a larger part of the scanninpc time of the fraction, c) Practical examples of measurements
With a c.ithode ray oscilloscope (Tektronics 5'i5) 10 scans of the mass range ME = X to ME = 2,5 • X per second could be recorded. The time constant in this case was T = 2.10"^ sec. With this measuring arrangement, continuous raass spectrometric analyses at the output of a gas chromatographic canillary column have been demonstrated consecutively on the ACHEMA 15 Exhibition in Frankfurt/M, Germany, in Summer igfjl. In the meantime, the c.-ithode ray oscilloscope has been replaced by a raultiple trace ultraviolet beam galvanometer recorder (ADEM) . This tyne r e c o r t i e r offers the advantage that the mass spectra can be taken and recorded in 7 different sensitivity ranges simultaneously. Measurement results are stiown in figures 3 to 6. Fig. 5 shows the gas chromatogram of a sample obtained with a capillary column. This sample consisted of the following components:
PCAK N a
39
UZ.
.A3.
C O M P O N E N T CONCENTRATION L%1
2 . 2 - D / f n e i t j j l ^ j & y c i n o O-SD
2 . 6 - V / ' m e f / ^ y i / j e x o n e 1-03
2 , 1 ^ - U i m ^ f h j i h e x Q n e 2 -00
2 ,2 , ' i i - T r i m e l l l y l p e n t a n e
3 . 3 - V i m e l h i f t h e x a n e 0 -75
P £ A y tJO.
U l , .
U S
U.6
. 4 7
U 8
COMPONENT CONCENTRATION
I'/yi PEAK-
NO.
T o l u e n e ^ 8 2 0
£ , 3 - D i m e t h y l l ? Q y a n & 1 0 0
a - M e t H y l I j e p t o n e J - y ^
U - M e i n y l f / e p t a n e 1 8 0
3 - r t ^ l u y l I j e p t o n e 6 03
U9 SO
5 1
sz S 3
C O M P O N E N T CONCENTVA TION
n - O c t a n e
E t h y l t i e - n z e n e
p - X s j l e n e
r r t - X y l e n e
o - x . i l e n e
2 b Z
• I
T^
1 !
PART OF THE SAS m o m 0 6 R A M OF A SOLUTION OF MORE THAN SO COmmTS\
3} m i te « yv +5 •' -M
Fig- 3
290

Of the gas stream leaving the capillary column, mass spectrograms have been recorded continuously with a scanning time of \ / \ second for the mass range ME = X to ME = 2^5 X. (ME = 40 - 120) Fig. 4 shows a cut-out of the mass spectrura of the component No. 39 marked in the gas chromatogram. This cut-out shows that even this component, which is present in the sample to 0,5 ^ only, can be well analyzed by mass spectrometry. Evaluable mass spectra are still obtained with a concentration of 0,1 ,"4 of the component concerned. If only the main peak in the mass spectrum of the component is recorded, considerably smaller concentrations are still detectable.
; ^s;
S6 .
i SI
55
.Qyyw
0,22$ec
2.2 - DimethylhexarK
[ B 1 backgroimdj
SS
A A A - A M / J \ | /«W^UAVWV
F i g , k Spec t rum 2 ,2 -Dime t h y l h e x a n e (I 'eak N o . 3 9 of g a s ch romatogramm, , , • F i g . 3)
"OJZlK
p - Xylerte
yA.^ l fVU.A.^
F i g . 5a
Spectrum p-Xylene No.4 of table Fig.6
291

Fig. 5b
Spectrum m-Xylene No.3 of table Fig.6
Fig. 5 shows the mass spectra taken of p-Xylene and m-Xylene which were not separated in tbe gas chromatogram of Fig. 3. The evaluation of these spectra for the ratio ^52/^50 is listed in the table of Fig. 6 for 5 different recordings.
Each of the five spectra recorded in 0,22 sec.
Medium value
API
p-Xylene
Ratio B|
2 2 ^ 28,5' 1,03
22.-L1 02 29,8 ' 30,3" 1,04 2L4S.
31,5' 1,01 31.8
30,1" 1,03 1,03 1,40 1,02
1,05
m-Xylene Ratio of peaks 52
5O-
59,0" 1,24-70.0 58,3"
1,19 69.0 55,7
1,24 69.0 58,3
•=148 66.2 53,0" 1,25
1,22 I4f=i, 6,24 30
Fig. 6
Meaaurements with an RPD Ion Source according to Fox and Schiff For exact AP-measurements an ion source.for the Mass Spectrometer CH k has been developed and tested with which retarding potential difference measurements can be performed. With an emission current of 250/uA, an electron, current of 6/uA was measured at the collector. This current was independent from the electron energy down to about 3 volts, A multiplier was uaed for the measurement of the ions.
292

A 2 ; j -
Ut
m T. -
OMfSR
VuTmuu
' I J ll
FOI
eiccmoM
1 1
—1
Bf4W ) 1 1
r.
QJJOf/SfC
8 f « *
11
•
rrPc cw SMJ>?C£
^ :
KfliTC
m l
'•'is- 7
Fig. 7 is a schematic outline of the construction of this ion source. Since the impulse periods for electron current and ion current can be chosen independently from each other, it is also possible to measure the lifetime of shortliving ions with the source. The performed measurements had the following result:
a) With the original arrangement published by Fox, Hickam, Kjeldaas and Growe, Uev. Sci,Instr, 26, 1101 (1955) the adjustment of the electron optic proved to be rather critical and not always reproducible. With a
somewhat altered arrangement, published on the Joint Conference on Mass Spectrometry in London by Cloutier and Schiff, however, well reproducible ionization efficiency curves could be recorded with a simple ion source alignment. The less favourable result achieved with the arrangement according to Fox can probably be explained by the fact that the critical field of the retarding plate is very easily disturbed by surface charges whereas the space-charge threshold of the arrangement according to Schiff is not subject to such interference,
b) As has already been observed repeatedly by others the ionization efficiency curve-s for argon and other rare gases showed breaks. With CO, however, perfectly straight ionization efficiency curves could be taken with our ion source. These curves were very well reproducible. Several times repeated appearance potential measurements on CO coincided within a tolerance of 0,02 volts (Fig. 8),
3, Structure analyses on various alkalpides Mr. G,Spiteller (Org. Chemical Institute, University of Vienna, Austria) carried out a number of structural investigations on a series of low volatile alkaloides using a CH k Mass Spectrometer. Aa a result of theae analyses Fig, 9 shows the mass spectrum and the formula derived therefrom for "Kopsin", an Indian vegetable poison, A detailed description of the measurements and of deliberations with respect to the correct coordinating of the measured ion currents will be published elsewhere. The samples were vaporized from a small graphite furnace which can be heated under controlled conditions. The graphite furnace is introduced into the ion source by means of the vacuum look of the CH 4,
V' \ '
tso
(DIV.)
100
50
A l L t l mfKKI
I2S IJP IZi
APPEARANCE
CO* « W
/ ^
no 125
POTBNttAL
CUffPENT
/ /
/
1 /
UD l i i M < •
MEASUPEMENT
V )
M t l
Fig . 8
C ^ "
'X0 Jta M a t MO MO mo m
Massfnspektnjm des Kopsim
Fifi. 9
293

In Fig, 10 this vacuum 1 shown in a demounted arr A replaceable ionization containing the furnace w and the ionization chamb introduced into the ion without venting the anal cause the saraple enters chamber directly in vapo extremely low vapor pres for taking a spectrum ed by most organic compo decomposition. The lowes whi ch the temperature of source and like wise the of the vaporization furn aet is 150**C. For measurements of this desirable to have a high exact raasses of unknown with an accuracy of 0,1 highest resolution whic These completely separat mass number 128, which h This high resolution was (Netherlands) by uaing s
ock i s angement. unit
ith sample er can be source yzer. Bethe ionization r phase, an sure suffices ich is reach-
unds "without t value to the ion temperature
nee can be Fig. 10
kind it is resolving power and to be able to deterraine the
ion currents. The latter is possible in the CH 4 for differences in mass between two peaka. The
h can be achieved is demonstrated in Fig. 11. ed peaks represent the ions CgH20 ^"d Cjo tt on ave a relative difference in mass of I/1365. achieved in the Shell Uesearch Institute in Delfl lits of 0,01/0,03 nun.
(, M^^^m
^ t o ^ f t ^ I C^Hio •
d.i\'()fifi
Fig. 11: Maximum Resolution CH 4. Slit Widths 0,0l/0,03
294

APPLICATION OE POLYPHENY! 3THSRS AS CONDENSATION PUMP FLUIDS
IN MASS SPJ;CTROH'J;TRY
By
F. C. Maseles
Mass Snectrometry Laborarory
University of Texas
Austin 12, Texas
The exhaust high vacuum system of a large mass spectrometer juch as the Consolidated 21-100 series should remain in operation at all times as downtime is usually more costly than pump ooeration. Until the develonment of the Penning sorotion tTOe high vacuum numos, most mass spectrometers have used mercury condensation pumps and cascaded dry ice and liquid nitrogen trans with all their attendant evils. Mercury pump fluid possesses some inherent advantapres that organic oump fluids quite likely will never suraass. However, mercury's shortcomings in this situation outweigh its advantages.
Mercury pumps have been favored for mass spectrometer service, not because oil pumns are incapable of attaining the required low oressure with less elaborate cold trapping, but as long as one must rely on cold trans, cold tran failure on a mercury system is less disastrous than cold trao failure on an oil system. Unlike oils, mercurj' is not decoranosed thermally or chemically with the releast of large volumes of volatile decomnositions products diffuse into the analyzer and contribute to the background and to the formation of insulating layers in the analyzer that become statically charged and adversely affect the resolution of the instrument. Mercury oumps are chean; one charge of fluid lasts a lifetime: they are designed to work into a high forenressure lessening the requirement for very high quality forepumps; and, where treated with due respect, constitute little hazard to personnel. Were it not for the requirement of liquid trans to obtain pressures below 10~^torr, one would not be .justified in considering the elimination of the mercury pump.
However, a liquid nitrogen tran is required on a mercury system and its apparent pumnlng speed for C hydrocarbons and some even more readily condensed materials is limited. Maintenance and annoying task and, in snite of the best logistics, the nitrogen supply is too frequentlv Interrupted necessitating shutdown and loss of time.
Introduction of the ool^/pehnyl ethers as condensation numo fluids nromlses a revolution in vacuum techniques and elimination of liquid nitrogen trans excent in the most sonhisticated systems.
Qualification as an acceptable numo fluid for mass spectrometer service imnoses some very severe requirements on an organic corapound. I will dwell briefly on two of these requirements and, for those interested in pursuing the subject further, I recommend Mr. Kenneth Hickman's paner "High Vacuum with the Polyphenyl others", to be published shortly in the Trans^actions £f the American Vacuum Society.
An organic pump fluid should have a vapor oressure below 10""torr at room temperature and be sufficiently stable that in service its rate of decomnosition does not exceed the capacity of the oump to eliminate the volatile decomnosition products before they diffuse into the analyzer.
295

a: oc o '
cc Z) csi cn LJ cc a.
TEMPERATURE "C BISIM-PHENOXY-PHENYLI ETHER 2 - E T H Y L HEXYL SEBACATE (PERRY 8 W E B B E R ) - (OCTOI l BL-IO MIXED FIVE RING E T H E R S M - B I S I M - P H E N O X Y - P H E N O X Y ) B E N Z E N E B I S - M I M - P H E N O X Y - P H E N O X Y ) - P H E N Y L E T H E R ( OS
FROM. HIGH V A C U U M WITH THE P O L Y P H E N Y L E T H E R S
BY K.G. H I C K M A N
Fig . l
296

Slide . 1: Temperature- vapor nressure nlot.
This slide, a temperature-vanor nressure nlot for several of the nolynhenyl ethers and Octoil-S illustrates how the pol. rohenyl ethers meet the vanor nressure requirement. Because of the extremely large extraoolation used here, ten orders of magnitude in the case of Compound 3, there is considerable uncertainty ag to the true vapor pressures of these compounds at 25°C; however, if we assume three orders of magniture as reasonable limits to the uncertainty of this data and combine this with the information that Monsanto Chemical Comnany, Texas City, operates a mass spectrometer with an oil,diffusion pump and double Conner chevron baffles cooled to -liO C with Compound B-*-', it is not unreasonable to expect Com-nound 3 to perform satisfactorily from a vapor nressure standpoint at room tem-oerature.
The second of these criteria is more imnortant and more difficult to determine and, as a first approximation, we distributed information on the nol. Tjhenyl ethers around the camnus and several of our more venturesome colleagues tested Monsanto OS-I3B in their vacuum systems. All tests were made in glass systems, Baird Alnhert structure ion guages were used to measure pressures. OS 138 oerformed better than the oreviously used oils and one man who operates a very clean system for helium purification renorted untranned ultimate nressures in the 10~° range. Addition of liquid nitrogen to the traps did not lower this nressure. An unexpected and still not fully exolained bonus was an armarent Increase in pumning sneed as ultimate nressures were attained much more rapidly with OS 138. With this Information, we decided to install an untrapped glass numn on our 21-102 and give it a try.
Slide #2: Shot of purap.
This slide shows the present installation and includes a tan-water cooled "D" trao. The first installation was identical excent that the trap was not in the line and a VGIA was used in place of the Veeco guage tube shown here. I will exnlain why the trap was installed when the next slide is shown. The pump shown here is a two-stage glass fractionating similar to Consolidated's GF20 and was used because it was available. It is backed by a Welch Duo-seal lliOO series. This diffusion numo will eventually be replaced by a three-stage pump of the same tyne and a magnetically-actuated glass ball isolation valve will be provided to facilitate bakeout of the suction line and trap and to provide overpressure nrotection for the analyzer. You will notice that the boilers of the nump have been heavily insulated. We have used a coat of high temnerature aluminum paint on the glass covered by one inch of asbestos fiber. The operating temperature of OS 138 Is about 2B5°C deoendlng on the forenressure, and adequate insulation is essential in present pumos to attain this temperature without excessive power input to the boilers and to minimize fluctuations with room temperature and drafts. Variac control of the individual boilers is desirable permitting fine adjustment of the power input and operation of the nump in its most efficient range. Oil diffusion pumns are frequently condemned when the real fault is excessive boiler temperature causing decomposition of the oil. The temperature we use is slightly below that temnerature at which numning sneed ceases to rise with an increase in boiler temnerature and Is judged with sufficient accuracy by observing the change in exhaust nressure with boiler temperature while nitrogen is admitted through the sample inlet system. The entire pump is onerated at as high a temperature as is possible to facilitate ranld nurging of materials of low volatility. The exhaust pressure attained by the untrapned system was below the canacillty of the original VGIA vacuum guage. The background is shovm on the next slide.
Slide ^ 3 ' Spectrum records.
The record marked number one is a tynical background of the original installation and except for the neaks shown the record is clean to mass 6OO.
1) An Oil Diffusion Pump System for Mass Snectrometers, G. L. Roberts, K. Allan Pinkerton, and R. F. Wall, Monsanto Chemical Company, Texas City, Texas.
297

- y m y ^ ' i t ^ •ys~^i''-'Miy,-_:stzi^.isy/t'y!IA i. ^ ^ ^ g g
CoA/rAAfiJMnr'oy % ^
tp__ Zj .Z8 JZ 3fe, .ff2y " ., 4 .•?f'<' *f 6g r,: n ao 81 Se . ^^
"QG2J/*/u /ll* 'rexMusry^E" "P^ ±y j t / o : ^ J i n - y
HE
r J d i *
Fiuure 3
298

The second record Is the_ type pattern nroduced by oil backstreaming into the analyzer. The higher mass record shows a few neaks in the 200 and 350 range. The base neak would be 28 as Indicated here. VJe have made no attemnt to obtain a mass snectrum of this oil as we are not equipned to nroperly bake out the inlet system. This record was obtained quite by accident and is the result of leaving the magnet on maximum current over the weekend. Monday morning one oould toast bread on the magnet and the numo suction line was hot to the touch. "VJe shut down, cleaned un. Installed the tran, the Baird Alnhert t'/pe guage, and modified the exhaust vacuum guage to accomodate the new tube and to e-'tend its range one decade lower to 10" . A f.-Dlcal baci--Hround for the present system and the usual exhaust nressure is shown on the third rscord. We have cooled this tran by filling it with liquid nitrogen and the magnitude of the neaks does, not decrease. Filament emission of the new guage is very sensitive to contamination bv a sample so we have no information on the exhaust nressure during a samnle run or for half an hour after as it usually takes that long for the guage to recover: however, all traces of the samnle disappear from the record as raoidly as the inlet exhaust system can disnose of the sample. VJhereas formerly, with a liquid nitorgen tran, it took from three to five minutes and sometimes longer for all traces of substances such as acet^/lene and benzene to disappear, pumn out time now seldom exceeds one minute.
Needless to say, our liquid nitrogen purchases have dropned to almost zero with a resulting annual saving of annroximately $1500; however, the most gratifying result has been the ability to leave the laboratory overnight or over the weekend without so much as a glance at the filament of the discharge vacuum guage and speculating about whether one will find it still burning on return.
With our nresent knowledge and glassblower's time accounted at -iJT.OO/hr., we can duplicate this entire system for less than $175.00.
Our use of the 21-620 mass snectrometer is experimental and necessitates frequent onening of the vacuum system to make changes in the analyzer or inlet system. 3ven when let un with helium, it usually requires 2U hours or more to comnlete the cycle. In an attemot to shorten this time by elimination of the charcoal tran, we removed the original numn and tran and first reolaced it with a water-cooled "D" baffle and an externally heated glass body nump using the jet assembly from the original metal diffusion numn. This svstem was assembled using Buna S "0" rings coated with OS 138. The pumn reduced the nressure to zero on the discharge Penning guage in two hours, but there remained large peaks at masses 2, 18, 28, and hli. Four davs of numning eliminated the liU neak but the 28, 18, and 2 neaks were still .'lO, 80, and 20 divisions respectively. The sensitivity of the Instrument at this time was 100 divisions/micron for mass IJ3 of N-butane. Our first soeculatlon concerning this behavior was that the metal jet assembly was causing catalytic decomnosition of our oil, and we have not yet ruled out this possibility. The pump was renlaced with a pump similar to the one used on the 21-102. One "0" ring was eliminated in the change. Pump down was again quite rapid and the magnitude of the background peaks were reduced considerably but not to zero. At this time a vessel containing a Buna S "0" ring was opened to the gold leak and the background peaks rose Into the thousands range indicating that our background was originating in the "0" rings in snite of their coating of OS 138. The systera was again reworked and all but one of the "0" rings were eliminated with a consequent reduction in the background. To eliminate the last ring required machine work not convenient at the time. Vigorous baking of the last reraaining "0" ring has reduced the background to less than ten divisions. Soraetlme in the near future, we will eliminate it also and re-install the glass-metal nump and evaluate pumps that have metal in contact with the oil.
The raethod we have used for conversion of the 21-620 to this tyne exhaust system is raore difficult and costly than converting the 21-102 as machine work is required and soace is limited. The benefits accruing to the usual user are few and, in our oninion, not worth the effort required. In our case, the reduced turnaround time is worth the effort and we will continue to use the system for that reason; and, a s we intend to continue our exDeriments with the polyphenyl ethers, it is a convenient system for that numose.
Presented at Tenth Annual Meeting of ASTM Committee E-lU on Mass Spectrometry, June 3-June 8, 1962, New Orleans, La.
299

3imultanoouB Heamirement of Two Ion Ourrenbs by Fulee Oountlng tn a HaBB Speotrometer
Leonard A. Dietz Qenereil Electrlo Oompany
Knolle Atomic Power Laboratory* Soheneotady, New York
Abstract
Simultaneous measurement by pulse counting two lon beams with a mass separation ef A H/M as small as 1 / 2 ^ has been accomplished In a ?0- in radius double-foouslng mass speotrometer of t he Dempster t ype . Positively-charged Ions are produced by thermal Ionization on a hot filament and are detected by two heavily shielded e leo t ros ta t io eleotron m u l t i p l i e r s . The disadvantage of mul t ip l ie r s ize Is overcome by using e l ec t ros t a t io def lect ing p la tes t o Increase the dispersion between two resolved beams by deflect ing each beam In opposite d i rec t ions from the focal plane of the magnet Into I t s mul t ip l ie r de tec to r .
Introduotlon
In ce r t a in experiments with low Intens i ty beams ef charged p a r t i c l e s , i t Is des i rable t o detect two or mors beams sloultanaoualy In order t o Improve the precis ion of comparing small cu r r en t s . Simultaneous co l l ec t ion of two lon besms was f i r s t accomplished in a mass speotrraneter used for gas analysis by Nier, Ney, and Inghrem. This paper describes a dual pulse dountlng syston for detecting two ion beams whioh are resolved In a large mass speotrometer. The dual lon besms oan be used in special Invest igat ions or for precise Isotopic ana lys i s . Dual pulee counting has a basic advantage over conventional d i rec t current methods used in measuring the r a t i o of two small cur ren ts , s ince the instantaneous s t a t i s t i c a l f luctuat ions of both beams are summed over time, d l reo t ly in d i g i t a l form. This paper ia a r e port of the progress we have made In aohleving simultaneous pulse counting a t the Knolls Atomic Power Laboratory. A few de ta i l s of the technique s t i l l need to be worked out .
Apparatus
The mass speotrometer used in t h i s invest igat ion is a Dempster type with a 900, 50-In radius e lec t roe ta t lo analyzer followed by a 180°, JO-ln radius magnet. I t was constructed by P. A. White,^ who f i r s t used the magnet to analyze the energies of radioactively-eiai t ted alpha p a r t i c l e s .
An al l -metal vacuum system has been bu i l t t o Incorporate f ive 7^ l i t e r / sec Varian gertter-lon pumps, one on the source chamber, one a t each end of the e l e c t r o s t a t i c analyzer, and two on the magnet chember. A view of the completed mass spectrometer i s shown in Pig. 1 . All vacuum jo in t s are copper shear gaskets or are Viton 0-rings of 1/8-ln cross sect ional diameter. The source chamber i s machined firom a s ingle block of s t a in l e s s s t e e l and the e l ec t ro s t a t i o analyzer vacuum chsmber i s bent from a ^- In diam s ta in less s t e e l aesmless tube with an end flange welded on each end. Eaoh end of the e l e c t r o s t a t i c analyzer r e s t s on an accurately positioned ba l l bearing and the middle i s supported by a rod which can be raised or lowered by means of a bellows-sealed micrometer d r ive . This technique was developed by Nier? and has proved very useful in the a l lg tnent of our o p t i c s . The e l ec t ro s t a t i o
300
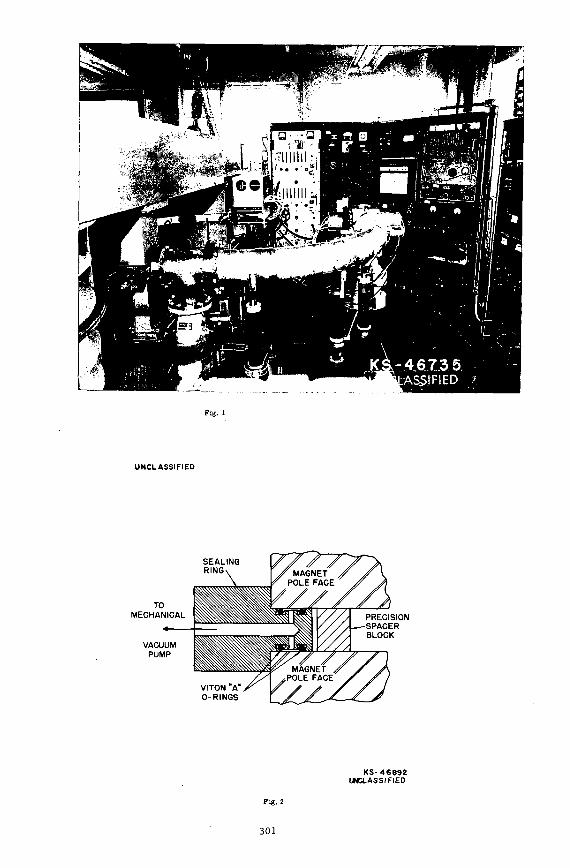
Fig. 1
UNCLASSIFIED
SEALING RIN6\
TO MECHANICAL
VACUUM PUMP
VITON "A" 0-RINGS
KS-46B9Z UNCLASSIFIED
Flg.2
301

analyzer pla tes are mounted between two f l a t e l e c t r i c a l l y grounded sectors by means of accurately ground pyreot spheres, after the method of Berry.^ The magnet pole faces sre sealed trim atmosphere by two se ts of Viton 0-r ings In a s t a in l e s s s tee l r ing which extends 1-in Inside the en t i r e pe r i phery of the pole faces . Two O-rlngs are positioned concentr ical ly in dovet a i l e d grooves cut in the top surface of the sealing r ing and are in contact with the top pole face and the sealing r i n g . Two more O-rlngs are positioned s imilar ly in the bottom surface of the seal ing r i n g . Eaoh of the four 0-r ings is about l 6 - t t in ciroumferenoe. Besm access holes on the median plane of the magnet aro cut through the r ing , between tho two pai rs of O-rlngs. The space between eaoh set of O-rlngs Is evacuated to a few microns pressure by a mechanical pump as shown in Fig. 2 . Pressures In the unbaked e l ec t ro s t a t i c and magnetio analyzer portions of the mass spectrometer are l ess than 1 X 10⁻⁸ and approximately A x 10-8 Torr, respectively. The higher pressure In the magnet chamber appears to be limited primarily by the vapor pressure of Viton. Different ia l pumping reduces the contr ibution of souroe chsmber pressure t o the analyzer pressure by a factor of 100. The souroe chsmber contains a small l iquid nitrogen o d d t r a p . I t i s the only cold t rap in the en t i r e high vacuum system.
A "ferrIs wheel" type of sample loader^ mounts 6 V-type fi laments" and permits 6 samples to be analyzed without breaking vacuum. The sample loader Is shown in Fig. ? . I t i s mounted on a KAPL-type lon gun with z focus. '
The dual pulse counting arrangement i s shown schematically in Fig. 4 . Each besm is deflected from a point s l i gh t ly beyond the focal plane of the magnet, into i t s electron mult ipl ier detector , by means of e l e c t r o s t a t i c def lect ing p l a t e s . The shape of the e l ec t r i c f ie ld between the deflect ing p la tes was optimized by f ie ld p lo t t ing and ray t r a c i n g . The beam deflectors are not shielded from the fringe f ie ld of the magnet. The output of each mul t ip l ie r i s fed Into a 10-Mc counting system. I . e . the resolving time of the system is 0.1 microsecond. Except for s t a r t ing and stopping gating pulses , the two counting systems operate independently of each o ther .
Other types of detectors were condldered. I . e . sol id s t a t e c rys t a l counters and semiconductor magnetio mul t lp l l e re , but a t the time the dual counting system was designed, data were lacking on t h e i r response to random counting r a t e s of several megacycles. Therefore, we decided to use a small lA-stage e l ec t ro s t a t i c electron mul t ip l ier and counting system which we are using in the detect ion of s ingle besms.7
Magnetic shielding by means of a hollow c i rcu lar Iron cylinder reduces the s t ray magnetio f ie ld in the region of the eleotron paths through a mul t i p l ie r by a factor of about 10^. The magnetio shielding of each deteotor extends approximately 2- in beyond ei ther end of the dynode s t r u c t u r e . We have found t h i s type of simple shield far more effective than many layers of high permeability f o i l or an iron shield of rectangular cross sec t ion . For an Isotopio analys is , the separation between the center l ines of eaoh pair of beam deflector p la tes i s adjusted by means of micrometer drives t o equal the dispersion between the two beams for Isotopes of masses Mi and Mo. Also, the def lect ion vol tages , i V^ and i V2, are adjusted independently to give maximum counting r a t e from each electron mul t ip l i e r . The def lect ion voltages are obtained from voltage dividers connected across the pos i t ive and negative voltages supplied to the e l ec t ros t a t i c analyzer.
Experimental Results
For precise r a t i o determinations, the r a t i o response must be independent of small f luctuat ions in magnetic f ie ld in tens i ty and accelerat ing vol tage, and in small errors in d ia l s e t t i n g s . By adjusting the width of the defining
302

fOQ fflUJ c o rn l*-
303

s l i t a t the entranoe to the 180° magnet, the besm width a t the magnet fooal plane oan be made much narrower than the smallest separation of the besm def lec tor pla tes (O.OAO-in), so tha t none of the besm Is intercepted by these p l a t e s . The r a t i o response as a function of changes in the accelerat ing voltage is shovn in Fig. ^ . That i s , both beams are t rans la ted simultaneously, stepwise across the besm deflector defining s l i t s . Voltages and focusing condi t ions for each mul t ip l ier were the same. Notice t h a t the value of the observed r a t i o drops in going from curve B to curve 0, even though the ion gun was not refooused. This r e su l t s from changing the il luminating current deit-s l t y d i s t r i bu t ion over the sens i t ive areas of each of the f i r s t dynodes. We find tha t the r a t i o response i s different for different filaments or for different focusing conditions with the same filament. For exsmple, we find no plateau when both beams are deflected along the z_ (ve r t i c a l ) axes of both f i r s t dynodes. Therefore, i t appears t h a t the dvtal pulse-counting technique presented here i s limited a t t h i s time to comparison measurements only, and ceurnot be used for absolute abundance measurements.
In applying dual pulse oountlng t o precise isotopio abundance measurements, we have found tha t a l t e rna te ly measuring a ssmple and a standard, both on different f i laments, does not give the desired precis ion. As waa jus t ment ioned, t h i s i s due to the non-uniform sens i t i v i ty of the eleotron mul t ip l ier over the length of a dynode. I t appears t h a t an lon whioh s t r i ke s the middle of the f i r s t dynode has a higher probabil i ty of producing a detectable pulse than one s t r ik ing a t ei ther end. For Instanoe, the d i s t r ibu t ion of Ions in the z, ( ve r t i c a l ) d i rec t ion is large enough so tha t ions can s t r i k e the f i r s t dynode of the ROA eleotron mul t ip l ier a t a point only 1/8-ln from ei ther end. We believe t h i s can be corrected by proper baffling and mul t ip l ier design. However, t h i s l imi ta t ion current ly r e s t r i c t s our appl icat ion of simultaneous pulse counting t o ce r t a in measuremente which oan be accanplished with a newly developed Internal standard technique." In addition to applying t h i s promising new technique to our two-stage instruments, we sre current ly engaged in extending i t to simultaneous co l lec t ion .
Aoknowledg^sent
I t i s a pleasure t o acknowledge the contributions of the following people; J . W. Owens, F. A. Ehmer, C. T. DeGroat, J . H. Thomas, and J . E. Demers during the design and fabr icat ion of par t s ; L. R. Hanrahan and G. A. Land during the assembly and t e s t of the mass speotrometerj and A. E. Cameron for supplying us parts for the sample loader .
REFQfENOES
• The Knolls Atomic Power Laboratory Is operated by the General Elect r ic Compaiy for the United States Atomlo Energy Commission.'
1 . A. 0. Nier, E, P. Ney, and M. G. Inghram, Rev. Sc i . I n s t r . 18, 294 (1947).
2 . F. A. White, F. M. Rourke, J . C. Sheffield, R, P. Schuman, and J . R. Hilzenga, Fhys. Rev. 109. 457 (1958).
5 . A. 0 . Nier, pr ivate eoDmunloatlon.
4 . 0 . E. Berry in U. 3 . N a t ' l . Bureau of S tds . Circular 522 (U. S, Govt. Print ing Office, 1955), pp. 267-268. Aleo see L. A. Dietz, Rev. Soi . I n s t r . 52, 659 (1961).
5* The Sample leader was designed by A. E. Oameron's mass spectrometry group a t the Oak Ridge National Laboratory, Oak Ridge, Tennessee.
6 . L. A. Dietz, Rev. Sol . I n s t r . ^ , 255 (1959).
7 . L. A. Dietz, 0 . F. Pachucki, J . C. Sheffield, A. B, Hanee, and L. R. Hanrahan, Anal. Chem. ^ 1276 ( i960) .
8 . L. A. Dietz, C. F. Pachucki, and G. A. Land, Anal. Chem. ^ 1 , 709 (1962).
304

1 — I — I — I — I — I — I — I — I — I — I — I — \ — r
- CJ
S f i ^
u> <
2 *
o
< a!
s_. < o o
00 ^
oc o 1 -
^a 1 -UJ o
o _ l l J
obu.
z 3
o o
^8
-loo z I UJ
- o o
r < T O
(O < I llJ m
<n 00 eg
CVJ 1
— — — — — — — — — O O O O c i C i O
SIMV^a NOI OAM dO ( SlINn AdVdlig^V Nl) OIIVU Q^AdBSQO
305

DISPLAY SYSTEM FOR RECORDING RAPID
CHANGES IN GAS COMPOSITION
B. R. F. Kendall
Nuclide Analysis Associates State College, Penna.
INTRODUCTION
During the past few years, increased attention has been given to the development of fast-scanning mass spectrometers. Many of these Instruments are capable of supplying thousands of complete mass spectra during the course of gas reactions lasting for small fractions of a second. In order to record such rapid changes in gas composition, particularly when these changes Involve several different gases, special output circuits and display systems are required.
Where all of the Information appearing at the output of a fast-scanning mass spectrometer must be recorded, a rotating drum camera can be used-'-. Successive spectra are displaced vertically, so that peak heights must be measured and replotted before a detailed study can be made of peak height variations as functions of time.
If changes In the amplitude of a single mass peak are to be recorded, a system described by Damoth^ can be used. The mass peak Is displayed on an oscilloscope screen and caused to move steadily across the screen in a direction parallel to its baseline. The envelope of such a display Indicates variations of peak height with time.
Changes in the amplitudes of particular mass peaks can also be recorded using multi-channel systems. Some of these have been described by Fowler and Hugh-Jones3,. Harrington'*, and Stallard^. Systems of this kind are restricted to use at a limited number of preselected mass positions.
Another method of recording changing spectra has been suggested by Levine", as an extension of the usefulness of the linear intensity-modulated oscilloscope display mentioned in a previous paper? by the present author.' In this type of display, the positions and brightness of spots along a straight line give the mass numbers and qualitative Indications of the peak amplitudes. If this display is moved in a direction at right angles to its length at a suitable rate, peak amplitude changes are seen as Intensity variations in the moving spots representing each Ionic species. The method Is sensitive and makes it possible to record a large amount of Information on a single photograph. A disadvantage Is the difficulty of obtaining quantitative Indications of peak amplitudes from the density-modulated negatives.
This paper describes a new type of display system, developed In the course of a general study of methods of extracting, processing, and displaying data obtained from spectral instruments. The system transforms information contained in repeatedly swept mass spectra directly into simultaneous peak height versus time traces for all peaks In the spectrum. The baselines of these traces are positioned on the vertical axis of the display In such a way as to Identify the corresponding masa numbers. The display is normally presented on an oscilloscope screen and can easily be recorded on a single photograph.
PRINCIPLE OF OPERATION
The new system gives a quantitative display of both mass and peak height information along the vertical" axis of the oscilloscope screen. The horizontal axis Is used as the time axis. Intensity modulation Is used to make visible the separate peak height versus time traces for each raass.
306

1
^ ^
Typical Spectrum
m,
\ 0 2
i I
i'
step Number
FlR. 1. Example of conversion of two-dimansiona1 spectrum to v e r t i c a l one-dlmenalona1 d i sp l ay .
ni|OB,
v -"2?' ^2
5
TYPICAL PEAK HEIGHT TRACES . FOR MASSES M,. M^i SPACES BETWEEN BRIGHTENED AREAS
MASS SWEEP SIGNAL
-HORIZONTAL TWEBASE INPUT
PEAK HEIGHT
«-TIM,
MASS
M J MASS MARKER V _ ELEC TRON BEAM PATHS SHOWN FOR MARKER CYCLE AND TWO OPERATING CYCLES
Fig. 2. Principle of display system.
307

The manner In which mass and amplitude data can be displayed quantitatively along a vertical axis can be explained by reference to Figure 1. A typical two-dimensional mass spectrum Is shown at the top of Figure 1. This oan be displayed as in Step 1, with mass plotted vertically. In general only the masses mi, m2 and the amplitudes ai, a2 of the peaks will be required; the spectrum can therefore be displayed as in Step 2, without loss of useful information. The idealized mass peaks oan be folded along the vertical axis, as in Step 3, without loss of information provided they do not overlap. To allow for peak height indications even in the event of overlapping, the folded idealized peaks can be replaced by markers Ai, Ag indicating the positions of the peak tops, as In Step 1. Fluctuations In the peak amplitudes a^, ag are then represented by corresponding movements of A^ andAg. By reducing the amplitudes of the Idealized peaks Instantaneously to zero as In Step 5, Ai and Ag can be brought to the baseline positions B^ and Bg. These positions respectively indicate the mass numbers mi and mg on the mass scale and the datum positions-from which the corresponding peak amplitudes are to be measured.
The simplest of several possible practical arrangements Is shown in Figure 2. The mass spectrum (a plot of lon ourrent versus time) is applied to the vertical deflection plate Yi via a two-position switch which provides for grounding Yi so that the baselines can be marked. The signal representing collected mass number as a function of time is applied to the other vertical deflection plate Yg. A modulating signal, proportional to the second differential of the peak amplitude with respect to time, is applied to a suitable modulating electrode In the cathode-ray tube. A normal time-base signal Is applied between the horizontal deflection plates Xi and Xg.
Suppose the system Is put Into operation with Yi grounded so that the base lines can be marked. The oscilloscope electron beam is set at an intensity too low for it to be visible. The beam is swept downwards by the sawtooth voltage representing the mass sweep of the mass spectrometer. Whenever a mass peak passes through a maximum the trace brightens, giving the two markers Bi and Bg which Identify the masses and indicate the baseline levels from which peak heights are to be measured.
Suppose that Y^ is then reconnected to the signal representing the mass spectrum. The osclllosoope electron beam is again swept downwards by the sawtooth voltage, but superimposed on this steady sweep are rapid upward deflections which occur whenever a mass peak is registered by the lon detector. The amplitude of each upward deflection Is proportional to the height of the corresponding mass peak. At the limit of each upward deflection the spot.Is brightened so that it becomes visible. The horizontal time-base voltage Is simultaneously deflecting the moving electron beam slowly across the screen so that simultaneous peak height versus time traces are obtained for each peak,
EXPERIMENTAL EQUIPMENT
The prototype display system was developed for use with a special tlme-of-flight mass spectrometer operating at sweep repetition frequencies of 25-50 Kc, The equipment was Intended for use in studying gas evolution processes lasting for times as short as a few milliseconds.
A block diagram of the experimental system Is shown in Figure 3. The mass spectrum signal is applied to the Y^ plate of the oscilloscope tube through a delay line. The press-button switch Sw 1 makes it possible to suppress the peak height indications so that the baselines of the peak height versus time traces can be determined. The second differential ofthe mass spectrum signal, after amplification with phase inversion and removal of negative components of the waveform, is applied to the cathode of the oscilloscope tube. The delay line is adjusted to cancel the delay introduced by the modulating amplifier, A sawtooth voltage representing the mass sweep Is applied through an attenuator so that the mass scale of the display can be varied. A
308

kmOstsctor
Zl ^ Amplifier
Mess Spectrum (Repeatedly Svmpt)
Second Differentiol of FM( Amplitude w.r.t. Time z T ^ Amplifier 4
Rectifier
Modulating Signal
_Li_
T Sw,
Mass Sweep Signol
r iR. 3. Block dl.nran of .x iMr lB.n t . l display a , . t .
0
3 0 0
T ime (sec.)
Temp, ( ° K )
4 6
2 0 0 0
Cha n (tes in pas compos ition during desorption liom tun RS ten filamenl. Adsorption i ime: 4 hours a t res idua1 R B S pressure of l.Kx 10~- torr .
309

simple pulse generator controlled by the switch Sw 2 triggers a standard oscilloscope time-base circuit and supplies a second triggering pulse at a preselected time thereafter to initiate the phenomenon to be studied.
RESULTS OBTAINED WITH EXPERIMENTAL DISPLAY SYSTEM
A typical photographic record is shown in Figure k . This shows variations In the partial pressures of gases desorbed from a tungsten filament during heating from 300°K to 2000 K at 38oc/sec, Adsorption time was four hours at a total residual gas pressure of 1,8 x 10"" torr. The baseline markers down the left side of the photograph identify the gases present and indicate the levels from which the corresponding peak heights are to be measured. The steps following the baseline markers Indicate the partial pressures of the residual gases, the major contributions being from hydrogen and carbon monoxide. Smaller amounts of carbon dioxide and methane are also present. The single hydrogen and complex carbon monoxide desorption peaks are clearly indicated. The largest vertical deflection of the carbon monoxide trace corresponds to a partial pressure of approximately 10~° torr. Traces of methane and nitrogen can be detected at approximately 700°K and 1200°K, respectively.
The limited bandwidth of the circuits used to amplify the modulating signal caused some filllng-ln of the desorption peak contours. This does not affect the accuracy of partial pressure Indications, which are measured from the upper edges of the peak contours. It does, however, make It more difficult to interpret traces which cross or overlap. Production versions of the display system will be available with a special nonlinear pulse amplifier in the modulating circuit in order to avoid this effect.
Figure 5 shows a set of results taken under the same conditions as Figure 4, except that the adsorption times were varied from 1 minute in trace 1 to 24 hours in trace 11, The changes In shape and amplitude of the hydrogen and carbon monoxide peaks for different adsorption times (and hence surface coverage) are in general accordance with results obtained by other Investigators using pure hydrogen and carbon monoxide In separate experiments.
The experimental display system has also been used to study gas evolution from heated metallic surfaces, cleanup of gases from glass during exposure to Intense light, evolution and pumping of gases during flashing of titanium getters, and desorption of adsorbed carbon dioxide from tungsten. The latter experiments showed that carbon monoxide was the only gas desorbed as a result of heating a tungsten filament on which carbon dioxide had been adsorbed. The carbon monoxide desorption spectrum was almost Identical with that obtained in experiments in which pure carbon monoxide was adsorbed, except for a very small additional desorption peak between 350°K and 400°K,
Figure 5 shows a record of gas evolution from Pyrex as a result of irradiation for 1 millisecond by a 10^ watt Xenon lamp. The record was traced from the original photograph because some of the details were too faint for satisfactory reproduction. The glass was in the form of a side tube with a 7cm, llne-of-slght path into the Ionizing region of the time-of-flight mass spectrometer.
Before the flash, the baseline positions were marked in the usual way. The background gas pressure was 10~9 torr, consisting almost entirely of hydrogen, carbon monoxide and a smaller amount of carbon dioxide.
The timebase was thentriggered and the flash tube fired at time zero. Maximum flash intensity occured at the point marked x on the time scale. The rapid Increase in hydrogen and carbon monoxide partial pressures Is clearly shown. Further experiments with the equipment adjusted for a higher mass range showed that a smaller amount of carbon dioxide (indicated by the dotted line in Figure 6) was also evolved. Each of the three traces reached a maximum after about 1 to 3 milliseconds, the effective time constants Increasing with molecular weight,
310

Pig. 5: Set of desorption records for adsorption times ranging frora 1 rain, to 2k hrs. Other conditions as I'or Fig. 4.
, , I • • I « • • •
I I •
28 CO-0 X 0.5 10
FLASH DURATION MlLLISECOt-DS
15 2.0
44 CO,
r i g , 6 . Desorptio.i of H,• CO and CO, from glass during Bxpoaure 10^ watt, 1 piilTisocond Iigfit pulse from Xenon flash tub-
311

These pressure transients then fell with time constants of several tens of milliseconds as the evolved gases were pumped away. Allowing for the time taken for evolved gases to reach equilibrium in the ionizing region, it appears likely that desorption occurred only during the flash for each of the three gases.
Similar experiments with helium, methane, water vapor and argon present In small quantities in the background gas showed a barely detectable photodesorptlon of methane, and no detectable photodesorption of the other gases.
The photodesorption effects were found to be reversible if clean glass surfaces were used. After 12 flashes, each lasting one millisecond, the amount of gas desorbed at each flash had fallen by an order of magnitude. After 5 to 10 minutes without flashing, the amount of gas desorbed at the next flash was close to the original value,
DISCUSSION
Results obtained with the display system show that it offers a simple and convenient way of displaying and recording rapidly changing mass spectra. Although the existing equipment was designed for use at the very high sweep frequencies characteristic of tlme-of-flight mass spectrometers, the principle is equally applicable to other types of mass spectrometers which can be adjusted so that the peak tops are narrow and well-defined.
An important advantage of the display system over a conventional multichannel output system, apart from relative simplicity, is the ability to register peak amplitude changes throughout the mass range instead of only at a limited number of preselected mass positions. There is therefore no possibility of falling to record unexpected but possibly significant changes in the mass spectrum.
The main applications of the system appear to lie in the study of fast gas reactions, such as flash photodesorption, photochemical reactions, and flash thermal desorption. The method Is also likely to be useful for studying slower but much more complex reactions, the detailed courses of which would be very tedious to follow by conventional means.
REFERENCES
1. Kistlakowsky, G,B., and Kydd, P,H,, J. Amer, Chem, Soc, 79 ' 825 (1957)
2. Damoth, D.C, paper presented at Eighth Annual Meeting on Mass Spectrometry of A.S.T.M. Committee E-14, Atlantic City, New Jersey (I960)
3. Fowler, K.T., and Hugh-Jones, P., Brit. Med. J., 1 1205 (1957)
4. Harrington, D.B., Encyclopedia of Spectroscopy (C.F. Clark,ED.) p.628 (Reinhold, N.Y. I960)
5. Stallard, M.J.H., paper presented at Third International Conference on Medical Electronics, London (i960)
6. Levine, L.P., (Honeywell Research Center, Hopkins, Minn.) Private Communication (I96I)
7. Kendall, B.R.F., Proceedings of Ninth Annual A.S.T.M. E-14 Meeting on Mass Spectrometry, 196I, p.158 (Published 1962)
312

MODIFICATIONS TO THE INLET AND R'^CORDING SYSTEMS OF A C,E,C, 21-103C HASS SPECTROfffiTER TO ENABLE DIRECT GAS INTRODUCTION FOR DYI.'AiMIC EVOLUTION STUDIES by J. D. Reynolds and P. C. Green. General Dynamics/ Port Worth, A Division of General Dynamics Corporation.
ABSTRACT
The glass inlet syste.ii of a Consolidated Electrodynamics Corporation 21-103C Mass Spectroraeter was modified to aocom.T.odate alternately the direct Introduction of evolved gases into the ionizing region or conventional sample analyses utilizing the standard molecular leak.
Relationships between peak height and flow rate through the ionizing region have been established experimentally in order to correlate peak height data with evolution rates from a dynamic system.
An oscillograph recorder drive speed control was designed and Installed to facilitate continuous scanning over long periods of time without prohibitive paper usage. Paper feed rates of one, two, four, and eight inches per minute are available.
This work was performed under United States Air Force Contract 33(600)-38946.
INTRODUCTION
Expanding the useful range of mass spectrometrlc analysis has opened many fields of Investigation. Several modifications to allow direct introduction of samples into the ionizing region appear in the literature^1). The modifications described In this study permit the convenient use of the instrument In part-time conjunction with a dynamic gas evolution cell.
Gases may be analyzed quantitatively and qualitatively as they are generated from a sample excited by thermal, electrical, or radiation energy.
The variable speed control on the recorder drive motor opens possibilities of uninterrupted tracings of single m/e evolutions and of spectrum scans compressed to optimum length.
INLET SYSTEM MODIFICATIONS
The modifications Incorporated into the glass inlet system of a Consolidated Electrodynamics Corporation 21-103C Mass Speotrometer have wide applicability to dynamic gas evolution studies such as thermal degradation and pyrolysis product analysis. These alterations offer the obvious advantages of being able to take an analytical look at a system at any phase of a reaction in that system without Interrupting the progress of the reaction.
At General Dynamlcs/Port Worth the apparatus was used to dynajn-Ically introduce gases evolved from irradiated polyethylene Into the ionizing region of the mass speotrometer, thus allowing the first v e a l look at primary decomposition of the polymer in a radiation field (2), The irradiation cell used is shown in Figure 1.
A thermal bath was incorporated in the cell to maintain controlled temperatures during irradiation. A second cold trap between the reaction cell and the mass speotrometer may be used with various thermostat fluids to fractionally freeze out high molecular weight specie, thus aiding the analysis of lower moleoular weight components of the evolved gases. •
Gases evolved from the cell are pumped Into the ionizing region through a three-way high-vacuum hollow plug stopcock allowing the reaction cell to be evacuated through the sample inlet cabinet vacuum system or pumped Into the isatron. The gold leak is bypassed by means of another high-vacuum hollow stopper stopcock.
Initially, a six-inch section of one-inch O.D. half-inch I.D. Tygon was inserted between the reaction cell and the mass speotrometer to give structural flexibility to the system. A very high rate of water evolution at reduced pressures necessitated the removal of this link and illustrated the advantages of the all-glass system which raay be flame degassed.
The stopcocks are lubricated v;ith Dow Corning 11 Compound Silicone High Vacuum Lubricant. After In-plaoe bakeout, the system exhibited a low background entirely suitable for precise measurements.
This configuration allows normal sample Introduction through the inlet cabinet and gold leak or direct introduction of evolved gases Into
313

the isatron with or without the molecular leak. The micromanometer may also be fed directly from the reaction cell to check evolution volumes.
INSTRUMENT CALIBRATION
In order to quantitatively correlate data from the gas evolution cell the peak height to molecular flow rate ratio must be established.
The relationship between pressure In the inlet volume as measured by the micromanometer and the observed peak height was determined for hydrogen, methane, ethane, ethylene, propane, and normal butane.
Next, the leak rate was calculated as the change of pressure In the inlet system versus time as the gas escapes through the molecular leak(3).
The exact volume of the system was obtained from C.E.C. furnished inlet block prints and physical measureraents of the a:iditional glassware. Using the established gas flow rate out of a known volume at a measured pressure and the peak height associated with this pressui-e, the number of molecules per unit time flowing through the isatron can readily be correlated with the observed peak height.
In plotting chamber pressure in microns versus the net peak height of various calibrating gases, a slope of 1,02 to 1.14 was observed in all cases. The curves for hydrogen, methane, ethylene, and propane are shown in Figure 2. This variation appears to be real and not a function of micromanometer zero drift, as drift corrections were applied to all curves.
American Petroleum Institute Mass Speotral Data(4) normalized with known normal butane furnished sensitivities and cracking patterns of other gases of Interest not available.
RECORDER DRIVE SPEED CONTROL
In observing gas evolutions over long periods of time, the benefits of providing calibrated and synchronized speed reductions in oscillograph recorder chart drive of the mass spectrometer became evident. One of the foremost advantages is that of extending the recording time so that data from protracted tests can be preserved without the necessity of Interrupting the procedure for the replenishment of chart paper. Additionally, optimum time scales can be chosen to suit the particular requirement, arranging the data for easy identification of peaks and for convenient comparison. Finally, the time scale compression made recordings v;lth physical sizes whioh are convenient for reproduction and incorporation into reports.
The use of gear changing to reduce the drive speed is not practical because the fragile nature of the equipment makes it unsuitable for mechanical modification, because the modification would prevent the substitution of similar but unmodified recorders, and because of the inconvenience associated with the gear changing operations. Electronic means of reducing the frequency to the synchronous motor were chosen over mechanical techniques for greater reliability, better synchronization, less electrical noise and for the greater ease of construction brought about by the ready availability of the standard electrical components .
The synchronous motor on the recorder chart drive normally operates with a 60 cps Input frequency. Driving this motor with frequencies of 30, 15, or 7.5 ops.,respectively, reduces the shaft speed by factors of 2, 4, and 8. A monostable multivibrator triggered by a negative pulse rectified from the SO-cycle power line provides a uniform pulse to drive cascaded binary counters. A selector switch on the Inputs to buffer amplifiers which drive the thyratrons grids to allow the chosen number of alternations to be gated through the thyratrons to the motor from the AC anode supply. It is the use of this AC supply on the thyratrons which enables the tubes to be shut off without other turn-off circuitry. Using an oscilloscope to observe the waveform of the voltage appearing across the motor at the normal speed, a 60 ops sine wave could be seen. At half speed, a positive pulse would be observed across the motor for the first l/60-seoond period, and a negative pulse on the second period. The waveform at l/4 speed (or 15 cps) shows positive pulses for the first tv/o periods and negative pulses for the second two. Similarly, the waveform at 1/8 speed shows positive pulses for the first four periods and negative pulses for the successive four periods.
Transistors were used for the frequency dividers because of their ready availability, although glow transfer tubes might accomplish the
314

same function equally well. Thyratrons were used to drive the motor instead of silicon-controlled- rectifiers on account of the lower cost of tubes.
Power supply requirements for the circuits are very modest. Principally, this is due to the use of alternating current for the thyratrons, the only elements of the circuit with large power demands. Tv;o readily available Isolation transformers are used in a series connection to provide the 220-volt anode potential for the thyratrons whioh drive the recorder motor. A simple, dual-voltage, zener-regulated supply furnishes power for the transistors.
A ten-second tirae delay relay prevents the application of anode potential to the thyratrons before their cathodes can be brought up to temperature. Other protective features Include the use of a 1.6-ampere slow-blow fuse in the main power line to secure the circuit in general and a 1,0-ampere fast-blow fuse in the transistor power circuit for added safety.
The output of the recorder drive speed control unit is connected to the oscillograph motor through the existing motor control switch on the recorder control panel. This simplifies wiring and provides for the simultaneous initiation of recorder drive and other functions within the spectrometer. Due to the nature of the voltage v/aveforms applied to the motor for the various speeds, the single existing motor phasing condenser is usable under all conditions. This obviates the necessity for any changes In the recorder itself, either me'chanical or electrical. Under other circumstances separate phasing condensers would be required for each speed and additional connectors would be needed for interconnections .
The driving circuits v/ere constructed on vertical panels surroun'd-ing a central opening v/hich provides cooling through a chimney-like air flow. Consistent with the concept of minimal speotrometer alteration, the equipment was located in a vacant space underneath the clock on an existing panel (see Figure 3 ) ,
After installation, checks were made for overheating, excess vibration, and inadequate torque. As seen in Figure 4, motor temperature was actually decreased by 400c at slower speeds. At the low speeds, inertia does not prevent the obvious movement of the motor with each pulse but the existing shock mounts were found to prevent the transraission of this vibration to the galvanometer assembly. Synchronism, which might be impaired by inadequate torque, was checked satisfactorily by the compariaon of the measured length of records to calculated true length.
To make records at normal speed, the speed selector is set at the 60 cps position making the electrical circuit and operating procedures exactly the same as with the unmodified spectrometer. For slow speed operation, either 30, 15 or 7.5 cps operation is selected v/ith the switch, ten seconds warraup time is allowed, and the motor in the recorder is controlled as It was previously. A neon light connected across the motor gives visual indication of the frequency being applied.
As a temporary alternative, the motor can be driven at slow speed Vfith off-the-shelf equipment found in many laboratories. This has been done using a Hewlett-Packard low frequency audio oscillator (function generator) to drive a 60-watt Mcintosh Audio Amplifier. The 500-ohm output of the amplifier v/as coupled dlreotly to the motor leads and two 10-raicrofarad oil filled condensers were connected in parallel across the existing motor phasing condenser. Although the resulting operating frequency was 7.5 cps for a factor of eight reduction in speed, there was no direct synchronization v/lth the power line using this method. Further, different values of shading capacity are required for the optimum operation at each speed.
Another possible method which was considered but not tried involves the use of clock motor, cam, and interrupter switch to reduce the duty cycle of the power applied to the recorder drive motor. IVhile this method is simple and inexpensive it provides poor synchronization with time, is subject to frailties inherent in mechanical mechanisms, gives discontinuous movement of the chart paper (which may distort data), and may cause electrical- noise.
The transistor-thyratron circuit described previously was designed and fabricated in the Buclear Aerospace Research Facility (HARP) and was installed on the C.E.C. mass spectroraeter in the chemical division of the General Dynamics/Fort Worth Environmental Test Laboratory. Since its Installation in Noveraber of 1961, the electronic speed control has been used in nuraerous experiraents without malfunction.
315

ACKiiOV/L::DGEr.S:iTS
The authors v/lsh to gratefully acknowledge the generous aid of 0. H. Hill and R. L. Johnston of General Dynamics Nuclear Laboratories in the compilation of this manuscript. Pull credit for the detail design, construction, and installation of the Recorder Drive Speed Control belongs to li. '.V. Blacknan of the Development lianufacturing Department 04 G o n e r a l Dynaraics/Port V/orth, This v/ork v.'as performed under contracts v/lth the United States Air Force.
RSF^LREKCES
1. J. B. Farmer and P, P, Lossing Can. J. Chem. 55 (1955) 861.
2. 0. H. Hill and R. U. Johnston "Gaseous Yields from X-Irradlated Polyethylenes"- Bulletin The Araerican Phy. Soc. Ser. 2, Vol. 7, No. 1, Jan, 1962.
3. "Hass Spectrometer Operation and I.-Iaintena.ice i.ianual" Consolidated Electrodynamics Corporation.
4. "Mass Spectral Data" American Petroleura Institute Research Project 44, Carnegie Institute of Technology.
316

IMPROVEMENT IN READOUT ACCURACY OF THE CEC MASCOT
by
H. M. Grubb and R. W. Vander Haar
Research and Development Department, American Oil Company, Whiting, Indiana
The addition of the CEC; Mascot peak digitizer to the, high mass speotrometer system at Whiting has saved a great deal of time in handling routine spectra. in this area of application, its limitation on minimum readable peak height and non-readout of metastable peaks have been of little concern. An additional shortcoming was discovered recently, however, in connection with the accuracy of the peak digitizer. This problera had not previously been publicized and indeed may not have been recognized, to judge from the tone of the raost recent CEC letter to "Mascot Users" (July 25, 196l).
During the course of recent maintenance work, tests were made to see how well the peak digitizer followed small changes In amplitude of simulated peak input, particularly in the regions of range changes. A portion of one of the curves that was obtained is given in Figure 1. Each point represents the average of ten or raore measureraents. The irregular stepwise shape of the curve is obvious. The location of the ideal response curve is unknown, since no calibration points are located In this area, but errors up to l" appear likely in this region as a result of peak digitizer non-linearity,
The step curve suggested that the peak digitizer was off calibration. Accordingly, the Dlgital-to-Analog Converter calibration resistors were reset fbiiowing CEC's recommended calibration procedure. An E.S.I. Model DV-l(.li Dekavider was used to obtain the precise voltage ratios needed, and a Tektronix Type 51-3 Osclllosoope served as the null deteotor. The calibration points--800, l|-00, 200, 100, 80, 1.0, 20, 10, and 8 counts--were set .so that the voltage output of the Dlgital-to-Analog (D-A) Converter was accurate to the equivalent of 0.2 oount or better.
Following the calibration, the output of the D-A converter was checked over various ranges of counts between and beyond the calibration points, using the same ypltage divider and oscilloscope. The errors found in the range OTIOO counts are presented in Figure 2; here the errors, in counts, are plotted against the number of counts applied to the D-A converter circuit. The maximum absolute error is 3.6 counts at 79 counts, giving a relative error of over 1+ . Figure 3 shows a similar plot of the errors found in the range 700-800 counts; here the maximum error is 5.7 counts, but the relative error is less than one per cent because of the greater number of counts Involved. These errors are large enough to acooiuit for the step curves in Figure 1. It is apparent that nine calibration points are not sufficient to guarantee good peak digitizer linearity.
The error curves in Figures 2 and 3 show repetitive cycles. The pattern of errors for the units repeats at each multiple of ten, shifted upward or downward by the amount of error present at that tens level. Similarly, the pattern for the range O-lOO counts was found to repeat at eaoh multiple of one hundred, with a similar offset due to the error at that hundreds level. These plots indicated Immediately that the largest errors were being Introduced at the various tens levels.
The output of the D-A converter is a current whioh is fed back to the Input of the peak digitizer. This feedback ourrent should be exactly proportional to the number of counts in register. Figure l. shows a portion of the D-A conversion circuit, and indicates how the feedback current is developed. The left side of the figure is the "800" adding circuit frora the hundreds board; that on the right is the "80" adding circuit frora the tens board. When the counter Indicates an "800" is needed, transistor Q-607 shorts the negative end of Zener diode CR-6oL|-to ground, transistor Q-608 is effectively an open circuit, and the Zener voltage across CR-6ot|. contributes to the feedback voltage, measured at the feedback siarmiing point. When "80O" Is not needed, the transistors reverse and the positive end of the Zener diode is shorted to ground;
317

FIGURE )
MASCOT NONLINEARITY
350
340 —
3 O
5 330
O U t n
^ 320
^ 310
< 300
• • —
• •
• • • •
2901 I 1 1 I 1 880 900 920 940 960 980 1000
PEAK SIMULATOR DIAL READING (LOW BATTERY VOLTAGE)
FIGURE 2
D-A CONVERTER ERRORS
10 20 30 40 , 50 60 70
NUMBER OF COUNTS
80 90 100
318

however, any D.C. voltage present across Q-608 in its shorted configuration contributes to the feedback voltage. Similarly, when "80" is oalled for, transistor Q-612 Is an open circuit across Zener diode CR-612, and the voltage across this diode adds to the feedback voltage. If "80" is not needed, Q-612 shorts out CR-612, but here also any D.C. voltage across Q-612 still contributes to the feedback voltage.
The CEC manual for the Mascot-!:- indicates that the transistor shorting voltages are quite small, and that in normal operation, they are compensated. The calibration procedure does effeot compensation at the calibration points, but it may not do so elsewhere.
The voltages across the shorting transistors on the hundreds board (Q-608 and three others in the same configuration) ranged from 1.2 to 3.0 millivolts. Those on the tens and units boards (In positions similar to that of Q-612) were much larger, however; they ranged from 20 to 55 millivolts. The order of magnitude difference in these voltage drops appears reasonable considering the circuit differences. Referring again to Figure Ij., It is seen that Q-612, on the tens board, must pass about 5 milliamperes (250 volts divided by I4.7K) when it shorts out the Zener diode. On the other hand, the ourrent that Q-608, on the hundreds board, must carry in order to transfer the positive end of the Zener diode to grovmd potential need not be more than the Zener voltage divided by the series resistance, or about 0.1 milliampere. Fifty times as much shorting current oould easily cause ten or twenty times as much shorting voltage drop.
In order to appraise the effects of these transistor shorting voltages, the D-A conversion circuits were analyzed and circuit equations developed from whioh errors could be estimated. An as example. Figure 5 illustrates the situation that exists on the hundreds board when "800" is called for. The currents In and out of the summing point at the top of the 20K summing resistor, disregarding the tens and units boards, are given by:
^z " Ecal , , 1 1 1 , ^oal (1^ — f r = (E al - V ) ( + f + ^ ) + ToK"
800 °®- ° 100 200 1|00
Epai is the feedback voltage at the summing, point for 80O counts. E^ is the "800" Zener diode voltage, and Vg represents the voltage drop across the shorted transistors (the transistor voltage drops are all assximed to be equal here). Equation (1) oan be rearranged and simplified to;
Ecal Eg „ , 1 1 1 . (2) -1?- = r — + Vg ( + ^ -4-^
800 100 200 1;00
where R is defined byj
1 _ 1 1 1 1 1 R ~ R, " R * R, " R„ " ?0K
100 200 I4.OO 800 Equations similar to (2) can be written for 100, 200, and 1.00
counts (one-eighth, one-quarter, and one-half of 80O counts, respective-ly):
1 E c a l Ez „ , 1 1 1 , (3) B - R - = 1 — + V S ( R — + R — + ' ^ — )
100 200 Ij-OO 800
- IT
(1+)
(5)
^Operation and Maintenance Manual, Mascot Mass Spectrum Digitizer, Type 3q.-20l, Lots 1-lj-, Consolidated Electrodynamics Corporation, May, i960.
319
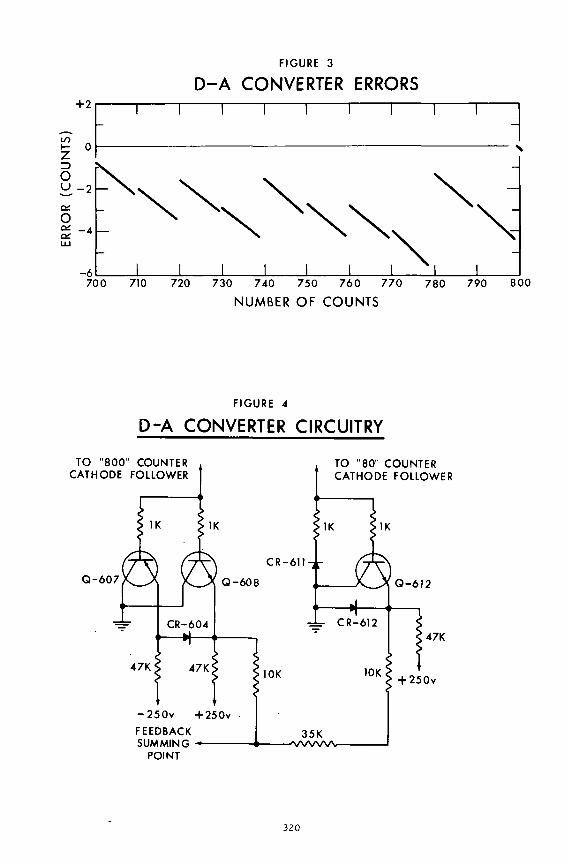
+ 2
I - 0 Z O
cn
o
- 6 1 — 700
FIGURE 3
D-A CONVERTER ERRORS
\
710 720 730 740 750 760 770
NUMBER OF COUNTS
780 790 800
FIGURE 4
D-A CONVERTER CIRCUITRY
TO "800" COUNTER CATHODE FOLLOWER
TO "80" COUNTER CATHODE FOLLOWER
Q-607 Q-612
47K
+ 250v
- 2 5 0 v FEEDBACK SUMMING
POINT
320

In each case, the Zener diode voltage is applied to the proper branch resistance, as called for, and the transistor shorting voltages are applied to the remaining resistances. The Zener diode voltages are also assumed equal.
If now equations (3), {h-), and (5) are added, the result will represent the proper feedback for 700 counts:
Ez(i: 100
1 1 + ^ — ^ - K . —
200 14-00
) + + 2V, 800
1 1 + ^
loo 200 lj-00 800
Equation (6) cannot be realized by the D-A converter, however, because one transistor oannot simultaneously supply E^ and Vg to the same branch resistance. The following equation represents the actual "700" ooiint, where E^ is applied to the 100, 200, and L|.00 resistances and Vg is applied to the 800 branch:
(7) E700 R
7Ecal Eerror " B R ~ + - ^ — = E {n •*• • + •""
'800
The difference between equations (6) and (7),
(8) 2V„(-s R 100 200 "1 00 '800
represents the error that must exist at 700 counts if the transistor shorting voltages are not zero, no matter how accurate the calibration at 100, 200, and Ij-OO.
An error of not more than one oount is desirable. The feedback voltage equivalent of one count was determined to be 3.3 millivolts. Substituting this value for Egrror ^n equation (8) leads to a limit of 2,1 millivolts for the transistor shorting voltage drops on the hundreds board. Similarly, the voltage drops across the tens transistors should be less than 16 millivolts; both of these limits apply only if error is being produced by the board in question. Comparison of these limits to the voltage drops actually measured on the hundreds and tens D-A boards led to the conclusion that the 2,1 millivolt limit on the hundreds board was attainable by selection of transistors, but that the I6 millivolt limit for the tens board was not. The shorting voltage characteristics of a dozen locally purchased transistors did not differ markedly from those supplied with the Mascot.
An obvious solution to the problem was the replacement of the tens board with a duplicate hundreds board, with the addition of the series resistors between boards. A new hundreds board was not readily obtainable from CEC, however, so the alternate course was taken; the tens board circuitry was converted to that present on the hundreds board. The physical construction and printed circuitry on the two boards are identical, so that the conversion was relatively simple. The transistors on these boards were placed in the order of their shorted voltage drops, with the lowest one In the "8OO" spot, the next best in the "lj.00" spot, and so on down through the two circuits. The 2,1 and 16 millivolt limits specified above were met In this way. An accompanying problem was that of obtaining an extra 20 milliamperes from the -2^0 volt regulated power supply. CEC indicated, in response to an Inquiry, that the power supply transformer T-703 did not have the neoessary capacity. The problem wss solved by replacing T-703 with a urc Type H-8li. transformer.
After these changes were completed, the D-A converter was recalibrated" and error measureraents in the various count ranges were determined as before. Figure 6 shows a comparison of these latest error raeasureraents with the original errors for the range O-lOO counts. The maximum error in this range is now only 0.9 count, at 7I4.-79 counts. The largest error found on any of the ranges checked was +1.5 counts, at 780 counts.
321

FIGURE 5
"800" CALIBRATION:
'100 1 20 0 uoo ' 800
/ I - c a l
20K
FROM "lO's" AND " I s "
FIGURE 6
D-A CONVERTER ERRORS
+ 2
I - 0
z O U - 2 Of
O - 4
- 6
1 r
N V ^ \
- ORIGINAL
MODIFIED
J L
\
J \ L 0 10 20 30 40 50 60 70 80 90 100
NUMBER OF COUNTS
322

The "Mascot User" letter referred to previously states that a linearity of 1 part per 1,000 is inherent in the design of the D-A converter. This is taken to mean a maximum error of 1 count in any part of the 1,000 count range. This specification places limits on transistor shorting voltages whioh are not readily met in the Mascot circuitry originally supplied by CEC, As a result of the changes described above, however, the linearity of the D-A converter of the Mascot at Whiting appears now to approach 1 part per 1,000.
323

NEGATIVE ION FORMATION IN VARIOUS GASES AT PRESSURES UP TO . 5 nun OF Hg
R. K. Curran Westlnghouse Research Laboratories, Pittsburgh 35, Pennsylvania
The work that I would like to report on was performed with two different mass spectrometers. Measurements at pressures less Chan I \i were made using a mass spectrometer designed by Dr. R. E. Fox, slightly modified to permit some differential pumping and the use of a source with an improved collection efficiency for ions with kinetic energy. The RPD method was used to control the electron beam. The source end of the instrument for the pressure range above a few microns is shown in Fig. 1. The gas sample is introduced through the center glass tube. After passing through the ion source most of the gas exits through the first pump. With the source at 1 mm Hg of He the analyzer region is at less than 10'° mm Hg. To facilitate kinetic energy measurements, the vacutim envelope is run at the acceleration voltage with the source at or near ground potential. This requires that the individual wires leading to the source be enclosed in a glass tube to eliminate corona. The electron beam is controlled with an RPD electron gun. Distribution widths at half maximum of about .1 ev are obtained.
Figure 2 represents the layout of the two mass spectrometers. With the ion collector at ground and the analyzer at the accelerating voltage, the source potential may be varied to trace out the retarding curve for an ion. The ions are retarded at the collector. Both mass spectrometers can be equipped with electron multipliers. The output noise of the multiplier used corresponds to an input current of less than 10"^^ amp.
The operation of the high pressure mass spectrometer was checked using the He and He ions from He. Figure 3 shows the electron energy dependence of the He"*" and He.'*' ion currents. The electron energy scale was calibrated from the vanishing point of the He* ion current. The He •*• ion current is formed by a secondary reaction in which the atoms that have been excited by electron impact later collide with unexcited He atoms with the result that the excitation energy is carried off by an ejected electron leaving behind an He."*" molecular ion. The He.'*' ion current may be expected to reflect the excitation functions for the various He excited states that result in its formation. The vertical lines indicate the position of lowest level of the n B 3 4j 5 groups that apparently contribute to He^"^ formation. The correlation between these and the breaks in the He + ion current is quite good. Figure 4 shows the pressure dependence of the He, ana He'*' ion currents. The pressure dependences were taken with zero repeller voltage. The solid line through the He."*" points has a slope of two up to a pressure of over 1000 \ i . This is consistent with the forming process discussed above. The He" ion current is observed to be linear with pressure to over 500 |j after which it bends over. It has been shown that this is due to charge exchange collisions between He* and He in the region between the electron beam and the exit slit of the ion source, a distance of about 2 mm. The He-"^ ion with an apparently smaller charge transfer cross section in He does not depart from its p dependence until pressures in excess of 1000 \i are reached. Similar results have been obtained for Ne+ and Ne "•".
Negative ion formation in 0, was examined. An 0 ion was observed to arise from two processes. The 0* frora dissociative attachment is shown in Fig. 5. The kinetic energy of the 0" fragment was measured as a function of electron energy. The results are shown plotted in Fig. 6. The line of slope 1/2 through the points has an intercept of 3 ev which should be the difference between the dissociation energy of 0-
This work has been supported in part by the Advanced Research Projects Agency through the Office of Naval Research.
324

High pressure mass spectrometer tube.
Figure 1
Ion Col lector-
Ion Retard
Filament
(ou)
Ion Focus
Mass Spectrometer
Figure 2
325

and the electron affinity of 0. These results are in agreement with the work of G. J. Schulz using a total tube but do not agree with the value for the electron affinity of 0 obtained by photodetachment or, as will be noted later, with the value obtained from Che study of ion pair formacion by elecCron impact.
An 0 ion onsets a t 11.3 ev and its dependence on elecCron current is not linear but rather appears as chough the 0~ arises from two processes, one involving one electron and another requiring the excitation of an 0„ molecule by one electron followed by Che dissociacive attachment of a second electron. At present nothing can be said of the details of these processes.
An 0^ ion was observed in Che negaCive lon specCrum. In order Co discuss its mode of formation it is necessary to recall some previous work in 0-. In 0- it it was observed that 0" and 0 ~ ions were formed by low energy electrons. The appearance poCencials of Chese ions, along with their dependence on electron energy, led to the construction of a proposed set of potential energy curves for the 0-" molecule. These are shown in Fig. 7. Collisions involving 0' and 0^ should be described by these curves. In particular it would appear from che curves that if an 0 ion has sufficient energy to approach an 0» molecule along che lower 0^~ potential curve, then there will be a possibility that the system will separate along the upper curve to form 0-" and 0. This type of process is proposed to explain the 0„ ion current observed. The dependence of the 0^ and 0 ion currents on electron energy is shown in Fig. 5. The 0«" ion is observed to onset at 1 ev above the 0* ion currenc threshold. The pressure dependence of the ratio of the 0^"/0" currents is linear, but the pressure dependence of the individual ion currents does not depend on pressure in the way one would expect. That is 0„" and 0 exhibit pressure dependences that are too large. The origin of this difficulty appears to be in the discrimination of the mass spectrometer against ions with kineCic energy. The mass specCrometer apparently collects only those ions with kinetic energy that are initially directed into a very small solid angle decermined by the exit slit. (The exit slit Is small to allow sufficient differential pumping.) As Che pressure ts increased, fast ions directed in an unfavorable solid angle undergo collisions and are slowed' before they escape the allowable collection region for slow particles and thus are collected with an efficiency depending on che pressure. This effecC has been verified by mixing Ne with 0 and observing the 0" ion current to be linear with 0« pressure at partial Ne pressures of about 200 \i or more. The ions also exhibit proper pressure dependences when the repeller voltage is large compared Co Che ion kineCic energy.
Figure 8 shows the equations for energy balance in the proposed reacCion for Che formation of 0„~. The first line expresses Che facC that Co effect the removal of an electron from 0" and reattach it Co O-* one has Co supply energy at least in the amount of Che difference beCween EA(0) and EACO^)• This energy is supplied through the kinetic energy of the 0" lon which is determined by the kinetic energy of formation plus the effect of the repeller voltage. The 2/3 has its origin in the fact that at mosC only 2/3 of Che 0 kinetic energy can go into potential energy of Che collision complex. The second line ts the expression for KE(0") at 0." threshold. Eliminating KE(0~) between the two equations and substituting the values indicated, one obtains the result EA(0) < 1.5 ev, which is consistent with Che accepted value of EA(0). This ts somewhat surprising since the 0~ ions come from the dissociative attachment process previously found to give a value of EA(p) "2.1 ev. No convincing argument can be given to resolve this discrepancy.
A very weak 0. signal has also been found to onset at 0 ev. The dependence of this ion on electron energy is shown in Fig. 9. Also shown is the electron retarding curve used to calibrate the energy scale. The shape of this curve ts consistent with the results of Schulz obtained in a Cotal tube. The process here is probably the three-body attachment process
^ "*• °2 "*" °2 ^ ^2" •*• ^2 '
Some investigation has also been done on pair formation processes. The type of measurement made l a shown tn Fig. 10 where H^ and H from H„ are ploCted vs electron energy. The vanishing point of Che H-"*" ion currenC ts used Co calibrate the electron energy scale. Such a plot gives Cwo deCerminations of the electron affinity of U. First from the onset at 17.3 assuming this to be IT + H", one obtains EA(H) " .8 ev using the accepted values of 1(H) and D(H») and second from the difference between the onset of H^ + H~ and the second break assuming tt to be the onset of H + H gives again EA(H) B .8 ev. These are in quite good agreement with the accepted value of £A(H).
326

(s^un AjBJ iqjB) ^uajjno uoi
o^
+ a>
V + CVJ
^ y> "^^^^-^^-o^ ir\ ^
a. c<\
y i i
o irC <>sJ
t
^ 1 1
o CM
)<= u-ICVI
)
> O)
>^ CD 1 -
L U
o . -U J
• o
c ra
+
o a> u c O)
• a C C L a> • D
>^ £• O)
c OJ c o
CO
Ll
.1 £
(simn AjeJjjqjB) juajjno uoj sy
327

Pair formation processes have been studied previously in 0» by Randolph and Geballe,'- in NO by Cloutier and Schiff,^ and in CO by Lagergren.^ The work has been repeated to obtain the data from a single instrument. Figure II shows data on pair formation taken in 0., NO, and CO. In 0. the onset 17.2 ev gives EA(0) = 1.5 ev while the difference between onsets gives EA(OJ = l . k ev. In NO the onset 19.5 ev gives EA(0) = 1.5 ev, while the difference gives EA(0) = 1.6 ev. In CO the 20.8 ev onset gives EA = 1.6 ev, while the difference gives EA(0) = 1.5 ev. It would appear that there is little doubt that the electron affinity of 0 obtained from pair formation appearance potentials is in agreement with the accepted value of 1.465 ev.^
Figure 12 shows the electron energy dependence of 0 /CO. If the AP of 0 at 23.7 ev is taken as the threshold for O"*" + C", then EA(C) = 1.0 ev and if the 24.8 onset is 0"*" + C, then the difference gives EA(C) = 1.1 ev. It is interesting to note that the 0"*" ion current has structure at less than 1 ev above threshold. If this is interpreted as evidence for an excited state of C", then from the 0 data it is .5 ev above the ground state. The recent work of Seman and Branscomb^ on photodetachment in C" indicates an excited state of C" somewhere below .5 ev above the ground state of C". The present results would appear to be consistent with this result.
REFERENCES
1. P. L. Randolph and R. Geballe, University of Washington, Thesis, 1958 (unpublished).
2. G. G. Cloutier and H. I. Schiff, J. Chem. Phys. 31, 793 (1959).
3. C. R. Lagergren^ University of Minnesota, Thesis, 1955 (unpublished).
4. L. M. Branscomb, J. Chem. Phys. 29, 452 (1958).
5. M. L. Seman and L. M. Branscomb, Phys. Rev. 125, 1602 (1962).
328

•iH
Cx
(A3) A6jau3 0U3ui>|
o r^
, "^
> - > m k-a> c
U J
c o t -
o OJ LLJ
1 CM
o • o C
ro O •!=i
c: <u
• o c: (U o . 0 }
X 3
p-^ CJl
(U
a, c o I -
i n
Q) Ll 1 hO
b t
(stjun AjBJijqjB) luajjnQ uoi
329

CURVE 518104
^ 1 O2 + 0
EA (O2)
i EA (0) 0 2 " ^ °
O2+O
0 ^ - 0 Separation
Figure 7
EA(0) - EA(02) - | ( K E ( 0 " + VJ^U 0
2KE(0")+ 0(62) - EA(0) = AP(02)
2 EA(0) < 3 EA(02) " ^ ^R ^ ^ ^ ^ V ' ^^^2^
EA (O2) = . 6 ev
AP(02) = 5.3ev
V^ = .5ev
D(02) = 5.11 ev
EA(0) < 1.5ev
Figure 8
330

rv
4-^CM
I-H ^ * 3
OO A I-H X
n-1 ^y>^
I-H X
--o--_j I—1 1
o
2 j cn
(s mn AjBJijqjB) juajjno uoi o
O) a. CU
• D > C31 L . O) c <u c o
I CM
o
o . a>
• o > i cn
L-
(U c o
(sijun ^JBJjjqjB) iU9Jjn3 uoj
331

17.0
23.0
18.0 19.0 20.0 21.0 Electron Energy (ev)
22.0 23.0
Electron energy dependence for M InM + 0 " processes
F i g u r e 11
24.0 Electron Energy (ev)
25.0
Electron energy dependence of C and 0 from pair formation in CO
Figure 12
332

ELECTRON TRANSFER IN COLLISIONS OF NEGATIVE IONS WITH O2 MOLECULES
T. L. Bailey
College of Engineering and Department of Physics University of Florida, Gainesville, Florida
Cross sections for the production of slow heavy negative ions and for the production of free electrons in collisions of negative ions with O2 molecules have been measured by an ion beam-gas scattering technique. The experimental method consists of directing a momentum analyzed beam of primary negative ions, of kinetic energy variable over the range 4-350 e.v. through a collision chamber containing gas at low pressures. Slow electrons, produced by detachment processes, and slow heavy negative ions, which arise from simple electron transfer (and perhaps other processes), are extracted from a known length of the primary beam path by a weak electrostatic field. These product species then pass through a region containing a radio-frequency field. When the radio-frequency field is adjusted to the proper frequency and voltage, it sweeps out all electrons, without attenuating the current of slow heavy ions. Thus the currents of product ions and electrons can be measured separately, and are used to calculate separately a ^ , the cross section for production of slow heavy negative ions, and a ^ , the cross section for production of free electrons.
The systems Oj in O2, H" in O2, and 0" in O2 have been studied. The results obtained for O2 in O2 and for H~ in O2 show that cr is rather large for both systems over the entire energy range of the measurements. In both cases, the dominant contribution to Oj is attributed to simple charge transfer. For Oj in O2, "t rises fairly smoothly with decreasing primary ion energy W, from a value CTf = 7-9 " 10-16 cm^ at W = 29^*.3 e.v. to 20.6. x 10-16 cm^ at W = 3-6 e.v. The behavior of Cj- versus W is indicative of a process for which the energy defect AE is approximately zero. For H- in O2, dt increases from at = 6 . k x 10-'6 cm^ at W = 350 e.v. to a shallow maximum of CTt = 13.0 X 10-'6 cm2 at W = 70.5 e.v., then drops to a^ = 9.6 x 10⁻¹⁶ cm^ at W = 25.0 e.v., and from this minimum again rises to 13-0 x 10-16 cm2 at W = 7-7 e.v., the lowest energy of the measurements. If Ot is due to simple electron transfer alone, its behavior with energy below W = 25-0 e.v. indicates that the electron affinity of 02 is approximately equal to that of H, and it is estimated that E(02) = 0.75 ± . 2 k e.v. The maximum at W = 70.5 e.v. may arise from the reaction H- + O2 = H + (Of)", where (O2)"' is in an excited internal state. cr- for 0" .in O2 was smaller throughout the range of the measurements than (Jt for OJ in O2, or H" in 02. For this system, aj versus W shows an unusual double maximum structure: there is a flat maximum at W ^ 100 e.v., where a^ = 3 . k X 10-16 cm^ It is nearly certain that C7(- in the region of the W = 100 e.v. maximum is due to simple charge transfer alone. An interpretation of this maximum, based on the preceding assumption, and on the adiabatic hypothesis, gives the inequality E(02) *• 0.9 e.v., which is consistent with the estimate deduced from the low energy behavior of (Jt for. H" in 02- The maximum at W = 9 e . v . is attributed to contr i but ions from an ion-molecule reaction, such as 0" + O2 = (O3)""' = 0" + O2, rather than to simple charge transfer.
The electron detachment cross sections at energies above W = 30 e.v. for all three systems are similar in magnitude and in behavior with ion energy to those which have been observed for other colliding systems. The behavior of oj versus W for 0" and H- at very low ion energies is rather unexpected, however, aj for 0~ in O2 extrapolates to zero at an ion energy considerably less than the appearance potential for direct col-lisional detachment, 0" + O2 = 0 + O2 + e-, and the low energy crj' s for H" in O2 extrapolate to a positive value at W = 0. These results suggest that at very low energies the CTjj's may arise in part from the reactions 0" + O2 = O3 + e", and H" + O2 = HO2 + e".
Preliminary studies of collisions of 0" ions in N2 show that tjt ^o"" this system is negligible in the range 25 > W i 350 e.v., and therefore that the electron transfer reaction Q- + N2 = 0 + Nj does not occur. For 0" in N2. abnormally large currents of relatively fast heavy ions, scattered through 30° or more, were observed. This indicates that either (a) there is an unusual amount of large angle elastic scattering, or (b) an ion-molecule reaction, such as 0" + N2 = NO" + N, is taking place with high probability at fairly elevated energies.
333

SOME UHIQUE APPLICATIONS OF HEGATIVE lOM MASS SPECTRA
Russell Baadock ^ Chemi stry Division, Oak Ridge National Laboratory
Oak Ridge, Tennessee
Abstract
The negative lon mass spectra of some organic materials stand in contrast to the positive ion mass spectra as being raore readily understood In terms of molecular structure ajid chemical behavior. Spectra of some of the simple hydrocarbons ajid alcohols are presented to support this viewpoint. Often the negative lon spectra, because of their simplicity and unamblgulty, readily lend themselves to quantitative analyses in mixtures such as formic acid, HCOOH, and formic-d acid, DCOOH. It Is shown that negative lon spectra are the principal data which made It possible to identify the transient species observed in the reaction of D„ + C0„ on platinum. Evidence for the contribution of negative ions in the polymerization of mixtures of (CN)p + Xe are presented and discussed.
Introduction
1 2 Some years ago Melton and Rosenstock ' employed a commerciaaiy built mass spectrometer to investigate metastable and collision induced dlssoolations. This experience and a number of other considerations led us to design and build a versatile and sensitive instrument vhich vould be suitable for a vide range of applications and investigations In chemical physics.
All of the pertineotkfeatures of the mass spectrometer have been presented in earlier publications ' so I vill list here only those features vhich are pertinent to the study of negative Ions. They are as follovs:
1. A high degree of differential pumping so that the pressure in the ionization chamber may be built up to 1 mm of Hg.
2. A I k stage electron multiplier plus a vibrating reed electrometer and counting circuitry for high sensitivity of ion detection.
3. A Hutchison type emission regulator for stability of the beam of ionizing electrons, and
k. A thoria Iridium filament for inertness.
It has become evident in the past year that other vorkers have also found that essentially these sarae Instrument features are useful In applying a mass spectrometer to problems In chemical research.
Figure 1 is a draving of our ion source. With versatility as veil as exploratory applications in mind, the ion source vas constructed as shovn. With differential pumping, the pressure in the ionization chamber can be made about £in order of magnitude higher than in the general region of the ion source. Since the final exit slit of the source is the only vacuum connection betveen the ion source and the analyzer tube, a second pump (not shovn) is able to maintain the vacuum in the analyzer tube about three orders of magnitude lover than the vacuum in the lon source region.
By means of relatively simple changes to the ion source, ions may be formed by any one of the folloving means:
1. Lov energy electrons (5O-IOO ev vhich vere used for the vork reported in this paper).
Operated by Union Carbide Corporation for the U. S. Atomic Energy Commission.
334

UNCLASSIFIED
ORNL-LR-Owg. 42950C
ELECTRON B E A M -
Figure 1 MASS SPECTROMETER ION SOURCE
Figure 2
NEGATIVE IONS FROM HCOOH, DCOOH, AND HCOOD
MASS
16
17
18
44
45
46
91
92
9 3
ION
0~
OH"
—
COO"
HCOO"
—
HCOOH
HCOOH
•HCOO"
R.A.
6.3
3.4
—
O.l
100.0
—
o.l
—
—
DCOOH
ION
0 "
OH"
OD-
C00~
COOH-
DCOO"
—
D COOH DCO(
R.A.
6.6
3.5
0 .2
O.l
1.2
100.0
—
—
r o.l
HCOOD
ION
0"
OH"
OD"
C00~
HCOO"
—
—
HCOOfi-
.^^
HCOO
R.A.
6 .9
0 . 6
3.5
O.l
100.0
—
—
O.l
335

2. High energy (up to 6 kev) electrons.
3. Alpha particles from Po-210 mounted on a platinum disc and placed in front of the ion repeller.
k. Beta particles from Hi-63 mounted on a platinum disc and placed in front of the lon repeller, or
J. Replace the ion repeller vith a coll of platinum wire and use a beam of electrons to ionize species evolved from the surface of the cateilyst.
The information reported here on negative ion mass spectra comes from studies in our group by Melton vho vas assisted from time to time by other interested members of the Chemistry Division as noted in the bibliography.
Acids
The negative lon mass spectra of formic acid, HCOOH, formic acid-d, HCOQD, and formic-d acid, DCOOH vere studied rather extensively by Melton and Ropp. They have shovn that negative ion formation in these acids is predominantly by loss of the hydroxyl hydrogen. The formation of negative ions from reactants in the gas phase ia these acids by hydroxyl bond cleavage is analogous to liquid phase ionic dissociation of organic acids containing the carboxyl group.
In Figure 2, one can cleaxly see by examining the data, especially for masses k^ and k 6 , that In the formic acids the formation of negative ions results almost exclusively from the cleavage of the hydroxyl bond.
It vas also found In some additional studies that the trend in sensitivity to negative ion formation in formic acid, acetic aoid, and propionic acid is roughly comparable in magnitude to the relative tendencies of these acids to ionize in aqueous eolution, as measured by their ionization constants.
We note in passing that the small, but measurable intensities at masses 91, 92 and 93 led to a subsequent investigation of an interesting negative ion-molecule reaction in a mixture of HCOOH and DCOOH.°
The tremendous advantage of using the negative ion spectra for quantitative measurements in a mixture such as formlc-d acid, DCOOH, and formic acid, HCOOH, is seen from the data in Figure 3- One needs to measure only mass k6 as representative of the unlabelled acid as contrasted vith the 28 ionic species in the positive lon spectra.
The pover and simplicity of the negative ion spectra of organic acids containing the carboxyl group, especially vhen one is concerned vith a mixture of labelled and unlabelled acids as is sometimes the case in biological studies, has been recognized and is being demonstrated in some studies nov in progress.
Hydrocarbons and Alcohol
Tvo general conclusions can be dravn from the mass spectral data nov available for a fev of the aliphatic hydrocarbons, methane, the C2-hydrocarbons and n-butane.' First, ionization and dissociation reactions induced by 50-75 volt electrons yield about 1 negative ion to 10 positive ions. Second, the percent of C2H" formed from the aliphatlcs, in the open chain molecules above methane increases vith increasing saturation. If one considers acetylene, ethylene, ethane and n-butane in that order, then the percent of CgH- increases from 23 to 30 to 38 to 59.
Methane, the first in the series of paraffins, has been studied rather extensively by three groups of investigators. Since h x ^ energy {~ 73 v ) electrons vere employed in these studies, the mass spectra vere produced predominantly by lon pair production. The relative distribution of both positive and negative ions ts shovn in Figure k. The negative ion data is from the work
336

MASS
12
13
14
15
16
17
18
19
20
26
29
30
31
44
45
46
47
16
17
ie 44
45
46
47
Figure 3
POSITIVE AND NEGATIVE IONS FROM DCOOH
ION
C+
CH+
DC+
HCD+
0+
0H+
H0H+OD+
HOD+
C0+
HCO+
DCO+
DC3O+
C O , -
HCOO+
DCOO+
DCOOH+
0 -
OH-
0 0 -
coo-HCOO-
DCOO-
DC,30„0-
RELATIVE ABUNDANCE
0.90
0.10
0.90
0.18
2.04
3.79
8.03
18.67
15.51
12.08
88.61
1.35
23.09
36.84
38.22
100.00
0.14
0.07
0.004
0.002
0.02
2.06
0.004
UNCLASSIFIED OIIKLJ.I).OWS. 34919
RELATIVE ABUNDANCE (OF NEGATIVE IONS ONLY)
6.6
3.5
0.2
0.1
1.2
100.0
0.2
Figure 4
UNCLASSIFIED
ORNL-LR-Dwg. 56175
RELATIVE ABUNDANCE FOR NEGATIVE AND POSITIVE IONS INDUCED IN METHANE BY ELECTRON IMPACT
80 o
•D C
60
.a
& 40
20
0- X , OCH"
-
- ?-^'-o'
l \ 1 1
1
C H J 0
1
r 1 r—
"CH3^
C H ^ 0)
CH4 A
-
-
1
^ cn - r-
12 13 14
(M/e) of lon
15 16
337

of Melton and Rudolph and the positive ion data is frora the vork of Melton and Rosenstock. These cm-ves have been normalized by making the most abundant ion in each spectrum equal to 100. The absolute intensity differs by a factor of 10 as shovn. The relative intensities of the ions as a function of the number of hydrogens remaining on an individual carbon atom are of interest here. The negative ion abundance decreases rapidly vith increasing saturation of the carbon atom, vhich is in accord vith the decreasing electron affinity vith increasing saturation of the carbon vhile In the case of the positive ions. Just the reverse is true.
The negative ion mass spectra of the alcohols have severeil general features vhich have been correlated to molecular structure and chemiceil properties. Melton emd Rudolph have shovn that loss of hydrogen by negative ion formation is almost entirely restricted to loss of an odd number of hydrogen atoms. Furthermore, the most predominant negative ion formed by hydrogen extraction in all the alcohols results in the loss of a single hydrogen atom. For example, an examination of methyl alcohol labelled In the hydroxyl position, i.e., CH5OD, has shovn that the CHiO" ion is formed almost exclusively as a result or cleavage of the O-D bond. This mode of formation of CH5O- is analogous to the previously referred to breakup of formic acid. These observations strongly suggest that negative ions formed by hydrogen extraction are formed In all alcohols predominantly by loss of the hydroxyl hydrogen.
Negative lon formation by electron Impact of secondary and tertiary alcohols proceeds almost exclusively by loss of the hydroxyl hydrogen. In primary alcohols, in addition to forming negative ions by loss of the hydroxyl hydrogen, other ions c£in be formed by the loss of tvo additional hydrogens, probably the alpha hydrogens. Since it is knovn that the alpha hydrogens are more active in oxidation reactions than the other aliphatic hydrogens, these observations appear to be In good agreement vith the chemicEil properties of the alcohols.
It oan be seen in Figure 5 that the negative ion spectra of n-butane and n-butyl alcohol shov remarkable similarity. This agreement is in accord vith the fact that the reactivity of an alcohol in an homolgous series more closely approaches that of the corresponding alkane as the alkyl radical increases in length. By vay of contrast, the negative ion spectra of ethane and ethanol are not nearly so similar to one another, as might veil be expected.
We also note that In n-but6uie, vhich is the heaviest aliphatic hydrocarbon for vhich we hare negative ion mass spectral data, the Cg" ion is an order of magnitude more abundant than the other carbon species. Ionic species containing a single hydrogen are generally more abundant than vhen an even number of hydrogens are present. It has been noted that in positive ion mass spectra, positive ions containing an odd nuraber of hydrogens a r e usually much more abundant than those containing an even number.
Catalysis
Melton has also used our reseeirch mass speotrometer to Identify and study the volatile transient species produced hy catalytic action. Several investigators have reported that free radicals are formed on and possibly desorbed from catalysts during heteregenous reactions but these have not heretofore been identified mass spectrometrically.
The catalyst in the form of a spiral of 0.5 mm platinum vire, 3 x 13 mm vith a surface of ~ 1 cm^ vas mounted inside the ionization chamber in approximately the position of the ion repeller and parallel to and just behind the electron beam. The catalyst could he self heated by passing a current through it. Gases under investigation vere introduced in the usual manner and products evolved from the reaction on the catalyst passed into the electron beam and were ionized. Products of the reactions vere studied as a function of catalyst temperature, and the pressure and concentration of each reactant.
338

Figure 5
Relative abundance of negative ions from some alkanes and corresponding alcohols.
m/e
12 13 14 15
24 25 26
36 37 38
48 49
Ion
c-CH-CH2-CHs-
C2-C2H-C2H2
Cs-C3H-C3H2
C4-C4H-
Ethane
20 29 8
100 100
3
Ethanol
31 51 18 28
61 100
3
«-Butane
3 13 7 2
29 100
5
3 2
1 3
w-Butanol
3 7 4 1
31 100
3
6 4 2
1 2
Figure 6
UNCLASSIFIED ORNL-LR-DW9. 90(33
FREE RADICALS AND INTERMEDIATES DETECTED IN THE REACTION D, + C O , - ^ D,0 + CO
M/fe ION PROBABLE PRECURSOR PROBABLE SOURCE
2 D ' ^ .D" D Dg-^'HD + D
30 DCO"^
46 DCOO"
60 co;
62 Dco;
DCO
DCOOD;COOD
D2C03;C03
DgCOjlDCOj
DCO DESORBED
CO2 + D2 ^DCOOD
D2O + 002^^ )2003
DgO +C02^M)2C03
339

The reaction of Dg + COg vas investigated in an extensive series of experiments. The formation and desorption of species containing D, C, and 0 vas deduced. To determine the configuration of the intermediates, all of the positive and negative ions produced from neutral species during the course of the reaction vere Identified. The results are given in Figure 6.
The positive and negative ions appeared to be derived from tvo structural classes of neutral species, namely, a carbonate type giving rise to DCOT" and COj" and a formic acid type giving rise to DCOO" and DCO^. Since the behavior of the catalyst vith respect to these ionic species had been determined, it seemed reasonable to determine whether or not the catalyst presented the same behavior vhen exposed to a stable compound having either the formic acid or carbonate type configuration. The test vas restricted to the use of formic acid labelled with deuterium on the carbon atom. The behavior of the radicals displaced from the surface of the catalyst was oompletely analogous to that in the earlier experiments.
We simply wish to emphasize here that the major portion of the information found useful in a study of the transient species desorbed from a platinum catalyst in the course of the heteregeneous reaction of I^ and COg came from an investigation of the negative ion spectrum.
Mixture of (CIljp + Xe
Some years ago lind and Bardwell shoved that the rates of radiolytic polymerization are, in general, increased by the admixing of noble gases. In most systems studied the rare gases had higher ionization potentials than the reactant gases and the increased rates of reaction were explained on the basis of charge transfer. In the (CN)2 + Xe system charge transfer to the reactant Is not energetically possible since Xe has the lover ionization potential, 12.1 ev against 13.6 ev for (CN)2' Hovever, llnd and Bardwell found that Xe Increased rather than decreased the yield of polymerization of cyanogen.
Melton and Rudolph investigated the transient species produced in the (CN)2 and (C N ) 2 + Xe systems and part of their observations are summarized in Figure 7- When Xe vas admixed vith (CH)2 the total intensity of negative ions vas markedly Increased. For example, in a 9Xe: l(CW)2 mixture, the intensity of (CN)" was increased about twenty fold. This Increase in negative ion intensity is attributed to two processes: One, ionization by secondary electrons from Xe, and tvo, a reaction of metastable Xe* (5p^6s) vith (CN)2 "to form CN radicals vhich are subsequently ionized.
The increased intensity of negative-ion polymers plus a reaction addition complex [Xe(CH)2]^ observed in the positive ion spectrum are believed to be the explanation of the previously observed increased rate of polymerization of (CII)2 upon the admixture of Xe.
1 2 3 k 5 6 7 8 9
10. 11.
References
H. M. Rosenstock and C. E. Melton, J. Chem. Phys., 26, ^ i k (1957). C. E. Melton and H. M. Rosenstock, J. Chem. Fhys., iS, 567 (1957). C. E. Melton and G. F. Wells, J. Chera. Phys., 27, 1132 (1957). G. F. Wells and C. E. Melton, Rev. Sci. Instr., 28, IO65 (1957)-Gus A. Ropp and C. E. Melton, J. Am. Chem. Soc.,~Bo, 3509 (1958). C. E. Melton, G. A. Ropp and T. W. Martin, J. Phys. Chem., 6k , 1577 (1960). C. E. Melton and P. S. Rudolph, J. Chem. Phys., , llt85 (1959)-C. E. Melton, J. Chem. Phys., 2i> 1'751 (196I). S. C. Lind, D. C. Bardwell and J. H. Perry, J. An. Chem. Soc, kQ, 1556 (1926). S. C. Lind and D. C. Bardvell, J. Am. Chem. Soc, M , 1575 (192FJ. C. E. Melton and P. S. Rudolph, J. Chem. Phys., , 1591)- (I960).
340

UNCLASSIFIED OflNL-LR-Dwg. 4B446
Figure 7
POLYMER-ION MASS SPECi HA
\
26
52
78
104
130
156
182
208
234
260
OF (CN)2 AT 1 mm
FORMULA
CN
(CN)2
(CN)3
(CN)4
(CN)5
(CN)6
(CN)7
(CN)8
(CN)9
(CN),o
INTENSITY + lonxlO"' -lon
2.5 X 10®
9.0 X 10^
1.6 X 10®
52 X I0'°
6.0 X lO'*
1.2 xlO®
4.7 X lO'
l.l X 10'
1.0 X lO'
2.2 X 10'
24 X10®
1.9 xlO^
1.3 X 10®
2.0 X10®
4.5 X 10°
3.1 X 10°
5.4 X 10*
37 X 10
3
5
-
341

Bruce Steiner Michael L. Seman . Levis M. Branscomb
Atomic Physics Division, National Bureau of Standards, Washington 25, D. C.
Photodetachment of I Ions has been observed in a crossed beam experiment. The apparatus used was essentially similar to thac in previous photodetachment experiments. Use of four Sharp Cut filters provided good "effective" resolution close to threshold but did not permit an independent determination of the behavior of the cross section as a function of wavelength. A step function cross section, shown by Berry and co-workers to approximate closely the true cross section behavior, was used to provide an upper energy limit to the electron affinity shown to be close to the actual value. The value of the electron affinity thus determined, 3.076 ± .005 ev, is in excellent agreement vith the shock wave determination of Berry, 3.075 ± .003. The absolute magnitude of the cross section in the region 0.3 ev above threshold was determined to be 2.1 1 1.1 x lO'^'cm^.
INTRODUCTION
Until recently, the electron affinities of the halogen atcms have been regarded as rather well determined^. Confidence was encouraged by the fact that the various values determined generally agreed with one another within typical uncertainties of 0.10 ev, as listed in Table IV.
However, a recent series of shock wave experiments by R. Stephen Berry and co-workers^ has yielded a set of photon absorption thresholds for Cl", Br" and I" consistently lower by about 0.10 ev than the previously accepted values. These spectra are especially noteworthy in that they are the first absorption spectra of negative Ions ever obtained in which the absorption of the light is observed spectroscopically. The chief uncertainty in the experiments of Berry and co-workers is the accuracy with which the lowering of the threshold energy by Debye-Huckel effects in the shock wave plasma can be estimated.
The present crossed-beam experimental study of the photodetachment of electrons from I" represents an effort (1) to determine the threshold energy for photodetachment of free I" Ions independent of plasma effects, and (2) to determine the absolute magnitude of the cross section In the region of the threshold. The absolute magnitude of the crosa section can be used in the shock wave experiment to give directly the negative ion densities in the shock wave. This Information can then be used in the calculation of the Debye-Huckel correction to the observed absorption threshold, which Is required to convert this threshold energy to the free state electron affinity of iodine.
This research was supported in part by the Office of Naval Research and the Advanced Research Projects Agency, Department of Defense.
* Present address: Joint Institute for Laboratory Astrophysics,
University of Colorado, Boulder, Colorado.
342

Table I. Filters used in threshold measurement
Filter Identification Coming Number Transmission less than 17.
(M) for X greater than: (A)
A 3389 + 3391 4025 B 3391 3997 C 3389 3980 D 3060 3730
Table II. Experimentally determined relative photodetachment probability,? M
Filter Identification P Standard Deviation Total Uncertainty (M) " (7.) (7.)
A .28 5k 55 B 1.36 6 12 C 3.66 14 17 D 43.5 9 13
Table III. Electron affinity of atomic iodine as determined in this work
Standard Total Standard Total X Deviation Uncertainty hv Deviation Uncertainty (A)° (A) (A) (e?) (ev) (ev)
+4 +6 - .,, -.003 -6 -7 3.076 ^_op^ +11 +15 3_„„ -.008
^C^^D
' ' B ^ ^ C
^A^^B
4031
4036
4057
19 -32 +.014
43 >4-43 , . „ >-.032 32 -35 +.024
+
-+
+
.005
.012
.024
.032
.027
Wavelengths (X ) and equivalent electron affinities (hv ) corresponding to the threshold.for photodetachment deterrained by ratios of signal (P ) using various filters (M) and a step function cross section.
343

EXPERIMENTAL PROCEDURE
The apparatus used was essentially similar to that in previous photodetachment work^^^. I ions were formed in a hot cathode arc discharge through a mixture of iodine vapor and ammonia. The negative ions were extracted from the ion source, accelerated, and mass analyzed by a 90° sector magnetic field. After deceleration, the beam entered the reaction chamber, where it intersected a chopped photon beam which photodetached electrons from the ions. These electrons were detected by an electron multiplier and the signal amplified, synchronously detected, and integrated for periods up to 50 sec. A 1000 watt dc xenon arc discharge lamp replaced the carbon arc of earlier experiments. The consecutive introduction of four Sharp Cut filters, listed in Table I, provided the information concerning the wavelength dependence of the cross section.
When adjusted to transmit I , the mass analyzer was capable of full resolution of one part in 15. The most_likely possible contaminant in the "resolved" beam is thought to be HI . However, the closed shell-plus-one structure of such an ion, analogous to that of noble gas negative ions, is considered to be unstable; almost certainly, HI constitutes a negligibly small fraction of the beam, if indeed HI exists at all.
The procedure for the measurement of the photon flux differed from that of previous photodetachment experiments. Before performance of the present photodetachment experiments, a section of the reflected arc light was focussed on the slit of a small prism monochromator which was fitted with a thermocouple detector and previously calibrated for response as a function of wavelength by an "NBS Standard of Spectral Radiance"^. The average of three wavelength scans, corrected for monochromator-detector sensitivity, was taken to be representative of the relative spectral radiance of the xenon lamp within the 10 percent intensity fluctuation of the source. For the photodetachment experiment, the fixed fraction of the total light reaching the monitoring bolometer was filtered so that the bolometer received light only in the region \<4850 A, The bolometer was then used to measure fluctuations of the light in this wavelength region during the course of the experiment. The light output of the xenon lamp varied no more than 10 percent during a period of several minutes while the current through the lamp was maintained at 41.2 ± 0,2 amperes.
The transmission of each of the various filters was measured independently by the NBS Photometry and Calorimetry Section.
EXPERIMENTAL RESULTS
Threshold Energy
The direct experimental results are listed in Table II as signals in arbitrary units for each of the filters. Each result represents the average of five or six individual determinations. The uncertainties are listed both for the standard deviation assuming random errors only and also as total uncertainties for systematic as well as random errors.
The threshold energy determinations in Table III were made in the following manner. When time-varying factors are removed, the photodetached electron current with filter M in place is given by the equation.
P M " ^^Z^'^'^) '^M^^^ ""^ ^ - ^ ^ Since the geometrical factor, k, is independent of the particular filter used, the measurement of ratios of Pw's for the various filters of known transmission, T (X), together with measured values for the source radiance, cp'(X), permits determination of the threshold energy if the shape of the cross section, o i X ) , is known. The curves representing cp'XTw as a function of wavelength for the various filters are shown in figure 1. Although the wavelength differences in the transmission limits of the various filters used in these experiments were far less than in previous crossed beam experiments, with a resulting increase in "resolving power" at threshold, the relatively small number of filters did not permit a precise independent determination of this threshold shape.
344

370
Figure 1, PhoCon density per angstrom, cp'XT in arbitrary units, as a function of wavelength, Eor Light from xenon arc lamp with each of four filters used In the determination of the threshold Eor photodetachment oE electrons from 1'.
350 4 0 0 450 500 m/i.
Figure 2. Photon density per angstrom. tp'XT in arbitrary units^ as a function of wavelength, for light from xenon arc Lamp with filter combination "E", used tn the determination o£ the absolute cross section for photodetachment of electrons from I .
345

]/2 ? of the cross section to be represented by the series a ~ aE ' (b+cE+dE ..,) where E is the ejected electron kinetic energy, i.e, (hv-E^) where hv is the photon energy and EQ is the threshold energy. Although the relative magnitude of the higher order terms is not determined by first principles, a fit of previous experimental-data for oxygen and carbon^ has proved possible over about 0,3 ev energy range with the predicted infinite slope at threshold and two or three series terms. In contrast to the work on those negative ions, the experiments of Berry et al. show that the threshold behavior for I approximates a step function, infinite slope at threshold and constant cross section above. Thus for I , many higher order terms are necessary to describe the cross section as obaerved by Berry in the above series, even in the first 0,3 ev.
Berry's observations also show that there are no strong absorption lines near threshold due to photoexcitation followed by autodetachment. Although the exact shape of the absorption cross section is obscured by Debye-Huckel effects, the curve is observed by Berry to rise monotonically (and nearly as a step function) within 0.3 ev of the threshold. It follows that the use of a step function, instead of a more slowly rising function in the determination of the threshold energy from our beam experiment, provides an upper limit for the iodine electron affinity. The integration in equation (1) with a step function cross section reduces to an integration of the experimental function shown in Figure 1:
T a=o
Pj = k r cp'(X) T^ (X) X dX
The upper limit of this integration i s the threshold to be determined. The upper limit in energy we thus obtain is 3,076 ± .005 ev. This value is to be compared with Berry's uncorrected experimental value, 3.070 ± 0.003, which is a lower limit in energy.
The main systematic error in this work is undoubtedly the 107o uncertainty in the spectral radiance, cp'(X). Compared to this, other factors can be neglected. Thus, the uncertainties in the last column of Table III include this I07e in each P in addition to the standard deviation of the various P., values of assuming random errors,
M
Absolute Cross Section o
The magnitude of the cross section between threshold and 3600 A has been measured relative to the absolute magnitude of the cross section for photodetachment of H~ between 4900 A and 3600 A . Figure 2 shows cp' T as a function of wavelength for filter "E" used in this measurement. The absolute cross section magnitude thus determined for a step function is (2.1 ± 0.5) X 10" cm . This error limit is again the standard deviation assuming random errors.
The difference in area under the true cross section curve from that under a step function from threshold to 3600 A probably is not more than 10 percent. Systematic errors due to beam inhomogeneity probably are not greater than the range of statistical error. Hence, the total uncertainty may be ± 50 percent. _, . 2
The absolute cross section, 2.1 ± 1.1 x 10 cm has been used by Berry and co-workers to arrive a t an ion densjty for I . This density leads them to a Debye-Huckel correction of 6 A, or an electron affinity of 3.075 ± .003 ev. A summary of this and other determinations of the electron affinity of atomic iodine appear in Table IV,
ACKNOWLEDGMENTS
We are grateful to Professor R, Stephen Berry for his sharing his experimental data with us prior to publication. The careful measurement of the transmissions of the various filters by John Schleter of the Bureau of Standards was essential to this work. Dr, Herbert P, Broida, of the Bureau of Standards, has also been most helpful.
346

Table IV. Determinations by various workers of the electron affinity of atomic iodine
Method Value (ev) Worker
Surface ionization
Surface ionization
Lattice energies
Photoionization
Shock tube photodetachment (lower bound) (corrected)
Crossed beam photodetachment
(upper bound)
3.23 ± 0.02 (assuming A(Br) = 3.50)
3.17 ± 0.07
3.19 ± 0.06
3.13 ± 0.12
3.070 ± 0.003 3.075 ± 0.003
3.076 ± 0.005
Bakulina and lonov,
Bailey
Cubiciottl
Morrison et_ al_
Berry, Reiman, Spokes Berry, Reiman, Spokes
This work
I. N. Bakulina and N. I. lonov, Doki. Akad. Nauk SSSR, 105, 680 (1955). OT. L. Bailey, J. Chem. Phys., 28, 792 (1958). ^D. Cubicciotti, J. Chem. Phys. 34, 2189 (1961). °J. D. Morrison, H. Hurzeler, M. G. Inghram, and H. E. Stanton,
J. Chem. Phys. 33, 821 (1960). ^R. S. Berry, C. W. Reiman, and G. N. Spokes, J. Chem. Phys. accompanying
paper.
REFERENCES
1. T.Ii. Bailey, J. Chem. Phys. 28, 792 (1958). 2. R. Stephen Berry, et al, J. Chem. Phys. 35, 2237 (1961); Bull.. Am.
Phys. Soc. 7j 69 (1962). 3. S. J. Smith and L. M. Branscomb, Rev. Sci. Inst. 31j 733 (1960). 4. M. L. Seman and L. M. Branscomb, Phys. Rev. (March 1, 1962). 5. R. Stair, et al, J. Research Nat'l. Bur. Standards, 64A, 291 (1960), 6. L. M. Branscomb, et al, Phys. Rev. 111. 504 (1958). 7. T. John, Mon. Notices Roy. Astron. Soc. 121, 41 (1960).
347

Measurement of Electron Capture Cross Sections Using Swarm Methods
G. S. Hurst Health Physics Division ,,,
Oak Ridge National Laboratory' Oak Ridge, Tennessee
(*0perated by Union Carbide Corporation for the U. S. Atomic Energy Commission)
I. INTRODUCTION
In the experimental studies of the formation of negative ions, electron swarm methods appear to have a definite role. In the swarm method electrons make many collisions with the atomic and molecular gas through which they move under the action of an applied electrical field, and unlike in beam experiments, they have a wide distribution of kinetic energy. This disadvantage concerning the spread of electron energies does not preclude the following applications of swarm experiments: 1) in spite of the wide spread in electron energies, careful analysis of swarm data may give reasonably accurate total cross sections for electron capture; 2) swarm experiments may be performed over a wide range of average electron energies, e.g., thermal to greater than 10 ev, depending on the gas used and the magnitude of E/P (volts cm-1 (mm Hg)" ); 3) swarm experiments may be done at much higher pressures than beam experiments, hence collision processes may be examined for various atomic and molecular effects.
In the usual swarm method the types of ions formed are not determined, and the investigator must resort to theory or to mass spectrometry for this information. Hence, beam experiments which are not sufficient within themselves to determine all the information which is needed may be combined with mass spectrometer experiments to considerable mutual advantage.
In swarm experiments electrons are set free in a gas by various means, e.g., thermionic emission, UV irradiation, or gas ionization with energetic particles. Regardless of their energy of liberation, they come into an equilibrium energy which is characteristic only of the gas and E/P. This equilibrium distribution of electron energies is established as a balance between the energy gained from the electrical field and the energy lost by atomic or molecular collisions. Several swarm parameters are open to direct experimental measurement; among these are w, the rate of drift of the electron swarm in the field direction, W/D, where D is the electron diffusion coefficient, and a, the probability of electron capture per cm of travel in the field direction at unit pressure. From these measured quantities_one may derive other quantities of interest such as the average kinetic energy, £, the probability, h, of electron capture in a collision, and ir , the capture cross section. The reader is referred to Healey and Reed' for a comprehensive treatment of the electron swarm and for a valuable compilation of experimental data.
II. ELECTRON DIFFUSION EXPERIMENTS AND AVERAGE ELECTRON ENERGY
7 3 Several investigators have used various versions of the Townsend ' diffusion
apparatus to study the motion of electrons in gases; recent publications4,5 contain references to the earlier work. The method is based on a theoretical treatment of electron transport which considers simultaneous diffusion and electron drift due to the applied field. For example, if electrons are transported in the z direction due to an applied field in this direction, the differential equation expressing the time and space dependent density n is given by
1 3n _ 2 w 5n , .
where t is the time, and w and D are the drift velocity and diffusion coefficients, respectively. The steady state solution (i.e., 3n/9t = 0) of Eq. (1) has been worked out for boundary conditions appropriate to experimentally convenient geometries by Huxley and Bennett" and by Huxley and Crompton." Having obtained the solution for the electron density, one may write expressions for the current received by concentric collectors, and the experimentally measured ratio, R, of currents received by two collectors may.be used to calculate W/D. For example, consider a source located at the point where the z axis makes a normal i'ntersect icn with one end of an infinite slab of height, h, the other end of which contains two concentric planar regions of inner radius b and outer total radius c (about the z axis). Figure 1 shows a plotS of
348

UNCUSSIFIED ORNL-LR-OWG-69271
Coeff ic ient ky for the Druyvesteyn Dis t r ibut ion for Electrons in
N i tro^en, Carbon D ioxIde, Methane, Ethylene, and Cyclopropane.
E/p
Volts citi/njn Hg
0.2
0.4
0.6
0.8
1.0
1.2
1.4
1.6
1.8
2.0
2.5
3.0
3.5
4.0
4.5
5.0
Ni trogen
6.74
11.7
16.0
19.3
21.3
23.0
24.4
25.6
26.6
27.5
29.9
31.0
33.1
33.8
35.0
35.8
Carbon Dioxide
2.00
2.05
2.12
2.13
2.21
2.31
2.39
2.72
3.12
3.77
4.67
6.07
7.85
Methane
2.15
3.30
4.39
5.85
7.52
9.10
U.O
13.1
15.2
17.4
22.9
29.6
35.1
42.0
46.9
53.4
Ethylene
2.36
2.53
2.82
3.11
3.50
3.82
4.29
4.73
5.03
6.34
7.99
9.48
11.3
13.1
14.8
Cyclopropane
2.48
2.54
2.81
3.09
3.50
3.83
4.14
4.45
4.83
5.22
6.08
7.06
8.01
8.93
9.95
11.1
Table M. Evaluation of the Ratio wap/f(£) for Various Values of s.
An {E/P)-Independent Ratio Indicates a Solution to Eq. (9) .
E/P
O.UO
O.I45
0 . 5 0
0 . 5 5
0 . 6 0
0 . 6 5
0 .70
0 . 7 5
0
cm" (mm Hg)"
0 . 1 8
0 . 5 7
1.20
2 . 0
3-0
I 4 . I
5.3
6.6
-6 V . Q - 1 0
s e c " (mm Hg)
0 . 0 5 8
0 . 1 8 5
0 . 3 9 6 .
0 .670
1.02
1.1.1
1.86
2 .31 .
E l e c t r o n Energy (ev)
6.3
f ( t )
0.0022U
0 .00615
0 .0126
0 .0213
0 .0317
0.0U28
0.051*0
O.06W
..ayU)
2 5 . 9 X 10
3 0 . 1 X 10
31.1. X 10^
3 1 . 5 X 10^
32 .2 X 10
3 2 . 9 X 10^
3I1.I1 X 10^
36.2 X 10^
6.1l
f(<:)
0 .00161
0.001*72
0 .0102
0 .0179
0 .0273
0 .0377
O.OWli
0 .0589
v.ayf(c)
36,0 X 10^
39.2 X 10
38 .8 X 10^
37.lt X 10^
37.k X 10^
37.11 X 10^
38.ll X 10^
39-7 X 10^
6.5
f (0
O.OOllii
0 .00358
0 .00813
0.01119
0 .0233
0 .0330
0.01132
0 .0533
vayf(c)
5 0 . 9 X 10
5 1 . 7 X 10
l t8 .7 X 10^
I15.O X 10^
li3.B X 10^
I12.7 X 10^
l i3 .1 X 10^
1.3.9 X 10^
r (0
0 .000793
0 .00269
0.006113
0 .0122
0 . 0 1 9 8
0 .0287
0 . 0 3 8 3
0.01181
6.6
..ayu)
7 3 . 1 X 10
6 8 . 8 X 10^
5 1 . 6 X 10*
511.9 X 10
5 1 . 5 X 10^
I19.I r. 10*
I18.6 X 10*
I18.6 X 10*
349

^ - ' b l i ' h "*" i r ) 3S a func t i on of E h/k, f o r various r a t i o s , b /h , and fo r a f i x e d value
of c/h = 1.5. The c o e f f i c i e n t k j is re la ted to W/D by the equat ion,
w A 38.92 E/P 38.92 E/P * ,-,. DP " k j " k.|. *'^'
where A = 1 fo r the Maxwellian d i s t r i b u t i o n and A = 1.14 fo r the Druyvesteyn d i s t r i b u t i o n . The Townsend c o e f f i c i e n t , k j , is a convenient measure of the average k i n e t i c energy of the e lec t rons , usua l ly ca l led a g i t a t i o n energy, and is def ined as f o l l o w s :
Electron A g i t a t i o n Energy . , , T Molecular A g i t a t i o n Energy at 25° C '
C lea r l y , k- is a f unc t i on of E/P since the k ine t i c -energy fo r molecules is unaffected by the e l e c t r i c a l f i e l d , and the a g i t a t i o n energy fo r e lec t rons genera l ly increases w i th E/P. Of the two d i s t r i b u t i o n f unc t i ons , i . e . , Maxwellian or Druyvesteyn, i t should be said that the l a t t e r is genera l ly more meaningful s ince i,t is der ived from the Boltzman t ranspor t equat ion and is app l i cab le to e lect rons under the in f luence of an e l e c t r i c a l f i e l d .
The d i f f u s i o n apparatus used by Cochran and Forester has been described in cons iderab le d e t a i l . 5 Figure 2 is a schematic diagram of the d i f f u s i o n chamber in which h was held constant a t 3 cm, b could be set at 0 .3 , 0 .6 , 0 .9 , or 1.5 cm, and c was held constant a t 4.5 cm.
Table I summarizes the Townsend c o e f f i c i e n t k j f o r e lec t rons in n i t r ogen , carbon d i o x i d e , methane, e thy lene, and cyclopropane. These are based on d i f f u s i o n measurements of W/DP and Eq. ( 2 ) . I t is noted that the average e lec t ron energy corresponding to these k j values covers the range from about 0.08 ev to 2.0 ev, depending on the gas and E / P .
I I I . THE DISTRIBm'ION OF ELECTRON ENERGIES IN ARGON
Ho ls te in° has shown that the d i s t r i b u t i o n o f energies fo r e lec t rons making e l a s t i c c o l l i s i o n s in a gas may be obtained from a s o l u t i o n of the Boltzman t ranspor t equat ion. This theory has been appl ied by Barbiere? to He and Ar and the connection between the energy d i s t r i b u t i o n and d r i f t v e l o c i t y was shown. Figure 3 shows the d r i f t ve l oc i t y in Ar as measured by Bowe and by Bortner e t a l . " Bowe'^ has shown tha t measured d r i f t v e l o c i t y as a f unc t i on of E/P (P is the pressure normalized to 25° C) gives a basis f o r es t imat ing the t ranspor t cross sect ion f o r Ar as a f unc t i on of e lec t ron energy. The t ranspor t cross sect ions so obtained are in general agreement w i th the Ramsauer-Kollath data;- '- ' thus, the e lec t ron energy d i s t r i b u t i o n s der ived from t ranspor t theory are cons i s t e n t w i th the experimental d r i f t v e l o c i t i e s . Figure 4 shows some of the d i s t r i bu t ion funct ions fo r Ar at a few values o f E / P . ' ^
IV. MEASUREMENT OF ELECTRON CAPTURE CROSS SECTIONS WITH SWARM EXPERIMENTS
One example o f an e lec t ron swarm experiment f o r the measurement of the attachment c o e f f i c i e n t , a , is shown schemat ical ly in F i g . 5. In the apparatuslS the motion o f f r ee e lec t rons is examined in two chambers having a common atmosphere. In one case the "pu lse he igh t " due to the work done by the e l e c t r i c a l f i e l d in t ranspor t ing f ree e lec t rons ( l i b e r a t e d by alpha p a r t i c l e ion iza t ion) in the f i e l d d i r e c t i o n is measured w i t h a pulse a m p l i f i e r . In the other case the d r i f t v e l o c i t y is measured. From these two q u a n t i t i e s , a is ca l cu l a ted .
I t has been shown'^ that the time-dependent change in p o t e n t i a l g ( t ) of the c o l l e c t o r p la te of a plane i on i za t i on chamber of separat ion d cm, due to f ree e lectrons moving through the chamber, is given by
g ( t ) = ( A / f ) [ l - exp(- f t / x g ) ] (4)
350

E h / k. vo l t s
F i g . 1 . Curves Showing t h e E l e c t r o n C u r r e n t R a t i o R as a F u n c t i o n o f E h / k j f o r
S e v e r a l Va lues o f b / h .
UNCLASSIFIED O R N L - L R - D W G . 52787R
PRESSURE GAUGE
I
" " I H J J I l l l ^ A^ c
TO VACUUM PUMP
a&=
2 V 3
'TTnT'
VARIAC
IO
= ^
-1.5 KV
, 0 T 0 ( - ) 5 0 0 *• V.D.C. POWER
g j l lPPI Y
FIELD POWER
SUPPLY
P TO GAS INPUT
ELECTROMETER
F i g . 2 . Schemat i c D iagram o f t h e E l e c t r o n D i f f u s i o n Chamber
351

where A is a constant , T . is the c o l l e c t i o n time of f r ee e lec t rons , and f = In th i s expression a is the attachment c o e f f i c i e n t fo r e lect rons def ined by
a f j P d .
dN CKNfiPdx (5)
where -dN/N is the f r a c t i o n of e lectrons captured In moving dx in the f i e l d d i r e c t i o n and f jP is the pressure of the a t tach ing gas, re fer red to a standard tennperature o f Z5° C- I f the pulse is examined w i th a pulse amp l i f i e r of equal d i f f e r e n t i a t i n g and In tegra t ing time constants (both equal to t j ) , the output pulse of such an amp l i f i e r Is given by
v(,) = r datii i T ^ ^-(T-t)/ti ^ J d t t l
(6)
/ " ' / ' 1 where t / t , e is the response of the a m p l i f i e r to a step f u n c t i o n .
Using Eq. (4) for g ( t ) , the expression given in Eq. (6) fo r V ( T ) becomes fo r T < Tr,
V(-r) = Ae
Vt,
( v ^ f ) exp(uT) (7a)
and fo r T > TQ
V(T) = A exp(- T / t )
( V ' i f > {exp(uTQ)- l }T
-exp(uTQ)( Tg - l ) - I (7b)
where u = ( T „ - t f ) / t , T „ , and where T„ is the co l l ec equal to wD. Equations (7a) and (7bJ have been eva i . e . , the maximum value of V ( T ) fo r T ^ t , = 0, 1, 2 With experimental values fo r Tn and the pu
t i o n time f o r f ree e lec t rons and is luated to f i n d the "pu lse he igh t " , , 3, 4 , and 5 as a func t ion of f . l 6
pulse he ight , f and 0! may then be ca l cu la ted .
The apparatus i l l u s t r a t e d in F i g . 5 has been app e lec t ron cap tu re . i n H2O vapor. To obta in e lectrons d i s s o c i a t i v e capture takes place in many molecules, molecular gases...in Ar. Figure 6 shows the pulse-he amounts of water vapor were mixed w i t h Ar at 400 mm mixtures of Ar and water are shown in F ig . 7. Frcm c o e f f i c i e n t s a were ca lcu la ted and are shown in F ig E/P values is p lo t ted as a func t ion of the r a t i o of pressure, f2P.
l i ed to the study of d i s s o c i a t i v e in the energy range where i t is convenient to mix these
ight data obtained when var ious Hg. D r i f t v e l o c i t y data f o r these data the attachment
. 8. In th is f i g u r e , a f o r various water pressure, f jP , to Ar
From F ig . 8 i t is seen that a i s , w i t h i n experimental e r r o r , independent of t o t a l pressure but depends s t rong ly on the r a t i o f jP / f 2P . This suggests tha t the e lec t ron energy d i s t r i b u t i o n in Ai- is inf luenced by water , and that an increase in f i P / f z P decreases the number of e lec t rons in the range where d i s s o c i a t i v e capture takes p lace. I t seems reasonable to expect that the l i m i t i n g values of cc as ^-^ l^z!^ approaches zero,
QQ, are to be associated w i t h the e lec t ron energy d i s t r i b u t i o n of pure Ar. Thus we can w r i t e ag ' " terms of the capture cross sec t i on , o" (e) , a t energy e as f o l l o w s :
No(2/m)2
w(E/P) / e^ <r^(e)f de (8 )
3 5 2

UNCLASSIFIED ORNL-LR-DWG-69273
ARGON
g o . 4
g
^ ^ / ^
BORTNER, HURST Q STONE -
BOWE
.2 .4 .5
E/P [(VOLTS cm'' (mm hg)"']
Fig. 3. D r i f t Velocity in Ar as Measured by Bowe and by Bortner, Hurst, and Stone
0 . 9
0 . 8
0 . 7
0 . 6
0 . 5
0 . 4
0.9
O.l 0 . 0 9 0 . 0 8 0 . 0 7 0 . 0 6 0 . 0 9
0.04
Sii ~ 0 . 0 2
O.OI 0 . 0 0 9 o.ooe 0 . 0 0 7
0 . 0 0 6
O.OOS
0 . 0 0 4
r f -
^ [ N ^ -—— \
ARGON
^*>_ . \ >
\ \
E/P'02o\
^^^r—
,E/P-0.3o\
\
1\ \E/P=.Q
\
E/P-I.OO
\
E/P.0.60
E/P-0.50
\
*2\ \
\
I 2 3 4 9 6 ELECTRON ENERGY,6
Fig. 4. D is t r ibu t ion Functions for Ar at Various Values of E/P
.8
353

where f(e, E/P) is the normalized energy distribution function for electrons in pure is the electron drift velocity in Ar, m is the electron mass, and NQ is the
where f(e, Ar, W(E/P)
number of water molecules per cm^ at 1 mm Hg.
Considering the fact that the mass spectrograph data and a beam experiment show a fairly narrow peak for the formation of H" and that in all such experiments the electron beam has an appreciable spread in energy, it is reasonable to select a strongly peaked function as a trial solution for o- (e) in Eq. (8). Hence,
/ E \ No(2/m)2 JL -: y t x p
° ^ P w(E/P) ^ " ^ P - „
E (£)d£ (9)
where e, is the energy at which the capture cross section peaks. Since the various observers are not in agreement on the energy at which the cross section peaks, we consider £] as a variable and find a value which satisfies Eq-. (9) for the experimental range of E/P. Tabulations of wao/f(e) for various electron energies e are shown in Table II. In these tabulations the drift velocity w for Ar was taken from Bortner, Hurst, and Stone." The values of the electron energy distribution function for Ar are those given in Section III. It is seen frora Table li that if we let ej = 6.3 or 6.5, the fit to Eq. (9) is less accurate. The magnitude of the cross section integral
00
,(e)d£
corresponding to e j = 6.4 ev is 7.7 x 10" ' ° cm ev. The magnitude of A and the energy where the cross sect ion is a maximum, e , , der ived in t h i s way compared favorably w i th the resu l t s obtained by Buche l 'n ikova .^ I From the curve publ ished by Buchel 'n ikova, one may est imate e^ = 6.4 ev and A = 6.5 x l O " ' ^ ^,^2 ^ i .
The above discussions i l l u s t r a t e the use of swarm experiments to ob ta in absolute cross sec t ions , i . e . , app l i ca t i on (1) in the i n t r o d u c t i o n . S i m i l a r l y , good agreement has been found between beam exper iments^ ' and swarm measurements'5,17 fo r the cross sec t ion f o r e lec t ron capture to form 0" due to i n t e r a c t i o n w i t h 02- F i n a l l y , l e t us re fe r to the app l i ca t ions of e lec t ron swarm experiments to (2) and (3) in the i n t r o duc t i on . For example, i t has been found^^ tha t fo r mixtures conta in ing small amounts of O2 in N2, a depends both on the pressure of O2 and of N^. In t h i s case the average e lec t ron energy ranged from about 0.4 ev to 0.8 ev, corresponding to the E/P range 0.2
llf to 0.8 (see Table I ) , and thus unstable O2, i . e . , (O^ is formed by d i r e c t capture.
I t was found that the cross sect ion fo r s t a b i l i z a t i o n of O, by a c o l l i s i o n w i t h OT, o-j,was 3 X 10"15 cm^ and w i t h N2, <TZ " ^^ ^ " 10" ' ^ cm^. Tnese widely d i f f e r i n g cross sect ions are cons is tent w i th the idea that o-j corresponds to the t rans fe r of e l ec t r on i c e x c i t a t i o n and that tr-i corresponds to v i b r a t i o n a l t r a n s f e r , and t h i s in tu rn
- * 4_-suggests tha t 0 , is i n i t i a l l y the T; l e v e l .
354

UNCLASSIFIED ORNL-LR-DWG 2 ( 0 0 8
1-LITER CHAMBER
ATTACHING GAS INLET
TO PRESSURE GAUGE -
TO VAC. PUMP
-22.9 MEGOHMS
MOTOR DRIVEN BASE LINE
AIA PRE AMP
A-l LINEAR
AMP
SINGLE CHANNEL ANALYZER
RATE METERI
A 1 BROWN 1 IRECORDERI
GAS PURIFICATION I / ~ ' SYSTEM l = =
NON-ATTACHING GAS INLET
F ig. 5. Electron Attachment Apparatus
UNCLASSIFIED ORNL-LR-DWG. 5Z745
70 •
I 50 •
3 0 -
2 0 -
PURE ARGON
f P I mm Hg)'" 0.022
=0.056
0.2 0.3 0.4 0.5 0.6
E/P [ V O L T S cm" ' (mm H g P ' ]
0.9
Fig. 6. Pulse Height vs E/P for H^O-Ar Mixtures (400 nm Hg)
355

REFEI^ENCES
1. R. H. Healey and J. W. Reed, The Behavior of Sloi Electrons in Gases (The Wireless
Press for Amalgamated Wireless Ltd., Sydney, Australia, 1941).
2. J. S. Townsend and V. A. Bailey, Phil. Mag. 44, 1033 (1922).
3. J. S. Townsend, in Electrons in Gases (Hutchinson's Scientific and Technical Publi
cations, New York, 1948).
4. L. W. Cochran and D. W. Forester, Phys. Rev. (to be published).
5. D. W. Forester and L. W. Cochran, "Diffusion of Slow Electrons in Gases," ORNL-3091,
Sept. 29, 1961.
6. L. G. H. Huxley and F. W. Bennett, Phil. Mag. 30, 396 (1940).
7. L. G. H. Huxley and R. W. Crompton, Proc. Phys. Soc. B68, 381 (1955).
8. T. Holstein, Phys. Rev. 70, 367 (1946).
9. D. Barbiere, Phys. Rev. 84, 653 (1951).
10. J. C. Bowe, Phys. Rev. U 7 . '411 (I960).
11. T. E. Bor tner , G. S. Hurst , and W. G. Stone, Rev. S c i . I n s t r . 28, 103 (1957).
12. J . C. Bowe, Phys. Rev. _n7, 1416 ( I960 ) .
13. C. Ramsauer and R. K o l l a t h , Ann. Physik _I2, 837 (1932).
14. For a complete t a b u l a t i o n , see R. H. R i t ch ie and G. E. Whi tes ides, "Equ i l i b r i um Electron D i s t r i b u t i o n s in E l a s t i c a l l y Scat te r ing Gases," ORNL-3081, June 2, I 9 6 I .
15. T. E. Bortner and G. S.Hurst, Health Phys. J., 39 (1958). 16. The o r i g i n a l pub l i ca t i on (Ref. 15) contained er rors f o r T Q / I J > 2 which have sub
sequently been corrected and reported by H. B. E ld r idge , "Pulse Height Calcul a t i ons f o r a P a r a l l e l P late Ion iza t ion Chamber Containing Elect ron At tach ing Gases," ORNL-3090 ( t o be p r i n t e d ) . This repor t contains a de ta i l ed tabu la t i on of the pulse he igh t as a func t ion of f f o r var ious values o f - ^ J t , .
17. G. S. Hurst , L. B. O 'Ke l l y , and T. E. Bor tner , Phys. Rev. 123. 1715 (1961).
18. W. W. Loz ie r , Phys. Rev. 36, 1417 (1930).
19. M. M. Mann, A. H u s t r u l i d , and J . T. Tate, Phys. Rev. 58, 340 (1940).
20. M. C o t t i n , J . Chim. Phys. 56, 1024 (1959).
2 1 . I . S. Buchel 'n ikova, Soviet Phys. JETP 35(8 ) , 783 (1959).
22. G. S. Hurst and T. E. Bor tner , Phys. Rev. 114, 116 (1959).
356

UNCLASSIFIED ORNL-LR-DWG 52746
0.3 0.4 0.5 0.6
E /P [ V O L T S cm~' (mmHg ) - ' ] 0 8 0.9 1.0
Fig . 7. Electron D r i f t Veloc i ty in H^O-Ar Mixtures (400 rm Hg)
2 3 4 5 PRESSURE RATIO f |P / f jPx lO*
F ig. 8. Attachment Coef f ic ient a as a Function of the Ratio of H.O Pressure to Ar Pressure for Various Values of £/P.
357

A Mass Spectrometric Investigation of Secondary Reactions in Mixtures Containing Mercury Vapor.
si /
V. Cermak and Z. Herman
Institute of Physical Chemistry, Czechoslovak Academy of Sciences, Prague
This paper deals with the first results of an investigation of
the reactivity of ions and neutral excited particles in mixtures contain
ing vapors of metals. We started this work at the Institute of Physical
Chemistry of the Czechoslovak Academy of Sciences in Prague, hoping to
obtain valuable data in a field hitherto quite unexplored. The data for
such reactions--which occur, for example, in mixtures containing mercury
vapor--might be of importance in gaseous electronics, in radiation chemistry
(Hg atoms are reported to act in some cases as lon scavengers (Newton and
Mains, I961) ), or in the theory of ion-molecule reactions and Interactions
of excited neutral species.
We have been studying the reactions occurring in mixtures of
mercury with the noble gases, Og, Ng, COg, H20, NH,, CHj , CgHg, CjHQ,
CgHg, and CH5OH. An ordinary mass spectrometer of the Nier type was
used; it was equipped with a sensitive vibrating reed amplifier so that
minimum currents of 5.10" a could be measured.
The reactions occurring in the mixtures are of two types. To
the first type belong reactions between two neutral particles, one of
which is in eui electronically excited state. In the reaction a charged
addition product is formed and an electron is released. This type is
analogous to the reactions forming Csg ions in vapors of Cs, (Mohler
and Boeckner, 1930), Arg ions in Ar (Tuxen, 1956), (Arnot and M'Ewen,
1958)) or XeCHij"*" ions in mixtures of Xe and methane (Field and Franklin,
1961).
In mixtures of mercury with noble gases (Table I) the reacting
excited particle can be identified, by measurement of the appearance
358

F W a OJ
+ w m
+ 00 tr]
^
+ + + tJO + + tiO t<) t * to
OD M td to ra cu ta to o rA J - to
w c\j CM ra ra CVJ to
•^00
a o
o
U 4^
te c 0) 0) p. 4^ P. O < "-P.
tc
ra +
S
00
w
+
* S
OJ
> u Qi 01
•P O
OJ
> 01
-P
B
00
to
+
* OJ
* * to m
+
a~
00
w
+
o
+ t £
ra +
K
B "^
% " ^ 1
QJ
1 2
OD
ra -F
0)
00
ra + S
00
m + ^
bO
ra + OJ
00
ra •F
HI
w
CO
ra -F
<M
a
t30
ra i . «^
tc w +.0 i
to to t.-e
to to -F
4:
w ra 4-
s
359

potential of the reaction product, as an excited noble gas atom. This
is so even if the excitation energy is higher than the ionization potential
of mercury (10.43 V: Table I, reaction No. 3).
In mixtures of mercury vith molecules the secondary lone contain,
beside the mercury atom, the combined moleoule (Table I: reactions 7-11)-
The appearance potential of these secondary molecular ions is always lower
than the ionization potential of both particles. In this case the reacting
excited species are probably Hg atoms.
The current of secondary ions depends on the energy of exciting
electrons and exhibits a sharp maximum at an electron energy about twice
as great as the excitation energy of the primary particle (Fig. l). These
ciu-ves resemble the excitation function for optically-forhldden transitions,
but the peaks in Fig. 1 are not so sharp and are shifted towEirds greater
excitation energies. We tried to get more information about the nature of
the reactive particles using the 1 E,-log E. plot (l is the current of the
secondary ions, E is the energy of the exciting electrons). In these
coordinates both the ionization efficiency curves in electron impact spectros
copy and excitation efficiency curves in optical spectroscopy, corresponding
to allowed transitions, are (at E, »13.6 eV) straight lines witb positive
slope (Miller and Platzman, 1956). Deviations occur if the transition
violates either total spin or orbital momentum conservation rules.
The i E^-log Ej plot for ArHg'*' ions is shown in Fig. 2. If the
same considerations could be applied in the case of excitation by electron
impact as in excitation by photons, then the shape of the curve would indicate
the simultaneous participation of long-lived and. short-lived excited states
formed by optically forbidden and allowed transitions, respectively.
However, since very little is known about the shape of electron impact
excitation efficiency curves for transitions in which electron exchange
occurs, no definite conclusions can yet be drawn from a graph of the type
presented in Fig. 2.
360

UJ i i tl,
y OJ
o
CD
O
o
I I
.^
I I ^ z : ^ ' ^
1 ^
o
6
o i 0 i 60 I I p .5?
a ^ + C\ j
O O
^ •f-
J T i
g
^ +
£n o r
>» s.
361

nl FH
tr. t> c a D) -H
U 4 ^
i l HJ
o 6 i ? "?
+ + CO CO
ra^ to
F Nl tn
ra
+ «) ra ITN
K
-F 00
ffi .d-to
+ tui K-
362

Fig. 1:
Dependence upon electron energy (uncorrected) of lon current of
Hg"*" ion and of secondary ions ArHg"*", KrHg+, and XeHg+. The current
for a particular lon represents the sum of all isotopic contributions.
Ordinate heights are extended, for KrHg''' and XeHg'*', k x and 10 x,
respectively. Concentration of atoms in ionization chamber: Hg:
3.8 . 10^2 atoms/cm5, Ar: I.9 . IQ-'- atoms/cm', Kr: 1.2 . 10^5
atoms/cm^, Xe: 8 . 10 atoms/cm5.
/A
I I I
100 300400 C^
Fig. 2:
rependence of iEj upon log Ej (1 - lon current, E[ - electron
energy) for Hg lon and secondary lon ArHg'*'.
363

To the second type of reaction belong those in which ions take
part. Secondary ions and neutral particles are fonned in these ion-molecule
reactions (Table II). In the mixtures containing saturated hydrocarbons,
secondary ions vith one carbon atom are formed more readily than the ions
with two or three carbon atoms (see Table II). In sorae cases the secondary
ion HHg was observed. Its relative abundance is comparable to or greater
than the abundance of the raost frequent secondary ions in the given mixture.
However, it was irapossible to identify the primary reacting ions, because
the measurement of the appearance potential of HHg ions was very inaccurate
due to the great current of priraary Hg"*" ions.
Using the equation
Q = ig (ip n 1)-^ (1)
the reaction cross sections Q were calculated in some of the cases, and
the data are summarized in Table III. (in this equation i and 1 denote s p
the current of secondary and primary ions, respectively, n the concentration
of neutral reacting particles in 1 cm^, and 1 the distance between the
center of the ionzing electron beam and the exit slit of the ionization
chamber. ) One of the most frequent secondary ions is the CH Hg"'' ion. If
the value of the heat of formation of the CH Hg"*" ion, AHj- = l6o kcal/mole,
is used (Hobrock and Kiser, I962), the calculated energy of the (CHi - Hg)
bond is 102 kcal/mole. The bonrf is very strong and is comparable to the
strength of the CH2-H bond in the methane molecule (102 kcal/mole).
Table III.
Reaction Cross Sections of Several Ion - Molecule Reactions in Mercury Vapor.
Calculated from equation (l). Electron energy 75 eV, extracting potential l ^k V, ionizing
electron current 30 ua.
Mixture
Ar + H^
HgO
Og + Hg
HgO + Hg
CHj^ + Hg
Ar 4- H.,
Reaction
ArH
HgO 4- HgO = H,0
Hg 4- 0„
OH"^ +•• Hg
OHg"^
OHHg"^
OHg^
4- H
4- OH
+ 0
+ H
4- H
CH, 4- Hg = CH,H g' + H
CE - 4- Hg = CHgHg" 4- (Hg)
364
Reaction Cross Section
Q . 10 ^ cn?
99
69
3.6
2.1
1.6
2.0
1.2

Rare Gas Molecule-Ion Formation by Mass Spectrometry. Kinetics of Ar +, Ne +, and Hep+ Formation by Second and Third Order Processes
J. S. Dahler, J. L. Franklin, M. S. B. Munson, and F. H. Field Research and Development
Humble Oil & Refining Company Baytown, Texas
Summary
The ions Ar-+, Ne„+, and He„+, are formed in a mass spectrometer operated at
high pressures (up to 300 microns) by the bimolecular excited atom reaction R* + R =
R„ + e, and Ar„ and Ne are formed by the termolecular ion-molecule reaction R + 2R =
Rg + R. In helium, while He^ is formed by a third order process, there is doubt that
an ionic reaction is involved.
Ratios of the rates (cross-sections) for excitation leading to Rp formation
-2 -2 -2
and ionization are found to be 5-5 x 10 , 1.0 x 10 , and 6 .k x 10 for argon, neon, and
helium. The measurements were made at nominal electron voltages (EV) of 15, 20, and 22
volts, respectively, whioh correspond to maximum excitation. Values of l.U x 10 and
0 45 x 10 were also obtained at EV = 70 volts for argon and neon.
The experiments yield only the product of the bimolecular rate oonstant and the
lifetime of the R* reactant atom (k T ), and the values of this product obtained at EV =
15, 20, and 22 volts are for argon, neon, and helium 3.6 x lO" , 11.6 x lo" , and
0.58 X 10" cc/mol. At EV = 70 volts values of 2.7 x lo" and 1.1 x lo" cc/mol are
obtained for .irgon and neon. Speculations are given concerning the magnitude of the
lifetimes of R*, and it is concluded that values of about 10" sec must be considered as
possible. The corresponding cross-sections for the reaction forming R lie in the range 16 2
1000 - 10,000 X 10' cm .
The rate constants for the formation of Ar and Ne. by the three-body process
oD OQ O O
are, respectively, 2.1 x 10" and 2.0 x lo" cc /mol sec. It is recognized that values
aa large as these are in disagreement with values Inferred from pulsed discharge lon
drift velocity experiments. A possible mode of reconciliation is suggested; namely, at
sufficiently high pressures coUisional decomposition of R ions formed by the termolec
ular process occiu- in the drift velocity experiments.
365

A High Pressure hfass Spectrometrlc Study of Reactions of Rare Gases with N and CO
M. S. B. Munson, F. H. Field, and J. L. Franklin Research and Development
Humble Oil & Refining Company
Baytown, Texas
Summary
Studies have been made in a mass spectrometer at ionization chamber pressures
of about 160 1 on mlxtiures of rare gases, R = He, Ne, Ar, Kr, and Xe, with N- and CO.
The Ions Rg" , ArN^'^, Kr'Mg" , XeNg'*', ArCO"^, KrCO'^, KrCO"^, XeCO'*', N, *, and (00)2" were
observed as the result of reactions of excited rare gas atcms. Under conditions which
maximize the effect of excited state reactions', RN , N, , RCO , and (C0)„ are formed by
reactions which compete with reactions for the formation of R . Three body lon-molecule
reactiona also form these ions under conditions of higher eleotron energy and pressure.
At higher electron energies (30 ev eomp£ired to 15 ev) and lower field strengths
(12.5 v/cm compared to 50 v/cm) and other Ions, ArC*, KrC" , XeC , CgO , COg , 0 , 0 " ^ ,
ArN , KrN , XeN , N- , and N , are formed. N and RN appear to be formed from excited
nitrogen molecule ions. C O appears to be formed from excited carbon monoxide moleciU.e
ions, but RC appears to be formed from excited rare gas ions.
No compound ions between He or Ne and N_ or CO were observed under the normal
conditions of these experiments, nor were any RO Ions detected.
366

Observation of the Products of Collision Processes and Ion Decomposition In a Lineeir, Pulsed Tlme-of-Fllght Ifess Spectrometer
R. E. Ferguson, K. E. McCulloh, and H. M. Rosenstock National Bureau of Standards
Washington, D.C.
ABSTRACT
The feasibility of detecting neutral species and small fragment ions associated
with lon pulses in a linear, pulsed time-of-flight mass spectrometer has been investlga.^
ted. The fast neutral species may be produced by charge exchange, and both neutrals and
fragment ions may result from collision-Induced dissociation or spontaneous dissociation
(metastable decomposition) of ions in the field-free region of the flight tube after
acceleration.
The method used is application of a DC retarding potential a few centimeters
before the electron multiplier detector target. Neutral species are unaffected and appear
at the original mass position of the parent ion; ions are retarded but can still be
focused as sharp pulses arriving after emd well separated from the neutral pulses; frag
ment ions (with the same velocity as the parent ion but with smaller mass) are retarded
more and appear after the parent ion peak.
Charge exchange of fast ions (2.8 k ev) with gas molecules in the flight tube,
single and double charge exchange of doubly charged species, neutrals and small ions from
collision-induced dissociation, and neutrals and ions from spontaneous decomposition of
a parent ion have been observed and will be illustrated.
The method is a simple and powerful one for surveying mass spectra for pecu
liarities of ciurrent Interest. With appropriate improvements in the apparatus, the
opportunity exists as well for making quantitative measurements of cross sections for the
various collision processes observed.
367

VELOCITY DEPENDENCE OF ION-MOLECULE REACTION CROSS SECTION
D. A. Kubone and V/.H. Hamill
Depar tment of Chemis t ry and Radiation Labora tory University of Notre Dame
INTRODUCTION
In genera l an ion-molecule react ion can be represen ted by
P"*" + M - S" + F
where P is the reac tant or p r i m a r y ion, M the neutral nnolecule, S the secondary or product ion and F one or more neutra l f ragments . Pa ren t -daugh te r re la t ionships a r e usually es tabl ished by the correspondence of their appearance potent ia ls . The choice of the fragment species is dictated by the c r i te r ion of A H|^ < 0, since endothermic react ions a r e not likely to be observed in the m a s s spec t romete r (8 ,9) .
These ion-molecule r eac t ions , as studied by m a s s s p e c t r o m e t r y , have gained wide in te res t in recent y e a r s . Much emphasis has been placed upon the various types of ion-molecule react ions and their implications for radiation chemis t ry ( 1 , 2 , 3 , 4 ) . There have been few publications which have dealt d i rect ly with the dependence of the react ion c r o s s sec t ion, Q, on the prinnary ion energy, EQ •
Gioumousis and Stevenson (5) have presented a treatnnent based on the r igorous kinetic theory of gases which re la tes the microscopic c r o s s sect ion, o" , to the cross sect ion, Q, m e a s u r e d by the m a s s s p e c t r o m e t e r . Field et al (13), using averaged quanti t ies instead of distr ibution functions, have a lso t rea ted this p rob lem. Both t r ea tmen t s predic t that Q va r i e s as the inverse square root of the ion energy , E Q . A t r ea tment leading to a very useful relat ion between tr and Q given by Boelri jk and Hannill (6) is reviewed.
The p resen t theory introduces the physical size of the colliding p a r t i c l e s , a feature ignored in ea r l i e r t r ea tmen t s (5 ,13) , to explain the deviation of Q from the predic ted E J ' ^ dependence.
THEORY
Langevin (10) descr ibed the interact ion of an ion with a nnolecule in t e r m s of a point charge inducing a dipole moment in a polar izable nnolectde. The potential function for such a system is given by
V = - .ei£ (1) 2r<
where e is the e lect ronic cha rge , a the polarizabil i ty and r the ion-molecule separa t ion .
The calculated orbits for this type of potential show a c r i t i ca l va lue , boi of the impact p a r a m e t e r , b , which is the distance of c loses t approach of the colliding pair in the absence of polar izat ion forces such that if b > bo the interact ion resu l t s only in sca t ter ing and if b < bo the in teract ion leads to an intimate spiral l ing col l is ion. It is assunned that for coll is ions with b > bo there is no react ion and al l 'collisions with b < bo lead to reac t ion . Hence , bo can be used to define a mic roscop ic c r o s s sect ion.
0- = TT b o ' ( 2 )
An express ion for tr in t e r m s of reduced m a s s , p., molecular polar izabi l i ty , a and re la t ive veloci ty , g, can be calculated in a s t ra ightforward m a n n e r .
b o = (4e '<^ /^g ' ) ' /* (3)
368

<r(g) = TTbo* = 2 i re g"' (c /u) ' /» , (4)
where \i = m^ m2/(mi + m^). The subscr ip ts 1 and 2 refer to the ion and nnolecule, r espec t ive ly .
Stevenson and Gioumousis (5) have related the nnicroscopic c ro s s section a to the c r o s s section m e a s u r e d by the m a s s spec t romete r in the following m a n n e r . Neutral molecules with a Maxwellian distr ibution of velocit ies a r e ionized by an e lect ron beam in the ion s o u r c e . The resul t ing ions a r e repel led towards the exit slit of the ion source by a voltage E applied between the repe l le r e lect rode and the exit s l i t , giving the ions a maximunn energy E Q , Between the e lec t ron beam and the exit slit these non-Maxwellian ions collide with neutra l the rmal molecules to form coll ision complexes . The average c ro s s section must be calculated at each point between the e lec t ron beam and the exit slit and then averaged over this react ion path.
The distr ibution function of velocity connponent v^ of ions of m a s s nnj along the ion path z, in the direct ion of the exit s l i t , is given by
f(vz,z) = v ( v „ z ) B m . e x p [ ( - l / k T ) ( l / 2 m . v ^ . - e z E ) ] ^ ^
(1/kT) (1/2 mi v^^ - ezE)
where B is the ra te of formation of pr i rnary ions and ^ has the values
V = 1 z < 0
V = 2 z > 0, vz > 0, (1/2 mi v* - ezE) > 0
V = 0 Vz < 0
V = 0 (1/2 mi v \ - e z E ) < 0
The velocity dis t r ibut ions of the ions in the x and y direct ions and al l the components of neut ra l molecules a r e one dimensional Maxwellian dis tr ibut ions
y v ^ ) a . - { ^ ) ' ^ ' e " ^ dx (6)
The ra te of react ion R can be expressed in t e rms of the velocity dis t r ibut ions fj and fj of the ions and nnolecules and the microscopic c ross section o" (g)
^ " ^ - i ° f \\ ' *''•' ^ '' ^ s " 's ' >- " ^ 1 " '^'
where N is the concentrat ion of neutral molecules in the ion source and IQ the distance fronn the e lec t ron beam to the exit s l i t .
Since cr (g) is an inverse function of g the factor g <T (g) is a constant and the integral reduces to an integral of the product of the distr ibution functions. Making the assumpt ion that EQ » kT
;^ B 1 M ( 2 " ^ i " e ' ) • / ' E -1/2 R = 2,7 B lo N ( " ' " ' " ° ) E o " ' / ' (8)
Eo is identified with C I Q E .
The number of secondary ions Hg is proport ional to the number of p r i m a r y ions np, to N, to lo and to the average c r o s s section Q. Thus
Hg = n p N lo Q (9)
and so Q = 2 cr L / E O ' / ' (10)
where
L 2l/2 T, e (HLL±JI}i <,)lA (11)
^ m j ' ^ '
369

Boelrijk and Hamill have given a m o r e useful relat ion between tr (g) and Q (6). The number of secondary ions fornned in a volume element with 1 cm^ a r e a pa ra l l e l to the e lec t ron beam and sides z and z + dz from the plane of the beann can be wri t ten
dng = np N 0- (z) dz (12)
Here the nnicroscopic c r o s s section is expressed as a function of position along the react ion path.
Integration over the path gives
r^o ng = n p N \ 0- (z) dz (13)
and z can be wri t ten in ternns of lo* E and E Q . Thus
z / l o - = E / E O (14)
and nnaking the substitution (11)
^s/ ip = Hg/np (15)
where the i ' s r ep re sen t the respect ive measu red ion c u r r e n t s ,
ig = i p N loEo" ' 'S^° tr ( E ) d E (16)
and finally
i s / i p (Nlo)" ' = Q = Eo"' 5 ^ ° tr (E) dE (17)
To a good approxinnation the relat ive velocity g can be taken as the velocity of the ion, i . e . ,
E = 1/2 m , g ' (18)
and so equation (4) beconnes
.(E) = Z'/ . e{^I^l^^ ofl' y ^ = - I . / E " / ' (19)
U s i n g (17) a n d (19)
r.'A HF. = ? ir . / w . y Q = E „ - ' ^ a L / E ' / ' dE = 2 a L / E O ' ' ' (20)
The resu l t is identical to the one obtained by Stevenson.
Equation (10) has been used to desc r ibe a number of ion-molecule react ions (5, 12). However , there a r e many reac t ions which show a depar tu re from an Eo ' ' dependence indicating that (10) is not an adequate descr ipt ion ( 6 , 7 , 13). One fact not taken into account in deriving (10) was the physical size of the colliding p a r t i c l e s . In other words it was assumed that TT bg was much l a r g e r than (TJ^, the ha rd sphere coll ision c r o s s sect ion. This assumpt ion appears not to be valid in many cases (6). Fo r some value of E Q , IT bo will be ecl ipsed by o"j^, i . e . ,
Et = ( C ^ L A K ) ' • (21)
where E^ is the energy at which TT b^ = <J'K* Introduction of this TR^, which is a s sumed to be energy independent in the present context , into equation (19) will lead to a d i s continuity in the functional dependence of Q on E Q .
Instead of (19) the nnicroscopic c r o s s section is now wri t ten
CTi ( E ) = P L ( - T L / E ' / ' - ^ K ) + P K "• K : E < E^ (22)
370

The t e r m in b racke ts r e p r e s e n t s the energy dependent a r ea and ITK the a r ea for head-on or "hard" co l l i s ions . The P - f ac to r s r ep re sen t react ion efficiencies and a r e taken to be energy independent. F r o m (17) and (22) the integrated c r o s s section is
Ql = 2 P L 0- L E ; ' / ' + <r K ( P K - P L ) : E < Et (23)
If E > Et there a r e only the energy-independent coll isions and
0-2 (E) = P K "-K •• E > E t (24)
Integrating over the react ion path
02 = E J ' C ' a , (E) dE + Eo"' C ° "-2 (E) dE (25) ^o • 'Et
= Eo' ' ( 2 P L < r L E t ' / ' - P L ""K t ) + P R " K (^6)
Using (21) and simplifying
Qz = P L CTL E / ^ E J ' + Pj^i^K : E >Et (27)
T h u s , at high ion energ ies (E > Et) Q will vary as EQ . This predict ion is the d i rec t consequence of the introduction of the energy independent c r o s s section CTLT.
There is another c r i t e r ion which will a lso lead to an EQ dependence. At a c r i t i ca l ion energy E^ the ion molecule complex becomes unstable , i . e . ,
(T J (E) = 0; E >Ec (28)
An example of this situation has been repor ted in the case of "st icky coll is ion" complexes (14) and in the ion-molecule react ions of cyclopropane (7).
The integrated c r o s s section is . Et . .E,
Ql -" . -' E
^ t I -^c !3 = Eo"' C ( r i ( E ) d E + Eo" \ c r j ( E ) d E +
' o ' ^
-1 fEo Eo ) o - j (E )dE (29)
Ec
Integrating and simplifying
Qj = Eo"' ( P L (TL E J S P K O-K E C ) : E > E ^ : E^ > Ej (30)
" Ec < Et E^ . ^ E^
Q4 = E o ' 5 0-, ( E ) d E + Eo"' f c r3 (E)dE (31) ° Ec
and
Q4 = Eo"' (2 P L T ^ E y + UK ( P K - P L ) E ^ ) : E >EC: EC < Et (32)
EXPERIMENTAL
The ins t rument used for al l measu remen t s is the CEC 21-103A m a s s s p e c t r o m e t e r equipped with a 31-402 ion sou rce . Modification of the ionizing voltage and repe l l e r voltage c i rcu i t s to facil i tate ion-molecule m e a s u r e m e n t s a r e descr ibed e lsewhere (6). The detection and recording of ion cu r r en t s was accomplished with an Applied Phys ics model 30 vibrating reed e l ec t romete r and a Sargent model MR
371

char t r e c o r d e r . The range of sensi t ivi ty attainable with this connbination is 10 to 10"** annperes . The electronneter has been nnodified for c r i t i ca l dannping and is equipped with a t u r r e t switch to expedite rapid changing of the sensit ivi ty of the electronneter over the stated range .
A complete descr ipt ion of the techniques for measur ing appearance poten t ia l s , c r o s s sec t ions , p r e s s u r e dependences and other re la ted nneasurements is given in "Techniques for Studying ion-Molecule React ions" (15).
Normal gases used in this study were obtained from Matheson and were purified as needed by s tandard techniques . Heavy hydrogen was obtained from the Stuart Oxygen Co. and methane-d^ from Merck of Canada; n-butane-d|Q was p repa red by catalytic exchange between n-C^Hjo and D2 (16).
All c r o s s section nneasurements were nnade under the following ion source conditions: ion acce le ra t ing voltage, 500 v; e lec t ron energy , 70 v; e lec t ron c u r r e n t , 10.5 mic roamp; total p r e s s u r e in the 3-l i ter bulb of 570 nnicrons Hg which c o r r e sponds to a N of 1 . 2 x 1 0 nnolecules/cnn . l o i s 1 .3mna .
RESULTS AND DISCUSSION
In the reac t ions repor ted he re no evidence of EQ was found, i . e . , only one discontinuity is observed in the plot of Q against EQ . Hence, al l r e su l t s will be in te rpre ted on the bas i s of equations (23) and (27).
Before present ing the actual exper imenta l resu l t s it is ins t ruc t ive to exannine a "synthet ic" react ion with r ega rd to the plots of Q against E j * ' ^ and EQ . Such a react ion has been const ructed using (23) and (27) with the values o" ^ = 50 x 10'*^ cm evv2 £^ _ 2^0 ev, o-j^ = 35.4 x lO"^^ cm^, and Pj^ = Pj^ = 1 and is shown in F igure 1. Pj^ and P L will not always be unity for actual c a s e s ; different values of P K and P L will only shift the curves along the ord ina te . The a r r o w s indicate the position of Et on the energy sca le . It is evident that Et cannot be deternnined accura te ly by d i rec t observa t ion . However Et can be deternnined analytical ly by the following method. Rear ranging (23) and (27),
Ql - - K ( P K - P L ) = 2 P L < r L E o " ' / ' (33)
Qz - P K < ^ K = P L - ^ L E i / ' Eo"' (34)
Dividing (33) by(34) and r ea r r ang ing again
E ' / ' - 2 E ' / ' Q ' " P K ° ' K (35) "^^ - ' ' ^ ° Q I - - K ( P K " P L )
V a l u e s of Qj (by e x t r a p o l a t i o n fronn t h e low e n e r g y r e g i o n ) a n d Qj a r e r e a d f r o m a p lo t of Q a g a i n s t E j ' ' a t a v a l u e of E o a b o v e Et ( e s t i m a t e d by d i r e c t o b s e r v a t i o n ) . P K "• K ^ ' id ' ' • K ( P K " P L ) a r e t h e i n t e r c e p t s of Q a g a i n s t E j ' a n d E j ' ' ^ , r e s p e c t i v e l y . V a l u e s of E t , c a l c u l a t e d u s i n g s e v e r a l d i f f e r e n t v a l u e s of E o i a l l a b o v e Et» w e r e found to b e e s s e n t i a l l y i n d e p e n d e n t of E Q .
A n a c t u a l r e a c t i o n w h i c h c a n be c o m p a r e d t o t h e s y n t h e t i c r e a c t i o n j u s t d e s c r i b e d i s s h o w n in F i g u r e 2 . In t h i s c a s e P K i s z e r o .
T h e r e a r e s e v e r a l m e a n s to t e s t t h e a d e q u a c y of the t r e a t n n e n t . F i r s t , v a l u e s of P L 0" L o b s o b t a i n e d fronn the s l o p e of Q a g a i n s t Eo" c a n be c o m p a r e d t o t h e v a l u e c a l c u l a t e d f r o m (11) .
T1 /z I rn , + m , . ' A , . • ^ L c a l c = 2 ' / 2 ,r e ( — L j f j - 2 - c) ( U )
T h i s c o m p a r i s o n i s s h o w n in T a b l e s I a n d I I . T h e h i g h v a l u e s of P ^ tr L o b s ^ ° ^ ' ^ ^ m i x t u r e s of l i g h t a n d h e a v y h y d r o g e n w i t h n i t r o g e n , c a r b o n m o n o x i d e a n d a r g o n c a n be
372

explained by the following consideration.
Hutchison, et al. (17) and Giese (18) have pointed out that in such systems the secondary ion can arise from the reaction going by
a. B"*" + HJ - BH"*" + H
and also by
b. Hj" + B - BH"*" + H
Consider the following. In general
ig = ipN lo Eo"' ^ ° 0- (E) dE (16)
o
is/(ipN lo) = Q= Eo ' \ T (E)dE (17) o
and
is = isa + isb (36)
where ig is the total measured ion current of BH . Then;
. c^° -1 C^° is = ipa Nb lo Eo ) o- (E) dE + ip^ Na lo EQ \ <rb(E)dE
(37)
rearranging
_ ^ ^ _ = E o " ' f ° . , ( E ) d E + ^ Eo"' <f°-b(E)dE ipa Nb lo J ipa Nb " i
(38)
From (17) and since ip = kN
Qa = Qa + (kbAa) Qb (39)
Qa is the cross section plotted using the measured ig and taking B as the reactant ion. Qa will of course be larger than either Qa or Qb. (39) could also have been written
Qb = (ka/kb) Qa + Qb (40)
Making the assumption that P L is unity for reactions a and b, the ratio Qb/Qa can be obtained from theory
Qb/Qa = (ma ai,/m^ay^ (41)
where ma is the mass of the neutral molecule and a its polarizability. Calling this ratio P
Q 1 = (1 + k b A a P) Qa (42)
ka and kb can be obtained from plots of ip against N. For a given EQ, (41) can be written
<r 'La = (1 + kbAa P) t La (43)
In Table III values of "• Lacalc ^""""^ equation (43) are compared to observed values of o" La •
PLO'Lobs = 50.5 X 10"" cm2 ev ' ' ' compared to 71.6 x lO"" cm' ev'^' for
(TLcalc '^°'' * ^ reaction COj"*" + HJ - COjH+ + H
373

This may be understood qualitatively in t e r m s of a ' s t e r i c ' fac tor . If the s t ruc tu re of the COzH"*" ion is
o-c=o I
H
t h e r e w i l l be a s t e r i c h i n d r a n c e for t h e H - a t o m to g e t on t h e c a r b o n a t o m , m a k i n g P L l e s s t h a n u n i t y . U n f o r t u n a t e l y , t h e r e i s no i n f o r m a t i o n t h a t t h e a u t h o r i s a w a r e of w h i c h g i v e s a n y c l u e a s to t h e s t r u c t u r e of t h i s i o n . O n e f ac t in f a v o r of t h i s s t r u c t u r e i s t ha t i t i s a r e s o n a n t s t r u c t u r e .
In the c a s e of the O j - H j (Dj) s y s t e m , t h e r e a c t a n t i on i s t a k e n to be Oj"*" in i t s f i r s t e x c i t e d s t a t e . S i n c e the n u m b e r of Oj in the e x c i t e d s t a t e i s l e s s t h a n in t h e g r o u n d s t a t e o" L o b s ^ i H t)^ l e s s t h a n tr L c a l c * H o w e v e r , o t h e r w o r k in t h e l i t e r a t u r e l i s t s HJ"' ' a s t h e r e a c t a n t i on ( 1 2 , 2 1 ) . T h e p r e s e n t c h o i c e of Oj*'*' i s b a s e d on t h e f o l l o w i n g f a c t s . T h e a p p e a r a n c e p o t e n t i a l s of OjH"*" a n d H j + c o i n c i d e w i t h e a c h o t h e r . H o w e v e r , the a p p e a r a n c e p o t e n t i a l of OjH a l s o c o i n c i d e s , w i t h i n e x p e r i n n e n t a l e r r o r , w i th the f i r s t e x c i t e d s t a t e of Oj"*" ( 1 9 ) . T h e o b s e r v a t i o n of OjH"*" in a m i x t u r e of o x y g e n a n d m e t h a n e s h o w s a n e x c i t e d s t a t e of Oj i s i n v o l v e d . T h e on ly r e a c t i o n e n e r g e t i c a l l y a l l o w e d in t h i s s y s t e m i s
Oj+ (* TT u) + CH^ —OjH""" + C H J A H J . = - 5 5 K c a l
a l l o t h e r s a r e e n d o t h e r n n i c ; (AHf ' s o b t a i n e d f r o m r e f . 2 0 ) .
A H - K c a l
Oj'*' ( 1T g) + CH4 - . OzH""" + CH3 + 40
CH4+ + Oj -> OjH'*' + CH3 + 18
CH3+ + Oj - O^U^ + C H J + 69
AHf K c a l
CHJ ' ' " + O J -» OjH"'" + CH + 4 2
If the r e a c t a n t ion w e r e H j t h i s w o u l d be t h e on ly c a s e w h e r e H j i s no t t h e m o l e c u l e in r e a c t i o n s of t h e t y p e (22)
X"'" + H J - . XH''" + H
A n o t h e r f ac t w h i c h s t r o n g l y s u p p o r t s the c h o i c e of O j * i s t h a t Ef i s o b s e r v e d for
OJ"'' (" TTu) + Dj - OjD''' + D
but no t for
Oj-^ ( * TT u) + H J -4 OjH''" + H
R e p l a c i n g Hj by Dj w i l l l o w e r t h e v a l u e of E t a b o u t a f a c t o r of t w o . T h i s i s e v i d e n t on i n s p e c t i n g e q u a t i o n s (11) a n d (21 ) . M e a s u r e m e n t s of Q did n o t e x t e n d to s u f f i c i e n t l y h i g h v a l u e s of E o t o s e e E t in the O j - H j s y s t e m but w a s h i g h e n o u g h t o s e e i t in t h e O j - D j s y s t e n n . If t h e i on w e r e Hj'*" t h e v a l u e of E t w o u l d be t h e s a m e w h e t h e r Hj o r Dj w e r e u s e d .
T h i s f e a t u r e of b e i n g u n a b l e to o b s e r v e E t a l s o , a p p l i e s t o m i x t u r e s of l i g h t a n d h e a v y h y d r o g e n w i t h a r g o n , n i t r o g e n , c a r b o n m o n o x i d e , c a r b o n d i o x i d e a n d h y d r o g e n c y a n i d e . A c c o r d i n g t o e q u a t i o n (21) t h e c o m b i n a t i o n of a l a r g e (r L ^ u d a s m a l l o-K d i c t a t e s a h i g h v a l u e of E t . Q f o r the N j - H j a n d N j - D j s y s t e m s w e r e e x a m i n e d a t h i g h e r v a l u e s of E o by u s e of e x t r a b a t t e r i e s in the r e p e l l e r c i r c u i t . E t w a s o b s e r v e d fo r bo th H j a n d Dj m i x t u r e s . T h e c a l c u l a t e d r a t i o Etpj / E t Q j f r o m e q u a t i o n s (11) a n d (21) i s 1 . 8 7 5 , t h e o b s e r v e d r a t i o i s 2 . 1.
374

Another connparison involves o" Kobs obtained fronn
-Kobs = ' ' ^ y ' ^ )
a n d v a l u e s c a l c u l a t e d Cronn V a n d e r W a a l s ' b ' . g a s v i s c o s i t y a n d m o l a r r e f r a c t i o n . T h e s e c o m p a r i s o n s a r e s h o w n in T a b l e I V . T h e v a l u e s of o"Kob ^ ^ ^ v e r y r e a s o n a b l e a n d in f a c t a p p e a r to r e f l e c t the d i f f e r e n c e s b e t w e e n the m o l e c u l e s m o r e f a i t h fu l ly t h a n do t h e o t h e r O " K ; ' S .
C O N C L U S I O N
T h e t r e a t m e n t p r e s e n t e d h e r e p r o v i d e s a n a d e q u a t e d e s c r i p t i o n of t h e e x p e r i n n e n t a l f a c t s . I t i s a nnore r e a l i s t i c a p p r o a c h t h a n the po in t p a r t i c l e t r e a t n n e n t u s e d by S t e v e n s o n , s i n c e Q r a p i d l y d e c r e a s e s w i th i n c r e a s i n g e n e r g y .
T h e g e n e r a l n a t u r e of the p r e s e n t t r e a t m e n t , the a g r e e m e n t b e t w e e n p r e d i c t e d a n d o b s e r v e d q u a n t i t i e s , the v a r i o u s c o r r e l a t i o n s b e t w e e n the p a r a m e t e r s a n d t h e r e a s o n a b l e v a l u e s of c p^ i n d i c a t e a d i r e c t a n d so f a r u n i q u e a p p r o a c h t o p a r t i c l e m e c h a n i c s .
ion
D J
O J *
O J *
H j O
DjO
H j O
CD4
CD3
m o l e c
Hz
Hz
Dz
D J
Hz
n - C ^
C D ,
CD4
u le
,Dio
T A B L E I
s e c . ion o - L c a l c
DjH
OjH
OjD
HjOD
DjOH
HjOD
CDs
CzDs
26 A ' ev
6 1 . 6
45
35
4 7 . 4
55
38
37
•A
IT L o b s
3 1 . 7 A ' ev
25
1 4 . 6
28
45
5 6 . 5
42
40
l A
375

ion
N J
Nz
C O
C O
COj
C O j
A
A
H C N
Dz
H J
m o l e c u l e
Hz
D J
Hj
D J
Hj
Dz
Hz
Dz
D J
D J
H J
s y s t e m
N J -
C O •
A - H ;
N J -
C O •
A -
Hz
• H z
s
D J
- D J
Dz
T A B L E 11
s e c . ion < L c a l c
NjH
NzD
COH
C O D
COjH
COzD
AH
AD
H C N D
D3
H3
s e c . i on
NjH
COH
AH
NjD
C O D
AD
CO S* ' A 58 A ev
42
58
42
7 1 . 6
5 1 . 8
6 8 . 5
4 9 . 6
4 1 . 6
2 1 . 2
2 1 . 2
T A B L E III
"• L a c a l c
•7 1 S2 ' A 71 A ev ' 71
77
53
53
58
" " L o b s
84 A ' ev ' / '
6 6 . 5
75
57
5 0 . 5
36
76
6 0 . 5
4 8 . 6
2 1 . 5
2 3 . 5
^ L a o b s
84
75
76
66
57
60
oZ i/z A ev
H J
Dz
H j O
DjO
H j O
CD4
C D ,
m o l e c
Dz
Hz
HZ
Dz
Hz
n -C4
CD4
CD4
ule
.D,o
E t ' / ^
2 . 64 ev
2 .60
2 .42
1 . 5 ,
2 . 7 6
2.O0
1.65
1.75
T A B L E IV
l A
Kobj
8 A '
8. 1
10.7
22.2
• 17.2
27 .5
23
21.2
Kgv
18.3
18.3
18.3
18.8
18.8
34.8
31.4
31 .4
A'
Kv,
24
2 4
24
25
2 5
44
33
33
dw
A'
K m r
10.8 A'
10.8
10.8
13.3
13.3
31.6
24.2
24.2
376

REFERENCES
1. M. Ha iss insky , Ed. ,"The Chemical and Biological Action of Rad ia t ions , " Academic P r e s s , Inc. , New York, N . Y . , Vol. V, 1961, Chapter 4.
2. "W.H. Hami l l , Ann. Rev. P h y s . Chem. , IA, 87 (1960).
3. 'W.H. Johnston, e t a l . , "Ion-Molecule React ions" , No. JLI -650-3 -7 UC-23 , I so topes , William H. Johnston Labora to r ies , 1959.
4. J . Durup, "Les Reactions Entre Ions Posi t i fs et Molecules en Phase Gazeuse" , Gau th ie r -Vi l l a r , P a r i s , 1960.
5. G. Gioumousis and D . P . Stevenson, J . Chem. P h y s . , 2_9, 294 (1958).
6. N. Boelri jk and W.H. Hamil l , J . Am. Chem. Soc. , 84, 730 (1962).
7. R . F . p o t t i e , A . J . Lorquet and W.H. Hamil l , J . Am. Chem. S o c , 84, 529 (1962).
8. F . W . Lampe and F . H . F ie ld , Tet rahedron 7, 189(1959).
9. V . L . Ta l l roze and E . L . Frankevi tch , Proceedings of the F i r s t All-Union conference on Radiation Chemis t ry , Moscow, 1957, Consultants Bureau, Inc. , New York, 1959.
10. P . Langevin, Ann. Chim. P h y s . , 8, 245 (1905).
11. D .A. Kubose and W.H. Hamil l , J . P h y s . Chem. 65, 183 (1961).
12. D . P . Stevenson and D.O. Sch l s s le r , J . Chem. P h y s . , 29, 282 (1958).
13. F . H . F ie ld , J . L . Frankl in and F . W . Lampe , J . Am. Chem. Soc. , 79, 2419 (1957).
14. R . F . po t t i e and W.H. Hamil l , J . P h y s . Chem. , 63, 877, (1959).
15. Techniques for Studying Ion-molecule React ions , on deposi t , Science L i b r a r y , University of Notre Dame.
16. H. Gi l l i s , R. Williams and W.H. Hamil l , J . Am. Chem. Soc. , 83 , 17 (1961).
17. D. Hutchison, A. Kuppermann and L. Pobo , presented at ASTM Committee E-14 on Mass Spec t romet ry , Chicago, June , 1961.
18. C . F . Giese and W . B . Ma ie r , II, J . Chem. P h y s . , 35, 1913 (1961).
19. D . C . F r o s t and C.A. McDowell, J . Am. Chem. Soc. , 8£, 6183 (1958).
20. F . H . Field and J . L . F rank l in , "Electron Innpact Phenomena and the P r o p e r t i e s of Gaseous Ions" , Academic P r e s s , Inc . , New York, N . Y . , 1957, appendix.
2 1 . P . Dong and M. Cottin, J . Chem. P h y s . 57, 557 (I960).
22 . H. Gutb ie r , Zei t . Na tur fo rsch . 12A, 499 (1957).
377

Q
-
-
>
Synthetic Reaction
y y yf" •^•yy
1 1 •
^ y
•E.-'
1
^
1
Figure 1. Plot of Q against E-a and E"! for a
synthetic reaction. Range of E Q is 0.5 to 11.5 ev.
The arrows indicate Ex..
Figure 2. Plot of Q against E"! and E"! for the
reaction C D | + C D ^ — ^ ™ 5 "'" ^ g- Range of E^ is
0.5 to 11.5 ev.
378

MASS SPECTROMKTRIC OBSERVATION OF ELECTRON AND PROTON TRANSFER REACTIONS BETWEEN POSITIVE IONS AND NEUTRAL MOLECULES*
A. Henglein and G. A. Muccini
Radiation Research Laboratories, Mellon Institute, Pittsburgh, Pa.
and
Hahn-Meitner-Instltut fiir Kemforschung, Berlln-Wannsee
This work was supported, in part, by the U. S. Atomic Energy Commission.
SUMMARY
The raethod of Cermak and Herman has been applied to mass spectrometric studies of symmetrical electron and proton transfer processes. The characteristics of the lon source used have been Investigated both experimentally and theoretically. A new type of ionization efficiency curve is obtained if the current of a secondary lon is plotted as a function of the voltage between ionization chamber and electron trap at constant low voltage between the filament and the chamber. Essentially complete dlBcrimination of primary ions has been achieved.
Electron transfer occurs with rather low cross section in methane but Increases with molecular size and with Increasing unsaturation. Large cross sections were observed In sulfur and iodine containing compounds. Double charge transfer reactions such as
NO"*"*" + NO -» NO + NO"*"*"
Xe"*^ + Xe -» Xe + Xe"*"*"
have also been observed. Proton transfer reactions have been observed in several simple molecules. Some experimental results are presented which Indicate that proton transfer may occur via a complex (at low kinetic energies) or as a stripping process (at higher energies).
Fragment ions have aleo been observed in the secondary mass spectra of several compounds. While part of these may result from the scattering of primary fragment idns, in some cases additional processes have to be postulated such as hydride lon transfer and dissociative charge transfer from vlbrationally excited ions.
INTRODUCTION
A simple new method for mass spectrometrlc studies of the interactions between ions and neutral molecules has recently been described by Cermak and Herman.^ The electron accelerating voltage between the filament and the ionization chamber of a conventional lon source is kept below the ionization potential of the gas. The electrons traverse the chamber without causing any ionization and are then further accelerated by an electric field between the ionization chamber and the electron trap. The primary ions are accelerated in the direction opposite to the electron beam by this field before entering the ionization chamber. These primary ions are not able to pass the slit system of the mass spectrometer because of a kinetic energy component perpendicular to the direction of analysis. However, secondary ions produced by collisions with gas molecules in the chamber can be extracted into the analyzing section of the instrument if they are formed with negligible amounts of kinetic energy. Cermak and Herman demonstrated this In studies of dissociative charge transfer reactions in cases in which the transfer of mass and therefore of kinetic energy Is extremely small.
The methodology of Cermak and Herman has been applied in studies carried out with a Consolidated Electrodynamics Corporation Model 21-103 C mass spectrometer. The sensitivity of the instrument was Increased by using a Model 31 Cary (Vibrating Reed) Electrometer for the measurement of the lon currents. Studies of the characteristics of the ion source showed that essentially complete discrimination between primary and secondary ions is obtained. As a result it has been possible to Investigate a number of typical resonant charge transfer reactions. In addition, the mass spectra of secondary ions of several simple compounds have been studied. It has been found that these secondary mass spectra contain not only the parent ions (formed by resonant charge transfer) but also protonated molecules as well as ions of lower masses resulting from ion-molecule reactions. It seems noteworthy to emphasize that the high degree of discrimination of primary ions makes It possible to detect certain secondary ions which cannot be observed in the conventional operation of the ion source.
Characterietics of the lon source
a) Experimental
The normal operation of the ion source is demonstrated in Fig. 1 for methane (curve 1). The current of the parent ion is given as a function of the electron
379

. .— ;u9Jjno uo| Ajopuooss
o O
1 1
tn
"o >
CO I I
« UJ
1 1
I
^ ^ (/) o > o I I
K LLI
. 1 _
' \
^ ^ * ^ * * * ^ N n
1 1 1
T - l -T — f
V »rt V ^ .»-
X o X >
X O X ^ ^
X UJ ^"V i^^^^ ^ ^
^"•^s^,^^^^ ^
l l l l
1 1
tn
o > O ^ l i
l l J
V
1 1
-
o
l ua j j n s uoj AjDiuNd
_ a.
O i n Q
= l s
>
r
1
CM
I
1 \
^*^Oii i fc~~
m Si ^ " • ^ ^ o s 1 > .g
§ 1 Q II II \ 01 ( -
h ^ w
,— X
o QL
l l
a> tn
^ o D >
o 2 > ^ 11 II o h-
UJUJ
I I I I I I I I I
«
1 V \ S J2 \ .9 o 1 *- > \ Sco
\ II 11
\ L I J LU ro \
T \ • A
\ TJ
l l i l l l l 1° 1
(''H3)dl -I I I I I I I 1
-
~
— -
~
—
-*^
o o
|U3Jjno uoj
o ro
C M |
O j£
380

accelerating voltage at constant trap voltage. A small current which decreases rapidly with decreasing electron voltage can still be obberved below the Ionization potential of methane (13.0 volts). Between 11,0 and 13.0 voltt this current is attributed to the energy spread of the electron beam. At 11.0 volts the slope of curve 1 changes discontinuously and at lower voltages becomes nearly independent of the electron accelerating voltage. Fig. 2 shows the dependence of the CH4"*"-current on the pressure in the gas inlet system. Proportionality exists if the ion source is operated in the conventional way, i.e. with incident electron energies above the ionization potential of the methane (curve L). The current Increases with the square of the pressure If the electron accelerating voltage is kept below 11.0 volts (curve 2). In this range only secondary CH4 ions which result from some interaction of primary ions formed between the chainber and trap with gas m9lecule6 in the chamber are observed.
The formation of these secondary CH "*" lone is described In a more detailed manner by curve 3 in Fig. 1. The electron accelerating voltage Ee has been kept constant at 8.0 volts and the CH*'*' current has been studied as a function of the trap voltage E j . ,Cur-ye 3 represents an "ionization efficiency curve" for the secondary ion. The "appearance potential" here amounts to 5.0 volts. This corresponds exactly to the ionization potential of 13.0 volts of methane since the energy of the electrons is equal to Eg .+ EJ = 13,0 when they reach the electron trap. It can therefore be concluded that the pir ecursor of the secondary CH4''" lon Is the priraary CH4'** ion which transfers its charge in ^ collision with a methane molecule. "Secondary ionization efficiency curves" are therefore helpful In Investigations of the nature of the primary lon. However, the meaning of such secondary ionization efficiency curves is somewhat different from that ^bt^ined in more conventional ion sources. This will be discussed in detail in the follovdng theoretical part.
The description of the characteristics of the ion source Is completed by curve 2 in Fig, 1 where the lon current Is plotted versus the trap voltage at constant accelerating ybltage above the ionization potential of the gas. As it is well known from conventional operation the ion current is practically Independent of E-j over a wide range.
b) Theoretical
-The secondary ions cannot reach the collector if they have excessive kinetic energy either parallel to the long axis^bf the slits (i.e. in the direction of the primary ions) pr perpendicular to this axis and to the direction of analysis. Only a beam within the jdi.yergence angles a and p (perpendicular to and in the plane of analysis, respectively) will pass .thr,ough the whole slit system. The" angle a Is determined by the length li of the ,exlt slit of the ionization chamber and I2 of the entrance slit of the collector system as well as the distance a between .the two slits. The angle p Is determined by the widths dl and d^ of the exit slit of the ionization chamber and the exit slit of the lon accelerating system as well as their distance b. In the mass spectrometer employed here' ll, la and a ,were 1.0, 1.26 and 40 cm, and di, d^ and b were 0.15, 0.15 and 7.2 mm, r'espectiyery. The values of Ct and p are calculated to be equal to 0,056 and 0.0415 radians from these data. The maximum kinetic energy components Ifcx and UR parallel and perpendicular to the .direction of the primary ion beam which will allow analysis are given by
.U - a2. V . (1)
"ZT Ufi = ^ (2)
where V is the ion accelerating high voltage of the lon source. In this work V was equal to 800 volts. \Jf2 and Uo are found to amount to
U( = 2.5 eV (3)
Up = 0.34 eV (4)
Let XQ be the distance between the ionization chamber and electron trap, x the distance between the chamber and a point between these two electrodes. The total kinetic energy of an electron which ionizes a molecule at this point is equal to Etof Eg + U(x) where U Is the potential difference between the chamber and this point. If the field gradient between chamber and trap Is linear U = Ex * "^. The primary ion formed at the distance x is accelerated by the potential U and enters the chamber with the kinetic energy eU(3[). At the appearance potential, AP, of the secondary ionization efficiency curve, all ionizations take place immediately in front of the collector. I.e. x = XQ and Etot = Eg + Ex, and all primary ions entering the ionization chamber have the kinetic energy eE^. However, at higher values of Ex ionization can occur between Xg and a minimum distance xi which is given by the condition Ee + l'(xi) " ^ - The primary lon beam therefore will have a distribution In kinetic energy between ^^((xi) "' ^T- Since Xl decreases with Increasing Ex this distribution will become broader and broader.
The number of primary ions which are formed between x and x + dx (or U and U + dU) and which will therefore obtain the kinetic energy eU is equal to
381

voltaqe — ^ Fig. 3: Curve 1: Ionization efficiency curve of ClU*" (E^ constant at 40 volts. Eg
variable. Abacisaa: E Q - B volta. Curve 1 is normalized at Eg-S = 40 volta)
Curve 2: Total primary CH^ current as function of Ef at Eg = conatant at 8 volta. (Curve 2 Is calculated from curve 1 according to Eq. 7, Normalization of curve 2 at £y •> 40 volts)
X: Observed secondary CH^ current at various values of E-p (Eg constant at 8
volta. Normalization at Ex "" 0 volta)
35 I 40 ET
45 E , + ET
Fig. t*: Ionization efficiency curves of secondary ions In methane (Eg = constant at 8 volts. Ex variable. All curves normalized at E-j. = 40 volts)
382

«(U) dU « c . a(u). dx (5)
where c is the concentration of gas molecules in the lon source and ^(u) the cross section for ionization at the distance x. I.e. at total electron energy Eg + U. If U = Ex" —
r > < _ ^ y i V ^ c . ^ ^ a ^ ^ y dV "°(6)
The total number of primary ions formed between x and xi will amount to
E.
" t o t - ^ - E l - j -(U)''" (>
TiTi) is easily derived from the conventional Ionization efficiency curve. curve 1 in Fig. 3 represents a(u) for CH* If Eg is equal to 8 volts. This curve is the measured primary ionization efficiency curve 1 in Fig. 1 (the scale of the abscissa is just shifted by 8 volts). Curve 2 in Fig. 3 is the Integral
E T • J
ET
E. - J ^ y AP-8
of curve 1 and represents the total primary CH*''' current at different voltages Ex. Both curves are normalized at 40 volts.
The number of secondary ions which are produced by reactions of the primary lens in the ionization chamber is proportional to
N;„^ ' " • J N(.» • t^^n d" (8) tot J "(U) "(U) AP-E^
where tr'iyjs is the cross section of the lon-molecule reaction. By combining Eq. 6 and 8
/ ' •^tot- =^ i : j °-(u) • -(u) • < " <') AP-Eg
is obtained. If CT' IS independenC of the kinetic energy of the primary lon, N^^^ becomes proportional to WJ-Q^., i.e. the shape of the secondary Ionization efficiency curve will be identical to that calculated from Eq. 7 (Fig. 3). In these considerations it has been assumed that all secondary ions reach the collector. However, If the secondary ions are formed with kinetic energies perpendicular to the direction of flight only a fraction, f, will be collected. As the kinetic energy of the primary lon Increases f will decrease and N' will be described by the relation
h «tot.^ " ^ - ^ i - j - ( U ) - -(U)- U ) • '" ( °>
Symmetrical charge transfer reactions
Symmetrical charge transfer processes have been studied by a number of authors?"^ These investigations have mainly been restricted to the noble gases. The reaction Hs**" + Ha -+ H2 + H2 seems to be the only process studied in which molecular species are involved. The cross sections of such resonance processes are expected and have been found to be higher than gas collision cross sections. This arises because the resonance introduces a long range Interaction which would otherwise not occur. Relatively little variation of the cross section with the kinetic energy of the lon has been found. At energies above 200 eV in all cases the cross section observed falls very slowly and steadily as the relative kinetic energy of the collision partners Increases. At lower kinetic energies, however, a small maxlraum has been observed in argon and In neon® and a very pronounced one in hydrogen.* These anomalies have been attributed to the occurrence of non-resonant processes in the noble gases due to the spin multiplicity of the lowest state of these ions. In the case of H2 a side reaction In which a change of vibrational energy is Involved has been assumed.* Scattering of ions in the case of exact resonance occurs primarily at small angles, the scattering intensity at 90° being practically zero.^ It can therefore be assuraed that all secondary parent Ions formed in our lon source exclusively result from symmetrical charge transfer.
Fig. 3 contains a few points from curve 3 in Fig. 1. These points fit curve 2 in Fig. 3 fairly well. This curve is calculated on the assumption that both i ( ^ j \ and CT/y.. In Eq. 10 ate constant over the range from 5-40 volts. The agreement indicates, as mentioned above, that the transfer of kinetic energy is very sraall and that the cross section of the observed process is not significantly dependent on the kinetic energy.
383

TABLE I
Relative cross section of symraetrical charge transfer reactions
relative cross section
relative cross section
CH4
CaHg
CsH "*
c-CsH,
CSHQ
NO
H2O
002"*'
(1.0)-
3.3
10
14
5.0
29
13
4.1
4.2
4.3
HCl
NH3"
CSa
, +
Ar
Kr
Xe
7.0
7.8
15
19
27
3.7
9.3
15
23
Ar
Kr+
Xe+
+ NO
1.1
1.8
3.0
0.3
a + + reference reaction: CH4 + CH4 -» CH* + CH.t
384

Fig. 4 shows the ionization efficiency curves for the secondary ions observed in methane and Figs. 5-7 show similar data for some other simple molecules. The appearance potentials of the parent ions are always identical with those of the primary parent ions. All observed symmetrical charge transfer processes are listed in Table 1. The lowest cross section for transfer of a single electron has been found in methane. This reaction has been selected for reference in Table 1. In order to obtain relative cross sections, the ratio
current of secondary ion at E^ = 8 and Ef = 40 volts
current fo primary ion at Ee = 40 and Ef = 40 volts
has been measured relative to the similar ratio for methane. This procedure assumes that the primary ion current in the Cermak-Herman operation of the ion source (Eg = 8, E^ *= 40) is proportional to the ion current in the more conventional operation of the source (i.e. E^ = 40 volts). Since the primary ion current contained ions of kinetic energies between about 5 and 40 volts, the value of the cross section obtained is an average over this range. An additional complication arises since the primary molecular ions formed by electron Impact will have various amounts of vibrational energy. The data obtained by the present method of measuring cross sections can be compared with literature values in the case of the noble gases. Our ratio of the cross sections In argon and neon amounts to 9.3/3.7 =2.5 which agrees with the ratio of 2.5-3,0 calculated from the measurements of Rostagni.® Absolute cross sections may be calculated from the data in Table 1 by using the known absolute cross section of the transfer process in argon (38 x 10"^®cm^ at 20 eV).
The cross section depends significantly on the nature of the compound. In molecules of similar size (such as ethane, ethylene and acetylene) the cross section increases with Increasing unsaturation. A similar increase is observed by going from cyclohexane to cyclohexene. High cross sections have been found in the sulfur containing compounds and in iodine. Table 1 also contains some examples of symmetrical double charge transfer. In these experiments, 110 volts were used Instead of 40 to carry out the measurements and Eq. II adjusted accordingly. The process
NO"^ + NO - NO + NO'^ (12) was the only one found for the transfer of two charges in a molecular system.
Proton transfer reactions
The secondary mass spectra of some simple molecules are listed in Table 2. The ionization efficiency curves of these secondary ions are shown by Figs. 4-7. Ions of the form Hn + I 3C from parent molecules Hj X have been observed in all cases. The secondary ionization efficiency curves of these ions begin at the same appearance potentials as those of the parent ions HnX"*". Primary ions H^X^ must therefore be the precursors of the protonated species as well as the secondary parent ions.
H X + H X" (13a) ^ n n '
C n ^
"n-1^ + "n+l'' <""> In order to corapare the competing processes of electron and proton transfer the ratio of the currents of the secondary ions Hn.iX"*" and H^X* is plotted in Fig. 8 versus the voltage Ex.
The general shape of the secondary ionization efficiency curves of the ions Hn .iX differs markedly from that of the ions Hj,H'''. A maximum at 10-15 volts above the appearance potential can usually be observed (Figs. 4-7). The decrease in the ratio Hn+iX^/HnX*" in Fig. 8 indicates that electron transfer predominates more and more at higher kinetic energies. The shape of the H[i.).iX+ curves in Figs. 4-7 may be explained by the Inverse dependencies of CT, CT' and f on the kinetic energy eU of the primary ions (Eq. 10). The Increase in CT(U) ' rather low kinetic energies determines the main features of the shape of the curve while the decrease in CT'(U) and in f(u\ becomes predominant at higher kinetic energies. The decrease of a ' is well known from conventional studies on ion-molecule reactions.^'® It raay be described by the relation
CT' « U° (14)
over a certain range of U. Values for a of -0.5 to -1.4 have been observed for different reactions.'•°
The collection efficiency, f(u)» *- ^ ° longer be assumed to be constant as in the electron transfer reactions since the transfer of the mass of the proton will be accompanied by the transfer of kinetic energy. This term is therefore expected to decrease above a certain value of U, but the decrease should depend strongly on the nature of the collision. The reaction may occur via an activated complex which dissociates into the final products after a lifetime much longer than the time of a molecular vibration. The existence of such complexes has been proven indirectly® and directly^^*^ in several
385

TABLE 2
Primary and secondary raass spectra of simple molecules
_ , I a ~ ' " ~ relative intensity Substance Ion ionization _
potential (volts) primary spectrum secondary spectrura
HaO''" 2.4 29
H20'*" • 12.61 100 100
'' ''" OH"^ -12.8 20
O"*" 13.61 0.7
HaS"*" <0.04 2
hydrogen HaS"*" 10.47 100 100
^"^"•^^ HS+ 3b 4
S"*" 10.36 41 3
HaCl"*" 1.2 7
'^yf°fr HC1+ 12.90 100 100 chloride
13.01 15 0.7
NH,"*" 0.6 15
NHa"*" 10.52 - 11.3 100 IQO
NH2''" 57 2
3.5
14.54 7.8
CHs"*" 2.8 20
CH4''" 13.1 100 100
methane CHa""" 9.9 78 120
CHa"*" 11.9 12 6
CH"*" 11.13 5
C+ 1
C2Hy'*" not detectable 0.2
C2Hs''" 11.6 100 100
C2H5"'" 8.7 82 122
ethane Caftt"*" 10.51 410 93
CsHa"*" 133 17
C2H2'^ 11.41 74 3
C2H"*" 6
C ^ 0.8
C2H5"'" not detectable 2
C2H4"^ 10.51 100 100
ethylene C2H3 54 9
CeHe"*" 11.41 52 5
CaH""" 8
02""" 1
^Pressure of the gas inlet system: 600n. Repeller field: 3.84 volts/cm
Primary spectra; Ee= 40 volts, Ex= 40 volts. Secondary spectraj Ee*»8volts, Ex = 40volts
'^Data taken from F. H. Field and J. L. Franklin, "Electron Impact Phenomena",
Academic Press. Inc., New York 1957
386

lon-molecule reactions. Coraplexes are probably preferentially formed at low kinetic energies. At higher kinetic energies the lifetime of the complex will become shorter than the time required for distribution of the excitation energy in the various degrees of freedom in the complex. I.e. there is practically no real coraplex formation. Reactions which are observed at higher kinetic energies are more likely to occur as stripping processes. Essentially the cross sections of such processes are not expected to exceed gas kinetic cross sections. In the case of complex formation the intermediate complex will move with half the original kinetic energy (eU) in the direction of the primary lon, the rest of the kinetic energy appearing as internal energy. The reaction product Hn+lX^ will have the kinetic energy -j (eU)'-2j— ~ 5 (eU) in the direction of the primary ion (where A is the mass of the molecule HnX). It will have an additional coraponent of kinetic energy directed at random if part of the excitation energy of the complex and of the exothermicity of the reaction appears as kinetic energy of the final products. At values of U above 10 volts the maximura energy component l^, at which collection is allowed, will have been reached. The collection efficiency is expected to fall significantly as the kinetic energy of the primary ion exceeds a few electron volts.
Where the secondary ion results from stripping of a proton from the primary ion the protonated molecule will be formed with the kinetic energy i • x ^ (eU) in the direction of the primary lon. This amount is rauch less than in the case of complex formation. There f(u) is expected to depend only slightly on the kinetic energy in the range of 5-40 volts. The ratio H[i .iX+/HnX in Fig. 8 is only slightly dependent on Ex in the cases of hydrogen chloride, hydrogen sulfide and ammonia. If we can again assurae that CT' and f of the electron transfer are nearly independent of energy it raust be concluded that CT' and f of the proton transfer show the same behavior. The stripping model would therefore be more adequate to describe these reactions than the activated complex model (at least for kinetic energies above 5 eV). The very strong decrease in the current ratio CHs'''/CH4'*" in Fig. 8 Indicates that this reaction occurs via a coraplex at low kinetic energies while a stripping reaction predorainates at higher energies. This may also explain some observations of Field et. al.® who studied the reaction CH*"*" + CHt-* CHs"*" + CH3 by operating the lon source in the conventional way. They found the cross section to decrease at repeller field strengths between 10-100 volts/cm but to become constant at higher field strengths.
The C2H7 lon which could not be detected in conventional studies on lon-molecule reactions in ethane''' has been observed (Table 2, Fig. 8) with low intensity. Since the appearance potentials of C2H6 » C2HS and CsH^ from ethane do not differ very much, it is difficult to attribute the secondary CaH7+ to one of these priraary ions. A rough estiraate shows that the cross section of the formation of C2H7''' in ethane must be 100 times smaller than that of the proton transfer in water. This low cross section explains the failure to detect C2H7''' in the conventional operation of an lon source since C2H7"'' is here masked by the C^^ isotopic peak of the C2H6"'' ion.
Fragment ions in the secondary raass spectra
The secondary mass spectra in Table 2 contain a number of ions of lower raass numbers. Their secondary appearance potentials are identical with the known appearance potentials of these ions when formed by electron impact. It cannot be ruled out that primary ions are not scattered and pass through the slit system of the mass spectrometer. The collection efficiency of scattered ions is expected to be very small since raost will have coraponents of kinetic energy perpendicular to the direction of analysis. Furthermore, the scattering intensity at 90* is very low.^* This would explain the rather low relative intensities of most of the fragment ions in Table 2. The table, however, contains a few exaraples which strongly indicate that there must be additional processes of formation of secondary fragment ions.
The ion CH3 is the raost abundant in the secondary raass spectrura of methane. Its intensity is even higher than that of CH4 (the abundant lon in the primary mass spectrum). Furthermore, the secondary ionization efficiency curve of CHa"'' always runs above that of CHt'*' except for the immediate vicinity of the appearance potential of CH3 (Fig. 4). This is in contrast to the behaviour of the primary ionization efficiency curves of these lons.^^ It must be concluded that CHa"*" ions are forraed by some ion-raolecule reactions such as H" transfer from methane
or dissociative electron transfer CHs"^
CHt"*"*
+
+
CH4
CHt
-
_
CH*
CH4
+
+
CHa"*"
C H 3 +
(15)
(16)
If reaction (16) is initiated by a CH*''' lon in its ground state the energy deficit D(CH3"*'-H) has to be taken from the kinetic energy of the CH4 ion. The cross section of this process would be very small since the collision occurs adlabatlcally in the energy range studied. However, if the CH4"'" lon is forraed with an araount of vibrational energy only about one-tenth of an electron volt sraaller than D(CHa'*'-H) the rest of the energy deficit raay easily be delivered by the kinetic energy. It is at present not possible to distinguish between reactions (15) and (16). Sirailarly the CEHS"*" ion occurs with
387

100-
• 80
i 60 c 0)
40
20
(-)! I I I .CF'I ' I I I I I I I I I I I I I I 1 I I I I I I I I I I I I I I I I I I I I
0 5 10 15 20 25 30 35 40 ET 10 15 20 25 30 35 40 . 45 E-r + Eg
Fig. 5: Ionization efficiency curves of secondary iona In water (Eg ° constant at 10 volcs. Ef variable)
2- lOOh tn c <u
.1 801-c o
0 I 5 I 10 I 15 I 20 I 25 I 30 I 35 I 40 Ej 10 15 20 25 30 35 40 45 Ej+Ee
Fig. 6: Ionization efficiency curves of secondary ions In hydrogen sulfide (E = 8 volts, E J variable) *
388

10 5 I 10 I 15 I 20 I 25 I 30 I 35 | 40 ET
15 20 25 30 35 40 45 ET + EB
Fig. 7: Ionization efficiency curves of secondary ions in hydrogen chloride and ammonia (Eg - 8 voLts, E J variable)
0.18
Trap voltage ET • Fig. 8: Currenc ratio of protonated molecules and secondary parent ions as a function of
E J (Eg *• 8 volcs. 1 and r: left and right ordlnace scale, respectively)
389
abnormally high intensity in the secondary mass spectriiffl of ethane. It is therefore attributed to the analogous reactions
CEHS"*" + C2HS -> CaHe + C2H5''' (17)
°'' +• + C2HQ + C2HQ -* CgHg + CaHg + H (18)
The OH lon could not be detected in the secondary spectrum of water although its intensity as priraary lon is very high. The absence of this ion as a secondary lon would seera to corroborate the above ideas that the high intensities observed for CHa"*" and C2H5'*" cannot be due to scattering of the primary ions. It also indicates that hydride ion transfer (Eq. 19) does not occur. The ionization potential of OH seems to be
OH"*" + H2O - HpO + OH"*" (19)
slightly higher than that of water while that of CHa is much lower than that of methane (Table 2). In the case of water electron transfer
OH'*' + H2O - OH + H^d^ (20)
is expected to compete with reaction (19). Reaction 20 is of Interest in considerations of the radiation chemistry of water. It explains the fact that there is no chemical evidence of OH* although the mass spectrum of water Indicates that Off*" is formed in high yield by high energy radiation. In the case of hydrogen chloride, the fragment Cl also has a slightly higher ionization potential than the molecule. The reaction Cl"*" + HCl -» Cl + HCl"*" may therefore be responsible for the very low relative intensity of Cl"*" in the secondary mass spectrum of hydrogen chloride.
1. 2.
3. 4. 5. 6. 7. 8. 9.
10. 11. 12. 13. 14. 15.
LITEEtATURE REFERENCES
V. Cermak and Z. Herman, Nucleonics 1^, 106 (1961) H. S. W. Massey and E. H. S. Burhop, "Electronic and Ionic Impact Phenomena", Oxford, At the Clarendon Press 525 (1952) J. B. Hasted, Proc. Roy. Soc. 205 A, 421 (1951) H. B. Gilbody and J. B. Hasted, Proc. Roy. Soc. 238 A, 334 (1956) J. B. Hasted, Advances in Electronics and Electron Physics, 13 , 1 (1950) A. Rostagni, Nuovo Cimento J^, 134 (1935) Reference 2, p. 443 D. P. Stevenson and D. 0. Schlssler, J. Chem. Phys. 29, 282 (1958) P. H. Field, J. L. Franklin and F. W. Lampe, J. Am. Chera. Soc. 79. 2419 (1957) A. Henglein, Z. Naturforschung, _17a, 37 (1962) R. F. Pottle and W. H. HaralU, J. Phys. Chem. 63, 877 (1959) A. Henglein, Z. Naturforschung, 17a, 44 (1962) F. W. Lampe and F. H. Field, J. Am. Chera. Soc. 81, 3242 (1959) Reference 2, p. 496-497 A. Henglein and G. A. Muccini, Z. Naturforschung, J_5a, 584 (1960)
390

THE EFFECT OF PRESSURE SCATTERING ON HIGH PRECISION
ISOTOPIC ABUNDANCE MEASUREMENTS*
K. A. Kaiser University of Minnesota
ABSTRACT
As part of a study of the present limitations on attainable precision
in Isotopic abundance raeasureraents, pressure scattering of the raass spectroraeter
ion beara was calculated using a hard sphere scattering model. For a
conventional sector field instrument the calculations predict;
(1) asymmetric scattering tails which fall off logarithmically from abundant
mass peaks,
(2) that nearly all scattered ions which are collected come from two source
reglons--one immediately before the collector and the other immediately
before the analyzer,
(3) an apparent change in a null raethod Isotopic abundance ratio when the
collected lon beams move with respect to the collector slits. Also in
precision Isotopic gas analysis, the calculations give a natural
explanation of the "Pressure Effect" I.e. the change of a null method
isotopic abundance ratio with ion beam Intensity. Preliminary experiments
gave quantitative agreeraent with calculated values of the scattering
intensities.
* Paper submitted in partial fulfillment of the requirements for the M.S. degree.
Presently employed at the Argonne National Laboratory.
391

Ions in the Carbon Dioxide Glow Discharge
P. H. Dawson and A. W. Tickner Applied Chemistry Division, National Research Council,
Ottawa, Canada.
This work is part of a study of d.c. glow discharges in which the ions are observed by means of a mass spectrometer. The general significance of the results extends beyond the direct application to discharge physics since ion-molecule reactions will be reflected in the ion abundances that are observed.
The apparatus is shown in Figure 1. The instrument is of a conventional double-focussing type with a variable slit in the plane of the energy spectrum so that any band of ion energies can be selected. Figure 2 shows the discharge tube and ion source in greater detail. The electron gun is electrostatically focussed to avoid interference with the discharge and is used only for setting up and testing the instrument. The discharge tube cathode is movable,and, since the negative glow maintains its position relative to the cathode, movement of the cathode enables the various regions of the discharge to be sampled by the probe. Ions are drawn from the plasma by a potential difference of about twelve volts maintained between the probe and the potential of the plasma in front of the probe.
Figure 3 shows a simple physical picture of a discharge and its principal regions: the cathode dark space, the negative glow and Faraday dark space and the positive column. An important characteristic is the variation of electric field. The cathode dark space has a high field and positive ions from the front of the negative glow are accelerated to the cathode. Electrons from the cathode are accelerated to the glow and a substantial proportion reach it with energies of several hundred volts. The primary ion formation in the negative glow is therefore that caused by relatively high energy electrons. The interior of the glow,is a nearly field free region in which ions are lost mainly by diffusion to the walls and it is here that ion-molecule reactions are likely to occur. On the anode side of the negative glow, the field increases and this results in the formation of the positive column. The mean electron energy increases as the positive column is entered but energies only reach values great enough to maintain the necessary ionisation and effects requiring the lowest energies predominate, in contrast with the negative glow.
Figure 4 shows some results for a carbon dioxide discharge at 0.1 mm pressure and a current density of 0.01 mA/cm2. The major ion produced in the negative glow is, as expected, CO, . CO is also found but is much smaller than would be expected from electron impact data. It is relatively larger at the front of the glow. In the interior it probably readily undergoes charge exchange with carbon dioxide since its ionisation potential exceeds that of CO2 by only 0.2 eV. The O^^ ions have two^possible origins. They may be formed from reactions between excited CO ions and carbon dioxide molecules or by charge exchange between COj ions and oxygen molecules formed as products of the discharge. The relative displacement of the O2 maximum into the interior of the glow is consistent with both of these processes. The HCOp"*" ion closely parallels the behaviour of COj""" and is presvmiably formed Cy a reaction of CO2 with hydrogeneous impurities, such as water. The concentrations of such impurities are very small but they produce significant effects. The interior of the negative glow seems particularly suitable for the forraation of ion clusters and several are observed as shown. Clusters observed in smaller amounts and not shown in the figure were CO2.CO2 and CO.COp . The clusters must have considerable stability in order to be detected and this may have some application to current theories in radiation chemistry.
Figure 5 gives some results for a discharge at the same pressure but with a fivefold increase in current so that the discharge is more abnormal. CO"*" is about the same relative to the total level of ionisation, but Oj"*" is now the dominant ion except at the front of the glow. This is consistent with its formation from an excited COg"*" ion since it is known that in a more strongly abnormal discharge a greater proportion of the electrons reaching the glow have energies equal to the full cathode fall. The increase in 02'*" relative to 003"^ is, however, also consistent with the
392

1 l . ,p i ia l r]lB>. d u t h o r i ) .
€M ^
Figure 3 Figure J+
IONS FROM C 0 2
BESEflVOIB WtESJUBE Tmi
7
Figure 5 Figure 6
0 ^
,.-— y y / /
/ / • / / :' C01,0 / / ; 1
/ / . ,••• /
/ ico4 / ^
• .
/ /
T i y y ^
/
COj OlSCMftBCt
OlSTHNCt m o w CAtHODC- I
Figure 7 Figure 8
393

formation of O2 by charge exchange since the percentage of decomposition increases with increasing current density.
We have also studied the mass spectrum of carbon dioxide in an analytical mass spectrometer at higher than usual ion source pressures. The situation is complicated by the apparent occurrence of surface processes producing oxygen but some Oj"*" is found with an appearance potential of about 24 eV. as shown in Figure 6. This is surprisingly high since only 18.2 eV, is required for a thermoneutral reaction and excited states of CO2+ are known, from spectroscopic work, to occur at 18.2 and 19.2 eV.
Several experiments have been carried out with the CO2 discharge using different flow rates to give different overall conversions. Low flow rates and added oxygen increase the proportion of O2 but^not as much as would be expected if the increased concentration of Oj in high current density experiments was due only to charge exchange with the increased amounts of oxygen produced. It seems likely, therefore, that although the charge exchange mechanism does play some part in the occurrence of Op'^, formation by an ion-molecule reaction involving an excited CO is alio' important. Further experiments are being carried out in an attempt to assess more exactly the relative importance of the two processes
Some results at a higher pressure are shown in Figure 7. In the negative glow, CO is now smaller relative to the total ionisation, as might be expected. (The ion marked (CO2) should be C2O2 ). In the Faraday dark space 02"*" is the most abundant ion. The relative positions at vrtiich the various ions increase in abundance as the field increases at the start of the positive column gives some indication of the mechanisms of formation in this region. Figure 8 shows a logarithmic plot of the ratios of ion currents to their respective constant values in the positive column. For O2 » *' ® increase occurs nearest the cathode where the mean electron energy is lowest showing that the 02"*" is formed by the ionisj^tion of oxygen produced in the discharge. On the other hand CO2 and HCO2 are formed nearest the anode and show identical behaviour suggesting a common mode of formation requiring higher energy - that is, the ionisation of carbon dioxide. H2C()2 and HCO require an intermediate amount of energy and must form from easily ionised impurities or from excited molecules of carbon dioxide or carbon monoxide. The increase of C2O2 before that of COp"*" la in accordance with the recent finding of Field and co-workers that it can be formed by reaction of an excited carbon monoxide molecule (12.8 eV.) with another carbon monoxide molecule. No CO is observed in positive column.
In conclusion, the possible significance of these results to work on the radiation chemistry of carbon dioxide should be noted since one might expect some analogy with the discharge phenomena. Currently accepted mechanisms explaining the radiation chemistry of the gas assume that ions play little part but our results suggest that ion-molecule reactions may be important.
CAS DISCHARGE TUBE t ION SOURCE
Figure 1 Figure 2
394

DETERMINATION OF ELECTRONIC ENERGY LEVELS
OF MOLECULES BY LOW ENERGY ELECTRON IMPACT
Aron Kuppermann and Lionel M. Raff Department of Chemistry University of Illinois
Urbana, Illinois
Abstract
A raethod has been devised for deterraining electronic
energy levels of molecules by inelastic scattering of low energy
electrons. The method consists in sending a beam of monoenergetlc
electrons with energy In the range of 25 to 50 eV into a gas at about
-4 10 ram Hg pressure. The electrons scattered by the gas molecules are
energy-analysed by retarding fields produced by cylindrical grids whose
axis is the incident non-scattered beam. The energy losses of the
electrons furnish the electronic excitation energies. The electronic
tranaltlons induced Include optically forbidden ones, due to exchange
scattering. The method Is thus specially suited for the determination
of the energies of low lying excited triplet states of molecules. Using
the optical ionization potential of helium (24.585 eV) to calibrate the
3 electron beam energy, the determination of the energy of the 2 S state of
helium furnished 19.8 eV. The known optical value is 19.818 eV. Impact
spectra were also obtained for argon, ethylene and other molecules.
The apparatus will be described and the results obtained so far given.
395

PHOTOIONIZATION PROCESSES STUDIED BY MASS SPECTROMETRY
D. C. Frost, D. Mak and C. A. McDowell Department of Chemistry
University of British Columbia Vancouver 8, B. C.
Manuscript Withdrawn
396

ANALYSIS OF LOW MELTING METALS BY SPARK SOURCE MASS SPECTROMETRY
b y
J. D. Waldron and W. A. Wolstenholme Associated Electrical Industries Ltd.
Manchester, England
1. INTROPUCTION
The problem in the analysis of low melting metals by spark aource mass epectrometry is primarily one of forming suitable electrodes from the sample material. Prom this point of view gallium (melting point 29.80C; presents the most difficult problem since it becomes molten under conditions normally existing on the spark.
This paper describes techniques which have been successfully employed to analyse gallium by spark source mass spectrometry and which might be applied with advantage to other low melting metals.
2. GRAPHITE SUPPORT METHOD
The first approach to this problem was made using graphite as a supporting electrode for a globule of galliumU ). During sparking the gallium melts and spreads over the surface of the carbon, as shown in Pig.1, and enables spectra of gallium to be obtained.
The technique has the advantage of simplicity but there is strong evidence that selective distillation of certain impurities occurs and only semi-quantitative results can be given. Also it is difficult to obtain long exposures and therefore high sensitivity with this method. To achieve qviantitative determination of Impurities and high sensitivity it is therefore essential that the gallium should be In the solid state.
3. COOLED ELECTRODE TECHNIQUE
Por this method the gallium samples were prepared by etching three times in translator grade hydrochloric acid and washing in deionlzed water. The material was then melted under an infra red lamp and formed into electrodes l/l6" diameter and approximately f" long in P.T.P.E. tubing. The tubing was then cut away and the electrodes placed directly in the ion source of an A.E.I. MS7 mass spectrometer.
The lon source of the instrument was modified for this work so that the electrodes could be cooled to prevent melting while the high voltage spark is passed between them. A glass tube sealed to a metal flange was fitted to the top of the ion source as shown in Pig.2. The tube could be filled with liquid nitrogen and thei<mal contact between the cooled inner surface of the electrodes made by means of two pieces of copper braid connected to copper strips which were wrapped roTind the glass tube and clamped to the electrodes as shown. The tube was filled with liquid nitrogen after evacuation of the ion source and the level maintained by topping up approximately every 15 minutes.
Using this method of cooling analyses were carried out with spark conditions typical of those used for materials of higher melting point. The only difficulty encountered in maintaining the spark was the need to adjust the electrode rather more frequently than usual. Typical pressures in the analyser and souroe regions of the instrument during the analysis were 1 x 10-° torr and 1 x 10⁻⁶ torr respectively,
397

398

4. RESULTS OBTAINED BY THE COOLED ELECTRODE TECHNIQUE
Results obtained in the analysis of three different gallium semples are shown in Table 1. Per this analysis the concentrations were estimated by the visual method(2) on the assumption that all the elements had the same sensitivity. Significant differences were observed between the samples; the results of zinc and copper were particularly interesting for the use of gallium in semi-conductors.
TABLE 1
Element
Pb T l Hg Sn I n Ag Ge Zn Cu Pe Ca K Cl S S i Al Mg B
Sample 1
200 10
3 3 1
co.ooe 1 0 . 0 0 6 3 1 0 . 1 0 . 1 4
^ 0 . 2 0 . 1 0 . 1
^ 0 . 1 0 . 0 3
Sample 2
200 < 0 . 0 0 3
1 1000
3 2
< 0 . 0 3 6 1
^ 0 . 2 ' : 3
1 1
< • !
1 10
0 . 1 0 . 1
Sample 3
< 0 . 0 0 6 4 0 . 0 0 3 < 0 . 0 3
0 . 1 ^ 0 . 0 1 -: 0 . 0 0 6 ^ 0 . 1
0 . 0 2 ^ 0 . 0 3
0 . 0 3 0 . 3
4 0 . 0 1 0 . 1 0 . 6
-^0.3 0 . 1
/ . O . l ^ 0 . 0 1
As with normal samples more accurate determinations of concentration were carried out for certain elements using a microdensitometer. The densities of the impurity and the gallium lines were measured and plotted against the logarithm of the exposure (I.e. the total integrated monitor current). The results obtained for the 208pb+, 205T1+, 63cu+ and 'iGa+ lines are shown in Pig.3. Prom these plots the exposures required to produce a given density for the gallium and the impurity element were compared and an estimate of the impurity concentration obtained by substituting the values of exposure so calculated in the same expression as that used for the visual method.
Table 2 shows the results obtained for the concentrations of lead, copper and thallium in three analyses of one sample. Although more analyses are required in order to obtain really meaningful statistics the results suggest that the reproducibility of the method is of the order of 25%.
Plate
TABLE
Pb
104 129 135
2
C o n c e n t r a t i o n
Cu
3 . 4 3 . 4 5 . 6
(pT>m a t o m i c )
T l
4 . 5 3 . 1 4 . 1
399

ANALYSIS OF GALLIUM USING GRAPHITE SUPPORTING ELECTRODES.
Pig . l .
ISO
I 4 0 •
I30- •
l a o •
n o
IOO-
9 0
eo •
7a
60-
so
40-
3a
20
ANALYSIS OF GALLIUM ANALYTICAL CURVES.
(3a oniyj -oooi (Pb only) .1 (Cu « T?j t
^
INTEGRATED MONITOR CURRENT ( m M COulOmbs!)
Pig.3 .
- ^ 1 ( t (
T IOO
1 0 0 0
400

Table 3 gives the estimated limits of detection of the method for 72 elements in gallium. These limits have been estimated from the photographic plate on the basis of a longest exposure of 10-6 coulombs. An exposure of this length can be obtained with gallium in approximately 2 i hours.
TABLE 3
Element
Uranitun Thorium Bismuth Lead Thallium Mercury Gold Platinum Iriditun Osmium Rhenium Tungst en Tantaltun Hafnium Lutetium Ytterbium Thulium Erbium Holmium Dysprosium Terbium Gadolinium Europium Samarium Neodymixun Praseodymium Cerium Lanthanum Barium Ceslvun Iodine Tellurium Antimony Tin Indium Cadmium Silver
Limit of Detection
0.003 0.003 0.01 0.006 0.003 0.01 0.03 0.01 0.006 0.006 0.006 0.01 0.1 0.01 0.003 0.01 0.003 0.01 0.003 0.01 0.003 0.01 0.006 0.01 0.01 .03 .1 .01 .1
0.01 0.003 0.01 0.006 0.01 0.003 0.01 0.006
0. 0. 0. 0.
Element
Palladium Rhodium Ruthenium Molybdenum Niobium Zirconium Yttrium Strontium Rubidium Bromine Selenium Arsenic Germanium Zinc Copper Nickel Cobalt Iron Manganese Chromium Vanadium Titanivim Scandium Calcium Potassium Chlorine Sulphur Phosphorus Silicon Aluminium Magnesium Sodium Fluorine Boron Beryllium Lithium
- overlap by
Limit of Detection
0.01 0.003 0.01 0.01 0.003 0.006 0.003 0.1 0.01 0.02 0.1 0.01 0.03 0.006 0.01 0.003 0.003 0.003 0.003 0.003 0.01 0.1 0.01 0.03 0.01 0.04 0.03 0.01 0.03 0.01 0.1
No value 0.01 0.003 0.01 0.01
69Ga3*
COMPARISON WITH STANDARDS
Two samples doped with approximately 0.8 ppm by weight of copper and zinc respectively were cast into rods in p.v.c. sheathing and then etched in the same way as indicated above before being mounted in the lon source.
401

In Table 4 the results obtained by mass spectrometry are compared with those obtained by neutron activation analysis.
TABLE 4
Mass Spectrometry Neutron Activation
1 2 Mean
Cu concentration (ppm wt) 0.90 0.72 0.81 1.3
Zn concentration (ppm wt) 0.66 0.91 0.79 1.0
Bearing in mind that the mass spectrometric results were calculated on the assumption that the elements copper, zinc and gallium all had the same sensitivity, the agreement between the mass spectrometric and neutron activation analyses is encouraging. This is particularly the case with zinc which was observed to give spuriously high results in the graphite support technique due to selective distillation effects.
The difference between the neutron activation and mass spectrometric results should not be taken as Indicating an absolute error In one or other method. Accepting the neutron activation figures as correct, the results suggest that copper and zinc have low relative sensitivities in the spark compared with gallium,
6, CONCLUSIONS
Spark source mass spectrometry can be successfully applied to the estimation of impurities in gallium by cooling the electrodes. The cooled electrode technique has a number of advantages over the graphite support method in that firstly, it enables longer exposures and therefore lower limits of detection to be obtained (about a factor of 30), secondly, selective distillation of impurities is prevented and thirdly, the possibility of interference from the graphite support electrode is removed.
It is possible that the technique could be applied with advantage to other low melting metals such as indium (melting point 156.4°C). Althoiigh indium does not actually melt during sparking there have been indications that impurity elements auch as zinc may give spuriously high results due to selective distillation effects and this might be reduced by using the cooled electrode technique.
ACKNOWLEDGEMENT
The authors wish to thank Mr. J. A. James of Associated Electrical Industries (Rugby) Ltd. for making available the results of the neutron activation analysis.
REFERENCES
1. R. Brown, R.D. Craig, J. A. James and C.M. Wilson "Analysis of Trace Impurities by Spark Source Mass Spectrometry". Proceedings of Boston Conference on Ultra-purification of Semiconductor Materials, 1961 (to be published by Macmillan).
2. R.D. Craig, G.A. Errock and J.D. Waldron "Advances in Mass Spectrometry" Edited by J.D. Waldron, Pergamon Press, 1959, p.143.
402

ION CHARGE DISTRIBUTION IN AM R. F. SPARK ION SOURCE AND ITS EFFECT ON QUANTITATIVE ANALYSIS
Edward B. Owens Lincoln Laboratory,* Massachusetts Institute of Technology
Lexington 73> Massachusetts
SUMMARY
Data are presented showing the lon charge distribution observed from an r. f. spark souroe with sarapiles of GaAs, GaSb, InAs, InSb and stainless steel. The experiments were performed with source conditions varied to have pulse lengths of 5j kO, y i , and l60 microseconds, repetition rates of 100 and 1000 pulses per second, and spark voltages of 30 and 90 kv. Ilford Qg plates were used for the ion detector.
The emulsion was calibrated by the "two line" method to convert the nou-llnear photographic data to ion density values. The line widths were taken Into consideration by multiplying the peak ion density of a line by the width of the line at half peak ion density. Background corrections were made by subtracting the ion densities due to the background from the ion density values of the lines. The validity of this method of handling photographic data was demonstrated with results of two experiments. One experiment was to put constant exposures on a plate while changing the magnet to plate distance to deliberately cause the lines to broaden. With line widths changing by a factor of two, the number of ions determined from the photographic data was constant within 10°/o. The second verifying experiment was to measure isotope ratios. The relative abundance of Sb and of Ga isotopes determined with this method agreed with the accepted values within 5 /6..
In all the exposures used in tliese tests the charge exchange lines, the polymer lines, and tUe triply charged lines were observed to contribute not more than l°/o to the total number of ions striking the plate. Therefore the charge distribution of an element in an exposure was reported as the number of singly charged ions of that element divided by the total of singly charged ions plus doubly charged ions of that element. Detailed examination of the data revealed:
1) The charge distribution is not the same for all materials under all conditions. There is no single, universally applicable constant.
2) The charge distribution is oonstant to within about 5°/o for a given element in a given matrix sparked with constant source conditions, but differs for the same matrix under different source conditions and for different matrices under the same source condition.
3) For each material tested the ion charge distributions of the constituent elements fluctuated together. That is, under a given source condition the constituent elements of a sample all have approximately the same lon charge distribution. This is a highly desirable condition because when it exists only a small error will result in the quantitative analysis if the multiply charged ions are neglected and the element concentrations are determined from the ratios of the singly charged ions.
If) No consistent pattern was found for the relationship between the ion charge distribution and a change in pulse length, the number of pulses per second, or the sparking voltage.
Additional information was obtained from this Investigation by using the data to calculate the composition of the ion beam from eaoh of the III-V semiconductor compounds used. These compounds have a one-to-one ratio (at least to within 1 ppm) for the two elements in the solid sample. The results showed the ion beam from GaAs to be 52 to 53°/fc Ga, from GaSb to be 54 to 64°/o Ga, from InAs to be 50 to 59°/o In, and from InSb to be 57 to 6 3 ° / o In. The error terms for these experiments are such that the composition of the beams from GaAs and InAs are probably not significantly different 50 - 50. It was found also that after prolonged sparking the ion beam from GaAs became predominantly Ga (87 to 97°/° Ga), indicating perhaps a loss of the more volatile As from the area of sparking. No other compound showed this effect.
•Operated with support from the U. S. Army, Navy, and Air Force.
403

PHOTOGRAPHIC QUANTITATIVE ANALYSIS WITH A SOLIDS SPARK HASS SPECTROGRAPH
By
C. W. Hull Consolidated Electrodynamics Corporation
Pasadena, California
ABSTRACT
Any method of quantitative analysis with a mass spectrograph, which uses a photoplate as a detector, must take several factors Into consideration.
In the spectrograph, every mass Is focused at a different radius. This introduces two quantitative problems.
1. Line width and shape vary across the plate.
2. The lon transmission of the instrument itself varies with path length.
The photoplate as a detector also offers various problems.
3. The emulsion does not darken In a linear manner, and the darkening characteristics change from plate to plate.
k. The sensitivity of the eniulston exhibits lon mass dependence, ion energy dependence, and may have chemical dependence as well.
5. Errors may be introduced In the densitometry.
Also, the problems that exist In any mass focusing instrument are present.
6. Space charge may broaden the ion beam,
7 . A substantial background level may exist, due In this case to gas scattering.
And In the spark source, two problems are significant.
8. The ratio of singly charged to multiply and fractionally charged Ions may vary, both from element to element and with time,
9. Ionization efficiency changes from element to element.
Each of these effects can contribute an error In a quantitative calculation. A quantitative method has been developed which gives consistent results, which can lead to analysis by comparison with known standards, and gives a more refined method of studying the problems Inherent In the system.
I. DISCUSSION OF PROBLEMS
A. Calibratlon Curve
In photographic quantitative analysis, the first thing that must be determined Is the relationship between the number of ions striking the emulsion and the darkening effect they have on the plate.
Such a "calibration curve" is necessary not only for relating densitometer transmission scans to exposure, but is essential for measuring line widths and studying line shapes.
Also, at least with the plates now being used. It is quite essential that some sort of a calibration be done on each plate. Both sensitivity and curve shape change from plate to plate, even under carefully controlled developing conditions.
404

0 " — O.OI
- I 1 — I I I I I I "
FIGURE I
VARIATION OF CALIBRATION CURVE FROM PLATE TO PLATE FOR ILFORD 0 2 , DEVELOPED FOR 7 MIN. IN DI9
T I • T - I I I I I I
O.l 1.0
EXPOSURE,E
IOO
FIGURE 2
CALIBRATION CURVE FOR PLATE P-264 TUNGSTEN ILFORD Q2 DEVELOPED 7 MIN. IN DI9
1.0
EXPOSURE,E 10 IOO
405

Figure 1 shows how the slope of the calibrat icn curve can change from plate to plate. Using a curve calibrated from some previous plate could lead to an error of several hundred percent, even if normalized for sensitivity.
The variation from plate to plate is not well understood, but is often attributed to changes in the emulsion due to heat and vacuum. The calibration within a plate is relatively consistent.
There are several empirical methods available for calibrating a plate. One method is to make a series of exposures by measuring the total ion beam electrically with a beam monitor and covering the dynamic range of the photoplate. The dependability of this method depends upon the accuracy of the beam monitor and upon the stability of the ratio of singly to multiply and fractionally charged ions.
Also, various methods using known isotope abundances have been used successfully,' and are useful when the errors of the beam monitor method are excessive.
A device often found convenient is to "curve match" the experimental data to an empirical equation that Is known to match a correct calibration curve. Ilford (i2 plates are found to normalize to within a few percent to the function.
T(E) : I + E R
or, solved for E
• ( - ^ )
l/R
Here T Is optical transmission, T ^ is the saturation transmission, R Is an experimental constant between I and 1.5, and E is "relative exposure," norraalized to unity at
Figure 1 is this function, solved for
I + E R
and plotted for several values of R.
Figure 2 is that function, normalized to an experimental calibration curve of tungsten. The curve matching method seems to be the best for interpolation and for extrapolation to small exposures.
B. Line Width And Shape
When using an Ion-sensitive plate as a detector, there are two assumptions generally made about its collective properties. The first Is that the reciprocity law is not violated, consequently the plate is a perfect Integrator over time.
] / E. Owens,"Quantitatlve Analysis in a Solid State Mass Spectrograph," paper delivered before American Cheraical Society, Washington, D.C, March, 1962.
406

-100%
FIGURE 3
WIDTH AT 1/2 HEIGHT
GRAPHICAL TRANSFORMATION OF OPTICAL TRANSMISSION SCAN INTO EXPOSURE DISTRIBUTION CURVE
0.9
0.8
FIGURE 4
VARIATION OF LINE SHAPE WITH RADIUS, AT CONSTANT MASS AND INTENSITY
SOLID LINE IS
E/Eo= ,-.692(W/W|/2)2
1.0 1.5 2.0 2.5 3.0
407

The second assumption is that the exposure on the plate is proportional to the charge striking the plate, point for point, and hence the plate Is a perfect integrator across the line. Within what limits these assumptions are t rue is not yet wel1 known.
After the calibration curve has been determined, the integration across the line may be performed. Figure 3 shows how the optical transmission scan, as obtained from the densitometer, could be transformed into an exposure distribution curve.
This curve could be integrated by counting squares or using a planlmeter, but it Is generally much more convenient to determine only the half exposure height and assume that the integral Is the product of the exposure, the width at half exposure height, and a shape factor. As long as the shape factor is constant, area corrections may be made by making width corrections only. Figure k shows the variance in peak shape found across the plate. The area under that normalized curve has a maximun change of about 7%.
The width itself, however, may change considerably more than this. Figure 5 shows how line width varies across the plate. This variance is a function of the Individual spectrograph, but a factor of two is not uncommon.
Figure 6 shows line broadening due to space charge effects. It is a plot of line width versus Isotope ratio for tungsten. Here the change in width Is only around 20%. However, analytical errors up to a factor of eight have been observed due to this effect.
C. lon Transmission
The ion beam ts not collimated in the vertical direction, so that the number of ions transmitted through the magnetic analyzer at high radius Is less than the number transmitted at low radius. Figure 7 shows this magnetic analyzer efficiency function, as derived from the geometry of the spectrograph. Again an error of up to a factor of two could result If a correction for the effect were not made.
D. Background And Dens Itometer Errors
Various types of background effects almost always exist around the low abundance lines. For background due to gas scattering, the densitometer reading for the background should be converted to exposure from the calibration curve, and this exposure should be subtracted from the peak exposure of the line. Quite consistent results have come from this technique.
However, drift in the densitometer cannot be corrected in this manner, nor have good results been obtained where the development fog was Inconsistent across the plate.
Another error may result due to the finite width of the densitometer slit. As a close approximation. It can be shown that the error due to silt width averaging Is
T|/2-TMIN / Wd ^ A T =
Where Tmn is the peak transmission, T| 2 '^ ^^^ transmission at half exposure height, W]/2 Is the width at half exposure, and Wj is the effective width of the densitometer silt. If Wj Is near W1/2 • errors of about 10% In TJ^KJ, or up to 30% in exposure may result. Wd being finite contributes other errors, but in the highly non-linear case of a photoplate the shift in T^IN 's the most significant.
408

1.0
X I-9
l i j h >
lli oc
.2
FIGURE 5
VARIATION OF LINE WIDTH WITH PATH LENGTH, FOR CONSTANT MASS AND INTENSITY
4 6 8 10
INCHES ALONG PLATE (X)
12 14
1.0
O.l
FIGURE 6
VARIATION OF LINE WIDTH WITH INTENSITY, AT CONSTANT MASS AND RADIUS
O.OI
0.001 .0 l.l
RELATIVE LINE WIDTH
409
1.2 1.3

E. Example
Figure 8 shows how the measurements just discussed are made on a typical peak. T H I N IS 0.288, and is converted to E^AX ~ 2.'16 from the calibration curve. ^BAK " 0-692 Is also converted to EB/\|^ " O.518. The half exposure height Is then
E M A X - ^ B A K ^ ^ EMAX + ^BAK E| /2 = 5 + E B 4 K = 3 = I-'IS
Again from the calibration curve Ej/2 '* converted to T1/2 • O.'tOJ, and the peak width Is measured at this Tjy2 point. W)/2 '* found to be O.I6.
Next, the A T due to densitometer slit averaging Is calculated and found to be .015, so that
""•MIN - ^ T = .288 - .015 = .273
and from the corrected T a corrected E Is found
t/HAX + A E = 2.67
Table 1 lists the effects of making the various corrections discussed concerning Figure 8. Here the line width correction and the background correction are the most significant, although this need not be the case.
F. Other Errors
Although the total of these effects is significant, others just as important have not been considered. The sensitivity of the plate is dependent upon ion mass. Ion energy, and may have a chemical dependence. These effects have been Investigated by Owens,^ Ewald,3 and Hintenberger.'^ The variance experienced is similar to that found in electron multiplier detection of Ions.
Also, the relationship of the numbers of singly charged Ions to multiply and fractionally charged Ions clearly affects any analysis. This has been Investigated by Owens.5
And lastly, due to a lack of analytical tools, the relative Ionization efficiencies of the elements in a spark have not yet been deterrained to any high degree of sophisticatlon.6
The latter two problems, however, are not problems Introduced by photoplate detection, but come from the spark source Itself. The photoplate detector will be most helpful In determining both charge ratio patterns and ionization efficiencies.
Also, the corrections of Table 1 would have to be made, in some manner or another, with any type of detecting system attempting to detect at more than one radI us.
2/ E. Owens, "The Effect of Ion Mass and lon Energy on the Sensitivity of Ilford Q2 Plates as lon Detectors in Mass Spectroscopy," Lincoln Laboratory Report J A - 1855.
y F. Burlefinger and H. Ewald, Z. Naturforschung, p. 430, April, I96I.
k J E, Dornenburg and H, Hintenberger, Z. Naturforschung, p. 676, July, I96I.
^/ E. Owens, "lon Charge Distribution in an R. F. Spark lon Source and Its Effect on Quantitative Analysis," paper delivered before ASTM Committee E-14 Meeting on Hass Spectrometry, June, I96Z.
6/ B. Chakravarty, V. S. Venkatasubramanian, and H. E, Duckworth, "Relative Ionization Efficiencies for Elements In a Spark Source," delivered before symposium on Mass Spectrometry, Oxford, September, 1961.
410

100%
90%
8 0 % •
70%
60%
50%
40%
FIGURE 7
MAGNETIC ANALYZER EFFICIENCY FUNCTION FOR CEC 21-110-P
^^^^ I + 0.0625 (2.275+X)
2 4 6 8 10
INCHES ALONG PLATE (X)
12 14
O.l
0.2
0.3
0.4
0.5
0.6
0.7
0.8
0.9 -
1.0'
M o ^ PEAK, 10 23 .8%
Q = |xl0-8 X=7.58 IN, FMA ' ' - 6 I8 ,WR£F = . 2 6 4
= 1.4X10 ' ^ F „ A _ = . 5 7 5 ^REF
T M I N - ' ^ T = . 2 7 3
E M A X + ^ E = 2 . 6 7
'REF
^MIN"'288 E M A X = 2 . 4 6
EMAX*EeAK _ W„2 =.16 — j p — 2 E|/2°"-49
T,-, = .405
T B . K = . 6 9 2 BAK
BAK 3 ^ = .518
ABUNDANCE, UNCORRECTED 0.145% CORRECTED 0.071%
FIGURE 8
411

ABUNDANCE CORRECTIONS
CORRECTION ABUNDANCE DEVIATION
NONE 0.145% 0
BACKGROUND 0.114% - 2 7 . 2 %
LINE WIDTH 0.088% - 6 4 . 8 %
SLIT WIDTH 0,157% + 7.6%
ANALYZER EFFICIENCY 0.135% - 7.4%
ALL ABOVE 0,071% -103.0%
TABLE I
I I . ANALYTICAL
Under ideal cond i t i ons , the basic accuracy of the photoplate is good. The isotope ra t i os of tungsten. Figure 2, were determined to w i t h i n 3% of the publ ished values (c loser f o r the major i so topes) . A t race impur i ty of I ron in aluminum at 0.8 ppm has been reproduced to w i t h i n 3.5% from one p la te to another. And, in genera l , when a p la te i s analyzed and several l i nes are ava i l ab le fo r ana l ys i s , a f t e r proper background and width cor rec t ions have been made the concentrat ions determined vary by less than 20%.
This suggests that an analyst in teres ted in de tec t ing element A in matr ix B, by comparison w i t h known standards, should be able to do so w i t h good accuracy to low de tec t ion l i m i t s .
I t a lso suggests that the photoplate can be a good tool f o r s tudying Ion iz ing e f f e c t s in the spark source. And in- the event that these e f f e c t s are p red i c tab le , general ana lys is should be as accurate as ana lys is by known standard comparison.
412

IMPROVED ACCURACY IN SOLIDS MASS SPECTROMETRY
George D. Perkins and Charles F. Robinson BeLl and HowelL Research Center
Pasadena, California
Manuscript Withdrawn
413

THE AP?LIC/.TIOy 0? SFAIB: SOURCE ;:.''.5S 3PECTR0;;ni:TRY
TOANiLYTICAL PP.CBLffitS AP.ISIKG IN AK ATOMIC EI?3RG'f IITLUSTRY
R. G. F i t z s i m n o n s , "1. F l e t c h e r and R. Tushingham
An atomic energy proeranme p r e s e n t s many problems t o t h e E .na ly t ioa l . chemis t and to meet t h i s c h a l l e n g e i t i s e s s e n t i a l t o e x p l o i t t h e new i n s t r u m e n t s and t e c h n i q u e s . This paper d e s c r i b e s some of t h e w a y s . i n which t h e newly a v a i l a b l e spa rk s o u r c e mass s p e c t r o m e t e r , A . E , I , Type " S , 7 , " ' h r s heen of v a l u e .
One of t h e a t t r a c t i v e f e a t u r e s of t h i s ins t ru raen t i s i t s a b i l i t y t o y i e l d a g r e a t de.il of inform' ' . t ion about e s s e n t i n l l y pure s u b s t a n c e s when only a fe?; rr.illiGrams of tive mn-ter ia l r.re a v a l l . o b l e . This f e a t u r e has been e x p l o i t e d i n t h e a n a l y s i s of o r y s t . a l s of n a t u r a l g r a p h i t e ivhich have been p u r i f i e d hy Dr. J . v.. Thomas^^' of U n i v e r s i t y Co l l ege of Nor th •Vsles, Eangor , These c r y s t a l s v/eigh.3d about 2 mg each and '.vere ahout 3 mm, squa re by 0 .1 mm. t h i c k . F i g , 1 shews t h e s i z e of such a c r y s t a l compared w i th an e l e c t r o d e of normall.v accep t ed s i z e and s h a p e . The problem of i n t r o d u c i n g t h e c r y s t a l s i n t o t i ie spa rk was so lved hy s u p p o r t i n g them in e x t e n s i o n e l e c t r o d e s of h igh i^virity indium m e t a l . Indium was chos jn bac-iuse i t nas r e a d i l y o b t a i n a b l e i n a s t a t e of h igh c u r i t y , was v e r y m a l l e a b l e and p o s s e s s e d two i s o t o p e s of odd mass numbers ( I n ' • . I n ^ ^ 5 ) . This l a s t proport .v makes t h e indium r e a d i l y i d e n t i f i a b l e and e n s u r e s t h a t i t s m u l t i p l y charged i ons produce n e g l i g i b l o i n t e r f e r e n c e s a t l o ' - e r m a s s e s . ITo d i f f i c u l t y was e x p e r i e n c e d i n s t r i k i n g a spa rk between two c r y s t a l s mounted i n t h i s way. The s p a r k , which d id not wander from t h e c r y s t a l s , could he ma in ta inen f o r s e v e r a l hours v.'hen n e c e s s a r y and l i m i t s of d e t e c t i o n of 0 ,01 ppm. atomic vjcre r e a d i l y o b t a i n a h l e , Ovor for t j^ i m p u r i t y e l emen t s " 'sre d e t e c t e d i n ^ouie of t h e s a m p l e s . An example of tha r e s u l t s o b t a i n e d i s g i v e n i n Tabla I ,
TaMo I
A'.i.'^l.Yscs 01 Graph i t e Cr .vs ta l s
R e s u l t s quoted aro £i.s p . p . m . v^t/wt v.'ith r e s p e c t t o c a r b o n .
ELIT-T OT
Detn , 1
Ee tn , 2
Detn . 3
D.-;tn. '..
D o t - . 5
Pot;-.. 6
'>5f:?'.r^ie-.-.-:
Cu
0 , 6
1.5
0 , 2
^ , k
0..'..
0 , 3
y
VA
0,3
3
0.05
1.0
0,1^.
n . f
, or's-'
Co
<o,05
<o,05
<o.55
.•^•,03
<0.1
.-0.05
-
Fe
9
10
2
k
12
T ^
^0" '
:.:n
<o,o5
0 . 1 3
0 .05
^ . 1
0 . 2
0 . - .
i-.r\-
Cr
1,2
3
0,1 .
1.3
1.1
0 , 0
75r-
V
0 , 2
<0,1
0 . 2
0 .1
0 . 2
^.^
5()':
Ti
<0 .7
<0.7
1.2
1.1
1
A P
' .y
3c
<o.o;+
=0.0.1+
' i .O/ t
0 .7
0 .07
^ . 0 4
-
Ca
2000
20
13
15
60
30
-
K
<3
<3
< ; L
0 . t
0 . 6
0 . 2
-
••hi t j c - "'' ''••'•311 r-ot-^"?' ' ' frO:'.! PL ^'^^l•' -ctocl
4 1 4

*
s
415

Carbon i s one of the few elements which produce polyatomic ions in significa,nt numbers. Visual examination of the speotra obtained in t h i s work s!!Ov;ed tha t the r e l a t ive abundance of the polyatomic carbon ions did not f a l l off uniformly with increasing carbon numher.
Fig. 2 shows the var ia t ion of r e l a t i ve abundance of the ions with carbon number, Sac'v point on the graph i s the mean of eight separate detetminations. Up to a carbon number of eight , the abundance f a l l s off vrith carbon number with flVin-odd intenni ty a l t e rna t ions . This posi t ive ion pat tern is similar to that obtained by Honig'--^' and agrees with the predict ion of P i tzer and Clementl^^', Above a crrbon numher of eight the pat tern becomes more confused. This modification at hi:?hcr oarhor. numbers may v.-ell be due to Jhe high local temperatures in the spark, quoted by .V.imov and llalkov*'--^ as 5 ^ 10'+ K.
The great s e n s i t i v i t y and small s<--mple requirements of spark source mass spectro.T.etry has permitted the exanination of small areas and corrosion cav i t i e s in alloys and gr.aphita. In th i s case the technique consists of holding a fine probe of ahout 0.5 mm. diameter close to the araa or cavity to ba examined and maintaining the spark, between the probe and the area under t e s t . The probe i s made of similar material to that of the saraple but of higher pur i ty , as shown by previous analys is . For example, in the case of graphite, spectroscopical ly pure graphito is employed as the probe. Fig. 3 i s a nhotograph showing the pr'o' Q ' r.cl 3.a.T.ple mounted for inser t ion in the source. The value of t h i s technique i s in comparing the i.-Tipurities procent on small araas of the surface. Using th i s technique detection l imi t s of about 0,5 p,p,r.'.. atomic v/ere obtained and i t v/as found tha t the spark could be loo-.lised to an area of about 1 sq, mm. The surface was penetrated to about 0,1 mm. dui'ing the analys is . At levels above 10 p,p.m, atonic detenninations v/ith a coefficient of var ia t ion of 70/c' v/ere obtained v/ithout the use of m.icrophotometry of the p l a t e s . Fig, k shows som.e corrosion cavi t ies in a commercially availahle graphite '.'/hich were examined by th is technique, Tlie da.ma3e caused "by the spark can be c lea r ly seen, indicating the sraall area examined. Using th i s method concentrat ions of impurities in the cav i t i es have been deteoted a.nd the invest ig. ' t ion is continuing,
Surface imp'urities and var ia t ion of impurity content with depth have been studied. In these cases samples '.vere obtained by milling the specimens and segregating tha different l aye r s . The mill ings v,-ere then oompa.cted under pressure in a mculc^ing die to produce a sui table electrode form.
During t h i s -.vork d i f f i cu l ty '.'.'as experienced with the examination of magnesium a l loys . The efficiency of ionisa t ion of raagensium in the spark souroe proved to lie shout ton times gro-ater than exp'ected. Consetiuently in' ovder to meet a given detection l imit the exposure had to be ten times longer than normal. The high v o l a t i l i t y of tlie rr.agnesium ca'ased e l e c t r i c a l leakage in tlie source, ovarloading the accelerating voltage pov/er aupply. I t was therefore necessary to l imit the ion current v/hioh slov.'ed down the r a t s of an.alysis s t i l ? fur ther .
This technique of milling and recompactir.g has also been used to investig.ate the diffusion of metals throi:igh other metals. Table I I sho'/is some resu l t s obtained for a sample '.vhich had been held in contact with uranium at 500"C for one v/eek.
Table I I
Migration of Uranium in a s.ample .rftcr contact at 500"0 for 1 '.veek
Distance from contact surface
0 - 0.005"
0.005" - 0,010"
0,010" - 0,015"
Uranium content p,p.m. by weight
9 7
0,5 l . k
<o,4 <o,5
416

Fig. 3. Photogr.iph showing the prcbc and sample mnur.ted for insertion in the
Gourco,
Pig. 1^, Corrosion cavities in a commercially avp.ilable graphite examined by " this technique.
417

All the studios reported above have employed visual examination of the photographic alates. Mors accurate results can be obtained using miorophotometry. Here it has been found advantageous to calibrate the photographic plate Qsing a polyisotopic element. The relative abundance of its isotopes are knov/n and by plotting the product of isotopic abundance and total integrated ch.arge ag.ainst density, ma.ny points bocomie available for defining the characteristic curve, Curvss obtained in this way are sliown in Fig. 5 and 6 , Using, the more usual toolinique of plotting relative expos'aro against density only ahout four points v/ill bo on the linear portion of the ourve. Adoption of the isotopic method '.vhen analysing a st.andard copper alloy (Johnson laatthey C.I4O) gave a coefficient of variation of 20" instead of tho 25f- to 30'? using the older teo/uiique,
AC!aio-,vLSDG:;.is:T
The authors '.'.Ish to express their thanks to Mr, G. G. Cookson and Mr, '.7, G. Griffiths who helped with the analytical deteiminations. Tbe authors also wish to thank the i anaging Director, U.K.A.3.A., Production Group for his permission to publish this paper,
?."F3T;3TTCi:s
1, E l l i o t t , R, ?.:., C r a i g h , R, D . , and E r r o c k , G. A. P r o c . F i f t h I n t e r i i a ' t i o n a l I n s t r u m e n t s and l ieasurement Confe rence , Stockholm, 1960'
2 , Hughes, E. S, G, a.nd Thomas, J , U , ,
n a t u r e , 1 2 3 , 83'3 ( 1 9 ^ 2 ) .
3 , Honig, R. E . , Symposium on Uass Dpeotrometry , Oxford, I 9 6 I ,
k . P i t z e r , K. S, .and C l e m e n t l , E . , J . .'u::. Chera. Soo. 8 l j 4477 t 1 9 5 9 ) ,
5 , Akiniov, E. A. and Malkov, B, P , , Op t i c s and S p e c t r o s c o p y , 6_, 56 (1959^ .
418

STANDARD COPPER ALLOY CAO 02 EMULS ON
001 o to Isotope abundance x total integrated charge
OOI Ol l.o " •
Isotope abundance x total integrated charge
F i g . 3 t'o (.. C i i - r " c t c r i r bic cu rves f o r r^ho•^,o,•'r-'•-hic -.-i . i i .es,
419
IO

High T emperature Vqporlza»-lon S<-udles '
J ,Drowart.
La'boratoire de Chimle Physique I 'loleculalre
Un!ver3lti5 Libre de Bruxelles
Brusse l s , Belgium
The present r epo r t sumr'arlzes work done during the pas t one
and a ha l f .vears a*- ••he Laborai-olre de Chimle Physique l/'ol^cu-
l a i r e , Dnlver3l<-y of Brusse l s . !•• p resen t s d e f i n i t e rej^ults for
a numher of systems and pre l iminary ones for C-hers s ' - l l l under
I n v e s t l g a t i on. (1.2)
The mass specTome ^er and experimental t-oohnlque have (a ,4)
been descr ibed previous ly . B r i e f l y , ob<-alnlng *-hermooheml-
cal d9*-a I s based upon <-he evapora*-lon of "-he sample from a
Knudsen c e l l of known •-emper.-iture, forma'•lon of a molecular
beam, lonlza '- lon of "-he n e u t r a l species by e l ec t ron impac*- wlt-h
elec^-rons of ad jus tab le energy (5-70 ev.). and Iden'-lf i ca*-lon
of *-he paren*- molecules from '•he mass, appearance po^-en'-ial and
Ion iza t ion e f f i c i ency curves of the i ons . Pres--ure3 P, are ob-
"-alned for "-he var ious molecules so Iden'- lf led f-hrough p r e s
sure c a l i b r a t i o n s based on quan'-l'^a^lve evaporat ions of known
amoun"-s of '-he sample or of pressure callbran'^s, or on the
observa'^lon of known e q u i l i b r i a . The f i r s ' - nrocedure r equ i r e s
in general knowledge of i-he re la ' - lve Ion iza t ion cross sec t ions
of species of rainor Importance. The second procedure r e q u i r e s
•-his knowledge for a l l spec ie s , Including '-he pressure cal lbran ' - .
These cross seC-lons are el '-her measured by simul'-aneous or suc
cess ive qjan'"i'-a'-lve evapora'-lons of the sample and of a r e f e -(5 ,6)
rence element, <-he study of congruen'-ly vaporizing compounds (7,10)
of '-he use of double oven '-echnlques , or derived from (11)
oalcula'-ed values
Heats of r e a c t i o n AH° are oalcula'-ed from '•he re ia ' - lons o
AH° = AF° - TA[(F,^ - H ° ) / T J
or AH° = - R dlnK/d( l /T)
where AF° = - RT InK Is the change In free energy
421

K = fr. p. •"" '-he equilibrium cons'-iin'-,
Vl '-he s'-oechlometric coeff'cien'- for each reac'-an'- or
produC- In '-he reaction considered.
A{F° - H°)/T]the difference In free energy funC-lon ^> T o "
of products and reaC-ants,
T t-he absolute tempera'-ure.
Dlasoola'-lon energies D° given below were obtained either direC-]
from equil ibria of '-he i-ype
AB(g) . . A(g) + B(g) + D°(AB)
or from '-hermochemical cycles
AB(3) ». AB(g) -f AH°(3Ubl,AB)
AB(g) A(g) + B(g) + D°(AB)
A(g) A(s) -4H°(subl,A) o
B(g) B(3) -4H°(-ubl,B) o
A(s) -i- B(s) AB(s) - aH°(form,AB) o
The sys'-ems s'-udied comprise elemen's, al loys, carbides, oxides,
sulfides, selenldes and te l lur ides . The resul ts ob'-ained are as
follows.
AHg or D° in kcal/mole ref.
128.0 t 2.5 l . .
65.5 t 5.5 12
97.2 ± 5 13,14
(ob'-ained in '-he s'-udy of CaS, SrS and BaS (see 5)
S e ^ { g ) 2 Se(g) 77,2 ± 5 14
(obtained In the study of ZnSe (see 9)
Alloys.
AgSn(g) Ag(g) + Sn(g) 31.6 ± 5 15
CuSn(g) Cu(g) + Sn(g) 41.4 ± 4 15
AuSn(g) Au(g) + Sn(g) 57.5 t 4 15
AuCr(g) Au(g) • Cr(g) 50.4 ± 3.5 16
422
Elemen
B(s)
% ( e )
S 2 ( g )
Reac
' • s
t i o n
B(g)
2 B(g)
2 S ( g )

A u P d ( g ) _ Au(g) - P d ( g ) 3 3 . 3 - 5 15
3 . Sys tems Boron-Carbon and B o r o n - C a r b o n - S l l i c o n
1/4 B4C(3)
BC(g)
% C ( g )
BC2(g)
B S l ( g )
BCSl(g)
B(g) -H 1/4 C(g
B(g) -• C(g)
2 B(g) + C(g)
B(g) + 2 C(g)
B(g) • S i ( g )
B(g ) + C(g) +
;raphl*-e)
SMg)
1 3 1 , 5
1 0 5
2 6 0
30B
7 0
2^50
± 2 . 5
t 10
t 10
t 10
t 10
t 10
12
17
1 7
17
17
1 7
4 , Magnesium, Ca lc ium and S t ron ' - lum o x i d e s (G.Verhaegen and O . H x t e e n )
(1-lolybdenum or Tungs t en c r u c i b l e s )
MgO(g) f/'g(g) + 0 ( g ) 77 1 10
CaO(g) Ca(g) - 0 ( g ) 97 ± 6
S rO(g) S r ( g ) - 0 ( g ) S7 t 6
Srf>0(g) 2 S r ( g ) + 0 ( g ) 180 ± 12
STV.o'0^{g) SrO(g) + MoC^(g) 150 t 2 0
SrHoO^(g) SrO(g) - HoO^Cg) 175 ± 2 0
SrW03(g) S rO(g) + VIQ^{81 160 1 2 0
SrW04(g) SrO(g) + VlO^ig) 190 ± 2 0
5 . Ca lc ium S t r o n t i u m , Barium and Manganese S u l f i d e s
1 4 2 . 8 t -5 (29aoK) 13,14
7 1 , 0 ± 5 13 ,14
136.2 ± 12(298 01^)14
7 3 , 9 ± 5 14
119 t l l ( 2 9 8 o K ) 14
90 ,2 t 6 14
154 1 16(298OK) M
84 t 11 14
423
CaS(3)
CaS(g)
S r S ( s )
S r S ( g )
BaS(g)
BaS(g)
2 BaS( s )
Ba2Sg(g)
CaS(g)
Ca(g) + s ( g )
S r S ( g )
S r ( g ) - S ( g )
BaS(g)
E a ( g ) - S ( g )
Ba2S2(g)
2 BaS(g)

MnS(g)-* Mn(g) - S(g) 65 ± 5 18
6. Mixtures of Salcium, S'-rontlum and Barium Oxides and Sulfides
SO(g) S(g) -f 0(g)
CaO(g) Ca.(g) • 0(g)
SrO(g) Sr(g) -f 0(g)
BaO(g) Ba(g) • 0(g)
7 . Ind ium S u l f i d e ( R . C o l i n )
I n 2 S ( g ) 2 I n ( g ) ••• S (g )
I n S ( g ) I n ( g ) -H S ( g )
I n 2 S 2 ( g ) I n 2 S ( g ) -f 1/2 S g ( g )
8 . Group IV - Group VI Compounds ( R . C o l i n , F . D g g r e v e , J . C . L i e v i n , . T . m c h e l e t and G. Ve rhaegen )
n G e ( s ) + a G e 0 g ( 3 ) (GeO)^(g) 5 6 . 9 t 3 (n = 1 ; 29aoK)
^ ^ 4 8 . 8 - 5 (n = 2 ; 29BOK)
9 8 . 5 - 10(n = 3 ; 298oK)
GeO(g) Ge(g) ••- 0 ( g ) 1 5 6 . 6 t 3
n s n ( s ) + " SnO„(s ) (SnO)^(g ) 71 t 2 ( n = 1 . 2 9 8 o K ) 2 2 ^ " ^
75 t 3 ( n = 2. 2980K)
123. t
1 0 0 . 1
102 .4
1 2 3 . 0
1 5 0 . 0
6 8 . 5
3 7 , 2
7
+
+
+
+
•+
±
7
10
10
5
4
6
14
14
14
14
83 t 10 ( n = 3 ; 29BOK)
89 t 15 ((1 = 4 ; 2980K)
105 t 2 0 (n = 5 ; 2980K)
t 2 5 (n = 6; 2980K) 106
3 SnO(g) Sn (g ) - 0 ( c ) 1 2 8 . 5 -
nPbO(s) (PbO)^(g) n = 1 - 4
S l S ( s ) S l S ( g ) 53 - - 3 (2980K)
3 1 3 2 ( 3 ) S l S ( g ) + 1/2 S g ( g ) lOB 1 3 (2980K)
S13g(3 ) S132(g) 70 t 3 (2980K)
S 1 3 ( s ) S i ( s ) -<- 3 ( 3 ) 38 i s (2980K)
S13g(3) S K s ) + 2 S ( s ) 50 t 3 (298°K)
424

G e S ( s ) m
GeS(g)
S n S ( s )
2 S n S ( 9 )
SnS(g)
P b S l s )
2 PbS(3)
PbS(g)
GeS(g)
Ge (g ) -H S ( g )
SnS(g)
^r^ \ i^ ) Sn(g ) -f S ( g )
PbS(fe)
PV2U) P b ( g ) + S ( g )
1 3 4 . 1 t -a.o
5 2 . 6 - 1.6
5 6 . 5 t 5 . 0
1 1 0 . 1 t 3 . 0
5 5 . 7 i 1,6
6 6 . 6 t 5 . 0
7 9 . 1 - 2 , B
(29eoK)
(29eoK)
(29SOK)
(2GB0K)
19
19
SnPbS (g ) SnS(g) -y PbS(g) 4 6 . 5 t 5 . 0 (29aoK) 19
S n S e ( s ) S n S e ( g ) 4 7 . 5 t 3 . 0 (2£8oK)
2 S n S 6 ( s ) S a ^ S e g t g ) 4 7 . 9 - 5 . 0 (29aoK)
SnS6(g) S n ( g ) -K S 6 ( g ) 9 5 . 0 t 4 . 0
S n S e ( s ) S n ( 3 ) -•• S 6 ( s ) 1 5 . 6 t 3 . 0 (298oK)
3 n T e ( s ) SnTe(g ) 4 8 . 3 t 3 . 0 (29BoK)
SnTe(g) S n ( g ) + T e ( g ) 8 0 . 9 t 4 , 0
SnTe(3) S n ( 3 ) + T e ( s ) U . O t 3 . 0 (29eoK) ( R , 9 )
) . Rel'i^^ive I o n l z a * - l o n Cross S e c t i o n s from Double Oven Exper lmen ' - s
'Kith ZnSe ( R . C o l i n , D . D e t r y , P . G o l d f i n g e r and M, Jeunehomme).
<r Ixr V = 2 . 3 / 1 / 0 . 7 (-t 2 0 fO (24 aV) Ssg Se 2n
r - If- I i r ~ 1 . 5 / 1 / 0 . 5 ( t 2 0 i ) (70 eV) 14 Se Se Zn
2
425

X •This work was spojjsored in part by the Wright Air Division of the Aeronautical System Division, A.F.S.C., U.S. Air Force, through I'-s European Office.
REFERENCES.
1. J . D r o w a r t and R . E . H o n i g , J.Chem. Phys . , 2_5, 581 (1955) J.Phye.Chem. , 61, 980 (1957)
2. M.Ackerman, P.E.S'-'iff ord and J.Drowart, J.Chem.Phys. , 33, 1784 (1960).
3. H.G.Inghram and J.Drowart in High Temperature Technology, Vc Graw Hill Book Company, New York 1960.
4. P.Goldfinger, Mass Spectrometry Conference, A'-lantlc City 1960.
5. P.Goldfinger, M.Ackerman and M.Jeunehomme, Vaporization of Compounds and Alloys at High Tempera'-ure, Final Technical Report, Contract AF 61(052)-19 January 1959.
6. A.W.Searcy, S./tllllams and P.Schissel, J.Chem.Phys. , 32, 957 (1960)
7. T.A.Milne, J.Chem.Phys., 28, 717 (1958).
8. R.Colin, Ind.Chim.Belg., 25, 51 (1961).
9 . P . G o l d f i n g e r , Wass Spec*-rometry C o n f e r e n c e , C h i c a g o , 1 1 1 . 1 9 6 1 .
1 0 . J . B e r k o w i t z , H.A. Tasman and W.A.Chupka, J . C h e m . P h y s . , 3 6 , 2170 ( 1 9 6 2 ) .
1 1 . G.Vil.Otvos and D.P.? i -evenson, J .Am.Chem.Soc. , 7 8 , 546 ( 1 9 5 6 ) .
12 . G .Verhaegen and J . D r o w a r t , J . C h e m . P h y s . , i n p r e s s .
1 3 . R . C o l i n , P . G o l d f i n g e r and M. Jeunehomme, Nai-ure , 1 8 7 , 408 (1960) .
1 4 . H, Jeunehomme, T h e s i s , U n i v e r s i t y of B r u s s e l s ( 1 9 6 2 ) .
1 5 . M.Ackerman, J . D r o w a r t , F . E . S t a f f o r d and G . V e r h a e g e n , J .Chem. P h y s . , 3 6 , 1557 ( 1 9 6 2 ) .
1 6 . M.Ackerman, F . E . S t a f f o r d and G . V e r h a e g e n , J . C h e m . P h y s . , 36 1560 (1962 ) .
1 7 . G . V e r h a e g e n , F .E .S t . ' . i f fo rd , M.Ackerman and J . D r o w a r t , Na ' -u re , 1 9 3 , 1280 (1962 ) .
1 8 . R . C o l i n , P . G o l d f i n g e r and M. Jeunehomme, N a t u r e , 194 , 282 (1952 ) .
1 9 . R . C o l i n and J . D r o w a r t , J . C h e m . P h y s . , i n p r e s s .
426

Thermodynamics of Dilute Solutions by Knudsen Cell Techniques
J. H. Norman and P. Winchell General Atomic/Division of General Dynamics
John Jay Hopkins Laboratory for Pure and Applied Science San Diego 12, California
INTRODUCTION
A program to study the thermodynamic properties of seml-conductlng devices Is in progress at General Atomic. One portion of this program, which has been reported elsewhere, (•'-' is concerned with the measurement of the distribution coefficient of a doping agent between a solid semiconductor and a corresponding melt. This coefficient is the ratio of the activity coefficient of the doping agent in the melt to the activity coefficient in the solid. The portion of the program reported here involves mass-spectrometric studies of the activity coefficient of a doping agent in appropriate melts. This work has been done by studying effusates from a Knudsen cell containing the melts hy means of mass-spectrometric techniques similar to those originated by W, A, Chupka and M. G. Inghram, (2)
EXPERBENTAL PROCEDURE
This investigation was concerned with the antimony-indium system, with zinc used as the doping agent. Vapor-pressure measurements on the liquid metals were found to be tractable. It was possible to make significant, accurate mass-spectrometric observations of intensities of gj.Zn'' and Sbt,
In the first experiments, with a heat-shielded furnace, the zinc background signal far exceeded the zinc signal from the Knudsen cell. In the next experiments, a water-cooled plate was installed as a first collimatlng slit and the heat shielding was removed. The background zinc peaks were reduced to a few per cent of the cell signal. However, in this furnace configuration, the Knudsen cell had a large temperature gracLient and antimony condensed on the lid of the cell and plugged the orifice. Radiant-energy heating was Installed above the Knudsen cell, pareillel to and not blocking the collimatlng slit. This did not appreciably affect the background and allowed the teraperature of the top of the cell to be maintained near that of the melt.
During the early investigations, the molybdenum Knudsen cell was found to Interact with the sample. Analysis of the cell contents showed that an antimony sample dissolved 5^ molybdenum. This problem was circumvented by using a graphite cell liner, so that the melt did not come into contact with the raolybdenum.
The furnace and cell used in obtaining the thermodynamic data reported here are shown in Fig, 1. The furnace is of a tanttilum-wlre, resistance-heated type. Its body is molybdenum, and the tantalum wire Is threaded through embedded alumina tubes. The fUmace rests on a molybdenum tripod.
The molybdenum Knudsen cell consists of three separate pieces, a cell body, a lid, and a ring. Cell lids are 3/4-iQ, disks 25 mils thick with 90° "V" slits cut in them; the orifices are approxiraately 5 mils wide and from 1/8 to 1/2 in. long. The use of a slit affords a greater flux than a circular orifice when the cell pressure is limited by Knudsen conditions. The lid is held tightly to the cell body by six stainless steel screws (graphite lubricated). There is a 3° bevel toward the center, such that considerable pressure can be applied between the body and the lid. The top ring serves to distribute the pressure evenly. Platinum—platinum—lO^S-rhodlum thermocouples are held in wells in the top ring and in the bottom of the cell body. These thermocouples are protected by alumina tubes, since they are attacked by antimony vapors. Above the furnace the grid of l6 strands of 5-mil tungsten wire is held In a nickel-ceramic frame. The furnace is hung from the furnace base—water-cooled plate. There is a beam shutter plate in this base. The ion source Is aiso affixed to the base.
The ion source is similar to that reported by Chupka and Inghram.'^' Although repellers are available, field penetration from the focus plates is used to draw out the ions from the source. Using the source in this manner slightly improves the spectrometer's signal-to-noise ratio, sinoe the noise consists mainly of hydrooarbon peaks. It is believed that the velocity of the beam causes this discrimination, A virtual slit is used to keep source contamination low. Electrons of nominally 20-v energy produced the ions for this study.
427

FIGURE
KNUDSEN CELL AND RESISTANCE FURNACE
SHUTTER PLATE
FURNACE BASE
TUNGSTEN GRID—^C TOP HEATER
THERMOCOUPLE
MOLYBDENUM CELL COVER
1/16 IN . MOLYBDENUM SUPPORT ROD ( 3 )
WATER COOLED PLATE
STAINLESS STEEL SCREW (6)
GRAPHITE LINER
MOLYBDENUM KNUDSEN CELL ( I IN.DIA)
MOLYBDENUM FURNACE BODY
TANTALUM WIRES IN ALUMINA TUBES
THERMOCOUPLE
FIGURE 3
ZINC ACTIVITY COEFFICIENT, r z n . AND PARTIAL MOLAR HEAT OF SOLUTION, AH^n.FOR DILUTE ZINC SOLUTIONS
IN ANTIMONY- 50a% INDIUM MELTS
1.0
0.9
/Zn 0.8
0.7
0.6
1 1
-
'i——- -
" 1 1
1 1
^ Z n =
1 1
1
1 6 '^^'^^ MOLE
1 •
1
• *
-
-
1
1.00 1.05 I.IO 1.15 1.20 1.25
RECIPROCAL TEMPERATURE ( "K - 'X IO^ )
4 2 8

A 3-ln. radius, 1+5 sector-magnet serves as the mass analyzer. The resolution of the system Is around forty using a l/2-ram collector slit. The detector is a DuMont PN-SP-lSl electron multiplier with 2800 v stepped regularly between its 1+ Be-Cu dynodes. The multiplier anode was removed from the ceramic base and mounted separately to reduce noise. The signal is amplified by a Keithley Model 410 micromicroarameter.
An experiment Is performed by loading the Knudsen cell with antimony, indium, and 2 at-' of zinc. After assembling the equipment and establishing a vacuum (approxiraately lO-o torr), the cell is heated and measurements are taken of the cell temperature, z±nc-6k ion signal, and tetrantlmony ion signal. The cell temperature is maintained essentially constant and these measurements are repeated frequently, the time of each measureraent being noted.
DISCUSSION AHD RESUUS
When a unique vaporizing species exists for a dilute-solution component, the data obtained in studies such as those described for zinc can be interpreted with the aid of Knudsen flow equations and Henry's law concerning dilute solutions.
At a constant temperature, T, the number of moles of the species leaving the cell per unit time, -(dn/dt), or the change in the number of moles in the cell, dn/dt, is given by
dn _ pA (1)
where p is the species partial pressure in the cell, M is the species molecular weight, A is the effective orifice area, and K is a constant.
If one assumes that the evaporating species is tbe same as the solution component species and that the solution species is dilute, then Henry's law can be used to describe the species partial pressure as follows:
P = ^ f ^ ^ere n « t ; ° i '- 1
(2)
In Eq. (2), n is the moles of the species in solution, £n. is the total moles of the solution coraponents, 7 is the activity coefficient of the species in solution, and P is the pressure of the species when n =^n •
y ^ -ilnn K{m:)^l\n^
dt * PA
^ \ y K(MT)^/^ n^ dt • PA
(3)
where n « J n .
The significance of Eq, (3) in these studies can be seen in the replacement of
dlnn/dt by din I +|/dt jbecause not pot I + , where I„ + is the intensity of the
vZn i peak. This substitution can be made at constant teraperature for a Henry's-law
solution, in which oase the mass speotrometer signal is a linear function of the cell
pressure. In Eq. (3) all factors, except the tirae differential of the logarithm, are
known to be constants in dilute solutions; thus, the term din jl +[ /dt raust also be
a constant. The slope of the line produced ^en In I™ + is plotted against time is
this constant. The data shown in Fig. 2 illustrates the slope determination. In this
figure log [ l i 7 „ + l l ^ ,] is plotted in place of the In (ig +l above. Since the rate of
sntlmony effusion is essentially constant, the use of this ratio tends to cancel
furnace shifts, source drifts, and changes in deteotor sensitivity. The use of the
429

ratio is unnecessary to demonstrate the method, but tends to give more reproducible results.
According to the derivations, it is necessary to consider only isothermal data. However, this is experimentally irapossible. Therefore, methods of correcting the data to an isothermal equivalent have been used. Equation {k) is derived from Eq. (l) emd from a statement that the number of ions formed in the source is dependent upon the quantity of material passing through the source in a given time divided by the beam velocity, the latter being a residence time factor /To<{n/ l f f :
^ = ^ . (.) 1 ' O
In Eq. {k), the 1 subscripts refer to the exis t ing conditions (teraperature, T. ; species
pressure, P ; and signal i n t ens i ty , I ) , The conditions tha t would govern an Isothermal
experiment are given by 0 subscr ip ts . The use of Eq. (1+) involves se lect ing a T„, and
calculat ing I from I . , T. , T ., and P Q / P , (the l a t t e r term i s obtained from the heat of
vaporization of the species in an i t e r a t i v e process . ) Also, the evaporating time should
be corrected according to another modification of Eq, ( l ) as follows:
^ - ^ , (5) ^1*1 V o ^ '
Here, one equates the moles, u , leaving the cell for the experimental temperature, T. ,
to the moles, n., that would leave at the isothermal tenjierature. The isothermal
evaporating time, t., is then calculated from knowledge of T , T , t. , and P ^ l F ^ .
Two thermocouples monitor the cell tenperature. The effective cell temperature,
T, Is then calculated according to the following empirical function of the base tenjiera-
ture of the cell, T_, and the ring teraperature of the cell, T_ (See Fig, l):
T = 0,6T„ + 0.1<.T„ (6)
a n
This equation was developed empirically and can reasonably be applied for small differences in the two measured temperatures (e.g,, 10°C),
The teraperature corrections serve a purpose other than that of correcting rainor
temperature fluctuations during an experiment. It is possible by using these teraperature
corrections to extrapolate with negligible error the value of I„ +/l_ to zero heating
time and obtain an initial value for this ratio. This initial value can be assigned
to the initial coraposition of the melt. By properly comparing the Initial values of
this ratio to values obtained when essentially pure antimony Is used, the activity
coefficient for antimony can be obtained.
By studying the variations in the activity coefficients of zinc and antimony with temperature, the partial molar heats of solution of these two entitles can be determined. The heat of solution of antimony is also available from an experiment in \rtiioh the teraperature is varied and the intensity of the tetrantlmony peak is observed. Here the antimony heat of solution equals one quarter of the difference between the heat of vaporization of tetrantlmony from pure antimony and from the solution in question. A close study of the antimony activities should allow a calculation of indium values by using the Glbbs-Duhem equation.
Shown in Fig. 3 is an example of these data. Here the measured zinc activity coefficients according to Eq. (3) are shown for a 50-50 at-^ melt of indium and antimony with a negligible quantity of zinc present. In Eq. (3)> the value of P for zinc that was used in determining the activity coefficients presented in Fig. 3 is given by
430

the equation published by R. F. Barrow, et al,:
log P = 9.5672 - 1. STl* log T -
(3)
6676,11. T (7)
An accuracy of 55 Is shown for the acti-vlty coefficients, and it would appear that the precision of these measurements is approximately this value. For a Knudsen cell method using a mass spectrometer, this precision exceeds that normally reported for similar theimDdynamlo quantities. It is believed that errors in the effective cell temperature are responsible for most of the uncertainty in these measurements.
One feature of this method for obtaining thermodynamic data by mass-spectrometric means is of particular interest—only the relative intensities of a time-dependent peak are injiortant. Questions of mass spectroraetrlc sensitivities are eliminated. This method, in fact, may well be used in determining these mass spectrometric sensitivities,
REFERENCES
1, U. Merten and A. P. Hatcher, submitted for publication in J, Fhys, Chem, Solids,
2, W. A, Chupka and M. G. Inghram, J. Phys. Chem. 59, 100 (1955).
3, R. F, Barrow, e t a l . , Trans, Faraday Soc,, 51, 135l|- (1955).
FIGURE 2
TIME DEPENDENCE OF THE Zn* SIGNAL.(KNUDSEN CELL CONTENTS: ANTIMONY-INDIUM 2 0 0 % INITIALLY WITH
ZINC-2a %)
Izn*
1.0
0.5
0.2
O.l
0.05
0.02
1 1 1
^ V
^ \
-
-
. . I l l
1 1 1
-
-
\
\ -
1 1 1 ^
10 20 40 60 eo TIME (MINUTES)
IOO 120
431

THE VAPORIZATION OF BERYLLIUM, MAGNESIUM AND ALUMINUM BORATES AHD THE PROBLEM OF SECOND-LAW MEASUREMENTS*
Alfred Bilchler, J. B. Berkowitz-Mattuck and J. L. Stauffer Arthur D. Little, Inc., Cambridge kO, Mass.
Introduction
The purpose of this note is to report briefly on the current status of our work on gaseous metaborates and to discuss In detail some points of high-temperature technique which arose in connection with this work. It was shown earlier''-'- that the vaporization behavior of alkali metaborates paralleled that of the alkali halides with monomer, dlmer and trimer molecules being produced In the vapor. The fragmentation pattern of these molecules corresponded to that of the alkali halides, the ions produced by the higher species having the formula Mn^-^^S^n-l' •*•* ^^ therefore of interest to investigate the existence of other gaseous metaborates.
Since the ultimate objective of this work is the determination of the heats of formation of gaseous compounds, and since thermodynamic functions for many species of interest are only very imperfectly known, considerable attention was given to the determination of thermocheraical data from the slopes of vapor pressure vs temperature curves. It was found that small teraperature gradients in effusion crucibles could have a surprisingly large effect on the accuracy of the so-called second-law heats of vaporization. The uniformly heated Knudsen cell source with two thermocouples on the Inside, which is described in this paper, provides reliable second-law enthalpies.
Apparatus
The instrument used in these studies was a 12 inch radius, 60° sector mass-spectrometer designed by Inghram and built by Nuclide Analysis Associates. Molecules effusing from Knudsen cells are Ionized by 60-volt electrons. Resulting ions are accelerated by a 4000 volt field, deflected by a magnetic analyzer, and collected either on a sample collector plate or on the first dynode of a l6-stage electron multiplier, with a gain of the order of 5 x 10⁵. The output of either the collector or the electron multiplier is fed to a Vibrating Reed Electroraeter and then displayed on a chart recorder.
For the experiments on the metal-oxide boron-oxide systems discussed below, a molybdenum Knudsen cell with platinum liners was used. Teraperatures were measured with a platlnum-lOjt rhodium thermocouple placed in a well at the bottom of the crucible. Once the systems of interest have been characterized, the improved Knudsen cells described in this report will be used for determination of accurate second-law data.
Sample Preparation
Samples were prepared by mixing the appropriate metal oxide in the Knudsen cell and heating for at least 8 hours -near 1000°. Where necessary, the formation of condensed phase products was demonstrated by obtaining X-ray diffraction patterns of the residue left after the experiment. X-ray patterns were obtained on a Phillps-Norelco X-ray diffractometer.
* Supported by the United States Array Bureau of Research under the Advanced Research Projects Agency Program.
432

z o »-< nr m
1
< o
ac I I I
> _ i
CO
^ i i j
a: LD
o lA o
§-
o
i-o CtJ
o
K"
IC
o o
L 2
O O
o - 2
o " 0>
^
0
1-
I l l l l
o CO
+1
u> u >
I
.<?
/ y
\ 1
9
* H * JC
/ /
••
1
y
cy /
/ ^
illll
10
d +1
10 <0
li
I * <J
/ r y
/
\ 1 KI
j /
/ /
lo
d l l l l l 1 1
y y
c
Q.
»
Z
1
1
y ^ y
JIIM 1 1 1
.
~
1 -o
o \
o o
o 00
o OJ
o ID t~
%
o p
z
cn UJ Q
UJ _ l CD
_i S < o
UJ g
5; 8 K, o
E
- o w
i n Ui _ i a. O o o s or. Ul I
<—' ttl CJ
to
UJ IT 3 CD U.
>-o CD
O
_ l _ l < * <D v !
I I I z _ l
CL
-IO
o
433

Results
A. Beryllium Oxide-Boron Oxide
Gaseous beryllium metaborate was observed at temperatures between 1320 and 1520°K. The principal ionic species was Be(B02)^ at mass numbers 95 to 95, the ion-current ratio Be (BO2 )|/B20J being of the order of I/50. No phase diagram Is available for the BeO-BaOj system. In the course of an extended experiment, however, the ion ratio Be(BOg)2/B205 was found to be only a function of temperature, although the absolute intensities of both ionic species decreased with time. These observations suggest that the equilibrium
BeO(s) + B20^(g) 7^ Be{BO^)^{e) (l)
obtained. With this assumption, reaction (l) is found to have an enthalpy of 35 kcal mole"^. The heat of formation of Be(B02)2 from the elements, which is calculated from this value, is approximately twice that of the heat of formation of gaseous lithium or sodium metaborate, a relation which may be compared to a ratio of approxiraately 2.5 between the heats of formation of beryllium fluoride and lithium or sodium fluoride. To a limited extent, therefore, the similarity of BO2 to halide ions is bome out in the case of the beryllium compounds.
B. Magnesium Oxide-Boron Oxide and Aluminum Oxide-Boron Oxide Systems
In the magnesium oxide-boron oxide system the principal ion species was identified as MgBOj at mass numbers 65 and 66. Only small lon currents were found at peaks corresponding to Mg(B02)2- The phase diagram in this case is known(2) and is very complex. Further experiments are in progress to deduce the molecular species in the vapor from the lon species, and to determine the heat of formation of magnesium metaborate. In the aluminum oxide-boron oxide system no species corresponding to a gaseous aluminum borate were observed at temperatures up to lltOO'C. In both the magnesium oxide-boron oxide and aluminum oxide-boron oxide systems X-ray examination of the residue at the termination of the experiment showed the presence of crystalline mixed oxides demonstrating that reaction between the two condensed phases indeed occurred.
The Deteimination of Second-Law Heats
A. Second and Third-Law Heats
The procedure which has been used raost extensively so far to obtain therraodynaralc data by raass-spectrometric techniques has been the third-law method. Thus, in the case of a heat of sublimation, a value of ^ g oan be obtained from every value of the vapor pressure P measured if the entropies of the condensed phase and the gaseous species are known:
^ = - RTlnP + TAS (2) s s ^ '
Much less emphasis has been placed on the second-law method which in this case would involve the determination of AHs from the slope of a log P vs TJ; plot. It was realized from the beginning of this work, however, that the scarcity of molecular constants for the gaseous metaborates was likely to produce an uncertainty in the third-law heats of formation of these molecules, which would be at least as large as the 5 to 10 kcal mole"! uncertainty normally associated with second-law determinations.(5) Since the precision of any given slope determination was usually of the order of it 2 kcal per mole, it was felt that considerable improvement of the reliability of second-law measurements should be possible.
434

2 3 a:
i i o
K t ^ > _ l
CO
OJ
UJ
O
u.
o
k. o
V < • -
"D O
E
o o
0) T3
o
o .
k.
u
« o
\ Q.
t -
r
l i j
L -
1 -
UJ S < -J
^
t -
;
o
o l -
- 1 UJ
/ /
III
4
• o
41
(0
(J K
S o 1 -
°N >
V /
i l i
- 1
O
t l 0)
lA
6 1-
_ i -1
/ / /
KT
-1 < o
in
•1
Ki
^ J0
Q. y «
hr J a
7\ \ ^ / y y y
1 I l l l l 11
/ / j ^
/ / o
/ y
/ y
y
/
i i l i i i i i i
/
" " /
/ -
_ -
.
: ^ o
i
z 3 CC
z o 1 -< Q :
m _i < o
UJ
CO
UJ Q : 3 CD U.
V . o
i u
• o
o •o
o
c o
o •a
Q.
E
c o
- I < 3£
(D
, 1
(0 ID
6 •^
a . o
/
- l l l i l l 1 1
_1 <
^ 00
• t
o 0)
o t-' -1
* y - " /
\
-1
< o 1£ <D
<C
z O y
CD 0 /
I l l l l 1 1 1
/ 6
1 -
6 /
Q- r O ^
1 l l l i l l 1 1
y / / ' ' y
y z UJ
< _j u. O
z
< UJ X ^
/ ^ •
y y y y y X
X /
< -•o
6
_ i
i
-
1
J UJ
-•
I l l l l 1 1 1 1 o o
435

The problem was further underlined at the start of the work on the mixed oxide systems discussed in this note. In these systems, gaseous B2OJ is, under the conditions of raeasurement of the experiraent, either the major or the only gaseous species forraed. It was therefore planned to use gaseous B2OJ as a pressure-calibrating substance. A series of runs with pure boron oxide gave heats of vaporization which were consistently about 15 kcal mole higher than the most frequently quoted value in the literature.'^/ A series of silver calibration runs were then carried out. The second-law heats of sublimation of silver determined from these runs showed a scatter of as rauch as i 10 kcal mole'-'-about the best current value. (5) Teraperature errors provided the raost obvious explanation of these results. Traditional analysis of the effect of temperature errors on second-law heats, however, gave values for these errors which appeared excessively large.
Nevertheless, a standard molybdenum crucible was finally equipped with tvo platinum-rhodium thermocouples, one of which vas spot-velded to the inside of the crucible lid while the other projected to the botton of the crucible. Both thermocouples vere led through the lid by means of alundum insulators, vith Sauereisen cement used to make the openings tight.
The results of a silver vaporization run carried out with this crucible are shown in Figure 1. Each of the experimental values of I*T (where I is the intensity of the -'-'Ag ' peak, in arbitrary units) vas plotted against the temperatures given respectively by the veil, inside-top, and inside-bottom thermocouples. Only the points plotted against the inside-top thermocouple temperature are shown; for the other two sets of points the least square lines are shown. It is clear from Figure 1 that with the type of crucible and heating arrangement illustrated, the lid is the coolest part of the cell and determines the vapor pressure. The second-lav heat of sublimation obtained vith the lid temperature is 66.9 - 1.8 kcal raole for a mean temperature of 1110°K, in excellent agreement with the best third-law value available for this temperature, 67.0 _ 0.2 kcal mole" . The experiment was terminated before all the silver had evaporated, and it was found that the residual silver had indeed been transferred oompletely to the lid. It should also be pointed out that the teraperature distribution implied in Figure 1 will be observed only when the principal source of heating is electron bombardment frora a filaraent. At high temperatures, when electron eraission from radiation shields is the principal source of heat, the top of the crucible will always be hotter than the bottom.
B. Analysis of Temperature Errors
Figure 1 also demonstrated the shortcomings of the standard analysis of the effeot of teraperature errors. In this analysis, the teraperature read by thermocouple or pyrometer is assumed to be T + 5T, where T is the "true" temperature in the crucible (i.e. the temperature which represents the vapor pressure), while gT represents the error in temperature reading, which is assumed to be constant over the entire temperature range of the experiments. Under these circumstances the error B ( A H ) in the second-law heat AH produced by an error 5T is given by
5 ( ^ ) 2 5 T , s AH T ^•^'
where T is the mean temperature of the experiments. Typically, a temperature error of 60° is then required to produce a lOjt error in £S if the experimental temperature is near 1200°K.
436

As can be seen from Figure 1, however, the temperature gradient actually varies over the experimental interval. Thus, instead of the true temperature interval T2 - Ti = iH , one measures an interval which is in error by an amount of & (^). The error in ££. is given by
&(^) ^ 5(^) d,-. AH ^ ^ '
If measurements are carried out over a 150° range, a lO i error in AH will be produced if the temperature is correct at one end of the range, but is off by only 15° at the other end.
The critical nature of errors in temperature range is illustrated in Figure 2, which shows a silver run made in the course of development of a new crucible design. Here the temperature of the lid was about 100° hotter than that of the bottom. Nevertheless, the inside-bottom thermocouple gave a second-law heat of sublimation vhloh was correct to within 2 kcal, whereas the heat given by the well "thermocouple vas nearly 10 kcal low. It will be observed that the teraperature measured in the thermocouple well actually crosses that of the inside-bottom of the crucible. Hence, in this case, a pressure calibration using total evaporization of a silver sample at temperatures anywhere in the center region of the measureraents vould have given excellent results from the point of viev of third-lav measureraents, but vould have been corapletely misleading as to the reliability of second-lav slopes.
C. Crucible Design
The crucible design finally developed is shown in Figure 5. The over-all configuration reserables closely that used by Panish(5) vith the iraportant addition that two thermocouples are introduced into the inside of the crucible. The two halves of the crucible are heated by Independently controlled filaments. It is thus easily possible to keep the top and bottora teraperatures identical within two degrees. A further coraplication is introduced in work involving molten boron oxide since the latter would react with the alundum thermocouple leads. In this case, a thin platinum liner is used with the thermocouples welded to the liner. To perform silver calibration runs with the latter arrangeraent (Fig. k ) , the silver vas placed in an alundum liner. Even vith this rather complex arrangement, heats obtained frora slopes have always been within 3 kcal mole'I of the accepted value. We therefore believe that the crucible configuration is capable of producing second-law data with an accuracy of - 5 kcal.
The new crucible design has been used in a redetermination of the heat of sublimation of boron oxide. The experimental data are shown in Figure 5- The two sets of points have been displaced relative to each other by one decade, since otherwise they overlap very closely. The numbers attached to one set of points show the order in which they were obtained and show that there was no trend with time in these experiments. The resulting heat of sublimation of boron oxide at a mean temperature of 1500°K is 93.5 - 3 kcal/raol.
References
(1) Bl iohler , A . , and Berkowi tz -Mat tuck , J . B . , The V a p o r i z a t i o n of Li th ium and Sodium M e t a b o r a t e , in Chemical and Therraodynamic P r o p e r t i e s a t High Tempera tu r e s , XVIII th I n t e r n a t i o n a l Congress of Pure and App l i ed Chemis t ry , M o n t r e a l , Canada, August I 9 6 I , p . 76 .
(2) H. M. Davis and M. A. Knight , J . Amer. Ceram. Soo. 2 8 , 97 (191+5).
(Cont inued on next page)
437

I * T
1000
IOO
10
FIGURE 5 BgOg VAPORIZATION
April I I ,
AH = 9 3
.620 - I I 1 L.
1000
I * T
100
10
o.l
.660 .700 .740 .780 . 820 .860 l o ' / T
References - Concluded
(5) Inghram, M. G., and Drowart, J., Mass Spectrometry Applied to High Temperature Chemistry, in Proceedings of an International Symposium on'High Temperature Technology, pp. 219-21+0, McGraw-Hill Book Company, Inc., New York, I96O.
(1*) R. Speiser, S. Naiditoh and H. L. Johnston, J. Amer. Chem. Soc. ^ , 2578 (1950).
(5) M. B. Panish, J. Chem. Eng. Data 6, 592 (I961).
438

Mass Spectrometrlc Study of High Temperature Reactions of BF3(g), HsCg) and HaO(g) with BsOsiS,) and B{ s) .
William P. Sholette and Richard P, Porter Department of Chemistry, Cornell University, Ithaca, N. Y.
Summary
Low pressure, high temperature reactions of Ha-BPa mixtures with B2O3, of HE with B-B2O3 mixtures, and of water vapor with elemental boron have been investigated. The experimental technique Involves flowing the reactant gas at pressures between 10"9 and 10"3 atmospheres Into a Knudsen-type vessel containing a condensed sample at temperatures in the range 900°K to 1400°K, and observing the gaseous products effusing from the oven mass spectrometrically,(1) Mixtures of Ha-BPa reacted with BaOa to produce a spectrum containing chiefly groupings of m/e = 80-84, 98-IO2, 116-120, and 155-138, corresponding to Ions formed by electron Impact of boroxine, BsOaHsCg), and the fluoroboroxines B303HaF(g), B303HF2(g) , and BsOsPsCg) , respectively. In both the reaction of H2 with ( B + 8203) and that of H2O with B the major product formed is B3O3H3, with smaller yields of B304H3(g) (hydroxyboroxine) also observed. In the experiments with water vapor and boron, results indicated that H3O was oompletely converted to Ha in the reaction vessel, accompanied by the formation of 6303, Hence this system was essentially the same as that In which hydrogen was reacted with B-BaOa, In Table I we show a typical mass spectrum obtained in the reaction of H20(g) on an isotopically enriched sample of OB.
By means of second law and third law treatments of the data obtained in these studies, heats of reaction were calculated for the following equilibria:
{1) H2( g) + BaOsPa; g) :^± HP( g) + B303P2H( g) (2) 2 B303P2H( g) ;;=± B303PH2(g) + BaOsPa^g) (3) 2 BaOaPHaCg).^^::? B303H3(g) + B303P2H(g) (4) 3/2H2(g) + B(3) + B 2 0 3 { 1 ) : ^ ± BaOsHaCg) (5) BaOaHarg) •»• l/^BzOaiJL) :^± B304H3(g) + 2/3SB(s)
Combining the results for reactions (l)-(5) with a heat of formation for B303F3(gy of -567 kcals/mole (2) at 298°K, heats of formation were obtained for B303P2H, B30aPH2, and B3O3H3. Reactions (4) and (5) led to an independent value of AH^^ for B3O3H3 as well as a value for B3O4H3, To complete Table II a value of -54l kcals/mole (2) for AHfgsa o^ B30aH3(g) was used to obtain an interpolated heat of formation for B3O5H3.
(1) R, P, Porter, D. R, Bldinosti, and K. P, Watterson, J. Chem, Phys., 26, 2104 (1962),
(2) J.A.N.A.P. Thermochemical Data, Thermal Laboratory, Dow Chemical Company, Midland, Michigan, I960,
439

Table I
Mass spectrum of gaseous products in the reaction p t H20(g) with i0B( s) (enriched),^
T = 1250°K, Ionizing electron energy = 75 volta
m/e
97
82 81 80 79 70 69 68 54 53 52 27
Ion
-u B304H2
B303H2"^
B203H*
B202H'^
BOH"*"
Intensity (relative units)
3,7 12.9 6,3
40,0 100,0 5.5 1,1 4.8 1,3 6.6
36,0 4,0 17,3
a) sample is about 92 percent '•°B and 8 percent ^B.
Table II
Heats of Formation of Gaseous Bojxjxines, Hydroxy-boroxines, and Fluoroboroxines at 298°K.
Gaseous Molecule AH° laea
B3O3H3 -307 ± 8 ' -308 ± 6* B3O3H2OH -399 ± 6\ B303H(0H)2 -476 ± 10° B303(0H)3 -541 ± 10° BaOgHaP -392 ± 6f BaOaHPa -479 ± 5^ B3O3P3 -567 ± 3°
this work interpolated value reference (2).
440

A NEW METHOD OF INCREASING THE EFFICIENCY OF
SURFACE IONIZATION SOURCES
N. R. Daly and N. C. Fenner Atomic Weapons Research Establishment
Aldermaston, England
Manuscript Withdrawn
441

BIBLIOGRAPHY OF PUBLISHED AND UNPUBLISHED PAPERS
on
MASS SPECTROMETRY FOR 1961
The following pages were p repared by subcommit tees II, III, V, and VII, as
pa r t of the Annual Repor t of Subcommit tees , covering act ivi t ies in their fields of i n
t e r e s t . They a r e included in the collection of papers in response to many r eques t s
for a b roade r and more useful distr ibution of such information. In the p resen t effort,
no specific a t tempt was made to avoid multiple r e fe rences to papers of j .n te res t in
var ious f ie lds .
443

1961 Bibliography
Theoretical and Fundamental Aspects of Mass Spectrometry
Prepared by Sub .Committee II
June, 1962
I. Itiss Spectra - Experimental, Correlations, and General Considerations. Compiled by W. H. McFadden, USDA, Western Utilization Research and Development Division, Albany, California.
1. Aczel, T., "Correlations of Mass Spectra with Structure in Aromatic Phenols,"
Anal. Chem., 32, l8l9 (l96l).
2. Beynon, J. H., "Mass Spectra of Various Qulnone and Polycyclic Ketones,"
App. Spec, lk_, 156 (i960).
3. Bienann, K., and Vetter, W., "Separation of Peptide Derivatives by G. C. and
Mass Spectral Determination of Sequence," Biochem. Biophys. Res. Communs. 3,
578 (i960).
k. Ryhage, R., and Stenhagen, E., "Mass Spectrometrlc Studies. Methyl Esters of
Normal Chain Oxo-, Hydroxy, Methoxy, and Epoxy Acids," Arkiv Kemi, 15, 51+5(1960).
5. Lorquet, J. C , "Electron Molecule Interaction. Electron Transition Induced
During Impact," J. Chim. Phys. 5X, IO78 (196O).
6. Biemann, K., "Application of Mass Spectrometry in Amino and Peptide Chemistry,"
Chlmla (Swltz), l4, 393 (l96o).
7. Natalis, P., "Mass Spectra of 6 Cis and Trans Isomers of Dimethyl Cyclohexane,"
Bull. soc. chim. Beiges, 69, 519 (i960).
8. Collin, J., "Dissociation Processes in the Mass Spectra of Oxygen Containing
Heterocyclic Derivatives. Furfuryl and Tetrahydrofurfuryl Alcohols,"
Bull soc. chim. Beiges, §£, 575 (i960).
9. Collin, J., "Dissociation Processes In the Mass Spectra of Oxygen Containing
Heterocyclic Derivatives. Dloxolane, 2-methyl-1,3-dloxolane, Dioxane, and
2,lt,6-tri methyl- 1,3,5-trloxane," Bull soo. chlm. Beiges, 69, 585 (196O).
445
10. Beynon, J. H., Saunders, R. A., and Williams, A. E., "High Resolution Mass
Spectra of Aliphatic Esters," Anal. Chem., 33, 221 (I96I).
11. Beynon, J. H., Saunders, R. A., Topham, A., "Fragmentation of Long Chain
Paraffins Under Electron Bombardment Using Isotoplcally labelled Compounds,
J. Phys. Chem., 65_, 111* (1961).
12. Steiner, B., Glese, C. F., and Inghram, M. G., "Photoionization of Alkanes.
Dissociation of Excited Molecular Ions," J. Chem. Phys. 3^ 189 (1961).
13. Aczel, T., and Lumpkin, H. E., "Correlation of Mass Spectra with Structure in
Aromatlo Oxygen Compounds," Anal. Chem., 33) 386 (1961).
ll*. Hirota, K., et al ., "Mass Spectra and Appearance Potentials of Acetic and
Deuteroacetic Acid," Bull. Chem. Soc. Japan, 34, 226 (196I).
15. Ashlina, S., and Katsumata, A., "Qualitative Analysis of Hydrocarbons by tfess
Spectrometrlc Measurement of Rearrangement Ions/' Seklyu Gakkal Shi, k, 2lt(l96l).
16. Henneberg, D., et al ., "Boron Compounds. Mass Spectra of Lower Boron Trialkyls,"
Ann. Chem. Lieblgs, 61*0, 52 (I96I).
17. Blemann, K., and Friedmann, S. M., "Mass Spectrometrlc Evidence for the Structure
of Iboxyg^lne and its Tosylate," Tetrahedron Letters, jjfe, 68 (196I).
18. Levy, E. J., and Stahl, W. A., "Mass Spectra of Aliphatic Thiols and Sulphides,"
Anal. Chem. 33, 707 (l96l).
19. Qulnn, E.I., and Mohler, F. L., "Mass Spectra of Some Deuteroethanes," J. Res.
Natl. Bur. Stnds., 65A, 93 (l96l).
20. Cassuto, A., "Variations of Mass Spectra with Temperature Between -195° and
+200°C," Compte Rend., 252, 1311 (l96l).
21. Meyerson, S., e^ al^., "Organic Ions in the Gas Phase. Blcycloheptadlene,"
J. Am. Chem. Soc. 83, ll*01 (196I).
22. Majer, J.R., "Mass Spectra of Cyclic Fluorine Compounds," J. Appl. Chem. 11,
l4l (1961).
446

23. Dibeler, V. H., Reese, R. M., and Franklin, J. L., "Mass Spectrometric Study of
Cyanogen and Cyano-Acetylenes," J. Am. Chem. Soc. 8^, 1813 (1961).
24. Eliel, E. L., et al_., "Organic Ions In the Gas Phase. Dissociation of Benzyl
Alcohol by Electron Impact/' J. Am. Chem. Soc. 83^ 2l*8l (1961).
25. Sporer, A. H., "Photoionization of Triaryl Methyl Leuco Nitriles," Trans. Faraday
Soc. 57, 983 (1961).
26. Polyakova, A. A., et al., "Mass Spectra and Structure of Organic Compounds,
bfess Spectra of Enln Hydrocarbons with a T-Butyl Radical at the Multiple Bonds,
Izvest. Vyskhlkh Ucheb. Zavedenii, Khlm. I Khim. Tekhnol., k, #2, 321 (I96I).
27. Trent, F. M., and Miller, F. D., "Mass Spectra of Some High Molecular Weight
Aliphatic Acids and Their Methyl Esters. Analysis of Nonanoic Acid and 2-Ethyl
Heptanolc Acid Mixtures," Appl. Spec, 15, 64 (1961).
28. Saalfeld, F. A., and Svec. H. J., "Mass Spectrum of Stannane," J. Inorg.
Nuclear. Chem. 18, 98 (1961).
29., Heyns, K., and Gruetzmacher, H. F., "Mass Spectra of Methyl Esters of n-Formyl-
a-Amino Acid," Z. Naturforsch 16B, 293 (l96l).
30. Beckey, H. D., "Measurement of Extremely Short Decay Times of Organic Ions with
The Field Ionization Mass Spectrometer," Z. Naturforsch 16A, 5O5 (1961).
31. Vilesov, F. I., et al., "Electron Distribution Over Energies in the Photoioniza
tion of Aromatic Amines in the Gaseous Phase," Doklady Akad. Mauk S.S.S.E. I38
1329 (1961).
32. Stenhagen, E., "Mass Spectra as an Aid in the Case of the Determination of the
Structure of Organic Compounds, Especially in the Case of Llpides and Peptides,"
Z. Anal. Chem.. 181, 462 (I96I).
33- Biemann, K., et al_., "Determination by Mass Spectrometry of the Structure of
Proline Derivatives from Apples," Nature 191, 38O (196I).
3I*. Miller, G. H., and Pritchard, G. 0., "Mass Spectra of Pentafluoropropanal and
Heptafluorobutanal," Chem. and Ind. (London) 13l4 (196I).
447

35. Berkowitz, J . , e t a l . , "Mass Spectrum of Ethyl Lithium Vapor," J . Phys. Chem. 65,
1380 (1961).
36. Mead, W. L., and Wilde, A. J . , "Mass Spectrum ofVanadyl Etloporphyrin-I ,"
Chem. and Ind. (London) 1315 ( l96 l ) .
37. Biemann, K., e t a l . , "Ifess Speotra of Organic Molecules. Ethyl Esters of Amino
Acids," J . Am. Chem. S o c , 83, 3795 ( l96 l ) .
38. Omura, I . , "Ifess Spectra a t Low Ionizing Voltages and Bond Dissociation Energies
of Molecular Ions from Hydrocarbons," Bull . Chem. Soc. Japan 34, 1227 (1961).
39- Vilesov, F. I . , "Photodissoclation of Organic Vapors in the Vacuum Region of the
Spectrum," Zhur. F iz . Khim. 35, 2010 (1961).
ko. F r i t z , G., et^al^., "Mass Spectral Invest igat ion of Silicon-Methylene Compounds,"
Z. Anorg. u. Allgem. Chem. 312, 201 ( iy6 l ) .
4 l . Biemann, K., e t a l . , "Investigation hy Mass Spectrometry of the Alkaloids of
Aspidosperma Quebrachoblanco," Tetrahedron Letters 485 ( l96 l ) .
1*2. Akoplan, M. E., e t a l . , "Mass Spectrometric Invest igat ion of How the Photoioniza
t ion Efficiency of Benzene Derivatives i s Related to Their Spectra ," Doklady
Adad. Nauk S.S.S.R. ikO, 1037 ( l96 l ) .
1*3. Kurbatov, B. L., e t al^., "Electron Distr ibut ion over Kinetic Energies in the
Photoionization of Methyl Derivatives of Benzene," Doklady Akad. Nauk S.S.S.R.
l4o, 797 (1961).
44. Ryha^, R., et al^., "Mass Spectral Studies. Methyl Esters of a, p-unsaturated
Long-Chain Acids. Structure of 27-Carbon-Phthlenoio Acid," Arkiv. Kemi 18, 179
(1961).
1*5. Kanomata, J . , "Mass Spectral Study of Ionization and Dissociation of Di-Ethyl
Ether by Electron Impact," Bull. Chem. Soc. Japan 34, 1596 (196I).
46. Blemann, K., and Friedman, S. M., "Application of Mass Spectra to Structure
Problems: Iboga Alkaloids," J . Am. Chem. Soc. 83, 4805 ( I96 l ) .
448

47. Biemann, K., "Application of Mass Spectra to Structure Problems: Carbon
Skeleton of Sarpaglne," J. Am. Chem. Soo. §3, 48oi (I96l).
48. Mclafferty, F., "Mass Spectral Analysis. Aliphatic Halogenated Compounds,"
Anal. Chem. 34, 2 (1962).
1*9. Mclafferty, F., "Mass Spectral Analysis. Aromatic Halogenated Compounds,"
Anal. Chem. 3|i, 16 (1962).
50. Mclafferty, F., "Mass Spectral Analysis. Aliphatic Nitriles," Anal. Chem. 34,
26 (1962).
51. Aczel, T., and Lumpkin, H. E., "Correlation of Mass Spectra with Structure in
Aromatic Oxygenated Compounds. Benzoate Type Esters," Anal. Chem. 34, 33 (1962).
52. Polyakova, A. A., and Petrov, A. A., "Mass Spectra and Structure of Organic
Compounds. Mass Spectra of Alkenyl Vinyl Acetylene," Zhur. Abshchei
Khlm. 31, 3515 (1961).
53. Baun, W. L. , and Fischer, D. W., "Mass Spectra of Amino Acids Using a Radio
Frequency Spa'rk Source," Anal. Chem. 3I*, 29I* (1962).
5I*. S p l t e l l e r , G., "Structural Determination of Ethyl 5,7-Dimethyl-2-aminocumaron-3-
carboxylate with the Aid of a Mass Spectrometer," Monatsh. Chem. 92, l l42 (1961).
55- S p i t e l l e r , G., "Ortho Effect in the Mass Speotra of Aromatic Compounds,"
Monatsh. Chem. 92, l l47 (1961).
56. Gallegos, E. J . , and Kiser, R. W., "Electron Impact Spectroscopy of the 4 and
5 Membered Saturated Heterocyclic Compounds Containing Nitrogen, Oxygen, and
Sulfur ," J . Phys. Chem. 66, I36 (1962).
57. Hobrock, B. G., and Kiser, R. W., "Eleotron Irapact Spectroscopy of Tetramethyl
Germane, Trimethyl Si lane, and Dimethyl Mercury," J . Phys. Chem. 66, 155 (1962).
449

In addit ion to the above published works, the following re la ted papers were presented a t the ASTM E-l4 Mass Spectrometry meeting and a t the Mass Spectroraetry Conference held a t Oxford.
A.S.T.M. E-l4 Meeting, Chicago, I l l i n o i s , June I96I .
58. Lorquet, J . C , "A Non-Stat is t ical Approach to the Calculation of Mass Spectra . '
59. Coggeshall, N. D., "Comparison of Mass Spectral Regulari t ies for n-Parafflns
and n-Termlnal Olefins."
60. McFadden, W. H., "The Mass Spectra of Three Deuterated Propenes."
61 . Pinan, P. A., £t al^., "Correlation Studies on Some Oxygen Containing Corapounds.
62. Muccini, G. A., e t a l . , "Metastable Ions in Mass Spectrometry."
63. Harless, H., "Anomalies in the Mass Spectrum of Hexachloropropene and I t s
Relation to Basic Concepts of the Propene Molecule."
61*. Cook, G. L., e t ^ ^ . , "Analytically Useful Correlations of Mass Spectra and
Molecular Structures of Thiols, Sulfides, and Disulf ides ."
65. lange, W. J . , "Study of Negative Ions with a Cycloidal Instrument."
66. Hebling, A., and Lightman, D., "Fragment Patterns and Appearance Potent ia ls
Using the Omegatron Mass Spectrometer."
67. Crable, G. F . , and Kearns, G. L., "Effects of Substi tuent Groups on the Ioniza
t ion Potent ia ls of Benzenes."
68. Kennedy, A., and Colburn, C. B. , "The Strength of the N-F Bonds in NF, and of
the N-F Bonds and the N-N Bonds in NgFi^."
69. Poster , N. G., e t a l . , "The >bss Spectra of 2-n-Hexylthiophene and Q;-C-'-3-2-n-
Hexylthiophene."
70. Bedwell, V. E. , e t a l . , "Mass Spectrometric Study of Reactive Materials - I .
Chlorine Tr i f luor ide ."
71 . Bedwell, V. E., e t a l . , "Mass Speotrometrio Study of Reactive Materials - I I .
Pentaborane."
450

I n s t i t u t e of Petroleum and A.S.T.M. E-ll* jo in t Conference on Mass Spectrometry, Oxford, 1961.
72. Cassuto, A., "Variations of Mass Spectra with Temperature between -195°C and
+200°C."
73- Meyerson, S. , e t al^., "Organic Ions in the Gas Phase. Ionization and Dis
sociation of Methylcyclopentane and Related Cycloalkanes."
74. Henneberg, D., "Rearrangement in the Spectra of Trialkyl-Boranes."
75. D'Or, L., "Some Factors Affecting the Ionization and Dissociation of Hydro
carbon Molecules ( c ) . "
76. Bieraann, K., "Determination of the Structure of Alkaloids by Mass Spectrometry.
77. Reid, K., e t a l . , "The hfess Spectra of Some Flavours and Carbohydrates ."
78. F i tches , H. J . M., "The Mass Spectra of Sorae S tero ids ."
79. Snedden, W., "The Mass Spectra of Some Borazoles."
80. Botter , R., and Nlef, G., "Electron Impact Studies of Carbon Sub-Oxide by
Mass Spectrometry."
81 . Majer,' J . R., and Patr ick, C. R., "Electron Impact Studies of Halogenated
Benzenes ( c ) . "
I I . Theory of Mass Spectra - Formation of Ions and Dissociation of Ions and Molecules. Compiled by Morris Krauss, NBS, Washington, D. C.
82. Begun, G. M. and landau, L., "Mass Spectra and Metastable Transitions in
Isotopic Nitrous Oxides," J . Chem. Phys. 35, 51*7 (1961).
83. Chupka, W. A., and Kaminsky, M., "Energy Distr ibut ion and Fragmentation
Processes Resulting from Electron Impact on Propane and n-Butane", J . Chem.
Phys. 35, 1991 (1961).
81*. Cassuto, A., "Variations of Ifess Spectra with Temperature Between -195 and
200°C", Compt. rend. 252, I3 I I (1961).
451

85. Dorman, F. H. and Morrison, "Determination of Relative Electronic Transition
Probabilities by Impact Methods," J. Chem. Phys. 34, 578 (I961).
86. Dorman, F. H. and Morrison, J. D., "Double and Triple Ionization in Molecules
Induced by Electron Impact," J. Chem. Phys. 35, 575 (I96I).
87. Eyring, E. M. and Wahrhaftig, A. L., "Dependence of Calculated and Experimental
Propane Mass Spectra Upon Eleotron Voltage," J. Chem. Phys. 34, 23 (196I).
88. Foner, S. N. and Nail, B. H., "Structure in the Ionization Near Threshold of
Rare Gases by Electron Impact," Phys. Rev. 122, 512 (I961).
89. Ford, J., "Equlpartltlon of Energy for Non-linear Systems," J. Math. Phys.
2, 387 (1961).
90. Frey, H. M., "New Experimental Tests of the Theories of Unimolecular
Reactions," Trans. Faraday Soo. 56, 5I (i960).
91. ffirrington, R. E. and Rabinovitch, B. S., "Decomposition of Activated sec-
Butyl Radicals from Different Sources and Unimolecular Reaction Theory,"
•J. Chem. Phys. 33, 1271 (I960).
92. Horie, T., Nagura, T., and Otsuka, M., "Radiative Collisions Between Molecular
and Electronic Beams. V. Angular Momentum Distribution of CH* Separating
from Simple Organic Molecules," J. Phys. Soc. Japan 15, 64l (i960).
93. von Koch, H. and Lindholm, E., "Dissociation of Ethanol Molecule Ions Formed
in Charge Exchange Collisions with Positive Ions," Arkiv Fysik I9, I23 (I961).
94. Kurbatov, B. L., Vilesov, F. I., Terenin, A. N., "Electron Distribution over
Kinetic Energies in the Photo-ionization of Methyl Derivatives of Benzene,"
Doklady Akad. Nauk S.S.S.R. l40, 797 (I961).
95. Lavroskaya, K., Markin, M. I. and Talroze, V. L., "Charge Transfer from Ions
to Complex Molecules," Kinetika 1 Kataliz 2, 21 (I961).
96. Monahan, J. E. and Stanton, H. E., "Kinetic-Energy Distribution of Ionic
Fragments from Some Hydrocarbons under Electron Impact," Bull. Am. Phys.
Soc. II, 6, 356 (1961).
452

97- Percival, I. C , "Almost Periodicity and the Qjiantal H-Theorem," J. Math.
Phys. 2, 235 (1961).
98. Platzmann, R. L., "Total Ionization in Gases by High-Energy Particles: An
Appraisal of our Understanding," Internat. J. Appl. Radiation and Isotopes
10, 116 (1961).
99. Platzmann, R. L., "Probability of Ionization by the Transfer of the Energy
of Excited Atoms to Molecules," J. Phys. Radium 21, 853 (I96O).
100. Rabinovitch, B. S. and Current, J. H., "On the Classical Approximation in
Unimolecular Reactions and Mass Spectra," J. Chem. Phys. 35, 2250 (I96I).
101. Rosenstock, H. M., "On the Classical Approximation in the Statistical Theory
of Mass Speotra," J. Chem. Phys. 34, 2182 (I96I).
102. Schlag, E. W., "Unimolecular Rates Due to Multiple Critical Oscillators,"
J. Chem. Phys. 35, 2117 (I961).
103. Schug, J. C. and Coggeshall, N. D., "Note on the Statistical Theory of Mass
Spectra," J. Chem. Phys. 35, 111*6 (I96I).
104. Slater, N. B., "Cubic Potential Surfaces in the Transition State Theory of
Unimolecular Reactions," J. Chem. Phys. 33 , 445 (1961).
105. Tanaka, I., Carrlngton, T. and Broida, H. P., "Photon Dissociation of Water:
Initial Non-equilibrium Populations of Rotational States of 0H(^2"^),"
J. Chem. Phys. 35, 75O (I96I).
106. Thiele, E. and Wilson, D. J., "Anharmonlclty in Unimolecular Reactions,"
J. Chem. Phys. 35, 1256 (I96I).
107. Vestal, M. L. and Rosenstock, H. M., "Oscillator Models in Unimolecular
Reactions," J. Chem. Phys. 35, 2008 (I96I).
108. Vilesov, F. I., Kurbatov, B. L. and Terenin, A. N., "Electron Energy
Distribution During the Photoionization of Aromatic Amines in the Gaseous
Phase," Dokl. Akad. Nauk S.S.S.R. I38, I329 (I961).
453

109. Wall, F. T., Hiller, L. A. Jr., and Mazur, J., "Statistical Computation
of Reaction Probabilities, II," J. Chem. Phys. 35, 1284 (I961).
n o . Wallensteln, M. B. and Krauss, M., "Interpretation of the Appearance Potentials
of Secondary Ions," J. Chem. Phys. 34, 929 (I961).
111. Watanabe, T., "A Theory of Electron Impact on Some Polyatomic Molecules,"
J. Phys. Soc. Japan 16, 510 (196I).
111. Ionization and Appearance Potentials.
Complied by M. S. B. Munson, Humble Oil & Refining Company, Baytown, Texas.
112. Curran, R. K. and Fox, R. E., "Mass Speotrometer Investigation of Ionization
of N2O by Electron Impact," J. Chem. Phys. 34, I59O (I96I).
113. Fox, R. E. and Curran, R. K., "Ionization Processes in CClij. and SFg by
Electron Beams," J. Chem. Phys. 34, 1595 (I96I).
114. Fox, R. E., "Ionization Cross Sections Near Threshold by Electron Impact,"
J. Chem. Phys. 35, 1379 (196l).
115. Curran, R. K., "Negative Ion Formation in Ozone," J. Chem. Phys. 35, 1849
(1961).
116. Meyerson, Seymour, "Effect of Electron Energy on Some Electron-Irapact
Processes," J. Chem. Phys. 34, 2046 (I96I).
117. Meyerson, Seymour, "Erratum. Effect of Eleotron Energy on Some Electron-
Impact Processes," J. Chem. Phys. 35, II37 (I96I).
118. Momlgny, J., "Behaviour of els- and trans-Dlhaloethylenes on Eleotron
Impact," Bull. Soc. Chim. Beiges. 70, 24l (I961).
119. Momigny, J., "Erratum. Behaviour of cis- and trans-Ethylenedihalldes
Under Electron Impact," Bull. Soc. Chlm. Beiges. 70, 627 (I961).
120. Momigny, J., "The Ionization Potentials of cis- and trans-Dlhaloethylenes,"
Bull. Classe Sci. Acad. Soy. Belg. 46, 686 (I96O).
454

121. Kaneko, Y., "Ionization Efficiency Curves for Ar+, Kr" , N2"^, and CO""" by
Electron Impact," J. Phys. Soc. Japan l6, I587 (I96I).
122. Kaneko, Y., "Single and Double Ionization of Sodium, Potassium and
Magnesium by Electron Impact," J. Phys. Soo. Japan I6, 2288 (I96I).
123. Herron, J. T. and Dibeler, V. H., "Mass Spectrometrlc Study of NF2, NF3,
HgFg, and NgFj ," J. Hes. Natl. Bureau Stds. 65A, 405 (I961).
124. Schoenheit, E., "Mass Spectrometric Investigation of the Photoionization
of Argon," Z. Naturforschg. l6a, IO94 (I961).
125. Kiser, R. W. and Hlsatsune, I. C , "Electron Impact Spectroscopy of
Nitrogen Dioxide," J. Phys. Chem. 63 , 1444 (1961).
126. Gallegos, E. J. and Kiser, R. W., "Electron Impact Spectroscopy of
Ethylene Sulfide and Ethylenelmine," J. Phys. Chem. 65, II77 (I96I).
127. Gallegos, E. J. and Kiser, R. W., "Electron-Impact Spectroscopy of
Ethylene Oxide and Propylene Oxide," J. Am. Chem. Soo. 83, 773 (I961).
128. Kiser, R. W. and Hobrook, B. G., "Electron-Impact Spectroscopy of Tetra-
methyl-Slllcon, Tin, and Lead," J. Phys. Chem. 65, 2l86 (I961).
129. Dorman, F. H. and Morrison, J. D., "Ionization Potentials of Multiply-
Charged Krypton, Xenon, and Mercury," J. Chem. Phys. 34, 1407 (I96I).
130. Dorman, F. H. and Morrison, J. D., "Double and Triple Ionization In
Molecules Induced by Electron Impact," J. Chem. Phys. 35, 575 (I961).
131. Marmet, P. and Morrison, J. D., "Mass Spectrometer for Ionization
Efficiency Studies Using an Electron Velocity Selector," J. Chem. Phys.
35, 746 (1961).
132. Harrison, A. G., Kebarle, P., and Lossing, F. P., "Free Radicals by Mass
Spectrometry. XXI. The Ionization Potentials of Some Meta- and Para-
Substituted Benzyl Radicals," J. Am. Chem. Soc. 83, 777 (I961).
455

133. Pottie, R. F., Harrison, A. G., and Lossing, F. P., "Free Radicals by
Mass Spectrometry. XXIV. Ionization Potentials of Cycloalkyl Free
Radicals and Cycloalkanes," J. Am. Chrem. Soc. 83, 3204 (I961).
134. Pottie, R. F. and Lossing, F. P., "Free Radicals by Mass Spectrometry.
Ionization Potentials of Cyanoalkyl Radicals," J. Am. Chem. Soc. 83,
4737 (I96I).
135. Herzberg, G., "The Ionization Potential of CHg," Can. J. Phys. 39, I5II
(1961).
136. Robertson, E. W. and Barrow, R. F., "Rotational Analysis of the Energy
Band Transition System of Diatomic Potassium and the Ionization Potential
of Diatomic Potassium," Proc. Chem. Soc. 329 (I961).
137. Kearns, D. R. and Calvin, M., "Solid State Ionization Potentials of Some
Aromatic Organic Compounds," J. Chem. Phys. 34, 2026 (I961).
138. Fineman, M. A. and Petrocelli, A. W., "Molecular Studies with a Lozler
Electron-Impact Apparatus," Planetary Space Sci. 3, I87 (I961).
139. Hirota, Kozo, Nagoshl, Kazuo, and Hatada, Motoyashi, "Studies on Mass
Spectra and Appearance Potentials of Acetic Acid and Deuterioacetlc Acid,"
Bull. Chem. Soo. Japan 35, 226 (I96I).
140. Schulz, G. J., "Study of the NgO Molecule by Using Electron Beams," J.
Chem. Phys. 34, I778 (I961).
141. KUnkenberg, P. F. A., van KLeer, Th. A. M., and Noorman, P. E., "Structure
and Ionization Potential of Hf III and Hf IV," Physica 27, I5I (196I).
142. El Sayed, M. F. A., Kasha, M., and Tanaka, Y., "Ionization Potentials of
Benzene, Hexadeuteriobenzene, and Pyridine from their Observed Rydberg
Series in the Region 600-2000 A," J. Chem. Phys. 34 334 (I96I).
143. Foner, S. N. and Nail, B. H., "Structure in the Ionization Near Threshold
of Rare Gases by Electron Impact," Phys. Rev. 122, 512 (I96I).
456

144. Vainshteln, L. A., "Excitation of Atoms and Ions by Electron Impact,"
Optlka 1 Spektroskopiya 11, 301 (I961).
145. Dolder, K. T., Harrison, M. F. A., and Thonemann, P. C , "Measurement of
the Ionization Cross Section of Helium Ions by Electron Irapact," Proc. Roy.
Soc. Lon. 264A, 367 (196l).
146. Vilesov, F. I. and Kurbatov, B. L., "Photoionization of Ethers and Carbonyls
of Metals in the Gaseous Phase," Doklady Akad. Nauk. S.S.S.R. 140, 1364
(1961).
147. Kanomata, I., "Mass Spectrometric Study on Ionization and Dissociation of
of Diethyl Ether by Electron Impact," Bull. Chem. Soc. Japan 34, I596
(1961).
148. Baughan, C. A., "Ionization Potentials, Electron Affinities, and Screening
Constants. A Simple Theory," Trans. Far. Soc. 57, 1863 (1961).
149. Omura, I., "Mass Spectra at Low Ionizing Voltage and Bond Dissociation
Energies of Moleoular Ions from Hydrocarbons," Bull. Chem. Soo. Japan 34,
1227 (1961).
IV. Free Radicals and Chemical Reactions.
Compiled by P. Kebarle, Dept. of Chemistry, U. of Alberta, Edmonton, Alberta.
150. Barber, M., Cuthbert, J., Farren, J., and Linnett, J. W. , " The Mass Spectro
metry of Free Radicals. 2. Sorae Reactions of Methyl Radicals," Abstract papers.
XVIII lUPAC Conference, Montreal 1961.
151. Bldinosti, D. R., and Porter, R. F., "Mass Spectrometric Studies of Low Pressure
Pyrolysis Reactions of Chlorinated and Fluorinated Cj and Cg Compounds on
Graphite," J. Am. Chem. Soc §3, 3737, (l96l).
152. Bornkessel, K. and Pilot, J., "Mass Spectrometric Investigation of the Gas
Products on Heating Hydrogen and Silicon Containing Magnesium," (in German),
Z. Naturforschung l6a, 432 (I961).
153. Bradley, J. N., and Kistlakowsky, G. B., "Shock Wave Studies by fess Spectro
raetry I. Thermal Decomposition of Nitrous Oxide," J. Chera. Phys. 35., 256 (I96I).
457

154. Gutbier, H., "Mass Spectrometric Investigation of Evaporation Processes of
Some Compounds with the Zinc Blend Lattice Structure at Temperatures around
1000°K (in German)," Z. Naturforschung l6 , 268 (196I).
155. Bradley, J. N., and Kistlakowsky, G. B., "Shock Waves by Mass Spectrometry II:
Polymerization and Oxidation of Acetylene," J. Chem. Phys. 35, 264 (I961).
156. Bradley, J. N., "Shock Wave Decomposition of Nitroparaffins. Part I. Mass
Spectrometric Study of Nltromethane Decomposition," Trans. Faraday Soc 57,
1750 (1961).
157. Dong, Pham, and Cottin, Maurice, "Mass Spectroraetrlc Study of the Products of
The Themal Decomposition of Hydrogen, Oxygen and Water Vapour," J. Chira.
Phys. 58, 803 (1961) (in French).
158. Goldfinger, P., Huybrechts, G., Verbeke, G., "Mass Spectrometrlc Studies of
Fast-Reactions at Atmospheric Pressure," Joint Conference Mass Speotrometry-
Oxford - 1961.
159. Harrison, A. G., Kebarle, P., and Lossing, F. P., "Free Radicals by Mass
Spectrometry XXI: The Ionization Potentials of Some Meta and Kira Substituted
Benzyl Radicals," J. Am. Chem. Soc. §3, 777 (196I).
160. Herron, J. T., "Rate of the Reaction of NO + N," J. Chem. Phys. 35, 1138 (I96I).
161. Herron, J. T., and Dibeler, V. H., "Mass Spectrometrlc Study of the Thermal
Dissociation of NgFij," J. Chem. Phys, 31, 747 (l96l).
162. Keharle, P., "The Mercury Photosensitized Decomposition of Mercury Dimethyl,"
Joint Meeting Mass Spectrometry - Oxford - 1961.
163. Melton, C.E., "Studies of Transient Species Formed During Catalytic Reactions
of COg + Dg and 1-butene," J. Chem. Phys. 35^ 1750 (196I).
164. Pottie, R. F., Harrison, A. G., and Lossing, F. P., "Free Radicals by Mass
Spectrometry XXII: Primary Decomposition Steps in the Mercury Photosensitized
Decomposition of Methanol and Dimethyl Ether," Canadian J. Chem. 39, 102 (I961).
165. Pottie, R. F. and Lossing, F. P., "Free Radicals by Mass Spectrometry XXIII:
Mass Spectra of Benzyl and Benzyl-a-d^, Free Radicals," J. Am. Chem. Soc 83,
2634 (1961).
458

166. Po t t i e , R. F . , Harrison, A. G., and Lossing, F. P . , "Free Radicals by Mass
Spectrometry XXIV: Ionization of Cycloaklyl Free Radicals and Cycloalkanes,"
J . Am. Chem. S o c , 83, 3204 (1961).
167.- Po t t i e , R. F . , and Lossing, F. P . , "Free Radicals by Mass Spectrometry XXV:
Ionisat ion Potent ials of Cyanoalkyl Radicals ," J . Am. Chem. S o c 83, 4737
(1961).
168. Terenin, A., Vilessov, F . , Kurbatov, B. , and Dodonova, N., "Mass Spectrometry
and Luminescence of Radicals in the Photodissoclation and Photoionization of
Molecules by Vacuum Ultraviolet Radiation," Abstract Ifepers XVIII lUPAC
Conference, Montreal 1961.
V. High Temperature Mass Spectrometry. Compiled by J . Drowart, Service of Chemical Physics, Free University of Brussels, Brussels, Belgium.
169. Ackerman, M., Drowart, J . , Stafford, F. E., and Verhaegen, G., Wright Air
Development Division, Air Research and Development Command, Contract AF
61(052)225 - Sc ient i f ic Note No. 5 (I961).
170. Ackerman, M., Stafford, F. E., Verhaegen, G., Wright Air Development Division,
Air Research and Development Command, Contract AF 61(052)225 - Sc ien t i f ic Note
No. 6 (1961).
171. Ackerman, R. J . , and Rauh, E. G., J . Chem. Phys. 36, 448 (1962).
172. Akishin, P. A., Gorokhov, L. N., and Sidorov, L..N., "Mass Spectrometrlc
Study of Cesium Halides," Doklady Akad Nauk SSSR 135, 113 (i960).
173. Akishin, P. A., and Khodeev, Yu. S . , "Determination of the Heat of Sublimation
of Uranium Tetrafluorlde by the Mass Spectroscopic Method," Zhur. F i s . Khim.,
35^ 1169 (1961).
174. Babellowsky, T., and Boerboom, A. J . H., "Therraodynamic Study of CaO and Ta,"
Symposium on Mass Spectrometry Oxford (1961). See a l so : Mass Spectroraetry
Conference, ASTM Committee E-l4, Chicago (1961).
459

175- Basoombe, K. N., Greene, J. L., and Sugden, T. M., "The Ionization Produced
by Addition of Acetylene to a Hydrogen-Oxygen-Nitrogen Flame," Symposium on
Mass Spectrometry, Oxford (196I).
176. Bascombe, K. N., Jenkins, D., Schiff, H. I., and Sugden, T. M., "The Production
of HH'"' and NO" Ions in Flames," ASTM Committee E-l4, Chicago (I96I).
177. Berkowitz, J., Tasman, H. A., and Chupka, W. A., "Double Oven Experiment with
Lithium Halides," Abstracts, l8th International Congress of Pure and Applied
Chemistry, University of Toronto Press, (196I) p. I09.
178. Berkowitz, J., Bafus, D. A., and Brown, T. L., "The Mass Spectrum of Ethyl-
lithium Vapor," J. Phys. Chem. 65, I38O (196I).
179. Berkowitz-Mattuck, J. , Buchler, A., and Goldstein, S., "Reaction Between Molyb
denum and Oxygen," Contract AF 33 (6l6)-6l54 (1961) (A.D. Little, Inc,
Cambridge, Mass.).
180. Bldinosti, D. R., and Porter, R. F., "Mass Spectrometric Studies of Low
Pressure Pyrolysis Reactions of Chlorinated and Fluorinated C ^ and Cg on
Graphite," J. Am. Chem. Soc. §3, 3737 (l96l).
181. Brackman, R. T., and Fite, W. L., "Condensation of Atomic and Molecular Hg at
Low Temperatures," J. Chem. Phys. 34, 1572 (I96I).
182. Buchler, A., and Berkowitz-Mattuck, J. B., "The Vaporization of Lithium and
Sodium Metaborate," l8th International Congress of Pure and Applied Chemistry,
University of Toronto Press (I961). p. 100.
183. Calcote, H. F., Eight International Symposium on Combustion, Williams and
Wilkins Cy., Baltimore, Maryland (I96I).
184. Calcote, H. F., and Reuter, J. L., "Mass Spectrometric Studies of Ion Profiles
In Low Pressure Flame," Mass Spectrometry Conference, ASTM Committee E-l4,
Chicago (1961).
185. Cater, E. D., Rauh, E. G., and Thorn, R. J., "Uranium Monosulfide. II. Mass
Spectroraetrlc Study of its Vaporization," J. Chem: Phys. 35_, 6l9 (1961).
460

186. Chupka, W. A., Meschi, D. J . , and Berkowitz, J . , "Reaction of Graphite with
Hydrogen: Heat of Forraation of the Methylene Radical ," Abstracts , l8th In t e r
national Congress of Pure and Applied Cheraistry, University of Toronto Press
(1961) p . 115-
187. Chupka, W. A, Berkowitz, J . , Meschi, D. J . , and TasDBn, H. A., "Mass Spectro
metric Studies of High Temperature Systems," Symposium on Mass Spectrometry,
Oxford 1961.
188. Colin, R., Goldfinger, P . , and Jeunehomme, M., "Mass Spectrometric Invest igat ion
of the Vaporization of Sulphides and the Dissociation Energy of Sg," Nature 187,
4o8 (i960).
189. Colin, R., "Ionization Cross-Sections of Te and Teg," Ind. Chim. Belg. , 26, 51
(1961).
190. Colin, R., and Drowart, J . , "Dissociation Energy of Gaseous SuS, PbS, and
Their Diraers," Wright Air Development Division, Office of Aerospace Research,
Contract AF 6l(052)-225, Scient i f ic Note No. 9 (I962).
191. Colin, R., Goldfinger, P . , and Jeunehomme, M., "Dissociation Energy of Gaseous
MnS," Wright Air Development Division, Office of Aerospace Research Contract
AF 61(052)-225 Scient i f ic Note No. 10 (1962).
192. DeJaeger, S. , Deckers, J . , and Van Tiggelen, A., Eighth Internat ional Symposium
on Combustion. Williams and Wilkins Cy., Baltimore, hferyland I96I .
193. Foster , H. J . , "The Adaptation of a Bendix Tlme-of-Flight Mass Spectrometer
for High Temperature Studies ," Mass Spectroraetry Conference, ASTM Committee
E-l4, Chicago ( l96 l ) .
194. Goldfinger, P . , "High Temperature Studies a t the Brussels Mass Spectrometry
Laboratory." ASTM Coraraittee E-l4 Chicago (1961).
195. Goldstein, H. W., Walsh, P. N., and White, D., "Rare E a r t h s . I . Vaporization
of lagO, and NdgOj: Dissociation Energies of Gaseous laO and NdO," J . Phys.
Chem. 65, l400 (1961).
196. Gorokhov, L. N., Doklady Akad. Nauk. SSSR 142, 113 (I962).
461

197. Grimley, R. T., Burns, R. P . , and Inghram, M. G., "Thermodynamics of the
Vaporization of CrgOo: Dissociation Energies of CrO, CrOg & CrO,," J . Chem.
Phys. 34, 664 (1961).
198. Grimley, R. T., Burns, R. P, and Inghram, M. G., "Thermodynamics of the Vapori
zation of Nickel Oxide," J . Chem. Phys. 35, 551 ( l96 l ) .
199. Grimley, R. T., and Burns, R. P . , "Controlled Atmosphere High Temperature
Vaporization Studies ," Mass Spectrometry Conference, ASTM Committee E-l4
Chicago (1961).
200. Honig, R. E., "Mass Spectrometric Studies of Solid Surfaces," Symposium on Mass
Spectrometry, Oxford, I96I.
201. Honlg, R. E., "The Sputtering of Sil icon Carbide by Posit ive Ion Bombardment,"
Fifth Internat ional Conference on Ionization Phenomena in Gases, Munich (196I).
202. JeunehoTmne, M., Thesis, University of Brussels (1962).
203. McKlnley, J . D., "A Mass Spectrometric Investigation of the High Teraperature
Reaction Between Nickel and Chlorine," Abstracts , 136th Meeting, A.C.S.,
Atlant ic City 1959-
204. Moran, T. I . , and Trischka, J . W. "New Determinations of the Vibrational Constants
of LIT" and Li°Cl35 by the Molecular Beam Elec t r ic Resonance Method," J . Chem.
Phys. 34, 923 (1961).
205. Nlki t in , 0. T., and Gorokhov, C. N., Zhurn, Neerg. Khim., 6, 224 (1961).
206. Panish, M. B. , "Vaporization of Several Rare Earth Oxides," J . Chem. Phys. 34
1079 (1961).
207. Panish, M. B. , "Vaporization of the Rare Earth Oxides," J . Chem. Phys. 34,
1915 (1961).
208. ftinlsh, M. B. , and Reif, L., "Vaporization of Iridium and Rhodium," J . Chem.
Phys. 34, 1915 (1961).
209. Porter , R. F . , "S tab i l i t i e s of Gaseous Molecules in the Pb-Te Systems,"
J . Chem. Phys. 34, 583 (1961).
462

210. Porter , R. F . , "Molecular Association in Sodium Cyanide Vapor," J . Chem. Phys. 35^
318 (1961).
211. Shchukarev, S. A., and Semenov, G. A., Doklady Akad. Nauk. SSSR l 4 l . 652, (196I).
212. Studier , M. H., Sloth, E. N., and Moore, L. P . , "The Chemistry of Uranium in Sur
face Ionization Sources," J . Phys. Chem. 66, 133 (I962). See also Mass Spectro
metry Conference, ASTM Committee E-l4, Chicago (I96I) .
213. Studier , M. H., "Gaseous Oxides of Rhenium." J . Phys. Chem. 66, I89 (I962).
214. Tsvetaev, A. A., Glazunov, M. P . , Kiselev, V. A., Alekseev, L. A., Chuzhko, R. K.,
"Activation Energy for Sublimation from Different faces of Zn Monocrystals."
Zhurn. F iz . Khim., 35^ 2800 (I96I) .
215. Verhaegen, G., Stafford, F. E. , Ackerman, M., and Drowart, J . , Wright Air
Development Division, Office of Aerospace Research. Contract AF 61 (062)-225,
Sc ient i f ic Note No. 8 (I962).
216. Walsh, P. N., Dever, D. F . , and White, D., "Rare Earths. I I I . A Mass Spectro
metric Invest igat ion of the Isomolecular Oxygen-Exchange Reactions of Lanthanum,
Cerium, Praseodymium, and Neodymium with the i r Monoxides .
217. White, D., Walsh, P. N. Goldstein, H. W., and Dever, D. F . , "Rare Earths: I I .
A Mass Speotrometrio Determination of the Heats of Sublimation (or Vaporization)
of Neodymiun, Praseodymium, Gadolinium, Terbium, Dysprosium, and Neodymium with
Their Molecules," J . Phys. Chem. 65^ l405 (1961).
218. White, D., Walsh, P. N., Goldstein, H. W., and Dever, D. F . "The Dissociation
Energies of the Gaseous Monoxides of the Rare Earths: Thermodynamic Properties
of some Gaseous Oxides," Abstracts , l8th Internat ional Congress of Pure and
Applied Chemistry, University of Toronto Press ( l96l) p . 99-
219. White, D., Sommer, A., Walsh, P. N., and Goldstein, H. W., "The Application of
The Time-of-Flight Mass Spectrometer to the Study of Inorganic Materials a t
Elevated Temperatures," Symposium on Mass Spectrometry, Oxford (1961).
220. Akishin, P. A., Gorokhov, L. N., and Khodeev, Yu.S., "Evaporation of Sodium and
Lithium Metaborate," Zhurn. Strukt Khlm. 2, 209 ( l96 l ) .
463

221. Ryabchlkov, L. N., and Tlkhinskii, G. F., "Evaporation of Beryllium Chloride,"
Piz.Metall. 1 Metallov, 10, 635 (i960).
222. Trulson, 0. C , Hudson, D. E., and Speddlng, F. H., "Determination of the Heat
of Sublimation of Eu, Gd, Ho and Er Using Surface Ionization," J. Chem. Phys.
^ , 1018 (1961).
VI. lon Molecule Reactions Compiled by J . L. Franklin, Humble Oil and Refining Co., Baytown, Texas
223. Barnes, W. W., Martin, D. W., and McDaniel, E. W., "Mass Spectrogi'aphlc Iden t i
f ica t ion of the Ion Observed in Hydrogen Mobility Experiments," Phys. Rev.
Let ters 6, 110 (1961).
224. Bates, D. R. and Nlcolet, M., "Rate of .Ion-Atom Exchange," J . Atmos. & Terres t .
Phys. 21, 286 (1961).
225. Beynon, J . H., Lester, G. R., Saunders, R. A.,and Williams, A. E., "Formation
of Ions in Mass Spectrometers by Ion-Molecule Reactions," Trans. Faraday S o c 5X,
1259 (1961).
226. Bloch, A., "Mass Spectrum of Ar a t an Elevated Pressure in the Ion Beara," J .
Chira Phys. 58, 289 (I96I) .
227. Fie ld , F. H., "Reactions of Gaseous Ions. VIII . Multiple Order Ion-Molecule
Reactions and the Ultra-High Pressure Mass Spectrum of Ethylene," J . Am. Chem.
Soc 83, 1523 (1961).
228. Field, F. H., and Franklin, J . L., "Reactions of Gaseous Ions. X. lonio
Reactions in Xenon-Methane Mixtures," J . Am. Chem. Soc. 83, 4509 (1961).
229. For res ta l , L. J . , and Hammill, W. H., "Effects of Ionic and Free Radical
Processes In the Radiolysls of Organic Liquid Mixtures," J . Am. Chem. Soc 83,
1535 (1961).
230. Pranklln, J . L. and Field, F. H., "Reactions of Gaseous Ions. IX. Charge Exchange
Reactions of Rare Gas Ions with Ethylene," J . Am. Chem. Soc. 83, 3555 (1961).
464

231. Franzen, J . , and Hintenberger, H., "Polyatomic Molecule Ions in a High Frequency
Spark between Electrodes of the Eleraents Be, C, Mg, Ae, Ti, Fe, and Cu,"
Z. Naturforsch. l6a, 535 ( l96 l ) .
232. Fuchs,R., "Ion-Molecule Reactions in Paraffins, Olefins, and Acetylene,"
Z. Naturforsch. l6a, 1026 (196I).
233. Fueno, T., Eyring, H., and Ree, T., "Three-Body Recombination of Gaseous Ions,"
Can. J . Chem. 38, l693 (i960).
234. Gatz, C , Smith, F. T., and Wise, H., "Chemi-Ionization in Three Body Gas
Phase Reactions," J . Chem. Phys. 35, I5OO (1961).
235. Giese, Clayton F . , and Maier, William B., I I , "Ion-Molecule Reactions Studied
with Mass Analysis of Primary Ion Beam," J . Chem. Phys. 35, I913 (1961).
236. G i l l i s , H. A., Williams, R. R., J r . , and Hamill, W. H., "Ionic and Free
Radical Processes in the Radiolysis of Liquid Methyl and Ethyl Iodides,"
J . Am. Chem. Soc 83, 17 ( l96 l ) .
237. Hall , R. M. S . , "NgOH Ions from Nitrous Oxide in Mass Spectrometry,"
Chemistry and Industry I961, p . 369-
238. Henkes, W., "Ionization and Acceleration of Condensed Molecular Beams,"
Z. Naturforsch. l6a , 842 (l96l). .
239. Hertzberg, M., "Ion-Neutral Reactions," J . Atomospherlc & Terrest . Phys. 20,
177 (1961).
240. Hertzberg, M., Rapp, D., Ortenburger, I . 0 . , and Brigl ia , D. D., "Ion-Neutral
Reactions in the Helium-Hydrogen Systera," J . Chem. Phys. 34, 343 (196I).
241. I r sa , A. P . , and Friednan, L., "Collision Induced Dissociation of HD"*", "
J . Chera. Phys. 34, 330 (I96I) .
242. Karachevtsev, G. H., Markin, M. I . , and Tal ' roze, V. L., "An Investigation of
Charge Transfer from the Thermal Ions A"*", Kr"*", and Xe"*" to the Molecules CH4,
CgHg, and CgHjj by the Impulse Method," Izvest Akad. Nauk SSSR, Otdel. Khim.
Nauk 1961, No. 8, 1528.
4 6 5

243. Kaul, W, Lauterbach, U., and Taubert R., "The Appearance Potent ia ls of HeH*,
NeB*, AH*, KrH*, KrD* and H3*," Z. Naturforsch l6a , 624 (1961).
244. King, J . R., "Recombination of Ions in Flames. Effect of Temperature,"
J . Chem. Phys. 35, 380 ( I96I) .
245. Kondratiev, V. N., and Pt lohts in , I . I . , "Gas-Phase Interact ion Between Carbon
Monoxide and Ionized Oxygen," Kinetika & Kataliz, 2, 492 (196I).
246. Kasner, W. H., Rodgers, W. A., and Biondl, M. A., "Electron-Ion Recombination
Coefficients in Ng & Og," Phys. Rev. Let ters 7, 321 (1961).
247. lampe,F. W., Franklin, J . L., and Fie ld , F. H., "Kinetics of the Reactions of
Ions with Molecules," Chapter 3 of Progress in Reaction Kinetics. Edited by
G. Porter , Pergamon Press, London, 1961.
248. lavrovskaya, G. K., Maarkln, M. I . , & Tal ' roze , V. L., "Charge Transfer and
Complex Molecules," Kinetika & Kataliz 2, 21 (1961).
249. Libby, W. F . , "Chemistry of Posit ive Ions. I . General Theory Par t i cu la r ly for
the Radiation Induced Cross Linkage of Polymers and Polymerization of Saturated
Hydrocarbons," J . Chem. Phys. 35^ 17l4 (I961).
250. Padley, P. J . , F&ge. F. M., and Sugden, T. M., "Effect of Halogen on the
Ionization in Alkali-Laden Hydrogen and Acetylene Flames," Trans. Faraday S o c
57, 1552 (1961).
251. P ra t t , T. H., and Wolfgang, R., "The Self Induced Exchange of Tritium Gas with
Methane," J . Am. Chem. Soc. 8 ^ 10 (1961).
252. Popescu, I . , "Resonant Charge Transfer in Dense Gases," Proc. Phys. Soc.
(London) 78, 584 (I961).
253. Smith, C. F . , Gorman, B. G., and Lampe, F . W.,'hydrogen Inhibi t ion of the Rare Gas
Sensi t ized Radiolysls of Cyclopropane," J . Am. Chem. Soc. 83, 3559 (1961).
254. Tal ' roze , V. L., "Elementary Processes Taking Place Upon Coll is ions of Slow
Ions with Molecules," Izvest . Akad. Nauk SSSR, (Phys Ser ies) 24, 1001 (i960).
255. Von Koch, H., and Lindholm, E., "Dissociation of CgHcOH* Formed in Charge
Exchange Coll isions with Posit ive Ions." Arkiv f. Physik !£ , 123 (196I).
466

256. Wagner, C. D., "Radiolysls of Liquid Propane. Ion-Molecule Condensation,"
Tetrahedron 14, l64 ( I96l ) .
257. Williams, T. F . , "Correlation of the Radiation Chemistry of Liquid Hydrocarbons
with the Energetics of Molecular-Ion Reactions," Trans. Faraday Soc. 57^ 755
(1961).
VIII . Miscellaneous
Compiled by J . Goodings and H. I . Schiff, Department of Chemistry, McGlll University, Montreal, Canada
Solid and Surface Phenomena
258. Moore, G. E., "Dissociation of Adsorbed CO by Slow Electrons," J . Appl. Phys.
32, 1241 (1961).
259. Surplice, N. A., "Emission of Negative Ions of Oxygen from Dispenser
Cathodes. I . Cathodes of Barium Oxide in Sintered Nickel," B r i t . J . Appl.
Physics 12, 214 (196I).
260. Surplice, N. A., "Emission of Negative Ions of Oxygen from Dispenser
Cathodes. I I Cathodes of Barium Alumlnate in Sintered Tungsten," Br i t . J . Appl.
Phys. 12, 220 (1961).
261. Inguye, H., "Mass Spectrometrlc Study on Absorption of Vfater Vapour on a
Graphite Surface," Bull . Chem. Soc. Japan 34, 643 (I961).
262. Hannay, N. B. , "Mass Spectrographic Analysis of So l ids , " Science 134, 1220
(1961).
Shock Waves
263. Bradley, J . N., and Kistlakowsky, G. B. , "Shock Wave by Mass Spectrometry. I
Thermal Decomposition of Nitrous Oxide," J . Chem. Phys. 33j 256 (I961).
264. Bradley, J . N., and Kistlakowsky, G. B . , "Shock Wave Studies by Mass Spectro
raetry. I I Polymerization and Oxidation of Acetylene," J . Chem. Phys. 35, 264
(1961).
265. Bradley, J . H., "Shook Wave Decomposition of Nitroparaffins. Part I . Mass
Spectrometric Study of Nltromethane Decomposition," Trans. Faraday S o c 3Jj
1750 (1961).
4 6 7

Discharges and Plasmas
266. Nastyukha, A. I . , Strlganov, A. R., Afanas'ev, I . I . , Mikhailov, L. N., and
Oganov, M. N., "hfass Spectrographic and Spectroscopic Studies of Hydrogen
from an Ion Source," Plasma Phys. - Accelerators - Thermonuclear Res. (English
Translation) 3, 2l8 (196I).
267. Donahue, T. M., and Hushfar, P . , "Formation of Negative Ions in a Gas by
Charge Transfer frora a Fast Atomic Hydrogen Beam," Phys. Rev. 124, 138 (1961).
268. Thompson, J . B. , "Electron Energy Distr ibution in Plasmas. IV Oxygen and
Nitrogen," P r o c Roy. Soc A262, 503 ( l96 l ) .
269. Rose, P. H., Bastide, R. P . , and Wlttkower, A. B., "High Current Posit ive
Hydrogen Ion Source with Mass Analysis ," Rev. Sci . I n s t r . 32_, 58l (I961).
Other
270. Reinlsch, L., "Radiolysis and Mass Spectrometry," J . Chera. Phys. 51, 1064
(i960).
271. Yuasa, T., "Mass Spectrometric Studies of Gaseous Ions. Gaseous Ions of
Serai-Conductive, Semi-Metallic and Metallic Elements," Nippon Kagaku Zasshi,
81, 1643 (i960).
272. Akishin, P. A., and Khodlev, V. S. , "Mass Spectral Determination of the Heats
of Sublimation of Uranium Tetraf luorlde," Zhur. F iz . Chira. 35_, II69 ( l96 l ) .
273. Grogerov, I . P . , and Turklna, M. J . , "Transformation of Phenyl Radicals In
Solution, as Investigated by the Isotopic and Mass Spectrometric Method,"
Doklady Akad. Nauk., SSSR l4o, 1317 (196I).
468

Bibliography of High Molecular Weight Mass Spectrometry
Prepared by Subcommittee III
June 1962
1. Aczel, T., and H. E. Lumpkin, "Correlations of Mass Spectra
with Structure In Aromatic Oxygenated Compounds, Methyl Sub
stituted Aromatic Acids and Aldehydes", Anal. Chem. 33., 387
(1961).
2. Ardenne, M. von, K. Steinfelder, and R. Tummler, "Electron
Addition Mass Spectrometrlc Determination of the Number of
Carbon Atoms In Oxygenated Molecules from the Ratio C-'-3/C ,
Naturwlssenschaften 42., 492 (I96O).
3. Ardenne, M. von, K. Steinfelder, and R. Tummies, "Electron
Addition Mass Spectrograms of Condensed Aromatic Hydrocarbons",
Agnew. Chem. H , I36 (196I)
4. Bergstroem, S., R. Ryhage, and E. Stenhagen, "Mass Spectrometrlc
Studies on Sterols and Bile Acids", Svensk. Kem. Tldskr. XX,
566 (1961).
5. Beynon, J. H., R. A, Saunders, A. Topham, and A. E. Williams,
"Fragmentation of Long-chain Paraffins Under Electron
Bombardment Using Isotoplcally Labeled Compounds", J. Phys.
Chem. 6^, 114 (196I).
6. Blemann, K., "Determination of the Carbon Skeleton of Sarpaglne
by Mass Spectrometry", Tetrahedron Letters i960, 9.
7. Blemann, K., "Application of Mass Spectrometry to Structure
Problems. Carbon Skeleton of Sarpaglne", J. Am. Chem. Soc. 83.,
4801 (1961).
8. Blemann, K., and G. G. J, Deffner, "Determination of N-'-S in
Amino Acid Mixtures Without Separation into Individual Com
ponents Biochem. and Blophys. Research Communs. 4, 283 (196I).
469

9. Blemann, K., G. G. J. Deffner, and F. C. Steward, "Determina
tion by Mass Spectrometry of the Structure of Proline
Derivatives from Apples", Nature 191. 380 (I96I).
10. Blemann, K., and M. Friedmann-Spiteller, "Application of Mass
Spectrometry to Structure Problems. Iboga Alkaloids", J. Am.
Chem. Soc. 83., 4805 (196I).
11. Blemann, K., and M. Friedmann-Spiteller, "Mass Spectrometrlc
Evidence for the Structure of Iboxygalne and Its Tosylate",
Tetrahedron Letters I96I, 68.
12. Blemann, K., M. Friedmann-Spiteller, and G. Splteller, "Investi
gation by Mass Spectrometry of the Alkaloids of Aspidosperma-
Quebrachoblanco", Tetrahedron Letters I96I, 485.
13. Blemann, K., C. Lloret, J. Assellneau, E. Lederer, and J. Polonsky,
"Structure of Lysoplne, a New Amino-Acld Isolated from Crown
Gall Tissue", Biochlm. et Blophys. Acta 40, 369 (I96O).
14. Blemann, K., 'and G. Spiteller, "Structure of Quebrach Amine",
Tetrahedron Letters I96I. 299.
15. Blemann, K., J. Seibl, and P. Gapp, "Mass Spectra of Organic
Molecules. I. Ethyl Esters of Amino Acids", J. Am. Chem.
Soc. 81, 3795 (1961).
16. Bray, E. E., and E. D. Evans, "Distribution of n-Paraffins as
a Clue to the Recognition of Source Beds", Geochim. et Cosmochim.
Acta 22, 2 (1961).
17. Clerc, R. J., and M. J. O'Neal, "Mass Spectrometrlc Analysis
of Asphalt. A Preliminary Investigation", Anal. Chem. 33.
380 (1961).
18. Cousins, L. R., D. J. Clancy, and G. F. Crable, "Dehydro
genation as an Aid to the Mass Spectrometric Analysis of
Naphthenes", Anal. Chem. 33, 1875 (I961).
470

19. Dink-Nguyen, N., and R. Ryhage, "A Mass Spectrometric
Demonstration of Hydrogen-Deuterium Exchange and Hydrogen
Redistribution During Catalytic Deuteration of Some Methyl
Octadecenoates", J. Research Inst. Catalysis, Hokkaido
Unlv. 8, 73 (i960).
20. Djerassi, C , B. Gllert, J. N. Shoolery, L. F. Johnston,
and K. Blemann, "Alkaloid Studies. XXVI. The Constitution
of Pyrlfolldlne", Experlntla 11, 162 (1961).
21. Fllnn, R. A., and 0. A. Larson, "Effects of Hydrogenation and
Catalytic Cracking on Various Molecular Types In Middle
Distillates", Preprints, Am. Chem. Soc, Dlv. Petrol. Chem. ^,
No. 3, 19 (i960).
22. Fritz, G., H. Buhl, J. Grobe, P. Aulinger, and W. Reering,
"Mass Spectrometric Investigation of Sl-Methylene Compounds",
Z. Anorg. U. Allgem. Chem. 312, 201 (I96I).
23. Gur'eu, M. V., "Mass Spectra and Primary Processes In the
Radiation Chemistry of Paraffins", Doklady Akad. Nauk S.S.S.R.
136, 856 (1951).
24. Heyns, K., and H. F. Gruetzmacker, "Mass Spectra of N-Formyl-a-
Amlno Acid Methyl Esters", Z. Naturforsch. 16B, 293 (1961).
25. Hlrt, C. A., "Analysis of Multicomponent Methyl- and Phenyl-
chlorosllane Solutions", Anal. Chem. 33, I786 (I96I).
26. Hoene, J. von, and W. M. Hickam, "Electron Attachment In C3F] 50",
J. Chem. Fhys. 32, 876 (I96O).
27. Holden, H. W., and J. C. Robb, "A Study of Coal by Mass
Spectrometry", Fuel 32, 39 (i960).
28. Levy, E. J., R. R. Doyle, R. A. Brown, and F. W. Melpolder,
"Identification of Components in Paraffin Wax by High Temperature
Gas Chromatography and Mass Spectrometry", Anal. Chem. 33, 698
(1961).
471

29. Levy, E. J., and W. A. Stahl, "Mass Spectra of Aliphatic
Thiols and Sulfides", Anal. Chem. 33., 707 (1961).
30. Lumpkin, H. E., and G. R. Taylor, "A Solids Inlet System for
a Mass Spectrometer", Anal. Chem. 33, 476 (I961).
31. Majer, J. R., "Mass Spectra of Cyclic Fluorine Compounds",
J. Appl. Chem. 1^, l4l (196I).
32. Margrave, J. L . , "Ionization Potentials of BjHg, B^Hgl,
•^10^14' "" • 10 13'-'2 5 ^ ^ ° ^ Electron Impact Studies", J. Chem.
Phys. 32, 1889 (i960).
33. Mead, W. L., and A. J. Wilde, "Mass Spectrum of Vanadyl
Etloporphyrin", Chem. and Ind. I961, 1315.
34. Miller, G. H., and G. 0. Pritchard, "Mass Spectra of Penta
fluoropropanal and Heptafluorobutanal", Chem. and Ind. I96I,
1314.
35. Nagy, B., and G. C. Gagnon, "Geochemistry of the Athabasca
Petroleum Deposit", Geochim. et Cosmochim. Acta 23, 155. (I96I).
36. Natalis, P., "Behavior of C^-g'Cycloalkanes and Ci|_g-
Ferfluorocycloalkanes Under the Impact of Electrons", Bull.
Soc. Roy. Sci. Liege 29, 2i (i960).
37. Park. R., and H. N. Dunning, "Stable C Isotope Studies of
Crude Oils and Their Porphyrin Aggregates", Geochim. et
Cosmochim. Acta 22, 99 (I96I).
38. Ryhage, R, S. Stallberg-Stenhagen and E. Stenhagen, "Mass
Spectrometrlc Studies. VII. Methyl Esters of a , p -
Unsaturated Long Chain Acids. Structure of C2Y Phthlenolc
Acid", Arkiv. Kemi 18, 179 (I96I).
39. Ryhage, R., and E. Stenhagen, "Mass Spectrometry in Lipid
Research", J. Lipid Research 1,, 36I (I96O).
472

40. Ryhage, R., and E. Stenhagen, "Mass Spectrometrlc Studies.
IV. Esters of Monomethyl - Substituted Long Chain Carboxylic
Acids", Arkiv. Kemi. 1^, 29I (i960).
41. Shapiro, I., and H. Landesman, "Fragmentation Patterns of
Halogenated Pentaboranes", J. Chem. Phys. 33., 1590 (I96O).
42. Sharkey, A. G., J. L. Schultz, and R. A. Friedel, "Comparison
of the Mass Spectra of Extracts and Vacuum Pyrolysis Products
from Coal", Fuel 4o, 423 (I96l).
43. Stenhagen, E., "Mass Spectrometry In Determination of Structure
of Organic Compounds, Especially Lipids and Peptides", Z. Anal.
Chemle I8I, 462 (I96I).
44. Trent, F. M., F. D. Miller, and G. H. Brown, "Mass Spectrometry
of Some High Molecular Weight Aliphatic Acids and Their Methyl
Esters. Analysis of Nonanoic and 2-Ethylheptanolc Acid
Mixtures", Appl. Spect. I5., 64 (1961).
45. Zlmlna, K, I., A. A. Polyakova, R. A. Khmel'nitskii, and
R. D. Obelentsev, "Mass Spectrometric Study of Some Thlophane
Homologs", Zhur. Obschel Khlm. 30, 1264 (196O).
473

BIBLIOGRAPHY of published and unpublished material pertaining'to new instruments and techniques in mass spectrometry for 1961.
Prepared by Subcommittee V ASIM Committee E-14
1. Aheam, A. J., "Mass Spectrographlc Studies of Impurities on Surfaces," Nat'l Symposium on Vacuum Technology 6, 1-5 (1959).
2. Aheam, A. J., ' lass Spectrographlc Analysis of Insulators using a Vacuum Spark Positive Ion Source," J. Appl. Phys. 32, No. 7, 1195-1196 (1961).
3. Aheam, A. J., "Mass Spectrographlc Detection of Impurities In Liquids," J. Appl. Phys. 32, No. 7, 1197-1201 (1961).
4. Akishin,P.A., Gorokhouv, L. N., Nlkltln, 0. Tl, and Khodeev, Yu. S., "Mass Spectrometer for Vaporization Study of Slightly Volatile Substances," Pribory i Tekh. Ekaperlmenta, No. 4, 98-102 (1960). ^
5. Akishin, P. A., Gorokhov, L. N., and Sidorov, L. N., "Mass Spectrometrlc Study of Sodium Chloride and Lithium Fluoride, Using a Double Effusion Chamber," Zhur. Fiz. Khim., 33, 2822-3 (1959).
6. Alekseevskll, N. E. , Dubrovln, A. V., Kosourov, G. I., Prudkovskil, G. P., Flllmonov, S. E., Chekln, V. I., Shelyapin, V. N. , and Shuvalova, T. K., "Inhomogeneous-Fleld Mass Spectrometer for Analysis of Light-Element Isotopes," Proc. All-Unlon Sci. Tech. Conf. Appl. Radioactive Isotopes, Moscow, 73-77 (1957).
7. Anbar, M. and Guttman, S., "The Isotopic Exchange of Oxygen Between lodate Ions and Water," J. Amer. Chem. Soc, 83, 781-783 (1961).
8. Ardenne, M. von. Developments In the Electron-Accumulating Mass Spectrometry of Polyatomic Molecules," Trans. No. MCL-818 of Zeitshrift Fur Angewandte Physlck 11, 121-131, (1959).
9. Ardenne, M. V., Selnfelder, K., and Tummler, R., "Mass-Spectrograms of Condensed Aromatic Hydrocarbons, Using Electron Addition," Angew. Chem. 7 3 , 136-42 (1961).
10. Ausloos, P. and Rebbert, R. E., "Intramolecular Rearrangements. III. Fonnation of 1-Methylcyclobutanol in the Photolysis of 2-Pentanone," J. Amer. Chem. Soc. 83, 4897-4899 (1951).
11. Bader, Michel, Wlttebom, Fred C , and Snouse, Thomas W., "Sputtering of Metals by Mass-Analyzed N2+ and 1T ," NASA Tech. Report R-105 (1961).
12. Bafus, D. A. and Brcrwn, T. L., "The Mass Spectrum of Ethyllithlum Vapor," J. Phys. Oiem., 65-8. 1380-1383.
13. Bainbridge, K. T. and Moreland, P. E. Jr., "The Mass spectrometer at Harvard University,"(Contract NONR-186619) Lyman Lab. of Physics, Harvard U., Cambridge, Mass., April 1961.
14. Bakhtln, V. I., and Mlkhallln, V. N., "Autocompensated Thermovacuum Meter," Izmeritel'naya Tekh. S o . 9, 25-26 (1960).
15. Barnes, W. S., Martin, D. W., and McDanlel, E. W., "Mass Spectrographlc Identification of the Ion Observed in Hydrogen Mobility Experiments," Reprint from Phys. Rev. Letters, 6, 110-111 (1961).
16. Beckey, H. D., "Mass Spectrometric Investigation by Means of a Field-Emission Ion Source of Ion-Molecule Reactions and of the Association of Mater," Z. Naturforsch, 15a. 822-7 (;i960).
17. Begun, G, M. and Landau, L., 'Mass Spectra and Metastable Transitions in Isotopic Nitrous Oxides," J. Oiem. Phys. 35, 547-551 (1961).
18. Belyakov, Yu. I. and Agishev, E. I., "Application of the Pulse Mass Spectroscope to the Investigation of Gas Evolution from Metals," Zhur. Tekh. Fiz. 29, 796-8 (1959).
474

19. Benson, B. B. and Parker, P. D. M., Relations Among the Solubilities of Nitrogen, Argon, and Oxygen in Distilled Water and Sea Water," J. Phys. Chem., 65-9, 1489-1496.
20. Bernecker, R. R. and Long, F. A., "Heats of Formation of Some Organic Positive Ions and Their Parent Radicals and Molecules," J. Phys. Chem. 65-9. 1565-1569.
21. Betts, J. F., Fluegge, R. A., O'Halloran, G. J., Narcisi, R. S.. "Development of a Balloon-Bome TIme-of-Flight Mass Spectrometer," A.S.T.M., Ninth Annual Meeting of Committee E-14, Chicago, 111., June 4-9, 1961.
22. Bldinosti, D. R. and Porter, R. F., "Mass Spectrometrlc Studies of Low Pressure Pyrolysis Reactions of Chlorinated and Fluorinated- Cl and C2 Compounds on Graphite," J, Amer. Chem. Soc, 83, 3737-3743 (1961).
23. Blemann, K., Seibl, J., and Gapp, F., "Mass Spectra of Organic Molecules. I. Ethyl Esters of Amino Acids," J. Amer. Chem. Soc. 83, 3795-3804 (1961).
24. Blemann, K. ."Application of Mass Spectrometry to Structure Problems. IV. The Carbon Skeleton of Sarpaglne," J. Amer. Chem. Soc. 83, 4801-05 (1961).
25. Biemann, K. and Friedmann-Spiteller, Margot, "Application of Mass Spectrometry to Structure Problems. V. Iboga Alkaloids," J. Amer. Chem. Soc, 83, 4805-10 (1961).
26. Bloch,. A., "The Mass Spectrum of Argonat Elevated Pressures in the Ion Source," J. de Chlmie Physique 58. 289-91 (1961).
27. Bonnet, Mile.,, "Mass Spectrometer for Light Elements," Vide 16, 134-40 (1961).
28. Bradley, J. N. and Kistlakowsky, G. B., "Shockwave Studies by Mass Spectrometry. I. Thermal Decomposition of Nitrous Oxide," J. Chem. Phys. 35, 256-263 (1961).
29. Bradley, J. N. and Kistlakowsky, G. B.. "Shockwave Studies by Mass Spectrometry. II. Polymerization and Qxidation of Acetylene," J. Chem. Phys. 25. 264-70 (1961).
30. Brown, T. L., Berkowitz, Jr., and Bafus, D. A.. "The Mass Spectrum of Ethyl-Lithium Vapor." Contract AF 49 (638) 466 (U. of Illinois in coop, with Argonne Nat'l Labs, Jan. 1951), (AFOSR-220).
31. Bunt, E. A., "Mass Analysis of Flames and Flue Gases," Syn^oslum on Combustion, 7th, London and Oxford. 1958. 325-31 (1959).
32. Burtt. R. B., Colligon, J. S.. and Leek. J. H., "Sorption and Replacement of Ionized Noble Gases at a Tungsten Surface," British J. of Appl. Phys. 12. 395-400. (1951).
33. Busch, F. V. and Paul, W., "Isotope Separation by the Electrical Mass Filter," Zeitschr. F. Physik, 164, 581-7 (1961).
34. Busch, F. V. and Paul, W., "Non-Linear Resonances in the Electrical Mass Filter due to Irregularities of the Field Distribution," Zeitschr. F. Physlk, 164, 588 (1961).
35. Campbell, B. L. and Whitten, K. N., "Isotopic Discrimination Introduced by Electron Multiplier Detection in Mass Spectrometry." Jour, of Sci. Instr. 38. 516, (1961).
36. Cathey, LeConte, "Electron Multiplier as a Detector for a Surface Ionization Mass Spectrometer, Design," U.S. At. Energy Comm. DP-498, 18 pp. (1960).
37. Charles, D., and Warnecke, R. J., Jr., "Experimental Study of an Omegatron-Type Mass Spectrometer," Nat'l Symposium on Vacuum Technol. 6. 34-41 (1959).
38. Chupka. W. A. and Kaminsky, M., "Energy Distribution and Fragmentation Processes Resulting from Electron Impact of Propane and n-Butane," J. Chem. Phys. 35, 1991-1998 (1961).
39. Colin, R., "Measures of Thermodynamic Values by Mass Spectrometer, Study of Sulfur and Zinc," AD-257, 163, Dlv. 25.17 (1961), Aerospace Tech. Intell, Center, Wright-Patterson AFB, Ohio
475

40. Colin, R., "Measurement of the Relative Ionization Cross-Sections of Zn. Te, and Te2. and of the Dissociation Energy of Te by Mass Spectrometry." AB-257-713, Div. 25. Aerospace Tech.Intell. Center, Wright Patterson AFB, Ohio.
41. Cook. G. L.. Meyer, R. A., and Earnshaw, D. G., "Dual-Inlet Syatem for a Mass Spectrometer." U.S. Bur. Mines, Rept. Invest. No. 5663. 8 pp. (1960).
42. Comides, I, Kakuszl, M., Pasztohy, B,, "Mass Spectrometric Investigation of Residual Gases," Ann. Irinyi Tech. School of Chem., 2 , 55-63 (1961).
43. Curran. R. K.. "Low-Energy Processes for F" Formation in SFg." J. Chem. Phys. 34. 1069, (1961).
44. Curran, R. K. and Fox, R. E., "Mass Spectrometer Investigation of Ionization of N2O by Electron Impact." J. Chem. Phys. 34, 1590-1594 (1961).
45. Curran, R. K.. "Posiclve and Negative Ion Formation in CCI3F." J. Chem. Phys. 34. 2007-10 (1951).
45. Curran. R. K., "Negative Ion Formation in Ozone." J. Chem. Phys. 35. 1849-1851 (1961).
47. Cuthbert, J., "Modifications to an M.S. 2 Mass Spectrometer." J. Sci. Instr., 38. 337 (1961).
48. Daly. N. R.. "High Sensitivity Mass Spectrometer Leak Detector." Rev. Sci. Instr. 30, 1093-1095 (1959).
49. Dibeler, V. H.. Reese, R. M., and Franklin, J. L., "Mass Spectrometrlc Study of Cyanogen and Cyanoacetylenes," J. Amer. Chem. Soc, 83, 1813-1817 (1961).
50. Donahue, T. M. and Hushfar, Farid, "Formation of Negative Ions in a Gas by Charge Transfer from a Fast Atomic Hydrogen Beam," Contract DA-36-034-0RD-2912 and NONR-63406, Rept. No. 15, Unlv. of Pittsburgh, Unclassified (1961).
51. Dorman, F. H. and Morrison, J. D., "Determination of Relative Electronic Transition Probabilities by Impact Methods," J. Chem. Phys. 34, 578-582 (1961).
52. Dorman, F. H. and Morrison, J. D., "Ionization Potentials of Multiply Charged Krypton, Xenon, and Mercury." J. Chem. Phya. 34, 1407-1410 (1961).
53. Dorman, F. H. and Morrison, J. D., "Double and Triple Ionization in Molecules Induced by Electron Impact," J. Chem. Phys. 35, 575-581 (1961).
54. Doucette, E. I., "Materials for and the Mechanism of Gettering Multiple Component Gases." Ronson Metals Corp, Newark, N. J..Contract AF 19 (604) 8430 (AFCRL-578).
55. Eberhardt, P.. "Trochoidal Mass Spectrometer for Small Amounts of Rare Gases," Helv. Phys. Acta. 33, 588-590 (1960).
55. Ehlbeck, H. W., Ruf, J., Schuetze, H. J., "Rapid Scanning R-F Mass Spectrometer," Telefunken, Ulm (Donau), Germany, unpublished material.
57. Ehlbeck, H. W. . Loecherev, K. H., Ruf, J., Schuetze, H. J., "The Operation of the R.F. Mass Spectrometer at High r.f. Voltage Levels," Seventh Nat'l Symposium on Vacuum Technology Transaction (1950).
58. Elbert, A. A. Jr., "Uae of a Getter-Ion Type Pump with a Mass Spectrometer," Applied Spectroscopy JL5, 152 (1961).
59. Eliel, E. L., McCollum. J. D.. Meyeraon. S., and Rylander. P., "Organic Ions in the Gas Phase,IX. Dissociation of Benzyl Alcohol by Electron Impact,'! J. Amer. Chem. Soc. 83, 2481-2484 (1951).
50. Ewald, Heinz, "Mass Spectrograph for the Analysis of Particles of High Kinetic Energy." Proc. Intem. Conf. Nuclidic Masses. Hamilton. Ontario. Canada, 491-7.
51. Eyring, E. M. and Wahrhaftig, A. L., "Dependence of Calculated and Experimental Propane Mass Spectra upon Electron Voltage," J. Chem. Phys. 34, 23-28 (1961).
476

62. Fergason, L. A., "The Determination of Hydrogen in Uranium by Mass Spectrometry," nuclear Science and Eng., May 1961.
63. Field, F. H. and Franklin, J. L., "Reactions of Gaseous Ions. X. Ionic Reactions in Xenon-Methane Mixtures," J. Amer. Chem. Soc. 83, 4509-4515 (1961).
64. Field, F. H., "Reactions of Gaseous Ions. VIII. Multiple Order Ion-Molecule Reactions and the Ultra-iigh Pressure Mass Spectrum of Ethylene," J. Amer. Chem. Soc, 83, 1523-1534 (1961).
65. Fiks, V. B. and Plkus, G, E., "The Analysis of Trace Impurities by the Magnetic Resonance Mass Spectrometer," Fiz. Tverdago Tela , 715-727 (I960).
66. Florescu, N. A., "New Thermionic Ionization Gage," Vide 16, 10-17 (1961).
67. Floumoy, J. M. and Wllmarth, W. K., "The Base Catalyzed Exchange of Hydrogen Gas and Protonlc Solvents. III. The Catalytic Efficiency of Concentrated Aqueous Alkali," J. Amer. Chem. Soc, 83, 2257-2262 (1961).
68. Fluegge, R. A., "The Use of the Spark Source-Time-of-Flight Mass Spectrometer," Ninth Annual Meeting of Committee E-14, A.S.T.A., Chicago, 111., June 4-9, 1961.
69. Fogen', Ya. M., Koval', A. G., Leuchenko, Yu, Z,, "Formation of Slow Negative Ions In Single Collisions between Fast Negative Hydrogen nnrf Oxygen Ions and Gas Molecules," JETP (USSR) 40, 13-22 (1951); JETP 13, 8-14, (1961).
70. Forrestal, L. J. and Hamill, W. H., "Effects of Ionic and Free Radical Processes in the Radiolysls of Organic Liquid Mixtures," J, Amer. Chem. Soc. 83, 1535-1541 (1961).
71. Fox, R. E. and Curran, R. K., "Ionization Processes In CCI4 and SFg by Electron Beams," J, Chem. Phys, 34, 1595-1501 (1961).
72. Fox, R. E., "Ionization Cross Sections Near Threshold by Electron Impact," J. Chem. Phys., 35, 1379-1382 (1961).
73. Frldlrkhov, S. A., "Vacuum Gage for an Ultrahigh Vacuum," Nauch.-Tekh. Inform. Byull. Leningrad. Polltekh. Inst. No. 1, 45-49 (1959).
74. Frlstrom, R. M., Grunfelder, C., and Favln, S,, "Methane-Oxygen Flame Structure, m . Characteristic Profiles and Matter and Energy Conservation in a One-Twentieth Atmosphere Flame," J. Phys. Chem., 55-4, 580-601.
75. Frost, D. C. and McDowell, C. A., "The Determination of Ionization and Dissociation Potentials of Molecules by Radiation of Electrons," Contracts AF-19 (604) 2275, Proj. 7535, Univ. of British Columbia, Canada (1960).
76. Futrell, J. H., "Use of Mass Spectral Data In Radiation Chemistry," J. Chem. Phys., 35, 353-355 (1961).
77. Gabor, D., "A New Thermionic Generator," Nature 189. 868-872 (1961).
78. Gallegos, E. and Kiser, R. W,, "Electron Impact Spectroscopy of Ethylene Sulfide and Ethylenimlne," J. Phys. Chem., 65-7, 1177-1182.
79. Gallegos, E. J. and Kiser, R. W., "Electron Inqiact Spectroscopy of Ethylene Oxide and Propylene Oxide," J, Amer. Chem. Soc. 83, 773-777 (1951).
80. Gatz, C, R., Rosser, W. A., Smith, F. T., "Study of Radar Beam Attenuation in Rocket Exhaust Gases. Part 2, The Chemistry of Ionization in Rocket Exhausts," Contract AF-04 (647) 221 AFBMD Tr. 61-39 Pt. 2 (1961).
81. Genge, C. A., "Innovations in Heated Inlet System for Mass Spectrometer," Anal. Chem. 31, 1747-1748 (1959).
82. Ghosh, S. N. and Srlvastava, B. N., "Sensitivity of UG-IA Ionization Gauge (iculated from the Probability of Ionization of Gases," Can. J. of Phys, 39 (2), 1951.
83. Giedd, G. K. and Roberta, G, C , "Emission Control for the Omegatron-type Mass Spectrometer," J. Sci. Instr. S. 361-362 (1951).
477

84. Giese, C. F. and Maier, W. B.II, "Ion-Molecule Reactions Studied with Mass Analysis of Primary Ion Beam," Jr. (Jiem. Phys. 35, 1913-1914 (1961).
85. Goldstein, H. W., Walsh, P. N., White, D., "Hare Earths. II. Vaporization of La203 and Nd^O,: Dissociation Energies of Gaseous LaO and NdO," J. Phys. Chem. 65-8. 1401-1404.
86. Grimley, R. T.. Bums. R. P.. and Inghram. M. G., "Thermodynamics of the Vaporization of Nickel Oxide." J. Chem. Phys. 35. 551-554 (1961).
87. Grimley. R. T., Bums, R. P., and Inghram, M. G., "Thermodynamics of the Vaporization of Cr203; Dissociation Energies of CtO. Cr02, and Cr03." J. Chem. Phys. 34, 664-667 (1961)
88. Halloran, G. J.. "A Rapid Response Mass Spectrometer for Respiratory Fuction Analysis." Paper presented at the clinic on Instrumentation Requirements for Psychophysiological Research held at Lafayette Clinic, Detroit, Mich.. May 15-17, 1961.
89. Harrison, A. G., Kebarle, P., Lossing, F. P., "Free Radicals by Mass Spectrometry. XXI. The Ionization Potentials of Some Meta- and Para-Substituted Benzyl Radicals," J. Amer. Chem. Soc, 83, 777-780 (1961).
90. Harvey, C. E. and Mellichamp, J. W., "Spectrochemlcal Detection of Nonmetallic Elements," Contract DA 36-039-SC-78267. In coop, with Army Signal Res. and Devel. Lab., Fort Monmonth, N. J. (1951).
91. Herlan, Albert, "Evaluation of Mass-Spectrometric Analyses by Using a Digital Computer," Z. anal. Chem. 180, 321-330 (1961).
92. Herron, J. T. and Dibeler, V. H., "Mass Spectrometrlc Study of NF2, NF3. N2F2, and N2F4," Jour, of Research, Nat'l Bureau of Standards, 65a, Sept-Oct. 1961, 405-409.
93. Herron, J. T., "Rate of the Reaction NO + N and Some Heterogeneous Reactions Observed in the Ion Source of a Mass Spectrometer," Jour, of Research, Nat'l Bureau of Standards, 65a, Sept.-Oct. 1961, 411-413.
94. Hertzberg,M., Rapp, D., Ortenburger, I. B., and Briglia, D. D., "Ion-Neutral Reactions in the Helium-Hydrogen System," J. Chem. Phys. 34, 343- 344 (1951).
95. Hirota, K. Nagoshi. K., Hatada, M., "Studies on Maas Spectra and Appearance Potentials of Acetic and Deuteroacetic Acid, a33COOH." Bull. Chem. Soc, Japan, 34, 226 (1961).
96. Hobrock, B. G. and Kiser, R. W., "Electron Impact Spectroscopy of Tetra Methyl Silicon - Tin and Lead -," J. Phys. Chem. 55-12, 2186-2189.
97. Hoering, T. C. and Parker, P. L., "The Geochemistry of the Stable Isotopes of Qilorine," Geochim, et Cosmochim. Acta, 23, 186 (1961).
98. Holroyd, R. A., "Radiation (Siemistry of Neopentane," J. Phys. Chem., 65-8, 1352-1357.
99. Honlg, R. E., "Ultra-High Vacuum Studies with a Small Bakeable Mass Spectrometer," Nat'l Symposium on Vacuum Technol. 6, 20-26 (1959).
100. Ingalla, R. B., "Hydrogen Formation in the Radiolysls of Toluene," J. Phys. Chem. 65-9, 1605-1608.
101. Inghram, Mark G., "Thermodynamics of Refractory Materials as Determined with a Mass Spectrometer," Unlv. of Chicago, 111., Proj. TB2-0001 (1543) (Contract DA U-022-ORD-1993 ,
102. Inouye, H., "Mass Spectrcmetrlc Study on Adsorption of Water Vapor," Bull. Chem. Soc, Japan, 34, 543 (1961).
103. Irsa, A. P. and Friedman, L., "Collision-Induced Dissociation of HD," J. Chem. Phys. 34, 330-331 (1961).
478

104. Istomln, V. G., "Mass-Spectrometrlc Measurements of the Ionic Composition of the Upper Atmosphere by the Third Artificial Earth Satellite," Doklady Akad. Nauk. S.S.S.E. 129, 81-84 (1959).
105. Istomln, V. G., "Radio-Frequency Mass Spectrometer for the Investigation of the Ionic Composition of the Upper Atmosphere." Trans, from Iskusstuennyye Sputniki Zemli (Artificial Earth Satellites, Ac. of Sci., U.S.S.R.) Jan. 1961.
106. Istomln, V. G., "Variation in the Positive Ion Concentration with Altitude from Data of Mass Spectrometry on the Third Satellite," Planetary & Space Sci., 8, Dec. 1951, Pergamon Press.
107. Janatka, Mlroslav, and Urgosik, Bohus, "Analysis of Residual Gases in Vacuum System by Means of the Omegatron," Ceskolov. Casopis fys. J^, 461-464 (1950).
108. Kanomata, I., Kaneko, Y., Ogu'ri, T., "Mass Spectrometer for Appearance Potential Study," TSyo Butsuri (Jour, of Applied Physics, Japan), 30, 502 (1961).
109. Karmohapatro, S. B., "Two-Directional, Focusing, High-Intensity Mass-Spectrometer," Indian J. Phys. 34, 407-415 (1960).
110. Kauder, L. N., Spindel, W., Monse, E. U., "Fractionation of Oxygen Isotopes by the Distillation of Azeotropic Solutions," J. Phys. Chem. 65-8, 1435-1438.
111. Kenezevic , Z. V., "Mass Spectrometrlc Determination of the Self-Diffusion Coefficient of Boron Trifluoride," Bull, of the Institute of Nuclear Sciences, "Boris Kldrich," 11, 141-144, (1961).
112. Ridley, K. G. and Silver, D. E. P., "Mass Spectrometer for the Isotopic Analysis of Lithium," Jour. Sci. Instr. 38, 1961, 47-51.
113. Kirchner, Fritz, "Geiger Counters for Achieving High Sensitivity and Fast Readings in Mass Spectroscopic Investigation," Z. angew. Phys. JL3, 53-6 (1961).
114. Kiser, R. W. and Hisatsua^.I. C., "Electron Impact Spectroscopy of Nitrogen Dioxide," J. Phys. Chem. 65-8, 1445-1446.
115. Klopfer, A. and Schmidt, W., "Omegatron Mass Spectrometer and Its Characteristics," Vacuum 10, 363-372 (1960).
116. Klopfer, A. and Schmidt, W., "An Omegatron for the Quantitative Analysis of Gases," Phillips Tech. Rev. 22, 195-203 (1961).
117. Knox, B. E. and Palmer, H. B., "Bond Dissociation Energies in Small Hydrocarbon Molecules," Chemical Review 51, 247-255 (1961).
118. Kohler, R., Paul, W., Schmidt, K., and von Zahn, U., "Preliminary Report on a Quadrupole Spectrometer of High Resolution," Proc. Intem. Conf. Nuclidic Masses, Hamilton, Ont., Can., 507-13.
119. Kokubu, N., Mayeda, I., Drey, H. C., "Deuterium Content of Minerals, Rocks, and Liquid Inclusion from Rocks," Geochim. et Cosmochim. Acta., _21, 247 (1961).
120. Konlg, L. A., "Influence of Second-Order Aberrations on the Line Shape in Mass Spectrometers with First-Order Double Focusing," Proc. Intern. Conf. Nuclidlc Masses, Hamilton, Ont., Can., 498-505.
121. Kubose, Don A., and Hamlll. William H.. "Mass-Dependent Ion Collection Efficiencies in a Mass Spectrometer," J. Phys. Chem. 55, 183-184, (1951).
122. Kuchkov, E. M., "The Shape of the Mass Spectrum Lines and the Role of the Pulse Ion Source in the Radio-Frequency Mass Spectrometer," Zhur. Tekh. Fiz. 30. 568-572 (1960).
123. Kupriyanov, S. E., "Adaptation of the MS-1 Mass Spectrometer for Analysis of Inert Gases and Determination of Small Amounts of Inqjurities," Trudy, Postoyan. Mezhlnst. Kollok, po Tverd. Fazam Peremennogo Sostava, Fiz.-Khlm. Inst. Im L. Ua. Karpova 1957-8, No. 8-30, 104-7 (Pub. 1959).
124. Lafferty, J. M., "Hot-Cathode Magnetron Ionization Gage for the Measurement of Ultrahigh Vacuums," J. Appl. Phys. 32, 424-434 (1951).
479

125. Landahl, Charles E. and Merryman, Roy G., "Modifications to C3EC 21-520 Mass Spectrometer for Increased Sensitivity," U.S. At. Energy Comm. LAMS-2491 (1961).
126. Levina L. E.. "Possible Use of Mass Spectrometry to Study the Thermodynamics of Evaporation." Zhur. Fiz. Khim. 34. 456-459 (1960).
127. Linner, L. R., George. R. I., and McQulstan, R. B., "Automatic Vacuum Control in the 760-lxl0"8 mm Range," Rev. Sci. Str. jll. 650-652 (1960).
128. Locherer. K. H., "Non-Linear Theory for the High Frequency, Redhead type. Mass Spectrometer," Vakuum Technik, Sept. 6, 1961, Rudolf A. Lang, Verlag, Berlln-Charlottenburg, 2.
129. Lumpkin, H. E. and Taylor, G. R., "Solids Inlet Systems for a Mass Spectrometer," Anal. Chem. 33, 476-7 (1961).
130. Lynn, K. R. and Yankwlch, P. E., "Cyanide Carbon Isotope Fractionation in the Reaction of Cyanide Ion and Methyl Iodide. Carbon Isotope Effect in the Hydrolysis of Methyl Iodide," J. Amer. Chem. Soc. 83, 53-57 (1951).
131. McDaniel, E. W. and Martin, D. W., "Mobility and Clustering of Negative Ions and Mass Spectrographlc Study of Ion-Molecule Reactions Occurring at Thermal Energies Under Gas Kinetic Conditions," Georgia Inst, of Tech., Eng. Exper. Sta., Atlanta, Ga., Final summary report. Mar. 31, 1951.
132. McMullen, C. C , Cragg, C. B.. Thode, H. G., "Absolute Ratio of B'-^/B^" in Searles Lake Borax," Geochim. et Cosmochim. Acta. 23, 147 (1961).
133. Maass, I., The Exchange of 0-18 between water and glass," Kernenergie _3, 843-6, 1960.
134. Margrave, J. L., "High Temperature and Plasma CJiemlstry," CJiem. Engln. 68, 168-172 (1961).
135. Marshall, R. R. and Hess, D. C , "Lead from Troilite of the Toluca Iron Meteorite," Geochim. et Cosmochim. Acts 21, 151 (1961).
135. Martynkevlch, G. M., "Mass Spectra and Structure of Metal Vapors," Izvest. Akad. Nauk S.S.S.R. Otdel. Tekh Nauk, Met. 1 Toplivo, No. 6, 145-7 (1950).
137. Melton C. E., "Studies of Transient Species Formed During Catalytic Reactions of CO2 + D2 and of 1-Butene," J. Chem. Phys. 35, 1751-1757 (1951).
138. Meyerson, S,, McCollum, J. D.. Rylander, P. N., "Organic Ions in the Gas Phase. VIII. Blcycloheptadlene," J. Amer. Chem, Soc. 83, 1401-1403 (1951).
139. Meyerson, S., "Effect of Electron Energy on Some Electron Impact Processes," J. Chem. Phys. 34, 2045-2049 (1951).
140. Milne, T. A., Klein, H, M., Cubicciotti. D., "Mass Spectrometer Analysis of the Vapor in Equilibrium with the Alkali-Metal CJilorldes," J. Oiem. Phys., 28. 718-719 (1958).
lAl. Milne, T. A., Determination of Relative Partial Pressures from Mass Spectrometer Ion Intensity Measurements," J. Chem. Phys. 28, 717-718 (1958).
142. Morris, J. M., "Spectrographlc Analysis of Semiconductor and Related Materials," Metal Hydrides, Inc., Beverly, Mass., Final report, March 1961, contract AF-19 (604) 3469.
143. Muller, Gunter, "Sampling Apparatus for Small Gas Quantities," Chem. Tech. (Berlin) 13, 237 (1961).
144. Mumbach, Herbert R., "Liquid-Sampling Devise for the Mass Spectrometer," Anal. Chem. 33, 318-319 (1961).
145. Narten, A. and Taylor, T. I., "Separation of Nitrogen and Oxygen Isotopes by Exchange of Nitric Oxide Complexes," J. Phys. Chem., 65-10. 1877-1880.
146. Nief. G. and Severln, M., "Mass-Spectrometrlc Analysis of Trace Oxygen in Carbon Dioxide," Comm. energie at. (France), Rappt. CEA 1941 (1951).
480

147. Nier, A. 0., "Small General Purpose Double Focusing Masa Spectrometer," reprint from Rev. Sci. Instr. 31 1127-1132, (1950).
148. Nikolaeu, V. S., Emitrieu, I. S., Fateeva, L. N., and Tepcova, Ya. A. "Investigation of the Equilibrium Charge Distribution in a Fast Ion Beam." J.E.T.P. 12. 627-533 (1951).
149. Nishlno. Y., "Studies on the Characteristic Peak and the Sensitivity for the Analysis of the Micro-Component by the Mass Spectrometry," Bunseki Kagaku, 10, 591 (1951).
150. Okano, J., "An Analysis of Residual Gases," Shinku, Jour, of the Vacuum Society of Japan, 4, 154 (1961).
151. Palchak, R. J. F., Norman, J. H., Williams, R. E.,"Decaborane, "6Benzyl" B, JI,., Chemistry," J. Amer. Chem. Soc. 83, 3380-3384 (1961). 10^13
152. Panish, M. B., "Vaporization of Several Rare Earth Oxidea," J. Chem. Phys. 34, 1079-1080 (1961).
153. Papazlan, H. A., "The Decomposition of Solid HAN2 Induced by Charged Particle Bombardment," J. Phys. Chem., 65-1, 53-55.
154. Park, R. and Dunning, H. N., "Stable Carbon Isotope Studies of Crude Oils and Their Porphyrin Aggreggates." Geochim. et Cosmochim. Acta £2. 99 (1961).
155. Pavlenko, V. A., Rafal'son, A. E. Slutskli, M. E., Tsveiman, G. A., and Shutov. M. D., "Radlofrequency Mass Spectrometer for Analysis of the Ionic and Molecular Composition of the Upper Atmosphere Layers," Pribory 1 Tekh. Ekspt. No. 6, 89-95 (1960).
156. Plkus. G. E. and Fiks, V. B., "Analysis of Microimpurlties by Magnetic Resonance Mass Spectrometry. II. Calculation of the Background Current," Fiz, Tverdogo Tela_2, 3120-3128 (1950).
157. Pines, H. and Ravoire, J., "Alumina; Catalyst and Support. XII. The Effect of Intrinsic Acidity of Aluminas upon Hydrogen-Deuterium Exchange," J. Phys. C3iem. 65-10. 1859-1861.
158. Plyutto, A. A. , "Acceleration of Positive Ions in Expansion of the Plasma in a Vacuum," J.E.T.P (U.S.S.R) 39, 1589-1592 (1960); J.E.T.P. 12, 1106-1108 (1961).
159. Porter, R. F,, "Molecular Association in Sodium Cyanide Vapor." J. Chem. Phys. 35, 318-322 (1961).
160. Porter, R. F., Stabilities of Gaseous Molecules In the Pb-Se and Pb-Te Systems," J. Chem. Phys. 34, 583-587 (1961).
161. Porter, R. F., "Mass Spectra of Vapors in the AI-AIF3 and AI-LIF-AIF3 Systems," Cornell Univ., Ithaca, N. Y., reprint from J. Chem. Phys. 33i 951-952 (1960).
162. Porter, R. F. and Zeller, E. E., "Mass Spectra of Aluminum (III) Halides and the Heats of Dissociation of Al2F6(g) and LiF.AlF3(g)," Cornel Univ., Ithaca, N. Y, Contract AF-18 (603)1 (AFOSR TN 60-340) Nov. 1960.
163. Potapov, V. K., Vasil'yev, V. G., and Tunitskly,N. N., "Ionization and Dissociation of Molecules of n-Octane and n-Nonane by Monoenergetic Electrons." Trans. No. MCL-587 from Doklady Akademii Nauk S.S.S.T. Izdatel'stvo Akad. Nauk S.S.S.R. 126, 612-615 (1959).
164. Pottie, R. F. and Lossing, F. P.. "Free Radicals by Mass Spectrometry. XXV. Ionization Potentials of Cyano-alkyl Radicals," J. Amer. Chem. Soc. 83, 4737-4739 (1961).
165. Pottie, R. F. and Lossing, F. P., "Free Radicals by Mass Spectrometry. XXIII. Mass Spectra of Benzyl and Alpha-d2-Benzyl Free Radicals," J. Amer. Chem. Soc. 83, 2634-2636 (1951).
166. Pottle, R. F.. Harrison. A. G., Lossing. F. P., "Free Radicals by Mass Spectrometry. XXIV. Ionization Potentials of Cycloalkyl Free Radicals and Cycloalkanes," J. Amer. Chem. Soc. 83, 3204-3206, (1961).
481

167, Qulnn, E. I. and Mohler, F. L., "Mass Spectra of Some Deuetroethanes," Jour, of Research, Natl. Bur. Stds. 65a Mar-April 1961, 93-95.
158. Rauh, E. G. and Thorn, R. J., "Uranium Monosulfide. II. Mass Spectrometric Study of Its Vaporization," J. Chem. Phys. 35, 619-24 (1961).
169. Rohwedder, William Kenneth, "Spark-Source Mass Spectrometer Intended for Major-Component Analysis," Unlv. Microfilms (Ann Arbor, Mich.), L.C. Card No. Mic 60-6517. 107 pp.
170. Ropp, G. A. and Gulllory, W. A., "Isotopic Studies Involving Formic Acid, and Its Derivatives. VII. Oxygen-18 Isotope Effect in the Photochemical Reaction of Formic Acid and Chlorine," J. Phys. CJiem. 65-9. 1496-1498.
171. Ropp, G. A., Melton, C. E., and Rudolph, P. S., Mass Spectrometrlc Test for an Intermediate in a Photochemical Reaction Involving Chlorine," J. Chem. Phys. 34, 588-589 (1961).
172. Safronov, B. G. Azovskli, Yu. S., and Aseev, G. G., "A Mass Spectroscopic Source of Ions with Surface Ionization," Pribory 1 Tekh. EzsperImenta, 70-82 (1957).
173. Salto. Y. and Hino, T., "Thermal Deterioration of Enameled Wires by the Mass Spectrometer Method," Power Appl. and Systems, 653-557 (1960).
174. Schoenheit, E.. "Mass Spectrometrlc Detection of Ions with the Ion Transformer Detector,"f.Naturforsch 15a, 839-841 (1960).
175. Schoenheit, E., "Masa Spectrometrlc Examination of the Photoionization of Hydrogen," Feltman Research Lab., Picatlnny Arsenal, Dover, N. J., 5 p. (1950), trans, from Zeitschrift fur Naturforschung by Fallnkas, A.
176. Schuchhardt, G., "Ion Motion In an Omegatron," Vacuum 10, 373-381 (1960).
177. Schulek, E., Pals, I., and Comides. I.. "Investigation of the (Jianges in the Oxidation Number by the Use of 0-18 Tracer Techniques." J. Inorg. Nucl. caiem. 21. 187-188 (1961).
178. Schulz. G. J., "Study of the N2O Molecule Using Electron Beams." J. (Jiem. Phys. 34. 1778-1781 (1961).
179. Shreeve, J. M. and Cady. G. H.. "Some Reactions of Peroxydisulfuryl Diflorlde>" J. Amer. Chem. Soc, 83, 4521-4525 (1951).
180. Shyuttse, V., Demlrkhanov, R. A. Gutkln, T. I., Samadashvili, 0. A., and Karpenko, I. K., "Mass-Spectrograph with Dual Focusing Along the Total Scale for Measuring Mass Isotopes," Pribory 1 Tekh. Eksperimenta No. 4, 92-98 (1950).
181. Smith. Lincoln G., "Design of a New RF Mass Spectrometer." Proc. Intem. Conf. Nuclidlc Masses. Hamilton, Ont.. Can., 418-431.
182. Splcyn, V. I. and Flnlkov, F, G., "Application of the 0-18 Isotope to Determine the Bond Strength of Oxygen in the Crystal Lattice of Solids." Kernenergie, 2> 834-835, (1960)
183. Stakhovskii, R. I., "Causes of Instability of Ion (Sirrents In the Analytical Mass Spectrometer and a Periodic Calibration Method," Automat. I Telemekh, 91-108 (1958).
184. Steiner, B., Glese, C. F., and Inghram, M. G., "Photoionization of Alkanes -Dissociation of Excited Molecular Ions," J. Chem. Phys. 34, 189-220 (1961).
185.Stevens, C., Terandy. J., Lobell, G.. Wolfe. J., Beyer. N.. and Lewis, R., "Argonne 100-inch Radius Double-Focusing Mass Spectrometer," Proc. Intem. Ckjnf. Nuclidlc Masses, Hamilton, Ont., Can., 403-417.
186 Stief, L. J. and Ausloos, P., "Vapor Phase Radiolysls of Azomethane," J. Phys. Chem., 65-5. 877-881.
187. Sujlura, Toshlo, and Hayakawa, Teruo, "Secondary Electron Emission From a Copper-Beryllium (4%) Surface by Bombardment of Various Positive Ions." Bull. Chem. Soc Japan 34, 58-63 (1961).
482

188. Sullivan, R. F., Egan, C. J., Langlols, G. E., Selg, R. P., "A New Reaction that Orcurs in the Hydro-cracking of Certain Aromatic Hydrocarbons," J. Amer. Chem. Soc, 83, 1156-1160 (1961).
189. Surplice, N. A., "Emission of Negative Ions of Oxygen from Dispenser Cathodes," (Part 1 - Cathodes of Barium Oxide in Sintered Nickel). Physics Dept., Unlv. College of North Staffordshire, Keele, Staffordshire, England. Brit. J. of Appl. Phys. 12> 214-219 (1961).
190. Beynon, J. H., Saunders, R. A., Topham, A., and Williams, A. E.. "The Study of the Fragmentation of Long-Chain Paraffins under Electron Bombardment using Isotoplcally Labelled Compound." J. Phys. Chem., 65-1, 114-118.
191. Trent, F. M., Miller, F. D., Brown, G. H., "Mass Spectrometry of Some High Molecular Weight Aliphatic Acids and Their Methyl Esters. Analysis of Nonanoic and 2-Ethylheptanolc Acid Mixtures," Applied Spectroscopy 15, 64-57 (1961).
192. Trulson, 0. C., Hudson, D. E., and Speddlng, F. H., "Cohesive Energies of Europium, Gadolinium, Holmium, and Erbium," J. Qiem. Phys. 35. 1018-1026 (1961).
193. Tumerman. L. A., "New Optical Method of Mass Spectroscopy," Fiz. Sbomik L'vov. Univ. No. 3, 81-83 (1957).
194. Tuul, J. and Farnsworth, H. E., "Dependence of Activity and Activation Energy on Surface Treatment of Nickel and Copper-Nickel Catalysts," J. Amer. Chem. Soc. _83, 2247-2253 (1961).
195. Vanderwaal, J. and Francken, J. C , "Analysis of Residual Gases in Television Picture Tubes with the Aid of the Omegatron," Phillips Tech. Rev. 23, 122-131, (1961/52).
196. Verhaegen, G., "On the Stability of Symmetrical Blatomlc Molecules of the Transition Elements," AD-257, 710, Dlv. 25, June 15, 1961, Aerospace Tech. Intelligence Center, Wright-Patterson AFB. Ohio.
197. Wallensteln, M. B. and Krauss, M., Interpretation of the Appearance Potentials of Secondary Ions," J. Chem. Phys. 34, 929-936 (1961). '
198. Walsh, p. N., Dever, D. F., White, D., "Rare Earths, m . A Mass Spectrometrlc Investigation of the Isomolecular Oxygen-Exchange Reactions of Lanthanum, Cerium, Praesodymium, and Neodymium with their Monoxides," J. Phys. Chem. 65-8. 1410-13.
199. Webster, R. K., Dance, D. F., Slee, L. J., "Some Possible Applications of Mass Spectrometry to Accounting Problems in Chemical Processing Plants," Anal. Chim. Acta 24, 509-525, (1961).
200. Webster, R. K., Smales, A. A., Dance, D. F., and Slee, L. J., "Determination of Plutonium by Mass Spectrometry Using a Plutonium-242 Tracer," Anal. Chim. Acta 24, 371-380, (1961).
201. Weininger, J. L., "The Reaction of Active Nitrogen with Liquid Siloxane Heptamer, Dy," J. Amer. Chem. Soc, 83, 3388-3390 (1961).
202. Welsz, P. B. and Kem, W. P., "Hydrocarbon Synthesis on Pure Irons",J. Phys. Chem. 65-3. 417-419.
203. White, D., Walsh, P. N., Goldstein, H. W., Dever, D. F., "Rare Earths. II. A Mass Spectrometric Determination of the Heats of Sublimation (or Vaporization) of Neodymium Praesodymium, Gadolinium, Terbium, Dysproslim, Holmium, Erbium, and Lutetium," J. Phys. Chem. 65-8. 1404-1409.
204. Williams. W. S.. "The Heats of Formation of Titanium Diboride; Experimental and Analytical Resolution of Literature Conflict," J. Phys. Chem., 65-12. 2213-2215.
205. Wolsky, S., "Research Study for Improved Omegatron Tubes," Contract AF-19 (604)-7409, AF(3tL-76, Final Report Feb. 1961, Raytheon Mfg. Co., Waltham. Mass.
205. Zahn, H. "Mass Spectrometric Analysis of the Lead Isotopes,"Kernenergie 3, 913-914 (1960).
207. Zdanuk, E. J., Bierlg, R., Rubin, L. G. . and Wolsky. S. P.. "An Onegatron Spectrometer, Its Characteristics and Application," Vacuum 10, 382-389 (1950).
483

208. Zlotowskl, J. and Vlncel, H., "Mass Spectrometric Studies of Chemical Processes Occurring in a Self-Quenching G. M. Counter-Filled with Long-Chain Saturated Hydrocarbons," Kemenergle, 3. 870-879, (1960).
209. Zmbov. K. F. and Ribnikar, S. V.. "Note on the Mass Spectra and Si;ructure of the Alcoxydifluroboranes," Bull, of Institute of Nuclear Sciences, "Boris Kldrich," Vol. II, No. 236, 145-153 (1961).
210. "New Logarithmic Transistorized Electrometer of I O " Dynamic Range Permits more Convenient Scanning of Mass Spectrum," An Electronic System for Tlme-of Flight Mass Spectrometer; unpublished material of Bendix Corporation Research Laboratories Division.
211. Geophysics Corporation, "New Instrument, Fundamental Study of Time of Flight," December 1961 (Contract NASW-25).
212. Kuchkov, E. M., "The Connection Between the Energy Distribution of Electrons and the Line Shape of the Mass Spectrum for a Radio-Frequency Mass Spectrometer," Zhur. Tekh. Fiz. 30, 948-953 (1960).
484

MASS SPECTROMETRY OF SOLIDS
A BIBLIOGRAPHY FOR 1961
Sub-Committee VII
Richard E. Honig RCA Laboratories
Princeton, New Jersey
1. M. Ackerman, J. Drowart, F. Stafford and G. Verhaegen, "Mass Spectrometric Study of Gaseous Molecules Above the AgSn, AuSn and CuSn Alloys," Scientific Note No. 5, Contract No. 61(052)-225, Brussels (1961).
2. A. J. Ahearn, "Mass Spectrographic Analysis of Insulators Using a Vacuum Spark Positive Ion Source," J. Appl. Phys. 32, 1195-7 (1961).
3. A. J. Ahearn, "Mass Spectrographlc Detection of Impurities In Liquids," J. Appl. Phys. 32, 1197-1201 (1961).
4. P.A. Akishin and Yu. S. Khodeev, "Determination of Heat of Sublimation of Uranium Tetrafluorlde by the Mass-Spectrometric Method," Zhur. Fiz. Khlm. 35, 1169-70 (1961).
5. T. Babellowsky and A. J. H. Boerboom, "Thermodynamic Study of CaO and Ta," Joint Conf. on Mass Spectrometry, Oxford (1961).
5. R. Bradley and E. Ruedl, "Positive Ion Emission frora Surfaces," Proceedings of Fifth International Conference on Ionization Phenomena in Gases, H. Maecker, Ed. (North-Holland Publ. Co., Amsterdam 1961).
7. R. Brown, R. D. Craig and R. M. Elliott, "Current Status of Spark Source Mass Spectrometry," Joint Conf. on Mass Spectrometry, Oxford (1961).
8. J.D. Carette and L. Kerwin, "Study of Red Phosphorus by Mass Spectrometry," Can. J. Phys. 39, 1300-19 (1961).
9. E. D. Cater, E. G. Rauh and R. J. Thorn, "Uranium Monosulfide. II. Mass Spectrometric Study of its Vaporization," J. Chem. Phys. 35, 519-24 (1961).
10. B. Chakravarty, V. S. Ventasubramanian and H. E. Duckworth, "The Relative Ionization Efficiencie for Elements in a Spark Source," Joint Conf. on Mass Spectrometry, Oxford (1961) .
11. W. A. Chupka, J. Berkowitz, D. J. Meschi and H. A. Tasman, "Mass Spectrometric Studies of High Temperature Systems," Joint Conf. on Mass Spectrometry, Oxford (1961).
12. E, A. C. Crouch, "On the Thermal Ionization of Elements of High Ionization Potential," Joint Conf. on Mass Spectrometry, Oxford (1961).
13. E. Doernenburg, H. Hintenberger and J. Franzen, "Structure of Polyatomic C Molecules Formed in HF Sparks," Z. Naturf. _16A 532-4 (1961).
14. J. M. Fluit, L. Friedman, A. J. H. Boerboom and J. Kistemaker, "Isotopic Fractionation of Lithium in Sputtering," J. Chem. Phys. 35, 1143-4 (1961).
15. J. M. Fluit, L. Friedman, J. van Eck, C. Snoek and J. Kistemaker, "Photons and Metastable Atoms Produced in Sputtering Experiments (5-20 kev)," Proceedings of Fifth International Conference on Ionization Phenomena in Gases, H. Maecker, Ed. (North-Holland Publ. Co., Amsterdam 1961).
16. J. Franzen and H. Hintenberger, "Multlatomic Molecular Ions in the High Frequency Spark Between Electrodes from Be, C, Mg, Al, Ti, Fe and Cu," Z. Naturf. 16A. 535-9 (1961).
485

17. H. W. Goldstein, P. N. Walsh and D. White, "Rare Earths. I. Vaporization of La.O, and Nd„0,: Dissociation Energies of Gaseous LaO and NdO," J. Chem. Phys. 65, 1400-4 (1961).
18. E. F. Greene, "Reduction of K Ion Background in W Surface Ionization Detectors for Molecular Beams," Rev. Sci. Instr. 32, 860-1 (1951).
19. R. T. Grimley, R. P. Burns and M. G. Inghram, "Thermodynamics of the Vaporization of NiO," J. Chem. Phys. 35, 551-4 (1961).
20. R. T. Grimley, R. P. Burns and M. G. Inghram, "Thermodynamics of the Vaporization of Cr,0,: Dissociation Energies of CrO, CrO, and CrO,," J. Chem. Phys. 34, 664-7 (1961J. " ^ ' '
21. H. Gutbier, "Mass Spectrometrlc Investigation of Vaporization of Simple Compounds Having a Zinc Blende Structure at Near 1000°K," Z. Naturf. 16A,268-79 (1961).
22. H. B. Hannay, "Mass Spectrographic Analysis of Solids," Science ^ 4 , 1220-5 (1961).
23. A. A. Hasapis, A. J. Melveger, M. B. Panish, L. Reif and C. L. Rosen, "The Vaporization and Physical Properties of Certain Refractories," Quarterly Technical Summary Report No. 4, Contract AF33(616)-6840 (1961).
24. R. E. Honig, "The Sputtering of Silicon Carbide by Positive Ion Bombardment," Proceedings of Fifth International Conference on Ionization Phenomena in Gases, H. Maecker, Ed. (North-Holland Publ. Co., Amsterdam 1961).
25. R. E. Honig, "Mass Spectrometric Studies of Solid Surfaces," Joint Conference on Mass Spectrometry, Oxford (1961).
26. G. E. Moore, "Dissociation of Absorbed CO by Slow Electrons," J. Appl. Phys. 22, 1241-51 (1961).
27. H. E. Lumpkin and G. R. Taylor, "Solids Inlet System for a Mass Spectrometer," An. Chem. 33, 476 (1961).
28. M. B. Panish, "Vaporization of the Rare Earth Oxides," J. Chem. Phys. 34, 2197-8 (1961).
29. M. B. Panish, "Vapor Pressure of Silver," J. Chem. Eng. Data 6, 592-4 (1961).
30. M. B. Panish and L. Reif, "Vaporization of Iridium and Rhenium," J. Chem. Phys. 34, 1915-18 (1961).
31. R. F. Porter, Molecular Association in Sodium Cyanide Vapor," J. Chem. Phys. 35, 318-22 (1961).
32. R. F. Porter. "Stabilities of Gaseous Molecules in the Pb-Se and Pb-Te Systems." J. Chem. Phys. 34. 583-7 (1961).
33. V . I . Raiko, M. S. loffe and V. S. Zolotarev. "An Ion Source with Surface Ionization for the Separation of Isotopes of Alkali Metals," (Soviet) Instr. and Exp. Techniques #1, 25-27 (1961).
34. R. G. Ridley and D. E. P. Silver, "Mass Spectrometer-for the Isotopic Analysis of Li," J. Sci. Instr. 38, 47-50 (1961).
35. W. K. Rohwedder. "A Spark Source Mass Spectrometer Intended for Major Component Analysis." Diss. Abstr. 21, 2094 (1961).
35. C. M. Stevens, J. Terandy, G. Lobell, J. Wolfe, R. Lewis and N. Beyer, "High Sensitivity Isotopic Analysis Using the Argonne 100-Inch Radius Double Focusing Mass Spectrometer," Joint Conf. on Mass Spectrometry, Oxford (1951).
37. N. A. Surplice, "Emission of Negative Ions from Dispenser Cathodes. I. Cathodes of BaO in Sintered Nl. II. Cathodes of BaAl 0, In Sintered W," Brit. J. Appl. Phys. 12, 214-19, 20-1 (1961).
486

38. G. Verhaegen, F. E, Stafford and M. Ackerman, "Mass Spectrometric Studies of the Molecule BC_ in the Vapor Above the System Boron-Carbon," Scientific Note No. 3, Contract NoT AF61(052)-225 (1961).
39. E. Z. Vintaykin, P. L. Gruzin and S. N. Fedovov, "The Use of Isotopes in the Study of Atomic Mobility and Interatomic Interaction in Metals," pp. 278-84 in "Metallurgy and Metallography."
40. P. N. Walsh, D. F. Dever and D. White, "III. A Mass-spectrometric Investigation of the Isomolecular Oxygen-Exchange Reactions of Lanthanum, Cerium, Praseodymium and Neodymium with Their Monoxides," J. Chem. Phys. 65, 1410-3 (1961).
41. D. White, A. Sommer, P. N. Walsh and H. W. Goldstein, "The Application of the Time of Flight Mass Spectrometer to the Study of Inorganic Materials at Elevated Temperatures," Joint Conf. on Mass Spectrometry, Oxford (1961).
42. D. White, P. N. Walsh, H. W. Goldstein and D. F. Dever, "Rare Earths. II. A Mass Spectrometrlc Determination of the Heats of Sublimation (or Vaporization) of Neodymium, Praseodymium, Gadolinium, Terbium, Dysprosium, Holmium, Erbium and Lutetium," J. Phys. Chem. 65, 1404-9 (1951).
43. J. P. Zlngermann and V. A. Morozovky, "Ionization Method for the Investigation of the Kinetics of Adsorption on the Surface of Solids," Fiz. Tverdogo Tela 3 , 123-31 (1961).
487

Related Documents